UNITED STATES
SECURITIES AND EXCHANGE COMMISSION
WASHINGTON, D.C. 20549
FORM
CURRENT REPORT
Pursuant to Section 13 or 15(d)
of the Securities Exchange Act of 1934
Date of Report (Date of Earliest Event Reported):
(Exact name of registrant as specified in its charter)
(State or other jurisdiction | (Commission | (I.R.S. Employer | ||
of incorporation) | File Number) | Identification No.) | ||
(Address of principal executive offices) | (Zip Code) |
Registrant’s telephone number, including area code: (
Not Applicable
Former name or former address, if changed since last report
Check the appropriate box below if the Form 8-K filing is intended to simultaneously satisfy the filing obligation of the registrant under any of the following provisions:
Securities registered pursuant to Section 12(b) of the Act:
Title of each class | Trading Symbol(s) | Name of each exchange on which registered |
Indicate by check mark whether the registrant is an emerging growth company as defined in Rule 405 of the Securities Act of 1933 (§230.405 of this chapter) or Rule 12b-2 of the Securities Exchange Act of 1934 (§240.12b-2 of this chapter).
Emerging Growth Company
If an emerging growth company, indicate by check mark if the registrant has elected not to use the extended transition period for complying with any new or revised financial accounting standards provided pursuant to Section 13(a) of the Exchange Act. ☐
Item 2.02 Results of Operations and Financial Condition.
On February 9, 2021, UDR, Inc. (the “Company”) issued a press release announcing its financial results for the quarter and year ended December 31, 2020. This press release is furnished as Exhibit 99.1 to this Report and refers to supplemental financial information that is available on the Company’s website and furnished as Exhibit 99.2 to this Report. This information shall not be deemed “filed” for purposes of Section 18 of the Securities Exchange Act of 1934, as amended, and is not incorporated by reference into any filing of the Company, whether made before or after the date hereof, regardless of any general incorporation language in such filing.
Item 9.01 Financial Statements and Exhibits.
(d) Exhibits.
Ex. No. |
| Description |
99.1 | ||
99.2 | ||
104 | Cover Page Interactive Data File – The cover page XBRL tags are embedded within the Inline XBRL document |
SIGNATURES
Pursuant to the requirements of the Securities Exchange Act of 1934, the registrant has duly caused this report to be signed on its behalf by the undersigned hereunto duly authorized.
UDR, Inc. | ||||
February 9, 2021 | By: | /s/ Joseph D. Fisher | ||
Joseph D. Fisher | ||||
Senior Vice President and Chief Financial Officer | ||||
(Principal Financial Officer) |
UDR ANNOUNCES FOURTH QUARTER AND FULL-YEAR 2020 RESULTS
AND 2021 GUIDANCE
UDR, Inc. (the “Company”) Fourth Quarter 2020 Highlights:
● | Net income per share was $0.09, Funds from Operations (“FFO”) per share was $0.39, FFO as Adjusted (“FFOA”) per share was $0.49, and Adjusted FFO (“AFFO”) per share was $0.43. |
● | Net income attributable to common stockholders was $25.5 million compared to net income of $96.9 million in the prior year period, primarily due to lower gains from sold properties and a decline in Combined Same-Store net operating income (“NOI”). |
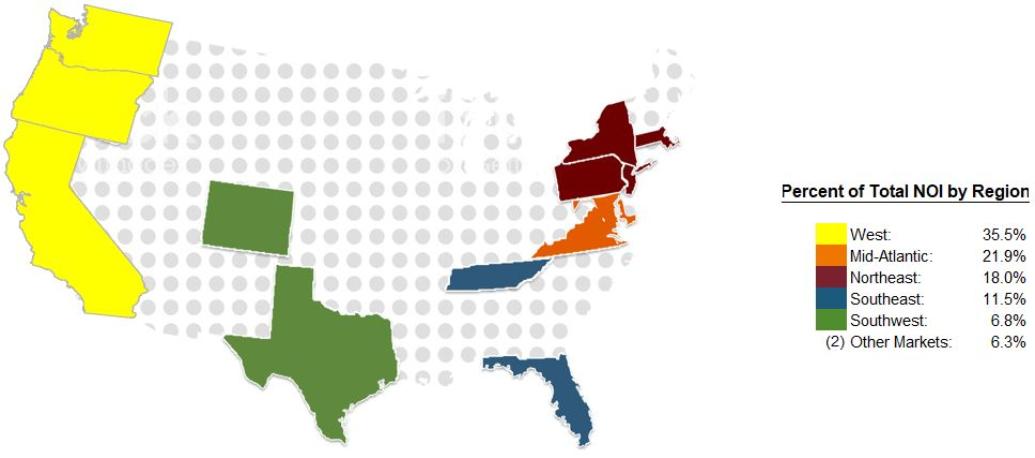
● | Year-over-year (“YOY”) Combined Same-Store results during the fourth quarter of 2020, with concessions accounted for on cash and straight-line bases, as compared to the fourth quarter of 2019 were as follows: |
Region | Revenue Growth / (Decline) | Expense Growth / (Decline) | NOI Growth / (Decline) | % of Combined Same-Store Portfolio(1) | Physical Occupancy(2) | YOY Change in Occupancy |
West | (9.7)% | 4.2% | (14.0)% | 36.5% | 95.0% | (1.6)% |
Mid-Atlantic | (1.5)% | 1.0% | (2.5)% | 23.5% | 97.0% | 0.1% |
Northeast | (12.8)% | 8.1% | (21.9)% | 16.2% | 94.3% | (2.2)% |
Southeast | 3.2% | 10.1% | 0.2% | 11.8% | 97.2% | 0.2% |
Southwest | 0.2% | 4.1% | (2.1)% | 7.3% | 97.1% | 0.4% |
Other Markets | (0.4)% | 1.1% | (1.0)% | 4.7% | 97.4% | 1.6% |
Total (Cash) | (5.9)% | 4.8% | (10.1)% | 100.0% | 96.1% | (0.6)% |
Total (Straight-Line) | (4.5)% | - | (8.1)% | - | - | - |
(1) | Based on Q4 2020 Combined Same-Store NOI. For definitions of terms, please refer to the “Definitions and Reconciliations” section of the Company’s related quarterly Supplemental Financial Information. |
(2) | Weighted average Combined Same-Store physical occupancy for the quarter. |
● | The Company continues to implement its Next Generation Operating Platform, which assisted in limiting full-year 2020 Combined Same-Store controllable expense growth to 0.2 percent YOY. |
● | The Company settled approximately 2.1 million shares of common stock under its previously-announced forward equity sales agreements at a weighted average net price of $48.23 for proceeds of $102.3 million. |
● | As previously announced, the Company issued $350.0 million of unsecured debt at an effective interest rate of 1.94 percent that matures in March 2033 and used a portion of the proceeds to repay $250.6 million of higher cost debt with a weighted average interest rate of 3.82 percent originally due in 2023 and 2024. |
● | During the quarter, the Company: |
o | Sold DelRay Tower, a 332-home community in Metropolitan Washington, D.C. for gross proceeds of $145.0 million. |
o | Entered into an agreement to sell Parallel, a 386-home community in Orange County, CA, for gross proceeds of $156.0 million. Transaction completion is expected by the end of the first quarter 2021. |
o | Acquired Andover Place at Cross Creek, a 672-home community in Tampa, FL, for $122.5 million, and Station on Silver, a 400-home community in suburban Washington, D.C. for $128.6 million. |
● | Subsequent to year-end, the Company: |
o | Sold OLiVE DTLA, a 293-home joint venture community in Los Angeles, CA, in which the Company had 47 percent ownership, for a gross sales price of $121.0 million. |
o | Acquired Union Place, a 300-home community in suburban Boston, MA, for $77.4 million. |
o | Through its Developer Capital Program, committed to invest $30.2 million into a 356-home multifamily development in suburban Washington, D.C. (Herndon, VA). The investment yields 9.0 percent on the Company’s capital outstanding and includes profit participation upon a liquidity event. |
1
“2020 proved to be a challenging but also gratifying year for UDR. Despite the economic realities brought on by the pandemic, our business and operating results have remained resilient due to ongoing advancements from our Next Generation Operating Platform, our diversified portfolio, a strong balance sheet, and the phenomenal dedication from all UDR associates,” said Tom Toomey, UDR’s Chairman and CEO. “2021 has started with signs of stability, including occupancy above 96 percent, higher levels of traffic, and concessions starting to ease. However, increased and extended regulatory actions, the timing and efficacy of widespread vaccinations, and the unknown cadence of the full reopening of the nation’s economy continue to pose risks to our business. Nevertheless, UDR has a strong team with a proven ability to execute our strategy, and the Company is well positioned to capitalize on future opportunities as demonstrated by our accretive capital recycling efforts. I commend our associates for their engagement and the compassion they have demonstrated with our residents during 2020 and look forward to a successful 2021.”
Recent Operating Trends
The table below is a summary of third quarter 2020, fourth quarter 2020, and January 2021 residential operational trends. “I am encouraged by our January results, which continue to demonstrate stable billed revenue, increasing occupancy, and improving effective blended lease rate growth,” said Mike Lacy, UDR’s Senior Vice President of Operations. “Despite a slight seasonal deterioration in collections, which has historically occurred every year during the months of November, December, and January, we remain confident in our ability to collect residential rent payments in the high-90 percent range of billed revenue.”
Summary of Third Quarter and Fourth Quarter 2020 and January 2021 Residential Operating Trends (1)
| As of and Through January 31, 2021 | |||||
Metric | Q3 2020 | Oct 2020 | Nov 2020 | Dec 2020 | Q4 2020 | Jan 2021 |
Residential revenue billed ($ millions) | $312.5 | $102.8 | $102.8 | $105.7 | $311.3 | $104.1 |
Revenue reserved or written-off(2) | 2.3% | N/A | N/A | N/A | 2.4% | N/A |
Cash revenue collected (% of billed) during billing period | 96.1% | 94.1% | 93.5% | 93.1% | 95.4% | 93.2% |
Cash revenue collected (% of billed) subsequent to billing period(1) | 1.6% | 2.9% | 2.6% | 2.1% | 0.7% | N/A |
Cash revenue collected (% of billed) as of January 31, 2021 | 97.7% | 97.0% | 96.1% | 95.2% | 96.1% (2) | 93.2% |
Leasing Traffic(3) | 1,132 | 1,158 | 927 | 760 | 948 | 925 |
Visits(3) | 31,751 | 11,213 | 7,688 | 7,797 | 26,698 | 10,487 |
Combined Same-Store Metrics | | | | | | |
Weighted Average Physical Occupancy | 95.5% | 95.9% | 96.2% | 96.3% | 96.1% | 96.4% |
Effective Blended Lease Rate Growth(3) | (0.6)% | (0.6)% | 0.0% | 0.0% | (0.3)% | 0.1% |
(1) | Metrics shown here are as of January 31, 2021, and are for the Company’s total residential portfolio, unless otherwise indicated. |
(2) | For Q4 2020, the Company reserved (reflected as a reduction to revenue) approximately 1.3 percent, or $4.0 million, of billed residential revenue for bad debt, including $0.1 million for the Company’s share from unconsolidated joint ventures. This brings the Company’s total bad debt reserve to $13.5 million, including $0.8 million for the Company’s share from unconsolidated joint ventures, which compares to a year-end accounts receivable balance of $21.0 million. |
(3) | For definitions, please refer to the “Definitions and Reconciliations” section of the Company’s related quarterly Supplemental Financial Information. |
2
Outlook
For the first quarter and full-year of 2021, the Company has established the following same-store and earnings guidance ranges (1):
| Q4 2020 (Actual) | Q1 2021 (Outlook) | Full-Year 2020 (Actual) | Full-Year 2021 (Outlook) |
Net Income / (Loss) per share | $0.09 | $0.14 to $0.16 | $0.20 | $0.13 to $0.25 |
FFO per share | $0.39 | $0.45 to $0.47 | $1.85 | $1.87 to $1.99 |
FFOA per share | $0.49 | $0.46 to $0.48 | $2.04 | $1.88 to $2.00 |
AFFO per share | $0.43 | $0.43 to $0.45 | $1.86 | $1.70 to $1.82 |
YOY Combined Same-Store Revenue Growth / (Decline), with concessions reported on a cash basis | (5.9)% | N/A | (2.8)% | (2.5)% to 0.5% |
YOY Combined Same-Store Revenue Growth / (Decline), with concessions reported on a straight-line basis | (4.5)% | N/A | (1.7)% | (4.5)% to (1.5)% |
YOY Combined Same-Store Expense Growth | 4.8% | N/A | 3.7% | 1.0% to 4.0% |
YOY Combined Same-Store NOI Growth / (Decline), with concessions reported on a cash basis | (10.1)% | N/A | (5.4)% | (4.0)% to 0.0% |
YOY Combined Same-Store NOI Growth / (Decline), with concessions reported on a straight-line basis | (8.1)% | N/A | (3.9)% | (6.5)% to (2.5)% |
(1) | Additional assumptions for the Company’s first quarter and 2021 outlook can be found on Attachment 15 of the Company’s related quarterly Supplemental Financial Information. A reconciliation of FFO per share, FFOA per share, and AFFO per share to GAAP Net Income per share can be found on Attachment 16(E) of the Company’s related quarterly Supplemental Financial Information. Non-GAAP financial measures and other terms, as used in this earnings release, are defined and further explained on Attachments 16(A) through 16(E), “Definitions and Reconciliations,” of the Company’s related quarterly Supplemental Financial Information. |
Fourth Quarter 2020 Operations
In the fourth quarter, total revenue decreased by ($2.4) million year-over-year, or (0.8) percent, to $302.4 million. This decrease was primarily attributable to declines in revenue from mature communities. The fourth quarter annualized rate of turnover increased by 120 basis points versus the prior year period to 41.1 percent. Please refer to the table on page 1 of this Press Release for additional details on fourth quarter Combined Same-Store growth results.
24.6 percent of the Company’s fourth quarter 2020 Combined Same-Store NOI came from communities located in New York, the San Francisco Bay Area, and Boston. YOY rent growth and occupancy in the suburban areas of these markets remained stable during the fourth quarter, but operating results in the urban areas of these markets remained challenged due to delayed re-openings of the cities, resulting in elevated concessionary activity and lower physical occupancy versus the prior year period.
Summary of Fourth Quarter YOY Combined Same-Store Growth and Occupancy Trends
| | Revenue Growth / (Decline) | NOI Growth / (Decline) | Physical Occupancy(3) | |||
Market | % of Combined Same-Store Portfolio(1) | Cash Basis(2) | Straight-Line Basis(2) | Cash Basis(2) | Straight-Line Basis(2) | Q4 2020 | As of January 31, 2021 |
New York, NY | 4.3% | (22.1)% | (13.7)% | (44.7)% | (31.4)% | 93.9% | 94.6% |
San Francisco, CA | 8.4% | (22.1)% | (18.7)% | (29.8)% | (25.4)% | 90.4% | 91.9% |
Boston, MA | 11.9% | (6.3)% | (6.2)% | (8.3)% | (8.2)% | 94.4% | 95.3% |
Subtotal / Wtd. Avg. | 24.6% | (14.5)% | (12.5)% | (22.0)% | (20.0)% | 92.9% | 94.0% |
Remaining Markets | 75.4% | (1.6)% | (1.1)% | (3.7)% | (3.2)% | 96.7% | 97.2% |
Total / Wtd. Avg. | 100.0% | (5.9)% | (4.5)% | (10.1)% | (8.1)% | 96.1% | 96.4% |
(1) | Based on Q4 2020 Combined Same-Store NOI. Totals may not equate to the displayed subtotals or weighted averages due to rounding. For definitions of terms, please refer to the “Definitions and Reconciliations” section of the Company’s related quarterly Supplemental Financial Information. |
(2) | “Cash Basis” and “Straight-Line Basis” present concessions reported on a cash or straight-line basis, respectively. |
(3) | Weighted average Combined Same-Store physical occupancy for the fourth quarter 2020 and as of January 31, 2021, respectively. |
3
In the table below, the Company has presented sequential Combined Same-Store results by region, with concessions accounted for on cash and straight-line bases.
Summary of Combined Same-Store Results in Fourth Quarter 2020 versus Third Quarter 2020
Region | Revenue Growth / (Decline) | Expense Growth / (Decline) | NOI Growth / (Decline) | % of Combined Same-Store Portfolio(1) | Physical Occupancy(2) | Sequential Change in Occupancy |
West | (2.4)% | 0.2% | (3.4)% | 36.5% | 95.0% | 0.9% |
Mid-Atlantic | 0.0% | (5.8)% | 2.6% | 23.5% | 97.0% | 0.3% |
Northeast | 1.1% | (3.1)% | 3.9% | 16.2% | 94.3% | 1.8% |
Southeast | 1.3% | (1.9)% | 2.8% | 11.8% | 97.2% | (0.1)% |
Southwest | (0.3)% | (8.8)% | 5.8% | 7.3% | 97.1% | 0.2% |
Other Markets | 0.0% | (6.0)% | 2.8% | 4.7% | 97.4% | 0.3% |
Total (Cash) | (0.5)% | (3.3)% | 0.8% | 100.0% | 96.1% | 0.6% |
Total (Straight-Line) | (1.8)% | - | (1.1)% | - | - | - |
(1) | Based on Q4 2020 Combined Same-Store NOI. For definitions of terms, please refer to the “Definitions and Reconciliations” section of the Company’s related quarterly Supplemental Financial Information. |
(2) | Weighted average Combined Same-Store physical occupancy for the quarter. |
In the table below, the Company has presented components of residential revenue contribution that drove the year-over-year and sequential decreases in Combined Same-Store revenue during the fourth quarter, as reported on a cash basis. The decreases are a result of the following:
| Year-Over-Year Contribution to Growth / (Decline)(1) | Sequential Contribution to Growth / (Decline)(1) | ||
Residential Revenue Components | Q4 2019 to Q4 2020 ($ in millions) | Q4 2019 to Q4 2020 (%) | Q3 2020 to Q4 2020 ($ in millions) | Q3 2020 to Q4 2020 (%) |
Base Quarter Combined Same-Store Revenue | $292.2 | | $276.4 | |
Gross Rents | $(5.7) | (2.0)% | $(4.8) | (1.7)% |
Concessions(2) | $(7.1) | (2.4)% | $0.7 | 0.3% |
Economic Occupancy Loss | $(2.1) | (0.7)% | $3.3 | 1.2% |
Bad Debt Reserve and Net Bad Debt Write-Offs | $(4.3) | (1.5)% | $(0.1) | (0.0)% |
Fee and Other Income | $1.9 | 0.7% | $(0.6) | (0.2)% |
Q4 2020 Combined Same-Store Revenue | $274.9 | (5.9)% | $274.9 | (0.5)% |
(1) | Totals may not sum to $274.9 million, (5.9) percent and (0.5) percent, respectively, due to rounding. |
(2) | Concessions exclude direct leasing costs. Please see Attachment 16(A), “Definitions and Reconciliations,” of the Company’s related quarterly Supplemental Financial Information for a reconciliation of Combined Same-Store Revenue with concessions on a cash basis to Combined Same-Store Revenue on a straight-line basis. |
For the twelve months ended December 31, 2020, total revenue increased by $89.0 million year-over-year, or 7.7 percent, to $1.2 billion. This increase was primarily attributable to growth in revenue from acquired and stabilized, non-mature communities.
In the table below, the Company has presented Combined Same-Store results by region for the twelve months ended December 31, 2020, with concessions accounted for on cash and straight-line bases. The full-year annualized rate of turnover increased by 30 basis points versus the prior year period to 48.4 percent.
4
Summary of Combined Same-Store Results Full-Year 2020 versus Full-Year 2019
Region | Revenue Growth / (Decline) | Expense Growth / (Decline) | NOI Growth / (Decline) | % of Combined Same-Store Portfolio(1) | Physical Occupancy(2) | Full-Year YOY Change in Occupancy |
West | (4.6)% | 3.3% | (7.1)% | 39.2% | 95.4% | (1.1)% |
Mid-Atlantic | (0.5)% | 1.8% | (1.4)% | 24.2% | 96.9% | (0.2)% |
Northeast | (8.9)% | 7.8% | (16.7)% | 12.6% | 94.5% | (2.2)% |
Southeast | 2.2% | 7.4% | (0.1)% | 11.4% | 97.2% | 0.3% |
Southwest | 1.5% | 0.2% | 2.4% | 7.6% | 97.0% | 0.5% |
Other Markets | 0.1% | 1.5% | (0.5)% | 5.0% | 96.8% | 0.8% |
Total (Cash) | (2.8)% | 3.7% | (5.4)% | 100.0% | 96.3% | (0.4)% |
Total (Straight-Line) | (1.7)% | - | (3.9)% | - | - | - |
(1) | Based on full-year 2020 Combined Same-Store NOI. For definitions of terms, please refer to the “Definitions and Reconciliations” section of the Company’s related quarterly Supplemental Financial Information. |
(2) | Weighted average Combined Same-Store physical occupancy for full-year 2020. |
Retail tenant income accounts for less than two percent of the Company’s consolidated NOI. During the fourth quarter, the Company collected 88.9 percent of billed retail revenue and reserved $1.7 million, including $0.1 million for UDR’s share from unconsolidated joint ventures, of its retail revenue based on probability of collection.
Transactional Activity
During the quarter, the Company:
● | Sold DelRay Tower, a 332-home community located in Metropolitan Washington, D.C. (Alexandria, VA), for gross proceeds of $145.0 million, or $437,000 per home, as previously announced. At the time of sale, the community had a weighted average monthly revenue per occupied home of $2,095 and physical occupancy of 93 percent. |
● | Entered into an agreement to sell Parallel, a 386-home community located in Orange County (Anaheim), CA, for gross proceeds of $156.0 million, or $404,000 per home. Transaction completion is expected by the end of the first quarter 2021. As of January 31, 2021, the community had a weighted average monthly revenue per occupied home of $2,160 and physical occupancy of 96 percent. |
● | Acquired Addison Park and Andover Place, two adjacent properties of 336 homes apiece, located in suburban Tampa, FL, for $122.5 million, or $182,000 per home. At the time of acquisition, the communities (21 and 23 years old, respectively) had an average blended monthly revenue per occupied home of $1,192 and occupancy of 96 percent. UDR will operate the two properties as one large community named Andover Place at Cross Creek. |
● | Acquired Station on Silver, a 400-home community located in suburban Washington, D.C. (Herndon, VA), for $128.6 million, or $322,000 per home. At the time of acquisition, the two-year-old community, which is located near an existing wholly owned UDR community (The Courts at Dulles) and a DCP community (Makers Rise), had average monthly revenue per occupied home of $1,778 and occupancy of 94 percent. |
Subsequent to year-end, the Company:
● | Sold OLiVE DTLA, a 293-home joint venture community located in Los Angeles, CA, in which the Company had 47 percent ownership, for a gross sales price of $121.0 million, or $413,000 per home. At the time of sale, the community had a weighted average monthly revenue per occupied home of $2,550 and physical occupancy of 93 percent. |
● | Acquired Union Place, a 300-home community based in suburban Boston (Franklin, MA), for $77.4 million, or $258,000 per home. At the time of acquisition, the 15-year-old property, which affords substantial operational and renovation upside, had average monthly revenue per occupied home of $1,707 and occupancy of 94 percent. |
5
Development Activity
At the end of the fourth quarter, the Company’s development pipeline totaled $491.5 million, of which 50 percent of this cost had been incurred. The Company’s active pipeline includes five development communities, one each in Addison, TX; Denver, CO; Dublin, CA; Washington, D.C.; and King of Prussia, PA, for a combined total of 1,378 homes. During the quarter construction commenced at Village at Valley Forge, a $68.0 million, 200-home community in the King of Prussia submarket of Philadelphia, PA.
Developer Capital Program (“DCP”) Activity
At the end of the fourth quarter, the Company’s DCP investments, including accrued return, totaled $429.0 million with a weighted average return rate of 8.3 percent and weighted average remaining term of 2.4 years.
During the quarter, the Company’s $53.7 million investment balance and accrued return on its mezzanine loan for The Portals development in Washington, D.C., was repaid.
Subsequent to quarter-end, the Company committed to invest $30.2 million into Makers Rise, a 356-home multifamily development located in suburban Washington, D.C. (Herndon, VA). The investment yields 9.0 percent on the Company’s capital outstanding with five years until expected redemption and includes profit participation upon a liquidity event. The community is fully capitalized, inclusive of $16.7 million of developer equity (or approximately 15 percent of the $110.3 million total project cost), and construction is scheduled to commence during the first quarter of 2021.
Capital Markets and Balance Sheet Activity
During the quarter, the Company settled approximately 2.1 million shares of common stock under its previously-announced forward equity sales agreements at a weighted average net price of $48.23 for proceeds of $102.3 million.
As previously announced, during the quarter the Company issued $350.0 million of unsecured debt at an effective interest rate of 1.94 percent that matures in March 2033. The Company expects to allocate the net proceeds from the offering to eligible Green projects. Pending allocation for such purposes, the Company used a portion of the proceeds to redeem $183.1 million of 3.75 percent medium-term unsecured notes originally due July 2024 and repay other outstanding indebtedness, including the Company’s $67.5 million of 4.0 percent secured indebtedness originally maturing in 2023 and outstanding balances on the Company’s commercial paper program and working capital credit facility. The combined prepayment and make-whole amounts, netted against fair market value adjustments, totaled approximately $23.8 million.
Subsequent to quarter-end, UDR and its joint venture partner MetLife refinanced $302.9 million of mortgage loans with a weighted average interest rate of 3.7 percent on Columbus Square (Manhattan, NY) that were scheduled to mature in 2022 with $229.6 million of fixed rate mortgage loans at a weighted average interest rate of 2.6 percent that mature in 2031.
As of December 31, 2020, the Company had $958.4 million of liquidity through a combination of cash and undrawn capacity on its credit facilities. Please see Attachment 15 of the Company’s related quarterly Supplemental Financial Information for additional details on projected capital sources and uses.
The Company’s total indebtedness as of December 31, 2020 was $5.0 billion with no remaining consolidated maturities until 2023, excluding principal amortization, amounts on the Company’s commercial paper program and amounts on the Company’s working capital credit facility. The Company ended the quarter with fixed-rate debt representing 94.4 percent of its total debt, a weighted average interest rate of 2.91 percent and a weighted average years to maturity of 8.0 years. The Company’s consolidated leverage was 34.9 percent versus 34.2 percent a year ago, its consolidated net-debt-to-EBITDAre was 6.8x versus 6.1x a year ago and its consolidated fixed charge coverage ratio was 4.5x versus 4.9x a year ago.
6
Senior Management and Board of Directors
As previously announced, effective January 1, 2021, Jerry A. Davis transitioned from the role of Chief Operating Officer, but continues to serve as President of the Company. Mr. Davis will focus on the continued implementation and evolution of the Company’s Next Generation Operating Platform, the evaluation of new technologies and technology investments useful to the Company’s business areas, and redevelopment opportunities. In conjunction with the transition, Mr. Davis intends to retire at year-end 2021, at which time he will transition to a consulting role. Michael D. Lacy, the Company’s Senior Vice President of Property Operations, will continue to oversee UDR’s day-to-day operations, as he has for the last three years.
As previously announced, during the quarter the Company appointed Diane Morefield to its Board of Directors. Ms. Morefield most recently served as Executive Vice President and Chief Financial Officer at CyrusOne, Inc, a $13 billion publicly traded data center REIT, and previously held executive-level positions at two publicly traded REITs that have since been taken private. Ms. Morefield is an independent director and serves on the Audit and Governance Committees.
Dividend
As previously announced, the Company’s Board of Directors declared a regular quarterly dividend on its common stock for the fourth quarter of 2020 in the amount of $0.36 per share. The dividend was paid in cash on February 1, 2021 to UDR common stock shareholders of record as of January 11, 2021. The fourth quarter 2020 dividend represented the 193rd consecutive quarterly dividend paid by the Company on its common stock.
The Company offers Supplemental Financial Information that provides details on the financial position and operating results of the Company which is available on the Company's website at ir.udr.com.
Conference Call and Webcast Information
UDR will host a webcast and conference call at 1:00 p.m. Eastern Time on February 10, 2021 to discuss fourth quarter and full-year results as well as high-level views for 2021.
The webcast will be available on UDR's website at ir.udr.com. To listen to a live broadcast, access the site at least 15 minutes prior to the scheduled start time in order to register, download and install any necessary audio software.
To participate in the teleconference dial 877-705-6003 for domestic and 201-493-6725 for international. A passcode is not necessary.
This quarter, given the combination of a high volume of conference calls occurring during this time of year generally and the impact that the COVID-19 pandemic has had on staffing and capacity at our conference call provider, we anticipate potential delays if you dial in to be connected to the live call. As a result, we encourage stockholders and interested parties to join us for the Company’s earnings results discussion via the webcast link. If you choose to dial in to the live call, please allow extra time to be connected to the call.
A replay of the conference call will be available through March 12, 2021, by dialing 844-512-2921 for domestic and 412-317-6671 for international and entering the confirmation number, 13714660, when prompted for the passcode. A replay of the call will also be available for 30 days on UDR's website at ir.udr.com.
Full Text of the Earnings Report and Supplemental Data
The full text of the earnings report and related quarterly Supplemental Financial Information will be available on the Company’s website at ir.udr.com.
7
Forward-Looking Statements
Certain statements made in this press release may constitute “forward-looking statements.” Words such as “expects,” “intends,” “believes,” “anticipates,” “plans,” “likely,” “will,” “seeks,” “estimates” and variations of such words and similar expressions are intended to identify such forward-looking statements. Forward-looking statements, by their nature, involve estimates, projections, goals, forecasts and assumptions and are subject to risks and uncertainties that could cause actual results or outcomes to differ materially from those expressed in a forward-looking statement, due to a number of factors, which include, but are not limited to, the impact of the COVID-19 pandemic and measures intended to prevent its spread or address its effects, unfavorable changes in the apartment market, changing economic conditions, the impact of inflation/deflation on rental rates and property operating expenses, expectations concerning availability of capital and the stabilization of the capital markets, the impact of competition and competitive pricing, acquisitions, developments and redevelopments not achieving anticipated results, delays in completing developments, redevelopments and lease-ups on schedule, expectations on job growth, home affordability and demand/supply ratio for multifamily housing, expectations concerning development and redevelopment activities, expectations on occupancy levels and rental rates, expectations concerning the joint ventures with third parties, expectations that technology will help grow net operating income, expectations on annualized net operating income and other risk factors discussed in documents filed by the Company with the SEC from time to time, including the Company's Annual Report on Form 10-K and the Company's Quarterly Reports on Form 10-Q. Actual results may differ materially from those described in the forward-looking statements. These forward-looking statements and such risks, uncertainties and other factors speak only as of the date of this press release, and the Company expressly disclaims any obligation or undertaking to update or revise any forward-looking statement contained herein, to reflect any change in the Company's expectations with regard thereto, or any other change in events, conditions or circumstances on which any such statement is based, except to the extent otherwise required under the U.S. securities laws.
About UDR, Inc.
UDR, Inc. (NYSE: UDR), an S&P 500 company, is a leading multifamily real estate investment trust with a demonstrated performance history of delivering superior and dependable returns by successfully managing, buying, selling, developing and redeveloping attractive real estate communities in targeted U.S. markets. As of December 31, 2020, UDR owned or had an ownership position in 52,589 apartment homes including 1,176 homes under development. For over 48 years, UDR has delivered long-term value to shareholders, the best standard of service to Residents and the highest quality experience for Associates.
8
Exhibit 99.2
Financial Highlights
UDR, Inc.
As of End of Fourth Quarter 2020
(Unaudited) (1)
| | | | Actual Results | | Actual Results | | Guidance as of December 31, 2020 | ||
Dollars in thousands, except per share and unit | | | | 4Q 2020 | | YTD 2020 | | 1Q 2021 | | Full-Year 2021 |
| | | | | | | | | | |
GAAP Metrics | | | | | | | | | | |
Net income/(loss) attributable to UDR, Inc. | | | | $26,532 | | $64,266 | | -- | | -- |
Net income/(loss) attributable to common stockholders | | | | $25,481 | | $60,036 | | -- | | -- |
Income/(loss) per weighted average common share, diluted | | | | $0.09 | | $0.20 | | $0.14 to $0.16 | | $0.13 to $0.25 |
| | | | | | | | | | |
Per Share Metrics | | | | | | | | | | |
FFO per common share and unit, diluted | | | | $0.39 | | $1.85 | | $0.45 to $0.47 | | $1.87 to $1.99 |
FFO as Adjusted per common share and unit, diluted | | | | $0.49 | | $2.04 | | $0.46 to $0.48 | | $1.88 to $2.00 |
Adjusted Funds from Operations ("AFFO") per common share and unit, diluted | | | | $0.43 | | $1.86 | | $0.43 to $0.45 | | $1.70 to $1.82 |
Dividend declared per share and unit | | | | $0.36 | | $1.44 | | $0.3625 | | $1.45 |
| | | | | | | | | | |
Combined Same-Store Operating Metrics (2) | | | | | | | | | | |
Combined Revenue growth/(decline) (Cash basis) | | | | -5.9% | | -2.8% | | -- | | (2.50%) - 0.50% |
Combined Revenue growth/(decline) (Straight-line basis) | | | | -4.5% | | -1.7% | | -- | | (4.50%) - (1.50%) |
Combined Expense growth | | | | 4.8% | | 3.7% | | -- | | 1.00% - 4.00% |
Combined NOI growth/(decline) (Cash basis) | | | | -10.1% | | -5.4% | | -- | | (4.00%) - 0.00% |
Combined NOI growth/(decline) (Straight-line basis) | | | | -8.1% | | -3.9% | | -- | | (6.50%) - (2.50%) |
Combined Physical Occupancy | | | | 96.1% | | 96.3% | | -- | | -- |
| | | | | | | | | | |
| | | | | | | | | | |
Property Metrics | | | | Homes | | Communities | | % of Total NOI | | |
Combined Same-Store (2) | | | | 45,088 | | 141 | | 88.8% | | |
Acquired JV Same-Store Portfolio (2) | | | | (3,619) | | (11) | | -7.2% | | |
UDR Same-Store | | | | 41,469 | | 130 | | 81.6% | | |
Stabilized, Non-Mature | | | | 1,535 | | 5 | | 2.6% | | |
Acquired JV Same-Store Portfolio (2) | | | | 3,619 | | 11 | | 7.2% | | |
Acquired Communities | | | | 1,072 | | 2 | | 0.6% | | |
Development, completed | | | | 202 | | - | | 0.1% | | |
Non-Residential / Other | | | | N/A | | N/A | | 3.8% | | |
Joint Venture (3) | | | | 2,837 | | 13 | | 4.1% | | |
Total completed homes | | | | 50,734 | | 161 | | 100% | | |
Held for Disposition | | | | 679 | | 2 | | - | | |
Under Development | | | | 1,176 | | 5 | | - | | |
Total Quarter-end homes (3)(4) | | | | 52,589 | | 168 | | 100% | | |
| | | | | | | | | | |
| | | | | | | | | | |
Balance Sheet Metrics (adjusted for non-recurring items) | | | | | | | | | | |
| | | | 4Q 2020 | | 4Q 2019 | | | | |
Consolidated Interest Coverage Ratio | | | | 4.6x | | 5.0x | | | | |
Consolidated Fixed Charge Coverage Ratio | | | | 4.5x | | 4.9x | | | | |
Consolidated Debt as a percentage of Total Assets | | | | 34.9% | | 34.2% | | | | |
Consolidated Net Debt-to-EBITDAre | | | | 6.8x | | 6.1x | | | | |
| | | | | | | | | | |
(1) | See Attachment 16 for definitions, other terms and reconciliations. |
(2) | Amounts include the Acquired JV Same-Store Portfolio Communities as if these communities were 100% owned by UDR during all periods presented. These communities were stabilized as of the beginning of the prior year, were not in process of any substantial redevelopment activities, and were not held for disposition. Because these communities became wholly owned by UDR in 2019 (the 11 communities and 3,619 homes were previously owned by UDR unconsolidated JVs), they are not included in the UDR Same-Store Communities. These 11 communities will be eligible to join the UDR Same-Store Communities on January 1, 2021. |
(3) | Joint venture NOI is based on UDR's share. Homes and communities at 100%. |
(4) | Excludes 2,644 homes that are part of the Developer Capital Program as described in Attachment 12(B). |
1
Attachment 1
UDR, Inc.
Consolidated Statements of Operations
(Unaudited) (1)
| | Three Months Ended | | Twelve Months Ended | ||||||||
| | December 31, | | December 31, | ||||||||
In thousands, except per share amounts | | 2020 | | 2019 | | 2020 | | 2019 | ||||
| | | | | | | | | | | | |
REVENUES: | | | | | | | | | | | | |
Rental income (2) | | $ | 301,176 | | $ | 302,745 | | $ | 1,236,096 | | $ | 1,138,138 |
Joint venture management and other fees | | | 1,208 | | | 2,073 | | | 5,069 | | | 14,055 |
Total revenues | | | 302,384 | | | 304,818 | | | 1,241,165 | | | 1,152,193 |
| | | | | | | | | | | | |
OPERATING EXPENSES: | | | | | | | | | | | | |
Property operating and maintenance | | | 50,359 | | | 47,245 | | | 201,944 | | | 178,947 |
Real estate taxes and insurance | | | 45,965 | | | 40,264 | | | 180,450 | | | 150,888 |
Property management | | | 8,659 | | | 8,703 | | | 35,538 | | | 32,721 |
Other operating expenses | | | 6,153 | | | 2,800 | | | 22,762 | | | 13,932 |
Real estate depreciation and amortization | | | 146,135 | | | 143,464 | | | 608,616 | | | 501,257 |
General and administrative | | | 11,978 | | | 14,531 | | | 49,885 | | | 51,533 |
Casualty-related charges/(recoveries), net | | | 778 | | | 1,316 | | | 2,131 | | | 474 |
Other depreciation and amortization | | | 2,074 | | | 1,713 | | | 10,013 | | | 6,666 |
Total operating expenses | | | 272,101 | | | 260,036 | | | 1,111,339 | | | 936,418 |
| | | | | | | | | | | | |
Gain/(loss) on sale of real estate owned | | | 57,974 | | | - | | | 119,277 | | | 5,282 |
Operating income | | | 88,257 | | | 44,782 | | | 249,103 | | | 221,057 |
| | | | | | | | | | | | |
Income/(loss) from unconsolidated entities (2) | | | 4,516 | | | 118,486 | | | 18,844 | | | 137,873 |
Interest expense | | | (37,874) | | | (37,124) | | | (153,516) | | | (141,323) |
Cost associated with debt extinguishment and other | | | (24,650) | | | (23,311) | | | (49,190) | | | (29,594) |
Total interest expense | | | (62,524) | | | (60,435) | | | (202,706) | | | (170,917) |
Interest income and other income/(expense), net (3) | | | (1,030) | | | 2,406 | | | 6,274 | | | 15,404 |
| | | | | | | | | | | | |
Income/(loss) before income taxes | | | 29,219 | | | 105,239 | | | 71,515 | | | 203,417 |
Tax (provision)/benefit, net | | | (668) | | | (2) | | | (2,545) | | | (3,838) |
| | | | | | | | | | | | |
Net Income/(loss) | | | 28,551 | | | 105,237 | | | 68,970 | | | 199,579 |
Net (income)/loss attributable to redeemable noncontrolling interests in the OP and DownREIT Partnership (4) | | | (1,929) | | | (7,235) | | | (4,543) | | | (14,426) |
Net (income)/loss attributable to noncontrolling interests | | | (90) | | | (43) | | | (161) | | | (188) |
| | | | | | | | | | | | |
Net income/(loss) attributable to UDR, Inc. | | | 26,532 | | | 97,959 | | | 64,266 | | | 184,965 |
Distributions to preferred stockholders - Series E (Convertible) | | | (1,051) | | | (1,031) | | | (4,230) | | | (4,104) |
| | | | | | | | | | | | |
Net income/(loss) attributable to common stockholders | | $ | 25,481 | | $ | 96,928 | | $ | 60,036 | | $ | 180,861 |
| | | | | | | | | | | | |
| | | | | | | | | | | | |
Income/(loss) per weighted average common share - basic: | | | $0.09 | | | $0.33 | | | $0.20 | | | $0.63 |
Income/(loss) per weighted average common share - diluted: | | | $0.09 | | | $0.33 | | | $0.20 | | | $0.63 |
| | | | | | | | | | | | |
Common distributions declared per share | | | $0.3600 | | | $0.3425 | | | $1.4400 | | | $1.3700 |
| | | | | | | | | | | | |
Weighted average number of common shares outstanding - basic | | | 294,301 | | | 293,107 | | | 294,545 | | | 285,247 |
Weighted average number of common shares outstanding - diluted | | | 294,805 | | | 294,073 | | | 294,927 | | | 286,015 |
(1) | See Attachment 16 for definitions and other terms. |
(2) | During the three months ended December 31, 2020, UDR collected 95.4% of billed residential revenue and 88.9% of billed retail revenue. Of the 4.6% and 11.1% not collected, UDR reserved (reflected as a reduction to revenues) approximately 1.3% or $4.0 million for residential, including $0.1 million for UDR’s share from unconsolidated joint ventures, and 23.8% or $1.7 million, including straight-line rent receivables and $0.1 million for UDR’s share from unconsolidated joint ventures, for retail. The reserves are based on probability of collection. |
(3) | During the three months ended December 31, 2020, UDR recorded an impairment charge of approximately $3.1 million on its investment in equity securities of a non-core investment. Following the impairment charge, UDR’s investment is carried at $0 on the consolidated balance sheet. UDR initially acquired the investment for $1.0 million in 2016 and recorded an unrealized gain of $2.1 million in 2018 based on the pricing of a subsequent capital raise. |
(4) | Due to the quarterly calculation of noncontrolling interests, the sum of the quarterly amounts will not equal the annual totals. |
2
Attachment 2
UDR, Inc.
Funds From Operations
(Unaudited) (1)
| | Three Months Ended | | | Twelve Months Ended | |||||||
| | December 31, | | | December 31, | |||||||
In thousands, except per share and unit amounts | | 2020 | | 2019 | | | 2020 | | 2019 | |||
| | | | | | | | | | | | |
Net income/(loss) attributable to common stockholders | | $ | 25,481 | | $ | 96,928 | | $ | 60,036 | | $ | 180,861 |
| | | | | | | | | | | | |
Real estate depreciation and amortization | | | 146,135 | | | 143,464 | | | 608,616 | | | 501,257 |
Noncontrolling interests | | | 2,019 | | | 7,278 | | | 4,704 | | | 14,614 |
Real estate depreciation and amortization on unconsolidated joint ventures | | | 8,724 | | | 12,454 | | | 35,023 | | | 57,954 |
Net gain on the sale of unconsolidated depreciable property | | | - | | | (114,897) | | | - | | | (125,407) |
Net gain on the sale of depreciable real estate owned, net of tax | | | (57,549) | | | - | | | (118,852) | | | - |
Funds from operations ("FFO") attributable to common stockholders and unitholders, basic | | $ | 124,810 | | $ | 145,227 | | $ | 589,527 | | $ | 629,279 |
| | | | | | | | | | | | |
Distributions to preferred stockholders - Series E (Convertible) (2) | | | 1,051 | | | 1,031 | | | 4,230 | | | 4,104 |
| | | | | | | | | | | | |
FFO attributable to common stockholders and unitholders, diluted | | $ | 125,861 | | $ | 146,258 | | $ | 593,757 | | $ | 633,383 |
| | | | | | | | | | | | |
FFO per weighted average common share and unit, basic | | $ | 0.39 | | $ | 0.46 | | $ | 1.86 | | $ | 2.04 |
FFO per weighted average common share and unit, diluted | | $ | 0.39 | | $ | 0.46 | | $ | 1.85 | | $ | 2.03 |
| | | | | | | | | | | | |
Weighted average number of common shares and OP/DownREIT Units outstanding, basic | | | 316,605 | | | 315,004 | | | 316,855 | | | 308,020 |
Weighted average number of common shares, OP/DownREIT Units, and common stock | | | | | | | | | | | | |
equivalents outstanding, diluted | | | 320,027 | | | 318,981 | | | 320,187 | | | 311,799 |
| | | | | | | | | | | | |
Impact of adjustments to FFO: | | | | | | | | | | | | |
Cost associated with debt extinguishment and other | | $ | 24,650 | | $ | 23,311 | | $ | 49,190 | | $ | 29,594 |
Promoted interest on settlement of note receivable, net of tax | | | - | | | - | | | - | | | (6,482) |
Legal and other costs | | | 5,059 | | | - | | | 8,973 | | | 3,660 |
Net gain on the sale of non-depreciable real estate owned | | | - | | | - | | | - | | | (5,282) |
Realized/unrealized (gain)/loss on unconsolidated technology investments, net of tax | | | (435) | | | 73 | | | (3,582) | | | (3,300) |
Joint venture development success fee | | | - | | | - | | | - | | | (3,750) |
Severance costs and other restructuring expense | | | 52 | | | 116 | | | 1,948 | | | 390 |
Casualty-related charges/(recoveries), net | | | 823 | | | 1,463 | | | 2,545 | | | 636 |
Casualty-related charges/(recoveries) on unconsolidated joint ventures, net | | | - | | | 50 | | | 31 | | | (374) |
| | $ | 30,149 | | $ | 25,013 | | $ | 59,105 | | $ | 15,092 |
| | | | | | | | | | | | |
FFO as Adjusted attributable to common stockholders and unitholders, diluted | | $ | 156,010 | | $ | 171,271 | | $ | 652,862 | | $ | 648,475 |
| | | | | | | | | | | | |
FFO as Adjusted per weighted average common share and unit, diluted | | $ | 0.49 | | $ | 0.54 | | $ | 2.04 | | $ | 2.08 |
| | | | | | | | | | | | |
Recurring capital expenditures | | | (17,814) | | | (18,101) | | | (56,924) | | | (51,246) |
AFFO attributable to common stockholders and unitholders, diluted | | $ | 138,196 | | $ | 153,170 | | $ | 595,938 | | $ | 597,229 |
| | | | | | | | | | | | |
AFFO per weighted average common share and unit, diluted | | $ | 0.43 | | $ | 0.48 | | $ | 1.86 | | $ | 1.92 |
(1) | See Attachment 16 for definitions and other terms. |
(2) | Series E preferred shares are dilutive for purposes of calculating FFO per share for the three and twelve months ended December 31, 2020 and December 31, 2019. Consequently, distributions to Series E preferred stockholders are added to FFO and the weighted average number of shares are included in the denominator when calculating FFO per common share and unit, diluted. |
3
Attachment 3
UDR, Inc.
Consolidated Balance Sheets
(Unaudited) (1)
| | December 31, | | December 31, | ||
In thousands, except share and per share amounts | | 2020 | | 2019 | ||
| | | | | | |
ASSETS | | | | | | |
| | | | | | |
Real estate owned: | | | | | | |
Real estate held for investment | | $ | 12,706,940 | | $ | 12,532,324 |
Less: accumulated depreciation | | | (4,590,577) | | | (4,131,330) |
Real estate held for investment, net | | | 8,116,363 | | | 8,400,994 |
Real estate under development | | | | | | |
(net of accumulated depreciation of $1,010 and $23) | | | 246,867 | | | 69,754 |
Real estate held for disposition | | | | | | |
(net of accumulated depreciation of $13,779 and $0) | | | 102,876 | | | - |
Total real estate owned, net of accumulated depreciation | | | 8,466,106 | | | 8,470,748 |
| | | | | | |
Cash and cash equivalents | | | 1,409 | | | 8,106 |
Restricted cash | | | 22,762 | | | 25,185 |
Notes receivable, net | | | 157,992 | | | 153,650 |
Investment in and advances to unconsolidated joint ventures, net | | | 600,233 | | | 588,262 |
Operating lease right-of-use assets | | | 200,913 | | | 204,225 |
Other assets | | | 188,118 | | | 186,296 |
Total assets | | $ | 9,637,533 | | $ | 9,636,472 |
| | | | | | |
LIABILITIES AND EQUITY | | | | | | |
| | | | | | |
Liabilities: | | | | | | |
Secured debt | | $ | 862,147 | | $ | 1,149,441 |
Unsecured debt | | | 4,114,401 | | | 3,558,083 |
Operating lease liabilities | | | 195,592 | | | 198,558 |
Real estate taxes payable | | | 29,946 | | | 29,445 |
Accrued interest payable | | | 44,760 | | | 45,199 |
Security deposits and prepaid rent | | | 49,008 | | | 48,353 |
Distributions payable | | | 115,795 | | | 109,382 |
Accounts payable, accrued expenses, and other liabilities | | | 110,999 | | | 90,032 |
Total liabilities | | | 5,522,648 | | | 5,228,493 |
| | | | | | |
Redeemable noncontrolling interests in the OP and DownREIT Partnership | | | 856,294 | | | 1,018,665 |
| | | | | | |
Equity: | | | | | | |
Preferred stock, no par value; 50,000,000 shares authorized | | | | | | |
2,695,363 shares of 8.00% Series E Cumulative Convertible issued | | | | | | |
and outstanding (2,780,994 shares at December 31, 2019) | | | 44,764 | | | 46,200 |
14,440,519 shares of Series F outstanding (14,691,274 shares | | | | | | |
at December 31, 2019) | | | 1 | | | 1 |
Common stock, $0.01 par value; 350,000,000 shares authorized | | | | | | |
296,611,579 shares issued and outstanding (294,588,305 shares at December 31, 2019) | | | 2,966 | | | 2,946 |
Additional paid-in capital | | | 5,881,383 | | | 5,781,975 |
Distributions in excess of net income | | | (2,685,770) | | | (2,462,132) |
Accumulated other comprehensive income/(loss), net | | | (9,144) | | | (10,448) |
Total stockholders' equity | | | 3,234,200 | | | 3,358,542 |
Noncontrolling interests | | | 24,391 | | | 30,772 |
Total equity | | | 3,258,591 | | | 3,389,314 |
Total liabilities and equity | | $ | 9,637,533 | | $ | 9,636,472 |
(1) | See Attachment 16 for definitions and other terms. |
4
Attachment 4(A)
UDR, Inc.
Selected Financial Information
(Unaudited) (1)
| | | | | | | | | | December 31, | | December 31, |
Common Stock and Equivalents | | | | | | | | | | 2020 | | 2019 |
| | | | | | | | | | | | |
Common shares | | | | | | | | | | 296,374,227 | | 294,340,740 |
Restricted shares | | | | | | | | | | 237,352 | | 247,565 |
Total common shares | | | | | | | | | | 296,611,579 | | 294,588,305 |
Restricted unit and common stock equivalents | | | | | | | | | | 344,128 | | 766,926 |
Operating and DownREIT Partnership units | | | | | | | | | | 20,530,251 | | 20,061,283 |
Class A Limited Partnership units | | | | | | | | | | 1,751,671 | | 1,751,671 |
Series E cumulative convertible preferred shares (2) | | | | | | | | | | 2,918,127 | | 3,010,843 |
Total common shares, OP/DownREIT units, and common stock equivalents | | | | | | | | | | 322,155,756 | | 320,179,028 |
| | | | | | | | | | | | |
| | | | | | | | | | | | |
| | | | | | | | | | | | |
| | | | | | | | | | | | |
Weighted Average Number of Shares Outstanding | | | | | | | | | | 4Q 2020 | | 4Q 2019 |
| | | | | | | | | | | | |
Weighted average number of common shares and OP/DownREIT units outstanding - basic | | | | | | | | | | 316,604,571 | | 315,004,063 |
Weighted average number of OP/DownREIT units outstanding | | | | | | | | | | (22,304,319) | | (21,897,139) |
Weighted average number of common shares outstanding - basic per the Consolidated Statements of Operations | | | | | | | | | | 294,300,252 | | 293,106,924 |
| | | | | | | | | | | | |
Weighted average number of common shares, OP/DownREIT units, and common stock equivalents outstanding - diluted | | | | | | | | | | 320,026,558 | | 318,981,352 |
Weighted average number of OP/DownREIT units outstanding | | | | | | | | | | (22,304,319) | | (21,897,139) |
Weighted average number of Series E cumulative convertible preferred shares outstanding (3) | | | | | | | | | | (2,918,127) | | (3,010,843) |
Weighted average number of common shares outstanding - diluted per the Consolidated Statements of Operations | | | | | | | | | | 294,804,112 | | 294,073,370 |
| | | | | | | | | | | | |
| | | | | | | | | | | | |
| | | | | | | | | | Year-to-Date 2020 | | Year-to-Date 2019 |
| | | | | | | | | | | | |
Weighted average number of common shares and OP/DownREIT units outstanding - basic | | | | | | | | | | 316,854,783 | | 308,020,556 |
Weighted average number of OP/DownREIT units outstanding | | | | | | | | | | (22,309,907) | | (22,773,160) |
Weighted average number of common shares outstanding - basic per the Consolidated Statements of Operations | | | | | | | | | | 294,544,876 | | 285,247,396 |
| | | | | | | | | | | | |
Weighted average number of common shares, OP/DownREIT units, and common stock equivalents outstanding - diluted | | | | | | | | | | 320,187,149 | | 311,798,958 |
Weighted average number of OP/DownREIT units outstanding | | | | | | | | | | (22,309,907) | | (22,773,160) |
Weighted average number of Series E cumulative convertible preferred shares outstanding (3) | | | | | | | | | | (2,949,792) | | (3,010,843) |
Weighted average number of common shares outstanding - diluted per the Consolidated Statements of Operations | | | | | | | | | | 294,927,450 | | 286,014,955 |
| | | | | | | | | | | | |
(1) | See Attachment 16 for definitions and other terms. |
(2) | At December 31, 2020 and December 31, 2019 there were 2,695,363 and 2,780,994 of Series E cumulative convertible preferred shares outstanding, which is equivalent to 2,918,127 and 3,010,843 shares of common stock if converted (after adjusting for the special dividend paid in 2008). |
(3) | Series E cumulative convertible preferred shares are anti-dilutive for purposes of calculating Income/(loss) per weighted average common share for the three and twelve months ended December 31, 2020 and December 31, 2019. |
5
Attachment 4(B)
UDR, Inc.
Selected Financial Information
(Unaudited) (1)
| | | | | | | | | | | | | | Weighted | | Weighted |
| | | | | | | | | | | | | | Average | | Average Years |
Debt Structure, In thousands | | | | | | | | Balance | | | % of Total | | Interest Rate | | to Maturity (2) | |
| | | | | | | | | | | | | | | | |
Secured | | | Fixed | | | | | $ | 824,550 | | | 16.6% | | 3.31% | | 7.2 |
| | | Floating | | | | | | 27,000 | | | 0.5% | | 0.84% | | 11.2 |
| | | Combined | | | | | | 851,550 | | | 17.1% | | 3.23% | | 7.3 |
| | | | | | | | | | | | | | | | |
Unsecured | | | Fixed | | | | | | 3,880,644 | (3) | | 77.8% | | 3.14% | | 8.6 |
| | | Floating | | | | | | 253,024 | | | 5.1% | | 0.46% | | 0.5 |
| | | Combined | | | | | | 4,133,668 | | | 82.9% | | 2.98% | | 8.1 |
| | | | | | | | | | | | | | | | |
Total Debt | | | Fixed | | | | | | 4,705,194 | | | 94.4% | | 3.17% | | 8.3 |
| | | Floating | | | | | | 280,024 | | | 5.6% | | 0.49% | | 1.6 |
| | | Combined | | | | | | 4,985,218 | | | 100.0% | | 3.02% | | 8.0 |
| | | Total Non-Cash Adjustments (4) | | | | | | (8,670) | | | | | | | |
| | | Total per Balance Sheet | | | | | $ | 4,976,548 | | | | | 2.91% | | |
| | | | | | | | | | | | | | | | |
| | | | | | | | | | | | | | | | |
| | | | | | | | | | | | | | | | |
Debt Maturities, In thousands | | | | | | | | | | | | | | | | |
| | | | | | | | Revolving Credit | | | | | | | | |
| | | | | Unsecured | | Facilities & Comm. | | | | | | | Weighted Average | ||
| | Secured Debt (5) | | Debt (5) | | Paper (2) (6) (7) | | Balance | | % of Total | | Interest Rate | ||||
| | | | | | | | | | | | | | | | |
2021 | | $ | 1,097 | | $ | - | | $ | 190,000 | | $ | 191,097 | | 3.8% | | 0.29% |
2022 | | | 1,140 | | | - | | | 28,024 | | | 29,164 | | 0.6% | | 1.08% |
2023 | | | 1,183 | | | 350,000 | | | - | | | 351,183 | | 7.0% | | 2.41% |
2024 | | | 95,280 | | | 15,644 | | | - | | | 110,924 | | 2.2% | | 4.00% |
2025 | | | 173,189 | | | 300,000 | | | - | | | 473,189 | | 9.5% | | 4.22% |
2026 | | | 51,070 | | | 300,000 | | | - | | | 351,070 | | 7.0% | | 2.94% |
2027 | | | 1,111 | | | 300,000 | | | - | | | 301,111 | | 6.0% | | 3.50% |
2028 | | | 122,466 | | | 300,000 | | | - | | | 422,466 | | 8.5% | | 3.67% |
2029 | | | 144,584 | | | 300,000 | | | - | | | 444,584 | | 8.9% | | 3.89% |
2030 | | | 72,500 | | | 600,000 | | | - | | | 672,500 | | 13.5% | | 3.29% |
Thereafter | | | 187,930 | | | 1,450,000 | | | - | | | 1,637,930 | | 33.0% | | 2.50% |
| | | 851,550 | | | 3,915,644 | | | 218,024 | | | 4,985,218 | | 100.0% | | 3.02% |
Total Non-Cash Adjustments (4) | | | 10,597 | | | (19,267) | | | - | | | (8,670) | | | | |
Total per Balance Sheet | | $ | 862,147 | | $ | 3,896,377 | | $ | 218,024 | | $ | 4,976,548 | | | | 2.91% |
(1) | See Attachment 16 for definitions and other terms. |
(2) | The 2021 maturity reflects the $190.0 million of principal outstanding at an interest rate of 0.27%, the equivalent of LIBOR plus a spread of 12 basis points, on the Company’s unsecured commercial paper program as of December 31, 2020. Under the terms of the program the Company may issue up to a maximum aggregate amount outstanding of $500.0 million. If the commercial paper was refinanced using the line of credit, the weighted average years to maturity would be 8.0 years without extensions and 8.1 years with extensions. |
(3) | Includes $315.0 million of floating rate debt that has been fixed using interest rate swaps at a weighted average all-in rate of 2.55% until January 2021 and 1.07% from January 2021 until July 2022. |
(4) | Includes the unamortized balance of fair market value adjustments, premiums/discounts and deferred financing costs. |
(5) | Includes principal amortization, as applicable. |
(6) | There were no borrowings outstanding on our $1.1 billion line of credit at December 31, 2020. The facility has a maturity date of January 2023, plus two six-month extension options and carries an interest rate equal to LIBOR plus a spread of 82.5 basis points. |
(7) | There was $28.0 million outstanding on our $75.0 million working capital credit facility at December 31, 2020. The facility has a maturity date of January 2022. The working capital credit facility carries an interest rate equal to LIBOR plus a spread of 82.5 basis points. |
6
Attachment 4(C)
UDR, Inc.
Selected Financial Information
(Dollars in Thousands)
(Unaudited) (1)
| | | | | | | | | | | | Quarter Ended | |
Coverage Ratios | | | | | | | | | | | | December 31, 2020 | |
Net income/(loss) | | | | | | | | | | | | $ | 28,551 |
Adjustments: | | | | | | | | | | | | | |
Interest expense, including costs associated with debt extinguishment | | | 62,524 | ||||||||||
Real estate depreciation and amortization | | | | | | | | | | | | | 146,135 |
Other depreciation and amortization | | | | | | | | | | | | | 2,074 |
Tax provision/(benefit), net | | | | | | | | | | | | | 668 |
Net (gain)/loss on the sale of depreciable real estate owned | | | (57,974) | ||||||||||
Adjustments to reflect the Company's share of EBITDAre of unconsolidated joint ventures | | | 13,261 | ||||||||||
EBITDAre | | | | | | | | | | | | $ | 195,239 |
| | | | | | | | | | | | | |
Casualty-related charges/(recoveries), net | | | | | | | | | | | | | 823 |
Legal and other costs | | | | | | | | | | | | | 5,059 |
Severance costs and other restructuring expense | | | | | | | | | | | | | 52 |
(Income)/loss from unconsolidated entities | | | | | | | | | | | | | (4,516) |
Adjustments to reflect the Company's share of EBITDAre of unconsolidated joint ventures | | | (13,261) | ||||||||||
Management fee expense on unconsolidated joint ventures | | | (566) | ||||||||||
Consolidated EBITDAre - adjusted for non-recurring items | | $ | 182,830 | ||||||||||
| | | | | | | | | | | | | |
Annualized consolidated EBITDAre - adjusted for non-recurring items | | $ | 731,320 | ||||||||||
| | | | | | | | | | | | | |
Interest expense, including costs associated with debt extinguishment | | | 62,524 | ||||||||||
Capitalized interest expense | | | | | | | | | | | | | 2,108 |
Total interest | | | | | | | | | | | | $ | 64,632 |
Cost associated with debt extinguishment | | | | | | | | | | | | | (24,650) |
Total interest - adjusted for non-recurring items | | | | | | | | | | | | $ | 39,982 |
| | | | | | | | | | | | | |
Preferred dividends | | | | | | | | | | | | $ | 1,051 |
| | | | | | | | | | | | | |
Total debt | | | | | | | | | | | | $ | 4,976,548 |
Cash | | | | | | | | | | | | | (1,409) |
Net debt | | | | | | | | | | | | $ | 4,975,139 |
| | | | | | | | | | | | | |
Consolidated Interest Coverage Ratio - adjusted for non-recurring items | | | 4.6x | ||||||||||
| | | | | | | | | | | | | |
Consolidated Fixed Charge Coverage Ratio - adjusted for non-recurring items | | | 4.5x | ||||||||||
| | | | | | | | | | | | | |
Consolidated Net Debt-to-EBITDAre - adjusted for non-recurring items | | | 6.8x | ||||||||||
| | | | | | | | | | | | | |
| | | | | | | | | | | | | |
Debt Covenant Overview | |||||||||||||
| | | | | | | | | | | | | |
Unsecured Line of Credit Covenants (2) | | | | | | | Required | | | Actual | | | Compliance |
| | | | | | | | | | | | | |
Maximum Leverage Ratio | | | | | | | ≤60.0% | | | 37.0% (2) | | | Yes |
Minimum Fixed Charge Coverage Ratio | | | | | | | ≥1.5x | | | 4.2x | | | Yes |
Maximum Secured Debt Ratio | | | | | | | ≤40.0% | | | 10.2% | | | Yes |
Minimum Unencumbered Pool Leverage Ratio | | | | | | | ≥150.0% | | | 309.8% | | | Yes |
| | | | | | | | | | | | | |
Senior Unsecured Note Covenants (3) | | | | | | | Required | | | Actual | | | Compliance |
| | | | | | | | | | | | | |
Debt as a percentage of Total Assets | | | | | | | ≤65.0% | | | 35.0% (3) | | | Yes |
Consolidated Income Available for Debt Service to Annual Service Charge | | ≥1.5x | | | 5.4x | | | Yes | |||||
Secured Debt as a percentage of Total Assets | | | | | | | ≤40.0% | | | 6.1% | | | Yes |
Total Unencumbered Assets to Unsecured Debt | | | | | | | ≥150.0% | | | 298.0% | | | Yes |
| | | | | | | | | | | | | |
Securities Ratings | | | | | | | Debt | | | Outlook | | | Commercial Paper |
| | | | | | | | | | | | | |
Moody's Investors Service | | | | | | | Baa1 | | | Stable | | | P-2 |
S&P Global Ratings | | | | | | | BBB+ | | | Stable | | | A-2 |
| | | | | | | | | | | | | |
| | | | | | | | | | | | | |
| | | | | | | | | | | | | |
| | | | | | | | | | Gross | | | % of |
| | Number of | | 4Q 2020 NOI (1) | | | | | Carrying Value | | | Total Gross | |
Asset Summary | | Homes | | ($000s) | | % of NOI | | | ($000s) | | | Carrying Value | |
| | | | | | | | | | | | | |
Unencumbered assets | | 42,387 | | $ | 180,943 | | 88.3% | | $ | 11,689,785 | | | 89.4% |
Encumbered assets | | 5,896 | | | 23,909 | | 11.7% | | | 1,381,687 | | | 10.6% |
| | 48,283 | | $ | 204,852 | | 100.0% | | $ | 13,071,472 | | | 100.0% |
(1) | See Attachment 16 for definitions and other terms. |
(2) | As defined in our credit agreement dated September 27, 2018. |
(3) | As defined in our indenture dated November 1, 1995 as amended, supplemented or modified from time to time. |
7
Attachment 5
UDR, Inc.
Operating Information
(Unaudited) (1)
| | Total | | Quarter Ended | | Quarter Ended | | Quarter Ended | | Quarter Ended | | Quarter Ended | |||||
Dollars in thousands | | Homes | | December 31, 2020 | | September 30, 2020 | | June 30, 2020 | | March 31, 2020 | | December 31, 2019 | |||||
Revenues | | | | | | | | | | | | | | | | | |
Combined Same-Store Communities (2) | | 45,088 | | $ | 274,922 | | $ | 276,402 | | $ | 283,959 | | $ | 294,910 | | $ | 292,167 |
Acquired JV Same-Store Portfolio Communities (2) | | (3,619) | | | (23,243) | | | (23,246) | | | (23,421) | | | (24,228) | | | (23,656) |
UDR Same-Store Communities | | 41,469 | | | 251,679 | | | 253,156 | | | 260,538 | | | 270,682 | | | 268,511 |
Stabilized, Non-Mature Communities | | 1,535 | | | 11,203 | | | 10,719 | | | 12,309 | | | 12,079 | | | 9,547 |
Acquired JV Same-Store Portfolio Communities | | 3,619 | | | 23,243 | | | 23,246 | | | 23,421 | | | 24,228 | | | 11,161 |
Acquired Communities | | 1,072 | | | 1,676 | | | - | | | - | | | - | | | - |
Development Communities | | 202 | | | 539 | | | 244 | | | 58 | | | 7 | | | - |
Non-Residential / Other (3) | | - | | | 10,498 | | | 17,057 | | | 4,065 | | | 5,958 | | | 6,832 |
Total | | 47,897 | | $ | 298,838 | | $ | 304,422 | | $ | 300,391 | | $ | 312,954 | | $ | 296,051 |
| | | | | | | | | | | | | | | | | |
Expenses | | | | | | | | | | | | | | | | | |
Combined Same-Store Communities (2) | | | | $ | 86,160 | | $ | 89,109 | | $ | 84,074 | | $ | 84,562 | | $ | 82,191 |
Acquired JV Same-Store Portfolio Communities (2) | | | | | (7,852) | | | (8,230) | | | (7,673) | | | (7,900) | | | (7,342) |
UDR Same-Store Communities | | | | | 78,308 | | | 80,879 | | | 76,401 | | | 76,662 | | | 74,849 |
Stabilized, Non-Mature Communities | | | | | 5,757 | | | 5,463 | | | 4,722 | | | 4,455 | | | 3,654 |
Acquired JV Same-Store Portfolio Communities | | | | | 7,852 | | | 8,230 | | | 7,673 | | | 7,900 | | | 3,318 |
Acquired Communities | | | | | 500 | | | - | | | - | | | - | | | - |
Development Communities | | | | | 215 | | | 248 | | | 123 | | | 47 | | | 6 |
Non-Residential / Other (3) | | | | | 2,447 | | | 1,207 | | | 2,948 | | | 3,287 | | | 3,498 |
Total (4) | | | | $ | 95,079 | | $ | 96,027 | | $ | 91,867 | | $ | 92,351 | | $ | 85,325 |
| | | | | | | | | | | | | | | | | |
Net Operating Income | | | | | | | | | | | | | | | | | |
Combined Same-Store Communities (2) | | | | $ | 188,762 | | $ | 187,293 | | $ | 199,885 | | $ | 210,348 | | $ | 209,976 |
Acquired JV Same-Store Portfolio Communities (2) | | | | | (15,391) | | | (15,016) | | | (15,748) | | | (16,328) | | | (16,314) |
UDR Same-Store Communities | | | | | 173,371 | | | 172,277 | | | 184,137 | | | 194,020 | | | 193,662 |
Stabilized, Non-Mature Communities | | | | | 5,446 | | | 5,256 | | | 7,587 | | | 7,624 | | | 5,893 |
Acquired JV Same-Store Portfolio Communities | | | | | 15,391 | | | 15,016 | | | 15,748 | | | 16,328 | | | 7,843 |
Acquired Communities | | | | | 1,176 | | | - | | | - | | | - | | | - |
Development Communities | | | | | 324 | | | (4) | | | (65) | | | (40) | | | (6) |
Non-Residential / Other (3) | | | | | 8,051 | | | 15,850 | | | 1,117 | | | 2,671 | | | 3,334 |
Total | | | | $ | 203,759 | | $ | 208,395 | | $ | 208,524 | | $ | 220,603 | | $ | 210,726 |
| | | | | | | | | | | | | | | | | |
Operating Margin | | | | | | | | | | | | | | | | | |
Combined Same-Store Communities | | | | | 68.7% | | | 67.8% | | | 70.4% | | | 71.3% | | | 71.9% |
| | | | | | | | | | | | | | | | | |
Weighted Average Physical Occupancy | | | | | | | | | | | | | | | | | |
Combined Same-Store Communities (2) | | | | | 96.1% | | | 95.5% | | | 96.1% | | | 96.9% | | | 96.7% |
Acquired JV Same-Store Portfolio Communities (2) | | | | | 96.1% | | | 96.3% | | | 95.8% | | | 96.0% | | | 95.8% |
UDR Same-Store Communities | | | | | 96.1% | | | 95.4% | | | 96.2% | | | 96.9% | | | 96.8% |
Stabilized, Non-Mature Communities | | | | | 92.7% | | | 89.9% | | | 93.1% | | | 95.3% | | | 93.3% |
Acquired JV Same-Store Portfolio Communities | | | | | 96.1% | | | 96.3% | | | 95.8% | | | 96.0% | | | 95.8% |
Acquired Communities | | | | | 95.7% | | | - | | | - | | | - | | | - |
Development Communities | | | | | 81.6% | | | 79.6% | | | 44.5% | | | - | | | - |
Other (5) | | | | | 93.3% | | | 92.9% | | | 94.0% | | | 96.7% | | | 96.6% |
Total | | | | | 95.9% | | | 95.3% | | | 96.0% | | | 96.9% | | | 96.6% |
| | | | | | | | | | | | | | | | | |
Sold and Held for Disposition Communities | | | | | | | | | | | | | | | | | |
Revenues | | 386 | | $ | 2,338 | | $ | 4,423 | | $ | 5,591 | | $ | 7,139 | | $ | 6,694 |
Expenses (4) | | | | | 1,245 | | | 1,686 | | | 1,862 | | | 2,277 | | | 2,184 |
Net Operating Income/(Loss) | | | | $ | 1,093 | | $ | 2,737 | | $ | 3,729 | | $ | 4,862 | | $ | 4,510 |
| | | | | | | | | | | | | | | | | |
Total | | 48,283 | | $ | 204,852 | | $ | 211,132 | | $ | 212,253 | | $ | 225,465 | | $ | 215,236 |
(1) | See Attachment 16 for definitions and other terms. |
(2) | Amounts include the Acquired JV Same-Store Portfolio Communities as if these communities were 100% owned by UDR during all periods presented. These communities were stabilized as of the beginning of the prior year, were not in process of any substantial redevelopment activities, and were not held for disposition. Because these communities became wholly owned by UDR in 2019 (the 11 communities and 3,619 homes were previously owned by UDR unconsolidated JVs), they are not included in the UDR Same-Store Communities. These 11 communities will be eligible to join the UDR Same-Store Communities on January 1, 2021. |
(3) | Primarily non-residential revenue and expense and straight-line adjustment for concessions. |
(4) | The summation of Total expenses and Sold and Held for Disposition Communities expenses above agrees to the summation of property operating and maintenance and real estate taxes and insurance expenses on Attachment 1. |
(5) | Includes occupancy of Sold and Held for Disposition Communities. |
8
Attachment 6
UDR, Inc.
Combined Same-Store Operating Expense Information (1)
(Dollars in Thousands)
(Unaudited) (2)
| | % of 4Q 2020 | | | | | | | | |
| | Combined SS | | | | | | | | |
Year-Over-Year Comparison | | Operating Expenses | | 4Q 2020 | | 4Q 2019 | | % Change | ||
| | | | | | | | | | |
Personnel | | 16.6% | | $ | 14,288 | | $ | 15,921 | | -10.3% |
Utilities | | 13.3% | | | 11,469 | | | 10,692 | | 7.3% |
Repair and maintenance | | 16.0% | | | 13,788 | | | 12,396 | | 11.2% |
Administrative and marketing | | 7.2% | | | 6,235 | | | 6,264 | | -0.5% |
Controllable expenses | | 53.1% | | | 45,780 | | | 45,273 | | 1.1% |
| | | | | | | | | | |
Real estate taxes (3) | | 42.2% | | $ | 36,347 | | $ | 33,873 | | 7.3% |
Insurance | | 4.7% | | | 4,033 | | | 3,045 | | 32.5% |
Combined Same-Store operating expenses (3) | | 100.0% | | $ | 86,160 | | $ | 82,191 | | 4.8% |
| | | | | | | | | | |
Combined Same-Store Homes | | 45,088 | | | | | | | | |
| | | | | | | | | | |
| | | | | | | | | | |
| | | | | | | | | | |
| | % of 4Q 2020 | | | | | | | | |
| | Combined SS | | | | | | | | |
Sequential Comparison | | Operating Expenses | | 4Q 2020 | | 3Q 2020 | | % Change | ||
| | | | | | | | | | |
Personnel | | 16.6% | | $ | 14,288 | | $ | 15,423 | | -7.4% |
Utilities | | 13.3% | | | 11,469 | | | 11,820 | | -3.0% |
Repair and maintenance | | 16.0% | | | 13,788 | | | 15,121 | | -8.8% |
Administrative and marketing | | 7.2% | | | 6,235 | | | 6,153 | | 1.3% |
Controllable expenses | | 53.1% | | | 45,780 | | | 48,517 | | -5.6% |
| | | | | | | | | | |
Real estate taxes (3) | | 42.2% | | $ | 36,347 | | $ | 36,694 | | -0.9% |
Insurance | | 4.7% | | | 4,033 | | | 3,898 | | 3.5% |
Combined Same-Store operating expenses (3) | | 100.0% | | $ | 86,160 | | $ | 89,109 | | -3.3% |
| | | | | | | | | | |
Combined Same-Store Homes | | 45,088 | | | | | | | | |
| | | | | | | | | | |
| | | | | | | | | | |
| | | | | | | | | | |
| | | | | | | | | | |
| | % of YTD 2020 | | | | | | | | |
| | Combined SS | | | | | | | | |
Year-to-Date Comparison | | Operating Expenses | | YTD 2020 | | YTD 2019 | | % Change | ||
| | | | | | | | | | |
Personnel | | 17.5% | | $ | 54,658 | | $ | 59,902 | | -8.8% |
Utilities | | 13.3% | | | 41,532 | | | 39,960 | | 3.9% |
Repair and maintenance | | 15.5% | | | 48,270 | | | 43,170 | | 11.8% |
Administrative and marketing | | 6.7% | | | 20,891 | | | 22,043 | | -5.2% |
Controllable expenses | | 53.0% | | | 165,351 | | | 165,075 | | 0.2% |
| | | | | | | | | | |
Real estate taxes (3) | | 42.5% | | $ | 132,331 | | $ | 123,265 | | 7.4% |
Insurance | | 4.5% | | | 13,912 | | | 12,143 | | 14.6% |
Combined Same-Store operating expenses (3) | | 100.0% | | $ | 311,594 | | $ | 300,483 | | 3.7% |
| | | | | | | | | | |
Combined Same-Store Homes | | 41,226 | | | | | | | | |
(1) | 4Q19 and YTD19 operating expenses include the Acquired JV Same-Store Portfolio Communities (the 11 communities and 3,619 homes previously owned by UDR unconsolidated JVs) as if these communities were 100% owned by UDR during all periods presented. |
(2) | See Attachment 16 for definitions and other terms. |
(3) | The year-over-year, sequential and year-to-date comparisons presented above include $347 thousand, $0 thousand and $1.3 million, respectively, of higher New York real estate taxes due to 421g exemption and abatement reductions. |
9
Attachment 7(A)
UDR, Inc.
Apartment Home Breakout
Portfolio Overview as of Quarter Ended
December 31, 2020
(Unaudited) (1)
| | | | Non-Mature Homes | | | | Unconsolidated | | | ||
| | | | | | | | Total | | Joint Venture | | Total |
| | Total Combined | | | | Non- | | Consolidated | | Operating | | Homes |
| | Same-Store Homes | | Stabilized (2) | | Stabil. / Other (3) | | Homes | | Homes (4) | | (incl. JV) (4) |
West Region | | | | | | | | | | | | |
Orange County, CA | | 4,950 | | - | | - | | 4,950 | | 381 | | 5,331 |
San Francisco, CA | | 2,751 | | - | | - | | 2,751 | | 602 | | 3,353 |
Seattle, WA | | 2,725 | | - | | - | | 2,725 | | - | | 2,725 |
Monterey Peninsula, CA | | 1,565 | | - | | - | | 1,565 | | - | | 1,565 |
Los Angeles, CA | | 1,225 | | - | | - | | 1,225 | | 340 | | 1,565 |
| | 13,216 | | - | | - | | 13,216 | | 1,323 | | 14,539 |
| | | | | | | | | | | | |
Mid-Atlantic Region | | | | | | | | | | | | |
Metropolitan DC | | 8,002 | | - | | 400 | | 8,402 | | - | | 8,402 |
Baltimore, MD | | 1,597 | | - | | - | | 1,597 | | - | | 1,597 |
Richmond, VA | | 1,358 | | - | | - | | 1,358 | | - | | 1,358 |
| | 10,957 | | - | | 400 | | 11,357 | | - | | 11,357 |
| | | | | | | | | | | | |
Northeast Region | | | | | | | | | | | | |
Boston, MA | | 4,139 | | 159 | | - | | 4,298 | | 250 | | 4,548 |
New York, NY | | 1,825 | | 493 | | - | | 2,318 | | 710 | | 3,028 |
| | 5,964 | | 652 | | - | | 6,616 | | 960 | | 7,576 |
| | | | | | | | | | | | |
Southeast Region | | | | | | | | | | | | |
Tampa, FL | | 2,908 | | 294 | | 672 | | 3,874 | | - | | 3,874 |
Orlando, FL | | 2,500 | | - | | - | | 2,500 | | - | | 2,500 |
Nashville, TN | | 2,260 | | - | | - | | 2,260 | | - | | 2,260 |
| | 7,668 | | 294 | | 672 | | 8,634 | | - | | 8,634 |
| | | | | | | | | | | | |
Southwest Region | | | | | | | | | | | | |
Dallas, TX | | 3,864 | | - | | 202 | | 4,066 | | - | | 4,066 |
Austin, TX | | 1,272 | | - | | - | | 1,272 | | - | | 1,272 |
| | 5,136 | | - | | 202 | | 5,338 | | - | | 5,338 |
| | | | | | | | | | | | |
Other Markets (5) | | 2,147 | | 589 | | - | | 2,736 | | 554 | | 3,290 |
| | | | | | | | | | | | |
Totals | | 45,088 | | 1,535 | | 1,274 | | 47,897 | | 2,837 | | 50,734 |
| | | | | | | | | | | | |
Communities (6) | | 141 | | 5 | | 2 | | 148 | | 13 | | 161 |
| | | | | | | | | | | | |
| | | | | | Homes | | Communities | | | | |
Total completed homes | | | | | | 50,734 | | 161 | | | | |
Held for Disposition | | | | | | 386 | | 1 | | | | |
Joint Venture Held for Disposition | | | | | | 293 | | 1 | | | | |
Under Development (7) | | | | | | 1,176 | | 5 | | | | |
| | | | | | | | | | | | |
Total Quarter-end homes and communities | | | | | | 52,589 | | 168 | | | | |
(1) | See Attachment 16 for definitions and other terms. |
(2) | Represents homes included in Stabilized, Non-Mature Communities category on Attachment 5. |
(3) | Represents homes included in Acquired, Development, Redevelopment and Non-Residential/Other Communities categories on Attachment 5. Excludes development homes not yet completed and Sold and Held for Disposition Communities. |
(4) | Represents joint venture operating homes at 100 percent. Excludes joint venture held for disposition communities. See Attachment 12(A) for UDR's joint venture and partnership ownership interests. |
(5) | Other Markets include Denver (218 homes), Palm Beach (636 homes), Inland Empire (654 homes), San Diego (163 wholly owned, 264 JV homes), Portland (752 homes) and Philadelphia (313 wholly owned, 290 JV homes). |
(6) | Represents communities where 100 percent of all development homes have been completed. |
(7) | See Attachment 9 for UDR’s developments and ownership interests. |
10
Attachment 7(B)
UDR, Inc.
Non-Mature Home Summary
Portfolio Overview as of Quarter Ended
December 31, 2020
(Unaudited) (1)(2)
Non-Mature Home Breakout - By Date (quarter indicates anticipated date of QTD Same-Store inclusion) | |||||||||||||
| | | | | | | | | | | | | |
| | | | | | | | | | | | | |
Community | | | Category | | # of Homes | | Market | | Same-Store Quarter (3) | | | ||
| | | | | | | | | | | | | |
Park Square | | | Stabilized, Non-Mature | | 313 | | Philadelphia, PA | | 1Q21 | | | ||
| | | | | | | | | | | | ||
The Slade at Channelside | | | Stabilized, Non-Mature | | 294 | | Tampa, FL | | 2Q21 | | | ||
| | | | | | | | | | | | ||
The Arbory | | | Stabilized, Non-Mature | | 276 | | Portland, OR | | 2Q21 | | | ||
| | | | | | | | | | | | ||
10 Hanover Square | | | Stabilized, Non-Mature | | 493 | | New York, NY | | 1Q22 | | | ||
| | | | | | | | | | | | ||
Garrison Square | | | Stabilized, Non-Mature | | 159 | | Boston, MA | | 1Q22 | | | ||
| | | | | | | | | | | | ||
Andover Place at Cross Creek | | | Acquired | | 672 | | Tampa, FL | | 2Q22 | | | ||
| | | | | | | | | | | | ||
Station on Silver | | | Acquired | | 400 | | Metropolitan DC | | 2Q22 | | | ||
| | | | | | | | | | | | | |
Vitruvian West Phase 2 | | | Development | | 202 | (4) | Dallas, TX | | 3Q22 | | | ||
| | | | | | | | | | | | | |
Total | | | | | | | 2,809 | | | | | | |
| | | | | | | | | | | | | |
| | | | | | | | | | | | | |
Summary of Non-Mature Home Activity | |||||||||||||
| | | | | Stabilized, | | | | | | | | |
| | | Market | | Non-Mature | | Acquired | | Redevelopment | | Development | | Total |
Non-Mature Homes at September 30, 2020 | | 2,480 | | - | | 652 | | 147 | | 3,279 | |||
Rodgers Forge | | | Baltimore, MD | | (498) | | - | | - | | - | | (498) |
The Commons at Windsor Gardens | | | Boston, MA | | (914) | | - | | - | | - | | (914) |
One William | | | New York, NY | | (185) | | - | | - | | - | | (185) |
10 Hanover Square | | | New York, NY | | 493 | | - | | (493) | | - | | - |
Garrison Square | | | Boston, MA | | 159 | | | | (159) | | | | - |
Andover Place at Cross Creek | | | Tampa, FL | | - | | 672 | | - | | - | | 672 |
Station on Silver | | | Metropolitan DC | | - | | 400 | | - | | - | | 400 |
Vitruvian West Phase 2 | | | Dallas, TX | | - | | - | | - | | 55 | | 55 |
Non-Mature Homes at December 31, 2020 | | 1,535 | | 1,072 | | - | | 202 | | 2,809 | |||
| | | | | | | | | | | | | |
| | | | | | | Held for | | | | | | |
Held for Disposition Homes at December 31, 2020 | | | | Disposition | | | | | | | |||
Parallel | | | Orange County, CA | | | | 386 | | | | | | |
(1) | See Attachment 16 for definitions and other terms. |
(2) | Excludes the Acquired JV Same-Store Portfolio Communities (11 communities and 3,619 homes). |
(3) | Estimated Same-Store quarter represents the quarter UDR anticipates contributing the community to the QTD same-store pool. |
(4) | 202 homes of 366 total homes have been delivered as of December 31, 2020 as described on Attachment 9. |
11
Attachment 7(C)
UDR, Inc.
Total Revenue Per Occupied Home Summary
Portfolio Overview as of Quarter Ended
December 31, 2020
(Unaudited) (1)
| | | | Non-Mature Homes | | | | Unconsolidated | | | ||||||||
| | Total Combined | | | | | | | | Total | | Joint Venture | | Total | ||||
| | Same-Store | | | | | | Non- | | Consolidated | | Operating | | Homes | ||||
| | Homes | | Stabilized (2) | | | Stabilized (3) | | Homes | | Homes (4) | | (incl. JV at share) (4) | |||||
| | | | | | | | | | | | | | | | | | |
West Region | | | | | | | | | | | | | | | | | | |
Orange County, CA | | $ | 2,460 | | $ | - | | $ | - | | $ | 2,460 | | $ | 2,454 | | $ | 2,460 |
San Francisco, CA | | | 3,127 | | | - | | | - | | | 3,127 | | | 4,377 | | | 3,245 |
Seattle, WA | | | 2,371 | | | - | | | - | | | 2,371 | | | - | | | 2,371 |
Monterey Peninsula, CA | | | 1,954 | | | - | | | - | | | 1,954 | | | - | | | 1,954 |
Los Angeles, CA | | | 2,590 | | | - | | | - | | | 2,590 | | | 4,007 | | | 2,760 |
| | | | | | | | | | | | | | | | | | |
Mid-Atlantic Region | | | | | | | | | | | | | | | | | | |
Metropolitan DC | | | 2,131 | | | - | | | 1,922 | | | 2,121 | | | - | | | 2,121 |
Baltimore, MD | | | 1,632 | | | - | | | - | | | 1,632 | | | - | | | 1,632 |
Richmond, VA | | | 1,432 | | | - | | | - | | | 1,432 | | | - | | | 1,432 |
| | | | | | | | | | | | | | | | | | |
Northeast Region | | | | | | | | | | | | | | | | | | |
Boston, MA | | | 2,651 | | | 4,614 | | | - | | | 2,718 | | | 2,174 | | | 2,702 |
New York, NY | | | 3,482 | | | 3,107 | | | - | | | 3,407 | | | 4,557 | | | 3,557 |
| | | | | | | | | | | | | | | | | | |
Southeast Region | | | | | | | | | | | | | | | | | | |
Tampa, FL | | | 1,578 | | | 1,992 | | | 1,205 | | | 1,544 | | | - | | | 1,544 |
Orlando, FL | | | 1,427 | | | - | | | - | | | 1,427 | | | - | | | 1,427 |
Nashville, TN | | | 1,395 | | | - | | | - | | | 1,395 | | | - | | | 1,395 |
| | | | | | | | | | | | | | | | | | |
Southwest Region | | | | | | | | | | | | | | | | | | |
Dallas, TX | | | 1,479 | | | - | | | 1,435 | | | 1,476 | | | - | | | 1,476 |
Austin, TX | | | 1,551 | | | - | | | - | | | 1,551 | | | - | | | 1,551 |
| | | | | | | | | | | | | | | | | | |
Other Markets | | | 2,023 | | | 2,078 | | | - | | | 2,034 | | | 2,996 | | | 2,122 |
| | | | | | | | | | | | | | | | | | |
Weighted Average | | $ | 2,114 | | $ | 2,624 | | $ | 1,460 | | $ | 2,114 | | $ | 3,623 | | $ | 2,156 |
(1) | See Attachment 16 for definitions and other terms. |
(2) | Represents homes included in Stabilized, Non-Mature Communities category on Attachment 5. |
(3) | Represents homes included in Acquired, Development, Redevelopment and Non-Residential/Other Communities categories on Attachment 5. Excludes development homes not yet completed and Sold and Held for Disposition Communities. |
(4) | Represents joint ventures at UDR's ownership interests. Excludes joint venture held for disposition communities. See Attachment 12(A) for UDR's joint venture and partnership ownership interests. |
12
Attachment 7(D)
UDR, Inc.
Net Operating Income Breakout By Market
December 31, 2020
(Dollars in Thousands)
(Unaudited) (1)
| Three Months Ended December 31, 2020 | | | | | | |||||||||||
| | | | | | | | | | | | | | | | | |
| | Combined | | | | | UDR's | | | | | | | | | ||
| | Same-Store | | Non Same-Store (3) | | Share of JVs (3)(4) | | Total | | | | | | ||||
| | | | | | | | | | | | | | | | | |
Net Operating Income | | $ | 188,762 | | $ | 14,997 | | $ | 8,752 | | $ | 212,511 | | | | | |
| | | | | | | | | | | | | | | | | |
% of Net Operating Income | | | 88.8% | | | 7.1% | | | 4.1% | | | 100.0% | | | | | |
| | | | | | | | | | | | | | | | | |
| | | | | | | | | | | | | | | | | |
Three Months Ended December 31, 2020 | |||||||||||||||||
| | | | | | | | | | | | | | | | | |
| | As a % of NOI | | | | | As a % of NOI | ||||||||||
| | Combined | | | | | | | Combined | | | | | | |||
Region | | Same-Store | | Total | | Region | | Same-Store | | | Total | ||||||
| | | | | | | | | | | | | | | | | |
West Region | | | | | | | | Southeast Region | | | | | | | | | |
Orange County, CA | | | 14.1% | | | 13.4% | | Tampa, FL | | | 4.6% | | | | | 4.9% | |
San Francisco, CA | | | 8.4% | | | 8.7% | | Orlando, FL | | | 3.8% | | | | | 3.5% | |
Seattle, WA | | | 7.1% | | | 6.7% | | Nashville, TN | | | 3.4% | | | | | 3.1% | |
Monterey Penninsula, CA | | | 3.7% | | | 3.3% | | | | | | 11.8% | | | | | 11.5% |
Los Angeles, CA | | | 3.2% | | | 3.4% | | | | | | | | | | | |
| | | 36.5% | | | 35.5% | | Southwest Region | | | | | | | | | |
| | | | | | | | Dallas, TX | | | 5.5% | | | | | 5.2% | |
Mid-Atlantic Region | | | | | | | | Austin, TX | | | 1.8% | | | | | 1.6% | |
Metropolitan DC | | | 18.4% | | | 17.2% | | | | | | 7.3% | | | | | 6.8% |
Baltimore, MD | | | 2.8% | | | 2.6% | | | | | | | | | | | |
Richmond, VA | | | 2.3% | | | 2.1% | | Other Markets | | | 4.7% | | | | | 6.3% | |
| | | 23.5% | | | 21.9% | | | | | | | | | | | |
| | | | | | | | | | | | | | | | | |
Northeast Region | | | | | | | | | | | | | | | | | |
Boston, MA | | | 11.9% | | | 11.9% | | | | | | | | | | | |
New York, NY | | | 4.3% | | | 6.1% | | | | | | | | | | | |
| | | 16.2% | | | 18.0% | | Total | | | 100.0% | | | | | 100.0% | |
| | | | | | | | | | | | | | | | | |
(1) | See Attachment 16 for definitions and other terms. |
(2) | Other Markets are included in the map within their actual geography. See Attachment 7(A), footnote 5 for details regarding location of the Other Markets. |
(3) | Excludes results from Sold and Held for Disposition Communities. |
(4) | Includes UDR's share of joint venture and partnership NOI on Attachment 12(A). |
13
Attachment 8(A)
UDR, Inc.
Combined Same-Store Operating Information By Major Market (1)
Current Quarter vs. Prior Year Quarter
December 31, 2020
(Unaudited) (2)
| | | % of Combined | | | | | | | | | | |
| | Total | Same-Store | | Combined Same-Store | ||||||||
| | Combined | Portfolio | | | | | | | | | | |
| | Same-Store | Based on | | Physical Occupancy | | Total Revenue per Occupied Home | ||||||
| | Homes | 4Q 2020 NOI | | 4Q 20 | 4Q 19 | Change | | 4Q 20 | 4Q 19 | Change | ||
| | | | | | | | | | | | | |
West Region | | | | | | | | | | | | | |
Orange County, CA | | 4,950 | 14.1% | | 96.3% | 96.7% | -0.4% | | $ | 2,460 | $ | 2,521 | -2.4% |
San Francisco, CA | | 2,751 | 8.4% | | 90.4% | 96.3% | -5.9% | | | 3,127 | | 3,766 | -17.0% |
Seattle, WA | | 2,725 | 7.1% | | 97.0% | 96.5% | 0.5% | | | 2,371 | | 2,537 | -6.5% |
Monterey Peninsula, CA | | 1,565 | 3.7% | | 96.6% | 96.5% | 0.1% | | | 1,954 | | 1,931 | 1.2% |
Los Angeles, CA | | 1,225 | 3.2% | | 94.1% | 97.0% | -2.9% | | | 2,590 | | 2,916 | -11.2% |
| | 13,216 | 36.5% | | 95.0% | 96.6% | -1.6% | | | 2,524 | | 2,750 | -8.2% |
| | | | | | | | | | | | | |
Mid-Atlantic Region | | | | | | | | | | | | | |
Metropolitan DC | | 8,002 | 18.4% | | 96.5% | 97.1% | -0.6% | | | 2,131 | | 2,176 | -2.1% |
Baltimore, MD | | 1,597 | 2.8% | | 98.0% | 96.1% | 1.9% | | | 1,632 | | 1,617 | 0.9% |
Richmond, VA | | 1,358 | 2.3% | | 98.7% | 96.9% | 1.8% | | | 1,432 | | 1,409 | 1.6% |
| | 10,957 | 23.5% | | 97.0% | 96.9% | 0.1% | | | 1,969 | | 2,000 | -1.5% |
| | | | | | | | | | | | | |
Northeast Region | | | | | | | | | | | | | |
Boston, MA | | 4,139 | 11.9% | | 94.4% | 95.9% | -1.5% | | | 2,651 | | 2,784 | -4.8% |
New York, NY | | 1,825 | 4.3% | | 93.9% | 97.8% | -3.9% | | | 3,482 | | 4,292 | -18.9% |
| | 5,964 | 16.2% | | 94.3% | 96.5% | -2.2% | | | 2,901 | | 3,252 | -10.8% |
| | | | | | | | | | | | | |
Southeast Region | | | | | | | | | | | | | |
Tampa, FL | | 2,908 | 4.6% | | 97.2% | 96.8% | 0.4% | | | 1,578 | | 1,515 | 4.2% |
Orlando, FL | | 2,500 | 3.8% | | 96.7% | 96.3% | 0.4% | | | 1,427 | | 1,416 | 0.8% |
Nashville, TN | | 2,260 | 3.4% | | 97.6% | 97.9% | -0.3% | | | 1,395 | | 1,344 | 3.8% |
| | 7,668 | 11.8% | | 97.2% | 97.0% | 0.2% | | | 1,475 | | 1,432 | 3.0% |
| | | | | | | | | | | | | |
Southwest Region | | | | | | | | | | | | | |
Dallas, TX | | 3,864 | 5.5% | | 96.9% | 96.7% | 0.2% | | | 1,479 | | 1,488 | -0.6% |
Austin, TX | | 1,272 | 1.8% | | 97.5% | 96.9% | 0.6% | | | 1,551 | | 1,530 | 1.4% |
| | 5,136 | 7.3% | | 97.1% | 96.7% | 0.4% | | | 1,495 | | 1,497 | -0.2% |
| | | | | | | | | | | | | |
Other Markets | | 2,147 | 4.7% | | 97.4% | 95.8% | 1.6% | | | 2,023 | | 2,063 | -1.9% |
| | | | | | | | | | | | | |
Total Combined/ Weighted Avg. | | 45,088 | 100.0% | | 96.1% | 96.7% | -0.6% | | $ | 2,114 | $ | 2,234 | -5.3% |
(1) | 4Q19 amounts include the Acquired JV Same-Store Portfolio Communities (the 11 communities and 3,619 homes previously owned by UDR unconsolidated JVs) as if these communities were 100% owned by UDR during all periods presented. |
(2) | See Attachment 16 for definitions and other terms. |
14
Attachment 8(B)
UDR, Inc.
Combined Same-Store Operating Information By Major Market(1)
Current Quarter vs. Prior Year Quarter
December 31, 2020
(Unaudited) (2)
| | | | Combined Same-Store ($000s) | |||||||||||||||
| Total | | | | | | | | | | | | | | | | | | |
| Combined | | | | | | | | | | | | | | | | | | |
| Same-Store | | Revenues | | Expenses | | Net Operating Income | ||||||||||||
| Homes | | 4Q 20 | 4Q 19 | Change | | 4Q 20 | 4Q 19 | Change | | 4Q 20 | 4Q 19 | Change | ||||||
| | | | | | | | | | | | | | | | | | | |
West Region | | | | | | | | | | | | | | | | | | | |
Orange County, CA | 4,950 | | $ | 35,180 | $ | 36,208 | -2.8% | | $ | 8,521 | $ | 8,366 | 1.8% | | $ | 26,659 | $ | 27,842 | -4.2% |
San Francisco, CA | 2,751 | | | 23,330 | | 29,933 | -22.1% | | | 7,426 | | 7,272 | 2.1% | | | 15,904 | | 22,661 | -29.8% |
Seattle, WA | 2,725 | | | 18,800 | | 20,017 | -6.1% | | | 5,408 | | 5,025 | 7.6% | | | 13,392 | | 14,992 | -10.7% |
Monterey Peninsula, CA | 1,565 | | | 8,861 | | 8,750 | 1.3% | | | 1,933 | | 1,817 | 6.4% | | | 6,928 | | 6,933 | -0.1% |
Los Angeles, CA | 1,225 | | | 8,958 | | 10,394 | -13.8% | | | 2,865 | | 2,615 | 9.6% | | | 6,093 | | 7,779 | -21.7% |
| 13,216 | | | 95,129 | | 105,302 | -9.7% | | | 26,153 | | 25,095 | 4.2% | | | 68,976 | | 80,207 | -14.0% |
| | | | | | | | | | | | | | | | | | | |
Mid-Atlantic Region | | | | | | | | | | | | | | | | | | | |
Metropolitan DC | 8,002 | | | 49,372 | | 50,718 | -2.7% | | | 14,654 | | 14,681 | -0.2% | | | 34,718 | | 36,037 | -3.7% |
Baltimore, MD | 1,597 | | | 7,663 | | 7,446 | 2.9% | | | 2,382 | | 2,243 | 6.2% | | | 5,281 | | 5,203 | 1.5% |
Richmond, VA | 1,358 | | | 5,758 | | 5,562 | 3.5% | | | 1,451 | | 1,382 | 4.9% | | | 4,307 | | 4,180 | 3.0% |
| 10,957 | | | 62,793 | | 63,726 | -1.5% | | | 18,487 | | 18,306 | 1.0% | | | 44,306 | | 45,420 | -2.5% |
| | | | | | | | | | | | | | | | | | | |
Northeast Region | | | | | | | | | | | | | | | | | | | |
Boston, MA | 4,139 | | | 31,072 | | 33,147 | -6.3% | | | 8,621 | | 8,657 | -0.4% | | | 22,451 | | 24,490 | -8.3% |
New York, NY | 1,825 | | | 17,900 | | 22,982 | -22.1% | | | 9,851 | | 8,438 | 16.8% | | | 8,049 | | 14,544 | -44.7% |
| 5,964 | | | 48,972 | | 56,129 | -12.8% | | | 18,472 | | 17,095 | 8.1% | | | 30,500 | | 39,034 | -21.9% |
| | | | | | | | | | | | | | | | | | | |
Southeast Region | | | | | | | | | | | | | | | | | | | |
Tampa, FL | 2,908 | | | 13,382 | | 12,798 | 4.6% | | | 4,745 | | 4,326 | 9.7% | | | 8,637 | | 8,472 | 1.9% |
Orlando, FL | 2,500 | | | 10,349 | | 10,225 | 1.2% | | | 3,203 | | 3,013 | 6.3% | | | 7,146 | | 7,212 | -0.9% |
Nashville, TN | 2,260 | | | 9,229 | | 8,919 | 3.5% | | | 2,705 | | 2,339 | 15.6% | | | 6,524 | | 6,580 | -0.8% |
| 7,668 | | | 32,960 | | 31,942 | 3.2% | | | 10,653 | | 9,678 | 10.1% | | | 22,307 | | 22,264 | 0.2% |
| | | | | | | | | | | | | | | | | | | |
Southwest Region | | | | | | | | | | | | | | | | | | | |
Dallas, TX | 3,864 | | | 16,608 | | 16,676 | -0.4% | | | 6,147 | | 6,096 | 0.8% | | | 10,461 | | 10,580 | -1.1% |
Austin, TX | 1,272 | | | 5,771 | | 5,658 | 2.0% | | | 2,411 | | 2,127 | 13.4% | | | 3,360 | | 3,531 | -4.8% |
| 5,136 | | | 22,379 | | 22,334 | 0.2% | | | 8,558 | | 8,223 | 4.1% | | | 13,821 | | 14,111 | -2.1% |
| | | | | | | | | | | | | | | | | | | |
Other Markets | 2,147 | | | 12,689 | | 12,734 | -0.4% | | | 3,837 | | 3,794 | 1.1% | | | 8,852 | | 8,940 | -1.0% |
| | | | | | | | | | | | | | | | | | | |
Total Combined (3)(4) | 45,088 | | $ | 274,922 | $ | 292,167 | -5.9% | | $ | 86,160 | $ | 82,191 | 4.8% | | $ | 188,762 | $ | 209,976 | -10.1% |
(1) | 4Q 19 amounts include the Acquired JV Same-Store Portfolio Communities (the 11 communities and 3,619 homes previously owned by UDR unconsolidated JVs) as if these communities were 100% owned by UDR during all periods presented. |
(2) | See Attachment 16 for definitions and other terms. |
(3) | 4Q 20 includes a reserve (reflected as a reduction to revenues) of approximately $3.8 million or 1.4% of billed residential revenue on our Combined Same-Store Communities. The reserve is based on probability of collection. |
(4) | With concessions reflected on a straight-line basis, Combined Same-Store revenue and Combined Same-Store NOI decreased year-over-year by -4.5% and -8.1%, respectively. See Attachment 16(A) for definitions and reconciliations. |
15
Attachment 8(C)
UDR, Inc.
Combined Same-Store Operating Information By Major Market
Current Quarter vs. Last Quarter
December 31, 2020
(Unaudited) (1)
| | Total | | Combined Same-Store | ||||||||
| | Combined | | | | | | | | | | |
| | Same-Store | | Physical Occupancy | | Total Revenue per Occupied Home | ||||||
| | Homes | | 4Q 20 | 3Q 20 | Change | | 4Q 20 | 3Q 20 | Change | ||
| | | | | | | | | | | | |
West Region | | | | | | | | | | | | |
Orange County, CA | | 4,950 | | 96.3% | 96.3% | 0.0% | | $ | 2,460 | $ | 2,474 | -0.6% |
San Francisco, CA | | 2,751 | | 90.4% | 86.3% | 4.1% | | | 3,127 | | 3,453 | -9.4% |
Seattle, WA | | 2,725 | | 97.0% | 95.6% | 1.4% | | | 2,371 | | 2,446 | -3.1% |
Monterey Peninsula, CA | | 1,565 | | 96.6% | 97.2% | -0.6% | | | 1,954 | | 1,935 | 1.0% |
Los Angeles, CA | | 1,225 | | 94.1% | 95.0% | -0.9% | | | 2,590 | | 2,734 | -5.3% |
| | 13,216 | | 95.0% | 94.1% | 0.9% | | | 2,524 | | 2,613 | -3.4% |
| | | | | | | | | | | | |
Mid-Atlantic Region | | | | | | | | | | | | |
Metropolitan DC | | 8,002 | | 96.5% | 96.4% | 0.1% | | | 2,131 | | 2,137 | -0.3% |
Baltimore, MD | | 1,597 | | 98.0% | 97.3% | 0.7% | | | 1,632 | | 1,635 | -0.2% |
Richmond, VA | | 1,358 | | 98.7% | 98.1% | 0.6% | | | 1,432 | | 1,434 | -0.1% |
| | 10,957 | | 97.0% | 96.7% | 0.3% | | | 1,969 | | 1,975 | -0.3% |
| | | | | | | | | | | | |
Northeast Region | | | | | | | | | | | | |
Boston, MA | | 4,139 | | 94.4% | 94.3% | 0.1% | | | 2,651 | | 2,579 | 2.8% |
New York, NY | | 1,825 | | 93.9% | 88.5% | 5.4% | | | 3,482 | | 3,761 | -7.4% |
| | 5,964 | | 94.3% | 92.5% | 1.8% | | | 2,901 | | 2,925 | -0.8% |
| | | | | | | | | | | | |
Southeast Region | | | | | | | | | | | | |
Tampa, FL | | 2,908 | | 97.2% | 96.9% | 0.3% | | | 1,578 | | 1,540 | 2.5% |
Orlando, FL | | 2,500 | | 96.7% | 97.2% | -0.5% | | | 1,427 | | 1,407 | 1.4% |
Nashville, TN | | 2,260 | | 97.6% | 97.8% | -0.2% | | | 1,395 | | 1,398 | -0.2% |
| | 7,668 | | 97.2% | 97.3% | -0.1% | | | 1,475 | | 1,455 | 1.4% |
| | | | | | | | | | | | |
Southwest Region | | | | | | | | | | | | |
Dallas, TX | | 3,864 | | 96.9% | 96.6% | 0.3% | | | 1,479 | | 1,483 | -0.3% |
Austin, TX | | 1,272 | | 97.5% | 97.6% | -0.1% | | | 1,551 | | 1,570 | -1.2% |
| | 5,136 | | 97.1% | 96.9% | 0.2% | | | 1,495 | | 1,504 | -0.6% |
| | | | | | | | | | | | |
Other Markets | | 2,147 | | 97.4% | 97.1% | 0.3% | | | 2,023 | | 2,029 | -0.3% |
| | | | | | | | | | | | |
Total Combined/ Weighted Avg. | | 45,088 | | 96.1% | 95.5% | 0.6% | | $ | 2,114 | $ | 2,141 | -1.3% |
(1) | See Attachment 16 for definitions and other terms. |
16
Attachment 8(D)
UDR, Inc.
Combined Same-Store Operating Information By Major Market
Current Quarter vs. Last Quarter
December 31, 2020
(Unaudited) (1)
| Total | | | Combined Same-Store ($000s) | |||||||||||||||
| Combined | | | | | | | | | | | | | | | | | | |
| Same-Store | | Revenues | | Expenses | | Net Operating Income | ||||||||||||
| Homes | | 4Q 20 | 3Q 20 | Change | | 4Q 20 | 3Q 20 | Change | | 4Q 20 | 3Q 20 | Change | ||||||
| | | | | | | | | | | | | | | | | | | |
West Region | | | | | | | | | | | | | | | | | | | |
Orange County, CA | 4,950 | | $ | 35,180 | $ | 35,384 | -0.6% | | $ | 8,521 | $ | 8,628 | -1.2% | | $ | 26,659 | $ | 26,756 | -0.4% |
San Francisco, CA | 2,751 | | | 23,330 | | 24,595 | -5.1% | | | 7,426 | | 7,259 | 2.3% | | | 15,904 | | 17,336 | -8.3% |
Seattle, WA | 2,725 | | | 18,800 | | 19,114 | -1.6% | | | 5,408 | | 5,522 | -2.1% | | | 13,392 | | 13,592 | -1.5% |
Monterey Peninsula, CA | 1,565 | | | 8,861 | | 8,832 | 0.3% | | | 1,933 | | 1,888 | 2.4% | | | 6,928 | | 6,944 | -0.2% |
Los Angeles, CA | 1,225 | | | 8,958 | | 9,546 | -6.2% | | | 2,865 | | 2,794 | 2.5% | | | 6,093 | | 6,752 | -9.8% |
| 13,216 | | | 95,129 | | 97,471 | -2.4% | | | 26,153 | | 26,091 | 0.2% | | | 68,976 | | 71,380 | -3.4% |
| | | | | | | | | | | | | | | | | | | |
Mid-Atlantic Region | | | | | | | | | | | | | | | | | | | |
Metropolitan DC | 8,002 | | | 49,372 | | 49,457 | -0.2% | | | 14,654 | | 15,756 | -7.0% | | | 34,718 | | 33,701 | 3.0% |
Baltimore, MD | 1,597 | | | 7,663 | | 7,624 | 0.5% | | | 2,382 | | 2,387 | -0.2% | | | 5,281 | | 5,237 | 0.8% |
Richmond, VA | 1,358 | | | 5,758 | | 5,733 | 0.4% | | | 1,451 | | 1,482 | -2.1% | | | 4,307 | | 4,251 | 1.3% |
| 10,957 | | | 62,793 | | 62,814 | 0.0% | | | 18,487 | | 19,625 | -5.8% | | | 44,306 | | 43,189 | 2.6% |
| | | | | | | | | | | | | | | | | | | |
Northeast Region | | | | | | | | | | | | | | | | | | | |
Boston, MA | 4,139 | | | 31,072 | | 30,199 | 2.9% | | | 8,621 | | 9,129 | -5.6% | | | 22,451 | | 21,070 | 6.6% |
New York, NY | 1,825 | | | 17,900 | | 18,224 | -1.8% | | | 9,851 | | 9,934 | -0.8% | | | 8,049 | | 8,290 | -2.9% |
| 5,964 | | | 48,972 | | 48,423 | 1.1% | | | 18,472 | | 19,063 | -3.1% | | | 30,500 | | 29,360 | 3.9% |
| | | | | | | | | | | | | | | | | | | |
Southeast Region | | | | | | | | | | | | | | | | | | | |
Tampa, FL | 2,908 | | | 13,382 | | 13,018 | 2.8% | | | 4,745 | | 4,855 | -2.3% | | | 8,637 | | 8,163 | 5.8% |
Orlando, FL | 2,500 | | | 10,349 | | 10,260 | 0.9% | | | 3,203 | | 3,294 | -2.8% | | | 7,146 | | 6,966 | 2.6% |
Nashville, TN | 2,260 | | | 9,229 | | 9,273 | -0.5% | | | 2,705 | | 2,709 | -0.2% | | | 6,524 | | 6,564 | -0.6% |
| 7,668 | | | 32,960 | | 32,551 | 1.3% | | | 10,653 | | 10,858 | -1.9% | | | 22,307 | | 21,693 | 2.8% |
| | | | | | | | | | | | | | | | | | | |
Southwest Region | | | | | | | | | | | | | | | | | | | |
Dallas, TX | 3,864 | | | 16,608 | | 16,604 | 0.0% | | | 6,147 | | 6,926 | -11.2% | | | 10,461 | | 9,678 | 8.1% |
Austin, TX | 1,272 | | | 5,771 | | 5,849 | -1.3% | | | 2,411 | | 2,462 | -2.1% | | | 3,360 | | 3,387 | -0.8% |
| 5,136 | | | 22,379 | | 22,453 | -0.3% | | | 8,558 | | 9,388 | -8.8% | | | 13,821 | | 13,065 | 5.8% |
| | | | | | | | | | | | | | | | | | | |
Other Markets | 2,147 | | | 12,689 | | 12,690 | 0.0% | | | 3,837 | | 4,084 | -6.0% | | | 8,852 | | 8,606 | 2.8% |
| | | | | | | | | | | | | | | | | | | |
Total Combined (2)(3) | 45,088 | | $ | 274,922 | $ | 276,402 | -0.5% | | $ | 86,160 | $ | 89,109 | -3.3% | | $ | 188,762 | $ | 187,293 | 0.8% |
(1) | See Attachment 16 for definitions and other terms. |
(2) | 4Q20 and 3Q20 include reserves (reflected as a reduction to revenues) of approximately $3.8 million and $3.4 million or 1.4% and 1.2%, respectively, of billed residential revenue on our Combined Same-Store Communities. The reserve is based on probability of collection. |
(3) | With concessions reflected on a straight-line basis, Combined Same-Store revenue and Combined Same-Store NOI decreased quarter-over-quarter by -1.8% and -1.1%, respectively. See Attachment 16(A) for definitions and reconciliations. |
17
Attachment 8(E)
UDR, Inc.
Combined Same-Store Operating Information By Major Market (1)
Current Year-to-Date vs. Prior Year-to-Date
December 31, 2020
(Unaudited) (2)
| | Total | % of Combined | | | | | | | | | | |
| | Combined | Same-Store Portfolio | | Combined Same-Store | ||||||||
| | Same-Store | Based on | | Physical Occupancy | | Total Revenue per Occupied Home | ||||||
| | Homes | YTD 2020 NOI | | YTD 20 | YTD 19 | Change | | YTD 20 | YTD 19 | Change | ||
| | | | | | | | | | | | | |
West Region | | | | | | | | | | | | | |
Orange County, CA | | 4,434 | 13.0% | | 96.5% | 96.3% | 0.2% | | $ | 2,328 | $ | 2,354 | -1.1% |
San Francisco, CA | | 2,751 | 10.9% | | 91.5% | 96.8% | -5.3% | | | 3,502 | | 3,749 | -6.6% |
Seattle, WA | | 2,570 | 7.5% | | 96.7% | 96.6% | 0.1% | | | 2,472 | | 2,525 | -2.1% |
Monterey Peninsula, CA | | 1,565 | 3.9% | | 96.6% | 96.6% | 0.0% | | | 1,941 | | 1,893 | 2.5% |
Los Angeles, CA | | 1,225 | 3.9% | | 95.5% | 96.6% | -1.1% | | | 2,765 | | 2,903 | -4.8% |
| | 12,545 | 39.2% | | 95.4% | 96.5% | -1.1% | | | 2,599 | | 2,692 | -3.5% |
| | | | | | | | | | | | | |
Mid-Atlantic Region | | | | | | | | | | | | | |
Metropolitan DC | | 8,002 | 19.6% | | 96.7% | 97.1% | -0.4% | | | 2,150 | | 2,162 | -0.6% |
Baltimore, MD | | 1,099 | 2.2% | | 97.6% | 96.8% | 0.8% | | | 1,731 | | 1,732 | -0.1% |
Richmond, VA | | 1,358 | 2.4% | | 97.8% | 97.4% | 0.4% | | | 1,422 | | 1,392 | 2.2% |
| | 10,459 | 24.2% | | 96.9% | 97.1% | -0.2% | | | 2,010 | | 2,017 | -0.3% |
| | | | | | | | | | | | | |
Northeast Region | | | | | | | | | | | | | |
Boston, MA | | 2,440 | 7.9% | | 95.6% | 96.0% | -0.4% | | | 2,727 | | 2,823 | -3.4% |
New York, NY | | 1,452 | 4.7% | | 92.6% | 97.9% | -5.3% | | | 4,133 | | 4,550 | -9.2% |
| | 3,892 | 12.6% | | 94.5% | 96.7% | -2.2% | | | 3,241 | | 3,475 | -6.7% |
| | | | | | | | | | | | | |
Southeast Region | | | | | | | | | | | | | |
Tampa, FL | | 2,287 | 3.7% | | 97.1% | 96.9% | 0.2% | | | 1,483 | | 1,453 | 2.1% |
Orlando, FL | | 2,500 | 4.0% | | 96.8% | 96.4% | 0.4% | | | 1,413 | | 1,409 | 0.3% |
Nashville, TN | | 2,260 | 3.7% | | 97.8% | 97.5% | 0.3% | | | 1,378 | | 1,333 | 3.4% |
| | 7,047 | 11.4% | | 97.2% | 96.9% | 0.3% | | | 1,424 | | 1,399 | 1.8% |
| | | | | | | | | | | | | |
Southwest Region | | | | | | | | | | | | | |
Dallas, TX | | 3,864 | 5.7% | | 96.8% | 96.3% | 0.5% | | | 1,487 | | 1,475 | 0.8% |
Austin, TX | | 1,272 | 1.9% | | 97.6% | 97.3% | 0.3% | | | 1,549 | | 1,524 | 1.6% |
| | 5,136 | 7.6% | | 97.0% | 96.5% | 0.5% | | | 1,502 | | 1,487 | 1.0% |
| | | | | | | | | | | | | |
Other Markets | | 2,147 | 5.0% | | 96.8% | 96.0% | 0.8% | | | 2,032 | | 2,048 | -0.8% |
| | | | | | | | | | | | | |
Total Combined/ Weighted Avg. | | 41,226 | 100.0% | | 96.3% | 96.7% | -0.4% | | $ | 2,138 | $ | 2,189 | -2.3% |
(1) | YTD 19 amounts include the Acquired JV Same-Store Portfolio Communities (the 11 communities and 3,619 homes previously owned by UDR unconsolidated JVs) as if these communities were 100% owned by UDR during all periods presented. |
(2) | See Attachment 16 for definitions and other terms. |
18
Attachment 8(F)
UDR, Inc.
Combined Same-Store Operating Information By Major Market (1)
Current Year-to-Date vs. Prior Year-to-Date
December 31, 2020
(Unaudited) (2)
| Total | | | Combined Same-Store ($000s) | |||||||||||||||
| Combined | | | | | | | | | | | | | | | | | | |
| Same-Store | | Revenues | | Expenses | | Net Operating Income | ||||||||||||
| Homes | | YTD 20 | YTD 19 | Change | | YTD 20 | YTD 19 | Change | | YTD 20 | YTD 19 | Change | ||||||
| | | | | | | | | | | | | | | | | | | |
West Region | | | | | | | | | | | | | | | | | | | |
Orange County, CA | 4,434 | | $ | 119,550 | $ | 120,627 | -0.9% | | $ | 27,846 | $ | 26,968 | 3.3% | | $ | 91,704 | $ | 93,659 | -2.1% |
San Francisco, CA | 2,751 | | | 105,778 | | 119,806 | -11.7% | | | 29,018 | | 28,496 | 1.8% | | | 76,760 | | 91,310 | -15.9% |
Seattle, WA | 2,570 | | | 73,707 | | 75,217 | -2.0% | | | 20,697 | | 19,700 | 5.1% | | | 53,010 | | 55,517 | -4.5% |
Monterey Peninsula, CA | 1,565 | | | 35,205 | | 34,343 | 2.5% | | | 7,618 | | 7,405 | 2.9% | | | 27,587 | | 26,938 | 2.4% |
Los Angeles, CA | 1,225 | | | 38,814 | | 41,228 | -5.9% | | | 11,229 | | 10,795 | 4.0% | | | 27,585 | | 30,433 | -9.4% |
| 12,545 | | | 373,054 | | 391,221 | -4.6% | | | 96,408 | | 93,364 | 3.3% | | | 276,646 | | 297,857 | -7.1% |
| | | | | | | | | | | | | | | | | | | |
Mid-Atlantic Region | | | | | | | | | | | | | | | | | | | |
Metropolitan DC | 8,002 | | | 199,638 | | 201,552 | -0.9% | | | 60,743 | | 60,115 | 1.0% | | | 138,895 | | 141,437 | -1.8% |
Baltimore, MD | 1,099 | | | 22,284 | | 22,106 | 0.8% | | | 6,974 | | 6,548 | 6.5% | | | 15,310 | | 15,558 | -1.6% |
Richmond, VA | 1,358 | | | 22,668 | | 22,095 | 2.6% | | | 5,794 | | 5,524 | 4.9% | | | 16,874 | | 16,571 | 1.8% |
| 10,459 | | | 244,590 | | 245,753 | -0.5% | | | 73,511 | | 72,187 | 1.8% | | | 171,079 | | 173,566 | -1.4% |
| | | | | | | | | | | | | | | | | | | |
Northeast Region | | | | | | | | | | | | | | | | | | | |
Boston, MA | 2,440 | | | 76,338 | | 79,356 | -3.8% | | | 20,418 | | 20,850 | -2.1% | | | 55,920 | | 58,506 | -4.4% |
New York, NY | 1,452 | | | 66,691 | | 77,622 | -14.1% | | | 33,510 | | 29,187 | 14.8% | | | 33,181 | | 48,435 | -31.5% |
| 3,892 | | | 143,029 | | 156,978 | -8.9% | | | 53,928 | | 50,037 | 7.8% | | | 89,101 | | 106,941 | -16.7% |
| | | | | | | | | | | | | | | | | | | |
Southeast Region | | | | | | | | | | | | | | | | | | | |
Tampa, FL | 2,287 | | | 39,527 | | 38,635 | 2.3% | | | 13,578 | | 12,618 | 7.6% | | | 25,949 | | 26,017 | -0.3% |
Orlando, FL | 2,500 | | | 41,022 | | 40,735 | 0.7% | | | 12,481 | | 11,969 | 4.3% | | | 28,541 | | 28,766 | -0.8% |
Nashville, TN | 2,260 | | | 36,547 | | 35,244 | 3.7% | | | 10,604 | | 9,537 | 11.2% | | | 25,943 | | 25,707 | 0.9% |
| 7,047 | | | 117,096 | | 114,614 | 2.2% | | | 36,663 | | 34,124 | 7.4% | | | 80,433 | | 80,490 | -0.1% |
| | | | | | | | | | | | | | | | | | | |
Southwest Region | | | | | | | | | | | | | | | | | | | |
Dallas, TX | 3,864 | | | 66,746 | | 65,852 | 1.4% | | | 26,271 | | 26,349 | -0.3% | | | 40,475 | | 39,503 | 2.5% |
Austin, TX | 1,272 | | | 23,075 | | 22,634 | 1.9% | | | 9,468 | | 9,306 | 1.7% | | | 13,607 | | 13,328 | 2.1% |
| 5,136 | | | 89,821 | | 88,486 | 1.5% | | | 35,739 | | 35,655 | 0.2% | | | 54,082 | | 52,831 | 2.4% |
| | | | | | | | | | | | | | | | | | | |
Other Markets | 2,147 | | | 50,686 | | 50,652 | 0.1% | | | 15,345 | | 15,116 | 1.5% | | | 35,341 | | 35,536 | -0.5% |
| | | | | | | | | | | | | | | | | | | |
Total Combined (3)(4) | 41,226 | | $ | 1,018,276 | $ | 1,047,704 | -2.8% | | $ | 311,594 | $ | 300,483 | 3.7% | | $ | 706,682 | $ | 747,221 | -5.4% |
(1) | YTD 19 amounts include the Acquired JV Same-Store Portfolio Communities (the 11 communities and 3,619 homes previously owned by UDR unconsolidated JVs) as if these communities were 100% owned by UDR during all periods presented. |
(2) | See Attachment 16 for definitions and other terms. |
(3) | YTD 20 includes a reserve (reflected as a reduction to revenues) of approximately $11.0 million or 1.1% of billed residential revenue on our Combined Same-Store Communities. The reserve is based on probability of collection. |
(4) | With concessions reflected on a straight-line basis, Combined Same-Store revenue and Combined Same-Store NOI decreased year-over-year by -1.7% and -3.9%, respectively. See Attachment 16(A) for definitions and reconciliations. |
19
Attachment 8(G)
UDR, Inc.
Combined Same-Store Operating Information By Major Market (1)
December 31, 2020
(Unaudited) (2)
| | Combined Effective Blended Lease Rate Growth | | Combined Effective New Lease Rate Growth | | Combined Effective Renewal Lease Rate Growth | | Combined Annualized Turnover (3)(4) | |||
| | 4Q 2020 | | 4Q 2020 | | 4Q 2020 | | 4Q 2020 | 4Q 2019 | YTD 2020 | YTD 2019 |
| | | | | | | | | | | |
West Region | | | | | | | | | | | |
Orange County, CA | | -0.3% | | -2.3% | | 3.1% | | 43.4% | 53.0% | 50.1% | 58.7% |
San Francisco, CA | | -1.9% | | -3.1% | | -1.5% | | 58.0% | 45.3% | 60.4% | 56.0% |
Seattle, WA | | -3.3% | | -7.2% | | -0.5% | | 48.2% | 47.8% | 52.7% | 53.4% |
Monterey Peninsula, CA | | 3.9% | | 5.8% | | 2.3% | | 36.0% | 41.1% | 37.8% | 42.6% |
Los Angeles, CA | | -2.2% | | -5.4% | | 1.6% | | 42.4% | 35.9% | 45.8% | 46.6% |
| | -0.8% | | -2.6% | | 1.2% | | 47.5% | 47.9% | 51.7% | 54.5% |
| | | | | | | | | | | |
Mid-Atlantic Region | | | | | | | | | | | |
Metropolitan DC | | -1.6% | | -5.2% | | 2.2% | | 33.7% | 30.0% | 41.7% | 42.4% |
Baltimore, MD | | 2.1% | | 0.5% | | 4.0% | | 37.8% | 37.0% | 48.6% | 49.4% |
Richmond, VA | | 6.2% | | 7.0% | | 5.6% | | 28.6% | 35.9% | 44.1% | 46.5% |
| | -0.3% | | -3.2% | | 2.8% | | 33.8% | 32.0% | 43.2% | 44.1% |
| | | | | | | | | | | |
Northeast Region | | | | | | | | | | | |
Boston, MA | | 0.5% | | -2.0% | | 2.4% | | 38.0% | 34.9% | 46.7% | 38.9% |
New York, NY | | -6.7% | | -11.6% | | -4.9% | | 31.7% | 21.7% | 53.7% | 33.0% |
| | -1.2% | | -3.5% | | 0.3% | | 36.3% | 32.1% | 49.1% | 37.3% |
| | | | | | | | | | | |
Southeast Region | | | | | | | | | | | |
Tampa, FL | | 3.4% | | 2.2% | | 4.8% | | 44.9% | 41.5% | 53.9% | 51.2% |
Orlando, FL | | -0.4% | | -3.9% | | 3.4% | | 44.8% | 44.6% | 50.4% | 51.0% |
Nashville, TN | | -0.8% | | -4.6% | | 3.4% | | 40.4% | 37.9% | 47.0% | 47.7% |
| | 1.0% | | -1.7% | | 4.0% | | 43.6% | 41.6% | 50.9% | 50.1% |
| | | | | | | | | | | |
Southwest Region | | | | | | | | | | | |
Dallas, TX | | -0.9% | | -4.9% | | 3.6% | | 47.1% | 44.9% | 51.4% | 51.3% |
Austin, TX | | -1.2% | | -4.9% | | 3.8% | | 45.5% | 39.6% | 47.9% | 50.6% |
| | -0.9% | | -4.9% | | 3.7% | | 46.7% | 43.7% | 50.6% | 51.1% |
| | | | | | | | | | | |
Other Markets | | 3.5% | | 2.2% | | 4.8% | | 40.7% | 48.5% | 45.6% | 50.7% |
| | | | | | | | | | | |
Total Combined/Weighted Avg. | | -0.3% | | -2.7% | | 2.2% | | 41.1% | 39.9% | 48.4% | 48.1% |
| | | | | | | | | | | |
| | | | | | | | | | | |
4Q 2019 Combined Weighted Avg. Lease Rate Growth (4) | | 2.3% | | -0.5% | | 5.2% | | | | | |
| | | | | | | | | | | |
| | | | | | | | | | | |
4Q 2020 Combined Percentage of Total Repriced Homes | | | | 50.6% | | 49.4% | | | | | |
(1) | 4Q19 and YTD19 amounts include the Acquired JV Same-Store Portfolio Communities (the 11 communities and 3,619 homes previously owned by UDR unconsolidated JVs) as if these communities were 100% owned by UDR during all periods presented. |
(2) | See Attachment 16 for definitions and other terms. |
(3) | 4Q20 Combined same-store home count: 45,088. YTD 2020 Combined same-store home count: 41,226. |
(4) | 4Q19 Combined same-store home count: 41,796. YTD 2019 Combined same-store home count: 41,578. |
20
Attachment 9
UDR, Inc.
Development Summary
December 31, 2020
(Dollars in Thousands)
(Unaudited) (1)
Wholly-Owned | | | | | | | | | | | | | | | | | | | | | |
| | | | | | | | | | | | | | | Schedule | | | Percentage | |||
| | # of | Compl. | Cost to | Budgeted | Est. Cost | | Project | | | Initial | | | | | | |||||
Community | Location | Homes | Homes | Date | Cost | per Home | | Debt | Start | Occ. | Compl. | | Leased | | Occupied | ||||||
| | | | | | | | | | | | | | | | | | | | | |
Projects Under Construction | | | | | | | | | | | | | | | | | | | | | |
Vitruvian West Phase 2 | Addison, TX | | 366 | 202 | $ | 57,024 | $ | 64,000 | $ | 175 | | $ | - | | 1Q19 | 2Q20 | 1Q21 | | 50.8% | | 46.2% |
Cirrus | Denver, CO | | 292 | - | | 67,125 | | 97,500 | | 334 | | | - | | 3Q19 | 4Q21 | 1Q22 | | - | | - |
5421 at Dublin Station | Dublin, CA | | 220 | - | | 57,799 | | 117,000 | | 532 | | | - | | 4Q19 | 4Q21 | 2Q22 | | - | | - |
Village at Valley Forge | King of Prussia, PA | | 200 | - | | 20,010 | | 68,000 | | 340 | | | - | | 4Q20 | 2Q22 | 3Q22 | | - | | - |
440 Penn Street | Washington, DC | | 300 | - | | 45,919 | | 145,000 | | 483 | | | - | | 3Q20 | 1Q23 | 2Q23 | | - | | - |
Total Under Construction | | | 1,378 | 202 | $ | 247,877 | $ | 491,500 | $ | 357 | | $ | - | | | | | | | | |
| | | | | | | | | | | | | | | | | | | | | |
Completed Projects, Non-Stabilized | | | | | | | | | | | | | | | | | | | |||
N/A | N/A | | - | - | $ | - | $ | - | $ | - | | $ | - | | N/A | N/A | N/A | | - | | - |
Total Completed, Non-Stabilized | | | - | - | $ | - | $ | - | $ | - | | $ | - | | | | | | | | |
| | | | | | | | | | | | | | | | | | | | | |
Total - Wholly Owned | | | 1,378 | 202 | $ | 247,877 | $ | 491,500 | $ | 357 | | $ | - | | | | | | | | |
| | | | | | | | | | | | | | | | | | | | | |
| | | | | | | | | | | | | | | | | | | | | |
NOI From Wholly-Owned Projects | | | | | | | | | | UDR's Capitalized Interest | | | | | | ||||||
| | 4Q 20 | | | | | | | | | | | 4Q 20 | | | | | | | ||
| | | | | | | | | | | | | | | | | | | | | |
Projects Under Construction | | $ | 324 | | | | | | | | | | | $ | 1,544 | | | | | | |
Completed, Non-Stabilized | | | - | | | | | | | | | | | | | | | | | | |
Total | | $ | 324 | | | | | | | | | | | | | | | | | | |
| | | | | | | | | | | | | | | | | | | | | |
| | | | | | | | | | | | | | | | | | | | | |
Projected Stabilized Yield on Development Projects Over Respective Market Cap Rates: | | 150-200 bps | | | | | | |
(1) | See Attachment 16 for definitions and other terms. |
21
Attachment 10
UDR, Inc.
Redevelopment Summary
December 31, 2020
(Dollars in Thousands)
(Unaudited) (1)
| | | | Sched. | | | | | | | | | Schedule | | Percentage | |||
| | | # of | Redev. | Compl. | Cost to | Budgeted | Est. Cost | | | | Same- Store Quarter | | | ||||
Community | Location | Homes | Homes | Homes | Date | Cost | per Home | | Start | Compl. | | Leased | Occupied | |||||
| | | | | | | | | | | | | | | | | | |
Projects in Redevelopment | | | | | | | | | | | | | | | ||||
| | | | | | | | | | | | | | | | | | |
N/A | N/A | - | - | - | $ | - | $ | - | $ | - | | N/A | N/A | N/A | | - | - | |
Total | | - | - | - | $ | - | $ | - | $ | - | | | | | | | | |
| | | | | | | | | | | | | | | | | | |
| | | | | | | | | | | | | | | | | | |
| | | | | | | | | | | | | | | | | | |
| | | | | | | | | | | | | | | | | | |
UDR's Capitalized Interest | | | | | | | | | | | | | | | | | | |
4Q 20 | | | | | | | | | | | | | | | | | | |
$ | 16 | | | | | | | | | | | | | | | | | |
| | | | | | | | | | | | | | | | | | |
| | | | | | | | | | | | | | | | | | |
| | | | | | | | | | | | | | | | | | |
| | | | | | | | | | | | | | | | | |
(1) | See Attachment 16 for definitions and other terms. |
22
Attachment 11
UDR, Inc.
Land Summary
December 31, 2020
(Dollars in Thousands)
(Unaudited) (1)
| | | UDR Ownership | Real Estate | | | | |
Parcel | Location | Interest | Cost Basis | Status Update (2) | ||||
| | | | | | | | |
| | | | | | Pursuing | Design | Hold for Future |
| | | | | | Entitlements | Development | Development |
Wholly-Owned | | | | | | | | |
| | | | | | | | |
Vitruvian Park® | Addison, TX | 100% | $ | 61,682 | Complete | In Process | In Process | |
Total | | | $ | 61,682 | | | | |
| | | | | | | | |
| | | | | | | | |
| | | | | | | | |
UDR's Capitalized Interest | | | | | | | | |
| | | | | | | | |
4Q 20 | | | | | | | | |
$ | 548 | | | | | | | |
(1) | See Attachment 16 for definitions and other terms. |
(2) | Pursuing Entitlements: During this phase the Company is actively pursuing the necessary approvals for the rights to develop multifamily and/or mixed use communities. |
Design Development: During this phase the Company is actively working to complete architectural and engineering documents in preparation for the commencement of construction of multifamily and/or mixed uses communities.
Hold for Future Development: Entitled and/or unentitled land sites that the Company holds for future development.
23
Attachment 12(A)
UDR, Inc.
Unconsolidated Joint Venture Summary
December 31, 2020
(Dollars in Thousands)
(Unaudited) (1)
| | | | | | | | | | | | | | | | | | | |
| | | | | | | Physical | | Total Rev. per | Net Operating Income | |||||||||
| Property | Own. | # of | # of | Occupancy | | Occ. Home | UDR's Share | | Total | |||||||||
Portfolio Characteristics | Type | Interest | Comm. | Homes | 4Q 20 | | 4Q 20 | 4Q 20 | YTD 20 | | YTD 20 (2) | ||||||||
UDR / MetLife | | | | | | | | | | | | | | | | | | | |
Operating communities | Various | | 50% | | 13 | 2,837 | 92.0% | | $ | 3,623 | $ | 8,752 | $ | 39,632 | | $ | 78,848 | ||
| | | | | | | | | | | | | | | | | | | |
UDR / West Coast Development JV | | | | | | | | | | | | | | | | | | | |
Held for Disposition (3) | Mid-rise | | 47% | | 1 | 293 | 89.0% | | | 2,505 | | 500 | | 2,094 | | | 4,445 | ||
Total | | | | | | 14 | 3,130 | 91.7% | | $ | 3,528 | $ | 9,252 | $ | 41,726 | | $ | 83,293 | |
| | | | | | | | | | | | | | | | | | | |
| | | | | | | | | | | | | | | | | | | |
| | | | | | | | | | | | | | | |||||
| Gross Book Value | | | | | | Weighted | | | | | | | | | | | ||
| of JV Real | Total Project | UDR's Equity | | Avg. Debt | | Debt | | | | | | | | |||||
Balance Sheet Characteristics | Estate Assets (4) | Debt (4) | Investment | | Interest Rate | | Maturities | | | | | | |||||||
| | | | | | | | | | | | | | | | | | | |
UDR / MetLife | | | | | | | | | | | | | | | | | | | |
Operating communities | $ | 1,698,884 | $ | 941,463 | $ | 264,599 | | 3.65% | | 2022-2028 | | | | | | | | ||
| | | | | | | | | | | | | | | | | | | |
UDR / West Coast Development JV | | | | | | | | | | | | | | | | | | | |
Held for Disposition | | 129,360 | | 54,394 | | 30,080 | | 1.67% | | 2021 | | | | | | | | ||
Total | $ | 1,828,244 | $ | 995,857 | $ | 294,679 | | 3.54% | | | | | | | | | | | |
| | | | | | | | | | | | | | | | | | | |
| | | | | | | | | | | | | | | | | | | |
| | | | | | | | | | | | | | | |||||
| Joint Venture | | | | | | | | | | | | | | | | | ||
| Same-Store | 4Q 20 vs. 4Q 19 Growth | | | 4Q 20 vs. 3Q 20 Growth | | | | |||||||||||
Joint Venture Same-Store Growth | Communities (5) | Revenue | Expense | NOI | | | Revenue | Expense | NOI | | | | |||||||
UDR / MetLife | 13 | -14.0% | 5.9% | -23.2% | | | -2.2% | -3.0% | -1.8% | | | | |||||||
Total | 13 | -14.0% | 5.9% | -23.2% | | | -2.2% | -3.0% | -1.8% | | | | |||||||
| | | | | | | | | | | | | | | | | | | |
| | | | | | | | | | | | | | | | | | | |
| | | | | | | | | | | | | | | |||||
| | | | | | | | | | | | | | | | | | | |
| Joint Venture | | | | | | | | | | | | | ||||||
| Same-Store | YTD 20 vs. YTD 19 Growth | | | | | | | | | | | | ||||||
Joint Venture Same-Store Growth | Communities (5) | Revenue | Expense | NOI | | | | | | | | | | | | ||||
UDR / MetLife | 12 | -6.7% | 3.4% | -11.3% | | | | | | | | | | | | ||||
Total | 12 | -6.7% | 3.4% | -11.3% | | | | | | | | | | | | ||||
| | | | | | | | | | | | | | | | | | | |
| | | | | | | | | | | | | | | | | | | |
| | | | | | | | | | | | | | |
(1) | See Attachment 16 for definitions and other terms. |
(2) | Represents NOI at 100% for the period ended December 31, 2020. |
(3) | Subsequent to quarter-end, the community was sold to an unaffiliated third-party. |
(4) | Joint ventures and partnerships represented at 100%. Debt balances are presented net of deferred financing costs. The gross book value of real estate assets for the UDR / West Coast Development JV represents the going-in valuation. |
(5) | Joint Venture Same-Store growth is presented at UDR’s ownership interest. |
24
Attachment 12(B)
UDR, Inc.
Developer Capital Program (2)
December 31, 2020
(Dollars in Thousands)
(Unaudited) (1)
Developer Capital Program | | | | | | | | | | | | | | | | | |
| | | | | | | | | | | | | | | | | |
| | | | | | | | | | Income from | | | | | | ||
| | # of | UDR Investment | Return | Years to | | Investment | Upside | Investment | ||||||||
Community | Location | Homes | Commitment (3) | Balance (3) | Rate | Maturity | | 4Q 2020 | Participation | Type | |||||||
| | | | | | | | | | | | | | | | | |
Preferred Equity and Mezzanine Loans | | | | | | | | | | | | | | ||||
| | | | | | | | | | | | | | | | | |
The Portals (4) | Washington, DC | - | $ | - | $ | - | 11.0% | - | | $ | 1,573 | - | Mezzanine Loan | ||||
1532 Harrison | San Francisco, CA | 136 | | 24,645 | | 34,135 | 11.0% | 1.5 | | | 962 | - | Preferred Equity | ||||
Junction | Santa Monica, CA | 66 | | 8,800 | | 11,699 | 12.0% | 1.6 | | | 347 | - | Preferred Equity | ||||
1200 Broadway | Nashville, TN | 313 | | 55,558 | | 69,330 | 8.0% | 1.7 | | | 1,375 | Variable | Preferred Equity | ||||
1300 Fairmount | Philadelphia, PA | 471 | | 51,393 | | 59,544 | 8.5% | 2.6 | | | 1,256 | Variable | Preferred Equity | ||||
Essex | Orlando, FL | 330 | | 12,886 | | 16,770 | 12.5% | 2.6 | | | 517 | - | Preferred Equity | ||||
Modera Lake Merritt | Oakland, CA | 173 | | 27,250 | | 30,928 | 9.0% | 3.2 | | | 691 | Variable | Preferred Equity | ||||
Thousand Oaks | Thousand Oaks, CA | 142 | | 20,059 | | 17,919 | 9.0% | 4.1 | | | 346 | Variable | Preferred Equity | ||||
Vernon Boulevard | Queens, NY | 534 | | 40,000 | | 42,360 | 13.0% | 4.5 | | | 1,358 | Variable | Preferred Equity | ||||
Total – Preferred Equity and Mezzanine Loans | 2,165 | $ | 240,591 | $ | 282,685 | 9.8% | 2.8 | | $ | 8,425 | | | | | | ||
| | | | | | | | | | | | | | | | | |
Secured Loans | | | | | | | | | | | | | | | | | |
| | | | | | | | | | | | | | | | | |
Alameda Point Block 11 (5) | Alameda, CA | 220 | $ | 20,000 | $ | 25,004 | 8.0% | 1.4 | | $ | - | - | Secured Loan | ||||
Brio (6) | Bellevue, WA | 259 | | 115,000 | | 121,337 | 4.8% | 1.8 | | | 1,437 | Purchase Option | Secured Loan | ||||
Total - Secured Loans | | 479 | $ | 135,000 | $ | 146,341 | 5.3% | 1.7 | | $ | 1,437 | | | | | | |
| | | | | | | | | | | | | | | | | |
Total - Developer Capital Program | 2,644 | $ | 375,591 | $ | 429,026 | 8.3% | 2.4 | | $ | 9,862 | | | | | | ||
| | | | | | | | | | | | | | | | | |
| | | | | | | | | | | | | | | | | |
| | | | | | | | | | | | | | | | | |
| | | | | | | | | | | | | | | | | |
(1) | See Attachment 16 for definitions and other terms. |
(2) | UDR's investments noted above are reflected as investment in and advances to unconsolidated joint ventures or notes receivable, net on the Consolidated Balance Sheets and income/(loss) from unconsolidated entities or interest and other income/(expense), net on the Consolidated Statements of Operations in accordance with GAAP. |
(3) | Investment commitment represents maximum loan principal or equity and therefore excludes accrued return. Investment balance includes amount funded plus accrued return prior to the period end. |
(4) | On December 23, 2020, UDR's investment balance and accrued return totaling approximately $53.7 million were paid in full. |
(5) | In March 2018, UDR made a $20.0 million secured loan to a third-party developer to acquire a parcel of land upon which the developer planned to construct a 220 apartment home community. The loan is secured by the land parcel and related assets, and, as of the end of the quarter, was reflected in notes receivable, net on the Consolidated Balance Sheets and interest and other income/(expense), net on the Consolidated Statements of Operations in accordance with GAAP. The developer defaulted on the loan in September 2020. As a result of the default, UDR expects to take title to the property pursuant to a deed in lieu of foreclosure. |
(6) | In November 2019, UDR made a $115.0 million secured loan to a third-party developer to finance a 259 apartment home community that was completed in 2020. UDR also entered into a purchase option agreement at the time the loan was funded which gave UDR the option to acquire the community at a fixed price, which is currently projected to occur in 2021. The option was exercised in August 2020. The loan is secured by the community and is reflected in notes receivable, net on the Consolidated Balance Sheets and interest and other income/(expense), net on the Consolidated Statements of Operations in accordance with GAAP. |
25
Attachment 13
UDR, Inc.
Acquisitions, Dispositions and Developer Capital Program Investments Summary
December 31, 2020
(Dollars in Thousands)
(Unaudited) (1)
| | | | | | Post | | | | | | | | | |
| | | | | Prior | Transaction | | | | | | | | | |
| | | | | Ownership | Ownership | | UDR Investment | Return | | # of | | |||
Date of Investment | | Community | | Location | Interest | Interest | | Commitment | Rate | | Homes | | |||
| | | | | | | | | | | | | | | |
Developer Capital Program - Investment | | | | | | | | | | | | ||||
| | | | | | | | | | | | | | | |
Feb-20 | | Thousand Oaks | | Thousand Oaks, CA | N/A | N/A | | $ | 20,059 | | 9.0% | | 142 | | |
Jul-20 | | Vernon Boulevard | | Queens, NY | N/A | N/A | | | 40,000 | | 13.0% | | 534 | | |
| | | | | | | | $ | 60,059 | | 11.7% | | 676 | | |
| | | | | | | | | | | | | | | |
| | | | | | | | UDR Payment | | Return | | # of | | | |
Developer Capital Program - Redemption | | | | Received | | Rate | | Homes | | | |||||
| | | | | | | | | | | | | | | |
Dec-20 | | The Portals | | Washington, DC | N/A | N/A | | $ | 53,735 | | 11.0% | | 373 | | |
| | | | | | | | $ | 53,735 | | 11.0% | | 373 | | |
| | | | | | | | | | | | | | | |
| | | | | | | | | | | | | | | |
| | | | | | | | | | | | | | | |
| | | | | | Post | | | | | | | | | |
| | | | | Prior | Transaction | | | | | | | | | |
| | | | | Ownership | Ownership | | | | | # of | Price per | |||
Date of Purchase | | Community | | Location | Interest | Interest | | Price (2) | Debt (2) | | Homes | Home | |||
| | | | | | | | | | | | | | | |
Acquisitions - Wholly-Owned | | | | | | | | | | | | | | | |
| | | | | | | | | | | | | | | |
Jan-20 | | The Slade at Channelside | | Tampa, FL | 0% | 100% | | $ | 85,200 | $ | - | | 294 | $ | 290 |
Jan-20 | | The Arbory | | Hillsboro, OR | 49% | 100% | | | 53,900 | | - | | 276 | | 195 |
Nov-20 | | Andover Place at Cross Creek | | Tampa, FL | 0% | 100% | | | 122,500 | | - | | 672 | | 182 |
Dec-20 | | Station on Silver | | Herndon, VA | 0% | 100% | | | 128,600 | | - | | 400 | | 322 |
| | | | | | | | $ | 390,200 | $ | - | | 1,642 | $ | 238 |
| | | | | | | | | | | | | | | |
Acquisitions - Wholly-Owned Land | | | | | | | | | | | | | | | |
| | | | | | | | | | | | | | | |
Aug-20 | | Village at Valley Forge | | King of Prussia, PA | 0% | 100% | | $ | 16,188 | $ | - | | - | $ | - |
| | | | | | | | $ | 16,188 | $ | - | | - | $ | - |
| | | | | | | | | | | | | | | |
| | | | | | | | | | | | | | | |
| | | | | | | | | | | | | | | |
| | | | | | Post | | | | | | | | | |
| | | | | Prior | Transaction | | | | | | | | | |
| | | | | Ownership | Ownership | | | | | # of | Price per | |||
Date of Sale | | Community | | Location | Interest | Interest | | Price (2) | Debt (2) | | Homes | Home | |||
| | | | | | | | | | | | | | | |
Dispositions - Wholly-Owned | | | | | | | | | | | | | | | |
| | | | | | | | | | | | | | | |
May-20 | | Waterscape (3) | | Kirkland, WA | 100% | 0% | | $ | 92,900 | $ | - | | 196 | $ | 474 |
May-20 | | Borgata Apartment Homes (4) | | Bellevue, WA | 100% | 0% | | | 49,700 | | - | | 71 | | 700 |
Oct-20 | | DelRay Tower (5) | | Alexandria, VA | 100% | 0% | | | 145,000 | | - | | 332 | | 437 |
| | | | | | | | $ | 287,600 | $ | - | | 599 | $ | 480 |
| | | | | | | | | | | | | | | |
(1) | See Attachment 16 for definitions and other terms. |
(2) | Price represents 100% of assets. Debt represents 100% of the asset's indebtedness. |
(3) | UDR recorded a gain on sale of approximately $31.7 million during the twelve months ended December 31, 2020, which is included in gain/(loss) on sale of real estate owned. |
(4) | UDR recorded a gain on sale of approximately $29.6 million during the twelve months ended December 31, 2020, which is included in gain/(loss) on sale of real estate owned. |
(5) | UDR recorded a gain on sale of approximately $58.0 million during the three and twelve months ended December 31, 2020, which is included in gain/(loss) on sale of real estate owned. |
26
Attachment 14
UDR, Inc.
Capital Expenditure and Repair and Maintenance Summary
December 31, 2020
(In thousands, except Cost per Home)
(Unaudited) (1)
| | | | Three Months | | Capex | | Twelve Months | | | Capex | |||
| | Estimated | | Ended | Cost | as a % | | Ended | | Cost | as a % | |||
Capital Expenditures for Consolidated Homes (2) | | Useful Life (yrs.) | | December 31, 2020 | per Home | of NOI | | December 31, 2020 | | per Home | of NOI | |||
| | | | | | | | | | | | | | |
Average number of homes (3) | | | | | 47,590 | | | | | | 47,475 | | | |
| | | | | | | | | | | | | | |
Recurring Cap Ex | | | | | | | | | | | | | | |
Asset preservation | | | | | | | | | | | | | | |
Building interiors | | 5 - 20 | | $ | 6,823 | $ | 143 | | | $ | 22,061 | $ | 465 | |
Building exteriors | | 5 - 20 | | | 6,016 | | 126 | | | | 16,900 | | 356 | |
Landscaping and grounds | | 10 | | | 1,629 | | 34 | | | | 4,985 | | 105 | |
Total asset preservation | | | | | 14,468 | | 304 | | | | 43,946 | | 926 | |
| | | | | | | | | | | | | | |
Turnover related | | 5 | | | 3,346 | | 70 | | | | 12,978 | | 273 | |
| | | | | | | | | | | | | | |
Total Recurring Cap Ex | | | | | 17,814 | | 374 | 9% | | | 56,924 | | 1,199 | 7% |
| | | | | | | | | | | | | | |
NOI Enhancing Cap Ex | | 5 - 20 | | | 23,647 | | 497 | | | | 48,752 | | 1,027 | |
| | | | | | | | | | | | | | |
Total Recurring and NOI Enhancing Cap Ex | | | | $ | 41,461 | $ | 871 | | | $ | 105,676 | $ | 2,226 | |
| | | | | | | | | | | | | | |
| | | | | | | | | | | | | | |
| | | | Three Months | | | | | Twelve Months | | | | ||
| | | | Ended | | Cost | | | Ended | | Cost | | ||
Repair and Maintenance for Consolidated Homes (Expensed) | | December 31, 2020 | | per Home | | | December 31, 2020 | | per Home | | ||||
| | | | | | | | | | | | | | |
Average number of homes (3) | | | | | 47,590 | | | | | | 47,475 | | | |
| | | | | | | | | | | | | | |
Contract services | | | | $ | 6,904 | $ | 145 | | | $ | 28,170 | $ | 593 | |
| | | | | | | | | | | | | | |
Turnover related expenses | | | | | 4,008 | | 84 | | | | 15,402 | | 324 | |
| | | | | | | | | | | | | | |
Other Repair and Maintenance | | | | | | | | | | | | | | |
Building interiors | | | | | 2,391 | | 50 | | | | 9,603 | | 202 | |
Building exteriors | | | | | 617 | | 13 | | | | 2,178 | | 46 | |
Landscaping and grounds | | | | | 399 | | 8 | | | | 1,441 | | 30 | |
Total Repair and Maintenance | | | | $ | 14,319 | $ | 301 | | | $ | 56,794 | $ | 1,196 | |
(1) | See Attachment 16 for definitions and other terms. |
(2) | Excludes redevelopment capital and initial capital expenditures on acquisitions. |
(3) | Average number of homes is calculated based on the number of homes outstanding at the end of each month. |
27
Attachment 15
UDR, Inc.
1Q 2021 and Full-Year 2021 Guidance
December 31, 2020
(Unaudited) (1)
| | | | | |||
| | | | | | | |
Net Income, FFO, FFO as Adjusted and AFFO per Share and Unit Guidance | | | | 1Q 2021 | | Full-Year 2021 | |
| | | | | | | |
Income/(loss) per weighted average common share, diluted | | | | $0.14 to $0.16 | | $0.13 to $0.25 | |
FFO per common share and unit, diluted | | | | $0.45 to $0.47 | | $1.87 to $1.99 | |
FFO as Adjusted per common share and unit, diluted | | | | $0.46 to $0.48 | | $1.88 to $2.00 | |
Adjusted Funds from Operations ("AFFO") per common share and unit, diluted | | | | $0.43 to $0.45 | | $1.70 to $1.82 | |
Annualized dividend per share and unit | | | | | | $1.45 | |
| | | | | | | |
| | | | | | | |
| | | | | | | |
Same-Store Guidance | | | | | | Full-Year 2021 | |
| | | | | | | |
Revenue growth / (decline) (Cash basis) | | | | | | (2.50%) - 0.50% | |
Revenue growth / (decline) (Straight-line basis) | | | | | | (4.50%) - (1.50%) | |
Expense growth | | | | | | 1.00% - 4.00% | |
NOI growth / (decline) (Cash basis) | | | | | | (4.00%) - 0.00% | |
NOI growth / (decline) (Straight-line basis) | | | | | | (6.50%) - (2.50%) | |
| | | | | | | |
| | | | | | | |
Sources of Funds ($ in millions) | | | | | | Full-Year 2021 | |
| | | | | | | |
AFFO less Dividends | | | | | | $80 to $120 | |
Debt Issuances, Sales Proceeds, and LOC Draw/Paydown | | | | | | $250 to $350 | |
| | | | | | | |
| | | | | | | |
Uses of Funds ($ in millions) | | | | | | Full-Year 2021 | |
| | | | | | | |
Debt maturities inclusive of principal amortization (2) | | | | | | $40 | |
Development spending and land acquisitions | | | | | | $150 to $250 | |
Redevelopment and other non-recurring | | | | | | $20 to $40 | |
Developer Capital Program, net | | | | | | $25 to $35 | |
Acquisitions | | | | | | $30 to $65 | |
NOI enhancing capital expenditures inclusive of Kitchen and Bath | | | | | | $40 to $45 | |
| | | | | | | |
| | | | | | | |
| | | | | | | |
Other Additions/(Deductions) ($ in millions except per home amounts) | | | | | | Full-Year 2021 | |
| | | | | | | |
Consolidated interest expense, net of capitalized interest and adjustments for FFO as Adjusted | | | | | | ($140) to ($150) | |
Capitalized interest expense (3) | | | | | | $8 to $12 | |
General and administrative expense | | | | | | ($45) to ($55) | |
Recurring capital expenditures per home | | | | | | $1,200 | |
| | | | | | | |
(1) | See Attachment 16 for definitions and other terms. |
(2) | Excludes short-term maturities related to the Company's unsecured commercial paper program. Includes the prepayment costs and net proceed associated with the Columbus Square refinance which occurred in January 2021. |
(3) | Excludes capitalized interest on joint venture and partnership level debt. |
28
Attachment 16(A)
UDR, Inc.
Definitions and Reconciliations
December 31, 2020
(Unaudited)
Acquired Communities: The Company defines Acquired Communities as those communities acquired by the Company, other than development and redevelopment activity, that did not achieve stabilization as of the most recent quarter.
Acquired JV Same-Store Portfolio Communities: Represents the Acquired JV Same-Store Portfolio Communities as if these communities were 100% owned by UDR since January 1, 2019. These communities were Stabilized for five full consecutive quarters and had stabilized operating expenses as of the beginning of the quarter in the prior year, were not in process of any substantial redevelopment activities, and were not held for disposition. Because these communities became wholly owned by UDR in 2019 (the 11 communities and 3,619 homes were previously owned by UDR unconsolidated JVs), they are not included in the UDR Same-Store Communities. See UDR Same-Store Communities for more information regarding inclusion. These communities have been identified in certain tables to provide Combined Same-Store results as if these communities were 100% owned by UDR in prior periods. These 11 communities will be eligible to join the UDR Same-Store Communities on January 1, 2021.
Adjusted Funds from Operations ("AFFO") attributable to common stockholders and unitholders: The Company defines AFFO as FFO as Adjusted attributable to common stockholders and unitholders less recurring capital expenditures on consolidated communities that are necessary to help preserve the value of and maintain functionality at our communities.
Management considers AFFO a useful supplemental performance metric for investors as it is more indicative of the Company's operational performance than FFO or FFO as Adjusted. AFFO is not intended to represent cash flow or liquidity for the period, and is only intended to provide an additional measure of our operating performance. The Company believes that net income/(loss) attributable to common stockholders is the most directly comparable GAAP financial measure to AFFO. Management believes that AFFO is a widely recognized measure of the operations of REITs, and presenting AFFO will enable investors to assess our performance in comparison to other REITs. However, other REITs may use different methodologies for calculating AFFO and, accordingly, our AFFO may not always be comparable to AFFO calculated by other REITs. AFFO should not be considered as an alternative to net income/(loss) (determined in accordance with GAAP) as an indication of financial performance, or as an alternative to cash flows from operating activities (determined in accordance with GAAP) as a measure of our liquidity, nor is it indicative of funds available to fund our cash needs, including our ability to make distributions. A reconciliation from net income/(loss) attributable to common stockholders to AFFO is provided on Attachment 2.
Combined Same-Store Revenue with Concessions on a Cash Basis: Combined Same-Store Revenue with Concessions on a Cash Basis is considered by the Company to be a supplemental measure to rental income on a straight-line basis which allows investors to evaluate the impact of both current and historical concessions and to more readily enable comparisons to revenue as reported by its peer REITs. In addition, Combined Same-Store Revenue with Concessions on a Cash Basis allows an investor to understand the historical trends in cash concessions.
A reconciliation between Combined Same-Store Revenue with Concessions on a Cash Basis to Combined Same-Store Revenue on a straight-line basis (inclusive of the impact to Combined Same-Store NOI) is provided below:
| 4Q 20 | | 4Q 19 | | 4Q 20 | | 3Q 20 | | YTD 20 | | YTD 19 | | ||||||
Revenue (Cash basis) | $ | 274,922 | | $ | 292,167 | | $ | 274,922 | | $ | 276,402 | | $ | 1,018,276 | | $ | 1,047,704 | |
Concessions granted/amortized, net | | 4,177 | | | 60 | | | 4,177 | | | 7,747 | | | 11,073 | | | (409) | |
Revenue (Straight-line basis) | $ | 279,099 | | $ | 292,227 | | $ | 279,099 | | $ | 284,149 | | $ | 1,029,349 | | $ | 1,047,295 | |
| | | | | | | | | | | | | | | | | | |
% change - Combined Same-Store Revenue with Concessions on a Cash Basis: | | -5.9% | | | | | | -0.5% | | | | | | -2.8% | | | | |
% change - Combined Same-Store Revenue on a straight-line basis: | | -4.5% | | | | | | -1.8% | | | | | | -1.7% | | | | |
| | | | | | | | | | | | | | | | | | |
% change - Combined Same-Store NOI with Combined Same-Store Revenue with Concessions on a Cash Basis: | | -10.1% | | | | | | 0.8% | | | | | | -5.4% | | | | |
% change - Combined Same-Store NOI with Combined Same-Store Revenue on a straight-line basis: | | -8.1% | | | | | | -1.1% | | | | | | -3.9% | | | | |
Consolidated Fixed Charge Coverage Ratio - adjusted for non-recurring items: The Company defines Consolidated Fixed Charge Coverage Ratio - adjusted for non-recurring items as Consolidated Interest Coverage Ratio - adjusted for non-recurring items divided by total consolidated interest, excluding the impact of costs associated with debt extinguishment, plus preferred dividends.
Management considers Consolidated Fixed Charge Coverage Ratio - adjusted for non-recurring items a useful metric for investors as it provides ratings agencies, investors and lending partners with a widely-used measure of the Company’s ability to service its consolidated debt obligations as well as compare leverage against that of its peer REITs. A reconciliation of the components that comprise Consolidated Fixed Charge Coverage Ratio - adjusted for non-recurring items is provided on Attachment 4(C) of the Company's quarterly supplemental disclosure.
Consolidated Interest Coverage Ratio - adjusted for non-recurring items: The Company defines Consolidated Interest Coverage Ratio - adjusted for non-recurring items as Consolidated EBITDAre – adjusted for non-recurring items divided by total consolidated interest, excluding the impact of costs associated with debt extinguishment.
Management considers Consolidated Interest Coverage Ratio - adjusted for non-recurring items a useful metric for investors as it provides ratings agencies, investors and lending partners with a widely-used measure of the Company’s ability to service its consolidated debt obligations as well as compare leverage against that of its peer REITs. A reconciliation of the components that comprise Consolidated Interest Coverage Ratio - adjusted for non-recurring items is provided on Attachment 4(C) of the Company's quarterly supplemental disclosure.
Consolidated Net Debt-to-EBITDAre - adjusted for non-recurring items: The Company defines Consolidated Net Debt-to-EBITDAre - adjusted for non-recurring items as total consolidated debt net of cash and cash equivalents divided by annualized Consolidated EBITDAre - adjusted for non-recurring items. Consolidated EBITDAre - adjusted for non-recurring items is defined as EBITDAre excluding the impact of income/(loss) from unconsolidated entities, adjustments to reflect the Company’s share of EBITDAre of unconsolidated joint ventures and other non-recurring items including, but not limited to casualty-related charges/(recoveries), net of wholly owned communities.
Management considers Consolidated Net Debt-to-EBITDAre - adjusted for non-recurring items a useful metric for investors as it provides ratings agencies, investors and lending partners with a widely-used measure of the Company’s ability to service its consolidated debt obligations as well as compare leverage against that of its peer REITs. A reconciliation between net income/(loss) and Consolidated EBITDAre - adjusted for non-recurring items is provided on Attachment 4(C) of the Company's quarterly supplemental disclosure.
Controllable Expenses: The Company refers to property operating and maintenance expenses as Controllable Expenses.
Controllable Operating Margin: The Company defines Controllable Operating Margin as (i) rental income less Controllable Expenses (ii) divided by rental income. Management considers Controllable Operating Margin a useful metric as it provides investors with an indicator of the Company’s ability to limit the growth of expenses that are within the control of the Company.
Development Communities: The Company defines Development Communities as those communities recently developed or under development by the Company, that are currently majority owned by the Company and have not achieved stabilization as of the most recent quarter.
29
Attachment 16(B)
UDR, Inc.
Definitions and Reconciliations
December 31, 2020
(Unaudited)
Earnings Before Interest, Taxes, Depreciation and Amortization for Real Estate (EBITDAre): The Company defines EBITDAre as net income/(loss) (computed in accordance GAAP), plus interest expense, including costs associated with debt extinguishment, plus real estate depreciation and amortization, plus other depreciation and amortization, plus (minus) income tax provision/(benefit), net, (minus) plus net gain/(loss) on the sale of depreciable real estate owned, plus impairment write-downs of depreciable real estate, plus the adjustments to reflect the Company’s share of EBITDAre of unconsolidated joint ventures. The Company computes EBITDAre in accordance with standards established by the National Association of Real Estate Investment Trusts, or Nareit, which may not be comparable to EBITDAre reported by other REITs that do not compute EBITDAre in accordance with the Nareit definition, or that interpret the Nareit definition differently than the Company does. The White Paper on EBITDAre was approved by the Board of Governors of Nareit in September 2017.
Management considers EBITDAre a useful metric for investors as it provides an additional indicator of the Company’s ability to incur and service debt, and will enable investors to assess our performance against that of its peer REITs. EBITDAre should be considered along with, but not as an alternative to, net income and cash flow as a measure of the Company’s activities in accordance with GAAP. EBITDAre does not represent cash generated from operating activities in accordance with GAAP and is not necessarily indicative of funds available to fund our cash needs. A reconciliation between net income/(loss) and EBITDAre is provided on Attachment 4(C) of the Company's quarterly supplemental disclosure.
Effective Blended Lease Rate Growth: The Company defines Effective Blended Lease Rate Growth as the combined proportional growth as a result of Effective New Lease Rate Growth and Effective Renewal Lease Rate Growth. Management considers Effective Blended Lease Rate Growth a useful metric for investors as it assesses combined proportional market-level, new and in-place demand trends.
Effective New Lease Rate Growth: The Company defines Effective New Lease Rate Growth as the increase in gross potential rent realized less concessions for the new lease term (current effective rent) versus prior resident effective rent for the prior lease term on new leases commenced during the current quarter.
Management considers Effective New Lease Rate Growth a useful metric for investors as it assesses market-level new demand trends.
Effective Renewal Lease Rate Growth: The Company defines Effective Renewal Lease Rate Growth as the increase in gross potential rent realized less concessions for the new lease term (current effective rent) versus prior effective rent for the prior lease term on renewed leases commenced during the current quarter.
Management considers Effective Renewal Lease Rate Growth a useful metric for investors as it assesses market-level, in-place demand trends.
Estimated Quarter of Completion: The Company defines Estimated Quarter of Completion of a development or redevelopment project as the date on which construction is expected to be completed, but it does not represent the date of stabilization.
Funds from Operations as Adjusted ("FFO as Adjusted") attributable to common stockholders and unitholders: The Company defines FFO as Adjusted attributable to common stockholders and unitholders as FFO excluding the impact of other non-comparable items including, but not limited to, acquisition-related costs, prepayment costs/benefits associated with early debt retirement, impairment write-downs or gains and losses on sales of real estate or other assets incidental to the main business of the Company and income taxes directly associated with those gains and losses, casualty-related expenses and recoveries, severance costs and legal and other costs.
Management believes that FFO as Adjusted is useful supplemental information regarding our operating performance as it provides a consistent comparison of our operating performance across time periods and allows investors to more easily compare our operating results with other REITs. FFO as Adjusted is not intended to represent cash flow or liquidity for the period, and is only intended to provide an additional measure of our operating performance. The Company believes that net income/(loss) attributable to common stockholders is the most directly comparable GAAP financial measure to FFO as Adjusted. However, other REITs may use different methodologies for calculating FFO as Adjusted or similar FFO measures and, accordingly, our FFO as Adjusted may not always be comparable to FFO as Adjusted or similar FFO measures calculated by other REITs. FFO as Adjusted should not be considered as an alternative to net income (determined in accordance with GAAP) as an indication of financial performance, or as an alternative to cash flows from operating activities (determined in accordance with GAAP) as a measure of our liquidity. A reconciliation from net income attributable to common stockholders to FFO as Adjusted is provided on Attachment 2.
Funds from Operations ("FFO") attributable to common stockholders and unitholders: The Company defines FFO attributable to common stockholders and unitholders as net income/(loss) attributable to common stockholders (computed in accordance with GAAP), excluding impairment write-downs of depreciable real estate related to the main business of the Company or of investments in non-consolidated investees that are directly attributable to decreases in the fair value of depreciable real estate held by the investee, gains and losses from sales of depreciable real estate related to the main business of the Company and income taxes directly associated with those gains and losses, plus real estate depreciation and amortization, and after adjustments for noncontrolling interests, and the Company’s share of unconsolidated partnerships and joint ventures. This definition conforms with the National Association of Real Estate Investment Trust's definition issued in April 2002 and restated in November 2018. In the computation of diluted FFO, if OP Units, DownREIT Units, unvested restricted stock, unvested LTIP Units, stock options, and the shares of Series E Cumulative Convertible Preferred Stock are dilutive, they are included in the diluted share count.
Management considers FFO a useful metric for investors as the Company uses FFO in evaluating property acquisitions and its operating performance and believes that FFO should be considered along with, but not as an alternative to, net income and cash flow as a measure of the Company's activities in accordance with GAAP. FFO does not represent cash generated from operating activities in accordance with GAAP and is not necessarily indicative of funds available to fund our cash needs. A reconciliation from net income/(loss) attributable to common stockholders to FFO is provided on Attachment 2.
Held For Disposition Communities: The Company defines Held for Disposition Communities as those communities that were held for sale as of the end of the most recent quarter.
Joint Venture Reconciliation at UDR's weighted average ownership interest:
In thousands | | | | | 4Q 2020 | | YTD 2020 | | | | ||
Income/(loss) from unconsolidated entities | | | | | $ | 4,516 | | $ | 18,844 | | | |
Management fee | | | | | | 566 | | | 2,296 | | | |
Interest expense | | | | | | 4,537 | | | 18,729 | | | |
Depreciation | | | | | | 8,724 | | | 35,023 | | | |
General and administrative | | | | | | 62 | | | 249 | | | |
West Coast Development JV Preferred Return | | | | | | (50) | | | (251) | | | |
Developer Capital Program (excludes Alameda Point Block 11 and Brio) | | | | | | (8,425) | | | (28,405) | | | |
Other (income)/expense | | | | | | (79) | | | 176 | | | |
Realized/unrealized (gain)/loss on unconsolidated technology investments | | | | | | (599) | | | (4,935) | | | |
Total Joint Venture NOI at UDR's Ownership Interest | | | $ | 9,252 | | $ | 41,726 | | | |
Leasing Traffic: The Company defines Leasing Traffic as average daily leads to lease a home for the period indicated.
30
Attachment 16(C)
UDR, Inc.
Definitions and Reconciliations
December 31, 2020
(Unaudited)
Net Operating Income (“NOI”): The Company defines NOI as rental income less direct property rental expenses. Rental income represents gross market rent and other revenues less adjustments for concessions, vacancy loss and bad debt. Rental expenses include real estate taxes, insurance, personnel, utilities, repairs and maintenance, administrative and marketing. Excluded from NOI is property management expense, which is calculated as 2.875% of property revenue, and land rent. Property management expense covers costs directly related to consolidated property operations, inclusive of corporate management, regional supervision, accounting and other costs.
Management considers NOI a useful metric for investors as it is a more meaningful representation of a community’s continuing operating performance than net income as it is prior to corporate-level expense allocations, general and administrative costs, capital structure and depreciation and amortization and is a widely used input, along with capitalization rates, in the determination of real estate valuations. A reconciliation from net income/(loss) attributable to UDR, Inc. to NOI is provided below.
In thousands | 4Q 2020 | 3Q 2020 | 2Q 2020 | | 1Q 2020 | 4Q 2019 | | |||||
Net income/(loss) attributable to UDR, Inc. | $ | 26,532 | $ | (25,258) | $ | 57,771 | | $ | 5,221 | $ | 97,959 | |
Property management | | 8,659 | | 8,879 | | 8,797 | | | 9,203 | | 8,703 | |
Other operating expenses | | 6,153 | | 5,543 | | 6,100 | | | 4,966 | | 2,800 | |
Real estate depreciation and amortization | | 146,135 | | 151,949 | | 155,056 | | | 155,476 | | 143,464 | |
Interest expense | | 62,524 | | 62,268 | | 38,597 | | | 39,317 | | 60,435 | |
Casualty-related charges/(recoveries), net | | 778 | | - | | 102 | | | 1,251 | | 1,316 | |
General and administrative | | 11,978 | | 11,958 | | 10,971 | | | 14,978 | | 14,531 | |
Tax provision/(benefit), net | | 668 | | 187 | | 1,526 | | | 164 | | 2 | |
(Income)/loss from unconsolidated entities | | (4,516) | | (2,940) | | (8,021) | | | (3,367) | | (118,486) | |
Interest income and other (income)/expense, net | | 1,030 | | (2,183) | | (2,421) | | | (2,700) | | (2,406) | |
Joint venture management and other fees | | (1,208) | | (1,199) | | (1,274) | | | (1,388) | | (2,073) | |
Other depreciation and amortization | | 2,074 | | 3,887 | | 2,027 | | | 2,025 | | 1,713 | |
(Gain)/loss on sale of real estate owned | | (57,974) | | - | | (61,303) | | | - | | - | |
Net income/(loss) attributable to noncontrolling interests | | 2,019 | | (1,959) | | 4,325 | | | 319 | | 7,278 | |
Total consolidated NOI | $ | 204,852 | $ | 211,132 | $ | 212,253 | | $ | 225,465 | $ | 215,236 | |
NOI Enhancing Capital Expenditures ("Cap Ex"): The Company defines NOI Enhancing Capital Expenditures as expenditures that result in increased income generation or decreased expense growth over time.
Management considers NOI Enhancing Capital Expenditures a useful metric for investors as it quantifies the amount of capital expenditures that are expected to grow, not just maintain, revenues or to decrease expenses.
Non-Mature Communities: The Company defines Non-Mature Communities as those communities that have not met the criteria to be included in same-store communities.
Non-Residential / Other: The Company defines Non-Residential / Other as non-apartment components of mixed-use properties, land held, properties being prepared for redevelopment and properties where a material change in home count has occurred.
Other Markets: The Company defines Other Markets as the accumulation of individual markets where it operates less than 1,000 Combined Same-Store homes. Management considers Other Markets a useful metric as the operating results for the individual markets are not representative of the fundamentals for those markets as a whole.
Physical Occupancy: The Company defines Physical Occupancy as the number of occupied homes divided by the total homes available at a community.
QTD Combined Same-Store Communities: QTD Combined Same-Store Communities represent the QTD UDR Same-Store Communities and the Acquired JV Same-Store Portfolio Communities as a single portfolio, as if the Acquired JV Same-Store Portfolio Communities were 100% owned by UDR during all periods presented.
QTD UDR Same-Store Communities: The Company defines QTD UDR Same-Store Communities as those communities Stabilized for five full consecutive quarters. These communities were owned and had stabilized operating expenses as of the beginning of the quarter in the prior year, were not in process of any substantial redevelopment activities, and were not held for disposition.
Recurring Capital Expenditures: The Company defines Recurring Capital Expenditures as expenditures that are necessary to help preserve the value of and maintain functionality at its communities.
Redevelopment Communities: The Company generally defines Redevelopment Communities as those communities where substantial redevelopment is in progress that is expected to have a material impact on the community's operations, including occupancy levels and future rental rates.
Redevelopment Projected Weighted Average Return on Incremental Capital Invested: The projected weighted average return on incremental capital invested for redevelopment projects is NOI as set forth in the definition of Stabilization Period for Redevelopment Yield, less Recurring Capital Expenditures, minus the project’s annualized NOI prior to commencing the redevelopment, less Recurring Capital Expenditures, divided by the total cost of the project.
Sold Communities: The Company defines Sold Communities as those communities that were disposed of prior to the end of the most recent quarter.
Stabilization/Stabilized: The Company defines Stabilization/Stabilized as when a community’s occupancy reaches 90% or above for at least three consecutive months.
Stabilized, Non-Mature Communities: The Company defines Stabilized, Non-Mature Communities as those communities that have reached Stabilization but are not yet in the same-store portfolio.
Stabilization Period for Development Yield: The Company defines the Stabilization Period for Development Yield as the forward twelve month NOI, excluding any remaining lease-up concessions outstanding, commencing one year following the delivery of the final home of the project.
Stabilization Period for Redevelopment Yield: The Company defines the stabilization period for a redevelopment property yield for purposes of computing the Redevelopment Projected Weighted Average Return on Incremental Capital Invested, as the forward twelve month NOI, excluding any remaining lease-up concessions outstanding, commencing one year following the delivery of the final home of a project.
31
Attachment 16(D)
UDR, Inc.
Definitions and Reconciliations
December 31, 2020
(Unaudited)
Stabilized Yield on Developments: The Company calculates expected stabilized yields on development as follows: projected stabilized NOI less management fees divided by budgeted construction costs on a project-specific basis. Projected stabilized NOI for development projects, calculated in accordance with the NOI reconciliation provided on Attachment 16(B), is set forth in the definition of Stabilization Period for Development Yield. Given the differing completion dates and years for which NOI is being projected for these communities as well as the complexities associated with estimating other expenses upon completion such as corporate overhead allocation, general and administrative costs and capital structure, a reconciliation to GAAP measures is not meaningful. Projected NOI for these projects is neither provided, nor is representative of Management’s expectations for the Company’s overall financial performance or cash flow growth and there can be no assurances that forecast NOI growth implied in the estimated construction yield of any project will be achieved.
Management considers estimated Stabilized Yield on Developments as a useful metric for investors as it helps provide context to the expected effects that development projects will have on the Company’s future performance once stabilized.
Total Revenue per Occupied Home: The Company defines Total Revenue per Occupied Home as rental and other revenues, calculated in accordance with GAAP, divided by the product of occupancy and the number of apartment homes.
Management considers Total Revenue per Occupied Home a useful metric for investors as it serves as a proxy for portfolio quality, both geographic and physical.
TRS: The Company’s taxable REIT subsidiary (“TRS”) focuses on making investments and providing services that are otherwise not allowed to be made or provided by a REIT.
Visits: The Company defines Visits as the summation of tours taken by current and prospective residents, whether in-person (where allowed) or by virtual means, for the period indicated.
YTD Combined Same-Store Communities: YTD Combined Same-Store Communities represent the YTD UDR Same-Store Communities and the Acquired JV Same-Store Portfolio Communities as a single portfolio, as if the Acquired JV Same-Store Portfolio Communities were 100% owned by UDR during all periods presented.
YTD UDR Same-Store Communities: The Company defines YTD UDR Same-Store Communities as those communities Stabilized for two full consecutive calendar years. These communities were owned and had stabilized operating expenses as of the beginning of the prior year, were not in process of any substantial redevelopment activities, and were not held for disposition.
32
Attachment 16(E)
UDR, Inc.
Definitions and Reconciliations
December 31, 2020
(Unaudited)
All guidance is based on current expectations of future economic conditions and the judgment of the Company's management team. The following reconciles from GAAP Net income/(loss) per share for full-year 2021 and first quarter 2021 to forecasted FFO, FFO as Adjusted and AFFO per share and unit:
| | | | | Full-Year 2021 | | | ||||
| | | | | Low | | High | | | ||
| | | | | | | | | | | |
Forecasted net income per diluted share | | | | | $ | 0.13 | | $ | 0.25 | | |
Conversion from GAAP share count | | | | | | (0.02) | | | (0.02) | | |
Net gain on the sale of depreciable real estate owned | | | | | | (0.16) | | | (0.16) | | |
Depreciation | | | | | | 1.89 | | | 1.89 | | |
Noncontrolling interests | | | | | | 0.02 | | | 0.02 | | |
Preferred dividends | | | | | | 0.01 | | | 0.01 | | |
Forecasted FFO per diluted share and unit | | | | | $ | 1.87 | | $ | 1.99 | | |
Legal and other costs | | | | | | - | | | - | | |
Cost associated with debt extinguishment | | | | | | 0.01 | | | 0.01 | | |
Casualty-related charges/(recoveries) | | | | | | - | | | - | | |
Realized/unrealized gain on unconsolidated investments, net of tax | | | | | | - | | | - | | |
Forecasted FFO as Adjusted per diluted share and unit | | | | | $ | 1.88 | | $ | 2.00 | | |
Recurring capital expenditures | | | | | | (0.18) | | | (0.18) | | |
Forecasted AFFO per diluted share and unit | | | | | $ | 1.70 | | $ | 1.82 | | |
| | | | | | | | | | | |
| | | | | | | | | | | |
| | | | | 1Q 2021 | | | ||||
| | | | | Low | | High | | | ||
| | | | | | | | | | | |
Forecasted net income per diluted share | | | | | $ | 0.14 | | $ | 0.16 | | |
Conversion from GAAP share count | | | | | | (0.01) | | | (0.01) | | |
Net gain on the sale of depreciable real estate owned | | | | | | (0.16) | | | (0.16) | | |
Depreciation | | | | | | 0.47 | | | 0.47 | | |
Noncontrolling interests | | | | | | 0.01 | | | 0.01 | | |
Preferred dividends | | | | | | - | | | - | | |
Forecasted FFO per diluted share and unit | | | | | $ | 0.45 | | $ | 0.47 | | |
Legal and other costs | | | | | | - | | | - | | |
Cost associated with debt extinguishment | | | | | | 0.01 | | | 0.01 | | |
Casualty-related charges/(recoveries) | | | | | | - | | | - | | |
Realized/unrealized gain on unconsolidated investments, net of tax | | | | | | - | | | - | | |
Forecasted FFO as Adjusted per diluted share and unit | | | | | $ | 0.46 | | $ | 0.48 | | |
Recurring capital expenditures | | | | | | (0.03) | | | (0.03) | | |
Forecasted AFFO per diluted share and unit | | | | | $ | 0.43 | | $ | 0.45 | | |
33
=!'S%*N2735Q7MFVM^^O+>RO"-WK?L[JHK.A?@'>H+I:)[I@
M/8MS&BK!I\,L3H/$NWZ9F)K#Y"1, <.(>:<,DVG*]W'0@.Z%Y@PJW]N@J\ "
MZ;S$W3 ?]!QN*C?JP4$D)PO5^XJ1Y1)4U.YQ44S,K- HW&IR,6X"D,=1K2R*
MCZ@@#PGUL"Z0B.+#@*7E+1V_\2H#2Z!.V="C:53X4QF@(<^05X)C@LW?%2>A
M B%18B5V4*/>FE#T;Q!JL&$(A%YGG+.LB+*NDBR?QY-Z>1:XHVT< Q3;L5U
M+X'$FQ01K#AXXB1130=T<#WK%0S;340!(PGHS.F\QE2N> K#HPB.BAW)HS>G
M*"D:9ZX^QSTOV1'(CHK*7"T=\&:-*:D0I -5IO6*AY*958>ZA>4 2Y*]>3_.
M@ZXNTHX#YY#Z6<+@#45%4(=F\L(K"Q6/)CY!%MF]U94O"RG OF]D<.QX @[V*>-V"=
M^P#SP$YR<4ZJ^N*S8FD9]ALF8.HYRQ2] _.K \@G]0S87\5Q$'Z/Y%9VWI%]
MI%K\.GS$TVCW.IS? %^^K8(XT&[Q6R
M=V6NI@;?NYMD[^67L'?T@[BR"_Z*O4-U#^*=D"D*?D/'[R^N$7]-WC;UDUC\
MDCS0GQIZ%$VFE_E8(F+TU;EA8.RU$KG%IKQW3/M7_2/
MN*NT=G=:Y_2M\7-A=:76.L-96_-G\,L_X0\ %@O^"3 "+U?Z@T*96YD]K+WO:QK_WL[P '.LC!#G&HPQSN
M"$
J$.6[TYX'45-B)T9'TSF3H8
MIZF^>POR_ZK.K&9;"ZF_PGX:@3'* 7(9/.8,:SW&"K8]UJYIUCU 9
M:0$!9DY,JI H8\N@:I@+Z:8+4K'K)@L'* )?B)T7Y&9@K:G3TJ)9S7?(-SP9
M_S;U];%_3?T!%_]M]Z?C3VU<<,6:MD4+VMB%N8L:>\?O3)WYZ'^G3N-FO!4_
M@J\[=.[/6Q_=L&W[YDV@I4O ?NG?UQC1O8.(G1C5IEAM4