Exhibit 99.1
Interim Consolidated Financial Statements
April 30, 2024
(Unaudited)
VERSABANK
Consolidated Balance Sheets
(Unaudited)
| (thousands of Canadian dollars) | ||||||||||||
| April 30 | October 31 | April 30 | ||||||||||
| As at | 2024 | 2023 | 2023 | |||||||||
| Assets | ||||||||||||
| Cash | $ | $ | $ | |||||||||
| Securities (note 4) | ||||||||||||
| Loans, net of allowance for credit losses (note 5) | ||||||||||||
| Other assets (note 6) | ||||||||||||
| $ | $ | $ | ||||||||||
| Liabilities and Shareholders' Equity | ||||||||||||
| Deposits | $ | $ | $ | |||||||||
| Subordinated notes payable (note 7) | ||||||||||||
| Other liabilities (note 8) | ||||||||||||
| Shareholders' equity: | ||||||||||||
| Share capital (note 9) | ||||||||||||
| Contributed surplus | ||||||||||||
| Retained earnings | ||||||||||||
| Accumulated other comprehensive income | ||||||||||||
| $ | $ | $ | ||||||||||
The accompanying notes are an integral part of these interim Consolidated Financial Statements.
VERSABANK
Consolidated Statements of Income and Comprehensive Income
(Unaudited)
| (thousands of Canadian dollars, except per share amounts) | ||||||||||||||||
| for the three months ended | for the six months ended | |||||||||||||||
| April 30 | April 30 | April 30 | April 30 | |||||||||||||
| 2024 | 2023 | 2024 | 2023 | |||||||||||||
| Interest income: | ||||||||||||||||
| Loans | $ | $ | $ | $ | ||||||||||||
| Other | ||||||||||||||||
| Interest expense: | ||||||||||||||||
| Deposits and other | ||||||||||||||||
| Subordinated notes | ||||||||||||||||
| Net interest income | ||||||||||||||||
| Non-interest income | ||||||||||||||||
| Total revenue | ||||||||||||||||
| Provision for (recovery of) credit losses (note 5) | ( | ) | ||||||||||||||
| Non-interest expenses: | ||||||||||||||||
| Salaries and benefits | ||||||||||||||||
| General and administrative | ||||||||||||||||
| Premises and equipment | ||||||||||||||||
| Income before income taxes | ||||||||||||||||
| Income tax provision (note 10) | ||||||||||||||||
| Net income | $ | $ | $ | $ | ||||||||||||
| Other comprehensive income (loss): | ||||||||||||||||
| Items that may subsequently be reclassified to net income: Foreign exchange gain (loss) on translation of foreign operations | ( | ) | ||||||||||||||
| Comprehensive income | $ | $ | $ | $ | ||||||||||||
| Basic and diluted income per common share (note 11) | $ | $ | $ | $ | ||||||||||||
The accompanying notes are an integral part of these interim Consolidated Financial Statements.
VERSABANK
Consolidated Statements of Changes in Shareholders’ Equity
(Unaudited)
| (thousands of Canadian dollars) | ||||||||||||||||
| for the three months ended | for the six months ended | |||||||||||||||
| April 30 | April 30 | April 30 | April 30 | |||||||||||||
| 2024 | 2023 | 2024 | 2023 | |||||||||||||
| Common shares (note 9): | ||||||||||||||||
| Balance, beginning of the period | $ | $ | $ | $ | ||||||||||||
| Purchased and cancelled during the period | ( | ) | ( | ) | ||||||||||||
| Balance, end of the period | $ | $ | $ | $ | ||||||||||||
| Preferred shares (note 9): | ||||||||||||||||
| Series 1 preferred shares | ||||||||||||||||
| Balance, beginning and end of the period | $ | $ | $ | $ | ||||||||||||
| Total share capital | $ | $ | $ | $ | ||||||||||||
| Contributed surplus: | ||||||||||||||||
| Balance, beginning of the period | $ | $ | $ | $ | ||||||||||||
| Stock-based compensation (note 9) | ||||||||||||||||
| Balance, end of the period | $ | $ | $ | $ | ||||||||||||
| Retained earnings: | ||||||||||||||||
| Balance, beginning of the period | $ | $ | $ | $ | ||||||||||||
| Adjustment for purchased and cancelled common shares | ( | ) | ( | ) | ||||||||||||
| Net income | ||||||||||||||||
| Dividends paid on common and preferred shares | ( | ) | ( | ) | ( | ) | ( | ) | ||||||||
| Balance, end of the period | $ | $ | $ | $ | ||||||||||||
| Accumulated other comprehensive income: | ||||||||||||||||
| Balance, beginning of the period | $ | $ | $ | $ | ||||||||||||
| Other comprehensive income (loss) | ( | ) | ||||||||||||||
| Balance, end of the period | $ | $ | $ | $ | ||||||||||||
| Total shareholders' equity | $ | $ | $ | $ | ||||||||||||
The accompanying notes are an integral part of these interim Consolidated Financial Statements.
VERSABANK
Consolidated Statements of Cash Flows
(Unaudited)
| (thousands of Canadian dollars) | ||||||||
| for the six months ended | ||||||||
| April 30 | April 30 | |||||||
| 2024 | 2023 | |||||||
| Cash provided by (used in): | ||||||||
| Operations: | ||||||||
| Net income | $ | $ | ||||||
| Adjustments to determine net cash flows: | ||||||||
| Items not involving cash: | ||||||||
| Provision for credit losses (recovery of) | ( | ) | ||||||
| Stock-based compensation | ||||||||
| Income tax provision | ||||||||
| Interest income | ( | ) | ( | ) | ||||
| Interest expense | ||||||||
| Amortization | ||||||||
| Accretion of discount on securities | ( | ) | ( | ) | ||||
| Foreign exchange rate change on assets and liabilities | ( | ) | ||||||
| Interest received | ||||||||
| Interest paid | ( | ) | ( | ) | ||||
| Income taxes paid | ( | ) | ( | ) | ||||
| Change in operating assets and liabilities: | ||||||||
| Loans | ( | ) | ( | ) | ||||
| Deposits | ||||||||
| Change in other assets and liabilities | ||||||||
| Investing: | ||||||||
| Sale of securities (note 19) | ||||||||
| Purchase of property and equipment | ( | ) | ( | ) | ||||
| Financing: | ||||||||
| Purchase and cancellation of common shares | ( | ) | ||||||
| Redemption of subordinated notes payable | ( | ) | ||||||
| Dividends paid | ( | ) | ( | ) | ||||
| Repayment of lease obligations | ( | ) | ( | ) | ||||
| ( | ) | ( | ) | |||||
| Change in cash | ||||||||
| Effect of exchange rate changes on cash | ( | ) | ( | ) | ||||
| Cash, beginning of the period | ||||||||
| Cash, end of the period | $ | $ | ||||||
The accompanying notes are an integral part of these interim Consolidated Financial Statements.
| 1. | Reporting entity: |
VersaBank (the “Bank”) operates as a Schedule I bank under the Bank Act (Canada) and is regulated by the Office of the Superintendent of Financial Institutions Canada (“OSFI”). The Bank, whose shares trade on the Toronto Stock Exchange and Nasdaq Stock Exchange, provides commercial lending and banking services to select niche markets in Canada and the United States as well as cybersecurity services through the operations of its wholly owned subsidiary DRT Cyber Inc., (“DRTC”). The Bank is incorporated and domiciled in Canada, and maintains its registered office at Suite 2002, 140 Fullarton Street, London, Ontario, Canada, N6A 5P2.
| 2. | Basis of preparation: |
a) Statement of compliance:
These interim Consolidated Financial Statements have been prepared in accordance with International Financial Reporting Standards (“IFRS”) as issued by the International Accounting Standards Board (“IASB”) and have been prepared in accordance with International Accounting Standard (“IAS”) 34 – Interim Financial Reporting and do not include all of the information required for full annual financial statements. These interim Consolidated Financial Statements should be read in conjunction with the Bank’s audited Consolidated Financial Statements for the year ended October 31, 2023.
The interim Consolidated Financial Statements for the three and six months ended April 30, 2024 and 2023 were approved by the Audit Committee of the Bank’s Board of Directors on June 3, 2024.
b) Basis of measurement:
These interim Consolidated Financial Statements have been prepared on the historical cost basis except securities (note 4), the investment in Canada Stablecorp Inc. (note 6) and an interest rate swap (note 12), which are measured at fair value in the Consolidated Balance Sheets.
c) Functional and presentation currency:
These interim Consolidated Financial Statements are presented in Canadian dollars, which is the Bank’s functional currency. Functional currency is also determined for each of the Bank’s subsidiaries, and items included in the interim financial statements of the subsidiaries are measured using their functional currency.
d) Use of estimates and judgements:
In preparing these interim Consolidated Financial Statements, management has exercised judgement and developed estimates in applying accounting policies and generating reported amounts of assets and liabilities at the date of the financial statements and income and expenses during the reporting periods. Areas where judgement was applied include assessing significant changes in credit risk on financial assets and in the selection of relevant forward-looking information in assessing the Bank’s allowance for expected credit losses on its financial assets as described in note 5 – Loans. Estimates are applied in the determination of the allowance for expected credit losses on financial assets, the fair value of stock options granted as described in note 9, the fair value of the investment in Canada Stablecorp Inc. as described in note 6, and the measurement of deferred taxes. It is reasonably possible, on the basis of existing knowledge, that actual results may vary from those expected in the development of these estimates. This could result in material adjustments to the carrying amounts of assets and/or liabilities affected in the future.
Estimates and their underlying assumptions are reviewed on an ongoing basis. Revisions to accounting estimates are applied prospectively once they are known.
| 3. | Significant accounting policies and future accounting changes: |
The accounting policies applied by the Bank in these interim Consolidated Financial Statements are the same as those applied by the Bank as at and for the year ended October 31, 2023 and are detailed in note 3 of the Bank’s 2023 audited Consolidated Financial Statements.
| 4. | Securities: |
As at April 30, 2024, the Bank held securities totalling $
| 5. | Loans, net of allowance for credit losses: |
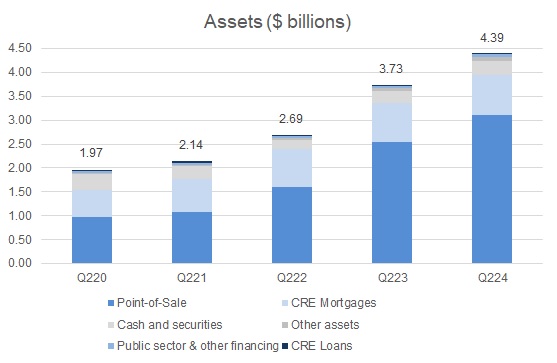
The Bank organizes its lending portfolio into the following four broad asset categories: Point-of-Sale Loans and Leases, Commercial Real Estate Mortgages, Commercial Real Estate Loans, and Public Sector and Other Financing. These categories have been established in the Bank’s proprietary, internally developed asset management system and have been designed to catalogue individual lending assets as a function primarily of their key risk drivers, the nature of the underlying collateral, and the applicable market segment.
The Point-of-Sale Loans and Leases (“POS Financing”) asset category is comprised of point-of-sale loan and lease receivables acquired from the Bank’s network of origination and servicing partners as well as warehouse loans that provide bridge financing to the Bank’s origination and servicing partners for the purpose of accumulating and seasoning practical volumes of individual loans and leases prior to the Bank purchasing the cashflow receivables derived from same.
The Commercial Real Estate Mortgages (“CRE Mortgages”) asset category is comprised primarily of Residential Construction, Term, Insured and Land Mortgages. All of these loans are business-to-business loans with the underlying credit risk exposure being primarily consumer in nature given that the vast majority of the loans are related to properties that are designated primarily for residential use. The portfolio benefits from diversity in its underlying security in the form of a broad range of such collateral properties.
The Commercial Real Estate Loans (“CRE Loans”) asset category is comprised primarily of condominium corporation financing loans.
The Public Sector and Other Financing (“PSOF”) asset category is comprised primarily of public sector loans and leases, a small balance of corporate loans and leases and single family residential conventional and insured mortgages.
Summary of loans and allowance for credit losses:
| (thousands of Canadian dollars) | ||||||||||||
| April 30 | October 31 | April 30 | ||||||||||
| 2024 | 2023 | 2023 | ||||||||||
| Point-of-sale loans and leases | $ | $ | $ | |||||||||
| Commercial real estate mortgages | ||||||||||||
| Commercial real estate loans | ||||||||||||
| Public sector and other financing | ||||||||||||
| Allowance for credit losses | ( | ) | ( | ) | ( | ) | ||||||
| Accrued interest | ||||||||||||
| Total loans, net of allowance for credit losses | $ | $ | $ | |||||||||
The following table provides a summary of loan amounts, ECL allowance amounts, and expected loss (“EL”) rates by lending asset category:
| As at April 30, 2024 | As at October 31, 2023 | |||||||||||||||||||||||||||||||
| (thousands of Canadian dollars) | Stage 1 | Stage 2 | Stage 3 | Total | Stage 1 | Stage 2 | Stage 3 | Total | ||||||||||||||||||||||||
| Point-of-sale loans and leases | $ | $ | $ | $ | $ | $ | $ | $ | ||||||||||||||||||||||||
| ECL allowance | ||||||||||||||||||||||||||||||||
| EL % | % | % | % | % | % | % | % | % | ||||||||||||||||||||||||
| Commercial real estate mortgages | $ | $ | $ | $ | $ | $ | $ | $ | ||||||||||||||||||||||||
| ECL allowance | ||||||||||||||||||||||||||||||||
| EL % | % | % | % | % | % | % | % | % | ||||||||||||||||||||||||
| Commercial real estate loans | $ | $ | $ | $ | $ | $ | $ | $ | ||||||||||||||||||||||||
| ECL allowance | ||||||||||||||||||||||||||||||||
| EL % | % | % | % | % | % | % | % | % | ||||||||||||||||||||||||
| Public sector and other financing | $ | $ | $ | $ | $ | $ | $ | $ | ||||||||||||||||||||||||
| ECL allowance | ||||||||||||||||||||||||||||||||
| EL % | % | % | % | % | % | % | % | % | ||||||||||||||||||||||||
| Total loans | $ | $ | $ | $ | $ | $ | $ | $ | ||||||||||||||||||||||||
| Total ECL allowance | ||||||||||||||||||||||||||||||||
| Total EL % | % | % | % | % | % | % | % | % | ||||||||||||||||||||||||
The Bank’s maximum exposure to credit risk is the carrying value of its financial assets. The Bank holds security against the majority of its loans in the form of mortgage interests over property, other registered securities over assets, guarantees or cash reserves (holdbacks) on loan and lease receivables included in the POS Financing portfolio (see note 8).
Allowance for credit losses
The Bank must maintain an allowance for expected credit losses that is adequate, in management’s opinion, to absorb all credit related losses in the Bank’s lending and treasury portfolios. The expected credit loss methodology requires the recognition of credit losses based on 12 months of expected losses for performing loans which is reflected in the Bank’s Stage 1 grouping. The Bank recognizes lifetime expected losses on loans that have experienced a significant increase in credit risk since origination which is reflected in the Bank’s Stage 2 grouping. While there is elevated credit risk in the Bank’s POS Financing portfolio as at the measurement date, management does not believe that this represents significant increase in credit risk in that portfolio and the majority of this portfolio remains in stage 1. Impaired loans require recognition of lifetime losses and is reflected in Stage 3 grouping.
Forward-looking Information
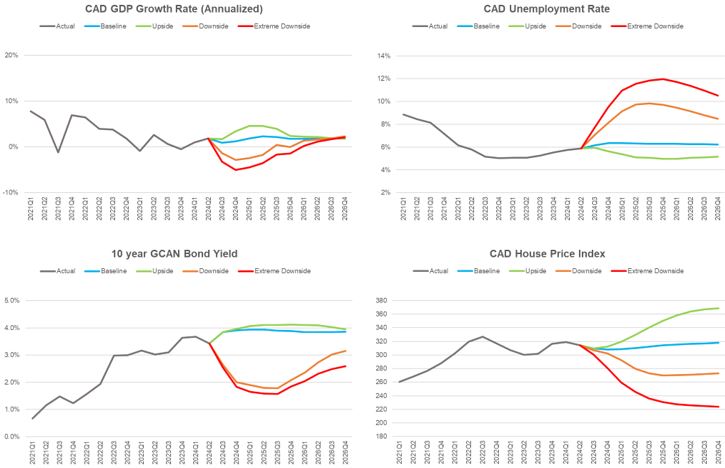
The Bank has sourced credit risk modeling systems and forecast macroeconomic scenario data from Moody’s Analytics, a third-party service provider for the purpose of computing forward-looking credit risk parameters under multiple macroeconomic scenarios that consider both market-wide and idiosyncratic factors and influences. The macroeconomic indicator data utilized by the Bank for the purpose of sensitizing probability of default and loss given default term structure data to forward economic conditions include, but are not limited to: real GDP, the national unemployment rate, long term interest rates, the consumer price index, the S&P/TSX Index and the price of oil. These specific macroeconomic indicators were selected in an attempt to ensure that the spectrum of fundamental macroeconomic influences on the key drivers of the credit risk profile of the Bank’s balance sheet, including: corporate, consumer and real estate market dynamics; corporate, consumer and SME borrower performance; geography; as well as collateral value volatility, are appropriately captured and incorporated into the Bank’s forward macroeconomic sensitivity analysis.
Key assumptions driving Moody’s Analytics’ baseline macroeconomic forecast trends this quarter include: the Bank of Canada cutting interest rates at the June policy meeting; the Canadian economy returning to modest growth in late 2024 and inflation approaching the Bank of Canada’s target by the third quarter of 2024; elevated debt service obligations strain household finances but result in only modest loan deterioration; high financing costs and low sales volumes cause home prices to contract over the course of the majority of year; the various military conflicts continue but do not escalate to other regional powers; supply-chain bottlenecks continue to ease which aids in moderating inflation; outbreaks of disease or illness have very little economic impact; and global oil prices stabilize with West Texas Intermediate in the high US $
Management developed ECL estimates using credit risk parameter term structure forecasts sensitized to individual baseline, upside and downside forecast macroeconomic scenarios, each weighted at 100%, and subsequently computed the variance of each to the Bank’s reported ECL as at April 30, 2024 in order to assess the alignment of the Bank’s reported ECL with the Bank’s credit risk profile, and further, to assess the scope, depth and ultimate effectiveness of the credit risk mitigation strategies that the Bank has applied to its lending portfolios (see Expected Credit Loss Sensitivity below).
Expected credit loss sensitivity:
The following table presents the sensitivity of the Bank’s estimated ECL to a range of individual macroeconomic scenarios, that in isolation may not reflect the Bank’s actual expected ECL exposure, as well as the variance of each to the Bank’s reported ECL as at April 30, 2024:
| (thousands of Canadian dollars) | ||||||||||||||||
| Reported | 100% | 100% | 100% | |||||||||||||
| ECL | Upside | Baseline | Downside | |||||||||||||
| Allowance for expected credit losses | $ | $ | $ | $ | ||||||||||||
| Variance from reported ECL | ( | ) | ( | ) | ||||||||||||
| Variance from reported ECL (%) | ( | ) | ( | ) | % | |||||||||||
The following table provides a reconciliation of the Bank’s ECL allowance by lending asset category for the three months ended April 30, 2024:
| (thousands of Canadian dollars) | Stage 1 | Stage 2 | Stage 3 | Total | ||||||||||||
| Point-of-sale loans and leases | ||||||||||||||||
| Balance at beginning of period | $ | $ | $ | $ | ||||||||||||
| Transfer in (out) to Stage 1 | ||||||||||||||||
| Transfer in (out) to Stage 2 | ||||||||||||||||
| Transfer in (out) to Stage 3 | ||||||||||||||||
| Net remeasurement of loss allowance | ||||||||||||||||
| Loan originations | ||||||||||||||||
| Derecognitions and maturities | ||||||||||||||||
| Provision for (recovery of) credit losses | ||||||||||||||||
| Write-offs | ||||||||||||||||
| Recoveries | ||||||||||||||||
| Balance at end of period | $ | $ | $ | $ | ||||||||||||
| Commercial real estate mortgages | ||||||||||||||||
| Balance at beginning of period | $ | $ | $ | $ | ||||||||||||
| Transfer in (out) to Stage 1 | ( | ) | ||||||||||||||
| Transfer in (out) to Stage 2 | ( | ) | ||||||||||||||
| Transfer in (out) to Stage 3 | ||||||||||||||||
| Net remeasurement of loss allowance | ( | ) | ( | ) | ( | ) | ||||||||||
| Loan originations | ||||||||||||||||
| Derecognitions and maturities | ( | ) | ( | ) | ( | ) | ||||||||||
| Provision for (recovery of) credit losses | ( | ) | ( | ) | ( | ) | ||||||||||
| Write-offs | ||||||||||||||||
| Recoveries | ||||||||||||||||
| Balance at end of period | $ | $ | $ | $ | ||||||||||||
| Commercial real estate loans | ||||||||||||||||
| Balance at beginning of period | $ | $ | $ | $ | ||||||||||||
| Transfer in (out) to Stage 1 | ||||||||||||||||
| Transfer in (out) to Stage 2 | ||||||||||||||||
| Transfer in (out) to Stage 3 | ||||||||||||||||
| Net remeasurement of loss allowance | ||||||||||||||||
| Loan originations | ||||||||||||||||
| Derecognitions and maturities | ||||||||||||||||
| Provision for (recovery of) credit losses | ||||||||||||||||
| Write-offs | ||||||||||||||||
| Recoveries | ||||||||||||||||
| Balance at end of period | $ | $ | $ | $ | ||||||||||||
| Public sector and other financing | ||||||||||||||||
| Balance at beginning of period | $ | $ | $ | $ | ||||||||||||
| Transfer in (out) to Stage 1 | ||||||||||||||||
| Transfer in (out) to Stage 2 | ||||||||||||||||
| Transfer in (out) to Stage 3 | ||||||||||||||||
| Net remeasurement of loss allowance | ( | ) | ||||||||||||||
| Loan originations | ||||||||||||||||
| Derecognitions and maturities | ||||||||||||||||
| Provision for (recovery of) credit losses | ( | ) | ||||||||||||||
| Write-offs | ||||||||||||||||
| Recoveries | ||||||||||||||||
| Balance at end of period | $ | $ | $ | $ | ||||||||||||
| Total balance at end of period | $ | $ | $ | $ | ||||||||||||
The following table provides a reconciliation of the Bank’s ECL allowance by lending asset category for the three months ended April 30, 2023:
| (thousands of Canadian dollars) | Stage 1 | Stage 2 | Stage 3 | Total | ||||||||||||
| Point-of-sale loans and leases | ||||||||||||||||
| Balance at beginning of period | $ | $ | $ | $ | ||||||||||||
| Transfer in (out) to Stage 1 | ( | ) | ||||||||||||||
| Transfer in (out) to Stage 2 | ( | ) | ||||||||||||||
| Transfer in (out) to Stage 3 | ||||||||||||||||
| Net remeasurement of loss allowance | ( | ) | ||||||||||||||
| Loan originations | ||||||||||||||||
| Derecognitions and maturities | ||||||||||||||||
| Provision for (recovery of) credit losses | ||||||||||||||||
| Write-offs | ||||||||||||||||
| Recoveries | ||||||||||||||||
| Balance at end of period | $ | $ | $ | $ | ||||||||||||
| Commercial real estate mortgages | ||||||||||||||||
| Balance at beginning of period | $ | $ | $ | $ | ||||||||||||
| Transfer in (out) to Stage 1 | ( | ) | ||||||||||||||
| Transfer in (out) to Stage 2 | ( | ) | ||||||||||||||
| Transfer in (out) to Stage 3 | ( | ) | ||||||||||||||
| Net remeasurement of loss allowance | ( | ) | ( | ) | ||||||||||||
| Loan originations | ||||||||||||||||
| Derecognitions and maturities | ( | ) | ( | ) | ( | ) | ||||||||||
| Provision for (recovery of) credit losses | ||||||||||||||||
| Write-offs | ||||||||||||||||
| Recoveries | ||||||||||||||||
| Balance at end of period | $ | $ | $ | $ | ||||||||||||
| Commercial real estate loans | ||||||||||||||||
| Balance at beginning of period | $ | $ | $ | $ | ||||||||||||
| Transfer in (out) to Stage 1 | ||||||||||||||||
| Transfer in (out) to Stage 2 | ||||||||||||||||
| Transfer in (out) to Stage 3 | ||||||||||||||||
| Net remeasurement of loss allowance | ||||||||||||||||
| Loan originations | ||||||||||||||||
| Derecognitions and maturities | ||||||||||||||||
| Provision for (recovery of) credit losses | ||||||||||||||||
| Write-offs | ||||||||||||||||
| Recoveries | ||||||||||||||||
| Balance at end of period | $ | $ | $ | $ | ||||||||||||
| Public sector and other financing | ||||||||||||||||
| Balance at beginning of period | $ | $ | $ | $ | ||||||||||||
| Transfer in (out) to Stage 1 | ||||||||||||||||
| Transfer in (out) to Stage 2 | ||||||||||||||||
| Transfer in (out) to Stage 3 | ||||||||||||||||
| Net remeasurement of loss allowance | ( | ) | ( | ) | ||||||||||||
| Loan originations | ||||||||||||||||
| Derecognitions and maturities | ||||||||||||||||
| Provision for (recovery of) credit losses | ||||||||||||||||
| Write-offs | ||||||||||||||||
| Recoveries | ||||||||||||||||
| Balance at end of period | $ | $ | $ | $ | ||||||||||||
| Total balance at end of period | $ | $ | $ | $ | ||||||||||||
The following table provides a reconciliation of the Bank’s ECL allowance by lending asset category for the six months ended April 30, 2024:
| (thousands of Canadian dollars) | Stage 1 | Stage 2 | Stage 3 | Total | ||||||||||||
| Point-of-sale loans and leases | ||||||||||||||||
| Balance at beginning of period | $ | $ | $ | $ | ||||||||||||
| Transfer in (out) to Stage 1 | ||||||||||||||||
| Transfer in (out) to Stage 2 | ||||||||||||||||
| Transfer in (out) to Stage 3 | ||||||||||||||||
| Net remeasurement of loss allowance | ||||||||||||||||
| Loan originations | ||||||||||||||||
| Derecognitions and maturities | ||||||||||||||||
| Provision for (recovery of) credit losses | ||||||||||||||||
| Write-offs | ||||||||||||||||
| Recoveries | ||||||||||||||||
| Balance at end of period | $ | $ | $ | $ | ||||||||||||
| Commercial real estate mortgages | ||||||||||||||||
| Balance at beginning of period | $ | $ | $ | $ | ||||||||||||
| Transfer in (out) to Stage 1 | ( | ) | ||||||||||||||
| Transfer in (out) to Stage 2 | ( | ) | ||||||||||||||
| Transfer in (out) to Stage 3 | ||||||||||||||||
| Net remeasurement of loss allowance | ( | ) | ( | ) | ( | ) | ||||||||||
| Loan originations | ||||||||||||||||
| Derecognitions and maturities | ( | ) | ( | ) | ( | ) | ||||||||||
| Provision for (recovery of) credit losses | ( | ) | ( | ) | ( | ) | ||||||||||
| Write-offs | ||||||||||||||||
| Recoveries | ||||||||||||||||
| Balance at end of period | $ | $ | $ | $ | ||||||||||||
| Commercial real estate loans | ||||||||||||||||
| Balance at beginning of period | $ | $ | $ | $ | ||||||||||||
| Transfer in (out) to Stage 1 | ||||||||||||||||
| Transfer in (out) to Stage 2 | ||||||||||||||||
| Transfer in (out) to Stage 3 | ||||||||||||||||
| Net remeasurement of loss allowance | ||||||||||||||||
| Loan originations | ||||||||||||||||
| Derecognitions and maturities | ||||||||||||||||
| Provision for (recovery of) credit losses | ||||||||||||||||
| Write-offs | ||||||||||||||||
| Recoveries | ||||||||||||||||
| Balance at end of period | $ | $ | $ | $ | ||||||||||||
| Public sector and other financing | ||||||||||||||||
| Balance at beginning of period | $ | $ | $ | $ | ||||||||||||
| Transfer in (out) to Stage 1 | ( | ) | ||||||||||||||
| Transfer in (out) to Stage 2 | ||||||||||||||||
| Transfer in (out) to Stage 3 | ||||||||||||||||
| Net remeasurement of loss allowance | ( | ) | ||||||||||||||
| Loan originations | ||||||||||||||||
| Derecognitions and maturities | ||||||||||||||||
| Provision for (recovery of) credit losses | ( | ) | ||||||||||||||
| Write-offs | ||||||||||||||||
| Recoveries | ||||||||||||||||
| Balance at end of period | $ | $ | $ | $ | ||||||||||||
| Total balance at end of period | $ | $ | $ | $ | ||||||||||||
The following table provides a reconciliation of the Bank’s ECL allowance by lending asset category for the six months ended April 30, 2023:
| (thousands of Canadian dollars) | Stage 1 | Stage 2 | Stage 3 | Total | ||||||||||||
| Point-of-sale loans and leases | ||||||||||||||||
| Balance at beginning of period | $ | $ | $ | $ | ||||||||||||
| Transfer in (out) to Stage 1 | ( | ) | ||||||||||||||
| Transfer in (out) to Stage 2 | ( | ) | ||||||||||||||
| Transfer in (out) to Stage 3 | ||||||||||||||||
| Net remeasurement of loss allowance | ( | ) | ||||||||||||||
| Loan originations | ||||||||||||||||
| Derecognitions and maturities | ||||||||||||||||
| Provision for (recovery of) credit losses | ||||||||||||||||
| Write-offs | ||||||||||||||||
| Recoveries | ||||||||||||||||
| Balance at end of period | $ | $ | $ | $ | ||||||||||||
| Commercial real estate mortgages | ||||||||||||||||
| Balance at beginning of period | $ | $ | $ | $ | ||||||||||||
| Transfer in (out) to Stage 1 | ( | ) | ||||||||||||||
| Transfer in (out) to Stage 2 | ( | ) | ||||||||||||||
| Transfer in (out) to Stage 3 | ( | ) | ||||||||||||||
| Net remeasurement of loss allowance | ( | ) | ( | ) | ||||||||||||
| Loan originations | ||||||||||||||||
| Derecognitions and maturities | ( | ) | ( | ) | ( | ) | ||||||||||
| Provision for (recovery of) credit losses | ( | ) | ||||||||||||||
| Write-offs | ||||||||||||||||
| Recoveries | ||||||||||||||||
| Balance at end of period | $ | $ | $ | $ | ||||||||||||
| Commercial real estate loans | ||||||||||||||||
| Balance at beginning of period | $ | $ | $ | $ | ||||||||||||
| Transfer in (out) to Stage 1 | ||||||||||||||||
| Transfer in (out) to Stage 2 | ||||||||||||||||
| Transfer in (out) to Stage 3 | ||||||||||||||||
| Net remeasurement of loss allowance | ||||||||||||||||
| Loan originations | ||||||||||||||||
| Derecognitions and maturities | ||||||||||||||||
| Provision for (recovery of) credit losses | ||||||||||||||||
| Write-offs | ||||||||||||||||
| Recoveries | ||||||||||||||||
| Balance at end of period | $ | $ | $ | $ | ||||||||||||
| Public sector and other financing | ||||||||||||||||
| Balance at beginning of period | $ | $ | $ | $ | ||||||||||||
| Transfer in (out) to Stage 1 | ||||||||||||||||
| Transfer in (out) to Stage 2 | ||||||||||||||||
| Transfer in (out) to Stage 3 | ||||||||||||||||
| Net remeasurement of loss allowance | ||||||||||||||||
| Loan originations | ||||||||||||||||
| Derecognitions and maturities | ||||||||||||||||
| Provision for (recovery of) credit losses | ||||||||||||||||
| Write-offs | ||||||||||||||||
| Recoveries | ||||||||||||||||
| Balance at end of period | $ | $ | $ | $ | ||||||||||||
| Total balance at end of period | $ | $ | $ | $ | ||||||||||||
Credit quality:
The Bank assigns a risk rating to each lending asset comprising its lending portfolio. A risk rating is assigned as a function of each new credit application, annual review or an amendment to a facility. The risk rating considers the credit risk attributes of the lending asset, structure, individual borrower circumstances as well as local, regional and global macroeconomic and market conditions. The Bank aggregates its risk rating assignments into the following three broad categories:
i) Satisfactory – The borrower and lending asset valuation are of acceptable credit quality.
ii) Watchlist – The borrower or the lending asset valuation exhibits potential credit weakness or a downward trend which, if not mitigated, will potentially weaken the Bank’s position. The lending asset requires close supervision.
iii) Classified – The collection of the structural payment and/or the full repayment of the lending asset is uncertain.
As of April 30, 2024,
| 6. | Other assets: |
| (thousands of Canadian dollars) | ||||||||||||
| April 30 | October 31 | April 30 | ||||||||||
| 2024 | 2023 | 2023 | ||||||||||
| Accounts receivable | $ | $ | $ | |||||||||
| Prepaid expenses and other | ||||||||||||
| Property and equipment | ||||||||||||
| Right-of-use assets | ||||||||||||
| Deferred income tax asset | ||||||||||||
| Interest rate swap (note 12) | ||||||||||||
| Investment (note 6a) | ||||||||||||
| Goodwill | ||||||||||||
| Intangible assets | ||||||||||||
| $ | $ | $ | ||||||||||
| a) | In February 2021, the Bank acquired an |
| 7. | Subordinated notes payable: |
| (thousands of Canadian dollars) | ||||||||||||
| April 30 | October 31 | April 30 | ||||||||||
| 2024 | 2023 | 2023 | ||||||||||
| Issued April 2021, unsecured, non-viability contingent capital compliant, subordinated notes payable, principal amount of US $ million, fixed effective interest rate of %, maturing . | $ | $ | $ | |||||||||
| Issued March 2019, unsecured, non-viability contingent capital compliant, subordinated notes payable, principal amount of $ million, $ is held by related party (note 14), fixed effective interest rate of %, maturing . | ||||||||||||
| $ | $ | $ | ||||||||||
On April 30, 2024, the Bank redeemed its $
| 8. | Other liabilities: |
| (thousands of Canadian dollars) | ||||||||||||
| April 30 | October 31 | April 30 | ||||||||||
| 2024 | 2023 | 2023 | ||||||||||
| Accounts payable and other | $ | $ | $ | |||||||||
| Current income tax liability | ||||||||||||
| Deferred income tax liability | ||||||||||||
| Lease obligations | ||||||||||||
| Cash collateral and amounts held in escrow | ||||||||||||
| Cash reserves on loan and lease receivables | ||||||||||||
| $ | $ | $ | ||||||||||
| 9. | Share capital: |
a) Common shares:
At April 30, 2024, there were
On August 5, 2022, the Bank received approval from the Toronto Stock Exchange (“TSX”) to proceed with a Normal Course Issuer Bid (“NCIB”) for its common shares. On September 21, 2022, the Bank received approval from the Nasdaq to proceed with a NCIB for its common shares. Pursuant to the NCIB, VersaBank was authorized to purchase for cancellation up to
The Bank was eligible to make purchases commencing on August 17, 2022 and the NCIB was terminated on August 16, 2023. The purchases were made by VersaBank through the facilities of the TSX and alternate trading systems and the Nasdaq in accordance with the rules of the TSX and such alternate trading systems and the Nasdaq, as applicable, and the prices that VersaBank paid for the Common Shares was at the market price of such shares at the time of acquisition. VersaBank made no purchases of Common Shares other than open market purchases. All shares purchased under the NCIB were cancelled.
No common shares were issued or purchased in the quarter end April 30, 2024. For the quarter ended April 30, 2023, the Bank purchased and cancelled
No common shares were issued or purchased in the six month period ended April 30, 2024. For the six month period ended April 30, 2023, the Bank purchased and cancelled
b) Preferred shares:
At April 30, 2024, there were
The holders of the Series 1 preferred shares are entitled to receive a non-cumulative fixed dividend in the amount of $
The Bank maintains the right to redeem, subject to the approval of OSFI, up to all of the outstanding Series 1 preferred shares on October 31, 2024 and on October 31 every years thereafter at a price of $
c) Stock options
Stock option transactions during the three and six month periods ended April 30, 2024 and 2023:
| for the three months ended | for the six months ended | |||||||||||||||||||||||||||||||
| April 30, 2024 | April 30, 2023 | April 30, 2024 | April 30, 2023 | |||||||||||||||||||||||||||||
| Weighted | Weighted | Weighted | Weighted | |||||||||||||||||||||||||||||
| Number of | average | Number of | average | Number of | average | Number of | average | |||||||||||||||||||||||||
| options | exercise price | options | exercise price | options | exercise price | options | exercise price | |||||||||||||||||||||||||
| Outstanding, beginning of period | $ | $ | $ | $ | ||||||||||||||||||||||||||||
| Granted | ||||||||||||||||||||||||||||||||
| Exercised | ||||||||||||||||||||||||||||||||
| Forfeited/cancelled | ( | ) | ( | ) | ( | ) | ( | ) | ||||||||||||||||||||||||
| Expired | ||||||||||||||||||||||||||||||||
| Outstanding, end of period | $ | $ | $ | $ | ||||||||||||||||||||||||||||
For the three and six month periods ended April 30, 2024, the Bank recognized $
| 10. | Income tax provision: |
Income tax provision for the three and six month periods ended April 30, 2024 was $
| 11. | Income per common share: |
| (thousands of Canadian dollars, except shares outstanding and per share amounts) | ||||||||||||||||
| for the three months ended | for the six months ended | |||||||||||||||
| April 30 | April 30 | April 30 | April 30 | |||||||||||||
| 2024 | 2023 | 2024 | 2023 | |||||||||||||
| Net income | $ | $ | $ | $ | ||||||||||||
| Less: dividends on preferred shares | ( | ) | ( | ) | ( | ) | ( | ) | ||||||||
| Weighted average number of common shares outstanding | ||||||||||||||||
| Income per common share: | $ | $ | $ | $ | ||||||||||||
Common shares associated with the Series 1 NVCC preferred shares are contingently issuable shares and would only have a dilutive impact upon issuance.
| 12. | Derivative instruments: |
At April 30, 2024, the Bank had an outstanding contract established for asset liability management purposes to swap between fixed and floating interest rates with a notional amount totalling $
| 13. | Commitments and contingencies: |
The amount of credit-related commitments represents the maximum amount of additional credit that the Bank could be obligated to extend.
| (thousands of Canadian dollars) | ||||||||||||
| April 30 | October 31 | April 30 | ||||||||||
| 2024 | 2023 | 2023 | ||||||||||
| Loan commitments | $ | $ | $ | |||||||||
| Letters of credit | ||||||||||||
| $ | $ | $ | ||||||||||
| 14. | Related party transactions: |
The Bank’s Board of Directors and Senior Executive Officers represent key management personnel and are related parties. At April 30, 2024, amounts due from these related parties totalled $
| 15. | Capital management: |
a) Overview:
The Bank’s policy is to maintain a strong capital base so as to retain investor, creditor and market confidence as well as to support the future growth and development of the business. The impact of the level of capital held on shareholders’ return is an important consideration, and the Bank recognizes the need to maintain a balance between the higher returns that may be possible with greater leverage and the advantages and security that may be afforded by a more robust capital position.
OSFI sets and monitors capital requirements for the Bank. Capital is managed in accordance with policies and plans that are regularly reviewed and approved by the Board of Directors and that take into account, amongst other items, forecasted capital requirements and current and anticipated financial market conditions.
The goal is to maintain adequate regulatory capital for the Bank to be considered well capitalized, protect deposits and provide capacity to support organic growth as well as to capitalize on strategic opportunities that do not otherwise require accessing the public capital markets, all the while providing a satisfactory return to shareholders. The Bank’s regulatory capital is comprised of share capital, retained earnings and unrealized gains and losses on fair value through other comprehensive income securities (Common Equity Tier 1 capital), preferred shares (Additional Tier 1 capital) and subordinated notes (Tier 2 capital).
The Bank monitors its capital adequacy and related capital ratios on a daily basis and has policies setting internal targets and thresholds for its capital ratios. These capital ratios consist of the leverage ratio and the risk-based capital ratios.
The Bank makes use of the Standardized Approach for credit risk as prescribed by OSFI and, therefore, may include eligible ECL allowance amounts in its Tier 2 capital, up to a maximum of
During the period ended April 30, 2024, there were no material changes in the Bank’s management of capital.
b) Risk-based capital ratios:
The Basel Committee on Banking Supervision has published the Basel III rules on capital adequacy and liquidity (“Basel III”). OSFI requires that all Canadian banks must comply with the Basel III standards on an “all-in” basis for the purpose of determining their risk-based capital ratios. Required minimum regulatory capital ratios are a
OSFI also requires banks to measure capital adequacy in accordance with guidelines for determining risk- adjusted capital and risk-weighted assets including off-balance sheet credit instruments as specified in the Basel III regulations. Based on the deemed credit risk for each type of asset, both on and off-balance sheet assets of the Bank are assigned a weighting ranging between 0% to 150% to determine the Bank’s risk- weighted equivalent assets and its risk-based capital ratios.
The Bank’s risk-based capital ratios are calculated as follows:
| (thousands of Canadian dollars) | ||||||||
| April 30 | October 31 | |||||||
| 2024 | 2023 | |||||||
| Common Equity Tier 1 (CET1) capital | ||||||||
| Directly issued qualifying common share capital | $ | $ | ||||||
| Contributed surplus | ||||||||
| Retained earnings | ||||||||
| Accumulated other comprehensive income | ||||||||
| CET1 before regulatory adjustments | ||||||||
| Regulatory adjustments applied to CET1 | ( | ) | ( | ) | ||||
| Common Equity Tier 1 capital | $ | $ | ||||||
| Additional Tier 1 capital | ||||||||
| Directly issued qualifying Additional Tier 1 instruments | $ | $ | ||||||
| Total Tier 1 capital | $ | $ | ||||||
| Tier 2 capital | ||||||||
| Directly issued Tier 2 capital instruments | $ | $ | ||||||
| Tier 2 capital before regulatory adjustments | ||||||||
| Eligible stage 1 and stage 2 allowance | ||||||||
| Total Tier 2 capital | $ | $ | ||||||
| Total regulatory capital | $ | $ | ||||||
| Total risk-weighted assets | $ | $ | ||||||
| Capital ratios | ||||||||
| CET1 capital ratio | % | % | ||||||
| Tier 1 capital ratio | % | % | ||||||
| Total capital ratio | % | % | ||||||
As at April 30, 2024 and October 31, 2023, the Bank exceeded all of the minimum Basel III regulatory capital requirements prescribed by OSFI.
c) Leverage ratio:
The leverage ratio, which is prescribed under the Basel III Accord, is a supplementary measure to the risk-based capital requirements and is defined as the ratio of Tier 1 capital to the Bank’s total exposures. The Basel III minimum leverage ratio is
| (thousands of Canadian dollars) | ||||||||
| April 30 | October 31 | |||||||
| 2024 | 2023 | |||||||
| On-balance sheet assets | $ | $ | ||||||
| Assets amounts adjusted in determining the Basel III Tier 1 capital | ( | ) | ( | ) | ||||
| Total on-balance sheet exposures | ||||||||
| Total off-balance sheet exposure at gross notional amount | $ | $ | ||||||
| Adjustments for conversion to credit equivalent amount | ( | ) | ( | ) | ||||
| Total off-balance sheet exposures | ||||||||
| Tier 1 capital | ||||||||
| Total exposures | ||||||||
| Leverage ratio | % | % | ||||||
As at April 30, 2024 and October 31, 2023, the Bank was in compliance with the leverage ratio prescribed by OSFI.
| 16. | Interest rate risk position: |
The Bank is subject to interest rate risk, which is the risk that a movement in interest rates could negatively impact net interest margin, net interest income and the economic value of assets, liabilities and shareholders’ equity. The following table provides the duration difference between the Bank’s assets and liabilities and the potential after-tax impact of a 100 basis point shift in interest rates on the Bank’s earnings during a 12 month period.
| (thousands of Canadian dollars) | ||||||||||||||||
| April 30, 2024 | October 31, 2023 | |||||||||||||||
| Increase 100 bps | Decrease 100 bps | Increase 100 bps | Decrease 100 bps | |||||||||||||
| Increase (decrease): | ||||||||||||||||
| Impact on projected net interest income during a 12 month period | $ | $ | ( | ) | $ | $ | ( | ) | ||||||||
| Duration difference between assets and liabilities (months) | ) | ( | ) | |||||||||||||
| 17. | Fair value of financial instruments: |
Fair values are based on management’s best estimates of market conditions and valuation policies at a certain point in time. The estimates are subjective and involve particular assumptions and judgement and, as such, may not be reflective of future fair values. The Bank’s loans and deposits lack an available market as they are not typically exchanged and, therefore, the book value of these instruments is not necessarily representative of amounts realizable upon immediate settlement. See note 21 of the October 31, 2023 audited Consolidated Financial Statements for more information on fair values.
| (thousands of Canadian dollars) | ||||||||||||||||||||||||||||||||||||||||
| April 30, 2024 | October 31, 2023 | |||||||||||||||||||||||||||||||||||||||
| Carrying Value | Fair value Level 1 | Fair Value Level 2 | Fair Value Level 3 | Total Fair Value | Carrying Value | Fair value Level 1 | Fair Value Level 2 | Fair Value Level 3 | Total Fair Value | |||||||||||||||||||||||||||||||
| Assets | ||||||||||||||||||||||||||||||||||||||||
| Cash | $ | $ | $ | $ | $ | $ | $ | $ | $ | $ | ||||||||||||||||||||||||||||||
| Securities | ||||||||||||||||||||||||||||||||||||||||
| Loans | ||||||||||||||||||||||||||||||||||||||||
| Derivatives | ||||||||||||||||||||||||||||||||||||||||
| Other financial assets | ||||||||||||||||||||||||||||||||||||||||
| Liabilities | ||||||||||||||||||||||||||||||||||||||||
| Deposits | $ | $ | $ | $ | $ | $ | $ | $ | $ | $ | ||||||||||||||||||||||||||||||
| Subordinated notes payable | ||||||||||||||||||||||||||||||||||||||||
| Other financial liabilities | ||||||||||||||||||||||||||||||||||||||||
| 18. | Operating segmentation: |
The Bank has established reportable operating segments, those being Digital Banking and DRTC (cybersecurity services). The two operating segments are strategic business operations providing distinct products and services to different markets and are separately managed as a function of the distinction in the nature of each business. The following summarizes the operations of each of the reportable segments:
Digital Banking – The Bank employs a branchless business-to-business model using its proprietary financial technology to address underserved segments in the Canadian and US banking markets. VersaBank obtains its deposits and provides the majority of its loans and leases electronically via innovative deposit and lending solutions for financial intermediaries.
DRTC (cybersecurity services and banking and financial technology development) – Leveraging its internally developed IT security software and capabilities, VersaBank established a wholly owned subsidiary, DRT Cyber Inc., to pursue significant large-market opportunities in cybersecurity and develop innovative solutions to address the rapidly growing volume of cyber threats challenging financial institutions, multi-national corporations and government entities.
The basis for the determination of the reportable segments is a function primarily of the systematic, consistent process employed by the Bank’s chief operating decision maker, the Chief Executive Officer, and the Chief Financial Officer in reviewing and interpreting the operations and performance of each segment. The accounting policies applied to these segments are consistent with those employed in the preparation of the Bank’s Consolidated Financial Statements, as disclosed in note 3 of the Bank’s 2023 audited Consolidated Financial Statements.
Performance is measured based on segment net income, as included in the Bank’s internal management reporting. Management has determined that this measure is the most relevant in evaluating segment results and in the allocation of resources.
The following table sets out the results of each reportable operating segment as at and for the three and six months ended April 30, 2024 and 2023:
| (thousands of Canadian dollars) | ||||||||||||||||||||||||||||||||
| for the three months ended | April 30, 2024 | April 30, 2023 | ||||||||||||||||||||||||||||||
| Digital | DRTC | Eliminations/ | Consolidated | Digital | DRTC | Eliminations/ | Consolidated | |||||||||||||||||||||||||
| Banking | Adjustments | Banking | Adjustments | |||||||||||||||||||||||||||||
| Net interest income | $ | $ | $ | $ | $ | $ | $ | $ | ||||||||||||||||||||||||
| Non-interest income | ( | ) | ( | ) | ||||||||||||||||||||||||||||
| Total revenue | ( | ) | ( | ) | ||||||||||||||||||||||||||||
| Provision for (recovery of) credit losses | ||||||||||||||||||||||||||||||||
| ( | ) | ( | ) | |||||||||||||||||||||||||||||
| Non-interest expenses: | ||||||||||||||||||||||||||||||||
| Salaries and benefits | ||||||||||||||||||||||||||||||||
| General and administrative | ( | ) | ( | ) | ||||||||||||||||||||||||||||
| Premises and equipment | ||||||||||||||||||||||||||||||||
| ( | ) | ( | ) | |||||||||||||||||||||||||||||
| Income (loss) before income taxes | ( | ) | ( | ) | ||||||||||||||||||||||||||||
| Income tax provision | ( | ) | ( | ) | ||||||||||||||||||||||||||||
| Net income (loss) | $ | $ | ( | ) | $ | $ | $ | $ | $ | $ | ||||||||||||||||||||||
| Total assets | $ | $ | $ | ( | ) | $ | $ | $ | $ | ( | ) | $ | ||||||||||||||||||||
| Total liabilities | $ | $ | $ | ( | ) | $ | $ | $ | $ | ( | ) | $ | ||||||||||||||||||||
| (thousands of Canadian dollars) | ||||||||||||||||||||||||||||||||
| for the six months ended | April 30, 2024 | April 30, 2023 | ||||||||||||||||||||||||||||||
| Digital | DRTC | Eliminations/ | Consolidated | Digital | DRTC | Eliminations/ | Consolidated | |||||||||||||||||||||||||
| Banking | Adjustments | Banking | Adjustments | |||||||||||||||||||||||||||||
| Net interest income | $ | $ | $ | $ | $ | $ | $ | $ | ||||||||||||||||||||||||
| Non-interest income | ( | ) | ( | ) | ||||||||||||||||||||||||||||
| Total revenue | ( | ) | ( | ) | ||||||||||||||||||||||||||||
| Provision for (recovery of) credit losses | ( | ) | ( | ) | ||||||||||||||||||||||||||||
| ( | ) | ( | ) | |||||||||||||||||||||||||||||
| Non-interest expenses: | ||||||||||||||||||||||||||||||||
| Salaries and benefits | ||||||||||||||||||||||||||||||||
| General and administrative | ( | ) | ( | ) | ||||||||||||||||||||||||||||
| Premises and equipment | ||||||||||||||||||||||||||||||||
| ( | ) | ( | ) | |||||||||||||||||||||||||||||
| Income (loss) before income taxes | ( | ) | ||||||||||||||||||||||||||||||
| Income tax provision | ( | ) | ||||||||||||||||||||||||||||||
| Net income (loss) | $ | $ | $ | $ | $ | $ | ( | ) | $ | $ | ||||||||||||||||||||||
| Total assets | $ | $ | $ | ( | ) | $ | $ | $ | $ | ( | ) | $ | ||||||||||||||||||||
| Total liabilities | $ | $ | $ | ( | ) | $ | $ | $ | $ | ( | ) | $ | ||||||||||||||||||||
The Bank has operations in the US, through both its Digital Banking and DRTC businesses, however as at April 30, 2024, substantially all of the Bank’s earnings and assets are based in Canada.
| 19. | Comparative balances: |
The interim financial statements have been reclassified, where applicable, to conform with the financial statement presentation used in the current period. Cash flows related to the Bank’s investments in securities were reflected in operating activities in the comparative period and are now reflected as investing activities, consistent with the presentation and disclosure in the Bank’s annual audited financial statements for the year ended October 31, 2023. The change did not affect the comparative period earnings.