UNITED STATES
SECURITIES AND EXCHANGE COMMISSION
WASHINGTON, D.C. 20549
FORM
CURRENT REPORT
PURSUANT TO SECTION 13 OR 15(d) OF
THE SECURITIES EXCHANGE ACT OF 1934
Date of Report (Date of earliest event reported)
(Exact Name of Registrant as Specified in Its Charter)
(State or Other Jurisdiction of Incorporation) |
(Commission File Number) |
(IRS Employer Identification No.) |
(Address of Principal Executive Offices) (Zip Code)
(Registrant’s Telephone Number, Including Area Code)
Check the appropriate box below if the Form 8-K filing is intended to simultaneously satisfy the filing obligation of the registrant under any of the following provisions (see General Instruction A.2. below):
Written communications pursuant to Rule 425 under the Securities Act (17 CFR 230.425) |
Soliciting material pursuant to Rule 14a-12 under the Exchange Act (17 CFR 240.14a-12) |
Pre-commencement communications pursuant to Rule 14d-2(b) under the Exchange Act (17 CFR 240.14d-2(b)) |
Pre-commencement communications pursuant to Rule 13e-4(c) under the Exchange Act (17 CFR 240.13e-4(c)) |
Indicate by check mark whether the registrant is an emerging growth company as defined in as defined in Rule 405 of the Securities Act of 1933 (§230.405 of this chapter) or Rule 12b-2 of the Securities Exchange Act of 1934 (§240.12b-2 of this chapter).
Emerging growth company
If an emerging growth company, indicate by check mark if the registrant has elected not to use the extended transition period for complying with any new or revised financial accounting standards provided pursuant to Section 13(a) of the Exchange Act. ☐
Securities registered pursuant to Section 12(b) of the Act: | ||
Title of Each Class | Trading Symbol | Name of Each Exchange on Which Registered |
Item 2.02 | Results of Operations and Financial Condition |
On August 6, 2021, Plymouth Industrial REIT, Inc. (the “Company”) issued a press release (the “Earnings Release”) announcing, among other things, earnings for the six months ended June 30, 2021. The text of the Earnings Release is included as Exhibit 99.1 to this Current Report.
The Earnings Release is furnished pursuant to Item 2.02 and shall not be deemed "filed" for purposes of Section 18 of the Securities Exchange Act of 1934, as amended (the "Exchange Act"), or subject to the liabilities of that Section. The information in this Current Report shall not be incorporated by reference in any filing under the Securities Act of 1933, as amended, or the Exchange Act, except as shall be expressly set forth by specific reference in such filing.
Item 7.01 | Regulation FD Disclosure. |
On August 6, 2021, the Company disclosed a supplemental analyst package in connection with its earnings conference call for the six months ended June 30, 2021, which took place on August 6, 2021. A copy of the supplemental analyst package is attached hereto as Exhibit 99.2.
The supplemental analyst package is furnished pursuant to Item 7.01 and shall not be deemed “filed” for purposes of Section 18 of the Exchange Act, or subject to the liabilities of that Section. The information in this Current Report shall not be incorporated by reference in any filing under the Securities Act of 1933, as amended, or the Exchange Act, except as shall be expressly set forth by specific reference in such filing.
Item 9.01 | Financial Statements and Exhibits. |
(d) Exhibits:
Exhibit No. | Description | |
99.1 | Press Release dated August 6, 2021 | |
99.2 | Supplemental Analyst Package – Second Quarter 2021 | |
104 | Cover Page Interactive Data File (formatted as inline XBRL) |
SIGNATURES
Pursuant to the requirements of the Securities Exchange Act of 1934, the Company has duly caused this report to be signed on its behalf by the undersigned hereunto duly authorized.
PLYMOUTH INDUSTRIAL REIT, INC. | ||||||
Date: August 6, 2021 | By: |
/s/ Jeffrey E. Witherell | ||||
Jeffrey E. Witherell | ||||||
Chief Executive Officer |
Exhibit 99.1
Contact:
Tripp Sullivan
SCR Partners
(615) 760-1104
TSullivan@scr-ir.com
PLYMOUTH INDUSTRIAL REIT REPORTS SECOND QUARTER RESULTS
BOSTON, August 6, 2021 – Plymouth Industrial REIT, Inc. (NYSE: PLYM) (the “Company”) today announced its consolidated financial results for the second quarter ended June 30, 2021 and other recent developments.
Second Quarter and Subsequent Highlights
• | Reported results for the second quarter of 2021 reflect a net loss attributable to common stockholders of $7.4 million, or $(0.25) per weighted average common share; net operating income (“NOI”) of $21.8 million; Core Funds from Operations attributable to common stockholders and unit holders (“Core FFO”) of $0.41 per weighted average common share and units; and Adjusted FFO (“AFFO”) of $0.32 per weighted average common share and units. |
• | Collected approximately 99.7% of its rent for the second quarter. |
• | Same store NOI (“SS NOI”) increased 2.6% on a GAAP basis excluding early termination income for the second quarter compared with the same period in 2020; decreased 1.6% on a cash basis excluding early termination income. |
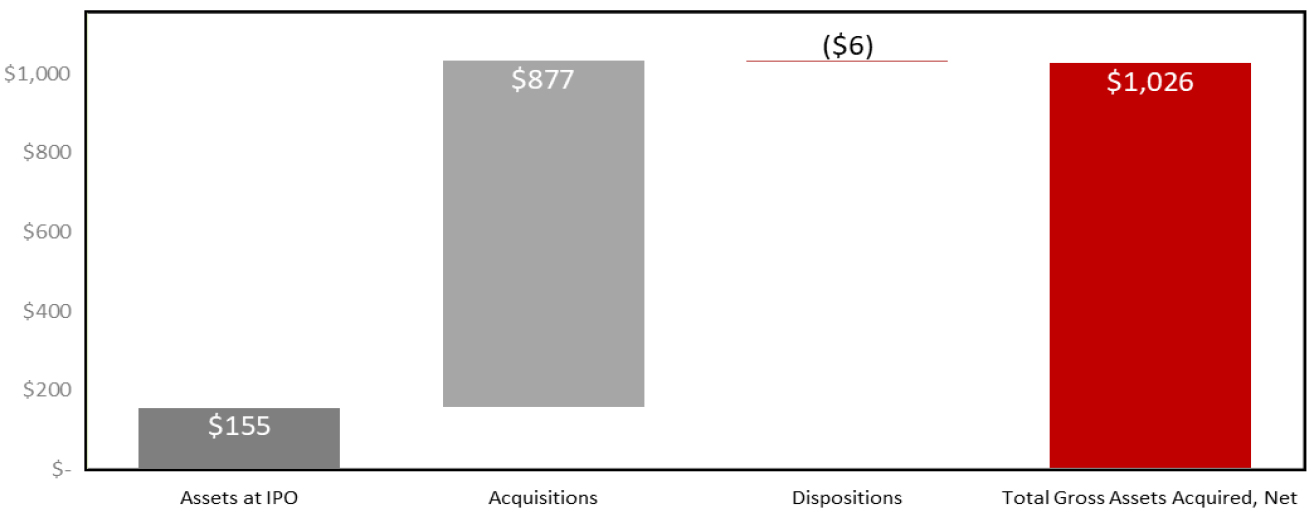
• | Acquired 4 buildings totaling 780,000 square feet for $30.3 million, a weighted average price of $47 per square foot and a weighted average initial projected yield of 7.3%. |
• | Commenced leases during the second quarter totaling 1.9 million square feet with a 7.0% increase in rental rates on a cash basis from leases greater than six months; through June 2021, approximately 82% of 2021 lease expirations have already been addressed in addition to 209,000 square feet of vacancy leased to new tenants. |
• | Secured commitments from its banking group to increase the unsecured credit facility to $500 million, comprised of a $200 million revolving credit facility and a new $200 million term loan in addition to the existing $100 million term loan, with lower borrowing costs and maturities extending to 2025 and 2027, respectively, and accordion provisions that would increase total borrowing capacity to $1 billion. |
• | Declared a regular quarterly cash dividend for the second quarter of 2021 of $0.21 for the common stock and a regular quarterly cash dividend of $0.46875 per share for the 7.50% Series A Cumulative Redeemable Preferred Stock (“the Preferred Stock”). |
• | Affirmed full year 2021 guidance ranges for net loss, Core FFO and AFFO per weighted average common share and units. |
Jeff Witherell, Chairman and Chief Executive Officer of Plymouth Industrial REIT, noted, “Our second quarter results reflect an intense focus on operations, leasing and asset management as we translate the sustained improvement in industrial fundamentals into rent growth and strong occupancy and collections. We are well ahead of plan on our 2021 lease expirations and exactly where we need to be to reach our portfolio performance goals for the year. With disciplined execution on our ATM program and agreements to expand our unsecured credit facilities, we are also well positioned to fund our acquisition goals for the year as well as fund selective new development opportunities.”
Financial Results for the Second Quarter of 2021
Net loss attributable to common stockholders for the quarter ended June 30, 2021 was $7.4 million, or $(0.25) per weighted average common share outstanding, compared with net loss attributable to common stockholders of $7.2 million, or $(0.49) per weighted average common share, for the same period in 2020. The decrease in net loss per weighted average common share was primarily due to an increase in net operating income, partially offset by an increase in depreciation expense associated with acquisitions activity. Weighted average common shares outstanding for the second quarters ended June 30, 2021 and 2020 were 29.4 million and 14.6 million, respectively. Plymouth has a total of 31.9 million common shares as of August 3, 2021.
Consolidated total revenues for the quarter ended June 30, 2021 were $32.9 million, compared with $26.1 million for the same period in 2020.
NOI for the quarter ended June 30, 2021 was $21.8 million compared with $17.1 million for the same period in 2020. Same store NOI (“SS NOI”) – Cash basis for the quarter ended June 30, 2021 was $14.1 million excluding early termination income compared with $14.3 million for the same period in 2020, a decrease of 1.6%. SS NOI for the second quarter was negatively impacted by free rent periods that will burn off in subsequent quarters, coupled with an increase in operating expenses during the quarter. SS NOI – GAAP basis excluding early termination income for the quarter ended June 30, 2021 was $15.4 million compared with $15.0 million for the same period in 2020, an increase of 2.6%. SS NOI for the second quarter was positively impacted by rents and reimbursements, partially offset by an increase in operating expenses during the quarter.
EBITDAre for the quarter ended June 30, 2021 was $18.4 million compared with $14.5 million for the same period in 2020.
Core FFO for the quarter ended June 30, 2021 (defined as FFO less dividends paid (or declared) to holders of preferred stock and excluding certain non-cash operating expenses such as impairment on real estate lease, unrealized appreciation/(depreciation) of warrants and loss on extinguishment of debt) was $12.3 million compared with $8.0 million for the same period in 2020, primarily as a result of the contribution from acquisitions. The Company reported Core FFO for the quarter ended June 30, 2021 of $0.41 per weighted average common share and unit compared with $0.51 per weighted average common share and unit for the same period in 2020. The increase in weighted average share count offset the contribution of acquisitions. Weighted average common shares and units outstanding for the second quarters ended June 30, 2021 and 2020 were 30.2 million and 15.7 million, respectively. As of June 30, 2021, the Company had a total of 31.6 million common shares and units outstanding and has a total of 32.4 million common shares and units outstanding as of August 3, 2021.
AFFO for the quarter ended June 30, 2021 was $9.8 million, or $0.32 per weighted average common share and unit, compared with $7.0 million, or $0.45 per weighted average common share and unit, for the same period in 2020, primarily driven by the change in Core FFO and increased recurring capital expenditures.
See “Non-GAAP Financial Measures” for complete definitions of NOI, EBITDAre, Core FFO and AFFO and the financial tables accompanying this press release for reconciliations of net income to NOI, EBITDAre, Core FFO and AFFO.
Capital Markets Activity and Liquidity
During the second quarter of 2021, the Company issued approximately 2.6 million common shares through its ATM program at an average price of $18.86 per share, raising approximately $48.6 million in net proceeds. To date in the third quarter of 2021, the Company issued approximately 786,000 common shares through its ATM program at an average of $21.04 per share, raising approximately $16.2 million in net proceeds.
As of August 3, 2021, the Company’s current cash balance was approximately $13.0 million, excluding operating expense escrows of approximately $6.3 million, and it has approximately $132.0 million of availability under the existing unsecured line of credit.
The Company has secured commitments from its banking group to increase the unsecured credit facility to $500 million, comprised of a $200 million revolving credit facility with a 4-year term and a new $200 million term loan with a 5.5-year term in addition to the existing $100 million term loan. The unsecured credit facility will have an accordion feature enabling the Company to increase total borrowing capacity under the revolving credit facility and term loan up to an aggregate of $1.0 billion, subject to certain conditions. Amounts outstanding under the facility and the term loan are expected to bear interest at LIBOR (with no floor) plus a margin between 130 to 190 basis points (previously set at 145 to 200 basis points), depending on the Company’s leverage. The new credit facility is anticipated to close by the end of August 2021.
Investment Activity
As of June 30, 2021, the Company had real estate investments comprised of 147 industrial buildings totaling 24.8 million square feet with occupancy of 96.2%. During the second quarter, the Company acquired two buildings totaling 230,000 square feet for a total of $14.1 million, a weighted average price of $62 per square foot, and a weighted average initial projected yield of 6.8%. The acquired buildings are in Memphis, Tennessee and St. Louis, Missouri.
Subsequent to quarter end, the Company acquired two multi-tenant industrial buildings in Memphis, Tennessee totaling 550,000 square feet for $16.2 million, a weighted average price of $34 per square foot, and an initial yield projected yield of 7.8%.
Leasing Activity
Leases commencing during the second quarter of 2021 totaled an aggregate of 1,952,000 square feet, of which 1,872,000 square feet is associated with leases with terms of at least six months. The Company will experience a 7.0% increase in rental rates on a cash basis from these leases. Leases commencing during the first half of 2021 totaled an aggregate of 3,209,000 square feet, of which 3,026,000 square feet is associated with leases with terms of at least six months. The Company will experience a 9.0% increase in rental rates on a cash basis from these leases.
Quarterly Distributions to Stockholders
On May 6, 2021, the Company announced the Board of Directors declared a 5% increase in the regular quarterly common stock dividend to $0.21 per share, or an annualized rate of $0.84 per share, for the second quarter of 2021. The dividend was payable on July 30, 2021 to stockholders of record as of the close of business on June 30, 2021.
On June 1, 2021, the Company announced the Board of Directors declared a regular quarterly cash dividend of $0.46875 per share for the Preferred Stock for the second quarter of 2021. The dividend was paid on June 30, 2021 to stockholders of record on June 15, 2021.
Guidance for 2021
The Company affirmed its full year 2021 guidance ranges for net loss, Core FFO and AFFO per weighted average common share and units and updated several of its accompanying guidance assumptions:
Full Year 2021 Range | ||||||||
Low | High | |||||||
Net loss | $ | (0.30 | ) | $ | (0.26 | ) | ||
Add: Real estate depreciation & amortization | 2.18 | 2.18 | ||||||
Add: Real estate depreciation & amortization attributable to JV | 0.05 | 0.05 | ||||||
Less: Gain on sale of real estate | (0.02 | ) | (0.02 | ) | ||||
Add: Unrealized appreciation of warrants | 0.01 | 0.01 | ||||||
Less: Preferred stock dividends | (0.22 | ) | (0.22 | ) | ||||
Core FFO | 1.70 | 1.74 | ||||||
Amortization of debt related costs | 0.05 | 0.05 | ||||||
Stock compensation | 0.05 | 0.05 | ||||||
Straight-line rent | (0.08 | ) | (0.08 | ) | ||||
Above/below market lease rents | (0.06 | ) | (0.06 | ) | ||||
Recurring capital expenditures | (0.23 | ) | (0.22 | ) | ||||
AFFO | $ | 1.43 | $ | 1.48 |
• | Total revenues of $136.1 million to $136.8 million for the year |
• | Net operating income of $90.4 million to $91.2 million for the year |
• | EBITDAre of $77.7 million to $78.2 million for the year |
• | General and administrative expenses of $12.6 million to $12.3 million for the year, including non-cash expenses of $1.6 million |
• | Recurring capital expenditures of $6.95 million to $6.65 million for the year |
• | SS NOI on a cash basis of $58.3 million to $58.9 million, representing a 2.5% to 3.0% increase for the year |
• | Same store occupancy of 95.5% to 97.0% for the year |
• | 30,748,000 weighted average common shares and operating partnership units outstanding for the year (32,393,000 currently outstanding) |
• | The completion of approximately $280 million in acquisitions ($91 million of which have been completed to date, with the balance projected to occur in the third and fourth quarters) |
Earnings Conference Call and Webcast
The Company will host a conference call and live audio webcast, both open for the general public to hear, later today at 9:00 a.m. Eastern Time. The number to call for this interactive teleconference is (844) 784-1727 (international callers: (412) 717-9587). A replay of the call will be available through August 13, 2021, by dialing (412) 317-0088 and entering the replay access code, 10158282.
The live audio webcast of the Company’s quarterly conference call will be available online in the Investor Relations section of the Company’s website at ir.plymouthreit.com. The online replay will be available approximately one hour after the end of the call and archived for approximately 90 days.
About Plymouth
Plymouth Industrial REIT, Inc. (NYSE: PLYM) is a real estate investment trust focused on the acquisition, ownership and management of single and multi-tenant industrial properties, including distribution centers, warehouses, light industrial and small bay industrial properties, located in primary and secondary markets within the main industrial, distribution and logistics corridors of the United States.
Forward-Looking Statements
This press release includes “forward-looking statements” that are made pursuant to the safe harbor provisions of Section 27A of the Securities Act of 1933 and of Section 21E of the Securities Exchange Act of 1934. The forward-looking statements in this release do not constitute guarantees of future performance. Investors are cautioned that statements in this press release, which are not strictly historical statements, including, without limitation, statements regarding management's plans, objectives and strategies, constitute forward-looking statements. Such forward-looking statements are subject to a number of known and unknown risks and uncertainties that could cause actual results to differ materially from those anticipated by the forward-looking statement, many of which may be beyond our control, including, without limitation, those factors described under the captions “Cautionary Note Regarding Forward-Looking Statements” and “Risk Factors” in the Company’s Annual Report on Form 10-K and Quarterly Reports on Form 10-Q filed with the Securities and Exchange Commission. Forward-looking statements generally can be identified by the use of forward-looking terminology such as “may,” “plan,” “seek,” “will,” “expect,” “intend,” “estimate,” “anticipate,” “believe” or “continue” or the negative thereof or variations thereon or similar terminology. Any forward-looking information presented herein is made only as of the date of this press release, and we do not undertake any obligation to update or revise any forward-looking information to reflect changes in assumptions, the occurrence of unanticipated events, or otherwise.
PLYMOUTH INDUSTRIAL REIT, INC.
CONDENSED CONSOLIDATED BALANCE SHEETS
UNAUDITED
(In thousands, except share and per share amounts)
June 30, | December 31, | |||||||
2021 | 2020 | |||||||
Assets | ||||||||
Real estate properties | $ | 960,620 | $ | 886,681 | ||||
Less accumulated depreciation | (118,523 | ) | (98,283 | ) | ||||
Real estate properties, net | 842,097 | 788,398 | ||||||
Cash | 13,229 | 15,668 | ||||||
Cash held in escrow | 11,666 | 11,939 | ||||||
Restricted cash | 4,419 | 4,447 | ||||||
Deferred lease intangibles, net | 64,510 | 66,116 | ||||||
Investment in unconsolidated joint venture | 6,186 | 6,683 | ||||||
Other assets | 27,721 | 27,019 | ||||||
Total assets | $ | 969,828 | $ | 920,270 | ||||
Liabilities, Preferred stock and Equity | ||||||||
Liabilities: | ||||||||
Secured debt, net | $ | 326,585 | $ | 328,908 | ||||
Unsecured debt, net | 99,333 | 99,254 | ||||||
Borrowings under line of credit | 68,000 | 90,000 | ||||||
Accounts payable, accrued expenses and other liabilities | 55,284 | 49,335 | ||||||
Deferred lease intangibles, net | 9,925 | 11,350 | ||||||
Financing lease liability | 2,216 | 2,207 | ||||||
Total liabilities | 561,343 | 581,054 | ||||||
Preferred stock, par value $0.01 per share, 100,000,000 shares authorized, | ||||||||
Series A: 2,023,551 and 2,023,999 shares issued and outstanding at June 30, 2021 and December 31, 2020, respectively (aggregate liquidation preference of $50,589 and $50,600 at June 30, 2021 and December 31, 2020, respectively) | 48,473 | 48,485 | ||||||
Series B: 4,411,764 shares issued and outstanding at June 30, 2021 and December 31, 2020, respectively (aggregate liquidation preference of $97,277 and $97,230 at June 30, 2021 and December 31, 2020, respectively) | 90,823 | 87,209 | ||||||
Equity: | ||||||||
Common stock, $0.01 par value: 900,000,000 shares authorized; 31,088,927 and 25,344,161 shares issued and outstanding at June 30, 2021 and December 31, 2020, respectively | 310 | 253 | ||||||
Additional paid in capital | 434,161 | 360,752 | ||||||
Accumulated deficit | (169,079 | ) | (162,250 | ) | ||||
Total stockholders' equity | 265,392 | 198,755 | ||||||
Non-controlling interest | 3,797 | 4,767 | ||||||
Total equity | 269,189 | 203,522 | ||||||
Total liabilities, preferred stock and equity | $ | 969,828 | $ | 920,270 |
PLYMOUTH INDUSTRIAL REIT, INC.
CONDENSED CONSOLIDATED STATEMENTS OF OPERATIONS
UNAUDITED
(In thousands, except share and per share amounts)
For the Three Months | For the Six Months | |||||||||||||||
Ended June 30, | Ended June 30, | |||||||||||||||
2021 | 2020 | 2021 | 2020 | |||||||||||||
Rental revenue | $ | 32,758 | $ | 26,137 | $ | 64,591 | $ | 52,366 | ||||||||
Management fee revenue and other income | 97 | — | 180 | — | ||||||||||||
Total revenues | 32,855 | 26,137 | 64,771 | 52,366 | ||||||||||||
Operating expenses: | ||||||||||||||||
Property | 10,940 | 9,026 | 22,366 | 18,037 | ||||||||||||
Depreciation and amortization | 16,902 | 13,520 | 32,679 | 27,617 | ||||||||||||
General and administrative | 3,309 | 2,576 | 6,318 | 5,098 | ||||||||||||
Total operating expenses | 31,151 | 25,122 | 61,363 | 50,752 | ||||||||||||
Other income (expense): | ||||||||||||||||
Interest expense | (4,825 | ) | (4,900 | ) | (9,583 | ) | (9,771 | ) | ||||||||
Earnings (loss) in investment of unconsolidated joint venture | (224 | ) | — | (497 | ) | — | ||||||||||
Gain on sale of real estate | — | — | 590 | — | ||||||||||||
Unrealized (appreciation) depreciation of warrants | (636 | ) | — | (883 | ) | — | ||||||||||
Total other income (expense) | (5,685 | ) | (4,900 | ) | (10,373 | ) | (9,771 | ) | ||||||||
Net loss | (3,981 | ) | (3,885 | ) | (6,965 | ) | (8,157 | ) | ||||||||
Less: Loss attributable to non-controlling interest | (71 | ) | (209 | ) | (136 | ) | (454 | ) | ||||||||
Net loss attributable to Plymouth Industrial REIT, Inc. | (3,910 | ) | (3,676 | ) | (6,829 | ) | (7,703 | ) | ||||||||
Less: Preferred stock dividends | 1,652 | 1,613 | 3,304 | 3,226 | ||||||||||||
Less: Series B preferred stock accretion to redemption value | 1,807 | 1,854 | 3,614 | 3,708 | ||||||||||||
Less: Amount allocated to participating securities | 48 | 30 | 105 | 106 | ||||||||||||
Net loss attributable to common stockholders | $ | (7,417 | ) | $ | (7,173 | ) | $ | (13,852 | ) | $ | (14,743 | ) | ||||
Net loss basic and diluted per share attributable to common stockholders | $ | (0.25 | ) | $ | (0.49 | ) | $ | (0.49 | ) | $ | (1.02 | ) | ||||
Weighted-average common shares outstanding basic and diluted | 29,348,561 | 14,649,290 | 28,282,565 | 14,514,233 |
Non-GAAP Financial Measures Definitions
Net Operating Income (NOI): We consider net operating income, or NOI, to be an appropriate supplemental measure to net income in that it helps both investors and management understand the core operations of our properties. We define NOI as total revenue (including rental revenue and tenant reimbursements) less property-level operating expenses. NOI excludes depreciation and amortization, general and administrative expenses, impairments, gain/loss on sale of real estate, interest expense, and other non-operating items.
EBITDAre: We define earnings before interest, taxes, depreciation and amortization for real estate in accordance with the standards established by the National Association of Real Estate Investment Trusts (“NAREIT”). EBITDAre represents net income (loss), computed in accordance with GAAP, before interest expense, tax, depreciation and amortization, gains or losses on the sale of rental property, and loss on impairments. We believe that EBITDAre is helpful to investors as a supplemental measure of our operating performance as a real estate company as it is a direct measure of the actual operating results of our industrial properties.
Funds from Operations (“FFO”): Funds from operations, or FFO, is a non-GAAP financial measure that is widely recognized as a measure of REIT operating performance. We consider FFO to be an appropriate supplemental measure of our operating performance as it is based on a net income analysis of property portfolio performance that excludes non-cash items such as depreciation. The historical accounting convention used for real estate assets requires straight-line depreciation of buildings and improvements, which implies that the value of real estate assets diminishes predictably over time. Since real estate values rise and fall with market conditions, presentations of operating results for a REIT, using historical accounting for depreciation, could be less informative. In December 2018, NAREIT issued a white paper restating the definition of FFO. The purpose of the restatement was not to change the fundamental definition of FFO, but to clarify existing NAREIT guidance. The restated definition of FFO is as follows: Net Income (calculated in accordance with GAAP), excluding: (i) Depreciation and amortization related to real estate, (ii) Gains and losses from the sale of certain real estate assets, (iii) Gain and losses from change in control, and (iv) Impairment write-downs of certain real estate assets and investments in entities when the impairment is directly attributable to decreases in the value of depreciable real estate held by the entity.
We define FFO consistent with the NAREIT definition. Adjustments for unconsolidated partnerships and joint ventures will be calculated to reflect FFO on the same basis. Other equity REITs may not calculate FFO as we do, and, accordingly, our FFO may not be comparable to such other REITs’ FFO. FFO should not be used as a measure of our liquidity, and is not indicative of funds available for our cash needs, including our ability to pay dividends.
Core Funds from Operations (“Core FFO”): Core FFO represents FFO reduced by dividends paid (or declared) to holders of our preferred stock and excludes certain non-cash operating expenses such as impairment on real estate lease, unrealized appreciation/(depreciation) of warrants and loss on extinguishment of debt. As with FFO, our reported Core FFO may not be comparable to other REITs’ Core FFO, should not be used as a measure of our liquidity, and is not indicative of our funds available for our cash needs, including our ability to pay dividends.
Adjusted Funds from Operations (“AFFO”): Adjusted funds from operations, or AFFO, is presented in addition to Core FFO. AFFO is defined as Core FFO, excluding certain non-cash operating revenues and expenses, acquisition and transaction related costs for transactions not completed and recurring capitalized expenditures. Recurring capitalized expenditures include expenditures required to maintain and re-tenant our properties, tenant improvements and leasing commissions. AFFO further adjusts Core FFO for certain other non-cash items, including the amortization or accretion of above or below market rents included in revenues, straight line rent adjustments, non-cash equity compensation and non-cash interest expense.
We believe AFFO provides a useful supplemental measure of our operating performance because it provides a consistent comparison of our operating performance across time periods that is comparable for each type of real estate investment and is consistent with management’s analysis of the operating performance of our properties. As a result, we believe that the use of AFFO, together with the required GAAP presentations, provide a more complete understanding of our operating performance. As with Core FFO, our reported AFFO may not be comparable to other REITs’ AFFO, should not be used as a measure of our liquidity, and is not indicative of our funds available for our cash needs, including our ability to pay dividends.
PLYMOUTH INDUSTRIAL REIT, INC.
SUPPLEMENTAL RECONCILIATION OF NON-GAAP DISCLOSURES
UNAUDITED
(In thousands, except per share amounts)
For the Three Months | For the Six Months | |||||||||||||||
Ended June 30, | Ended June 30, | |||||||||||||||
NOI: | 2021 | 2020 | 2021 | 2020 | ||||||||||||
Net loss | $ | (3,981 | ) | $ | (3,885 | ) | $ | (6,965 | ) | $ | (8,157 | ) | ||||
General and administrative | 3,309 | 2,576 | 6,318 | 5,098 | ||||||||||||
Depreciation and amortization | 16,902 | 13,520 | 32,679 | 27,617 | ||||||||||||
Interest expense | 4,825 | 4,900 | 9,583 | 9,771 | ||||||||||||
Gain on sale of real estate | — | — | (590 | ) | — | |||||||||||
Unrealized appreciation (depreciation) of warrants | 636 | — | 883 | — | ||||||||||||
(Earnings) loss in investment of unconsolidated joint venture | 224 | — | 497 | — | ||||||||||||
Management fee revenue and other income | (97 | ) | — | (180 | ) | — | ||||||||||
NOI | $ | 21,818 | $ | 17,111 | $ | 42,225 | $ | 34,329 |
For the Three Months | For the Six Months | |||||||||||||||
Ended June 30, | Ended June 30, | |||||||||||||||
EBITDAre: | 2021 | 2020 | 2021 | 2020 | ||||||||||||
Net loss | $ | (3,981 | ) | $ | (3,885 | ) | $ | (6,965 | ) | $ | (8,157 | ) | ||||
Depreciation and amortization | 16,902 | 13,520 | 32,679 | 27,617 | ||||||||||||
Interest expense | 4,825 | 4,900 | 9,583 | 9,771 | ||||||||||||
Unrealized appreciation (depreciation) of warrants | 636 | — | 883 | — | ||||||||||||
Gain on sale of real estate | — | — | (590 | ) | — | |||||||||||
EBITDAre | $ | 18,382 | $ | 14,535 | $ | 35,590 | $ | 29,231 |
For the Three Months | For the Six Months | |||||||||||||||
Ended June 30, | Ended June 30, | |||||||||||||||
FFO: | 2021 | 2020 | 2021 | 2020 | ||||||||||||
Net loss | $ | (3,981 | ) | $ | (3,885 | ) | $ | (6,965 | ) | $ | (8,157 | ) | ||||
Gain on sale of real estate | — | — | (590 | ) | — | |||||||||||
Depreciation and amortization | 16,902 | 13,520 | 32,679 | 27,617 | ||||||||||||
Depreciation and amortization from unconsolidated joint venture | 408 | — | 801 | — | ||||||||||||
FFO | $ | 13,329 | $ | 9,635 | $ | 25,925 | $ | 19,460 | ||||||||
Preferred stock dividends | (1,652 | ) | (1,613 | ) | (3,304 | ) | (3,226 | ) | ||||||||
Unrealized appreciation (depreciation) of warrants | 636 | — | 883 | — | ||||||||||||
Core FFO | $ | 12,313 | $ | 8,022 | $ | 23,504 | $ | 16,234 | ||||||||
Weighted average common shares and units outstanding | 30,156 | 15,675 | 29,109 | 15,564 | ||||||||||||
Core FFO per share | $ | 0.41 | $ | 0.51 | $ | 0.81 | $ | 1.04 |
For the Three Months | For the Six Months | |||||||||||||||
Ended June 30, | Ended June 30, | |||||||||||||||
AFFO: | 2021 | 2020 | 2021 | 2020 | ||||||||||||
Core FFO | $ | 12,313 | $ | 8,022 | $ | 23,504 | $ | 16,234 | ||||||||
Amortization of debt related costs | 370 | 366 | 739 | 665 | ||||||||||||
Non-cash interest expense | (29 | ) | (174 | ) | (72 | ) | 90 | |||||||||
Stock compensation | 461 | 383 | 879 | 732 | ||||||||||||
Straight line rent | (1,146 | ) | (443 | ) | (1,760 | ) | (961 | ) | ||||||||
Above/below market lease rents | (616 | ) | (438 | ) | (1,109 | ) | (986 | ) | ||||||||
Recurring capital expenditure (1) | (1,555 | ) | (719 | ) | (3,415 | ) | (1,755 | ) | ||||||||
AFFO | $ | 9,798 | $ | 6,997 | $ | 18,766 | $ | 14,019 | ||||||||
Weighted average common shares and units outstanding | 30,156 | 15,675 | 29,109 | 15,564 | ||||||||||||
AFFO per share | $ | 0.32 | $ | 0.45 | $ | 0.64 | $ | 0.90 |
Exhibit 99.2
Second Quarter 2021
Supplemental
Plymouth Industrial REIT, Inc. |
Table of Contents |
Introduction | |||
Executive Summary | 2 | ||
Management, Board of Directors, Investor Relations, and Equity Coverage | 2 | ||
Portfolio Statistics | 3 | ||
Acquisition Activity | 3 | ||
Select Recent Acquisitions | 4 | ||
Value Creation | 5 | ||
Replacement Cost Analysis | 5 | ||
Rent Collections and Deferrals | 6 | ||
Guidance | 7 | ||
Financial Information | |||
Same Store Net Operating Income (NOI) | 8 | ||
Consolidated Statements of Operations | 9 | ||
Consolidated NOI | 10 | ||
Earnings Before Interest, Taxes, Depreciation and Amortization for Real Estate (EBITDAre) | 10 | ||
Funds from Operations (FFO), Core FFO & Adjusted Funds from Operations (AFFO) | 10 | ||
Consolidated Balance Sheets | 11 | ||
Capital Structure and Debt Summary | 12 | ||
Capital Markets Activity | 12 | ||
Unconsolidated Joint Venture | 13 | ||
Net Asset Value Components | 14 | ||
Operational & Portfolio Information | |||
Leasing Activity | 15 | ||
Lease Expiration Schedule | 15 | ||
Leased Square Feet and Annualized Base Rent by Tenant Industry | 16 | ||
Leased Square Feet and Annualized Base Rent by Type | 17 | ||
Top 10 Tenants by Annualized Base Rent | 18 | ||
Lease Segmentation by Size | 18 | ||
Rentable Square Feet and Annualized Base Rent by Market | 19 | ||
Total Acquisition Cost by Market | 19 | ||
Appendix | |||
Glossary | 20 | ||
Forward-Looking Statements: This Supplemental Information contains forward-looking statements within the meaning of the U.S. federal securities laws. We make statements in this Supplemental Information that are forward-looking statements, which are usually identified by the use of words such as “anticipates,” “believes,” “estimates,” “expects,” “intends,” “may,” “plans” “projects,” “seeks,” “should,” “will,” and variations of such words or similar expressions. Our forward-looking statements reflect our current views about our plans, intentions, expectations, strategies and prospects, which are based on the information currently available to us and on assumptions we have made. Although we believe that our plans, intentions, expectations, strategies and prospects as reflected in or suggested by our forward-looking statements are reasonable, we can give no assurance that our plans, intentions, expectations, strategies or prospects will be attained or achieved and you should not place undue reliance on these forward-looking statements. Additionally, unforeseen factors emerge from time to time, and we cannot predict which factors will arise or their ultimate impact on our business or the extent to which any such factor, or combination of factors, may cause actual results to differ materially from those contained in any forward-looking statements. One of these factors is the outbreak of the novel coronavirus (COVID-19), the impact of which is difficult to fully assess at this time due to, among other factors, uncertainty regarding the severity and duration of the outbreak domestically and internationally and the effectiveness of efforts to contain the spread of the virus and its resulting direct and indirect impact on the U.S. economy and economic activity. Furthermore, actual results may differ materially from those described in the forward-looking statements and may be affected by a variety of risks and factors. Any forward-looking statement speaks only as of the date on which it is made. New risks and uncertainties arise over time, and it is not possible for us to predict those events or how they may affect us. Except as required by law, we are not obligated to, and do not intend to, update or revise any forward-looking statements, whether as a result of new information, future events or otherwise. | |
Definitions and Reconciliations: For definitions of certain terms used throughout this Supplemental Information, including certain non-GAAP financial measures, refer to the Glossary on pages 20-21. For reconciliations of the non-GAAP financial measures to the most directly comparable U.S. GAAP measures, refer to page 10. | |
Plymouth Industrial REIT, Inc. |
Executive Summary |
Company overview: Plymouth Industrial REIT, Inc. (NYSE: PLYM) is a real estate investment trust focused on the acquisition, ownership, and management of single and multi-tenant industrial properties, including distribution centers, warehouses, light industrial and small bay industrial properties, located in primary and secondary markets within the main industrial, distribution and logistics corridors of the United States. |
Management, Board of Directors, Investor Relations, and Equity Coverage |
Corporate | Investor Relations | Transfer Agent | ||||||
20 Custom House Street, 11th Floor | Tripp Sullivan | Continental Stock Transfer & Trust Company | ||||||
Boston, Massachusetts 02110 | SCR Partners | 1 State Street, 30th Floor | ||||||
617.340.3814 | 615.942.7077 | New York, NY 10004 | ||||||
www.plymouthreit.com | IR@plymouthreit.com | 212.509.4000 | ||||||
Executive Management | ||||||||
Jeffrey E. Witherell | Pendleton P. White, Jr. | Daniel C. Wright | James M. Connolly | |||||
Chief Executive Officer | President and | Executive Vice President | Executive Vice President | |||||
and Chairman | Chief Investment Officer | and Chief Financial Officer | Asset Management | |||||
Board of Directors | ||||||||
Martin Barber | Philip S. Cottone | Richard J. DeAgazio | David G. Gaw | |||||
Independent Director | Independent Director | Independent Director | Independent Director | |||||
John W. Guinee | Caitlin Murphy | Pendleton P. White, Jr. | Jeffrey E. Witherell | |||||
Independent Director | Independent Director | President and | Chief Executive Officer | |||||
Chief Investment Officer | and Chairman | |||||||
Equity Research Coverage1 | ||||||||
Baird | JMP Securities | Wedbush Securities | ||||||
Dave Rodgers | Aaron Hecht | Henry Coffey | ||||||
216.737.7341 | 415.835.3963 | 212.833.1382 | ||||||
Berenberg Capital Markets | KeyBanc Capital Markets | |||||||
Connor Siversky | Craig Mailman | |||||||
646.949.9037 | 917.368.2316 | |||||||
Colliers Securities | National Securities Corp. | |||||||
Barry Oxford | Guarav Mehta | |||||||
203.961.6573 | 212.417.8008 |
Investor Conference Call and Webcast: The Company will host a conference call and live audio webcast, both open for the general public to hear, on August 6, 2021 at 9:00 a.m. Eastern Time. The number to call for this interactive teleconference is (844) 784-1727 (international callers: (412) 717-9587). A replay of the call will be available through August 13, 2021 by dialing (412) 317-0088 and entering the replay access code, 10158282. |
|
1) The analysts listed provide research coverage on the Company. Any opinions, estimates or forecasts regarding the Company's performance made by these analysts are theirs alone and do not represent opinions, estimates or forecasts by the Company or its management. The Company does not by reference above imply its endorsement of or concurrence with such information, conclusions or recommendations. | |
Page 2
Plymouth Industrial REIT, Inc. |
Portfolio Statistics |
Unaudited ($ in thousands, except Cost/SF) as of 06/30/2021 |
Portfolio Snapshot | Portfolio Growth ($ in millions) |
Number of Properties | 113 | ![]() | ||
Number of Buildings | 147 | |||
Square Footage | 24,777 | |||
Occupancy | 96.2% | |||
WA Lease Term Remaining (yrs.) | 3.7 | |||
Total Annualized Base Rent (ABR)1 | $99,673 | |||
Rental Rate Increase - Cash basis2 | 7.0% |
Acquisition Activity |
Transaction Summary (YTD Q2 2021) | Investment Highlights | |||
Purchase Price4 | $ 75,050 | ● | Since the Company's initial public offering in June 2017, the Company has acquired $876.6 million of wholly owned warehouse, distribution, light manufacturing, and small bay industrial properties totaling approximately 21.0 million square feet | |
Cost Per Square Foot | $ 49.65 | |||
Replacement Cost/SF3 - YTD 2021 | $ 83.17 | |||
Square Footage Acquired | 1,616,448 | ● | YTD Q2 2021, the Company has acquired industrial properties in the markets of Columbus, Cleveland, St. Louis, Kansas City, Memphis, and Chicago at a significant discount to replacement cost | |
WA Occupancy at Acquisition | 100.0% | |||
WA Lease Term Remaining (yrs.) | 3.9 |
Acquisitions |
Location | Acquisition
Date |
#
of Buildings |
Purchase Price4 |
Square
Footage |
Projected
Initial Yield5 |
Cost
per Square Foot6 | ||||||
Memphis, TN | 6/29/2021 | 1 | $ 5,250 | 74,665 | 7.0% | $ 70.31 | ||||||
St. Louis, MO | 6/30/2021 | 1 | 8,800 | 155,434 | 6.7% | 56.62 | ||||||
Total Second Quarter 2021 Acquisitions | 2 | $ 14,050 | 230,099 | 6.8% | $ 61.73 | |||||||
Multiple | Q1 2021 | 5 | $ 61,000 | 1,386,349 | 7.7% | $ 46.87 | ||||||
Multiple | Full Year 2020 | 27 | $ 243,568 | 5,473,596 | 7.8% | $ 46.99 | ||||||
Multiple | Full Year 2019 | 31 | $ 220,115 | 5,776,928 | 8.4% | $ 42.21 | ||||||
Multiple | Full Year 2018 | 24 | $ 164,575 | 2,903,699 | 8.2% | $ 70.54 | ||||||
Multiple | 20177 | 36 | $ 173,325 | 5,195,563 | 8.4% | $ 33.81 | ||||||
Total Acquisitions Post-IPO | 125 | $ 876,633 | 20,966,234 | 8.1% | $ 47.83 |
QTD Q3 2021 Acquisitions | ||||||||||||
Location | Acquisition
Date |
#
of Buildings |
Purchase
Price4 |
Square
Footage |
Projected
Initial Yield5 |
Cost
per Square Foot6 | ||||||
Memphis, TN | 7/9/2021 | 1 | $ 9,900 | 233,000 | 7.7% | $ 42.49 | ||||||
Memphis, TN | 7/30/2021 | 1 | 6,277 | 316,935 | 8.0% | 19.81 | ||||||
2 | $ 16,177 | 549,935 | 7.8% | $ 33.69 | ||||||||
Portfolio statistics and acquisitions include wholly owned properties only.
1) | Annualized base rent is calculated as monthly contracted base rent as of June 30, 2021, multiplied by 12. Excludes rent abatements. |
2) | Based on approximately 1.9 million square feet of new and renewal leases greater than six months in term. Refer to Leasing Activity in this Supplemental Information for additional details. |
3) | Replacement cost is based on the Marshall & Swift valuation methodology for the determination of building costs. Replacement cost includes land reflected at the allocated cost in accordance with GAAP. |
4) | Represents total direct consideration paid rather than GAAP cost basis; purchase price for QTD Q3 2021 acquisitions include immediate capital expenditures. |
5) | Weighted based on Purchase Price. |
6) | Calculated as Purchase Price divided by square footage. |
7) | Since our initial public offering in June 2017. |
Page 3
Plymouth Industrial REIT, Inc. |
Select Recent Acquisitions |
During the first half of 2021 and to date in the third quarter, the Company closed on the acquisition of nine industrial buildings totaling approximately 2.2 million square feet for a total of $91 million, a weighted average price of $47 per square foot, and a weighted average initial yield of 7.6% |
Unaudited ($ in thousands, except Cost/SF) |
Corporate Woods | |||
![]() |
Location | St. Louis | |
Acquisition Date | June-21 | ||
# of Buildings | 1 | ||
Purchase Price1 | $8,800 | ||
Square Footage | 155,434 | ||
Occupancy | 100.0% | ||
WA Lease Term Remaining | 1.8 years | ||
Projected Initial Yield | 6.7% | ||
Replacement Cost/SF2 | $107.15 | ||
Multi-Tenant % | 100% | ||
Single-Tenant % | 0% | ||
Location Characteristics: St. Louis is located within 500 miles of one-third of the U.S. population and within 1,500 hundred miles of 90% of North America's population by way of its four interstates with national access. Additionally, the region is home to two international cargo airports, and the third-largest rail hub and second-largest inland port in the U.S. | |||
Market Characteristics: Strong leasing velocity and decreasing supply, vacancy remained stable in Q2 even as speculative construction delivers (source: JLL) | |||
Portfolio Fit: Brings Company's scale in the St. Louis market to over 1.0 million square feet and complements the existing tenant / industry base with the addition of a leading commercial manufacturer and 3PL companies to the roster |
ODW Logistics Distribution Center | |||
![]() |
Location | Columbus | |
Acquisition Date | March-21 | ||
# of Buildings | 1 | ||
Purchase Price1 | $29,000 | ||
Square Footage | 772,450 | ||
Occupancy | 100.0% | ||
WA Lease Term Remaining | 4.3 years | ||
Projected Initial Yield | 7.5% | ||
Replacement Cost/SF2 | $69.36 | ||
Multi-Tenant % | 0% | ||
Single-Tenant % | 100% | ||
Location Characteristics: Columbus is one of the preeminent distribution corridors in the world; centrally positioned to the entire eastern half of the U.S., enabling same-day / next-day delivery to all population centers in the Northeast, Mid-Atlantic, Southeast, and Midwest (source: CBRE) | |||
Market Characteristics: Low vacancy rates; positive supply and demand fundamentals supporting rent growth; robust development pipeline | |||
Portfolio Fit: Brings Company's scale in the Columbus metro area to nearly 3.0 million square feet and enlarges tenant / industry diversification | |||
1) | Represents total direct consideration paid rather than GAAP cost basis. |
2) | Replacement cost is based on the Marshall & Swift valuation methodology for the determination of building costs. Replacement cost includes land reflected at the allocated cost in accordance with GAAP. |
Page 4
Plymouth Industrial REIT, Inc. |
Value Creation |
Unaudited ($ in thousands, except RSF) |
Examples of Value Creation |
Lease Extension / Redevelopment | Lease Extension | New Development | ||
![]() |
![]() |
![]() | ||
Cincinnati, OH | Atlanta, GA | Portland, ME | ||
Acquired multi-tenant industrial building in October 2018 with over 1.1 million SF of rentable square feet and 30+ acres available for future development | Acquired in December 2017 with two years remaining on single-tenant lease term | Acquired multi-tenant industrial building in November 2014 with ~ 8 acres of developable land | ||
Renewed nearly 0.5 million SF at higher rental rents with average annual rent escalations of 3.3% and terms greater than 4 years | Negotiated early 5-year lease extension at higher rental rate with annual rent escalations of 3.0% | Broke ground on new ~70,000 square foot industrial building during Q2 2021 with an estimated shell completion in December 2021 at a cost of ~$7.2 million | ||
Reconfigured tenant layouts to maximize efficiency leading to ~40,000 SF of marketable space previously unleasable | Exit capitalization rate ~200bps below acquisition capitalization rate1 | Flexible design features will allow the building to be efficiently utilized for both single- and multi-tenant occupancy | ||
Currently installing floors over open crane pit areas to create an additional ~150,000 SF of new leasable space generating a projected cash yield of ~14.0% |
Replacement Cost Analysis |
Total Rentable | Purchase | Replacement | |||||||||
Market | Market Type2 | # of Buildings | Square Feet (RSF) | Price3 | Cost4 | ||||||
Atlanta | Primary | 9 | 1,318,002 | $ 62,931 | $ 81,124 | ||||||
Chicago | Primary | 38 | 6,078,434 | 232,676 | 497,205 | ||||||
Boston | Secondary | 1 | 200,625 | 10,500 | 20,161 | ||||||
Cincinnati | Secondary | 8 | 2,060,310 | 68,457 | 131,968 | ||||||
Cleveland | Secondary | 17 | 3,681,390 | 176,250 | 307,536 | ||||||
Columbus | Secondary | 10 | 2,724,173 | 101,643 | 183,766 | ||||||
Indianapolis | Secondary | 14 | 3,468,401 | 104,740 | 245,919 | ||||||
Jacksonville | Secondary | 24 | 1,966,154 | 135,650 | 172,492 | ||||||
Kansas City | Secondary | 1 | 221,911 | 8,600 | 20,451 | ||||||
Memphis | Secondary | 16 | 1,848,559 | 58,725 | 110,510 | ||||||
Philadelphia | Secondary | 1 | 156,634 | 9,700 | 10,569 | ||||||
St. Louis | Secondary | 8 | 1,052,261 | 56,237 | 81,458 | ||||||
Total | 147 | 24,776,854 | $ 1,026,109 | $ 1,863,159 | |||||||
1) | Based on acquisition yield and third-party real estate market estimate of current exit capitalization rate. |
2) | Primary markets means the following two metropolitan areas in the U.S., each generally consisting of more than 300 million square feet of industrial space: Chicago and Atlanta. Secondary markets means non-primary markets, each generally consisting of between 100 million and 300 million square feet of industrial space, including the following metropolitan areas in the U.S.: Boston, Cincinnati, Cleveland, Columbus, Indianapolis, Jacksonville, Kansas City, Memphis, Milwaukee, Philadelphia, South Florida, and St. Louis. Our definitions of primary and secondary markets may vary from the definitions of these terms used by investors, analysts, or other industrial REITs. |
3) | Represents total direct consideration paid rather than GAAP cost basis. |
4) | Replacement cost is based on the Marshall & Swift valuation methodology for the determination of building costs. Replacement cost includes land reflected at the allocated cost in accordance with GAAP. |
Page 5
Plymouth Industrial REIT, Inc. |
Rent Collections and Deferrals |
The Company continues to experience substantial rent collection throughout the COVID-19 pandemic. Collection of original contracted rents, including those deferred, as of the current quarter ended was over 99%. |
Unaudited ($ in thousands) |
% of Tenant | % of Tenant | Total Revised | |||||
Contractual Base | Contractual Base | Contractual Base | |||||
Rent Collections | Rent Collected | Rent Deferred | Rent Collected | ||||
First Quarter 2020 | 99.9% | 0.0% | 99.9% | ||||
Second Quarter 2020 | 95.2% | 4.7% | 99.9% | ||||
Third Quarter 2020 | 99.5% | 0.4% | 99.9% | ||||
Fourth Quarter 2020 | 99.9% | 0.0% | 99.9% | ||||
First Quarter 2021 | 99.7% | 0.2% | 99.9% | ||||
Second Quarter 20211 | 99.7% | 0.0% | 99.7% | ||||
Rent Deferrals2 | Granted | Collected | Outstanding | ||||
Full Year 20203 | $ 1,250 | $ 1,250 | $ — | ||||
First Quarter 20214 | $ 54 | $ — | $ 54 | ||||
1) | Cash receipts based on contractual base rent receivables through July 27, 2021. |
2) | Rent deferrals require full repayment of rent amounts within twelve months from the date of the deferment. |
3) | The total outstanding rental deferral amounts as of the year ended December 31, 2020 have been paid consistent with the deferral terms and fully collected. |
4) | A single deferment agreement was executed in the first quarter of 2021; no new deferrals were granted in the second quarter of 2021. The single deferment agreement calls for the repayment of deferred rents to be fully repaid by year-end 2021. |
Page 6
Plymouth Industrial REIT, Inc. |
Guidance |
The Company affirmed the full year 2021 guidance ranges for Net loss, Core FFO and AFFO attributable to common stockholders and unit holders noted below. In addition, the Company updated the 2021 guidance assumptions accompanying the full year range herein. |
Unaudited (in thousands, except per-share amounts) |
Full Year 2021 Range1 | |||||
Low | High | ||||
Net loss | $ (0.30) | $ (0.26) | |||
Depreciation and amortization | 2.18 | 2.18 | |||
Depreciation and amortization from unconsolidated joint venture | 0.05 | 0.05 | |||
Gain on sale of real estate | (0.02) | (0.02) | |||
Unrealized appreciation of warrants | 0.01 | 0.01 | |||
Preferred stock dividend | (0.22) | (0.22) | |||
Core FFO | $ 1.70 | $ 1.74 | |||
Amortization of debt related costs | 0.05 | 0.05 | |||
Stock compensation | 0.05 | 0.05 | |||
Straight-line rent | (0.08) | (0.08) | |||
Above/below market lease rents | (0.06) | (0.06) | |||
Recurring capital expenditures | (0.23) | (0.22) | |||
AFFO attributable to common stockholders and unit holders | $ 1.43 | $ 1.48 | |||
Weighted-average common shares and units outstanding | 30,748 | 30,748 | |||
2021 Guidance Assumptions | Low | High | |||
Total Revenue | $ 136,100 | $ 136,800 | |||
NOI | $ 90,400 | $ 91,200 | |||
EBITDAre | $ 77,650 | $ 78,150 | |||
General & Administrative2 | $ 12,600 | $ 12,300 | |||
Recurring Capital Expenditures | $ 6,950 | $ 6,650 | |||
Same Store Cash NOI3 | $ 58,300 | $ 58,850 | |||
Same Store Occupancy3 | 95.5% | 97.0% | |||
1) | Assumes the completion of approximately $280 million of acquisitions ($91 million of which have been completed to date, with the balance projected to occur in the third and fourth quarters). There can be no assurance that we will complete the projected acquisitions within the forecasted timeframes. |
2) | Includes non-cash stock compensation of $1.6 million for the full year 2021. |
3) | The Same Store Portfolio consists of 108 buildings aggregating 17,093,547 rentable square feet. The Same Store projected performance reflects an annual NOI cash basis excluding termination income increase of 2.5%-3.0%. |
Page 7
Plymouth Industrial REIT, Inc. |
Same Store Net Operating Income (NOI) |
Unaudited ($ in thousands) |
Same Store Portfolio Statistics | |||
Square footage | 17,093,547 | Includes: wholly owned properties as of December 31, 2019; determined and set once per year for the following twelve months (refer to Glossary for Same Store definition) | |
Number of properties | 81 | ||
Number of buildings | 108 | ||
Percentage of total portfolio square footage | 69.0% | Excludes: wholly owned properties classified as repositioning or lease-up during 2020 or 2021 (5 properties representing approximately 607,000 of rentable square feet) and unconsolidated joint venture properties | |
Occupancy at period end | 97.8% |
Same Store NOI - GAAP Basis |
Three Months Ended June 30, | |||||||||
2021 | 2020 | $ Change | % Change | ||||||
Rental revenue | $ 24,099 | $ 23,059 | $ 1,040 | 4.5% | |||||
Property expenses | 8,681 | 8,009 | 672 | 8.4% | |||||
Same Store NOI - GAAP Basis | $ 15,418 | $ 15,050 | $ 368 | 2.4% | |||||
Same Store NOI excluding early termination income - GAAP Basis1 | $ 15,418 | $ 15,031 | $ 387 | 2.6% | |||||
Six Months Ended June 30, | |||||||||
2021 | 2020 | $ Change | % Change | ||||||
Rental revenue | $ 48,321 | $ 47,062 | $ 1,259 | 2.7% | |||||
Property expenses | 18,082 | 16,441 | 1,641 | 10.0% | |||||
Same Store NOI - GAAP Basis | $ 30,239 | $ 30,621 | $ (382) | -1.2% | |||||
Same Store NOI excluding early termination income - GAAP Basis | $ 30,165 | $ 30,498 | $ (333) | -1.1% |
Same Store NOI - Cash Basis |
Three Months Ended June 30, | |||||||||
2021 | 2020 | $ Change | % Change | ||||||
Rental revenue | $ 22,769 | $ 22,348 | $ 421 | 1.9% | |||||
Property expenses | 8,681 | 8,009 | 672 | 8.4% | |||||
Same Store NOI - Cash Basis | $ 14,088 | $ 14,339 | $ (251) | -1.8% | |||||
Same Store NOI excluding early termination income - Cash Basis2 | $ 14,088 | $ 14,320 | $ (232) | -1.6% | |||||
Six Months Ended June 30, | |||||||||
2021 | 2020 | $ Change | % Change | ||||||
Rental revenue | $ 46,268 | $ 45,382 | $ 886 | 2.0% | |||||
Property expenses | 18,082 | 16,441 | 1,641 | 10.0% | |||||
Same Store NOI - Cash Basis | $ 28,186 | $ 28,941 | $ (755) | -2.6% | |||||
Same Store NOI excluding early termination income - Cash Basis | $ 28,113 | $ 28,818 | $ (705) | -2.4% | |||||
1) | Same Store NOI ("SS NOI") for the second quarter was positively impacted by rent escalations and renewal spreads, partially offset by an increase in operating expenses. |
2) | SS NOI for the second quarter was negatively impacted by free rent periods that will burn off in subsequent quarters, coupled with an increase in operating expenses. |
Page 8
Plymouth Industrial REIT, Inc. |
Consolidated Statements of Operations |
Unaudited ($ thousands, except per-share amounts) |
For the Three Months Ended June 30, | For the Six Months Ended June 30, | |||||||
2021 | 2020 | 2021 | 2020 | |||||
Revenues: | ||||||||
Rental revenue | $ 25,627 | $ 20,364 | $ 50,181 | $ 40,725 | ||||
Tenant recoveries | 7,131 | 5,773 | 14,410 | 11,641 | ||||
Management fee revenue1 | 97 | - | 180 | - | ||||
Total revenues | $ 32,855 | $ 26,137 | $ 64,771 | $ 52,366 | ||||
Operating expenses: | ||||||||
Property | 10,940 | 9,026 | 22,366 | 18,037 | ||||
Depreciation and amortization | 16,902 | 13,520 | 32,679 | 27,617 | ||||
General and administrative | 3,309 | 2,576 | 6,318 | 5,098 | ||||
Total operating expenses | $ 31,151 | $ 25,122 | $ 61,363 | $ 50,752 | ||||
Other income (expense): | ||||||||
Interest expense | (4,825) | (4,900) | (9,583) | (9,771) | ||||
Earnings (loss) in investment of unconsolidated joint venture2 | (224) | - | (497) | - | ||||
Unrealized (appreciation) depreciation of warrants3 | (636) | - | (883) | - | ||||
Gain on sale of real estate4 | - | - | 590 | - | ||||
Total other income (expense) | $ (5,685) | $ (4,900) | $ (10,373) | $ (9,771) | ||||
Net loss | $ (3,981) | $ (3,885) | $ (6,965) | $ (8,157) | ||||
Less: Loss attributable to non-controlling interest | (71) | (209) | (136) | (454) | ||||
Net loss attributable to Plymouth Industrial REIT, Inc. | $ (3,910) | $ (3,676) | $ (6,829) | $ (7,703) | ||||
Less: Preferred stock dividends | 1,652 | 1,613 | 3,304 | 3,226 | ||||
Less: Series B Preferred Stock accretion to redemption value | 1,807 | 1,854 | 3,614 | 3,708 | ||||
Less: Amount allocated to participating securities | 48 | 30 | 105 | 106 | ||||
Net loss attributable to common stockholders | $ (7,417) | $ (7,173) | $ (13,852) | $ (14,743) | ||||
Net loss basic and diluted per share attributable to common stockholders | $ (0.25) | $ (0.49) | $ (0.49) | $ (1.02) | ||||
Weighted-average common shares outstanding basic & diluted | 29,349 | 14,649 | 28,283 | 14,514 | ||||
1) | Represents management fee revenue earned from the unconsolidated joint venture. |
2) | Represents our share of earnings (losses) related to our investment in an unconsolidated joint venture. Refer to Unconsolidated Joint Venture in this Supplement Information for additional details. |
3) | Represents the change in the fair market value of our common stock warrants. |
4) | During the first quarter of 2021, the Company sold a single, 98,340 SF property for approximately $2,307, recognizing a net gain of $590. |
Page 9
Plymouth Industrial REIT, Inc. |
Non-GAAP Measurements |
Unaudited ($ in thousands) |
Consolidated NOI |
Three Months Ended June 30, | Six Months Ended June 30, | |||||||
2021 | 2020 | 2021 | 2020 | |||||
Net loss | $ (3,981) | $ (3,885) | $ (6,965) | $ (8,157) | ||||
General and administrative | 3,309 | 2,576 | 6,318 | 5,098 | ||||
Depreciation and amortization | 16,902 | 13,520 | 32,679 | 27,617 | ||||
Interest expense | 4,825 | 4,900 | 9,583 | 9,771 | ||||
Unrealized appreciation (depreciation) of warrants1 | 636 | - | 883 | - | ||||
(Earnings) loss in investment of unconsolidated joint venture2 | 224 | - | 497 | - | ||||
Gain on sale of real estate | - | - | (590) | - | ||||
Other Income3 | (97) | - | (180) | - | ||||
Net Operating Income | $ 21,818 | $ 17,111 | $ 42,225 | $ 34,329 |
Earnings Before Interest, Taxes, Depreciation and Amortization for Real Estate (EBITDAre) |
Net loss | $ (3,981) | $ (3,885) | $ (6,965) | $ (8,157) | ||||
Depreciation and amortization | 16,902 | 13,520 | 32,679 | 27,617 | ||||
Interest expense | 4,825 | 4,900 | 9,583 | 9,771 | ||||
Unrealized appreciation (depreciation) of warrants1 | 636 | - | 883 | - | ||||
Gain on sale of real estate | - | - | (590) | - | ||||
EBITDAre | $ 18,382 | $ 14,535 | $ 35,590 | $ 29,231 | ||||
Stock compensation | 461 | 383 | 879 | 732 | ||||
Pro forma effect of acquisitions4 | 234 | - | 1,266 | 584 | ||||
EBITDA adjustments attributable to unconsolidated joint venture5 | 500 | - | 986 | - | ||||
Adjusted EBITDA | $ 19,577 | $ 14,918 | $ 38,721 | $ 30,547 |
Funds from Operations (FFO), Core FFO & Adjusted Funds from Operations (AFFO) |
Net loss | $ (3,981) | $ (3,885) | $ (6,965) | $ (8,157) | ||||
Gain on sale of real estate | - | - | (590) | - | ||||
Depreciation and amortization | 16,902 | 13,520 | 32,679 | 27,617 | ||||
Depreciation and amortization from unconsolidated joint venture | 408 | - | 801 | - | ||||
FFO | $ 13,329 | $ 9,635 | $ 25,925 | $ 19,460 | ||||
Preferred stock dividends | (1,652) | (1,613) | (3,304) | (3,226) | ||||
Unrealized appreciation (depreciation) of warrants1 | 636 | - | 883 | - | ||||
Core FFO | $ 12,313 | $ 8,022 | $ 23,504 | $ 16,234 | ||||
Amortization of debt related costs | 369 | 366 | 739 | 665 | ||||
Non-cash interest expense | (29) | (174) | (72) | 90 | ||||
Stock compensation | 461 | 383 | 879 | 732 | ||||
Straight line rent | (1,146) | (443) | (1,760) | (961) | ||||
Above/below market lease rents | (616) | (438) | (1,109) | (986) | ||||
Recurring capital expenditures6 | (1,555) | (719) | (3,415) | (1,755) | ||||
AFFO | $ 9,797 | $ 6,997 | $ 18,766 | $ 14,019 | ||||
Weighted-average common shares and units outstanding | 30,156 | 15,675 | 29,109 | 15,564 | ||||
Core FFO attributable to common stockholders and unit holders per share | $ 0.41 | $ 0.51 | $ 0.81 | $ 1.04 | ||||
AFFO attributable to common stockholders and unit holders per share | $ 0.32 | $ 0.45 | $ 0.64 | $ 0.90 | ||||
1) | Represents the change in the fair market value of our common stock warrants. |
2) | Represents our share of (earnings) losses related to our investment in an unconsolidated joint venture. Refer to Unconsolidated Joint Venture in this Supplemental Information for additional details. |
3) | Represents management fee revenue earned from the unconsolidated joint venture. |
4) | Represents the estimated impact of wholly owned and joint venture acquisitions as if they had been acquired on the first day of each respective quarter in which the acquisitions occurred. We have made a number of assumptions in such estimates and there can be no assurance that we would have generated the projected levels of EBITDA had we owned the acquired properties as of the beginning of the respective periods. |
5) | Represents depreciation and amortization, and interest expense from the Company's unconsolidated joint venture. |
6) | Excludes non-recurring capital expenditures of $6,350 and $401 for the three months ended June 30, 2021 and 2020, respectively, and $7,584 and $2,151 for the six months ended June 30, 2021 and 2020, respectively. |
Page 10
Plymouth Industrial REIT, Inc. |
Consolidated Balance Sheets |
Unaudited ($ in thousands) |
June 30, 2021 | December 31, 2020 | ||||
ASSETS | |||||
Real estate properties: | |||||
Land | $ 170,245 | $ 159,681 | |||
Building and improvements | 790,375 | 727,000 | |||
Less accumulated depreciation | (118,523) | (98,283) | |||
Total real estate properties, net | $ 842,097 | $ 788,398 | |||
Cash, cash held in escrow and restricted cash | 29,314 | 32,054 | |||
Deferred lease intangibles, net | 64,510 | 66,116 | |||
Investment in unconsolidated joint venture1 | 6,186 | 6,683 | |||
Other assets | 27,721 | 27,019 | |||
Total assets | $ 969,828 | $ 920,270 | |||
LIABILITIES, PREFERRED STOCK AND EQUITY | |||||
Secured debt, net | $ 326,585 | $ 328,908 | |||
Unsecured debt, net2 | 167,333 | 189,254 | |||
Accounts payable, accrued expenses and other liabilities | 55,284 | 49,335 | |||
Deferred lease intangibles, net | 9,925 | 11,350 | |||
Financing lease liability3 | 2,216 | 2,207 | |||
Total liabilities | $ 561,343 | $ 581,054 | |||
Preferred stock - Series A | $ 48,473 | $ 48,485 | |||
Preferred stock - Series B4 | $ 90,823 | $ 87,209 | |||
Equity: | |||||
Common stock | $ 310 | $ 253 | |||
Additional paid in capital | 434,161 | 360,752 | |||
Accumulated deficit | (169,079) | (162,250) | |||
Total stockholders' equity | 265,392 | 198,755 | |||
Non-controlling interest | 3,797 | 4,767 | |||
Total equity | $ 269,189 | $ 203,522 | |||
Total liabilities, preferred stock and equity | $ 969,828 | $ 920,270 | |||
1) | Represents a noncontrolling equity interest in a single joint venture we entered into during October, 2020. Our investment in the joint venture is accounted for under the equity method of accounting. Refer to Investment in Unconsolidated Joint Venture in this Supplemental Information for additional details. | ||||
2) | Includes borrowings under revolving credit facility and term loan. Refer to Debt Summary in this Supplemental Information for additional details. | ||||
3) | As of June 30, 2021, we have a single finance lease in which we are the sublessee for a ground lease with a remaining lease term of approximately 34.5 years. Refer to our 2021 Quarterly Report on Form 10-Q for expanded disclosure. | ||||
4) | Refer to Glossary in this Supplemental Information for relevant features of the Preferred stock - Series B. |
Page 11
Plymouth Industrial REIT, Inc. |
Capital Structure and Debt Summary |
Unaudited ($ in thousands) as of 06/30/2021 |
Debt Summary |
Secured Debt: | Maturity Date | Interest Rate | Commitment | Principal Balance | |
Lincoln Life Mortgage1 | January-22 | 3.41% | $ 9,600 | $ 9,178 | |
AIG Loan | November-23 | 4.08% | 120,000 | 115,795 | |
Ohio National Life Mortgage1 | August-24 | 4.14% | 21,000 | 19,958 | |
Allianz Loan | April-26 | 4.07% | 63,115 | 63,115 | |
JPMorgan Chase Loan1 | January-27 | 5.23% | 13,900 | 13,323 | |
Nationwide Loan | October-27 | 2.97% | 15,000 | 15,000 | |
Minnesota Life Loan | May-28 | 3.78% | 21,500 | 20,663 | |
Transamerica Loan | August-28 | 4.35% | 78,000 | 72,312 | |
Total / Weighted Average Secured Debt | 4.10% | $ 342,115 | $ 329,344 | ||
Unsecured Debt: | |||||
KeyBank Revolving Credit Facility | October-24 | 1.95%2 | $ 200,000 | $ 68,000 | |
KeyBank Term Loan | October-25 | 1.95%2 | 100,000 | 100,000 | |
Total / Weighted Average Unsecured Debt | 1.95% | $ 300,000 | $ 168,000 |
June 30, | March 31, | December 31, | |||
Net Debt: | 2021 | 2021 | 2020 | ||
Total Debt3 | $ 508,544 | $ 539,883 | $ 533,211 | ||
Less: Cash | 29,314 | 28,163 | 32,054 | ||
Net Debt | $ 479,230 | $ 511,720 | $ 501,157 |
Capitalization |
June 30, | March 31, | December 31, | ||
2021 | 2021 | 2020 | ||
Common Shares and Units Outstanding4 | 31,596 | 28,945 | 25,951 | |
Closing Price (as of period end) | $ 19.90 | $ 16.85 | $ 15.00 | |
Market Value of Common Shares5 | $ 628,760 | $ 487,723 | $ 389,265 | |
Preferred Stock - Series A6 | 50,589 | 50,589 | 50,600 | |
Preferred Stock - Series B6 | 97,277 | 97,277 | 97,230 | |
Total Market Capitalization5,7 | $ 1,285,170 | $ 1,175,472 | $ 1,070,306 | |
Dividend / Share (annualized) | $ 0.84 | $ 0.80 | $ 0.80 | |
Dividend Yield (annualized) | 4.2% | 4.7% | 5.3% | |
Total Debt-to-Total Market Capitalization | 39.6% | 45.9% | 49.8% | |
Secured Debt as a % of Total Debt | 67.0% | 63.3% | 62.3% | |
Unsecured Debt as a % of Total Debt | 33.0% | 36.7% | 37.7% | |
Net Debt-to-Annualized Adjusted EBITDA (quarter annualized) | 6.2x | 6.7x | 6.7x | |
Net Debt plus Preferred-to-Annualized Adjusted EBITDA (quarter annualized)6 | 8.1x | 8.6x | 8.7x | |
Weighted Average Maturity of Total Debt (years) | 4.3 | 4.7 | 4.9 |
Capital Markets Activity - YTD |
Common Shares | Avg. Price | Offering | Period | Net Proceeds |
2,883,794 | $ 15.00 | ATM | Q1 2021 | $ 42,510 |
2,646,854 | $ 18.86 | ATM | Q2 2021 | $ 48,584 |
786,031 | $ 21.04 | ATM | Q3 2021 | $ 16,204 |
Refer to Glossary in this Supplemental Information for definitions of non-GAAP financial measures, including Net debt and Net debt plus preferred-to-Adjusted EBITDA. |
1) | Debt assumed at acquisition. |
2) | The 1-month LIBOR rate as of June 30, 2021 was 0.10%. The spread over the applicable rate for the KeyBank Term Loan and the revolving line of credit with KeyBank is based on the Company’s total leverage ratio. |
3) | Total Debt is not adjusted for the amortization of debt issuance costs or fair market premiums or discounts. Total Debt includes the Company's pro rata share of unconsolidated joint venture debt. |
4) | Common shares and units outstanding were 31,089 and 507 as of June 30, 2021, respectively, and 25,344 and 607 for the year ended 2020, respectively. |
5) | Based on closing price as of last trading day of the quarter and common shares and units as of the period ended. |
6) | Preferred Stock is calculated at its liquidation preference as of the end of the period. |
7) | Market value of shares and units plus total debt and preferred stock as of period end. |
Page 12
Plymouth Industrial REIT, Inc. |
Unconsolidated Joint Venture |
In October 2020, the Company announced the formation of a $150 million equity joint venture with Madison International Realty to pursue the acquisition of value-add and opportunistic industrial properties in key markets. The joint venture's first acquisition on December 17, 2020 was a portfolio of infill industrial buildings in metropolitan Memphis for $86 million. The acquisition is projected to provide an initial yield of approximately 7.7%. |
Unaudited ($ in thousands) as of 06/30/2021 |
Unconsolidated Joint Venture Portfolio Statistics | Madison International Realty Joint Venture |
Number of Properties | 16 | Partnership | Total Equity | |||||
Number of Buildings | 28 | Joint Venture Members | Interests | Commitment | ||||
Square Footage | 2,320,773 | Plymouth (Managing Member) | 20% | $ 30,000 | ||||
Occupancy | 95.0% | Madison | 80% | 120,000 | ||||
Weighted Average Lease Term Remaining (in years) | 2.6 | $ 150,000 | ||||||
Multi-Tenant % | 41% | Partner Equity Deployed | $ 33,328 | |||||
Single-Tenant % | 59% | Annualized Asset Mgmt. Fee to PLYM | $ 333 | |||||
Targeted Leverage |
Total Potential
Investment |
Remaining Potential Investment | |||||
60% | $ 375,000 | $ 289,000 | |||||
65% | $ 428,000 | $ 342,000 |
Balance Sheet Information1 | Selected Quarter-to-Date and Year-to-Date Financial Information1 |
June 30, | Three Months Ended | Six Months Ended | ||||||
ASSETS | 2021 | June 30, | June 30, | |||||
Real estate properties, net | $ 84,021 | Plymouth's Share | 2021 | 2021 | ||||
Cash, cash held in escrow and restricted cash | 4,623 | Revenues | $ 464 | $ 945 | ||||
Other assets | 1,303 | Net Operating Income | $ 283 | $ 604 | ||||
Total assets | $ 89,947 | Interest Expense | $ 92 | $ 185 | ||||
EBITDA | $ 260 | $ 560 | ||||||
LIABILITIES AND EQUITY | Joint Venture Assets | $ 17,989 | $ 17,989 | |||||
Secured debt, net2 | $ 55,412 | Joint Venture Debt | $ 11,200 | $ 11,200 | ||||
Other liabilities | 4,010 | |||||||
Equity | 30,525 | |||||||
Total liabilities and equity | $ 89,947 |
Joint Venture Key Terms | ||
● | We are the Managing Member of the joint venture and receive an annual 1% asset management fee on the total equity investment | |
● | Distribution of cash flows: first to Members pro rata until Madison achieves a 12% return; second 10% to Managing Member and 90% to Members pro-rata until Madison achieves a 15% return, thereafter 20% to Managing Member and 80% to Members pro rata | |
Additional details on the unconsolidated joint venture can be found in documents filed with or furnished to the SEC. |
1) | Balance sheet and portfolio information is presented at 100% of the joint venture. Selected financial information is presented at our pro rata share. |
2) | A $56 million mortgage secured by the joint venture properties from Minnesota Life that carries a seven-year term at a fixed interest rate of 3.15%. |
Page 13
Plymouth Industrial REIT, Inc. |
Net Asset Value Components |
Unaudited ($ in thousands) as of 06/30/2021 |
Net Operating Income | YTD 2021 Acquisitions |
Three Months Ended June 30, | Acquisition | # of | Square | Purchase | Projected | |||||
2021 | Market | Date | Buildings | Footage | Price | Initial Yield | ||||
Pro Forma Net Operating Income (NOI) | Kansas City | 2/12/2021 | 1 | 221,911 | $ 8,600 | 8.8% | ||||
Total Operating NOI | $ 21,818 | St. Louis | 3/23/2021 | 1 | 142,364 | 7,800 | 7.6% | |||
Share of Joint Venture NOI | $ 283 | Chicago | 3/25/2021 | 1 | 149,474 | 7,900 | 7.3% | |||
Pro Forma Effect of New Lease Activity1 | $ 264 | Cleveland | 3/29/2021 | 1 | 100,150 | 7,700 | 7.6% | |||
Pro Forma Effect of Acquisitions2 | $ 234 | Columbus | 3/29/2021 | 1 | 772,450 | 29,000 | 7.5% | |||
Pro Forma Effect of Repositioning / Development3 | $ 915 | Memphis | 6/29/2021 | 1 | 74,665 | 5,250 | 7.0% | |||
Pro Forma NOI | $ 23,514 | St. Louis | 6/30/2021 | 1 | 155,434 | 8,800 | 6.7% | |||
Memphis | 7/9/2021 | 1 | 233,000 | 9,900 | 7.7% | |||||
Amortization of above / below market lease intangibles, net | (625) | Memphis | 7/30/2021 | 1 | 316,935 | 6,277 | 8.0% | |||
Straight-line rental revenue adjustment | (1,151) | 9 | 2,166,383 | $ 91,227 | 7.6% | |||||
Pro Forma Cash NOI | $ 21,738 |
Other Assets and Liabilities | Developable Land |
Cash, cash held in escrow and restricted cash | $ 29,314 | Market | Owned
Land (acres)4 |
Developable
GLA (SF)4 |
Under
Construction (SF)5 |
Under
Development (SF)5 | ||
Other assets | $ 27,721 | Atlanta | 65 | 340,000 | - | 240,000 | ||
Accounts payable, accrued expenses and other liabilities | $ 55,284 | Chicago | 11 | 220,000 | - | - | ||
Boston | 8 | 70,000 | 70,000 | - | ||||
Debt and Preferred Stock | Cincinnati | 30 | 450,000 | - | - | |||
Jacksonville | 15 | 178,000 | - | 178,000 | ||||
Secured Debt, net | $ 329,344 | Memphis | 23 | 475,000 | - | - | ||
Unsecured Debt, net | $ 168,000 | 152 | 1,733,000 | 70,000 | 418,000 | |||
Share of Joint Venture Debt6 | $ 11,200 | |||||||
Preferred Stock - Series A7 | $ 50,589 | |||||||
Preferred Stock - Series B7 | $ 97,277 | |||||||
Common shares and units outstanding8 | 31,596 |
We have made a number of assumptions with respect to the pro forma effects and there can be no assurance that we would have generated the projected levels of NOI had we actually owned the acquired properties and / or fully stabilized the repositioning / development properties as of the beginning of the period. Refer to Glossary in this Supplemental Information for a definition and discussion of non-GAAP financial measures. |
1) | Represents the estimated incremental base rents from uncommented new leases as if rent commencement had occurred as of the beginning of the period. |
2) | Represents the estimated impact of acquisitions as if they had been acquired at the beginning of the period. |
3) | Represents the estimated impact of properties that are undergoing repositioning or lease-up as if the properties were fully stabilized and rents had commenced as of the beginning of the period. |
4) | Developable land represents acreage currently owned by us and identified for potential development. The developable gross leasable area (GLA) is based on the developable land area and a land to building ratio. Developable land and GLA are estimated and can change periodically due to changes in site design, road and storm water requirements, parking requirements and other factors. We have made a number of assumptions in such estimates and there can be no assurance that we will develop land that we own. |
5) | Under construction represents projects for which vertical construction has commenced. Under development represents projects in the pre-construction phase. |
6) | Our ownership interest is 20%. |
7) | Preferred Stock is calculated at its liquidation preference as of the end of the period. |
8) | Common shares and units outstanding were 31,089 and 507 as of June 30, 2021. |
Page 14
Plymouth Industrial REIT, Inc. |
Leasing Activity and Expirations |
Unaudited as of 06/30/2021 |
Lease Renewals and New Leases1 |
Year | Type | Square
Footage |
Percent | Expiring
Rent |
New Rent | % Change | Tenant Improvements $/SF/YR | Lease Commissions $/SF/YR |
2019 | Renewals | 1,380,839 | 58.4% | $ 4.17 | $ 4.51 | 7.9% | $ 0.19 | $ 0.14 |
New Leases | 982,116 | 41.6% | $ 2.88 | $ 3.43 | 19.1% | $ 0.27 | $ 0.23 | |
Total | 2,362,955 | 100% | $ 3.64 | $ 4.06 | 11.6% | $ 0.22 | $ 0.17 | |
2020 | Renewals | 1,881,346 | 71.1% | $ 3.75 | $ 3.93 | 4.8% | $ 0.13 | $ 0.08 |
New Leases | 764,314 | 28.9% | $ 4.31 | $ 5.07 | 17.6% | $ 0.24 | $ 0.19 | |
Total | 2,645,660 | 100% | $ 3.92 | $ 4.26 | 8.7% | $ 0.16 | $ 0.11 | |
Q1 2021 | Renewals | 899,102 | 77.5% | $ 4.00 | $ 4.39 | 9.8% | $ 0.23 | $ 0.07 |
New Leases | 261,495 | 22.5% | $ 3.82 | $ 4.61 | 20.7% | $ 0.15 | $ 0.14 | |
Total | 1,160,597 | 100% | $ 3.96 | $ 4.44 | 12.1% | $ 0.21 | $ 0.08 | |
Q2 2021 | Renewals | 937,191 | 50.1% | $ 4.04 | $ 4.17 | 3.2% | $ 0.16 | $ 0.10 |
New Leases | 934,931 | 49.9% | $ 3.49 | $ 3.89 | 11.4% | $ 0.23 | $ 0.23 | |
Total | 1,872,122 | 100% | $ 3.77 | $ 4.03 | 7.0% | $ 0.19 | $ 0.16 | |
Lease Expiration Schedule |
Year | Square Footage |
ABR2 | % of ABR Expiring3 |
![]() | ||
Available | 947,474 | $ - | - | |||
2021 | 626,970 | 3,286,297 | 3.3% | |||
2022 | 4,384,914 | 20,118,161 | 20.2% | |||
2023 | 2,928,271 | 11,595,946 | 11.6% | |||
2024 | 4,145,358 | 16,636,760 | 16.7% | |||
2025 | 4,303,875 | 17,028,884 | 17.1% | |||
Thereafter | 7,439,992 | 31,006,854 | 31.1% | |||
Total | 24,776,854 | $ 99,672,902 | 100.0% | |||
1) | Lease renewals and new lease activity excludes leases with terms less than six months. |
2) | Annualized base rent is calculated as monthly contracted base rent as of June 30, 2021, multiplied by 12. Excludes rent abatements. |
3) | Calculated as annualized base rent set forth in this table divided by total annualized base rent as of June 30, 2021. |
Page 15
Plymouth Industrial REIT, Inc. |
Leased Square Feet and Annualized Base Rent by Tenant Industry |
Unaudited as of 06/30/2021 |
Industry | Total Leased Square Feet | # of Tenants | % Rentable Square Feet |
ABR1 | % ABR | ABR Per Square Foot |
Logistics & Transportation | 6,439,826 | 70 | 27.0% | $ 24,399,453 | 24.5% | $ 3.79 |
Home & Garden | 1,588,580 | 14 | 6.7% | 5,132,335 | 5.1% | 3.23 |
Light Manufacturing | 1,350,976 | 10 | 5.7% | 5,182,306 | 5.2% | 3.84 |
Food & Beverage | 1,349,217 | 18 | 5.7% | 6,153,936 | 6.2% | 4.56 |
Construction | 1,321,567 | 30 | 5.5% | 5,480,685 | 5.5% | 4.15 |
Cardboard and Packaging | 1,299,200 | 13 | 5.5% | 4,724,076 | 4.7% | 3.64 |
Printing | 1,246,721 | 8 | 5.2% | 4,037,617 | 4.1% | 3.24 |
Automotive | 1,180,043 | 18 | 5.0% | 4,984,948 | 5.0% | 4.22 |
Wholesale/Retail | 866,416 | 19 | 3.6% | 3,289,913 | 3.3% | 3.80 |
Plastics | 771,234 | 10 | 3.2% | 3,171,461 | 3.2% | 4.11 |
Other Industries* | 6,415,600 | 191 | 26.9% | 33,116,172 | 33.2% | 5.16 |
Total | 23,829,380 | 401 | 100.0% | $ 99,672,902 | 100.0% | $ 4.18 |
*Other Industries | Total Leased Square Feet | # of Tenants | % Rentable Square Feet | ABR1 | % ABR | ABR Per Square Foot |
Industrial Equipment Components | 706,004 | 19 | 3.0% | $ 2,743,001 | 2.8% | $ 3.89 |
Healthcare | 499,667 | 20 | 2.1% | 2,889,651 | 2.9% | 5.78 |
Metal Fabrication/Finishing | 487,566 | 10 | 2.0% | 2,273,941 | 2.3% | 4.66 |
Technology & Electronics | 460,070 | 14 | 1.9% | 2,418,285 | 2.4% | 5.26 |
Business Services | 434,245 | 23 | 1.8% | 3,346,125 | 3.3% | 7.71 |
Storage | 405,696 | 10 | 1.7% | 2,648,708 | 2.7% | 6.53 |
Education | 402,844 | 7 | 1.7% | 2,015,124 | 2.0% | 5.00 |
Chemical | 371,672 | 6 | 1.6% | 1,385,709 | 1.4% | 3.73 |
Plumbing Equipment/Services | 361,374 | 6 | 1.5% | 1,250,125 | 1.3% | 3.46 |
Paper | 342,178 | 3 | 1.4% | 1,621,920 | 1.6% | 4.74 |
Appliances | 335,415 | 2 | 1.4% | 1,450,098 | 1.5% | 4.32 |
Other2 | 1,608,869 | 71 | 6.8% | 9,073,485 | 9.0% | 5.64 |
Total | 6,415,600 | 191 | 26.9% | $ 33,116,172 | 33.2% | $ 5.16 |
1) | Annualized base rent is calculated as monthly contracted base rent as of June 30, 2021, multiplied by 12. Excludes rent abatements. | |
2) | Includes tenant industries for which the total leased square feet aggregates to less than 300,000 square feet. |
Page 16
Plymouth Industrial REIT, Inc. |
Leased Square Feet and Annualized Base Rent by Type |
Unaudited as of 06/30/2021 |
Leased Square Feet and Annualized Base Rent by Lease Type |
Lease Type | Total Leased Square Feet | # of Leases | % Leased Square Feet | ABR1 | % ABR | ABR Per Square Foot | |
Triple Net | 17,495,874 | 297 | 73.4% | $ 71,472,276 | 71.7% | $ 4.09 | |
Modified Net | 3,436,598 | 50 | 14.4% | 14,981,943 | 15.0% | 4.36 | |
Gross | 2,896,908 | 54 | 12.2% | 13,218,683 | 13.3% | 4.56 | |
Total | 23,829,380 | 401 | 100.0% | $ 99,672,902 | 100.0% | $ 4.18 |
Leased Square Feet and Annualized Base Rent by Tenant Type |
Tenant Type | Total Leased Square Feet | # of Leases | % Leased Square Feet | ABR1 | % ABR | ABR Per Square Foot | |
Multi-Tenant | 14,662,242 | 340 | 61.5% | $ 65,720,532 | 65.9% | $ 4.48 | |
Single-Tenant | 9,167,138 | 61 | 38.5% | 33,952,370 | 34.1% | 3.70 | |
Total | 23,829,380 | 401 | 100.0% | $ 99,672,902 | 100.0% | $ 4.18 |
Leased Square Feet and Annualized Base Rent by Building Type |
Building Type | Total Leased Square Feet | # of Buildings | % Leased Square Feet | ABR1 | % ABR | ABR Per Square Foot | |
Warehouse/Distribution | 14,969,846 | 73 | 62.8% | $ 54,291,548 | 54.5% | $ 3.63 | |
Warehouse/Light Manufacturing | 6,079,878 | 29 | 25.5% | 25,037,033 | 25.1% | 4.12 | |
Small Bay Industrial2 | 2,779,656 | 45 | 11.7% | 20,344,321 | 20.4% | 7.32 | |
Total | 23,829,380 | 147 | 100.0% | $ 99,672,902 | 100.0% | $ 4.18 | |
1) | Annualized base rent is calculated as monthly contracted base rent as of June 30, 2021, multiplied by 12. Excludes rent abatements. | |
2) | Small bay industrial is inclusive of flex space totaling 366,366 leased square feet and annualized base rent of $5,015,951. Small bay industrial is multipurpose space; flex space includes office space that accounts for greater than 50% of the total rentable area. |
Page 17
Plymouth Industrial REIT, Inc. |
Top 10 Tenants by Annualized Base Rent |
Unaudited as of 06/30/2021 |
Tenant | Market | Industry | # of Leases | Total Leased Square Feet | Expiration | ABR Per Square Foot | ABR1 | % Total ABR | |
Archway Marketing Holdings, Inc. | Chicago | Logistics & Transportation | 3 | 503,000 | 3/31/2026 | $ 4.30 | $ 2,164,500 | 2.2% | |
ODW Logistics, Inc. | Columbus | Logistics & Transportation | 1 | 772,450 | 6/30/2025 | 2.80 | 2,162,860 | 2.2% | |
Balta US, Inc. | Jacksonville | Home & Garden | 2 | 629,084 | 12/31/2028 | 3.02 | 1,898,956 | 1.9% | |
Communications Test Design, Inc. | Memphis | Logistics & Transportation | 2 | 566,281 | 12/31/2024 | 3.21 | 1,819,461 | 1.8% | |
Pactiv Corporation | Chicago | Food & Beverage | 3 | 439,631 | 8/31/2023 | 3.86 | 1,696,552 | 1.7% | |
ASC Manufacturing, Ltd. | Cleveland | Light Manufacturing | 1 | 274,464 | 6/30/2022 | 6.08 | 1,667,508 | 1.7% | |
ASW Supply Chain Services, LLC | Cleveland | Logistics & Transportation | 4 | 532,437 | 11/30/2027 | 3.10 | 1,650,555 | 1.7% | |
First Logistics | Chicago | Logistics & Transportation | 1 | 327,194 | 10/31/2024 | 4.95 | 1,619,610 | 1.6% | |
JobsOhio Beverage System | Cleveland | Food & Beverage | 1 | 350,000 | 3/31/2024 | 4.26 | 1,491,000 | 1.5% | |
American Plastics, LLC | Cleveland | Plastics | 1 | 405,000 | 12/31/2028 | 3.67 | 1,485,342 | 1.5% | |
Total Largest Tenants by Annualized Rent | 19 | 4,799,541 | $ 3.68 | $ 17,656,344 | 17.8% | ||||
All Other Tenants | 382 | 19,029,839 | $ 4.31 | $ 82,016,558 | 82.2% | ||||
Total Company Portfolio | 401 | 23,829,380 | $ 4.18 | $ 99,672,902 | 100.0% |
Lease Segmentation by Size |
Square Feet | # of Leases | Total Leased Square Feet | Total Rentable Square Feet | Total Leased % | Total Leased % Excluding Repositioning2 | ABR1 | In-Place + Uncommenced ABR3 | % of Total In-Place + Uncommenced ABR | In-Place + Uncommenced ABR Per SF4 |
< 4,999 | 61 | 148,216 | 195,665 | 81.4% | 75.9% | $ 1,635,621 | $ 1,715,221 | 1.7% | $ 11.16 |
5,000 - 9,999 | 59 | 431,929 | 570,006 | 79.4% | 81.9% | 3,345,394 | 3,375,940 | 3.4% | 7.72 |
10,000 - 24,999 | 83 | 1,378,917 | 1,530,611 | 90.8% | 93.3% | 9,441,501 | 9,683,960 | 9.7% | 6.73 |
25,000 - 49,999 | 75 | 2,630,914 | 2,727,757 | 96.4% | 95.9% | 14,487,448 | 14,487,448 | 14.5% | 5.51 |
50,000 - 99,999 | 58 | 3,971,839 | 4,178,698 | 100.0% | 94.6% | 17,928,365 | 17,928,365 | 17.9% | 4.51 |
100,000 - 249,999 | 43 | 7,432,344 | 7,432,344 | 100.0% | 100.0% | 27,466,528 | 27,466,528 | 27.5% | 3.70 |
> 250,000 | 22 | 7,835,221 | 8,141,773 | 100.0% | 100.0% | 25,368,045 | 25,368,045 | 25.3% | 3.24 |
Total / Weighted Average | 401 | 23,829,380 | 24,776,854 | 96.2% | 98.4% | $ 99,672,902 | $100,025,507 | 100.0% | $ 4.19 |
1) | Annualized base rent is calculated as monthly contracted base rent as of June 30, 2021, multiplied by 12. Excludes rent abatements. | ||||
2) | Total Leased % Excluding Repositioning excludes vacant square footage being refurbished or repositioned. | ||||
3) | In-Place + Uncommenced ABR calculated as in-place current annualized base rent as of June 30, 2021 plus annualized base rent for leases signed but not commenced as of June 30, 2021. | ||||
4) | In-Place + Uncommenced ABR per SF is calculated as in-place current rent annualized base rent as of June 30, 2021 plus annualized base rent for leases signed but not commenced as of June 30, 2021, divided by leased square feet plus uncommenced leased square feet. | ||||
Page 18
Plymouth Industrial REIT, Inc. |
Rentable Square Feet and Annualized Base Rent by Market |
Unaudited ($ in thousands) as of 06/30/2021 |
Primary Markets1 |
Total Rentable | % Rentable | |||||||
# of Properties | # of Buildings | Occupancy | Square Feet | Square Feet | ABR2 | % ABR | ||
Atlanta | 8 | 9 | 99.2% | 1,318,002 | 5.3% | $ 5,235 | 5.3% | |
Chicago | 37 | 38 | 92.0% | 6,078,434 | 24.6% | 23,948 | 24.1% |
Secondary Markets1 |
# of Properties | # of Buildings | Occupancy | Square Feet | Square Feet | ABR2 | % ABR | ||
Boston | 1 | 1 | 100.0% | 200,625 | 0.8% | $ 1,141 | 1.1% | |
Cincinnati | 8 | 8 | 92.3% | 2,060,310 | 8.3% | 7,058 | 7.1% | |
Cleveland | 14 | 17 | 98.4% | 3,681,390 | 14.9% | 15,632 | 15.7% | |
Columbus | 10 | 10 | 99.3% | 2,724,173 | 11.0% | 8,904 | 8.9% | |
Indianapolis | 14 | 14 | 97.6% | 3,468,401 | 14.0% | 12,281 | 12.3% | |
Jacksonville | 7 | 24 | 99.7% | 1,966,154 | 7.9% | 12,782 | 12.8% | |
Kansas City | 1 | 1 | 100.0% | 221,911 | 0.9% | 789 | 0.8% | |
Memphis | 6 | 16 | 93.5% | 1,848,559 | 7.5% | 6,597 | 6.6% | |
Philadelphia | 1 | 1 | 99.8% | 156,634 | 0.6% | 939 | 0.9% | |
St. Louis | 6 | 8 | 99.7% | 1,052,261 | 4.2% | 4,366 | 4.4% | |
Total | 113 | 147 | 96.2% | 24,776,854 | 100.0% | $ 99,672 | 100.0% |
Total Acquisition Cost by Market |
Market | State | # of Buildings | Total Acquisition Cost3 | Gross Real Estate Assets4 | % Gross Real Estate Assets | |
Atlanta | GA | 9 | $ 62,931 | $ 55,067 | 5.8% | |
Chicago | IL, IN, WI | 38 | 232,676 | 224,308 | 23.5% | |
Boston | MA, ME | 1 | 10,500 | 9,270 | 1.0% | |
Cincinnati | OH, KY | 8 | 68,457 | 60,471 | 6.4% | |
Cleveland | OH | 17 | 176,250 | 164,925 | 17.2% | |
Columbus | OH | 10 | 101,643 | 98,764 | 10.4% | |
Indianapolis | IN | 14 | 104,740 | 93,601 | 9.8% | |
Jacksonville | FL, GA | 24 | 135,650 | 123,431 | 13.0% | |
Kansas City | MO | 1 | 8,600 | 8,114 | 0.9% | |
Memphis | TN | 16 | 58,725 | 54,038 | 5.7% | |
Philadelphia | PA, NJ | 1 | 9,700 | 8,657 | 0.9% | |
St. Louis | MO | 8 | 56,237 | 51,590 | 5.4% | |
Total | 147 | $ 1,026,109 | $ 952,236 | 100.0% | ||
1) | Primary markets means the following two metropolitan areas in the U.S., each generally consisting of more than 300 million square feet of industrial space: Chicago and Atlanta. Secondary markets means non-primary markets, each generally consisting of between 100 million and 300 million square feet of industrial space, including the following metropolitan areas in the U.S.: Boston, Cincinnati, Cleveland, Columbus, Indianapolis, Jacksonville, Kansas City, Memphis, Milwaukee, Philadelphia, South Florida, and St. Louis. Our definitions of primary and secondary markets may vary from the definitions of these terms used by investors, analysts, or other industrial REITs. |
2) | Annualized base rent is calculated as monthly contracted base rent as of June 30, 2021, multiplied by 12. Excludes rent abatements. |
3) | Represents total direct consideration paid prior to the allocations per U.S. GAAP. |
4) | The gross book value of real estate assets as of June 30, 2021 excluding $7,473 in leasehold improvements and assets related to Corporate activities and the finance lease right-of-use asset of $911 related to the ground sublease at 2100 International Parkway. Gross book value of real estate assets excludes depreciation and the allocation of the acquisition cost related to intangible assets and liabilities required by U.S. GAAP. |
Page 19
Plymouth Industrial REIT, Inc. |
Glossary |
This glossary contains additional details for sections throughout this Supplemental Information, including explanations and reconciliations of certain non-GAAP financial measures, and the reasons why we use these supplemental measures of performance and believe they provide useful information to investors. Additional detail can be found in our most recent annual report on Form 10-K and subsequent quarterly reports on Form 10-Q, as well as other documents filed with or furnished to the SEC from time to time. |
Non-GAAP Financial Measures Definitions: |
Net Operating Income (NOI): We consider net operating income, or NOI, to be an appropriate supplemental measure to net income in that it helps both investors and management understand the core operations of our properties. We define NOI as total revenue (including rental revenue and tenant reimbursements) less property-level operating expenses. NOI excludes depreciation and amortization, general and administrative expenses, impairments, gain/loss on sale of real estate, interest expense, and other non-operating items. |
Cash Net Operating Income - (Cash NOI): We define Cash NOI as NOI excluding straight-line rent adjustments and amortization of above and below market leases. |
EBITDAre and Adjusted EBITDA: We define earnings before interest, taxes, depreciation and amortization for real estate in accordance with the standards established by the National Association of Real Estate Investment Trusts (“NAREIT”). EBITDAre represents net income (loss), computed in accordance with GAAP, before interest expense, tax, depreciation and amortization, gains or losses on the sale of rental property, and loss on impairments. We calculate Adjusted EBITDA by adding or subtracting from EBITDAre the following items: (i) non-cash stock compensation, (ii) gain (loss) on extinguishment of debt, (iii) acquisition expenses (iv) the proforma impacts of acquisition and dispositions and (v) non-cash impairments on real estate lease. We believe that EBITDAre and Adjusted EBITDA are helpful to investors as supplemental measures of our operating performance as a real estate company as they are direct measures of the actual operating results of our industrial properties. EBITDAre and Adjusted EBITDA should not be used as measures of our liquidity and may not be comparable to how other REITs' calculate EBITDAre and Adjusted EBITDA. |
Funds From Operations ("FFO"): Funds from operations, or FFO, is a non-GAAP financial measure that is widely recognized as a measure of REIT operating performance. We consider FFO to be an appropriate supplemental measure of our operating performance as it is based on a net income analysis of property portfolio performance that excludes non-cash items such as depreciation. The historical accounting convention used for real estate assets requires straight-line depreciation of buildings and improvements, which implies that the value of real estate assets diminishes predictably over time. Since real estate values rise and fall with market conditions, presentations of operating results for a REIT using historical accounting for depreciation could be less informative. In December 2018, NAREIT issued a white paper restating the definition of FFO. The purpose of the restatement was not to change the fundamental definition of FFO, but to clarify existing NAREIT guidance. The restated definition of FFO is as follows: Net Income (calculated in accordance with GAAP), excluding: (i) Depreciation and amortization related to real estate, (ii) Gains and losses from the sale of certain real estate assets, (iii) Gain and losses from change in control, and (iv) Impairment write-downs of certain real estate assets and investments in entities when the impairment is directly attributable to decreases in the value of depreciable real estate held by the entity. We define FFO consistent with the NAREIT definition. Adjustments for unconsolidated partnerships and joint ventures will be calculated to reflect FFO on the same basis. Other equity REITs may not calculate FFO as we do, and accordingly, our FFO may not be comparable to such other REITs’ FFO. FFO should not be used as a measure of our liquidity, and is not indicative of funds available for our cash needs, including our ability to pay dividends. |
Core Funds from Operations (“Core FFO”): Core FFO represents FFO reduced by dividends paid (or declared) to holders of our preferred stock and excludes certain non-cash operating expenses such as impairment on real estate lease, unrealized appreciation/(depreciation) of warrants and loss on extinguishment of debt. As with FFO, our reported Core FFO may not be comparable to other REITs’ Core FFO, should not be used as a measure of our liquidity, and is not indicative of our funds available for our cash needs, including our ability to pay dividends. |
Adjusted Funds from Operations attributable to common stockholders (“AFFO”): Adjusted funds from operations, or AFFO, is presented in addition to Core FFO. AFFO is defined as Core FFO, excluding certain non-cash operating revenues and expenses, acquisition and transaction related costs for transactions not completed and recurring capitalized expenditures. Recurring capitalized expenditures include expenditures required to maintain and re-tenant our properties, tenant improvements and leasing commissions. AFFO further adjusts Core FFO for certain other non-cash items, including the amortization or accretion of above or below market rents included in revenues, straight line rent adjustments, non-cash equity compensation and non-cash interest expense. We believe AFFO provides a useful supplemental measure of our operating performance because it provides a consistent comparison of our operating performance across time periods that is comparable for each type of real estate investment and is consistent with management’s analysis of the operating performance of our properties. As a result, we believe that the use of AFFO, together with the required GAAP presentations, provide a more complete understanding of our operating performance. As a result, we believe that the use of AFFO, together with the required GAAP presentations, provide a more complete understanding of our operating performance. As with Core FFO, our reported AFFO may not be comparable to other REITs’ AFFO, should not be used as a measure of our liquidity, and is not indicative of our funds available for our cash needs, including our ability to pay dividends. |
Net Debt and Preferred stock to Adjusted EBITDA: Net debt and preferred stock to Adjusted EBITDA is a non-GAAP financial measure that we believe is useful to investors as a supplemental measure in evaluating balance sheet leverage. Net debt and preferred stock is equal to the sum of total consolidated and our pro rata share of unconsolidated joint venture debt less cash, cash equivalents, and restricted cash, plus preferred stock calculated at its liquidation preference as of the end of the period. |
Page 20
Plymouth Industrial REIT, Inc. |
Glossary |
This glossary contains additional details for sections throughout this Supplemental Information, including explanations and reconciliations of certain non-GAAP financial measures, and the reasons why we use these supplemental measures of performance and believe they provide useful information to investors. Additional detail can be found in our most recent annual report on Form 10-K and subsequent quarterly reports on Form 10-Q, as well as other documents filed with or furnished to the SEC from time to time. |
Other Definitions: |
GAAP: U.S. generally accepted accounting principles. |
Gross Assets: The carrying amount of total assets plus accumulated depreciation and amortization, as reported in the Company’s consolidated financial statements. For gross assets as of June 30, 2021 the calculation is as follows: |
Total assets | $ 969,828 | |
Add back accumulated depreciation | 118,523 | |
Add back intangible amortization | 61,308 | |
Gross assets | $ 1,149,659 |
Joint Venture Financial Information: We present components of balance sheet and operating results information related to our real estate joint venture, which are not presented, or intended to be presented, in accordance with GAAP. We present the proportionate share of certain financial line items by applying our noncontrolling economic interest ownership percentage to each financial item to arrive at the amount of such cumulative noncontrolling interest share of each component presented. In addition, we present components of balance sheet and portfolio information at 100% of the joint venture. We believe this information can help investors estimate the balance sheet and operating results information related to our unconsolidated joint venture. Presenting this information provides a perspective not immediately available from consolidated financial statements and one that can supplement an understanding of the joint venture assets, liabilities, revenues, and expenses included in our consolidated results. Joint venture financial information should not be considered an alternative to our consolidated financial statements, which are prepared in accordance with GAAP. |
Lease Type: We define our triple net leases in that the tenant is responsible for all aspects of and costs related to the property and its operation during the lease term. We define our modified net leases in that the landlord is responsible for some property related expenses during the lease term, but the cost of most of the expenses is passed through to the tenant. We define our gross leases in that the landlord is responsible for all aspects of and costs related to the property and its operation during the lease term. |
Non-Recurring Capital Expenditures: Non-recurring capital expenditures include capital expenditures of long lived improvements required to upgrade/replace existing systems or items that previously did not exist. Non-recurring capital expenditures also include costs associated with repositioning a property, redevelopment/development and capital improvements known at the time of acquisition. |
Occupancy: We define occupancy as the percentage of total leasable square footage as the earlier of lease term commencement or revenue recognition in accordance to GAAP as of the close of the reporting period. |
Preferred Stock - Series B: On December 14, 2018, we completed the offering of 4,411,764 shares of the Company’s Series B Convertible Redeemable Preferred Stock at a purchase price of $17.00 per share for an aggregate consideration of $75,000 or $71,800, net of issuance costs. The relevant features of the Series B Preferred Stock ("Series B") are as follows ($ in thousands): |
Year | Cash Pay Rate | Annual Cash Dividend |
Liquidation Preference1 |
Conversion and Redemption Options2 | ||||
1 - 2019 | 3.25% | $ 2,438 | $ 97,230 | No conversion or redemption options | ||||
2 - 2020 | 3.50% | $ 2,625 | $ 97,230 | No conversion or redemption options | ||||
3 - 2021 | 3.75% | $ 2,813 | $ 97,230 | No conversion or redemption options | ||||
4 - 2022 | 4.00% | $ 3,000 | $ 97,230 | - Commencing 1/1/2022, holders of the Series B have the
right to convert at the liquidation preference; - Commencing 1/1/2022, Plymouth can elect to convert up to 100% of Series B upon the 20-day VWAP per share of Plymouth's common stock being greater than $26.35; - Neither option expires | ||||
5 - 2023 | 6.50% | $ 4,875 | $ 105,971 | Commencing 1/1/2023, Plymouth can redeem up to 50% of the Series B at the liquidation preference | ||||
6 - 20243 | 12.00% | $ 9,000 | $ 114,028 | - Commencing 1/1/2024,
Plymouth can redeem up to 100% of the Series B at the liquidation preference; - Commencing 12/31/2024, any outstanding shares of Series B will automatically covert into common stock, subject to the 19.99% threshold4 |
1) | Liquidation Preference is defined as the greater of (a) the amount necessary for the holder to achieve a 12% internal rate of return, taking into account cash dividends paid and (b) $21.89, plus accrued and unpaid dividends. |
2) | Conversion and Redemption Options grant Plymouth the right to settle the conversion/redemption via: I) Physical Settlement with each share of Series B being converted to a number of common shares equal to the greater of (i) one share of common stock or (ii) the quotient of the liquidation preference divided by the 20-Day VWAP, subject to the 19.99% threshold, or II) Cash Settlement whereby we pay for each share of Series B being converted in cash in an amount equal to the greater of (i) the liquidation preference or (ii) the 20-Day VWAP, or III) Combination Settlement whereby Plymouth shall pay, or deliver, in respect to each share of Series B being converted, a settlement amount equal to either (i) cash equal to the Cash Settlement amount or (ii) number of shares of common stock equal to the Physical Settlement. |
3) | Effective 1/1/2025, in the event the Series B Preferred Stock has not been settled, the holders obtain certain governance rights, including the option to elect an additional two members to Plymouth's Board of Directors. |
4) | The 19.99% Threshold requires approval from the shareholders of Plymouth's common stock to approve the conversion of any Series B Preferred Stock into common shares that exceeds 19.99% of the outstanding common shares as of December 14, 2018. |
Recurring Capital Expenditures: Recurring capitalized expenditures includes capital expenditures required to maintain and re-tenant our buildings, tenant improvements and leasing commissions. |
Replacement Cost: is based on the Marshall & Swift valuation methodology for the determination of building costs. The Marshall & Swift building cost data and analysis is widely recognized within the U.S. legal system and has been written into in law in over 30 U.S. states and recognized in the U.S. Treasury Department Internal Revenue Service Publication. Replacement cost includes land reflected at the allocated cost in accordance with Financial Accounting Standards Board ("FASB") ASC 805. |
Same Store Portfolio: The Same Store Portfolio is a subset of the consolidated portfolio and includes properties that are wholly owned by the Company as of December 31, 2019. The Same Store Portfolio is evaluated and defined on an annual basis based on the growth and size of the consolidated portfolio. The Same Store Portfolio excludes properties that were or will be classified as repositioning or lease-up during 2020 and 2021. For 2021, the Same Store Portfolio consists of 81 properties aggregating 17,093,547 rentable square feet. Properties that are being repositioned generally are defined as those properties where a significant amount of space is held vacant in order to implement capital improvements that enhance the functionality, rental cash flows, and value of that property. We define a significant amount of space at a property using both the size of the space and its proportion to the properties total square footage as a determinate. Our computation of same store NOI may not be comparable to other REITs. |
VWAP: The volume weighted average price of a trading security. |
Weighted Average Lease Term Remaining: The average contractual lease term remaining as of the close of the reporting period (in years) weighted by square footage. |
Page 21
7!E96YU;0 I%4VQI8V54>7!E $EM9R &8F]U;F1S
M3V)J8P $ !28W0Q ! !4;W @;&]N9P 3&5F
M=&QO;F< $)T;VUL;VYG %D0 !29VAT;&]N9P "!P #
M=7)L5$585 $ !N=6QL5$585 $ !-7=WU7N3M;Z6M_I#W]M_EGO?]5N5Z?\DVU_[)XO\ H#K0YHYI
MK_R4KK_LHE_Z#ZP#O3O.W_,X^UC;Z_\ &1=W#_X\Y]T_JKRS_P!&ZU_[)XO^
M@.G_ .M?,O\ T<;K_G/+_P!!]8V[T[Q_'F;_H/KO\ V8'OK_G^';H_\J5O3_ZM]Z/)_+!_Y9=K_P!D\/\ T!U[
M^N_,7_1VN_\ LHF_Z#ZZ_P!F#[Y )/>';W'T'^DK>G/_ *N^]?U/Y7_Z-=K_
M -D\/_0'6QSQS#Y[M=_]E$W_ $'UV?D#WW?CN_MVUKW_ -)>\_\ ZM]^/*'*
MPX[9:#_J'A_Z ZNG.?,TII'NEV?^HB;_ *#ZX?[,#W[^.\.WOU W_P!)>\^!
M?E;?>^]?U1Y5_P"C9:?]D\/_ $!T[_6SFO\ Z.=W_P!E,W_0?7(?('OO\]W]
MO_G_ )J5O3\F_P#RN^_?U2Y5_P"C9:?]DT/_ $!U[^MG-?\ T<[O_LHF_P"@
M^N_]F"[Z M_IO[>^G_/RMY__ %;[W_5+E0?\LRT_[)X?^@.O'FWFH"G[SN_^
MRB;_ *#ZPGY =_:KCN_N BW('9>\Q_O)KO;B] U?\ *5/ZC_AG7,?('OV]O].';^D\7_TE;S_^K?;?]4>4O^C7:?\ 9-#_
M - =+OZZ
\EC+_/K&!;4Z:TP.N:4I>P52WC7DGGF
MWT/O32A#UM+0S+7TZX_9/95LVIBQ/Y ^MOI[LL^*GIE[%@0.NFHI +,6/'%@
M;#WL7"]5>Q?0:^AZ\*72H!_/U)_H>#[\\@LST=TO93<