UNITED STATES
SECURITIES AND EXCHANGE
COMMISSION
Washington, D.C. 20549
FORM 40-F
[ ] Registration statement pursuant to Section 12 of the Securities Exchange Act of 1934 or
[X] Annual report pursuant to Section 13(a) or 15(d) of the Securities Exchange Act of 1934
For the fiscal year ended October 31, 2011 | Commission File Number 001-32345 |
Cardero Resource
Corp.
(Exact name of Registrant as specified in its
charter)
British Columbia, Canada | Not Applicable | |
(Province or Other Jurisdiction of | 1221 | (I.R.S. Employer |
Incorporation or Organization) | (Primary Standard Industrial Classification | Identification No.) |
Code No.) |
#2300 1177 West Hastings
Street
Vancouver, British Columbia, V6E 2K3
(604)
408-7488
(Address and telephone number of Registrants principal
executive offices)
DL Services Inc.
Columbia Center, 701 Fifth Avenue,
Suite 6100
Seattle, WA 98104-7043
(206) 903-5448
(Name,
address (including zip code) and telephone number (including
area code) of
agent for service in the United States)
Securities registered or to be registered pursuant to Section 12(b) of the Act:
Title of Each Class: | Name of Each Exchange On Which Registered: |
Common Shares, no par value | NYSE Amex LLC |
Securities registered or to be registered pursuant to Section 12(g) of the Act: None
Securities for which there is a reporting obligation pursuant to Section 15(d) of the Act: None
For annual reports, indicate by check mark the information filed with this form:
[X] Annual Information Form | [X] Audited Annual Financial Statements |
At October 31, 2011, the Registrant had outstanding
83,054,104 common shares without par value.
Indicate by check mark whether the Registrant (1) has filed all
reports required to be filed by Section 13 or 15(d) of the Exchange Act during
the preceding 12 months (or for such shorter period that the Registrant was
required to file such reports) and (2) has been subject to such filing
requirements for the past 90 days.
[X] Yes [ ] No
Indicate by check mark whether the Registrant has submitted
electronically and posted on its corporate Web site, if any, every Interactive
Data File required to be submitted and posted pursuant to Rule 405 of Regulation
S-T (§232.405 of this chapter) during the preceding 12 months (or for such
shorter period that the Registrant was required to submit and post such files).
[ ] Yes [
] No
DOCUMENTS INCORPORATED BY REFERENCE
The Annual Information Form (“AIF”) of Cardero Resource Corp. (the “Registrant” or the “Company”) for the fiscal year ended October 31, 2011 is incorporated herein by reference.
The audited consolidated financial statements of the Company for the years ended October 31, 2011 and 2010, including the report of the auditors with respect thereto, are incorporated herein by reference. For a reconciliation of important differences between Canadian generally accepted accounting principles (“Canadian GAAP”) and United States generally accepted accounting principles (“U.S. GAAP”), see Note 15 to the Company’s audited consolidated financial statements.
The Company’s management’s discussion and analysis (“MD&A”) for the year ended October 31, 2011 is incorporated herein by reference.
EXPLANATORY NOTE
The Company is a Canadian issuer eligible to file its annual report pursuant to Section 13 of the Securities Exchange Act of 1934, as amended (the “Exchange Act”) on Form 40-F. The Company is a “foreign private issuer” as defined in Rule 3b-4 under the Exchange Act. Accordingly, the Company’s equity securities are exempt from Sections 14(a), 14(b), 14(c), 14(f) and 16 of the Exchange Act pursuant to Rule 3a12-3.
The Company is permitted, under a multi-jurisdictional disclosure system adopted by the United States, to prepare this annual report on Form 40-F in accordance with Canadian disclosure requirements, which are different from those of the United States.
The Company has prepared the financial statements included in this annual report in accordance with Canadian GAAP, and is subject to Canadian auditing and auditor independence standards. Accordingly, the financial statements of the Company included in this report may not be comparable to financial statements of United States companies. Significant differences between Canadian GAAP and U.S. GAAP are described in Note 15 to the audited consolidated financial statements of the Company included in this report.
Unless otherwise indicated, all dollar amounts are reported in Canadian dollars.
FORWARD LOOKING STATEMENTS
This report contains forward-looking statements concerning anticipated developments in the operations of the Company in future periods, planned exploration and development activities, the adequacy of the Company’s financial resources and other events or conditions that may occur in the future. Forward-looking statements are frequently, but not always, identified by words such as “expects,” “anticipates,” “believes,” “intends,” “estimates,” “potential,” “possible” and similar expressions, or statements that events, conditions or results “will,” “may,” “could” or “should” occur or be achieved. Information concerning the interpretation of drill results and mineral resource estimates also may be deemed to be forward-looking statements, as such information constitutes a prediction of what mineralization might be found to be present if and when a project is actually developed. Forward-looking statements are statements about the future and are inherently uncertain, and actual achievements of the Company or other future events or conditions may differ materially from those reflected in the forward-looking statements due to a variety of risks, uncertainties and other factors, including, without limitation, those described in the AIF.
The Company’s forward-looking statements are based on the beliefs, expectations and opinions of management on the date the statements are made and the Company assumes no obligation to update such forward-looking statements in the future. For the reasons set forth above, investors should not place undue reliance on forward-looking statements.
DISCLOSURE CONTROLS AND PROCEDURES
The information provided under the heading “Evaluation of Disclosure Controls and Procedures” (page 55) contained in the MD&A is incorporated by reference herein.
MANAGEMENTS REPORT ON INTERNAL CONTROL OVER FINANCIAL REPORTING
The information provided under the heading “Management’s Report On Internal Control Over Financial Reporting” contained at the beginning of the Company’s audited consolidated financial statements is incorporated by reference herein.
ATTESTATION REPORT OF THE REGISTERED PUBLIC ACCOUNTING FIRM
The information provided under the heading “Report of Independent Registered Public Accounting Firm to the Shareholders of Cardero Resource Corp. (an Exploration Stage Company)” contained at the beginning of the Company’s audited consolidated financial statements is incorporated by reference herein.
CHANGES IN INTERNAL CONTROL OVER FINANCIAL REPORTING
The information provided under the heading “Changes In Internal Control Over Financial Reporting” (page 56) contained in the MD&A is incorporated by reference herein.
DIRECTOR INDEPENDENCE
The Company’s Board of Directors consists of the following individuals: Hendrik Van Alphen, Lawrence W. Talbot, Leonard Harris, Murray Hitzman and Stephan Fitch. The Company’s Board of Directors has determined that Messrs. Harris, Hitzman and Fitch are “independent” under the criteria established by NYSE Amex.
AUDIT COMMITTEE IDENTIFICATION AND FINANCIAL EXPERT
The information provided in Schedule “A” to the AIF is incorporated by reference herein. The Company’s Board of Directors has determined that Stephan Fitch, a member of the Audit Committee, is an “audit committee financial expert” within the meaning of the Commission’s rules. Mr. Fitch is “independent” under the criteria established by NYSE Amex.
CODE OF ETHICS
The Company has adopted a code of ethics that applies to its principal executive officer, principal financial officer, principal accounting officer or controller and persons performing similar functions. A copy of the Company’s code of ethics has been posted on the Company’s Internet website at www.cardero.com. No substantive amendments were made to the Company’s code of ethics during the fiscal year ended October 31, 2011 and no waivers of the Company’s code of ethics were granted to any principal officer of the Company or any person performing similar functions during the fiscal year ended October 31, 2011.
PRINCIPAL ACCOUNTANT FEES AND SERVICES
The information provided under the headings “Pre-Approval Policies and Procedures” (page 12) and “External Auditor Service Fees (By Category)” (page 12) contained in Schedule “A” to the AIF is incorporated by reference herein.
OFF-BALANCE SHEET ARRANGEMENTS
The Company does not have any off-balance sheet arrangements.
TABULAR DISCLOSURE OF CONTRACTUAL OBLIGATIONS
The following table presents, as at October 31, 2011, the Company’s known contractual obligations, aggregated by type of contractual obligation as set forth below:
Payments Due by Period(2) | |||||
Contractual obligations |
Total |
Less than 1 Year |
1-3 Years |
3-5 Years |
More than 5 Years |
Operating lease obligations (1) |
7,380,654 |
692,389 |
2,154,153 |
2,226,206 |
2,307,906 |
Total contractual obligations |
$ 7,380,654 |
$ 692,389 |
$ 2,154,153 |
$ 2,226,206 |
$ 2,307,906 |
(1) |
Obligations in respect of office and facilities leases. |
MINE SAFETY DISCLOSURE
Not applicable.
UNDERTAKINGS
The Company undertakes to make available, in person or by telephone, representatives to respond to inquiries made by the Commission staff, and to furnish promptly, when requested to do so by the Commission staff, information relating to: the securities registered pursuant to Form 40-F; the securities in relation to which the obligation to file an annual report on Form 40-F arises; or transactions in said securities.
CONSENT TO SERVICE OF PROCESS
The Company has previously filed with the Commission a written consent to service of process and power of attorney on Form F-X. Any change to the name or address of the Companys agent for service shall be communicated promptly to the Commission by amendment to the Form F-X referencing the file number of the Company.
SIGNATURES
Pursuant to the requirements of the Exchange Act, the Registrant certifies that it meets all of the requirements for filing on Form 40-F and has duly caused this annual report to be signed on its behalf by the undersigned, thereto duly authorized.
CARDERO RESOURCE CORP. | |
/s/ Michael Hunter | |
Michael Hunter | |
President and Chief Executive Officer |
Date: January 30, 2012
EXHIBIT INDEX
The following documents are being filed with the Commission as exhibits to this annual report on Form 40-F.
(1) |
Incorporated by reference to the Form 6-K furnished by the Company on August 24, 2011. |
(2) |
Incorporated by reference to the Form 6-K furnished by the Company on January 11, 2012. |
ANNUAL INFORMATION FORM
FOR THE FISCAL YEAR ENDED
OCTOBER 31, 2011

Suite 2300 1177 West Hastings Street
Vancouver, British
Columbia
V6E 2K3
January 26, 2012
ITEM 2 - TABLE OF CONTENTS
i
TABLE OF CONTENTS
(continued)
Page | ||
ITEM 15: | NAMES AND INTERESTS OF EXPERTS | 63 |
Names and Interests of Experts | 63 | |
ITEM 16: | ADDITIONAL INFORMATION | 64 |
Audit Committee Information | 64 | |
Additional Information | 64 | |
SCHEDULE A AUDIT COMMITTEE INFORMATION |
ii
PRELIMINARY NOTES
Documents Incorporated by Reference
Incorporated by reference into this Annual Information Form (AIF) are the following documents:
(a) |
Consolidated Audited Financial Statements of the Company for the year ended October 31, 2011; | |
(b) |
Management Discussion and Analysis of the Company for the year ended October 31, 2011 dated January 26, 2012 (MD&A); | |
(c) |
Management Information Circular dated August 11, 2011 in respect of the 2011 Annual General Meeting (Information Circular); | |
(d) |
Technical report dated December 6, 2011 entitled Technical Report, Carbon Creek Coal Property, British Columbia, Canada prepared by Norwest Corporation (the Carbon Creek Report); | |
(e) |
Technical report dated January 18, 2012 entitled Technical Report, Sheini Hills Iron Project, Ghana, Africa prepared by Keith J. Henderson, EurGeol (the Sheini Report); | |
(f) |
Technical report dated January 27, 2012, effective January 19, 2012, entitled Technical Report on the Longnose Ilmenite Project, Minnesota, USA prepared by SRK Consulting (Canada) Inc. (the Longnose Report); and | |
(g) |
Technical report dated January 27, 2012, effective January 19, 2012, entitled Technical Report on the Titac Ilmenite Exploration Project, Minnesota, USA prepared by SRK Consulting (Canada) Inc. (the Titac Report); |
copies of which may be obtained online from SEDAR at www.sedar.com.
All financial information in this AIF is prepared in accordance with generally accepted accounting principles in Canada.
Date of Information
All information in this AIF is as of October 31, 2011 unless otherwise indicated.
Currency and Exchange Rates
All dollar amounts in this AIF are expressed in Canadian dollars unless otherwise indicated. The Companys accounts are maintained in Canadian dollars and the Companys financial statements are prepared in accordance with generally accepted accounting principles in Canada. All references to U.S. dollars, USD or to US$ are to U.S. dollars, to MXP are to Mexican pesos, to ARS are to Argentinean pesos and to PEN are to Peruvian nuevo soles.
The following table sets forth the rate of exchange for the Canadian dollar, expressed in United States dollars in effect at the end of the periods indicated, the average of exchange rates in effect on the last day of each month during such periods, and the high and low exchange rates during such periods based on the noon rate of exchange as reported by the Bank of Canada for conversion of Canadian dollars into United States dollars.
- 4 -
Year Ended October 31 | |||
Canadian Dollars to U.S. Dollars | 2011 | 2010 | 2009 |
Rate at end of period | USD 1.0065 | USD 0.9784 | USD 0.9282 |
Average rate for period | USD 1.0139 | USD 0.9636 | USD 0.8552 |
High for period | USD 1.0583 | USD 1.0039 | USD 0.9716 |
Low for period | USD 0.9430 | USD 0.9278 | USD 0.7692 |
Metric Equivalents
For ease of reference, the following factors for converting Imperial measurements into metric equivalents are provided:
To convert from Imperial | To metric | Multiply by |
Acres | Hectares | 0.404686 |
Feet | Metres | 0.30480 |
Miles | Kilometres | 1.609344 |
Tons | Tonnes | 0.907185 |
Ounces (troy)/ton | Grams/Tonne | 34.2857 |
1 mile = 1.609 kilometres | 2000 pounds (1 short ton) = 0.907 tonnes |
1 acre = 0.405 hectares | 1 ounce (troy) = 31.103 grams |
2,204.62 pounds = 1 metric ton = 1 tonne | 1 ounce (troy)/ton = 34.2857 grams/tonne |
Terms used and not defined in this AIF that are defined in National Instrument 51-102 Continuous Disclosure Obligations shall bear that definition. Other definitions are set out in National Instrument 14-101 Definitions.
Forward-Looking Statements
This AIF contains forward-looking statements and forward-looking information (collectively, forward-looking statements) within the meaning of applicable Canadian and US securities legislation. These statements relate to future events or the future activities or performance of the Company. All statements, other than statements of historical fact, are forward-looking statements. Information concerning mineral resource estimates also may be deemed to be forward-looking statements in that it reflects a prediction of the mineralization that would be encountered if a mineral deposit were developed and mined. Forward-looking statements are typically identified by words such as: believe, expect, anticipate, intend, estimate, postulate, plans and similar expressions, or which by their nature refer to future events. These forward-looking statements include, but are not limited to, statements concerning:
the Companys strategies and objectives, both generally and specifically in respect of the Carbon Creek property, the Sheini iron ore properties, and the Minnesota Iron/Titanium properties;
the ability of the Company to convert portions of the existing resource at the Carbon Creek property into the Measured & Indicated categories;
the ability of the Company to increase the global resource at the Carbon Creek property by including additional coal seams in the resource estimation;
- 5 -
the timing of decisions regarding the timing and costs of exploration programs with respect to, and the issuance of the necessary permits and authorizations required for, the Companys ongoing exploration programs on its properties;
the Companys estimates of the quality and quantity of the resources at its mineral properties;
the timing and cost of the planned future exploration programs at the Minnesota Iron/Titanium and Carbon Creek properties, and the timing of the receipt of results therefrom;
the Companys future cash requirements;
general business and economic conditions;
the Companys ability to meet its financial obligations as they come due, and to be able to raise the necessary funds to continue operations; and
the Companys ability to negotiate acceptable option/joint venture agreements for some or all of its non-core properties.
Although the Company believes that such statements are reasonable, it can give no assurance that such expectations will prove to be correct. Inherent in forward-looking statements are risks and uncertainties beyond the Companys ability to predict or control, including, but not limited to, risks related to the Companys inability to identify one or more economic deposits on its properties, variations in the nature, quality and quantity of any mineral deposits that may be located, variations in the market price of any mineral products the Company may produce or plan to produce, the Companys inability to obtain any necessary permits, consents or authorizations required for its activities, to produce minerals from its properties successfully or profitably, to continue its projected growth, to raise the necessary capital or to be fully able to implement its business strategies, and other risks identified herein under Risk Factors. The Company cautions investors that any forward-looking statements by the Company are not guarantees of future performance, and that actual results are likely to differ, and may differ materially, from those expressed or implied by forward-looking statements contained in this AIF. Such statements are based on a number of assumptions which may prove incorrect, including, but not limited to, assumptions about:
the level and volatility of the price of commodities, and iron ore, coal, vanadium and titanium in particular;
general business and economic conditions;
the timing of the receipt of regulatory and governmental approvals, permits and authorizations necessary to implement and carry on the Companys planned exploration programs, particularly at the Minnesota Iron/Titanium and Carbon Creek property;
conditions in the financial markets generally;
the Companys ability to secure the necessary consulting, drilling and related services and supplies on favourable terms in connection with its ongoing and planned exploration programs;
the Companys ability to attract and retain key staff;
the accuracy of the Companys resource estimates (including with respect to size and grade) and the geological, operational and price assumptions on which these are based;
the timing of the ability to commence and complete the planned work at the Carbon Creek property;
- 6 -
the anticipated terms of the consents, permits and authorizations necessary to carry out the planned exploration programs at the Companys properties and the Companys ability to comply with such terms on a safe and cost-effective basis;
the ongoing relations of the Company with its underlying optionors/lessors and the applicable regulatory agencies;
that the metallurgy and recovery characteristics of samples from certain of the Companys mineral properties are reflective of the deposit as a whole;
the Companys ability to negotiate and enter into appropriate off-take agreements for the potential products from Carbon Creek; and
the Companys ability to overcome any potential difficulties in adapting pilot scale operations and testing to commercial scale operations.
In addition, in carrying out the resource estimation with respect to the Carbon Creek project, as described under Narrative Description of the Business - Material Mineral Projects Carbon Creek Metallurgical Coal Deposit, British Columbia, Canada, a number of assumptions have been made, which are more particularly described in that section.
These forward-looking statements are made as of the date hereof and the Company does not intend and does not assume any obligation to update these forward-looking statements, except as required by applicable law. For the reasons set forth above, investors should not attribute undue certainty to or place undue reliance on forward-looking statements.
Caution Regarding Adjacent or Similar Mineral Properties
This AIF contains information with respect to adjacent or similar mineral properties in respect of which the Company has no interest or rights to explore or mine. The Company advises US investors that the mining guidelines of the US Securities and Exchange Commission (the SEC) set forth in the SECs Industry Guide 7 (SEC Industry Guide 7) strictly prohibit information of this type in documents filed with the SEC. Because Cardero meets the definition of a foreign private issuer under applicable SEC rules and is preparing this AIF pursuant to Canadian disclosure requirements under the Canada-U.S. Multi-Jurisdictional Disclosure System, this AIF is not subject to the requirements of SEC Industry Guide 7. Readers are cautioned that the Company has no interest in or right to acquire any interest in any such properties, and that mineral deposits on adjacent or similar properties are not indicative of mineral deposits on the Companys properties.
Caution Regarding Reference to Resources and Reserves
National Instrument 43-101 Standards of Disclosure of Mineral Projects (NI 43-101) is a rule developed by the Canadian Securities Administrators which establishes standards for all public disclosure an issuer makes of scientific and technical information concerning mineral projects. Unless otherwise indicated, all reserve and resource estimates contained in or incorporated by reference in this AIF have been prepared in accordance with NI 43-101 and the guidelines set out in the Canadian Institute of Mining, Metallurgy and Petroleum (the CIM) Standards on Mineral Resource and Mineral Reserves, adopted by the CIM Council on November 14, 2004 (the CIM Standards) as they may be amended from time to time by the CIM.
United States investors are cautioned that the requirements and terminology of NI 43-101 and the CIM Standards differ significantly from the requirements and terminology set forth in SEC Industry Guide 7. Accordingly, the Companys disclosures regarding mineralization may not be comparable to similar information disclosed by companies subject to SEC Industry Guide 7. Without limiting the foregoing, while the terms mineral resources, inferred mineral resources, indicated mineral resources and measured mineral resources are recognized and required by NI 43-101 and the CIM Standards, they are not recognized by the SEC and are not permitted to be used in documents filed with the SEC by companies subject to SEC Industry Guide 7. Mineral resources which are not mineral reserves do not have demonstrated economic viability, and US investors are cautioned not to assume that all or any part of a mineral resource will ever be converted into reserves. Further, inferred resources have a great amount of uncertainty as to their existence and as to whether they can be mined legally or economically. It cannot be assumed that all or any part of the inferred resources will ever be upgraded to a higher resource category. Under Canadian rules, estimates of inferred mineral resources may not form the basis of a feasibility study or prefeasibility study, except in rare cases. The SEC normally only permits issuers to report mineralization that does not constitute SEC Industry Guide 7 compliant reserves as in-place tonnage and grade without reference to unit amounts. The term contained ounces is not permitted under the rules of SEC Industry Guide 7. In addition, the NI 43-101 and CIM Standards definition of a reserve differs from the definition in SEC Industry Guide 7. In SEC Industry Guide 7, a mineral reserve is defined as a part of a mineral deposit which could be economically and legally extracted or produced at the time the mineral reserve determination is made. The SEC has taken the position that mineral reserves for a mineral property may not be designated unless: (i) competent professional engineers conduct a detailed engineering and economic study, and the bankable or final feasibility study demonstrates that a mineral deposit can be mined profitably at a commercial rate; (ii) a historic three-year average commodity price is used in any reserve or cash flow analysis used to designate reserves; and (iii) the company has demonstrated that the mineral property will receive its governmental permits, and the primary environmental document has been filed with the appropriate governmental authorities. See Glossary of Terms.
- 7 -
Caution Regarding Historical Results
Historical results of operations and trends that may be inferred from the discussion and analysis in this AIF may not necessarily indicate future results from operations. In particular, the current state of the global securities markets may cause significant reductions in the price of the Companys securities and render it difficult or impossible for the Company to raise the funds necessary to continue operations. See Risk Factors Share Price Volatility.
Glossary of Terms
The following is a glossary of certain mining and other terms used in this AIF:
aeolian |
Caused or carried by the wind |
Ag |
Silver |
alteration |
Changes in the chemical or mineralogical composition of a rock, generally produced by weathering or hydrothermal solutions |
anomalous |
Departing from the expected or normal |
anomaly |
A geological feature, especially in the subsurface, distinguished by geological, geophysical or geochemical means, which is different from the general surroundings and is often of potential economic value |
As |
Arsenic |
Au |
Gold |
breccia |
Angular broken rock fragments held together by a mineral cement or a fine- grained matrix |
- 8 -
Cardero Argentina |
Cardero Argentina, S.A., a wholly owned Argentinean subsidiary of Cardero |
| |
Cardero Chile |
Compania Minera Cardero Chile Limitada, a wholly owned Chilean subsidiary of Cardero |
| |
Cardero Coal |
Cardero Coal Ltd., a wholly owned British Columbia subsidiary of Cardero |
| |
Cardero Ghana |
Cardero Ghana Ltd., a wholly owned Ghana subisidary of Cardero Iron Ghana BVI |
| |
Cardero Hierro BVI |
Cardero Hierro Peru (BVI) Ltd., a wholly owned British Virgin Islands subsidiary of Cardero Iron BVI |
| |
Cardero Hierro Peru |
Cardero Hierro del Peru, S.A.C., a wholly owned Peruvian subsidiary of Cardero Hierro BVI |
| |
Cardero Iron |
Cardero Iron Ore Company Ltd., a wholly owned British Columbia subsidiary of Cardero |
| |
Cardero Iron BVI |
Cardero Iron Ore Company (BVI) Ltd., a wholly owned British Virgin Islands subsidiary of Cardero Iron |
| |
Cardero Iron Ghana |
Cardero Iron Ore Ghana (BVI) Ltd., a wholly owned British Virgin Islands subsidiary of Cardero Iron BVI |
| |
Cardero Iron USA |
Cardero Iron Ore (USA) Inc., a wholly owned Delaware subsidiary of Cardero Iron |
| |
Cardero Management USA |
Cardero Iron Ore Management (USA) Inc., a wholly owned Delaware subsidiary of Cardero Iron |
| |
Cardero Peru |
Cardero Peru, S.A.C., a wholly owned Peruvian subsidiary of Cardero |
| |
cateo |
A cateo is an exploration concession, granted under Argentine mining law, which does not permit mining but gives the owner a preferential right to apply for a mining concession (mina) for the some or all of the area of the cateo following a discovery. Cateos are measured in 500 hectare unit areas, and a single cateo cannot exceed 20 units (10,000 hectares) |
| |
CCDL |
Cerro Colorado Development Ltd., a wholly owned British Columbia subsidiary of Cardero |
| |
clastic |
Pertaining to a rock or sediment composed principally of fragments derived from pre-existing rocks or minerals and transported some distance from their places of origin; also said of the texture of such a rock |
| |
cm |
Centimetres |
| |
Co |
Cobalt |
- 9 -
Common Shares |
The common shares without par value in the capital stock of Cardero as the same are constituted on the date hereof |
| |
conglomerate |
A coarse grained clastic sedimentary rock, composed of rounded to sub-angular fragments larger than 2mm in diameter set in a fine-grained matrix of sand or silt, and commonly cemented by calcium carbonate, iron oxide, silica or hardened clay |
| |
Cu |
Copper |
| |
deposit |
A mineralized body which has been physically delineated by sufficient drilling, trenching, and/or underground work, and found to contain a sufficient average grade of metal or metals to warrant further exploration and/or development expenditures. Such a deposit does not qualify as a commercially mineable ore body or as containing reserves or ore, unless final legal, technical and economic factors are resolved |
| |
diamond drill |
A type of rotary drill in which the cutting is done by abrasion rather than percussion. The cutting bit is set with diamonds and is attached to the end of the long hollow rods through which water is pumped to the cutting face. The drill cuts a core of rock which is recovered in long cylindrical sections, an inch or more in diameter |
| |
dike |
A tabular body of igneous rock that cuts across the structure of adjacent rocks or cuts massive rocks (cf: Sill) |
| |
dip |
The angle that a stratum or any planar feature makes with the horizontal, measured perpendicular to the strike and in the vertical plane |
| |
direct reduction |
In a direct reduction process, lump iron oxide pellets and/or lump iron ore are reduced (oxygen removed) by a reducing gas, producing direct reduced iron (DRI). If the cooling stage is omitted, the DRI can be immediately briquetted into hot briquetted iron (HBI) |
| |
Director |
A member of the Board of Directors of Cardero |
| |
disseminated |
Fine particles of mineral dispersed throughout the enclosing rock |
| |
distal |
Said of an ore deposit formed at a considerable distance (e.g. tens of kilometres) from the volcanic source from which its constituents have been derived |
| |
DRI |
Direct reduced iron is a virgin iron source that is relatively uniform in composition, and virtually free from tramp or deleterious elements. It is used increasingly in electric furnace steelmaking to dilute the contaminants present in the scrap used in these processes. It has an associated energy value in the form of combined carbon, which has a tendency to increase furnace efficiency |
| |
dune |
A mound, ridge or hill of wind-blown sand, either bare or covered with vegetation |
- 10 -
epithermal |
Said of a hydrothermal mineral deposit formed within about 1 kilometre of the earths surface and in the temperature range of 50-200° C, occurring mainly as veins |
| |
executive officer |
When used in relation to any issuer (including Cardero) means an individual who is: |
(a) |
a chair, vice chair or president; | |
(b) |
a vice-president in charge of a principal business unit, division or function, including sales, finance or production; | |
(c) |
an officer of the issuer or any of its subsidiaries that performs a policy-making function in respect of the issuer; or | |
(d) |
performing a policy-making function in respect of the issuer |
exsolved |
Said of a substance that has undergone exsolution, being the process of the separation of an initially homogenous solution into at least two different crystalline minerals without the addition or removal of any materials usually occurs upon cooling |
Fe |
Iron |
felsic |
An igneous rock having abundant light coloured minerals, also, applied to those minerals (quartz, feldspars, feldspathoids, muscovite) as a group |
footwall |
The mass of rock beneath a fault, orebody or mine working; especially the wall rock beneath an inclined vein or fault |
gangue |
The valueless rock or mineral aggregates in an ore; that part of the ore that is not economically desirable but cannot be avoided in mining. It is separated from the ore minerals during concentration |
gneiss |
A foliated rock formed by regional metamorphism, in which bands or lenticles of granular minerals alternate with bands or lenticles of minerals with flaky or elongate prismatic habit. Mineral composition is not an essential factor in its definition |
g/t |
Grams per metric tonne |
grab sample |
A sample composed of one or more pieces of rock, collected from a mineralized zone that, when analyzed, do not represent a particular width of mineralization nor necessarily the true mineral concentration of any larger portion of a mineralized zone |
grade |
To contain a particular quantity of ore or mineral, relative to other constituents, in a specified quantity of rock |
hematite |
A common iron mineral found in igneous, sedimentary and metamorphic rocks a principal ore of iron |
- 11 -
hydrothermal |
A term pertaining to hot aqueous solutions of magmatic origin which may transport metals and minerals in solution |
| |
hypabyssal |
A general adjective applied to minor intrusions such as sills and dikes, and to the rocks that compose them, which have crystallized under conditions intermediate between plutonic and extrusive |
| |
ilmenite |
An iron black opaque rhombohedral mineral (FeTiO3 ) the principal ore of titanium |
| |
intrusion |
The process of the emplacement of magma in pre-existing rock, magmatic activity. Also, the igneous rock mass so formed |
| |
intrusive |
Of or pertaining to intrusion, both the process and the rock so formed |
| |
IOCG |
iron oxide copper-gold |
| |
Iron Sands Project |
The Pampa el Toro iron sands project in Peru |
| |
km |
Kilometres |
| |
lens |
A body of ore or rock that is thick in the middle and thin at the edges, like a doubly convex lens (adj: lenticular) |
| |
m |
Metres |
| |
mm |
Millimetres |
| |
mafic |
Said of an igneous rock composed chiefly of dark, ferromagnesian minerals, also, said of those minerals |
| |
magmatic |
Of, or pertaining to, or derived from, magma |
| |
magnetic separation |
A process in which a magnetically susceptible mineral is separated from gangue minerals by applying a strong magnetic field; ores of iron are commonly treated in this way. It can be either dry(the matter to undergo separation does not have any added fluids, such as water) or wet (the matter to undergo separation has a fluid, such as water, added prior to undergoing separation) |
| |
magnetite |
A black, isometric, strongly magnetic, opaque mineral of the spinel group which constitutes an important ore of iron and is a very common and widely distributed accessory mineral in rock of all kinds |
| |
massive |
Said of a mineral deposit, especially of sulphides, characterized by a great concentration of ore in one place, as opposed to a disseminated or veinlike deposit |
| |
metallogeny |
The study of the genesis of mineral deposits, with emphasis on their relationship in space and time to regional petrographic and tectonic features of the earths crust |
- 12 -
metasomatism |
The process of practically simultaneous capillary solution and deposition by which a new mineral may grow in the body of an old mineral or mineral aggregate (syn: replacement) |
| |
migmatites |
A rock composed of igneous or of igneous appearing and/or metamorphic materials, which are generally distinguishable megascopically |
| |
mina |
A mina is a mining concession, granted under Argentine mining law, which permits mining within the area of the concession on a commercial basis. The area of a mina is measured in pertenencias. A mina may be applied for following a formal declaration of a discovery within the area of the mina. Each mina may consist of two or more pertenencias. Common pertenencias are six hectares and disseminated pertenencias are 100 hectares (relating to disseminated deposits of metals rather than discrete veins). The applicable mining authority may determine the number of pertenencias required to cover the geologic extent of the mineral deposit in question. Once granted, minas have an indefinite term assuming exploration development or mining is in progress |
| |
mineral reserve |
The economically mineable part of a measured or indicated mineral resource demonstrated by at least a preliminary feasibility study. This study must include adequate information on mining, processing, metallurgical, economic and other relevant factors that demonstrate, at the time of reporting, that economic extraction can be justified. A mineral reserve includes diluting materials and allowances for losses that may occur when the material is mined and processed |
| |
mineral resource |
A concentration or occurrence of natural, solid, inorganic or fossilized organic material in or on the Earths crust in such form and quantity and of such a grade or quality that it has reasonable prospects for economic extraction. The location, quantity, grade, geological characteristics and continuity of a mineral resource are known, estimated or interpreted from specific geological evidence and knowledge. The term mineral resource covers mineralization and natural material of intrinsic economic interest which has been identified and estimated through exploration and sampling and within which mineral reserves may subsequently be defined by the consideration and application of technical, economic, legal, environmental, socio-economic and governmental factors. The phrase reasonable prospects for economic extraction implies a judgement by a qualified person (as that term is defined in NI 43-101) in respect of the technical and economic factors likely to influence the prospect of economic extraction. A mineral resource is an inventory of mineralization that, under realistically assumed and justifiable technical and economic conditions, might become economically extractable |
| |
mineralization |
The concentration of metals and their chemical compounds within a body of rock |
| |
MMC |
Minerales Y Metales California, S.A. de C.V., a wholly owned Mexican subsidiary of Cardero |
- 13 -
National Instrument
43-101/ NI 43-101 |
National Instrument 43-101 of the Canadian Securities Administrators entitled Standards of Disclosure for Mineral Projects |
| |
NSR |
Net smelter return |
| |
NYSE-A |
NYSE - Amex LLC |
| |
open pit |
A surface mine, open to daylight, such as a quarry. Also referred to as open-cut or open-cast mine |
| |
pelite |
A mudstone or lutite |
| |
pelitic |
Pertaining to or derived from pelite; esp. said of a sedimentary rock composed of a clay or a metamorphic rock derived from a pelite |
| |
pig iron |
Semi-finished metal produced from iron ore in blast furnace, containing 92 percent iron, high amounts of carbon (typically up to 3.5 percent), and balance largely manganese and silicone plus small amounts of phosphorus, sulphur, and other impurities. Pig iron is further refined in a furnace for conversion into steel. The term was derived from the 19th century method of casting the bars of the pig iron in depressions or moulds formed in the sand floor adjacent to the furnace. These were connected to a runner (known as a sow) and when filled with metal the runner and the numerous smaller moulds were supposed to resemble a litter of suckling pigs, hence the term pig iron |
| |
porphyry |
An igneous rock of any composition that contains conspicuous phenocrysts (relatively large crystals) in a fine-grained groundmass |
| |
PPB or ppb |
Parts per billion |
| |
PPM or ppm |
Parts per million |
| |
pseudomorph |
A mineral whose outward crystal form is that of another mineral; it is described as being after the mineral whose outward form it has. Adj: pseudomorphous |
| |
SHV |
Sediment Hosted Vein, a reference to a family of gold deposits that consist of gold in quartz veins hosted by shale and siltstone sedimentary rocks |
| |
sill |
A tabular igneous intrusion that parallels the planar structure of the surrounding rock (cf: dike) |
| |
slag |
A product of smelting, containing, mostly as silicates, the substances not sought to be produced as matte or metal, and having a lower specific gravity than the latter; - called also, esp. in iron smelting, cinder. The slag of iron blast furnaces is essentially silicate of calcium, magnesium, and aluminum; that of lead and copper smelting furnaces contains iron |
| |
strike |
The direction taken by a structural surface |
- 14 -
sulfide |
A mineral compound characterized by the linkage of sulphur with a metal, such as galena (lead sulphide) or pyrite (iron sulphide) |
| |
TiO2 |
Titanium dioxide, also known as titanium oxide or titania, a naturally occurring oxide of titanium |
| |
tailings |
The material that remains after all metals considered economic have been removed from ore during milling |
| |
TSE |
Toronto Stock Exchange |
| |
V2 O5 |
Vanadium pentoxide, an important compound of vanadium, used primarily for the production of sulphuric acid and ferrovanadium |
- 15 -
ITEM 3: CORPORATE STRUCTURE
Name, Address and Incorporation
Cardero Resource Corp. (Cardero) was incorporated under the Company Act (British Columbia) on December 31, 1985 under the name Halley Resources Ltd.. The name was subsequently changed to Rugby Resources Limited on September 6, 1991, to Euro-Ad Systems Inc. on April 30, 1993, to Sun Devil Gold Corp. on July 3, 1997, and to Cardero Resource Corp. on May 18, 1999. Cardero was transitioned under the Business Corporations Act (British Columbia) (BCBCA) on January 13, 2005, and is now governed by that statute. On April 22, 2005, Cardero filed a new Notice of Articles, reflecting the adoption by the shareholders, on April 15, 2005, of a new form of Articles to govern the affairs of the Company in substitution for the original articles adopted under the old Company Act (B.C.) and reflecting the increased flexibility available to companies under the BCBCA. A copy of the new Articles is available on SEDAR at www.sedar.com.
The head office and principal business address of Cardero is located at Suite 2300 1177 West Hastings Street, Vancouver, British Columbia, Canada V6E 2K3, and its registered and records office is located at 550 Burrard Street, Suite 2300, P.O. Box 30, Bentall 5, Vancouver, British Columbia, Canada V6C 2B5.
Intercorporate Relationships
The following corporate chart sets forth all of Carderos subsidiaries and their respective jurisdictions of incorporation. Each of these subsidiaries is wholly owned, directly or indirectly, by Cardero:
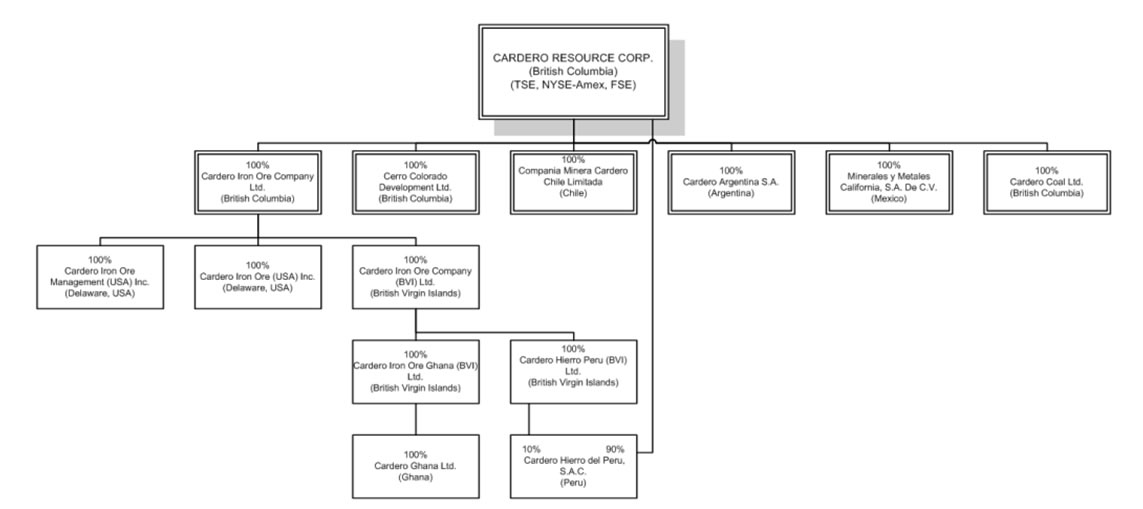
Throughout this document references made to the Company refer to Cardero and its consolidated subsidiaries, Cardero Coal, Cardero Iron, Cardero Argentina, Cardero Peru, Cardero Chile, CCDL, MMC, Cardero Iron USA, Cardero Management USA, Cardero Iron BVI, Cardero Hierro BVI, Cardero Hierro Peru, Cardero Iron Ghana and Cardero Ghana, while reference to Cardero refer to the Canadian parent company only.
- 16 -
ITEM 4: GENERAL DEVELOPMENT OF THE BUSINESS
Three Year History
The Company is a mineral exploration company engaged in the acquisition, exploration and development of mineral properties. The Company currently holds or has the right to acquire interests in a number of mineral properties in Argentina, Mexico, Peru, the United States of America, Ghana and Canada. The Company is in the exploration stage as its properties have not yet reached commercial production and none of its properties is beyond the preliminary exploration stage. All work presently planned by the Company is directed at defining mineralization and increasing understanding of the characteristics of, and economics of, that mineralization. There are currently no identified mineral reserves and, other than on the Carbon Creek property and the Longnose and Titac properties, there are currently no identified mineral resources, on any of the Companys mineral properties.
Over the past three financial years, the Company has focused on the acquisition and exploration of mineral properties primarily in Argentina, Mexico, Peru, the United States and, more recently, Ghana and Canada. During the 2009, 2010 and 2011 financial years, the Company entered into a number of option agreements to acquire properties in these countries that it believes have the potential to host large gold, silver, copper-gold, iron ore/titanium/vanadium and/or coal deposits. Some of these, such as the Huachi, Cerro Juncal, Cerro Atajo, La Poma and Mina Azules properties in Argentina, the La Zorra and Ludivina properties in Mexico, the Amable Maria and Bocana properties in Peru, the Pedernales property in Chile and the properties acquired as part of its SHV Project in Argentina, have since been returned to the respective vendors or abandoned, and the associated costs written off, in light of disappointing exploration results. In this regard, during the 2010 fiscal year, the Company wrote off $8,498,083 in acquisition and exploration costs due to disappointing exploration results; during the 2011 fiscal year the Company wrote off $12,206,614 in acquisition and exploration costs. However, the Company has retained the most strategic concessions and continues to look for a joint venture partner to carry out additional exploration. The Organullo property in Argentina was the subject of an extensive work program in the fall of 2010, and in September 2011, the Company entered into an option/joint venture agreement with Artha Resources Corporation (Artha), whereby an Argentinean subsidiary of Artha can earn a 55% working interest in the Organullo property, and thereafter form a joint venture with Cardero Argentina S.A. The Company continued active discussions towards a joint venture or outright sale of the Iron Sands Project with a number of companies which continued to express an interest in this project. The Titac and Longnose properties in Minnesota were the subject of an initial drill program in 2010 and the Company completed follow-up work programs in 2011. Final drill results were received on these properties (see Narrative Description of the Business - Material Mineral Projects - Longnose Titanium Project, Minnesota, USA and Titac Titanium Project, Minnesota, USA).
During fiscal 2010, the Company optioned out its Corrales and Santa Teresa properties in Mexico and its Pirquitas property in Argentina, and will continue to seek joint venture partners for its Los Manantiales (Mina Angela) property in Argentina.
Pursuant to a Memorandum of Understanding dated August 8, 2008 (but effective as and from April 25, 2008) between the Company and International Minerals and Mines Ltd., a private Gibraltar company (IMM), the Company had the right to acquire up to a 30% interest in IMM Gold Limited (IMMG), a subsidiary of IMM which is engaged in reconnaissance exploration programs in the Caucasian Region. The Company is the manager of the exploration programs on behalf of IMMG. A director of Cardero is a director and significant shareholder of a private company which is the major shareholder (67%) of IMM. The Company acquired an initial 15% interest in IMMG by issuing to IMM an initial 500,000 Common Shares in November 2008, at which time the Company received 123,530 ordinary shares of IMMG, representing a 15% interest. While prospective areas were identified, no properties had been acquired by IMMG. Accordingly the Company determined not to acquire the additional 15% interest in IMMG before December 31, 2009. However, the Company has continued to work with IMMG in reviewing potential acquisitions.
- 17 -
Having identified iron ore as a commodity for which there was a significant demand, the Company has, on an ongoing basis, continued to evaluate a number of prospective iron ore properties, some of which have been acquired. The Pampa de Pongo Iron property (which sold for USD 100 million in January, 2010) and the Iron Sands Project, both in Peru, are examples of this. The Company has also focused on iron ore properties that contain significant titanium and vanadium, both of which are important industrial metals, and is pursuing ongoing metallurgical testwork to determine the optimum way to separate out the titanium and/or vanadium from the slag produced by treating the iron ore in a melter to produce titanium/vanadium rich slag.
The primary focus of the Companys activities in fiscal 2008 and 2009 was the completion of a preliminary economic assessment at the Iron Sands Project in Peru, as well as ongoing metallurgical work relevant to the production of iron ore and pig iron from Pampa de Pongo material. Due to the significant costs associated with moving the project forward to commercial production, management determined that the sale of the Pampa de Pongo project was appropriate and, to this end, on October 24, 2008, the Company entered into an agreement with Nanjinzhao Group Co., Ltd., (Nanjinzhao), a private Chinese enterprise located in Zibo City, Shandong Province, Peoples Republic of China, for the sale of the property. The sale was ultimately completed in January, 2010 and the total sale price of USD 100 million was received by the Company. The Company paid a finders fee to an arms length private company in consideration of the finder introducing Cardero to Nanjinzhao and providing ongoing advice in the negotiations.
During fiscal 2008 and fiscal 2009, the Company also carried out a pilot plant separation test at the Iron Sands Project, with a view to producing an iron concentrate and carrying out metallurgical testing of such concentrate, allowing for the Company to optimize the separation parameters and determine potential production parameters. The Company successfully produced a 40 tonne magnetic concentrate, significantly increased the pilot plant through-put (from 2.8 to 18 tonnes/hour) and increased the anticipated magnetic concentrate grade (to 55.5% iron). The concentrate was shipped to the United States, where extensive commercial scale melting tests, targeting the production of a premium-quality pig iron were carried out. In addition, bench scale testing of the concentrate indicates that a simple screening process resulted in an upgrade to 62.8% iron, and additional work is underway, targeting an increase to 64% iron through additional screening and other mineral separation techniques. The Company commissioned SRK Consulting (Johannesburg) to prepare a resource estimate for the Iron Sands Project utilizing the information from the 120 existing resource definition drillholes, and the resource estimate was delivered on, and effective as at, July 21, 2009.
In keeping with bulk-commodity focus, in June, 2010, Cardero acquired an initial interest of 49.9% in Coalhunter Mining Corporation (Coalhunter). Pursuant to private placements completed on September 27, 2010 and December 21, 2010, Carderos interest in Coalhunter increased to 45.5% . On June 1, 2011, Cardero acquired all of the issued and outstanding common shares of Coalhunter and Coalhunter subsequently changed its name to Cardero Coal Ltd. (see Significant Acquisitions). Upon completion of the acquisition, Michael Hunter was appointed President of Cardero and, subsequent to fiscal 2011, also assumed the position of Chief Executive Officer with Hendrik Van Alphen stepping down as CEO and assuming the position of Managing Director.
During fiscal 2011, Cardero acquired an aggregate of 8,634,007 common shares, representing 16.32%, of Abzu Gold Ltd. ("Abzu"), together with warrants to purchase an additional 3,782,000 common shares of Abzu. Abzu operates as a gold exploration and discovery company in Ghana, West Africa.
Cardero also completed an additional $1,175,000 investment in Kria Resources Ltd. ("Kria") through the exercise of warrants acquired by way of private placement. The investment resulted in Cardero holding an aggregate of 20,875,000 common shares of Kria, representing approximately 19.97% of the issued and outstanding common shares of Kria.
- 18 -
The Company optioned its Organullo Gold Project, Northwest Argentina, to Artha Resources Corporation ("Artha"), whereby Artha can earn an undivided fifty-five (55%) percent working interest in the Organullo Project, and thereafter form a Joint Venture with Cardero Argentina. Joint venturing of the Organullo Project is part of Cardero's strategy to option-out all non-core assets, allowing the Company to focus on development of its coal and iron ore projects.
The 2011 field program was completed at the Carbon Creek Metallurgical Coal deposit ("Carbon Creek") located in the Peace River Coal Field of northeastern British Columbia. Additionally, the Company received a Preliminary Economic Assessment (see Narrative Description of the Business -Material Mineral Projects Carbon Creek Metallurgical Coal Deposit, British Columbia, Canada).
Subsequent to fiscal 2011, Cardero entered into a Letter of Intent ("LOI") with Anglo Pacific Group PLC ("Anglo Pacific") to acquire 100% of Trefi Coal Corporation ("Trefi"), a wholly owned subsidiary of Anglo Pacific which owns the Trefi Metallurgical Coal deposit in the Peace River Coalfield, northeast British Columbia, Canada. The Trefi Metallurgical Coal deposit comprises 15 coal licenses and 3 license application areas, totaling 9,437 hectares, located approximately 30 kilometres southeast of the town of Chetwynd in northeastern BC. The deposit has been explored previously by Gulf Canada (27 drillholes for 6,332 metres) and by Anglo Pacific (5 drillholes for 1,006 metres). The deposit is located within 60 kilometres of the Company's flagship metallurgical coal deposit at Carbon Creek.
Cardero closed its non-brokered private placement (the "Offering") announced on November 2, 2011 and increased on November 7, 2011. A total of 8,029,750 units ("Cardero Units") was sold at a price of CAD 0.95 per Cardero Unit for aggregate gross proceeds of CAD 7,628,262.50. Each Cardero Unit consisted of one Common Share and one-half of one common share purchase warrant (each whole warrant, a "Cardero Warrant"). Each Cardero Warrant is exercisable into one additional Common Share for a period of 12 months from the closing of the Offering at an exercise price of CAD 1.25. If, at any time from 4 months after the closing of the Offering until the expiry of the Cardero Warrants, the daily volume-weighted average trading price of the Common Shares on the TSX exceeds CAD 1.75 for at least 10 consecutive trading days, the Company may, within 30 days, give an expiry acceleration notice to the holders of Cardero Warrants and, if it does so, the Cardero Warrants will, unless exercised, expire on the 30th day after the expiry acceleration notice is given.
Cardero received repayment of the USD 8 million loan originally made to Kria Resources Inc. ("Kria") (now a wholly owned subsidiary of Trevali Mining Corporation ("Trevali")). The Company, Kria and Trevali agreed that the loan, plus interest of USD 645,260, was to be repaid as follows: (i) Kria has paid Cardero USD 5,000,000 in cash; and (ii) the balance of USD 3,645,260 (equivalent to CAD 3,734,569) has been satisfied by Trevali issuing to Cardero 4,149,521 units ("Trevali Units"), with each Trevali Unit being comprised of one common share of Trevali ("Trevali Common Share") and one-half of one transferrable common share purchase warrant (a "Trevali Warrant"), at a deemed price of CAD 0.90 per Trevali Unit. Each whole Trevali Warrant will entitle the holder thereof to purchase one Trevali Common Share ("Trevali Warrant Share") at a price of CAD 1.10 per share until January 16, 2014. The Trevali Common Shares, Trevali Warrants and any Trevali Warrant Shares issued are subject to a hold period in Canada expiring on May 17, 2012.
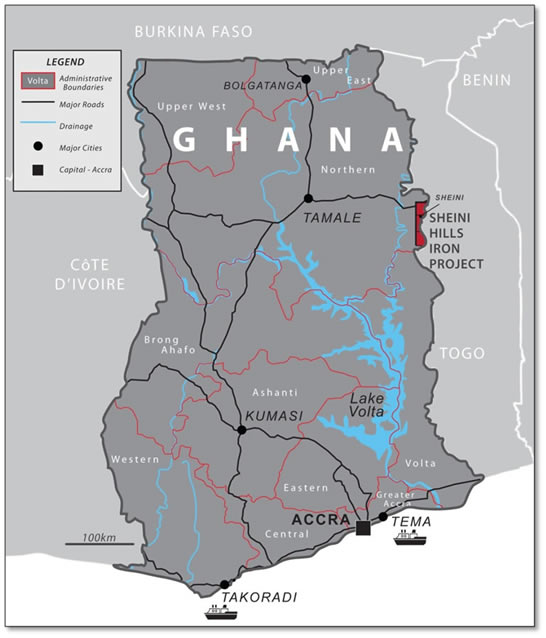
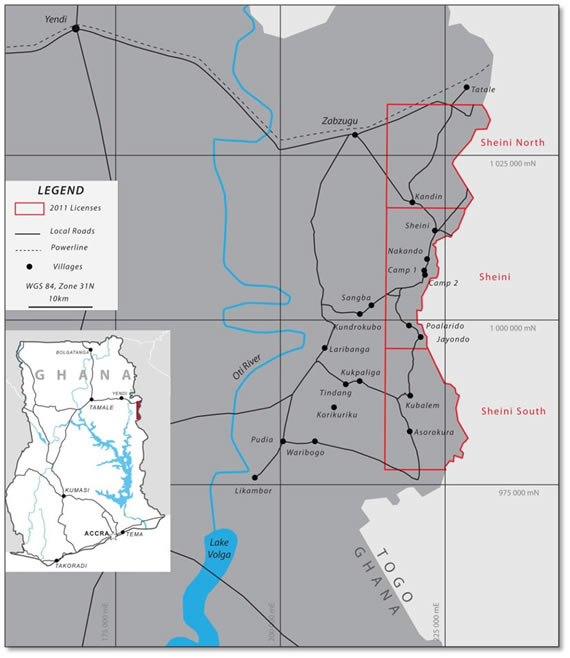
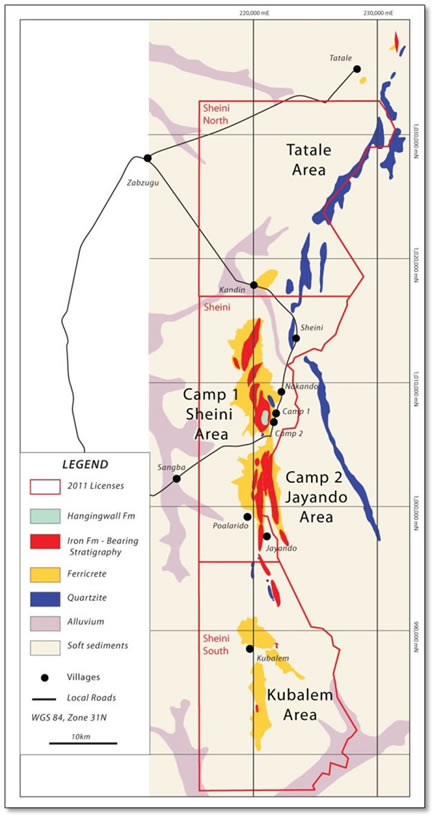
Carderos Ghanaian joint venture partner, Emmaland Resources Limited ("Emmaland"), received from the Government of the Republic of Ghana, through The Minister for Lands and Natural Resources (Ghana) ("Minister"), three prospecting licenses covering lands located in the Zabzugu-Tatale District in the Northern Region of the Republic of Ghana and referred to as the Sheini Hills Iron Project (approximately 400 square kilometres in aggregate). Cardero Ghana has signed joint venture agreements with Emmaland pursuant to which Cardero Ghana can acquire a 100% joint venture interest in each of the three licenses. Exploration has been initiated over Sheini Hills Iron Deposits, Ghana (see Narrative Description of the Business - Material Mineral Projects Sheini Hills Iron Project, Ghana).
- 19 -
Significant Acquisitions
Since November 1, 2010, being the commencement of the Companys last completed fiscal year, Cardero completed the acquisition of Coalhunter by acquiring all of the issued and outstanding shares of Coalhunter that it did not own, as set out in the Form 51-102F4 filed by the Company. Immediately prior to the acquisition, Cardero held 17,808,143 common shares of Coalhunter (representing approximately 47.48% of Coalhunters issued and outstanding shares).
Pursuant to an Arrangement Agreement dated April 18, 2011 between Cardero and Coalhunter, on June 1, 2011 each Coalhunter shareholder (other than Cardero) received 0.8 of a common share of Cardero for each common share of Coalhunter held, resulting in the issuance of 23,397,002 Common Shares. A further 5,885,543 Common Shares are reserved upon the exercise of options held by former Coalhunter optionees, the exercise of Coalhunter warrants and pursuant to Coalhunter property acquisition agreements.
Coalhunter is a private British Columbia company that has entered into various agreements to explore and, if warranted, develop, certain coal deposits in the Peace River Coal Field located in the northeast region of British Columbia. The property consists of a lease of freehold coal and certain coal licenses issued, or to be issued, by the British Columbia government. Coalhunter will hold a 75% interest in the joint venture and its co-venturer will hold a 25% carried interest. Coalhunter will be required to fund all exploration, development and mining costs, and the co-venturer will receive 25% of the net proceeds (after recovery by Coalhunter of its capital expenditures and ongoing operating costs). See Narrative Description of the Business - Material Mineral Projects Carbon Creek Metallurgical Coal Deposit, British Columbia, Canada.
Coalhunter changed its name to Cardero Coal Ltd. on September 14, 2011.
ITEM 5: NARRATIVE DESCRIPTION OF THE BUSINESS
General
Summary
The Company currently holds, or has rights to acquire, interests (ranging from 75% to 100%) in several mineral properties (subject, in certain cases, to net smelter return royalties payable to the original property vendors) in Argentina, Mexico, Peru, the United States, Ghana and Canada. The Company is in the process of evaluating such properties through exploration programs or, in some cases, mineralogical and metallurgical studies and materials processing tests. In all cases, the objective is to evaluate the potential of the subject property and to determine if spending additional funds is warranted (in which case, an appropriate program to advance the property to the next decision point will be formulated and, depending upon available funds, implemented) or not (in which case the property may be offered for option/joint venture or returned to the vendor or abandoned, as applicable). At the present time, the Company is primarily interested in properties that are prospective for precious metals, copper, iron ore, titanium, vanadium and coal.
With the completion of the sale of the Pampa de Pongo Iron Project in January, 2010, the Company considers that the Carbon Creek property in British Columbia, Canada, the Longnose and Titac Iron Titanium properties in Minnesota, USA and the Sheini Hills property in Ghana, Africa, are its material mineral properties at the present time. However, ongoing work on other properties may produce results that would cause the Company to consider them as material mineral properties in the future. Information with respect to the Companys material mineral properties is set out in the Material Mineral Projects section of this AIF.
- 20 -
The Company is in the exploration stage and does not mine, produce or sell any mineral products at this time, nor do any of its current properties have any known or identified mineral resources (with the exception of the Carbon Creek property and the Longnose and Titac properties), or mineral reserves. The Company does not propose any method of production at this time, although it is conducting extensive work on the Carbon Creek property in order to ascertain the appropriate production methods to employ should the property go into commercial production.
All aspects of the Companys business require specialized skills and knowledge. Such skills and knowledge include the areas of geology, drilling, logistical planning, geophysics, metallurgy and mineral processing, implementation of exploration programs and accounting. While recent increased activity in the resource mining industry has made it more difficult to locate competent employees and consultants in such fields, the Company has found that it can locate and retain such employees and consultants and believes it will continue to be able to do so.
All of the raw materials the Company requires to carry on its business are readily available through normal supply or business contracting channels in Canada, Ghana, Argentina, Mexico, Peru and the United States. The Company has secured, or reasonably believes that it will be able to secure, personnel to conduct its contemplated programs.
The mining business is subject to mineral price cycles. The marketability of minerals and mineral concentrates is also affected by worldwide economic cycles. In recent years, the significant demand for minerals in some countries (notably China and India) has driven increased commodity prices to historic highs. While the downturn in the world economy in 2008 and 2009 significantly moderated the record high prices, and temporarily reduced the upward price pressures, for many commodities (including several that the Company is in the business of exploring for), the upward price movements have recently become re-established, primarily as a result of Chinese demand for commodities such as copper, coal and iron ore. It is difficult to assess if the apparent upward momentum in several commodity prices are long-term trends, and there is great uncertainty as to the recovery, or otherwise, of the world, and particularly, the Chinese, economy. If the economic recovery stalls and commodity prices decline as a consequence, a continuing period of lower prices could significantly affect the economic potential of many of the Companys current properties and result in the Company determining to cease work on, or drop its interest in, some or all of such properties. The one exception to this is gold. Fear of potential inflation as a consequence of the stimulus packages implemented by many countries (notably the United States) and the potential negative influence on the US dollar (among other currencies), have led to significant increases in the price of gold to record highs.
The Companys business is not substantially dependent on any contract such as a contract to sell the major part of its products or services or to purchase the major part of its requirements for goods, services or raw materials, or on any franchise or licence or other agreement to use a patent, formula, trade secret, process or trade name upon which its business depends.
It is not expected that the Companys business will be affected in the current financial year by the renegotiation or termination of contracts or sub-contracts.
As of October 31, 2011, Cardero had 16 full-time employees, Cardero Coal had 14 full-time employees and Cardero Management USA had three full-time employees. The Company relies to a large degree upon consultants and contractors to carry on many of its activities and, in particular, to supervise and carry out the work programs on its mineral properties. However, should the Company expand its activities, it is likely that it will choose to hire additional employees.
Bankruptcy and Similar Procedures
There are no bankruptcy, receivership or similar proceedings against Cardero, nor is Cardero aware of any such pending or threatened proceedings. There have not been any voluntary bankruptcy, receivership or similar proceedings by Cardero within the three most recently completed financial years or completed or currently proposed for the current financial year.
- 21 -
Reorganizations
There have been no reorganizations of or involving Cardero within the three most recently completed financial years and no reorganizations are currently proposed for the current financial year.
Social or Environmental Policies
Cardero has created a Sustainable Development Committee (SDC), which has adopted a formal charter. The overall purpose of the SDC is to assist the Board in fulfilling its oversight responsibilities with respect to the Boards and the Companys continuing commitment to improving the environment and ensuring that the Companys activities are carried out, and that its facilities are operated and maintained, in a safe, sustainable and environmentally sound manner. The primary function of the SDC is to monitor, review and provide oversight with respect to the Companys policies, standards, accountabilities and programs relative to health, safety, community relations and environmental-related matters. Further, the SDC is to advise the Board and make recommendations for the Boards consideration regarding health, safety, community relations and environmental-related issues. In particular, the SDC is to consider and advise the Board with respect to current standards of sustainable development for projects and activities such as those of the Company, particularly with a view to ensuring that the Companys business is run in a manner, and its projects are operated and developed, so as to achieve the ideals and reflect the following principles of sustainable development:
(a) |
living within environmental limits, | |
(b) |
ensuring a strong, healthy and just society, | |
(c) |
achieving a sustainable economy, | |
(d) |
using sound science responsibly, and | |
(e) |
promoting good governance. |
The SDC is also responsible for monitoring the activities of the Company in connection with the initial and ongoing interaction between the Companys activities, operations and personnel and the communities in which the Companys projects and related activities are located, with a view to ensuring that management develops and follows appropriate policies and activities to enhance the relationship between the Company and its personnel and the communities in which it operates and reflect the principles of sustainable development in that regard.
Although not set out in a specific policy, the Company strives to be a positive influence in the local communities where its mineral projects are located, not only by contributing to the welfare of such communities through donations of money and supplies, as appropriate, but also through hiring, when appropriate, local workers to assist in ongoing exploration programs as well as contributing to and improving local infrastructure. The Company considers that building and maintaining strong relationships with such communities is fundamental to its ability to continue to operate in such regions and to assist in the eventual development (if any) of mining operations in such regions, and it attaches considerable importance to commencing and fostering them from the beginning of its involvement in any particular area.
Cardero has also adopted a Code of Business Conduct and Ethics, which provides, among other things, that the Company is committed to complying with all laws and governmental regulations applicable to its activities and, specifically, to maintaining a safe and healthy work environment and conducting its activities in full compliance with all applicable environmental laws.
- 22 -
Risk Factors
In addition to those risk factors discussed elsewhere in this AIF, the Company is subject to the following risk factors:
Resource Exploration and Development is Generally a Speculative Business: Resource exploration and development is a speculative business and involves a high degree of risk, including, among other things, unprofitable efforts resulting both from the failure to discover mineral deposits and from finding mineral deposits which, though present, are insufficient in size and grade at the then prevailing market conditions to return a profit from production. The marketability of natural resources which may be acquired or discovered by the Company will be affected by numerous factors beyond the control of the Company. These factors include market fluctuations, the proximity and capacity of natural resource markets, government regulations, including regulations relating to prices, taxes, royalties, land use, importing and exporting of minerals and environmental protection. The exact effect of these factors cannot be accurately predicted, but the combination of these factors may result in the Company not receiving an adequate return on invested capital.
There are no known reserves and, other than on the Carbon Creek property and the Longnose and Titac properties, there are no known resources, on any of the Companys properties. The majority of exploration projects do not result in the discovery of commercially mineable deposits of ore. Substantial expenditures are required to establish ore reserves through drilling and metallurgical and other testing techniques, determine metal content and metallurgical recovery processes to extract metal from the ore, and construct, renovate or expand mining and processing facilities. No assurance can be given that any level of recovery of ore reserves will be realized or that any identified mineral deposit, even it is established to contain an estimated resource, will ever qualify as a commercial mineable ore body which can be legally and economically exploited. Mineral resources are not mineral reserves and there is no assurance that any mineral resources will ultimately be reclassified as proven or probable reserves. Mineral resources which are not mineral reserves do not have demonstrated economic viability.
Fluctuation of Commodity Prices: Even if commercial quantities of mineral deposits are discovered by the Company, there is no guarantee that a profitable market will exist for the sale of the minerals produced. The Companys long-term viability and profitability depend, in large part, upon the market price of minerals which have experienced significant movement over short periods of time, and are affected by numerous factors beyond the control of the Company, including international economic and political trends, expectations of inflation, currency exchange fluctuations, interest rates and global or regional consumption patterns, speculative activities and increased production due to improved mining and production methods. The recent price fluctuations in the price of all commodities for which the Company is presently exploring is an example of a situation over which the Company has no control and may materially adversely affect the Company in a manner that it may not be able to compensate for. The supply of and demand for minerals are affected by various factors, including political events, economic conditions and production costs in major producing regions. There can be no assurance that the price of any minerals produced from the Companys properties will be such that any such deposits can be mined at a profit.
Recent market events and conditions: Since 2008, the U.S. credit markets have experienced serious disruption due to a deterioration in residential property values, defaults and delinquencies in the residential mortgage market (particularly, sub-prime and non-prime mortgages) and a decline in the credit quality of mortgage backed securities. These problems have led to a slow-down in residential housing market transactions, declining housing prices, delinquencies in non-mortgage consumer credit and a general decline in consumer confidence. These conditions caused a loss of confidence in the broader U.S. and global credit and financial markets and resulting in the collapse of, and government intervention in, major banks, financial institutions and insurers and creating a climate of greater volatility, less liquidity, widening of credit spreads, a lack of price transparency, increased credit losses and tighter credit conditions. Notwithstanding various actions by the U.S. and foreign governments, concerns about the general condition of the capital markets, financial instruments, banks, investment banks, insurers and other financial institutions caused the broader credit markets to further deteriorate and stock markets to decline substantially. In addition, general economic indicators have deteriorated, including declining consumer sentiment, increased unemployment and declining economic growth and uncertainty about corporate earnings.
- 23 -
While these conditions appear to have improved slightly in 2010/11, unprecedented disruptions in the credit and financial markets have had a significant material adverse impact on a number of financial institutions and have limited access to capital and credit for many companies. These disruptions could, among other things, make it more difficult for the Company to obtain, or increase its cost of obtaining, capital and financing for its operations. The Companys access to additional capital may not be available on terms acceptable to it or at all.
General Economic Conditions: The recent unprecedented events in global financial markets have had a profound impact on the global economy. Many industries, including the gold and base metal mining industry, are impacted by these market conditions. Some of the key impacts of the current financial market turmoil include contraction in credit markets resulting in a widening of credit risk, devaluations and high volatility in global equity, commodity, foreign exchange and precious metal markets, and a lack of market liquidity. A continued or worsened slowdown in the financial markets or other economic conditions, including but not limited to, consumer spending, employment rates, business conditions, inflation, fuel and energy costs, consumer debt levels, lack of available credit, the state of the financial markets, interest rates, and tax rates may adversely affect the Companys growth and profitability. Specifically:
The global credit/liquidity crisis could impact the cost and availability of financing and the Companys overall liquidity
the volatility of gold and other base metal prices may impact the Companys future revenues, profits and cash flow
volatile energy prices, commodity and consumables prices and currency exchange rates impact potential production costs
the devaluation and volatility of global stock markets impacts the valuation of the Common Shares, which may impact the Companys ability to raise funds through the issuance of Common Shares
These factors could have a material adverse effect on the Companys financial condition and results of operations.
Share Price Volatility: In 2010/11, worldwide securities markets, particularly those in the United States and Canada, have experienced a high level of price and volume volatility, and the market price of securities of many companies, particularly those considered exploration or development stage companies, have experienced unprecedented fluctuations in price which have not necessarily been related to the operating performance, underlying asset values or prospects of such companies. Most significantly, the share prices of junior natural resource companies have experienced an unprecedented decline in value and there has been a significant decline in the number of buyers willing to purchase such securities. In addition, significantly higher redemptions by holders of mutual funds has forced many of such funds (including those holding the Companys securities) to sell such securities at any price. As a consequence, despite the Companys past success in securing significant equity financing, market forces may render it difficult or impossible for the Company to secure placees to purchase new share issues at a price which will not lead to severe dilution to existing shareholders, or at all. Therefore, there can be no assurance that significant fluctuations in the Common Shares will not occur, or that such fluctuations will not materially adversely impact on the Companys ability to raise equity funding without significant dilution to its existing shareholders, or at all.
- 24 -
Permits and Licenses: The operations of the Company will require licenses and permits from various governmental authorities. There can be no assurance that the Company will be able to obtain all necessary licenses and permits that may be required to carry out exploration, development and mining operations at its projects, on reasonable terms or at all. Delays or a failure to obtain such licenses and permits, or a failure to comply with the terms of any such licenses and permits that the Company does obtain, could have a material adverse effect on the Company.
Acquisition of Mineral Properties under Agreements: The agreements pursuant to which the Company has the right to acquire a number of its properties provide that the Company must make a series of cash payments and/or share issuances over certain time periods, expend certain minimum amounts on the exploration of the properties or contribute its share of ongoing expenditures. Failure by the Company to make such payments, issue such shares or make such expenditures in a timely fashion may result in the Company losing its interest in such properties. There can be no assurance that the Company will have, or be able to obtain, the necessary financial resources to be able to maintain all of its property agreements in good standing, or to be able to comply with all of its obligations thereunder, with the result that the Company could forfeit its interest in one or more of its mineral properties.
Title Matters: The acquisition of title to mineral properties in Mexico, Peru, Argentina and Ghana is a very detailed and time-consuming process. Title to, and the area of, mineral concessions may be disputed. While the Company has diligently investigated title to all mineral properties in which it has an interest and, to the best of its knowledge, title to all such properties is in good standing or, where not yet granted, the application process appears to be proceeding normally in all the circumstances, this should not be construed as a guarantee of title or that any such applications for concessions will be granted. Title to mineral properties may be affected by undetected defects such as aboriginal or indigenous peoples land claims, or unregistered agreements or transfers. The Company has not obtained title opinions for the majority of its mineral properties. Not all the mineral properties in which the Company has an interest have been surveyed, and their actual extent and location may be in doubt.
Surface Rights and Access: Although the Company acquires the rights to some or all of the minerals in the ground subject to the mineral tenures that it acquires, or has a right to acquire, in most cases it does not thereby acquire any rights to, or ownership of, the surface to the areas covered by its mineral tenures. In such cases, applicable mining laws usually provide for rights of access to the surface for the purpose of carrying on mining activities, however, the enforcement of such rights through the courts can be costly and time consuming. It is necessary to negotiate surface access or to purchase the surface rights if long-term access is required. There can be no guarantee that, despite having the right at law to access the surface and carry on mining activities, the Company will be able to negotiate satisfactory agreements with any such existing landowners/occupiers for such access or purchase of such surface rights, and therefore it may be unable to carry out planned mining activities. In addition, in circumstances where such access is denied, or no agreement can be reached, the Company may need to rely on the assistance of local officials or the courts in the applicable jurisdiction, the outcomes of which cannot be predicted with any certainty. The inability of the Company to secure surface access or purchase required surface rights could materially and adversely affect the timing, cost or overall ability of the Company to develop any mineral deposits it may locate. This is a particular problem in many areas of Mexico, Argentina, Peru and Ghana, where blockades of access to the Companys properties, hostile actions by local communities and the potential unwillingness of local police or governmental officials to assist a foreign company against its own citizens can result in the Company being unable to carry out any exploration activities despite being legally authorized to do so and having complied with all applicable local laws and requirements.
- 25 -
No Assurance of Profitability: The Company has no history of production or earnings and due to the nature of its business there can be no assurance that the Company will be profitable. The Company has not paid dividends on its shares since incorporation and does not anticipate doing so in the foreseeable future. All of the Companys properties are in the exploration stage and the Company has not defined or delineated any proven or probable reserves on any of its properties. None of the Companys properties are currently under development. Continued exploration of its existing properties and the future development of any properties found to be economically feasible, will require significant funds. The only present source of funds available to the Company is through the sale of its equity securities or the sale or optioning of a portion of its interest in its mineral properties. Even if the results of exploration are encouraging, the Company may not have sufficient funds to conduct the further exploration that may be necessary to determine whether or not a commercially mineable deposit exists. While the Company may generate additional working capital through further equity offerings or through the sale or possible syndication of its properties, there is no assurance that any such funds will be available on favourable terms, or at all. At present, it is impossible to determine what amounts of additional funds, if any, may be required. Failure to raise such additional capital could put the continued viability of the Company at risk.
Uninsured or Uninsurable Risks: Exploration, development and mining operations involve various hazards, including environmental hazards, industrial accidents, metallurgical and other processing problems, unusual or unexpected rock formations, structural cave-ins or slides, flooding, fires, metal losses and periodic interruptions due to inclement or hazardous weather conditions. These risks could result in damage to or destruction of mineral properties, facilities or other property, personal injury, environmental damage, delays in operations, increased cost of operations, monetary losses and possible legal liability. The Company may not be able to obtain insurance to cover these risks at economically feasible premiums or at all. The Company may elect not to insure where premium costs are disproportionate to the Companys perception of the relevant risks. The payment of such insurance premiums and of such liabilities would reduce the funds available for exploration and production activities.
Government Regulation: Any exploration, development or mining operations carried on by the Company will be subject to government legislation, policies and controls relating to prospecting, development, production, environmental protection, mining taxes and labour standards. The Company cannot predict whether or not such legislation, policies or controls, as presently in effect, will remain so, and any changes therein (for example, significant new royalties or taxes), which are completely outside the control of the Company, may materially adversely affect to ability of the Company to continue its planned business within any such jurisdictions.
Foreign Countries and Political Risk: The Company has mineral properties located in Peru, Argentina, Mexico, the United States and Ghana. In such countries, mineral exploration and mining activities may be affected in varying degrees by political or economic instability, expropriation of property and changes in government regulations such as tax laws, business laws, environmental laws and mining laws. Any changes in regulations or shifts in political conditions are beyond the control of the Company and may materially adversely affect it business, or if significant enough, may make it impossible to continue to operate in certain countries. Operations may be affected in varying degrees by government regulations with respect to restrictions on production, price controls, foreign exchange restrictions, export controls, income taxes, expropriation of property, environmental legislation and mine safety.
Dependence Upon Others and Key Personnel: The success of the Companys operations will depend upon numerous factors, many of which are beyond the Companys control, including (i) the ability of the Company to enter into strategic alliances through a combination of one or more joint ventures, mergers or acquisition transactions; and (ii) the ability to attract and retain additional key personnel in exploration, mine development, sales, marketing, technical support and finance. These and other factors will require the use of outside suppliers as well as the talents and efforts of the Company.
- 26 -
There can be no assurance of success with any or all of these factors on which the Companys operations will depend. The Company has relied and may continue to rely, upon consultants and others for operating expertise.
Exploration and Mining Risks: Fires, power outages, labour disruptions, flooding, explosions, cave-ins, landslides and the inability to obtain suitable or adequate machinery, equipment or labour are other risks involved in the operation of mines and the conduct of exploration programs. Substantial expenditures are required to establish reserves through drilling, to develop metallurgical processes, to develop the mining and processing facilities and infrastructure at any site chosen for mining. Although substantial benefits may be derived from the discovery of a major mineralized deposit, no assurance can be given that minerals will be discovered in sufficient quantities to justify commercial operations or that funds required for development can be obtained on a timely basis. The economics of developing mineral properties is affected by many factors including the cost of operations, variations of the grade of ore mined, fluctuations in the price of gold or other minerals produced, costs of processing equipment and such other factors as government regulations, including regulations relating to royalties, allowable production, importing and exporting of minerals and environmental protection. In addition, the grade of mineralization ultimately mined may differ from that indicated by drilling results and such differences could be material. Short term factors, such as the need for orderly development of ore bodies or the processing of new or different grades, may have an adverse effect on mining operations and on the results of operations. There can be no assurance that minerals recovered in small scale laboratory tests will be duplicated in large scale tests under on-site conditions or in production scale operations. Material changes in geological resources, grades, stripping ratios or recovery rates may affect the economic viability of projects.
Currency Fluctuations: The Company presently maintains its accounts in Canadian dollars. Due to the nature of its operations in such countries, the Company also maintains accounts in U.S. dollars, Mexican and Argentinean pesos, Peruvian nuevo soles and Ghanaian Cedi. The Companys operations in the United States, Mexico, Argentina, Peru and Ghana and its proposed payment commitments and exploration expenditures under many of the agreements pursuant to which it holds, or has a right to acquire, an interest in its mineral properties are denominated in U.S. dollars, making it subject to foreign currency fluctuations. Such fluctuations are out of its control and may materially adversely affect the Companys financial position and results. The Company does not engage in any hedging programs with respect to currencies.
Environmental Restrictions: The activities of the Company are subject to environmental regulations promulgated by government agencies in different countries from time to time. Environmental legislation generally provides for restrictions and prohibitions on spills, releases or emissions into the air, discharges into water, management of waste, management of hazardous substances, protection of natural resources, antiquities and endangered species and reclamation of lands disturbed by mining operations. Certain types of operations require the submission and approval of environmental impact assessments. Environmental legislation is evolving in a manner which means stricter standards, and enforcement, fines and penalties for non-compliance are more stringent. Environmental assessments of proposed projects carry a heightened degree of responsibility for companies and directors, officers and employees. The cost of compliance with changes in governmental regulations has a potential to reduce the profitability of operations.
Regulatory Requirements: The activities of the Company are subject to extensive regulations governing various matters, including environmental protection, management and use of toxic substances and explosives, management of natural resources, exploration, development of mines, production and post-closure reclamation, exports, price controls, taxation, regulations concerning business dealings with indigenous peoples, labour standards on occupational health and safety, including mine safety, and historic and cultural preservation. Failure to comply with applicable laws and regulations may result in civil or criminal fines or penalties, enforcement actions thereunder, including orders issued by regulatory or judicial authorities causing operations to cease or be curtailed, and may include corrective measures requiring capital expenditures, installation of additional equipment, or remedial actions, any of which could result in the Company incurring significant expenditures. The Company may also be required to compensate those suffering loss or damage by reason of a breach of such laws, regulations or permitting requirements. It is also possible that future laws and regulations, or more stringent enforcement of current laws and regulations by governmental authorities, could cause additional expense, capital expenditures, restrictions on or suspension of the Companys operations and delays in the exploration and development of the Companys properties.
- 27 -
Limited Experience with Development-Stage Mining Operations: The Company has limited experience in placing resource properties into production, and its ability to do so will be dependent upon using the services of appropriately experienced personnel or entering into agreements with other major resource companies that can provide such expertise. There can be no assurance that the Company will have available to it the necessary expertise when and if it places its resource properties into production.
Estimates of Mineral Reserves and Resources and Production Risks: The mineral resource estimates presented in the Companys filings with securities regulatory authorities, press releases and other public statements that may be made from time to time are based upon estimates made by Company personnel and independent geologists, and no assurance can be given that any particular level of recovery of minerals will in fact be realized or that an identified reserve or resource will ever qualify as a commercially mineable (or viable) deposit which can be legally and economically exploited. The estimating of mineral resources and mineral reserves is a subjective process and the accuracy of mineral resource and mineral reserve estimates is a function of the quantity and quality of available data, the accuracy of statistical computations, and the assumptions used and judgments made in interpreting available engineering and geological information. There is significant uncertainty in any mineral resource or mineral reserve estimate and the actual deposits encountered and the economic viability of a deposit may differ materially from the Companys estimates. Accordingly, there can be no assurance that:
these estimates will be accurate;
reserves, resource or other mineralization figures will be accurate; or
this mineralization could be mined or processed profitably.
Because the Company has not commenced production at any of its properties, and has not defined or delineated any proven or probable reserves on any of its properties, mineralization estimates for the Companys properties may require adjustments or downward revisions based upon further exploration or development work or actual production experience. In addition, the grade of mineralization ultimately mined may differ from that indicated by drilling results and such differences could be material. There can be no assurance that minerals recovered in small-scale tests will be duplicated in large-scale tests under on-site conditions or in production scale. Production can be affected by such factors as permitting regulations and requirements, weather, environmental factors, unforeseen technical difficulties, unusual or unexpected geological formations and work interruptions. Short term factors, such as the need for orderly development of deposits or the processing of new or different grades, may have a material adverse effect on mining operations and on the results of operations. There can be no assurance that minerals recovered in small scale laboratory tests will be duplicated in large scale tests under on-site conditions or in production scale operations. Material changes in reserves or resources, grades, stripping ratios or recovery rates may affect the economic viability of projects. The estimated resources described in the Companys filings with securities regulatory authorities, press releases and other public statements that may be made from time to time should not be interpreted as assurances of mine life or of the profitability of future operations. Estimated mineral resources and mineral reserves may have to be re-estimated based on changes in applicable commodity prices, further exploration or development activity or actual production experience. This could materially and adversely affect estimates of the volume or grade of mineralization, estimated recovery rates or other important factors that influence mineral resource or mineral reserve estimates. Market price fluctuations for gold, silver or base metals, increased production costs or reduced recovery rates or other factors may render any particular reserves uneconomical or unprofitable to develop at a particular site or sites. A reduction in estimated reserves could require material write downs in investment in the affected mining property and increased amortization, reclamation and closure charges.
- 28 -
Mineral resources are not mineral reserves and there is no assurance that any mineral resources will ultimately be reclassified as proven or probable reserves. Mineral resources which are not mineral reserves do not have demonstrated economic viability. The failure to establish proven and probable reserves could restrict the Companys ability to successfully implement its strategies for long-term growth.
Enforcement of Civil Liabilities: As many of the assets of the Company are located outside of Canada and the United States, and certain of the directors and officers of Cardero are resident outside of Canada and/or the United States, it may be difficult or impossible to enforce judgements granted by a court in Canada or the United States against the assets of the Company or the directors and officers of Cardero residing outside of such country.
Mining Industry is Intensely Competitive: The Companys business of the acquisition, exploration and development of mineral properties is intensely competitive. The Company may be at a competitive disadvantage in acquiring additional mining properties because it must compete with other individuals and companies, many of which have greater financial resources, operational experience and technical capabilities than the Company. The Company may also encounter increasing competition from other mining companies in efforts to hire experienced mining professionals. Competition for exploration resources at all levels is currently very intense, particularly affecting the availability of manpower, drill rigs and helicopters. Increased competition could adversely affect the Companys ability to attract necessary capital funding or acquire suitable producing properties or prospects for mineral exploration in the future.
The Company may be a passive foreign investment company under the U.S. Internal Revenue Code, which may result in material adverse U.S. federal income tax consequences to investors in Common Shares that are U.S. taxpayers: Investors in Common Shares that are U.S. taxpayers should be aware that Cardero believes that it has been in one or more prior tax years, and may be in current and future tax years, a passive foreign investment company under Section 1297(a) of the U.S. Internal Revenue Code (a PFIC). However, no determination has been made regarding Carderos PFIC status for any particular tax year. If Cardero is or becomes a PFIC, generally any gain recognized on the sale of the Common Shares and any excess distributions (as specifically defined) paid on the Common Shares must be rateably allocated to each day in a U.S. taxpayers holding period for the Common Shares. The amount of any such gain or excess distribution allocated to prior years of such U.S. taxpayers holding period for the Common Shares generally will be subject to U.S. federal income tax at the highest tax applicable to ordinary income in each such prior year, and the U.S. taxpayer will be required to pay interest on the resulting tax liability for each such prior year, calculated as if such tax liability had been due in each such prior year. The amount of any such gain or excess distribution allocated to the tax year of disposition or distribution of the excess distribution and to years before the entity became a PFIC, if any, would be taxed as ordinary income.
Alternatively, a U.S. taxpayer that makes a qualified electing fund (a QEF) election with respect to Cardero generally will be subject to U.S. federal income tax on such U.S. taxpayers pro rata share of Carderos net capital gain and ordinary earnings (as specifically defined and calculated under U.S. federal income tax rules), regardless of whether such amounts are actually distributed by Cardero. U.S. taxpayers should be aware, however, that there can be no assurance that Cardero will satisfy record keeping requirements under the QEF rules or that Cardero will supply U.S. taxpayers with required information under the QEF rules, if Cardero is a PFIC and a U.S. taxpayer wishes to make a QEF election. As a second alternative, a U.S. taxpayer may make a mark-to-market election if Cardero is a PFIC and the Common Shares are marketable stock (as specifically defined). A U.S. taxpayer that makes a mark-to-market election generally will include in gross income, for each taxable year in which Cardero is a PFIC, an amount equal to the excess, if any, of (a) the fair market value of the Common Shares as of the close of such taxable year over (b) such U.S. taxpayers adjusted tax basis in the Common Shares.
- 29 -
The above paragraphs contain only a brief summary of certain U.S. federal income tax considerations. Investors should consult their own tax advisor regarding the PFIC rules and other U.S. federal income tax consequences of the acquisition, ownership, and disposition of Common Shares.
Material Mineral Projects
Carbon Creek Metallurgical Coal Deposit, British Columbia, Canada
Information in this AIF regarding the Carbon Creek property is based on information provided by the Carbon Creek Report. The following summary is from the Carbon Creek Report and the detailed disclosure in the Carbon Creek Report is incorporated into this AIF by reference. Readers are encouraged to review the entire Carbon Creek Report, which is filed on SEDAR at www.sedar.com.
Location
The Carbon Creek property lies approximately 60km northwest of the town of Chetwynd, BC and 40km west of the town of Hudsons Hope. Improved forest service roads connect the property with British Columbia Highway 29 between the towns of Chetwynd and Hudson Hope. The CN Rail line connecting Fort St John and Tumbler Ridge areas with Prince George passes 40km south of the property. The CN Rail line provides direct access to the ports of Vancouver and Ridley Terminals in Prince Rupert, BC.
Tenure and Joint Venture
The Carbon Creek property is in the Peace River Coalfield and consists of twelve Coal License Applications (and any coal licenses issued pursuant to such applications) and ten Crown Granted District Lots (CGDL), comprising a contiguous tenure parcel of 17,200ha.
Ten of the Coal License Applications have been submitted by P. Burns Resources Ltd. (Burns) of Calgary, Alberta and, upon the issuance of any coal licenses thereunder, such licenses are to be transferred to the Carbon Creek Partnership (CCP), an Alberta partnership. One Coal License Application has been submitted by Alan A. Johnson (Johnson), and one has been submitted by Cardero Coal.
The CGDLs, totalling approximately 2,600ha, are controlled by Peace River Partnership (PRP), an Alberta partnership. Cardero Coal has entered into an option to acquire a coal lease over the CGDL from PRP.
Cardero Coal has entered into an agreement with Johnson to purchase the one coal license to be issued pursuant to the Coal License Application submitted by Johnson (subject to the issuance of the applicable coal license).
Cardero Coal has entered into a joint venture agreement with CCP, in which Cardero Coal will have a 75% interest and CCP will have a 25% interest. Pursuant to the joint venture agreement, each joint venture partner is contributing its interest in the Carbon Creek property, being the coal lease over the CGDL (when acquired by Cardero Coal), and all coal licenses (if and when issued to Burns and transferred to CCP and if as and when issued to Cardero Coal pursuant to the applicable Coal License Applications and, in the case of the coal license which may be issued to Johnson pursuant to his Coal License Application, upon its acquisition from him by Cardero Coal). The joint venture, known as the Carbon Creek Joint Venture, will control and operate the Carbon Creek property described above. The joint venture agreement provides that the CCP interest is a carried net profits interest which requires Cardero Coal to fund the exploration, development, construction and operation of the mine and that the CCP receives no profits until Cardero Coal has recovered its investment. At that point, the CCP is entitled to 25% of the net profits of the Carbon Creek Joint Venture.
- 30 -
Cardero Coal is the manager of the Carbon Creek Joint Venture.
Cardero completed the acquisition of the balance of the outstanding shares of Coalhunter through a plan of arrangement that was completed on June 1, 2011.
Geology
The local geology of the Carbon Creek Property consists of a doubly-plunging syncline which lies between two anticlinal belts that straddle the western and eastern boundaries of the property. The synclinal axis roughly parallels the course of Carbon Creek, and plunges gently (less than 5°) to the south-southeast through the main project area. Dips in the central portion of the property are nearly flat, ranging from 0º to 15º, increasing to up to 30º along the synclinal flanks in the east and west portions of the property. Dips through the east and central portions of the initial development area are very mild due to their proximity to the syncline axis. Dips increase to the west moving up the western limb of the syncline.
Four north-south trending faults were identified in early exploration programs and were thought to die out in these directions. According to Utah Mines Ltd. (Utah) dips of strata in proximity to these faults increase to the point where they effectively separate the property into discreet mining blocks. The three westernmost faults were interpreted to be high-angle reverse faults with displacements estimated to range from between 50m to 70m. The easternmost Carbon Creek fault was speculated to be a high-angle thrust and having significant displacement, in the range of hundreds of meters, based on the interpretation of a coal-barren portion of the upper Gething being exposed on its eastern side.
Recent field work conducted by Cardero Coal has shown that the severity of the faulting may be less than estimated by Utah during their evaluations in the late 1970s and early 1980s. Definitive data that would permit accurate, detailed mine planning in the areas proximal to suspected faults has yet to be collected and/or evaluated. The most notable change in interpretation is the intersection of what is believed to be the lower coal seams of the propertys stratigraphic sequence on the east side of the Carbon Creek Fault. This fault was formerly thought to have had sufficient uplift to expose the barren zone of the Gething Formation lying below the coal horizons. Although not sufficiently defined as a resource for inclusion in the Carbon Creek Report, it does present an exploration target for establishing additional resource tonnage in the future.
Mineralization
The mineralized zones encountered on the property are predominantly medium volatile bituminous coal seams, with minor increase or decrease in rank depending on structural or stratigraphic variations and depth of burial. Historic coal quality reports indicate that the coals will, with beneficiation (washing) to remove impurities, produce a product with coking properties suitable for metallurgic applications. Thermal coal suitable for electric power generation could be produced with or without further processing in addition to, or as an alternative to, a coking coal product.
Coal Occurrence
Over thirty coal seams occur in the middle and upper portions of the Gething Formation. Sixteen seams are present through the northern half of the property. Twelve main seams have figured prominently in historic coal tonnage calculations.
Coal deposition is typical of the Gething Formation, consisting of abundant coal seams, some showing favorable metallurgical properties. The twelve seams listed in Table 1.1 are developed sufficiently to be of economic significance. These seams range from 1.14m to 2.17m in average thickness. Raw coal qualities are presented for each of these seams. Values shown represent coal without out-of-seam dilution (OSD). Processing coal mixed with OSD using size specific density and froth flotation separating processes (coal washing) is widely used to improve coal quality by reducing ash content and raising its calorific value. Coking properties such as free swelling index (FSI) and dilation are typically improved as well, through washing.
- 31 -
Table 1.1 Raw Coal Quality
SEAM |
AVERAGE THICKNESS (M) |
COAL QUALITY (AIR DRIED BASIS) | ||||||
MOISTURE (%) |
ASH (%) |
SULPHUR
(%) |
VOLATILE MATTER (%) |
FIXED
CARBON % |
CALORIFIC
VALUE BTU/LB |
FSI | ||
58 | 1.14 | 2.60 | 12.56 | 0.92 | 28.92 | 55.93 | 12,663 | 2.0 |
55 | 1.57 | 2.74 | 12.42 | 0.68 | 28.59 | 56.26 | 12,893 | 2.5 |
54 | 1.39 | 2.78 | 5.66 | 0.83 | 27.36 | 64.20 | 13,926 | 1.5 |
52 | 1.63 | 2.18 | 17.14 | 1.88 | 28.33 | 52.35 | 12,178 | 4.0 |
51A | 1.29 | 2.74 | 6.25 | 0.80 | 28.01 | 63.00 | 13,902 | 2.0 |
51 | 1.51 | 2.73 | 9.63 | 0.73 | 26.42 | 61.23 | 13,228 | 2.0 |
47 | 1.14 | 2.53 | 15.49 | 0.91 | 24.00 | 57.98 | 12,441 | 1.5 |
46 | 1.70 | 2.60 | 6.50 | 0.83 | 26.92 | 63.99 | 13,907 | 2.0 |
40 | 1.95 | 2.02 | 13.99 | 1.17 | 27.16 | 56.83 | 12,892 | 5.5 |
31 | 1.99 | 1.50 | 25.74 | 1.42 | 24.33 | 48.43 | 10,906 | 6.0 |
15 | 2.17 | 1.08 | 17.11 | 0.57 | 21.14 | 60.67 | 12,602 | 2.5 |
14 | 1.91 | 0.95 | 19.03 | 0.57 | 19.20 | 60.83 | 12,362 | 3.0 |
Raw coal qualities indicate good coking coal potential in seams 31, 40 and 52 based on average FSI values. In-place raw ash contents are generally low and all seams will be improved with washing which would reduce ash content further and typically increase the FSI by a few points. With careful blending, the other seams would likely be saleable in the coking coal market.
Exploration
The periods and types of coal exploration undertaken on the property are summarised in Table 1.2. The coal exploration methods can be separated into four types: regional mapping and field sampling, aerial surveys, coring and open-hole (rotary) drilling, and bulk sampling. Types by era are summarized below.
Table 1.2 Exploration Methods
Year |
Company/
Individual |
Drill Holes |
Exploration Activity |
1908 to 1942 | Various* | Surface mapping, and sampling, trenching | |
1943 | Stines | Surface mapping, and sampling, trenching | |
1945 | Mathews | Surface mapping, and sampling, trenching | |
1970 | Trend Exploration | Aerial reconnaissance mapping | |
1971 | Utah | 9 | Surface mapping and drilling |
1972 | Utah | 14 | Surface mapping and drilling |
- 32 -
Year |
Company/
Individual |
Drill Holes |
Exploration Activity |
1973 | Utah | 16 | Surface mapping and drilling |
1975 | Utah | 36 | Surface mapping, drilling, and 2D seismic program |
1976 | Utah | 181 | Surface mapping, drilling and bulk sampling from adits |
1981 | Utah | 45 | Surface mapping and drilling |
2010 | Coalhunter | 8 | Validation drilling (coring) |
All drilling was vertically orientated, targeting coal seams that were mostly dipping between 5o and 20o from vertical. Approximately one third of the 309 holes drilled on the property were sampled core holes. The rotary holes were completed for the purposes of coal seam correlations and mapping depth of surface weathering.
Cardero Coal has been conducting a sizable exploration and development drilling project within the CGDL area of the property since August of 2011. Drilling data from this program has not been used to define resources in the Carbon Creek Report but will be assimilated into an updated geologic model for planned feasibility work during 2012.
Coal Resources
A resource estimation of the Carbon Creek property was completed in accordance with the procedures and criteria of Geological Survey of Canada (GSC) Paper 88-21 as required by NI 43-101. The mineral resource estimates for surface and underground moderate geology-type coal reported from the current Carbon Creek geologic model are outlined in Table 1.2. The resource statement is current as of October 1, 2011. Surface mineable resources are based on mining to a maximum strip ratio (waste volume to tonne of in-place coal) of 20 to 1.
Carbon Creek has an estimated 166.7Mt of in-place coal resources in the measured and indicated categories. Table 1.3 breaks these resources into surface and underground tonnes.
Table 1.3 Classification of Resource Carbon Creek Property October 1, 2011
Deposit Type |
ASTM Coal Rank |
Measured (Mt) |
Indicated (Mt) |
Inferred (Mt) |
Surface | mvB | 33.1 | 20.1 | 19.6 |
Underground | mvB | 42.4 | 71.1 | 147.5 |
Total | mvB | 166.7 | 167.1 |
The accuracy of resource estimates is, in part, a function of the quality and quantity of available data and of engineering and geological interpretation and judgment. Given the data available at the time the Carbon Creek Report was prepared, the estimates presented herein are considered reasonable. However, they should be accepted with the understanding that additional data and analysis available subsequent to the date of the estimates may necessitate revision. These revisions may be material. There is no guarantee that all or any part of the estimated resources will be recoverable. Mineral resources are not mineral reserves and there is no assurance that any mineral resources will ultimately be reclassified as proven or probable reserves. Mineral resources which are not mineral reserves do not have demonstrated economic viability.
- 33 -
Mineable Coal
Based on the geological model developed in the Carbon Creek Report a general mining layout was prepared for both surface and underground mining areas. Applying mining parameters, as discussed in Section 16 of the Carbon Creek Report, a potentially mineable tonnage estimate was developed for each mining method as shown in Table 1.4.
Table 1.4 Potentially Mineable Coal Tonnes Through Year 30
Mining Method |
Mineable Tonnes
(millions) |
Resource Tonnes
(Measured & Indicated) |
Surface | 21.8 | 53.2 |
Underground | 115.2 | 113.5 |
Combined Total | 137.0 | 166.7 |
The Run of Mine (ROM) surface potentially mineable tonnes are significantly lower than the surface resource identified above. This difference is explained by the fact that much of this resource is higher strip ratio and higher cost relative to underground mining methods. The ROM underground tonnes exceed the geological resource estimate because the mining layout includes a small amount (1.7Mt) of Inferred tonnes.
Coal Processing
ROM coal will be crushed and sent to a coal washery where ash will be removed through heavy media separation of the coarse fractions and floatation for the fines fractions. Wash plant yields have been estimated on average at 68% for surface mined coal and 62% for underground mined coal. Individual yield and indicative clean coal specifications are presented in more detail in Section 13 of the Carbon Creek Report. The clean coal will be dried in a fluidized bed dryer to approximately 6% moisture and stored in covered storage to keep it dry until shipment.
Production Volume and Schedule
Annual production is based on the mine plans described in Section 16 of the Carbon Creek Report. The surface mine will begin operations first, with the underground mine beginning operations two years after the surface mine. This allows time to develop an area to access the underground mineable coal seams. The combined mining operation is planned for 30 years excluding pre-production development and construction time.
The surface mine is projected to begin production at 3.1M ROM tonnes per annum (tpa) and maintain this level for 7 years. The expected wash plant yield of 68% results in 2.1Mtpa (Million tonnes per annum) saleable coal from the surface mine. This production from surface mining is expected to yield 14.8Mt saleable over the seven year period (years 1 7).
The underground mine is expected to begin production in the third year of mine operations at .59Mtpa ROM increasing to the steady state level of 4.7Mtpa ROM by the beginning of the eighth year of mining operations. The expected wash plant yield of 62% results in 2.9Mtpa saleable from the underground mine. The underground mine is assumed to operate 28 years producing 115.2M ROM tonnes and 71.4M saleable tonnes. This production schedule depletes the measured and indicated underground mineable coal tonnes shown above in Table 1.4.
Transportation
Clean coal will be loaded into highway type coal haulers operated by a trucking contractor and hauled approximately 69km to a rail loadout on the CN railway. The coal will be offloaded into a bottom-dump hopper and conveyed to a twin dome covered storage structure. Clean coal will be drawn from beneath the storage piles onto a reclaim conveyor and loaded through a batch weighing system into unit trains. The coal will be transported to the ports of Vancouver and/or Prince Rupert for loading onto ships for transport to the Pacific Rim markets. The clean coal will be exposed to the elements during train transport and while stockpiled temporarily at the port and is expected to increase in moisture content to about 8%m, which is the preferred maximum for ocean shipping.
- 34 -
Capital Costs
Assumptions regarding capital expenditures are detailed in Section 21 of the Carbon Creek Report. All dollar values throughout the Carbon Creek Report are in US$. Pre-production capital requirements total $301M and include coal handling, coal preparation, train loadout facilities, surface facilities, site access and power, and mine development and contingency. All major surface and underground mining equipment is assumed to be leased with a seven year lease term at 4.5% and a 20% residual. The total value of the mining equipment being leased is $151M. Annual lease payments at full production for surface mining total $12.3M and $9.6M for underground.
Total capital excluding leased equipment is $504M over the LOM. Lease payments for mining equipment total $321M over the LOM.
Manpower
Manpower requirements to operate and maintain the surface and underground mines and coal processing plant are shown in Tables 1.5 and 1.6.
Table 1.5 Manpower Requirements
Surface Mine and
Four Underground Units (through year 7)
Area | Hourly Workers | Management | Totals |
Surface Mine | 190 | 28 | 218 |
Underground Mine | 220 | 61 | 281 |
Prep Plant | 62 | 11 | 73 |
Totals | 472 | 100 | 572 |
Table 1.6 Manpower Requirements
Eight Underground Units (Year 8 through Year 30)
Area | Hourly Workers | Management | Totals |
Underground Mine | 432 | 98 | 530 |
Prep Plant | 62 | 11 | 73 |
Totals | 494 | 109 | 603 |
Operating Costs
Operating costs have been estimated for the surface and underground mines based on required equipment hours, labour hours and materials and supplies. These costs are shown in Table 1.7 on a unit basis for each mine and the coal handling and preparation plant (CHPP).
- 35 -
Table 1.7 Cash Operating Costs
Cost Area | $/ROM tonne | $/Clean tonne |
Surface Mining | 30.62 | 50.77 |
Underground Mining | 31.86 | 57.68 |
Coal Handling & Prep | 3.90 | |
Sub-Total ( Includes equipment lease payments) | 60.76 | |
Indirect Costs | 10.51 | |
Total Cash Costs | 71.27 |
Economic Results
Norwest prepared an economic model in US$ that captures direct costs, including labor, equipment, materials, production taxes and royalties. Indirect costs including corporate overhead, mineral tax and property tax were added to the model along with depreciation of purchased equipment and facilities. A cash flow calculation was prepared on an after tax basis using an average FOB price of $185 per saleable tonne and an average clean coal production of 2.9Mtpa. Clean coal production increases from 2.1Mtpa to 3.2Mtpa over the first seven years of production and then averages 2.9Mtpa for the remaining mine life of 23 years. The first seven years includes surface mine production and the ramp up of underground mining. After seven years, the property is mined by underground methods only.
Pre-production cash outflows total $301M over the estimated three year development and construction period. Cash flow is positive once production begins and payback occurs by the end of the third year of production or six years after the initial cash outflow. After payback and providing for the net profits interest, cash flow averages $115M per year for a total net cash flow of $3.1B over the life of the mine for Carderos 75% interest.
The internal rate of return for Carderos 75% interest in the Carbon Creek Joint Venture is approximately 29%. Net present values at 8%, 10% and 12% are shown in the Table 1.8.
Table 1.8 NPV Results Carderos 75% Interest ($millions)
Interest Rate | 8% | 10% | 12% |
NPV | $752 | $551 | $408 |
The internal rate of return for the entire property is approximately 35.1% . Net present values at 8%, 10% and 12% are shown in Table 1.9.
Table 1.9 NPV Results 100% Interest ($ Millions)
Interest Rate | 8% | 10% | 12% |
NPV | $1,070 | $800 | $605 |
The Carbon Creek Report is preliminary in nature, and includes inferred mineral resources. Inferred mineral resources are considered too speculative geologically to have technical and economic considerations applied to them that would enable them to be categorized as mineral reserves. Mineral resources that are not mineral reserves do not have demonstrated economic viability. Accordingly, there can be no certainty that the results estimated in the Carbon Creek Report will be realized.
- 36 -
Sensitivity Analysis
Sensitivity of the economics regarding coal sales price, direct mining costs and capital expenditures were evaluated. The results are summarized in Table 1.10.
Table 1.10 Sensitivity Analysis ($millions)
IRR | NPV at 8% | NPV at 10% | NPV at 12% | |
Base Case at $185 | 29.3% | $752 | $551 | $408 |
Coal Sales at $270 | 46.3% | $1,755 | $1,335 | $1,033 |
Coal Sales at $141 | 16.1% | $229 | $142 | $79 |
10% Increase in Direct Mining Costs | 28.6% | $696 | $510 | $377 |
10% Increase in Capital Costs | 28.6% | $753 | $551 | $407 |
Given the high margins, the project is more sensitive to changes in coal prices than it is to changes in direct mining costs and capital costs. The 10% increase in capital cost does not result in any significant change in NPV because it delays the effect of the net profits interest.
Table 1.11 summarizes the key results of the Carbon Creek Report.
Table 1.11 Carbon Creek Project Summary
Resource Measured & Indicated | Mt | 166.7 |
Resource Inferred | Mt | 167.1 |
Underground Potentially Mineable Tonnes | Mt | 115.1 |
Mean Plant Recovery | % | 62% |
Underground Clean Coal Tonnes | Mt | 71.4 |
Surface Potentially Mineable Tonnes | Mt | 21.8 |
Mean Plant Recovery | % | 68% |
Surface Clean Coal Tonnes | Mt | 14.8 |
Total Clean Coal Tonnes Produced | Mt | 86.2 |
Surface Mining Minimum Seam Thickness | M | 0.6 |
Surface Mining Maximum strip ratio | Ratio | 12.5:1 |
Underground Mining Minimum Seam Thickness | M | 1.2 |
Full Production Rate Clean Coal per Year | Mt/yr | 2.9 |
Pre-production Capital Costs | M$ | 301 |
Sustaining Capital LOM | M$ | 203 |
Value of Leased Equipment LOM | M$ | 151 |
Surface Mine OPEX ROM Basis | $/t | 30.62 |
Underground Mine OPEX ROM Basis | $/t | 31.86 |
Surface Mine OPEX Clean Coal Basis | $/t | 50.77 |
Underground Mine OPEX Clean Coal Basis | $/t | 57.68 |
Processing OPEX | $/t | 3.90 |
Average direct mine costs (incl. equipment lease) Clean Coal Basis | $/t | 60.76 |
Haul, Rail & Port Costs | $/t | 42.42 |
- 37 -
FOB Price Long-Term Base Case | $/t | 185 |
Gross Revenue LOM | M$ | 15,952 |
Operating Costs LOM | M$ | 6,145 |
Pre-Tax Operating Cash Flow LOM | M$ | 6,149 |
Post-Tax NPV 8 (75% Basis) | M$ | 752 |
Internal Rate of Return (75% Basis) | % | 29.3 |
Post-Tax NPV 8 (100% Basis) | M$ | 1,070 |
Internal Rate of Return (100% Basis) | % | 35.1 |
Total Undiscounted Post-Tax Cash Flow (75% Basis) | M$ | 3,113 |
Conclusions
Based on the results of the Carbon Creek Report, Norwest has reached the following conclusions:
1. |
There are sufficient potentially mineable tonnes of metallurgical grade coal in the Carbon Creek resource area to produce approximately 2.9Mtpa saleable coal for a 30 year period. | |
2. |
No fatal flaws have been identified at this stage of project development. | |
3. |
Pre-production capital costs, estimated at $301M will be required to bring this project into production. Additional capital, including replacement of $203M will be required to sustain operations over the remaining life of the mine. | |
4. |
Operating costs per tonne of clean coal average $71.27. | |
5. |
At a conservative price for metallurgical grade coal of $185, this Project will generate positive cash flows and achieve an internal rate of return (IRR) on investment of 29.3%. |
Recommendations
Development Drilling
The results of the 2011 drilling program should be included in the geological database and a new geological model produced. This will provide a better mine planning base as well as indicate where future development drilling is needed to increase confidence in the resource estimates.
Mine Planning Refinement
Additional refinement of the geologic model along with a detailed mine plan is recommended and will yield a revised and more accurate recoverable reserve base if reserves are defined in the future. This work should be completed at the Prefeasibility level of project evaluation. Optimum production plans and methods should be analyzed. One example for further study is to examine surface mineable coal extractable by contour and highwall mining methods. Highwall mining generally has proven prudent in resource recovery and cost efficiency. Further evaluation can provide insight into the applicability of highwall mining at this property.
CHPP Design and Construction
Prior to proceeding with the project for detailed design and construction, Norwest recommends that additional studies be performed to better characterize the coals to ensure proper equipment design. The best available information and best practices were implemented in the design of the system, although additional information will supplement the database for final design.
Additional studies and recommended data include:
- 38 -
Further metallurgical characterization of main seams and potential blends.
Materials characteristics tests for the projected refuse materials.
Environmental loads including temperature ranges, wind load, and expected snow and rain precipitation can be collected during a site data collection campaign. For the purposes of this study, regional data was used to estimate the effective loading.
Geotechnical Studies
Geotechnical sampling and detailed core logging should be conducted in conjunction with any drillcore activities in order to build a current rock mechanics database. Most of this work is already underway in the 2011 drilling program.
A full investigation of the foundation material around the plant and surface facilities area as well as the waste impoundment area is required. Anecdotal information was used in this design study using best practices and information from similar projects in the area, although site construction will require further studies. Detailed geotechnical data is being collected as part of the 2011 field program.
Water Supply Hydrology
Additional work on the property should include well completions and pump tests for defining groundwater characteristics and establishing monitor wells for baseline permitting data.
A water recovery and aquifer study will be required prior to project implementation. For this study, it was assumed that a sufficient supply will be available.
Thermal Dryer
Research Turbo dryer as a possible lower cost option to the fluidized bed coal dryer.
The Company cautions that the foregoing economic analysis (PEA) is only preliminary in nature, and is based on technical and economic assumptions which will be evaluated in further studies. The PEA is based on the current (as at October 1, 2011) Carbon Creek estimated resource model, which consists of material in both the measured/indicated and inferred classifications. Inferred mineral resources are considered too speculative geologically to have technical and economic considerations applied to them. The current basis of project information is not sufficient to convert the mineral resources to mineral reserves, and mineral resources that are not mineral reserves do not have demonstrated economic viability. Accordingly, there can be no certainty that the results estimated in the PEA will be realized.
Planned Activities
The Company is proceeding with the preparation of a pre-feasibility study on the Carbon Creek project, which it anticipates will be complete in Q3 of 2012. In connection with the prefeasibility study work, the Company will carry out the recommendation set out in the Carbon Creek Report which are applicable to the CGDL portion of the Carbon Creek project. All necessary permits are in place for this portion of the program, and the Company has the funds to complete the proposed program.
Sheini Hills Iron Project, Ghana
Information in this AIF regarding the Sheini Project is based on information provided by the Sheini Report. The following summary is from the Sheini Report and the detailed disclosure in the Sheini Report is incorporated into this AIF by reference. Readers are encouraged to review the entire Sheini Report, which is filed on SEDAR at www.sedar.com.
- 39 -
Property Description and Location
The Project is located in the Zabzugu-Tatale District in the Northern Region of the Republic of Ghana. The Project area (Project Area) consists of three contiguous prospecting licences (Prospecting Licenses) covering a cumulative licence area of 397.5 square kilometres. The Government of the Republic of Ghana acting by the Ministry of Lands and Natural Resources has issued a licence document dated December 8, 2011 for each of the three Prospecting Licences (Sheini North, Sheini and Sheini South).
The Prospecting Licences were issued to Emmaland Resources Limited (Emmaland), a local Ghanaian company. Cardero Ghana Ltd. (Cardero Ghana), an indirect wholly owned Ghanaian subsidiary of Cardero, has entered into three separate joint ventures (one for each Prospecting License) with Emmaland. The object of each joint venture is to explore and, if warranted, develop the lands subject to the relevant Prospecting Licence. The effective date for each of the joint venture agreements is December 12, 2011.
Under the three joint ventures, Cardero Ghana will have the right to earn a 100% working interest in each Prospecting Licence, subject to (a) a 10% NPI (net profit interest) in favour of Emmaland and (b) a 10% fully carried interest, in favour of the Government of Ghana, in the portions of the licence areas that become the subject of one or more mining licences subsequently issued to Emmaland. Cardero Ghana will have the right to purchase the 10% NPI held by Emmaland in a joint venture at any time for an amount representing the net present value thereof, as calculated by an independent engineering firm, or such other amount as is acceptable to Emmaland. There are no other royalties or back-in rights to which the Project is subject.
In order to earn its interest, Cardero Ghana is required to fund all expenditures under each of the particular joint ventures and make cash payments to Emmaland totalling USD 16,600,000. To date, USD 6,450,000 million has been paid in scheduled payments and advances.
Each Prospecting License outlines a required work program and an expenditure commitment based on this work program. The expenditure commitments relate to the initial two-year licence period, ending December 8, 2013, and total USD 9,180,966 for all three Prospecting Licenses.
Accessibility, Climate, Infrastructure, and Physiography
The Project is situated in the eastern part of Ghanas Northern Region, close to the border with Togo and approximately 400 kilometres north of Ghanas capital city, Accra. Tamale, Ghanas second largest city is the regional capital and an administrative centre, as well as the regional transportation hub. Sheini Village lies approximately at the centre of the concession, 20 kilometres southeast of Zabzugu.
Transportation between the main centres of population in the region is mostly by road, although there are reasonable air connections between the regional centres. Tamale is the main population centre in the region with approximately 360,000 people. Sheini Village has a population of between 400 and 500. There are a number of smaller communities south of Sheini with populations of between 100 and 200 people.
The closest railway line in Ghana to the Sheini area is the AccraKumasi rail line located approximately 350 kilometres south. The Ghana government has long-term plans to extend the existing railway line to Tamale and Yendi. A rail line exists closer to the Sheini area at Blita in Togo, located approximately 100 kilometres southeast of the Sheini Village. This railway line extends south to the port at Lomé, Togos capital, and is used primarily for the transport of limestone and phosphates.
In Ghana, the Tema sea port, the largest in the country, is located approximately 390 kilometres south-southwest of the Sheini area and approximately 30 kilometres east of Accra.
- 40 -
A major power line follows the TamaleYendiZabzuguTatale road, which brings power to the towns and villages along this route. Zabzugu, the closest town with electrical power, is located 20 kilometres northwest of the Sheini area.
The Oti River represents the major water source and is located 20 kilometres west of the Sheini area. The river rises in Burkina Faso and forms part of the international boundaries between Benin and Burkina Faso and between Togo and Ghana.
The Northern Region of Ghana is located in the savannah belt with a typical hot, sub-Saharan climate. There are two major seasonsdry and wet. Climatic conditions are not expected to adversely impact exploration activities in the area.
The physical geography of Ghanas Northern Region reflects the geological setting of the area. The landscape surrounding Tamale is generally flat due to the soft sedimentary rocks of the Volta Basin. The landscape becomes more undulating east of Tamale and of the Oti River, suggesting the presence of more resistive rock formations.
The Oti River produces a broad valley with elevations of 8090 metres above sea level in the vicinity of the Sheini area. Toward the Togo border, ridges standing several hundred metres above the surrounding savannah are elongated in a northsouth direction.
Project History
The first detailed exploration work that focused on the iron occurrences around Sheini Village was by E. H. Jacques in the 1950s. His report (1958) summarizing the exploration work was re-printed by Ghanas Geological Survey Department (GGSD) in 2003 (Archive Report No. 85).
According to this report, Jacques and his team carried out geological mapping, technical work, trenching (10 trenches), and diamond core drilling (nine boreholes) along the ridges with iron mineralization from Kandin in the north to the Kubalem area in the south, comprising approximately 35 kilometres of strike length. Jacques describes eight groups of iron-mineralized bodies from this large area.
All of the samples taken during this phase of exploration were assayed for iron and silica only. A small number of samples were also assayed for phosphorous. The results, presented in Jacques report as tables, show iron grades in the range of 30%50% iron, with silica content of usually more than 15% SiO2. The content of phosphorous is usually below 0.2%P2O5.
In the early 1960s, geoscientists from the Soviet Union were invited to Ghana to assist with geological mapping, with prospecting, and with performing numerous specific studies in northern Ghana. The iron occurrences around Sheini Village were studied as part of one of the projects managed by the Soviets. The work included detailed geological mapping, trenching, and drilling. The results were summarized in several reports and some of them have been re-printed by the GGSD. The reports indicate that the exploration was focused mainly on the area northwest, west, and southwest of Sheini Village.
No significant exploration work was done in the Sheini area after the Soviet geologists left Ghana. According to the GGSD, small-scale exploration work has been done by St. Jude Resources Ltd. (Vancouver, BC) in the Sheini North area during 20042006. The exploration was testing the concept that the iron occurrences may be of epigenetic origin, similar to Olympic Damtype Iron Oxide Copper Gold (IOCG) deposits. The St. Jude Resources exploration concession expired in 2006.
In 2008, the Minerals Commission of Ghana granted non-exclusive exploration permits to twelve companies. The size of the non-exclusive exploration permit granted was 178.81 square kilometres, coincident with Emmalands current Sheini Prospecting Licence and part of the Sheini North Prospecting License. The Minerals Commission of Ghana ran a competitive bidding process, with the Prospecting Licences being awarded to the company submitting the winning bid. A report was submitted by each company, including due diligence sampling results (where such work had been done), together with recommendations for multi-phase exploration and ultimate exploitation of the iron mineralization in the Sheini area.
- 41 -
The results of the work together with recommendations for a further exploration program were summarized in the report submitted to the Minerals Commission of Ghana. In December 2011, the Minerals Commission of Ghana granted three Prospecting Licenses to Emmaland covering the Project Area.
Geological Setting
At the regional scale, the Project is located within the eastern part of the West African Craton called the Eastern Pan African Domain. The Project Area is located in the Togo Belt, starting in southeast Niger and running south-southwest to southeastern Ghana, comprising supracrustal sediments and volcanics of probable late Precambrian to early Phanerozoic age. The Togo Belt consists of Buem Formation and Togo Formation. The rocks of the Buem Formation are dominated by east- to southeast-dipping clastic sediments, mainly sandstones, siltstones, shales, and mudstones. Massive chert (silexites), limestones, and dolomites are known from Togo.
The Iron Formation is located mainly within the Ghanaian part of the Buem Formation, but some of the bodies also cross the border into Togo. The iron mineralization is associated with tillites situated near the base of the Buem Formation.
The Iron Formation forms a folded sedimentary unit several hundred metres thick and outcropping along wide ridges (or sets of parallel ridges) running for more than 35 kilometres in a northsouth direction. They are composed of a number of horizons varying in lithology, grain size, and mineral composition. The individual horizons of the Iron Formation have a thickness between 20 and more than 100 metres and are inter-bedded with sandstones, siltstones, and probably quartzites. The iron bearing horizons dip 10°45°, mainly to the east-southeast (in the Sheini south and Kubalem area) and also to the west in the area west of Sheini Village.
Deposit Type
The observed geological, mineralogical, and geochemical features indicate that the Sheini mineralization fits a Banded Iron Formation (BIF) model. The wide scale presence of hematite and rarity of magnetite may indicate Hematite-rich Banded Iron Formation (H-BIF). More likely however, the low amount of magnetite at surface is probably due to surface alteration (oxidation) of magnetite to hematite (martite).
The relationship between hematite and magnetite will be clarified by the planned drilling. Based on similarities to other West African BIFs, the upper, oxidized layer is likely to be 70120 metres in thickness. The oxidized layer is likely to be underlain by a magnetite-facies, primary BIF.
Exploration
The initial exploration work in the Sheini area, completed by Emmaland with input from Cardero, was carried out during late 2010 and throughout 2011. The initial phase of work, from late 2010 to mid-2011, was focused on obtaining sufficient data to meet the requirements of the Minerals Commission of Ghana and to successfully win the tender to obtain prospecting licenses over the Sheini area. The second phase of exploration, subsequent to the issue of the three Prospecting Licences to Emmaland in late 2011, has consisted of reconnaissance mapping over new areas to the north and south of the original, non-exclusive exploration licence.
According to the available historical reports, there was extensive exploration carried out in the Sheini area between 1945 and 1980. No maps or tables showing the exact location of the historical workings (trenches and boreholes) remain. For this reason, prospecting was focused on locating these old workings to obtain an overview of the scale of the historical exploration work.
- 42 -
A total of 35 historical trenches, mainly trending east-west with total length of around 2,076 metres, have been located to date. The trenches are situated primarily along the ridges and steep slopes exposing the iron mineralization where access for drilling was difficult. Most of the trenches are oriented in an eastwest direction, which is perpendicular to the trend of the iron mineralization.
In addition to the trenches, 18 historical boreholes have been located during prospecting. According to the historical reports, 23 boreholes were drilled between the 1950s and 1970s. It is not clear which of the located collars were drilled by Jacques team in the 1950s or by the Soviet team in the 1960s. As with the historical trenches, there appears to be very limited data remaining in the archives of the GGSD related to the drilling program.
In total, 29 trenches with an approximate length of 1,552 metres have been cleaned and prepared for sampling to date. One-meter-channel sampling was used to collect samples from the cleaned historical trenches. In total, 656 metres of channel sampling were carried out in 29 cleaned trenches with approximate total trench length of 1,552 metres. These 656 metres of channel sampling represent 659 channel samples. A total of 307 samples were prepared and assayed by ALS laboratory in Kumasi. The rest of the samples (449) are stored securely ready for transport in the future.
The results of the 269 trench samples (excluding blanks and duplicates) adequately confirm the findings presented by historical explorers. The results also confirm the field geological and mineralogical observations that BIF, due to its composition, grain size, and texture, is typically higher grade than Fragmental Iron Formation (Fragmental) (BIF and Fragmental are collectively referred to as the Iron Formations).
Table 2.1: Iron Results for Major Iron Formation Lithologies
Lithology |
Fe total. (%) | |||
Min. | Max. | Median | Mean | |
Banded Iron Formation (n=105) | 30.98 | 60.08 | 48.05 | 47.50 |
Fragmental Iron Formation (n=155) | 29.03 | 55.04 | 38.33 | 38.84 |
Fragmental Iron Formation (weathered) (n=9) | 16.51 | 25.46 | 20.07 | 20.55 |
Sample Analysis & QA/QC
The primary laboratory used for preparation and analysis of samples was the ALS laboratory at Kumasi, Ghana. Dr. Karel Maly of Aurum Exploration Services, Ireland (who was retained by Emmaland), visited the laboratory in 2011 to ensure that all aspects of sample preparation and analysis were satisfactory. The ALS is a global network of laboratories that operates to the highest international standards.
At the laboratory, the samples were crushed, pulverized, and assayed. Lithogeochemical analysis using the Lithium Borate Fusion and ICP-AES was used by ALS (code ME-ICP06) to determine the major elements oxides (SiO2, Al2O3, Fe2O3, CaO, MgO, Na2O, K2O, Cr2O3, TiO2, MnO, P2O5, SrO, BaO, and LOI).
No Certified Reference Material (CRM) was acquired and no CRMs were inserted into the batches of samples sent to ALS for preparation and analysis. The QA/QC procedure required the insertion of field duplicated material (inserted every 11th sample) and field blank material (inserted every 35th sample). The field blank material consisted of white barren quartzite collected from quartzite outcrops northwest of Sheini Village (coordinates 223156E 1015989N).
Prepared pulps for 10% of the assayed samples (29 samples) were sent to OMAC Laboratories in Ireland (OMAC) for analysis and comparison with the ALS laboratory in Ghana. At OMAC, the same analytical method as used by ALS (lithogeochemical analysis using the Lithium Borate Fusion and ICP-AES (code BF/ES)) was chosen to obtain comparable results. Results indicate good correlation of the iron data between the ALS (original) and OMAC (check) laboratories for the samples, with a slight high bias (~2%) in the OMAC results. Five check samples, however, exhibit more than 10% relative difference, and all have lower Fe2O3 results in the check assays (OMAC). These samples are currently being re-run by OMAC in order to discern whether this may have been an intra-batch analytical error at the laboratory. This issue notwithstanding, the overall quality of the analytical data is considered to be good.
- 43 -
Recommendations
Cardero Ghana, as operator of the Sheini Hills Joint Venture, has exploration expenditure commitments of $9.18 million to be incurred by December 8, 2013. This minimum expenditure commitment is a sum of three separate $3.6 million commitments, relating to each of the three Prospecting Licences.
A $19.3 million exploration program, which excludes joint venture payments, is recommended for the upcoming period ending December 8, 2013. A preliminary budget of $5.79 million is recommended to move the project through Phase I drilling and metallurgical testing in 2012.
Cardero Ghana has already signed contracts with independent and reputable consultants to:
Process and interpret satellite imagery covering the Project Area. The results of this work are expected in Q1 2012. Their interpretation will help identify surface alteration of rocks associated with the oxidation and upgrade of primary BIF. Additionally, the study will provide a preliminary structural understanding of the Project Area.
Perform an airborne geophysical survey in Q1 2012. The interpreted data, expected to be available in Q2 2012, will help define the extent of BIF and Fragmental at surface and under cover (along strike to the north and south). This survey will also assist in outlining and interpreting the geological setting of the belt by highlighting resistivity and compositional changes.
Carry out a diamond drill program over the Project Area to identify DSO (direct shipping ore) and to reveal more about the geological setting of the Project Area and about the relationship between iron grade, oxidation state, and depth.
Future exploration should include:
Additional geological mapping to provide geological context to the iron-dominant ridges.
Conducting a detailed infrastructure and transport study to help with future project planning.
Monitoring of early-stage exploration planning and procedures, ultimately producing a 43-101 resource estimate for the Sheini Project.
Initiating an environmental baseline study across the entire area of the Prospecting Licences.
Planned Activities
The Company intends to proceed with Phase I of the recommended program, and work has already commenced in this regard. Subject to the results of Phase I being satisfactory and the Company securing the required funding, the Company intends to proceed with Phase II of the recommended work program upon the completion of Phase I. In any case, the Company intends to meet the required expenditures under each of the Prospecting Licenses.
Longnose Titanium Project, Minnesota, USA
Information in this AIF regarding the Longnose Titanium Project is based on information provided by the Longnose Report. The following summary is from the Longnose Report and the detailed disclosure in the Longnose Report is incorporated into this AIF by reference. Readers are encouraged to review the entire Longnose Report, which is filed on SEDAR at www.sedar.com.
- 44 -
Property Description and Location
The lands making up the Project (Project Area) are located in northeastern Minnesota in St. Louis County, Township 59N, Range 13W, Section 30 and is centered at: (Coordinate system: Universal Trans Mercator, Zone 15 North, North American 1983 Datum) 572200 metres East, 5268300 metres North.
Carderos indirect wholly owned subsidiary, Cardero Iron Ore (USA) Inc. (CIOUS), holds an option to acquire up to an 85% interest in the Project by incurring USD 1,850,000 in expenditures (to acquire 70%) and delivering a feasibility study (to acquire an additional 15%). Upon CIOUS earning its 70% or 85% interest, the optionor of the Project has the option to maintain its 30% or 15% interest and enter into a joint venture with CIOUS, or to convert its working interest to either a 10% or 5% net profits interest. Advance royalties and production royalties are payable to the underlying property lessors.
CIOUS has all required licenses, permits and registrations in place to carry out exploration and resource definition drilling. Additional permits will be required in the future to advance to the next stage.
Accessibility, Climate, Local Resources, Infrastructure and Physiography
Topographic relief is generally low, and the surface is flat-laying. Elevations range between 465 and 490 metres (m) above mean sea level. The ground cover at the Project Area is a mixture of Palustrine, forested wetlands (Cowardin classification system), and higher dry forested ground. Overburden, consisting of glacial till, is present and the depth to bedrock is approximately 3 m to 30 m from surface.
Accessibility is excellent, with the Project located off of a paved county highway via a well maintained gravel road.
The climate in northeastern Minnesota is mid-continental. Winter conditions usually begin in mid-December and last until mid-March, with frozen ground beginning in late December to early January. The spring thaw usually begins in mid-March to late April, with stable, dry spring-summer-fall conditions occurring from late April to mid-December.
The population of Aurora, Minnesota (the nearest major population centre) is approximately 1,850, and the nearby city of Hoyt Lakes (8 km, 5 miles, east of Aurora), Minnesota has a population of approximately 2,000 people.
The infrastructure in northeastern Minnesota related to mining activities is excellent, with low cost electricity, railroads, paved state and county highways, international shipping ports, mining professionals, mining vendors, and trained labor all readily available. International shipping ports are located along the north shore of Lake Superior, including Duluth/Superior, Silver Bay, Taconite Harbor, and Two Harbors, with linked rail systems to all.
History
The Project Area was the subject of historical exploration processes between 1950 and 2008. The deposit was initially discovered by Bear Creek Mining, while exploring for copper-nickel (Cu-Ni) deposits.
Twelve (12) drill holes were completed by American Shield Corp., Bear Creek Mining, and Nicor during the 1980s and 1990s.
The Project Area was held by a series of mining companies including American Shield and BHP Minerals International Inc. (BHP). BHP held the Project Area for some time in the 1990s. Most of the work completed by BHP centered on metallurgy, and TiO2 recovery. Initial metallurgical testing focussed on the production of an ilmenite concentrate. Further upgrading analysis was completed as well, the first of which involved a smelting and sulfation-leaching process developed by the US Bureau of Mines. Their second investigation involved an oxidation-reduction roast followed by chemical leaching, using a process called the Murso process.
- 45 -
Several large (1.5 tonne to 60 tonne) bulk samples were utilized to complete the metallurgical testwork. The larger samples were collected from out crop of the Longnose deposit, while smaller test samples were taken from core. The University of Minnesota, Natural Resources Research Institute, Coleraine Minerals Research Laboratory houses what remains of both bulk samples.
Geological Setting and Mineralization
The Project Area is located within the Superior Province of the Canadian Shield, and is underlain by intrusive rocks generated during the formation of the Midcontinent Rift. Mineralization is hosted by Oxide-bearing Ultramafic Intrusions (OUI or OUIs) that intruded into layered series intrusions of the Duluth Complex. OUIs are dominantly composed of coarse-grained to pegmatitic pyroxenite, peridotite, and dunite that contain approximately 10-40% titanium-iron oxide mineralization, dominantly as ilmenite with lesser titaniferous magnetite. Typically, zones of massive and semi-massive oxide are also present throughout the stratigraphy. Locally, some OUIs also contain abundant copper-nickel sulfide mineralization as well; however, this style of mineralization has not been intersected within the Project Area. Most OUIs occur along the western margin of the southern portion of the Duluth Complex, and display numerous shapes (sheet-, funnel-, dike- and pipe-like geometries) and inclinations (flat-lying, moderately-dipping, and sub-vertical).
The Longnose OUI is geologically interpreted to be a late-stage intrusion that cut early Duluth Complex stratigraphy, and is associated with magmatism generated by the 1.1 billion year old Midcontinent Rift system.
The Longnose OUl contains disseminated, semi-massive, and massive ilmenite and titaniferous-magnetite mineralization. The Project Area hosts a single intrusion which is at least 150 m thick, dipping shallowly to the southeast.
Mineralization at the Project Area dominantly consists of disseminated to net-textured, medium to coarse-grained, Ilmenite, titaniferous magnetite and magnetite. Olivine-rich ultramafic rocks (peridotite, feldspathic peridotite & dunite) host the majority of the titanium-iron oxide mineralization found in the Longnose OUI, and will often be net-textured with oxide minerals interstitial to silicates. Visual modal mineral calculations generally estimate that titanium-iron oxide minerals compose 15-35% of the peridotitic and dunitic rocks at the Project. Numerous massive and semi-massive titanium-iron oxide horizons or zones (45-100% titanium-iron oxide) have been intersected in drill core. These massive and semi-massive oxides seem to be dominantly hosted by peridotite and dunite, though they have been intersected within zones of pyroxenite as well. It is clear that the main mineralized intrusion at the Project is a thick, laterally and vertically continuous intrusion dominantly composed of a mixture of oxide-bearing peridotite, oxide-bearing dunite, massive oxide, and semi-massive oxide with between 15% and 100% titanium-iron oxide mineralization.
Exploration
Exploration at the Project has included surface sampling, geophysics and diamond drilling.
Twenty-seven diamond drill core holes have been drilled on the Project Area, including six holes drilled by CIOUS in 2010, and nine holes drilled by CIOUS in 2011. Historic drilling includes 12 drill holes completed by a variety of operators in the 1980s and 1990s. The historic drill core has been re-sampled by CIOUS during 2009 and 2010, where such material was available. In total, the twenty-seven holes totalled 5,217 m, with 1,979 m from historic holes and 3,238 m from CIOUS drill holes.
Drill hole spacing for the Project is variable (drill holes are not on a regular grid) between 50 m and 100 m. Drill core has been sampled in 1 m to 6 m intervals.
Exploration data has focussed on the geology and titanium (Ti) and iron (Fe) analytical sample data; however, other elements should be reviewed and potentially estimated in future analysis. Titanium was measured as TiO2 and iron was measured as Fe2O3.
- 46 -
Sample Preparation, Analyses and Security
CIOUS has utilized a thorough and robust procedure for sampling, sample preparation, analysis and security.
Procedures for core handling, logging, sampling and sample shipping were well thought out and well implemented. Analysis was completed by ALS, one of the largest commercial laboratories in the world. A robust program of quality assurance and quality control samples was implemented and met or exceeded industry standard procedures. Sample security and chain of custody documentation was maintained throughout the process and was thoroughly reviewed by SRK.
Data Verifications
Exploration data verification for the Project has included a site visit by SRK, enforced database structures, analytical quality assurance and quality control (QA/QC) samples, independent sampling and assay checking.
SRKs Wayne Barnett, Pr.Sci.Nat visited the site in July 2009 and Mike Johnson, P. Geo, visited the site in March 2010. During these site visits, SRK verified drill hole locations, drilling, logging and sampling procedures, security and documentation. SRK also collected independent sampling during these site visits and confirmed the TiO2 and Fe2O3 values for five Longnose samples.
CIOUS utilized an onsite database which validated the data entry process as it was being completed and reduced clerical errors. As well, Carderos head office checked the data upon import into their main exploration database in order to minimize data errors.
SRK verified 92% of the assay database by downloading these records directly from the commercial laboratory and checking them against the Mineral Resource database.
CIOUS completed QA/QC sampling (blanks, standards, duplicates) totalling 393 samples, equal to 23% of the total samples. SRK has reviewed the QA/QC sample insertion rate and results, and concluded that the analytical data should be reliable.
Mineral Processing and Metallurgical Testing
Most processing and metallurgical testwork at the Project was completed prior to CIOUS involvement in the property.
Historical metallurgical testwork indicated that there is a reasonable chance that a saleable ilmenite and magnetite concentrate could be created from the Longnose deposit. Metallurgical testing regarding the Longnose deposit has focussed primarily on optimizing ilmenite recovery and creation of the ilmenite concentrate.
The historic metallurgical testwork indicates a relatively simple processing flow sheet. It would include crushing the material to a selected size and processing the ore by density and then by magnetic properties. The density separation would remove the silicates from the much more dense oxides. The oxides would then be split into a non-magnetic / paramagnetic fraction as well as a magnetic fraction. Magnetite would partition into the magnetic fraction, while the ilmenite would partition into the non-magnetic / paramagnetic fraction. The magnetic fraction could be further upgraded to recover some ilmenite that would partition into that fraction. The ilmenite concentrate could then be sold to an external processing site, or could be processed at a newly created process facility as part of a further beneficiation/added value processing project; however, a potential upgrading facility would have very significant capital costs.
Historical testwork has shown that the concentrates created from the Longnose rock can be processed into a potentially saleable concentrate; however, the quality of the concentrate may be adversely affected by the high magnesium content of the ilmenite.
- 47 -
CIOUS has completed very limited metallurgical testing at this stage. Recent work includes only Davis Tube tests, which are used to determine the proportion of material which is magnetic and which is commonly associated with magnetite.
CIOUS will have to complete further metallurgical work for the Project if further economic analysis is contemplated.
Mineral Resource Estimates
In 2011, SRK was retained by Cardero to complete a Mineral Resource for the Longnose OUI deposit, as well as update the technical report for the Project.
SRK utilized Gemcoms Surpac® version 6.2 and several other software packages to complete the estimation. A comprehensive and validated drill hole database was utilized to complete the analysis. The database includes twenty-seven drill holes; however, only twenty-four were utilized in the estimation process due to issues with resampling of some historic drill holes. All 2010-11 drill hole data included multi-shot downhole surveys; however, historic holes did not have downhole surveys. The estimation process utilized 1681 samples out of the databases 1956 samples. A total of 855 specific gravity measurements were utilized to estimate bulk densities. Estimation of metal grades utilized regularized 2 m composites.
Two geological domains were defined for the estimation process. The domains were defined by the presence of peridotite or pyroxenite oxide bearing rocks. The peridotite domain has higher olivine content and encompasses higher TiO2 grades near the core of the deposit. The pyroxenite domain includes higher pyroxene content, has lower TiO2 grades and is generally found at the periphery of the deposit. The geological domains are generalized, with some instances of other rock types within each domain.
The estimations were made into a threedimensional block model with 20 m by 20 m by 10 m block size, with sub-blocking to 5 m by 5 m by 2.5m. Estimated parameters included specific gravity, TiO2 and Fe2O3 grades. Metal grade interpolation was completed through three passes using increasingly larger search ellipses and lower restrictions on sample inclusion in each pass. Search ellipses were generally flat pancakes with the shortest direction of continuity sub-vertically and the longest in the northwest-southeast direction. The search ellipse orientations, which dip 20 degrees to the east, were based upon variography completed on the 2 m composite data. Ordinary kriging (OK) was used to estimate TiO2 and Fe2O3, while inverse distance squared (ID2) was used to estimate the specific gravity data. Mineral resources were classified in accordance with definitions provided by the Canadian Institute of Mining (CIM) as stipulated in NI 43-101.
In order to quantify the Mineral Resources requirement of reasonable prospects of economic extraction, the block model was subjected to conceptual mining limits using an open pit optimization program. The process uses reasonable mining and processing parameters to define a conceptual pit within which the material with reasonable economic prospects should be contained. For the Project optimization runs, it was assumed that all TiO2 is contained in the mineral Ilmenite. Fe2O3 values were modified to reflect the amount of iron taken up by ilmenite as well as the component estimated to be within silicates. However, more detailed testing is required in order to properly quantify the magnetite content of the resource, so iron was not given any value in the resource pit optimization limits. Historic metallurgical data indicates that a very high percentage of the TiO2 is contained within ilmenite, with a relatively small component in titaniferous magnetite and silicates.
The Mineral Resource Statement for the Project is presented in Table 3.1 below.
- 48 -
Table 3.1: Mineral Resource Statement*, Longnose Project,
Minnesota, USA, SRK
Consulting (Canada) Inc, effective date, January 19,
2012.
Category (Open Pit**) |
Estimated Quantity
|
Estimated Grade | |
TiO2 | Adjusted Fe2O3*** | ||
Mt | % | % | |
Indicated | 58.1 | 16.6 | 18.8 |
Inferred | 65.3 | 16.4 | 19.4 |
* Mineral resources are reported in relation to a conceptual pit shell. Mineral resources are not mineral reserves and do not have demonstrated economic viability. All figures are rounded to reflect the relative accuracy of the estimate. All composites have been capped where appropriate. | |||
** Open pit (near surface) Mineral Resources are reported at a cut-off grade of 8% TiO2. Cut-off grades are based on a price of US$170 per tonne of Ilmenite back calculated to TiO2 and recoveries of 70 percent, without considering revenues from other metals including Fe. | |||
*** Reported Fe2O3 has been lowered to reflect the amount of Fe estimated contained within ilmenite and silicates, based upon Davis Tube testing. At this time, accurately quantifying the amount of magnetite contained within this estimate is not possible. |
As stated above, the Mineral Resource has been quantified in terms of TiO2 and Fe2O3, the analyticalcomponents captured for assays of titanium and iron. The Fe2O3 values have been reduced to reflect Fe found within silicates and within the ilmenite associated with the TiO2, however accurately quantifying magnetite is not possible at this time as further mineralogical work will be needed. In any potential mining scenario, the Project would produce ilmenite (FeTiO3) and may produce titaniferous magnetite (TiFe2O4) and magnetite (Fe3O4) as a by-product. Using CIOUSs Davis Tube test results, historic mineralogy and metallurgy reports, reasonable assumptions regarding mineralogy of the deposit, estimates of the quantity of ilmenite was made. The contained ilmenite in the Mineral Resource is summarized in Table 3.2.
Table 3.2: Summary of Longnose Project ilmenite content within the Mineral Resource
Category |
Quantity |
Ilmenite Grade | Contained Ilmenite |
(FeTiO3) | |||
Mt | % | Mt. | |
Indicated | 58.1 | 31.5 | 18.30 |
Inferred | 65.3 | 31.2 | 20.40 |
Interpretation and Conclusions
The Longnose deposit is an ultramafic intrusion significantly enriched in ilmenite and magnetite oxides. The deposit is flat lying and provides a geometry that should be amicable to open pit mining. The Longnose deposit is approximately 700 m long in the north-south direction, 600 m wide in the east-west direction and 150 m thick.
The Longnose OUI is geologically interpreted to be late-stage intrusion that cuts early Duluth Complex intrusives, and is associated with magmatism generated by the 1.1 billion year old Midcontinent Rift system. The drilling program conducted in 2010 and 2011 by CIOUS confirmed strong titanium-iron-oxide mineralization at the Project Area, hosted within troctolitic rocks of the Partridge River intrusion.
The Longnose intrusion is stratigraphically simple, consisting of a core of olivine-rich dunitic and peridotitic rocks containing disseminated titanium-iron oxide mineralization with horizons of massive and semi-massive oxide throughout, that is enveloped by pyroxenitic rocks, which contain much less mineralization. Disseminated titanium-iron oxide mineralization is continuous, and the horizons of massive and semi-massive oxide may link up to form layers that dip moderately coincident with dip of the overall intrusion.
- 49 -
The exploration data for the Project is robust; viable to support the Mineral Resource defined within this document. The data has been well validated and the analyses have been found to be repeatable. Overall, correlation of the mineralization between drill holes is reasonable and it is expected that the Mineral Resource accurately represents the TiO2 and Fe2O3 mineralization. Based on the TiO2 estimates, the mineralogy of the deposit and the Davis Tube test results, the amount of ilmenite and magnetite has been quantified.
Ilmenite and, to a lesser extent, titaniferous magnetite is used as a source material for titanium which is used to make paint pigment and as a metal alloy. Rutile is the ideal source material for titanium as it contains nearly twice as much Ti as ilmenite; however, ilmenite is by far the more common source. Most ilmenite is processed from ilmenite sands (secondary ilmenite) however several primary ilmenite mines have been successfully exploited. Processing plants capable of handling ilmenite concentrates are found in Canada, the US and throughout the world.
Ilmenite is an industrial mineral and there are risks and uncertainties associated with this ilmenite resource, many of which are common to industrial mineral deposits. Industrial minerals have special risks that are not typically associated with precious or base metal mines. Special concerns include mineralogy of material, deleterious elements (such as silica, calcium, magnesium and manganese), and special market factors such as market size or proprietary technology. Because of these and other issues, industrial mineral deposits carry additional risk compared to more common metal products. Historic testwork has indicated that the Longnose deposit produces concentrate with less favourable magnesium levels, which may adversely affect the potential value of the concentrate.
Historic tests have indicated that a viable ilmenite concentrate could be created from processing of Longnose material, although higher than ideal magnesium levels may reduce the product price somewhat. The ilmenite could potentially be sold as a concentrate to an existing ilmenite processing plant, as the deposit is amicable to shipping due to its proximity to rail and a short haul to bulk ports on the western shore of Lake Superior. As well, local added-value beneficiation is under consideration by Cardero. This goal of further beneficiation would be to produce a high TiO2synthetic rutile slag amicable for processing into the paint pigments; however, such processing facilities are capital intensive and further work is required to determine if such a process is viable.
Based upon the significant amount of historical research completed on the Project, a relatively simple processing flow sheet for ilmenite concentrate, a recent increase in demand for ilmenite and the projects close proximity to other bulk mines and inexpensive shipping routes, SRK believes that the Project meets the criteria for having reasonable prospects of economic extraction.
Recommendations
In order to begin to better understand the potential economics of the Project, further work is required. At this stage of the exploration, SRK recommends the following work and expenditures:
a comprehensive mineralogical study of the oxide and sulfide mineralization should be conducted to confirm the specific oxide minerals present throughout the defined mineralization;
metallurgical testwork in conjunction with the mineralogical studies, to assist with better understanding of ilmenite and magnetite recovery, project economic analysis and provide an update to the work completed in the 1990s;
completion of a preliminary economic assessment to assist with further exploration and provide project specific economic criteria;
further study of the other elements, such as vanadium, magnesium and silica contents and how they are distributed through the deposit;
a relatively small infill drilling program consisting of 3-5 drill holes; and,
- 50 -
A budget to complete the recommended work program is presented in Table 3.3.
Table 3.3: Estimated Cost for the Exploration Program Proposed for the Longnose Project.
Recommendation | Estimated Cost (US$) |
Mineralogical studies and analytical data | 50,000 |
Metallurgical analysis and testwork | 150,000 |
Preliminary economic assessment analysis | 150,000 |
Geophysical Survey | 30,000 |
Longnose step-out drilling (3-5 holes/900-1500m @ $165/m*) | 200,000 |
Longnose infill drilling (3-5 holes/600-1000m @ $165/m*) | 130,000 |
Acquisition of additional mineral leases/property boundary survey | 40,000 |
TOTAL | 750,000 |
* Drilling cost per meter includes: Site and Trail preparation, drilling, sampling, facility/vehicle lease, and staffing |
Planned Activities
The Company does not intend to proceed with further work on the Longnose Property at this time, and will be seeking a joint venture partner to further advance the property.
Titac Titanium Project, Minnesota, USA
Information in this AIF regarding the Titac Titanium Project is based on information provided by the Titac Report. The following summary is from the Titac Report and the detailed disclosure in the Titac Report is incorporated into this AIF by reference. Readers are encouraged to review the entire Titac Report, which is filed on SEDAR at www.sedar.com.
Property Description and Location
The land making up the Project (Project Area) is located in northeastern Minnesota in St. Louis County, Township 55N, Range 14W, Section 34, and Township 54N, Range 14W, Section 3. The property is approximately centered at: (Coordinate system: Universal Trans Mercator, Zone 15 North, North American 1983 Datum) 568000 m East, 5228000 m North.
The Project Area interests are held by Cardero Iron Ore (USA) Inc. (CIOUS), a wholly owned indirect subsidiary of Cardero, and work on the property is carried on through Cardero Iron Ore Management (USA) Inc., an indirectly wholly owned subsidiary of Cardero. Cardero holds a 100% leasehold interest in the Project Area under a mining lease dated July 1, 2009. The lease is for an initial term of 20 years, subject to extension for up to 20 additional years, and requires annual rental payments until commercial production and thereafter production royalty payments (minimum $200,000/year).
CIOUS has all required licenses, permits and registrations in place to carry out exploration and resource definition drilling. Additional permits will be required in the future to advance to the next stage.
- 51 -
Accessibility, Climate, Local Resources, Infrastructure and Physiography
Topographic relief on the Titac property is generally low, and the surface is flat-laying. Elevations range between 470 m and 490 m above mean sea level. The ground cover is a mixture of Palustrine, forested wetlands (Cowardin classification system), and higher dry forested ground. Overburden, consisting of glacial till, is present and the depth to bedrock is approximately 20 to 30 m (m) from surface.
Accessibility is excellent, with the Project Area located along a paved county highway.
The climate in northeastern Minnesota is mid-continental. Winter conditions usually begin in mid-December and last until mid-March, with frozen ground beginning in late-December to early-January. The spring thaw usually begins in mid-March to late-April, with stable, dry spring-summer-fall conditions occurring from late-April to mid-December.
The population of Aurora, Minnesota (the nearest major population centre) is approximately 1,850, and the nearby city of Hoyt Lakes (5 miles east of Aurora), Minnesota has a population of approximately 2,000 people.
The infrastructure in northeastern Minnesota related to mining activities is excellent, with low cost electricity, railroads, paved state and county highways, international shipping ports, mining professionals, mining vendors, and trained labor all readily available. International shipping ports are located along the north shore of Lake Superior, including Duluth/Superior, Silver Bay, Taconite Harbor, and Two Harbors, with linked rail systems to all.
History
Exploration of the Project Area, historically known as Section 34, has been limited, though several exploratory bore holes and geophysical surveys have been completed. Six holes were drilled historically (by United States Steel Corp.), and Cardero completed 30 holes in 2010 and 2 holes in 2011. A ground magnetic survey was conducted in the mid-1960s by United States Steel Corp. A small amount of metallurgical testwork was completed by United States Steel Corp. in 1971.
Geological Setting and Mineralization
The Project Area is located within the Superior Province of the Canadian Shield, and is underlain by intrusive rocks generated during the formation of the Midcontinent Rift. Mineralization is hosted by Oxide-bearing Ultramafic Intrusions (OUIs) that intruded into layered series intrusions of the Duluth Complex. OUIs are dominantly composed of coarse-grained to pegmatitic pyroxenite, peridotite, and dunite that contain approximately 15-40% titanium-iron oxide mineralization. Typically, zones of massive and semi-massive oxide are also present throughout the stratigraphy. Locally, some OUIs also contain abundant copper-nickel sulfide mineralization. Most OUIs occur along the western margin of the southern portion of the Duluth Complex, and display numerous shapes (sheet-, funnel-, dike- and pipe-like geometries), and inclinations (flat-lying, moderately-dipping, and sub-vertical).
The Titac OUIs are geologically interpreted to be late-stage intrusions that cut early Duluth Complex stratigraphy, and are associated with magmatism generated by the 1.1 billion year old Midcontinent Rift system.
The Titac OUls contain disseminated, semi-massive, and massive titanium-iron oxide mineralization, dominantly ilmenite (TiFeO3) and magnetite and titaniferous magnetite (Fe3O4, Fe2TiO4). The Project
Area contains at least two mineralized OUIs (Titac North and Titac South). Titac North is at least 450 m thick (open at depth) and has a vertical pipe-like geometry. Titac South is at least 490 m thick, and also has a pipe-like geometry.
- 52 -
Exploration and Drilling
Exploration of the Project Area by CIOUS began in 2010. Reinterpretation of the ground magnetic survey conducted by United States Steel Corp. confirmed the presence of multiple titaniferous-iron oxide-bearing intrusions at the Project Area including two large intrusions referred to as Titac North and Titac South. No bedrock is exposed on the Project Area with the result that bedrock mapping has not been undertaken.
Drilling at the Project Area is complex because of the stratigraphy of the Titac intrusions.
During 2010 and 2011, a total of 11,034.4 m were completed for 32 drill-holes, 8 (2685.3 m) of which were drilled at Titac North and 24 (8349.1 m) at Titac South. The drilling confirmed titanium-iron-oxide mineralization at the Project Area and determined that the Titac property contains at least two intrusions with large zones of titanium-iron-oxide mineralization (Titac North and Titac South). All assay results from the 2010 and 2011 drilling campaigns have been received and are included in the Titac Report.
Sample Preparation, Analyses and Security
Cardero has utilized a thorough and robust procedure for sampling, sample preparation, analysis and security.
Procedures for core handling, logging, sampling, and sample shipping were well thought out and well implemented. Analysis was completed by ALS, one of the largest commercial laboratories in the world. A robust program of quality assurance and quality control samples was implemented and met or exceeded industry standard procedures. Sample security and chain of custody documentation was maintained throughout the process and was thoroughly reviewed by SRK.
Data Verifications
Exploration data verification for the Project Area has included a site visit by SRK, enforced database structures, analytical quality assurance and quality control samples, independent sampling and assay checking.
SRKs Wayne Barnett, Pri. Sci. Nat. visited the site in July 2009 and Mike Johnson, P. Geo, visited the site in March 2010. During these site visits, SRK verified drill hole locations, drilling, logging and sampling procedures, security and documentation. SRK also collected independent sampling during these site visits and confirmed the TiO2 and Fe2O3 values for two Titac samples.
Cardero utilized an onsite database which validated the data entry process as it was being completed and reduced clerical errors. In addition, Carderos head office checked the data upon import into their main exploration database in order to minimize data errors.
SRK verified 100% of the assay database by downloading these records directly from the commercial laboratory and checking them against the Mineral Resource database.
Cardero completed QA/QC sampling (blanks, standards, duplicates) totalling 1075 samples, equal to 22% of the total samples. SRK has reviewed the QA/QC sample insertion rate and results and found that they indicate that the analytical data should be reliable. However, analytical standards selection and certain standard results should be more carefully scrutinized for future programs.
Mineral Processing and Metallurgical Testing
Metallurgical test work (Davies Tube tests) was completed on two samples from one of the historical drill holes (26002) on the Project Area in 1972.
The historic metallurgical test work indicates a relatively simple processing flow sheet. It would include crushing the material to a selected size and processing the ore by density and then by magnetic properties. The density separation would remove the silicates from the much more dense oxides. The oxides would then be split into a non-magnetic / paramagnetic fraction as well as a magnetic fraction. Magnetite would partition into the magnetic fraction, while the ilmenite would partition into the non-magnetic / paramagnetic fraction. The magnetic fraction could be further upgraded to recover some ilmenite that would partition into that fraction. The ilmenite concentrate could then be sold to an external processing site, or could be processed at a newly created process facility as part of a further beneficiation/added value processing project; however, a potential upgrading facility would have very significant capital costs.
- 53 -
Cardero has completed very limited metallurgical testing at this stage. Recent work includes only Davies Tube tests, used to determine the proportion of magnetic iron commonly associated with magnetite. Significant further metallurgical work is required for the Project if further economic analysis is contemplated.
Mineral Resource Estimates
In July 2009, SRK was retained by Cardero to complete a Mineral Resource for the Titac OUI deposits, as well as update the technical report for the project.
SRK utilized Gemcoms Gems version 6.3.1 to complete the Mineral Resource estimation. A comprehensive and validated drill hole database was utilized to complete the analysis. The database includes 32 drill holes, 8 of which were drilled in Titac North and 24 of which were drilled in Titac South. Drilling in Titac North was insufficient for the delineation of mineralized domains and resource estimation. The Mineral Resource presented here only includes Titac South. The estimation process utilized 2837 samples out of the databases 3929 samples for Titac South. A total of 855 specific gravity measurements were utilized to estimate bulk densities.
Three geological domains were modelled for the estimation process. The domains were defined by peridotite or pyroxenite dominated oxide bearing ultramafic rocks. A marginal zone of mixed perdidotite, pyroxenite and country rock was also modelled.
The Titac South resources were estimated using GemsTM (a Gemcom software product) block modeling software in multiple passes in 10 x 10 x 10 m blocks. Grade estimates were based on 1.8 m composited samples. Capping of TiO2 and Fe2O3 assays was not applied in any of the three domains. Ordinary kriging was used to estimate TiO2 and Fe2O3.Inverse distance squared was used to estimate the specific gravity data. Mineral resources were classified in accordance with definitions provided by the Canadian Institute of Mining (CIM) as stipulated in NI43-101. All interpolated blocks were classified as Inferred Mineral Resource.
In order to quantify the Mineral Resources requirement of reasonable prospects of economic extraction, the block model was subjected to conceptual mining limits using an open pit optimization program. The process uses reasonable mining and processing parameters to define a conceptual pit within which the material with reasonable economic prospects should be contained. For the Titac Project optimization runs, it was assumed that all TiO2 is contained in the mineral Ilmenite and no value was associated with the Fe2O3 material in order to avoid double counting of the value associated with iron. Historic metallurgical data indicates that a very high percentage of the TiO2 is contained within ilmenite, with a small component in titaniferous magnetite and silicates.
The Mineral Resource Statement for the Project is presented in Table 4.1 below.
- 54 -
Table 4.1: Mineral Resource Statement*, Titac Project,
Minnesota, USA, SRK
Consulting (Canada) Inc, effective date, January 19,
2012
Category |
Estimated Quantity |
Estimated Grade | |
TiO2 | Adjusted Fe2 O3 *** | ||
Mt | % | % | |
Open Pit** | |||
Inferred | 45.1 | 15.0 | 14.74 |
* |
Mineral resources are reported in relation to a conceptual pit shell. Mineral resources are not mineral reserves and do not have demonstrated economic viability. All figures are rounded to reflect the relative accuracy of the estimate. All composites have been capped where appropriate. | |
** |
Open pit mineral resources are reported at a cut-off grade of 8% TiO2 . Cut-off grades are based on a price of US$170 per tonne of Ilmenite back calculated to TiO2 and recoveries of 70 percent, without considering revenues from other metals. | |
*** |
Reported Fe2 O3 has been lowered to reflect the amount of Fe estimated to be contained in ilmenite based on the assumption that all Ti has been assigned to ilmenite. At this time, accurately quantifying the amount of magnetite contained within this estimate is not possible. |
As stated above, the Mineral Resource has been quantified in terms of TiO2 and Fe2O3, the analyticalcomponents captured for assays of titanium and iron. In any potential mining scenario, the Project would produce ilmenite (FeTiO3) and potentially titaniferous magnetite (TiFe2O4) and magnetite (Fe3O4) as a byproduct. The Fe2O3 values have been reduced to reflect Fe found within the ilmenite associated with the TiO2, however accurately quantifying magnetite is not possible at this time as further mineralogical work will be needed.
Based on the assumption that all Ti is found within ilmenite, the contained ilmenite metal in the Mineral Resource is summarized in Table 4.2.
Table 4.2: Summary of Titac Project ilmenite content within the Mineral Resource
Category |
Quantity
|
Ilmenite Grade | Contained Ilmenite |
(FeTiO3) | |||
Mt | % | Mt. | |
Inferred | 45.1 | 28.5 | 12.9 |
Interpretation and Conclusions
Ilmenite and to a lesser extent titaniferous magnetite is used as a source material for titanium used as pigments and as a metal alloy. Rutile is the ideal source material for titanium as it contains nearly twice as much Ti as ilmenite; however, ilmenite is by far the more common source.
Ilmenite is an industrial mineral and there are risks and uncertainties associated with this ilmenite resource, many of which are common to industrial mineral deposits. Industrial minerals have special risks that are not typically associated with precious or base metal mines. Special concerns include mineralogy of material, deleterious elements (such as silica, calcium, magnesium and manganese), and special market factors such as market size or proprietary technology. Because of these and other issues, industrial mineral deposits carry additional risk compared to more common metal products.
Historic metallurgical tests of the Titac material are very limited. Small scale testing indicates that a viable ilmenite concentrate could be created from processing of Titac material, although higher than ideal deleterious element values, such as magnesium, may reduce the potential ilmenite product price. The ilmenite may be sold as a concentrate to an existing ilmenite processor as the deposit is amicable to shipping due to its proximity to rail and a short haul to bulk ports on the western shore of Lake Superior. As well, local beneficiation could be considered, particularly when other nearby OUI bodies are considered for increased scale. The main hurdle to overcome with future exploitation of the Titac deposit revolves around metallurgical optimization to create the highest grade concentrate while reducing potential deleterious element contamination of the concentrate. Further economic analysis of this project is anticipated and should include resolution of the mineralogical, metallurgical and processing issues.
- 55 -
Based upon a relatively simple processing flow sheet for ilmenite concentrate, a recent increase in demand for ilmenite and the projects close proximity to other bulk mines and inexpensive shipping routes, SRK believes that the Project meets the criteria for having reasonable prospects of economic extraction.
The mineral resources for Titac South presented in the Titac Report represent the first time disclosure of Mineral Resource for the Project Area. Drilling on the Titac North deposit is insufficient for delineation of the deposit and evaluation of a resource for Titac North has not been undertaken.
The Mineral Resource for the Titac South deposit at a cut-off grade of 8% TiO2 includes 45.1 million tonnes at an average grade of 15.0% TiO2. Based on the assumption that all Ti is found within ilmenite, the contained ilmenite in the Mineral Resource includes 12.8 million tonnes at an average grade of 28.5% ilmenite. While not quantified here, the potential for extraction of iron from magnetite exists and would provide an upside to the project. As well, vanadium may be of economic interest, although it has not been significantly analyzed by SRK.
Recommendations
The Project Area is at an early exploration stage and merits additional work. The drilling program conducted in 2010 and 2011 by CIOUS has confirmed strong titanium-iron-oxide mineralization at the Project Area, and determined that the Project Area contains at least two OUIs with large zones of titanium-iron-oxide mineralization (Titac North and Titac South). The Titac South intrusion was extensively drilled by CIOUS in 2010 and 2011, and has been fairly well defined by this drilling. A modest in-fill drilling program is recommended at Titac South to further define contacts with country rock, and to fill-in local gaps within the intrusion. Ore mineral speciation and metallurgical/beneficiation studies, as well as a preliminary economic assessment, should also be conducted
SRK recommends the following work and expenditures:
An in-fill drilling program consisting of 6 diamond drill holes and ~1,800 m of core is recommended;
A petrographic and mineral chemistry study of typical oxide and sulfide mineralization present at Titac should be conducted to identify the specific oxide and sulfide minerals present, and their elemental make-up;
Metallurgical test work in conjunction with the mineralogical studies, to assist with better understanding of ilmenite and magnetite recovery, project economic analysis: 100 kg composite from sample coarse rejects should be collected that represents average TiO2 grades; and
A preliminary economic assessment should be conducted.
A 2011 budget is presented to complete the recommended work program:
- 56 -
Table 4.3: Estimated Cost for the Exploration Program Proposed for the Titac Project
Recommendation |
Estimated Cost
(US$) |
Titac South in-fill drilling (6 holes/1,800 m @ $180/m*) | 324,000 |
Petrographic and mineral chemistry study | 20,000 |
Metallurgical testing | 50,000 |
Preliminary economic assessment study | 100,000 |
TOTAL | 494,000 |
*Drilling cost per metre includes: Site and Trail preparation, drilling, sampling, facility/vehicle-lease, and staffing
Planned Activities
The Company does not intend to proceed with further work on the Longnose Property at this time, and will be seeking a joint venture partner to further advance the property.
Qualified Person(s) and Quality Control/Quality Assurance
Keith Henderson, EurGeol, Carderos Vice President-Exploration and a qualified person as defined by National Instrument 43-101, has supervised the preparation of the scientific and technical information that forms the basis for the mineral property disclosure in this AIF. Mr. Henderson is not independent of the Company, as he is an employee and holds incentive stock options.
The work programs on the Companys non-optioned properties are designed and are supervised by Mr. Henderson, either alone or in conjunction with independent consultants. Mr. Henderson and such consultants, as applicable, are responsible for all aspects of the work, including the quality control/quality assurance program. On-site personnel at the various projects rigorously collect and track samples which are then sealed and shipped to ALS Chemex for assay. ALS Chemexs quality system complies with the requirements for the International Standards ISO 9001:2000 and ISO 17025: 1999. Analytical accuracy and precision are monitored by the analysis of reagent blanks, reference material and replicate samples. Quality control is further assured by the use of international and in-house standards. Blind certified reference material is inserted at regular intervals into the sample sequence by Cardero personnel in order to independently assess analytical accuracy. Finally, representative blind duplicate samples are forwarded to ALS Chemex and an ISO compliant third party laboratory for additional quality control.
Gary M. Stubblefield, P.E., of Norwest Corporation, is a professional engineer (Colorado, Montana and Utah) and, as such, is acting as the Qualified Person, as defined in NI 43-101 for certain portions of the Carbon Creek Report. Mr. Stubblefield has a B.Sc. in Mining Engineering and more than 40 years of relevant experience in engineering and mine supervision and operations, including 18 years in surface coal mining. Both Mr. Stubblefield and Norwest are independent of the Company under NI 43-101.
Lawrence D. Henchel, SME, of Norwest Corporation, is a Registered Member of the Society for Mining, Metallurgy and Exploration, Inc (SME) and, as such is acting as the Qualified Person, as defined in NI 43-101 for certain portions of the Carbon Creek Report, including the October 1, 2011 resource modeling for the Carbon Creek deposit. Mr. Henchel has a B.Sc. in Geology and 28 years of relevant experience as a geologist specializing in coal and industrial minerals in both exploration and mining. Both Mr. Henchel and Norwest are independent of the Company under NI 43-101.
- 57 -
Darrell Farrow, Pr.Sci.Nat. of SRK Consulting (Canada) Inc. is a member of the South African Counsel for Scientific Natural Professions and, as such is acting as the Qualified Person, as defined in NI 43-101 for certain portions of the Longnose and Titac Reports. Mr. Farrow has a BSc. and an MSc. in Geology and 28 years of relevant experience as a research geochemist for four years, as a geologist at two mining operations over a period of ten years, as a manager of an exploration laboratory for three years, and as a consulting geologist for eleven years. Both Mr. Farrow and SRK Consulting (Canada) Inc. are independent of the Company under NI 43-101.
Michael Johnson, P.Geo of SRK Consulting (Canada) Inc. is a Professional Geoscientist (BC) and, as such is acting as the Qualified Person, as defined in NI 43-101 for certain portions of the Longnose and Titac Reports, including the January 19, 2012 resource modeling for the Longnose and Titac deposits. Mr. Johnson has a BSc. in Geological Sciences and 15 years of relevant experience as a geologist, exploration manager, mine geologist and open pit mine manager. He has extensive experience in resource estimation within many deposit types and has worked with ultramafic intrusions and related mineral deposits for more than 10 years. Both Mr. Johnson and SRK Consulting (Canada) are independent of the Company under NI 43-101.
ITEM 6: DIVIDENDS
There are no restrictions which prevent the Company from paying dividends. The Company has not paid any dividends in the last three financial years. The Company has no present intention of paying any dividends, as it anticipates that all available funds will be invested to finance the growth of its business. The directors of Cardero will determine if and when dividends should be declared and paid in the future, based on the Companys financial position at the relevant time.
ITEM 7: DESCRIPTION OF CAPITAL STRUCTURE
General Description of Capital Structure
The authorized capital of Cardero is an unlimited number of Common Shares, of which 91,517,854 were issued at January 26, 2012. The holders of Common Shares are entitled to receive notice of and attend all meetings of shareholders, with each Common Share held entitling the holder to one vote on any resolution to be passed at such shareholder meetings. The holders of Common Shares are entitled to dividends if, as and when declared by the board of directors of Cardero. The Common Shares are entitled, upon liquidation, dissolution or winding up of Cardero, to receive the remaining assets of Cardero available for distribution to shareholders.
ITEM 8: MARKET FOR SECURITIES
The Common Shares are listed and posted for trading on the TSE (symbol CDU), on the NYSE-A (symbol CDY), and on the Frankfurt Stock Exchange (symbol CR5).
Trading Price and Volume
The following table provides information as to the high, low and closing prices of the Common Shares on the TSE during the 12 months of the most recently completed financial year and the 3 months since the most recent financial year end, as well as the volume of shares traded for each month:
- 58 -
Toronto Stock Exchange
Month |
High
($) |
Low
($) |
Close
($) |
Volume
|
January 1 to 26, 2012 | 1.56 | 1.02 | 1.51 | 8,163,017 |
December, 2011 | 1.24 | 0.89 | 1.02 | 2,545,519 |
November, 2011 | 1.31 | 0.96 | 1.10 | 4,755,469 |
October, 2011 | 1.10 | 0.75 | 1.08 | 1,681,353 |
September, 2011 | 1.22 | 0.90 | 0.96 | 2,401,852 |
August, 2011 | 1.28 | 0.98 | 1.20 | 5,480,767 |
July, 2011 | 1.39 | 1.17 | 1.25 | 3,868,518 |
June, 2011 | 1.56 | 1.13 | 1.22 | 3,315,811 |
May, 2011 | 1.77 | 1.51 | 1.56 | 1,737,496 |
April, 2011 | 1.89 | 1.69 | 1.74 | 2,038,320 |
March, 2011 | 2.16 | 1.59 | 1.84 | 4,125,718 |
February, 2011 | 2.25 | 1.73 | 1.87 | 2,199,321 |
January, 2011 | 2.22 | 1.68 | 1.78 | 2,324,008 |
December, 2010 | 2.35 | 1.37 | 2.30 | 3,775,184 |
November, 2010 | 1.60 | 1.20 | 1.54 | 2,879,008 |
ITEM 9: ESCROWED SECURITIES
There are no securities of the Company subject to escrow.
ITEM 10: DIRECTORS AND EXECUTIVE OFFICERS
Name, Occupation and Security Holding
The names, positions or offices held with Cardero, province/state and country of residence, and principal occupation over the last five years of the Directors and executive officers of Cardero are as follows:
Name, Position and | Principal Occupation | Period of Service as an |
Province/State and Country of | During the Past 5 Years(1) | Executive Officer or |
Residence(1) | Director(2) | |
Michael Hunter President and Chief Executive Officer British Columbia, Canada |
Businessman; Director, President & CEO of
Cardero Coal since June 2008; co-founder of First Coal Corporation, director to 2008 |
President since June 1, 2011 Chief Executive Officer since November 9, 2011 |
Hendrik Van Alphen Managing Director British Columbia, Canada |
Businessman; President of Cardero, 2000 to June
1, 2011; Chief Executive Officer of Cardero, 2001 to November 9, 2011 |
Director since April 19, 1999 President from April 10, 2000 to June 1, 2011 Chief Executive Officer from May 14, 2001 to November 9, 2011 |
- 59 -
Name, Position and | Principal Occupation | Period of Service as an |
Province/State and Country of | During the Past 5 Years(1) | Executive Officer or |
Residence(1) | Director(2) | |
Leonard Harris(3)(4)(5)(6)
Director Colorado, USA |
Independent consultant to the
mining industry, 1992 to present. |
Since February 25, 2000 |
Lawrence W. Talbot Director, Vice-President and General Counsel British Columbia, Canada |
Barrister and Solicitor; Owner,
Lawrence W. Talbot Law Corporation (law firm) since May, 2006; previously Partner, Gowling Lafleur Henderson LLP (law firm) since April 2000. |
Director since April 17, 2003
Vice-President & General Counsel since July 1, 2006 |
Murray W. Hitzman,
Ph.D.(3)(4)(5) Director Colorado, United States |
Geologist; Professor of Economic
Geology at the Colorado School of Mines since June 1996 and Head of the Department of Geology and Geological Engineering at the Colorado School of Mines, August 2000 to August 2007. |
Since January 4, 2006 |
Stephan A. Fitch(3)(4)(6)
Director London, England |
Businessman; Managing Director, IAG Holdings
Limited (private investment company) 2003 to present; previously Partner, International Asset Group Ltd. (private merchant and investment banking firm) 1995 to 2003. |
Since May 31, 2006 |
Blaine Bailey, CGA Chief Financial Officer British Columbia, Canada |
Businessman, CGA; CFO of Cardero
Coal since July 2008; Principal of Promaid Services Ltd. from September 2002 to January 2011 |
Since November 9, 2011 |
Keith Henderson, EurGeol Executive Vice President British Columbia, Canada |
Geologist; Vice President, Exploration of
Cardero, April 1, 2007 to November 9, 2011; President, Dorato Resources Inc., December 1, 2008 to October, 2011; Senior Project Geologist, Anglo American (Exploration) Canada Ltd., 2002 to March 31, 2007 |
Executive Vice President since November 9, 2011 |
Glenn Hoffman CEO and President of Cardero Iron Ore Company Ltd. South Carolina, USA |
Metallurgist; CEO and President
of Cardero Iron Ore Company Ltd. (subsidiary) since August, 2007; previously, several positions, including Manager of Research and Development, with Midrex Technologies, Inc. (private process engineering and technology company) |
Since August 23, 2007
|
Notes:
1. |
The information as to place of residence and principal occupation, not being within the knowledge of Cardero, has been furnished by the respective Directors and executive officers individually. |
2. |
All directorships expire at the next Annual General Meeting of the shareholders of Cardero (which is required to be held on or before December 15, 2012). All officers hold office at the pleasure of the Board. |
3. |
Denotes member of the Audit Committee. |
4. |
Denotes member of the Compensation Committee. |
5. |
Denotes member of the Sustainable Development Committee. |
6. |
Denotes member of the Corporate Governance and Nominating Committee |
- 60 -
Cardero does not currently have any board committees other than the Audit Committee, the Compensation Committee, the Corporate Governance and Nominating Committee and the Sustainable Development Committee.
As at January 26, 2012, Carderos Directors and executive officers, as a group, beneficially hold a total of 3,374,609 Common Shares, directly or indirectly, representing 3.7% of the 91,517,854 issued Common Shares. Carderos Directors and executive officers, as a group, also hold the following incentive stock options to purchase up to the following numbers of Common Shares until the dates shown:
Number of Options to | Exercise Price | Expiry Date |
Purchase Common Shares | per Common Share | |
500,000 | $1.16 | July 29, 2012 |
875,000 | $1.16 | August 11, 2012 |
40,000 | $0.06 | June 1, 2013 |
80,000 | $0.16 | June 1, 2013 |
240,000 | $0.31 | June 1, 2013 |
240,000 | $0.06 | June 1, 2013 |
80,000 | $0.31 | June 1, 2013 |
60,000 | $0.38 | June 1, 2013 |
400,000 | $0.38 | June 1, 2013 |
136,000 | $0.44 | June 1, 2013 |
20,000 | $0.16 | June 1, 2013 |
985,000 | $1.10 | November 9, 2013 |
650,000 | $1.51 | January 26, 2014 |
Cease Trade Orders, Bankruptcies, Penalties or Sanctions
1. |
No Director or executive officer of Cardero is, as at the date of this AIF, or was within ten years before the date of this AIF, a director, chief executive officer or chief financial officer of any company (including Cardero) that: | ||
(a) |
was subject to an order that was issued while the Director or executive officer was acting in the capacity as director, chief executive officer or chief financial officer, except as follows: | ||
(i) |
Blaine Bailey, the Chief Financial Officer of Cardero, was Chief Financial Officer of Qumana Software Inc. (formerly, Thoughtshare Communications Inc.) which was subject to cease trade orders issued by the British Columbia Securities Commission (BCSC) and the Alberta Securities Commission (ASC) in September and October 2003, respectively, for failing to file financial statements. The required financial statements were subsequently filed and revocation orders from the BCSC and the ASC were issued in August, 2005. Qumana Software Inc. was subject to cease trade orders issued by the BCSC and the ASC in August 2007 and January 2008, respectively, for failing to file financial statements; | ||
(ii) |
Blaine Bailey, the Chief Financial Officer of Cardero, was Chief Financial Officer of Gulfside Minerals Ltd. which was subject to a cease trade order issued by the BCSC for failing to file a NI 43-101 compliant technical report within the required time period. The technical report was subsequently filed and the cease trade order was revoked; or |
- 61 -
(b) |
was subject to an order that was issued after the Director or executive officer ceased to be a director, chief executive officer or chief financial officer and which resulted from an event that occurred while that person was acting in the capacity as director, chief executive officer or chief financial officer. |
For the purposes hereof, the term order means:
(a) |
a cease trade order; | ||
(b) |
an order similar to a cease trade order; or | ||
(c) |
an order that denied the relevant company access to any exemption under securities legislation, | ||
that was in effect for a period of more than 30 consecutive days. | |||
2. |
No Director or executive officer of Cardero, or a shareholder holding a sufficient number of securities of Cardero to affect materially the control of Cardero: | ||
(a) |
is, as at the date of this AIF, or has been within the ten years before the date of this AIF, a director or executive officer of any company (including Cardero) that, while such person was acting in such capacity, or within a year of that person ceasing to act in that capacity, became bankrupt, made a proposal under any legislation relating to bankruptcy or insolvency or was subject to or instituted any proceedings, arrangement or compromise with creditors or had a receiver, receiver-manager or trustee appointed to hold its assets, except as follows: | ||
(i) |
Blaine Bailey, the Chief Financial Officer of Cardero, was Chief Financial Officer of Golden Arch Resources Ltd., a company that was listed on the TSX Venture Exchange and placed into receivership on October 25, 2009; or | ||
(b) |
has, within ten years before the date of this AIF, become bankrupt, made a proposal under any legislation relating to bankruptcy or insolvency, or become subject to or instituted any proceedings, arrangement or compromise with creditors, or has a receiver, receiver manager or trustee appointed to hold the assets of the Director, executive officer or shareholder. | ||
3. |
No Director or executive officer of Cardero, or a shareholder holding a sufficient number of securities of Cardero to affect materially the control of Cardero, has been subject to: | ||
(a) |
any penalties or sanctions imposed by a court relating to securities legislation or by a securities regulatory authority or has entered into a settlement agreement with a securities regulatory authority; or | ||
(b) |
any other penalties or sanctions imposed by a court or regulatory body that would likely be considered important to a reasonable investor making an investment decision. |
Conflicts of Interest
Certain Directors and executive officers of Cardero are directors, officers and/or shareholders of other private and publicly listed companies, including companies that engage in mineral exploration and development (including Wealth Minerals Ltd., International Tower Hill Mines Ltd., Dorato Resources Inc., Trevali Mining Corporation, Indico Resources Ltd., Balmoral Resources Ltd., Ethos Capital Corp., Pedro Resources Ltd., Remstar Resources Ltd. and Minaurum Gold Inc.). To the extent that such other companies may participate in or be affected by ventures involving Cardero, these Directors and executive officers of Cardero may have conflicting interests in negotiating, settling and approving the terms of such ventures. Conflicts of interest affecting the Directors and executive officers of Cardero will be governed by Carderos Code of Business Conduct and Ethics, the Articles of Cardero and the provisions of the BCBCA and other applicable laws. In the event that such a conflict of interest arises at a meeting of the Directors, a Director affected by the conflict must disclose the nature and extent of his interest and abstain from voting for or against matters concerning the matter in respect of which the conflict arises. Directors and executive officers are required to disclose any conflicts or potential conflicts to the board of Directors as soon as they become aware of them. In accordance with the requirements of the NYSE Amex Company Guide, transactions involving a conflict of interest or related party transactions are required to be approved by Carderos Audit Committee.
- 62 -
ITEM 11: PROMOTERS
Cardero does not presently have, and has not within the last two completed financial years had, any promoters.
ITEM 12: LEGAL PROCEEDINGS AND REGULATORY ACTIONS
Legal Proceedings
The Company is not currently, and has not since November 1, 2010 (being the commencement of the Companys last competed financial year) been, a party to any legal proceedings, nor is any of the Companys properties presently, or has, since November 1, 2010 (being the commencement of the Companys last competed financial year), any of the Companys properties been, subject to any legal proceedings.
Regulatory Actions
There have not been any: | |
1. |
penalties or sanctions imposed against Cardero by a court relating to securities legislation or by a securities regulatory authority during the financial year ended October 31, 2011; |
2. |
other penalties or sanctions imposed against Cardero by a court relating to securities legislation or by a securities regulatory authority that would likely be considered important to a reasonable investor making an investment decision; or |
3. |
settlement agreements entered into by Cardero before a court relating to securities legislation or with a securities regulatory authority during the financial year ended October 31, 2011. |
Interest of Management and Others in Material Transactions
No: | |
1. |
Director or executive officer of the Company; |
2. |
any person or company that is the direct or indirect beneficial owner of, or who exercises control or direction over, more than 10% of the Common Shares; or |
3. |
any associate or affiliate of any of the persons or companies referred to in paragraphs 1 or 2, |
has, during any of the financial years ended October 31, 2009, 2010 or 2011, or during the current financial year, had any material interest, direct or indirect, in any transaction that has materially affected, or will materially affect, the Company, other than:
- 63 -
(a) |
On November 29, 2011, Cardero closed a non-brokered private placement of 8,029,750 units. The units were sold at $0.95 per unit, and each unit consisted of one Common Share and one-half of a share purchase warrant, with one whole warrant being exercisable to purchase an additional Common Share at a price of $1.25 for 12 months from closing. Michael Hunter, the President and CEO, purchased an aggregate of 205,740 units; Hendrik Van Alphen, the Managing Director, purchased an aggregate of 580,000 units; Lawrence Talbot, a Director and the Vice-President and General Counsel, purchased an aggregate of 105,000 units; and Keith Henderson, the Executive Vice President, purchased an aggregate of 121,000 units. Such purchases were upon the identical terms and conditions as the other subscribers in the placement. | |
(b) |
Stephan Fitch, a Director of Cardero, is a director and significant shareholder of a private company which is the major shareholder (67%) of International Minerals and Mines Ltd. (IMM). The Company acquired from IMM a 15% interest in IMM Gold Ltd. (IMMG), a subsidiary of IMM (See General Development of the Business Three Year History for details on this transaction). This transaction was approved by Carderos audit committee and board of directors (other than Stephan Fitch, who abstained from voting in each case). |
ITEM 13: TRANSFER AGENT AND REGISTRAR
Carderos transfer agent and registrar is Computershare Investor Services Inc. Transfers may be effected at, and registration facilities are maintained at:
1. |
in British Columbia, 3rd Floor, 510 Burrard Street, Vancouver, British Columbia, V6C 3B9; and |
2. |
in Ontario, 100 University Avenue, 11th Floor, Toronto, Ontario M5J 2Y12. |
ITEM 14: MATERIAL CONTRACTS
Other than as set out in this AIF under Significant Acquisitions and in the ordinary course of the Companys business of mineral property evaluation, acquisition and divestiture and exploration, including raising the funding therefor, there are no material contracts that have been entered into by the Company since November 1, 2010 (being the commencement of the Companys most recently completed financial year) that are still in effect and that require filing under Section 12.2 of National Instrument 51-102.
ITEM 15: NAMES AND INTERESTS OF EXPERTS
Names and Interests of Experts
The following are the persons or companies:
1. |
who were named as having prepared or certified a statement, report or valuation described or included in a filing, or referred to in a filing, made under National Instrument 51-102 by Cardero during, or relating to, the fiscal year ending October 31, 2011, being Carderos most recently completed financial year; and | ||
2. |
whose profession or business gives authority to the statement, report or valuation made by the person or company: | ||
(a) |
Smythe Ratcliffe LLP, Chartered Accountants: | ||
(i) |
provided an auditors report dated January 20, 2011 in respect of the Companys consolidated financial statements for the years ended October 31, 2010 and 2009 and incorporated by reference into Carderos AIF dated January 20, 2011, and |
- 64 -
(ii) |
provided an auditors report dated January 26, 2012 in respect of the Companys consolidated financial statements for the years ended October 31, 2011 and 2010 and incorporated by reference into this AIF. | ||
Smythe Ratcliffe LLP is independent in accordance with the auditors rules of professional conduct in British Columbia; | |||
(b) |
Each of Gary M. Stubblefield and Lawrence D. Henchel of Norwest Corporation is responsible for the preparation of one or more sections of the Carbon Creek Report incorporated by reference into this AIF. Each of them is independent of the Company and neither holds more than 1% of the Common Shares; | ||
(c) |
Keith J. Henderson, EurGeol, PGeo, of the Company is responsible for the preparation of the Sheini Report incorporated by reference into this AIF. Mr. Henderson is not independent of the Company, as he is the Executive Vice President, and holds Common Shares and incentive stock options; and | ||
(d) |
Each of Michael Johnson, PGeo, and Darrell Farrow, Pr. Sci. Nat., on behalf of SRK Consulting (Canada) Inc., is responsible for the preparation of one or more sections of the Longnose Report and the Titac Report incorporated by reference into this AIF. Each of them is independent of the Company and none of them holds more than 1% of the Common Shares. |
ITEM 16: ADDITIONAL INFORMATION
Audit Committee Information
Under National Instrument 52-110 Audit Committees (NI 52-110), companies that are required to file an Annual Information Form are required to provide certain disclosure with respect to their audit committee, including the text of the audit committees charter, the composition of the audit committee and the fees paid to the external auditor. This information with respect to Cardero is provided in Schedule A.
Additional Information
Additional information relating to Cardero may be found on SEDAR at www.sedar.com. Additional information, including Directors and officers remuneration and indebtedness, principal holders of Carderos securities and securities authorized for issuance under equity compensation plans, if applicable, is contained in the Information Circular. Additional financial information is available in the Financial Statements and MD&A.
A copy of this AIF, the Information Circular, the Financial Statements and the MD&A, together with any interim financial statements from the past financial year, may be found on the SEDAR website at www.sedar.com or be obtained upon request from the Secretary of Cardero. A reasonable fee for copying may be charged if the request is made by a person who is not a registered security holder of Cardero.
Schedule A
Audit Committee Information
The Audit Committees Charter
The following is the text of the current Charter for Carderos Audit Committee:
CARDERO RESOURCE
CORP.
AUDIT COMMITTEE
CHARTER
(Adopted by the Board of Directors on December 16,
2004)
ARTICLE 1 - PURPOSE
The overall purpose of the Audit Committee (the Committee) is to:
(a) |
ensure that the management of Cardero Resource Corp. (the Company) has designed and implemented an effective system of internal financial controls for reviewing and reporting on the Companys financial statements; | ||
(b) |
oversee, review and report on the integrity of the Companys financial disclosure and reporting; | ||
(c) |
review the Company's compliance with regulatory and statutory requirements as they relate to financial statements, taxation matters and disclosure of material facts; and | ||
(d) |
be directly responsible for: | ||
(i) |
the selection of a firm of external auditors to be proposed for election as the external auditors of the Company, | ||
(ii) |
the oversight of the work of the Companys external auditors, and | ||
(iii) |
subject to the grant by the shareholders of the authority to do so, if required, fixing the compensation of the external auditors of the Company. |
ARTICLE 2 - COMPOSITION, PROCEDURES AND ORGANIZATION
2.1 |
The Committee will consist of at least three members of the Board of Directors (the Board), all of whom will be independent and unrelated directors of the Company within the meaning of all applicable legal and regulatory requirements (except in the circumstances, and only to the extent, permitted by all applicable legal and regulatory requirements). |
2.2 |
All of the members of the Committee will be financially literate, at least one member of the Committee will have accounting or related financial expertise (i.e. able to analyze and interpret a full set of financial statements, including the notes thereto, in accordance with generally accepted accounting principles) and at least one member of the Committee will be a financial expert within the meaning of the rules and forms adopted by the Securities and Exchange Commission (except in the circumstances, and only to the extent, permitted by all applicable legal and regulatory requirements). |
2.3 |
The Board, at its organizational meeting held in conjunction with each annual general meeting of the shareholders, will appoint the members of the Committee for the ensuing year. The Board may at any time remove or replace any member of the Committee and may fill any vacancy in the Committee. |
- 4 -
2.4 |
Unless the Board has appointed a chair of the Committee, the members of the Committee will elect a chair from among their number. | |||
2.5 |
The Committee will select an individual to act as secretary for the Committee, who will be either: | |||
(a) |
a member of the Committee other than the chair, or | |||
(b) |
another individual who is not a member of the management of the Company. | |||
2.6 |
The quorum for meetings will be a majority of the members of the Committee, present in person or by telephone or other telecommunication device that permits all persons participating in the meeting to speak and to hear each other. Decisions by the Committee will be by the affirmative vote of a majority of the members of the Committee, or by consent resolutions in writing signed by each member of the Committee. | |||
2.7 |
The Committee will have access to such officers and employees of the Company and to the Company's external auditors, and to such information respecting the Company, as it considers to be necessary or advisable in order to perform its duties and responsibilities. | |||
2.8 |
Meetings of the Committee will be conducted as follows: | |||
(a) |
the Committee will meet: | |||
(i) |
at least four times annually, and | |||
(ii) |
may meet as many additional times: | |||
A. |
as deemed necessary or appropriate by the Committee, | |||
B. |
upon request by any member of the Committee, the Chief Executive Officer, the Chief Financial Officer or the external auditors, |
in each case at such times and at such locations as may be determined by the Committee or the chair of the Committee. Except in respect of a regularly scheduled meeting of the Committee, notice of such meeting, together with a proposed agenda, will be delivered to each member of the Committee not less that forty-eight (48) hours prior to the proposed meeting time (which notice may be waived by all of the members of the Committee); and | ||
(b) |
the external auditors and management representatives will be invited to attend as necessary in the discretion of the Committee. |
2.9 |
The internal accounting staff, any external accounting consultant(s) and the external auditors will have a direct line of communication to the Committee through its chair and may bypass management if deemed necessary. The Committee, through its chair, may contact directly any employee in, or consultant of, the Company as it deems necessary, and any employee of, or consultant to, the Company may bring before the Committee any matter involving questionable, illegal or improper financial practices or transactions. |
- 5 -
2.10 |
The Committee may, in its sole discretion, retain, at the expense of the Company, such legal, financial or other advisors or consultants as it may deem necessary or advisable in order to properly and fully perform its duties and responsibilities hereunder. |
ARTICLE 3 - DUTIES AND RESPONSIBILITIES
3.1 |
The overall duties and responsibilities of the Committee will be as follows: | ||
(a) |
be directly responsible for: | ||
(i) |
the selection of a firm of external auditors to be proposed for election as the external auditors of the Company, | ||
(ii) |
the oversight of the work of the Companys external auditors, and | ||
(iii) |
subject to the grant by the shareholders of the authority to do so, if required, fixing the compensation of the external auditors of the Company; | ||
(b) |
to review with the management of the Company (and, in the case of the annual audited statements, with the external auditors) the annual audited consolidated and unaudited consolidated quarterly financial statements, including the notes thereto, to ensure that such statements present fairly the financial position of the Company and the results of its operations and, if appropriate, to recommend to the Board as to the approval of any such financial statements; | ||
(c) |
to assist the Board in the discharge of its responsibilities relating to the Companys accounting principles, reporting practices and internal controls and its approval of the Company's annual and quarterly consolidated financial statements; | ||
(d) |
to establish and maintain a direct line of communication with the Company's internal accounting staff and any external accounting consultant(s) and assess their performance; | ||
(e) |
to ensure that the management of the Company has designed, implemented and is maintaining an effective and appropriate system of internal financial controls; and | ||
(f) |
to report regularly to the Board on the fulfilment of its duties and responsibilities. | ||
3.2 |
The duties and responsibilities of the Committee as they relate to the external auditors will be as follows: | ||
(a) |
to select a firm of external auditors to be proposed by management of the Company to the shareholders for election by the shareholders as the external auditors for the Company, and to verify the independence of such proposed external auditors; | ||
(b) |
to review and approve the fee, scope and timing of the annual and any other audit performed by the external auditors; | ||
(c) |
to review and evaluate the qualifications, performance and independence of the lead partner of the external auditors of the Company; | ||
(d) |
to discuss with management of the Company the timing and process for implementing the rotation of the lead audit partner and the reviewing partners of the external auditors of the Company; |
- 6 -
(e) |
to obtain confirmation from the external auditors of the Company that they will report directly to the Committee; | ||
(f) |
to obtain confirmation from the external auditors of the company that they will report in a timely matter to the Committee all critical accounting policies and practices to be used, all alternative accounting policies and practices, the ramifications of each of such accounting policies and practices and the accounting policy and practice preferred by the external auditors of the Company, for the financial information of the Company within applicable generally accepted accounting principles (GAAP) which have been discussed with management of the Company and will provide a copy of all material written communications between the external auditors of the Company and management of the Company including, without limitation, any management letter or schedule of unadjusted differences; | ||
(g) |
obtain confirmation from the external auditors of the Company that they will ensure that all reports filed under the United States Securities Exchange Act of 1934, as amended, which contain financial statements required to be prepared in accordance with Canadian GAAP and/or are reconciled to, United States GAAP, reflect all material correcting adjustments identified by the external auditors of the Company; | ||
(h) |
to review and approve the Companys hiring policies regarding partners, employees and former partners and employees of the present and any former external auditors of the Company; | ||
(i) |
to review and pre-approve all non-audit services to be provided to the Company (or any of its subsidiaries) by the external auditors, provided that such pre- approval authority may be delegated by the Committee to any member of the Committee who is independent and unrelated on the condition that any such pre-approval must be presented to the Committee at its first schedule meeting following any such approval; | ||
(j) |
review the audit plan of the external auditors prior to the commencement of the audit; | ||
(k) |
to review with the external auditors, upon completion of their annual audit: | ||
(i) |
the contents of their report, | ||
(ii) |
the scope and quality of the audit work performed, | ||
(iii) |
the adequacy of the Company's financial and accounting personnel, | ||
(iv) |
the co-operation received from the Company's personnel and any external consultants during the audit, | ||
(v) |
the scope and nature of the internal resources used, | ||
(vi) |
any significant transactions outside of the normal business of the Company, |
- 7 -
(vii) | any significant proposed adjustments and recommendations for improving internal accounting controls, accounting principles or management systems, and | ||
(viii) |
the non-audit services provided by the external auditors during the year under audit; | ||
(l) |
to discuss with the external auditors not just the acceptability, but also the quality, of the Companys accounting principles; and | ||
(m) |
to implement structures and procedures to ensure that the Committee meets the external auditors on a regular basis in the absence of management. | ||
3.3 |
The duties and responsibilities of the Committee as they relate to the internal control procedures of the Company are to: | ||
(a) |
review the appropriateness and effectiveness of the Company's policies and business practices which impact on the financial integrity of the Company, including those relating to internal accounting, the use of and services provided by any external accounting consultant(s), insurance, information services and systems and financial controls, management reporting and risk management, and to ensure that the Company maintains: | ||
(i) |
the necessary books, records and accounts in reasonable detail to accurately and fairly reflect the Companys financial transactions, | ||
(ii) |
effective internal control systems, and | ||
(iii) |
adequate processes for assessing the risk of material misstatement of the financial statements and for detecting control weaknesses or fraud; | ||
(b) |
establish procedures for: | ||
(i) |
the receipt, retention and treatment of complaints received by the Company regarding accounting, internal accounting controls or auditing matters, and | ||
(ii) |
the confidential, anonymous submission by employees or any external consultants of the Company of concerns regarding questionable accounting or auditing matters; | ||
(c) |
to periodically review this policy and recommend to the Board any changes which the Committee may deem appropriate; | ||
(d) |
review any unresolved issues between management and the external auditors that could affect the financial reporting or internal controls of the Company; | ||
(e) |
periodically review the Company's financial and auditing procedures and the extent to which recommendations made by the internal accounting staff, by any external accounting consultant(s) or by the external auditors have been implemented; | ||
(f) |
assist in the preparation of any internal control report by management, which provides that management of the Company is responsible for establishing and maintaining an adequate control structure and procedures for financial reporting by the Company, assessing the effectiveness of such control structure and procedures, and ensuring that the external auditors of the Company attest to, and report on, the assessment of such control structure and procedures by management of the Company; |
- 8 -
(g) |
assist the Chief Executive Officer and the Chief Financial Officer of the Company in their assessment of the effectiveness of the Companys internal control over financial reporting and in determining whether there has been any material change in the Companys internal control over financial reporting which has materially affected or could materially affect such internal control subsequent to the date of the evaluation; and | ||
(h) |
assist the Chief Executive Officer and the Chief Financial Officer of the Company in identifying and addressing any significant deficiencies or material weaknesses in the design or operation of the Companys internal control over financial information and any fraud, whether or not material, that involves management or other employees who have a significant role in the Companys internal control over financial reporting. | ||
3.4 |
The Committee is also charged with the responsibility to: | ||
(a) |
review the Company's quarterly statements of earnings, including the impact of unusual items and changes in accounting principles and estimates and report to the Board with respect thereto; | ||
(b) |
review and approve the financial sections of: | ||
(i) |
the annual report to shareholders; | ||
(ii) |
the annual information form (if any); | ||
(iii) |
any quarterly or annual management discussion and analysis; | ||
(iv) |
prospectuses; and | ||
(v) |
other public reports requiring approval by the Board, | ||
and report to the Board with respect thereto including, without limitation, as to the approval (or otherwise) thereof by the Board; | |||
(c) |
review regulatory filings and decisions as they relate to the Company's consolidated annual and interim financial statements, including any press releases with respect thereto; | ||
(d) |
ensure that the Company discloses in the periodic reports of the Company, as appropriate, whether at least one member of the Committee is a financial expert within the meaning of the rules and forms adopted by the Securities and Exchange Commission; | ||
(e) |
ensure that all non-audit services approved by or on behalf of the Committee are disclosed in the periodic reports of the Company; | ||
(f) |
ensure that each annual report and, to the extent required by any applicable legal or regulatory requirement, any quarterly report of the Company includes disclosure with respect to all material off-balance sheet transactions, arrangements, obligations (including contingent obligations) and other relationships of the Company with unconsolidated entities which may have a current or future effect on the Company in accordance with all applicable legal and regulatory requirements; |
- 9 -
(g) |
ensure that all financial statements and other financial information, including pro forma financial information, included in any report filed by the Company with any regulatory authority or contained in any public disclosure or press release of the Company is presented in a manner which does not contain a material misstatement or omission and reconciles the pro forma information contained therein to Canadian GAAP, and if appropriate, reconciles such pro forma information contained therein to United States GAAP, and which otherwise complies with all applicable legal and regulatory requirements; | |
(h) |
review the appropriateness of the policies and procedures used in the preparation of the Company's consolidated financial statements and other required disclosure documents, and consider recommendations for any material change to such policies; | |
(i) |
review and report on the integrity of the Companys consolidated financial statements; | |
(j) |
review the minutes of any audit committee meeting of any subsidiaries of the Company; | |
(k) |
review with management, the external auditors and, if necessary, with legal counsel, any litigation, claim or other contingency, including tax assessments that could have a material effect upon the financial position or operating results of the Company and the manner in which such matters have been disclosed in the consolidated financial statements; | |
(l) |
review the Companys compliance with regulatory and statutory requirements as they relate to financial statements, tax matters and disclosure of material facts; and | |
(m) |
develop a calendar of activities to be undertaken by the Committee for each ensuing year and to submit the calendar in the appropriate format to the Board within a reasonable time following each annual general meeting of shareholders. | |
3.5 |
The Committee shall have the authority to determine: | |
(a) |
subject to the grant by the shareholders of the authority to do so, if required, the compensation to be received by the external auditors of the Company in connection with all audit services, and non-audit services, to be performed by the auditors; | |
(b) |
the compensation to be received by any legal, financial or other advisors or consultants engaged by the Committee to assist it in performing its duties and responsibilities hereunder; and | |
(c) |
the appropriate funding for the ordinary administrative expenses of the Committee. |
- 10 -
ARTICLE 4 GENERAL
4.1 |
The Committee will: | |
(a) |
prepare any report or other disclosure, including any recommendation of the Committee, required by any applicable legal or regulatory requirement to be included in the annual proxy or information circular of the Company; | |
(b) |
review this Charter at least annually and recommend any changes herein to the Board; | |
(c) |
report the activities of the Committee to the Board on a regular basis and make such recommendations thereto as the Committee may deem necessary or appropriate; and | |
(d) |
prepare and review with the Board an annual performance evaluation of the Committee, which performance evaluation must compare the performance of the Committee with the requirements of this Charter and be conducted in such manner as the Committee deems appropriate. Such report to the Board may be in such form as the Committee determines, which may include being in the form of an oral report by the chair of the Committee or by another member of the Committee designated by the Committee to make such report. | |
4.2 |
No member of the Committee will receive any compensation from the Company, other than fees for being a director of the Company, or a member of a committee of the Board. | |
4.3 |
In addition to the foregoing, the Committee will perform such other duties as may be assigned to it by the Board from time to time or as may be required by any applicable stock exchanges, regulatory authorities or legislation. |
Composition of the Audit Committee
Carderos Audit Committee is made up of the following directors:
Name | Independent (Y/N) | Status |
Leonard Harris | Independent | Financially Literate |
Murray Hitzman | Independent | Financially Literate |
Stephan Fitch | Independent | Financially Literate |
Relevant Education And Experience
The experience and education of each member of the Audit Committee that is relevant to the performance of his responsibilities as a member of the Audit Committee is as follows: Leonard Harris: Mr. Harris is a professional engineer with Metallurgy diploma and 50 years experience in all aspects of mineral processing and mining operations worldwide, a significant part of which has been in South America. Mr. Harris spent 16 years with Cerro de Pasco Corporation before joining Newmont Mining Corporation, where he served as President and General Manager of Newmont Peru Limited and Vice-President and General Manager of Newmont Latin America. Mr. Harris was General Manager (involved in construction and operation) of the Minera Yanacocha gold mine in Peru. Since 1995, Mr. Harris has been a consultant and director of several small capitalized mining companies including Glamis Gold Ltd., Solitario Resources Inc., Alamos Gold Inc., Corriente Resources Inc., Endeavour Silver Corp. and Cardero. In such roles, he has had extensive experience with the review and understanding of the accounting principles relevant to the financial statements of public natural resource companies, including companies comparable to Cardero.
- 11 -
Murray Hitzman: Dr. Hitzman received BA degrees in Earth Science and Anthropology from Dartmouth College in 1976, an MS in geology from the University of Washington, Seattle in 1978, and a Ph.D. from Stanford University in 1983. Dr. Hitzman began work in the mining industry with Anaconda in 1976 at the Yerington porphyry copper mine in Nevada and subsequently worked for Anaconda in Alaska from 1977 through 1982. From 1982 through 1993, Dr. Hitzman worked throughout the world for Chevron Resources Company and initiated and managed base and precious metal exploration projects in Papua New Guinea, Brazil, Spain, Ireland, France, Germany, Italy, Tanzania, Canada, and the United States. In 1990 he discovered the Lisheen zinc-lead-silver deposit in Ireland. From 1990 through 1993, Dr. Hitzman was manager of the Lisheen project, guiding it through exploration and pre-feasibility, including engineering and environmental studies. In 1993, Dr. Hitzman was named Geological Society of America Congressional Fellow and served from September, 1993 to August, 1994, on the staff of U.S. Senator Joseph Lieberman (D - CT) working on natural resource and environmental issues. Dr. Hitzman was named Executive Branch Fellow by the American Association for the Advancement for Science/Sloan Foundation during 1994. As the Executive Branch Fellow he served as a senior policy analyst in the White House Office of Science and Technology Policy from September, 1994 through March, 1996 specializing in natural resource, environmental, and geoscience issues. In June, 1996, Dr. Hitzman became the Charles F. Fogarty Professor of Economic Geology at the Colorado School of Mines, and in 2000 was named Head of the Department of Geology and Geological Engineering at the Colorado School of Mines (he stepped down as such in August, 2007). Mr. Hitzman has been a director of a number of public companies similar to Cardero and, in such roles, he has had experience with the review and understanding of the accounting principles relevant to the financial statements of public natural resource companies.
Stephan Fitch: Stephan Fitch is a co-founder and a managing director of the London based International Asset Group, Ltd. (IAGL), a private company which specializes in international merchant banking activities. He has been involved in a broad range of international corporate finance/investment banking activities for over 18 years specializing primarily in start up, venture capital and small-capitalized public companies. Prior to joining IAGL, Mr. Fitch was co-founder and Executive Vice President of New World Capital, Inc. New World was established in 1992 and was involved in corporate finance and investment banking activities throughout Europe and the US. The firm's activities included the raising of capital from European institutional investors for small-capitalized US public companies, corporate restructuring, technology transfers between U.S. high tech companies and European conglomerates and, numerous M & A/strategic advisory projects. During this time, he assisted with the purchase and management of Eastern Securities, a fully licensed, NASD member, and New York City based broker/dealer. Prior to joining New World, Mr. Fitch co-founded in 1986, Somerset Partners Ltd., a Denver based partnership specializing in M & A activities. From 1984 to 1986, Mr. Fitch worked as an assistant research analyst for Cambridge Research and Management Group, a registered commodities trading advisor, based in Century City, California. In 1984, Mr. Fitch earned a Bachelor of Arts degree from the University of California, Los Angeles in Political Science with a specialization in International Relations. In connection with these activities, Mr. Fitch has had extensive experience in reviewing, interpreting and assessing financial statements and the underlying accounting principles, and has been involved in the development and analysis of internal controls and procedures for financial reporting.
Reliance on Certain Exemptions
At no time since November 1, 2010, being the commencement of Carderos most recently completed financial year, has the Company relied on the exemptions in the following sections of MI 52-110:
- 12 -
1. |
Section 2.4 (De Minimis Non-audit Services); |
2. |
Section 3.2 (Initial Public Offerings); |
3. |
Section 3.3(2) (Controlled Companies); |
4. |
Section 3.4 (Events Outside Control of Member); |
5. |
Section 3.5 (Death, Disability or Resignation of Audit Committee Member); |
6. |
Section 3.6 (Temporary Exemption for Limited and Exceptional Circumstances); |
7. |
Section 3.8 (Acquisition of Financial Literacy); or |
8. |
an exemption from MI 52-110, in whole or in part, granted under Part 8 of MI 52-110. |
Audit Committee Oversight
At no time since November 1, 2010, being the commencement of Carderos most recently completed financial year, was a recommendation of the Audit Committee to nominate or compensate an external auditor not adopted by the Board.
Pre-Approval Policies and Procedures
The Audit Committee is authorized by the Board to review the performance of Carderos external auditors and approve in advance provision of services other than auditing and to consider the independence of the external auditors, including reviewing the range of services provided in the context of all consulting services bought by Cardero. The Chairman of the Audit Committee is authorized to approve, in advance, any non-audit services or additional work which the Chairman deems as necessary and is required to notify the other members of the Audit Committee of such non-audit or additional work.
External Auditor Service Fees (By Category)
The aggregate fees billed by the Companys external auditors in each of the last two fiscal years for professional services rendered are as follows:
Financial Year Ending |
Audit
Fees(1) |
Audit Related
Fees(2) |
Tax
Fees(3) |
All Other
Fees(4) |
October 31, 2011 | $152,000 | $50,000(5) | $8,000 | $77,000(6) |
October 31, 2010 | $193,000 | $56,000(5) | $7,000 | $7,500(6) |
(1) The aggregate audit fees billed for the audit of the financial statements for the fiscal year indicated, including with respect to the audit of the Companys internal control over financial reporting in accordance with Section 404 of the Sarbanes-Oxley Act of 2002.
(2) The aggregate fees billed for assurance and related services that are reasonably related to the performance of the audit or review of the Companys financial statements which are not included under the heading Audit Fees.
(3) The aggregate fees billed for professional services rendered for tax compliance, tax advice and tax planning. The work performed in each year was assistance in the preparation and review of Carderos tax returns.
(4) The aggregate fees billed for products and services other than as set out under the headings Audit Fees, Audit Related Fees and Tax Fees.
(5) The services rendered are in connection with the review of the Companys quarterly financial statement and of its Form 40F and AIF disclosure documents and management discussion and analysis for the fiscal years indicated.
(6) The services rendered are in connection with the consideration of consolidating accounting issues (2011 - $30,000), plan of arrangement (2011 - $17,000) and the sale of the Pampa de Pongo property in Peru (2011 - $30,000; 2010 - $7,500).
CARDERO RESOURCE CORP.
(An Exploration Stage Company)
Audited Consolidated Financial Statements
October 31, 2011 and 2010
MANAGEMENTS RESPONSIBILITY FOR FINANCIAL STATEMENTS
The consolidated financial statements and all information in the annual report are the responsibility of the Board of Directors and management. The consolidated financial statements have been prepared by management in accordance with Canadian generally accepted accounting principles. Management maintains the necessary systems of internal controls, policies and procedures to provide assurance that assets are safeguarded and that the financial records are reliable and form a proper basis for the preparation of financial statements.
The Board of Directors ensures that management fulfills its responsibilities for financial reporting and internal control through an Audit Committee. This committee, which reports to the Board of Directors, meets with the independent auditors and reviews the financial statements.
The consolidated financial statements have been audited by Smythe Ratcliffe LLP, Chartered Accountants, who were appointed by the shareholders. The auditors report outlines the scope of their examination and their opinion on the consolidated financial statements.
MANAGEMENTS REPORT ON INTERNAL CONTROL OVER FINANCIAL REPORTING
The management of the Company is responsible for establishing and maintaining adequate internal control over financial reporting. Internal control over financial reporting is a process to provide reasonable assurance regarding the reliability of the Companys financial reporting for external purposes in accordance with accounting principles generally accepted in Canada and the United States of America. Internal control over financial reporting includes maintaining records that, in reasonable detail, accurately and fairly reflect the transactions and dispositions of the assets of the Company; providing reasonable assurance that transactions are recorded as necessary for preparation of the Companys financial statements in accordance with generally accepted accounting principles; providing reasonable assurance that receipts and expenditures are made in accordance with authorizations of management and the directors of the Company; and providing reasonable assurance that unauthorized acquisition, use or disposition of Companys assets that could have a material effect on its financial statements would be prevented or detected on a timely basis. Because of its inherent limitations, internal control over financial reporting is not intended to provide absolute assurance that a misstatement of the Companys financial statements would be prevented or detected.
The Company acquired 100% ownership in Cardero Coal Ltd. (formerly Coalhunter Mining Corporation) on June 1, 2011. Management excluded from its assessment of the effectiveness of Cardero Resource Corp.s internal control over financial reporting as of October 31, 2011. Cardero Coal Ltd.s internal control over financial reporting is associated with total assets of $66.4 million included in the consolidated financial statements of Cardero Resource Corp. and subsidiaries as of and for the year ended October 31, 2011. Management did not assess the effectiveness of internal control over financial reporting at Cardero Coal Ltd. due to the complexity associated with assessing internal controls during integration efforts.
Management conducted an evaluation of the effectiveness of the Companys internal control over financial reporting based on the framework and criteria established in Internal Control Integrated Framework, issued by the Committee of Sponsoring Organizations of the Treadway Commission. This evaluation included review of the documentation of controls, evaluation of the design effectiveness of controls, testing of the operating effectiveness of controls and a conclusion on this evaluation. Based on this evaluation, management concluded that the Companys internal control over financial reporting was effective as of October 31, 2011. The effectiveness of the Companys internal control over financial reporting as of October 31, 2011 has been audited by Smythe Ratcliffe LLP, an independent registered public accounting firm, as stated in their report.
Michael Hunter | Blaine Bailey |
Michael Hunter, | Blaine Bailey, |
President & Chief Executive Officer | Chief Financial Officer |
January 26, 2012 | |
Vancouver, Canada |
REPORT OF INDEPENDENT REGISTERED PUBLIC ACCOUNTING FIRM
TO THE SHAREHOLDERS OF CARDERO RESOURCE CORP.
(An Exploration Stage Company)
We have audited the accompanying consolidated balance sheets of Cardero Resource Corp. as of October 31, 2011 and 2010 and the consolidated statements of operations, shareholders equity and cash flows for the years ended October 31, 2011, 2010 and 2009, and a summary of significant accounting policies and other explanatory information.
Managements Responsibility for the Consolidated Financial
Statements
Management is responsible for the preparation and fair
presentation of these consolidated financial statements in accordance with
Canadian generally accepted accounting principles, and for such internal control
as management determines is necessary to enable the preparation of consolidated
financial statements that are free from material misstatement, whether due to
fraud or error.
Auditors Responsibility
Our responsibility
is to express an opinion on these consolidated financial statements based on our
audits. We conducted our audits in accordance with Canadian generally accepted
auditing standards and the standards of the Public Company Accounting Oversight
Board (United States). Those standards require that we comply with ethical
requirements and plan and perform the audit to obtain reasonable assurance about
whether the consolidated financial statements are free from material
misstatement.
An audit involves performing procedures to obtain audit evidence about the amounts and disclosures in the consolidated financial statements. The procedures selected depend on the auditors judgment, including the assessment of the risks of material misstatement of the consolidated financial statements, whether due to fraud or error. In making those risk assessments, the auditor considers internal control relevant to the entitys preparation and fair presentation of the consolidated financial statements in order to design audit procedures that are appropriate in the circumstances. An audit also includes evaluating the appropriateness of accounting policies used and the reasonableness of accounting estimates made by management, as well as evaluating the overall presentation of the consolidated financial statements.
We believe that the audit evidence we have obtained in our audits is sufficient and appropriate to provide a basis for our audit opinion.
Opinion
In our opinion, these consolidated financial
statements present fairly, in all material respects, the financial position of
Cardero Resource Corp. as at October 31, 2011 and 2010, and the results of its
operations and its cash flows for the years ended October 31, 2011, 2010 and
2009 in accordance with Canadian generally accepted accounting principles.
Other Matter
We have also audited, in accordance
with the standards of the Public Company Accounting Oversight Board (United
States), the Companys internal control over financial reporting as of October
31, 2011 based on criteria established in Internal Control Integrated
Framework issued by the Committee of Sponsoring Organizations of the Treadway
Commission and our report dated January 26, 2012 expressed an unqualified
opinion thereon.
Vancouver, Canada
January 26, 2012
REPORT OF INDEPENDENT REGISTERED PUBLIC ACCOUNTING FIRM
TO THE SHAREHOLDERS OF CARDERO RESOURCE CORP.
(An Exploration Stage Company)
We have audited Cardero Resource Corp.s (the Company) internal control over financial reporting as of October 31, 2011 based on the criteria established in Internal Control Integrated Framework issued by the Committee of Sponsoring Organizations of the Treadway Commission (COSO). The Companys management is responsible for maintaining effective internal control over financial reporting and for its assessment of the effectiveness of internal control over financial reporting included in the accompanying Management Report on Internal Control Over Financial Reporting. Our responsibility is to express an opinion on the Companys internal control over financial reporting based on our audit.
We conducted our audit in accordance with the standards of the Public Company Accounting Oversight Board (United States). Those standards require that we plan and perform the audit to obtain reasonable assurance about whether effective internal control over financial reporting was maintained in all material respects. Our audit included obtaining an understanding of internal control over financial reporting, assessing the risk that a material weakness exists, and testing and evaluating the design and operating effectiveness of internal control based on the assessed risks. Our audit also included performing such other procedures as we considered necessary in the circumstances. We believe that our audit provides a reasonable basis for our opinion.
A companys internal control over financial reporting is a process designed to provide reasonable assurance regarding the reliability of financial reporting and the preparation of financial statements for external purposes in accordance with generally accepted accounting principles. A companys internal control over financial reporting includes those policies and procedures that: (1) pertain to the maintenance of records that, in reasonable detail, accurately and fairly reflect the transactions and dispositions of the assets of the company; (2) provide reasonable assurance that transactions are recorded as necessary to permit preparation of financial statements in accordance with generally accepted accounting principles, and that receipts and expenditures of the company are being made only in accordance with authorizations of management and directors of the company; and (3) provide reasonable assurance regarding prevention or timely detection of unauthorized acquisition, use or disposition of the companys assets that could have a material effect on the financial statements.
Because of its inherent limitations, internal control over financial reporting may not prevent or detect misstatements. Also, projections of any evaluation of effectiveness to future periods are subject to the risk that controls may become inadequate because of changes in conditions, or that the degree of compliance with the policies or procedures may deteriorate.
As indicated in the accompanying Cardero Resource Corp.s Managements Report on Internal Control Over Financial Reporting, managements assessment of and conclusion on the effectiveness of internal control over financial reporting did not include the internal controls of Cardero Coal Ltd. (formerly Coalhunter Mining Corporation), which is included in the October 31, 2011 consolidated financial statements of Cardero Resource Corp. and constituted $66.4 million of total assets as of October 31, 2011. Our audit of internal control over financial reporting of Cardero Resource Corp. also did not include an evaluation of the internal control over financial reporting of Cardero Coal Ltd.
In our opinion, the Company maintained, in all material respects, effective internal control over financial reporting as of October 31, 2011, based on the criteria established in Internal Control Integrated Framework issued by the COSO.
We have also audited, in accordance with the standards of the Public Company Accounting Oversight Board (United States), the consolidated balance sheets of the Company as of October 31, 2011 and 2010, and the related consolidated statements of operations, shareholders equity and cash flows for the years ended October 31, 2011, 2010 and 2009, and our report dated January 26, 2012 expressed an unqualified opinion thereon.
Vancouver, Canada
January 26, 2012
CARDERO RESOURCE CORP. |
(AN EXPLORATION STAGE COMPANY) |
Consolidated Financial Statements |
October 31, 2011, 2010 and 2009 |
CARDERO RESOURCE CORP.
(AN EXPLORATION STAGE
COMPANY)
Consolidated Balance Sheets
October 31
2011 | 2010 | |||||
ASSETS | ||||||
Current | ||||||
Cash and cash equivalents | $ | 5,985,634 | $ | 52,264,003 | ||
Accounts receivable | 1,434,077 | 267,431 | ||||
Due from related parties (note 9) | 1,239,043 | 1,361,550 | ||||
Loan receivable (note 9) | 8,580,096 | - | ||||
Prepaid expenses | 356,191 | 335,493 | ||||
Total Current Assets | 17,595,041 | 54,228,477 | ||||
Fixed Assets (note 4) | 910,996 | 197,737 | ||||
Resource Related Investments (note 5) | 32,551,104 | 60,685,650 | ||||
Equity Investments (note 6) | - | 5,236,540 | ||||
Resource Property Advances | 810,100 | - | ||||
Resource Properties (notes 3 and 7) | 69,347,042 | 15,856,750 | ||||
Reclamation Deposit | 115,000 | - | ||||
Total Assets | $ | 121,329,283 | $ | 136,205,154 | ||
LIABILITIES | ||||||
Current | ||||||
Accounts payable and accrued liabilities (note 9) | $ | 4,038,261 | $ | 832,087 | ||
Income taxes payable | - | 26,847,314 | ||||
Total Current Liabilities | 4,038,261 | 27,679,401 | ||||
Future Income Tax Liability (note 3) | 11,713,033 | - | ||||
Total Liabilities | 15,751,294 | 27,679,401 | ||||
SHAREHOLDERS EQUITY | ||||||
Capital Stock (notes 3 and 8) | 107,237,122 | 69,890,947 | ||||
Contributed Surplus | 20,318,203 | 14,726,585 | ||||
Accumulated Other Comprehensive Income | 9,075,564 | 30,227,593 | ||||
Deficit | (31,052,900 | ) | (6,319,372 | ) | ||
Total Shareholders Equity | 105,577,989 | 108,525,753 | ||||
Total Liabilities and Shareholders Equity | $ | 121,329,283 | $ | 136,205,154 |
Nature of operations (note 1)
Commitments (note
12)
Subsequent events (note 17)
Approved on behalf of the Board:
Hendrik Van Alphen | Lawrence W. Talbot | |
Hendrik Van Alphen, Director | Lawrence W. Talbot, Director |
See Notes to Consolidated Financial Statements | 1 |
CARDERO RESOURCE CORP.
(AN EXPLORATION STAGE
COMPANY)
Consolidated Statements of Operations
Years Ended October 31
2011 | 2010 | 2009 | |||||||
Administrative Expenses | |||||||||
Amortization | $ | 244,935 | $ | 69,463 | $ | 52,418 | |||
Bad debts | - | 104,835 | 468,099 | ||||||
Consulting fees (notes 8 and 9) | 1,324,798 | 1,828,250 | 1,276,789 | ||||||
Corporate development | 606,239 | 301,906 | 91,058 | ||||||
Insurance | 108,928 | 162,115 | 173,179 | ||||||
Investor relations (note 8) | 650,779 | 553,873 | 254,789 | ||||||
Office costs | 736,844 | 1,005,473 | 726,334 | ||||||
Professional fees (note 9) | 977,197 | 995,418 | 820,382 | ||||||
Property evaluations (note 7(e)) | 3,610,508 | 226,202 | 453,525 | ||||||
Regulatory and transfer agent fees | 221,064 | 104,686 | 134,609 | ||||||
Salaries and benefits (note 8) | 3,840,081 | 3,238,965 | 2,215,861 | ||||||
Travel | 225,639 | 328,387 | 255,344 | ||||||
Loss Before Other Items and Income Taxes | (12,547,012 | ) | (8,919,573 | ) | (6,922,387 | ) | |||
Other Items | |||||||||
Foreign exchange gain (loss) | 984,660 | (3,832,001 | ) | (418,566 | ) | ||||
Interest income, net of bank charges (note 9(c)) | 1,420,650 | 36 | 24,575 | ||||||
Realized gain on sale of available-for-sale investment (note 5) | 8,833,404 | 939,651 | 2,718,254 | ||||||
Unrealized gain (loss) on derivative investments (note 5) | (2,936,073 | ) | 1,346,746 | 349,424 | |||||
Unrealized gain (loss) on held-for-trading investment (note 5) | (59,500 | ) | 52,000 | 11,000 | |||||
Gain on sale of resource property (note 7(c)(ii)) | - | 87,727,157 | 8,597,655 | ||||||
Write-off of resource properties (note 7) | (12,206,614 | ) | (8,498,083 | ) | (3,070,287 | ) | |||
Impairment losses on available-for-sale investments (note 5) | (2,837,978 | ) | - | - | |||||
Loss on equity investments (note 6) | (793,194 | ) | (483,461 | ) | (795,000 | ) | |||
Loss on debt settlement | - | - | (17,176 | ) | |||||
(7,594,645 | ) | 77,252,045 | 7,399,879 | ||||||
Income (Loss) Before Income Taxes | (20,141,657 | ) | 68,332,472 | 477,492 | |||||
Income Taxes | |||||||||
Current expense | (859,159 | ) | (26,421,049 | ) | (2,564,900 | ) | |||
Future recovery (expense) (note 11) | (3,732,712 | ) | 3,039,547 | 1,832,780 | |||||
(4,591,871 | ) | (23,381,502 | ) | (732,120 | ) | ||||
Net Income (Loss) for the Year | $ | (24,733,528 | ) | $ | 44,950,970 | $ | (254,628 | ) | |
Basic and Diluted Income (Loss) Per Share | $ | (0.36 | ) | $ | 0.77 | $ | (0.01 | ) | |
Weighted Average Number of Common Shares Outstanding | 68,988,456 | 58,571,515 | 58,421,309 |
CARDERO RESOURCE CORP.
(AN EXPLORATION STAGE
COMPANY)
Consolidated Statements of Shareholders Equity
Capital Stock | Accumulated | |||||||||||||||||||||||
Other | Total | |||||||||||||||||||||||
Obligation to | Contributed | Comprehensive | Shareholders | |||||||||||||||||||||
Shares | Amount | Issue Shares | Deficit | Surplus | Income | Equity | ||||||||||||||||||
Balance, October 31, 2008 | 57,782,847 | $ | 68,824,822 | $ | 795,000 | $ | (51,015,714 | ) | $ | 11,912,309 | $ | 2,617,740 | $ | 33,134,157 | ||||||||||
Net loss for the year | - | - | - | (254,628 | ) | - | - | (254,628 | ) | |||||||||||||||
Other comprehensive income | ||||||||||||||||||||||||
Unrealized gain on available-for-sale investments | - | - | - | - | - | 12,043,882 | 12,043,882 | |||||||||||||||||
Transfer to income of realized gain on sale of resource related
investments |
- | - | - | - | - | (1,658,126 | ) | (1,658,126 | ) | |||||||||||||||
Comprehensive income for the year | 10,131,128 | |||||||||||||||||||||||
Shares issued for cash | ||||||||||||||||||||||||
Exercise of options | 25,000 | 36,750 | - | - | - | - | 36,750 | |||||||||||||||||
Exercise of warrants | 92,500 | 127,500 | - | - | - | - | 127,500 | |||||||||||||||||
Shares issued for non-cash | ||||||||||||||||||||||||
Reclassification of contributed surplus on exercise of options | - | 14,088 | - | - | (14,088 | ) | - | - | ||||||||||||||||
Reclassification of contributed surplus on exercise of warrants | - | 32,059 | - | - | (32,059 | ) | - | - | ||||||||||||||||
Investment acquisition | 500,000 | 795,000 | (795,000 | ) | - | - | - | - | ||||||||||||||||
Obligation to issue shares | - | - | 111,500 | - | - | - | 111,500 | |||||||||||||||||
Debt settlement | 143,130 | 204,676 | - | - | - | - | 204,676 | |||||||||||||||||
Stock-based compensation | - | - | - | - | 1,192,109 | - | 1,192,109 | |||||||||||||||||
Balance, October 31, 2009 | 58,543,477 | 70,034,895 | 111,500 | (51,270,342 | ) | 13,058,271 | 13,003,496 | 44,937,820 |
CARDERO RESOURCE CORP.
(AN EXPLORATION STAGE
COMPANY)
Consolidated Statements of Shareholders Equity (Continued)
Capital Stock | Accumulated | |||||||||||||||||||||||
Other | Total | |||||||||||||||||||||||
Obligation to | Contributed | Comprehensive | Shareholders | |||||||||||||||||||||
Shares | Amount | Issue Shares | Deficit | Surplus | Income | Equity | ||||||||||||||||||
Balance, October 31, 2009 (carried forward) | 58,543,477 | $ | 70,034,895 | $ | 111,500 | $ | (51,270,342 | ) | $ | 13,058,271 | $ | 13,003,496 | $ | 44,937,820 | ||||||||||
Net income for the year | - | - | - | 44,950,970 | - | - | 44,950,970 | |||||||||||||||||
Other comprehensive income | ||||||||||||||||||||||||
Unrealized gain on available-for-sale investments | - | - | - | - | - | 17,686,472 | 17,686,472 | |||||||||||||||||
Transfer
to income of realized gain on sale of resource related investments |
- | - | - | - | - | (462,375 | ) | (462,375 | ) | |||||||||||||||
Comprehensive income for the year | 62,175,067 | |||||||||||||||||||||||
Shares issued for cash | ||||||||||||||||||||||||
Exercise warrants | 67,125 | 90,619 | - | - | - | - | 90,619 | |||||||||||||||||
Shares purchased pending return to treasury | (312,300 | ) | (374,760 | ) | - | - | 1,066 | - | (373,694 | ) | ||||||||||||||
Shares issued for non-cash | ||||||||||||||||||||||||
Reclassification of contributed surplus on exercise of warrants | - | 28,693 | - | - | (28,693 | ) | - | - | ||||||||||||||||
Property acquisition | 75,000 | 111,500 | (111,500 | ) | - | - | - | - | ||||||||||||||||
Stock-based compensation | - | - | - | - | 1,695,941 | - | 1,695,941 | |||||||||||||||||
Balance, October 31, 2010 | 58,373,302 | 69,890,947 | - | (6,319,372 | ) | 14,726,585 | 30,227,593 | 108,525,753 | ||||||||||||||||
Net loss for the year | - | - | - | (24,733,528 | ) | - | - | (24,733,528 | ) | |||||||||||||||
Other comprehensive income | ||||||||||||||||||||||||
Unrealized loss on available-for-sale investments | - | - | - | - | - | (13,039,757 | ) | (13,039,757 | ) | |||||||||||||||
Transfer to income of realized gain on sale of
resource related investments |
- | - | - | - | - | (8,112,272 | ) | (8,112,272 | ) | |||||||||||||||
Comprehensive loss for the year | (45,885,557 | ) | ||||||||||||||||||||||
Shares issued for cash | ||||||||||||||||||||||||
Exercise options | 840,000 | 1,026,150 | - | - | - | - | 1,026,150 | |||||||||||||||||
Exercise warrants | 443,800 | 171,718 | - | - | - | - | 171,718 | |||||||||||||||||
Shares issued for non-cash | ||||||||||||||||||||||||
Reclassification of contributed surplus on exercise of options | - | 556,406 | - | - | (556,406 | ) | - | - | ||||||||||||||||
Reclassification of contributed surplus on exercise of warrants | - | 496,398 | - | - | (496,398 | ) | - | - | ||||||||||||||||
Acquisition of Cardero Coal (note 3) | 23,397,002 | 35,095,503 | - | - | 5,342,487 | - | 40,437,990 | |||||||||||||||||
Stock-based compensation | - | - | - | - | 1,301,935 | - | 1,301,935 | |||||||||||||||||
Balance, October 31, 2011 | 83,054,104 | $ | 107,237,122 | $ | - | $ | (31,052,900 | ) | $ | 20,318,203 | $ | 9,075,564 | $ | 105,577,989 |
CARDERO RESOURCE CORP.
(AN EXPLORATION STAGE
COMPANY)
Consolidated Statements of Cash Flows
Years Ended October 31
2011 | 2010 | 2009 | |||||||
Operating Activities | |||||||||
Net income (loss) for the year | $ | (24,733,528 | ) | $ | 44,950,970 | $ | (254,628 | ) | |
Items not involving cash | |||||||||
Amortization | 244,935 | 69,463 | 52,418 | ||||||
Bad debts | - | 104,835 | 468,099 | ||||||
Stock-based compensation (note 8) | 1,301,935 | 1,695,941 | 1,192,109 | ||||||
Write-off of resource properties (note 7) | 12,206,614 | 8,498,083 | 3,070,287 | ||||||
Realized gain on sale of available-for-sale investments | (8,833,403 | ) | (939,651 | ) | (2,718,254 | ) | |||
Unrealized loss (gain) on held-for-trading investment (note 5) | 59,500 | (52,000 | ) | (11,000 | ) | ||||
Loss on equity investment | 793,194 | 483,461 | 795,000 | ||||||
Unrealized loss (gain) on derivative investments (note 5) | 2,936,073 | (1,346,746 | ) | (349,424 | ) | ||||
Impairment losses on available-for-sale investments (note 5) | 2,837,978 | - | - | ||||||
Amortization of fair value of warrants to interest income | (892,513 | ) | - | - | |||||
Gain on sale of resource property | - | (87,727,157 | ) | (8,597,655 | ) | ||||
Loss on debt settlement | - | - | 17,176 | ||||||
Future income taxes (recovery) expense | 3,732,712 | (3,039,547 | ) | (1,832,780 | ) | ||||
Realized foreign exchange gain on income tax payable | (1,245,680 | ) | - | - | |||||
Unrealized foreign exchange loss | 1,369,755 | 2,877,426 | 32,360 | ||||||
Changes in non-cash working capital items | |||||||||
Accounts receivable | (308,776 | ) | (85,975 | ) | 300,662 | ||||
Due from related parties | 122,507 | (773,594 | ) | 150,916 | |||||
Loan receivable | (8,580,096 | ) | - | - | |||||
Prepaid expenses | (15,532 | ) | (95,465 | ) | (16,254 | ) | |||
Accounts payable and accrued liabilities | (163,112 | ) | 173,710 | 78,765 | |||||
Income taxes payable | (25,601,634 | ) | 24,282,414 | 2,564,900 | |||||
Cash Used in Operating Activities | (44,769,071 | ) | (10,923,832 | ) | (5,057,303 | ) | |||
Investing Activities | |||||||||
Acquisition of Cardero Coal Ltd. (note 3) | 2,348,873 | - | - | ||||||
Investment in and expenditures on resource properties | (7,332,461 | ) | (7,411,092 | ) | (3,778,314 | ) | |||
Increase in reclamation deposit | (110,000 | ) | - | - | |||||
Proceeds from resource property transactions, net of costs | - | 88,372,433 | 13,587,313 | ||||||
Proceeds from sale of resource related investments | 12,250,273 | 2,416,776 | 4,607,154 | ||||||
Purchase of resource related investments | (3,840,625 | ) | (17,094,329 | ) | (4,874,325 | ) | |||
Purchase of equity investments | (3,882,443 | ) | (5,720,000 | ) | - | ||||
Purchase of fixed assets | (771,028 | ) | (38,648 | ) | (82,059 | ) | |||
Cash Provided by (Used in) Investing Activities | (1,337,411 | ) | 60,525,140 | 9,459,769 | |||||
Financing Activities | |||||||||
Proceeds from shares issued | 1,197,868 | 90,619 | 164,250 | ||||||
Shares purchased pending return to treasury | - | (373,694 | ) | - | |||||
Cash Provided by (Used in) Financing Activities | 1,197,868 | (283,075 | ) | 164,250 | |||||
Effect of Foreign Exchange on Cash | (1,369,755 | ) | (2,877,426 | ) | (32,360 | ) | |||
Increase (Decrease) in Cash and Cash Equivalents | (46,278,369 | ) | 46,440,807 | 4,534,356 | |||||
Cash and Cash Equivalents, Beginning of the Year | 52,264,003 | 5,823,196 | 1,288,840 | ||||||
Cash and Cash Equivalents, End of the Year | $ | 5,985,634 | $ | 52,264,003 | $ | 5,823,196 | |||
Supplemental cash flow information (note 16) |
CARDERO RESOURCE CORP. |
(AN EXPLORATION STAGE COMPANY) |
Notes to Consolidated Financial Statements |
Years ended October 31, 2011, 2010 and 2009 |
1. |
NATURE OF OPERATIONS | |
Cardero Resource Corp. and its subsidiaries are engaged in the exploration of mineral properties, primarily in Mexico, Peru, Argentina, Ghana, the United States and Canada. The Company considers itself to be an exploration stage company. | ||
These consolidated financial statements have been prepared on the basis of accounting principles applicable to a going concern, which assume that the Company will be able to continue in operation for the foreseeable future. | ||
The Company incurred a loss of $24,733,528 for the year ended October 31, 2011 (2010 $44,950,970 net income; 2009 $254,628 net loss). The Company has working capital as at October 31, 2011 of $13,556,780 (2010 - $26,549,076), and a deficit of $31,052,900 (2010 - $6,319,372). | ||
As the equity market improves, with the fair value of the Companys investments, management believes it has sufficient funding for operations in the near future, which results in the going concern assumption being an appropriate underlying concept for the preparation of these consolidated financial statements. | ||
The business of mining and exploration involves a high degree of risk and there can be no assurance that current exploration programs will result in profitable mining operations. The Company has no source of revenue, and has significant cash requirements to meet its administrative overhead and maintain its mineral interests. The recoverability of amounts shown for resource properties is dependent on several factors. These include the discovery of economically recoverable reserves, the ability of the Company to obtain the necessary financing to complete the development of these properties, and future profitable production or proceeds from disposition of mineral properties or resource related investments. | ||
2. |
SIGNIFICANT ACCOUNTING POLICIES | |
(a) |
Basis of presentation | |
These consolidated financial statements are prepared in accordance with Canadian generally accepted accounting principles (GAAP) and are stated in Canadian dollars. As described in note 15, accounting principles generally accepted in Canada differ in certain material respects from accounting principles generally accepted in the United States (US GAAP). | ||
These consolidated financial statements include the accounts of Cardero Resource Corp. (Cardero) and its wholly-owned integrated subsidiaries, Cardero Argentina, S.A. (Cardero Argentina), Minerales Y Metales California, S.A. de C.V. (MMC), Cardero Iron Ore Company Ltd., Cardero Hierro Del Peru S.A.C. (Cardero Iron Peru), Cerro Colorado Development Ltd., Compania Minera Cardero Chile Limitada (Cardero Chile), Cardero Iron Ore (USA) Inc. (Cardero Iron US), Cardero Iron Ore Management (USA) Inc., Cardero Iron Ore Company (BVI) Ltd., Cardero Hierro Peru (BVI) Ltd., Cardero Coal Ltd. (formerly Coalhunter Mining Corporation) (Cardero Coal), Cardero Ghana Ltd. (Cardero Ghana) and Cardero Iron Ore Ghana (BVI) Ltd. (collectively, the Company). All significant inter-company transactions and balances have been eliminated. | ||
(b) |
Cash and cash equivalents | |
Cash and cash equivalents includes cash and highly liquid investments, with maturities of three months or less from the date of purchase, that are readily convertible to known amounts of cash and which are subject to an insignificant risk of change in value. Cash equivalents are held for the purpose of meeting short-term cash commitments rather than for investment or other purposes. |
6
CARDERO RESOURCE CORP. |
(AN EXPLORATION STAGE COMPANY) |
Notes to Consolidated Financial Statements |
Years ended October 31, 2011, 2010 and 2009 |
2. |
SIGNIFICANT ACCOUNTING POLICIES (Continued) | |
(c) |
Use of estimates | |
The preparation of financial statements in conformity with Canadian GAAP requires management to make estimates and assumptions that affect the reported amounts of assets and liabilities and disclosure of contingent assets and liabilities at the date of the financial statements, and the reported amounts of revenues and expenses during the reporting period. Areas requiring the use of estimates include the rates of amortization for fixed assets, the recoverability of resource property interests, the recoverability of accounts receivable and amounts due from related parties, the recoverability of equity investments, the assumptions used in the determination of the fair value of financial instruments and stock-based compensation, and the determination of the valuation allowance for future income tax assets and accruals. Management believes the estimates are reasonable; however, actual results could differ from those estimates and could impact future results of operations and cash flows. | ||
(d) |
Amortization | |
Amortization of fixed assets is recorded at the following annual rates: |
Computer equipment | - | 30% declining balance basis |
Computer software | - | 100% declining balance |
Office equipment | - | 20% to 30% declining balance basis |
Vehicle | - | 20% declining balance |
Metallurgy lab | - | over 5 years on a straight-line basis |
Leasehold improvements | - | over the term of the lease on a straight-line basis |
Additions during the year are amortized at one-half the annual rates. | ||
(e) |
Investments | |
Investments over which the Company exercises significant influence are accounted for using the equity method. Resource related investments, not including derivatives, are principally classified as available-for-sale, and are carried at quoted market value, where applicable, or at an estimate of fair value. Resulting unrealized gains or losses, net of applicable income taxes, are reflected in other comprehensive income, while realized gains or losses are reflected in operations. Share purchase warrants included in investments are derivative financial instruments and are classified as held-for-trading and, accordingly, unrealized gains or losses, net of applicable income taxes, are included in operations. | ||
The investments are reviewed, on an investment-by-investment basis quarterly, to consider whether there are any conditions that may indicate that the impairments are other than temporary. When the impairments are other than temporary, in the Companys assessment, the accumulated unrealized gains or losses are reflected in operations rather than in other comprehensive income. |
7
CARDERO RESOURCE CORP. |
(AN EXPLORATION STAGE COMPANY) |
Notes to Consolidated Financial Statements |
Years ended October 31, 2011, 2010 and 2009 |
2. |
SIGNIFICANT ACCOUNTING POLICIES (Continued) | ||
(f) |
Resource properties | ||
The Company capitalizes all costs related to investments in mineral property interests on a property-by-property basis. Such costs include mineral property acquisition costs and exploration and development expenditures, net of any recoveries. Costs are deferred until such time as the extent of mineralization has been determined and mineral property interests are either developed, the property is sold or the Companys mineral rights are allowed to lapse. | |||
All capitalized costs are reviewed, on a property-by-property basis, to consider whether there are any conditions that may indicate impairment. When the carrying value of a property exceeds its net recoverable amount (as estimated by quantifiable evidence of an economic geological resource or reserve or by reference to option or joint venture expenditure commitments) or when, in the Companys assessment, it will be unable to sell the property for an amount greater than the deferred costs, the property is written down for the impairment in value. | |||
From time to time, the Company may acquire or dispose of a mineral property interest pursuant to the terms of an option agreement. As such options are exercisable entirely at the discretion of the optionee, the amounts payable or receivable are not recorded at the time of the agreement. Option payments are recorded as property costs or recoveries when the payments are made or received. | |||
The amounts shown for acquisition costs and deferred exploration expenditures represent costs incurred to date and do not necessarily reflect present or future values. | |||
Capitalized costs are depleted over the useful lives of the properties upon commencement of commercial production, or written-off if the properties are abandoned or the applicable mineral rights are allowed to lapse. | |||
(g) |
Foreign currency translation | ||
The functional and reporting currency of the Company is the Canadian dollar. Amounts recorded in foreign currency are translated into Canadian dollars as follows: | |||
i. |
Monetary assets and liabilities, at the rate of exchange in effect as at the balance sheet date; | ||
ii. |
Non-monetary assets and liabilities, at the exchange rates prevailing at the time of the acquisition of the assets or assumption of the liabilities; and | ||
iii. |
Interest income and expenses (excluding amortization, which is translated at the same rate as the related asset), at the rate of exchange on the transaction date. |
Gains and losses arising from this translation of foreign currency are included in the determination of net income (loss) for the period. | ||
(h) |
Stock-based compensation | |
The Company accounts for stock-based compensation using a fair value based method with respect to all stock-based payments measured and recognized, to directors, employees and non -employees. For directors and employees, the fair value of the option is measured at the date of grant. For non-employees, the fair value of the options is measured on the earlier of the date at which the counterparty performance is complete or the date the performance commitment is reached, or the date at which the equity instruments are granted if they are fully vested and non-forfeitable. For directors, employees and non-employees, the fair value of the options is accrued and charged either to operations or mineral property interests, with the offset credit to contributed surplus, over the vesting period. If and when the stock options are exercised, the applicable amounts from contributed surplus are transferred to capital stock. |
8
CARDERO RESOURCE CORP. |
(AN EXPLORATION STAGE COMPANY) |
Notes to Consolidated Financial Statements |
Years ended October 31, 2011, 2010 and 2009 |
2. |
SIGNIFICANT ACCOUNTING POLICIES (Continued) | |
(i) |
Basic and diluted income (loss) per share | |
Basic income (loss) per share is calculated using the weighted average number of common shares outstanding during the year. The Company uses the treasury stock method to compute the dilutive effect of options, warrants and similar instruments. Under this method the dilutive effect on income per share is calculated presuming the exercise of outstanding options, warrants and similar instruments. It assumes that the proceeds of such exercise would be used to repurchase common shares at the average market price during the year. However, the calculation of diluted income (loss) per share excludes the effects of various conversions and exercise of options and warrants that would be anti-dilutive. Shares held in escrow, other than where their release is subject to the passage of time, are not included in the calculation of the weighted average number of common shares outstanding. | ||
(j) |
Revenue recognition | |
Interest income is recorded as earned at the effective rate of interest over the term to maturity. | ||
(k) |
Asset retirement obligations (ARO) | |
The Company recognizes an estimate of the liability associated with an ARO in the consolidated financial statements at the time the liability is incurred. The estimated fair value of the ARO is recorded as a long-term liability, with a corresponding increase in the carrying amount of the related asset. The capitalized amount is depleted on a unit-of-production basis over the life of the proved reserves. The liability amount is increased each reporting period due to the passage of time and the amount of accretion is charged to earnings in the period. The ARO can also increase or decrease due to changes in the estimates of timing of cash flows or changes in the original estimated undiscounted cost. Actual costs incurred upon settlement of the ARO are charged against the ARO to the extent of the liability recorded. | ||
(l) |
Income taxes | |
The Company follows the asset and liability method of accounting for income taxes. Under this method of tax allocation, future income tax assets and liabilities are determined based on differences between the financial statement carrying values and their respective income tax basis (temporary differences). Future income tax assets and liabilities are measured using the tax rates expected to be in effect when the temporary differences are likely to reverse. The effect on future income tax assets and liabilities of a change in tax rates is included in operations in the period in which the change is enacted or substantially assured. The amount of future income tax assets recognized is limited to the amount of the benefit that is more likely than not to be realized. | ||
(m) |
Financial instruments | |
All financial instruments are classified as one of the following: held-to-maturity, loans and receivables, held-for-trading, available-for-sale or other financial liabilities. Financial assets and liabilities held-for-trading are measured at fair value with gains and losses recognized in net income (loss). Financial assets held-to-maturity, loans and receivables, and other financial liabilities are measured at amortized cost using the effective interest method. Available-for-sale instruments are measured at fair value with unrealized gains and losses recognized in other comprehensive income (loss) and reported in shareholders equity. Any financial instrument may be designated as held-for-trading upon initial recognition. | ||
Transaction costs that are directly attributable to the acquisition or issue of financial instruments that are classified as other than held-for-trading, which are expensed as incurred, are included in the initial carrying value. |
9
CARDERO RESOURCE CORP. |
(AN EXPLORATION STAGE COMPANY) |
Notes to Consolidated Financial Statements |
Years ended October 31, 2011, 2010 and 2009 |
2. |
SIGNIFICANT ACCOUNTING POLICIES (Continued) | |
(n) |
Future accounting changes | |
International Financial Reporting Standards (IFRS) | ||
In 2008, the Canadian Accounting Standards Board confirmed that the transition to IFRS from Canadian GAAP will be effective for fiscal years beginning on or after January 1, 2011 for publicly accountable enterprises. The Company will therefore be required to present IFRS financial statements for its January 31, 2012 interim consolidated financial statements. The effective date will require the restatement for comparative purposes of amounts reported by the Company for the interim periods and for the year ended October 31, 2011. | ||
3. |
ACQUISITION OF CARDERO COAL | |
On June 1, 2011, the Company completed the acquisition of Cardero Coal through a Plan of Arrangement (the Acquisition) whereby one Cardero Coal common share was exchanged for 0.8 of a common share of the Company. The acquisition resulted in the Company issuing 23,397,002 common shares on the effective date, with a further 5,885,543 common shares reserved for issuance for the exercise of options held by former Cardero Coal optionees, the exercise of Cardero Coal warrants and pursuant to Cardero Coal property acquisition agreements. On completion of the transaction, Cardero Coal became a wholly-owned subsidiary of the Company. The Company accounted for the Acquisition using the asset acquisition method. | ||
The fair value of the common shares of the Company issued in connection with the Acquisition has been determined at $1.50 per share. The fair values of the Companys share purchase options and warrants issued as replacement options and warrants granted were $2,416,470 and $4,354,140. The Company options vest on December 1, 2011 (25%), June 1, 2012 (25%), and December 1, 2012 (50%). The fair values were calculated using the Black-Scholes pricing model. Of the aggregate fair value, $988,347 represents the value of the Cardero Coal options at May 31, 2011 and was allocated to the total purchase price. The remaining $1,428,123 will be allocated to salaries and benefits over the vesting term. The assumptions used in the calculation are as follows: |
Options | Warrants | ||
Expected life (years) | 2.0 | 2.0 | |
Interest rate | 1.45% | 1.45% | |
Volatility (average) | 49.89% | 52.61% | |
Dividend yield | 0.00% | 0.00% |
The purchase consideration is comprised of the following:
Total purchase price: | ||||
Initial investments in Cardero Coal to acquire a 45.5% interest | $ | 7,205,311 | ||
Issuance of 23,397,002 Cardero common shares for 54.5% interest | 35,095,503 | |||
Fair value of 2,029,143 Cardero options as replacement options | 988,347 | |||
Fair value of 3,856,400 Cardero warrants as replacement warrants | 4,354,140 | |||
Transaction costs | 922,393 | |||
$ | 48,565,694 |
10
CARDERO RESOURCE CORP. |
(AN EXPLORATION STAGE COMPANY) |
Notes to Consolidated Financial Statements |
Years ended October 31, 2011, 2010 and 2009 |
3. |
ACQUISITION OF CARDERO COAL (Continued) |
The fair value of the Cardero Coal assets acquired and liabilities assumed as at the acquisition date were as follows: |
Purchase price allocation: | ||||
Cash | $ | 2,626,895 | ||
Accounts receivable | 87,990 | |||
Due from Cardero | 644,370 | |||
Prepaid expenses | 5,166 | |||
Fixed assets | 187,166 | |||
Resource property advances | 166,788 | |||
Reclamation deposit | 5,000 | |||
Resource properties (note 7) | 57,021,938 | |||
Accounts payable and accrued liabilities | (466,586 | ) | ||
Future income tax liability | (11,713,033 | ) | ||
$ | 48,565,694 |
4. |
FIXED ASSETS |
2011 | 2010 | |||||||||||||||||||
Accumulated | Accumulated | |||||||||||||||||||
Cost | Amortization | Net | Cost | Amortization | Net | |||||||||||||||
Computer equipment | $ | 232,518 | $ | 145,741 | $ | 86,777 | $ | 171,624 | $ | 122,128 | $ | 49,496 | ||||||||
Computer software | 146,280 | 63,738 | 82,542 | - | - | - | ||||||||||||||
Office equipment | 208,937 | 68,830 | 140,107 | 99,853 | 48,402 | 51,451 | ||||||||||||||
Vehicle | 20,874 | 1,740 | 19,134 | - | - | - | ||||||||||||||
Metallurgy lab | 508,651 | 102,359 | 406,292 | - | - | - | ||||||||||||||
Leasehold improvements | 345,068 | 168,924 | 176,144 | 210,530 | 113,740 | 96,790 | ||||||||||||||
$ | 1,462,328 | $ | 551,332 | $ | 910,996 | $ | 482,007 | $ | 284,270 | $ | 197,737 |
5. |
RESOURCE RELATED INVESTMENTS |
Shares | Warrants | ||||||||||||||||
2011 | Number | Fair Value | Number | Fair Value | Total | ||||||||||||
International Tower Hill Mines Ltd. (ITH) | 3,053,933 | $ | 15,330,744 | - | $ | - | $ | 15,330,744 | |||||||||
Trevali Mining Corporation (Trevali) | 11,159,432 | 10,043,489 | 4,533,572 | 506,635 | 10,550,124 | ||||||||||||
Wealth Minerals Ltd. (Wealth) | 5,022,806 | 1,029,675 | - | - | 1,029,675 | ||||||||||||
Dorato Resources Inc. (Dorato) | 2,536,000 | 304,320 | - | - | 304,320 | ||||||||||||
Indico Resources Ltd. (Indico) | 50,000 | 11,000 | - | - | 11,000 | ||||||||||||
Balmoral Resources Ltd. (Balmoral) | 240,000 | 235,200 | - | - | 235,200 | ||||||||||||
Corvus Gold Inc. (Corvus) | 1,655,711 | 1,043,098 | - | - | 1,043,098 | ||||||||||||
Abzu Gold Inc. (Abzu Gold) | 8,934,007 | 3,841,623 | 3,782,000 | 37,820 | 3,879,443 | ||||||||||||
Ethos Capital Corp.(Ethos) | 250,000 | 167,500 | - | - | 167,500 | ||||||||||||
$ | 32,006,649 | $ | 544,455 | $ | 32,551,104 |
11
CARDERO RESOURCE CORP. |
(AN EXPLORATION STAGE COMPANY) |
Notes to Consolidated Financial Statements |
Years ended October 31, 2011, 2010 and 2009 |
5. |
RESOURCE RELATED INVESTMENTS (Continued) |
Shares | Warrants | ||||||||||||||||
2010 | Number | Fair Value | Number | Fair Value | Total | ||||||||||||
ITH | 4,591,223 | $ | 34,847,383 | - | $ | - | $ | 34,847,383 | |||||||||
Trevali | 7,032,432 | 9,986,053 | 2,855,866 | 1,243,942 | 11,229,995 | ||||||||||||
Wealth | 5,022,806 | 3,164,368 | - | - | 3,164,368 | ||||||||||||
Dorato | 2,416,000 | 3,020,000 | - | - | 3,020,000 | ||||||||||||
Indico | 50,000 | 31,000 | - | - | 31,000 | ||||||||||||
Kria Resources Ltd. (Kria) | 15,000,000 | 3,150,000 | 15,000,000 | 2,400,000 | 5,550,000 | ||||||||||||
Corvus | 880,711 | 871,904 | - | - | 871,904 | ||||||||||||
Abzu Gold | 3,782,000 | 1,891,000 | - | - | 1,891,000 | ||||||||||||
Ethos | 100,000 | 80,000 | - | - | 80,000 | ||||||||||||
$ | 57,041,708 | $ | 3,643,942 | $ | 60,685,650 |
All the resource related companies are considered to be related parties by virtue of having directors and/or officers in common. All investments in shares are classified as available-for-sale under the financial instruments classification except for the investment in Ethos, which is classified as held-for-trading. As investments in warrants are considered to be derivative instruments, they are by definition classified as held-for-trading.
During the year ended October 31, 2011, the Company acquired additional investments for a total cost of $3,840,625 (2010 - $17,094,329; 2009 - $4,874,325). The Company sold investments for gross proceeds of $12,250,273 (2010 - $2,416,776; 2009 - $4,607,154) at a cost of $3,416,869 (2010 - $1,477,125; 2009 - $1,888,900) for net gains on sale of $8,833,403 (2010 - $939,651; 2009 - $2,718,254). Impairment losses on resource related investments amounted to $2,837,978 (2010 and 2009 - $Nil).
2011 | 2010 | ||||||||||||||
Exercise | Number of | Exercise | Number of | ||||||||||||
Warrants | Expiry Date | Price | Warrants | Price | Warrants | ||||||||||
Trevali | May 11, 2011 | $ | 1.30 | - | $ | 1.30 | 625,000 | ||||||||
May 29, 2010 | $ | 1.20 | - | $ | 1.20 | 67,000 | |||||||||
October 9, 2011 | $ | 1.00 | - | $ | 1.00 | 735,294 | |||||||||
September 1, 2012 | $ | 1.50 | 1,428,572 | $ | 1.50 | 1,428,572 | |||||||||
July 29, 2012 | $ | 1.00 | 1,825,000 | $ | 1.00 | - | |||||||||
January 14, 2012 | $ | 1.25 | 1,280,000 | $ | 1.25 | - | |||||||||
4,533,572 | 2,855,866 | ||||||||||||||
Abzu Gold | December 21, 2011 (note 17) | $ | 0.75 | 3,782,000 | $ | 0.75 | - | ||||||||
Kria | July 29, 2012 | $ | 1.00 | - | $ | 1.00 | 15,000,000 |
During the year ended October 31, 2011, the Company recorded an unrealized loss (gain) on the fair value adjustment of derivatives of $2,936,073 (2010 ($1,346,746); 2009 ($349,424)) and acquired additional share purchase warrants at a value of $718,580 (2010 - $1,171,429; 2009 - $905,072)
12
CARDERO RESOURCE CORP. |
(AN EXPLORATION STAGE COMPANY) |
Notes to Consolidated Financial Statements |
Years ended October 31, 2011, 2010 and 2009 |
6. |
EQUITY INVESTMENTS |
2011 | 2010 | ||||||
Abzu Resources Ltd. | $ | - | $ | 1,131,253 | |||
Cardero Coal Ltd. (Ownership interest 42%) | - | 4,105,287 | |||||
$ | - | $ | 5,236,540 |
(a) |
Abzu Resources Ltd. (Abzu) | |
During the year ended October 31, 2010, the Company acquired 9,000,002 shares of Abzu at a gross cost of $1,350,000. The Companys proportionate share of the net book value of Abzus assets at the acquisition date totaled $1,220,272. The difference between investment cost and the Companys share of net assets is attributed to resource properties. The Company accounted for its investment in Abzu using the equity method and recorded the investment at a gross cost of $1,350,000. For the year ended October 31, 2010, the Companys share of Abzus results of operations amounted to a loss of $218,748 based upon Abzus financial statements as of October 31, 2010. As at October 31, 2010, the Company held approximately 31.36% of the outstanding common shares of Abzu. | ||
On December 21, 2010, Totem Minerals Inc. acquired Abzu and changed its name to Abzu Gold Inc. (note 5). Between November 1, 2010 and December 20, 2010, the Companys share of Abzus results of operations amounted to a loss of $10,775 based upon Abzus financial statements as of December 31, 2010. | ||
Following the above acquisition, the Company held 16.32% of Abzu Gold and changed this investment classification to available-for-sale from the equity method (note 5). | ||
(b) |
Cardero Coal | |
During the year ended October 31, 2010, the Company acquired 14,200,000 shares of Cardero Coal at a gross cost of $4,370,000. The Companys proportionate share of the net book value of Cardero Coals assets (liabilities) at the acquisition dates totaled $(60,669). The difference between investment cost and the Companys share of net assets was attributed to resource properties. The Company accounted for its investment in Cardero Coal using the equity method and recorded the investment at a gross cost of $4,370,000. For the year ended October 31, 2010, the Companys share of Cardero Coals results of operations amounted to a loss of $264,713 based upon Cardero Coals financial statements as of October 31, 2010. As at October 31, 2010, the Company held approximately 42% of the outstanding common shares of Cardero Coal. | ||
On December 16, 2010, the Company participated in a private placement in Cardero Coal and acquired 5,600,000 special warrants of Cardero Coal (Special Warrants) at a cost of $2,800,000. Each Special Warrant was exercisable to acquire one common share of Cardero Coal, and would be automatically exercised upon the third business day after the issuance of a receipt for a prospectus of Cardero Coal qualifying the issuance of the common shares upon the exercise of the Special Warrants. If such receipt was not issued by June 27, 2011, each Special Warrant would thereafter be exercisable to acquire 1.1 common shares, and if such receipt has not been issued by September 27, 2011, each Special Warrant would thereafter be exercisable to acquire 1.11 common shares. | ||
Pursuant to its top-up right, on December 21, 2010, the Company acquired by private placement an additional 3,608,143 common shares of Cardero Coal at a cost of $0.30 per share, for an additional investment of $1,082,443. | ||
During the year ended October 31, 2011, the Company acquired the balance of Cardero Coals outstanding securities pursuant to a Plan of Arrangement, effective June 1, 2011 (note 3). |
13
CARDERO RESOURCE CORP. |
(AN EXPLORATION STAGE COMPANY) |
Notes to Consolidated Financial Statements |
Years ended October 31, 2011, 2010 and 2009 |
6. |
EQUITY INVESTMENTS (Continued) | |
(b) |
Cardero Coal (Continued) | |
Before the acquisition, the Companys share of Cardero Coals results of operations amounted to a loss of $782,419 based upon Cardero Coals financial statements as of May 31, 2011. The Company held approximately 45.5% (2010 - 42%) of the outstanding common shares of Cardero Coal before the acquisition. | ||
(c) |
IMM Gold Ltd. (IMMG) | |
Pursuant to a Memorandum of Understanding dated August 8, 2008 (but effective as and from April 25, 2008) between the Company and International Minerals and Mines Ltd. (IMM), a private Gibraltar company, the Company had the right to acquire up to a 30% interest in IMMG, a subsidiary of IMM. The Company is the manager of the exploration programs, but no properties have yet been acquired by IMMG. A director of Cardero is a director and significant shareholder of a private company, which is the major shareholder (67%) of IMM (note 9). | ||
The Company acquired a 15% interest in IMMG by issuing to IMM 500,000 common shares on November 24, 2008 valued at $795,000. The Company received 123,530 ordinary shares of IMMG, representing a 15% interest. The Company may also be required to issue up to an additional 250,000 common shares as consideration for the initial 15% interest in IMMG if, on November 24, 2009, the volume weighted average trading price for the Companys common shares on the Toronto Stock Exchange (the TSX) for the five trading days immediately prior to such date (Final VWAP) is less than $1.83. In such case, the Company is then required to issue to IMM such number of additional common shares of the Company (up to a maximum of 250,000 additional shares) as is equal to the difference between the $1.83 and the Final VWAP, multiplied by 500,000 and divided by the Final VWAP. | ||
For the year ended October 31, 2009, the Companys share of IMMGs results of operations amounted to a loss of $199,677 based upon IMMGs audited financial statements for the year then ended. After consideration of current market conditions and IMMGs operating loss, the Company recorded an impairment charge of $595,323 to reduce the carrying value of the investment to $Nil. |
14
CARDERO RESOURCE CORP. |
(AN EXPLORATION STAGE COMPANY) |
Notes to Consolidated Financial Statements |
Years ended October 31, 2011, 2010 and 2009 |
7. |
RESOURCE PROPERTIES |
The Companys capitalized acquisition and exploration expenditures on its resource properties are as follows: |
Mexico | Argentina | Peru | U.S.A. | Ghana | Canada | ||||||||||||||||||||||
(note 7(a)) | (note 7(b)) | (note 7(c)) | (note 7(d)) | (note 7(e)) | (note 7(f)) | ||||||||||||||||||||||
Iron Sands/ | Longnose/ | Ghana Sheini | |||||||||||||||||||||||||
Baja | Other | Total | Marcona | TiTac | Iron Ore | Carbon Creek | Total | ||||||||||||||||||||
Balance, October 31, 2009 | $ | 7,336,527 | $ | 231,978 | $ | 7,568,505 | $ | 894,114 | $ | 8,727,626 | $ | 309,347 | $ | - | $ | - | $ | 17,499,592 | |||||||||
Acquisition costs cash | 302,911 | 10,966 | 313,877 | 4,887 | 649,772 | 70,714 | 50,000 | - | 1,089,250 | ||||||||||||||||||
Deferred exploration costs: | |||||||||||||||||||||||||||
Camp | 111,473 | 12,075 | 123,548 | 298,536 | 658,584 | 318,650 | - | - | 1,399,318 | ||||||||||||||||||
Drilling and analysis | 654,228 | - | 654,228 | 784,761 | 27,097 | 1,614,088 | - | - | 3,080,174 | ||||||||||||||||||
Personnel and geology | 92,944 | 6,108 | 99,052 | 489,337 | 191,016 | 336,178 | 170,916 | - | 1,286,499 | ||||||||||||||||||
Total exploration costs | 858,645 | 18,183 | 876,828 | 1,572,634 | 876,697 | 2,268,916 | 170,916 | - | 5,765,991 | ||||||||||||||||||
Total expenditures for the year | 1,161,556 | 29,149 | 1,190,705 | 1,577,521 | 1,526,469 | 2,339,630 | 220,916 | - | 6,855,241 | ||||||||||||||||||
Write-offs Acquisition costs | (3,567,578 | ) | - | (3,567,578 | ) | - | - | - | - | - | (3,567,578 | ) | |||||||||||||||
Write-offs Exploration costs | (4,930,505 | ) | - | (4,930,505 | ) | - | - | - | - | - | (4,930,505 | ) | |||||||||||||||
Total write-offs | (8,498,083 | ) | - | (8,498,083 | ) | - | - | - | - | - | (8,498,083 | ) | |||||||||||||||
Balance, October 31, 2010 | - | 261,127 | 261,127 | 2,471,635 | 10,254,095 | 2,648,977 | 220,916 | - | 15,856,750 | ||||||||||||||||||
Acquisition costs: | |||||||||||||||||||||||||||
Acquisition costs shares (note 3) | - | - | - | - | - | - | - | 57,021,938 | 57,021,938 | ||||||||||||||||||
Acquisition costs cash | - | 3,373 | 3,373 | 8,479 | 877,561 | 50,075 | - | 5,800 | 945,288 | ||||||||||||||||||
Total acquisition costs | - | 3,373 | 3,373 | 8,479 | 877,561 | 50,075 | - | 57,027,738 | 57,967,226 | ||||||||||||||||||
Deferred exploration costs: | |||||||||||||||||||||||||||
Camp | - | 17,504 | 17,504 | 65,396 | 653,215 | 218,206 | - | 3,155,433 | 4,109,754 | ||||||||||||||||||
Drilling and analysis | - | - | - | 94,927 | 114,397 | 578,031 | - | 1,823,913 | 2,611,268 | ||||||||||||||||||
Personnel and geology | - | - | - | 61,210 | 29,700 | 268,835 | - | 946,296 | 1,306,041 | ||||||||||||||||||
Total exploration costs | - | 17,504 | 17,504 | 221,533 | 797,312 | 1,065,072 | - | 5,925,642 | 8,027,063 | ||||||||||||||||||
Total expenditures for the year | - | 20,877 | 20,877 | 230,012 | 1,674,873 | 1,115,147 | - | 62,953,380 | 65,994,289 | ||||||||||||||||||
Costs recovered Exploration | - | (222,000 | ) | (222,000 | ) | - | - | (75,383 | ) | - | - | (297,383 | ) | ||||||||||||||
Write-offs Acquisition costs | - | (6,730 | ) | (6,730 | ) | (50,000 | ) | (4,383,054 | ) | - | (50,000 | ) | - | (4,489,784 | ) | ||||||||||||
Write-offs Exploration costs | - | - | - | - | (7,545,914 | ) | - | (170,916 | ) | - | (7,716,830 | ) | |||||||||||||||
Total write-offs | - | (6,730 | ) | (6,730 | ) | (50,000 | ) | (11,928,968 | ) | - | (220,916 | ) | - | (12,206,614 | ) | ||||||||||||
Balance, October 31, 2011 | $ | - | $ | 53,274 | $ | 53,274 | $ | 2,651,647 | $ | - | $ | 3,688,741 | $ | - | $ | 62,953,380 | $ | 69,347,042 | |||||||||
Represented by: | |||||||||||||||||||||||||||
Acquisition costs | $ | - | $ | 53,274 | $ | 53,274 | $ | 144,891 | $ | - | $ | 293,111 | $ | - | $ | 57,027,738 | $ | 57,519,014 | |||||||||
Exploration costs | - | - | - | 2,506,756 | - | 3,395,630 | - | 5,925,642 | 11,828,028 | ||||||||||||||||||
Balance, October 31, 2011 | $ | - | $ | 53,274 | $ | 53,274 | $ | 2,651,647 | $ | - | $ | 3,688,741 | $ | - | $ | 62,953,380 | $ | 69,347,042 |
15
CARDERO RESOURCE CORP. |
(AN EXPLORATION STAGE COMPANY) |
Notes to Consolidated Financial Statements |
Years ended October 31, 2011, 2010 and 2009 |
7. |
RESOURCE PROPERTIES (Continued) | |
(a) |
Mexico | |
The properties in Mexico consist of the following: |
i. |
Baja IOCG Project, Baja California State, Mexico | |
Pursuant to an agreement dated December 1, 2002 (as amended by agreements dated November 26, | ||
2003 and June 30, 2005) between the Company and Anglo (the Anglo Agreement), Anglo agreed to manage and fund exploration expenditures for the identification and acquisition of not less than one mineral concession within an area of interest measuring approximately 50,050 square kilometres in size. Anglo could earn a 70% interest in the mineral concession(s) so acquired, as well as in certain previously acquired mineral concessions held by the Company, and a 70% interest in a new Mexican company to be formed to hold such concessions, by incurring aggregate exploration expenditures of not less than USD 3,700,000, as follows: |
- | USD 200,000 on or before December 1, 2003 (incurred); | |
- | USD 800,000 on or before December 1, 2004 (incurred); | |
- | USD 1,200,000 on or before December 1, 2005 (incurred); and | |
- | USD 3,700,000 on or before December 1, 2006 (see below). |
Upon Anglo incurring an aggregate USD 3,700,000 of exploration expenditures, a joint venture would be formed, with each party required to contribute its pro rata share of all future exploration expenditures. A non-participating party can be diluted to a minimum 10% working interest, below which percentage its interest would be automatically converted to a 5% net profit interest.
Pursuant to an amending agreement dated June 30, 2005 between the Company and Anglo, the Company assumed operation of the project. Under the terms of the amending agreement, the Company was required to incur exploration expenditures of not less than USD 500,000 within a 12-month period and, upon doing so, earned an additional 10% interest, thereby increasing its retained interest in the project to 40% upon the exercise by Anglo of its option. Upon having incurred the required USD 500,000 in exploration expenditures, the Company could either elect to terminate its expenditure period by delivering a resumption notice to Anglo, or to elect to remain as operator and continue to incur exploration expenditures. If the Company elected to continue incurring exploration expenditures following the USD 500,000 having been incurred, it would earn an additional 0.1% interest for each additional USD 10,000 of exploration expenditures incurred. If the Company elected to continue incurring exploration expenditures, at such time as it has incurred an aggregate of USD 1,400,000 (and has thereby increased its retained interest to 49% upon the exercise by Anglo of its option), it was required to deliver an election request notice to Anglo. Upon receipt by Anglo of a resumption notice or an election request notice, Anglo was required (unless it otherwise so elected) to immediately resume incurring aggregate exploration expenditures of USD 3,700,000 in order to earn its interest in the project (which will range from 60% to 51%, depending upon the amount of exploration expenditures incurred by the Company prior to the delivery of a resumption notice) with the original exploration expenditure dates extended to take into account the time the Company acted as operator. If the Company delivered a resumption notice, or if the Company delivered an election request notice and Anglo elected to continue incurring exploration expenditures, and thereafter Anglo fails to maintain its option in good standing, the Company could terminate the agreement. If the Company delivered an election request notice and Anglo did not elect to resume incurring exploration expenditures, the agreement would be automatically terminated. In either case, in the event of termination, the Company would retain its 100% interest in the project, with Anglo having no residual interest therein.
16
CARDERO RESOURCE CORP. |
(AN EXPLORATION STAGE COMPANY) |
Notes to Consolidated Financial Statements |
Years ended October 31, 2011, 2010 and 2009 |
7. |
RESOURCE PROPERTIES (Continued) | ||
(a) |
Mexico (Continued) | ||
i. |
Baja IOCG Project, Baja California State, Mexico (Continued) | ||
Effective May 30, 2006, Anglo elected to terminate the Anglo Agreement and thereby forfeited any interest in, or rights to earn any interest in, the mineral concessions that were the subject of that agreement. Accordingly, the Company is now the owner of a 100% interest in the concessions comprising the Baja IOCG Project. | |||
On May 20, 2004, Western Telluric Resources Inc. (WTR) and Minera Olympic, S. de R.L. de C.V. (Minera) (collectively, the Plaintiffs) commenced an action (the Action) in the British Columbia Supreme Court (Vancouver Registry, No. S042795) against the Company and James Dawson, Murray McClaren and their respective companies, Dawson Geological Consultants Ltd. and 529197 B.C. Ltd. (carrying on business as Crockite Resources). The relief claimed against the Company is the setting aside of an agreement dated December 12, 2001 between the Company and Minera regarding the acquisition of mineral concessions. The Company filed a Statement of Defence, in which it denied any liability, as well as a counterclaim (the Counterclaim) against the Plaintiffs. Pursuant to an agreement dated October 17, 2007 (Settlement Agreement) among the Plaintiffs, the Company and all other parties to the various actions, all actions (including the Action and the Counterclaim) have been settled. As its part of the settlement, the Company has agreed to issue an aggregate of 500,000 shares to WTR and to grant to WTR a 1.5% net smelter return (NSR) royalty over its existing and future acquired Baja California properties, of which the Company can acquire one-half (0.75%) for $2,000,000. Fulfillment by the Company of its obligations under the Settlement Agreement was subject to the acceptance for filing thereof by the TSX (received on November 20, 2007) and the NYSE-A (formerly, the American Stock Exchange) (received on November 13, 2007). Effective May 23, 2008, the transaction closed and the 500,000 shares were released to WTR. | |||
During the year ended October 31, 2010, the Company wrote-off its remaining investment in the property in the amount of $8,498,083. | |||
ii. |
Corrales Property, Chihuahua State, Mexico | ||
The Corrales property consists of one exploitation concession (100 hectares) located in the Municipality of Lopez, Chihuahua State, plus an additional 8,400-hectare exploration concession held 100% by the Company. | |||
Pursuant to an agreement dated October 23, 2007 between the Company and three Mexican individuals, the Company has been granted a five-year lease of the exploitation concession, with the right to purchase a 100% interest by making aggregate payments of USD 657,000 over five years to October 23, 2012, as follows: |
- | USD 24,000 on execution (paid); | |
- | USD 18,000 on or before January 23, 2008 (paid); | |
- | USD 15,000 on or before October 23, 2008 (paid); | |
- | USD 60,000 on or before October 23, 2009 (note 7(a)(iv)); | |
- | USD 90,000 on or before October 23, 2010 (note 7(a)(iv)); | |
- | USD 100,000 on or before October 23, 2011 (note 7(a)(iv)); and | |
- | USD 350,000 on or before October 23, 2012. |
The Company has granted to a public company the option to acquire up to a 70% interest in the Corrales property (see note 7(a)(iv)).
17
CARDERO RESOURCE CORP. |
(AN EXPLORATION STAGE COMPANY) |
Notes to Consolidated Financial Statements |
Years ended October 31, 2011, 2010 and 2009 |
7. |
RESOURCE PROPERTIES (Continued) |
(a) |
Mexico (Continued) |
iii. |
Santa Teresa Property, Coahuila State | |
The Santa Teresa property consists of 8,715 hectares of exploration concessions held 100% by the Company. The Company has granted to a public company the option to acquire up to a 70% interest in the Santa Teresa property (note 7(a)(iv)). | ||
iv. |
Ethos Capital Corp. Option/Joint Venture, Mexico | |
The Company signed a letter of intent (LOI) dated June 12, 2008, as amended October 9, 2008 and May 29, 2009, with Ethos Capital Corp., a company listed on the TSX Venture Exchange (TSXV), pursuant to which Ethos has been granted an option to earn an interest in the Companys Corrales and Santa Teresa silver-lead-zinc projects in Mexico (notes 7(a)(ii) and (iii). | ||
Pursuant to the LOI, Ethos has an exclusive option to earn an undivided 70% interest in the Corrales and Santa Teresa properties by: |
(a) |
paying to the Company the sum of $500,000 (subsequently amended to $300,000), as follows : |
(i) |
$100,000 by July 17, 2009 (the Acceptance Date), which is five days after the LOI is accepted for filing by the TSXV (received August 18, 2009); | |
(ii) |
an additional $150,000 (subsequently amended to $75,000) by the day, which is one year after the Acceptance Date (received on December 10, 2010); | |
(iii) |
an additional $250,000 (subsequently amended to $125,000) by the day, which is two years after the Acceptance Date (not paid, currently under negotiation); |
(b) |
delivering to the Company 1,434,000 (subsequently amended to 1,100,300) Ethos common shares, as follows: |
(i) |
100,000 shares with a fair value of $17,000 on the Acceptance Date (received); | |
(ii) |
266,800 (subsequently amended to 150,000 with a fair value of $147,000) shares by the day, which is one year after the Acceptance Date (received on December 10, 2010); | |
(iii) |
an additional 466,900 (subsequently amended to 250,000) shares by the day, which is two years after the Acceptance Date (not issued, currently under negotiation); and | |
(iv) |
an additional 600,300 shares by the day, which is three years after the Acceptance Date; and |
(c) |
maintaining the properties (including making all required payments pursuant to the underlying option agreements) in good standing during the option period. |
Following the exercise of the option by Ethos, the Mexican subsidiaries of Ethos and the Company will enter into a joint venture, with each party being responsible for its ongoing share of further expenditures. If the interest of a participant is diluted to 10% or less, the interest of that participant will be converted to a 10% net profits interest royalty.
During the year ended October 31, 2009, the Company received $255,143 from Ethos, comprised of $138,143 of expenditure reimbursement and $117,000 of option payments.
During the year ended October 31, 2011, the Company received $222,000 in option payments from Ethos.
18
CARDERO RESOURCE CORP. |
(AN EXPLORATION STAGE COMPANY) |
Notes to Consolidated Financial Statements |
Years ended October 31, 2011, 2010 and 2009 |
7. |
RESOURCE PROPERTIES (Continued) |
(b) |
Argentina |
i. |
Chingolo Silver Project, Jujuy Province, Argentina, consisting of the following concessions: |
- Cavok Property, Jujuy Province, Argentina
Pursuant to an agreement dated May 22, 2002 between the Company and a private Argentinean company, the Company has the right to acquire a 100% interest in three mineral concessions in Jujuy Province, Argentina, by making a payment of USD 10,000 on or before October 18, 2002 (paid) and issuing an aggregate of 250,000 common shares, as follows:
- | 50,000 common shares on or before October 18, 2002 (issued); | |
- | 100,000 common shares on or before October 18, 2003 (issued); and | |
- | 100,000 common shares on or before October 18, 2006 (issued). |
Two of these concessions form part of the Olaroz Silver Project and, during the fiscal year ended October 31, 2004, these two concessions were written down by $4,381,701 to a nominal value of $1. The third concession forms part of the Chingolo Silver Project. During the year ended October 31, 2009, the Company relinquished or abandoned, or commenced the process of relinquishing or abandoning, all properties relating to its investment in the Chingolo Project, resulting in a charge to operations of $679,055.
ii. |
Huachi Property, Argentina | |
Pursuant to an agreement dated June 13, 2005 between the Company and a private Argentinean company, the Company can acquire a 100% interest in 30 mining concessions referred to as the Huachi Property in the Province of San Juan, Argentina. In order to maintain the option in good standing and to be permitted to carry out exploration activities prior to such exercise, the Company is required to make payments and incur exploration expenditures as follows: | ||
Payments of USD 5,500,000, as follows: |
- | USD 70,000 on June 13, 2005 (paid); | |
- | USD 70,000 on or before April 13, 2006 (paid); | |
- | USD 200,000 on or before June 13, 2007 (paid); | |
- | USD 600,000 on or before April 13, 2008 (renegotiated to USD 110,000, which was paid); | |
- | USD 1,000,000 on or before June 13, 2009 (see below); and | |
- | USD 3,560,000 on or before June 13, 2010. |
Exploration expenditures of USD 2,000,000, as follows:
- | USD 750,000 on or before December 13, 2007 (incurred); and | |
- | USD 1,250,000 on or before June 13, 2010 (see below). |
Pursuant to an agreement dated November 30, 2006 between the Company and an Argentinean individual, the Company can acquire a 50% interest in one mining concession (mina) adjacent to the 30 Huachi concessions noted above. In order to maintain the option in good standing, to be permitted to carry out exploration activities prior to such exercise, and to exercise the option, the Company is required to make aggregate payments of USD 965,000 to the vendor, as follows:
19
CARDERO RESOURCE CORP. |
(AN EXPLORATION STAGE COMPANY) |
Notes to Consolidated Financial Statements |
Years ended October 31, 2011, 2010 and 2009 |
7. |
RESOURCE PROPERTIES (Continued) |
(b) |
Argentina (Continued) |
ii. |
Huachi Property, Argentina (Continued) |
- | USD 5,000 on signing (paid); | |
- | USD 10,000 on November 30, 2007 ( paid); | |
- | USD 50,000 on November 30, 2008 (see below); | |
- | USD 150,000 on November 30, 2009; | |
- | USD 250,000 on November 30, 2010; and | |
- | USD 500,000 on November 30, 2011. |
The Company has relinquished or abandoned, or is in the process of relinquishing or abandoning, all properties relating to its investment in the Huachi Project, resulting in a charge to operations of $1,917,437 during the year ended October 31, 2009. | ||
iii. |
Other Argentinean Properties |
(a) |
Organullo Property, Salta Province, Argentina | |
Pursuant to an agreement dated October 1, 2004 between the Company and an Argentinean individual, the Company purchased a 100% interest in eight minas in Salta Province, Argentina, in consideration of the issuance of 70,000 common shares. These common shares were issued during the year ended October 31, 2005. | ||
Pursuant to an agreement dated September 1, 2011 between the Company and Artha Resources Corporation (Artha) as accepted by Artha on September 9, 2011, the Company optioned its Organullo Gold project to Artha, whereby Artha can earn an undivided 55% working interest in the Organullo Project, and thereafter form a Joint Venture with Cardero Argentina. | ||
Artha has the option to earn an undivided 55% right, title and working interest in and to the Organullo property by incurring an aggregate of USD 1,500,000 in exploration expenditures over four years (USD 250,000 by September 9, 2012) and by issuing an aggregate of 350,000 common shares in the capital of Artha, also over three years (50,000 shares within 15 days of Exchange acceptance - received). Upon Artha having earned its initial 55% interest, Cardero has a right to maintain its 45% interest through pro-rata funding of exploration work going forward. Alternatively, Cardero may choose to be diluted down to a minimum of 10%, at which point its interest will be converted to a 2% NSR royalty. | ||
(b) |
Los Manantiales Property (formerly Mina Angela), Chubut Province, Argentina | |
Pursuant to an agreement dated April 25, 2004 between the Company and a private Argentinean company, the Company can acquire a 100% interest in 44 mineral concessions in Chubut Province, Argentina, subject to a 1% NSR to the vendor, in consideration of aggregate cash payments to the vendor of USD 400,000, as follows: |
- |
USD 50,000 on or before April 25, 2005 (paid); | |
- |
USD 50,000 on or before April 25, 2006 (renegotiated, with $10,000 paid on April 25, 2006 and the balance of USD 40,000 paid in October 2006); | |
- |
USD 150,000 on or before April 25, 2007 (paid); and | |
- |
USD 150,000 on or before April 25, 2008 (paid). |
20
CARDERO RESOURCE CORP. |
(AN EXPLORATION STAGE COMPANY) |
Notes to Consolidated Financial Statements |
Years ended October 31, 2011, 2010 and 2009 |
7. |
RESOURCE PROPERTIES (Continued) |
(b) |
Argentina (Continued) |
iii. |
Other Argentinean Properties (Continued) |
(b) |
Los Manantiales Property (formerly Mina Angela), Chubut Province, Argentina (Continued) | |
The Company has the option to purchase the 1% NSR royalty from the vendor for the sum of USD 500,000 at any time. | ||
Pursuant to a binding LOI dated March 12, 2007, the Company has granted to a public company the option to acquire up to a 70% interest in the property. Pursuant to the LOI, the optionee had a period of 60 days to carry out due diligence. The Company received a payment of USD 40,000 on signing of the LOI, which was refundable to the optionee if it declined to proceed. The optionee elected to proceed. The optionee may earn an initial 60% interest in the property by incurring an aggregate of USD 3,500,000 in expenditures over four years (including making all payments required pursuant to the underlying agreement). Upon the optionee having earned an initial 60% interest, the Company may elect to either participate at its 40% interest level, or request the optionee to fund the preparation of a bankable feasibility study within four years of such request and thereby earn an additional 10% interest in the joint venture. Upon such request being made by the Company, the optionee may elect to fund the bankable feasibility study. If it does so, it will earn the additional 10% interest upon completion of the bankable feasibility study. Following the formation of the joint venture and the completion of its earn-in requirements by the optionee, each participant is responsible for funding its share of joint venture expenditures. If it does not do so, its interest will be diluted. Upon the interest of a participant being diluted to less than 10%, such interest will be converted to a 2% NSR. | ||
In June 2007, the optionee elected to make all remaining payments required under the underlying agreement, and thereby permit the Company to exercise the option and acquire the property (subject to the 1% NSR royalty). The property has been transferred to the Company. On December 3, 2008, the optionee terminated the option and returned all interest in the property to the Company. | ||
(c) |
Pirquitas Property, Jujuy Province, Argentina | |
The Pirquitas Property consists of one cateo (approximately 4,382 hectares) near the town of Minas Pirquitas. The property was acquired by the Company through staking and application therefor. | ||
The Company has entered into an agreement dated July 9, 2009 with a private Australian company (subsequently assigned by the private company to a public British Columbia company), whereby the optionee may earn a 55% interest in the Pirquitas Property by incurring exploration expenditures of USD 1,000,000 over four years, of which USD 50,000 must be incurred in the first year (incurred) and an additional USD 100,000 in the second year (incurred). The effective date of the agreement is July 14, 2009. Following the optionee having earned its interest, the parties will enter into a joint venture, and thereafter each party is required to contribute its proportional share of further expenditures or be diluted on a straight-line basis. |
21
CARDERO RESOURCE CORP. |
(AN EXPLORATION STAGE COMPANY) |
Notes to Consolidated Financial Statements |
Years ended October 31, 2011, 2010 and 2009 |
7. |
RESOURCE PROPERTIES (Continued) |
(c) |
Peru |
i. |
Marcona Project, Lucanas, Nazca and Caraveli Provinces, Peru (Carbonera and Daniella Properties) | |
Pursuant to option agreements dated October 1, 2003 and October 23, 2003 between the Company and a private Peruvian company, the Company acquired mineral concessions covering approximately 30,000 hectares in Lucanas, Nazca and Caraveli Provinces, Peru. Approximately 10,500 hectares of these concessions are subject to an underlying agreement with Rio Tinto Mining and Exploration | ||
Limited (Rio Tinto). The private company holds the exclusive right and option to acquire a 100% interest from Rio Tinto, subject to a 0.5% NSR to Rio Tinto, by incurring USD 450,000 in exploration expenditures over three years ending August 22, 2006 and by paying Rio Tinto USD 500,000 (of which USD 50,000 has been paid) on or before January 27, 2008. The Company can earn a 100% interest in all 30,000 hectares by assuming and performing all commitments to Rio Tinto pursuant to the underlying agreement, paying the vendor an aggregate of USD 120,000 (paid) and issuing an aggregate of 650,000 common shares to the vendor, as follows: |
- | 150,000 common shares on TSXV acceptance (issued); | |
- | 100,000 common shares on or before May 28, 2004 (issued); | |
- | 200,000 common shares on or before November 28, 2004 (issued); and | |
- | 200,000 common shares on or before November 28, 2005 (issued). |
The Company determined not to exercise the option from Rio Tinto, and terminated the underlying agreement with Rio Tinto. In addition, the Company abandoned all but five of the concessions (3,200 hectares) held by Minera Koripampa del Peru S.A. (Koripampa), (which retained concessions form part of the Companys Iron Sands project (see note 7(c)(iii)). | ||
ii. |
Pampa de Pongo Property, Caraveli Province, Peru | |
Pursuant to an option agreement dated February 2, 2004 between the Company and a private Peruvian company, the Company can acquire a 100% interest in mineral concessions covering approximately 7,970 hectares in Caraveli Province, Peru. The private Peruvian company holds the exclusive right and option to acquire a 100% interest in these concessions from Rio Tinto in consideration of the payment to Rio Tinto of aggregate payments of USD 500,000 over four years as follows: |
- | USD 50,000 on or before January 27, 2005 (paid); | |
- | USD 50,000 on or before January 27, 2006 (paid); | |
- | USD 100,000 on or before January 27, 2007 (paid); and | |
- | USD 300,000 on or before January 27, 2008 (paid). |
The Company can earn a 100% interest in the property by assuming all of the obligations of the private company pursuant to the underlying agreement with Rio Tinto, and making the following payments and share issuances:
Payments aggregating USD 130,900 as follows:
- | USD 65,900 on or before March 12, 2004 (for back taxes on the property) (paid); and | |
- | USD 65,000 on or before March 12, 2004 (paid). |
Issuance of an aggregate of 70,000 common shares, as follows:
- | 35,000 shares on or before March 12, 2004 (issued); and | |
- | 35,000 shares on or before September 12, 2004 (issued). |
22
CARDERO RESOURCE CORP. |
(AN EXPLORATION STAGE COMPANY) |
Notes to Consolidated Financial Statements |
Years ended October 31, 2011, 2010 and 2009 |
7. |
RESOURCE PROPERTIES (Continued) |
(c) |
Peru (Continued) |
ii. |
Pampa de Pongo Property, Caraveli Province, Peru (Continued) | |
In January 2008, the Company gave notice to Rio Tinto that it was exercising the option, and made the final USD 300,000 payment as required to do so. Rio Tinto transferred title to the concessions to a Peruvian subsidiary of the Company in November 2008, subject to their continuing right of first refusal concerning any disposition of these concessions by the Company. | ||
In the summer of 2008, the Company made applications for ten additional concessions surrounding the Rio Tinto concessions (19,900 hectares), all of which form part of the Pampa de Pongo property. | ||
On October 24, 2008, the Company entered into an agreement with Nanjinzhao Group Co., Ltd., (Nanjinzhao), a private Chinese enterprise located in Zibo City, Shandong Province, PRC, whereby the Company agreed to sell the Pampa de Pongo property to Nanjinzhao for USD 200 million (subject to Rio Tinto declining to exercise its right of first refusal in respect thereof). The agreement requires an initial deposit of USD 10 million, payable on or before March 17, 2009, with a final payment of USD 190 million due on or before September 17, 2009. During the initial three-month period, Nanjinzhao will obtain the appropriate Chinese governmental consents to the transaction. The Pampa de Pongo property will be transferred to a Peruvian subsidiary of Nanjinzhao once the USD 10 million deposit has been received. The agreement permits Cardero to decline to proceed with the transaction at any time prior to the receipt of the USD 190 million final payment, provided that, if such decision is made at any time after the initial USD 10 million deposit has been paid, Cardero is required to return the deposit and pay Nanjinzhao an additional USD 20 million as a break-up fee. Upon repayment of the deposit (and break-up fee, if required), the Pampa de Pongo property will be retransferred to the Company. The Company will pay a finders fee to an arms length private company in consideration of the finder introducing Cardero to Nanjinzhao and providing ongoing advice in the negotiations. On December 17, 2008, the Company received notification from Rio Tinto that it was declining to exercise its right of first refusal with respect to the October 24, 2008 transaction between the Company and Nanjinzhao. | ||
The Company, Cardero Iron Peru and Zibo Hongda Mining Co., Ltd. (Hongda), a subsidiary of Nanjinzhao, agreed to amend the provisions of the October 24, 2008 sale agreement among the Company, Cardero Iron Peru and Nanjinzhao (the interest of Nanjinzhao in which was assigned to Hongda on April 3, 2009) for the purchase by Hongda of the Pampa de Pongo Iron Deposit in Peru. | ||
Hongda had requested a purchase price reduction due to difficult global economic conditions that have significantly adversely impacted iron ore prices. Following negotiations, Cardero and Cardero Iron Peru agreed to revise the final sale price to USD 100 million (of which USD 2 million had already been paid). | ||
Accordingly, on May 21, 2009 Hongda paid the required USD 10 million deposit to Cardero Iron Peru, which is non-refundable unless either (i) Cardero terminates the agreement or (ii) Rio Tinto exercises its right of first offer. Due to the new lower purchase price, pursuant to its right of first offer Rio Tinto had another 45-day period (expired on July 9, 2009) to match the revised terms. The Rio Tinto right of first offer expired unexercised, and therefore the USD 10 million deposit from Hongda is non-refundable unless Cardero chooses to terminate the purchase agreement. | ||
The balance of the purchase price of USD 88 million was split into three payments and paid as follows: |
- | USD 18 million, received on December 17, 2009; | |
- | USD 40 million, received on December 17, 2009; and | |
- | USD 30 million, to be received on December 31, 2009 (received January 11, 2010). |
23
CARDERO RESOURCE CORP. |
(AN EXPLORATION STAGE COMPANY) |
Notes to Consolidated Financial Statements |
Years ended October 31, 2011, 2010 and 2009 |
7. |
RESOURCE PROPERTIES (Continued) | ||
(c) |
Peru (Continued) | ||
ii. |
Pampa de Pongo Property, Caraveli Province, Peru (Continued) | ||
As of October 31, 2009, the payments received to date of $13,898,800 (USD 12 million) were recognized in other income, net of related property costs of $4,889,658 and transaction costs of $411,487, for a gain of $8,597,655 before applicable income taxes. | |||
During the year ended October 31, 2010, payments received of $93,607,400 (USD 88 million) were recognized in other income, net of related property costs of $645,276 and transaction costs of $5,234,967, for a gain of $87,727,157 before applicable income taxes. | |||
iii. |
Iron Sands Project, Nazca and Caraveli Provinces, Peru |
The Companys Iron Sands Project consists of approximately 32,000 hectares of unconsolidated and semi-consolidated mineral bearing sands, the rights to which are encompassed by certain of the mineral claims comprising the Carbonera and Daniella properties (note 7(c)(i)), and an additional 39 mineral claims acquired by staking at a cost of USD 77,000, in the Departments of Arequipa, (Caraveli Province) and Ica (Nazca Province), Peru. As a result of work to date, some of the foregoing concessions have been dropped, and the property now consists of 16 concessions (12,100 hectares in four areas) owned 100% by the Company and five concessions (3,600 hectares in two areas) held under option as described below.
The Company has assumed, from a private Peruvian company, all rights and obligations under an agreement dated December 16, 2005 between a private Peruvian company and Minera Ataspacas S.A. (Minera Ataspacas), an arms length private Peruvian company, whereby the private Peruvian company has the option to acquire, from Minera Ataspacas, an initial 70% interest in five mineral sand concessions (3,600 hectares total) surrounded by certain of the Companys mineral tenures noted above. In order to exercise the option, the Company is required to pay a total of USD 6,830,000 over five years to December 15, 2010 (with an initial payment of USD 20,000 on or before December 16, 2005 (paid)) and incur exploration expenditures of not less than USD 250,000 over the same period, as follows and as amended (see below):
- | USD 80,000 on or before December 16, 2006 (paid); | |
- | USD 100,000 on or before December 16, 2007 (paid); | |
- | USD 150,000 on or before December 16, 2008 (paid); | |
- | USD 500,000 on or before December
16, 2009 (paid); and USD 6,000,000 on or before December 16, 2011 (amended to February 8, 2012) (not paid); | |
- | USD 50,000 on or before December 16, 2007 (incurred); | |
- | USD 50,000 on or before December 16, 2008 (incurred); | |
- | USD 50,000 on or before December 16, 2009 (incurred); | |
- | USD 50,000 on or before December 16, 2010 (incurred); and | |
- | USD 50,000 on or before December 16, 2011 (incurred). |
Upon the Company having acquired the 70% interest, a joint venture company will be formed with Minera Ataspacas, and each party will thereafter be required to contribute its share of ongoing expenditures or be diluted. If either party is diluted to less than 10%, such interest will be converted to a 2% NSR royalty. If Minera Ataspacas is reduced to the 2% NSR, the Company may purchase half the NSR (1%) for USD 2,000,000 within 24 months of the exercise of the option, and the remaining half (1%) for USD 8,000,000 within 36 months of the exercise of the option.
24
CARDERO RESOURCE CORP. |
(AN EXPLORATION STAGE COMPANY) |
Notes to Consolidated Financial Statements |
Years ended October 31, 2011, 2010 and 2009 |
7. |
RESOURCE PROPERTIES (Continued) | ||
(c) |
Peru (Continued) | ||
iii. |
Iron Sands Project, Nazca and Caraveli Provinces, Peru (continued) | ||
The Company entered into an agreement dated October 20, 2005 with the Peruvian subsidiary of a public B.C. company (the Optionee), whereby the Company has granted the Optionee the right to earn a 70% interest in the hard rock mineral rights (thereby excluding the unconsolidated and semi-consolidated mineral sands on such claims) accruing to certain of the mineral claims comprising the Iron Sands Project (plus additional claims acquired from Koripampa (note 7(c)(i)). | |||
In order to exercise the option, the Optionee is required to incur an aggregate of USD 3,000,000 in expenditures over four years to November 18, 2009 and perform all of the obligations of the Company under the underlying agreements with respect to the Carbonera and Daniella properties (note 7(c)(i)), including making all payments and incurring all exploration expenditures required thereunder. Upon the Optionee having earned its 70% interest, the Optionee and the Company will incorporate a new Peruvian company to hold such rights, in which the Optionee and the Company will hold a 70% and a 30% interest therein, respectively. Each party will thereafter be required to contribute its pro rata share of future expenditures, and a party failing to contribute will have its interest in the joint venture company diluted. At such point as a partys interest in the joint venture company is reduced to 10%, such interest will be acquired by the joint venture company in exchange for the grant to the diluted party of a 1% NSR. The Optionee terminated the agreement and returned its interest in the applicable concessions on April 16, 2007. | |||
In November 2009, the Company entered into agreements with Minera Ataspacas and others regarding its option on certain of the concessions comprised in its Iron Sands Project, Peru. Pursuant to two agreements dated November 13, 2009, the original option agreement of December 16, 2005 with Minera Ataspacas was amended to provide that the Company may now acquire a 100% interest in the shares of a new Peruvian company (into which Minera Ataspacas will transfer a 100% interest in the five concessions subject to the option in favour of the Company) by paying to the shareholders of such new company the sum of USD 500,000 upon execution (paid) and USD 6,150,000 on or before December 16, 2010. The option exercise date was further amended by an agreement dated January 13, 2011, such that the option is now exercisable on or before February 9, 2012 for an option payment of USD 6,000,000. In consideration of the extension, the Company paid USD 800,000, of which USD 150,000 was applied to reduce the final option payment and USD 650,000 was for the extension of the option exercise deadline. | |||
During the year ended October 31, 2011, the Company wrote-off its remaining investment in the property in the amount of $11,928,968. | |||
iv. |
Amable Maria Property, Peru | ||
The Amable Maria Property consists of 37 mining concessions (approximately 29,620 hectares) located in the Provinces of Chanchamayo and Jauja, Department of Junin, Peru, and acquired by the Company through staking and application therefor. After an unsuccessful search for a joint venture partner, the property was abandoned in July 2009, and the Company has written off the associated costs of $473,795 at October 31, 2009. |
25
CARDERO RESOURCE CORP. |
(AN EXPLORATION STAGE COMPANY) |
Notes to Consolidated Financial Statements |
Years ended October 31, 2011, 2010 and 2009 |
7. |
RESOURCE PROPERTIES (Continued) |
(d) |
United States of America |
i. |
TiTac Property, Minnesota | |
Pursuant to an option agreement dated July 1, 2008 (as amended on July 24, 2008) between the | ||
Company and an arms length private mineral owner, the Company has a two-year option to enter into a mining lease for an aggregate of 1,402 acres (567 hectares) of mineral rights located in Louis County, Minnesota. The mining lease will grant a lease over any mineral substance of a metalliferous nature, including those intermingled or associated materials or substances, recovered from each ton of crude ore for the purpose of extracting iron (essentially, iron, titanium and vanadium). | ||
The option agreement requires an initial payment of USD 5,000 on execution (paid) plus an extension payment of USD 25,000 due on the first anniversary of the agreement in order to extend the option for an additional year (option exercised). There are no work commitments under the option, but the Company is required to comply with all laws and to maintain specified insurance in place during the option term. | ||
The initial term of the mining lease is for a period of 20 years, provided that the lease may be extended for an additional five-year period if the Company gives notice at least 180 days prior to the end of such term, and has either paid to the owner at least USD 10,000,000 in royalties over the initial term or pays to the owner the difference between the royalties actually paid and USD 10,000,000. In like manner, the lease can be extended for up to three additional five-year terms, provided that the appropriate notice is given and that the Company has paid to the owner at least USD 5,000,000 in royalties during the previous five-year term (or pays any deficiency in cash). | ||
On May 29, 2009, the Company, through Cardero Iron US, exercised its option to enter into a mining lease with respect to the TiTac property in Minnesota, and made the initial USD 2,500 payment required upon execution of the lease (which is dated July 1, 2009). | ||
ii. |
Longnose Property, Minnesota | |
Pursuant to an agreement dated November 26, 2008 between the Company and an arms length individual on behalf of an arms length B.C. company, the Company was granted the option to acquire up to an 85% interest in the interest of the optionor in certain existing mineral leases, and in a lease to be entered into, covering 100% of the fee mineral rights (approximately 200 acres) located in St. Louis County, Minnesota, just north of the town of Hoyt Lakes. The Company can earn an initial 70% in the interest of the optionor interest by incurring cumulative expenditures of USD 1,850,000 as follows: |
- | USD 100,000 on or before December 8, 2009 (incurred); | |
- | USD 250,000 on or before December 8, 2010 (incurred); | |
- | USD 500,000 on or before December 8, 2011 (incurred); and | |
- | USD 1,000,000 on or before December 8, 2012. |
A payment of USD 50,000 (paid) to the optionor is required on or before August 15, 2009 (and each and every August 28 thereafter) to be used by the optionor to make the annual USD 50,000 advance royalty payment due to the underlying landowners. The Company can earn an additional 15% interest of the optionor (85% overall) by delivering a feasibility study (no time limit for delivery). Upon the Company having earned a 70% or 85% interest, the optionor can elect to convert its interest to a 10% net profits interest (if the Company elects not to earn the additional 15% interest) or a 5% net profits interest (if the Company elects to earn the full 85% interest). If the optionor does not so elect, upon the Company having earned its 70% or 85% interest, as applicable, the Company and the optionor will enter into a joint venture, with each party being responsible for its pro rata share of all joint venture expenditures. If a party to the joint venture is diluted to a 10% or lesser interest, such interest will be converted to a 2.5% net profits interest.
26
CARDERO RESOURCE CORP. |
(AN EXPLORATION STAGE COMPANY) |
Notes to Consolidated Financial Statements |
Years ended October 31, 2011, 2010 and 2009 |
7. |
RESOURCE PROPERTIES (Continued) |
(d) |
United States of America (Continued) |
ii. |
Longnose Property, Minnesota (Continued) |
During the year ended October 31, 2010, the Company issued 75,000 common shares valued at $111,500 as a finders fee in connection with the acquisition of its interests in the TiTac and Longnose properties in Minnesota. | ||
(e) |
Ghana | |
Pursuant to an agreement dated November 22, 2010 between Cardero Ghana and a private Ghanaian company, the parties entered into an arrangement under which Cardero Ghana will provide the financial resources and exploration expertise for the purpose of enabling the private Ghanaian company to apply to the Minerals Commission of Ghana for a prospecting license in respect of the certain lands in north-eastern Ghana referred to as the Sheini Iron Ore deposit. If the private Ghanaian company is successful in being awarded the prospecting license then, subject to the consent of the Government of Ghana, Cardero Ghana and the private Ghanaian company will enter into a joint venture to explore and, if warranted, develop and mine such deposit. | ||
All costs incurred prior to receiving prospecting license have been reflected in Property Evaluations in the Consolidated Statements of Operations. | ||
Upon the formation of such joint venture, the participants will be deemed to have the following respective interests: |
Cardero Ghana 100% participating
interest
Private Ghanaian Company 10% net profit interest
Upon the issuance of a mining lease subsequent to the expiry of the term of the prospecting license for the deposit, the Republic of Ghana will hold a ten percent free carried equity interest in the property subject to the mining lease.
Subsequent to October 31, 2011, three separate prospecting licenses covering the Sheini Iron Ore deposit were granted (dated December 8, 2011) and Cardero Ghana and the Private Ghanaian Company have entered into three separate joint ventures (one for each prospecting license), each dated December 12, 2011, to explore and, if warranted, develop the lands subject to the prospecting licenses.
Under the three joint ventures, Cardero Ghana will fund all expenditures under the particular joint venture and make the following payments to the Private Ghanaian Company:
For the Sheini Hills North prospecting license:
- |
USD 25,000 upon the agreement to enter into the joint venture (paid); | |
- |
USD 250,000 as an initial joint venture payment (paid); | |
- |
USD 1,000,000 upon the formation of the joint venture
(Effective Date) (paid USD 700,000 and | |
- |
USD 1,000,000 six months after the Effective Date (paid); | |
- |
USD 500,000 one year after the Effective Date; | |
- |
USD 1,000,000 two years after the Effective Date; | |
- |
USD 1,000,000 three years after the Effective Date; | |
- |
USD 500,000 four years after the Effective Date; and | |
- |
USD 500,000 five years after the Effective Date. |
27
CARDERO RESOURCE CORP. |
(AN EXPLORATION STAGE COMPANY) |
Notes to Consolidated Financial Statements |
Years ended October 31, 2011, 2010 and 2009 |
7. |
RESOURCE PROPERTIES (Continued) |
(e) |
Ghana (Continued) | |
For the Middle Sheini prospecting license: |
- |
USD 25,000 upon the agreement to enter into the joint venture (paid); | |
- |
USD 250,000 as an initial joint venture payment (paid); | |
- |
USD 1,000,000 upon the formation of the joint venture (Effective Date) (paid subsequent to October 31, 2011); | |
- |
USD 1,000,000 six months after the Effective Date (paid USD 100,000 subsequent to October 31, 2011); | |
- |
USD 500,000 one year after the Effective Date (paid); | |
- |
USD 1,000,000 two years after the Effective Date; | |
- |
USD 1,000,000 three years after the Effective Date; | |
- |
USD 500,000 four years after the Effective Date; and | |
- |
USD 500,000 five years after the Effective Date. |
For the Sheini South prospecting license:
- |
USD 3,000,000 upon the formation of the joint venture (Effective Date) (paid subsequent to October 31, 2011); | |
- |
USD 1,000,000 one year after the Effective Date; and | |
- |
USD 1,000,000 two years after the Effective Date. |
The Company has agreed to issue, subject to regulatory acceptance, a finders fee of 2,000,000 common shares to an arms length British Columbia company in connection with the acquisition of the Sheini project. The shares are to be issued in stages, as to 500,000 upon execution of one or more joint venture agreements on the Sheini properties, and an additional 500,000 shares after 6, 12 and 18 months, provided that at least one of the joint venture agreements is still in effect and that further work is planned. Regulator acceptance has not yet been received. | ||
(f) |
Canada Carbon Creek Property, British Columbia | |
To acquire its interest in the Carbon Creek Metallurgical Coal Property, Cardero Coal entered into the following agreements: |
i. |
Johnson Agreement | ||
On May 18, 2010, Cardero Coal entered into a Coal Tenure Option Agreement (Johnson Agreement) to acquire, upon issuance, one coal license (Johnson License) over an area located in the Peace River Land District of British Columbia. Consideration for a 100% interest in the license consists of the following payments and share issuances: | |||
- |
payments to date of $350,000 and an additional payment of $5,000,000 due within four months of the date the coal license is issued by the Government of British Columbia and transferred to Cardero Coal. Cardero Coal can extend the payment date by paying a $20,000 monthly fee for up to three additional months; | ||
- |
issuance of 400,000 common shares of the Company. Such issuance is to be made concurrently with the $5,000,000 final payment; and | ||
- |
issuance of an option to acquire 1,000,000 common shares of Cardero Coal at an exercise price of $0.1875 per share (issued). The option was exercised on March 9, 2011. | ||
ii. |
Burns Agreement | ||
On June 15, 2010, Cardero Coal entered into an option agreement (Burns Agreement) to acquire a lease of the coal situated on 10 Crown granted district lots (CGDL) located in the Peace River Land District of British Columbia. To maintain its option, Cardero Coal has paid $3,500,000 to date and is |
28
CARDERO RESOURCE CORP. |
(AN EXPLORATION STAGE COMPANY) |
Notes to Consolidated Financial Statements |
Years ended October 31, 2011, 2010 and 2009 |
7. |
RESOURCE PROPERTIES (Continued) |
(f) |
Canada Carbon Creek Property, British Columbia (Continued) |
ii |
Burns Agreement (continued) | |
required to make a further $2,500,000 payment on or before December 30, 2011 (paid) (note 17). Upon making the final payment, Cardero Coal may exercise the option upon payment of $1. | ||
Under the lease agreement (Burns Lease), Cardero Coal will pay a 5% freight on rail royalty on all coal sold or $2 per metric tonne of coal sold, whichever is greater, and 20% on sales for any coal substances sold or consumed on the CGDL. |
iii. |
Joint Venture Agreement | |
On June 15, 2010, Cardero Coal entered into a joint venture agreement (the Joint Venture Agreement) with a private Alberta partnership, to participate in common operation and exploration, development and production of the Carbon Creek Property. Under the Joint Venture Agreement, the Carbon Creek Property subject to the joint venture will consist of Cardero Coals interest in the Johnson License (once issued and transferred to Cardero Coal), Cardero Coals interest in the Burns Lease (once the option has been exercised), 10 coal licenses held by the joint venture partner (once issued), one coal license held by Cardero Coal (once issued) and any additional coal licenses acquired by a joint venturer within 25 kilometres of the balance of the Carbon Creek Property. Pursuant to the Joint Venture Agreement, the Company will have a 75% interest in the joint venture and is responsible for incurring all costs of carrying out the required exploration, development and mining of the Carbon Creek Property and the marketing of the product produced. The joint venture partner will have a 25% carried interest in the joint venture and will not be required to contribute to any such costs. The joint venture partner is entitled to receive 25% of the net proceeds of production following Cardero Coal having recovered, from the proceeds of any production, all monies paid under the Johnson Agreement and all costs incurred by Cardero Coal to develop the mine site and put it into production. | ||
To acquire its interest in the joint venture, the Company was required to issue 1,600,000 common shares (issued) plus warrants to purchase an additional 1,600,000 common shares (issued) and make total payments of $6,000,000, of which it has paid a total of $3,500,000 to date and is required to make a final payment of $2,500,000 on or before December 30, 2011 (paid) (note 17). | ||
On June 1, 2011, the Company acquired the balance of the outstanding securities of Cardero Coal (note 3). |
(g) |
Title and environmental | |
Although the Company has taken steps to verify the title to mineral properties in which it has or had a right to acquire an interest in accordance with industry standards for the current stage of exploration of such properties, these procedures do not guarantee title (whether of the Company or of any underlying vendor(s) from whom the Company may be acquiring its interest). Title to mineral properties may be subject to unregistered prior agreements or transfers, and may also be affected by undetected defects or the rights of indigenous peoples. Environmental legislations are becoming increasingly stringent and costs and expenses of regulatory compliance are increasing. The impact of new and future environmental legislations on the Companys operations may cause additional expenses and restrictions. If the restrictions adversely affect the scope of exploration and development on the mineral properties, the potential for production on the property may be diminished or negated. | ||
(h) |
Asset retirement obligations | |
The Company is not aware of any AROs as of October 31, 2011 and 2010. |
29
CARDERO RESOURCE CORP. |
(AN EXPLORATION STAGE COMPANY) |
Notes to Consolidated Financial Statements |
Years ended October 31, 2011, 2010 and 2009 |
8. |
CAPITAL STOCK | |
(a) |
Authorized | |
An unlimited number of common shares without par value. | ||
During the year ended October 31, 2010, the Company launched a normal course issuer bid to purchase up to 4,500,000 of its common shares through the facilities of the TSX. During the year ended October 31, 2010, the Company purchased 312,300 common shares. On October 14, 2011, these common shares were returned to treasury. | ||
(b) |
Share purchase warrants | |
The following common share purchase warrants entitle the holders thereof to purchase one common share for each warrant. Warrants transactions are as follows: |
2011 | 2010 | |||||||||||||
Weighted | Weighted | |||||||||||||
Average | Average | |||||||||||||
Number of | Exercise | Number of | Exercise | |||||||||||
Warrants | Price | Warrants | Price | |||||||||||
Warrants outstanding, beginning of the year | - | $ | - | 4,303,100 | $ | 1.47 | ||||||||
Issued pursuant to Acquisition (note 3) | 3,856,400 | $ | 0.39 | - | $ | - | ||||||||
Exercised | (443,800 | ) | $ | (0.39 | ) | (67,125 | ) | $ | (1.35 | ) | ||||
Expired | - | $ | - | (4,235,975 | ) | $ | 1.48 | |||||||
Warrants outstanding, end of the year | 3,412,600 | $ | 0.39 | - | $ | - |
Warrants outstanding are as follows:
2011 | 2010 | |||||||||||||
Exercise | Number of | Exercise | Number of | |||||||||||
Expiry Date | Price | Warrants | Price | Warrants | ||||||||||
December 17, 2011 (note 17) | $ | 0.63 | 428,400 | $ | - | - | ||||||||
March 1, 2012 | $ | 0.06 | 240,000 | $ | - | - | ||||||||
March 29, 2012 | $ | 0.16 | 5,600 | $ | - | - | ||||||||
April 6, 2012 | $ | 0.16 | 12,600 | $ | - | - | ||||||||
May 20, 2012 | $ | 0.06 | 120,000 | $ | - | - | ||||||||
June 14, 2012 | $ | 0.38 | 336,000 | $ | - | - | ||||||||
June 15, 2012 | $ | 0.06 | 120,000 | $ | - | - | ||||||||
September 22, 2012 | $ | 0.44 | 70,000 | $ | - | - | ||||||||
January 12, 2013 | $ | 0.13 | 240,000 | $ | - | - | ||||||||
May 29, 2013 | $ | 0.13 | 240,000 | $ | - | - | ||||||||
June 1, 2013 | $ | 0.50 | 1,600,000 | $ | - | - | ||||||||
3,412,600 | - |
30
CARDERO RESOURCE CORP. |
(AN EXPLORATION STAGE COMPANY) |
Notes to Consolidated Financial Statements |
Years ended October 31, 2011, 2010 and 2009 |
8. |
CAPITAL STOCK (Continued) | |
(c) |
Stock options | |
The Company has a stock option plan whereby the Company may grant options to directors, officers, employees and consultants to purchase common shares, provided that the aggregate number of shares subject to such options may not exceed 10% of the common shares outstanding at the time of any grant (not including agent or broker options). The exercise price of each option is required to be set at the higher of the closing price of the Companys common shares on the trading day prior to the date of grant and the five-day volume-weighted average trading price for the five trading days prior to the date of grant (without any discounts). The option term and vesting period is determined by the Board of Directors within regulatory guidelines (the maximum term is ten years). All options are recorded at fair value when granted and are vested at the date for grant. A summary of the status of the stock option plan as of October 31, 2011 and 2010 and changes during the years ended on those dates is presented below: |
2011 | 2010 | |||||||||||||
Weighted | Weighted | |||||||||||||
Average | Average | |||||||||||||
Number of | Exercise | Number of | Exercise | |||||||||||
Options | Price | Options | Price | |||||||||||
Options outstanding, beginning of the year | 5,310,000 | $ | 1.23 | 5,500,000 | $ | 1.77 | ||||||||
Granted pursuant to Acquisition (note 3) | 2,029,143 | $ | 0.32 | - | $ | - | ||||||||
Granted | 1,100,000 | $ | 1.83 | 3,510,000 | $ | 1.21 | ||||||||
Expired | (1,000,000 | ) | $ | 1.30 | (3,700,000 | ) | $ | (2.01 | ) | |||||
Exercised | (840,000 | ) | $ | 1.22 | - | $ | - | |||||||
Options outstanding, end of the year | 6,599,143 | $ | 1.04 | 5,310,000 | $ | 1.23 |
The weighted average remaining contractual life of options outstanding at October 31, 2011 was 1.02 years (2010 1.3 years).
Stock options outstanding are as follows:
2011 | 2010 | |||||||||||||||||||
Exercisable | Exercisable | |||||||||||||||||||
Exercise | Number of | at Year | Exercise | Number of | at Year- | |||||||||||||||
Expiry Date | Price | Options | End | Price | Options | End | ||||||||||||||
December 9, 2010 | $ | 1.16 | - | - | $ | 1.16 | 575,000 | 575,000 | ||||||||||||
April 9, 2011 | $ | 1.39 | - | - | $ | 1.39 | 225,000 | 225,000 | ||||||||||||
September 11, 2011 | $ | 1.30 | - | - | $ | 1.30 | 1,000,000 | 1,000,000 | ||||||||||||
December 1, 2011 (note17) |
$ | 1.31 | 360,000 | 360,000 | $ | 1.31 | 360,000 | 360,000 | ||||||||||||
February 2, 2012 | $ | 1.41 | 500,000 | 500,000 | $ | 1.41 | 500,000 | 500,000 | ||||||||||||
July 29, 2012 | $ | 1.16 | 1,485,000 | 1,485,000 | $ | 1.16 | 1,525,000 | 1,525,000 | ||||||||||||
August 11, 2012 | $ | 1.16 | 1,125,000 | 1,125,000 | $ | 1.16 | 1,125,000 | 1,125,000 | ||||||||||||
September 8, 2012 | $ | 1.28 | 100,000 | 100,000 | $ | - | - | - | ||||||||||||
January 28, 2013 | $ | 1.83 | 1,000,000 | 1,000,000 | $ | - | - | - | ||||||||||||
June 1, 2013 | $ | 0.06 | 280,000 | - | $ | - | - | - | ||||||||||||
June 1, 2013 | $ | 0.16 | 100,000 | - | $ | - | - | - | ||||||||||||
June 1, 2013 | $ | 0.31 | 320,000 | - | $ | - | - | - | ||||||||||||
June 1, 2013 | $ | 0.38 | 980,000 | - | $ | - | - | - | ||||||||||||
June 1, 2013 | $ | 0.44 | 349,143 | - | $ | - | - | - | ||||||||||||
6,599,143 | 4,570,000 | 5,310,000 | 5,310,000 |
31
CARDERO RESOURCE CORP. |
(AN EXPLORATION STAGE COMPANY) |
Notes to Consolidated Financial Statements |
Years ended October 31, 2011, 2010 and 2009 |
8. |
CAPITAL STOCK (Continued) | |
(c) |
Stock options (Continued) | |
At October 31, 2011, the aggregate intrinsic value of outstanding and exercisable stock options is $1,538,100 (2010 - $258,000). | ||
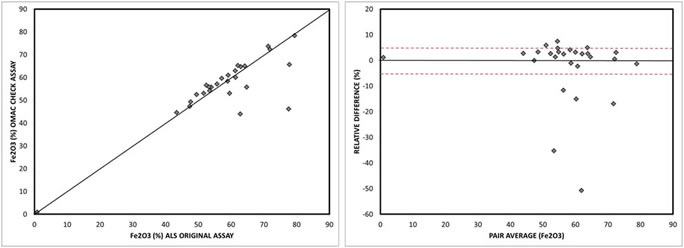
The Company uses the fair value method for determining stock-based compensation for all options granted during the fiscal years. The fair value was determined using the Black-Scholes option pricing model based on the following assumptions: |
2011 | 2010 | 2009 | ||
Expected life (years) | 2.0 | 2.0 | 2.0 | |
Interest rate | 1.35% | 1.43% | 1.32% | |
Volatility (average) | 61.21% | 72.33% | 102.04% | |
Dividend yield | 0.00% | 0.00% | 0.00% |
Stock-based compensation charges for the year ended October 31, 2011 totalled $1,301,935 (2010 - $1,695,941; 2009 - $1,192,109), allocated as follows:
2011 | 2010 | 2009 | ||||||||
Consulting fees | $ | 15,135 | $ | 217,132 | $ | 492,953 | ||||
Investor relations | 294,066 | 371,965 | 50,395 | |||||||
Salaries and benefits | 992,734 | 1,106,844 | 648,761 | |||||||
$ | 1,301,935 | $ | 1,695,941 | $ | 1,192,109 |
The weighted average fair value of options granted during the year was $0.60 (2010 - $0.48) .
9. |
RELATED PARTY TRANSACTIONS | |
(a) |
Due to related parties | |
During the years ended October 31, 2011, 2010 and 2009, the Company incurred the following expenses to officers or directors of the Company or companies with common directors: |
2011 | 2010 | 2009 | ||||||||
Consulting fees | $ | 115,000 | $ | 224,159 | $ | 90,000 | ||||
Professional fees | $ | 82,500 | $ | 87,056 | $ | 136,425 |
At October 31, 2011, there was $Nil (2010 - $7,700) included in accounts payable and accrued liabilities. Professional fees include amounts paid to a law firm of which a director is a shareholder.
32
CARDERO RESOURCE CORP. |
(AN EXPLORATION STAGE COMPANY) |
Notes to Consolidated Financial Statements |
Years ended October 31, 2011, 2010 and 2009 |
9. |
RELATED PARTY TRANSACTIONS (Continued) | |
(b) |
Due from related parties | |
Amounts due from related parties are comprised as follows: |
2011 | 2010 | ||||||
Unsecured promissory notes, 1% per annum,
due the earlier of 30 days after demand or the due date, if applicable: |
|||||||
Trevali | $ | 142,945 | $ | 78,227 | |||
Wealth | 495,312 | 305,871 | |||||
Dorato | 261,882 | 143,193 | |||||
Indico | 49,891 | 468,819 | |||||
Abzu | 171,268 | 208,345 | |||||
IMM | 18,805 | 18,820 | |||||
ITH | 22,899 | 11,185 | |||||
Others | 76,041 | 127,090 | |||||
$ | 1,239,043 | $ | 1,361,550 |
The Company recovered $1,331,389 during the year ended October 31, 2011 (2010 - $894,131, 2009 - $764,875) in rent and administration costs from Wealth, ITH, Dorato, Indico, Trevali, Balmoral, Abzu, Corvus and Lawrence W. Talbot Law Corporation (LWTLC), companies with common officers or directors. | ||
These charges were measured by the exchange amount, which is the amount agreed upon by the transacting parties. | ||
(c) |
Loan receivable | |
The Company entered into a loan agreement with Kria whereby the Company advanced Kria $8,064,000 (the Loan) to fund the USD 8,000,000 property payment due by Kria to Xstrata Canada Corporation (Xstrata) on or before January 16, 2011 under the terms of the revised Halfmile and Stratmat property purchase agreement dated July 15, 2009, between Kria and Xstrata. The Loan bears interest at 10% per annum, calculated monthly, not in advance. As security for the Loan, Kria has granted in favour of the Company a first charge, mortgage and security interest over all its assets and undertakings. In connection with the Loan, Kria issued to the Company 6,400,000 common share purchase warrants of Kria (the Bonus Warrants). Each Bonus Warrant entitles the holder to acquire a common share of Kria at an exercise price of $0.25 until January 14, 2012. The fair value of the warrants was calculated at $1,131,136 using the Black-Scholes model, and this amount was recognized as additional interest income under the term of the loan. On April 7, 2011, Trevali acquired Kria and the 6,400,000 Kria Bonus Warrants were exchanged for 1,280,000 Trevali warrants on 5:1 exchange ratio. The interest rate of the Loan was retroactively reduced to 8% to be calculated monthly and not in advance and is due on or before January 14, 2012 (note 17). Accrued interest of $516,096 is included in the loan balance presented. | ||
(d) |
Related parties | |
Mr. Stephan Fitch, a director of the Company, is a director and significant shareholder of a private company that is the major shareholder (67%) of IMM. The Company has acquired a 15% interest in IMMG, a subsidiary of IMM (note 6(c)). This transaction was approved by the Companys audit committee and Board of Directors (other than Mr. Fitch, who abstained from voting in each case). The Company considered the collectability of advances totalling $468,099 to IMMG to be doubtful and, accordingly, wrote them off during the year ended October 31, 2009. |
33
CARDERO RESOURCE CORP. |
(AN EXPLORATION STAGE COMPANY) |
Notes to Consolidated Financial Statements |
Years ended October 31, 2011, 2010 and 2009 |
9. |
RELATED PARTY TRANSACTIONS (Continued) | |
(d) |
Related parties (Continued) | |
Effective October 1, 2005, the Company retained Mr. Carlos Ballon of Lima, Peru, to provide management services on behalf of the Company in Peru through his private Peruvian company, Koripampa, for a fee of USD 10,000 per month (reduced to USD 7,500 per month starting from March 2007), which has been expensed to consulting fees. Mr. Ballon became President of Cardero Peru in April 2006. Accordingly, Mr. Ballon is a related party with respect to the Company. Prior to Mr. Ballon becoming a related party, the Company entered into a number of mineral property acquisition/option agreements with either Koripampa or Sudamericana de Metales Peru S.A., another private Peruvian company controlled by Mr. Ballon. Such property transactions include those with respect to the Carbonera and Daniella Properties (note 7(c)(i)), the Pampa de Pongo Property (note 7(c)(ii)), the Katanga Property and the Corongo Property. | ||
The presidents of MMC and Cardero Argentina provide management services for USD 3,750 each per month, which is expensed to consulting fees or capitalized to property costs, depending upon the nature of the services. | ||
The Company has entered into a retainer agreement dated May 1, 2007 with LWTLC, pursuant to which LWTLC agrees to provide legal services to the Company. Pursuant to the retainer agreement, the Company has agreed to pay LWTLC a minimum annual retainer of $82,500 (plus applicable taxes and disbursements). The retainer agreement may be terminated by LWTLC on reasonable notice, and by the Company on one years notice (or payment of one years retainer in lieu of notice). | ||
10. |
GEOGRAPHIC SEGMENTED DATA | |
The Company operates in one industry segment, the mineral resources industry, and in six geographical segments, Canada, Peru, Mexico, Argentina, Ghana and the United States. The significant asset categories identifiable with these geographical areas are as follows: |
2011 | |||||||||||||
Canada | Argentina | Others | Total | ||||||||||
Resource properties | $ | 62,953,380 | $ | 2,651,647 | $ | 3,742,015 | $ | 69,347,042 | |||||
Cash and cash equivalents | 5,821,354 | 15,799 | 148,481 | 5,985,634 | |||||||||
Resource related investments | 32,551,104 | - | - | 32,551,104 | |||||||||
Others | 12,452,096 | 158,982 | 834,425 | 13,445,503 | |||||||||
$ | 113,777,934 | $ | 2,826,428 | $ | 4,724,921 | $ | 121,329,283 |
2010 | |||||||||||||
Canada | Argentina | Others | Total | ||||||||||
Resource properties | $ | - | $ | 2,471,635 | $ | 13,385,115 | $ | 15,856,750 | |||||
Cash and cash equivalents | 6,152,489 | 16,496 | 46,095,018 | 52,264,003 | |||||||||
Resource related investments | 60,685,650 | - | - | 60,685,650 | |||||||||
Equity investments | 5,236,540 | - | - | 5,236,540 | |||||||||
Others | 972,345 | 47,991 | 1,141,875 | 2,162,211 | |||||||||
$ | 73,047,024 | $ | 2,536,122 | $ | 60,622,008 | $ | 136,205,154 |
34
CARDERO RESOURCE CORP. |
(AN EXPLORATION STAGE COMPANY) |
Notes to Consolidated Financial Statements |
Years ended October 31, 2011, 2010 and 2009 |
11. |
INCOME TAXES |
A reconciliation of income taxes at Canadian statutory rates (2011 26.83%; 2010 30.31%; 2009 27.42%) is as follows for the years ended October 31: |
2011 | 2010 | 2009 | ||||||||
Income tax expense (benefits) | $ | (5,404,676 | ) | $ | 20,715,743 | $ | 130,966 | |||
Permanent differences | 38,991 | (255,155 | ) | (69,679 | ) | |||||
Stock-based compensation | 349,353 | 487,583 | 359,620 | |||||||
Non-taxable portion of capital gains | (1,185,149 | ) | (135,075 | ) | (410,004 | ) | ||||
Change in timing differences on mineral properties | - | 5,463,032 | - | |||||||
Write-off of resource property | 3,275,441 | 2,443,199 | 924,735 | |||||||
Future income taxes on sale of Pampa de Pongo | - | - | (2,564,900 | ) | ||||||
Other temporary differences | (1,574,676 | ) | 714,802 | 398,566 | ||||||
Change in timing differences | (11,466,565 | ) | 206,620 | - | ||||||
Effect of tax rates in other jurisdictions | (33,992 | ) | (62,996 | ) | (23,470 | ) | ||||
Effect of rate change | 828,255 | (316,272 | ) | 62,945 | ||||||
Change in valuation allowance | 19,764,889 | (5,879,979 | ) | 1,923,341 | ||||||
$ | 4,591,871 | $ | 23,381,502 | $ | 732,120 |
The components of future income tax assets (liabilities) are as follows:
2011 | 2010 | ||||||
Future income tax assets | |||||||
Non-capital loss carry-forwards | $ | 14,587,869 | $ | 9,584,878 | |||
Difference between undepreciated
capital cost over net book value of
property and equipment |
133,630 | 56,628 | |||||
Cumulative eligible capital deduction | 13,678 | 13,678 | |||||
Share issue costs | 162,765 | 154,416 | |||||
Tax value in excess of book value of resource properties | 5,585,137 | - | |||||
Other | 1,436,957 | 297,085 | |||||
Total future income tax assets | 21,920,036 | 10,106,685 | |||||
Valuation allowance | (21,065,584 | ) | (586,039 | ) | |||
Net future income tax assets | $ | 854,452 | $ | 9,520,646 | |||
Future income tax liabilities | |||||||
Book value in excess of tax values of investments | $ | (854,452 | ) | $ | (4,649,040 | ) | |
Book value in excess of tax values of
resource properties Cardero Coal (note 3) |
(11,713,033 | ) | (4,871,606 | ) | |||
Total future income tax liabilities | $ | (12,567,485 | ) | $ | (9,520,646 | ) | |
Net income tax assets (liabilities) | $ | (11,713,033 | ) | $ | - |
The valuation allowance reflects the Companys estimate that the tax assets, more likely than not, will not be realized.
35
CARDERO RESOURCE CORP. |
(AN EXPLORATION STAGE COMPANY) |
Notes to Consolidated Financial Statements |
Years ended October 31, 2011, 2010 and 2009 |
11. |
INCOME TAXES (Continued) |
The Company has available approximate non-capital losses that may be carried forward to apply against future years' income for income tax purposes in all jurisdictions. The losses expire as follows: |
Available to | Canada | Foreign | Total | |||||||
2012 | $ | - | $ | 1,465,295 | $ | 1,465,295 | ||||
2013 | - | 894,185 | 894,185 | |||||||
2014 | 1,446,622 | 693,716 | 2,140,338 | |||||||
2015 | 2,950,454 | 511,021 | 3,461,475 | |||||||
2016 | 2,850,458 | 4,909,884 | 7,760,342 | |||||||
2017 | - | 356,852 | 356,852 | |||||||
2018 | - | 918,397 | 918,397 | |||||||
2019 | - | 477,096 | 477,096 | |||||||
2020 | - | 1,066,883 | 1,066,883 | |||||||
2021 | - | 488,452 | 488,452 | |||||||
2027 | 3,086,818 | 69,804 | 3,156,622 | |||||||
2028 | 4,130,985 | 354,363 | 4,485,348 | |||||||
2029 | 2,258,886 | 230,673 | 2,489,559 | |||||||
2030 | 6,446,014 | 559,083 | 7,005,097 | |||||||
2031 | 14,217,604 | 659,878 | 14,877,482 | |||||||
Deferred expiry | - | 3,174,361 | 3,174,361 | |||||||
$ | 37,387,841 | $ | 16,829,943 | $ | 54,217,784 |
12. |
COMMITMENTS |
The Company was committed to monthly lease payments of $11,907 for its premises at 1901 1177 West Hastings Street, Vancouver, under its current lease, which expired August 31, 2010. On September 8, 2008, the Company sub-leased the premises to another company for the remaining term of the lease with the landlords consent. The Company entered into a sub-lease dated May 14, 2008 for new office space located at 1920 1188 West Georgia Street, Vancouver. The new sub-lease commenced August 1, 2008 for a term of 51 months. The initial lease payments are $14,654 per month for basic rent and $9,623 per month for estimated operating costs, commencing in September 2008. | |
The Company entered into a lease dated November 18, 2010 for office space located at 2300 1177 West Hastings Street, Vancouver for a term commencing April 1, 2011 for a period of ten years to March 31, 2021 (subject to renewal for an additional five years). The rent for the first three years is $312,579 per annum, plus operating costs and $335,733 per annum, plus operating costs for the next two years. | |
The Companys subsidiary Cardero Coal entered into a lease dated November 24, 2011 for office space located at 1800 - 1177 West Hastings Street, Vancouver for a term commencing May 1, 2012 for a period of eight years and eleven months. The rent for the first three years is $139,023 per annum, plus operating cost and $149,321 plus operating costs per annum for the next two years. | |
Other commitments are disclosed elsewhere in these consolidated financial statements as appropriate. | |
13. |
RISK AND CAPITAL MANAGEMENT; FINANCIAL INSTRUMENTS |
The Company manages its capital structure, and makes adjustments to it, based on the funds available to the Company in order to support future business opportunities. The Company defines its capital as shareholders equity. The Board of Directors does not establish quantitative return on capital criteria for management, but rather relies on the expertise of the Companys management to sustain future development of the business. |
36
CARDERO RESOURCE CORP. |
(AN EXPLORATION STAGE COMPANY) |
Notes to Consolidated Financial Statements |
Years ended October 31, 2011, 2010 and 2009 |
13. |
RISK AND CAPITAL MANAGEMENT; FINANCIAL INSTRUMENTS (Continued) |
The Company currently has no source of revenues; as such, the Company is dependent upon external financings or the sale of assets (or an interest therein) to fund activities. In order to carry future projects and pay for administrative costs, the Company will spend its existing working capital and raise additional funds as needed. Management reviews its capital management approach on an ongoing basis and believes that this approach, given the relative size of the Company, is reasonable. There were no changes in the Companys approach to capital management during the year ended October 31, 2011. The Company is not subject to externally imposed capital requirements. | |
The Company classified its cash and cash equivalents as held-for-trading; accounts receivable and due from related parties as loans and receivables; and accounts payable and accrued liabilities as other financial liabilities. The classification of resource related investments is set out in note 5. The carrying values of cash and cash equivalents, accounts receivable, and accounts payable and accrued liabilities approximate their fair values due to the short-term maturity of these financial instruments. The fair values of amounts due from related parties have not been disclosed, as their fair values cannot be reliably measured since the parties are not at arms length. | |
The Canadian Institute of Chartered Accountants (CICA) Handbook Section 3862 establishes a fair value hierarchy that prioritizes the inputs to valuation techniques used to measure fair value as follows: |
Level 1 quoted prices (unadjusted) in active markets for identical assets or liabilities;
Level 2 inputs other than quoted prices included in Level 1 that are observable for the asset or liability, either directly (i.e., as prices) or indirectly (i.e., derived from prices); and
Level 3 inputs for the asset or liability that are not based on observable market data (unobservable inputs).
The following table sets forth the Companys financial assets measured at fair value by level within the fair value hierarchy.
2011 | Level 1 | Level 2 | Level 3 | Total | |||||||||
Cash and cash equivalents | $ | 5,985,634 | $ | - | $ | - | $ | 5,985,634 | |||||
Resource related investments | 32,006,649 | - | - | 32,006,649 | |||||||||
Resource related investments | - | 544,455 | - | 544,455 | |||||||||
$ | 37,992,283 | $ | 544,455 | $ | - | $ | 38,536,738 |
2010 | Level 1 | Level 2 | Level 3 | Total | |||||||||
Cash and cash equivalents | $ | 52,264,003 | $ | - | $ | - | $ | 52,264,003 | |||||
Resource related investments | 57,041,708 | - | - | 57,041,708 | |||||||||
Resource related investments | - | 3,643,942 | - | 3,643,942 | |||||||||
$ | 109,305,711 | $ | 3,643,942 | $ | - | $ | 112,949,653 |
37
CARDERO RESOURCE CORP. |
(AN EXPLORATION STAGE COMPANY) |
Notes to Consolidated Financial Statements |
Years ended October 31, 2011, 2010 and 2009 |
13. |
RISK AND CAPITAL MANAGEMENT; FINANCIAL INSTRUMENTS (Continued) | |
The Companys exposure to risk on its financial instruments is summarized below: | ||
(a) |
Credit risk | |
The Company manages credit risk, in respect of cash and cash equivalents, by purchasing highly liquid, short-term investment grade securities held at major financial institutions in Canada and Peru in accordance with the Companys investment policy. In regards to amounts receivable, the Company is not exposed to significant credit risk, as they are primarily due from governmental agencies. | ||
Concentration of credit risk exists with respect to the Companys cash and cash equivalents, as all amounts in Canada and Peru are held at major financial institutions. The Companys concentration of credit risk and maximum exposure thereto is as follows relating to funds held in Canada, Peru and other countries: |
2011 | 2010 | ||||||
Bank accounts - Canada | $ | 5,436,725 | $ | 6,035,679 | |||
Bank accounts - Peru | 457 | 46,042,361 | |||||
Bank accounts - Others | 548,452 | 185,963 | |||||
$ | 5,985,634 | $ | 52,264,003 |
The credit risk associated with cash and cash equivalents is minimized substantially by ensuring that these financial assets are placed with major financial institutions with strong investment-grade ratings given by a primary ratings agency. The Company does not hold any asset-backed securities. | |||
With respect to the $1,239,043 (2010 - $1,361,550) due from related parties, the credit risk has been assessed as low by management as the Company has strong working relationships with the related parties involved. | |||
(b) |
Liquidity risk | ||
Liquidity risk is the risk that the Company will encounter difficulty in settling its commitments. The Companys approach to managing liquidity risk is to provide reasonable assurance that it will have sufficient funds to meet liabilities when due. The Company manages its liquidity risk by forecasting cash flows from operations and anticipated investing and financing activities. The Company maintains sufficient cash and cash equivalents at October 31, 2011 of $5,985,634 (2010 - $52,264,003) in order to meet short-term business requirements. At October 31, 2011, the Company had accounts payable and accrued liabilities of $4,038,261 (2010 - $832,087), which are due within 30 days. | |||
(c) |
Market risk | ||
Market risk is the risk that the fair value or future cash flows of a financial instrument will fluctuate because of changes in market prices. Market risk comprises three types of risk: interest rate risk, foreign currency risk and other price risk. | |||
i. |
Interest rate risk | ||
The Companys cash and cash equivalents consist of cash held in bank accounts and guaranteed investment certificates that earn interest at variable interest rates. Due to the short-term nature of these financial instruments, fluctuations in market rates do not have a significant impact on estimated fair values as of October 31, 2011 Future cash flows from interest income on cash and cash equivalents will be affected by interest rate fluctuations. The Company manages interest rate risk by maintaining an investment policy that focuses primarily on preservation of capital and liquidity. |
38
CARDERO RESOURCE CORP. |
(AN EXPLORATION STAGE COMPANY) |
Notes to Consolidated Financial Statements |
Years ended October 31, 2011, 2010 and 2009 |
13. |
RISK AND CAPITAL MANAGEMENT; FINANCIAL INSTRUMENTS (Continued) | ||
(c) |
Market risk (Continued) | ||
ii. |
Foreign currency risk | ||
The Company is exposed to foreign currency risk to the extent that monetary financial instruments are denominated in United States, Mexican, Argentinean and Peruvian currencies. The Company has not entered into any foreign currency contracts to mitigate this risk as it believes this risk is minimized by the amount of cash held in these foreign jurisdictions. The Companys sensitivity analysis suggests that a consistent 5% change in the rate of exchange in all foreign jurisdictions where it has assets employed would change mineral properties and foreign exchange gain or loss by $11,839 (2010 - $2,332,000). | |||
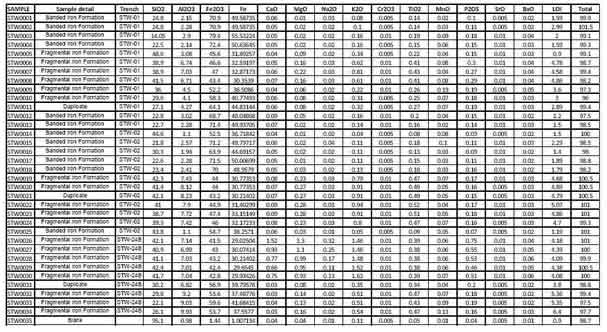
iii. |
Other price risk | ||
Other price risk is the risk that the fair value or future cash flows of a financial instrument will fluctuate due to changes in market prices, other than those arising from interest rate risk or foreign currency risk. The Companys investments are carried at market value and are, therefore, directly affected by fluctuations in the market value of the underlying securities. The Companys sensitivity analysis suggests that a 1% change in market prices would change the value of the resource related investments by $325,511, and the change on resource related investments in warrants cannot be predicted. |
14. |
COMPARATIVE FIGURES |
Certain of the figures for 2010 and 2009 have been reclassified to conform to the presentation adopted for the current year. |
39
CARDERO RESOURCE CORP. |
(AN EXPLORATION STAGE COMPANY) |
Notes to Consolidated Financial Statements |
Years ended October 31, 2011, 2010 and 2009 |
15. |
DIFFERENCES BETWEEN CANADIAN AND US GAAP | |
Differences in accounting principles | ||
(a) |
Exploration expenditures | |
Under Canadian GAAP, acquisition costs and exploration expenditures are capitalized. Under US GAAP, exploration costs incurred in locating areas of potential mineralization are expensed as incurred. | ||
Commercial feasibility is established in compliance with the Securities and Exchange Commission (SEC) | ||
Industry Guide 7, which consists of identifying that part of mineral deposit that could be economically and legally extracted or produced at the time of the reserve determination. After an area of interest has been assessed as commercially feasible, expenditures specific to the area of interest for further development are capitalized. In deciding when an area of interest is likely to be commercially feasible, management may consider, among other factors, the results of pre-feasibility studies, detailed analysis of drilling results, the supply and cost of required labour and equipment, and whether necessary mining and environmental permits can be obtained. | ||
Under US GAAP, mining projects are reviewed for impairment whenever events or changes in circumstances indicate that the carrying amounts of these assets may not be recoverable. If estimated future cash flows expected to result from the use of the mining project or property, and their eventual disposition are less than the carrying amount of the mining project or property, an impairment is recognized based upon the estimated fair value of the mining project or property. Fair value generally is based on the present value of estimated future net cash flows for each mining project, property, calculated using estimated mineable reserves, mineral resources, based on engineering reports, projected rates of production over the estimated mine, recovery rates, capital requirements, remediation costs and future prices considering the Companys hedging and marketing plans. At October 31, 2011, all resource properties considered active under US GAAP had a book value of $57,519,014 (2010 - $4,048,400) (note 7), after all applicable impairment charges. | ||
(b) |
Reconciliation of total assets, liabilities and shareholders equity as of October 31: |
2011 | 2010 | ||||||
Total assets per Canadian GAAP | $ | 121,329,283 | $ | 136,205,154 | |||
Exploration expenditures on resource properties expensed under US GAAP | (11,828,028 | ) | (11,808,350 | ) | |||
Total assets per US GAAP | $ | 109,501,255 | $ | 124,396,804 | |||
Total liabilities per Canadian and US GAAP | $ | 15,751,294 | $ | 27,679,401 | |||
Total shareholders equity per Canadian GAAP | 105,577,989 | 108,525,753 | |||||
Exploration expenditures on resource properties expensed under US GAAP | (11,828,028 | ) | (11,808,350 | ) | |||
Total shareholders equity per US GAAP | 93,749,961 | 96,717,403 | |||||
Total liabilities and shareholders equity per US GAAP | $ | 109,501,255 | $ | 124,396,804 |
40
CARDERO RESOURCE CORP. |
(AN EXPLORATION STAGE COMPANY) |
Notes to Consolidated Financial Statements |
Years ended October 31, 2011, 2010 and 2009 |
15. |
DIFFERENCES BETWEEN CANADIAN AND US GAAP (Continued) | |
Differences in accounting principles (Continued) | ||
(c) |
Reconciliation of net income/(loss) and comprehensive income/(loss) reported in Canadian GAAP and US GAAP: | |
Statements of operations for the years ended October 31: |
2011 | 2010 | 2009 | ||||||||
Net income (loss) per Canadian GAAP | $ | (24,733,528 | ) | $ | 44,950,970 | $ | (254,628 | ) | ||
Exploration and development costs | (8,027,063 | ) | (5,765,991 | ) | (2,789,143 | ) | ||||
Reverse exploration and developments costs written-off |
7,716,830 | 4,930,505 | 1,668,856 | |||||||
Exploration and development costs recovered | 297,383 | - | 3,399,882 | |||||||
Total difference | (12,850 | ) | (835,486 | ) | 2,279,595 | |||||
Net income (loss) per US GAAP | $ | (24,746,378 | ) | $ | 44,115,484 | $ | 2,024,967 | |||
Weighted average number of common shares outstanding |
68,988,456 | 58,571,515 | 58,421,309 | |||||||
Basic and diluted income (loss) per share
in accordance with Canadian GAAP |
$ | (0.36 | ) | $ | 0.77 | $ | (0.01 | ) | ||
Total differences | (0.00 | ) | (0.02 | ) | 0.04 | |||||
Basic and diluted income (loss) per share in
accordance with US GAAP |
$ | (0.36 | ) | $ | 0.75 | $ | 0.03 |
Statements of comprehensive income (loss) for the years ended October 31:
2011 | 2010 | 2009 | ||||||||
Comprehensive income (loss) in accordance
with Canadian GAAP |
$ | (45,885,557 | ) | $ | 62,175,067 | $ | 10,131,128 | |||
Total difference
in net income (loss) between Canadian and US GAAP |
(12,850 | ) | (835,486 | ) | 2,279,595 | |||||
Total
comprehensive income (loss) in accordance with US GAAP |
$ | (45,898,407 | ) | $ | 61,339,581 | $ | 12,410,723 |
41
CARDERO RESOURCE CORP. |
(AN EXPLORATION STAGE COMPANY) |
Notes to Consolidated Financial Statements |
Years ended October 31, 2011, 2010 and 2009 |
15. |
DIFFERENCES BETWEEN CANADIAN AND US GAAP (Continued) Differences in accounting principles (Continued) | |
(d) |
Reconciliation of cash flows in accordance with Canadian GAAP and US GAAP: | |
Statements of cash flows for the years ended October 31: |
2011 | 2010 | 2009 | ||||||||
Net cash used in operating activities in
accordance with Canadian GAAP |
$ | (44,769,071 | ) | $ | (10,923,832 | ) | $ | (5,057,303 | ) | |
Adjustments to net
loss involving use of cash Write-off of capitalized resource property exploration costs |
(5,124,364 | ) | (5,855,417 | ) | (2,919,150 | ) | ||||
Net cash used in operating activities in
accordance with US GAAP |
(49,893,435 | ) | (16,779,249 | ) | (7,976,453 | ) | ||||
Net cash provided by (used in) investing
activities in accordance with Canadian GAAP |
(1,337,411 | ) | 60,525,140 | 9,459,769 | ||||||
Reclassification
of capitalized resource property exploration costs |
5,124,364 | 5,855,417 | 2,919,150 | |||||||
Net cash provided by (used in) investing
activities in accordance with US GAAP |
3,786,953 | 66,380,557 | 12,378,919 | |||||||
Net cash flows provided by (used in)financing
activities in accordance with Canadian and US GAAP |
1,197,868 | (283,075 | ) | 164,250 | ||||||
Effect of foreign exchange on cash in accordance
with Canadian and US GAAP |
(1,369,755 | ) | (2,877,426 | ) | (32,360 | ) | ||||
Net (decrease) increase in cash and cash
equivalents in accordance with Canadian and US GAAP |
(46,278,369 | ) | 46,440,807 | 4,534,356 | ||||||
Cash and cash
equivalents, beginning of the year in accordance with Canadian and US GAAP |
52,264,003 | 5,823,196 | 1,288,840 | |||||||
Cash and cash equivalents, end of the year
in accordance with Canadian and US GAAP |
$ | 5,985,634 | $ | 52,264,003 | $ | 5,823,196 |
(e) |
Cumulative development stage reporting | |
The Company is not required and has opted to not report such information for Canadian reporting and for US GAAP purposes; the Company is considered an exploration stage company. Statement of Financial Accounting Standards No. 7 Accounting and Reporting by Development Stage Enterprises requires the disclosure of cumulative-to-date information for each line item on the statements of operations and cash flow plus annual summaries of each component of shareholders equity since inception. Under Canadian GAAP, Accounting Guideline AcG 11 Enterprises in the Development Stage, issued by the Canadian Institute of Chartered Accountants, does not require reporting of this information. Had the consolidated financial statements been prepared in accordance with US GAAP such information would have been disclosed. |
42
CARDERO RESOURCE CORP. |
(AN EXPLORATION STAGE COMPANY) |
Notes to Consolidated Financial Statements |
Years ended October 31, 2011, 2010 and 2009 |
15. |
DIFFERENCES BETWEEN CANADIAN AND US GAAP (Continued) | |
Differences in accounting principles (Continued) | ||
(f) |
Income taxes | |
Under Canadian GAAP, future tax assets and liabilities are recorded at substantively enacted tax rates. Under US GAAP, deferred tax assets and liabilities are recorded at enacted tax rates. There were no significant differences between enacted and substantively enacted tax rates for any of the periods presented. | ||
In 2006, FASB issued FIN 48, Accounting for Uncertainty in Income Taxes, an Interpretation of FASB Statement 109. This interpretation prescribes a recognition threshold and measurement criteria for the financial statement recognition of a tax position taken or expected to be taken in a tax return. This interpretation was effective for the Company on February 1, 2008. The Company is required to determine whether it is more likely than not that a tax position will be sustained upon examination and such positions that meet this threshold will be measured at the most likely amount to be realized upon settlement. | ||
The Company has reviewed its tax positions and determined that the application of FIN 48 does not result in any material adjustment for US GAAP purposes | ||
(g) |
Derivatives | |
Under US GAAP, the Company is required to adopt EITF Issue No. 07-5, Determining Whether an | ||
Instrument (or embedded Feature) is Indexed to an Entitys Own Stock. The standard provides guidance on when certain contingent and other adjustment features in equity-linked financial instruments are indexed solely to an entitys own stock. Such adjustment features also include strike prices which are denominated in a foreign currency. The adoption of this standard did not have a material impact on the consolidated financial statements. | ||
(h) |
Marketable securities | |
Prior to June 1, 2007, under Canadian GAAP marketable securities and long-term investments were carried at the lower of cost or market, and adjustments to the carrying value are shown as an expense on the Statement of Operations. Under US GAAP marketable equity securities are carried at market value, and changes to the market value are shown as a component of shareholder's equity (if the securities are classified as available-for-sale securities) or as gain or loss in the Statement of Operations (if the securities are classified as trading securities). Effective June 1, 2007, the Companys accounting for financial instruments, equity and comprehensive income under US GAAP is substantially equivalent to the accounting under Canadian GAAP. | ||
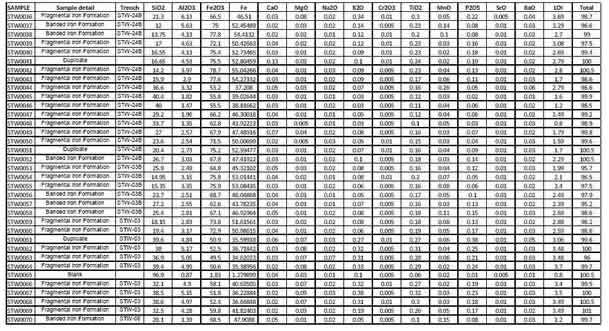
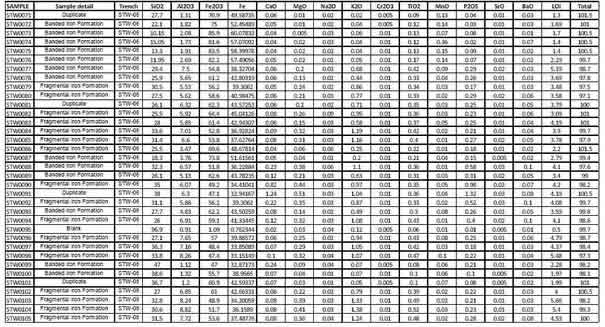
(i) |
Adoption of IFRS | |
On November1, 2011, the Company will transition from the current Canadian GAAP standards to IFRS. The Company will not provide a reconciliation to United States GAAP in future consolidated financial statements. |
43
CARDERO RESOURCE CORP. |
(AN EXPLORATION STAGE COMPANY) |
Notes to Consolidated Financial Statements |
Years ended October 31, 2011, 2010 and 2009 |
16. |
SUPPLEMENTAL CASH FLOW INFORMATION |
2011 | 2010 | 2009 | ||||||||
Supplemental Cash Flow Information | ||||||||||
Accounts payable related to property expenditure | $ | 3,195,677 | $ | 292,977 | $ | 203,551 | ||||
Accounts receivable related to property expenditure | $ | 769,880 | $ | - | $ | - | ||||
Shares issued on Acquisition of Cardero Coal (note 3) | $ | 35,095,503 | $ | - | $ | - | ||||
Shares issued for debt settlement | $ | - | $ | - | $ | 204,676 | ||||
Shares issued for equity investment | $ | - | $ | - | $ | 795,000 | ||||
Shares issued for property option payments | $ | - | $ | 111,500 | $ | - | ||||
Option payment received in shares | $ | - | $ | - | $ | 17,000 | ||||
Obligation to issue shares | $ | - | $ | - | $ | 111,500 | ||||
Interest paid | $ | - | $ | - | $ | - | ||||
Income taxes paid | $ | 25,601,634 | $ | 2,138,634 | $ | - |
17. |
SUBSEQUENT EVENTS | |
Subsequent to October 31, 2011: | ||
(a) |
On November 29, 2011, the Company completed a non-brokered private placement pursuant to which the Company sold 8,029,750 units (Units) at a price of $ 0.95 per Unit for aggregate gross proceeds of $7,628,263. Each Unit consists of one common share of the Company (a Share) and one-half of one common share purchase warrant (each whole warrant, a Warrant). Each Warrant is exercisable into one additional Share until November 29, 2012 at an exercise price of $1.25. | |
(b) |
The Company granted 1,400,000 stock options at a price of $1.10 for a period of two years ending November 9, 2013. | |
(c) |
On November 17, 2011 the Company entered into a Letter of Intent (LOI) with Anglo Pacific Group PLC (Anglo Pacific) to acquire 100% of Trefi Coal Corporation (Trefi), a wholly-owned subsidiary of Angolo Pacific which owns the Trefi Metallurgical Coal deposit in the Peace River Coalfield, British Columbia, Canada. | |
The main terms of the proposed acquisition are as follows: |
|
In consideration of the payment of $3.5 million, and the issuance of 500,000 common shares of the Company plus warrants to acquire an additional 1,000,000 common shares of the Company at a price of $1.40 per share for a period of 18 months after closing, Cardero will be granted the option (First Option) to acquire 50% of the issued shares of Trefi. | |
|
In order to exercise the First Option, the Company will be required to deliver a bankable feasibility study (BFS) with respect to the Trefi Coal project within four years of closing. | |
|
If the BFS delivered by the Company is positive (defined as a BFS which demonstrates an IRR greater than 20%, utilizing a discount rate of 10% and an industry consensus forward looking 4 year price for the coal proposed to be delivered from the project), the Company may acquire the balance of Trefi (50%) by making a production decision, paying Anglo Pacific $5.0 million and issuing $1 million of Cardero shares (valued at the 5 day VWAP price to the date of issuance). | |
|
If the BFS is positive, but the Company does not elect to make a production decision, then Anglo Pacific will have the option to reacquire the 50% of Trefi from the Company by paying the Company 50% of the total expenditures by the Company on the BFS. | |
|
If the BFS is not positive, then the Company will retain its 50% of Trefi and commit to periodic reviews of the BFS. If, after 2 years, the BFS remains not positive and Company has not elected to make a production decision and acquire the balance of Trefi by making the $5.0 million payment and issuing the $1.0 million of Cardero shares, then a buy-sell process may be initiated, by which the party offering to pay the highest price to the other party will be able to purchase the interest of the other party. | |
|
Once in production, Anglo Pacific will be paid a gross revenue royalty of 3% to be priced on an FOB basis, with the obligation for payment of the royalty to be secured. |
44
CARDERO RESOURCE CORP. |
(AN EXPLORATION STAGE COMPANY) |
Notes to Consolidated Financial Statements |
Years ended October 31, 2011, 2010 and 2009 |
17. |
SUBSEQUENT EVENTS (Continued) | ||
(d) |
The Company received repayment of the USD 8,000,000 loan plus USD 645,260 in interest (note 9(c)) from Trevali on January 16, 2012. The loan was repaid as follows: | ||
|
USD 5,000,000 in cash, and | ||
|
USD 3,645,260 (CAD $3,734,569) through the issuance of 4,149,521 units (Units) of Trevali at a deemed price of $0.90 per Unit. Each Unit is comprised of one common share of Trevali (Common Share) and one-half of one transferrable common share purchase warrant (a Warrant). Each whole Warrant will entitle the holder thereof to purchase one Common Share (Warrant Share) at a price of $1.10 per share until January 16, 2014. The Common Shares, Warrants and any Warrant Shares issued are subject to a hold period in Canada expiring on May 17, 2012. | ||
(e) |
The Company sold the remaining balance of its investments in ITH (note 5) for net proceeds of $15,306,885 and resulting in a gain on sale of $9,748,727. | ||
(f) |
360,000 options exercisable at a price of $1.31 per share expired unexercised on December 1, 2011. | ||
(g) |
The Company issued 428,400 common shares on exercise of 428,400 agents warrants for gross proceeds of $269,892. | ||
(h) |
3,782,000 Abzu warrants (note 5) exercisable at a price of $0.75 expired unexercised on December 21, 2011. | ||
(i) |
Cardero Coal paid final option payment of $2,500,000 pursuant to the Burns Agreement (note 7(f)(ii)) and exercised to option to enter into a mining lease over the coal situate in the CGDLs. | ||
(j) |
Cardero Coal paid the final option payment of $2,500,000 pursuant to the Joint Venture Agreement (note 7(f)(iii)). | ||
(k) |
The Company sold 593,000 Corvus shares (note 5) for net proceeds of $373,964 and resulting in a loss on sale of $112,296. | ||
(l) |
The Company granted 1,500,000 stock options at a price of $1.51 for a period of two years ending January 26, 2014. |
45
CARDERO RESOURCE CORP. |
Form 51-102F1 |
Managements Discussion and Analysis |
For the year ended October 31, 2011 |
INTRODUCTION
This Management Discussion and Analysis (MD&A) for Cardero Resource Corp. (Cardero or the Company) for the year ended October 31, 2011 has been prepared by management, in accordance with the requirements of National Instrument 51-102, as of January 26, 2012, and compares its financial results for the year ended October 31, 2011 to the previous year. This MD&A provides a detailed analysis of the business of Cardero and should be read in conjunction with the Companys audited consolidated financial statements for the year ended October 31, 2011. The Companys reporting currency is the Canadian dollar and all amounts in this MD&A are expressed in Canadian dollars. The Company reports its financial position, results of operations and cash-flows in accordance with Canadian generally accepted accounting principles.
Forward-Looking Statements
This MD&A contains forward-looking statements and forward-looking information (collectively, forward-looking statements) within the meaning of applicable Canadian and US securities legislation. These statements relate to future events or the future activities or performance of the Company. All statements, other than statements of historical fact, are forward-looking statements. Information concerning mineral resource estimates also may be deemed to be forward-looking statements in that it reflects a prediction of the mineralization that would be encountered if a mineral deposit were developed and mined. Forward-looking statements are typically identified by words such as: believe, expect, anticipate, intend, estimate, postulate, plans and similar expressions, or which by their nature refer to future events. These forward looking statements include, but are not limited to, statements concerning:
the Companys strategies and objectives, both generally and specifically in respect of Carbon Creek Metallurgical Coal property (Carbon Creek), Sheini iron ore properties, and the Minnesota Iron/Titanium properties ;
the ability of the Company to convert portions of the existing resource at Carbon Creek into the Measured & Indicated categories;
the ability of the Company to increase the global resource at Carbon Creek by including additional coal seams in the resource estimation;
the timing of decisions regarding the timing and costs of exploration programs with respect to, and the issuance of the necessary permits and authorizations required for, the Companys ongoing exploration programs on its properties;
the Companys estimates of the quality and quantity of the resources at its mineral properties;
the timing and cost of the planned future exploration programs at the Minnesota Iron/Titanium and Carbon Creek Coal properties, and the timing of the receipt of results therefrom;
the Companys future cash requirements;
Cardero Resource Corp. | |
Form 51-102F1 | |
Management Discussion & Analysis | |
Year ended October 31, 2011 | Page 2 |
general business and economic conditions;
the Companys ability to meet its financial obligations as they come due, and to be able to raise the necessary funds to continue operations; and
the Companys ability to negotiate acceptable option/joint venture agreements for some or all of its non-core properties.
Although the Company believes that such statements are reasonable, it can give no assurance that such expectations will prove to be correct. Inherent in forward looking statements are risks and uncertainties beyond the Companys ability to predict or control, including, but not limited to, risks related to the Companys inability to identify one or more economic deposits on its properties, variations in the nature, quality and quantity of any mineral deposits that may be located, variations in the market price of any mineral products the Company may produce or plan to produce, the Companys inability to obtain any necessary permits, consents or authorizations required for its activities, to produce minerals from its properties successfully or profitably, to continue its projected growth, to raise the necessary capital or to be fully able to implement its business strategies, and other risks identified herein under Risk Factors. The Company cautions investors that any forward-looking statements by the Company are not guarantees of future performance, and that actual results are likely to differ, and may differ materially, from those expressed or implied by forward looking statements contained in this MD&A. Such statements are based on a number of assumptions which may prove incorrect, including, but not limited to, assumptions about:
the level and volatility of the price of commodities, and iron ore, coal, vanadium and titanium in particular;
general business and economic conditions;
the timing of the receipt of regulatory and governmental approvals, permits and authorizations necessary to implement and carry on the Companys planned exploration programs, particularly at the Minnesota Iron/Titanium and Carbon Creek Coal properties;
conditions in the financial markets generally;
the Companys ability to secure the necessary consulting, drilling and related services and supplies on favourable terms in connection with its ongoing and planned exploration programs;
the Companys ability to attract and retain key staff;
the accuracy of the Companys resource estimates (including with respect to size and grade) and the geological, operational and price assumptions on which these are based;
the timing of the ability to commence and complete the planned work at the Carbon Creek Coal property;
the anticipated terms of the consents, permits and authorizations necessary to carry out the planned exploration programs at the Companys properties and the Companys ability to comply with such terms on a safe and cost-effective basis;
the ongoing relations of the Company with its underlying optionors/lessors and the applicable regulatory agencies;
Cardero Resource Corp. | |
Form 51-102F1 | |
Management Discussion & Analysis | |
Year ended October 31, 2011 | Page 3 |
that the metallurgy and recovery characteristics of samples from certain of the Companys mineral properties are reflective of the deposit as a whole;
the Companys ability to negotiate and enter into appropriate off-take agreements for the potential products from Carbon Creek; and
the Companys ability to overcome any potential difficulties in adapting pilot scale operations and testing to commercial scale operations.
These forward looking statements are made as of the date hereof and the Company does not intend and does not assume any obligation, to update these forward looking statements, except as required by applicable law. For the reasons set forth above, investors should not attribute undue certainty to or place undue reliance on forward-looking statements.
Caution Regarding Adjacent or Similar Mineral Properties
This MD&A contains information with respect to adjacent or similar mineral properties in respect of which the Company has no interest or rights to explore or mine. The Company advises US investors that the mining guidelines of the US Securities and Exchange Commission (the SEC) set forth in the SECs Industry Guide 7 (SEC Industry Guide 7) strictly prohibit information of this type in documents filed with the SEC. Because the Company meets the definition of a foreign private issuer under applicable SEC rules and is preparing this MD&A pursuant to Canadian disclosure requirements under the Canada-U.S. Multi-Jurisdictional Disclosure System, this MD&A is not subject to the requirements of SEC Industry Guide 7. Readers are cautioned that the Company has no interest in or right to acquire any interest in any such properties, and that mineral deposits on adjacent or similar properties are not indicative of mineral deposits on the Companys properties.
Caution Regarding Reference to Resources and Reserves
National Instrument 43-101 Standards of Disclosure of Mineral Projects (NI 43-101) is a rule developed by the Canadian Securities Administrators which establishes standards for all public disclosure an issuer makes of scientific and technical information concerning mineral projects. Unless otherwise indicated, all reserve and resource estimates contained in or incorporated by reference in this MD&A have been prepared in accordance with NI 43-101 and the guidelines set out in the Canadian Institute of Mining, Metallurgy and Petroleum (the CIM) Standards on Mineral Resource and Mineral Reserves, adopted by the CIM Council on November 14, 2004 (the CIM Standards) as they may be amended from time to time by the CIM and, with respect to coal, in the Geological Survey of Canada Paper 88-21 entitled A Standardized Coal Resource/Reserve Reporting System for Canada originally published in 1988.
The terms mineral reserve, proven mineral reserve and probable mineral reserve are Canadian mining terms as defined in accordance with NI 43-101 and the CIM Standards. These definitions differ from the definitions in SEC Industry Guide 7. The SEC has taken the position that mineral reserves for a mineral property may not be designated unless: (i) competent professional engineers conduct a detailed engineering and economic study, and the bankable or final feasibility study demonstrates that a mineral deposit can be mined profitably at a commercial rate; (ii) a historic three-year average commodity price is used in any reserve or cash flow analysis used to designate reserves; and (iii) the company has demonstrated that the mineral property will receive its governmental permits, and the primary environmental document has been filed with the appropriate governmental authorities.
Cardero Resource Corp. | |
Form 51-102F1 | |
Management Discussion & Analysis | |
Year ended October 31, 2011 | Page 4 |
In addition, the terms "mineral resource", "measured mineral resource", "indicated mineral resource" and "inferred mineral resource" are defined in and required to be disclosed by NI 43-101 and the CIM Standards; however, these terms are not defined terms under SEC Industry Guide 7 and are normally not permitted to be used in reports and registration statements filed with the SEC. Investors are cautioned not to assume that any part or all of mineral deposits in these categories will ever be converted into reserves. "Inferred mineral resources" have a great amount of uncertainty as to their existence, and great uncertainty as to their economic and legal feasibility. It cannot be assumed that all or any part of an inferred mineral resource will ever be upgraded to a higher category. Under Canadian rules, estimates of inferred mineral resources may not form the basis of feasibility or pre-feasibility studies, except in rare cases. Investors are cautioned not to assume that all or any part of an inferred mineral resource exists or is economically or legally mineable. Disclosure of "contained ounces" in a resource is permitted disclosure under Canadian regulations; however, the SEC normally only permits issuers to report mineralization that does not constitute "reserves" by SEC Industry Guide 7 standards as in place tonnage and grade without reference to unit measures.
Accordingly, information contained in this MD&A and the documents incorporated by reference herein contain descriptions of the Company's mineral deposits that may not be comparable to similar information made public by U.S. companies subject to the reporting and disclosure requirements under the United States federal securities laws and the rules and regulations thereunder.
Caution Regarding Historical Results
Historical results of operations and trends that may be inferred from the discussion and analysis in this MD&A may not necessarily indicate future results from operations. In particular, the current state of the global securities markets may cause significant reductions in the price of the Company's securities and render it difficult or impossible for the Company to raise the funds necessary to continue operations. See "Risk Factors - Share Price Volatility".
All of the Company's public disclosure filings, including its most recent management information circular, material change reports, press releases and other information, may be accessed via www.sedar.com and readers are urged to review these materials, including the technical reports filed with respect to the Company's mineral properties.
DATE
This MD&A reflects information available as at January 26, 2012.
Cardero Resource Corp. | |
Form 51-102F1 | |
Management Discussion & Analysis | |
Year ended October 31, 2011 | Page 5 |
RESULTS OF OPERATIONS
Background
Cardero Resource Corp. is a junior resource mineral exploration company. Its assets consist of interests in mineral properties, investments and cash. The Company funds its operations primarily through the sale of its equity securities, its investments and interests in its mineral properties. The mineral exploration business is very high risk (See Risk Factors).
Exploration Activities
General
Through 2011 Cardero was focussed on the migration from high-risk, early-stage grassroots exploration projects, and on bulk commodities such as metallurgical coal and iron, where it can add value through identification and acquisition of advanced projects.
In recent years, Cardero's focus has increasingly been on iron ore and iron-making technologies. The sale of Cardero's wholly-owned Pampa de Pongo iron deposit in late 2009 for US$100 million cash represented an early success in the iron market. Cardero continues to hold significant iron ore resources at the Iron Sands Project in Peru and iron-titanium interests in Minnesota, USA.
In keeping with bulk-commodity focus, on June 1, 2011, Cardero completed the acquisition of all of the issued securities of Coalhunter Mining Corporation, which subsequently changed its name to Cardero Coal Ltd. (Cardero Coal). Cardero Coal is a private British Columbia company which controls the Carbon Creek Metallurgical Coal deposit in north-eastern British Columbia, Canada, and is proceeding with an aggressive work program as outlined below.
Carderos current strategy is to seek to option-out or joint venture all of its non-core assets, allowing the Company to focus on its coal and iron ore projects. Cardero is also actively assessing and seeking to acquire interests in a number of mineral exploration properties which are prospective for iron ore and coal. At the present time, it is focusing its activities on its core projects in Minnesota (United States), British Columbia (Canada), and Ghana (Africa) where it has established subsidiaries and the infrastructure to enable it to actively work in such countries. The Company, through its subsidiaries, holds, or has or is negotiating the right to acquire interests in, mineral properties in these countries. However, at the present time it does not consider all of these to be material as, in many cases, the properties are in the early stages of evaluation, or have not had sufficient work done on them by the Company to determine if they are material.
Property |
Total Costs to October 31, 2010 |
Total Costs to October 31, 2011 |
Estimated Fiscal 2012 Expenditures(1) |
Minnesota Iron-Titanium Projects, USA | $2,648,977 | $3,688,741 | $1,000,000 |
Carbon Creek Metallurgical Coal Project, BC, Canada | $3,138,691 | $62,953,380 | $36,000,000 |
Sheini Hills Iron Project | $220,916 | $3,041,310 | $6,000,000 |
Note: |
1. |
This amount represents the estimated exploration expenditures for fiscal year ending October 31, 2012 and does not include property acquisition costs. Estimated expenditures are contingent upon ongoing successful results justifying further expenditures. |
Cardero Resource Corp. | |
Form 51-102F1 | |
Management Discussion & Analysis | |
Year ended October 31, 2011 | Page 6 |
During the year ended October 31, 2011 and to January 26, 2012, the Company was primarily focussed on the Carbon Creek Metallurgical Coal deposit, including preparations for the field program and the beginning of the field program in August, completing the drilling programs for the Longnose and Titac properties together with its ongoing efforts to investigate and evaluate additional potential acquisitions.
Material Mineral Properties
Carbon Creek Metallurgical Coal Deposit, British Columbia, Canada
Information in this MD&A regarding the Carbon Creek property is based on information provided by the technical report dated December 6, 2011 entitled "Technical Report, Carbon Creek Coal Property, British Columbia, Canada" (the "Carbon Creek Report") prepared by Norwest Corporation ("Norwest"). The following summary is from the Carbon Creek Report and the detailed disclosure in the Carbon Creek Report is incorporated into this MD&Aby reference. Readers are encouraged to review the entire Carbon Creek Report, which is filed on SEDAR at www.sedar.com.
Location
The Carbon Creek property lies approximately 60km northwest of the town of Chetwynd, BC and 40km west of the town of Hudson's Hope. Improved forest service roads connect the property with British Columbia Highway 29 between the towns of Chetwynd and Hudson Hope. The CN Rail line connecting Fort St John and Tumbler Ridge areas with Prince George passes 40km south of the property. The CN Rail line provides direct access to the ports of Vancouver and Ridley Terminals in Prince Rupert, BC.
Tenure and Joint Venture
The Carbon Creek property is in the Peace River Coalfield and consists of twelve Coal License Applications (and any coal licenses issued pursuant to such applications) and ten Crown Granted District Lots (CGDL), comprising a contiguous tenure parcel of 17,200ha.
Ten of the Coal License Applications have been submitted by P. Burns Resources Ltd. (Burns) of Calgary, Alberta and, upon the issuance of any coal licenses thereunder, such licenses are to be transferred to the Carbon Creek Partnership (CCP), an Alberta partnership. One Coal License Application has been submitted by Alan A. Johnson (Johnson), and one has been submitted by Cardero Coal.
The CGDL's, totalling approximately 2,600ha, are controlled by Peace River Partnership (PRP), an Alberta partnership. Cardero Coal has entered into an option to acquire a coal lease over the CGDL from PRP.
Cardero Coal has entered into an agreement with Johnson to purchase the one coal license to be issued pursuant to the Coal License Application submitted by Johnson (subject to the issuance of the applicable coal license).
Cardero Coal has entered into a joint venture agreement with CCP, in which Cardero Coal will have a 75% interest and CCP will have a 25% interest. Pursuant to the joint venture agreement, each joint venture partner is contributing its interest in the Carbon Creek property, being the coal lease over the CGDL (when acquired by Cardero Coal), and all coal licenses (if and when issued to Burns and transferred to CCP and if as and when issued to Cardero Coal pursuant to the applicable Coal License Applications and, in the case of the coal license which may be issued to Johnson pursuant to his Coal License Application, upon its acquisition from him by Cardero Coal). The joint venture, known as the Carbon Creek Joint Venture, will control and operate the Carbon Creek property described above. The joint venture agreement provides that the CCP interest is a carried net profits interest which requires Cardero Coal to fund the exploration, development, construction and operation of the mine and that the CCP receives no profits until Cardero Coal has recovered its investment. At that point, the CCP is entitled to 25% of the net profits of the Carbon Creek Joint Venture. Cardero Coal is the manager of the Carbon Creek Joint Venture.
Cardero Resource Corp. | |
Form 51-102F1 | |
Management Discussion & Analysis | |
Year ended October 31, 2011 | Page 7 |
Cardero completed the acquisition of the balance of the outstanding shares of Cardero Coal through a Plan of Arrangement that was completed on June 1, 2011.
Geology
The local geology of the Carbon Creek Property consists of a doubly-plunging syncline which lies between two anticlinal belts that straddle the western and eastern boundaries of the property. The synclinal axis roughly parallels the course of Carbon Creek, and plunges gently (less than 5°) to the south-southeast through the main project area. Dips in the central portion of the property are nearly flat, ranging from 0º to 15º, increasing to up to 30º along the synclinal flanks in the east and west portions of the property. Dips through the east and central portions of the initial development area are very mild due to their proximity to the syncline axis. Dips increase to the west moving up the western limb of the syncline.
Four north-south trending faults were identified in early exploration programs and were thought to die out in these directions. According to Utah Mines Ltd. (Utah) dips of strata in proximity to these faults increase to the point where they effectively separate the property into discreet mining blocks. The three westernmost faults were interpreted to be high-angle reverse faults with displacements estimated to range from between 50m to 70m. The easternmost Carbon Creek fault was speculated to be a high-angle thrust and having significant displacement, in the range of hundreds of meters, based on the interpretation of a coal-barren portion of the upper Gething being exposed on its eastern side.
Recent field work conducted by Cardero Coal has shown that the severity of the faulting may be less than estimated by Utah during their evaluations in the late 1970's and early 1980's. Definitive data that would permit accurate, detailed mine planning in the areas proximal to suspected faults has yet to be collected and/or evaluated. The most notable change in interpretation is the intersection of what is believed to be the lower coal seams of the property's stratigraphic sequence on the east side of the Carbon Creek Fault. This fault was formerly thought to have had sufficient uplift to expose the barren zone of the Gething Formation lying below the coal horizons. Although not sufficiently defined as a resource for inclusion in the Carbon Creek Report, it does present an exploration target for establishing additional resource tonnage in the future.
Mineralization
The mineralized zones encountered on the property are predominantly medium volatile bituminous coal seams, with minor increase or decrease in rank depending on structural or stratigraphic variations and depth of burial. Historic coal quality reports indicate that the coals will, with beneficiation (washing) to remove impurities, produce a product with coking properties suitable for metallurgic applications. Thermal coal suitable for electric power generation could be produced with or without further processing in addition to, or as an alternative to, a coking coal product.
Cardero Resource Corp. | |
Form 51-102F1 | |
Management Discussion & Analysis | |
Year ended October 31, 2011 | Page 8 |
Coal Occurrence
Over thirty coal seams occur in the middle and upper portions of the Gething Formation. Sixteen seams are present through the northern half of the property. Twelve main seams have figured prominently in historic coal tonnage calculations.
Coal deposition is typical of the Gething Formation, consisting of abundant coal seams, some showing favorable metallurgical properties. The twelve seams listed in Table 1.1 are developed sufficiently to be of economic significance. These seams range from 1.14m to 2.17m in average thickness. Raw coal qualities are presented for each of these seams. Values shown represent coal without out-of-seam dilution (OSD). Processing coal mixed with OSD using size specific density and froth flotation separating processes (coal washing) is widely used to improve coal quality by reducing ash content and raising its calorific value. Coking properties such as free swelling index (FSI) and dilation are typically improved as well, through washing.
Table 1.1 Raw Coal Quality
SEAM | AVERAGE
THICKNESS (M) |
COAL QUALITY (AIR DRIED BASIS) | ||||||
MOISTURE (%) |
ASH (%) |
SULPHUR (%) |
VOLATILE MATTER (%) |
FIXED CARBON % |
CALORIFIC VALUE BTU/LB |
FSI | ||
58 | 1.14 | 2.60 | 12.56 | 0.92 | 28.92 | 55.93 | 12,663 | 2.0 |
55 | 1.57 | 2.74 | 12.42 | 0.68 | 28.59 | 56.26 | 12,893 | 2.5 |
54 | 1.39 | 2.78 | 5.66 | 0.83 | 27.36 | 64.20 | 13,926 | 1.5 |
52 | 1.63 | 2.18 | 17.14 | 1.88 | 28.33 | 52.35 | 12,178 | 4.0 |
51A | 1.29 | 2.74 | 6.25 | 0.80 | 28.01 | 63.00 | 13,902 | 2.0 |
51 | 1.51 | 2.73 | 9.63 | 0.73 | 26.42 | 61.23 | 13,228 | 2.0 |
47 | 1.14 | 2.53 | 15.49 | 0.91 | 24.00 | 57.98 | 12,441 | 1.5 |
46 | 1.70 | 2.60 | 6.50 | 0.83 | 26.92 | 63.99 | 13,907 | 2.0 |
40 | 1.95 | 2.02 | 13.99 | 1.17 | 27.16 | 56.83 | 12,892 | 5.5 |
31 | 1.99 | 1.50 | 25.74 | 1.42 | 24.33 | 48.43 | 10,906 | 6.0 |
15 | 2.17 | 1.08 | 17.11 | 0.57 | 21.14 | 60.67 | 12,602 | 2.5 |
14 | 1.91 | 0.95 | 19.03 | 0.57 | 19.20 | 60.83 | 12,362 | 3.0 |
Raw coal qualities indicate good coking coal potential in seams 31, 40 and 52 based on average FSI values. In-place raw ash contents are generally low and all seams will be improved with washing which would reduce ash content further and typically increase the FSI by a few points. With careful blending, the other seams would likely be saleable in the coking coal market.
Exploration
The periods and types of coal exploration undertaken on the property are summarised in Table 1.2. The coal exploration methods can be separated into four types: regional mapping and field sampling, aerial surveys, coring and open-hole (rotary) drilling, and bulk sampling. Types by era are summarized below.
Cardero Resource Corp. | |
Form 51-102F1 | |
Management Discussion & Analysis | |
Year ended October 31, 2011 | Page 9 |
Table 1.2 Exploration Methods
Year |
Company/
Individual |
Drill
Holes |
Exploration Activity |
1908 to 1942 |
Various* | Surface mapping, and sampling, trenching | |
1943 | Stines | Surface mapping, and sampling, trenching | |
1945 | Mathews | Surface mapping, and sampling, trenching | |
1970 | Trend Exploration | Aerial reconnaissance mapping | |
1971 | Utah | 9 | Surface mapping and drilling |
1972 | Utah | 14 | Surface mapping and drilling |
1973 | Utah | 16 | Surface mapping and drilling |
1975 | Utah | 36 | Surface mapping, drilling, and 2D seismic program |
1976 | Utah | 181 | Surface mapping, drilling and bulk sampling from adits |
1981 | Utah | 45 | Surface mapping and drilling |
2010 | Coalhunter | 8 | Validation drilling (coring) |
All drilling was vertically orientated, targeting coal seams that were mostly dipping between 5o and 20o from vertical. Approximately one third of the 309 holes drilled on the property were sampled core holes. The rotary holes were completed for the purposes of coal seam correlations and mapping depth of surface weathering.
Cardero Coal has been conducting a sizable exploration and development drilling project within the CGDL area of the property since August of 2011. Drilling data from this program has not been used to define resources in the Carbon Creek Report but will be assimilated into an updated geologic model for planned feasibility work during 2012.
Coal Resources
A resource estimation of the Carbon Creek property was completed in accordance with the procedures and criteria of Geological Survey of Canada (GSC) Paper 88-21 as required by NI 43-101. The mineral resource estimates for surface and underground moderate geology-type coal reported from the current Carbon Creek geologic model are outlined in Table 1.2. The resource statement is current as of October 1, 2011. Surface mineable resources are based on mining to a maximum strip ratio (waste volume to tonne of in-place coal) of 20 to 1.
Carbon Creek has an estimated 166.7Mt of in-place coal resources in the measured and indicated categories. Table 1.3 breaks these resources into surface and underground tonnes.
Cardero Resource Corp. | |
Form 51-102F1 | |
Management Discussion & Analysis | |
Year ended October 31, 2011 | Page 10 |
Table 1.3 Classification of Resource Carbon Creek Property October 1, 2011
Deposit Type | ASTM Coal Rank |
Measured (Mt) |
Indicated
(Mt) |
Inferred (Mt) |
Surface | mvB | 33.1 | 20.1 | 19.6 |
Underground | mvB | 42.4 | 71.1 | 147.5 |
Total | mvB | 166.7 | 167.1 |
The accuracy of resource estimates is, in part, a function of the quality and quantity of available data and of engineering and geological interpretation and judgment. Given the data available at the time the Carbon Creek Report was prepared, the estimates presented herein are considered reasonable. However, they should be accepted with the understanding that additional data and analysis available subsequent to the date of the estimates may necessitate revision. These revisions may be material. There is no guarantee that all or any part of the estimated resources will be recoverable. Mineral resources are not mineral reserves and there is no assurance that any mineral resources will ultimately be reclassified as proven or probable reserves. Mineral resources which are not mineral reserves do not have demonstrated economic viability.
Mineable Coal
Based on the geological model developed in the Carbon Creek Report a general mining layout was prepared for both surface and underground mining areas. Applying mining parameters, as discussed in Section 16 of the Carbon Creek Report, a potentially mineable tonnage estimate was developed for each mining method as shown in Table 1.4.
Table 1.4 Potentially Mineable Coal Tonnes Through Year 30
Mining Method | Potentially Mineable
Tonnes (millions) |
Resource Tonnes
(Measured & Indicated) |
Surface | 21.8 | 53.2 |
Underground | 115.2 | 113.5 |
Combined Total | 137.0 | 166.7 |
The Run of Mine (ROM) surface potentially mineable tonnes are significantly lower than the surface resource identified above. This difference is explained by the fact that much of this resource is higher strip ratio and higher cost relative to underground mining methods. The ROM underground tonnes exceed the geological resource estimate because the mining layout includes a small amount (1.7Mt) of Inferred tonnes.
Coal Processing
ROM coal will be crushed and sent to a coal washery where ash will be removed through heavy media separation of the coarse fractions and floatation for the fines fractions. Wash plant yields have been estimated on average at 68% for surface mined coal and 62% for underground mined coal. Individual yield and indicative clean coal specifications are presented in more detail in Section 13 of the Carbon Creek Report. The clean coal will be dried in a fluidized bed dryer to approximately 6% moisture and stored in covered storage to keep it dry until shipment.
Cardero Resource Corp. | |
Form 51-102F1 | |
Management Discussion & Analysis | |
Year ended October 31, 2011 | Page 11 |
Production Volume and Schedule
Annual production is based on the mine plans described in Section 16 of the Carbon Creek Report. The surface mine will begin operations first, with the underground mine beginning operations two years after the surface mine. This allows time to develop an area to access the underground mineable coal seams. The combined mining operation is planned for 30 years excluding pre-production development and construction time.
The surface mine is projected to begin production at 3.1M ROM tonnes per annum (tpa) and maintain this level for 7 years. The expected wash plant yield of 68% results in 2.1Mtpa (Million tonnes per annum) saleable coal from the surface mine. This production from surface mining is expected to yield 14.8Mt saleable over the seven year period (years 1- 7).
The underground mine is expected to begin production in the third year of mine operations at .59Mtpa ROM increasing to the steady state level of 4.7Mtpa ROM by the beginning of the eighth year of mining operations. The expected wash plant yield of 62% results in 2.9Mtpa saleable from the underground mine. The underground mine is assumed to operate 28 years producing 115.2M ROM tonnes and 71.4M saleable tonnes. This production schedule depletes the measured and indicated underground mineable coal tonnes shown above in Table 1.4.
Transportation
Clean coal will be loaded into highway type coal haulers operated by a trucking contractor and hauled approximately 69km to a rail loadout on the CN railway. The coal will be offloaded into a bottom-dump hopper and conveyed to a twin dome covered storage structure. Clean coal will be drawn from beneath the storage piles onto a reclaim conveyor and loaded through a batch weighing system into unit trains. The coal will be transported to the ports of Vancouver and/or Prince Rupert for loading onto ships for transport to the Pacific Rim markets. The clean coal will be exposed to the elements during train transport and while stockpiled temporarily at the port and is expected to increase in moisture content to about 8%m, which is the preferred maximum for ocean shipping.
Capital Costs
Assumptions regarding capital expenditures are detailed in Section 21 of the Carbon Creek Report. All dollar values throughout the Carbon Creek Report are in US$. Pre-production capital requirements total $301M and include coal handling, coal preparation, train loadout facilities, surface facilities, site access and power, and mine development and contingency. All major surface and underground mining equipment is assumed to be leased with a seven year lease term at 4.5% and a 20% residual. The total value of the mining equipment being leased is $151M. Annual lease payments at full production for surface mining total $12.3M and $9.6M for underground.
Total capital excluding leased equipment is $504M over the LOM. Lease payments for mining equipment total $321M over the LOM.
Manpower
Manpower requirements to operate and maintain the surface and underground mines and coal processing plant are shown in Tables 1.5 and 1.6.
Cardero Resource Corp. | |
Form 51-102F1 | |
Management Discussion & Analysis | |
Year ended October 31, 2011 | Page 12 |
Table 1.5 Manpower Requirements Surface Mine and Four Underground Units (through year 7)
Area | Hourly Workers | Management | Totals |
Surface Mine | 190 | 28 | 218 |
Underground Mine | 220 | 61 | 281 |
Prep Plant | 62 | 11 | 73 |
Totals | 472 | 100 | 572 |
Table 1.6 Manpower Requirements
Eight Underground Units (Year 8 through Year 30)
Area | Hourly Workers | Management | Totals |
Underground Mine | 432 | 98 | 530 |
Prep Plant | 62 | 11 | 73 |
Totals | 494 | 109 | 603 |
Operating Costs
Operating costs have been estimated for the surface and underground mines based on required equipment hours, labour hours and materials and supplies. These costs are shown in Table 1.7 on a unit basis for each mine and the coal handling and preparation plant (CHPP).
Table 1.7 Cash Operating Costs
Cost Area | $/ROM tonne | $/Clean tonne |
Surface Mining | 30.62 | 50.77 |
Underground Mining | 31.86 | 57.68 |
Coal Handling & Prep | 3.90 | |
Sub-Total ( Includes equipment lease payments) | 60.76 | |
Indirect Costs | 10.51 | |
Total Cash Costs | 71.27 |
Economic Results
Norwest prepared an economic model in US$ that captures direct costs, including labor, equipment, materials, production taxes and royalties. Indirect costs including corporate overhead, mineral tax and property tax were added to the model along with depreciation of purchased equipment and facilities. A cash flow calculation was prepared on an after tax basis using an average FOB price of $185 per saleable tonne and an average clean coal production of 2.9Mtpa. Clean coal production increases from 2.1Mtpa to 3.2Mtpa over the first seven years of production and then averages 2.9Mtpa for the remaining mine life of 23 years. The first seven years includes surface mine production and the ramp up of underground mining. After seven years, the property is mined by underground methods only.
Pre-production cash outflows total $301M over the estimated three year development and construction period. Cash flow is positive once production begins and payback occurs by the end of the third year of production or six years after the initial cash outflow. After payback and providing for the net profits interest, cash flow averages $115M per year for a total net cash flow of $3.1B over the life of the mine for Carderos 75% interest.
Cardero Resource Corp. | |
Form 51-102F1 | |
Management Discussion & Analysis | |
Year ended October 31, 2011 | Page 13 |
The internal rate of return for Carderos 75% interest in the Carbon Creek Joint Venture is approximately 29%. Net present values at 8%, 10% and 12% are shown in the Table 1.8.
Table 1.8 NPV Results Carderos 75% Interest ($millions)
Interest Rate | 8% | 10% | 12% |
NPV | $752 | $551 | $408 |
The internal rate of return for the entire property is approximately 35.1% . Net present values at 8%, 10% and 12% are shown in Table 1.9.
Table 1.9 NPV Results 100% Interest ($ Millions)
Interest Rate | 8% | 10% | 12% |
NPV | $1,070 | $800 | $605 |
The Carbon Creek Report is preliminary in nature, and includes inferred mineral resources. Inferred mineral resources are considered too speculative geologically to have technical and economic considerations applied to them that would enable them to be categorized as mineral reserves. Mineral resources that are not mineral reserves do not have demonstrated economic viability. Accordingly, there can be no certainty that the results estimated in the Carbon Creek Report will be realized.
Sensitivity Analysis
Sensitivity of the economics regarding coal sales price, direct mining costs and capital expenditures were evaluated. The results are summarized in Table 1.10.
Table 1.10 Sensitivity Analysis ($millions)
IRR | NPV at 8% | NPV at 10% | NPV at 12% | |
Base Case at $185 | 29.3% | $752 | $551 | $408 |
Coal Sales at $270 | 46.3% | $1,755 | $1,335 | $1,033 |
Coal Sales at $141 | 16.1% | $229 | $142 | $79 |
10% Increase in Direct Mining Costs | 28.6% | $696 | $510 | $377 |
10% Increase in Capital Costs | 28.6% | $753 | $551 | $407 |
Given the high margins, the project is more sensitive to changes in coal prices than it is to changes in direct mining costs and capital costs. The 10% increase in capital cost does not result in any significant change in NPV because it delays the effect of the net profits interest.
Cardero Resource Corp. | |
Form 51-102F1 | |
Management Discussion & Analysis | |
Year ended October 31, 2011 | Page 14 |
Table 1.11 summarizes the key results of the Carbon Creek Report.
Table 1.11 Carbon Creek Project Summary
Resource Measured & Indicated | Mt | 166.7 |
Resource Inferred | Mt | 167.1 |
Underground Potentially Mineable Tonnes | Mt | 115.1 |
Mean Plant Recovery | % | 62% |
Underground Clean Coal Tonnes | Mt | 71.4 |
Surface Potentially Mineable Tonnes | Mt | 21.8 |
Mean Plant Recovery | % | 68% |
Surface Clean Coal Tonnes | Mt | 14.8 |
Total Clean Coal Tonnes Produced | Mt | 86.2 |
Surface Mining Minimum Seam Thickness | M | 0.6 |
Surface Mining Maximum strip ratio | Ratio | 12.5:1 |
Underground Mining Minimum Seam Thickness | M | 1.2 |
Full Production Rate Clean Coal per Year | Mt/yr | 2.9 |
Pre-production Capital Costs | M$ | 301 |
Sustaining Capital LOM | M$ | 203 |
Value of Leased Equipment LOM | M$ | 151 |
Surface Mine OPEX ROM Basis | $/t | 30.62 |
Underground Mine OPEX ROM Basis | $/t | 31.86 |
Surface Mine OPEX Clean Coal Basis | $/t | 50.77 |
Underground Mine OPEX Clean Coal Basis | $/t | 57.68 |
Processing OPEX | $/t | 3.90 |
Average direct mine costs (incl. equipment lease) Clean Coal Basis | $/t | 60.76 |
Haul, Rail & Port Costs | $/t | 42.42 |
FOB Price Long-Term Base Case | $/t | 185 |
Gross Revenue LOM | M$ | 15,952 |
Operating Costs LOM | M$ | 6,145 |
Pre-Tax Operating Cash Flow LOM | M$ | 6,149 |
Post-Tax NPV 8 (75% Basis) | M$ | 752 |
Internal Rate of Return (75% Basis) | % | 29.3 |
Post-Tax NPV 8 (100% Basis) | M$ | 1,070 |
Internal Rate of Return (100% Basis) | % | 35.1 |
Total Undiscounted Post-Tax Cash Flow (75% Basis) | M$ | 3,113 |
Conclusions
Based on the results of the Carbon Creek Report, Norwest has reached the following conclusions:
1. |
There are sufficient potentially mineable tonnes of metallurgical grade coal in the Carbon Creek resource area to produce approximately 2.9Mtpa saleable coal for a 30 year period. | |
2. |
No fatal flaws have been identified at this stage of project development. |
Cardero Resource Corp. | |
Form 51-102F1 | |
Management Discussion & Analysis | |
Year ended October 31, 2011 | Page 15 |
3. |
Pre-production capital costs, estimated at $301M will be required to bring this project into production. Additional capital, including replacement of $203M will be required to sustain operations over the remaining life of the mine. | |
4. |
Operating costs per tonne of clean coal average $71.27. | |
5. |
At a conservative price for metallurgical grade coal of $185, this Project will generate positive cash flows and achieve an internal rate of return (IRR) on investment of 29.3%. |
Recommendations
Development Drilling
The results of the 2011 drilling program should be included in the geological database and a new geological model produced. This will provide a better mine planning base as well as indicate where future development drilling is needed to increase confidence in the resource estimates.
Mine Planning Refinement
Additional refinement of the geologic model along with a detailed mine plan is recommended and will yield a revised and more accurate recoverable reserve base if reserves are defined in the future. This work should be completed at the Prefeasibility level of project evaluation. Optimum production plans and methods should be analyzed. One example for further study is to examine surface mineable coal extractable by contour and highwall mining methods. Highwall mining generally has proven prudent in resource recovery and cost efficiency. Further evaluation can provide insight into the applicability of highwall mining at this property.
CHPP Design and Construction
Prior to proceeding with the project for detailed design and construction, Norwest recommends that additional studies be performed to better characterize the coals to ensure proper equipment design. The best available information and best practices were implemented in the design of the system, although additional information will supplement the database for final design.
Additional studies and recommended data include:
Geotechnical Studies
Geotechnical sampling and detailed core logging should be conducted in conjunction with any drillcore activities in order to build a current rock mechanics database. Most of this work is already underway in the 2011 drilling program.
A full investigation of the foundation material around the plant and surface facilities area as well as the waste impoundment area is required. Anecdotal information was used in this design study using best practices and information from similar projects in the area, although site construction will require further studies. Detailed geotechnical data is being collected as part of the 2011 field program.
Cardero Resource Corp. | |
Form 51-102F1 | |
Management Discussion & Analysis | |
Year ended October 31, 2011 | Page 16 |
Water Supply - Hydrology
Additional work on the property should include well completions and pump tests for defining groundwater characteristics and establishing monitor wells for baseline permitting data.
A water recovery and aquifer study will be required prior to project implementation. For this study, it was assumed that a sufficient supply will be available.
Thermal Dryer
Research Turbo dryer as a possible lower cost option to the fluidized bed coal dryer.
The Company cautions that the foregoing economic analysis ("PEA") is only preliminary in nature, and is based on technical and economic assumptions which will be evaluated in further studies. The PEA is based on the current (as at October 1, 2011) Carbon Creek estimated resource model, which consists of material in both the measured/indicated and inferred classifications. Inferred mineral resources are considered too speculative geologically to have technical and economic considerations applied to them. The current basis of project information is not sufficient to convert the mineral resources to mineral reserves, and mineral resources that are not mineral reserves do not have demonstrated economic viability. Accordingly, there can be no certainty that the results estimated in the PEA will be realized.
Sheini Hills Iron Project, Ghana
Information in this MD&A regarding the Sheini Project is based on information provided by the technical report dated January 18, 2012 entitled "Technical Report, Sheini Hills Iron Project, Ghana, Africa" (the "Sheini Report") prepared by Keith J. Henderson, EurGeol . The following summary is from the Sheini Report and the detailed disclosure in the Sheini Report is incorporated into this MD&A by reference. Readers are encouraged to review the entire Sheini Report, which is filed on SEDAR at www.sedar.com.
Property Description and Location
The Project is located in the Zabzugu-Tatale District in the Northern Region of the Republic of Ghana. The Project area ("Project Area") consists of three contiguous prospecting licences ("Prospecting Licenses") covering a cumulative licence area of 397.5 square kilometres. The Government of the Republic of Ghana acting by the Ministry of Lands and Natural Resources has issued a licence document dated December 8, 2011 for each of the three Prospecting Licences (Sheini North, Sheini and Sheini South).
The Prospecting Licences were issued to Emmaland Resources Limited ("Emmaland"), a local Ghanaian company. Cardero Ghana Ltd. ("Cardero Ghana"), an indirect wholly owned Ghanaian subsidiary of Cardero, has entered into three separate joint ventures (one for each Prospecting License) with Emmaland. The object of each joint venture is to explore and, if warranted, develop the lands subject to the relevant Prospecting Licence. The effective date for each of the joint venture agreements is December 12, 2011.
Under the three joint ventures, Cardero Ghana will have the right to earn a 100% working interest in each Prospecting Licence, subject to (a) a 10% NPI (net profit interest) in favour of Emmaland and (b) a 10% fully carried interest, in favour of the Government of Ghana, in the portions of the licence areas that become the subject of one or more mining licences subsequently issued to Emmaland. Cardero Ghana will have the right to purchase the 10% NPI held by Emmaland in a joint venture at any time for an amount representing the net present value thereof, as calculated by an independent engineering firm, or such other amount as is acceptable to Emmaland. There are no other royalties or back-in rights to which the Project is subject.
Cardero Resource Corp. | |
Form 51-102F1 | |
Management Discussion & Analysis | |
Year ended October 31, 2011 | Page 17 |
In order to earn its interest, Cardero Ghana is required to fund all expenditures under each of the particular joint ventures and make cash payments to Emmaland totalling USD 16,600,000. To date, USD 6,450,000 million has been paid in scheduled payments and advances.
Each Prospecting License outlines a required work program and an expenditure commitment based on this work program. The expenditure commitments relate to the initial two-year licence period, ending December 8, 2013, and total USD 9,180,966 for all three Prospecting Licenses.
Accessibility, Climate, Infrastructure, and Physiography
The Project is situated in the eastern part of Ghana's Northern Region, close to the border with Togo and approximately 400 kilometres north of Ghana's capital city, Accra. Tamale, Ghana's second largest city is the regional capital and an administrative centre, as well as the regional transportation hub. Sheini Village lies approximately at the centre of the concession, 20 kilometres southeast of Zabzugu.
Transportation between the main centres of population in the region is mostly by road, although there are reasonable air connections between the regional centres. Tamale is the main population centre in the region with approximately 360,000 people. Sheini Village has a population of between 400 and 500. There are a number of smaller communities south of Sheini with populations of between 100 and 200 people.
The closest railway line in Ghana to the Sheini area is the Accra- Kumasi rail line located approximately 350 kilometres south. The Ghana government has long-term plans to extend the existing railway line to Tamale and Yendi. A rail line exists closer to the Sheini area at Blita in Togo, located approximately 100 kilometres southeast of the Sheini Village. This railway line extends south to the port at Lomé, Togo's capital, and is used primarily for the transport of limestone and phosphates.
In Ghana, the Tema sea port, the largest in the country, is located approximately 390 kilometres south-southwest of the Sheini area and approximately 30 kilometres east of Accra.
A major power line follows the Tamale- Yendi- Zabzugu- Tatale road, which brings power to the towns and villages along this route. Zabzugu, the closest town with electrical power, is located 20 kilometres northwest of the Sheini area.
The Oti River represents the major water source and is located 20 kilometres west of the Sheini area. The river rises in Burkina Faso and forms part of the international boundaries between Benin and Burkina Faso and between Togo and Ghana.
The Northern Region of Ghana is located in the savannah belt with a typical hot, sub-Saharan climate. There are two major seasons—dry and wet. Climatic conditions are not expected to adversely impact exploration activities in the area.
The physical geography of Ghana's Northern Region reflects the geological setting of the area. The landscape surrounding Tamale is generally flat due to the soft sedimentary rocks of the Volta Basin. The landscape becomes more undulating east of Tamale and of the Oti River, suggesting the presence of more resistive rock formations.
Cardero Resource Corp. | |
Form 51-102F1 | |
Management Discussion & Analysis | |
Year ended October 31, 2011 | Page 18 |
The Oti River produces a broad valley with elevations of 8090 metres above sea level in the vicinity of the Sheini area. Toward the Togo border, ridges standing several hundred metres above the surrounding savannah are elongated in a northsouth direction.
Project History
The first detailed exploration work that focused on the iron occurrences around Sheini Village was by E. H. Jacques in the 1950s. His report (1958) summarizing the exploration work was re-printed by Ghanas Geological Survey Department (GGSD) in 2003 (Archive Report No. 85).
According to this report, Jacques and his team carried out geological mapping, technical work, trenching (10 trenches), and diamond core drilling (nine boreholes) along the ridges with iron mineralization from Kandin in the north to the Kubalem area in the south, comprising approximately 35 kilometres of strike length. Jacques describes eight groups of iron-mineralized bodies from this large area.
All of the samples taken during this phase of exploration were assayed for iron and silica only. A small number of samples were also assayed for phosphorous. The results, presented in Jacques report as tables, show iron grades in the range of 30%50% iron, with silica content of usually more than 15% SiO2. The content of phosphorous is usually below 0.2% P2O5.
In the early 1960s, geoscientists from the Soviet Union were invited to Ghana to assist with geological mapping, with prospecting, and with performing numerous specific studies in northern Ghana. The iron occurrences around Sheini Village were studied as part of one of the projects managed by the Soviets. The work included detailed geological mapping, trenching, and drilling. The results were summarized in several reports and some of them have been re-printed by the GGSD. The reports indicate that the exploration was focused mainly on the area northwest, west, and southwest of Sheini Village.
No significant exploration work was done in the Sheini area after the Soviet geologists left Ghana. According to the GGSD, small-scale exploration work has been done by St. Jude Resources Ltd. (Vancouver, BC) in the Sheini North area during 20042006. The exploration was testing the concept that the iron occurrences may be of epigenetic origin, similar to Olympic Damtype Iron Oxide Copper Gold (IOCG) deposits. The St. Jude Resources exploration concession expired in 2006.
In 2008, the Minerals Commission of Ghana granted non-exclusive exploration permits to twelve companies. The size of the non-exclusive exploration permit granted was 178.81 square kilometres, coincident with Emmalands current Sheini Prospecting Licence and part of the Sheini North Prospecting License. The Minerals Commission of Ghana ran a competitive bidding process, with the Prospecting Licences being awarded to the company submitting the winning bid. A report was submitted by each company, including due diligence sampling results (where such work had been done), together with recommendations for multi-phase exploration and ultimate exploitation of the iron mineralization in the Sheini area.
The results of the work together with recommendations for a further exploration program were summarized in the report submitted to the Minerals Commission of Ghana. In December 2011, the Minerals Commission of Ghana granted three Prospecting Licenses to Emmaland covering the Project Area.
Geological Setting
At the regional scale, the Project is located within the eastern part of the West African Craton called the Eastern Pan African Domain. The Project Area is located in the Togo Belt, starting in southeast Niger and running south-southwest to southeastern Ghana, comprising supracrustal sediments and volcanics of probable late Precambrian to early Phanerozoic age. The Togo Belt consists of Buem Formation and Togo Formation. The rocks of the Buem Formation are dominated by east- to southeast-dipping clastic sediments, mainly sandstones, siltstones, shales, and mudstones. Massive chert (silexites), limestones, and dolomites are known from Togo.
Cardero Resource Corp. | |
Form 51-102F1 | |
Management Discussion & Analysis | |
Year ended October 31, 2011 | Page 19 |
The Iron Formation is located mainly within the Ghanaian part of the Buem Formation, but some of the bodies also cross the border into Togo. The iron mineralization is associated with tillites situated near the base of the Buem Formation.
The Iron Formation forms a folded sedimentary unit several hundred metres thick and outcropping along wide ridges (or sets of parallel ridges) running for more than 35 kilometres in a north- south direction. They are composed of a number of horizons varying in lithology, grain size, and mineral composition. The individual horizons of the Iron Formation have a thickness between 20 and more than 100 metres and are inter-bedded with sandstones, siltstones, and probably quartzites. The iron bearing horizons dip 10°- 45°, mainly to the east-southeast (in the Sheini south and Kubalem area) and also to the west in the area west of Sheini Village.
Deposit Type
The observed geological, mineralogical, and geochemical features indicate that the Sheini mineralization fits a Banded Iron Formation ("BIF") model. The wide scale presence of hematite and rarity of magnetite may indicate Hematite-rich Banded Iron Formation ("H-BIF"). More likely however, the low amount of magnetite at surface is probably due to surface alteration (oxidation) of magnetite to hematite (martite). The relationship between hematite and magnetite will be clarified by the planned drilling. Based on similarities to other West African BIFs, the upper, oxidized layer is likely to be 70- 120 metres in thickness. The oxidized layer is likely to be underlain by a magnetite-facies, primary BIF.
Exploration
The initial exploration work in the Sheini area, completed by Emmaland with input from Cardero, was carried out during late 2010 and throughout 2011. The initial phase of work, from late 2010 to mid-2011, was focused on obtaining sufficient data to meet the requirements of the Minerals Commission of Ghana and to successfully win the tender to obtain prospecting licenses over the Sheini area. The second phase of exploration, subsequent to the issue of the three Prospecting Licences to Emmaland in late 2011, has consisted of reconnaissance mapping over new areas to the north and south of the original, non-exclusive exploration licence.
According to the available historical reports, there was extensive exploration carried out in the Sheini area between 1945 and 1980. No maps or tables showing the exact location of the historical workings (trenches and boreholes) remain. For this reason, prospecting was focused on locating these old workings to obtain an overview of the scale of the historical exploration work.
A total of 35 historical trenches, mainly trending east-west with total length of around 2,076 metres, have been located to date. The trenches are situated primarily along the ridges and steep slopes exposing the iron mineralization where access for drilling was difficult. Most of the trenches are oriented in an east- west direction, which is perpendicular to the trend of the iron mineralization.
In addition to the trenches, 18 historical boreholes have been located during prospecting. According to the historical reports, 23 boreholes were drilled between the 1950s and 1970s. It is not clear which of the located collars were drilled by Jacques' team in the 1950s or by the Soviet team in the 1960s. As with the historical trenches, there appears to be very limited data remaining in the archives of the GGSD related to the drilling program.
Cardero Resource Corp. | |
Form 51-102F1 | |
Management Discussion & Analysis | |
Year ended October 31, 2011 | Page 20 |
In total, 29 trenches with an approximate length of 1,552 metres have been cleaned and prepared for sampling to date. One-meter-channel sampling was used to collect samples from the cleaned historical trenches. In total, 656 metres of channel sampling were carried out in 29 cleaned trenches with approximate total trench length of 1,552 metres. These 656 metres of channel sampling represent 659 channel samples. A total of 307 samples were prepared and assayed by ALS laboratory in Kumasi. The rest of the samples (449) are stored securely ready for transport in the future.
The results of the 269 trench samples (excluding blanks and duplicates) adequately confirm the findings presented by historical explorers. The results also confirm the field geological and mineralogical observations that BIF, due to its composition, grain size, and texture, is typically higher grade than Fragmental Iron Formation (Fragmental) (BIF and Fragmental are collectively referred to as the Iron Formations).
TABLE 2.1:Iron Results for Major Iron Formation Lithologies
Lithology | Fe total. (%) | |||
Min. | Max. | Median | Mean | |
Banded Iron Formation (n=105) | 30.98 | 60.08 | 48.05 | 47.50 |
Fragmental Iron Formation (n=155) | 29.03 | 55.04 | 38.33 | 38.84 |
Fragmenta lIron Formation (weathered) (n=9) | 16.51 | 25.46 | 20.07 | 20.55 |
Sample Analysis & QA/QC
The primary laboratory used for preparation and analysis of samples was the ALS laboratory at Kumasi, Ghana. Dr. Karel Maly of Aurum Exploration Services, Ireland (who was retained by Emmaland), visited the laboratory in 2011 to ensure that all aspects of sample preparation and analysis were satisfactory. The ALS is a global network of laboratories that operates to the highest international standards.
At the laboratory, the samples were crushed, pulverized, and assayed. Lithogeochemical analysis using the Lithium Borate Fusion and ICP-AES was used by ALS (code ME-ICP06) to determine the major elements oxides (SiO2, Al2O3, Fe2O3, CaO, MgO, Na2O, K2O, Cr2O3, TiO2, MnO, P2O5, SrO, BaO, and LOI).
No Certified Reference Material (CRM) was acquired and no CRMs were inserted into the batches of samples sent to ALS for preparation and analysis. The QA/QC procedure required the insertion of field duplicated material (inserted every 11th sample) and field blank material (inserted every 35th sample). The field blank material consisted of white barren quartzite collected from quartzite outcrops northwest of Sheini Village (coordinates 223156E 1015989N).
Prepared pulps for 10% of the assayed samples (29 samples) were sent to OMAC Laboratories in Ireland (OMAC) for analysis and comparison with the ALS laboratory in Ghana. At OMAC, the same analytical method as used by ALS (lithogeochemical analysis using the Lithium Borate Fusion and ICP-AES (code BF/ES)) was chosen to obtain comparable results. Results indicate good correlation of the iron data between the ALS (original) and OMAC (check) laboratories for the samples, with a slight high bias (~2%) in the OMAC results. Five check samples, however, exhibit more than 10% relative difference, and all have lower Fe2O3 results in the check assays (OMAC). These samples are currently being re-run by OMAC in order to discern whether this may have been an intra-batch analytical error at the laboratory. This issue notwithstanding, the overall quality of the analytical data is considered to be good.
Cardero Resource Corp. | |
Form 51-102F1 | |
Management Discussion & Analysis | |
Year ended October 31, 2011 | Page 21 |
Recommendations
Cardero Ghana, as operator of the Sheini Hills Joint Venture, has exploration expenditure commitments of $9.18 million to be incurred by December 8, 2013. This minimum expenditure commitment is a sum of three separate $3.6 million commitments, relating to each of the three Prospecting Licences.
A $19.3 million exploration program, which excludes joint venture payments, is recommended for the upcoming period ending December 8, 2013. A preliminary budget of $5.79 million is recommended to move the project through Phase I drilling and metallurgical testing in 2012.
Cardero Ghana has already signed contracts with independent and reputable consultants to:
Future exploration should include:
Longnose Titanium Project, Minnesota, USA
Information in this MD&A regarding the Longnose Titanium Project is based on information provided by the technical report dated January 27, 2012, effective January 19, 2012, entitled "Technical Report on the Longnose Ilmenite Project, Minnesota, USA" (the "Longnose Report") prepared by SRK Consulting (Canada) Inc. ("SRK"). The following summary is from the Longnose Report and the detailed disclosure in the Longnose Report is incorporated into this MD&A by reference. Readers are encouraged to review the entire Longnose Report, which is filed on SEDAR at www.sedar.com.
Property Description and Location
The lands making up the Project ("Project Area") are located in northeastern Minnesota in St. Louis County, Township 59N, Range 13W, Section 30 and is centered at: (Coordinate system: Universal Trans Mercator, Zone 15 North, North American 1983 Datum) 572200 metres East, 5268300 metres North.
Cardero's indirect wholly owned subsidiary, Cardero Iron Ore (USA) Inc. ("CIOUS"), holds an option to acquire up to an 85% interest in the Project by incurring USD 1,850,000 in expenditures (to acquire 70%) and delivering a feasibility study (to acquire an additional 15%). Upon CIOUS earning its 70% or 85% interest, the optionor of the Project has the option to maintain its 30% or 15% interest and enter into a joint venture with CIOUS, or to convert its working interest to either a 10% or 5% net profits interest. Advance royalties and production royalties are payable to the underlying property lessors.
Cardero Resource Corp. | |
Form 51-102F1 | |
Management Discussion & Analysis | |
Year ended October 31, 2011 | Page 22 |
CIOUS has all required licenses, permits and registrations in place to carry out exploration and resource definition drilling. Additional permits will be required in the future to advance to the next stage.
Accessibility, Climate, Local Resources, Infrastructure and Physiography
Topographic relief is generally low, and the surface is flat-laying. Elevations range between 465 and 490 metres (m) above mean sea level. The ground cover at the Project Area is a mixture of Palustrine, forested wetlands (Cowardin classification system), and higher dry forested ground. Overburden, consisting of glacial till, is present and the depth to bedrock is approximately 3 m to 30 m from surface. Accessibility is excellent, with the Project located off of a paved county highway via a well maintained gravel road.
The climate in northeastern Minnesota is mid-continental. Winter conditions usually begin in mid-December and last until mid-March, with frozen ground beginning in late December to early January. The spring thaw usually begins in mid-March to late April, with stable, dry spring-summer-fall conditions occurring from late April to mid-December.
The population of Aurora, Minnesota (the nearest major population centre) is approximately 1,850, and the nearby city of Hoyt Lakes (8 km, 5 miles, east of Aurora), Minnesota has a population of approximately 2,000 people.
The infrastructure in northeastern Minnesota related to mining activities is excellent, with low cost electricity, railroads, paved state and county highways, international shipping ports, mining professionals, mining vendors, and trained labor all readily available. International shipping ports are located along the north shore of Lake Superior, including Duluth/Superior, Silver Bay, Taconite Harbor, and Two Harbors, with linked rail systems to all.
History
The Project Area was the subject of historical exploration processes between 1950 and 2008. The deposit was initially discovered by Bear Creek Mining, while exploring for copper-nickel (Cu-Ni) deposits.
Twelve (12) drill holes were completed by American Shield Corp., Bear Creek Mining, and Nicor during the 1980s and 1990s.
The Project Area was held by a series of mining companies including American Shield and BHP Minerals International Inc. (BHP). BHP held the Project Area for some time in the 1990s. Most of the work completed by BHP centered on metallurgy, and TiO2 recovery.Initial metallurgical testing focussed on the production of an ilmenite concentrate. Further upgrading analysis was completed as well, the first of which involved a smelting and sulfation-leaching process developed by the US Bureau of Mines. Their second investigation involved an oxidation-reduction roast followed by chemical leaching, using a process called the Murso process.
Several large (1.5 tonne to 60 tonne) bulk samples were utilized to complete the metallurgical testwork. The larger samples were collected from out crop of the Longnose deposit, while smaller test samples were taken from core. The University of Minnesota, Natural Resources Research Institute, Coleraine Minerals Research Laboratory houses what remains of both bulk samples.
Cardero Resource Corp. | |
Form 51-102F1 | |
Management Discussion & Analysis | |
Year ended October 31, 2011 | Page 23 |
Geological Setting and Mineralization
The Project Area is located within the Superior Province of the Canadian Shield, and is underlain by intrusive rocks generated during the formation of the Midcontinent Rift. Mineralization is hosted by Oxide-bearing Ultramafic Intrusions (OUI or OUIs) that intruded into layered series intrusions of the Duluth Complex. OUIs are dominantly composed of coarse-grained to pegmatitic pyroxenite, peridotite, and dunite that contain approximately 10-40% titanium-iron oxide mineralization, dominantly as ilmenite with lesser titaniferous magnetite. Typically, zones of massive and semi-massive oxide are also present throughout the stratigraphy. Locally, some OUIs also contain abundant copper-nickel sulfide mineralization as well; however, this style of mineralization has not been intersected within the Project Area. Most OUIs occur along the western margin of the southern portion of the Duluth Complex, and display numerous shapes (sheet-, funnel-, dike- and pipe-like geometries) and inclinations (flat-lying, moderately-dipping, and sub-vertical).
The Longnose OUI is geologically interpreted to be a late-stage intrusion that cut early Duluth Complex stratigraphy, and is associated with magmatism generated by the 1.1 billion year old Midcontinent Rift system.
The Longnose OUl contains disseminated, semi-massive, and massive ilmenite and titaniferous-magnetite mineralization. The Project Area hosts a single intrusion which is at least 150 m thick, dipping shallowly to the southeast.
Mineralization at the Project Area dominantly consists of disseminated to net-textured, medium to coarse-grained, Ilmenite, titaniferous magnetite and magnetite. Olivine-rich ultramafic rocks (peridotite, feldspathic peridotite & dunite) host the majority of the titanium-iron oxide mineralization found in the Longnose OUI, and will often be net-textured with oxide minerals interstitial to silicates. Visual modal mineral calculations generally estimate that titanium-iron oxide minerals compose 15-35% of the peridotitic and dunitic rocks at the Project. Numerous massive and semi-massive titanium-iron oxide horizons or zones (45-100% titanium-iron oxide) have been intersected in drill core. These massive and semi-massive oxides seem to be dominantly hosted by peridotite and dunite, though they have been intersected within zones of pyroxenite as well. It is clear that the main mineralized intrusion at the Project is a thick, laterally and vertically continuous intrusion dominantly composed of a mixture of oxide-bearing peridotite, oxide-bearing dunite, massive oxide, and semi-massive oxide with between 15% and 100% titanium-iron oxide mineralization.
Exploration
Exploration at the Project has included surface sampling, geophysics and diamond drilling.
Twenty-seven diamond drill core holes have been drilled on the Project Area, including six holes drilled by CIOUS in 2010, and nine holes drilled by CIOUS in 2011. Historic drilling includes 12 drill holes completed by a variety of operators in the 1980s and 1990s. The historic drill core has been re-sampled by CIOUS during 2009 and 2010, where such material was available. In total, the twenty-seven holes totalled 5,217 m, with 1,979 m from historic holes and 3,238 m from CIOUS drill holes.
Drill hole spacing for the Project is variable (drill holes are not on a regular grid) between 50 m and 100 m. Drill core has been sampled in 1 m to 6 m intervals.
Exploration data has focussed on the geology and titanium (Ti) and iron (Fe) analytical sample data; however, other elements should be reviewed and potentially estimated in future analysis. Titanium was measured as TiO2 and iron was measured as Fe2O3.
Cardero Resource Corp. | |
Form 51-102F1 | |
Management Discussion & Analysis | |
Year ended October 31, 2011 | Page 24 |
Sample Preparation, Analyses and Security
CIOUS has utilized a thorough and robust procedure for sampling, sample preparation, analysis and security.
Procedures for core handling, logging, sampling and sample shipping were well thought out and well implemented. Analysis was completed by ALS, one of the largest commercial laboratories in the world. A robust program of quality assurance and quality control samples was implemented and met or exceeded industry standard procedures. Sample security and chain of custody documentation was maintained throughout the process and was thoroughly reviewed by SRK.
Data Verifications
Exploration data verification for the Project has included a site visit by SRK, enforced database structures, analytical quality assurance and quality control (QA/QC) samples, independent sampling and assay checking.
SRKs Wayne Barnett, Pr.Sci.Nat visited the site in July 2009 and Mike Johnson, P. Geo, visited the site in March 2010. During these site visits, SRK verified drill hole locations, drilling, logging and sampling procedures, security and documentation. SRK also collected independent sampling during these site visits and confirmed the TiO2 and Fe2O3 values for five Longnose samples.
CIOUS utilized an onsite database which validated the data entry process as it was being completed and reduced clerical errors. As well, Carderos head office checked the data upon import into their main exploration database in order to minimize data errors.
SRK verified 92% of the assay database by downloading these records directly from the commercial laboratory and checking them against the Mineral Resource database.
CIOUS completed QA/QC sampling (blanks, standards, duplicates) totalling 393 samples, equal to 23% of the total samples. SRK has reviewed the QA/QC sample insertion rate and results, and concluded that the analytical data should be reliable.
Mineral Processing and Metallurgical Testing
Most processing and metallurgical testwork at the Project was completed prior to CIOUS involvement in the property.
Historical metallurgical testwork indicated that there is a reasonable chance that a saleable ilmenite and magnetite concentrate could be created from the Longnose deposit. Metallurgical testing regarding the Longnose deposit has focussed primarily on optimizing ilmenite recovery and creation of the ilmenite concentrate.
The historic metallurgical testwork indicates a relatively simple processing flow sheet. It would include crushing the material to a selected size and processing the ore by density and then by magnetic properties. The density separation would remove the silicates from the much more dense oxides. The oxides would then be split into a non-magnetic / paramagnetic fraction as well as a magnetic fraction. Magnetite would partition into the magnetic fraction, while the ilmenite would partition into the non-magnetic / paramagnetic fraction. The magnetic fraction could be further upgraded to recover some ilmenite that would partition into that fraction. The ilmenite concentrate could then be sold to an external processing site, or could be processed at a newly created process facility as part of a further beneficiation/added value processing project; however, a potential upgrading facility would have very significant capital costs.
Cardero Resource Corp. | |
Form 51-102F1 | |
Management Discussion & Analysis | |
Year ended October 31, 2011 | Page 25 |
Historical testwork has shown that the concentrates created from the Longnose rock can be processed into a potentially saleable concentrate; however, the quality of the concentrate may be adversely affected by the high magnesium content of the ilmenite.
CIOUS has completed very limited metallurgical testing at this stage. Recent work includes only Davis Tube tests, which are used to determine the proportion of material which is magnetic and which is commonly associated with magnetite.
CIOUS will have to complete further metallurgical work for the Project if further economic analysis is contemplated.
Mineral Resource Estimates
In 2011, SRK was retained by Cardero to complete a Mineral Resource for the Longnose OUI deposit, as well as update the technical report for the Project.
SRK utilized Gemcoms Surpac® version 6.2 and several other software packages to complete the estimation. A comprehensive and validated drill hole database was utilized to complete the analysis. The database includes twenty-seven drill holes; however, only twenty-four were utilized in the estimation process due to issues with resampling of some historic drill holes. All 2010-11 drill hole data included multi-shot downhole surveys; however, historic holes did not have downhole surveys. The estimation process utilized 1681 samples out of the databases 1956 samples. A total of 855 specific gravity measurements were utilized to estimate bulk densities. Estimation of metal grades utilized regularized 2 m composites.
Two geological domains were defined for the estimation process. The domains were defined by the presence of peridotite or pyroxenite oxide bearing rocks. The peridotite domain has higher olivine content and encompasses higher TiO2 grades near the core of the deposit. The pyroxenite domain includes higher pyroxene content, has lower TiO2 grades and is generally found at the periphery of the deposit. The geological domains are generalized, with some instances of other rock types within each domain.
The estimations were made into a threedimensional block model with 20 m by 20 m by 10 m block size, with sub-blocking to 5 m by 5 m by 2.5m. Estimated parameters included specific gravity, TiO2 and Fe2O3 grades.Metal grade interpolation was completed through three passes using increasingly larger search ellipses and lower restrictions on sample inclusion in each pass. Search ellipses were generally flat pancakes with the shortest direction of continuity sub-vertically and the longest in the northwest-southeast direction. The search ellipse orientations, which dip 20 degrees to the east, were based upon variography completed on the 2 m composite data. Ordinary kriging (OK) was used to estimate TiO2 and Fe2O3, while inverse distance squared (ID2) was used to estimate the specific gravity data. Mineral resources were classified in accordance with definitions provided by the Canadian Institute of Mining (CIM) as stipulated in NI 43-101.
In order to quantify the Mineral Resources requirement of reasonable prospects of economic extraction, the block model was subjected to conceptual mining limits using an open pit optimization program. The process uses reasonable mining and processing parameters to define a conceptual pit within which the material with reasonable economic prospects should be contained. For the Project optimization runs, it was assumed that all TiO2 is contained in the mineral Ilmenite. Fe2O3 values were modified to reflect the amount of iron taken up by ilmenite as well as the component estimated to be within silicates. However, more detailed testing is required in order to properly quantify the magnetite content of the resource, so iron was not given any value in the resource pit optimization limits. Historic metallurgical data indicates that a very high percentage of the TiO2 is contained within ilmenite, with a relatively small component in titaniferous magnetite and silicates.
Cardero Resource Corp. | |
Form 51-102F1 | |
Management Discussion & Analysis | |
Year ended October 31, 2011 | Page 26 |
The Mineral Resource Statement for the Project is presented in Table 3.1 below.
Table 3.1: Mineral Resource Statement*, Longnose Project, Minnesota, USA, SRK Consulting (Canada) Inc, effective date, January 19, 2012.
Category (Open Pit**) |
Estimated Quantity | Estimated Grade | |
TiO2 | Adjusted Fe2O3*** | ||
Mt | % | % | |
Indicated | 58.1 | 16.6 | 18.8 |
Inferred | 65.3 | 16.4 | 19.4 |
Mineral resources are reported in relation to a conceptual pit shell. Mineral resources are not mineral reserves and do not have demonstrated economic viability. All figures are rounded to reflect the relative accuracy of the estimate. All composites have been capped where appropriate. |
* Open pit (near surface) Mineral Resources are reported at a cut-off grade of 8% TiO2. Cut-off grades are based on a price of US$170 per tonne of Ilmenite back calculated to TiO2 and recoveries of 70 percent, without considering revenues from other metals including Fe. |
** Reported Fe2O3 has been lowered to reflect the amount of Fe estimated contained within ilmenite and silicates, based upon Davis Tube testing. At this time, accurately quantifying the amount of magnetite contained within this estimate is not possible. |
As stated above, the Mineral Resource has been quantified in terms of TiO2 and Fe2O3, the analytical components captured for assays of titanium and iron. The Fe2O3 values have been reduced to reflect Fe found within silicates and within the ilmenite associated with the TiO2, however accurately quantifying magnetite is not possible at this time as further mineralogical work will be needed. In any potential mining scenario, the Project would produce ilmenite (FeTiO3) and may produce titaniferous magnetite (TiFe2O4) and magnetite (Fe3O4) as a by-product. Using CIOUSs Davis Tube test results, historic mineralogy and metallurgy reports, reasonable assumptions regarding mineralogy of the deposit, estimates of the quantity of ilmenite was made. The contained ilmenite in the Mineral Resource is summarized in Table 3.2.
Table 3.2: Summary of Longnose Project ilmenite content within the Mineral Resource
Category | Quantity | Ilmenite Grade | Contained Ilmenite |
(FeTiO3) | |||
Mt | % | Mt. | |
Indicated | 58.1 | 31.5 | 18.30 |
Inferred | 65.3 | 31.2 | 20.40 |
Cardero Resource Corp. | |
Form 51-102F1 | |
Management Discussion & Analysis | |
Year ended October 31, 2011 | Page 27 |
Interpretation and Conclusions
The Longnose deposit is an ultramafic intrusion significantly enriched in ilmenite and magnetite oxides. The deposit is flat lying and provides a geometry that should be amicable to open pit mining. The Longnose deposit is approximately 700 m long in the north-south direction, 600 m wide in the east-west direction and 150 m thick.
The Longnose OUI is geologically interpreted to be late-stage intrusion that cuts early Duluth Complex intrusives, and is associated with magmatism generated by the 1.1 billion year old Midcontinent Rift system. The drilling program conducted in 2010 and 2011 by CIOUS confirmed strong titanium-iron-oxide mineralization at the Project Area, hosted within troctolitic rocks of the Partridge River intrusion. The Longnose intrusion is stratigraphically simple, consisting of a core of olivine-rich dunitic and peridotitic rocks containing disseminated titanium-iron oxide mineralization with horizons of massive and semi-massive oxide throughout, that is enveloped by pyroxenitic rocks, which contain much less mineralization. Disseminated titanium-iron oxide mineralization is continuous, and the horizons of massive and semi-massive oxide may link up to form layers that dip moderately coincident with dip of the overall intrusion.
The exploration data for the Project is robust; viable to support the Mineral Resource defined within this document. The data has been well validated and the analyses have been found to be repeatable. Overall, correlation of the mineralization between drill holes is reasonable and it is expected that the Mineral Resource accurately represents the TiO2 and Fe2O3 mineralization. Based on the TiO2 estimates, the mineralogy of the deposit and the Davis Tube test results, the amount of ilmenite and magnetite has been quantified.
Ilmenite and, to a lesser extent, titaniferous magnetite is used as a source material for titanium which is used to make paint pigment and as a metal alloy. Rutile is the ideal source material for titanium as it contains nearly twice as much Ti as ilmenite; however, ilmenite is by far the more common source. Most ilmenite is processed from ilmenite sands (secondary ilmenite) however several primary ilmenite mines have been successfully exploited. Processing plants capable of handling ilmenite concentrates are found in Canada, the US and throughout the world.
Ilmenite is an industrial mineral and there are risks and uncertainties associated with this ilmenite resource, many of which are common to industrial mineral deposits. Industrial minerals have special risks that are not typically associated with precious or base metal mines. Special concerns include mineralogy of material, deleterious elements (such as silica, calcium, magnesium and manganese), and special market factors such as market size or proprietary technology. Because of these and other issues, industrial mineral deposits carry additional risk compared to more common metal products. Historic testwork has indicated that the Longnose deposit produces concentrate with less favourable magnesium levels, which may adversely affect the potential value of the concentrate.
Historic tests have indicated that a viable ilmenite concentrate could be created from processing of Longnose material, although higher than ideal magnesium levels may reduce the product price somewhat. The ilmenite could potentially be sold as a concentrate to an existing ilmenite processing plant, as the deposit is amicable to shipping due to its proximity to rail and a short haul to bulk ports on the western shore of Lake Superior. As well, local added-value beneficiation is under consideration by Cardero. This goal of further beneficiation would be to produce a high TiO2 synthetic rutile slag amicable for processing into the paint pigments; however, such processing facilities are capital intensive and further work is required to determine if such a process is viable.
Cardero Resource Corp. | |
Form 51-102F1 | |
Management Discussion & Analysis | |
Year ended October 31, 2011 | Page 28 |
Based upon the significant amount of historical research completed on the Project, a relatively simple processing flow sheet for ilmenite concentrate, a recent increase in demand for ilmenite and the projects close proximity to other bulk mines and inexpensive shipping routes, SRK believes that the Project meets the criteria for having reasonable prospects of economic extraction.
Recommendations
In order to begin to better understand the potential economics of the Project, further work is required. At this stage of the exploration, SRK recommends the following work and expenditures:
a comprehensive mineralogical study of the oxide and sulfide mineralization should be conducted to confirm the specific oxide minerals present throughout the defined mineralization;
metallurgical testwork in conjunction with the mineralogical studies, to assist with better understanding of ilmenite and magnetite recovery, project economic analysis and provide an update to the work completed in the 1990s;
completion of a preliminary economic assessment to assist with further exploration and provide project specific economic criteria;
further study of the other elements, such as vanadium, magnesium and silica contents and how they are distributed through the deposit;
a relatively small infill drilling program consisting of 3-5 drill holes; and,
a small step-out drilling program targeting the southern part of the intrusion consisting of 3-5 drill holes.
A budget to complete the recommended work program is presented in Table 3.3.
Table 3.3: Estimated Cost for the Exploration Program Proposed for the Longnose Project.
Recommendation |
Estimated Cost (US$) |
Mineralogical studies and analytical data | 50,000 |
Metallurgical analysis and testwork | 150,000 |
Preliminary economic assessment analysis | 150,000 |
Geophysical Survey | 30,000 |
Longnose step-out drilling (3-5 holes/900-1500m @ $165/m*) | 200,000 |
Longnose infill drilling (3-5 holes/600-1000m @ $165/m*) | 130,000 |
Acquisition of additional mineral leases/property boundary survey | 40,000 |
TOTAL | 750,000 |
* Drilling cost per meter includes: Site and Trail preparation, drilling, sampling, facility/vehicle lease, and staffing |
Cardero Resource Corp. | |
Form 51-102F1 | |
Management Discussion & Analysis | |
Year ended October 31, 2011 | Page 29 |
Titac Titanium Project, Minnesota, USA
Information in this MD&A regarding the Titac Titanium Project is based on information provided by the technical report dated January 27, 2012, effective January 19, 2012, entitled "Technical Report on the Titac Ilmenite Exploration Project, Minnesota, USA" (the "Titac Report") prepared by SRK. The following summary is from the Titac Report and the detailed disclosure in the Titac Report is incorporated into this MD&A by reference. Readers are encouraged to review the entire Titac Report, which is filed on SEDAR at www.sedar.com.
Property Description and Location
The land making up the Project ("Project Area") is located in northeastern Minnesota in St. Louis County, Township 55N, Range 14W, Section 34, and Township 54N, Range 14W, Section 3. The property is approximately centered at: (Coordinate system: Universal Trans Mercator, Zone 15 North, North American 1983 Datum) 568000 m East, 5228000 m North.
The Project Area interests are held by Cardero Iron Ore (USA) Inc. ("CIOUS"), a wholly owned indirect subsidiary of Cardero, and work on the property is carried on through Cardero Iron Ore Management (USA) Inc., an indirectly wholly owned subsidiary of Cardero. Cardero holds a 100% leasehold interest in the Project Area under a mining lease dated July 1, 2009. The lease is for an initial term of 20 years, subject to extension for up to 20 additional years, and requires annual rental payments until commercial production and thereafter production royalty payments (minimum $200,000/year).
CIOUS has all required licenses, permits and registrations in place to carry out exploration and resource definition drilling. Additional permits will be required in the future to advance to the next stage.
Accessibility, Climate, Local Resources, Infrastructure and Physiography
Topographic relief on the Titac property is generally low, and the surface is flat-laying. Elevations range between 470 m and 490 m above mean sea level. The ground cover is a mixture of Palustrine, forested wetlands (Cowardin classification system), and higher dry forested ground. Overburden, consisting of glacial till, is present and the depth to bedrock is approximately 20 to 30 m ("m") from surface.
Accessibility is excellent, with the Project Area located along a paved county highway.
The climate in northeastern Minnesota is mid-continental. Winter conditions usually begin in mid-December and last until mid-March, with frozen ground beginning in late-December to early-January. The spring thaw usually begins in mid-March to late-April, with stable, dry spring-summer-fall conditions occurring from late-April to mid-December.
The population of Aurora, Minnesota (the nearest major population centre) is approximately 1,850, and the nearby city of Hoyt Lakes (5 miles east of Aurora), Minnesota has a population of approximately 2,000 people.
The infrastructure in northeastern Minnesota related to mining activities is excellent, with low cost electricity, railroads, paved state and county highways, international shipping ports, mining professionals, mining vendors, and trained labor all readily available. International shipping ports are located along the north shore of Lake Superior, including Duluth/Superior, Silver Bay, Taconite Harbor, and Two Harbors, with linked rail systems to all.
Cardero Resource Corp. | |
Form 51-102F1 | |
Management Discussion & Analysis | |
Year ended October 31, 2011 | Page 30 |
History
Exploration of the Project Area, historically known as Section 34, has been limited, though several exploratory bore holes and geophysical surveys have been completed. Six holes were drilled historically (by United States Steel Corp.), and Cardero completed 30 holes in 2010 and 2 holes in 2011. A ground magnetic survey was conducted in the mid-1960s by United States Steel Corp. A small amount of metallurgical testwork was completed by United States Steel Corp. in 1971.
Geological Setting and Mineralization
The Project Area is located within the Superior Province of the Canadian Shield, and is underlain by intrusive rocks generated during the formation of the Midcontinent Rift. Mineralization is hosted by Oxide-bearing Ultramafic Intrusions (OUIs) that intruded into layered series intrusions of the Duluth Complex. OUIs are dominantly composed of coarse-grained to pegmatitic pyroxenite, peridotite, and dunite that contain approximately 15-40% titanium-iron oxide mineralization. Typically, zones of massive and semi-massive oxide are also present throughout the stratigraphy. Locally, some OUIs also contain abundant copper-nickel sulfide mineralization. Most OUIs occur along the western margin of the southern portion of the Duluth Complex, and display numerous shapes (sheet-, funnel-, dike- and pipe-like geometries), and inclinations (flat-lying, moderately-dipping, and sub-vertical).
The Titac OUIs are geologically interpreted to be late-stage intrusions that cut early Duluth Complex stratigraphy, and are associated with magmatism generated by the 1.1 billion year old Midcontinent Rift system.
The Titac OUls contain disseminated, semi-massive, and massive titanium-iron oxide mineralization, dominantly ilmenite (TiFeO3) and magnetite and titaniferous magnetite (Fe3O4, Fe2TiO4). The Project Area contains at least two mineralized OUIs (Titac North and Titac South). Titac North is at least 450 m thick (open at depth) and has a vertical pipe-like geometry. Titac South is at least 490 m thick, and also has a pipe-like geometry.
Exploration and Drilling
Exploration of the Project Area by CIOUS began in 2010. Reinterpretation of the ground magnetic survey conducted by United States Steel Corp. confirmed the presence of multiple titaniferous-iron oxide-bearing intrusions at the Project Area including two large intrusions referred to as Titac North and Titac South. No bedrock is exposed on the Project Area with the result that bedrock mapping has not been undertaken.
Drilling at the Project Area is complex because of the stratigraphy of the Titac intrusions.
During 2010 and 2011, a total of 11,034.4 m were completed for 32 drill-holes, 8 (2685.3 m) of which were drilled at Titac North and 24 (8349.1 m) at Titac South. The drilling confirmed titanium-iron-oxide mineralization at the Project Area and determined that the Titac property contains at least two intrusions with large zones of titanium-iron-oxide mineralization (Titac North and Titac South). All assay results from the 2010 and 2011 drilling campaigns have been received and are included in the Titac Report.
Sample Preparation, Analyses and Security
Cardero has utilized a thorough and robust procedure for sampling, sample preparation, analysis and security.
Cardero Resource Corp. | |
Form 51-102F1 | |
Management Discussion & Analysis | |
Year ended October 31, 2011 | Page 31 |
Procedures for core handling, logging, sampling, and sample shipping were well thought out and well implemented. Analysis was completed by ALS, one of the largest commercial laboratories in the world. A robust program of quality assurance and quality control samples was implemented and met or exceeded industry standard procedures. Sample security and chain of custody documentation was maintained throughout the process and was thoroughly reviewed by SRK.
Data Verifications
Exploration data verification for the Project Area has included a site visit by SRK, enforced database structures, analytical quality assurance and quality control samples, independent sampling and assay checking.
SRKs Wayne Barnett, Pri. Sci. Nat. visited the site in July 2009 and Mike Johnson, P. Geo, visited the site in March 2010. During these site visits, SRK verified drill hole locations, drilling, logging and sampling procedures, security and documentation. SRK also collected independent sampling during these site visits and confirmed the TiO2 and Fe2O3 values for two Titac samples.
Cardero utilized an onsite database which validated the data entry process as it was being completed and reduced clerical errors. In addition, Carderos head office checked the data upon import into their main exploration database in order to minimize data errors.
SRK verified 100% of the assay database by downloading these records directly from the commercial laboratory and checking them against the Mineral Resource database.
Cardero completed QA/QC sampling (blanks, standards, duplicates) totalling 1075 samples, equal to 22% of the total samples. SRK has reviewed the QA/QC sample insertion rate and results and found that they indicate that the analytical data should be reliable. However, analytical standards selection and certain standard results should be more carefully scrutinized for future programs.
Mineral Processing and Metallurgical Testing
Metallurgical test work (Davies Tube tests) was completed on two samples from one of the historical drill holes (26002) on the Project Area in 1972.
The historic metallurgical test work indicates a relatively simple processing flow sheet. It would include crushing the material to a selected size and processing the ore by density and then by magnetic properties. The density separation would remove the silicates from the much more dense oxides. The oxides would then be split into a non-magnetic / paramagnetic fraction as well as a magnetic fraction. Magnetite would partition into the magnetic fraction, while the ilmenite would partition into the non-magnetic / paramagnetic fraction. The magnetic fraction could be further upgraded to recover some ilmenite that would partition into that fraction. The ilmenite concentrate could then be sold to an external processing site, or could be processed at a newly created process facility as part of a further beneficiation/added value processing project; however, a potential upgrading facility would have very significant capital costs.
Cardero has completed very limited metallurgical testing at this stage. Recent work includes only Davies Tube tests, used to determine the proportion of magnetic iron commonly associated with magnetite. Significant further metallurgical work is required for the Project if further economic analysis is contemplated.
Cardero Resource Corp. | |
Form 51-102F1 | |
Management Discussion & Analysis | |
Year ended October 31, 2011 | Page 32 |
Mineral Resource Estimates
In July 2009, SRK was retained by Cardero to complete a Mineral Resource for the Titac OUI deposits, as well as update the technical report for the project.
SRK utilized Gemcoms Gems version 6.3.1 to complete the Mineral Resource estimation. A comprehensive and validated drill hole database was utilized to complete the analysis. The database includes 32 drill holes, 8 of which were drilled in Titac North and 24 of which were drilled in Titac South. Drilling in Titac North was insufficient for the delineation of mineralized domains and resource estimation. The Mineral Resource presented here only includes Titac South. The estimation process utilized 2837 samples out of the databases 3929 samples for Titac South. A total of 855 specific gravity measurements were utilized to estimate bulk densities.
Three geological domains were modelled for the estimation process. The domains were defined by peridotite or pyroxenite dominated oxide bearing ultramafic rocks. A marginal zone of mixed perdidotite, pyroxenite and country rock was also modelled.
The Titac South resources were estimated using GemsTM (a Gemcom software product) block modeling software in multiple passes in 10 x 10 x 10 m blocks. Grade estimates were based on 1.8 m composited samples. Capping of TiO2 and Fe2O3 assays was not applied in any of the three domains. Ordinary kriging was used to estimate TiO2 and Fe2O3. Inverse distance squared was used to estimate the specific gravity data. Mineral resources were classified in accordance with definitions provided by the Canadian Institute of Mining (CIM) as stipulated in NI43-101. All interpolated blocks were classified as Inferred Mineral Resource.
In order to quantify the Mineral Resources requirement of reasonable prospects of economic extraction, the block model was subjected to conceptual mining limits using an open pit optimization program. The process uses reasonable mining and processing parameters to define a conceptual pit within which the material with reasonable economic prospects should be contained. For the Titac Project optimization runs, it was assumed that all TiO2 is contained in the mineral Ilmenite and no value was associated with the Fe2O3 material in order to avoid double counting of the value associated with iron. Historic metallurgical data indicates that a very high percentage of the TiO2 is contained within ilmenite, with a small component in titaniferous magnetite and silicates.
The Mineral Resource Statement for the Project is presented in Table 4.1 below.
Table 4.1: Mineral Resource Statement*, Titac Project,
Minnesota, USA,
SRK Consulting (Canada) Inc, effective date, January 19,
2012
Category | Estimated Quantity | Estimated Grade | |
TiO2 | Adjusted Fe2 O3 *** | ||
Mt | % | % | |
Open Pit** | |||
Inferred | 45.1 | 15.0 | 14.74 |
Mineral resources are reported in relation to a conceptual
pit shell. Mineral resources are not mineral reserves and do not have
demonstrated economic viability. All figures are rounded to reflect the
relative accuracy of the estimate. All composites have been capped where
appropriate.
* Open pit mineral resources are reported at a cut-off grade of
8% TiO2. Cut-off grades are based on a price of US$170 per tonne of
Ilmenite back calculated to TiO2 and recoveries of 70 percent,
without considering revenues from other metals.
**Reported
Fe2O3 has been lowered to reflect the amount of Fe
estimated to be contained in ilmenite based on the assumption that all Ti has
been assigned to ilmenite. At this time, accurately quantifying the amount of
magnetite contained within this estimate is not possible.
Cardero Resource Corp. | |
Form 51-102F1 | |
Management Discussion & Analysis | |
Year ended October 31, 2011 | Page 33 |
As stated above, the Mineral Resource has been quantified in terms of TiO2 and Fe2O3, the analytical components captured for assays of titanium and iron. In any potential mining scenario, the Project would produce ilmenite (FeTiO3) and potentially titaniferous magnetite (TiFe2O4) and magnetite (Fe3O4) as a byproduct. The Fe2O3 values have been reduced to reflect Fe found within the ilmenite associated with the TiO2, however accurately quantifying magnetite is not possible at this time as further mineralogical work will be needed.
Based on the assumption that all Ti is found within ilmenite, the contained ilmenite metal in the Mineral Resource is summarized in Table 4.2.
Table 4.2: Summary of Titac Project ilmenite content within the Mineral Resource
Category | Quantity | Ilmenite Grade | Contained Ilmenite |
(FeTiO3) | |||
Mt | % | Mt. | |
Inferred | 45.1 | 28.5 | 12.9 |
Interpretation and Conclusions
Ilmenite and to a lesser extent titaniferous magnetite is used as a source material for titanium used as pigments and as a metal alloy. Rutile is the ideal source material for titanium as it contains nearly twice as much Ti as ilmenite; however, ilmenite is by far the more common source.
Ilmenite is an industrial mineral and there are risks and uncertainties associated with this ilmenite resource, many of which are common to industrial mineral deposits. Industrial minerals have special risks that are not typically associated with precious or base metal mines. Special concerns include mineralogy of material, deleterious elements (such as silica, calcium, magnesium and manganese), and special market factors such as market size or proprietary technology. Because of these and other issues, industrial mineral deposits carry additional risk compared to more common metal products.
Historic metallurgical tests of the Titac material are very limited. Small scale testing indicates that a viable ilmenite concentrate could be created from processing of Titac material, although higher than ideal deleterious element values, such as magnesium, may reduce the potential ilmenite product price. The ilmenite may be sold as a concentrate to an existing ilmenite processor as the deposit is amicable to shipping due to its proximity to rail and a short haul to bulk ports on the western shore of Lake Superior. As well, local beneficiation could be considered, particularly when other nearby OUI bodies are considered for increased scale. The main hurdle to overcome with future exploitation of the Titac deposit revolves around metallurgical optimization to create the highest grade concentrate while reducing potential deleterious element contamination of the concentrate. Further economic analysis of this project is anticipated and should include resolution of the mineralogical, metallurgical and processing issues. Based upon a relatively simple processing flow sheet for ilmenite concentrate, a recent increase in demand for ilmenite and the projects close proximity to other bulk mines and inexpensive shipping routes, SRK believes that the Project meets the criteria for having reasonable prospects of economic extraction.
The mineral resources for Titac South presented in the Titac Reportrepresent the first time disclosure of Mineral Resource for the Project Area. Drilling on the Titac North deposit is insufficient for delineation of the deposit and evaluation of a resource for Titac North has not been undertaken.
The Mineral Resource for the Titac South deposit at a cut-off grade of 8% TiO2 includes 45.1 million tonnes at an average grade of 15.0% TiO2. Based on the assumption that all Ti is found within ilmenite, the contained ilmenite in the Mineral Resource includes 12.8 million tonnes at an average grade of 28.5% ilmenite. While not quantified here, the potential for extraction of iron from magnetite exists and would provide an upside to the project. As well, vanadium may be of economic interest, although it has not been significantly analyzed by SRK.
Cardero Resource Corp. | |
Form 51-102F1 | |
Management Discussion & Analysis | |
Year ended October 31, 2011 | Page 34 |
Recommendations
The Project Area is at an early exploration stage and merits additional work. The drilling program conducted in 2010 and 2011 by CIOUS has confirmed strong titanium-iron-oxide mineralization at the Project Area, and determined that the Project Area contains at least two OUIs with large zones of titanium-iron-oxide mineralization (Titac North and Titac South). The Titac South intrusion was extensively drilled by CIOUS in 2010 and 2011, and has been fairly well defined by this drilling. A modest in-fill drilling program is recommended at Titac South to further define contacts with country rock, and to fill-in local gaps within the intrusion. Ore mineral speciation and metallurgical/beneficiation studies, as well as a preliminary economic assessment, should also be conducted
SRK recommends the following work and expenditures:
A 2011 budget is presented to complete the recommended work program:
Table 4.3: Estimated Cost for the Exploration Program Proposed for the Titac Project
Recommendation | Estimated Cost (US$) |
Titac South in-fill drilling (6 holes/1,800 m @ $180/m*) | 324,000 |
Petrographic and mineral chemistry study | 20,000 |
Metallurgical testing | 50,000 |
Preliminary economic assessment study | 100,000 |
TOTAL | 494,000 |
*Drilling cost per metre includes: Site and Trail preparation, drilling, sampling, facility/vehicle-lease, and staffing
Other Mineral Properties
Pampa El Toro Iron Sands Project, Peru
The Companys Pampa el Toro Iron Sands project now comprises 5 concessions (3,600 hectares in 2 areas) held under option from an arms length private Peruvian company. The Iron Sands project is located near the city of Nazca in the desert coastal region of southern Peru approximately 45 kilometres northeast of the port of San Juan and close to the large Marcona iron mine and the Pampa de Pongo iron deposit.
Cardero Resource Corp. | |
Form 51-102F1 | |
Management Discussion & Analysis | |
Year ended October 31, 2011 | Page 35 |
At the present time, the Company is actively engaged in negotiations to secure a partner who can help move the project to a commercial stage and, although the Company is presently in discussions with interested entities (including conducting property visits), there can be no assurance that it will be able to do so.
Baja IOCG, Mexico
The Company has produced a comprehensive data room, which is being reviewed by various companies under confidentiality agreements with the Company. The Company anticipates engaging in negotiations to secure a joint venture partner in the near future, but there can be no certainty that it will be able to do so or that it will be successful in entering into a joint venture agreement regarding the property.
Corrales and Santa Teresa Projects, Mexico
The Company has optioned its Corrales and Santa Teresa zinc-lead-silver projects in Mexico to Ethos Capital Corp. ("Ethos"). Ethos has advised that, with respect to the Santa Teresa property, an initial exploration program, to consist of detailed and property-scale geological mapping to further refine the mineral deposit model, is proposed but that no schedule for such work program has yet been determined. With respect to the Corrales property, Ethos has advised it is assessing the results of the initial percussion drilling program carried out in 2010, but no decision as to any follow-up work program has yet been concluded.
Organullo Project, Argentina
On September 9, 2011, the Company entered into an option/joint venture agreement with Artha Resources Corporation ("Artha"), whereby an Argentinean subsidiary of Artha can earn a 55% working interest in the Organullo property, and thereafter form a joint venture with Cardero Argentina S.A., a wholly owned subsidiary of the Company.
The option agreement provides that Artha has the option to earn a 55% working interest in the Organullo property by incurring an aggregate of USD 1,500,000 in exploration expenditures over three years (USD 250,000 by September 9, 2012) and by issuing an aggregate of 350,000 common shares in the capital of Artha, also over three years (50,000 shares within 15 days of TSXV acceptance - issued). Upon Artha having earned its initial 55% interest, the Company has the right to maintain its 45% interest through pro rata funding of exploration expenditures going forward. Alternatively, the Company may choose to be diluted down to a minimum interest of 10%, at which point its interest will be converted to a 2% NSR royalty.
The Company understands that Artha currently proposes to carry out drill program at the Organullo property in late 2011 or early 2012.
Los Manantiales (Mina Angela) Project, Argentina
On December 3, 2008, Hochschilds Mining Holdings Limited terminated its option to acquire an interest in the project, and returned all interest in the property to the Company. The Company is still awaiting receipt of all the data generated by Hochschilds in connection with its activities on the property as required by the option agreement. However, several attempts to secure such data have been unsuccessful. The Company is seeking a joint venture partner to continue work on this property.
Cardero Resource Corp. | |
Form 51-102F1 | |
Management Discussion & Analysis | |
Year ended October 31, 2011 | Page 36 |
Minas Pirquitas Project, Argentina
On July 17, 2009, the Company and Davcha Resources Pty. Ltd. ("Davcha") finalized the formal agreement in connection with the option to Davcha to earn a 55% interest in the property. Davcha is the operator. The Company has been advised that Davcha has agreed to option its interest in the Minas Pirquitas property, and four other properties in the same region, to Artha. Pursuant to the Cardero/Davcha agreement, Davcha is required to incur expenditures of USD 50,000 on or before July 14, 2010 and additional expenditures of USD 950,000 on or before July 14, 2013.
Artha has advised that it is currently in the process of finalizing community access agreements so that an initial 2,500m drilling program can be initiated on the Noeilla Breccia and Pirquitas NW prospects, where surface work and IP geophysics have defined 2 targets ready for drilling. Further information will be released as received from Artha.
Qualified Person(s) and Quality Control/Quality Assurance
Keith Henderson, EurGeol, Cardero's Vice President-Exploration and a qualified person as defined by National Instrument 43-101, has supervised the preparation of the scientific and technical information that forms the basis for the mineral property disclosure in this MD&A. Mr. Henderson is not independent of the Company, as he is an employee and holds incentive stock options.
The work programs on the Company's non-optioned properties are designed and are supervised by Mr. Henderson, either alone or in conjunction with independent consultants. Mr. Henderson and such consultants, as applicable, are responsible for all aspects of the work, including the quality control/quality assurance program. On-site personnel at the various projects rigorously collect and track samples which are then sealed and shipped to ALS Chemex for assay. ALS Chemex's quality system complies with the requirements for the International Standards ISO 9001:2000 and ISO 17025: 1999. Analytical accuracy and precision are monitored by the analysis of reagent blanks, reference material and replicate samples. Quality control is further assured by the use of international and in-house standards. Blind certified reference material is inserted at regular intervals into the sample sequence by Cardero personnel in order to independently assess analytical accuracy. Finally, representative blind duplicate samples are forwarded to ALS Chemex and an ISO compliant third party laboratory for additional quality control.
Gary M. Stubblefield, P.E., of Norwest Corporation, is a professional engineer (Colorado, Montana and Utah) and, as such, is acting as the Qualified Person, as defined in NI 43-101 for certain portions of the Carbon Creek Report. Mr. Stubblefield has a B.Sc. in Mining Engineering and more than 40 years of relevant experience in engineering and mine supervision and operations, including 18 years in surface coal mining. Both Mr. Stubblefield and Norwest are independent of the Company under NI 43-101.
Lawrence D. Henchel, SME, of Norwest Corporation, is a Registered Member of the Society for Mining, Metallurgy and Exploration, Inc (SME) and, as such is acting as the Qualified Person, as defined in NI 43-101 for certain portions of the Carbon Creek Report, including the October 1, 2011 resource modeling for the Carbon Creek deposit. Mr. Henchel has a B.Sc. in Geology and 28 years of relevant experience as a geologist specializing in coal and industrial minerals in both exploration and mining. Both Mr. Henchel and Norwest are independent of the Company under NI 43-101.
Darrell Farrow Pr.Sci.Nat. of SRK Consulting (Canada) Inc. is a member of the South African Counsel for Scientific Natural Professions and, as such is acting as the Qualified Person, as defined in NI 43-101 for certain portions of the Longnose and Titac Reports. Mr. Farrow has a BSc. and an MSc. in Geology and 28 years of relevant experience as a research geochemist for four years, as a geologist at two mining operations over a period of ten years, as a manager of an exploration laboratory for three years, and as a consulting geologist for eleven years. Both Mr. Farrow and SRK Consulting (Canada) Inc. are independent of the Company under NI 43-101.
Cardero Resource Corp. | |
Form 51-102F1 | |
Management Discussion & Analysis | |
Year ended October 31, 2011 | Page 37 |
Michael Johnson P.Geo of SRK Consulting (Canada) Inc. is a Professional Geoscientist (BC) and, as such is acting as the Qualified Person, as defined in NI 43-101 for certain portions of the Longnose and Titac Reports, including the January 17, 2012 resource modeling for the Longnose and Titac deposits. Mr. Johnson has a BSc. in Geological Sciences and 15 years of relevant experience as a geologist, exploration manager, mine geologist and open pit mine manager. He has extensive experience in resource estimation within many deposit types and has worked with ultramafic intrusions and related mineral deposits for more than 10 years. Both Mr. Johnson and SRK Consulting (Canada) are independent of the Company under NI 43-101.
Risk Factors
The Company is in the business of acquiring, exploring and, if warranted, developing and exploiting natural resource properties, primarily in Canada, Mexico, Argentina, Peru, the United States, and Ghana. Due to the nature of the Company's proposed business and the present stage of exploration of its mineral properties (which are primarily early to advanced stage exploration properties and, with the exception of the Pampa el Toro Iron Sands project in Peru and the Carbon Creek Coal property in British Columbia, with no known resources and or known reserves), the following risk factors, among others, will apply:
Resource Exploration and Development is Generally a Speculative Business: Resource exploration and development is a speculative business and involves a high degree of risk, including, among other things, unprofitable efforts resulting both from the failure to discover mineral deposits and from finding mineral deposits which, though present, are insufficient in size and grade at the then prevailing market conditions to return a profit from production. The marketability of natural resources which may be acquired or discovered by the Company will be affected by numerous factors beyond the control of the Company. These factors include market fluctuations, the proximity and capacity of natural resource markets, government regulations, including regulations relating to prices, taxes, royalties, land use, importing and exporting of minerals and environmental protection. The exact effect of these factors cannot be accurately predicted, but the combination of these factors may result in the Company not receiving an adequate return on invested capital.
There are no known reserves and, other than on the Carbon Creek property, the Longnose and Titac properties and the Iron Sands Project, there are no known resources, on any of the Company's properties. The majority of exploration projects do not result in the discovery of commercially mineable deposits of ore. Substantial expenditures are required to establish ore reserves through drilling and metallurgical and other testing techniques, determine metal content and metallurgical recovery processes to extract metal from the ore, and construct, renovate or expand mining and processing facilities. No assurance can be given that any level of recovery of ore reserves will be realized or that any identified mineral deposit, even it is established to contain an estimated resource, will ever qualify as a commercial mineable ore body which can be legally and economically exploited. Mineral resources are not mineral reserves and there is no assurance that any mineral resources will ultimately be reclassified as proven or probable reserves. Mineral resources which are not mineral reserves do not have demonstrated economic viability.
Fluctuation of Commodity Prices: Even if commercial quantities of mineral deposits are discovered by the Company, there is no guarantee that a profitable market will exist for the sale of the minerals produced. The Company's long-term viability and profitability depend, in large part, upon the market price of minerals which have experienced significant movement over short periods of time, and are affected by numerous factors beyond the control of the Company, including international economic and political trends, expectations of inflation, currency exchange fluctuations, interest rates and global or regional consumption patterns, speculative activities and increased production due to improved mining and production methods. The recent price fluctuations in the price of all commodities for which the Company is presently exploring is an example of a situation over which the Company has no control and may materially adversely affect the Company in a manner that it may not be able to compensate for. The supply of and demand for minerals are affected by various factors, including political events, economic conditions and production costs in major producing regions. There can be no assurance that the price of any minerals produced from the Company's properties will be such that any such deposits can be mined at a profit.
Cardero Resource Corp. | |
Form 51-102F1 | |
Management Discussion & Analysis | |
Year ended October 31, 2011 | Page 38 |
Recent market events and conditions: Since 2008, the U.S. credit markets have experienced serious disruption due to a deterioration in residential property values, defaults and delinquencies in the residential mortgage market (particularly, sub-prime and non-prime mortgages) and a decline in the credit quality of mortgage backed securities. These problems have led to a slow-down in residential housing market transactions, declining housing prices, delinquencies in non-mortgage consumer credit and a general decline in consumer confidence. These conditions caused a loss of confidence in the broader U.S. and global credit and financial markets and resulting in the collapse of, and government intervention in, major banks, financial institutions and insurers and creating a climate of greater volatility, less liquidity, widening of credit spreads, a lack of price transparency, increased credit losses and tighter credit conditions. Notwithstanding various actions by the U.S. and foreign governments, concerns about the general condition of the capital markets, financial instruments, banks, investment banks, insurers and other financial institutions caused the broader credit markets to further deteriorate and stock markets to decline substantially. In addition, general economic indicators have deteriorated, including declining consumer sentiment, increased unemployment and declining economic growth and uncertainty about corporate earnings.
While these conditions appear to have improved slightly in 2010/11, unprecedented disruptions in the credit and financial markets have had a significant material adverse impact on a number of financial institutions and have limited access to capital and credit for many companies. These disruptions could, among other things, make it more difficult for the Company to obtain, or increase its cost of obtaining, capital and financing for its operations. The Company's access to additional capital may not be available on terms acceptable to it or at all.
General Economic Conditions: The recent unprecedented events in global financial markets have had a profound impact on the global economy. Many industries, including the gold and base metal mining industry, are impacted by these market conditions. Some of the key impacts of the current financial market turmoil include contraction in credit markets resulting in a widening of credit risk, devaluations and high volatility in global equity, commodity, foreign exchange and precious metal markets, and a lack of market liquidity. A continued or worsened slowdown in the financial markets or other economic conditions, including but not limited to, consumer spending, employment rates, business conditions, inflation, fuel and energy costs, consumer debt levels, lack of available credit, the state of the financial markets, interest rates, and tax rates may adversely affect the Company's growth and profitability. Specifically:
Cardero Resource Corp. | |
Form 51-102F1 | |
Management Discussion & Analysis | |
Year ended October 31, 2011 | Page 39 |
These factors could have a material adverse effect on the Company's financial condition and results of operations.
Share Price Volatility: In 2010/11, worldwide securities markets, particularly those in the United States and Canada, have experienced a high level of price and volume volatility, and the market price of securities of many companies, particularly those considered exploration or development stage companies, have experienced unprecedented fluctuations in price which have not necessarily been related to the operating performance, underlying asset values or prospects of such companies. Most significantly, the share prices of junior natural resource companies have experienced an unprecedented decline in value and there has been a significant decline in the number of buyers willing to purchase such securities. In addition, significantly higher redemptions by holders of mutual funds has forced many of such funds (including those holding the Company's securities) to sell such securities at any price. As a consequence, despite the Company's past success in securing significant equity financing, market forces may render it difficult or impossible for the Company to secure placees to purchase new share issues at a price which will not lead to severe dilution to existing shareholders, or at all. Therefore, there can be no assurance that significant fluctuations in the trading price of the Company's common shares will not occur, or that such fluctuations will not materially adversely impact on the Company's ability to raise equity funding without significant dilution to its existing shareholders, or at all.
Permits and Licenses: The operations of the Company will require licenses and permits from various governmental authorities. There can be no assurance that the Company will be able to obtain all necessary licenses and permits that may be required to carry out exploration, development and mining operations at its projects, on reasonable terms or at all. Delays or a failure to obtain such licenses and permits, or a failure to comply with the terms of any such licenses and permits that the Company does obtain, could have a material adverse effect on the Company.
Acquisition of Mineral Properties under Agreements: The agreements pursuant to which the Company has the right to acquire a number of its properties provide that the Company must make a series of cash payments and/or share issuances over certain time periods, expend certain minimum amounts on the exploration of the properties or contribute its share of ongoing expenditures. Failure by the Company to make such payments, issue such shares or make such expenditures in a timely fashion may result in the Company losing its interest in such properties. There can be no assurance that the Company will have, or be able to obtain, the necessary financial resources to be able to maintain all of its property agreements in good standing, or to be able to comply with all of its obligations thereunder, with the result that the Company could forfeit its interest in one or more of its mineral properties.
Title Matters: The acquisition of title to mineral properties in Mexico, Peru, Argentina, and Ghana is a very detailed and time-consuming process. Title to, and the area of, mineral concessions may be disputed. While the Company has diligently investigated title to all mineral properties in which it has an interest and, to the best of its knowledge, title to all such properties is in good standing or, where not yet granted, the application process appears to be proceeding normally in all the circumstances, this should not be construed as a guarantee of title or that any such applications for concessions will be granted. Title to mineral properties may be affected by undetected defects such as aboriginal or indigenous peoples' land claims, or unregistered agreements or transfers. The Company has not obtained title opinions for the majority of its mineral properties. Not all the mineral properties in which the Company has an interest have been surveyed, and their actual extent and location may be in doubt.
Cardero Resource Corp. | |
Form 51-102F1 | |
Management Discussion & Analysis | |
Year ended October 31, 2011 | Page 40 |
Surface Rights and Access: Although the Company acquires the rights to some or all of the minerals in the ground subject to the mineral tenures that it acquires, or has a right to acquire, in most cases it does not thereby acquire any rights to, or ownership of, the surface to the areas covered by its mineral tenures. In such cases, applicable mining laws usually provide for rights of access to the surface for the purpose of carrying on mining activities, however, the enforcement of such rights through the courts can be costly and time consuming. It is necessary to negotiate surface access or to purchase the surface rights if long-term access is required. There can be no guarantee that, despite having the right at law to access the surface and carry on mining activities, the Company will be able to negotiate satisfactory agreements with any such existing landowners/occupiers for such access or purchase of such surface rights, and therefore it may be unable to carry out planned mining activities. In addition, in circumstances where such access is denied, or no agreement can be reached, the Company may need to rely on the assistance of local officials or the courts in the applicable jurisdiction, the outcomes of which cannot be predicted with any certainty. The inability of the Company to secure surface access or purchase required surface rights could materially and adversely affect the timing, cost or overall ability of the Company to develop any mineral deposits it may locate. This is a particular problem in many areas of Mexico, Argentina, Peru, and Ghana, where blockades of access to the Company's properties, hostile actions by local communities and the potential unwillingness of local police or governmental officials to assist a foreign company against its own citizens can result in the Company being unable to carry out any exploration activities despite being legally authorized to do so and having complied with all applicable local laws and requirements.
No Assurance of Profitability: The Company has no history of production or earnings and due to the nature of its business there can be no assurance that the Company will be profitable. The Company has not paid dividends on its shares since incorporation and does not anticipate doing so in the foreseeable future. All of the Company's properties are in the exploration stage and the Company has not defined or delineated any proven or probable reserves on any of its properties. None of the Company's properties are currently under development. Continued exploration of its existing properties and the future development of any properties found to be economically feasible, will require significant funds. The only present source of funds available to the Company is through the sale of its equity securities or the sale or optioning of a portion of its interest in its mineral properties. Even if the results of exploration are encouraging, the Company may not have sufficient funds to conduct the further exploration that may be necessary to determine whether or not a commercially mineable deposit exists. While the Company may generate additional working capital through further equity offerings or through the sale or possible syndication of its properties, there is no assurance that any such funds will be available on favourable terms, or at all. At present, it is impossible to determine what amounts of additional funds, if any, may be required. Failure to raise such additional capital could put the continued viability of the Company at risk.
Uninsured or Uninsurable Risks: Exploration, development and mining operations involve various hazards, including environmental hazards, industrial accidents, metallurgical and other processing problems, unusual or unexpected rock formations, structural cave-ins or slides, flooding, fires, metal losses and periodic interruptions due to inclement or hazardous weather conditions. These risks could result in damage to or destruction of mineral properties, facilities or other property, personal injury, environmental damage, delays in operations, increased cost of operations, monetary losses and possible legal liability. The Company may not be able to obtain insurance to cover these risks at economically feasible premiums or at all. The Company may elect not to insure where premium costs are disproportionate to the Company's perception of the relevant risks. The payment of such insurance premiums and of such liabilities would reduce the funds available for exploration and production activities.
Government Regulation: Any exploration, development or mining operations carried on by the Company will be subject to government legislation, policies and controls relating to prospecting, development, production, environmental protection, mining taxes and labour standards. The Company cannot predict whether or not such legislation, policies or controls, as presently in effect, will remain so, and any changes therein (for example, significant new royalties or taxes), which are completely outside the control of the Company, may materially adversely affect to ability of the Company to continue its planned business within any such jurisdictions.
Cardero Resource Corp. | |
Form 51-102F1 | |
Management Discussion & Analysis | |
Year ended October 31, 2011 | Page 41 |
Foreign Countries and Political Risk: The Company has mineral properties located in Peru, Argentina, Mexico, the United States and Ghana. In such countries, mineral exploration and mining activities may be affected in varying degrees by political or economic instability, expropriation of property and changes in government regulations such as tax laws, business laws, environmental laws and mining laws. Any changes in regulations or shifts in political conditions are beyond the control of the Company and may materially adversely affect it business, or if significant enough, may make it impossible to continue to operate in certain countries. Operations may be affected in varying degrees by government regulations with respect to restrictions on production, price controls, foreign exchange restrictions, export controls, income taxes, expropriation of property, environmental legislation and mine safety.
Dependence Upon Others and Key Personnel: The success of the Company's operations will depend upon numerous factors, many of which are beyond the Company's control, including (i) the ability of the Company to enter into strategic alliances through a combination of one or more joint ventures, mergers or acquisition transactions; and (ii) the ability to attract and retain additional key personnel in exploration, mine development, sales, marketing, technical support and finance. These and other factors will require the use of outside suppliers as well as the talents and efforts of the Company. There can be no assurance of success with any or all of these factors on which the Company's operations will depend. The Company has relied and may continue to rely, upon consultants and others for operating expertise.
Exploration and Mining Risks: Fires, power outages, labour disruptions, flooding, explosions, cave-ins, landslides and the inability to obtain suitable or adequate machinery, equipment or labour are other risks involved in the operation of mines and the conduct of exploration programs. Substantial expenditures are required to establish reserves through drilling, to develop metallurgical processes, to develop the mining and processing facilities and infrastructure at any site chosen for mining. Although substantial benefits may be derived from the discovery of a major mineralized deposit, no assurance can be given that minerals will be discovered in sufficient quantities to justify commercial operations or that funds required for development can be obtained on a timely basis. The economics of developing mineral properties is affected by many factors including the cost of operations, variations of the grade of ore mined, fluctuations in the price of gold or other minerals produced, costs of processing equipment and such other factors as government regulations, including regulations relating to royalties, allowable production, importing and exporting of minerals and environmental protection. In addition, the grade of mineralization ultimately mined may differ from that indicated by drilling results and such differences could be material. Short term factors, such as the need for orderly development of ore bodies or the processing of new or different grades, may have an adverse effect on mining operations and on the results of operations. There can be no assurance that minerals recovered in small scale laboratory tests will be duplicated in large scale tests under on-site conditions or in production scale operations. Material changes in geological resources, grades, stripping ratios or recovery rates may affect the economic viability of projects.
Currency Fluctuations: The Company presently maintains its accounts in Canadian dollars. Due to the nature of its operations in such countries, the Company also maintains accounts in U.S. dollars, Mexican and Argentinean pesos, Peruvian nuevo soles, and Ghanaian Cedi. The Company's operations in the United States, Mexico, Argentina, Peru and Ghana and its proposed payment commitments and exploration expenditures under many of the agreements pursuant to which it holds, or has a right to acquire, an interest in its mineral properties are denominated in U.S. dollars, making it subject to foreign currency fluctuations. Such fluctuations are out of its control and may materially adversely affect the Company's financial position and results. The Company does not engage in any hedging programs with respect to currencies.
Cardero Resource Corp. | |
Form 51-102F1 | |
Management Discussion & Analysis | |
Year ended October 31, 2011 | Page 42 |
Environmental Restrictions: The activities of the Company are subject to environmental regulations promulgated by government agencies in different countries from time to time. Environmental legislation generally provides for restrictions and prohibitions on spills, releases or emissions into the air, discharges into water, management of waste, management of hazardous substances, protection of natural resources, antiquities and endangered species and reclamation of lands disturbed by mining operations. Certain types of operations require the submission and approval of environmental impact assessments. Environmental legislation is evolving in a manner which means stricter standards, and enforcement, fines and penalties for non-compliance are more stringent. Environmental assessments of proposed projects carry a heightened degree of responsibility for companies and directors, officers and employees. The cost of compliance with changes in governmental regulations has a potential to reduce the profitability of operations.
Regulatory Requirements: The activities of the Company are subject to extensive regulations governing various matters, including environmental protection, management and use of toxic substances and explosives, management of natural resources, exploration, development of mines, production and post-closure reclamation, exports, price controls, taxation, regulations concerning business dealings with indigenous peoples, labour standards on occupational health and safety, including mine safety, and historic and cultural preservation. Failure to comply with applicable laws and regulations may result in civil or criminal fines or penalties, enforcement actions thereunder, including orders issued by regulatory or judicial authorities causing operations to cease or be curtailed, and may include corrective measures requiring capital expenditures, installation of additional equipment, or remedial actions, any of which could result in the Company incurring significant expenditures. The Company may also be required to compensate those suffering loss or damage by reason of a breach of such laws, regulations or permitting requirements. It is also possible that future laws and regulations, or more stringent enforcement of current laws and regulations by governmental authorities, could cause additional expense, capital expenditures, restrictions on or suspension of the Company's operations and delays in the exploration and development of the Company's properties.
Limited Experience with Development-Stage Mining Operations: The Company has limited experience in placing resource properties into production, and its ability to do so will be dependent upon using the services of appropriately experienced personnel or entering into agreements with other major resource companies that can provide such expertise. There can be no assurance that the Company will have available to it the necessary expertise when and if it places its resource properties into production.
Estimates of Mineral Reserves and Resources and Production Risks: The mineral resource estimates presented in the Company's filings with securities regulatory authorities, press releases and other public statements that may be made from time to time are based upon estimates made by Company personnel and independent geologists, and no assurance can be given that any particular level of recovery of minerals will in fact be realized or that an identified reserve or resource will ever qualify as a commercially mineable (or viable) deposit which can be legally and economically exploited. The estimating of mineral resources and mineral reserves is a subjective process and the accuracy of mineral resource and mineral reserve estimates is a function of the quantity and quality of available data, the accuracy of statistical computations, and the assumptions used and judgments made in interpreting available engineering and geological information. There is significant uncertainty in any mineral resource or mineral reserve estimate and the actual deposits encountered and the economic viability of a deposit may differ materially from the Company's estimates. Accordingly, there can be no assurance that:
Cardero Resource Corp. | |
Form 51-102F1 | |
Management Discussion & Analysis | |
Year ended October 31, 2011 | Page 43 |
Because the Company has not commenced production at any of its properties, and has not defined or delineated any proven or probable reserves on any of its properties, mineralization estimates for the Company's properties may require adjustments or downward revisions based upon further exploration or development work or actual production experience. In addition, the grade of mineralization ultimately mined may differ from that indicated by drilling results and such differences could be material. There can be no assurance that minerals recovered in small-scale tests will be duplicated in large-scale tests under on-site conditions or in production scale. Production can be affected by such factors as permitting regulations and requirements, weather, environmental factors, unforeseen technical difficulties, unusual or unexpected geological formations and work interruptions. Short term factors, such as the need for orderly development of deposits or the processing of new or different grades, may have a material adverse effect on mining operations and on the results of operations. There can be no assurance that minerals recovered in small scale laboratory tests will be duplicated in large scale tests under on-site conditions or in production scale operations. Material changes in reserves or resources, grades, stripping ratios or recovery rates may affect the economic viability of projects. The estimated resources described in the Company's filings with securities regulatory authorities, press releases and other public statements that may be made from time to time should not be interpreted as assurances of mine life or of the profitability of future operations. Estimated mineral resources and mineral reserves may have to be re-estimated based on changes in applicable commodity prices, further exploration or development activity or actual production experience. This could materially and adversely affect estimates of the volume or grade of mineralization, estimated recovery rates or other important factors that influence mineral resource or mineral reserve estimates. Market price fluctuations for gold, silver or base metals, increased production costs or reduced recovery rates or other factors may render any particular reserves uneconomical or unprofitable to develop at a particular site or sites. A reduction in estimated reserves could require material write downs in investment in the affected mining property and increased amortization, reclamation and closure charges.
Mineral resources are not mineral reserves and there is no assurance that any mineral resources will ultimately be reclassified as proven or probable reserves. Mineral resources which are not mineral reserves do not have demonstrated economic viability. The failure to establish proven and probable reserves could restrict the Company's ability to successfully implement its strategies for long-term growth.
Enforcement of Civil Liabilities: As many of the assets of the Company and its subsidiaries are located outside of Canada and the United States, and certain of the directors and officers of the Company are resident outside of Canada and/or the United States, it may be difficult or impossible to enforce judgements granted by a court in Canada or the United States against the assets of the Company and its subsidiaries or the directors and officers of the Company residing outside of such country.
Mining Industry is Intensely Competitive: The Company's business of the acquisition, exploration and development of mineral properties is intensely competitive. The Company may be at a competitive disadvantage in acquiring additional mining properties because it must compete with other individuals and companies, many of which have greater financial resources, operational experience and technical capabilities than the Company. The Company may also encounter increasing competition from other mining companies in efforts to hire experienced mining professionals. Competition for exploration resources at all levels is currently very intense, particularly affecting the availability of manpower, drill rigs and helicopters. Increased competition could adversely affect the Company's ability to attract necessary capital funding or acquire suitable producing properties or prospects for mineral exploration in the future.
Cardero Resource Corp. | |
Form 51-102F1 | |
Management Discussion & Analysis | |
Year ended October 31, 2011 | Page 44 |
The Company may be a "passive foreign investment company" under the U.S. Internal Revenue Code, which may result in material adverse U.S. federal income tax consequences to investors in Common Shares that are U.S. taxpayers: Investors in Common Shares that are U.S. taxpayers should be aware that Cardero believes that it has been in one or more prior tax years, and may be in current and future tax years, a "passive foreign investment company" under Section 1297(a) of the U.S. Internal Revenue Code (a "PFIC"). However, no determination has been made regarding Cardero's PFIC status for any particular tax year. If Cardero is or becomes a PFIC, generally any gain recognized on the sale of the Common Shares and any "excess distributions" (as specifically defined) paid on the Common Shares must be rateably allocated to each day in a U.S. taxpayer's holding period for the Common Shares. The amount of any such gain or excess distribution allocated to prior years of such U.S. taxpayer's holding period for the Common Shares generally will be subject to U.S. federal income tax at the highest tax applicable to ordinary income in each such prior year, and the U.S. taxpayer will be required to pay interest on the resulting tax liability for each such prior year, calculated as if such tax liability had been due in each such prior year. The amount of any such gain or excess distribution allocated to the tax year of disposition or distribution of the excess distribution and to years before the entity became a PFIC, if any, would be taxed as ordinary income.
Alternatively, a U.S. taxpayer that makes a "qualified electing fund" (a "QEF") election with respect to Cardero generally will be subject to U.S. federal income tax on such U.S. taxpayer's pro rata share of Cardero's "net capital gain" and "ordinary earnings" (as specifically defined and calculated under U.S. federal income tax rules), regardless of whether such amounts are actually distributed by Cardero. U.S. taxpayers should be aware, however, that there can be no assurance that Cardero will satisfy record keeping requirements under the QEF rules or that Cardero will supply U.S. taxpayers with required information under the QEF rules, if Cardero is a PFIC and a U.S. taxpayer wishes to make a QEF election. As a second alternative, a U.S. taxpayer may make a "mark-to-market election" if Cardero is a PFIC and the Common Shares are "marketable stock" (as specifically defined). A U.S. taxpayer that makes a mark-to-market election generally will include in gross income, for each taxable year in which Cardero is a PFIC, an amount equal to the excess, if any, of (a) the fair market value of the Common Shares as of the close of such taxable year over (b) such U.S. taxpayer's adjusted tax basis in the Common Shares.
The above paragraphs contain only a brief summary of certain U.S. federal income tax considerations. Investors should consult their own tax advisor regarding the PFIC rules and other U.S. federal income tax consequences of the acquisition, ownership, and disposition of Common Shares.
Financial Results of Operations
During the year ended October 31, 2011, the Company incurred net loss of $24,733,528 or $(0.36) per share compared to net income of $44,950,970 or $0.77 per share for the year ended October 31, 2010, and during the three month period ended October 31, 2011, the Company had a loss of $22,399,568 or $(0.27) per share as compared to an income of $834,518 or $0.01 per share for 2010.
The following discussion explains the variations in key components of these numbers but, as with most junior mineral exploration companies, the results of operations are not the main factor in establishing the financial health of the Company. Of far greater significance are the mineral properties in which the Company has, or may earn, an interest, its working capital and how many shares it has outstanding. Quarterly results can vary significantly depending on whether the Company has abandoned any properties or granted any stock options.
Cardero Resource Corp. | |
Form 51-102F1 | |
Management Discussion & Analysis | |
Year ended October 31, 2011 | Page 45 |
Year ended October 31, 2011 compared to year ended October 31, 2010
The significantly higher income in the year ended October 31, 2010 over the year ended October 31, 2011 was due to the payments received of $93,607,400 (USD 88,000,000) from the sale of Pampa de Pongo property, which have been recognized in other income of the comparative period, net of related property costs of $645,276 and transaction costs of $5,234,967 and before applicable income taxes. There was no comparable income during the year ended October 31, 2011.
The Companys general and administrative costs were $12,547,012, compared to $8,919,573 in 2010. The 41% increase is due to changes in the following expense categories:
Amortization increased to $244,935 (2010 - $69,463), primarily due to the increased amortization of the metallurgy lab, the acquisition of Cardero Coal, and the relocation of the Vancouver office in April 2011;
Bad debts of $ Nil (2010 - $104,835) was due to the Companys subsidiary in Mexico writing off VAT receivables in the prior year;
Consulting fees of $1,324,798 (2010 - $1,828,250) includes $15,135 (2010 - $217,132) of stock- based compensation (SBC). It decreased as a result of the fees paid to consultants hired on the sale of Pampa de Pongo property in the prior year, which has no comparative impact for the current year, offset by an increase due to the acquisition of Cardero Coal;
Corporate development of $606,239 (2010 - $301,906), increased mainly due to advertising fees paid to increase the coverage of the Companys activities;
Insurance of $108,928 (2010 - $162,115), declined primarily due to a decrease in the Directors & Officers insurance premiums and an increase in recoveries from other companies operating out of the Companys offices for reimbursement of office related insurance;
Investor relations of $650,779 (2010 - $553,873) includes SBC of $294,066 (2010 - $371,965). It increased as a result of the acquisition of Cardero Coal;
Office costs of $736,844 (2010 - $1,005,473), declined primarily due to increased recoveries from other companies operating out of the Companys offices;
Professional fees of $977,197 (2010 - $995,418) decreased slightly due to less activities in the Companys foreign subsidiaries thus leading to lower legal costs in the current year;
Property evaluations of $3,610,508 (2010 - $226,202) increased, primarily due to the exploration costs of $3,041,310 on Sheini Iron Ore projects in Ghana before the Company officially obtained the property licenses from the local government . The ongoing maintenance costs of $366,665 incurred on the Companys Baja IOCG project also contributed to the increase. Baja IOCG project had previously been written down while the Company continues to seek joint venture partners;
Regulatory and transfer agent fees increased to $221,064 (2010 - $104,686), primarily as a result of increased filing requirements due to the acquisition of Cardero Coal; and
Cardero Resource Corp. | |
Form 51-102F1 | |
Management Discussion & Analysis | |
Year ended October 31, 2011 | Page 46 |
Salaries and benefits of $3,840,081 (2010 - $3,238,965), increased due to the acquisition of Cardero Coal.
Travel expenses decreased to $225,639 (2010 - $328,387) as a result of decreased activities in the Companys foreign subsidiaries.
The Company earned $1,420,650 interest income in the current year, of which $516,096 principally from the Loan (as hereinafter defined) in the amount of $8,064,000 to Trevali Mining Corporation (Trevali), compared to an interest income of $36 in the prior year. Additionally, the Company recognized $892,513 interest income on the 6,400,000 Trevali Bonus Warrants (as hereinafter defined) in connection with the Loan.
The Company incurred $12,206,614 write-off in the resource properties in the current year versus $8,498,083 in prior year.
During the year ended October 31, 2011, the Company realized gain of $8,833,404 from the sale of International Tower Hill Mines Ltd. (ITH) (1,537,290 shares), Trevali (790,000 shares), and Corvus Gold Inc. (Corvus) (225,000 shares) common shares, compared to a realized gain of $939,651 from the sale of ITH (99,000 shares), Trevali (155,000 shares), Corvus (1,414,900 shares), and Dorato Resources Corp. (Dorato) (225,000 shares) common shares in the prior year. The Company also recorded $59,500 of unrealized loss on held-for-trading investments in Ethos Capital Corp. compared to $52,000 unrealized gain in the prior year. The unrealized loss on warrants of Trevali and Abzu Gold Ltd. (Abzu) in the current year was $2,936,673 versus unrealized gains on warrants of Trevali and Wealth Minerals Ltd. (Wealth) of $1,346,746 in the prior year. Due to substantial decline in the fair value of available-for-sale investments in Wealth and Doratos common shares, the Company recorded impairment losses of $2,837,978 (2010 - $Nil). These changes are due to market fluctuations which are entirely outside of the Companys control.
Three months ended October 31, 2011 compared to three months ended October 31, 2010
General and administrative expenses increased two-fold (2011 - $6,689,859, 2010 - $2,073,164), primarily due to the undernoted variances that occurred in the individual categories:
Amortization increased to $173,793 (2010 - $17,941), primarily due to the increased amortization of the metallurgy lab, the acquisition of Cardero Coal and the relocation of the Vancouver office in April 2011;
Consulting fees of $330,990 (2010 - $448,982). It decreased as a result of the fees paid to consultants hired on the sale of Pampa de Pongo property, which has no comparative impact for the current period offset by an increase due to the acquisition of Cardero Coal;
Corporate development of $97,369 (2010 - $34,329), increased mainly due to advertising fees paid to increase the coverage of the Companys activities;
Insurance of $31,335 (2010 - $27,486) increased primarily due to the extended insurance coverage of Cardero Coal after the acquisition;
Investor relations increased to $115,658 (2010 - $50,595), primarily due to attending the trade shows and increased efforts to expose to more investors in the current period;
Cardero Resource Corp. | |
Form 51-102F1 | |
Management Discussion & Analysis | |
Year ended October 31, 2011 | Page 47 |
Office costs decreased to $159,817 (2010 - $299,904) primarily due to increased recoveries from other companies operating out of the Companys offices;
Professional fees of $359,630 (2010 - $317,182) increased slightly due to the acquisition of Cardero Coal, offset by lower legal costs in the Companys foreign subsidiaries in the current period due to less activities;
Property evaluations of $3,069,984 (2010 - $33,537) increased primarily due to the exploration costs of $3,041,310 on Sheini Iron Ore projects in Ghana before the Company officially obtained the property licenses from the local government. The ongoing maintenance costs of $28,674 incurred on the Companys Baja IOCG project also contributed to the increase. Baja IOCG project had previously been written down while the Company continues to seek joint venture partners;
Regulatory and transfer agent fees increased to $107,690 (2010 - $35,055) primarily as a result of increased filing requirements due to the acquisition of Cardero Coal; and
Salaries and benefits of $2,204,488 (2010 - $710,000), increased due to SBC, which was $644,639 (2010 - $423,943) and $955,178 in bonus paid during the current period versus $Nil in the comparative period.
Travel expenses decreased to $39,105 (2010 - $199,343) as a result of decreased activities in the Companys foreign subsidiaries.
Other items showed a loss of $10,646,156 in the current quarter versus an income of $1,007,443 in the comparable quarter of 2010. Due to their nature, these transactions relate to events that do not necessarily generate comparable effects on the Companys operating results. Significant areas of change include:
Interest income of $1,064,127, of which $171,614, principally from the Loan (as hereinafter defined), versus an interest income of $192 in the comparative quarter. $892,513 interest income was recognized as additional interest income on 6,400,000 Treval Bonus Warrants (as hereinafter defined) in connection with the Loan;
The Company incurred $12,206,614 write-off in the resource properties in the current period versus $17,795 in prior period;
Realized gains from the sale of available-for-sale investments were $3,849,577 (2010 - $641,042) resulting from the current period sale of 944,590 shares of ITH and 225,000 shares of Corvus;
The unrealized loss on derivative investments (warrants) was $3,234,862 (2010 unrealized gain of $1,140,163). For the current period the loss was caused by decrease in the value of Trevali warrants and Abzu warrants;
The Company also recorded $150,000 of unrealized loss on held-for-trading investments in Ethos Capital Corp. compared to $39,500 unrealized gain in the comparative period of the prior year.
Due to substantial declined in values of available-for-sale investments in Wealth and Dorato, the Company recorded impairment losses of $2,837,978 during the current period versus $Nil in the comparative period, and
Cardero Resource Corp. | |
Form 51-102F1 | |
Management Discussion & Analysis | |
Year ended October 31, 2011 | Page 48 |
SELECTED ANNUAL INFORMATION
October 31, 2011 | October 31, 2010 | October 31, 2009 | |||||||
Income (Loss) for the year | $ | (24,733,528 | ) | $ | 44,950,970 | $ | (254,628 | ) | |
Net income (loss) per share | $ | (0.36 | ) | $ | 0.77 | $ | (0.01 | ) | |
Total assets | $ | 121,329,283 | $ | 136,205,154 | $ | 48,071,671 |
SUMMARY OF QUARTERLY RESULTS
The table below sets out the quarterly results, expressed in Canadian dollars, for the past three fiscal years:
Fiscal 2011
First Quarter | Second Quarter | Third Quarter | Fourth Quarter | |||||||||
Total revenue | $ | 42,158 | $ | 149,111 | $ | 165,254 | $ | 1,064,127 | ||||
Gain on sale of investments | 2,196,898 | 312,096 | 2,474,833 | 3,849,577 | ||||||||
Impairment loss | - | - | - | 2,837,978 | ||||||||
Write-off of resource properties | - | - | - | $ | 12,206,614 | |||||||
Net income (loss) | 4,349,493 | (2,859,179 | ) | (3,824,274 | ) | (22,399,568 | ) | |||||
Net income (loss) per share | 0.07 | (0.05 | ) | (0.05 | ) | (0.36 | ) | |||||
Comprehensive income (loss) | $ | 21,444,911 | $ | (10,318,134 | ) | $ | (17,846,724 | ) | $ | (39,165,610 | ) |
Fiscal 2010
First Quarter | Second Quarter | Third Quarter | Fourth Quarter | |||||||||
Total revenue | $ | 411 | $ | (993 | ) | $ | 426 | $ | 192 | |||
Gain (loss) on resource property | 89,406,016 | (780,415 | ) | (891,388 | ) | (7,056 | ) | |||||
Gain on sale of investments | 136,092 | 162,517 | - | 641,042 | ||||||||
Write-off of resource properties | - | 8,180,742 | 299,546 | 17,795 | ||||||||
Net income (loss) | 62,261,575 | (14,053,095 | ) | (4,092,028 | ) | 834,518 | ||||||
Net income (loss) per share | 1.06 | (0.24 | ) | (0.07 | ) | 0.02 | ||||||
Comprehensive income (loss) | $ | 69,081,221 | $ | (11,456,150 | ) | $ | (6,854,748 | ) | $ | 11,404,744 |
Cardero Resource Corp. | |
Form 51-102F1 | |
Management Discussion & Analysis | |
Year ended October 31, 2011 | Page 49 |
Fiscal 2009
First Quarter | Second Quarter | Third Quarter | Fourth Quarter | |||||||||
Total revenue | $ | 7,131 | $ | 5,446 | $ | (135 | ) | 12,133 | ||||
Gain (loss) on resource property | - | - | 8,731,350 | (133,695 | ) | |||||||
Gain on sale of investment | 660,103 | 1,722,356 | - | 335,795 | ||||||||
Write-off of resource properties | 2,642,051 | (45,559 | ) | - | 473,795 | |||||||
Net income (loss) | (2,997,821 | ) | 193,054 | 4,391,076 | (1,840,937 | ) | ||||||
Net income (loss) per share | (0.05 | ) | 0.00 | 0.08 | (0.02 | ) | ||||||
Comprehensive income (loss) | $ | 1,400,502 | $ | (671,416 | ) | $ | 6,506,293 | $ | 2,895,749 |
Notes: | 1) | There were no discontinued operations or extraordinary items in the periods under review. |
2) | The basic and diluted losses per share were the same in each of the periods. |
The variation seen over such quarters is primarily dependent upon the success of the Companys ongoing property evaluation program and the timing and results of the Companys exploration activities on its then current properties, none of which are possible to predict with any accuracy. There are no general trends regarding the Companys quarterly results, and the Companys business of mineral exploration is not seasonal. Quarterly results can vary significantly depending on whether the Company has abandoned any properties or granted any stock options or paid any employee bonuses and these are the factors that account for material variations in the Companys quarterly net losses, none of which are predictable. In addition, results in fiscal 2010 were significantly influenced by the one-time sale of the Pampa de Pongo property. While the Company may seek, in the future, to sell some or all of the interests in other of its mineral properties, the timing and potential effect of any such sale is impossible to predict. The write-off of mineral properties can have a material effect on quarterly results as and when they occur. Another factor which can cause a material variation in net loss on a quarterly basis is the grant of stock options due to the resulting SBC charges which can be significant when they arise. The payment of employee bonuses, being once-yearly charges, can also materially affect operating losses for the quarters in which they occur. General operating costs other than the specific items noted above tend to be quite similar from period to period. With the exception of the interest generated from the loan to Trevali (an one-off event), the variation in income is related solely to the interest earned on funds held by the Company, which is dependent upon the success of the Company in raising the required financing for its activities which will vary with overall market conditions, and is therefore difficult to predict.
LIQUIDITY AND CAPITAL RESOURCES
The Company has no revenue generating operations from which it can internally generate funds. To date, the Companys ongoing operations have been predominantly financed by the sale of its equity securities by way of private placements and the subsequent exercise of share purchase warrants and broker options issued in connection with such private placements. However, the exercise of warrants/options is dependent primarily on the market price and overall market liquidity of the Companys securities at or near the expiry date of such warrants/options (over which the Company has no control) and therefore there can be no guarantee that any existing warrants/options will be exercised. Over the past fiscal year, the Company has also successfully generated operating funds through the sale of certain of its investments, which have significantly increased in value since their acquisition. However, such returns are subject to fluctuations in the market for the shares of the companies in which the Company has invested, and therefore there can be no assurance that the Company will continue to be able to generate significant additional funds through the liquidation of its investments. In addition, the Company can raise funds through the sale of interests in its mineral properties (as, for example, with the sale of the Pampa de Pongo project) which raised $88,372,433 net of costs in the 2010 fiscal year.
Cardero Resource Corp. | |
Form 51-102F1 | |
Management Discussion & Analysis | |
Year ended October 31, 2011 | Page 50 |
The Company expects that it will operate at a loss for the foreseeable future, notwithstanding the income recognized on the Pampa de Pongo transaction. The Company currently has no funding commitments or arrangements for additional financing at this time (other than the potential exercise of outstanding options or warrants or the sale of some or all of its investments) and there is no assurance that the Company will be able to obtain additional financing on acceptable terms, if at all. There is significant uncertainty that the Company will be able to secure any additional financing required for the development of any of its mineral properties, or to develop any advanced properties that it may acquire. The quantity of funds to be raised and the terms of any proposed equity financing that may be undertaken will be negotiated by management as opportunities to raise funds arise. Specific plans related to the use of proceeds will be devised once financing has been completed and management knows what funds will be available for these purposes.
As at October 31, 2011, the Company reported cash and cash equivalents of $5,985,634 compared to $52,264,003 at October 31, 2010 and $5,823,196 as at October 31, 2009. The change in cash and cash equivalents over the period is comprised of funds used in investing activities of $1,337,411, $44,769,071 ($25,601,634 relating to income tax payable on the sale of Pampa de Pongo and $8,580,096 loaned to Kria Resources Ltd. (Kria) (now a wholly owned subsidiary of Trevali)) used in operations and $1,197,868 provided by financing activities due to proceeds from shares issued. As at October 31, 2011, the Company had working capital of $13,556,780 compared to working capital of $26,549,076 at October 31, 2010 and $3,803,620 at October 31, 2009.
Under the three prospected joint ventures, Cardero will fund all expenditures under the particular joint venture and make the following payments to Emmaland:
For the Sheini Hills North prospecting license:
- |
USD 25,000 upon the agreement to enter into the joint venture (paid); | |
- |
USD 250,000 as an initial joint venture payment (paid); | |
- |
USD 1,000,000 upon the formation of the joint venture
(Effective Date) (paid USD 700,000 and | |
- |
USD 1,000,000 six months after the Effective Date (paid); | |
- |
USD 500,000 one year after the Effective Date; | |
- |
USD 1,000,000 two years after the Effective Date; | |
- |
USD 1,000,000 three years after the Effective Date; | |
- |
USD 500,000 four years after the Effective Date; and | |
- |
USD 500,000 five years after the Effective Date. |
For the Middle Sheini prospecting license:
- |
USD 25,000 upon the agreement to enter into the joint venture (paid); | |
- |
USD 250,000 as an initial joint venture payment (paid); | |
- |
USD 1,000,000 upon the formation of the joint venture (Effective Date) (paid subsequent to October 31, 2011); | |
- |
USD 1,000,000 six months after the Effective Date (paid USD 100,000 subsequent to October 31, 2011); | |
- |
USD 500,000 one year after the Effective Date (paid); | |
- |
USD 1,000,000 two years after the Effective Date; | |
- |
USD 1,000,000 three years after the Effective Date; | |
- |
USD 500,000 four years after the Effective Date; and | |
- |
USD 500,000 five years after the Effective Date. |
Cardero Resource Corp. | |
Form 51-102F1 | |
Management Discussion & Analysis | |
Year ended October 31, 2011 | Page 51 |
For the Sheini South prospecting license:
- | USD 3,000,000 upon the formation of the joint venture (Effective Date) (paid); | |
- | USD 1,000,000 one year after the Effective Date; and | |
- | USD 1,000,000 two years after the Effective Date. |
And by virtue of the acquisition of Cardero Coal, the Company is therefore responsible for the balance of the option/acquisition payments to be made under the property agreements with respect to the Carbon Creek Metallurgical Coal deposit. The remaining payments under these agreements are as follows:
Johnson Agreement
Payment of $5,000,000 due within four months of the date the coal licenses are issued by the Government of British Columbia and transferred to the Cardero Coal. Cardero Coal can extend the payment date by paying a $20,000 monthly fee for up to three additional months.
Issuance of 400,000 common shares of the Company. Such issuance is to be made concurrently with the $5,000,000 final payment.
Burns Agreement
A final payment of $2,500,000 to be paid before December 30, 2011 was paid subsequent to October 31, 2011.
Joint Venture Agreement
A final payment of $2,500,000 to be paid before December 30, 2011 was paid subsequent to October 31, 2011.
The Company has no exposure to any asset-backed commercial paper. Other than cash held by its subsidiaries for their immediate operating needs in the United States, Mexico, Peru, Argentina and Ghana, all of the Companys cash reserves are on deposit with major financial institutions or invested in Government of Canada Treasury Bills or Bankers Acceptances issued by major Canadian chartered banks. The Company does not believe that the credit, liquidity or market risks with respect thereto have increased as a result of the current market conditions. However, in order to achieve greater security for the preservation of its capital, the Company has, of necessity, been required to accept lower rates of interest which has also lowered its potential interest income.
The following table discloses the Companys contractual obligations for mineral property lease and option payments and committed operating lease obligations. The Company does not have any long-term debt or loan obligations. Under the terms of certain option agreements and mineral property leases, the Company is required to make certain scheduled acquisition payments, incur certain levels of expenditures, and make lease and/or advance royalty payments as summarized in the table below in order to maintain and preserve the Companys interests in the related mineral properties. If the Company is unable or unwilling to make any such payments or incur such expenditures, the Company would lose or forfeit its rights to acquire or hold the related mineral properties. However, such payments are optional, and the Company can choose not to make such payments.
Cardero Resource Corp. | |
Form 51-102F1 | |
Management Discussion & Analysis | |
Year ended October 31, 2011 | Page 52 |
Payments Due by Period(3) | |||||||||||||||||||
November 1, | November 1, | ||||||||||||||||||
Prior to | 2012 to | November 1, | 2018 to | ||||||||||||||||
October 31, | October 31, | 2015 to October | October 31, | ||||||||||||||||
Contractual | 2012 (9 | 2015 (36 | 31, 2018 (36 | 2021(36 | |||||||||||||||
Obligations | Total | months) | months) | months) | months | ||||||||||||||
Mineral Property Leases/Options(1)(2) | $ | 15,250,000 | $ | 6,950,000 | $ | 6,150,000 | $ | 2,150,000 | $ | - | |||||||||
Operating Lease Obligations | 7,380,654 | 692,389 | 2,154,153 | 2,226,206 | 2,307,906 | ||||||||||||||
Total Contractual Obligations |
$ 22,630,654 |
$ 7,642,389 |
$ 8,304,153 |
$ 4,376,206 |
$ 2,307,906 |
Notes: |
|
1. |
Does not include required work expenditures, as it is assumed that the required expenditure level is significantly below the work which will actually be carried out by the Company. |
2. |
Does not include potential royalties that may be payable (other than annual minimum royalty payments). |
3. |
Assumes CAD and USD at par. |
OFF BALANCE-SHEET ARRANGMENTS
The Company has no off-balance sheet arrangements.
TRANSACTIONS WITH RELATED PARTIES
(a) |
Due to related parties |
During the years ended October 31, 2011 and 2010, the Company incurred the following expenses to officers or directors of the Company or companies with common directors: |
2011 | 2010 | ||||||
Consulting fees | $ | 115,000 | $ | 224,159 | |||
Professional fees | $ | 82,500 | $ | 87,056 |
At October 31, 2011, there was $Nil (October 31, 2010 - $7,700) included in accounts payable and accrued liabilities. Professional fees include amounts paid to a law firm of which a director is a shareholder.
(b) |
Due from related parties |
Amounts due from related parties are comprised as follows: |
Cardero Resource Corp. | |
Form 51-102F1 | |
Management Discussion & Analysis | |
Year ended October 31, 2011 | Page 53 |
2011 | 2010 | ||||||
Unsecured promissory notes, 1% per annum,
due the earlier of 30 days after demand or the due date, if applicable: |
|||||||
Trevali | $ | 142,945 | $ | 78,227 | |||
Wealth | 495,312 | 305,871 | |||||
Dorato | 261,882 | 143,193 | |||||
Indico | 49,891 | 468,819 | |||||
Abzu | 171,268 | 208,345 | |||||
IMM | 18,805 | 18,820 | |||||
ITH | 22,899 | 11,185 | |||||
Others | 76,041 | 127,090 | |||||
$ | 1,239,043 | $ | 1,361,550 |
The Company recovered $1,331,389 during the year ended October 31, 2011 (2010 - $894,131) in rent and administration costs from Wealth, ITH, Dorato, Indico Resources Ltd. (Indico), Trevali, Balmoral, Abzu, Corvus and Lawrence W. Talbot Law Corporation (LWTLC), companies with common officers or directors. | |
These charges were measured by the exchange amount, which is the amount agreed upon by the transacting parties. | |
(c) |
Loan receivable |
The Company entered into a loan agreement with Kria whereby the Company advanced Kria $8,064,000 (the Loan) to fund the USD 8,000,000 property payment due by Kria to Xstrata Canada Corporation (Xstrata) on or before January 16, 2011 under the terms of the revised Halfmile and Stratmat property purchase agreement dated July 15, 2009, between Kria and Xstrata. The Loan bore interest at 10% per annum, calculated monthly, not in advance. As security for the Loan, Kria granted in favour of the Company a first charge, mortgage and security interest over all its assets and undertakings. In connection with the Loan, Kria issued to the Company 6,400,000 common share purchase warrants of Kria (the Kria Bonus Warrants). Each Kria Bonus Warrant entitled the holder to acquire a common share of Kria at an exercise price of $0.25 until January 14, 2012. The fair value of the Kria Bonus Warrants was calculated at $1,131,136 using the Black-Scholes model, and this amount was recognized as additional interest income under the term of the Loan. On April 7, 2011, Trevali acquired Kria and the 6,400,000 Kria Bonus Warrants were exchanged for 1,280,000 Trevali warrants (the Trevali Bonus Warrants) on a 5:1 exchange ratio. The interest rate of the Loan was retroactively reduced to 8% to be calculated monthly and not in advance and was due on or before January 14, 2012 (note 17). Accrued interest of $516,096 is included in the Loan balance presented. | |
The Company received repayment of the USD 8,000,000 principal balance of the Loan plus USD 645,260 in interest from Trevali on January 14, 2012. The Loan was repaid as follows: |
|
USD 5,000,000 in cash, and | |
|
USD 3,645,260 (CAD $3,734,569) with 4,149,521 units (Trevali Units) of Trevali equity. |
Cardero Resource Corp. | |
Form 51-102F1 | |
Management Discussion & Analysis | |
Year ended October 31, 2011 | Page 54 |
Each Trevali Unit is comprised of one common share of Trevali and one-half of one transferrable common share purchase warrant (a "Trevali Warrant"), at a deemed price of $0.90 per Trevali Unit. Each whole Trevali Warrant will entitle the holder thereof to purchase one common share of Trevali at a price of $1.10 per share until January 16, 2014. | |
(d) |
Related parties |
Mr. Stephan Fitch, a director of the Company, is a director and significant shareholder of a private company that is the major shareholder (67%) of IMM. The Company has acquired a 15% interest in IMM Gold Ltd. (IMMG), a subsidiary of International Minerals and Mines Ltd. (IMM). This transaction was approved by the Companys audit committee and Board of Directors (other than Mr. Fitch, who abstained from voting in each case). The Company considered the collectability of advances totalling $468,099 to IMMG to be doubtful and, accordingly, wrote them off during the year ended October 31, 2009. | |
Effective October 1, 2005, the Company retained Mr. Carlos Ballon of Lima, Peru, to provide management services on behalf of the Company in Peru through his private Peruvian company, Koripampa, for a fee of USD 10,000 per month (reduced to USD 7,500 per month starting from March 2007), which has been expensed to consulting fees. Mr. Ballon became President of Cardero Peru in April 2006. Accordingly, Mr. Ballon is a related party with respect to the Company. Prior to Mr. Ballon becoming a related party, the Company entered into a number of mineral property acquisition/option agreements with either Koripampa or Sudamericana de Metales Peru S.A., another private Peruvian company controlled by Mr. Ballon. Such property transactions include those with respect to the Carbonera and Daniella Properties (note 7(c)(i)), the Pampa de Pongo Property (note 7(c)(ii)), the Katanga Property and the Corongo Property. The presidents of Minerales Y Metales California, S.A. de C.V. and Cardero Argentina provide management services for USD 3,750 each per month, which is expensed to consulting fees or capitalized to property costs, depending upon the nature of the services. | |
The Company has entered into a retainer agreement dated May 1, 2007 with LWTLC, pursuant to which LWTLC agrees to provide legal services to the Company. Pursuant to the retainer agreement, the Company has agreed to pay LWTLC a minimum annual retainer of $82,500 (plus applicable taxes and disbursements). The retainer agreement may be terminated by LWTLC on reasonable notice, and by the Company on one years notice (or payment of one years retainer in lieu of notice). |
PROPOSED TRANSACTIONS
Although the Company is currently investigating/negotiating a number of additional property acquisitions, and is entertaining proposals for the sale or option/joint venture of one or more of its properties, as at the date of this MD&A there are no proposed transactions where the Board of Directors, or senior management who believe that confirmation of the decision by the Board is probable, have decided to proceed with and which are not disclosed herein.
CRITICAL ACCOUNTING ESTIMATES
The preparation of financial statements in conformity with Canadian generally accepted accounting principles requires management to make estimates and assumptions that affect the reported amounts of assets and liabilities and disclosures of contingent assets and liabilities at the date of the financial statements, and the reported amounts of revenues and expenses during the reporting period. Areas requiring the use of estimates in the preparation of the Companys financial statements include the rates of amortization for equipment, the potential recovery of resource property interests, the assumptions used in the determination of the fair value of SBC and the determination of the valuation allowance for future income tax assets. Management believes the estimates used are reasonable; however, actual results could differ materially from those estimates and, if so, would impact future results of operations and cash flows.
Cardero Resource Corp. | |
Form 51-102F1 | |
Management Discussion & Analysis | |
Year ended October 31, 2011 | Page 55 |
CHANGES IN ACCOUNTING POLICIES
There have been no changes in the Company's accounting policies since November 1, 2010, being the start of the Company's most recently completed fiscal year.
FINANCIAL INSTRUMENTS AND OTHER INSTRUMENTS
The Company's cash and resource related investments in common shares of public companies are classified within Level 1 of the fair value hierarchy because they are valued using quoted market prices.
The Company's equity investments, resource related investments in warrants and accounts payable, are classified at Level 2 of the fair value hierarchy because they are derived directly from the prices of services provided by these parties; however, this is not readily measurable in an active market. The Company does not believe that it is exposed to any material risk with respect thereto.
The Company's cash and cash equivalents at October 31, 2011 was $5,985,634 of which $856,894 was held in US, Mexican, Argentinean and Peruvian currencies.
The Company's receivables and payables at October 31, 2011 were normal course business items that are settled on a regular basis. The Company's investments in ITH, Corvus Gold Ltd., Trevali, Abzu, Wealth, Indico and Dorato are carried at quoted market value or an estimate thereof, and are classified as "available-for-sale" for accounting purposes. The Company's investment in Ethos Capital Corp. is classified as "held-for-trading" for accounting purposes. All resource related investments in warrants are classified as held-for-trading and are considered derivative financial instruments where changes to the fair value are included in net income. The Company intends to dispose of its resource-related investments as necessary to fund ongoing operations.
MATERIAL PROCEEDINGS
The Company is not a party to any material proceedings.
EVALUATION OF DISCLOSURE CONTROLS AND PROCEDURES
Disclosure controls and procedures are controls and other procedures that are designed to provide reasonable assurance that all relevant information required to be disclosed in the Company's reports filed or submitted as part of the Company's continuous disclosure requirements is gathered and reported to senior management, including the Company's Chief Executive Officer and Chief Financial Officer, on a timely basis so that appropriate decisions can be made regarding public disclosure and such information can be recorded, processed, summarized and reported within the time periods specified by applicable regulatory authorities.
Management of the Company, with the participation of the Chief Executive Officer and the Chief Financial Officer, has evaluated the effectiveness of the Company's disclosure controls and procedures as at October 31, 2011 as required by Canadian and US securities laws. Based on that evaluation, the Chief Executive Officer and the Chief Financial Officer have concluded that, as of October 31, 2011, the disclosure controls and procedures were effective.
Cardero Resource Corp. | |
Form 51-102F1 | |
Management Discussion & Analysis | |
Year ended October 31, 2011 | Page 56 |
EVALUATION OF INTERNAL CONTROL OVER FINANCIAL REPORTING
Internal control over financial reporting means a process designed by, or under the supervision of, the Companys certifying officers, and effected by the Companys board of directors, management and other personnel, to provide reasonable assurance regarding the reliability of financial reporting and the preparation of financial statements for external purposes in accordance with the Companys GAAP and includes those policies and procedures that:
(a) |
pertain to the maintenance of records that in reasonable detail accurately and fairly reflect the transactions and dispositions of the assets of the Company; | |
(b) |
are designed to provide reasonable assurance that transactions are recorded as necessary to permit preparation of financial statements in accordance with the Companys GAAP, and that receipts and expenditures of the Company are being made only in accordance with authorizations of management and directors of the Company; and | |
(c) |
are designed to provide reasonable assurance regarding prevention or timely detection of unauthorized acquisition, use or disposition of the Companys assets that could have a material effect on the annual financial statements or interim financial statements. |
For an evaluation of the Companys internal control over financial reporting, please refer to Managements Report on Internal Control over Financial Reporting as well as Report of Independent Registered Public Accounting Firm to the Shareholders of Cardero Resource Corp. (an Exploration Stage Company) in the the Companys audited consolidated financial statements.
CHANGES IN INTERNAL CONTROL OVER FINANCIAL REPORTING
The Chief Executive Officer and Chief Financial Officer have concluded that there has been no change in the Companys internal control over financial reporting during the period beginning on November 1, 2010 and ended on October 31, 2011, that has materially affected, or is reasonably likely to materially affect, the Companys internal control over financial reporting.
TRANSITION TO INTERNATIONAL FINANCIAL REPORTING STANDARDS
General
The Canadian Accounting Standards Board has confirmed that, effective on January 1, 2011, IFRS replaced Canadian Generally Accepted Accounting Policies (GAAP) as the basis for accounting for publicly accountable enterprises. The first period reported under IFRS by the Company will be the three month period ended January 31, 2012 and the Companys first fiscal year end date under IFRS will be the fiscal year ending October 31, 2012.
The change from Canadian GAAP to IFRS will be a significant undertaking and may have significant effects on the Companys accounting, internal controls, disclosure controls and financial statement presentation.
The Company commenced transition plan development in November 2009. The Company has determined its preliminary IFRS policy decisions and significant expected accounting differences, based on an analysis of the current IFRS standards, and the following section outlines each of these. As the conversion work continues, additional differences between Canadian GAAP and IFRS may be identified. As a result, these accounting policy choices may change prior to the adoption of IFRS by the Company on November 1, 2011. Although the Company has identified key accounting policy differences, the impact of these differences to its financial statements has not been determined at this time. Decisions with respect to accounting policy changes, outlined below, may change once management has quantified and thoroughly analyzed the effects of such changes and has presented them for final review and approval by the Companys Audit Committee.
Cardero Resource Corp. | |
Form 51-102F1 | |
Management Discussion & Analysis | |
Year ended October 31, 2011 | Page 57 |
First-time Adoption of IFRS (IFRS 1)
In the first year of transition to IFRS, a company is allowed to elect certain exceptions from IFRS in order not to apply each IFRS on a retrospective basis. IFRS 1 has certain mandatory exemptions as well as limited optional exemptions. Based on analysis to date, the Company expects to apply the following optional exemptions under IFRS 1 that will be significant in preparing the financial statements under IFRS:
Business Combinations A company may elect, on transition to IFRS, to either restate all past business combinations in accordance with IFRS 3 Business Combinations or to apply an optional exemption from applying IFRS 3 to past business combinations. The Company will elect, on transition to IFRS, to apply the optional exemption such that transactions entered into prior to the transition date of November 1, 2010 will not be restated.
Share-Based Payments A company may elect not to apply IFRS 2 Share-Based Payments to equity instruments which vested before the transition date to IFRS. The Company will elect, on transition to IFRS, to apply the optional exemption such that equity instruments which vested prior to the transition date of November 1, 2010, will not be restated.
IFRS to Canadian GAAP differences
The following is the preliminary difference between the Companys Canadian GAAP accounting policies and the policy choices available under IFRS. Based on analysis to date, management believes they may not be material:
Share-based payments Canadian GAAP allows certain policy choices in the calculation of stock based compensation. The Company currently amortizes grants in their entirety on a straight-line basis over the vesting term. IFRS standards require each tranche in the grant to be amortized over its respective vesting period. As a result of these changes, share-based compensation expense will be accelerated under IFRS. In addition, unvested options at November 1, 2011 will be revalued under IFRS, with consequent adjustments to opening retained earnings. The Company currently vests options at the date of the grant.
Additional Impacts of Adopting IFRS
The Company has determined that the main impact of IFRS on the Company will involve a significant increase in note disclosure as well as certain presentation differences.
Current IFRS Transition Work
The Company is now quantifying the known differences between IFRS and Canadian GAAP.
The Companys finance group is continuing its education program to increase its understanding of IFRS.
The Company will continue to review all proposed and continuing IFRS amendments by the various regulatory bodies and update or revise the project plan accordingly to ensure it accomplishes a timely and efficient transition to IFRS.
Cardero Resource Corp. | |
Form 51-102F1 | |
Management Discussion & Analysis | |
Year ended October 31, 2011 | Page 58 |
DISCLOSURE OF OUTSTANDING SHARE DATA
1. |
Authorized and Issued capital stock: As at October 31, 2011: |
Authorized | Issued | Book Value | |||||
An unlimited number of common shares without par value | 83,054,104 | (1) | $ | 107,237,122 |
As at January 26, 2012:
Authorized | Issued | Book Value | |||||
An unlimited number of common shares without par value | 91,517,854 | $ | 115,511,002 |
2. |
Options Outstanding: As at October 31, 2011: |
Number | Exercise Price | Expiry Date | ||
360,000 | $ 1.31 | December 1, 2011 | ||
500,000 | $ 1.41 | February 2, 2012 | ||
1,485,000 | $ 1.16 | July 29, 2012 | ||
1,125,000 | $ 1.16 | August 11, 2012 | ||
100,000 | $ 1.28 | September 8, 2012 | ||
1,000,000 | $ 1.83 | January 28,2013 | ||
280,000 | (2) | $ 0.06 | June 1, 2013 | |
100,000 | (2) | $ 0.16 | June 1, 2013 | |
320,000 | (2) | $ 0.31 | June 1, 2013 | |
980,000 | (2) | $ 0.38 | June 1, 2013 | |
349,143 | (2) | $ 0.44 | June 1, 2013 | |
6,599,143 |
(2) |
Former Cardero Coal incentive stock options. |
Cardero Resource Corp. | |
Form 51-102F1 | |
Management Discussion & Analysis | |
Year ended October 31, 2011 | Page 59 |
As at January 26, 2012:
Number | Exercise Price | Expiry Date | |
500,000 | $ 1.41 | February 2, 2012 | |
1,485,000 | $ 1.16 | July 29, 2012 | |
1,125,000 | $ 1.16 | August 11, 2012 | |
100,000 | $ 1.28 | September 8, 2012 | |
1,000,000 | $ 1.83 | January 28,2013 | |
280,000(2) | $ 0.06 | June 1, 2013 | |
100,000(2) | $ 0.16 | June 1, 2013 | |
320,000(2) | $ 0.31 | June 1, 2013 | |
980,000(2) | $ 0.38 | June 1, 2013 | |
349,143(2) | $ 0.44 | June 1, 2013 | |
1,400,000 | $ 1.10 | November 9, 2013 | |
1,500,000 | $ 1.51 | January 26, 2014 | |
9,139,143 |
(2) |
Former Cardero Coal incentive stock options. |
The number of options remaining available for grant as at October 31, 2011 and 2010 were 1,706,267 and 527,330, respectively. | |
3. |
Warrants Outstanding: |
As at October 31, 2011, the following warrants were outstanding: |
Number | Exercise Price | Expiry Date | |
428,400 | $ 0.63 | December 17, 2011 | |
240,000 | $ 0.06 | March 1, 2012 | |
5,600 | $ 0.16 | March 29, 2012 | |
12,600 | $ 0.16 | April 6, 2012 | |
120,000 | $ 0.06 | May 20, 2012 | |
336,000 | $ 0.38 | June 14, 2012 | |
120,000 | $ 0.06 | June 15, 2012 | |
70,000 | $ 0.44 | September 22, 2012 | |
1,600,000 | $ 0.50 | June 1, 2013 | |
240,000 | $ 0.13 | January 12, 2013 | |
240,000 | $ 0.13 | May 29, 2013 | |
3,412,600 | (3) |
(3) |
Former Cardero Coal warrants. |
Cardero Resource Corp. | |
Form 51-102F1 | |
Management Discussion & Analysis | |
Year ended October 31, 2011 | Page 60 |
At January 26, 2012, the following warrants were outstanding:
Number | Exercise Price | Expiry Date | |
240,000 | $ 0.06 | March 1, 2012 | |
5,600 | $ 0.16 | March 29, 2012 | |
12,600 | $ 0.16 | April 6, 2012 | |
120,000 | $ 0.06 | May 20, 2012 | |
336,000 | $ 0.38 | June 14, 2012 | |
120,000 | $ 0.06 | June 15, 2012 | |
70,000 | $ 0.44 | September 22, 2012 | |
1,600,000 | $ 0.50 | June 1, 2013 | |
240,000 | $ 0.13 | January 12, 2013 | |
240,000 | $ 0.13 | May 29, 2013 | |
2,984,200 | (2) |
(3) |
Former Cardero Coal warrants. |
NYSE AMEX CORPORATE GOVERNANCE
The Companys common shares are listed on the NYSE Amex LLC (NYSE Amex). Section 110 of the NYSE Amex Company Guide permits NYSE Amex to consider the laws, customs and practices of foreign issuers in relaxing certain NYSE Amex listing criteria, and to grant exemptions from NYSE Amex listing criteria based on these considerations. A company seeking relief under these provisions is required to provide written certification from independent local counsel that the non-complying practice is not prohibited by home country law. A description of the significant ways in which the Companys governance practices differ from those followed by domestic companies pursuant to NYSE Amex standards is posted on the Companys website at www.cardero.com and a copy of such description is available by written request made to the Company.
ADDITIONAL SOURCES OF INFORMATION
Additional disclosures pertaining to the Company, including its most recent Annual Information Form, financial statements, management information circular, material change reports, press releases and other information, are available on the SEDAR website at www.sedar.com or on the Companys website at www.cardero.com. Readers are urged to review these materials, including the technical reports filed with respect to the Company's mineral properties.
TECHNICAL REPORT
SHEINI HILLS
IRON ROJECT
GHANA, AFRICA
EFFECTIVE DATE:
JANUARY 18, 2012
PREPARED FOR:
CARDERO RESOURCE CORP.
SUITE 2300 1177 WEST HASTINGS ST.
VANCOUVER, BC, V6E 4A2
AUTHOR:
EURGEOL KEITH J HENDERSON PGEO
CERTIFICATE OF QUALIFICATIONS
I, EurGeol Keith J Henderson, PGeo. of Vancouver, Canada, do hereby certify that
1. |
I am currently employed as Executive Vice President by Cardero Resource Corp., 2300-1177 West Hastings Street, Vancouver, BC, V6E 2K3. | |
2. |
I graduated from Queens University Belfast, Northern Ireland, in 1993 with a B.Sc. in Geology and from University College Dublin, Ireland, in 1995 with a M.Sc. in Petroleum Geology. | |
3. |
I am a Registered Professional Geologist with the European Federation of Geologists (EurGeol 178) and with the Institute of Geologists of Ireland (PGeo 041). | |
4. |
Since my graduation in 1993, I have been involved in the mineral exploration and mineral development industries in geological, supervision, management, and executive roles in various organizations over the past 19 years. I have been employed by Cardero Resource Corp. since 2007, where I now serve as Executive Vice President. | |
5. |
I have read the definition of qualified person set out in National Instrument 43-101 (NI 43-101) and certify that by reason of my education, affiliation with professional associations (as defined in NI 43-101), and past relevant work experience, I fulfill the requirements to be a qualified person for the purposes of NI 43-101. I have worked on iron ore projects since 2007, including the Pampa de Pongo Iron project in Peru and Longnose and Titac Iron Titanium projects in Minnesota, and have specific experience in drilling, geophysical modeling, resource modeling and metallurgical testing of various iron and iron-titanium types of mineralization. | |
6. |
I am responsible for the preparation of all sections of the technical report titled Technical Report, Sheini Hills Iron Project, Ghana dated January 18, 2012 (the Technical Report), relating to the Sheini Hills Iron Project. | |
7. |
I have had involvement with the property that is the subject of the Technical Report, having been personally involved in directing due diligence sampling and exploration at the Project since mid-2011. I personally inspected the Sheini Property on November 30, 2011. | |
8. |
As at the effective date of the Technical Report, to the best of my knowledge, information, and belief, the Technical Report contains all scientific and technical information that is required to be disclosed to make the Technical Report not misleading. | |
9. |
I am not independent of the issuer applying all of the tests in Section 1.5 of NI 43-101 as I am an employee and a shareholder. | |
10. |
I have read NI 43-101, and the Technical Report has been prepared in compliance with NI 43-101. |
Dated at Vancouver, British Columbia, Canada, this 18th day of January 2012.
ORIGINAL SIGNED AND SEALED
BY
_________________________________
EurGeol Keith Henderson,
PGeo
Executive Vice President
Cardero Resource Corp.
CARDERO RESOURCE CORP. |
TECHNICAL REPORT SHEINI HILLS IRON PROJECT |
TOC -2 |
TABLE OF CONTENTS
CARDERO RESOURCE CORP. |
TECHNICAL REPORT SHEINI HILLS IRON PROJECT |
TOC -3 |
CARDERO RESOURCE CORP. |
TECHNICAL REPORT SHEINI HILLS IRON PROJECT |
TOC -4 |
APPENDIX A: COORDINATES OF HISTORICAL BOREHOLES | I |
APPENDIX B: COORDINATES OF SAMPLED TRENCHES | II |
APPENDIX C: DETAILS OF CHANNEL SAMPLING IN TRENCHES | III |
APPENDIX D: SAMPLE ASSAY RESULTS | IV |
CARDERO RESOURCE CORP. |
TECHNICAL REPORT SHEINI HILLS IRON PROJECT |
TOC -5 |
LIST OF TABLES
CARDERO RESOURCE CORP. |
TECHNICAL REPORT SHEINI HILLS IRON PROJECT |
TOC -6 |
LIST OF FIGURES
CARDERO RESOURCE CORP. |
TECHNICAL REPORT SHEINI HILLS IRON PROJECT |
TOC -7 |
LIST OF PLATES
CARDERO RESOURCE CORP. |
TECHNICAL REPORT SHEINI HILLS IRON PROJECT |
TOC -8 |
1 SUMMARY
This Technical Report was prepared for Cardero Resource Corp. (Cardero; TSE-CDU), a mineral exploration and development company with corporate offices in Vancouver, British Columbia, Canada. This Technical Report provides a summary of the Sheini Hills Iron Project (Project), located in Ghana, Africa, including the due diligence work completed to date and recommendations for future exploration activities. This Technical Report has been prepared in accordance with National Instrument (NI) 43-101 and Form 43-101F1.
1.1 |
PROPERTY DESCRIPTION AND LOCATION |
The Project is located in the Zabzugu-Tatale District in the Northern Region of the Republic of Ghana. The Project area (Project Area) consists of three contiguous prospecting licences (Prospecting Licenses) covering a cumulative licence area of 397.5 square kilometres. The Government of the Republic of Ghana acting by the Ministry of Lands and Natural Resources has issued a licence document dated December 8, 2011 for each of the three Prospecting Licences (Sheini North, Sheini and Sheini South). | |
The Prospecting Licences were issued to Emmaland Resources Limited (Emmaland), a local Ghanaian company. Cardero Ghana Ltd. (Cardero Ghana), an indirect wholly owned Ghanaian subsidiary of Cardero, has entered into three separate joint ventures (one for each Prospecting License) with Emmaland. The object of each joint venture is to explore and, if warranted, develop the lands subject to the relevant Prospecting Licence. The effective date for each of the joint venture agreements is December 12, 2011. | |
Under the three joint ventures, Cardero Ghana will have the right to earn a 100% working interest in each Prospecting Licence, subject to (a) a 10% NPI (net profit interest) in favour of Emmaland and (b) a 10% fully carried interest, in favour of the Government of Ghana, in the portions of the licence areas that become the subject of one or more mining licences subsequently issued to Emmaland. Cardero Ghana will have the right to purchase the 10% NPI held by Emmaland in a joint venture at any time for an amount representing the net present value thereof, as calculated by an independent engineering firm, or such other amount as is acceptable to Emmaland. There are no other royalties or back-in rights to which the Project is subject. | |
In order to earn its interest, Cardero Ghana is required to fund all expenditures under each of the particular joint ventures and make cash payments to Emmaland totalling USD 16,600,000. To date, USD 6,450,000 million has been paid in scheduled payments and advances. | |
Each Prospecting License outlines a required work program and an expenditure commitment based on this work program. The expenditure commitments relate to the initial two-year licence period, ending December 8, 2013, and total USD 9,180,966 for all three Prospecting Licenses. |
CARDERO RESOURCE CORP. |
TECHNICAL REPORT SHEINI HILLS IRON PROJECT |
1-1 |
1.2 |
ACCESSIBILITY, CLIMATE, INFRASTRUCTURE, AND PHYSIOGRAPHY |
The Project is situated in the eastern part of Ghanas Northern Region, close to the border with Togo and approximately 400 kilometres north of Ghanas capital city, Accra. Tamale, Ghanas second largest city is the regional capital and an administrative centre, as well as the regional transportation hub. Sheini Village lies approximately at the centre of the concession, 20 kilometres southeast of Zabzugu. | |
Transportation between the main centres of population in the region is mostly by road, although there are reasonable air connections between the regional centres. Tamale is the main population centre in the region with approximately 360,000 people. Sheini Village has a population of between 400 and 500. There are a number of smaller communities south of Sheini with populations of between 100 and 200 people. | |
The closest railway line in Ghana to the Sheini area is the AccraKumasi rail line located approximately 350 kilometres south. The Ghana government has long-term plans to extend the existing railway line to Tamale and Yendi. A rail line exists closer to the Sheini area at Blita in Togo, located approximately 100 kilometres southeast of the Sheini Village. This railway line extends south to the port at Lomé, Togos capital, and is used primarily for the transport of limestone and phosphates. | |
In Ghana, the Tema sea port, the largest in the country, is located approximately 390 kilometres south-southwest of the Sheini area and approximately 30 kilometres east of Accra. | |
A major power line follows the TamaleYendiZabzuguTatale road, which brings power to the towns and villages along this route. Zabzugu, the closest town with electrical power, is located 20 kilometres northwest of the Sheini area. | |
The Oti River represents the major water source and is located 20 kilometres west of the Sheini area. The river rises in Burkina Faso and forms part of the international boundaries between Benin and Burkina Faso and between Togo and Ghana. | |
The Northern Region of Ghana is located in the savannah belt with a typical hot, sub-Saharan climate. There are two major seasonsdry and wet. Climatic conditions are not expected to adversely impact exploration activities in the area. | |
The physical geography of Ghanas Northern Region reflects the geological setting of the area. The landscape surrounding Tamale is generally flat due to the soft sedimentary rocks of the Volta Basin. The landscape becomes more undulating east of Tamale and of the Oti River, suggesting the presence of more resistive rock formations. | |
The Oti River produces a broad valley with elevations of 8090 metres above sea level in the vicinity of the Sheini area. Toward the Togo border, ridges standing several hundred metres above the surrounding savannah are elongated in a northsouth direction. |
CARDERO RESOURCE CORP. |
TECHNICAL REPORT SHEINI HILLS IRON PROJECT |
1-2 |
1.3 |
PROJECT HISTORY |
The first detailed exploration work that focused on the iron occurrences around Sheini Village was by E. H. Jacques in the 1950s. His report (1958) summarizing the exploration work was re-printed by Ghana's Geological Survey Department (“GGSD”) in 2003 (Archive Report No. 85). |
|
According to this report, Jacques and his team carried out geological mapping, technical work, trenching (10 trenches), and diamond core drilling (nine boreholes) along the ridges with iron mineralization from Kandin in the north to the Kubalem area in the south, comprising approximately 35 kilometres of strike length. Jacques describes eight groups of iron-mineralized bodies from this large area. |
|
All of the samples taken during this phase of exploration were assayed for iron and silica only. A small number of samples were also assayed for phosphorous. The results, presented in Jacques' report as tables, show iron grades in the range of 30%- 50% iron, with silica content of usually more than 15% SiO2. The content of phosphorous is usually below 0.2% P2O5. |
|
In the early 1960s, geoscientists from the Soviet Union were invited to Ghana to assist with geological mapping, with prospecting, and with performing numerous specific studies in northern Ghana. The iron occurrences around Sheini Village were studied as part of one of the projects managed by the Soviets. The work included detailed geological mapping, trenching, and drilling. The results were summarized in several reports and some of them have been re-printed by the GGSD. The reports indicate that the exploration was focused mainly on the area northwest, west, and southwest of Sheini Village. |
|
No significant exploration work was done in the Sheini area after the Soviet geologists left Ghana. According to the GGSD, small-scale exploration work has been done by St. Jude Resources Ltd. (Vancouver, BC) in the Sheini North area during 2004- 2006. The exploration was testing the concept that the iron occurrences may be of epigenetic origin, similar to Olympic Dam- type Iron Oxide Copper Gold (IOCG) deposits. The St. Jude Resources exploration concession expired in 2006. |
|
In 2008, the Minerals Commission of Ghana granted non-exclusive exploration permits to twelve companies. The size of the non-exclusive exploration permit granted was 178.81 square kilometres, coincident with Emmaland's current Sheini Prospecting Licence and part of the Sheini North Prospecting License. The Minerals Commission of Ghana ran a competitive bidding process, with the Prospecting Licences being awarded to the company submitting the winning bid. A report was submitted by each company, including due diligence sampling results (where such work had been done), together with recommendations for multi-phase exploration and ultimate exploitation of the iron mineralization in the Sheini area. |
|
The results of the work together with recommendations for a further exploration program were summarized in the report submitted to the Minerals Commission of Ghana. In December 2011, the Minerals Commission of Ghana granted three Prospecting Licenses to Emmaland covering the Project Area. |
CARDERO RESOURCE CORP. |
TECHNICAL REPORT SHEINI HILLS IRON PROJECT |
1-3 |
1.4 |
GEOLOGICAL SETTING |
At the regional scale, the Project is located within the eastern part of the West African Craton called the Eastern Pan African Domain. The Project Area is located in the Togo Belt, starting in southeast Niger and running south-southwest to southeastern Ghana, comprising supracrustal sediments and volcanics of probable late Precambrian to early Phanerozoic age. The Togo Belt consists of Buem Formation and Togo Formation. The rocks of the Buem Formation are dominated by east- to southeast-dipping clastic sediments, mainly sandstones, siltstones, shales, and mudstones. Massive chert (silexites), limestones, and dolomites are known from Togo. |
|
The Iron Formation is located mainly within the Ghanaian part of the Buem Formation, but some of the bodies also cross the border into Togo. The iron mineralization is associated with tillites situated near the base of the Buem Formation. |
|
The Iron Formation forms a folded sedimentary unit several hundred metres thick and outcropping along wide ridges (or sets of parallel ridges) running for more than 35 kilometres in a north- south direction. They are composed of a number of horizons varying in lithology, grain size, and mineral composition. The individual horizons of the Iron Formation have a thickness between 20 and more than 100 metres and are inter-bedded with sandstones, siltstones, and probably quartzites. The iron bearing horizons dip 10°- 45°, mainly to the east-southeast (in the Sheini south and Kubalem area) and also to the west in the area west of Sheini Village. |
|
1.5 |
DEPOSIT TYPE |
The observed geological, mineralogical, and geochemical features indicate that the Sheini mineralization fits a Banded Iron Formation (“BIF”) model. The wide scale presence of hematite and rarity of magnetite may indicate Hematite-rich Banded Iron Formation (“H-BIF”). More likely however, the low amount of magnetite at surface is probably due to surface alteration (oxidation) of magnetite to hematite (martite). |
|
The relationship between hematite and magnetite will be clarified by the planned drilling. Based on similarities to other West African BIFs, the upper, oxidized layer is likely to be 70- 120 metres in thickness. The oxidized layer is likely to be underlain by a magnetite-facies, primary BIF. |
|
1.6 |
EXPLORATION |
The initial exploration work in the Sheini area, completed by Emmaland with input from Cardero, was carried out during late 2010 and throughout 2011. The initial phase of work, from late 2010 to mid-2011, was focused on obtaining sufficient data to meet the requirements of the Minerals Commission of Ghana and to successfully win the tender to obtain prospecting licenses over the Sheini area. The second phase of exploration, subsequent to the issue of the three Prospecting Licences to Emmaland in late 2011, has consisted of reconnaissance mapping over new areas to the north and south of the original, non-exclusive exploration licence. |
CARDERO RESOURCE CORP. |
TECHNICAL REPORT SHEINI HILLS IRON PROJECT |
1-4 |
According to the available historical reports, there was extensive exploration carried out in the Sheini area between 1945 and 1980. No maps or tables showing the exact location of the historical workings (trenches and boreholes) remain. For this reason, prospecting was focused on locating these old workings to obtain an overview of the scale of the historical exploration work.
A total of 35 historical trenches, mainly trending east-west with total length of around 2,076 metres, have been located to date. The trenches are situated primarily along the ridges and steep slopes exposing the iron mineralization where access for drilling was difficult. Most of the trenches are oriented in an eastwest direction, which is perpendicular to the trend of the iron mineralization.
In addition to the trenches, 18 historical boreholes have been located during prospecting. According to the historical reports, 23 boreholes were drilled between the 1950s and 1970s. It is not clear which of the located collars were drilled by Jacques team in the 1950s or by the Soviet team in the 1960s. As with the historical trenches, there appears to be very limited data remaining in the archives of the GGSD related to the drilling program.
In total, 29 trenches with an approximate length of 1,552 metres have been cleaned and prepared for sampling to date. One-meter-channel sampling was used to collect samples from the cleaned historical trenches. In total, 656 metres of channel sampling were carried out in 29 cleaned trenches with approximate total trench length of 1,552 metres. These 656 metres of channel sampling represent 659 channel samples. A total of 307 samples were prepared and assayed by ALS laboratory in Kumasi. The rest of the samples (449) are stored securely ready for transport in the future.
The results of the 269 trench samples (excluding blanks and duplicates) adequately confirm the findings presented by historical explorers. The results also confirm the field geological and mineralogical observations that BIF, due to its composition, grain size, and texture, is typically higher grade than Fragmental Iron Formation (Fragmental) (BIF and Fragmental are collectively referred to as the Iron Formations).
TABLE 1.1: Iron Results for Major Iron Formation Lithologies
Lithology |
Fe total. (%) | |||
Min. | Max. | Median | Mean | |
Banded Iron Formation (n=105) | 30.98 | 60.08 | 48.05 | 47.50 |
Fragmental Iron Formation (n=155) | 29.03 | 55.04 | 38.33 | 38.84 |
Fragmental Iron Formation (weathered) (n=9) | 16.51 | 25.46 | 20.07 | 20.55 |
1.7 |
SAMPLE ANALYSIS & QA/QC |
The primary laboratory used for preparation and analysis of samples was the ALS laboratory at Kumasi, Ghana. Dr. Karel Maly of Aurum Exploration Services, Ireland (who was retained by Emmaland), visited the laboratory in 2011 to ensure that all aspects of sample preparation and analysis were satisfactory. The ALS is a global network of laboratories that operates to the highest international standards. |
CARDERO RESOURCE CORP. |
TECHNICAL REPORT SHEINI HILLS IRON PROJECT |
1-5 |
At the laboratory, the samples were crushed, pulverized, and assayed. Lithogeochemical analysis using the Lithium Borate Fusion and ICP-AES was used by ALS (code ME-ICP06) to determine the major elements oxides (SiO2, Al2O3, Fe2O3, CaO, MgO, Na2O, K2O, Cr2O3, TiO2, MnO, P2O5, SrO, BaO, and LOI). | |
| |
No Certified Reference Material (CRM) was acquired and no CRMs were inserted into the batches of samples sent to ALS for preparation and analysis. The QA/QC procedure required the insertion of field duplicated material (inserted every 11th sample) and field blank material (inserted every 35th sample). The field blank material consisted of white barren quartzite collected from quartzite outcrops northwest of Sheini Village (coordinates 223156E 1015989N). | |
| |
Prepared pulps for 10% of the assayed samples (29 samples) were sent to OMAC Laboratories in Ireland (OMAC) for analysis and comparison with the ALS laboratory in Ghana. At OMAC, the same analytical method as used by ALS (lithogeochemical analysis using the Lithium Borate Fusion and ICP-AES (code BF/ES)) was chosen to obtain comparable results. Results indicate good correlation of the iron data between the ALS (original) and OMAC (check) laboratories for the samples, with a slight high bias (~2%) in the OMAC results. Five check samples, however, exhibit more than 10% relative difference, and all have lower Fe2O3 results in the check assays (OMAC). | |
| |
These samples are currently being re-run by OMAC in order to discern whether this may have been an intra-batch analytical error at the laboratory. This issue notwithstanding, the overall quality of the analytical data is considered to be good. | |
| |
1.8 |
RECOMMENDATIONS |
| |
Cardero Ghana, as operator of the Sheini Hills Joint Venture, has exploration expenditure commitments of $9.18 million to be incurred by December 8, 2013. This minimum expenditure commitment is a sum of three separate $3.6 million commitments, relating to each of the three Prospecting Licences. | |
| |
A $19.3 million exploration program, which excludes joint venture payments, is recommended for the upcoming period ending December 8, 2013. A preliminary budget of $5.79 million is recommended to move the project through Phase I drilling and metallurgical testing in 2012. | |
| |
Cardero Ghana has already signed contracts with independent and reputable consultants to: |
|
Process and interpret satellite imagery covering the Project Area. The results of this work are expected in Q1 2012. Their interpretation will help identify surface alteration of rocks associated with the oxidation and upgrade of primary BIF. Additionally, the study will provide a preliminary structural understanding of the Project Area. | |
| ||
|
Perform an airborne geophysical survey in Q1 2012. The interpreted data, expected to be available in Q2 2012, will help define the extent of BIF and Fragmental at surface and under cover (along strike to the north and south). This survey will also assist in outlining and interpreting the geological setting of the belt by highlighting resistivity and compositional changes. |
CARDERO RESOURCE CORP. |
TECHNICAL REPORT SHEINI HILLS IRON PROJECT |
1-6 |
|
Carry out a diamond drill program over the Project Area to identify DSO (direct shipping ore) and to reveal more about the geological setting of the Project Area and about the relationship between iron grade, oxidation state, and depth. |
Future exploration should include
|
Additional geological mapping to provide geological context to the iron-dominant ridges. | |
| ||
|
Conducting a detailed infrastructure and transport study to help with future project planning. | |
| ||
|
Monitoring of early-stage exploration planning and procedures, ultimately producing a 43-101 resource estimate for the Sheini Project. | |
| ||
|
Initiating an environmental baseline study across the entire area of the Prospecting Licences. |
CARDERO RESOURCE CORP. |
TECHNICAL REPORT SHEINI HILLS IRON PROJECT |
1-7 |
2 INTRODUCTION
This report has been prepared by Cardero Resource Corp. in accordance with the current requirements of National Instrument 43-101 and Form 43-101F1.
The purpose of this report is to summarize the Sheini Hills Iron Project, to describe the exploration work completed to date, and to provide recommendations for future work.
2.1 |
SOURCES OF INFORMATION |
The data summarized in the report have been provided by Cardero and by Aurum Exploration Services, Ireland, independent geological consultants who were retained by Emmaland in connection with the initial exploration work during the term of the non-exclusive exploration permit. The initial exploration program at Sheini was conducted by Aurum and supervised by the author on behalf of Emmaland. In addition, historical data have been provided by government agencies in Ghana and have been reviewed where applicable. | |
2.2 |
PERSONAL PROPERTY INSPECTION |
The author visited the Sheini Project on November 30, 2011, to inspect the trenches excavated for due diligence sampling purposes and to review sampling procedures. He was satisfied that the procedures and protocols followed during this extensive program were professionally performed and adhered to current international standards for geochemical sampling. The author walked through and inspected approximately 50% of the sampled trenches, observing iron mineralization and structural geometry of the BIF and Fragmental. The occurrence of Iron Formations was found to be extensive and consistent with the geological mapping and trenching completed on the Project Area. | |
The author has exercised reasonable skill, care, and diligence to assess the information acquired during the preparation of this report. |
CARDERO RESOURCE CORP. |
TECHNICAL REPORT SHEINI HILLS IRON PROJECT |
2-1 |
3 RELIANCE ON OTHER EXPERTS
Not applicable.
CARDERO RESOURCE CORP. |
TECHNICAL REPORT SHEINI HILLS IRON PROJECT |
3-1 |
4 PROPERTY DESCRIPTION AND LOCATION
4.1 |
PROPERTY LOCATION |
The Project is located in the Zabzugu-Tatale District in the Northern Region of the Republic of Ghana (Figure 4.1). Cardero Ghana has negotiated joint ventures with Emmaland, pursuant to which Cardero Ghana can acquire a 100% joint venture interest in each of the three Prospecting Licences. |
FIGURE 4.1 : Location of Sheini Hills Iron Project in Ghana
CARDERO RESOURCE CORP. |
TECHNICAL REPORT SHEINI HILLS IRON PROJECT |
4-1 |
4.2 |
PROPERTY DESCRIPTION |
The Project Area consists of three contiguous Prospecting Licences (Figure 4.2). The licence coordinates are defined by degrees, minutes, and seconds using the Ghana national grid. The Government of the Republic of Ghana acting by the Ministry of Lands and Natural Resources has issued a licence document for each of the three Prospecting Licences. The Prospecting Licences define a cumulative licence area of 397.5 square kilometres and the corner coordinates of each licence are outlined in Table 4.1. |
TABLE 4.1: Sheini Project Licence Corner Coordinates
Licence Name | Latitude | Longitude |
Sheini North |
9°2000 | 0°2500 |
9°2000 | 0°3230 | |
9°1130 | 0°3115 | |
9°1130 | 0°2500 | |
Sheini |
9°1130 | 0°2500 |
9°1130 | 0°3115 | |
9°0000 | 0°2800 | |
9°0000 | 0°2500 | |
Sheini South |
9°0000 | 0°2500 |
9°0000 | 0°2800 | |
8°5000 | 0°2930 | |
9°5000 | 0°2500 |
The Prospecting Licences cover an area of approximately 50 kilometres north to south. The licence dimensions east to west are variable due to the irregular shape of the eastern licence boundary, which is defined by the Ghana-Togo national border.
Each of the three Prospecting Licences was issued on December 8, 2011 to Emmaland, and is issued for an initial period of two years. Each licence may be extended for an additional year without any reduction in area, provided that the requirements of the licence (including the required expenditure commitments outlined in Section 4.5) have been complied with and that the additional time is required for the holder of the licence to make an informed decision concerning the renewal of the licence.
Each licence may thereafter be renewed for a further period of up to three years (as determined by the Minister of Lands and Natural Resources upon recommendation by the Ghana Minerals Commission), provided that 50% of the area subject to the licence must be surrendered upon such renewal.
Emmaland may, at any time prior to the expiration of a licence, apply for up to three mining licences over some or all of the area subject to each licence. Mining licences are issued for a maximum of 30 years (subject to extension for an additional period of up to 30 years) and are limited in size to approximately 63 square kilometres.
CARDERO RESOURCE CORP. |
TECHNICAL REPORT SHEINI HILLS IRON PROJECT |
4-2 |
FIGURE 4.2: Location of Three Sheini Prospecting Licences in Northeast Ghana
4.3 |
PROPERTY OWNERSHIP |
The Prospecting Licences were issued to and are held by Emmaland. |
CARDERO RESOURCE CORP. |
TECHNICAL REPORT SHEINI HILLS IRON PROJECT |
4-3 |
4.4 |
EMMALAND-CARDERO GHANA JOINT VENTURE |
Cardero Ghana has entered into three separate joint ventures with Emmaland (one for each Prospecting Licence) to explore and, if warranted, develop the lands subject to the Prospecting Licences. The effective date for each of the joint venture agreements is December 12, 2011. Under each of the three joint ventures, Cardero Ghana will have the right to earn a 100% joint venture interest in each Prospecting Licence, subject to (a) a 10% NPI (net profit interest) in favour of Emmaland and (b) a 10% fully carried interest, in favour of the Government of Ghana, in the portions of the licence areas that become the subject of one or more mining licences subsequently issued to Emmaland. Cardero Ghana will have the right to purchase the 10% NPI held by Emmaland in a joint venture at any time for an amount representing the net present value thereof, as calculated by an independent engineering firm, or such other amount as is acceptable to Emmaland. There are no other royalties or back-in rights to which the Project is subject. | |
In order to earn its interest, Cardero Ghana will fund all expenditures under each of the joint ventures and make the following cash payments to Emmaland (Table 4.2) totaling USD 16,600,000. To date, USD 6,450,000 has been paid in scheduled payments and advances. |
TABLE 4.2: Joint Venture Payments to Emmaland Resources
Sheini North | Sheini | Sheini South | |
InitialPayment | $300,000 | $300,000 | |
OnSigningJV | $1,000,000 | $1,000,000 | $3,000,000 |
6Months | $1,000,000 | $1,000,000 | |
1YearAnniversary | $500,000 | $500,000 | $1,000,000 |
2YearAnniversary | $1,000,000 | $1,000,000 | $1,000,000 |
3YearAnniversary | $1,000,000 | $1,000,000 | |
4YearAnniversary | $500,000 | $500,000 | |
5YearAnniversary | $500,000 | $500,000 | |
$5,800,000 | $5,800,000 | $5,000,000 |
4.5 |
GOVERNMENT EXPENDITURE COMMITMENTS |
Each Prospecting License outlines a required work program and an expenditure commitment based on this work program. The expenditure commitments (Table 4.3) relate to the initial two- year licence period, ending December 8, 2013, and total USD 9,180,966 for all three Prospecting Licenses. |
CARDERO RESOURCE CORP. |
TECHNICAL REPORT SHEINI HILLS IRON PROJECT |
4-4 |
TABLE 4.3: Government Expenditure Commitments
Expenditure Commitment | |
Sheini North | $3,060,322 |
Sheini | $3,060,322 |
Sheini South | $3,060,322 |
$9,180,966 |
4.6 |
ENVIRONMENTAL LIABILITIES |
The Project Area has been subject to historical exploration, comprising trenching and diamond drilling, as well as to due diligence sampling by Emmaland and Cardero Ghana. No modern mining activities have been recorded in the area. The Project is a grassroots, early-stage exploration project with no known environmental liabilities. | |
Following the initiation of exploration activities in Q1 2012, Cardero Ghana intends to initiate environmental baseline studies throughout the Project Area. | |
4.7 |
SIGNIFICANT FACTORS AND RISKS |
The author is not aware of any significant risk factors. Ghana is a modern developing country with strong economic ties in West Africa and with Europe and North America. It is West Africa's largest gold producer and a top-ten gold producer globally. It is also the worlds second largest cocoa producer and is emerging as an oil-producing nation through newly discovered offshore fields. Ghana is a politically stable country, operating under a parliamentary system with a well- established mining law; as such, Ghana is considered to be a stable country without significant political risk. | |
Ghana also honours a historic chief system with a complex hierarchy branching downward from an Ashanti King, through four paramount regional Chiefs and then down to district and village Chiefs. Cardero Ghana has initiated and maintained strong relationships with all levels of this system, including the regional and local Chiefs in and around the Project Area. | |
Cardero Ghana is committed to building and maintaining strong relationships with local communities. Due diligence activities undertaken by Emmaland and Cardero Ghana were staffed by local people under the supervision of qualified personnel. Fifteen local people were initially hired to clean historical trenches and help with sampling of the trenches. Cardero Ghana also rented a local grader and operator to facilitate the improvement of roads to and from the Sheini area villages. This work was completed following conversations with the Chief of Kanden Village, who explained the difficulties experienced due to the poor state of local roads. The initial road repair work cemented good local relations and has since been extended to additional road repair and repair of bridges, thereby continuing to provide jobs for local people. |
CARDERO RESOURCE CORP. |
TECHNICAL REPORT SHEINI HILLS IRON PROJECT |
4-5 |
5 ACCESSIBILITY, CLIMATE, LOCAL RESOURCES, INFRASTRUCTURE, AND PHYSIOGRAPHY
5.1 |
ACCESS |
Access to Ghana is via the international airport in Accra, the capital city. The Project Area is situated in the eastern part of Ghanas Northern Region, close to the border with Togo, approximately 400 kilometres north of Accra. Tamale, Ghanas second largest city, is the regional capital and administrative centre, as well as the regional transportation hub. Tamale is connected to surrounding population centres via good quality paved roads and is serviced by a regional airport with several flights a day to Accra. | |
The Project Area is located approximately 170 kilometres east of Tamale and the access road is paved (Plate 5.1) as far as Yendi. East of Yendi, there are only seasonal dirt roads. | |
Sheini Village lies approximately at the centre of the Project Area (Figure 5.1), 20 kilometres southeast of Zabzugu. The ZabzuguSheini road is a dirt road that was upgraded by Emmaland in February 2011. Emmaland used a bulldozer and grader to widen and level the road (Plates 5.2 and 5.3). These improvements reduced the journey time between Zabzugu and the working areas. The road improvement was originally done at the request of the local population. The road remains in good conditions with the exception of one river crossing, which requires some bridge repairs. There is an alternative access road from Zabzugu to Sheini: A dirt road heads south from Zabzugu to Molina Village and then east to Sangba Village before turning northeast to Sheini. This route is considerably longer (50 kilometres), but the road is in good condition and represents an alternative access route to the area if the main ZabzuguSheini road becomes impassable during the rainy season. | |
5.2 |
PROXIMITY TO TOWNS AND LOCAL TRANSPORTATION |
Transportation between the main centres of population in the region is mostly by road, although there are reasonable air connections between the regional centres. Tamale is the main population centre in the region with approximately 360,000 people. Tamale is also the seat of local government for the Northern Region. The town of Yendi, approximately 90 kilometres east of Tamale, has a population of approximately 40,000 people. Yendi is the historical centre of the Dagbon Kingdom. Closer to Sheini, the town of Zabzugu (Plate 5.4) is the administrative centre for the Zabzugu-Tatale district in which the Project is located. The estimated population of the Zabzugu-Tatale district is 80,000 people. | |
Sheini Village, 20 kilometres southeast of Zabzugu, has a population of 400500 people. There are a number of smaller communities south of Sheini with populations between 100 and 200 people. Just southwest of Sheini is Camp Villages, comprising the villages Camp 1 and Camp 2 (Figure 5.1). |
CARDERO RESOURCE CORP. |
TECHNICAL REPORT SHEINI HILLS IRON PROJECT |
5-1 |
FIGURE 5.1: Local Infrastructure Close to Sheini Project
5.3 |
TOPOGRAPHY |
The terrain of Ghanas Northern Region reflects the geological setting of the area. The landscape around the city of Tamale is generally flat reflecting the soft sedimentary rocks of the Volta Basin that outcrop in the area (Plate 5.1). To the east of Tamale and east of the Oti River, which is a major tributary into Lake Volta, the landscape starts to become more undulating. Small hills occur in this area with elevations rising to about 150 metres above sea level, indicating the presence of more resistive rock formations. The Oti River forms a broad valley with elevations of 8090 metres above sea level in the vicinity of the Sheini area. |
CARDERO RESOURCE CORP. |
TECHNICAL REPORT SHEINI HILLS IRON PROJECT |
5-2 |
The undulated landscape continues from Zabzugu eastward toward the Togo border where ridges are elongated in a north-south direction, standing several hundred metres above the slightly undulating surrounding savannah. The ridges north of the ZabzuguSheini road are formed mainly by quartzites. | |
| |
The majority of the ridges trending for approximately 30 kilometres south from the Zabzugu Sheini road are formed principally by thick sequences of the Iron Formation (Figure 5.2). The ridges rise from approximately 150 metres above sea level to more than 400 metres above sea level, with peaks as high as 490 metres above sea level (Plate 5.6). The ridges formed by the Iron Formation also have various morphologies, with the BIF forming sharp narrow ridges with the development of scree slopes at the foot of these ridges. The less resistant Fragmental forms wide, smooth ridges and plateaus with limited outcrops of hard bedrock. There are large flatter areas around the Iron Formationdominated ridges covered by thick ferricrete. | |
| |
5.4 |
RIVERS AND DRAINAGES |
| |
All of the streams and rivers in the Project Area draining westward from the ridges at the Ghana- Togo border are tributaries of the Oti River (Plate 5.6), which in turn flows southward into Lake Volta. The small streams and rivers in the Sheini area are seasonal and are dry from the end of January until the end of May. The Oti River flows throughout the year. | |
| |
The local population obtains water from wells during the dry season. Almost every village in the Sheini area has at least one water borehole. These water wells are usually 3050 metres deep with a hand pump installed at the surface. There are several historical exploration boreholes in the Sheini area where artesian water flows throughout the year. | |
| |
5.5 |
VEGETATION |
| |
The vegetation in the flat areas surrounding the ridges has many features of typical African semi- open savannah woodland, with baobab, mango, and acacia trees and a variety of bushes. The most typical feature for these flat areas is dense, tall grass growing up to 3 metres high. The streams and rivers are typically surrounded by trees, while around the villages the ground is often cultivated with fields planted with a variety of crops. The major crops are yam, cassava, Guinea corn, millet, maize, hot peppers, tomatoes, and ground nuts. | |
| |
The vegetation on the ridges consists of overgrown scrubland with small trees, bushes, and tall grass. The vegetation on the ridges and any distance from running water dries quickly after the wet season. Local people start burning the dry bush and grass in December. |
CARDERO RESOURCE CORP. |
TECHNICAL REPORT SHEINI HILLS IRON PROJECT |
5-3 |
FIGURE 5.2: Topography Map
CARDERO RESOURCE CORP. |
TECHNICAL REPORT SHEINI HILLS IRON PROJECT |
5-4 |
5.6 |
CLIMATE |
The Northern Region of Ghana is located in the savannah belt with a typical hot sub-Saharan climate. There are two major seasons—dry and wet. |
|
The dry season is locally called Harmattan after a dry Sahara wind that blows from the northeast from the end of November to March and brings fine dust, often decreasing the visibility during the day. The wind affects the climate mainly in northern Ghana where it decreases the air humidity and creates hot days and cool nights. The days during the dry season are usually cloud- free. Mornings are chilly and sometimes humid with fog. The temperature at night is 15°C- 20°C but rises rapidly by midday to highs of 40°C. The lowest temperatures at night in the Sheini area are in January. The hottest days occur during March and April. The first thunderstorms, followed by short but intense rain, commence in the second half of March. |
|
The rainy season extends from the end of March to late October or early November. The temperatures vary between 25°C and 30°C, with daily highs frequently in excess of 30°C. The highest rainfall is between July and August when the average rainfall is about 1,000 mm- 1,300 mm. |
|
Climatic conditions are not expected to adversely impact exploration activities in the Project Area. |
|
5.7 |
POWER AND WATER |
The total generating capacity of Ghana in 1994 was about 1,187 megawatts, and annual production totalled approximately 4,490 million kilowatts. The main source of supply is the Volta River Authority (“VRA”) with six 127-megawatt turbines. The VRA's power plant at Akosombo Dam provides the bulk of all electricity consumed in Ghana, some 60% of which is purchased by Valco (Volta Aluminum Company) for its smelter. The power plant also meets most of the energy needs of Togo and Benin. The balance of Ghana's electricity is produced by diesel units owned by the Electricity Company of Ghana, by mining companies, and by a 160-megawatt hydroelectric plant at Kpong, about 40 kilometres downstream from Akosombo. |
|
Lake Volta is located about 150 kilometres southwest of the Sheini area where the Oti River, located just 20 kilometres west of the Sheini area, is one of the main tributaries to the lake. The lake is formed by the Akosombo Dam, which was completed in 1965. At 8,502 square kilometres, Lake Volta is the largest man-made lake (by surface area) in the world. |
|
A major power line follows the Tamale- Yendi- Zabzugu- Tatale road (Figure 5.1), bringing power to the towns and villages along this route. Zabzugu is the closest town with electrical power and is located 20 kilometres northwest of the Project area. During the recent field work and prospecting in the southern part of the Project Area, a power line was also noted going to Nakpali, which is located approximately 25 kilometres southwest of the Project Area. |
CARDERO RESOURCE CORP. |
TECHNICAL REPORT SHEINI HILLS IRON PROJECT |
5-5 |
Flowing 20 kilometres west of the Project Area, the Oti River represents the major water source. The river rises in Burkina Faso and forms part of the international boundaries between Benin and Burkina Faso and between Togo and Ghana. The width of the Oti River varies, ranging from approximately 75 metres west of Zabzugu (20 kilometres northwest of the Project Area) to approximately 200 metres 25 kilometres south of the Project Area (Plate 5.6). | |
| |
5.8 |
MEDICAL CARE |
| |
The medical care in Tamale and in the Zabzugu-Tatale district is at acceptable level. There are many small hospitals in Tamale, including a Teaching Hospital, which has a laboratory and an emergency facility. The closest medical clinic to the Project Area is in Zabzugu. This clinic is managed by the government and is able to deal with minor injuries and medical problems. The clinic in Tatale managed by the Catholic mission has staff trained to deal with snake bites. According to Father Isidor from the Tatale Catholic mission, the clinic has anti-venom serums against all types of venomous snakes in the Project Area. | |
| |
5.9 |
COMMUNICATIONS |
| |
Ghana has good mobile phone coverage operated by five major mobile network providers, although the quality of the mobile phone signal in the Project Area is variable. Consequently, a reliable satellite phone will be installed prior to major exploration activities. | |
| |
5.10 |
INFRASTRUCTURE AND PORTS |
| |
The closest railway line in Ghana to the Project Area is the AccraKumasi rail line located approximately 350 kilometres south. The Ghana government has long-term plans to extend the existing railway line to Tamale and Yendi. | |
| |
A rail line exists closer to the Project Area across the border in Togo. At Blita, Togo, located approximately 100 kilometres southeast of the Sheini Village, the railway line extends south to the port at Lomé, Togos capital, and is used primarily for the transport of limestone and phosphates. | |
| |
In Ghana, the Tema sea port, the largest in Ghana, is located approximately 390 kilometres south- southwest of the Project Area and approximately 30 kilometres east of Accra (Figure 4.1). |
CARDERO RESOURCE CORP. |
TECHNICAL REPORT SHEINI HILLS IRON PROJECT |
5-6 |
Plate 5.1: Paved TamaleYendi road traverses flat topography. Plate 5.2: Unpaved ZabzuguSheini road (Dec 2010). Plate 5.3: Improved ZabzuguSheini road (March 2011). Plate 5.4: Main street in Zabzugu Village. Plate 5.5: Ridge formed by iron mineralization, south of Kandin Village Plate 5.6: Oti River draining south to Lake Volta.
CARDERO RESOURCE CORP. |
TECHNICAL REPORT SHEINI HILLS IRON PROJECT |
5-7 |
6 HISTORY
Records held by the Ghana government document the history and extent of historical exploration in the Sheini area. These records show that the area has been studied by several groups of explorers. The knowledge of historical work is complicated by the presence of incomplete reports with no maps or coordinates showing the location of the old workings. A number of the reports are in the form of handwritten manuscripts that are difficult to decipher. There is also no clear information about the location, size, and ownership of the previous exploration concessions in the Sheini area. The historical exploration work in the Sheini area can be divided into four major time periods:
6.1 |
ANCIENT EXPLORATION |
Ancient exploration and production is inferred by the presence of small piles of slag material (Plate 6.1) scattered from Kandin Village, around Sheini Village, and southward to the Kubalem area. It is interesting that all of these places are located near the ferricrete outcrops (recent indurated iron deposits at surface). The reason for this may be that the ferricrete material was easier for iron smelting using primitive techniques (charcoal, limestone, and water). The first iron smelted in the area was probably used for forming tools and hunting weapons. It is important to mention that some of the slag may have been produced by lightning strikesnatural melting of ferricrete or iron-rich laterite by high-voltage lightning. | |
6.2 |
PERIOD 19001945 |
Records of mineral exploration for the period 19001945 are not well documented due to a complex and changing political situation in the area. The Sheini area was originally located in the area known as Slave Coast and later as the German colony of Togoland (formed in 1905). After the German defeat during World War I (August 1914) at the hands of British troops (coming from the Gold Coast) and French troops (coming from Dahomey), Togoland became two League of Nations mandates administered by Britain and France. After World War II, these mandates became UN Trust Territories. The residents of British Togoland, where the Project Area is located, voted to join the Gold Coast as part of the new independent nation of Ghana in 1957; French Togoland became an autonomous republic within the French Union in 1959. | |
According to the GGSD, the iron mineralization was first discovered around 1905 by a team of German geologists under the leadership of Dr. Koert, who travelled to the area to explore the potential of the new German colony in Togoland. After the area became part of the British Empire, it was visited again and was mapped and prospected by the geologists of the Golden Coast Geological Survey Department (probably around 1930). The aims of this program were to produce geological maps of the British Colony and to discover new mineral resources. However, few records remain of the findings of these surveys. No records of exploitation exist, and it is unclear to what extent the iron mineralization was recognized. |
CARDERO RESOURCE CORP. |
TECHNICAL REPORT SHEINI HILLS IRON PROJECT |
6-1 |
6.3 |
PERIOD 19451980 |
The period from 1945 to 1980 was the most important for mineral exploration in the Sheini area. The iron mineralization evident since 1905 and the new ideas about construction of the Akosombo Dam meant that the Sheini area became more strategic for the development of Ghana. |
6.3.1 |
E. H. Jacques |
The first detailed exploration work that focused on the iron occurrences around Sheini Village was by E. H. Jacques in the 1950s. His report (1958) summarizing the exploration work was re- printed by the GGSD in 2003 (Archive Report No. 85). | |
According to this report, Jacques and his team carried out geological mapping, technical work, trenching (10 trenches), and diamond core drilling (nine boreholes) along the ridges with iron mineralization from Kandin in the north to the Kubalem area in the south, comprising approximately 35 kilometres of strike length. Jacques describes eight groups of iron-mineralized bodies from this large area. | |
All of the samples taken during this phase of exploration were assayed for iron and silica. A small number of samples were also assayed for phosphorous. The results, presented in Jacques report as tables, show iron grades in the range of 3050% iron, with silica content of usually more than 15% SiO2. The content of phosphorous is usually below 0.2% P2O5 but some of the samples contain 1.0%1.5% P2O5. Jacques is the first author to suggest that the source of the occasionally higher phosphorus content could be the clasts of granitic rocks (granite, pegmatite) and metamorphic rocks (quartz-sericite-chlorite schist) within the mineralized tillites. | |
The report also contains an incomplete set of cross sections at an obscure scale, constructed from a combination of trenches and surface outcrops or a combination of trenches and boreholes. However, the trench and borehole location maps and the surface geological maps are missing from the report and no trench or borehole coordinates are provided. | |
6.3.2 |
Soviet Union Exploration |
In the early 1960s, geoscientists from the Soviet Union were invited to Ghana to assist with geological mapping, prospecting, and performing numerous specific studies in northern Ghana. A large operations base was established in the city of Tamale. The Soviet experts were involved in the exploration projects until 1966, when they were requested to leave the country by the Ghanaian government. | |
The iron occurrences around Sheini Village were studied as part of one of the projects managed by the Soviets. The work included detailed geological mapping, trenching, and drilling. The results were summarized in several reports and some of them have been re-printed by the GGSD. | |
The reports indicate that the exploration was focused mainly on the areas northwest, west, and southwest of the Sheini Village. The reasons were probably easy access, availability of local labour, and the remains of old workings from the previous exploration carried out by Jacques. Although the available reports are again incomplete and without location maps or coordinates, there is one basic geological map showing five major bodies of iron mineralization outlined by the Soviet geologists (Figure 6.1) . The same map shows the position of 11 trenches (from 12 described in the report) and 19 pits (from 72 described in the report). Boreholes are not shown on this map, although the report describes the presence of at least 14 boreholes. |
CARDERO RESOURCE CORP. |
TECHNICAL REPORT SHEINI HILLS IRON PROJECT |
6-2 |
The geological map is accompanied by an approximately 1.5 -kilometre-long, eastwest-trending geological cross section over Bodies 4 and 5 (Figure 6.2) . The southern part of the Sheini area and the Kubalem area were explored probably only at regional scale. The Soviet regional exploration work also indicated fine-grained gold in heavy mineral stream concentrates south of Sheini Village.
CARDERO RESOURCE CORP. |
TECHNICAL REPORT SHEINI HILLS IRON PROJECT |
6-3 |
FIGURE 6.1: Soviet Geology Map
CARDERO RESOURCE CORP. |
TECHNICAL REPORT SHEINI HILLS IRON PROJECT |
6-4 |
FIGURE 6.2: Soviet Geological Cross Section
6.4 |
PERIOD 19802008 |
No significant exploration work was done in the Sheini area after the Soviet geologists left Ghana. According to the GGSD, small-scale exploration work was carried out by St. Jude Resources Ltd. (Vancouver, BC) in the area of the Sheini North Prospecting License during 20042006. The exploration was testing the concept that the iron occurrences may be of epigenetic origin similar to Olympic Damtype IOCG deposits. St. Jude tested its collected samples for gold, but the results from the Sheini area were low (3 ppb). Of more interest were results reported from the Kubalem area where some laterite samples contained 3040 ppb gold and one sample contained 400 ppb gold. The details of the work and the sample locations are not known, and there appears to be no record of the location and size of the concession. St. Jude Resources exploration concession expired in 2006. |
CARDERO RESOURCE CORP. |
TECHNICAL REPORT SHEINI HILLS IRON PROJECT |
6-5 |
Plate 6.1: Piece of iron slag (10 centimetres across) discovered east of the Kandin Village. Plate 6.2: One of the Soviet trenches when it was discovered in December 2010. The trench was later cleaned, documented, and sampled. Plate 6.3: Casing of an old Soviet exploration drillhole. Plate 6.4: Old concrete drilling sump. Plate 6.5: 13 April 1965 written at the wall of old drilling water sump.
CARDERO RESOURCE CORP. |
TECHNICAL REPORT SHEINI HILLS IRON PROJECT |
6-6 |
6.5 |
PERIOD 2008- PRESENT |
In 2008, the Minerals Commission of Ghana granted non-exclusive exploration permits to six companies (Gold Coast Resources Limited, Marula Mines Ghana Limited, Integrated Metals Limited, Azumah Metals Ghana Limited, Inland Ghana Mines Limited, and Minergy Resources Limited) to allow each of them to search for iron ore within the Sheini area by geochemical and photo-geological surveys or other remote sensing techniques within a specified period of time. The deadline for final reporting was the second half of March 2011. A further seven companies (Pan African Minerals Company Limited, RSP International Ghana Limited, Compass Resources Limited, Emmaland Resources Limited, Wesun-Lu Ghana Mining Limited, Trans Global Drilling, and Energy Exploration Limited) were granted similar permits in 2010, with the same deadline as the first six companies. |
|
The size of the non-exclusive exploration permit granted was 178.81 square kilometres, coincident with Emmaland's current Sheini Prospecting Licence and part of the Sheini North Prospecting License (Figure 6.3). The Minerals Commission of Ghana ran a competitive bidding process, with the Prospecting Licences being awarded to the company submitting the winning bid. A report was submitted by each company, including due diligence sampling results (where such work had been done), together with recommendations for multi-phase exploration and ultimate exploitation of the iron mineralization in the Sheini area. |
|
The only company to undertake comprehensive due diligence work under the terms of the permit was Emmaland. The initial work was carried out by Emmaland, who hired three geologists from the GGSD (E. Cheremeh, S. Annum, and K. Ahumah). Their work included geological mapping, rock sampling, pit excavation (10 pits), and trench sampling. |
|
In December 2011, Aurum Exploration Services, Ireland, was engaged by Emmaland to run a three- month exploration program to collect adequate data to submit a successful report to the Minerals Commission of Ghana. The exploration consisted of geological mapping and prospecting, locating historical exploration workings and boreholes, and cleaning, documenting, and re-sampling historical trenches. A total of 659 channel samples (755 samples including duplicates and blanks) were collected from the historical trenches and 307 samples were assayed. The details of this work are presented in Section 9. |
|
The results of the work, together with recommendations for a further exploration program, were summarized in the report submitted to the Minerals Commission of Ghana before the deadline. On December 8, 2011, the Minerals Commission of Ghana issued three Prospecting Licenses covering the Project Area to Emmaland. |
CARDERO RESOURCE CORP. |
TECHNICAL REPORT SHEINI HILLS IRON PROJECT |
6-7 |
FIGURE 6.3: Original Non-Exclusive Exploration Licence
CARDERO RESOURCE CORP. |
TECHNICAL REPORT SHEINI HILLS IRON PROJECT |
6-8 |
6.6 |
RECOVERY OF DATA |
The major exploration work in the Sheini area was carried out between 1945 and 1980 by two major exploration teamsJacques (1958) and a team of Soviet geologists (19601966). | |
Jacques report describes 10 trenches and nine diamond core boreholes (both vertical and inclined). The report indicates problems during the drilling using tricone drill bits, which were performing better than diamond drill bits. This means that some caution may be required in relation to the drilling results. The geological and location maps in Jacques report are missing, so although the results are informative, they cannot be located and replicated in the field. | |
The Soviet reports indicate that 14 boreholes (vertical and inclined) with a maximum depth of 183 metres were drilled and that at least 12 trenches and 72 pits were excavated. However, only one geological map showing the positions of trenches has been recovered. The position of the boreholes, together with the drilling results, is unknown and the work is therefore of little direct use in guiding future exploration. | |
Due diligence field work by Emmaland revealed the location of 35 historical trenches and 18 historical boreholes. Almost all of these historical trenches are located in the syncline area west of Camp Villages (Figure 6.4). Only three trenches were discovered in the ridges east of Sangba Village. The trenches are situated mainly on the ridges and steep slopes, oriented in an eastwest direction. Only a few trenches (syncline area) are oriented in a northsouth direction. At the time when the trenches were discovered in 2010 and 2011, they were overgrown and partly collapsed (Plate 6.2) with no signs of recent exploration activity. It is likely that these trenches are the remains of the work carried out pre-1980. | |
Some of the discovered historical boreholes still have small pieces of casing (sometimes with borehole number) at the surface (Plate 6.3) and with a concrete water sump located next to it (Plate 6.4). Pieces of core containing barren hanging wall formations were discovered close to one of these holes along with the date 13 April 1965 (Plate 6.5) written on one concrete water sump. Although some of the boreholes are numbered, it is largely impossible to distinguish which boreholes were drilled by Jacques and which ones by the Soviets. An even more complicated situation occurs with the historical trenches because recent work has discovered more old trenches in the Project Area than those described by Jacques and the Soviets combined. Almost all of the discovered old trenches were in poor conditions and were cleaned before being documented and channel sampled (detailed in Section 9). | |
6.7 |
HISTORICAL RESOURCE ESTIMATES |
Both Jacques and the Soviet geologists tried to estimate reserves and resources based on the exploration work they each completed. Jacques report describes 10 trenches and nine diamond core boreholes spread over a width of one kilometre and a length of more than 35 kilometres, where he described a thickness of iron mineralization varying between 10 metres and 50 metres. It is clear that some of the holes didn't reach the iron mineralization and that some of them were finished within the iron mineralization due to technical problems, so the information about thickness is considered to be highly unreliable. |
CARDERO RESOURCE CORP. |
TECHNICAL REPORT SHEINI HILLS IRON PROJECT |
6-9 |
According to the available, albeit fragmented, Soviet reports, their exploration teams working in the Project Area during the 1960s carried out slightly more intensive exploration than Jacques. The Soviet technical work consists of 14 boreholes (vertical and inclined) with a maximum depth of 183 metres, at least 12 trenches, and 72 pits. The recent location of the old Soviet workings indicates that approximately 90% of their work had been done in a zone of iron mineralization approximately three kilometres long located southwest of the Sheini Village (west of Camp Villages). A smaller amount of work was completed in the large ridges west and northwest of the Sheini Village and no Soviet trenches and boreholes were observed in the Sheini South area or in the Kubalem area.
In comparison with the current Emmaland Prospecting Licences, which extend over 50 kilometres strike length, the Soviet work covered approximately 6% of the current exploration package. Although the available information from Soviet work only appears to cover part of the mineralized belt, the historical report (Bobrov and Pentelkov, 1964) describes estimated reserves for that portion. However, the author has reviewed the report and methodology and the resulting calculation and does not believe that the reported reserves are at all reliable or that they provide any useful information with respect to the ongoing exploration of the Project Area.
CARDERO RESOURCE CORP. |
TECHNICAL REPORT SHEINI HILLS IRON PROJECT |
6-10 |
FIGURE 6.4 : Map of Historical Excavations Located During Due Diligence Work
6.8 |
HISTORICAL PRODUCTION |
The only evidence of mining from the Sheini area consists of small ancient and undated hand excavations of ferricrete outcrops. There has been no modern iron ore mining and production within the known iron mineralization from Kandin in the north to Kubalem in the south during the last two centuries. |
CARDERO RESOURCE CORP. |
TECHNICAL REPORT SHEINI HILLS IRON PROJECT |
6-11 |
7 GEOLOGICAL SETTING AND MINERALIZATION
7.1 |
REGIONAL GEOLOGICAL SETTING |
At the regional scale the Sheini area is located within the eastern part of the West African Craton called the Eastern Pan African Domain (Wright et al., 1985). |
FIGURE 7.1: Summary Geology of West Africa
The major feature of this domain is the large late Proterozoic to early Palaeozoic Volta Basin (Figure 7.1), which is composed of mainly flat-lying sediments surrounded in the east by north-northeast to north-south-trending, low-metamorphic-grade supracrustal belts. The most important belt is the Togo Belt (Figure 7.2), starting in southeast Niger and running southsouthwest to southeastern Ghana. This belt is composed of Buem Formation, forming a ridge immediate east of the Volta basin, followed to the east by the Togo Formation, also known as Akwapimian in southeastern Ghana and the Atacora unit in Togo and Benin (Wright et al., 1985).
CARDERO RESOURCE CORP. |
TECHNICAL REPORT SHEINI HILLS IRON PROJECT |
7-1 |
FIGURE 7.2: Summary Geology of Volta Basin and Togo Belt
The Volta Basin, which covers almost 45% of Ghanas surface, is composed mainly from shallow marine platform sediments with ages ranging from 1,000 Ma to 500 Ma. The Volta Basin is composed of three major units (Wright et al., 1985):
| Lower VoltaianKwahu and Morago Groups | |
| Middle VoltaianOti Group | |
| Upper UnitObosum Group |
CARDERO RESOURCE CORP. |
TECHNICAL REPORT SHEINI HILLS IRON PROJECT |
7-2 |
The lower part of the basin is filled with a thick sedimentary sequence known as the Kwahu Group (south and southwest part of the basin) and Morago (Bombouaka) Group (north and northwest part of the basin). These groups are approximately 7001,000 Ma and are composed of flat-lying, massive, cross-bedded, shallow sandstones and arkoses.
The Kwahu and Morago Groups are overlain by the Oti Group sediments (570675 Ma). The basal conglomerates are interpreted as tillites, which contain up to one-metre-large boulders with an angular to sub-angular shape and striations at the surface. The rest of the Oti Group is composed of shallow marine platform clastic sedimentssandstones, micaceous sandstones, and arkoses. Thin layers of carbonates (limestones, dolomites) are also present. Alkali-rich volcanic and volcaniclastic rocks correlating with the lower parts of the Oti Group are reported from the eastern part of the basin.
The Obosum Group represents the youngest sedimentary sequence of the Volta Basin (450570 Ma). Its contact with the Oti Group is unconformable, and the Obosum Group is thickest and coarsest in the south-eastern part of the basin where conglomerates containing pebbles of various igneous and slightly metamorphosed rocks occur. Sandstones and siltstones are also known to form part of this group. The Obosum Group beds are also interpreted as molasse deposits formed by erosion of the Togo Belt.
The Volta Basin sediments overlay highly metamorphosed basement rocks composed of meta-volcanosedimentary units of early Proterozoic age, as well as metasedimentary basins and granite complexes of similar age that are known as Birrimian units. The deformation and metamorphism of these basement rocks are dated at around 2,100 Ma.
The eastern margin of the Volta Basin is formed by the Togo Belt, which comprises supracrustal sediments and volcanics of probable late Precambrian to early Phanerozoic age. The Togo Belt consists of Buem Formation (which is closest to the Volta Basin) and Togo Formation. According to the latest field observations, the Sheini area is probably located within the Buem Formation which forms a belt 1530 kilometres wide following the Ghana-Togo border with the larger part of this formation being located within Togo. The rocks of the Buem Formation are dominated by east- to southeast-dipping clastic sediments, mainly sandstones, siltstones, shales, and mudstones. Massive chert (silexites), limestones, and dolomites are known from Togo.
The Iron Formations are located mainly within the Ghanaian part of the Buem Formation, but some of the bodies also cross the border into Togo. The Iron Formations are associated with tillites situated near the base of the Buem Formation. These tillites may be comparable with the tillites of the Oti Group (Volta Basin). The Togo part of the Buem Formation also contains sequences of various volcanic rocks (alkaline and calc-alkaline), some of which are interpreted to have been formed on the sea floor due to preserved pillow structures. The rocks of the Buem Formation are largely not metamorphosed. It is believed that the deformation of this formation is mainly the result of compressional tectonics.
CARDERO RESOURCE CORP. |
TECHNICAL REPORT SHEINI HILLS IRON PROJECT |
7-3 |
7.2 |
SHEINI PROJECT GEOLOGY |
The Project Area is located at the boundary between the underlying Volta Basin (Oti Group) and Buem Formation, which hosts the Iron Formations. The exact position of the border between these two major units is not clear due to poor outcrop distribution east of the north south-trending ridges formed by the quartzites and Iron Formations. However, these ridges are thought to be part of the Buem Formation. | |
Rocks of both formations are not metamorphosed. The rocks of the Oti Group are usually not deformed and are flat-lying. The rocks of the Buem Formation are slightly folded, dipping mainly to the east. However, some of the Iron Formations and quartzites in the northern part of the Sheini area (in particular between Kandin and Tatale) are probably dipping to the west. The rocks that occur within the Sheini concession areas can be divided into three major groups: |
|
The footwall to the Iron Formation is composed of sandstones, arkoses, mudstones, and shales of the Oti Group and Sheini quartzites, which are probably part of the Buem Formation. | |
|
The Iron Formation includes BIF, chert, and ferruginous tillites. | |
|
The hanging wall to the Iron Formation is composed of mudstones, greywackes, polymictic sandstones, and quartzites of the Buem Formation. |
7.2.1 |
Footwall |
The sedimentary rocks of the Oti Group outcrop west of the Sheini Hills. The most common rock types are ferruginous feldspathic sandstones (Plate 7.1), arkoses, and shales. Outcrop density is very low in the Project Area due to low weathering resistance of these rocks. Areas with soft sand are located close to the outcrops. The Sheini quartzites form ridges, isolated rounded hills, and boulder outcrops (Plate 7.2) that surround the eastern part of the iron mineralization north of Camp Villages. Quartzites probably form the immediate footwall of the iron mineralization. Outcrops and large boulders of massive, white, or slightly greenish quartzite with rare grains of feldspar and mica are located west of the Sheini Village and east of Kandin Village where the quartzite ridges continue northward following the western border of the Sheini North Prospecting License. The massive nature of these beds means it is nearly impossible to measure the dip direction of the rocks, but outcrops east of Kandin indicate dips toward the west. Similar quartzites follow the western part of the iron mineralization, again located in footwall, in the Sheini South Prospecting Licenses area. | |
7.2.2 |
Iron Formations |
The Iron Formation produces a folded sedimentary unit several hundred metres thick and outcropping along wide ridges, or sets of parallel ridges, running for more than 35 kilometres in a north-south direction. These ridges are composed of a number of horizons varying in lithology, grain size, and mineral composition. The ridges with Iron Formation are present at four major locations within this area (Figure 7.3): |
CARDERO RESOURCE CORP. |
TECHNICAL REPORT SHEINI HILLS IRON PROJECT |
7-4 |
|
Tatale Area (Sheini North Prospecting License): visible mineralization for several hundred metres surrounded by ferricrete. | |
|
Camp 1-Sheini Area (Sheini Prospecting License): almost continuous ridge 10 kilometres long composed of many large bodies of iron mineralization surrounded by large ferricrete fields. | |
|
Camp 2-Jayando Area (Sheini & Sheini South Prospecting Licenses): almost continuous ridge 13 kilometres long (Plate 7.3) composed of many large bodies of iron mineralization (3050% of this large mineralized area is located in Togo). | |
|
Kubalem Area (Sheini South Prospecting License): large area with small hills and low elevated hills surrounded by large ferricrete fields. |
There is a large area with flat have a thictopography between Sheini Village and Tatale. Large ferricrete fields east of Kandin Village indicate the presence of iron mineralization in this area, probably covered by younger sediments. This interpretation will have to be investigated with future exploration activities.
The individual horizons of the Iron Formation kness varying between 20 and more than 100 metres and are inter-bedded with sandstones, siltstones, and probably quartzites. The iron-bearing horizons dip 10°45°, mainly to the east-southeast (in the Sheini South and Kubalem area) and also to the west in the area west of Sheini Village. Some outcrops also contain vertical dipping horizons. The most interesting structure within the Sheini area seems to be a syncline (historical Block 5 defined by the Soviets) located west of Camp Villages and extending for almost three kilometres in the northsouth direction.
CARDERO RESOURCE CORP. |
TECHNICAL REPORT SHEINI HILLS IRON PROJECT |
7-5 |
Plate 7.1: Outcrop of ferruginous sandstone of the Oti Group. Plate 7.2: Boulder and outcrop of white quartzite (probable immediate footwall to Iron Formations). Plate 7.3: 13-kilometre-long Iron Formation ridge in the Sheini South Prospecting License hosting multiple Iron Formation bodies.
CARDERO RESOURCE CORP. |
TECHNICAL REPORT SHEINI HILLS IRON PROJECT |
7-6 |
FIGURE 7.3: Geological Map of the Sheini Arrea
CARDERO RESOURCE CORP. |
TECHNICAL REPORT SHEINI HILLS IRON PROJECT |
7-7 |
The most common texture is breccia-like lithology, which is described by historical and recent reports (Jacques, 1958; Cheremeh, 2010) as ferruginous tillite (Plate 7.4). The rock contains fragments with diameters from several millimetres to more than one metre, surrounded by a very fine hematite matrix. The fragments represent various lithologies, ranging from sedimentary rocks (quartzites, sandstones) to igneous (granites, pegmatites), and metamorphic rocks (various micaceous schists). For the purpose of the recent exploration, this lithology has been named as Fragmental. | |
Fragmental forms thick layers and lenses, producing undulating topography followed by layers of the BIF, which can be several metres thick. The layers are thickly or thinly banded and laminated (Plate 7.5), where the colour of the bands probably indicates the ratio of hematite to quartz. The BIF often contains thin beds of coarse-grained sandstone and jasper or chert. BIF morphologically forms narrow sharp ridges and is easily mapped where exposed. | |
Ridges of Iron Formation are often surrounded by large tabular bodies of soft or hard ferricrete, which is formed from the weathering of the Iron Formations. | |
7.2.3 |
Hanging Wall |
The hanging wall of the Iron Formation is formed by mudstones, greywackes, or polymictic sandstones. These rocks are not outcropping at the surface and were discovered during detailed geological mapping of the syncline located west of the Camp Villages based on pieces of core left close to one of the historical drill sites. The amount of core with hanging wall formation left at this drill site indicates that the thickness of the hanging wall of the Iron Formation is probably less than 30 metres. |
7.3 |
TYPES OF IRON FORMATION |
There are three main types of iron mineralizationFragmental, BIF, and ferricretewith a variety of subtypes in the Sheini area. During the 1950s1970s, Jacques and the Soviet geologists used similar terms to describe various types of iron mineralization observed in natural outcrops, trenches, and boreholes. | |
In general, the thickness of the Iron Formation varies from 20 metres to 150 metres. A major part of the recent due diligence work was focused on the syncline west of Camp Villages due to the number of trenches opened within the Iron Formation at surface. | |
The best outcrop of the Iron Formation in this area was observed in the trench numbers STW- 04 and STW-04b, located in the eastern limb of the syncline where the thickness of the formation is approximately 130 metres. The sequence may be thicker than 130 metres here due to several more outcrops (in situ) located east of the eastern end of trench STW-04b. |
CARDERO RESOURCE CORP. |
TECHNICAL REPORT SHEINI HILLS IRON PROJECT |
7-8 |
The situation in the western limb of the syncline is more complex due to several lenses or layers of quartzite and sandstone surrounding the mineralization. However the thickness of the iron mineralization is probably more than 150 metres. There are also large surface outcrops of iron mineralization west and southwest of Sheini Village and west of the Sangba Village (Plate 7.7), indicating the thickness of the iron mineralization is in the range of 50150 metres.
7.3.1 |
Fragmental Iron Formation |
The Fragmental is the most common lithology within the area of mapped Iron Formation. It forms layers that are usually more than 1025 metres thick. The rock is softer than the BIF and readily weathers due to the contained fragments of granitic rocks. As a result, it does not form outcrops and is mostly exposed in trenches. Ridges underlain by Fragmental are usually smooth, undulating, and covered by a hard ferricrete layer or thick scree with rock fragments smaller than 10 centimetres in diameter. | |
This lithology resembles a breccia in texture and was described by historical and recent reports (Jacques, 1958; Cheremeh, 2010) as ferruginous tillite (Plate 7.4). The rock contains various amounts of unsorted fragments that are usually angular, subangular, and rarely rounded, hosted in a very fine red or reddish brown haematitic matrix. One 20- centimetre-thick layer of unusual ferruginous conglomerate (Plate 7.7) was noted in trench STW-15 in the western limb of the syncline area. | |
The size of the fragments varies between 1 millimetre to about 1 metre in diameter. The fragments represent various lithologies, commonly sandstone and quartz-albite-sericite schist, but also quartzite, granites, pegmatite, or basic/ultrabasic rocks. Small grains of black shiny volcanic glass were also observed. | |
It is important to mention that the Fragmental does not contain fragments of the Iron Formation. The matrix is formed by a very fine (less than 0.5 mm) mixture of iron oxides (hematite), iron hydroxides (goethite, hydrohematite), and silica (quartz, opal- chalcedony-jasper). | |
Fragmental can be divided into three subtypes according to the size of the fragments: |
| Type IAfragments below 1 mm | |
| Type IBfragments 110 mm | |
| Type ICfragments larger than 10 mm |
Type IA is not very common in the Project Area. It sometimes passes laterally into the BIF and it can be difficult to distinguish between these two lithologies. This subtype is more weathering-resistant than other subtypes of the Fragmental and it forms surface outcrops with limestone-like morphologic features. The rock is brownish red to brick red with very small amounts of fragments that are no more than one millimetre in size.
CARDERO RESOURCE CORP. |
TECHNICAL REPORT SHEINI HILLS IRON PROJECT |
7-9 |
Fragmental Type IB (Plate 7.4) is the most common type within the Fragmental in the Project Area. The typical rock of this subtype is reddish brown with a matrix of very fine grained hematite. | |
Fragmental Type IC is not common (fragments larger than 5 centimetres are very rare). The rock is very similar to Fragmental Type 1B but contains a very limited amount of fragments with a diameter of 20 centimetres or greater. It is interesting that the large fragments are commonly located close to the boundary between Fragmental and BIF. Layers and lenses (approximately 20 centimetres thick) of unusual conglomerate (Plate 7.7) were discovered in the same trench as the largest schist fragment. This rock contains unsorted subangular-to-rounded fragments with diameters between one millimetre and two centimetres of sandstone, limonitized greywacke, and fine-grained granite. The amount of brownish grey matrix is approximately 5%10%. The contact with surrounding grey BIF is sharp. | |
7.3.2 |
Banded Iron Formation |
BIF is also common in the Project Area, but the layers of this lithology are thinner than the Fragmental. Due to the high weathering resistance of this rock type (fine grained, no fragments), the outcropping layers are easily visible in the field, forming narrow ridges surrounded by stony colluvium with blocks up to three metres in diameter (Plate 7.8). Individual BIF beds are usually several metres thick with a maximum 25 metres observed in the trench STW-04 located in the eastern limb of the syncline. | |
This rock type is fine grained and can be thick banded (Plate 7.9), thin banded (in millimetre to centimetre scale), or very finely laminated with lamination visible under a hand lens or microscope. The bands and laminae are composed of black and grey to dark brown hematite and a reddish brown to red mixture of hematite, goethite, hydrohematite, and fine-grained silica. There are very fine (less than 1 millimetre) grains of magnetite disseminated in the rock. Assays of some samples indicated the presence of microscopic phosphates (apatite). Rare tiny veinlets of aluminum phosphate (trolleite) were also discovered in some of the samples of the BIF. This mineral occurs at other iron deposits (Västanå Iron Mine, Sweden). | |
The BIF often contains thin beds of coarse-grained sandstone (up to five centimetres thick) and layers or lenses of jasper or other types of cryptocrystalline or amorphous silica (opal, chalcedony). BIF can be divided into three subtypes depending on the content of impurities (sandstone or silica): |
| Type IIAno visible impurities (thick or thin banded) | |
| Type IIBcontains sandstone layers | |
| Type IICcontains bands and lenses of silica (jasper) |
CARDERO RESOURCE CORP. |
TECHNICAL REPORT SHEINI HILLS IRON PROJECT |
7-10 |
Sandstone layers are often irregular, discontinuous, and slightly folded together with the host Iron Formation (Plate 7.10). The BIF very rarely contains fragments of various rocks (similar to the Fragmental). These fragments are discordant with the bedding. It was also observed that deformed sandstone layers (Plate 7.11) are located close to these fragments, which may support a hypothesis about glacial drop stones falling into soft iron-rich sediment at the sea floor. | |
Silica forms layers and lenses up to 50 centimetres thick that are concordant with the banding of the iron mineralization. This silica usually does not contain 100% SiO2 but also contains various amounts of fine disseminated iron mineralization. Three colours ofsilica layers and lenses were observed in the Project Area: red (most common, Plate 7.12), greenish grey (rare), and pale yellow to white (very rare). The silica bodies are very fine grained where the crystallinity is not visible to the naked eye. Veinlets of crystalline, low-temperature quartz (with comb structures) were observed filling fractures in cryptocrystalline silica. | |
7.3.3 |
Ferricretes |
The outcrops of the Iron Formation are largely surrounded and partly covered by ferricrete, which is a recent deposit and the product of weathering of the Iron Formation. Ferricrete is an end-member laterite that has become intensely indurated and entirely cemented together. Two major types of ferricrete occur in the Project Area: |
| Type IIIAhard ferricrete forming layers and platforms at recent surface | |
| Type IIICdisaggregated ferricrete forming deposits with gravel size fragments |
Within the ridges, the ferricrete usually occurs above the Fragmental and also above the strongly fractured and brecciated zones. The maximum thickness of disaggregated ferricrete observed in the field was several metres. The maximum thickness of the hard indurated ferricrete was approximately 1.5 metres.
CARDERO RESOURCE CORP. |
TECHNICAL REPORT SHEINI HILLS IRON PROJECT |
7-11 |
Plate 7.4: Fresh outcrop of Fragmental. White quartzite clast in centre is 1cm across. Plate 7.5: Outcrop of finely laminated BIF. Plate 7.6: Hills and ridges of iron mineralization west of the Sangba Village, view to the north. The mineralization is dipping to the east (right). Hills on the horizon are part of the syncline structure west of Camp Villages. Plate 7.7: Ferruginous conglomerate discovered in the western limb of the syncline. The fragments are mainly sandstone and greywacke, with minor granite. Left bottom corner of the specimen is massive banded iron lithology. Plate 7.8: Large blocks of BIF northwest of Camp Villages. Plate 7.9: Outcrop of thick BIF.
CARDERO RESOURCE CORP. |
TECHNICAL REPORT SHEINI HILLS IRON PROJECT |
7-12 |
Plate 7.10: Slightly folded BIF containing irregular and discontinuous sandstone layers (western limb of the syncline, west of Camp Villages). Plate 7.11: Deformed and disturbed sandstone layer within the BIF (western limb of the syncline, west of Camp Villages). Plate 7.12: Lens of red jasper within the BIF (western limb of the syncline, west of Camp Villages).
CARDERO RESOURCE CORP. |
TECHNICAL REPORT SHEINI HILLS IRON PROJECT |
7-13 |
The disaggregated ferricrete is the most common but visible only in the trenches and recently made road cuts. It consists of gravel-size fragments composed of both BIF and Fragmental. It usually forms thick deposits at the foot of the hills and ridges below the scree or colluvium sediments.
The hard ferricrete can often be seen in flat areas close to the foot of the ridges and also at the small platforms within the ridges. The hard ferricrete is composed of fragments of Fragmental or BIF cemented by secondary iron hydroxides.
CARDERO RESOURCE CORP. |
TECHNICAL REPORT SHEINI HILLS IRON PROJECT |
7-14 |
8 DEPOSIT TYPES
At present there is not enough data to determine the exact type of deposit. The exploration work has just commenced and knowledge of the iron mineralization in the Project Area has come primarily from mapping. To date, there is limited geochemistry from the area and there is no detailed lithology, mineralogy (thin sections), dating, or drilling from which to get information about the thickness of the iron mineralization or the underlying, presumably fresh, unoxidized primary lithologies.
According to the geologists of the GGSD, the Sheini area can be characterized as
| IOCG (iron oxide copper gold)-type mineralization in a range between Kiruna-type and Olympic Damtype |
| Banded Iron Formation (BIF) and related tillites |
8.1 |
IRON OXIDE COPPER GOLD MODEL |
The author considers the IOCG option to be highly unlikely. The only similarity with IOCG is the breccia-like lithology of the Fragmental containing large amounts of various clasts. However, mineralization in the Project Area has clear sedimentary features with banding, folding, and clear sedimentary rocks in the footwall and hanging wall. There is no evidence for deep crustal structures in relation to the mineralization. The geochemical features of the Sheini iron mineralization also do not show any evidence for IOCG-type with no uranium, no background levels of rare earth elements, and no background levels of copper and gold to state just some of the inconsistencies. | |
8.2 |
BANDED IRON FORMATION MODEL |
The observed geological, mineralogical, and geochemical features indicate that the Sheini mineralization fits a BIF model. The wide-scale presence of hematite and rarity of magnetite may indicate H-BIF. More likely, however, the low amount of magnetite at surface is probably due to surface alteration (oxidation) of magnetite to hematite (martite). | |
The relationship between hematite and magnetite will be clarified by the planned drilling. Based on analogy with other West African BIFs, the upper, oxidized layer is likely to be 70 120 metres in thickness. The oxidized layer is probably underlain by a magnetite-facies, primary BIF. |
CARDERO RESOURCE CORP. |
TECHNICAL REPORT SHEINI HILLS IRON PROJECT |
8-1 |
9 EXPLORATION
The initial exploration work in the Sheini area, completed by Emmaland and Cardero Ghana, was carried out during late 2010 and throughout 2011.
The initial phase of work, from late 2010 to mid-2011, was focused on obtaining sufficient data to meet the requirements of the Minerals Commission of Ghana and to successfully win the tender to obtain an exploration concession over the Sheini area.
The second phase of exploration, subsequent to the issue of the three Prospecting Licences to Emmaland in late 2011, has consisted of reconnaissance mapping over new areas to the north and south of the original, non-exclusive licence.
The exploration work completed to date includes
|
Prospecting the Project Area from Tatale in the north to Kubalem in the south and locating historical workings, primarily trenches and boreholes. |
|
Reconnaissance geological mapping over the Project Area to obtain an overall view of the surface extension of the iron mineralization and surrounding lithological types. |
|
Detailed geological mapping in scale 1:2,500 of the syncline area located west of Camp Villages. This area was selected due to large amounts of outcrops, extensive iron mineralization, and historical trenches. |
|
Cleaning and channel sampling of selected historical trenches in the syncline area west of the Camp Villages. |
|
Construction of an initial access road to the syncline area west of Camp Villages. |
9.1 |
MAPPING AND SAMPLING OF HISTORICAL WORK |
According to the available historical reports, there was extensive exploration carried out in the Sheini area between 1945 and 1980. No maps or tables showing the exact location of the historical workings (trenches and boreholes) remain. For this reason, prospecting focused on locating these old workings to obtain an overview of the scale of the historical exploration work. | |
A total of 35 historical trenches, mainly trending eastwest, with a total length of around 2,076 metres have been located to date (Figure 9.1). Thirty-two trenches were located in the syncline area, west of Camp Villages. Only three trenches have so far been located in the ridges east of the Sangba Village. There are likely some undiscovered historical trenches in the area west and southwest of Sheini Village. |
CARDERO RESOURCE CORP. |
TECHNICAL REPORT SHEINI HILLS IRON PROJECT |
9-1 |
FIGURE 9.1: Historical Trenches and Drillholes Located Close to Sheini
The trenches are situated mainly along the ridges and steep slopes exposing the iron mineralization where access for drilling was difficult. Most of the trenches are oriented in an eastwest direction, which is perpendicular to the trend of the iron mineralization. Only a few trenches in the syncline area are oriented in a northsouth direction. At the time when the trenches were located during 2010 and 2011, they were largely overgrown and partly collapsed. All of the discovered historical trenches have since been excavated by hand. The average width of these trenches is 0.75 1.0 metres. The depth of the trenches varies depending on the depth of the bedrock but ranges between one and four metres. The length of the individual historical trenches ranges between 10 and 163 metres.
CARDERO RESOURCE CORP. |
TECHNICAL REPORT SHEINI HILLS IRON PROJECT |
9-2 |
The following trench parameters were measured and recorded from each trench that was located during prospecting:
| Coordinates of the start and end of the trench using a handheld GPS | |
| Length of the trench | |
| Direction and inclination using a geological compass | |
| Lithology | |
| Dip and strike of each rock formation |
In addition to the trenches, 18 historical boreholes were located during prospecting (Figure 9.1) . According to the historical reports, 23 boreholes were drilled during the 1950s1970s. It is not clear which of the located collars were drilled by Jacques team in the 1950s or by the Soviet team in the 1960s. Nearly all of the located boreholes are vertical or nearly vertical. Casing with 120 millimetres diameter was usually left at the drill pad to mark the borehole location (Plate 9.1) . Borehole numbers are still visible at some collars. Concrete sumps are located close to every drill pad and there is also evidence of old access roads connecting the drill pads with the old road system as well as discarded drill equipment (Plate 9.2) . Core was occasionally found at drill pads. In one instance, approximately 30 metres of core was left on the ground close to the borehole with number BH10 (Plate 9.3) . The entire core is from the hanging wall sequence (grey mudstone, greywacke, and quartzite). Pieces of core from the iron sequence were not found, indicating these were removed from the area for sampling.
As with the historical trenches, there appears to be very limited data related to the drilling program remaining in the archives of the GGSD. Appendix A includes coordinates of all historical boreholes that have been located to date.
CARDERO RESOURCE CORP. |
TECHNICAL REPORT SHEINI HILLS IRON PROJECT |
9-3 |
Plate 9.1: Historical drill hole casing. Plate 9.2: Old drill bit from historical work. Plate 9.3: Historical drill core. Plate 9.4: Channel sampling of near-surface Iron Formation in re-opened historical trench.
CARDERO RESOURCE CORP. |
TECHNICAL REPORT SHEINI HILLS IRON PROJECT |
9-4 |
9.2 |
GEOLOGICAL MAPPING |
Although the Sheini area was mapped in detail several times in the past (19451980), only one basic geological map made by the Soviet geologists remains in the government archives. For this reason, reconnaissance geological mapping was carried out over the Project Area to examine the approximate extent of the iron mineralization and the surrounding lithological types to help with planning further exploration programs. This mapping covered the whole Project Area with surface outcrops of iron mineralization from Tatale in the north to Kubalem in the south. Due to inaccurate topographic maps (official maps 1:50,000), an Aster contour map was used as a basis for mapping (Figure 9.1). The following information was collected during the reconnaissance geological mapping: |
| Lithology at documented surface outcrops (150 outcrops) | |
| Structural measurements (dip direction and dip) | |
| Samples from outcropping Iron Formation and surrounding lithology (23 samples) |
After documenting the surface outcrops of the iron mineralization, it was clear that more detailed mapping would be required to provide adequate information to construct cross sections. A scale of 1:2,500 was chosen as the best for this purpose. Geological units with a thickness of 2.5 metres or greater could then be represented on the map. The syncline structure west of Camp Villages was chosen as the best location for the pilot mapping project at this scale due to the greater outcrop density and the possibility that this will be one of the first areas to be drilled. An area of approximately 1.370 km x 1.480 km was mapped (Figure 9.2) at this scale and four 1,375-metre-long cross sections (with 400-metre spacing) were constructed (Figure 9.3) .
CARDERO RESOURCE CORP. |
TECHNICAL REPORT SHEINI HILLS IRON PROJECT |
9-5 |
FIGURE 9.2: Detailed Geological Map of the Area West of Camp Villages
FIGURE 9.3: Interpreted EastWest Cross Section N1007100
CARDERO RESOURCE CORP. |
TECHNICAL REPORT SHEINI HILLS IRON PROJECT |
9-6 |
9.3 |
TRENCH CLEANING AND SAMPLING |
In total, 35 historical trenches were discovered during prospecting work across the Project Area. According to the historical reports (Jacques, 1958; Bobrov and Pentelkov, 1964), these trenches were documented and channel sampled and the samples were assayed. The trench coordinates maps with trench locations, a large part of the trench documentation, and the sample assays are missing from the archives. | |
Nearly all of the trenches are located in places with difficult accesson upper parts of the ridges or on steep slopes on the ridges and hills. During the last 4050 years, the trenches have been filled by natural collapses and some of them have become almost invisible in the field. Limited or impossible access to the trenches excluded use of a mechanized excavator and the trenches were cleaned by hand using labour from Sheini and Camp Villages (Plate 9.4). | |
In total, 29 trenches (including extensions) with an approximate length of 1,552 metres have been cleaned and prepared for sampling to date. The coordinates of the cleaned trenches are summarized in Appendix B. | |
One-meter channel sampling was used to collect samples from the cleaned historical trenches. The following procedure was used for the trench documentation and sampling: |
|
The start and end of the trench were marked by wooden poles and coordinates were collected using an accurate handheld GPS. | |
|
The preferred trench wall (with good lithological profile) was chosen for sampling and measured. The shape and geological features were sketched on millimetre graph paper at a scale of 1:100 to 1:500. These drawings were then transferred onto computer to produce a JPG image. | |
|
The trench interval with continuous lithological profile where the bedding was angled (not parallel) with the horizontal sampling line was marked with spray paint (startblue; endred). The coordinates of the start and end of the sampling interval were recorded using an accurate handheld GPS. | |
|
The sampling area was divided into one-metre intervals (marked by yellow spray paint) using a tape measure. | |
|
Each metre was carefully sampled using channels 35 centimetres wide and 23 centimetres deep. Four labourers were used for the sampling to increase the speed of the sample collection. The samples were numbered similar to the trenches, but without a dash between the abbreviation and number. For example, STW0001 is the first sample from the trench number STW-01. On completion of the sampling, the trench number was visibly marked on a flat surface close to the trench and on a metal signpost. The samples were collected into numbered clear plastic bags. |
Due to the poor conditions of the historical trenches (collapses, weathered zones, bedding), the total length of the sampled intervals was smaller than the length of the trenches. In total 656 metres of channel sampling was carried out in 29 cleaned trenches (including extensions) with approximate total trench length of 1,552 metres. These 656 metres of channel sampling represent 659 channel samples (in total 755 samples, including 73 sample duplicates and 23 field blanks). The 307 samples were prepared and assayed by ALS laboratory in Kumasi. The rest of the samples (449) are stored securely ready for transport in the future. Details of channel sampling are provided in Appendix C.
CARDERO RESOURCE CORP. |
TECHNICAL REPORT SHEINI HILLS IRON PROJECT |
9-7 |
9.4 |
TRENCH SAMPLING RESULTS |
| |
The results of the 269 trench samples (excluding blanks and duplicates) adequately confirm the results presented by historical explorers. The results (presented in Tables 9.19.12 and summarized in Table 9.13) also confirm the field geological and mineralogical observations that BIF, due to its composition, grain size, and texture, is typically higher grade than Fragmental. Trench sampling results from the sampled and assayed trenches are presented as tables with highlighted FeTOT values for high- (>50% FeTOT), medium- (3050% FeTOT), and low- (<30% FeTOT) grade iron mineralization. Detailed results are presented in Appendix D. |
CARDERO RESOURCE CORP. |
TECHNICAL REPORT SHEINI HILLS IRON PROJECT |
9-8 |
CARDERO RESOURCE CORP. |
TECHNICAL REPORT SHEINI HILLS IRON PROJECT |
9-9 |
CARDERO RESOURCE CORP. |
TECHNICAL REPORT SHEINI HILLS IRON PROJECT |
9-10 |
CARDERO RESOURCE CORP. |
TECHNICAL REPORT SHEINI HILLS IRON PROJECT |
9-11 |
CARDERO RESOURCE CORP. |
TECHNICAL REPORT SHEINI HILLS IRON PROJECT |
9-12 |
TABLE 9.13: Summary Statistics from Trench Sample Analysis
Lithology |
Fe total. (%) | Fe2O3(%) | ||||||
Min. | Max. | Median | Mean | Min. | Max. | Median | Mean | |
Banded Iron Formation (n=105) | 30.98 | 60.08 | 48.05 | 47.50 | 44.30 | 85.90 | 68.70 | 67.91 |
Fragmental Iron Formation (n=155) | 29.03 | 55.04 | 38.33 | 38.84 | 41.50 | 78.70 | 54.80 | 55.53 |
Fragmental Iron Formation (weathered) (n=9) | 16.51 | 25.46 | 20.07 | 20.55 | 23.60 | 36.40 | 28.70 | 29.39 |
Lithology |
SiO2(%) | P2O5(%) | ||||||
Min. | Max. | Median | Mean | Min. | Max. | Median | Mean | |
Banded Iron Formation (n=105) | 6.86 | 47.40 | 24.50 | 24.00 | 0.02 | 0.58 | 0.14 | 0.15 |
Fragmental Iron Formation (n=155) | 14.20 | 48.60 | 30.60 | 30.72 | 0.02 | 0.98 | 0.20 | 0.22 |
Fragmental Iron Formation (weathered) (n=9) | 43.00 | 51.70 | 46.20 | 46.32 | 0.08 | 0.15 | 0.10 | 0.11 |
Lithology |
Al2O3(%) | TiO2(%) | ||||||
Min. | Max. | Median | Mean | Min. | Max. | Median | Mean | |
Banded Iron Formation (n=105) | 0.76 | 7.78 | 2.90 | 3.38 | 0.07 | 0.43 | 0.18 | 0.19 |
Fragmental Iron Formation (n=155) | 1.35 | 11.25 | 6.80 | 6.50 | 0.10 | 0.62 | 0.38 | 0.37 |
Fragmental Iron Formation (weathered) (n=9) | 10.85 | 13.60 | 12.20 | 12.17 | 0.58 | 0.70 | 0.64 | 0.64 |
CARDERO RESOURCE CORP. |
TECHNICAL REPORT SHEINI HILLS IRON PROJECT |
9-13 |
9.5 |
TRACE ELEMENTS |
The inclusion of even small amounts of some elements can have profound effects on the behavioural characteristics of a batch of iron or the operation of a smelter. These effects can be both positive and negative. Some chemicals are deliberately added (such as flux, which makes a blast furnace more efficient). Others elements are added because they make the iron more fluid or harder or give it some other desirable quality. The choice of iron ore, fuel, and flux determine how the slag behaves and the operational characteristics of the iron produced. | |
Ideally, iron ore contains only iron and oxygen. This is rarely the case in reality. Typically, iron ore contains a host of elements that are often unwanted in modern steel. Trace amounts of deleterious elements in an iron ore product will result in penalties from the end-user. As a result, it is important to consider the amounts of certain elements in the mineralized rocks. | |
It should be noted that all of the trench results presented in this report are from samples located within a few metres of surface and that they are therefore not representative of the Iron Formation chemistry at depth. In addition, the raw chemistry of Iron Formation at surface is not representative of the chemistry after beneficiation. | |
In the graphs presented below, the BIF is typically more pure than the Fragmental. This is because the fragments in the Fragmental introduce a percentage of non-iron chemistry. |
9.5.1 |
Silica |
Silica (SiO2) is almost always present in iron ore, but most of it is slagged off during the smelting process. At temperatures above 1,300°C some will be reduced and form an alloy with the iron. The hotter the furnace, the more silica will be present in the final iron product. | |
BIFs (and associated Fragmental) typically contain significant silica. Unoxidized, primary BIF consists mainly of magnetite and silica. The near-surface, oxidized BIF consists primarily of hematite (martite) and silica. It is therefore not surprising that the near-surface Iron Formations at Sheini contain significant silica, on the order of 1050%. In order for the Iron Formations to be upgraded to iron concentrate, the silica will have to be reduced through a process of beneficiation. This process is likely to consist of crushing, grinding, and either gravity or magnetic separation. Figure 9.4 shows total iron plotted against SiO2. | |
9.5.2 |
Aluminum |
Alumina (Al2O3) is very hard to reduce so aluminum contamination of the iron is not a problem. However, it does increase the viscosity of the slag, which can have a number of adverse effects on furnace operation. Thicker slag will slow the descent of the charge, prolonging the process. High aluminum content in the slag will also make it more difficult to tap off the liquid slag. At the extreme, this could lead to a frozen furnace. Increasing the amount of lime flux will counter this effect in the blast furnace. |
CARDERO RESOURCE CORP. |
TECHNICAL REPORT SHEINI HILLS IRON PROJECT |
9-14 |
With the exception of some end-member fragmental samples, the Al2O3 content (Figure 9.5) is generally less than 10%. It could be expected that normal beneficiation processes would reduce this content to less than 3%, essentially through removal of the non-iron-formation fragments in the rock. | |
|
|
9.5.3 |
Phosphorous |
| |
At phosphorous (P) concentrations greater than 0.2%, iron becomes increasingly cold-short, or brrittle, at low temperatures. Phosphorus cannot be easily removed by fluxing or smelting, and so iron ores must generally be low in phosphorus to begin with. | |
|
|
The concentrations of P2O5 in the Sheini Iron Formation samples (Figure 9.6) from surface are not considered to be problematic from the perspective of phosphorous content. | |
|
|
9.5.4 |
Sulfur |
| |
Due diligence sample analysis did not include sulfur (S) analysis. Based on the deposit model and examination of hand specimens from near-surface samples, sulfur is not expected to be a problem element. This will be confirmed by detailed analysis of drill core in the upcoming exploration program. |
FIGURE 9.4: Iron Grade versus SiO2
CARDERO RESOURCE CORP. |
TECHNICAL REPORT SHEINI HILLS IRON PROJECT |
9-15 |
FIGURE 9.5:Iron Grade versus Al2O3
FIGURE 9.6:Iron Grade versus P2O5
CARDERO RESOURCE CORP. |
TECHNICAL REPORT SHEINI HILLS IRON PROJECT |
9-16 |
10 DRILLING
No drilling has been undertaken by Emmland or Cardero Ghana to date. Drilling is recommended and planned for the upcoming exploration program.
CARDERO RESOURCE CORP. |
TECHNICAL REPORT SHEINI HILLS IRON PROJECT |
10-1 |
11 SAMPLE PREPARATION, ANALYSES, AND SECURITY
11.1 | SAMPLING PROCEDURE |
All samples presented in this report were collected by Dr. Karel D. Maly from Aurum Exploration Services, Ireland. Aurum is a well-respected and internationally recognized consulting firm, specializing in management of exploration programs at all levels from grassroots- to feasibility-level studies. | |
| |
Care was taken to ensure that channel samples were taken across true width, relative to dip and structure. | |
| |
All samples were packed into thick, clear plastic bags. The sample number was written on the bag with permanent marker, on an aluminum tag (inserted into the bag), and on a paper tag (inserted visibly into the folded part of the sample bag), and the sample bag was stapled closed. | |
| |
11.2 |
SAMPLING TRANSPORT |
| |
The samples, once sealed into bags, were transported to Emmalands secure storage location at Zabzugu, before onward transport to the ALS laboratory at Kumasi. The samples were stored in rows in numeric order for easy identification of samples. For transport to the laboratory, the samples were placed into large rice bags (usually 10 samples per one rice bag) with sample numbers written on the outside of the rice bags. These large rice bags were secured with cable ties and transported by road to the laboratory at Kumasi. |
11.3 | SAMPLE ANALYSIS |
The ALS laboratory at Kumasi was the primary laboratory used for preparation and analysis of samples. Dr. Maly visited the laboratory in 2011 to ensure that all aspects of sample preparation and analysis were satisfactory. ALS is a global network of laboratories, which operates to the highest international standards. ALS has developed and implemented at each of its locations a Quality Management System (QMS) designed to ensure the production of consistently reliable data. Most ALS Minerals laboratories are registered or are pending registration to ISO 9001:2008, and a number of analytical facilities have received ISO 17025 accreditations for specific laboratory procedures. At the laboratory, the samples were crushed, pulverized, and assayed. Lithogeochemical analysis using the Lithium Borate Fusion and ICP-AES was used by ALS (code ME-ICP06) to determine the major elements oxides (SiO2, Al2O3, Fe2O3, CaO, MgO, Na2O, K2O, Cr2O3, TiO2, MnO, P2O5, SrO, BaO and LOI). |
CARDERO RESOURCE CORP. |
TECHNICAL REPORT SHEINI HILLS IRON PROJECT |
11-1 |
11.4 | QUALITY CONTROL PROCEDURE |
No Certified Reference Material (CRM) was acquired and no CRMs were inserted into the batches of samples sent to ALS for preparation and analysis. The QA/QC procedure consisted of the insertion of field duplicated (inserted every 11th sample) and field blank (inserted every 35th sample) material. The field blank material consisted of white barren quartzite collected from quartzite outcrops northwest of Sheini Village (coordinates 223156E 1015989N). Finally, prepared pulps for 10% of the assayed samples (29 samples) were sent to OMAC in Ireland for analysis and comparison with the ALS laboratory in Ghana. |
11.4.1 |
Field Duplicate Performance |
The field duplicates (N=29 samples) were collected as a second sample from the same channel with the same technique and at the same time as the original sample. Figure 11.1 presents graphs comparing the iron results of duplicates with the original samples. Results are generally very good. However, seven duplicate samples had a difference between duplicate and original sample of more than 5%, and two samples had a difference greater than 10%. This could be due to localized lithological inhomogeneity of the sampled interval (narrow intervals of baanded/fragmental lithology) or by the fact that it had been sampled by hand. The repeatability of the results between the original and duplicate samples is considered to be sufficient. |
FIGURE 11.1: Fe2O3Routine Sample versus Field Duplicate Assay (left); Sample Pair Average versus Relative Difference (%) (right)
11.4.2 |
Field Blank Performance |
Due to the local absence of thick quartz veins in the area, white quartzite from a nearby ridge was used as a blank material (due to having the highest amount of silica and lowest amount of impurities). Quartzite collected from the quartzite outcrops (coordinates 223156E 1015989N) northwest of Sheini Village was used as the blank for all sample batches. |
CARDERO RESOURCE CORP. |
TECHNICAL REPORT SHEINI HILLS IRON PROJECT |
11-2 |
The assays show minor inhomogeneity of this blank with SiO2 content in the range of 92%97% and Fe content in the range of 0.6% 1.3% (Figure 11.2) . No gross carryover contamination during sample preparation was detected using this material; however, certified blank or pure quartz from another part of Ghana will be used for future work.
FIGURE 11.2: Field Blank Performance
11.4.3 |
OMAC Laboratory Check Analysis |
Due to the minor inhomogeneity of the blank material and lack of CRMs (standards) during the sampling, it was decided to improve the data verification and test the quality and accuracy of the ALS assays. Ten percent of the prepared pulps (N=29 samples) were sent to OMAC in Ireland for check analyses. OMAC holds ISO 17025:2005 certification. | |
| |
The same analytical method as used by ALS (lithogeochemical analysis using the Lithium Borate Fusion and ICP-AES (code BF/ES)) was chosen to obtain comparable results. | |
| |
Results indicate good correlation of the iron data between the ALS (original) and OMAC (check) laboratories for the samples, with a slight high bias (~2%) in the OMAC results. Five check samples, however, exhibit more than 10% relative difference, and all have lower Fe2O3 results in the check assays (OMAC). These samples are currently being re-run by OMAC in order to discern whether this may have been an intra-batch analytical error at the laboratory. If the results are similar, ALS will be asked to re-assay these samples. If both laboratories repeat these results, there may have been a sample number mix-up, and the original trench interval should be re- sampled and submitted. This issue will be followed up. This issue notwithstanding, the overall quality of the analytical data is considered to be good. |
CARDERO RESOURCE CORP. |
TECHNICAL REPORT SHEINI HILLS IRON PROJECT |
11-3 |
FIGURE 11.3: Fe2O3Original ALSAssay verus OMAC Check Assay (left); Sample Pair Average versus Relative Difference (%) (right)
CARDERO RESOURCE CORP. |
TECHNICAL REPORT SHEINI HILLS IRON PROJECT |
11-4 |
12 DATA VERIFICATION
The quality control methods that Emmaland and Cardero Ghana have put in place with respect to sampling and analysis are discussed in the previous section.
Historical data has not been verified and has not been relied upon.
The author is confident that the quality of the data presented in this report conforms to international standards and is sufficient for the stage of exploration. The data confirm the conclusions of historical workers and the observations made by the author on the ground.
CARDERO RESOURCE CORP. |
TECHNICAL REPORT SHEINI HILLS IRON PROJECT |
12-1 |
13 MINERAL PROCESSING AND METALLURGICAL TESTING
Metallurgical work has not yet been undertaken with respect to the Project but is recommended in Section 26.
CARDERO RESOURCE CORP. |
TECHNICAL REPORT SHEINI HILLS IRON PROJECT |
13-1 |
14 MINERAL RESOURCE ESTIMATES
No mineral resource estimate was completed as part of this report.
CARDERO RESOURCE CORP. |
TECHNICAL REPORT SHEINI HILLS IRON PROJECT |
14-1 |
15 MINERAL RESERVE ESTIMATES
No mineral reserve estimate was completed as part of this report.
CARDERO RESOURCE CORP. |
TECHNICAL REPORT SHEINI HILLS IRON PROJECT |
15-1 |
16 MINING METHODS
No mining study has been completed for this report due to the early stage of the exploration project.
CARDERO RESOURCE CORP. |
TECHNICAL REPORT SHEINI HILLS IRON PROJECT |
16-1 |
17 RECOVERY METHODS
Metallurgical work has not yet been undertaken at the Project but is recommended in Section 26.
CARDERO RESOURCE CORP. |
TECHNICAL REPORT SHEINI HILLS IRON PROJECT |
17-1 |
18 PROJECT INFRASTRUCTURE
In November 2011, Cardero Ghana commissioned Stonehouse Construction, an Australian contracting and consulting firm, to complete a preliminary transportation study. The purpose of the work was to identify and review high-level iron ore transportation options from the Project Area to a port. The report identified a number of potentially viable transportation options. Cardero Ghana is currently awaiting a proposal for a follow-up study, which will evaluate transportation options in more detail. Cardero Ghana recognizes that if exploration at the Project is successful, the development of viable material handling and transportation plans will be essential. Cardero Ghana intends to continue infrastructure viability studies in tandem with the ongoing exploration programs.
CARDERO RESOURCE CORP. |
TECHNICAL REPORT SHEINI HILLS IRON PROJECT |
18-1 |
19 MARKET STUDIES AND CONTRACTS
No market or contract studies have been completed for this report.
CARDERO RESOURCE CORP. |
TECHNICAL REPORT SHEINI HILLS IRON PROJECT |
19-1 |
20 ENVIRONMENTAL STUDIES, PERMITTING, AND SOCIAL OR COMMUNITY IMPACT
Due to the early stage of the Project, Cardero Ghana has not yet initiated environmental studies, but environmental baseline work is recommended in Section 26.
Cardero Ghanas current community engagement strategy has three objectives:
The effective and timely dissemination of information on the Project, including Cardero Ghanas plans and activities, to the community and interested stakeholders. This includes the ongoing dissemination of information on the existence and progress of the Project in general and will also include targeted information and awareness activities on specific Project activities as necessary e.g. when undertaking an airborne survey and at specific phases of the Project drilling activities.
The maintenance of good relations with people and their representatives in communities affected by the Project. Cardero Ghana will continue its focus on building and maintaining positive relations with local and community leaders in the area and with relevant local and regional official representatives.
The development and implementation of a community development and investment strategy that will target and support key areas and aspects of community life identified as important and where Cardero Ghanas involvement can make an appropriate and demonstrable positive impact. Already, Cardero Ghana has upgraded the roads in the immediate vicinity of the Project, thereby contributing to the ease and safety of transport of local people and businesses.
CARDERO RESOURCE CORP. |
TECHNICAL REPORT SHEINI HILLS IRON PROJECT |
20-1 |
21 CAPITAL AND OPERATING COSTS
A study of future capital or operating costs has not been completed due to the early stage of the Project.
CARDERO RESOURCE CORP. |
TECHNICAL REPORT SHEINI HILLS IRON PROJECT |
21-1 |
22 ECONOMIC ANALYSIS
No economic analysis has been prepared for this Project due to its early stage.
CARDERO RESOURCE CORP. |
TECHNICAL REPORT SHEINI HILLS IRON PROJECT |
22-1 |
23 ADJACENT PROPERTIES
There are no other iron exploration projects or iron producing operations close to the Project.
CARDERO RESOURCE CORP. |
TECHNICAL REPORT SHEINI HILLS IRON PROJECT |
23-1 |
24 OTHER RELEVANT DATA AND INFORMATION
Not applicable.
CARDERO RESOURCE CORP. |
TECHNICAL REPORT SHEINI HILLS IRON PROJECT |
24-1 |
25 INTERPRETATION AND CONCLUSIONS
The Prospecting Licences cover an extensive belt of iron mineralization starting near Tatale in the north, running southward to Sheini Village, and continuing further south beyond the village of Kubalema total of more than 50 kilometres. The Iron Formation forms ridges that rise several hundred metres high above the surrounding savannah and extend for more than 35 kilometres in a northsouth direction. The Iron Formations are interpreted to extend undercover through the entire length of the Project Area, but this interpretation will have to be proved through exploration drilling in 2012.
Two large exploration projects have previously been completed between 1945 and 1980. The majority of the historical information, including reports, location maps, geological maps, and cross sections, is no longer available. The information that is available does not conform to modern reporting standards and cannot be relied upon.
The current exploration work in the Project Area has focused on prospecting and reconnaissance geological mapping across the known mineralized area, with detailed geological mapping of the syncline area west of Camp Villages (southwest of Sheini Village), and on the cleaning, documentation, and sampling of the historical trenches discovered in the syncline area.
The historical trenches in the Project Area were extensively re-sampled between December 2010 and mid-2011. The majority of the samples were collected as one-metre-long channel samples to obtain continuous information (lithological, geochemical) over the width of the outcropping Iron Formation at surface. The initial trench samples were sent to the certified ALS laboratory at Kumasi, Ghana. Check samples comprising 10% of these samples (29) were sent for check analysis at ALS Groupcertified OMAC in Ireland.
The assay results reflect and confirm the geological features observed in the field during trenching and geological mapping. The results also reflect the available historical assay data that were produced in the 1950s and 1960s.
The results to date (Table 25.1) demonstrate that the BIF is higher grade than the Fragmental. This difference is due to content of the barren fragments in the Fragmental. It is also clear from the results that the Fragmental is affected by weathering in the surface outcrops, where the weathering of the fragments of granitic composition disintegrates the rocks and decreases the iron content (clayish lateritic soil is produced). The BIF is more weathering resistant and is forming the morphological ridges.
TABLE 25.1: Iron Results for Major Iron Formation Lithologies
Lithology |
Fe total. (%) | |||
Min. | Max. | Median | Mean | |
Banded Iron Formation (n=105) | 30.98 | 60.08 | 48.05 | 47.50 |
Fragmental Iron Formation (n=155) | 29.03 | 55.04 | 38.33 | 38.84 |
Fragmental Iron Formation (weathered) (n=9) | 16.51 | 25.46 | 20.07 | 20.55 |
CARDERO RESOURCE CORP. |
TECHNICAL REPORT SHEINI HILLS IRON PROJECT |
25-1 |
26 RECOMMENDATIONS
Cardero Ghana, as operator of the Emmaland-Cardero Sheini Hills Joint Venture, has exploration expenditure commitments of USD 9.18 million to be expended by December 8, 2013. This minimum expenditure commitment is a sum of three separate USD 3.06 million commitments, relating to each of the three Prospecting Licences.
26.1 | RECOMMENDED EXPLORATION PROGRAM |
A $19.35 million exploration program (which excludes joint venture payments) is recommended for the upcoming period ending December 12, 2013. |
26.1.1 |
Multispectral Interpretation |
Cardero Ghana has signed a contract with Murphy Geological Consultants, Ireland, for the processing and interpretation of satellite imagery (Landsat ETM+ and ASTER) covering the Project Area. This work is in progress with results expected in Q1 2012. The work will identify surface alteration of rocks associated with the oxidation and upgrade of primary BIF. Additionally, the study will provide a preliminary structural understanding of the Project Area. | |
26.1.2 |
Airborne Geophysical Survey |
Cardero Ghana has signed a contract with Geotech Airborne Limited, who will complete an airborne geophysical survey in Q1 2012. The survey will comprise approximately 3,000 line kilometres of V-TEM, Magnetic, and Radiometric data collection. Interpreted data are expected to be available in Q2 2012. | |
The aim of the geophysical survey is to define the extent of BIF and Fragmental at surface and under cover, along strike to the north and south. Additionally, in seeking areas of hematite-rich, silica-poor direct shipping ore (DSO), the geophysical data should help to define drill targets. V-TEM and radiometric data will help outline and interpret the geological setting of the belt by highlighting resistivity and compositional changes. | |
26.1.3 |
Geological Mapping & Structural Review |
Additional geological mapping should be performed, concentrating at first on topographic highs and ultimately covering the entire Project Area to provide geological context to the iron-dominant ridges. On receipt of interpreted multispectral and geophysical data, geologists will revisit specific areas where priority targets have been identified. This ground-truthing may only be possible on topographic highs and all targets will ultimately require drill testing. A structural review by a specialist in structural geology is also recommended prior to drill testing. |
CARDERO RESOURCE CORP. |
TECHNICAL REPORT SHEINI HILLS IRON PROJECT |
26-1 |
26.1.4 |
Diamond Drilling |
Cardero Ghana has signed a contract with Geodrill Limited to complete an initial 10,000 metres (Phase I) diamond drill program at the Project. The drilling will focus on the testing of specific geophysical targets aimed at identification of DSO. In addition, a number of drill holes will be drilled regionally, aimed at understanding the geological setting of the Project Area and understanding the relationship between iron grade, oxidation state, and depth. Additional drilling will be planned based on the results of the Phase I program. | |
All initial drilling should collect oriented core to facilitate structural interpretations. As well as detailed geological logging, geologists should collect basic geotechnical information. Routine measurement of magnetic susceptibility and specific gravity is also recommended. | |
26.1.5 |
Analysis & Metallurgical Testing |
All drill core will be routinely analyzed by XRF. The total iron percentage provided from the XRF will reflect all iron in the sample, including iron from magnetite, hematite, and other iron- bearing minerals. | |
All sample pulps should also be analyzed using a Satmagan, providing accurate analysis of only the ferro-magnetic compounds of iron such as magnetite. In the early stages of the drill program, 10% of samples should be also analyzed using a Davis Tube test, which uses an extremely powerful electromagnet, a glass separation tube, and a motor-driven agitation system. This equipment provides a clean concentrate of the magnetic fraction, which can be analyzed using an XRF method. The Satmagan method is considerably less expensive and less time-consuming than the Davis TubeXRF method. If the results of the Davis Tube tests can be correlated with the less expensive Satmagan results (as may be expected in BIF mineralogy), the Satmagan method can replace the routine use of Davis Tube tests. | |
Diamond drilling will include a proportion of large diameter HQ drilling to be used in preliminary, bench-scale beneficiation tests. A program of crushing and grinding, together with magnetic and gravity separation, is anticipated but has not yet been planned in detail. | |
26.1.6 |
Preliminary Infrastructure Study |
Cardero Ghana is expecting to engage a consulting firm to complete a detailed infrastructure and transport study to help with future project planning. | |
26.1.7 |
Resource Estimate |
It is recommended that an independent consulting firm be engaged to monitor early-stage exploration planning and procedures and to ultimately produce a 43-101 Resource Estimate for the Project. |
CARDERO RESOURCE CORP. |
TECHNICAL REPORT SHEINI HILLS IRON PROJECT |
26-2 |
26.1.8 |
Environmental Baseline |
It is recommended that Cardero Ghana initiate an environmental baseline study across the entire Project Area. |
26.2 | BUDGET |
A preliminary budget of $5.79 million is recommended to move the Project through phase I drilling and metallurgical testing in 2012. The detail of this budget is outlined below (Table 26.1). A budget of $13.56M is recommended for 2013. The total budget to December 8, 2013 is $19.35M. |
TABLE 26.1: Preliminary Budget
2012 Recommended Budget | Estimate |
Ghana Office and G & A | $315,000 |
Exploration Camp Expansion | $305,000 |
Airborne Geophysics | $504,000 |
Drilling (10,000m), Geology, Core Sampling & handling | $2,100,000 |
Sample Analysis | $711,000 |
Infrastructure and site development | $390,000 |
Travel | $260,000 |
Metallurgical Testing | $180,000 |
Independent 43-101 Resource Estimate | $240,000 |
Staff | $790,000 |
$5,795,000 |
2013 Recommended Budget | Estimate |
Ghana Office and G & A | $240,000 |
Exploration Camp Expansion | $80,000 |
Airborne Geophysics | $0 |
Drilling (50,000m), Geology, Core Sampling & handling | $10,550,000 |
Sample Analysis | $790,000 |
Infrastructure and site development | $65,000 |
Travel | $340,000 |
Metallurgical Testing | $260,000 |
Independent 43-101 Preliminary Economic Assessment | $240,000 |
Staff | $995,000 |
$13,560,000 |
CARDERO RESOURCE CORP. |
TECHNICAL REPORT SHEINI HILLS IRON PROJECT |
26-3 |
27 REFERENCES
Bobrov, S., Pentelkov, V. 1964. Report on the Geology and Minerals of the Eastern Part of the Bimbila-Zabzugu Area. Archive Report No. 59, GSD, Accra, p. 1-55.
Jacques, E. H. 1958. Report on the Sheini Iron Ore Deposits. Archive Report No. 85, GSD, Accra, p. 1-47.
Wright, J. B., Hastings, D. A., Jones, W. B., Williams, H. R. 1985. Geology and Mineral Resources of West Africa. George Allen & Unvin, London, pp. 56-82.
CARDERO RESOURCE CORP. |
TECHNICAL REPORT SHEINI HILLS IRON PROJECT |
27-1 |
APPENDIX A: COORDINATES OF HISTORICAL BOREHOLES
Borehole No. | Easting | Northing | Elevation | Comments |
BH-01 | 220969 | 1007387 | 245 | Old BH-10, vertical |
BH-02 | 221121 | 1007912 | 225 | Vertical |
BH-03 | 221019 | 1006684 | 224 | Vertical |
BH-04 | 221204 | 1007387 | 264 | Old BH-6, vertical |
BH-05 | 221019 | 1007058 | 234 | Vertical |
BH-06 | 220212 | 1010569 | 290 | Vertical |
BH-07 | 220189 | 1011075 | 324 | Vertical |
BH-08 | 221279 | 1007169 | 264 | Inclined 20-30 deg W |
BH-09 | 220696 | 1007400 | 278 | Old BH-6, inclined 75W |
BH-10 | 220819 | 1007592 | 241 | Vertical |
BH-11 | 220828 | 1007595 | 240 | Vertical |
BH-12 | 220738 | 1007053 | 238 | Vertical |
BH-13 | 220917 | 1006720 | 232 | Prepared but not drilled |
BH-14 | 220869 | 1008070 | 271 | Vertical |
BH-15 | 220336 | 1009381 | 262 | Vertical |
BH-16 | 220140 | 1008085 | 285 | Vertical |
BH-17 | 220248 | 1008078 | 284 | Vertical |
BH-18 | 220426 | 1008793 | 301 | Vertical |
CARDERO RESOURCE CORP. |
TECHNICAL REPORT SHEINI HILLS IRON PROJECT |
I |
APPENDIX B: COORDINATES OF SAMPLED TRENCHES
Start of Trench | End of Trench | |||||||
Trench No. | Easting | Northing | Elevation | Easting | Northing | Elevation | Length | Direction |
STW-01 | 221080 | 1006722 | 252 | 221061 | 1006721 | 251 | 19 | 270 |
STW-02 | 221114 | 1007014 | 302 | 221063 | 1007016 | 286 | 51 | 279 |
STW-03 | 221162 | 1007054 | 295 | 221136 | 1007056 | 305 | 31 | 280 |
STW-3b | 221136 | 1007056 | 305 | 221132 | 1007056 | 311 | 6 | 280 |
STW-04 | 221193 | 1007201 | 293 | 221120 | 1007219 | 298 | 76 | 288 |
STW-04b | 221246 | 1007197 | 288 | 221194 | 1007200 | 293 | 54 | 288 |
STW-05 | 221168 | 1007315 | 271 | 221050 | 1007317 | 260 | 118 | 274 |
STW-06 | 221262 | 1007308 | 276 | 221230 | 1007311 | 280 | 31 | 285 |
STW-07 | 221142 | 1007375 | 271 | 220983 | 1007384 | 254 | 158 | 278 |
STW-08 | 221262 | 1007383 | 275 | 221207 | 1007383 | 263 | 53.5 | 275 |
STW-09 | 221247 | 1007587 | 257 | 221223 | 1007587 | 253 | 25.5 | 275 |
STW-10 | 221212 | 1007705 | 267 | 221195 | 1007701 | 266 | 17 | 254 |
STW-11 | 221207 | 1007910 | 241 | 221173 | 1007912 | 236 | 31.6 | 270 |
STW-12 | 220775 | 1008052 | 289 | 220682 | 1008056 | 307 | 97 | 274 |
STW-13 | 220636 | 1007886 | 345 | 220587 | 1007893 | 329 | 52 | 272 |
STW-14 | 220588 | 1007608 | 339 | 220531 | 1007617 | 339 | 61 | 279 |
STW-15 | 220554 | 1007506 | 350 | 220520 | 1007507 | 341 | 34 | 274 |
STW-16 | 220674 | 1007414 | 288 | 220511 | 1007426 | 329 | 167 | 272 |
STW-17 | 220574 | 1007053 | 307 | 220499 | 1007055 | 320 | 71 | 272 |
STW-18 | 220520 | 1006973 | 329 | 220481 | 1006973 | 316 | 44 | 270 |
STW-19 | 220251 | 1006730 | 331 | 220219 | 1006731 | 324 | 31 | 272 |
STW-20 | 220499 | 1006724 | 338 | 220473 | 1006717 | 317 | 28 | 270 |
STW-21 | 220486 | 1006627 | 318 | 220428 | 1006630 | 297 | 63 | 274 |
STW-21b | 220504 | 1006626 | 313 | 220486 | 1006627 | 318 | 17 | 274 |
STW-22 | 220603 | 1006171 | 255 | 220598 | 1006249 | 290 | 78 | 351 |
STW-22b | 220598 | 1006249 | 290 | 220595 | 1006278 | 300 | 25 | 351 |
STW-23 | 220827 | 1006419 | 294 | 220816 | 1006425 | 290 | 15.8 | 297 |
STW-24 | 221011 | 1006589 | 219 | 220930 | 1006604 | 266 | 74 | 279 |
STW-24b | 221034 | 1006590 | 203 | 221011 | 1006589 | 219 | 23 | 279 |
CARDERO RESOURCE CORP. |
TECHNICAL REPORT SHEINI HILLS IRON PROJECT |
II |
APPENDIX C: DETAILS OF CHANNEL SAMPLING IN TRENCHES
Start of Sampling | End of Sampling | ||||||
Trench | Length | Easting | Northing | Easting | Northing | Length | No. of |
STW-01 | 19 | 221077 | 1006722 | 221067 | 1006723 | 11.4 | 13 |
STW-02 | 51 | 221114 | 1007014 | 221102 | 1007018 | 11 | 12 |
STW-03 | 31 | 221144 | 1007054 | 221136 | 1007056 | 9 | 11 |
STW-3b | 6 | 221136 | 1007056 | 221132 | 1007056 | 6 | 6 |
STW-04 | 76 | 221171 | 1007207 | 221121 | 1007219 | 51 | 59 |
STW-04b | 54 | 221246 | 1007197 | 221219 | 1007187 | 29 | 32 |
STW-05 | 118 | 221141 | 1007313 | 221122 | 1007314 | 18 | 20 |
STW-06 | 31 | 221262 | 1007308 | 221238 | 1007312 | 25 | 29 |
STW-07 | 158 | 221131 | 1007372 | 221111 | 1007371 | 19 | 22 |
STW-08 | 53.5 | 221262 | 1007383 | 221230 | 1007385 | 29.5 | 35 |
STW-09 | 25.5 | 221247 | 1007587 | 221227 | 1007588 | 19 | 21 |
STW-10 | 17 | 221212 | 1007705 | 221195 | 1007701 | 17 | 20 |
STW-12 | 97 | 220733 | 100853 | 220699 | 1008055 | 38 | 44 |
STW-13 | 52 | 220636 | 1007886 | 220616 | 1007891 | 23 | 27 |
STW-14 | 61 | 220588 | 1007608 | 220562 | 1007611 | 30 | 35 |
STW-15 | 34 | 220554 | 1007506 | 220531 | 1007507 | 23 | 26 |
STW-16 | 167 | 220554 | 1007424 | 220528 | 1007424 | 30 | 35 |
STW-17 | 71 | 220535 | 1007053 | 220511 | 1007053 | 20 | 24 |
STW-18 | 44 | 220520 | 1006973 | 220505 | 1006974 | 20 | 22 |
STW-19 | 31 | 220251 | 1006730 | 220219 | 1006731 | 31 | 35 |
STW-20 | 28 | 220499 | 1006724 | 220473 | 1006717 | 28 | 32 |
STW-21 | 63 | 220486 | 1006627 | 220471 | 1006629 | 20 | 23 |
STW-21b | 17 | 220504 | 1006626 | 220486 | 1006627 | 17 | 20 |
STW-22 | 78 | 220600 | 1006233 | 220598 | 1006249 | 30 | 35 |
STW-22b | 25 | 220598 | 1006249 | 220295 | 1006278 | 25 | 29 |
STW-24 | 74 | 220992 | 1006593 | 220951 | 1006604 | 53 | 61 |
STW-24b | 23 | 221034 | 1006590 | 221011 | 1006589 | 23 | 27 |
CARDERO RESOURCE CORP. |
TECHNICAL REPORT SHEINI HILLS IRON PROJECT |
III |
APPENDIX D: SAMPLE ASSAY RESULTS
CARDERO RESOURCE CORP. |
TECHNICAL REPORT SHEINI HILLS IRON PROJECT |
IV |
CARDERO RESOURCE CORP. |
TECHNICAL REPORT SHEINI HILLS IRON PROJECT |
V |
CARDERO RESOURCE CORP. |
TECHNICAL REPORT SHEINI HILLS IRON PROJECT |
VI |
CARDERO RESOURCE CORP. |
TECHNICAL REPORT SHEINI HILLS IRON PROJECT |
VII |
CARDERO RESOURCE CORP. |
TECHNICAL REPORT SHEINI HILLS IRON PROJECT |
VIII |
CARDERO RESOURCE CORP. |
TECHNICAL REPORT SHEINI HILLS IRON PROJECT |
IX |
CARDERO RESOURCE CORP. |
TECHNICAL REPORT SHEINI HILLS IRON PROJECT |
X |
CARDERO RESOURCE CORP. |
TECHNICAL REPORT SHEINI HILLS IRON PROJECT |
XI |
CARDERO RESOURCE CORP. |
TECHNICAL REPORT SHEINI HILLS IRON PROJECT |
XII |
Technical Report on the Longnose
Ilmenite Project, Minnesota, USA
Report Prepared for
Cardero Resource Corp.
Report Prepared by
SRK Consulting (Canada) Inc. |
2CC031.004 |
January 27, 2012 |
SRK Consulting | |
Longnose NI43-101 | Page i |
Technical Report on the
Longnose Ilmenite
Project, Minnesota, USA
Cardero Resource Corp. | |
Suite 2300 1177 West Hastings Street | |
Vancouver, BC,V6E 2K3 | |
website: www.cardero.com | |
Tel: +1.604.408.7488 | |
Fax: +1.604.408.7499 | |
SRK Consulting (Canada) Inc. | |
Suite 2200 1066 West Hastings Street | |
Vancouver, BC, V6E 3X2 | |
e-mail: vancouver@srk.com | |
website: www.srk.com | |
Tel: +1.604.681.4196 | |
Fax: +1.604.687.5532 | |
SRK Project Number 2CC031.004 | |
Effective date: | January 19, 2012 |
Report date: | January 27, 2012 |
Authored by:
Mike Johnson, P.Geo. | Darrell Farrow, Pr.Sci.Nat | |
Senior Consultant (Geology) | Associate Consultant (Geology) | |
Peer Reviewed by: | ||
Wayne Barnett, Pr.Sci.Nat | ||
Principle Consultant (Geology) |
________________
Cover Photo: A
meadow on Longnose Property in the summer
MDJ/DF/HD/WB | 2CC031_004_Longnose_NI43101_FinalReport_20120124_MDJ_wb_djf_20120127 | January 27, 2012 |
2CC031.004 Cardero Resource Corp. | |
Longnose Project | Page 2 |
Important Notice
This report was prepared as a National Instrument 43-101 Technical Report for Cardero Resource Corp. (Cardero or the Company) by SRK Consulting (Canada) Inc. (SRK). The quality of information, conclusions, and estimates contained herein is consistent with the level of effort involved in SRKs services based on: i) information available at the time of preparation, ii) data supplied by outside sources, and iii) the assumptions, conditions, and qualifications set forth in this report. This report is intended for use by Cardero subject to the terms and conditions of its contract with SRK and relevant securities legislation. The contract permits Cardero to file this report as a Technical Report with securities regulatory authorities pursuant to National Instrument 43-101, Standards of Disclosure for Mineral Projects.
MDJ/DF/HD/WB | 2CC031_004_Longnose_NI43101_FinalReport_20120124_MDJ_wb_djf_20120127 | January 27, 2012 |
2CC031.004 Cardero Resource Corp. | |
Longnose Project | Page 3 |
Executive Summary
This Technical Report documents the current technical data and Mineral Resource estimate for the Longnose Project (the Project). It was prepared following the guidelines of the Canadian Securities Administrators National Instrument 43-101 (NI 43-101) and Form 43-101F1, and in conformity with generally accepted CIM Estimation of Mineral Resources and Mineral Reserves Best Practice Guidelines. This report has been written by SRK on behalf of Cardero.
Property Description and Location
The Lands making up the Project (Project Area) are located in northeastern Minnesota in St. Louis County, Township 59N, Range 13W, Section 30 and is centered at: (Coordinate system: Universal Trans Mercator, Zone 15 North, North American 1983 Datum) 572200 metres East, 5268300 metres North.
Carderos indirect wholly owned subsidiary, Cardero Iron Ore (USA) Inc. (CIOUS), holds an option to acquire up to an 85% interest in the Project by incurring USD 1,850,000 in expenditures (to acquire 70%) and delivering a feasibility study (to acquire an additional 15%). Upon CIOUS earning its 70% or 85% interest, the optionor of the Project has the option to maintain its 30% or 15% interest and enter into a joint venture with CIOUS, or to convert its working interest to either a 10% or 5% net profits interest. Advance royalties and production royalties are payable to the underlying property lessors.
CIOUS has all required licenses, permits and registrations in place to carry out exploration and resource definition drilling. Additional permits will be required in the future to advance to the next stage.
Accessibility, Climate, Local Resources, Infrastructure and Physiography
Topographic relief is generally low, and the surface is flat-laying. Elevations range between 465 and 490 metres (m) above mean sea level. The ground cover at the Project Area is a mixture of Palustrine, forested wetlands (Cowardin classification system), and higher dry forested ground. Overburden, consisting of glacial till, is present and the depth to bedrock is approximately 3 m to 30 m from surface.
Accessibility is excellent, with the Project located off of a paved county highway via a well maintained gravel road.
The climate in northeastern Minnesota is mid-continental. Winter conditions usually begin in mid-December and last until mid-March, with frozen ground beginning in late December to early January. The spring thaw usually begins in mid-March to late April, with stable, dry spring-summer-fall conditions occurring from late April to mid-December.
The population of Aurora, Minnesota (the nearest major population centre) is approximately 1,850, and the nearby city of Hoyt Lakes (8 km, 5 miles, east of Aurora), Minnesota has a population of approximately 2,000 people.
The infrastructure in northeastern Minnesota related to mining activities is excellent, with low cost electricity, railroads, paved state and county highways, international shipping ports, mining professionals, mining vendors, and trained labor all readily available. International shipping ports are
MDJ/DF/HD/WB | 2CC031_004_Longnose_NI43101_FinalReport_20120124_MDJ_wb_djf_20120127 | January 27, 2012 |
2CC031.004 Cardero Resource Corp. | |
Longnose Project | Page 4 |
located along the north shore of Lake Superior, including Duluth/Superior, Silver Bay, Taconite Harbor, and Two Harbors, with linked rail systems to all.
History
The lands making up the Project (Project Area) were the subject of historical exploration processes between 1950 and 2008. The deposit was initially discovered by Bear Creek Mining, while exploring for copper-nickel (Cu-Ni) deposits.
Twelve (12) drill holes were completed by American Shield Corp., Bear Creek Mining, and Nicor during the 1980s and 1990s.
The Project Area was held by a series of mining companies including American Shield and BHP Minerals International Inc. (BHP). BHP held the Project Area for some time in the 1990s. Most of the work completed by BHP centered on metallurgy, and TiO2 recovery. Initial metallurgical testing focussed on the production of an ilmenite concentrate. Further upgrading analysis was completed as well, the first of which involved a smelting and sulfation-leaching process developed by the US Bureau of Mines. Their second investigation involved an oxidation-reduction roast followed by chemical leaching, using a process called the Murso process.
Several large (1.5 tonne to 60 tonne) bulk samples were utilized to complete the metallurgical testwork. The larger samples were collected from out crop of the Longnose deposit, while smaller test samples were taken from core. The University of Minnesota, Natural Resources Research Institute, Coleraine Minerals Research Laboratory houses what remains of both bulk samples.
Geological Setting and Mineralization
The Project Area is located within the Superior Province of the Canadian Shield, and is underlain by intrusive rocks generated during the formation of the Midcontinent Rift. Mineralization is hosted by Oxide-bearing Ultramafic Intrusions (OUI or OUIs) that intruded into layered series intrusions of the Duluth Complex. OUIs are dominantly composed of coarse-grained to pegmatitic pyroxenite, peridotite, and dunite that contain approximately 10-40% titanium-iron oxide mineralization, dominantly as ilmenite with lesser titaniferous magnetite. Typically, zones of massive and semi-massive oxide are also present throughout the stratigraphy. Locally, some OUIs also contain abundant copper-nickel sulfide mineralization as well; however, this style of mineralization has not been intersected within the Project Area. Most OUIs occur along the western margin of the southern portion of the Duluth Complex, and display numerous shapes (sheet-, funnel-, dike- and pipe-like geometries) and inclinations (flat-lying, moderately-dipping, and sub-vertical).
The Longnose OUI is geologically interpreted to be a late-stage intrusion that cut early Duluth Complex stratigraphy, and is associated with magmatism generated by the 1.1 billion year old Midcontinent Rift system.
The Longnose OUl contains disseminated, semi-massive, and massive ilmenite and titaniferous-magnetite mineralization. The Project Area hosts a single intrusion which is at least 150 m thick, dipping shallowly to the southeast.
Mineralization at the Project Area dominantly consists of disseminated to net-textured, medium to coarse-grained, Ilmenite, titaniferous magnetite and magnetite (Paster, 1987). Olivine-rich ultramafic rocks (peridotite, feldspathic peridotite & dunite) host the majority of the titanium-iron oxide mineralization found in the Longnose OUI, and will often be net-textured with oxide minerals
MDJ/DF/HD/WB | 2CC031_004_Longnose_NI43101_FinalReport_20120124_MDJ_wb_djf_20120127 | January 27, 2012 |
2CC031.004 Cardero Resource Corp. | |
Longnose Project | Page 5 |
interstitial to silicates. Visual modal mineral calculations generally estimate that titanium-iron oxide minerals compose 15-35% of the peridotitic and dunitic rocks at the Project. Numerous massive and semi-massive titanium-iron oxide horizons or zones (45-100% titanium-iron oxide) have been intersected in drill core. These massive and semi-massive oxides seem to be dominantly hosted by peridotite and dunite, though they have been intersected within zones of pyroxenite as well. It is clear that the main mineralized intrusion at the Project is a thick, laterally and vertically continuous intrusion dominantly composed of a mixture of oxide-bearing peridotite, oxide-bearing dunite, massive oxide, and semi-massive oxide with between 15% and 100% titanium-iron oxide mineralization.
Exploration
Exploration at the Project has included surface sampling, geophysics and diamond drilling.
Twenty-seven diamond drill core holes have been drilled on the Project Area, including six holes drilled by CIOUS in 2010, and nine holes drilled by CIOUS in 2011. Historic drilling includes 12 drill holes completed by a variety of operators in the 1980s and 1990s. The historic drill core has been re-sampled by CIOUS during 2009 and 2010, where such material was available. In total, the twenty-seven holes totalled 5,217 m, with 1,979 m from historic holes and 3,238 m from CIOUS drill holes.
Drill hole spacing for the Project is variable (drill holes are not on a regular grid) between 50 m and 100 m. Drill core has been sampled in 1 m to 6 m intervals.
Exploration data has focussed on the geology and titanium (Ti) and iron (Fe) analytical sample data; however, other elements should be reviewed and potentially estimated in future analysis. Titanium was measured as TiO2 and iron was measured as Fe2O3.
Sample Preparation, Analyses and Security
CIOUS has utilized a thorough and robust procedure for sampling, sample preparation, analysis and security.
Procedures for core handling, logging, sampling and sample shipping were well thought out and well implemented. Analysis was completed by ALS, one of the largest commercial laboratories in the world. A robust program of quality assurance and quality control samples was implemented and met or exceeded industry standard procedures. Sample security and chain of custody documentation was maintained throughout the process and was thoroughly reviewed by SRK.
Data Verifications
Exploration data verification for the Project has included a site visit by SRK, enforced database structures, analytical quality assurance and quality control (QA/QC) samples, independent sampling and assay checking.
SRKs Wayne Barnett, Pr.Sci.Nat visited the site in July 2009 and Mike Johnson, P. Geo, visited the site in March 2010. During these site visits, SRK verified drill hole locations, drilling, logging and sampling procedures, security and documentation. SRK also collected independent sampling during these site visits and confirmed the TiO2 and Fe2O3 values for five Longnose samples.
MDJ/DF/HD/WB | 2CC031_004_Longnose_NI43101_FinalReport_20120124_MDJ_wb_djf_20120127 | January 27, 2012 |
2CC031.004 Cardero Resource Corp. | |
Longnose Project | Page 6 |
CIOUS utilized an onsite database which validated the data entry process as it was being completed and reduced clerical errors. As well, Carderos head office checked the data upon import into their main exploration database in order to minimize data errors.
SRK verified 92% of the assay database by downloading these records directly from the commercial laboratory and checking them against the Mineral Resource database.
CIOUS completed QA/QC sampling (blanks, standards, duplicates) totalling 393 samples, equal to 23% of the total samples. SRK has reviewed the QA/QC sample insertion rate and results, and concluded that the analytical data should be reliable.
Mineral Processing and Metallurgical Testing
Most processing and metallurgical testwork at the Project was completed prior to CIOUS involvement in the property.
Historical metallurgical testwork indicated that there is a reasonable chance that a saleable ilmenite and magnetite concentrate could be created from the Longnose deposit. Metallurgical testing regarding the Longnose deposit has focussed primarily on optimizing ilmenite recovery and creation of the ilmenite concentrate.
The historic metallurgical testwork indicates a relatively simple processing flow sheet. It would include crushing the material to a selected size and processing the ore by density and then by magnetic properties. The density separation would remove the silicates from the much more dense oxides. The oxides would then be split into a non-magnetic / paramagnetic fraction as well as a magnetic fraction. Magnetite would partition into the magnetic fraction, while the ilmenite would partition into the non-magnetic / paramagnetic fraction. The magnetic fraction could be further upgraded to recover some ilmenite that would partition into that fraction. The ilmenite concentrate could then be sold to an external processing site, or could be processed at a newly created process facility as part of a further beneficiation/added value processing project; however, a potential upgrading facility would have very significant capital costs.
Historical testwork has shown that the concentrates created from the Longnose rock can be processed into a potentially saleable concentrate (Westmont, 1990); however, the quality of the concentrate may be adversely affected by the high magnesium content of the ilmenite. (Wright et al, 1984)
CIOUS has completed very limited metallurgical testing at this stage. Recent work includes only Davis Tube tests, which are used to determine the proportion of material which is magnetic and which is commonly associated with magnetite.
CIOUS will have to complete further metallurgical work for the Project if further economic analysis is contemplated.
Mineral Resource Estimates
In 2011, SRK was retained by Cardero to complete a Mineral Resource for the Longnose OUI deposit, as well as update the technical report for the Project.
SRK utilized Gemcoms Surpac® version 6.2 and several other software packages to complete the estimation. A comprehensive and validated drill hole database was utilized to complete the analysis. The database includes twenty-seven drill holes; however, only twenty-four were utilized in
MDJ/DF/HD/WB | 2CC031_004_Longnose_NI43101_FinalReport_20120124_MDJ_wb_djf_20120127 | January 27, 2012 |
2CC031.004 Cardero Resource Corp. | |
Longnose Project | Page 7 |
the estimation process due to issues with resampling of some historic drill holes. All 2010-11 drill hole data included multi-shot downhole surveys; however, historic holes did not have downhole surveys. The estimation process utilized 1681 samples out of the databases 1956 samples. A total of 855 specific gravity measurements were utilized to estimate bulk densities. Estimation of metal grades utilized regularized 2 m composites.
Two geological domains were defined for the estimation process. The domains were defined by the presence of peridotite or pyroxenite oxide bearing rocks. The peridotite domain has higher olivine content and encompasses higher TiO2 grades near the core of the deposit. The pyroxenite domain includes higher pyroxene content, has lower TiO2 grades and is generally found at the periphery of the deposit. The geological domains are generalized, with some instances of other rock types within each domain.
The estimations were made into a threedimensional block model with 20 m by 20 m by 10 m block size, with sub-blocking to 5 m by 5 m by 2.5m. Estimated parameters included specific gravity, TiO2 and Fe2O3 grades. Metal grade interpolation was completed through three passes using increasingly larger search ellipses and lower restrictions on sample inclusion in each pass. Search ellipses were generally flat pancakes with the shortest direction of continuity sub-vertically and the longest in the northwest-southeast direction. The search ellipse orientations, which dip 20 degrees to the east, were based upon variography completed on the 2 m composite data. Ordinary kriging (OK) was used to estimate TiO2 and Fe2O3, while inverse distance squared (ID2) was used to estimate the specific gravity data. Mineral resources were classified in accordance with definitions provided by the Canadian Institute of Mining (CIM) as stipulated in NI 43-101.
In order to quantify the Mineral Resources requirement of reasonable prospects of economic extraction, the block model was subjected to conceptual mining limits using an open pit optimization program. The process uses reasonable mining and processing parameters to define a conceptual pit within which the material with reasonable economic prospects should be contained. For the Project optimization runs, it was assumed that all TiO2 is contained in the mineral Ilmenite. Fe2O3 values were modified to reflect the amount of iron taken up by ilmenite as well as the component estimated to be within silicates. However, more detailed testing is required in order to properly quantify the magnetite content of the resource, so iron was not given any value in the resource pit optimization limits. Historic metallurgical data indicates that a very high percentage of the TiO2 is contained within ilmenite (Small, 1994), with a relatively small component in titaniferous magnetite and silicates.
The Mineral Resource Statement for the Project is presented in Table i below.
MDJ/DF/HD/WB | 2CC031_004_Longnose_NI43101_FinalReport_20120124_MDJ_wb_djf_20120127 | January 27, 2012 |
2CC031.004 Cardero Resource Corp. | |
Longnose Project | Page 8 |
Table i: Mineral Resource Statement*, Longnose Project, Minnesota, USA, SRK Consulting (Canada) Inc, effective date, January 19, 2012.
Category
(Open Pit**) |
Estimated Quantity
|
Estimated Grade | ||
TiO2 | Adjusted Fe2O3*** | |||
Mt | % | % | ||
Indicated | 58.1 | 16.6 | 18.8 | |
Inferred | 65.3 | 16.4 | 19.4 | |
* |
Mineral resources are reported in relation to a conceptual pit shell. Mineral resources are not mineral reserves and do not have demonstrated economic viability. All figures are rounded to reflect the relative accuracy of the estimate. All composites have been capped where appropriate. | |||
** |
Open pit (near surface) Mineral Resources are reported at a cut-off grade of 8% TiO2. Cut-off grades are based on a price of US$170 per tonne of Ilmenite back calculated to TiO2 and recoveries of 70 percent, without considering revenues from other metals including Fe. | |||
*** |
Reported Fe2O3 has been lowered to reflect the amount of Fe estimated contained within ilmenite and silicates, based upon Davis Tube testing. At this time, accurately quantifying the amount of magnetite contained within this estimate is not possible. |
As stated above, the Mineral Resource has been quantified in terms of TiO2 and Fe2O3, the analytical components captured for assays of titanium and iron. The Fe2O3 values have been reduced to reflect Fe found within silicates and within the ilmenite associated with the TiO2, however accurately quantifying magnetite is not possible at this time as further mineralogical work will be needed. In any potential mining scenario, the Project would produce ilmenite (FeTiO3) and may produce titaniferous magnetite (TiFe2O4) and magnetite (Fe3O4) as a by-product. Using CIOUSs Davis Tube test results, historic mineralogy and metallurgy reports, reasonable assumptions regarding mineralogy of the deposit, estimates of the quantity of ilmenite was made. The contained ilmenite in the Mineral Resource is summarized in Table ii.
Table ii: Summary of Longnose Project ilmenite content within the Mineral Resource
Category |
Quantity |
Ilmenite Grade | Contained Ilmenite |
(FeTiO3) | |||
Mt | % | Mt. | |
Indicated | 58.1 | 31.5 | 18.30 |
Inferred | 65.3 | 31.2 | 20.40 |
Interpretation and Conclusions
The Longnose deposit is an ultramafic intrusion significantly enriched in ilmenite and magnetite oxides. The deposit is flat lying and provides a geometry that should be amicable to open pit mining. The Longnose deposit is approximately 700 m long in the north-south direction, 600 m wide in the east-west direction and 150 m thick.
The Longnose OUI is geologically interpreted to be late-stage intrusion that cuts early Duluth Complex intrusives, and is associated with magmatism generated by the 1.1 billion year old Midcontinent Rift system. The drilling program conducted in 2010 and 2011 by CIOUS confirmed strong titanium-iron-oxide mineralization at the Project Area, hosted within troctolitic rocks of the Partridge River intrusion.
The Longnose intrusion is stratigraphically simple, consisting of a core of olivine-rich dunitic and peridotitic rocks containing disseminated titanium-iron oxide mineralization with horizons of massive and semi-massive oxide throughout, that is enveloped by pyroxenitic rocks, which contain much less mineralization. Disseminated titanium-iron oxide mineralization is continuous, and the horizons of
MDJ/DF/HD/WB | 2CC031_004_Longnose_NI43101_FinalReport_20120124_MDJ_wb_djf_20120127 | January 27, 2012 |
2CC031.004 Cardero Resource Corp. | |
Longnose Project | Page 9 |
massive and semi-massive oxide may link up to form layers that dip moderately coincident with dip of the overall intrusion.
The exploration data for the Project is robust; viable to support the Mineral Resource defined within this document. The data has been well validated and the analyses have been found to be repeatable. Overall, correlation of the mineralization between drill holes is reasonable and it is expected that the Mineral Resource accurately represents the TiO2 and Fe2O3 mineralization. Based on the TiO2 estimates, the mineralogy of the deposit and the Davis Tube test results, the amount of ilmenite and magnetite has been quantified.
Ilmenite and, to a lesser extent, titaniferous magnetite is used as a source material for titanium which is used to make paint pigment and as a metal alloy. Rutile is the ideal source material for titanium as it contains nearly twice as much Ti as ilmenite; however, ilmenite is by far the more common source. Most ilmenite is processed from ilmenite sands (secondary ilmenite) however several primary ilmenite mines have been successfully exploited. Processing plants capable of handling ilmenite concentrates are found in Canada, the US and throughout the world.
Ilmenite is an industrial mineral and there are risks and uncertainties associated with this ilmenite resource, many of which are common to industrial mineral deposits. Industrial minerals have special risks that are not typically associated with precious or base metal mines. Special concerns include mineralogy of material, deleterious elements (such as silica, calcium, magnesium and manganese), and special market factors such as market size or proprietary technology. Because of these and other issues, industrial mineral deposits carry additional risk compared to more common metal products. Historic testwork has indicated that the Longnose deposit produces concentrate with less favourable magnesium levels, which may adversely affect the potential value of the concentrate.
Historic tests have indicated that a viable ilmenite concentrate could be created from processing of Longnose material, although higher than ideal magnesium levels may reduce the product price somewhat. The ilmenite could potentially be sold as a concentrate to an existing ilmenite processing plant, as the deposit is amicable to shipping due to its proximity to rail and a short haul to bulk ports on the western shore of Lake Superior. As well, local added-value beneficiation is under consideration by Cardero. This goal of further beneficiation would be to produce a high TiO2 synthetic rutile slag amicable for processing into the paint pigments; however, such processing facilities are capital intensive and further work is required to determine if such a process is viable.
Based upon the significant amount of historical research completed on the Project, a relatively simple processing flow sheet for ilmenite concentrate, a recent increase in demand for ilmenite and the projects close proximity to other bulk mines and inexpensive shipping routes, SRK believes that the Project meets the criteria for having reasonable prospects of economic extraction.
Recommendations
In order to begin to better understand the potential economics of the Project, further work is required. At this stage of the exploration, SRK recommends the following work and expenditures:
a comprehensive mineralogical study of the oxide and sulfide mineralization should be conducted to confirm the specific oxide minerals present throughout the defined mineralization;
metallurgical testwork in conjunction with the mineralogical studies, to assist with better understanding of ilmenite and magnetite recovery, project economic analysis and provide an update to the work completed in the 1990s;
MDJ/DF/HD/WB | 2CC031_004_Longnose_NI43101_FinalReport_20120124_MDJ_wb_djf_20120127 | January 27, 2012 |
2CC031.004 Cardero Resource Corp. | |
Longnose Project | Page 10 |
completion of a preliminary economic assessment to assist with further exploration and provide project specific economic criteria;
further study of the other elements, such as vanadium, magnesium and silica contents and how they are distributed through the deposit;
a relatively small infill drilling program consisting of 3-5 drill holes; and,
a small step-out drilling program targeting the southern part of the intrusion consisting of 3-5 drill holes.
A budget to complete the recommended work program is presented in Table iii.
Table iii: Estimated Cost for the Exploration Program Proposed for the Longnose Project.
Recommendation |
Estimated Cost
(US$) |
Mineralogical studies and analytical data | 50,000 |
Metallurgical analysis and testwork | 150,000 |
Preliminary economic assessment analysis | 150,000 |
Geophysical Survey | 30,000 |
Longnose step-out drilling (3-5 holes/900-1500m @ $165/m*) | 200,000 |
Longnose infill drilling (3-5 holes/600-1000m @ $165/m*) | 130,000 |
Acquisition of additional mineral leases/property boundary survey | 40,000 |
TOTAL | 750,000 |
* Drilling cost per meter includes: Site and Trail preparation, drilling, sampling, facility/vehicle lease, and staffing |
MDJ/DF/HD/WB | 2CC031_004_Longnose_NI43101_FinalReport_20120124_MDJ_wb_djf_20120127 | January 27, 2012 |
2CC031.004 Cardero Resource Corp. | |
Longnose Project | Page 11 |
Table of Contents
MDJ/DF/HD/WB | 2CC031_004_Longnose_NI43101_FinalReport_20120124_MDJ_wb_djf_20120127 | January 27, 2012 |
2CC031.004 Cardero Resource Corp. | |
Longnose Project | Page 12 |
MDJ/DF/HD/WB | 2CC031_004_Longnose_NI43101_FinalReport_20120124_MDJ_wb_djf_20120127 | January 27, 2012 |
2CC031.004 Cardero Resource Corp. | |
Longnose Project | Page 13 |
16 | Interpretation and Conclusions | 87 |
17 | Recommendations | 89 |
18 | References | 91 |
MDJ/DF/HD/WB | 2CC031_004_Longnose_NI43101_FinalReport_20120124_MDJ_wb_djf_20120127 | January 27, 2012 |
2CC031.004 Cardero Resource Corp. | |
Longnose Project | Page 14 |
List of Tables
List of Figures
MDJ/DF/HD/WB | 2CC031_004_Longnose_NI43101_FinalReport_20120124_MDJ_wb_djf_20120127 | January 27, 2012 |
2CC031.004 Cardero Resource Corp. | |
Longnose Project | Page 15 |
MDJ/DF/HD/WB | 2CC031_004_Longnose_NI43101_FinalReport_20120124_MDJ_wb_djf_20120127 | January 27, 2012 |
2CC031.004 Cardero Resource Corp. | |
Longnose Project | Page 16 |
MDJ/DF/HD/WB | 2CC031_004_Longnose_NI43101_FinalReport_20120124_MDJ_wb_djf_20120127 | January 27, 2012 |
2CC031.004 Cardero Resource Corp. | |
Longnose Project | Page 17 |
1 |
Introduction and Terms of Reference |
This technical report for the Longnose property, located in Minnesota, USA, has been prepared for Cardero. Cardero is a mineral exploration company with corporate headquarters in Vancouver, B.C., Canada, and is listed on the Toronto Stock Exchange and the NYSE-Amex Stock Exchange. The Project interest is held by CIOUS, and work on the Project is carried on through Cardero Iron Ore Management (USA) Inc., an indirectly wholly owned subsidiary of Cardero.
This report relies on: historical assay data collected from drilling on the Property from the 1950s to the 1970s; re-logging of the drill core in the 2000s; re-assaying of the coarse rejects and quarter core of historical drill cores in 2009. Other geological information has come from a variety of sources, including the Minnesota Department of Natural Resources and other governmental sources, publicly available information, the underlying land owners of the Longnose property and personal communications with geologists and other professionals active in the area. In addition, this report incorporates data from drill testing of the Project commissioned by CIOUS in 2010 and 2011.
The Project Area is located in northeastern Minnesota near Aurora (Figure 3.1 ). It represents one of the numerous OUIs hosted by the Duluth Complex, which feature strong titaniferous-iron oxide mineralization. At the ProjectLongnose property, a total of 26 diamond drill holes have been completed: 11 by Northern Illinois Corp. (Nicor) and American Shield Corp., dating back to the mid-1970s, and 15 by CIOUS in 2010 and 2011.
In 2009, Cardero commissioned SRK Consulting (Canada) Inc. (SRK) to visit the Project and prepare a geological and Mineral Resource model for the Project. The services were rendered between July 2009 and January 2012, leading to the preparation of the Mineral Resource statement reported herein.
This technical report documents a Mineral Resource statement for the Project prepared by SRK. It was prepared following the guidelines of the Canadian Securities Administrators National Instrument 43-101 and Form 43-101F1. The Mineral Resource statement reported herein was prepared in conformity with generally accepted CIM Estimation of Mineral Resources and Mineral Reserves Best Practice Guidelines.
1.1 | Work Program |
The Mineral Resource statement reported herein is a collaborative effort between Cardero and SRK personnel. The exploration database was compiled and maintained by Cardero, and was audited by SRK. The geological model and outlines for the OUI mineralization were constructed by SRK from drill hole logs provided by Cardero. In the opinion of SRK, the geological model is a reasonable representation of the distribution of the targeted mineralization at the current level of sampling. The geostatistical analysis, variography and grade models were completed by SRK during the months between September 2011 and January, 2012.
The Mineral Resource statement reported herein was prepared in conformity with generally accepted CIM Exploration Best Practices and Estimation of Mineral Resource and Mineral Reserves Best Practices guidelines. This technical report was prepared following the guidelines of NI 43-101 and Form 43-101F1.
The technical report was assembled in SRK Vancouvers office during January 2012.
MDJ/DF/HD/WB | 2CC031_004_Longnose_NI43101_FinalReport_20120124_MDJ_wb_djf_20120127 | January 27, 2012 |
2CC031.004 Cardero Resource Corp. | |
Longnose Project | Page 18 |
1.2 | Basis of Technical Report |
|
This report is based on information collected by SRK during a site visit performed March 12 and March 13, 2010 and on additional information provided by Cardero throughout the course of SRKs investigations. Other information was obtained from the public domain. SRK has no reason to doubt the reliability of the information provided by Cardero. | ||
This technical report is based on the following sources of information: | ||
Discussions with Cardero personnel; | ||
Inspection of the Project area, including outcrop and drill core; | ||
Review of exploration data collected by CIOUS; and | ||
Additional information from public domain sources. | ||
1.3 | Qualifications of SRK and SRK Team | |
The SRK Group comprises over 1,000 professionals, offering expertise in a wide range of resource engineering disciplines. The SRK Groups independence is ensured by the fact that it holds no equity in any project and that its ownership rests solely with its staff. This fact permits SRK to provide its clients with conflict-free and objective recommendations on crucial judgment issues. SRK has a demonstrated track record in undertaking independent assessments of Mineral Resources and Mineral Reserves, project evaluations and audits, technical reports and independent feasibility evaluations to bankable standards on behalf of exploration and mining companies and financial institutions worldwide. The SRK Group has also worked with a large number of major international mining companies and their projects, providing mining industry consultancy service inputs. | ||
The resource evaluation work and the compilation of this technical report was completed by Michael D. Johnson, P.Geo. By virtue of their education, membership to a recognized professional association and relevant work experience, Michael D. Johnson is an independent Qualified Person as this term is defined by NI 43-101. | ||
The data validation and QA/QC analysis was completed by Darrell Farrow, Pr.Sci.Nat. By virtue of education, membership to a recognized professional association and relevant work experience, Darrell Farrow is an independent Qualified Person as this term is defined by NI 43-101. | ||
Dr. Wayne Barnett, Pr.Sci.Nat, a Principal with SRK, reviewed drafts of this technical report prior to their delivery to Cardero as per SRK internal quality management procedures. Dr. Wayne Barnett visited the project in July 2009. | ||
1.4 | Site Visit | |
In accordance with NI 43-101 guidelines, Mike Johnson of SRK visited the Longnose project on March 12 and 13, 2010, accompanied by Chris White, Senior Site geologist for CIOUS.Cardero. Wayne Barnett of SRK has also previously visited the site in July 2009 accompanied by Carderos Tansy OConnor-Parsons. | ||
The purpose of the most recent site visit was to review the digitalization of the exploration database and validation procedures, review exploration procedures, define geological modelling procedures, examine drill core, interview project personnel, and collect all relevant information for the preparation of a Mineral Resource model and the compilation of a technical report. During the visit, particular |
MDJ/DF/HD/WB | 2CC031_004_Longnose_NI43101_FinalReport_20120124_MDJ_wb_djf_20120127 | January 27, 2012 |
2CC031.004 Cardero Resource Corp. | |
Longnose Project | Page 19 |
attention was given to the treatment and validation of historical drilling data as well as the procedures being implemented during drilling, logging and sampling.
The site visit was completed while drilling was taking place on the Project. SRK staff was able to observe drilling, surveying, logging, sampling and sample handling and shipping.
SRK was given full access to relevant data and conducted interviews with Cardero/CIOUS personnel to obtain information on the past exploration work, to understand procedures used to collect, record, store and analyze historical and current exploration data.
1.5 | Acknowledgement |
SRK would like to acknowledge the support and collaboration provided by Cardero/CIOUS personnel for this assignment, particularly Chris White and Tansy OConnor-Parsons. Their collaboration was greatly appreciated and instrumental to the success of this project.
As well, the authors would like to thank SRKs Dr. Gilles Arseneau, P.Geo., Marek Nowak, P.Eng, and Dr. Adrian Dance for their contributions, reviews and advice during analysis and reporting of this Mineral Resource.
1.6 | Declaration |
SRKs opinion contained herein and effective January 19, 2012, is based on information collected by SRK throughout the course of SRKs investigations, which in turn reflect various technical and economic conditions at the time of writing. Given the nature of the mining business, these conditions can change significantly over relatively short periods of time. Consequently, actual results may be significantly more or less favourable.
This report may include technical information that requires subsequent calculations to derive subtotals, totals and weighted averages. Such calculations inherently involve a degree of rounding and consequently introduce a margin of error. Where these occur, SRK does not consider them to be material.
SRK is not an insider, associate or an affiliate of Cardero, and neither SRK nor any affiliate has acted as advisor to Cardero, its subsidiaries or its affiliates in connection with the Project. The results of the technical review by SRK are not dependent on any prior agreements concerning the conclusions to be reached, nor are there any undisclosed understandings concerning any future business dealings.
MDJ/DF/HD/WB | 2CC031_004_Longnose_NI43101_FinalReport_20120124_MDJ_wb_djf_20120127 | January 27, 2012 |
2CC031.004 Cardero Resource Corp. | |
Longnose Project | Page 20 |
2 |
Reliance on Other Experts |
In preparing this report, SRK has relied on information provided by Cardero for matters pertaining to environmental, socioeconomic, and permitting issues. SRK has not performed an independent verification of land title and tenure as summarized in Section 3 of this report. SRK did not verify the legality of any underlying agreement(s) that may exist concerning the permits or other agreement(s) between third parties, but have relied on a preliminary title work carried out by Minnesota counsel to Cardero.
SRK was informed by Cardero that there are no known litigations potentially affecting the Project.
MDJ/DF/HD/WB | 2CC031_004_Longnose_NI43101_FinalReport_20120124_MDJ_wb_djf_20120127 | January 27, 2012 |
2CC031.004 Cardero Resource Corp. | |
Longnose Project | Page 21 |
3 |
Property Description and Location |
The Project Area is located in northeastern Minnesota near Aurora ((image sourced from the Minnesota Department of Transportation)
Figure 3.1 ). The Project Area is located in St. Louis County, Township 59N, Range 13W, Section 30.
(image sourced from the Minnesota Department of Transportation)
Figure 3.1: Location of the Longnose property
The Project Area is centered at: (Coordinate system: Universal Trans Mercator, Zone 15 North, North American 1983 Datum) 572200 m East, 5268300 m North. CIOUS holds an option to acquire an interest in mineral leases on 280 acres (113 hectares) at the Project.
Properties in Minnesota are defined using the Township and Range, Section, quarter-section, quarter-section, quarter-section method. Sections are marked by corner posts; however corner posts are not always present. CIOUS has conducted a geographical location survey on the Project. This survey mainly focused on locating historical drill collars and the original sampling grid cut baseline. An in-depth property boundary survey has not been completed; however the Project Area boundaries have been located on aerial photographs (Figure 3.2) .
MDJ/DF/HD/WB | 2CC031_004_Longnose_NI43101_FinalReport_20120124_MDJ_wb_djf_20120127 | January 27, 2012 |
2CC031.004 Cardero Resource Corp. | |
Longnose Project | Page 22 |
Figure 3.2: Longnose Property boundary with 2010 drill collar locations.
Mineralization at the Project Area is approximately centered at: (Coordinate system: Universal Trans Mercator, Zone 15 North, North American 1983 Datum) 572100 m East, 5268300 m North. There have been no commercial mining operations at the Project Area.
3.1 | Mineral Tenure |
Minerals in Minnesota are typically held as fee simple interests, either as part of the overall land estate or as a separate property interest. In many cases, ownership of the mineral estate has been severed from the surface estate, and may be held by a different owner. Although title to the mineral estate is often held by the State of Minnesota or the US Federal government, there are significant areas of private mineral ownership in Minnesota. Thus, there is often split-estate ownership, where the person or entity owning the surface may be, and often is, different than the person or entity that owns the mineral rights. Additionally, mineral rights themselves may also be split (e.g. the hydrocarbon rights owner may be different than the non-hydrocarbon mineral rights owner). United States law indicates that in split-estate situations mineral rights are the dominant estate and have precedence over all other property rights (including surface). However, the mineral rights owner
MDJ/DF/HD/WB | 2CC031_004_Longnose_NI43101_FinalReport_20120124_MDJ_wb_djf_20120127 | January 27, 2012 |
2CC031.004 Cardero Resource Corp. | |
Longnose Project | Page 23 |
must have due regard for the surface estate and only occupy/use those portions of the surface that are necessary for mineral development.
Land holdings at the Project are primarily a split-estate wherein ALLETE, Inc. (ALLETE; a Minnesota corporation) (Allete) holds the surface rights, and a collection of individuals and other corporations holds the mineral rights (although Allete also holds an interest in some of the minerals). CIOUS has entered a ground license agreement with Allete dated January 12, 2010, pursuant to which CIOUS pays Allete a fixed fee per bore hole drilled, and agreed to carry out all required reclamation and indemnify Allete. In addition, under the ground license CIOUS has a right of first refusal to match any offer that may be made by a third party to purchase the surface estate held by Allete over the Project Area.
3.2 | Longnose Interest |
Pursuant to an agreement dated November 26, 2008 and accepted on December 8, 2008 between Cardero Iron Ore Company Ltd. and Raymond L. Morley (on behalf of The Morley Group Inc.) ("Morley"), CIOUS has been granted the option to acquire up to an 85% interest in the interest of Morley in certain existing mineral leases, and in a lease to be entered into, covering 100% of the fee mineral rights to approximately 200 acres and 50% of the fee mineral rights to approximately 80 acres, located in St. Louis County, Minnesota, just north of the town of Hoyt Lakes and referred to as the Longnose property.
CIOUS can earn an initial 70% interest in the Morley interest by incurring cumulative expenditures of USD 1,850,000 over 4 years to December 8, 2012 and paying USD 50,000 to Morley on or before August 15, 2009 (and each and every August 15th thereafter) to be used by Morley to make the annual USD 50,000 advance royalty payment due to the underlying landowners under the existing leases. CIOUS can earn an additional 15% interest in the Morley interest (for 85% overall) by delivering a feasibility study (no time limit for delivery). Upon CIOUS having earned a 70% or 85% interest, Morley can elect to convert its interest to a 10% net profits interest (if CIOUS elects not to earn the additional 15% interest) or a 5% net profits interest (if CIOUS elects to earn the full 85% interest). If Morley does not so elect, upon CIOUS having earned its 70% or 85% interest, as applicable, CIOUS and Morley will enter into a joint venture, with each party being responsible for its pro-rata share of all joint venture expenditures. If a party to the joint venture is diluted to a 10% or lesser interest, such interest will be converted to a 2.5% net profits interest. To October 31, 2011, CIOUS has incurred an aggregate of USD 1,802,389 in expenditures and made all of the required USD 50,000 payments to August 15, 2011.
MDJ/DF/HD/WB | 2CC031_004_Longnose_NI43101_FinalReport_20120124_MDJ_wb_djf_20120127 | January 27, 2012 |
2CC031.004 Cardero Resource Corp. | |
Longnose Project | Page 24 |
Table 3.1: Mineral Tenure Information.
Parcel Description |
Sec/Tsp/Range |
Surface Owner |
Mineral
Owner |
N½ of NE¼ |
30/59 North/13 West |
Allete, Inc. |
Allete, Inc. (½) American Shield Co, Darryl E. Coons & Lloyd K. Johnson (½) |
NW¼ of SE¼, SW¼ of NE¼ SE¼ of NE¼ NE¼ of SW¼ |
30/59 North/13 West |
Allete, Inc. |
Darryl E. Coons
(5/16) Harold A. Knutson (1/16) Duluth Superior Area Community Foundation (1/16) Jean Thomas Johnson (1/16) Frederick C. Dean (1/8) Lewis F. Bogan (1/8) Agnes Bogan Wells (1/8) Alfred Dean Bogan (1/8) |
SE¼ of NW¼ |
30/59 North/13 West |
Allete, Inc. |
Darryl E. Coons (5/16) Harold A. Knutson (1/16) Duluth Superior Area Community Foundation (1/16) Jean Thomas Johnson (1/16) Frederick C. Dean (1/8) Lewis F. Bogan (1/8) Agnes Bogan Wells (1/8) Alfred Dean Bogan (1/8) |
3.3 | Permits and Authorization |
All licenses, permits, and registrations required to conduct exploratory drilling in Minnesota have been obtained by CIOUS, and are up to date. The required licenses, permits, and registrations that CIOUS has obtained are listed below.
Licensed Exploratory Borer with the Minnesota Department of Natural Resources (MDNR); License number: A10-0102 (annual renewal).
Licensed Explorer Company with the Minnesota Department of Health (MDH); License number 2850 (annual renewal).
Licensed Explorer Responsible Individual with the Minnesota Department of Health: License number: 2841 (Chris White; lifetime license).
Permit for drilling in wetlands with the United States Army Corp of Engineers for the Project and the Titac Project (also held by CIOUS) (Permit expired on August 22, 2011).
Road Use Permit with the U.S. Forest Service for use of F.S.R. 117 to access the Project Area (annual renewal).
Special Uses Permit with the U.S. Forest Service for use of spur off of F.S.R. 117 to access the Project Area (3-year permit with annual renewal).
Storm Water Pollution Prevention Plan Permit (SWPPP) with the Minnesota Pollution Control Agency (MPCA) for each property (permit open until project completion, must notify MPCA upon completion of project for closure of permit).
3.4 | Environmental Considerations |
MDH regulations require that CIOUS must file a drill plan with the MDNR and the MDH at least 14 days prior to drilling operations, and the Explorer Responsible Individual must file well abandonment forms with the MDNR and the MDH within 30 days of completing each drill hole, and that exploratory bore holes must be sealed upon completion of drilling in compliance with MDH rules and regulations.
MDJ/DF/HD/WB | 2CC031_004_Longnose_NI43101_FinalReport_20120124_MDJ_wb_djf_20120127 | January 27, 2012 |
2CC031.004 Cardero Resource Corp. | |
Longnose Project | Page 25 |
Upon filing an initial drill plan, CIOUS may begin drilling operations after 14 days, and may revise, or expand the drill plan by notifying the MDNR and MDH within one day of executing the new drill plan.
MPCA regulations state that any ground disturbance greater than one acre requires the development, approval, and institution of a SWPPP. The plan must be drafted by a person, or persons, certified by the MPCA, and a certified SWPPP site manager must oversee implementation of the plan, and application of the plan throughout the duration of the project. This plan must be modified as the project progresses to reflect any change in operations that warrant additional or different pollution prevention measures. CIOUSs consulting geologist, Chris White, has obtained the proper certification with the MPCA to draft the SWPPP and to act as the SWPPP site manager; and Warren Johnson, a CIOUS contractor, is a certified SWPPP contractor with the MPCA. Chris White has been retained by CIOUS to oversee the overall and day-to-day project operations, and Warren Johnsons company has been retained to install all drill trails and drill pads at the Longnose property.
MDJ/DF/HD/WB | 2CC031_004_Longnose_NI43101_FinalReport_20120124_MDJ_wb_djf_20120127 | January 27, 2012 |
2CC031.004 Cardero Resource Corp. | |
Longnose Project | Page 26 |
4 |
Accessibility, Climate, Local Resources, Infrastructure and Physiography |
4.1 | Accessibility |
Accessibility is excellent, with the Project Area located off of a paved county highway via a well maintained gravel road.
The Project Area is located approximately 15.7 km (10 miles) east of Aurora, Minnesota. CIOUS is leasing a large portion of an old school building (Cina Building, 200 S. 2nd St. E., Aurora, MN 55705) in Aurora, Minnesota that serves as a field office, a drill core logging, preparation, and sampling facility, and a drill core, coarse sample, and sample pulp storage facility.
To access the Project Area from Aurora, MN: Beginning at the intersection between St. Louis County highway 99 and St. Louis County highway 110, travel east on St. Louis County highway 110 for 8.2 km (5.1 miles) to St. Louis County highway 666. Turn left, traveling north on St. Louis County highway 666 for 4.5 km (2.8 miles) to Forest Service Road 117. Turn right, traveling east on Forest Service Road 117 for 5.6 km (3.5 miles) to an unnamed spur which travels north. Turn right, traveling north on the unnamed spur for 0.3 miles (0.5 km) to an open equipment staging area.
4.2 | Local Resources and Infrastructure |
The population of Aurora, Minnesota is approximately 1,850, and the nearby city of Hoyt Lakes, Minnesota (5 miles east of Aurora) has a population of approximately 2,000 people. Duluth, Minnesota (pop. 84,419) is located approximately 120.7 km (75 miles) south of the Project. Virginia, Minnesota (pop. 8,481) is located approximately 56.3 km (35 miles) west of the Project.
Northeastern Minnesota has been supporting mining activities since the Soudan Mine opened in 1882. Currently, northeastern Minnesota facilitates six taconite (iron ore) mines located approximately within 96.5 km (60 miles) west of the Project in the Iron Range of Minnesota in the Virginia, and Hibbing, Minnesota area. When at full production, the taconite (iron ore) mining industry directly employs nearly 4,000 people in northeastern Minnesota.
The infrastructure in northeastern Minnesota related to mining activities is excellent with low cost electricity, railroads, paved state and county highways, international shipping ports, mining professionals, mining vendors, and trained labor all readily available. International shipping ports are located along the north shore of Lake Superior including Duluth/Superior, Silver Bay, Taconite Harbor, and Two Harbors with linked rail systems to all.
Northeastern Minnesota is easily accessible through air travel with three airports located within 96.5 km (60 miles) of Hoyt Lakes, Minnesota including the Eveleth Virginia Municipal Airport located in Virginia, Minnesota; the Range Regional Airport (RRA), located in Hibbing, Minnesota; and the Duluth International Airport (DIA), located in Duluth, Minnesota. Commercial flights are offered by Delta Airlines at RRA and DIA, and also by Allegiant Air at DIA. The Minneapolis/St. Paul airport is located approximately 321.7 km (200 miles) south of Hoyt Lakes, Minnesota. Connecting flights are available from Minneapolis/St. Paul to both DIA, and RRA.
The Laskin Energy Center is located near Hoyt Lakes, Minnesota (less than 16 km (10 miles) from the Project), providing 110 megawatts of electric service, and a 138KVA electricity transmission line
MDJ/DF/HD/WB | 2CC031_004_Longnose_NI43101_FinalReport_20120124_MDJ_wb_djf_20120127 | January 27, 2012 |
2CC031.004 Cardero Resource Corp. | |
Longnose Project | Page 27 |
runs within 5 km (3.1 miles) of the Project. The DM&IR (Canadian National) Railway services the Laskin Energy Park, located next to the Laskin Energy Center and a rail spur runs within 2 km (1.3 miles) of the Project. The Laskin Energy Park also provides natural gas, water and waste water, and industrial steam power services.
The Erie plant (formerly owned by LTV Steel Mining Company and currently owned by Polymet Mining Corporation), a large crushing, grinding, and milling facility, is located approximately 4 miles (6.4 km) west-northwest of the Project. The Erie plant was built in the 1950s, and processed approximately 100,000 tons of taconite (low-grade iron) ore per day until 2001 when LTV Steel Mining Company filed for bankruptcy. Polymet intends to use the Erie plant to process the copper-nickel-platinum group element ore from its NorthMet deposit, and estimates that the plant will provide 400 full-time jobs.
The Steel Dynamics, Inc. Mesabi Nugget plant is located just north of Hoyt Lakes, Minnesota. Mesabi Nugget uses an innovative direct-reduction process to produce pig-iron nuggets. Production began at Mesabi Nugget in December of 2009, and the plant has a capacity to produce 500,000 tonnes of pig-iron nuggets a year. The Mesabi Nugget plant currently provides approximately 90 full-time jobs.
4.3 | Climate |
The climate in northeastern Minnesota is mid-continental. Winter conditions usually begin in mid-December and last until mid-March, with frozen ground beginning in late-December to early-January. The spring thaw usually begins in mid-March to late-April, with stable, dry spring-summer-fall conditions occurring from late-April to mid-December. Table 4.1 below displays the monthly average temperatures and precipitation for the Hoyt Lakes area.
MDJ/DF/HD/WB | 2CC031_004_Longnose_NI43101_FinalReport_20120124_MDJ_wb_djf_20120127 | January 27, 2012 |
2CC031.004 Cardero Resource Corp. | |
Longnose Project | Page 28 |
Table 4.1: Average monthly temperatures and precipitation, Hoyt Lakes, Minnesota
MONTH |
Avg. High
Temp (degrees F) |
Avg. Low
Temp (degrees F) |
Avg.
Precipitation (inches) |
January | 16 | -14 | 0.76 |
February | 24 | -8 | 0.7 |
March | 35 | 6 | 0.99 |
April | 51 | 22 | 1.57 |
May | 65 | 33 | 3.05 |
June | 73 | 43 | 4.49 |
July | 77 | 48 | 4.42 |
August | 75 | 45 | 4.29 |
September | 65 | 36 | 4 |
October | 52 | 26 | 2.9 |
November | 34 | 12 | 1.33 |
December | 20 | -5 | 0.61 |
Source: www.weather.com
4.4 | Physiography |
Topographic relief on the Project Area is generally low, and the surface is flat-laying. Elevations on the Project Area range between 465 m and 480 m. The ground cover is a mixture of Palustrine, forested wetlands (Cowardin classification system), and higher dry forested ground. Longnose creek runs through the Project Area. Overburden, consisting of glacial till composed of pebbles, cobbles, and boulders within a sand and clay matrix, covers much of both properties. At the Project Area, bedrock is locally exposed to the north-northwest with up to approximately 3 m of overburden. The bedrock surface gently dips to the south-southeast where overburden thickens to approximately 20 m.
MDJ/DF/HD/WB | 2CC031_004_Longnose_NI43101_FinalReport_20120124_MDJ_wb_djf_20120127 | January 27, 2012 |
2CC031.004 Cardero Resource Corp. | |
Longnose Project | Page 29 |
Figure 4.1: Typical Landscape in the Project Area (provided by CIOUS)
MDJ/DF/HD/WB | 2CC031_004_Longnose_NI43101_FinalReport_20120124_MDJ_wb_djf_20120127 | January 27, 2012 |
2CC031.004 Cardero Resource Corp. | |
Longnose Project | Page 30 |
5 |
History |
Northeastern Minnesota has a strong history of iron and taconite mining, as well as copper, nickel, and platinum group element exploration. Titaniferous iron deposits were first discovered in northeastern Minnesota in the mid to late 1800s in the northern portion of the Duluth Complex. Additional titaniferous iron deposits were discovered in the southern part of the Duluth Complex in the mid to late 1900s during reconnaissance exploration for copper and nickel.
5.1 | Titaniferous Iron Oxide Mineralization in the Duluth Complex |
In 1967, several companies began exploring magnetic anomalies delineated from state geophysical surveys in the southern part of the Duluth Complex. Exploration drilling targeted these magnetic anomalies searching for copper-nickel sulfide mineralization. While copper-nickel sulfide mineralization was intersected in many drill holes, the magnetic anomalies were largely composed of titaniferous-iron oxide mineralization. At the time, these intrusions were generally thought to be of little importance, because copper-nickel grades were too low to have economic significance during that time period. However, several titaniferous iron oxide intrusions have been explored in detail including the Longnose intrusion.
The following summarizes the known history of the Project Area.
5.2 | Longnose Property |
Twenty seven diamond drill cores have been drilled at the Project Area. Bear Creek Mining Co. drilled the first hole in 1958 to investigate a magnetic high and electromagnetic anomaly. This first hole (A1-1) intersected titanium-iron-oxide mineralization to a depth of 102.1 m (335 feet), that was hosted by peridotite and pyroxenite. A decade later (1969), Exxon Corp. drilled a second hole (BA-6) on the property that intersected titanium-iron-oxide mineralization to a depth of 81 feet (24.7 m). American Shield Corp began exploration at Longnose in 1975, drilling a single hole (LN-1), and resumed drilling in 1984 via a joint venture agreement with Northern Illinois Corp. (Nicor); completing nine more drill holes on the property. Figure 5.1 displays the locations of historic drill holes on the Property Area including: A1-1, BA-6, and LN-1 through LN-10 (taken from Patelke and Severson, 2005). Exploration drilling on the Project Area halted until 2010, when CIOUS drilled six holes followed by nine holes in 2011.
Two bulk samples for metallurgical testing and TiO2 recovery have been collected from the Project Area. The test pit locations are displayed in Figure 6.1 (Patelke and Severson, 2001). The first bulk sample measured 32+ tons of material and was collected in 1984 by the American Shield Corp/Nicor joint venture. The second bulk sample measured 60 tons and was collected in the 1990s by American Shield Corp. The University of Minnesota, Natural Resources Research Institute, Coleraine Minerals Research Laboratory houses what remains of both bulk samples.
BHP Minerals International Inc. (BHP) held the Project Area for some time in the 1990s. Most of the work completed by BHP centered on metallurgy, and TiO2 recovery as well as value-added beneficiation of the ilmenite to a higher titanium product.
MDJ/DF/HD/WB | 2CC031_004_Longnose_NI43101_FinalReport_20120124_MDJ_wb_djf_20120127 | January 27, 2012 |
2CC031.004 Cardero Resource Corp. | |
Longnose Project | Page 31 |
Figure 5.1: Map showing the locations of historic diamond drill holes and bulk sample test pits on the Longnose property, taken from Patelke and Severson, 2005
5.2.1 | Historic Metallurgical Studies |
Metallurgical Testing was completed on the Longnose deposit at a variety of scales at different times. This included several bulk samples on which larger scale processing and metallurgy tests were completed.
The Coleraine Minerals Research Laboratory (CMRL) was provided with a sample of approximately 680 kg on March 6, 1991 by the American Shield Corp/Nicor joint venture. The sample was collected from a large outcrop within the western part of the Longnose deposit. A processing flow sheet was developed and the sample was beneficiated by grinding, spiral separation, magnetic concentration, and dry high tension concentration. The first full-scale pilot plant run was made on October 3, 1994. (Coleraine Minerals, 1994)
A larger bulk sample was collected in the 1990s by American Shield Corp. This 39 tonnes (43-ton) bulk sample of Longnose material was also collected from outcrop within the western portion of the deposit. The material was crushed to rod mill feed size, minus 3/8 inch, and processed in the CMRL wet pilot
MDJ/DF/HD/WB | 2CC031_004_Longnose_NI43101_FinalReport_20120124_MDJ_wb_djf_20120127 | January 27, 2012 |
2CC031.004 Cardero Resource Corp. | |
Longnose Project | Page 32 |
plant by rod-mill grinding, spiral separation, wet magnetic separation (WLIMS). The WLIMS operation yielded two streams (magnetic & non-magnetic fractions) that were subsequently processed. The downstream processing of the magnetic fraction incorporated ball mill grinding, and a second WLIMS step. The magnetic fraction essentially concentrated the iron, and the non-magnetic fraction was further processed using desliming and flotation so as to enrich the titania. The post-flotation stream comprised ~17% of the final titania concentrate. The previously mentioned non-magnetic fraction was dried and upgraded using high tension separation. The conductors from the high tension separation step became ~83% of the final titania concentrate. A flow sheet showing the average material balance for the wet & dry processing steps is given in the following table. Overall, the indicated recovery of TiO2 from this process was 66%.
(source CMRL, 1996)
Figure 5.2:
1996 bulk sample treatment flow sheet
Value-added pyrometallurgical processing has also been contemplated for the Longnose deposit. Up to 1996, the metallurgical analysis of the Longnose material was mainly focused on producing an Ilmenite concentrate above 45 % TiO2. Further beneficiation by upgrading of this concentrate to a titanium slag & pig iron has been contemplated because it is expected that such processing would have significant economic benefit and provide a site where an optimized process, designed for the local ilmenite bearing bodies, can be developed. It had been noted that the magnesium content of the ilmenite was higher than average and that local beneficiation may be advantageous compared to ilmenite concentrate sale.
BHP completed preliminary down-stream beneficiation testwork in the 1990s. Their first investigation involved a smelting and sulfation-leaching process developed by the US Bureau of
MDJ/DF/HD/WB | 2CC031_004_Longnose_NI43101_FinalReport_20120124_MDJ_wb_djf_20120127 | January 27, 2012 |
2CC031.004 Cardero Resource Corp. | |
Longnose Project | Page 33 |
Mines, a somewhat modified version of a process which is completed at several processing facilities located around the world, including in the US and Canada. Their second investigation involved an oxidation-reduction roast followed by chemical leaching. The second process was based on modifying the Murso process. The Murso process involved an acid leach of the material which results in a high grade (+94% TiO2) synthetic rutile. BHP apparently abandoned the Longnose project over a dispute regarding the ownership of the Murso technology (Ulland, 2000).
MDJ/DF/HD/WB | 2CC031_004_Longnose_NI43101_FinalReport_20120124_MDJ_wb_djf_20120127 | January 27, 2012 |
2CC031.004 Cardero Resource Corp. | |
Longnose Project | Page 34 |
6 |
Geological Setting and Mineralization |
6.1 | Regional Geology |
The Project Area is within the Superior Province of the Canadian Shield. The regional basement rocks are composed of Archean granitoid intrusions, metasedimentary rocks, and metavolcanic rocks; and Paleoproterozoic sedimentary rocks. Mafic flows, mafic and felsic intrusives, and related interflow sedimentary rocks cut these basement rocks during the development of the Mesoproterozoic Midcontinent Rift System (MCR).
The Midcontinent Rift System stretches from Lake Superior to Iowa (Figure 6.1), and is largely buried by sediments; however, MCR bedrock is relatively well exposed in the Lake Superior region. In northeastern Minnesota, the MCR is dominantly composed of several groups of rocks including: the North Shore Volcanic Group (NSVG), the Beaver Bay Complex, and the Duluth Complex. The roof zone of the MCR is largely composed of NSVG lava flows, and the Duluth Complex is generally the intrusive equivalent of the NSVG lava flows.
Figure 6.1: Mid-continent Bouguer gravity anomaly (Source geo.umn.edu/mgs/nicegeo/pdfs/boug_grav.pdf)
Figure 6.1 shows the Mid-continent rift extending from Lake Superior through Iowa, USA.
The multiple intrusions of the Duluth Complex occur within an arcing band from Duluth to near the Canadian border that is 270 km long and up to 40 km wide. In terms of aerial exposure, it is the second largest mafic intrusive complex on Earth after the Bushveld Complex of South Africa. The
MDJ/DF/HD/WB | 2CC031_004_Longnose_NI43101_FinalReport_20120124_MDJ_wb_djf_20120127 | January 27, 2012 |
2CC031.004 Cardero Resource Corp. | |
Longnose Project | Page 35 |
Duluth Complex is typically subdivided into four intrusive series based on dominant lithology, general age, and internal structure. In order of relative decreasing age, these series are the felsic series, the early gabbroic series, the anorthositic series, and the layered series (Miller et al., 2002). Field evidence suggests that the layered series intruded into the anorthositic series; however, U-Pd dates obtained by Paces and Miller (1993) show that the anorthositic series and the layered series are virtually identical in age. This indicates that the layered series likely intruded into the anorthositic series when it was still quite warm, and possibly semi-molten. The anorthositic series has not been subdivided into individual intrusions; however, the layered series has been shown to consist of at least 12 distinct mafic layered intrusions (Miller et al., 2002;).
A geological map of northeastern Minnesota displaying the Duluth Complex and associated formations with the layered series intrusions is shown in Figure 6.1.
(Miller et al. 2002).
Figure 6.2
Geological Map of northeastern Minnesota
In Figure 6.1, the geological units defined include: TI Tuscarora intrusion, L1T Lake One Troctolite, WLI Wilder Lake intrusion, SKI South Kawishiwi intrusion, BEI Bald Eagle intrusion, OLI Osier Lake intrusion, GLI Greenwood Lake intrusion, PRI Partridge River intrusion, WMI Western Margin intrusion, BLI Boulder Lake intrusion, DLS Layered Series at Duluth (Miller et al. 2002).
MDJ/DF/HD/WB | 2CC031_004_Longnose_NI43101_FinalReport_20120124_MDJ_wb_djf_20120127 | January 27, 2012 |
2CC031.004 Cardero Resource Corp. | |
Longnose Project | Page 36 |
6.2 | Property Geology |
Several layered series intrusions host numerous OUIs in the Duluth Complex, including (from north to south) the Partridge River intrusion, the Western Margin intrusion, and the Boulder Lake intrusion. All known OUIs occur proximal to the western contact of the Duluth Complex in a straight line beginning just south of Babbitt, Minnesota, and ending just north of Duluth, Minnesota. Known OUI intrusions in the Duluth Complex include Section 17, Longear, Longnose, Section 22, Skibo, Water Hen, Section 34 (Titac), Boulder Creek, Boulder Lake North, and Boulder Lake South. OUI deposits cut the layered series intrusions, and are generally regarded as late occurring events in the development of the MCR. Geometrically, OUIs have various shapes and sizes including pipe-like, sheet-like, and funnel-like, and their emplacement may be structurally controlled (Severson, 1995).
6.3 | Geology of the Longnose Property |
Outcropping bedrock is sparse on the Project Area with regards for the Longnose intrusion itself, though several outcrops do exist toward the northern extents of the Project Area, and country rock is exposed to the south of the intrusion. Most of the known geology of the Longnose intrusion comes from the 27 drill cores that have been drilled into and around the intrusion; 12 drill holes are historic, while six holes were drilled by CIOUS in 2010, and nine in 2011. The Longnose OUI is dominantly hosted by troctolite and augite troctolite of the Partridge River intrusion. Drilling has indicated that the Longnose intrusion is approximately 700 m long, by 600 m wide, by 150 m thick, and it appears to have a sill-like geometry with a moderate southeastern dip. The eastern, southeastern, and southern margins of the intrusion are not completely defined, and the intrusion may extend in these areas at depth. Lithologically, the OUI is composed of medium- to coarse-grained to pegmatitic pyroxenite, feldspathic pyroxenite, peridotite, feldspathic peridotite, dunite, semi-massive oxide, and massive oxide, as defined by the Severson and Hauck (1990) rock classification scheme for Duluth Complex rocks (Figure 6.3) . The core of the intrusion is composed of olivine-rich rocks (feldspathic peridotite, peridotite, and dunite), while the outer zones consist of predominantly pyroxenite. Massive and semi-massive oxides may be crudely layered or zoned throughout the intrusion. Contacts between country rock and the OUI are typically sharp (cm scale), and internal lithologic contacts of the OUI intrusion are also sharp. Titanium-iron oxide mineralization is known to extend to a true depth of at least 150 m, and may extend deeper to the east, southeast, and south of the intrusion.
MDJ/DF/HD/WB | 2CC031_004_Longnose_NI43101_FinalReport_20120124_MDJ_wb_djf_20120127 | January 27, 2012 |
2CC031.004 Cardero Resource Corp. | |
Longnose Project | Page 37 |
Figure 6.3: Schematic cross-section through the Longnose Oxide-bearing Ultramafic Intrusion
MDJ/DF/HD/WB | 2CC031_004_Longnose_NI43101_FinalReport_20120124_MDJ_wb_djf_20120127 | January 27, 2012 |
2CC031.004 Cardero Resource Corp. | |
Longnose Project | Page 38 |
Figure 6.4: Rock classification scheme for Duluth Complex rocks, after Severson and Hauck, 1990.
6.4 | Mineralization at Longnose |
Mineralization at Longnose dominantly consists of disseminated to net-textured, medium- to coarse-grained, ilmenite, titaniferous magnetite and magnetite. It is quite difficult to tell the difference between titanium-rich mineralization and iron-rich mineralization in hand sample; however, it is Carderos experience that drill core exhibiting a dark-silvery color is ilmenite-rich; drill core exhibiting a dull-black color is rich in titaniferous magnetite; and drill core exhibiting a shiny-black color is magnetite-rich. Olivine-rich ultramafic rocks (peridotite, feldspathic peridotite, & dunite) host the majority of the titanium-iron oxide mineralization found in the Longnose OUI, and will often be net-textured with oxide minerals interstitial to silicates. Carderos visual modal mineral calculations generally estimate that titanium-iron oxide minerals compose 15-35% of the peridotitic and dunitic rocks at Longnose.
Historic petrography work was completed by T.P. Paster on behalf of Westmont Mining Inc. in 1987. This work looked at 22 polished sections and three (3) concentrates from the Longnose deposit. Based on this work, cumulus ilmenite was found to be the dominant oxide, followed by cumulus
MDJ/DF/HD/WB | 2CC031_004_Longnose_NI43101_FinalReport_20120124_MDJ_wb_djf_20120127 | January 27, 2012 |
2CC031.004 Cardero Resource Corp. | |
Longnose Project | Page 39 |
titaniferous magnetite and intercumulus titaniferous magnetite. Magnetite was found to be minor and generally a product of olivine alteration. Cumulus oxides tended to be 0.2 mm to 10 mm in size. Minor rutile and hematite occurred as rims to ilmenite crystals. Silicate mineralogy included olivine, hyperthene and augite. (Pastor, 1987)
Numerous massive and semi-massive titanium-iron oxide horizons or zones (45-100% titanium-iron oxide) have been intersected by CIOUS in drill core. These massive and semi-massive oxides seem to be dominantly hosted by peridotite and dunite, though they have been intersected within zones of pyroxenite as well. It is somewhat unclear if the massive and semi-massive zones are continuous throughout the intrusion, or if they exist as discrete pockets.
It is clear, though, that the main mineralized intrusion at Longnose is a thick, laterally and vertically continuous intrusion, dominantly composed of a mixture of oxide-bearing peridotite, oxide-bearing dunite, massive oxide, and semi-massive oxide with between 15% and 100% titanium-iron oxide mineralization.
MDJ/DF/HD/WB | 2CC031_004_Longnose_NI43101_FinalReport_20120124_MDJ_wb_djf_20120127 | January 27, 2012 |
2CC031.004 Cardero Resource Corp. | |
Longnose Project | Page 40 |
7 |
Deposit Types |
Titaniferous iron oxide intrusions within the Duluth Complex were first discovered in 1867, approximately coincident with the discovery of the Mesabi Range iron ores (Winchell, 1897). Broderick (1917) was the first to classify the intrusions while working in the northern part of the Duluth Complex, subdividing them into 4 groups: A) inclusions of Gunflint Iron-Formation, B) gabbroic banded segregations, C) irregular late intrusions of titaniferous magnetite, and D) dike-like intrusions of titaniferous magnetite. Severson (1988), and Severson and Hauck (1990) recognized types 3 and 4 while working in the western and southern portions of the Duluth Complex and reclassified them together as OUIs, based on their ultramafic composition, high oxide content, and cross-cutting relationships to the layered series troctolitic intrusions that host them. Hauck et al. (1997) reclassified Brodericks (1917) subdivisions into three general types: Type 1, banded or layered, oxide-rich metasedimentary inclusions in mafic and ultramafic rocks; Type 2, banded or layered oxide segregations (cumulates) in mafic rocks; and Type 3, discordant OUIs with semi-massive to massive oxide zones. The Longnose intrusion is classified as Type 3 titaniferous iron oxide intrusions (Hauck et al. 1997) as described below.
Type 3 titaniferous iron oxide intrusions in the Duluth Complex are somewhat similar to the ultramafic intrusions of the Bushveld Complex, the Stillwater Complex, and the Rio Jacare Intrusion of Brazil (Hauck et al. 1997). They are typically composed of coarse-grained to pegmatitic, oxide-bearing (>5% to 30% oxide minerals) pyroxenite, peridotite, and dunite, which contain lenses of semi-massive (>30% to 90% oxide minerals) and massive oxide (>90% oxide minerals). OUIs in the Duluth Complex vary in size and shape, but generally seem to occur as sheet-like intrusions (sills), funnel-like intrusions, dike-like intrusions, or pipe-like intrusions. They can be zoned with numerous apophyses around a centralized ultramafic core. When they are zoned, they tend to feature pegmatitic pyroxenite, generally surrounding a core of coarse-grained to pegmatitic peridotite and dunite. They appear to be deep-seated and several Duluth Complex OUIs seem to be root-less.
Genesis of the Duluth Complex OUIs is speculative and several theories have been proposed as described below:
1) |
Severson (1988, 1991, & 1994), and Severson and Hauck (1990) suggest that a spatial/empirical relationship between the Duluth Complex OUIs and the Biwabik Iron-Formation exists, and that incorporation of the Biwabik Iron-Formation by the Duluth Complex at the basal contact may have inspired the genesis of the Duluth Complex OUIs. This does not directly explain the high titanium content of the Duluth Complex OUIs; however, Muhich (1993) finds that the Biwabik Iron-Formation is locally enriched in titanium proximal to the Duluth Complex basal contact. Muhichs (1993) observations suggest that the Duluth Complex OUIs may be genetically related to the Biwabik Iron-Formation, and may be assimilated inclusions of Biwabik Iron-Formation that have been enriched in titanium and iron from Duluth Complex magmas and fluids. | |
2) |
Severson (1988, 1994) and Severson and Hauck (1990) also suggested, as did Ross (1985), that Duluth Complex OUIs formed by infiltration metasomatism. Infiltration metasomatism calls on the upward streaming of intercumulus fluids that are derived from within a crystallizing cumulus pile, or more simply put, the magma itself. This genesis mechanism has been suggested for the formation of similar ultramafic plugs in the Bushveld Complex (Schiffries, 1982; Viljoen and Scoon, 1985). |
MDJ/DF/HD/WB | 2CC031_004_Longnose_NI43101_FinalReport_20120124_MDJ_wb_djf_20120127 | January 27, 2012 |
2CC031.004 Cardero Resource Corp. | |
Longnose Project | Page 41 |
3) |
Bonnichsen (1972) and Mainwaring and Naldrett (1977) suggested a magmatic origin for the Duluth Complex OUIs. In this empirical magmatic genesis model, the Duluth Complex OUIs would form from ferrogabbroic magmas, containing an abundance of suspended plagioclase crystals which separate from the magma and rise to the top of the magma chamber due to density contrasts, subsequently leaving the much more dense iron-rich titaniferous ultramafic magma toward the bottom. |
Evidence for all three genesis models exists, thus all three models, or a combination of the three may be accurate in specific instances. Mineralization at both properties appears to be largely intrusive in nature, but also exhibits textures near contacts with country rock that could be metasomatic in nature. It also seems apparent that in some instances Biwabik Iron formation could have influenced mineralization, based on the proximity of some OUIs to Biwabik Iron-Formation country rock. However, not all OUIs in the Duluth Complex show obvious proximity to occurrences of Biwabik Iron-Formation.
MDJ/DF/HD/WB | 2CC031_004_Longnose_NI43101_FinalReport_20120124_MDJ_wb_djf_20120127 | January 27, 2012 |
2CC031.004 Cardero Resource Corp. | |
Longnose Project | Page 42 |
8 |
Exploration |
Exploration of the Project Area by CIOUS began in the summer of 2009 with field searches for historic drill collars and resampling of historic drill holes.
Benchmark Engineering (Mountain Iron, Minnesota) was contracted to conduct the search with key CIOUS personnel on hand to oversee the work. At that time, re-assaying of historic drill core from the Project Area, which is stored at the University of Minnesota, Natural Resources Research Institute, Coleraine Minerals Research Laboratory, Coleraine, Minnesota, was also conducted.
Very little bedrock is exposed at the Project Area. Because of this, no bedrock mapping has been completed by CIOUS, although at least one bedrock map of the Project Area has been published (Linscheid, 1991). Bedrock outcrops from Linscheid (1991) were evaluated and included in the Bedrock Geological Map of Allen Quadrangle (Severson and Miller, 1999; pers. com., Severson, July 2010).
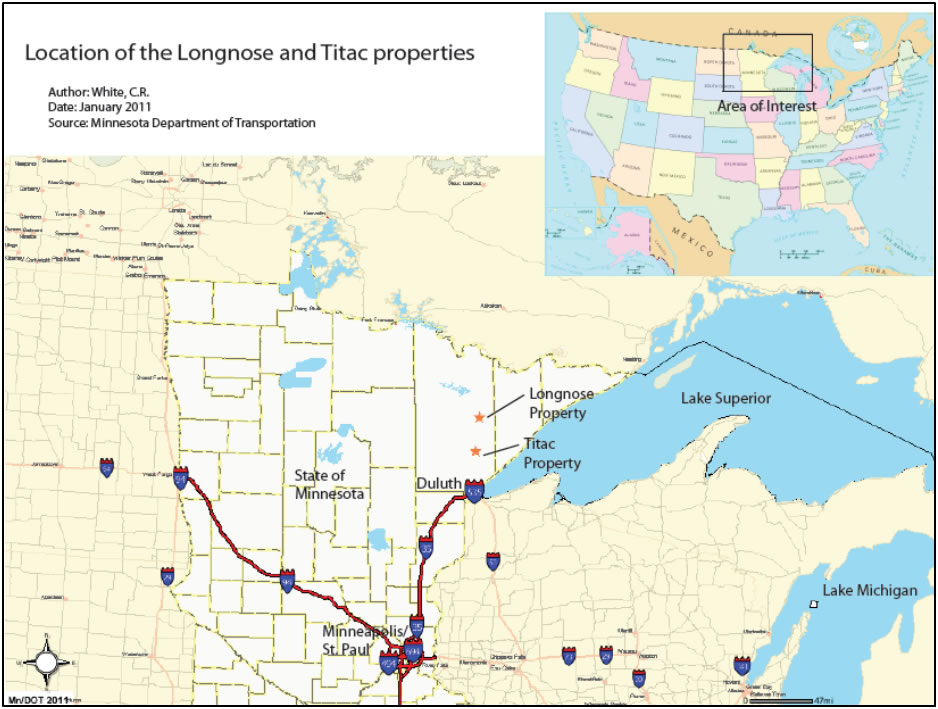
An airborne geophysical survey was conducted by the Minnesota Geological Survey which provided the initial template for early exploration. A ground magnetic survey was conducted by American Shield Corp. and this survey has not been obtained by Cardero; however, the original grid for the survey is still largely visible in the field.
MDJ/DF/HD/WB | 2CC031_004_Longnose_NI43101_FinalReport_20120124_MDJ_wb_djf_20120127 | January 27, 2012 |
2CC031.004 Cardero Resource Corp. | |
Longnose Project | Page 43 |
9 |
Drilling |
Drilling on the Project Area can be broken into historic and contemporary eras. Prior to 2010, 12 drill holes had been completed on the Project Area by a variety of operators. These holes should be considered historic drilling as Cardero had no involvement in the completion of these holes; however, some collar locations have been found and inferred and most of these holes were re-sampled by CIOUS.
CIOUS completed drilling of 15 NQ2 diamond drill holes totaling 3480.4 m (11,418.5 feet) on the Project Area between February 2010 and April 2011, which are the current or contemporary holes. Drilling depths were recorded in feet, as is the standard in the US. Drilling was completed by licensed drilling contractor Idea International Drilling Ltd. (Idea). In 2010, Idea conducted drilling operations using four different drill rigs (Atlas Copco CS1000, Atlas Copco Diamec U6, Atlas Copco CT14, and a Sandvik DE130), with two rigs operating at any given point in time. Drill rigs were skid-mounted (with the exception of the Atlas Copco CT14) and maneuvered in the field using Caterpillar D5M and D7G tractors. In 2011, one Morooka mounted drill rig (Boart Longyear LF70) was utilized. Licensed contractor Warren Johnson Excavating was contracted to install all drill trails, drill pads, and entrance/exit points. Trails, pads, and entrance/exit points were installed using a combination of Caterpillar tractors, Caterpillar excavators, and various logging skidders.
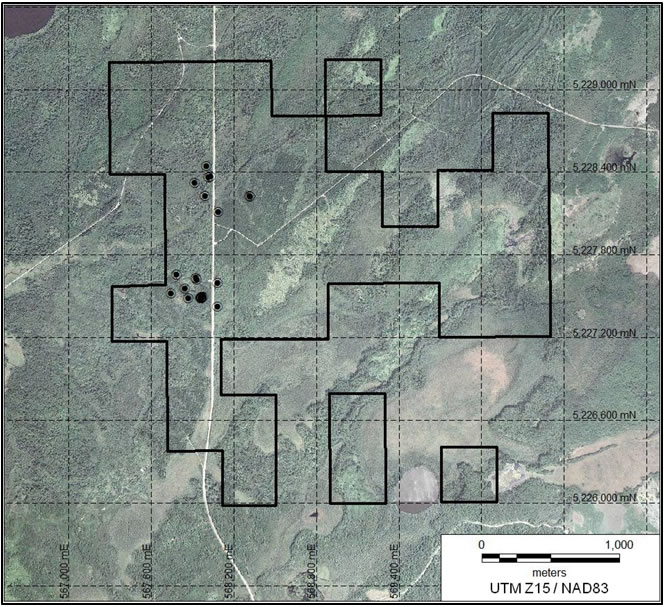
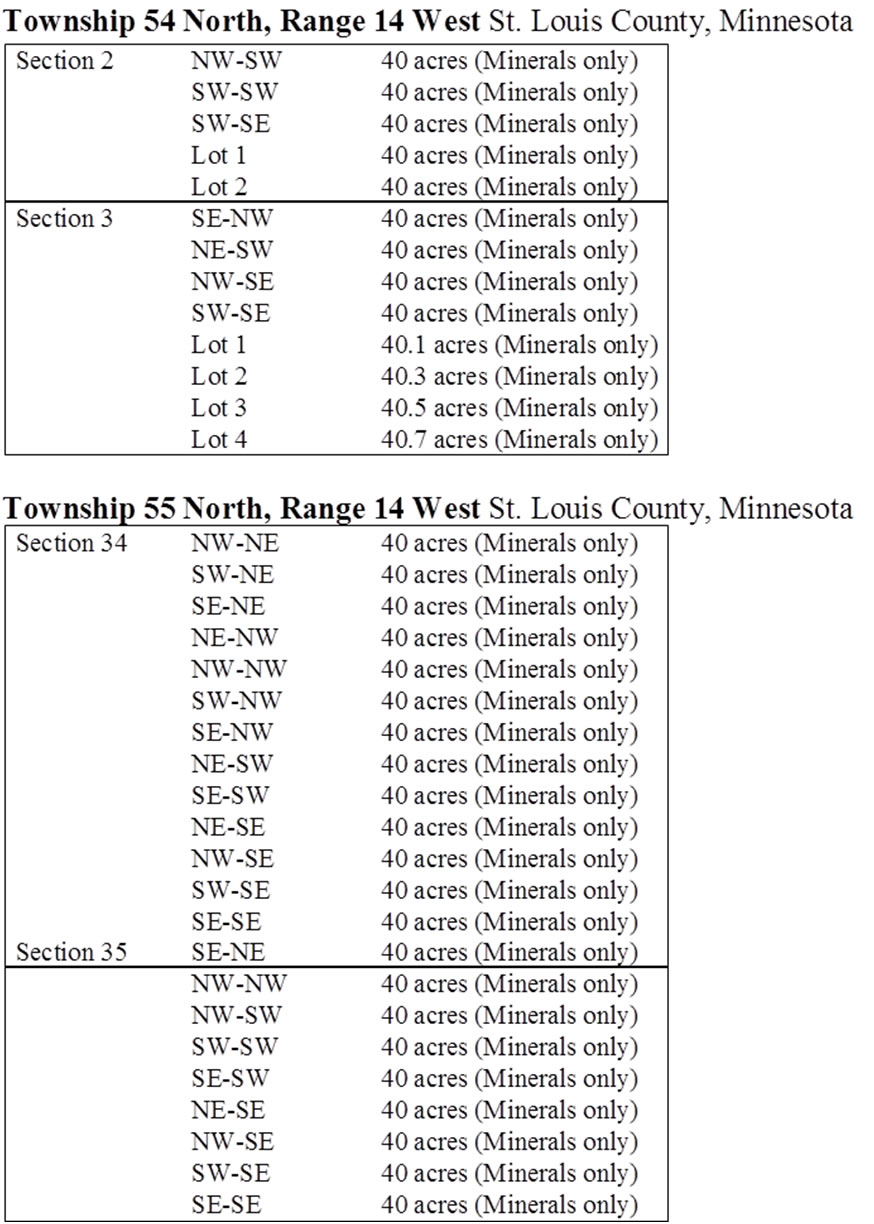
All drill holes were permanently abandoned per MDH standards, by setting a plug at least 300 feet below the surface of bedrock and filling the portion of the boring above the plug with neat cement. One drill hole (LNG-002-2010) was temporarily abandoned per MDH standards by installing a five foot casing extension on the drill collar and screwing a cap onto the casing extension. This hole was temporarily abandoned due to unseasonably warm temperatures, causing swamp-ground to become unworkable and forcing drilling operations in the swamp to cease and heavy equipment in the immediate area to be evacuated.
Down-hole surveys have been completed on all contemporary drill holes. The Idea survey crew conducted down-hole surveys of each respective drill hole following completion of each hole. Down-hole surveys were completed using a Gyro-based tool, with survey readings collected every 20 feet. Data consists of a dip reading in degrees, and easting and northing readings in feet relative to the starting position of the survey.
Drill hole locations were recorded at the time of drilling using a hand held Garmin GPS unit with accuracy to +/- 6 metres. Because casing was pulled upon completion of each drill hole, a steel fence post was used to mark the location of each hole. A location survey was completed by the Idea survey crew upon completion of drilling operations. Licensed surveyors Northern Lights Surveying and Mapping Inc. (Virginia, Minnesota) were contracted by Idea to place four to five location pins on site. Upon installation of these pins, Idea surveyed drill hole locations with sub-metre accuracy, recording the easting, northing, and elevation of each drill hole.
Some of the historic drill hole collars have been located by CIOUS and observed by SRK. Only the drill holes completed prior to approximately 1970 have drill collars that still exist on site. These drill collars have been located and surveyed with a differential GPS. Since approximately 1970, drill casings have been mandated to be removed upon remediation of the drill site, so these drill collars do not exist. Circumstantial evidence for other historic drill holes, such as drill pad clearings in the forest, has been found to support the location of many of these historic holes and their drill collar locations are believed to be within 10 m accuracy.
MDJ/DF/HD/WB | 2CC031_004_Longnose_NI43101_FinalReport_20120124_MDJ_wb_djf_20120127 | January 27, 2012 |
2CC031.004 Cardero Resource Corp. | |
Longnose Project | Page 44 |
Table 9.1 documents the technical specifications of all contemporary and historic drilling at the Project Area.
Table 9.1: Contemporary and historic drilling at the Longnose property
LONGNOSE PROPERTY CONTEMPORARY (drilled by Cardero Iron Ore Company Ltd.) | ||||||
DDH# | (Survey) m E | (Survey) m N | Total Depth (ft) | Azimuth | Dip | Total Depth (m) |
LNG-001-2010 | 572158.1 | 5268405.0 | 794 | 315 | -45 | 242 |
LNG-002-2010 | 572232.4 | 5268492.7 | 329.5 | 315 | -45 | 100.4 |
LNG-003-2010 | 571921.7 | 5268537.5 | 306 | 315 | -45 | 93.3 |
LNG-004-2010 | 571996.9 | 5268694.2 | 516 | 315 | -45 | 157.3 |
LNG-005-2010 | 572130.6 | 5268853.9 | 597 | Vertical | -90 | 182 |
LNG-006-2010 | 572083.0 | 5268744.5 | 588 | Vertical | -90 | 179.2 |
LNG-007-2011 | 572117.5 | 5268372.0 | 883 | 315 | -45 | 269.1 |
LNG-008-2011 | 572234.3 | 5268492.4 | 913 | 315 | -45 | 278.3 |
LNG-009-2011 | 572288.5 | 5268586.5 | 843 | 315 | -45 | 256.9 |
LNG-010-2011 | 572034.5 | 5268259.4 | 793 | 315 | -45 | 241.7 |
LNG-011-2011 | 572306.1 | 5268273.4 | 1053 | 315 | -45 | 321 |
LNG-012-2011 | 572307.1 | 5268271.6 | 997 | Vertical | -90 | 303.9 |
LNG-013-2011 | 572142.6 | 5268285.8 | 682 | 315 | -45 | 207.9 |
LNG-014-2011 | 572328.4 | 5268399.3 | 1163 | 315 | -45 | 354.5 |
LNG-015-2011 | 572365.7 | 5268496.3 | 961 | 315 | -45 | 292.9 |
LONGNOSE PROPERTY HISTORIC (drilled by American Shield Corp., Bear Creek Mining, and Nicor) | ||||||
DDH# | M E | M N | Total Depth (ft) | Azimuth | Dip | Total Depth (m) |
LN-1 | 572034 | 5268381 | 634 | 315 | -45 | 193.2 |
LN-2 | 572094 | 5268489 | 570 | 315 | -45 | 173.7 |
LN-3 | 572127 | 5268624 | 502 | 315 | -45 | 153 |
LN-4 | 572072 | 5268421 | 612 | 315 | -45 | 186.5 |
LN-5 | 572462 | 5268305 | 602 | 315 | -45 | 183.5 |
LN-6 | 572232 | 5268360 | 595 | 315 | -45 | 181.4 |
LN-7 | 572552 | 5268394 | 602 | 315 | -45 | 183.5 |
LN-8 | 572234 | 5268689 | 402 | 315 | -45 | 122.5 |
LN-9 | 572118 | 5268550 | 400 | 315 | -45 | 121.9 |
LN-10 | 572010 | 5268483 | 330 | 315 | -45 | 100.6 |
A1-1 | 571995 | 5268584 | 416 | Vertical | -90 | 126.8 |
BA-6 | 571869 | 5268614 | 3085 | Vertical | -90 | 940.3 |
9.1 | Drilling Results |
The Longnose OUI is defined by drilling with between 75 m and 125 m between pertinent drill holes. Most drill holes on the Project Area have intersected thick intervals of titanium-iron oxide mineralization, and the intrusive stratigraphy of the OUI can be fairly well correlated. The drilling completed by American Shield Corp. and Nicor follows a grid pattern in which section lines have a 315 degree bearing, and most of these holes were drilled with an azimuth of 315 degrees and a dip
MDJ/DF/HD/WB | 2CC031_004_Longnose_NI43101_FinalReport_20120124_MDJ_wb_djf_20120127 | January 27, 2012 |
2CC031.004 Cardero Resource Corp. | |
Longnose Project | Page 45 |
of -45 degrees, except two holes that were drilled vertically (See Table 9.1) . The drilling completed by CIOUS does not follow this grid, but instead fills in local gaps, and explores the outer limits of the defined Longnose intrusion. The intrusive stratigraphy of the Longnose OUI seems to dip to the southeast at 30-45 degrees; therefore drill holes with a -45 degree dip should give a reasonably accurate indication of the true thickness of mineralization.
Figure 9.1 and Figure 9.2 show the drill holes in typical plan and section views.
Figure 9.1: Map Showing the Distribution of Longnose Drilling.
MDJ/DF/HD/WB | 2CC031_004_Longnose_NI43101_FinalReport_20120124_MDJ_wb_djf_20120127 | January 27, 2012 |
2CC031.004 Cardero Resource Corp. | |
Longnose Project | Page 46 |
Figure 9.2: Example of drill holes with the Pyroxenite domain boundary in oblique section, looking northeast
9.2 | Historic Drill Hole Sampling |
The twelve historic drill holes were sampled by previous operators; however, none of the historical assay results were utilized by SRK or Cardero. Sampling and resampling has been completed by CIOUS on both contemporary and historic drill holes.
Remnants of historic drill core were retained by the government of Minnesota. CIOUS undertook to re-sample as much of the historic core as possible during 2009 and 2010. In rare instances, little or no material was available, but for the most part, core or assay rejects were available and were resampled. The procedures used to re-sample the historic core were largely the same as those used for the modern core (see section 10 & 11).
The sampled historic drill core material was either half or quarter core (preferentially), or assay rejects from historic sampling campaigns. In term of material samples, 14% of the historic resampled material was half core, while 36% was quarter core and 50% was from rejects. Core material was typically resampled at a 2.5 m interval, while reject material was sampled at an average interval of 3.1 m.
Only historic drill hole BA-6 could not be resampled at all. Historic drill hole A1-1 had only two samples that could be resampled, which encompasses only 7% of the hole length. For the remaining ten historic holes, approximately 70% of the drill hole intervals were resampled.
MDJ/DF/HD/WB | 2CC031_004_Longnose_NI43101_FinalReport_20120124_MDJ_wb_djf_20120127 | January 27, 2012 |
2CC031.004 Cardero Resource Corp. | |
Longnose Project | Page 47 |
10 |
Sample Preparation, Analyses, and Security |
10.1 | Sampling Method and Approach |
Modern samples collected by CIOUS for analysis are from drill core, while historic drill holes were re-sampled from drill core or sample rejects. Drill core sampling is typically continuous through the length of each drill hole, except where drill core is obviously not mineralized. In the cases of re-sampling historic core where no rejects or core material was available, the intervals have obviously not been re-assayed. Every effort was made to ensure there were no sample biases, and samples are representative of the mineralization found. The rocks are intrusive and competent, typically with limited, localized fracturing. Drill core recovery averages 92.3% and rock quality is typically good.
10.2 | Drill Core and Sample Interval Preparation |
Drill core is logged lithologically as it is drilled, and then stored in original cardboard boxes (10 feet per box) on pallets until additional analysis of core can be performed. As time permits, data is collected on core regarding rock quality, core recovery, magnetic susceptibility, and specific gravity. Sample intervals are then set-up, and the drill core is photographed. All drill core from the 2010 and 2011 drilling programs has been logged and sampled, and all sample results from the 2010 and 2011 drill core sampling campaign are complete. Lithologic logging and collection of other data from drill core is done per standard industry practices as follows:
Lithologic log
Lithologic intervals are recorded in feet based on run blocks inserted at the time of drilling. Specific data is collected on rock type, texture, grain-size, lithologic contacts, modal mineralogy, structures, oxide mineralization, sulfide mineralization, and alteration.
Rock quality/Core recovery
Intervals are recorded in feet based on run blocks inserted at the time of drilling. Actual lengths of intervals are measured and recorded in inches. The sum of all pieces of core greater than 4 inches is recorded, and total fractures per interval are recorded. RQD for each interval is determined by dividing the sum greater than 4 inches by the actual total inches of core recorded, and multiplying by 100.
Magnetic Susceptibility
Magnetic susceptibility data is collected on all drill core using a SAIC Exploranium KT-9 magnetic susceptibility meter. Five readings are collected for each core interval so that a reading is collected at least every 2 feet.
Specific Gravity
Specific gravity measurements are collected approximately every 20 feet. Core pieces measuring approximately 4 - 5 inches are weighed first in air (grams), and then in water (grams), using a manual balance and custom built work station.
Core photography
All drill core is photographed using a Sony Cyber-shot digital camera, typically with two core boxes per photo. All pictures are labeled as follows: DDH Box # (#-#).
MDJ/DF/HD/WB | 2CC031_004_Longnose_NI43101_FinalReport_20120124_MDJ_wb_djf_20120127 | January 27, 2012 |
2CC031.004 Cardero Resource Corp. | |
Longnose Project | Page 48 |
Sample intervals
All sample intervals are determined by visual inspection of drill core, generally based on a visual estimation of oxide and sulfide mineralization. Attempts are made to not cross lithologic boundaries within sample intervals; however, given the intrusive, locally lithologically heterogeneous nature of drill core this is not always possible. Drill core is pieced together and a line is drawn parallel to the long axis of all drill core to be sampled. Sample intervals range in length from 0.2 m to approximately 2.5 metres, with most sample intervals from 1.5 - 2.0 metres in length. Sample tags are stapled into boxes, and sample identification numbers are written on core for future reference. Sample intervals are recorded, noting the type of sample (i.e. core, quarter core original, quarter core duplicate, prep duplicate, standard, or blank), and the general lithology of the sample.
10.3 | Sample Collection and Preparation |
Samples are collected by sawing core in half along the line drawn parallel to the long axis of core with a diamond tipped blade. The core cutting saw is cleaned at the end of each day, or after 120 m (400 ft) of core has been cut (whichever is earlier), and the saw is filled with clean water at the time of cleaning. The left half of drill core is kept and remains in the original cardboard boxes, which are securely stored at CIOUSs field office in Aurora, Minnesota. The right half of core is collected and packaged in clear poly bags, along with a sample tag designating the sample identification number. Bags are labeled in black permanent marker with the corresponding sample identification number and a zip tie is used to close each poly bag. The weight of each sample is then recorded (in grams). Poly bags are packaged in white sand bags (typically five samples per sand bag). Each sand bag is labeled with the sample identification numbers that it contains, and the batch number that the samples belong to. Sand bags are first secured with a standard zip tie, and then a second individually numbered zip tie is placed over the standard zip tie for security. The security number is recorded along with the sample numbers that it represents. The sand bags are then transferred to a standard shipping pallet (generally 10-15 sand bags per pallet). The pallets are shrink wrapped, and labeled with the sample batch numbers. Generally, each drill hole is given a unique sample batch number.
10.4 | Sample Preparation, Analyses and Security |
Sample preparation of drill core is conducted at the CIOUS facility in Aurora, Minnesota by persons under contract with CIOUS to carry out the exploration, drilling, and sampling programs. Sample preparation of historic core from the Project Area was carried out by CIOUS personnel prior to the involvement of contractors hired to carry out the exploration, drilling, and sampling programs.
10.5 | Sample Analysis |
Samples are prepared for assay analysis by ALS Laboratory Group (ALS) at their Thunder Bay, Ontario facility. The laboratory prepares samples for assay using code prep-31, in which samples are crushed, and 250 g of material from each sample is split off and pulverized so that better than 85% pass through 75 micron mesh. Samples are dried if necessary using code DRY-21. The sample pulp is then shipped to the ALS facility in Vancouver, British Columbia, Canada for assay, while the coarse sample is put in temporary storage at ALS in Thunder Bay (and eventually shipped back to CIOUSs field office in Aurora, Minnesota).
MDJ/DF/HD/WB | 2CC031_004_Longnose_NI43101_FinalReport_20120124_MDJ_wb_djf_20120127 | January 27, 2012 |
2CC031.004 Cardero Resource Corp. | |
Longnose Project | Page 49 |
ALS Laboratory Group laboratories are ISO 17025 certified. The ALS laboratory used for sample preparation is located at 1160 Commerce Street, Thunder Bay, Ontario, Canada P7E 6EP. The ALS laboratory used for sample analysis is located at 2103 Dollarton Hwy, North Vancouver, British Columbia, Canada V7H 0A7.
A whole rock analysis (code: ME-ICP06) is conducted on samples, and base metals are analyzed using code ME-4ACD81. Sample analysis method ME-ICP06 returns results for all major oxides from 0.01 -100% as displayed in Table 10.1, and sample analysis method ME-4ACD81 returns results for base metals as listed in Table 10.2. Numerous samples have also been analyzed for rare earth and trace elements by ALS using sample method ME-MS81. The elements and respective ranges for sample method MA-MS81 are displayed in Table 10.3.
Table 10.1: Analytes and Ranges of ALS Laboratory Group sample analysis method ME-ICP06
Analyte | Range (%) | Analyte | Range (%) | Analyte | Range (%) |
SiO2 | 0.01-100 | Na2O | 0.01-100 | P2O5 | 0.01-100 |
Al2O3 | 0.01-100 | K2O | 0.01-100 | SrO | 0.01-100 |
Fe2O3 | 0.01-100 | Cr2O3 | 0.01-100 | BaO | 0.01-100 |
CaO | 0.01-100 | TiO2 | 0.01-100 | LOI | 0.01-100 |
MgO | 0.01-100 | MnO | 0.01-100 |
Table 10.2: Analytes and Ranges of ALS Laboratory Group sample analysis method ME-4ACD81
Analyte | Range (ppm) | Analyte | Range (ppm) | Analyte | Range (ppm) |
Ag | 0.5-100 | Cu | 1-10,000 | Ni | 1-10,000 |
As | 5-10,000 | Hg | 1-10,000 | Pb | 2-10,000 |
Cd | 0.5-1,000 | Mo | 1-10,000 | Zn | 2-10,000 |
Co | 1-10,000 |
Table 10.3: Analytes and Ranges of ALS Laboratory Group sample analysis method ME-MS81
Analyte | Range (ppm) | Analyte | Range (ppm) | Analyte | Range (ppm) |
g | 1-1,000 | Ho | 0.01-1,000 | Ta | 0.1-10,000 |
Ba | 0.5-10,000 | La | 0.5-10,000 | Tb | 0.01-1,000 |
Ce | 0.5-10,000 | Lu | 0.01-1,000 | Th | 0.05-1,000 |
Co | 0.5-10,000 | Mo | 2-10,000 | Tl | 0.5-1,000 |
Cr | 10-10,000 | Nb | 0.2-10,000 | Tm | 0.01-1,000 |
Cs | 0.01-10,000 | Nd | 0.1-10,000 | U | 0.05-1,000 |
Cu | 5-10,000 | Ni | 5-10,000 | V | 5-10,000 |
Dy | 0.05-1,000 | Pb | 5-10,000 | W | 1-10,000 |
Er | 0.03-1,000 | Pr | 0.03-1,000 | Y | 0.5-10,000 |
Eu | 0.03-1,000 | Rb | 0.2-10,000 | Yb | 0.03-1,000 |
Ga | 0.1-1,000 | Sm | 0.03-1,000 | Zn | 5-10,000 |
Gd | 0.05-1,000 | Sn | 1-10,000 | Zr | 2-10,000 |
Hf | 0.2-10,000 | Sr | 0.1-10,000 |
MDJ/DF/HD/WB | 2CC031_004_Longnose_NI43101_FinalReport_20120124_MDJ_wb_djf_20120127 | January 27, 2012 |
2CC031.004 Cardero Resource Corp. | |
Longnose Project | Page 50 |
Copper analyses that return values greater than the detection limits (>10,000 ppm) of sample method ME-4ACD81 are re-analyzed by ALS using sample method Cu-OG62, which has detection limits of 0.01 -40%.
The key elements for the Project are titanium (Ti), which is measured as TiO2 and iron (Fe) which is measured as Fe2O3.
10.6 | Sample Security |
Drill core is retrieved from drill sites on a daily basis by CIOUS staff, and delivered directly to the CIOUS field office in Aurora, Minnesota. Drill core is securely stored on-site at the field office until sampling can be conducted by CIOUS personnel. The CIOUS field office is locked at night and when personnel are not present at the facility and the local Aurora police force regularly patrol the area.
Upon collection of samples they are packaged as described above and shipped via chartered and bonded independent carrier Valley Carthage Transport and Manitoulin Transport for customs brokerage to ALS Laboratory Group Laboratories in Thunder Bay, Ontario, Canada. There have been no reported incidents regarding the individually numbered security zip ties placed on each sand bag, and thus there are no issues regarding the security of sample shipment.
There were no issues regarding drill core or sample security.
10.7 | Quality Assurance and Quality Control Programs |
CIOUS has instituted extensive QA/QC procedures to ensure the integrity of sample analyses. The QA/QC procedures followed for all drill core sampling conducted by CIOUS at the Project are outlined in Figure 10.1 below.
MDJ/DF/HD/WB | 2CC031_004_Longnose_NI43101_FinalReport_20120124_MDJ_wb_djf_20120127 | January 27, 2012 |
2CC031.004 Cardero Resource Corp. | |
Longnose Project | Page 51 |
Figure 10.1 Cardero Longnose Project Quality Control/Quality Assurance procedures
Field duplicates (FDUP) in this case refer to quarter core duplicates of the same sampling interval. A preparation duplicate (CDUP) consists of a poly bag containing only a sample tag with instructions for laboratory personnel to prepare the sample from the preceding standard drill core analysis by taking a split after the coarse crushing stage.
Three different reference materials are used in the Longnose sampling program. TTC-1 and LNC-1, which are in-house reference materials created by Cardero and, DH6701 which is a certified reference materials manufactured for Brammer Standard Company, Inc.
Blank material is collected locally in Minnesota from bedrock outcroppings of the Pokegama quartzite near Virginia, Minnesota. Pokegama quartzite is a suitable blank reference because it is dominantly composed of SiO2.
MDJ/DF/HD/WB | 2CC031_004_Longnose_NI43101_FinalReport_20120124_MDJ_wb_djf_20120127 | January 27, 2012 |
2CC031.004 Cardero Resource Corp. | |
Longnose Project | Page 52 |
11 |
A total of Data Verification |
11.1 | Quality Control Results |
Quality control samples (duplicates, blanks and standards) are used to monitor laboratory sample preparation, potential for contamination and analytical accuracy.
A total of 105 reference materials and 61 Pokegama quartzite blank samples were submitted blindly to the laboratory during the re-analysis of historical drill core samples in 2009 and the core sampling campaign and in 2010 and 2011. A total of 90 quarter core duplicate pairs were collected and submitted to the laboratory and 137 preparation duplicate pairs were prepared by the laboratory. Only the quarter core duplicates were blind to the laboratory. All analytical data including quality control samples were checked and verified by Carderos senior geochemist, Tansy OConnor-Parsons and reviewed by SRK.
In the opinion of SRK, the sampling preparation, security and analytical procedures used by CIOUS are consistent with generally accepted industry best practices and are therefore adequate.
Quarter-core and preparation duplicate data for TiO2 are presented in Figure 11.1 and Figure 11.2. These data exhibit good to excellent correlation for the elements of interest.
Figure 11.1: Scatterplot graph of TiO2 data for quarter core field duplicate data
MDJ/DF/HD/WB | 2CC031_004_Longnose_NI43101_FinalReport_20120124_MDJ_wb_djf_20120127 | January 27, 2012 |
2CC031.004 Cardero Resource Corp. | |
Longnose Project | Page 53 |
Figure 11.2: Scatterplot graph of TiO2 data for preparation duplicate data
Two internal reference materials (LNC-1 and TTC-1) and one commercial standard reference material (DH6701) were utilized by Cardero. Reference material results are plotted against their known concentration with tolerance levels within 10% (Figure 11.3, Figure 11.4, and Figure 11.5) . Overall, performance of the certified reference materials was satisfactory. TTC-1 shows a slightly high bias and relatively larger scatter, while LNC-1 shows no bias but significant scatter.
Figure 11.3: TiO2 data presented for internal reference materials TTC-1
MDJ/DF/HD/WB | 2CC031_004_Longnose_NI43101_FinalReport_20120124_MDJ_wb_djf_20120127 | January 27, 2012 |
2CC031.004 Cardero Resource Corp. | |
Longnose Project | Page 54 |
Figure 11.4: TiO2 data presented for internal reference material LNC-1
Figure 11.5 TiO2 data presented for standard reference material DH6701
To monitor the analytical accuracy of the laboratory, umpire/check assays were submitted to a second laboratory (Acme Analytical Laboratories in Vancouver, BC) where the sample pulps were analysed by the 4A04 package (lithium metaborate fusion/ICP-ES finish). All 303 samples from a single drill hole were submitted for the umpire assay, as the drill hole intersected all levels of ferro-titanium mineralization. The drill hole (TTC-019) is located at a nearby CIOUS ilmenite project with identical mineralization style as occurs at the Project) referred to as Titac. The Titac drilling program was concurrent with the Longnose program and adhered to the same procedures, so the check assay results are considered to be comparable. The results for TiO2 and Fe2O3 are presented
MDJ/DF/HD/WB | 2CC031_004_Longnose_NI43101_FinalReport_20120124_MDJ_wb_djf_20120127 | January 27, 2012 |
2CC031.004 Cardero Resource Corp. | |
Longnose Project | Page 55 |
in Figure 11.6. The data correlate very well for both analytes, however there is a slight low bias at the concentrations of > 27% TiO2 for the data from the ALS Minerals laboratory. This is not considered to be significant, as the data is within 10% analytical precision.
Figure 11.5: Scatterplots presenting analytical umpire (check) assays versus original assay results for Fe2O3 (left) and TiO2 (right) data
Coarse blank samples (Figure 11.7) show a slightly higher than background value for TiO2, indicating that the blank is not devoid of titanium. SRK normally compares the blank data to five times the detection limit, in this case a value of 0.05 % TiO2; however, this blank has an average TiO2 value ten times the detection limit. When the individual values are compared to a low baseline value of 0.1%TiO2, the blank sample results indicate very low-level carryover contamination during the preparation through to analytical stage.
Figure 11.6: TiO2 data presented for the Pokegama Quartzite Blank samples
MDJ/DF/HD/WB | 2CC031_004_Longnose_NI43101_FinalReport_20120124_MDJ_wb_djf_20120127 | January 27, 2012 |
2CC031.004 Cardero Resource Corp. | |
Longnose Project | Page 56 |
SRK has reviewed the results of all QA/QC samples. Duplicate and umpire analysis performed very well and blank samples performed adequately. The results of analytical, standard results are less ideal. Both internal standard results showed a large amount of scatter and standard TTC-1 showed a slight high bias. Also, CIOUS did not complete full round robin testing on the standards, making them difficult to properly use as a reference. CIOUS should be more careful to appropriately utilize reference standards for future drill programs.
In the opinion of SRK, the results of the analytical QA/QC program used by CIOUS provide sufficient support that the analytical data is viable to support the exploration analysis and the Mineral Resource.
11.2 | Verifications by Cardero |
Cardero completed several processes to verify the exploration data that has been captured at the Project.
Firstly, all exploration data was entered into a database which provided a level of data checking to ensure that errors are minimized. This includes standardized naming conventions and limits on field entries.
Secondly, all field records were retained by CIOUS and spot checks were made by Cardero head office staff to ensure that the database accurately reflected the data captured.
Data from the site database is backed up weekly to Carderos Vancouver office server.
11.3 | Verifications by SRK |
SRK completed a series of verifications to ensure that the exploration data is reliable enough for the creation of the Mineral Resource. These verifications included the site visits review of field procedures, reviewing analytical quality control data, independent sampling and independent verification of the assay results.
11.3.1 | Site Visit |
During the site visit completed on March 12 & 13, 2010, SRK was able to verify:
Exploration planning;
Selection of drill hole sites;
Mobilization of drill rigs;
Drilling processes and drill rig core handling;
Down-hole surveying;
Collar site marking & surveying;
Core logging;
Core sampling;
Sample QA/QC insertion;
Sample shipping and security; and
Data capture and backup.
In the opinion of SRK the site procedures used by CIOUS are consistent with generally accepted industry best practices and are therefore adequate.
MDJ/DF/HD/WB | 2CC031_004_Longnose_NI43101_FinalReport_20120124_MDJ_wb_djf_20120127 | January 27, 2012 |
2CC031.004 Cardero Resource Corp. | |
Longnose Project | Page 57 |
11.3.2 | Verifications of Analytical Quality Control Data |
Table 11.1 summarizes CIOUSs insertion rate for analytical QA/QC samples.
Table 11.1: Summary of Analytical Quality Control Data Produced By Cardero on the Longnose Project, 2010/11
Sampling Program |
Drilling and
Sampling Programs 2009-11 |
Percent of Samples (%) |
Comment |
Sample Count | 1695 | ||
Field Blanks | 61 | 3.6 | Locally derived quartzite material |
Standards | 105 | 6.2 | |
TTC-1 | 48 | 2.8 | Internal Cardero reference material |
LNC-1 | 49 | 2.9 | Internal Cardero reference material |
DH6701 | 8 | 0.5 | Certified Commercial Standard, Brammer |
Field Duplicates | 90 | 5.3 | Quarter Core |
Preparation Duplicates | 137 | 8.1 | Split of course crush |
Total QC Samples | 393 | 23.2 |
SRK believes that the QA/QC sample insertion rates described above meet industry standard rates. Generally, SRK expects 5% blanks, 5% standards and 5% duplicates for an overall insertion rate of 15 %. CIOUS has exceeded these thresholds for all sample types aside from blanks.
SRK noted in their review that the standard performance and internal standard analysis could be improved.
The internal standards did not have multi-laboratory round robin analysis and expected values for these standards have been calculated only through utilization as standard material and averaging results. This is not recommended and for further program, SRK recommends that multi-laboratory and round robin testing should be completed on all internal standards.
SRK has reviewed the results of the analytical QA/QC samples and found that the results are sufficient to provide confidence in the sampling and assay results.
11.3.3 | Independent Verification Sampling |
During the SRK site visits, independent verification samples were collected and sent to ALS for processing. Samples were collected from both the Longnose and Titac deposits.
In total, five independent samples from the Project Area were collected and processed. The results are shown in Table 11.2 and Figure 11.7. Even though only a small number of samples were collected, the samples showed very good correlation between the original Cardero TiO2 and Fe2O3 assays, and the independent duplicate results.
MDJ/DF/HD/WB | 2CC031_004_Longnose_NI43101_FinalReport_20120124_MDJ_wb_djf_20120127 | January 27, 2012 |
2CC031.004 Cardero Resource Corp. | |
Longnose Project | Page 58 |
Table 11.2 : Assay Results for Verification Samples Collected SRK on the Longnose Project.
Hole ID |
From (m) |
To (m) |
Original TiO2 (%) |
SRK Duplicate TiO2 (%) |
Original Fe2O3 (%) |
SRK Duplicate Fe2O3 (%) |
LN-8 | 51.82 | 54.86 | 18 | 17.55 | 35.2 | 34.9 |
LN-8 | 112.78 | 115.82 | 24.3 | 24.4 | 46.4 | 45.3 |
LN-8 | 67.06 | 70.10 | 14.6 | 14.75 | 25.9 | 26 |
LN-9 | 54.87 | 57.91 | 17.8 | 16.7 | 32.7 | 31.3 |
LN-10 | 73.15 | 76.20 | 28.1 | 26.5 | 54.3 | 50.5 |
Figure 11.7: Comparison of independent SRK verification samples
11.3.4 | Independent Assay Verification |
SRK independently verified 92% of the assay results by downloading the assay certificates directly from the laboratory and comparing the compiled results in an Access database. SRK found no errors in the TiO2 and Fe2O3 analytical data.
MDJ/DF/HD/WB | 2CC031_004_Longnose_NI43101_FinalReport_20120124_MDJ_wb_djf_20120127 | January 27, 2012 |
2CC031.004 Cardero Resource Corp. | |
Longnose Project | Page 59 |
12 |
Mineral Processing and Metallurgical Testing |
Significant amounts of historical beneficiation work has been conducted by the Coleraine Minerals Research Lab ( CMRL)) which is part of the University of Minnesota Duluths ((UMDs)) Natural Resources Research Institute ((NRRI),), located in Coleraine, Minnesota, USA. The work predates the NI 43-101 standards and therefore is not compliant. However, the work was completed to high standards and will be useful in designing the future beneficiation work. This work was described in Section 5 of this report.
12.1 | Recent Metallurgical Testwork |
Since Carderos involvement in the project, little metallurgical analysis has been completed by Cardero. However, in December 2011, Davis Tube tests were completed in order to determine the proportion of magnetic material and the Fe analytical value within this magnetic concentrate. At this time, only preliminary results of these tests have been received.
Approximately 160 Longnose samples were selected for Davis Tube processing. Davis Tube tests utilize an electromagnet to separate material into magnetic and non-magnetic/para-magnetic material. Samples were selected to cover a wide range of grades as well as being spatially representative. Analytical pulp rejects were utilized for the tests. The samples were shipped to G&T Metallurgical (G&T) in Kamloops BC.
At G&T each sample was assayed for Fe% (direct Fe% analysis as opposed to Fe2O3 that was completed in the main assay work). Then 10 g or 30 g of the material was selected for the tests. This material was pulp reject material (pulverized to 80% passing 200 mesh) and was not further re-crushed in any way by G&T. The material was separated into a magnetic and non-magnetic fraction by passing over a magnet set at 3000 gauss. The magnetic fraction was then weighed and the magnetic concentrate re-assayed for Fe%.
A total of 151 of these samples were from within the peridotite and pyroxenite domains. The results of this test were reviewed for each domain.
In a deposit with magnetite as the dominant Fe bearing mineral, this test provides data to calculate a regression of the proportion of magnetite expected at a range of Fe grades and the conversion of the Fe2O3 or Fe% analysis into a magnetite estimate. However, due to the fact that Fe partitions into ilmenite and a small but unknown amount of ilmenite would have partitioned into the magnetic concentrate, further work must be performed to properly quantify the magnetite content of these samples. A mineralogical study of a subset of these samples and concentrates would assist with determining the amount of ilmenite in the concentrate and TiO2 assays of the concentrate would allow for determination of the titaniferous magnetite as well.
Regression of the Davis Tube results has been utilized to adjust the Fe2O3 values reported in the Mineral Resource statement (Table i and Table 13.8) . This regression has reduced the values in order to account for the Fe contained within the ilmenite as well as silicates. However, without mineralogical analysis of the samples and magnetic concentrate, the results are not conclusive enough to be used to definitively quantify magnetite without the risk of double counting iron already accounted for in the ilmenite values.
MDJ/DF/HD/WB | 2CC031_004_Longnose_NI43101_FinalReport_20120124_MDJ_wb_djf_20120127 | January 27, 2012 |
2CC031.004 Cardero Resource Corp. | |
Longnose Project | Page 60 |
13 |
Mineral Resource Estimates |
13.1 | Introduction |
The Mineral Resource Statement presented herein represents the first Mineral Resource evaluation prepared for the Project in accordance with NI 43-101
The mineral resource model prepared by SRK considers 24 core boreholes drilled, and in the case of historic drilling re-sampled, by CIOUS during the period of 2009 through 2011. The resource estimation work was completed by Michael D. Johnson, P.Geo (APEGBC, No. 34923) an appropriate independent qualified person as this term is defined in NI 43-101. The effective date of the resource statement is January 19, 2012.
This section describes the resource estimation methodology and summarizes the key assumptions considered by SRK.
In the opinion of SRK, the resource evaluation reported herein is a reasonable representation of the global TiO2 and Fe2O3 Mineral Resources found in the Project at the current level of sampling. The mineral resources have been estimated in conformity with generally accepted CIM Estimation of Mineral Resource and Mineral Reserves Best Practices guidelines and are reported in accordance with the Canadian Securities Administrators National Instrument 43-101. Mineral resources are not Mineral Reserves and do not have demonstrated economic viability. There is no certainty that all or any part of the Mineral Resource will be converted into a Mineral Reserve.
The database used to estimate the Project Mineral Resources was thoroughly audited by SRK. SRK is of the opinion that the current drilling information is sufficiently reliable to interpret with confidence the boundaries for Ilmenite and magnetite mineralization and that the assay data are sufficiently reliable to support a Mineral Resource estimate.
Surpac® version 6.2 was used to construct the geological solids, prepare assay data for geostatistical analysis, construct the block model, estimate metal grades and tabulate mineral resources. The Geostatistical Software Library (GSLib) family of software were used for geostatistical analysis. Surpac® was used for the variography analysis and Leapfrog® version 4.2 was utilized in the solid model creation.
This section describes the work undertaken by SRK and key assumptions and parameters used to prepare the Mineral Resource model for the Project.
13.1.1 |
Ilmenite and Mineral Resources of Industrial Minerals |
The Longnose deposit is primarily of interest for ilmenite and to a lesser extent magnetite. Ilmenite is a titaniumiron oxide with a chemical formula of TiFeO3, containing approximately 32% Ti and37% Fe. The other significant source mineral for Ti is rutile, which has a chemical formula of TiO2 and is believed to be only a minor constituent of this deposit.
Magnetite within the Longnose deposit is made up of pure magnetite and titaniferous magnetite. Titaniferous magnetite has the chemical formula TiFe2O4 (50% Fe, 31% Ti) while pure magnetite is Fe3O4 (72% Fe). The ratio of titaniferous to pure magnetite likely varies throughout the deposit.
Chemical analysis of titanium in any form is measured as TiO2, while the current methods measureall iron as Fe2O3.
MDJ/DF/HD/WB | 2CC031_004_Longnose_NI43101_FinalReport_20120124_MDJ_wb_djf_20120127 | January 27, 2012 |
2CC031.004 Cardero Resource Corp. | |
Longnose Project | Page 61 |
As stated above, the Mineral Resource has been quantified in terms of TiO2 and Fe2O3, the analytical components of Ti and Fe. In any potential mining scenario, the Project would produce ilmenite (FeTiO3) and potentially magnetite (TiFe2O4, Fe3O4) as a by-product.
The CIM guidelines highlight the special care that should be undertaken when developing a Mineral Resource estimate for an industrial mineral deposit. A list of considerations includes:
These deposits differ from more common precious and base metal deposits;
Customer specifications for industrial products are often based on both physical and chemical properties;
An industrial mineral may have multiple market applications with different requirements or limits;
The physical properties of an industrial mineral deposit may vary from deposit to deposits or within a single deposit;
Use of multi-parameter estimation techniques may be desirable, such as the use of multiple indicators or co-kriging;
Published specifications and standards for industrial minerals should be used as a guide and not replace detailed market investigations;
Test results may be subject to scale-up effects and larger scale tests may be required; and,
Identification of market price factors are critical in determining value for an industrial mineral.
Ilmenite concentrate should be viable for a variety of processes and uses such as pigment and metal markets.
Processing of OUI material to create an ilmenite concentrate would include crushing the rock to a specified size and then completing density separation to remove the silicates to a float waste product and concentrating the heavy oxides. The oxide concentrate would then be separated into a magnetic and non-magnetic fraction. An example of such a flow sheet is shown in Figure 13.1. The ilmenite would be concentrated into the non/para-magnetic fraction, ideally containing >50 % TiO2 and recovering more than 70% of the TiO2. Magnetic minerals/elements of potential economic benefit would include magnetite and potentially vanadium.
General sources, processes and end uses of titanium bearing material are shown in Figure 13.1. Ilmenite is most commonly used as a pigment in paints as well as in a metal alloy in lightweight component construction (aerospace, aircraft, auto industry and bicycles). Ilmenite can be viable for production into synthetic rutile, sorel slag and low-alkali slag, as well as pigments through the sulphate and chloride processes.
Based upon the work summarized in a paper by Westmount Mining (Westmount, 1990), ilmenite from the Longnose deposit would be a saleable as an ilmenite concentrate; however, may be priced at the lower end of the pricing spectrum due to magnesium levels. Beneficiation to a Sorel slag, low-alkali slag or synthetic rutile would, however, be advantageous and increase market options. This type of beneficiation will require significant further testwork.
MDJ/DF/HD/WB | 2CC031_004_Longnose_NI43101_FinalReport_20120124_MDJ_wb_djf_20120127 | January 27, 2012 |
2CC031.004 Cardero Resource Corp. | |
Longnose Project | Page 62 |
Figure 13.1: Titanium feedstocks & uses (Westmont, 1990)
13.2 | Resource Estimation Procedures |
The resource evaluation methodology involved the following procedures:
Database compilation and verification;
Construction of wireframe models for the boundaries of the oxide mineralization;
Definition of resource domains;
Data conditioning (compositing and capping) for geostatistical analysis and variography;
Block model creation, coding and grade interpolation;
Resource classification and validation;
Assessment of reasonable prospects for economic extraction and selection of appropriate cut- off grades; and
Preparation of the Mineral Resource Statement.
13.3 | Resource Database |
SRK audited and reviewed data provided by Cardero to create a Surpac® database from which the Mineral Resource estimation was based. The database includes the following tables:
Drill hole collar information such as location and length;
MDJ/DF/HD/WB | 2CC031_004_Longnose_NI43101_FinalReport_20120124_MDJ_wb_djf_20120127 | January 27, 2012 |
2CC031.004 Cardero Resource Corp. | |
Longnose Project | Page 63 |
Downhole survey information such as direction and dip;
Lithology information including rock group codes and interpreted geology;
Downhole magnetic susceptibility data;
Downhole specific gravity measurements ; and,
Chemical analytical (assay) records.
The data encompassed 27 drill holes, 544 downhole survey readings and 1695 assays. Lithology data was only available for the 15 modern holes completed by CIOUS in 2010 and 2011.
Three historical drill holes were not utilized for the Mineral Resource due to lack of significant CIOUS sampling in these holes. Neither the drill core nor the assay rejects were available for re-sampling. Historical assays in these holes were not used in the estimation, but did not contradict the results of the estimates.
Basic statistics for the drill hole assay and specific gravity data are presented in Table 13.1 and .Table 13.2
Table 13.1: Statistical Summary of assay results in the database
TiO2 | Fe2O3 | Length | |
Count | 1695 | ||
Minimum | 0.09 | 5.38 | 0.30 |
Maximum | 41.70 | 69.70 | 6.10 |
Mean | 13.46 | 31.11 | 2.08 |
Standard Deviation |
7.60 |
11.39 |
0.60 |
Table 13.2: Statistical summary of specific gravity data in the database
Specific Gravity | |
Count | 855 |
Minimum | 2.59 |
Maximum | 4.7 |
Mean | 3.31 |
Standard Deviation | 0.41 |
13.4 | 3D Modelling |
Solid models were created to provide spatial limits for each of the mineralization domains within the Longnose deposit. The domains were largely created by interpretation of the drill hole lithology data from 2010/11 drill holes, in conjunction with analysis of the TiO2 and Fe2O3 assay values from all holes. There historic holes lack the lithology data that the modern holes have, so assay data was used as a surrogate for geology where required.
The domains were broadly defined based upon the designation of drillcore intervals as peridotite or pyroxenite dominated oxide bearing ultramafic rocks, or country rocks. The two domains were created by generalizing the lithology, so each domain is dominated by either peridotite or pyroxenite material, but may contain shorter intervals of other rock types.
Surpac® 6.2 and Leapfrog® software was used to create the wireframes. The boundaries were limited to below the surface and/or overburden boundary and so that no overlap or gap is created between the two domains.
MDJ/DF/HD/WB | 2CC031_004_Longnose_NI43101_FinalReport_20120124_MDJ_wb_djf_20120127 | January 27, 2012 |
2CC031.004 Cardero Resource Corp. | |
Longnose Project | Page 64 |
Topographic and overburden surfaces were modelled from the drill hole data. These surfaces were used to code the appropriate portions of the block model as air or overburden.
Figure 13.2 and Figure 13.3 show the interpreted domains in plan view and orthographic views.
Figure 13.2: Longnose three-dimensional (3-D) model domains (100 m grid)
Figure 13.3: Longnose 3-D models with drill holes (50 m grid, looking northeast)
MDJ/DF/HD/WB | 2CC031_004_Longnose_NI43101_FinalReport_20120124_MDJ_wb_djf_20120127 | January 27, 2012 |
2CC031.004 Cardero Resource Corp. | |
Longnose Project | Page 65 |
13.5 | Bulk Density |
The Longnose database contains 855 specific gravity (SG) measurements, 501 of which fall within the interpreted boundary of the Longnose OUI deposit. 354 SG measurements lie outside the mineralization domains, while 186 measurements lie within the peridotite domain and 315 measurements lie within the pyroxenite domain.
Specific gravity was measured on core samples by Cardero using a laboratory scale and recording the mass of drill hole core pieces in air and water. Drill hole core was not covered by wax or plastic film prior to immersion; however, porosity is not likely to be an issue with this type of rock. No strong correlation between specific gravity measurements and TiO2 or Fe2O3 assay results was noted.
SG data was utilized to estimate bulk density.
13.6 | Compositing |
Drill hole assay sample lengths are summarized in Figure 13.4; a histogram of sample lengths. Approximately 60% of the samples are less than 2 m in length, so a compositing interval of 2 m was selected.
Figure 13.4: Histogram of sample lengths
Composites of 1 m or less were tagged as short composites and not used in the estimation process so they did not have an unrepresentative influence on the estimates. Since the domains are relatively thick in all directions and these short composites only occur at domain boundaries, they are not significant to the estimation process.
MDJ/DF/HD/WB | 2CC031_004_Longnose_NI43101_FinalReport_20120124_MDJ_wb_djf_20120127 | January 27, 2012 |
2CC031.004 Cardero Resource Corp. | |
Longnose Project | Page 66 |
13.7 | Evaluation of Outliers |
Block grade estimates may be unduly affected by high grade outliers. Evaluation of the sample data for outliers which should be capped or otherwise restriceted was copmleted by looking at cumulative probability graphs. Theses plots are shown for TiO2 in both domains within Figure 13.5 and Figure 13.6.
Overall, the two domains show a relatively consistent trend of a single population from approximatley 15% TiO2 and above. At TiO2 values less than 15%, there is evidence of mixing of lower grade material such as pyroxenite in the Peridotie domain or country rock (troctolites) material within either of the mineralized domains.
For the Peridoite domain, there is a significant lower grade population which has been included within the domain and accounts for aporixatmly 20% of the samples. These samples are scattered throughout the deposit and cannot be modelled out at the current state of the data. The domain includes a very small percentage (< 5%) of very low grade (country rock) samples.
The pyroxenite domain also inlcudes a lower grade population (< 8% TiO2) which accounts for approximatley 5% of the samples. These samples are also mixed throughout the domain and cannot be easiliy modelled out at the current state of the data.
SRK determined that capping was uncessary for both TiO2 and Fe2O3 in either domain.
Figure 13.5: Peridotite Probability Plot (declustered composites)
MDJ/DF/HD/WB | 2CC031_004_Longnose_NI43101_FinalReport_20120124_MDJ_wb_djf_20120127 | January 27, 2012 |
2CC031.004 Cardero Resource Corp. | |
Longnose Project | Page 67 |
Figure 13.6: Pyroxenite Probability Plot (declustered composites)
13.8 | Statistical Analysis and Variography |
13.8.1 | Composite Statistics |
Composite statistics for TiO2 and Fe203 as well as sample statistics for specific gravity are described below.
TiO2 Composites Statistics
Figure 13.7 and Figure 13.8 show histograms of the TiO2 composites within each domain, as well as the basic statistics for each. The average peridotite TiO2 value is 18.9%,while the average in the pyroxenite is 13.75% .
MDJ/DF/HD/WB | 2CC031_004_Longnose_NI43101_FinalReport_20120124_MDJ_wb_djf_20120127 | January 27, 2012 |
2CC031.004 Cardero Resource Corp. | |
Longnose Project | Page 68 |
Figure 13.7: Peridotite composite histogram for TiO2
Figure 13.8: Pyroxenite composite histogram for TiO2
MDJ/DF/HD/WB | 2CC031_004_Longnose_NI43101_FinalReport_20120124_MDJ_wb_djf_20120127 | January 27, 2012 |
2CC031.004 Cardero Resource Corp. | |
Longnose Project | Page 69 |
Fe2O3 Composites Statistics
Figure 13.9 and Figure 13.10 show the histograms of the Fe2O3 composites within each domain, as well as the basic statistics of each. The average peridotite Fe2O3 value is 41.12%, while the average in the pyroxenite is 30.32% .
Figure 13.9: Peridotite Composite Histogram for Fe2O3
Figure 13.10: Pyroxenite composite histogram for Fe2O3
MDJ/DF/HD/WB | 2CC031_004_Longnose_NI43101_FinalReport_20120124_MDJ_wb_djf_20120127 | January 27, 2012 |
2CC031.004 Cardero Resource Corp. | |
Longnose Project | Page 70 |
13.8.2 | Specific Gravity Sample Statistics |
Figure 13.11 and Figure 13.12 show the histograms of the SG composites within each domain, as well as the basic statistics of each. The average peridotite domain SG is 3.64, while the average in the pyroxenite domain SG is 3.49. The surrounding country rock has an average SG of 2.97.
Figure 13.11: Longnose specific gravity histogram, peridotite domain
Figure 13.12: Longnose specific gravity histogram, pyroxenite domain
MDJ/DF/HD/WB | 2CC031_004_Longnose_NI43101_FinalReport_20120124_MDJ_wb_djf_20120127 | January 27, 2012 |
2CC031.004 Cardero Resource Corp. | |
Longnose Project | Page 71 |
Figure 13.13: Longnose specific gravity histogram, country rocks
13.8.3 | Variography |
Kriging parameters were derived from variogram analysis completed on the composites for each metal (Table 13.3) . A single variogram was used for both domains based upon the relatively limited data within any single domain. The nugget effects were established from downhole variograms.
The nugget values are 12% of the total sill for both TiO2 and Fe2O3 respectively. Note that the sill represents the grade variability at a distance beyond which there is no correlation in grade.
Table 13.3: TiO2 and Fe2O3 variogram parameters for both Longnose domains
Element |
Nugget
C0 |
Sill C1, C2 |
Surpac® Rotations Rule (LRL) | Ranges a1, a2 | ||||
around Z | around X | around Y | Y-Rot | X-Rot | Z-Rot | |||
TiO2 |
5 |
14 | 130 |
-20 |
0 |
135 | 135 | 68 |
23 | 200 | 200 | 100 | |||||
Fe2O3 |
12 |
29 | 135 |
-20 |
-10 |
70 | 29 | 22 |
53 | 350 | 146 | 109 |
A viable three-dimensional TiO2 variogram was not apparent in the data; however, a shallowly east-dipping omnidirectional variogram was fit to the data in two-dimensions (Figure 13.14) . It was decided that the downhole variogram would be utilized as a surrogate for determining the 3rd dimension ranges (Figure 13.15) .
MDJ/DF/HD/WB | 2CC031_004_Longnose_NI43101_FinalReport_20120124_MDJ_wb_djf_20120127 | January 27, 2012 |
2CC031.004 Cardero Resource Corp. | |
Longnose Project | Page 72 |
Figure 13.14: 2-D sub-horizontal component of the TiO2 variogram
Figure 13.15: Sub-vertical component of the TiO2 variogram (downhole)
MDJ/DF/HD/WB | 2CC031_004_Longnose_NI43101_FinalReport_20120124_MDJ_wb_djf_20120127 | January 27, 2012 |
2CC031.004 Cardero Resource Corp. | |
Longnose Project | Page 73 |
Analysis of the Fe2O3 composite data resulted in a viable three-dimensional variogram, which are shown in Figure 13.16.
Figure 13.16: Major (top), semi-major and minor axis (bottom) Fe2O3 variograms
The ranges of continuity are generally longer for the Fe2O3 sample data (~350 m / ~100 m) compared to TiO2 (~200 m / ~100 m).
MDJ/DF/HD/WB | 2CC031_004_Longnose_NI43101_FinalReport_20120124_MDJ_wb_djf_20120127 | January 27, 2012 |
2CC031.004 Cardero Resource Corp. | |
Longnose Project | Page 75 |
13.9 | Block Model and Grade Estimation |
A block model was constructed to encompass the entire domain models as well as the surrounding rock. The block model was constructed in order to provide a matrix database which can be populated by data such as geology codes, density data and grade estimates. The Longnose block model was created with the parameters described in Table 13.4.
Table 13.4: Block Model Summary
Type | Y | X | Z | Units |
Minimum Coordinates | 5,267,800 | 571,500 | 50 | UTM metres |
Maximum Coordinates | 5,269,100 | 572,900 | 500 | UTM metres |
Parent Block Size | 20 | 20 | 10 | metres |
Min. Sub-block Size | 5 | 5 | 2.5 | metres |
Rotation | 0 | 0 | 0 | degrees |
Block Model Size | 1,300 | 1,400 | 450 | metres |
Parent Blocks | 65 | 70 | 45 | blocks |
Total Parent Blocks | 204,750 | blocks |
Parent blocks were estimated, while sub-blocking was used only to improve volumetric accuracy only.
Key attributes of the block model included:
Estimation was completed for both TiO2 and Fe2O3 values using both ID2 and OK methods. Estimation of specific gravity was also completed by ID2 methods.
13.9.1 | Grade Interpolation |
Block grades were estimated by ordinary kriging into the domain models. All wireframe boundaries were treated as “hard” boundaries, meaning that blocks within a selected domain were only estimated by composites from within that domain.
TiO2 and Fe2O3 grades were estimated in multiple passes with increasing search radii. Successive passes only calculated grades into blocks that had not been interpolated by the previous passes. Table 13.5 summarises the search ellipse parameters used to estimate metal grades into the model.
MDJ/DF/HD/WB | 2CC031_004_Longnose_NI43101_FinalReport_20120124_MDJ_wb_djf_20120127 | January 27, 2012 |
2CC031.004 Cardero Resource Corp. | |
Longnose Project | Page 75 |
Table 13.5: Search ellipse parameters (Rotations aligned with Search Ellipses)
Metal |
Search Pass |
Empty Octants Allowed |
Search Ellipse Size |
Number of Composites |
Max. Samples per DDH | |||
X (m) | Y (m) | Z (m) | Min. | Max. | ||||
TiO2 | 1 | 4 | 125 | 125 | 63 | 6 | 16 | 4 |
TiO2 | 2 | 6 | 200 | 200 | 100 | 5 | 16 | 4 |
TiO2 | 3 | 8 | 250 | 250 | 125 | 2 | 16 | 3 |
Fe2O3 | 1 | 4 | 125 | 52 | 39 | 6 | 16 | 4 |
Fe2O3 | 2 | 6 | 200 | 83 | 63 | 5 | 16 | 4 |
Fe2O3 | 3 | 8 | 250 | 104 | 78 | 2 | 16 | 3 |
13.9.2 | Specific Gravity Interpolation |
Block density data was interpolated from specific gravity point measurements using ID2 methods. The estimate was created in two passes for each domain, including the country rock external to the mineralization.
The search ellipse for the ID2 estimates was aligned parallel to the Fe2O3 search ellipse, which is relatively similar to the trend of the TiO2 search ellipse. Estimation of density outside the mineralization domains was completed with an isotropic search ellipse. Passes were completed at a search ellipse of 150 m and then 300 m in the longest direction.
Minimum samples were generally three on the first pass and two on the second pass with a maximum number of samples of eight and a maximum of three from any drill hole for all passes.
Country rock blocks that were not estimated were assigned an average value of 2.99 g/cm3. Overburden blocks were assigned a value of 2.0 g/cm3, which is an estimated value and not based upon any project measurements.
13.10 | Model Validation |
13.10.1 | Declustered Average Grades |
In order to check for global bias between the sample data and the estimate, the global estimated grades for TiO2 and Fe2O3 have been compared to the declustered average composite data. Cell declustering had been utilized for this exercise, using GSLib software.
The results of cell declustered average composite grades compared to zero cut-off OK estimated grades are shown in Table 13.5. Overall, the results compare well, with estimated grades within 5% of the declustered composites grades for all but the TiO2 estimate in the pyroxenite domain.
In the case of the pyroxenite domain, the OK estimated grade is 12% higher than the declustered average to a volume within the Inferred Mineral Resource where drill holes having only penetrated partially through the mineralized zone and end in higher grade material. These higher grade assays at the end of these holes are extrapolated into a larger volume of material, where is reasonable to expect that higher grade mineralization exists.
MDJ/DF/HD/WB | 2CC031_004_Longnose_NI43101_FinalReport_20120124_MDJ_wb_djf_20120127 | January 27, 2012 |
2CC031.004 Cardero Resource Corp. | |
Longnose Project | Page 76 |
Table 13.6 : Declustered Average Grade compared to Estimated Grade at Zero Cut-off
Domain |
TiO2 Declustered
Grade |
OK Estimated TiO2 Grade |
Fe2O3
Declustered Grade |
OK Estimated
Fe2O3 Grade |
(TiO2 %) | (Fe2O3 %) | |||
Pyroxenite | 13.8 | 15.4 | 30.4 | 30.4 |
Peridotite | 18.9 | 18.7 | 41.0 | 41.2 |
13.10.2 | Comparison of Well Informed Blocks |
In order to validate how well the estimation process is estimating grades near samples, estimated blocks which also contain composite samples are selected (well informed blocks). The estimated grades for these blocks are compared to the average of the composite grades using a scatter plot. The scatter plots for TiO2 and Fe2O3 within each of the pyroxenite and peridotite domains are shown in Figure 13.7 and Figure 13.18.
Overall, the estimates appear to reasonably represent the sample data with some smoothing of grades evident and expected.
Figure 13.17: Comparison of TiO2 from Well Informed Blocks
Figure 13.18: Comparison of Fe2O3 from Well Informed Blocks
MDJ/DF/HD/WB | 2CC031_004_Longnose_NI43101_FinalReport_20120124_MDJ_wb_djf_20120127 | January 27, 2012 |
2CC031.004 Cardero Resource Corp. | |
Longnose Project | Page 77 |
13.10.3 | Swath Plot Comparison of Estimates to Composites |
Swath plots are used to compare the trends in composite grades, across the X, Y and Z axis, to the grade estimates.
Figure 13.19 and Figure 13.20 show the trends in TiO2 composite, OK estimated and ID2 estimated grades, for each of the pyroxenite and peridotite domains. Overall, the trends of the composites are reflected in the estimates; however, the estimates are smoother.
SRK believes that the swath plots reflect a reasonable correlation between sample and estimation trends. As well, the trends in the OK estimation are very similar to that of the ID2 estimation.
Figure 13.19: Pyroxenite Domain TiO2 Swath Plots
Figure 13.20: Peridotite Domain TiO2 Swath Plots
A cross section of the Longnose OUI deposit showing drill holes and block model grades is shown in Figure 13.21. The correlation of the assays and the block model grades seems to visually align. Smoothing of the drill hole grade is evident in the model.
MDJ/DF/HD/WB | 2CC031_004_Longnose_NI43101_FinalReport_20120124_MDJ_wb_djf_20120127 | January 27, 2012 |
2CC031.004 Cardero Resource Corp. | |
Longnose Project | Page 78 |
Figure 13.21: Cross section of Longnose OUI showing block grades (looking northeast)
13.11 | Fe2O3 estimate adjustment using Davis Tube data |
As discussed in Section 12, Davis Tube tests were used to help quantify the amount of Fe which partitions to a magnetic fraction.
SRK utilized 151 Davis Tube tests in order to establish a relationship between assayed Fe %, and magnetite assumed to be contained within the magnetic fraction. The maximum amount of magnetite possible in the concentrate was calculated using the Fe % concentrate assay, using the conversion:
Maximum Magnetite% in Concentrate = 1.382 * Fe% in Concentrate.
This magnetite percentage in the concentrate was then multiplied by the total concentrate weight, to determine the potential weight of magnetite in the concentrate. The weight of the potential magnetite in the concentrate was divided by the starting sample weight to establish the maximum weight percent of magnetite in the starting sample.
Linear regression of the maximum magnetite content versus the Fe % head assay, was completed to determine the relationship between Fe % and Magnetite %. This was completed for both domains and the regression for the peridotite domain is presented in Figure 13.22.
MDJ/DF/HD/WB | 2CC031_004_Longnose_NI43101_FinalReport_20120124_MDJ_wb_djf_20120127 | January 27, 2012 |
2CC031.004 Cardero Resource Corp. | |
Longnose Project | Page 79 |
Figure 13.22 : Davis Tube regression, peridotite domain
The indicated regression for the peridotite and pyroxenite domains were:
Predicted Peridotite Domain Magnetite Grade % = 1.55 X Fe% - 22.5
Predicted Pyroxenite Domain Magnetite Grade % = 1.27 X Fe% - 10.5
Unfortunately, due to the uncertainty of the amount of ilmenite partitioning to the magnetic concentrate, as well as the amount of titaniferous magnetite, there is a risk that the predicted magnetite is overstated. SRK, therefore, adjusted the Mineral Resource Fe2O3 (Table 13.8) grade using the regression, but has not quantified the amount of magnetite at this time. Further mineralogical study and chemical analysis of the magnetic concentrates is required.
13.12 | Mineral Resource Classification |
Block model quantities and grade estimates for the Project were classified according to the CIM Definition Standards for Mineral Resources and Mineral Reserves (December 2005) by Michael D. Johnson, P.Geo. (APEGBC, No. 34923), an appropriate independent qualified person for the purpose of NI 43-101.
Mineral resource classification is typically a subjective concept; industry best practices suggest that resource classification should consider both the confidence in the geological continuity of the mineralized structures, the quality and quantity of exploration data supporting the estimates, and the geostatistical confidence in the tonnage and grade estimates. Appropriate classification criteria should aim at integrating both concepts to delineate regular areas at similar resource classifications.
SRK is satisfied that the geological modelling honours the current geological information and knowledge. The location of the samples and the assay data are sufficiently reliable to support
MDJ/DF/HD/WB | 2CC031_004_Longnose_NI43101_FinalReport_20120124_MDJ_wb_djf_20120127 | January 27, 2012 |
2CC031.004 Cardero Resource Corp. | |
Longnose Project | Page 80 |
resource evaluation. The sampling information was acquired primarily by diamond (core) drilling on sections spaced at 50 m to 100 m.
Portions of the Project mineral resource has been classified as Indicated and Inferred. Generally, the core of the deposit has been sufficiently drilled to warrant Indicated classification, while the periphery and deeper eastern mineralization has been classified at Inferred.
The criteria used to classify blocks as Indicated included:
estimated in the first estimation pass;
blocks estimated by more than 8 composites; and,
blocks with average distances to their composites of less than 100 m.
SRK feels that blocks which conform to these criteria have demonstrated geological continuity and sufficiently dense sampling data to support mine planning. Blocks that met these criteria were selected and then volumes, which were dominated by these blocks and formed a cohesive and generally continuous volume, were coded as Indicated through the creation of a solid containing those blocks. In this way, the Indicated material has been interpreted to avoid disseminated blocks coded as Indicated interspersed with Inferred.
Blocks that did not conform to these criteria and fell outside the interpreted Indicated volume were classified as Inferred.
Approximately 44 % of the Mineral Resource is classed as Indicated with the remaining 56% classed as Inferred. The blocks comprising the Mineral Resource are shown in plan view in Figure 13.22, with the blocks colour coded by resource classification.
Figure 13.23: Mineral Resource blocks coloured by Mineral Resource classification (100 m grid)
MDJ/DF/HD/WB | 2CC031_004_Longnose_NI43101_FinalReport_20120124_MDJ_wb_djf_20120127 | January 27, 2012 |
2CC031.004 Cardero Resource Corp. | |
Longnose Project | Page 81 |
13.13 | Mineral Resource Statement |
CIM Definition Standards for Mineral Resources and Mineral Reserves (December 2005) defines a mineral resource as:
(A) concentration or occurrence of diamonds, natural solid inorganic material, or natural solid fossilized organic material including base and precious metals, coal, and industrial minerals in or on the Earths crust in such form and quantity and of such a grade or quality that it has reasonable prospects for economic extraction. The location, quantity, grade, geological characteristics and continuity of a Mineral Resource are known, estimated or interpreted from specific geological evidence and knowledge.
The reasonable prospects for economic extraction requirement generally implies that the quantity and grade estimates meet certain economic thresholds and that the mineral resources are reported at an appropriate cut-off grade taking into account extraction scenarios and processing recoveries. In order to meet this requirement, SRK considers that major portions of the Project are amenable for open pit extraction.
In order to determine the quantities of material offering reasonable prospects for economic extraction by a potential open pit, SRK used a pit optimizer (Gemcom Whittle® 4.4) and reasonable mining assumptions to evaluate the proportions of the block model that could be reasonably expected to be mined from an open pit.
For this exercise, TiO2 values were converted to Ilmenite grades by dividing by 0.5264. Fe2 O3 estimates provided no value in the pit optimizer by setting price and recovery to zero.
The optimization parameters (Table 13.7) were selected based on experience and benchmarking against similar projects. The reader is cautioned that the results from the pit optimization are used solely for the purpose of testing the reasonable prospects for economic extraction by an open pit and do not represent an attempt to estimate Mineral Reserves. There are no Mineral Reserves defined for the Project.
The results are used as a guide to assist in the preparation of a Mineral Resource statement and to select an appropriate resource reporting cut-off grade.
Table 13.7: Assumptions Considered for Conceptual Open Pit Optimization.
Parameter | Value | Unit |
TiO2 : Ilmenite Ratio | 0.5264:1 | n/a |
Ilmenite Price | 170 | $US per tonne |
Mining Cost | 2.50 | US$ per tonne mined |
Processing | 8.00 | US$ per tonne of feed |
General and Administrative | 1.00 | US$ per tonne of feed |
Mining Dilution | 0 | percent |
Mining Loss | 0 | percent |
Overall Pit Slope | 50 | degrees |
Ilmenite Process Recovery | 70 | percent |
Magnetite Process Recovery | 0 | percent |
With industrial minerals such as ilmenite, product pricing is subject to many more modifying factors than precious or base metals. SRK has utilized a consensus of market forecasts to choose this ilmenite price. SRK believes that site specific product pricing is unrealistic at this stage of the
MDJ/DF/HD/WB | 2CC031_004_Longnose_NI43101_FinalReport_20120124_MDJ_wb_djf_20120127 | January 27, 2012 |
2CC031.004 Cardero Resource Corp. | |
Longnose Project | Page 82 |
Project. SRK feels that pricing risks are offset by not planning for the potential value of magnetite which would reasonably be an expected as a by-product at such a deposit. As well, ilmenite pricing as low at $100 per tonne of ilmenite had little effect on the blocks contained within the conceptual pit shell.
SRK considers that the blocks located within the conceptual pit envelope show reasonable prospects for economic extraction and are well quantified, and therefore can be reported as a Mineral Resource. When running the optimizer, SRK found that the entire mineralized domains fell within the shell; therefore the optimization process essentially placed no constraints on the Mineral Resource.
The Mineral Resource statement is summarized in Table 13-8.
Table 13.8: Mineral Resource Statement*, Longnose Project, Minnesota, USA, SRK Consulting (Canada) Inc., effective date, January 19, 2012.
Category (Open Pit**) |
Estimated Quantity |
Estimated Grade | |
TiO2 | Adjusted Fe2O3*** | ||
Mt | % | % | |
Indicated | 58.1 | 16.6 | 18.8 |
Inferred | 65.3 | 16.4 | 19.4 |
* |
Mineral resources are reported in relation to a conceptual pit shell. Mineral resources are not mineral reserves and do not have demonstrated economic viability. All figures are rounded to reflect the relative accuracy of the estimate. All composites have been capped where appropriate. | |
** |
Open pit (near surface) mineral resources are reported at a cut-off grade of 8% TiO2. Cut-off grades are based on a price of US$170 per tonne of Ilmenite back calculated to TiO2 and recoveries of 70 percent, without considering revenues from other metals including Fe. | |
*** |
Reported Fe2O3 has been lowered to reflect the amount of Fe estimated contained within ilmenite and silicates, based upon Davis Tube testing. At this time, accurately quantifying the amount of magnetite contained within this estimate is not possible. |
As stated above, the Mineral Resource has been quantified in terms of TiO2 and Fe2O3, the analytical components captured for assays of titanium and iron. The Fe2O3 values have been reduced to reflect Fe found within silicates and within the ilmenite associated with the TiO2; however, accurately quantifying magnetite is not possible at this time as further mineralogical work will be needed. In any potential mining scenario, the Longnose Project would produce ilmenite (FeTiO3) and may produce titaniferous magnetite (TiFe2O4) and magnetite (Fe3O4) as a by-product. Using Carderos Davis Tube test results, historic mineralogy and metallurgy reports, reasonable assumptions regarding mineralogy of the deposit, estimates of the quantity of ilmenite were made.
The contained ilmenite in the Mineral Resource is summarized in Table 13.9
Table 13.9: Summary of Longnose Project Ilmenite content
Category |
Quantity |
Ilmenite Grade | Contained Ilmenite |
(FeTiO3) | |||
Mt | % | Mt. | |
Indicated | 58.1 | 31.5 | 18.30 |
Inferred | 65.3 | 31.2 | 20.40 |
MDJ/DF/HD/WB | 2CC031_004_Longnose_NI43101_FinalReport_20120124_MDJ_wb_djf_20120127 | January 27, 2012 |
2CC031.004 Cardero Resource Corp. | |
Longnose Project | Page 83 |
13.14 | Grade Sensitivity Analysis |
The mineral resources of the Longnose Project are sensitive to the selection of the reporting cut-off grade. To illustrate this sensitivity, the block model quantities and grade estimates within the conceptual pit used to constrain the mineral resources are presented in Table 13.10 at different TiO2 cut-off grades. The reader is cautioned that the figures presented in this table should not be misconstrued with a Mineral Resource Statement. The figures are only presented to show the sensitivity of the block model estimates to the selection of cut-off grade. Figure 13.24 presents this sensitivity as grade tonnage curves.
Table 13.10: Global block model quantities and grade estimates* at various TiO2 cut-off grades, Longnose Project.
Cut-off Grade | Quantity | Grade |
TiO2 (%) | (Mt) | TiO2 (%) |
5 | 125.1 | 16.4 |
6 | 125.0 | 16.4 |
7 | 124.7 | 16.4 |
8 | 123.4 | 16.5 |
9 | 121.5 | 16.6 |
10 | 117.0 | 16.9 |
11 | 109.8 | 17.3 |
12 | 101.8 | 17.8 |
13 | 93.2 | 18.3 |
14 | 85.0 | 18.7 |
15 | 76.7 | 19.2 |
16 | 67.8 | 19.6 |
17 | 58.0 | 20.2 |
18 | 47.8 | 20.7 |
19 | 37.1 | 21.4 |
20 | 26.6 | 22.1 |
25 | 2.4 | 26.9 |
30 | 0.2 | 30.8 |
* The reader is cautioned that the figures in this table should not be misconstrued with a Mineral Resource statement. The figures are only presented to show the sensitivity of the block model estimates to the selection of cut-off grade. |
MDJ/DF/HD/WB | 2CC031_004_Longnose_NI43101_FinalReport_20120124_MDJ_wb_djf_20120127 | January 27, 2012 |
2CC031.004 Cardero Resource Corp. | |
Longnose Project | Page 84 |
Figure 13.24: Grade Tonnage Curves for the Longnose.
MDJ/DF/HD/WB | 2CC031_004_Longnose_NI43101_FinalReport_20120124_MDJ_wb_djf_20120127 | January 27, 2012 |
2CC031.004 Cardero Resource Corp. | |
Longnose Project | Page 85 |
14 |
Adjacent Properties |
The Project is situated at the western edge of the Duluth geological complex, bordering on the archean Granite-Greenstone Terraines of the Canadian Shield.
This area is a prolific mining area, including several massive Taconite (Iron ore) mines of the Mesabi Range. The western margin of the Duluth Complex contains a series of Cu-Ni deposits in close proximity to the Project. These Cu-Ni deposits include Tecks Mesaba deposits and Polymets NorthMet deposit. These deposits lie near the basil contact between the Duluth Complex and the underlying older Precambrian rocks.
There are also numerous OUI bodies similar to Longnose within 20 km of the Project Area. The closest is Longyear which lies 1 km north of the Project Area. Section 17 OUI deposits lie about 2 km north of the Project Area and Section 22 lies 5km south-southwest. CIOUSs other OUI ilmenite project, Titac (formerly called Section 34), which is similar but smaller and lower grade than the Project, lies approximately 40 km south of the Project Area.
MDJ/DF/HD/WB | 2CC031_004_Longnose_NI43101_FinalReport_20120124_MDJ_wb_djf_20120127 | January 27, 2012 |
2CC031.004 Cardero Resource Corp. | |
Longnose Project | Page 86 |
15 |
Other Relevant Data and Information |
There is no additional data or information not contained in this report which is relevant to the Project.
MDJ/DF/HD/WB | 2CC031_004_Longnose_NI43101_FinalReport_20120124_MDJ_wb_djf_20120127 | January 27, 2012 |
2CC031.004 Cardero Resource Corp. | |
Longnose Project | Page 87 |
16 |
Interpretation and Conclusions |
The Longnose deposit is an ultramafic intrusion significantly enriched in ilmenite and magnetite oxides. The deposit is flat lying and provides a geometry that should be amicable to open pit mining. The Longnose deposit is approximately 700 m long in the north-south direction, 600 m wide in the east-west direction and 150 m thick.
The Longnose OUI is geologically interpreted to be late-stage intrusion that cuts early Duluth Complex intrusives and is associated with magmatism generated by the 1.1 billion year old Midcontinent Rift system. The drilling program conducted in 2010 and 2011 by CIOUS confirmed strong titanium-iron-oxide mineralization at the Project Area. The Longnose OUI is hosted by troctolitic rocks of the Partridge River intrusion.
The Longnose intrusion is stratigraphically simple, consisting of a core of olivine-rich dunitic and peridotitic rocks containing disseminated titanium-iron oxide mineralization with horizons of massive and semi-massive oxide throughout, that is enveloped by pyroxenitic rocks, which contain much less mineralization. Disseminated titanium-iron oxide mineralization is continuous, and the horizons of massive and semi-massive oxide may link up to form layers that dip moderately coincident with dip of the overall intrusion. The dominant oxide mineral is ilmenite with lesser amounts of titano-magnetite.
The exploration data for the Project is robust; viable to support the Mineral Resource defined within this document. The data has been well validated and has been found to be repeatable. Overall, correlation of the mineralization between drill holes is reasonable and it is expected that the Mineral Resource accurately represents the TiO2 and Fe2O3 mineralization. Based on the TiO2 estimates and the mineralogy of the deposit, the amount of ilmenite has been quantified. Potentially viable iron products (titaniferous-magnetite / magnetite) have not been quantified at this time.
Ilmenite and, to a lesser extent titaniferous magnetite, is used as a source material for titanium used as pigments and as a metal alloy. Rutile is the ideal source material for titanium as it contains a nearly twice as much Ti as ilmenite; however, ilmenite is by far the more common source.
Ilmenite is an industrial mineral and there are risks and uncertainties associated with this ilmenite resource, many of which are common to industrial mineral deposits. Industrial minerals have special risks that are not typically associated with precious or base metal mines. Special concerns include mineralogy of material, deleterious elements (such as silica, calcium, magnesium and manganese), and special market factors such as market size or proprietary technology. Because of these and other issues, industrial mineral deposits can carry additional risks compared to more common metal products.
Historic tests have indicated that a viable ilmenite concentrate could be created from the processing of Longnose material, although higher than ideal magnesium levels may reduce the product price somewhat. The ilmenite may be sold as a concentrate to an existing ilmenite processor as the deposit is amicable to shipping due to its proximity to rail and a short haul to bulk ports on the western shore of Lake Superior. As well, local beneficiation could be considered, particularly when other nearby OUI bodies are considered for increased scale. The main hurdle to overcome with future exploitation of the Longnose deposit revolves around metallurgical optimization to create the highest grade concentrate while reducing potential magnesium contamination of the concentrate or
MDJ/DF/HD/WB | 2CC031_004_Longnose_NI43101_FinalReport_20120124_MDJ_wb_djf_20120127 | January 27, 2012 |
2CC031.004 Cardero Resource Corp. | |
Longnose Project | Page 88 |
utilizing a beneficiation process that can handle the higher magnesium values. As further economic analysis of the Project is completed, solving these processing issues will be a focal point of the work.
Ilmenite and magnetite are industrial minerals and subject to the specifics of a relatively limited market with very special restrictions on saleable products. Although it is reasonable to expect that that the Longnose deposit mineralization can be concentrated into a potentially saleable product, a huge amount of data collection and analysis must be completed before more detailed economic assessment can be completed. The relative amounts of ilmenite, titaniferous magnetite and magnetite have yet to be fully understood, which prevents quantifying magnetite within the Mineral Resource.
Based upon the significant amount of historical research completed on the Project, a relatively simple processing flow sheet for ilmenite concentrate, a recent increase in demand for Ilmenite, and the projects close proximity to other bulk mines and inexpensive shipping routes; SRK believes that the Project meets the criteria for having reasonable prospects of economic extraction.
MDJ/DF/HD/WB | 2CC031_004_Longnose_NI43101_FinalReport_20120124_MDJ_wb_djf_20120127 | January 27, 2012 |
2CC031.004 Cardero Resource Corp. | |
Longnose Project | Page 89 |
17 |
Recommendations |
The drilling program conducted in 2010 and 2011 conducted by CIOUS has confirmed strong titanium-iron-oxide mineralization at the Project Area. The Project merits additional work.
The exploration data for the Project should be expanded and SRK recommend the following work:
a comprehensive mineralogical study of the oxide and sulfide mineralization should be conducted to confirm the specific oxide minerals present throughout the defined mineralization;
metallurgical testwork in conjunction with the mineralogical studies, to assist with better understanding of ilmenite and magnetite recovery, project economic analysis and provide an update to the work completed in the 1990s;
completion of a preliminary economic assessment to assist with further exploration and provide project specific economic criteria;
further study of the other elements, such as vanadium, magnesium and silica contents and how they are distributed through the deposit;
a relatively small infill drilling program consisting of 3-5 drill holes; and
a small step-out drilling program targeting the southern part of the intrusion consisting of 3-5 drill holes.
The Longnose intrusion is fairly well defined by historic drilling, and has been further defined by the drilling conducted by CIOUS in 2010 and 2011. However, some infill drilling is warranted to better define the boundaries of the peridotite domain as well as the pyroxenite domain to the northwest. As well, further step-out exploration drilling is recommended in the southeastern area of the Project Area. This drilling should consist of approximately 6-10 holes 100-300 m drill holes, totaling approximately 1500-2500 m.
In all ongoing drill programs, basic geotechnical data should be recorded in order to provide data to assist with economic analysis and preliminary investigations into potential open pit limits.
Mineralogical studies in conjunction with metallurgical testwork and further chemical analysis should be completed to provide a better understanding of the Ti and Fe bearing minerals and their relative proportions. During the current analysis, Ti has been assumed to be dominantly contained within Ilmenite.
A preliminary economic assessment is recommended. This is particularly important for an industrial mineral deposit, is relatively uncommon, and there is a specialized market for titanium products. Economic assessment can begin to qualify potential pitfalls for the project as well as help to set some project specific economic criteria that can assist with further drilling programs.
A 2011 budget to complete the recommended work program is presented in Table 17.1.
MDJ/DF/HD/WB | 2CC031_004_Longnose_NI43101_FinalReport_20120124_MDJ_wb_djf_20120127 | January 27, 2012 |
2CC031.004 Cardero Resource Corp. | |
Longnose Project | Page 90 |
Table 17.1: Estimated Cost for the Exploration Program Proposed for the Longnose Project.
Recommendation |
Estimated Cost (US$) |
Mineralogical studies and analytical data | 50,000 |
Metallurgical analysis and testwork | 150,000 |
Preliminary economic assessment analysis | 150,000 |
Geophysical Survey | 30,000 |
Longnose step-out drilling (3-5 holes/900-1500m @ $165/m*) | 200,000 |
Longnose infill drilling (3-5 holes/600-1000m @ $165/m*) | 130,000 |
Acquisition of additional mineral leases/property boundary survey | 40,000 |
TOTAL | 750,000 |
*Drilling cost per meter includes: Site and Trail preparation, drilling, sampling, facility/vehicle lease, and staffing |
MDJ/DF/HD/WB | 2CC031_004_Longnose_NI43101_FinalReport_20120124_MDJ_wb_djf_20120127 | January 27, 2012 |
2CC031.004 Cardero Resource Corp. | |
Longnose Project | Page 91 |
18 |
References |
Bankes, et al, 2003, Estimation of Mineral Resources and Mineral Reserves Best Practice Guidelines for Industrial Minerals., CIM, 7 p.
Bonnichsen, B., 1972, Southern part of the Duluth Complex in Sims, P.K., and Morey, G.B., eds., Geology of Minnesota: A centennial volume, St. Paul, Minnesota Geological Survey, p. 361-387.
Broderick, T.M., 1917, The relation of the titaniferous magnetites of northeastern Minnesota to the Duluth Gabbro, Economic Geology, v. 12, p. 663-696.
Coleraine Minerals Research Laborarory. April 26, 1996. Preliminary, unpublished report by . B. Niles, Research Coordinator. CMRL/TR-96-29. University of Minnesota Duluth, Natural Resources Research Institute, 5013 Miller Trunk Highway, Duluth, Minnesota, 55811.
Coleraine Minerals Research Institute,Pilot Plant Beneficiation Tests of a Bulk Sample of Ilmenite Ore Provided by American Shield Company, December 1994. CMRL/TR-94-15. University of Minnesota Duluth, Natural Resources Research Institute, 5013 Miller Trunk Highway, Duluth, Minnesota, 55811.
Hauck, S.A., Severson, M.J., Zanko, L., Barnes, S.J., Morton, P., Alminas, H., Foord, E.E., and Dahlberg, E.H., 1997, An overview of the geology and oxide, sulfide, and platinum-group element mineralization along the western and northern contacts of the Duluth Complex, in Ojakangas, R.W., Dickas, A.B., and Green, J.C., eds., Middle Proterozoic to Cambrian Rifting, Central North America: Boulder, Colorado, Geological Society of America Special Paper 312.
Henderson, K., Ripke, S., 2011, Longnose ande Titac Iron-Titanium exploration projects, Minnesota, USA, Exploration Results 2010/2011, 43-101 Technical Report, 73 p.
Linscheid, E.K., 1991, The petrography of the Longnose peridotite and its relationship to the Duluth Complex, Duluth, University of Minnesota, Masters thesis, 121 p.
Mainwaring, P.R., and Naldrett, A.J., 1977, Country rock assimilation and genesis of Cu-Ni sulfides in the Water Hen Intrusion, Duluth Complex, Minnesota, Economic Geology, v. 72, 1269-1284.
Muhich, T.G., 1993, Movement of titanium across the Duluth Complex-Biwabik Iron Formation contact at Dunka Pit, Mesabi Iron Range, northeastern Minnesota [M.S. thesis], Duluth, University of Minnesota, 154 p.
Paster, T.P., 1987, Petrography of the Longnose Ilmenite Deposit, Duluth Complex, Minnesota, Westmont Mining Inc., Consultant Report, 36 p.
Patelke, R.L., and Severson, M.J., 2005, A history of Copper-Nickel and Titanium Oxide test pits, bulk samples, and related metallurgical testing in the the Keweenawan Duluth Complex, northeastern Minnesota, Duluth, University of Minnesota, Natural Resources Research Institute, Technical Report NRRI/TR-2005/01, 121 p.
Ross, B.A., 1985, A petrologic study of the Bardon Peak peridotite, Duluth Complex [M.S. thesis], Duluth, University of Minnesota, 140 p.
Schiffries, C.M, 1982, The petrogenesis of a platiniferous dunite pipe in the Bushveld Complex: Infiltration metasomatism by a chloride solution, Economic Geology, v. 77, p. 1439-1453.
MDJ/DF/HD/WB | 2CC031_004_Longnose_NI43101_FinalReport_20120124_MDJ_wb_djf_20120127 | January 27, 2012 |
2CC031.004 Cardero Resource Corp. | |
Longnose Project | Page 92 |
Severson, M.J., 1988, Geology and structure of a portion of the Partridge River Intrusion: A progress report, Duluth, University of Minnesota, Natural Resources Research Institute, Technical Report, NRRI/GMIN-TR-88-08, 78 p.
Severson, M.J., 1991, Geology, mineralization, and geostatistics of the Minnamax/Babbitt Cu-Ni deposit (Local Boy area), Minnesota, Part I: Geology, Duluth, University of Minnesota, Natural Resources Research Institute, Technical Report, NRRI/TR-91/13a, 96 p.
Severson, M.J., 1994, Igneous stratigraphy of the South Kawishiwi Intrusion, Duluth Complex, northeastern Minnesota, Duluth, University of Minnesota, Natural Resources Research Institute, Technical Report, NRRI/TR-93/34, 210 p.
Severson, M.J., 1995, Geology of the southern portion of the Duluth Complex, Duluth, University of Minnesota, Natural Resources Research Institute, Technical Report, NRRI/TR-95/26, 185 p.
Severson, M.J., and Hauck, S.A., 1990, Geology, geochemistry, and stratigraphy of a portion of the Partridge River Intrusion, Duluth, University of Minnesota, Natural Resources Research Institute, Technical Report, NRRI/GMIN-TR-89-11, 230 p.
Severson, M.J., and Hauck, S.A., 2008, Finish logging of Duluth Complex drill core (And a Reinterpretation of the Geology at the Mesaba (Babbitt) deposit), Duluth, University of Minnesota, Natural Resources Research Institute, Technical Report, NRRI/TR-2008/17, 62 p.
Severson, M.J., and Miller, J.D., 1999, Bedrock Geological Map of Allen Quadrangle, Minnesota Geological Survey, Miscellaneous Map Series, Map M-91.
Small, J., 1992, Longnose MN Prospect Summary, BHP Minerals International, Internal Memo, 20 p.
Ulland, W., 2000, The Longnose and associated titanium deposits of Minnesota: a compilation of reports (June 19, 2000): On file at the MDNR, Lands and Minerals Division, Hibbing, Minnesota, 76 p.
Viljoen, M.J., and Scoon, R.N., 1985, Distribution and main geologic features of discordant intrusions of iron-rich ultramafic pegmatite in the Bushveld Complex, Economic Geology, v. 80, p. 1109-1128.
Weather.com, December 20, 2010, http://www.weather.com/outlook/health/fitness/wxclimatology/monthly/USMN0370
Winchell, H.V., 1897, Reputed nickel mines in Minnesota, Engineering Mining Journal, v. 64, p. 578. Westmont Mining, 1990, Westmont Mining Inc.s Minnesota Titanium Project, Westmont Mining Inc., Interval Report, p. 53.
MDJ/DF/HD/WB | 2CC031_004_Longnose_NI43101_FinalReport_20120124_MDJ_wb_djf_20120127 | January 27, 2012 |
2CC031.004 Cardero Resource Corp. | |
Longnose Project | Page 93 |
19 |
Date and Signature Page |
This technical report was written by the following Qualified Persons. The effective date of this technical report is January 19th, 2012.
Qualified Person | Signature | Date |
Michael D. Johnson, P.Geo | original signed | January 27, 2012 |
Darrell J. Farrow, Pr.Sci.Nat. | original signed | January 27, 2012 |
Reviewed by
Original signed | ||
Dr. Wayne Barnett, Pr.Sci.Nat | ||
Project Reviewer |
All data used as source material plus the text, tables, figures, and attachments of this document have been reviewed and prepared in accordance with generally accepted professional engineering and environmental practices.
MDJ/DF/HD/WB | 2CC031_004_Longnose_NI43101_FinalReport_20120124_MDJ_wb_djf_20120127 | January 27, 2012 |
CERTIFICATE OF QUALIFIED PERSON
To accompany the report entitled: Technical Report on the Longnose Ilmenite Project, Minnesota, USA, January 27, 2012 (Technical Report)
I, Michael D. Johnson, residing at 2021 Berkshire Crescent, Coquitlam, BC, V3E 3N5, do hereby certify that:
1) |
I am a Senior Geologist with the firm of SRK Consulting (Canada) Inc. (SRK) with an office at Suite 2200, 1066 West Hastings Street, Vancouver, BC, V6E 3X2; |
|
|
2) |
I am a graduate of the Queens University, Kingston, Ontario in 1996, where I obtained a B.Sc. (H) in Geological Sciences. I have practiced my profession continuously since graduation in April, 1996. I have been employed as a geologist, exploration manager, mine geologist and open pit mine manager. I have extensive experience in resource estimation within many deposit types. I have worked with ultramafic intrusions and related mineral deposits for more than 10 years; |
|
|
3) |
I am a Professional Geoscientist registered with the Association of Professional Engineers and Geoscientists of BC (registration # 34923); |
|
|
4) |
I have personally inspected the property that is the subject of the Technical Report in March 2010; |
|
|
5) |
I have read the definition of qualified person set out in National Instrument 43-101 and certify that by virtue of my education, affiliation to a professional association and past relevant work experience, I fulfill the requirements to be a qualified person for the purposes of National Instrument 43-101; |
|
|
6) |
I am responsible for the preparation of all sections of the Technical Report except Section 11; |
|
|
7) |
I am independent of the issuer as defined in Section 1.5 of National Instrument 43-101; |
|
|
8) |
I have had no prior involvement with the property that is the subject of the Technical Report; |
|
|
9) |
I have read National Instrument 43-101 and the sections of the Technical Report for which I am responsible have been prepared in compliance therewith; |
|
|
10) |
As of the effective date of the Technical Report, to the best of my knowledge, information and belief, the sections of the Report for which I am responsible contain all scientific and technical information that is required to be disclosed to make the portions of the Technical Report for which I am responsible not misleading; |
January 27, 2012 | [signed and sealed] |
Vancouver | Michael D. Johnson, P.Geo. |
Senior Geologist, SRK |
CERTIFICATE OF QUALIFIED PERSON
To accompany the report entitled: Technical Report on the Longnose Ilmenite Project, Minnesota, USA, January 27, 2012
I, Darrell Farrow, residing at 40 4055 Indian River Drive, North Vancouver, Canada, do hereby certify that:
1) |
I am an associate with the firm of SRK Consulting (Canada) Inc. (SRK) with an office at 22nd Floor, 1066 West Hastings Street, Vancouver, BC, Canada; | |
2) |
I am a graduate of the University of Pretoria, Pretoria, South Africa (M.Sc. Geology 1989) and the University of Cape Town, Cape Town, South Africa (B.Sc.(Hons) 1982). I have practiced my profession continuously since graduation and have been employed as a research geochemist for four years, as a geologist at two mining operations over a period of ten years, as a manager of an exploration laboratory for three years, and as a consulting geologist for eleven years; | |
3) |
I am a Professional Natural Scientist in the field of practice of Geological Science, registered as a member of the South African Council for Natural Scientific Professions, South Africa, Reg. No. 400163/07; | |
4) |
I have not personally inspected the Longnose project but have relied on a site visit conducted by Mike Johnson P.Geo., co-author of this technical report in March 2010; | |
5) |
I have read the definition of qualified person set out in National Instrument 43-101 and certify that by virtue of my education, affiliation to a professional association and past relevant work experience, I fulfill the requirements to be a qualified person for the purposes of National Instrument 43-101 and the sections to which I have contributed in this technical report have been prepared in compliance with National Instrument 43-101 and Form 43-101F1; | |
6) |
I as a qualified person am independent of the issuer as defined in Section 1.5 of National Instrument 43-101; | |
7) |
I am a co-author of this report and responsible for section 11; | |
8) |
I have had no prior involvement with the property that is the subject of this Technical Report; | |
9) |
I have read National Instrument 43-101 and confirm that the section of the Technical Report for which I am responsible has been prepared in compliance therewith; | |
10) |
As of the effective date of the Technical Report, to the best of my knowledge, information and belief, the section of the Technical Report for which I am responsible contains all scientific and technical information that is required to be disclosed to make the portions of the Technical Report for which I am responsible not misleading. |
Vancouver | [signed and sealed] |
January, 27, 2012 | Darrell Farrow, M.Sc., Pr.Sci.Nat. |
Technical Report on
the Titac
Ilmenite Exploration Project,
Minnesota, USA
Report Prepared for
Cardero Resource Corp.
Report Prepared by SRK Consulting (Canada)
Inc. |
2CC031.004 Cardero Resources | |
Titac Project NI 43-101 | Page i |
Technical Report on the Titac Ilmenite
Exploration Project, Minnesota, USA
Cardero Resource Corp.
Suite 2300 1177 West Hastings Street
Vancouver,
BC,V6E 2K3
website: www.cardero.com
Tel: +1.604.408.7488
Fax: +1.604.408.7499
SRK Consulting (Canada) Inc.
Suite 2200 1066 West
Hastings Street
Vancouver, BC, V6E 3X2
e-mail: vancouver@srk.com
website: www.srk.com
Tel:
+1.604.681.4196
Fax: + 1.604.687.5532
SRK Project Number 2CC031.004
Effective date: | January 19, 2012 |
Report date: | January 27, 2012 |
Authored by:
|
||
Darrell Farrow, P.Geo. | Mike Johnson, P.Geo. | |
Associate Consultant (Geology) | Senior Consultant (Geology) | |
Peer Reviewed by:
|
||
Wayne Barnett, Pr.Sci.Nat | ||
Principle Consultant (Geology) | ||
____________________ | ||
Cover: Photo of drill support road at Titac (source Cardero) |
DJF_MJ/WB | Titac-NI43-101Rpt (4).docx | January 27, 2012 |
2CC031.004 Cardero Resources | |
Titac Project NI 43-101 | Page 1 |
Important Notice
This report was prepared as a National Instrument 43-101 Technical Report for Cardero Resources Corp. (Cardero or the Company) by SRK Consulting (Canada) Inc. (SRK). The quality of information, conclusions, and estimates contained herein is consistent with the level of effort involved in SRKs services, based on: i) information available at the time of preparation, ii) data supplied by outside sources, and iii) the assumptions, conditions, and qualifications set forth in this report. This report is intended for use by Cardero, subject to the terms and conditions of its contract with SRK and relevant securities legislation. The contract permits Cardero to file this report as a Technical Report with Canadian securities regulatory authorities pursuant to National Instrument 43-101(NI 43-101), Standards of Disclosure for Mineral Projects.
DJF_MJ/WB | Titac-NI43-101Rpt (4).docx | January 27, 2012 |
2CC031.004 Cardero Resources | |
Titac Project NI 43-101 | Page 2 |
Executive Summary
This technical report documents the Mineral Resource estimate for the Titac Project (the Project). It was prepared following the guidelines of the Canadian Securities Administrators National Instrument 43-101 (NI 43-101) and Form 43-101F1, and in conformity with generally accepted CIM Estimation of Mineral Resources and Mineral Reserves Best Practice Guidelines. This report has been written by SRK Consulting (Canada) Inc. (SRK) on behalf of Cardero Resources Corp. (Cardero or the Company).
Property Description and Location
The land making up the Project (Project Area) is located in northeastern Minnesota in St. Louis County, Township 55N, Range 14W, Section 34, and Township 54N, Range 14W, Section 3. The property is approximately centered at: (Coordinate system: Universal Trans Mercator, Zone 15 North, North American 1983 Datum) 568000 m East, 5228000 m North.
The Project Area interests are held by Cardero Iron Ore (USA) Inc. (CIOUS), a wholly owned indirect subsidiary of Cardero, and work on the property is carried on through Cardero Iron Ore Management (USA) Inc., an indirectly wholly owned subsidiary of Cardero. Cardero holds a 100% leasehold interest in the Project Area under a mining lease dated July 1, 2009. The lease is for an initial term of 20 years, subject to extension for up to 20 additional years, and requires annual rental payments until commercial production and thereafter production royalty payments (minimum $200,000/year).
CIOUS has all required licenses, permits and registrations in place to carry out exploration and resource definition drilling. Additional permits will be required in the future to advance to the next stage.
Accessibility, Climate, Local Resources, Infrastructure and Physiography
Topographic relief on the Titac property is generally low, and the surface is flat-laying. Elevations range between 470 m and 490 m above mean sea level. The ground cover is a mixture of Palustrine, forested wetlands (Cowardin classification system), and higher dry forested ground. Overburden, consisting of glacial till, is present and the depth to bedrock is approximately 20 to 30 m (m) from surface.
Accessibility is excellent, with the Project Area located along a paved county highway.
The climate in northeastern Minnesota is mid-continental. Winter conditions usually begin in mid-December and last until mid-March, with frozen ground beginning in late-December to early-January. The spring thaw usually begins in mid-March to late-April, with stable, dry spring-summer-fall conditions occurring from late-April to mid-December.
The population of Aurora, Minnesota (the nearest major population centre) is approximately 1,850, and the nearby city of Hoyt Lakes (5 miles east of Aurora), Minnesota has a population of approximately 2,000 people.
The infrastructure in northeastern Minnesota related to mining activities is excellent, with low cost electricity, railroads, paved state and county highways, international shipping ports, mining professionals, mining vendors, and trained labor all readily available. International shipping ports are located along the north shore of Lake Superior, including Duluth/Superior, Silver Bay, Taconite Harbor, and Two Harbors, with linked rail systems to all.
DJF_MJ/WB | Titac-NI43-101Rpt (4).docx | January 27, 2012 |
2CC031.004 Cardero Resources | |
Titac Project NI 43-101 | Page 3 |
History
Exploration of the Project Area, historically known as Section 34, has been limited, though several exploratory bore holes and geophysical surveys have been completed. Six holes were drilled historically (by United States Steel Corp), and Cardero completed 30 holes in 2010 and 2 holes in 2011. A ground magnetic survey was conducted in the mid-1960s by United States Steel Corp. A small amount of metallurgical testwork was completed by United States Steel Corp. in 1971.
Geological Setting and Mineralization
The Project Area is located within the Superior Province of the Canadian Shield, and is underlain by intrusive rocks generated during the formation of the Midcontinent Rift. Mineralization is hosted by Oxide-bearing Ultramafic Intrusions (OUIs) that intruded into layered series intrusions of the Duluth Complex. OUIs are dominantly composed of coarse-grained to pegmatitic pyroxenite, peridotite, and dunite that contain approximately 15-40% titanium-iron oxide mineralization. Typically, zones of massive and semi-massive oxide are also present throughout the stratigraphy. Locally, some OUIs also contain abundant copper-nickel sulfide mineralization. Most OUIs occur along the western margin of the southern portion of the Duluth Complex, and display numerous shapes (sheet-, funnel, dike- and pipe-like geometries), and inclinations (flat-lying, moderately-dipping, and sub-vertical). The Titac OUIs are geologically interpreted to be late-stage intrusions that cut early Duluth Complex stratigraphy, and are associated with magmatism generated by the 1.1 billion year old Midcontinent Rift system.
The Titac OUls contain disseminated, semi-massive, and massive titanium-iron oxide mineralization, dominantly ilmenite (TiFeO3) and magnetite and titaniferous magnetite (Fe3O4, Fe2TiO4). The Project Area contains at least two mineralized OUIs (Titac North and Titac South). Titac North is at least 450 m thick (open at depth) and has a vertical pipe-like geometry. Titac South is at least 490 m thick, and also has a pipe-like geometry.
Exploration and Drilling
Exploration of the Project Area by CIOUS began in 2010. Reinterpretation of the ground magnetic survey conducted by USSC confirmed the presence of multiple titaniferous-iron oxide-bearing intrusions at the Project Area including two large intrusions referred to as Titac North and Titac South. No bedrock is exposed on the Project Area with the result that bedrock mapping has not been undertaken.
Drilling at the Project Area is complex because of the stratigraphy of the Titac intrusions.
During 2010 and 2011, a total of 11,034.4 m were completed for 32 drill-holes, 8 (2685.3 m) of which were drilled at Titac North and 24 (8349.1 m) at Titac South. The drilling confirmed titanium-iron-oxide mineralization at the Project Area and determined that the Titac property contains at least two intrusions with large zones of titanium-iron-oxide mineralization (Titac North and Titac South). All assay results from the 2010 and 2011 drilling campaigns have been received and are included in this report.
DJF_MJ/WB | Titac-NI43-101Rpt (4).docx | January 27, 2012 |
2CC031.004 Cardero Resources | |
Titac Project NI 43-101 | Page 4 |
Sample Preparation, Analyses and Security
Cardero has utilized a thorough and robust procedure for sampling, sample preparation, analysis and security.
Procedures for core handling, logging, sampling, and sample shipping were well thought out and well implemented. Analysis was completed by ALS, one of the largest commercial laboratories in the world. A robust program of quality assurance and quality control samples was implemented and met or exceeded industry standard procedures. Sample security and chain of custody documentation was maintained throughout the process and was thoroughly reviewed by SRK.
Data Verifications
Exploration data verification for the Project Area has included a site visit by SRK, enforced database structures, analytical quality assurance and quality control samples, independent sampling and assay checking.
SRKs Wayne Barnett, Pri. Sci. Nat. visited the site in July 2009 and Mike Johnson, P. Geo, visited the site in March 2010. During these site visits, SRK verified drill hole locations, drilling, logging and sampling procedures, security and documentation. SRK also collected independent sampling during these site visits and confirmed the TiO2 and Fe2O3 values for two Titac samples.
Cardero utilized an onsite database which validated the data entry process as it was being completed and reduced clerical errors. In addition, Carderos head office checked the data upon import into their main exploration database in order to minimize data errors.
SRK verified 100% of the assay database by downloading these records directly from the commercial laboratory and checking them against the Mineral Resource database.
Cardero completed QA/QC sampling (blanks, standards, duplicates) totalling 1075 samples, equal to 22% of the total samples. SRK has reviewed the QA/QC sample insertion rate and results and found that they indicate that the analytical data should be reliable. However, analytical standards selection and certain standard results should be more carefully scrutinized for future programs.
Mineral Processing and Metallurgical Testing
Metallurgical test work (Davies Tube tests) was completed on two samples from one of the historical drill holes (26002) on the Project Area in 1972.
The historic metallurgical test work indicates a relatively simple processing flow sheet. It would include crushing the material to a selected size and processing the ore by density and then by magnetic properties. The density separation would remove the silicates from the much more dense oxides. The oxides would then be split into a non-magnetic / paramagnetic fraction as well as a magnetic fraction. Magnetite would partition into the magnetic fraction, while the ilmenite would partition into the non-magnetic / paramagnetic fraction. The magnetic fraction could be further upgraded to recover some ilmenite that would partition into that fraction. The ilmenite concentrate could then be sold to an external processing site, or could be processed at a newly created process facility as part of a further beneficiation/added value processing project; however, a potential upgrading facility would have very significant capital costs.
Cardero has completed very limited metallurgical testing at this stage. Recent work includes only Davies Tube tests, used to determine the proportion of magnetic iron commonly associated with magnetite. Significant further metallurgical work is required for the Project if further economic analysis is contemplated.
DJF_MJ/WB | Titac-NI43-101Rpt (4).docx | January 27, 2012 |
2CC031.004 Cardero Resources | |
Titac Project NI 43-101 | Page 5 |
Mineral Resource Estimates
In July 2009, SRK was retained by Cardero to complete a Mineral Resource for the Titac OUI deposits, as well as update the technical report for the project.
SRK utilized Gemcoms Gems version 6.3.1 to complete the Mineral Resource estimation. A comprehensive and validated drill hole database was utilized to complete the analysis. The database includes 32 drill holes, 8 of which were drilled in Titac North and 24 of which were drilled in Titac South. Drilling in Titac North was insufficient for the delineation of mineralized domains and resource estimation. The Mineral Resource presented here only includes Titac South. The estimation process utilized 2837 samples out of the databases 3929 samples for Titac South. A total of 855 specific gravity measurements were utilized to estimate bulk densities.
Three geological domains were modelled for the estimation process. The domains were defined by peridotite or pyroxenite dominated oxide bearing ultramafic rocks. A marginal zone of mixed perdidotite, pyroxenite and country rock was also modelled.
The Titac South resources were estimated using GemsTM (a Gemcom software product) block modeling software in multiple passes in 10 x 10 x 10 m blocks. Grade estimates were based on 1.8 m composited samples. Capping of TiO2 and Fe2O3 assays was not applied in any of the three domains. Ordinary kriging was used to estimate TiO2 and Fe2O3. Inverse distance squared was used to estimate the specific gravity data. Mineral resources were classified in accordance with definitions provided by the Canadian Institute of Mining (CIM) as stipulated in NI43-101. All interpolated blocks were classified as Inferred Mineral Resource.
In order to quantify the Mineral Resources requirement of reasonable prospects of economic extraction, the block model was subjected to conceptual mining limits using an open pit optimization program. The process uses reasonable mining and processing parameters to define a conceptual pit within which the material with reasonable economic prospects should be contained. For the Titac Project optimization runs, it was assumed that all TiO2 is contained in the mineral Ilmenite and no value was associated with the Fe2O3 material in order to avoid double counting of the value associated with iron. Historic metallurgical data indicates that a very high percentage of the TiO2 is contained within ilmenite, with a small component in titaniferous magnetite and silicates.
The Mineral Resource Statement for the Project is presented in Table 1-1 below.
DJF_MJ/WB | Titac-NI43-101Rpt (4).docx | January 27, 2012 |
2CC031.004 Cardero Resources | |
Titac Project NI 43-101 | Page 6 |
Table i: Mineral Resource Statement*, Titac Project, Minnesota, USA, SRK Consulting (Canada) Inc, effective date, January 19, 2012
Category | Estimated Quantity | Estimated Grade | |
TiO2 | Adjusted Fe2O3*** | ||
Mt | % | % | |
Open Pit** | |||
Inferred | 45.1 | 15.0 | 14.74 |
* |
Mineral resources are reported in relation to a conceptual pit shell. Mineral resources are not mineral reserves and do not have demonstrated economic viability. All figures are rounded to reflect the relative accuracy of the estimate. All composites have been capped where appropriate. | |
** |
Open pit mineral resources are reported at a cut-off grade of 8% TiO2. Cut-off grades are based on a price of US$170 per tonne of Ilmenite back calculated to TiO2 and recoveries of 70 percent, without considering revenues from other metals. | |
*** |
Reported Fe2O3 has been lowered to reflect the amount of Fe estimated to be contained in ilmenite based on the assumption that all Ti has been assigned to ilmenite. At this time, accurately quantifying the amount of magnetite contained within this estimate is not possible. |
As stated above, the Mineral Resource has been quantified in terms of TiO2 and Fe2O3, the analytical components captured for assays of titanium and iron. In any potential mining scenario, the Project would produce ilmenite (FeTiO3) and potentially titaniferous magnetite (TiFe2O4) and magnetite (Fe3O4) as a by-product. The Fe2O3 values have been reduced to reflect Fe found within the ilmenite associated with the TiO2, however accurately quantifying magnetite is not possible at this time as further mineralogical work will be needed.
Based on the assumption that all Ti is found within ilmenite, the contained ilmenite metal in the Mineral Resource is summarized in Table 1-2.
Table ii: Summary of Titac Project ilmenite content within the Mineral Resource
Category | Quantity | Ilmenite Grade | Contained Ilmenite |
(FeTiO3) | |||
Mt | % | Mt. | |
Inferred | 45.1 | 28.5 | 12.9 |
Interpretation and Conclusions
Ilmenite and to a lesser extent titaniferous magnetite is used as a source material for titanium used as pigments and as a metal alloy. Rutile is the ideal source material for titanium as it contains nearly twice as much Ti as ilmenite; however, ilmenite is by far the more common source.
Ilmenite is an industrial mineral and there are risks and uncertainties associated with this ilmenite resource, many of which are common to industrial mineral deposits. Industrial minerals have special risks that are not typically associated with precious or base metal mines. Special concerns include mineralogy of material, deleterious elements (such as silica, calcium, magnesium and manganese), and special market factors such as market size or proprietary technology. Because of these and other issues, industrial mineral deposits carry additional risk compared to more common metal products.
Historic metallurgical tests of the Titac material are very limited. Small scale testing indicates that a viable ilmenite concentrate could be created from processing of Titac material, although higher than ideal deleterious element values, such as magnesium, may reduce the potential ilmenite product price. The ilmenite may be sold as a concentrate to an existing ilmenite processor as the deposit is amicable to shipping due to its proximity to rail and a short haul to bulk ports on the western shore of Lake Superior. As well, local beneficiation could be considered, particularly when other nearby OUI bodies are considered for increased scale. The main hurdle to overcome with future exploitation of the Titac deposit revolves around metallurgical optimization to create the highest grade concentrate while reducing potential deleterious element contamination of the concentrate. Further economic analysis of this project is anticipated and should include resolution of the mineralogical, metallurgical and processing issues.
DJF_MJ/WB | Titac-NI43-101Rpt (4).docx | January 27, 2012 |
2CC031.004 Cardero Resources | |
Titac Project NI 43-101 | Page 7 |
Based upon a relatively simple processing flow sheet for ilmenite concentrate, a recent increase in demand for ilmenite and the projects close proximity to other bulk mines and inexpensive shipping routes, SRK believes that the Project meets the criteria for having reasonable prospects of economic extraction.
The mineral resources for Titac South presented in this report represent the first time disclosure of Mineral Resource for the Project Area. Drilling on the Titac North deposit is insufficient for delineation of the deposit and evaluation of a resource for Titac North has not been undertaken.
The Mineral Resource for the Titac South deposit at a cut-off grade of 8% TiO2 includes 45.1 million tonnes at an average grade of 15.0% TiO2. Based on the assumption that all Ti is found within ilmenite, the contained ilmenite in the Mineral Resource includes 12.8 million tonnes at an average grade of 28.5% ilmenite. While not quantified here, the potential for extraction of iron from magnetite exists and would provide an upside to the project. As well, vanadium may be of economic interest, although it has not been significantly analyzed by SRK.
Recommendations
The Project Area is at an early exploration stage and merits additional work. The drilling program conducted in 2010 and 2011 by CIOUS has confirmed strong titanium-iron-oxide mineralization at the Project Area, and determined that the Project Area contains at least two OUIs with large zones of titanium-iron-oxide mineralization (Titac North and Titac South). The Titac South intrusion was extensively drilled by CIOUS in 2010 and 2011, and has been fairly well defined by this drilling. A modest in-fill drilling program is recommended at Titac South to further define contacts with country rock, and to fill-in local gaps within the intrusion. Ore mineral speciation and metallurgical/beneficiation studies, as well as a preliminary economic assessment, should also be conducted SRK recommends the following work and expenditures:
|
An in-fill drilling program consisting of 6 diamond drill holes and ~1,800 m of core is recommended; | |
|
A petrographic and mineral chemistry study of typical oxide and sulfide mineralization present at Titac should be conducted to identify the specific oxide and sulfide minerals present, and their elemental make-up; | |
|
Metallurgical test work in conjunction with the mineralogical studies, to assist with better understanding of ilmenite and magnetite recovery, project economic analysis: 100 kg composite from sample coarse rejects should be collected that represents average TiO2 grades; and | |
|
A preliminary economic assessment should be conducted. |
A 2011 budget is presented to complete the recommended work program:
DJF_MJ/WB | Titac-NI43-101Rpt (4).docx | January 27, 2012 |
2CC031.004 Cardero Resources | |
Titac Project NI 43-101 | Page 8 |
Table iii: Estimated Cost for the Exploration Program Proposed for the Titac Project
Recommendation | Estimated Cost (US$) |
Titac South in-fill drilling (6 holes/1,800 m @ $180/m*) | 324,000 |
Petrographic and mineral chemistry study | 20,000 |
Metallurgical testing | 50,000 |
Preliminary economic assessment study | 100,000 |
TOTAL | 494,000 |
*Drilling cost per metre includes: Site and Trail preparation, drilling, sampling, facility/vehicle-lease, and staffing
DJF_MJ/WB | Titac-NI43-101Rpt (4).docx | January 27, 2012 |
2CC031.004 Cardero Resources | |
Titac Project NI 43-101 | Page 9 |
Table of Contents
DJF_MJ/WB | Titac-NI43-101Rpt (4).docx | January 27, 2012 |
2CC031.004 Cardero Resources | |
Titac Project NI 43-101 | Page 10 |
DJF_MJ/WB | Titac-NI43-101Rpt (4).docx | January 27, 2012 |
2CC031.004 Cardero Resources | |
Titac Project NI 43-101 | Page 11 |
17 | Recommendations | 86 |
18 | References | 87 |
DJF_MJ/WB | Titac-NI43-101Rpt (4).docx | January 27, 2012 |
2CC031.004 Cardero Resources | |
Titac Project NI 43-101 | Page 12 |
List of Tables
List of Figures
DJF_MJ/WB | Titac-NI43-101Rpt (4).docx | January 27, 2012 |
2CC031.004 Cardero Resources | |
Titac Project NI 43-101 | Page 13 |
DJF_MJ/WB | Titac-NI43-101Rpt (4).docx | January 27, 2012 |
2CC031.004 Cardero Resources | |
Titac Project NI 43-101 | Page 14 |
Figure 13.13: Scatter plots showing correlation between OK, ID2 and average composite TiO2 and Fe2O3 sample grades for Mixed Domain | 77 |
Figure 13.14: Grade Tonnage Curves for the Titac Project | 80 |
DJF_MJ/WB | Titac-NI43-101Rpt (4).docx | January 27, 2012 |
2CC031.004 Cardero Resources | |
Titac Project NI 43-101 | Page 15 |
1 |
Introduction and Terms of Reference |
This technical report for the Titac Project (the Project), located in Minnesota, USA, has been prepared for Cardero Resource Corp. (Cardero or the Company). Cardero is a mineral exploration company with corporate headquarters in Vancouver, B.C., Canada, and is listed on the Toronto Stock Exchange and the NYSE-Amex Stock Exchange. The Project interests are held by Cardero Iron Ore (USA) Inc. (CIOUS), a wholly owned indirect subsidiary of Cardero, and work on the Project is carried on through Cardero Iron Ore Management (USA) Inc., an indirectly wholly owned subsidiary of Cardero. | |
This report relies on historical data collected from the Minnesota Department of Natural Resources and other governmental sources, publicly available information, the underlying land owners of the Project and personal communications with geologists and other professionals active in the area. In addition, this report incorporates data from drill testing of the land making up the Project (Project Area) commissioned by Cardero in 2010 and 2011. | |
The Project Area is located in northeastern Minnesota near Aurora (Figure 1.1). It represents one of the numerous oxide ultramafic intrusions (OUI) hosted by the Duluth Complex, which feature strong titaniferous-iron oxide mineralization. Exploration of the property is at an early stage. At the Project Area, 38 diamond drill holes have been completed: six by United States Steel Corp. dating to the late 1960s, and 32 by Cardero in 2010 and 2011. | |
In July 2009, Cardero commissioned SRK Consulting (Canada) Inc. (SRK) to visit the property and prepare a geological and Mineral Resource model for the Project. The services were rendered between July 2009 and January 2012, leading to the preparation of the Mineral Resource Statement, reported herein. | |
This technical report documents a Mineral Resource Statement for the Project prepared by SRK. It was prepared following the guidelines of the Canadian Securities Administrators National Instrument 43-101 (NI 43-101) and Form 43-101F1. The Mineral Resource Statement reported herein was prepared in conformity with generally accepted CIM Estimation of Mineral Resources and Mineral Reserves Best Practice Guidelines. |
1.1 |
Work Program |
The Mineral Resource Statement reported herein is a collaborative effort between Cardero and SRK personnel. The exploration database was compiled and maintained by Cardero, and was audited by SRK. The geological model and outlines for the OUI mineralization were constructed by SRK from drill hole logs provided by Cardero. In the opinion of SRK, the geological model is a reasonable representation of the distribution of the targeted mineralization at the current level of sampling. The geostatistical analysis, variography and grade models were completed by SRK during the months of September and December, 2011. | |
The Mineral Resource Statement reported herein was prepared in conformity with generally accepted CIM Exploration Best Practices and Estimation of Mineral Resource and Mineral Reserves Best Practices guidelines. This technical report was prepared following the guidelines of the Canadian Securities Administrators NI 43-101 and Form 43-101F1. | |
The technical report was assembled in SRK Vancouvers office during January 2012. |
DJF_MJ/WB | Titac-NI43-101Rpt (4).docx | January 27, 2012 |
2CC031.004 Cardero Resources | |
Titac Project NI 43-101 | Page 15 |
1.2 |
Basis of Technical Report |
This report is based on information collected by SRK during a site visit performed between March 12 and March 13, 2010 and on additional information provided by Cardero throughout the course of SRKs investigations. Other information was obtained from the public domain. SRK has no reason to doubt the reliability of the information provided by Cardero. | |
This technical report is based on the following sources of information: |
| Discussions with Cardero personnel; | |
| Inspection of the Project Area, including drill core; | |
| Review of exploration data collected by CIOUS; and | |
| Additional information from public domain sources. |
1.3 |
Qualifications of SRK and SRK Team |
The SRK Group comprises over 1,000 professionals, offering expertise in a wide range of resource engineering disciplines. The SRK Groups independence is ensured by the fact that it holds no equity in any project and that its ownership rests solely with its staff. This fact permits SRK to provide its clients with conflict-free and objective recommendations on crucial judgment issues. SRK has a demonstrated track record in undertaking independent assessments of Mineral Resources and Mineral Reserves, project evaluations and audits, technical reports and independent feasibility evaluations to bankable standards on behalf of exploration and mining companies and financial institutions worldwide. The SRK Group has also worked with a large number of major international mining companies and their projects, providing mining industry consultancy service inputs. | |
The resource evaluation work and the compilation of this technical report was completed by Darrell Farrow, M.Sc., Pr.Sci.Nat., under the supervision of Mike Johnson, P.Geo. By virtue of their education, memberships to recognized professional associations and relevant work experience, Darrell Farrow and Mike Johnson are independent Qualified Persons as this term is defined by NI43-101. | |
Dr. Wayne Barnett, Pr.Sci.Nat, a Principal with SRK, reviewed drafts of this technical report prior to their delivery to Cardero as per SRK internal quality management procedures. Dr. Wayne Barnett visited the project in July 2009. | |
1.4 |
Site Visit |
In accordance with NI 43-101 guidelines, Mike Johnson of SRK visited the Project on March 12 and 13, 2010, accompanied by Chris White, Senior Site geologist for CIOUS. In addition, SRKs Wayne Barnett had previously visited the site in July 2009 accompanied by Carderos Tansy Parsons- OConnor. | |
The purpose of the most recent site visit was to review the digitalization of the exploration database and validation procedures, review exploration procedures, define geological modelling procedures, examine drill core, interview project personnel, and to collect all relevant information for the preparation of a Mineral Resource model and the compilation of a technical report. During the visit, particular attention was given to the procedures being implemented during drilling, logging and sampling. |
DJF_MJ/WB | Titac-NI43-101Rpt (4).docx | January 27, 2012 |
2CC031.004 Cardero Resources | |
Titac Project NI 43-101 | Page 17 |
The site visit was completed while drilling was taking place on the Project. SRK staff was able to observe drilling, surveying, logging, sampling and sample handling, and shipping. | |
SRK was given full access to relevant data and conducted interviews of Cardero/CIOUS personnel to obtain information on the past exploration work, in order to understand procedures used to collect, record, store and analyze historical and current exploration data. | |
1.5 |
Acknowledgement |
SRK would like to acknowledge the support and collaboration provided by Cardero/CIOUS personnel for this assignment, particularly Chris White and Tansy OConnor-Parsons. Their collaboration was greatly appreciated and instrumental to the success of this project. | |
As well, the authors would like to thank SRKs Dr. Gilles Arseneau, P.Geo., Marek Nowak, P.Eng, and Dr. Adrian Dance for their contributions, reviews and advice during analysis and reporting of this Mineral Resource. | |
1.6 |
Declaration |
SRKs opinion, contained herein and effective January 19, 2012, is based on information collected by SRK throughout the course of SRKs investigations, which in turn reflect various technical and economic conditions at the time of writing. Given the nature of the mining business, these conditions can change significantly over relatively short periods of time. Consequently, actual results may be significantly more or less favourable. | |
This report may include technical information that requires subsequent calculations to derive sub- totals, totals and weighted averages. Such calculations inherently involve a degree of rounding and consequently introduce a margin of error. Where these occur, SRK does not consider them to be material. | |
SRK is not an insider, associate or an affiliate of Cardero, and neither SRK nor any affiliate has acted as an advisor to Cardero, its subsidiaries, or its affiliates in connection with the Project. The results of the technical review by SRK are not dependent on any prior agreements concerning the conclusions to be reached, nor are there any undisclosed understandings concerning any future business dealings. |
DJF_MJ/WB | Titac-NI43-101Rpt (4).docx | January 27, 2012 |
2CC031.004 Cardero Resources | |
Titac Project NI 43-101 | Page 18 |
2 |
Reliance on Other Experts |
In preparing this report, SRK has relied on information provided by Cardero for matters pertaining to environmental, socioeconomic, and permitting issues. SRK has not performed an independent verification of land title and tenure as summarized in Section 3 of this report. SRK did not verify the legality of any underlying agreement(s) that may exist concerning the permits or other agreement(s) between third parties, but have relied on preliminary title work carried out by Minnesota counsel to Cardero. | |
SRK was informed by Cardero that there are no known litigations potentially affecting the Project. |
2CC031.004 Cardero Resources | |
Titac Project NI 43-101 | Page 19 |
3 |
Property Description and Location |
The Project Area is located in northeastern Minnesota, near Aurora (Figure 3.1). The Project Area is located in St. Louis County, Township 55N, Range 14W, Section 34, and Township 54N, Range 14W, Section 3. |
(image sourced from the Minnesota Department of Transportation)
Figure 3.1: Location of the Titac property
The Project Area is approximately centered at: (Coordinate system: Universal Trans Mercator, Zone 15 North, North American 1983 Datum) 568,000 m East, 5,228,000 m North. CIOUS has a mineral lease on 1402 acres (567 hectares) at the Project Area.
Properties in Minnesota are defined using the Township and Range, Section, quarter-section, quarter-section, quarter-section method. Sections are marked by corner posts; however, corner posts are not always present. CIOUS has conducted a geographical location survey on the Project Area. This survey mainly focused on locating historical drill collars and the original sampling grid cut baseline. An in-depth property boundary survey has not been completed; however, the property boundaries have been located on aerial photographs (Figure 3.2) .
DJF_MJ/WB | Titac-NI43-101Rpt (4).docx | January 27, 2012 |
2CC031.004 Cardero Resources | |
Titac Project NI 43-101 | Page 20 |
Figure 3.2: Titac Property boundary with drill collar locations | |
Known zones of mineralization at the Project Area are approximately centered at: (Coordinate system: Universal Trans Mercator, Zone 15 North, North American 1983 Datum), 568,130 m East, 5,228,310 m North (Titac North); and 568,000 m East, 5,227,500 m North (Titac South). There have been no commercial mining operations at the Project Area. | |
3.1 |
Mineral Tenure |
Minerals in Minnesota are typically held as fee simple interests; either as part of the overall land estate or as a separate property interest. In many cases, ownership of the mineral estate has been severed from the surface estate, and may be held by a different owner. Although title to the mineral estate is often held by the State of Minnesota or the US Federal government, there are significant areas of private mineral ownership in Minnesota. Thus, there is often split-estate ownership, where the person or entity owning the surface may be, and often is, different than the person or entity that owns the mineral rights. Additionally, mineral rights themselves may also be split (e.g. the hydrocarbon rights owner may be different than the non-hydrocarbon mineral rights owner). United States law indicates that in split-estate situations, mineral rights are the dominant estate and have precedence over all other property rights (including surface). However, the mineral rights owner must have due regard for the surface estate and only occupy/use those portions of the surface that are necessary for mineral development. | |
Land holdings at the Project Area are a split-estate wherein St Louis County (the County) holds the surface rights, and a private mineral owner holds the mineral rights. CIOUS has entered an authorization agreement with the County dated June 11, 2008, pursuant to which CIOUS is authorized, on a non-exclusive basis, to enter upon the surface lands and conduct drilling operations, subject to compliance with applicable laws and the Countys approval of the specific drilling plans of CIOUS. CIOUS pays the County a fixed fee per bore hole drilled, and has agreed to carry out all required reclamation and indemnify, save and hold harmless the County. |
DJF_MJ/WB | Titac-NI43-101Rpt (4).docx | January 27, 2012 |
2CC031.004 Cardero Resources | |
Titac Project NI 43-101 | Page 21 |
3.2 |
Titac Interest |
CIOUS has entered into a mining lease with a private mineral owner over an aggregate of 1,402 acres (567 hectares) of mineral rights located in sections 2 and 3 of Township 54 North and sections 34 and 35 of Township 55 North, all Range 14 West, St. Louis County, Minnesota (Table 1). The mining lease covers any mineral substance of a metalliferous nature, including those intermingled or associated materials or substances, recovered from each tonne of crude ore for the purpose of extracting iron (essentially, iron, titanium and vanadium). All other minerals are reserved to the private mineral owner. | |
The initial term of the mining lease is for a period of 20 years, commencing July 1, 2009, provided that the lease may be extended for an additional 5 year period if CIOUS gives notice at least 180 days prior to the end of such term, and has either paid to the owner at least USD $10,000,000 in royalties or pays to the owner the difference between the royalties actually paid and USD $10,000,000. In like manner, the lease can be extended for up to three additional 5 year terms, provided that the appropriate notice is given and that CIOUS has paid to the owner at least USD $5,000,000 in royalties during the previous 5 year term (or pays any deficiency in cash). CIOUS can terminate the lease at any time on sixty days' notice. CIOUS is required to make a bonus payment of USD $2,500 upon entering into the lease, plus yearly rental payments under the lease of: |
| the greater of USD $2,500 and USD $2/acre in years one and two; | |
| the greater of USD $5,000 and USD $5/acre in years three through five; | |
| the greater of USD $7,500 or USD $10/acre in years six through ten; | |
| the greater of $USD 10,000 or USD $25/acre in years eleven through fifteen; and | |
| the greater of USD $50,000 or USD $50/acre in years sixteen through twenty. |
These rental payments cease upon the commencement of commercial production, following which yearly minimum royalty payments of USD $200,000 apply. Following the commencement of commercial production, CIOUS is required to pay a royalty of USD $0.85 per ton of crude iron ore (adjusted quarterly based on variation in the quoted price of certain iron ore products) and 5% of the net return values (calculated in accordance with the provisions of the lease) for any other products produced (subject to a minimum royalty of USD $0.02 per pound of titanium). CIOUS is required to incur minimum work expenditures of USD $50,000 prior to the second anniversary of the lease, and USD $50,000 per year thereafter (any deficiency being payable in cash to the owner). Up to October 31, 2011, CIOUS had incurred an aggregate of USD $1,802,121 in expenditures and made all of the required rental payments to July 1, 2011.
DJF_MJ/WB | Titac-NI43-101Rpt (4).docx | January 27, 2012 |
2CC031.004 Cardero Resources | |
Titac Project NI 43-101 | Page 22 |
Table 3-1: Mineral Tenure Information
DJF_MJ/WB | Titac-NI43-101Rpt (4).docx | January 27, 2012 |
2CC031.004 Cardero Resources | |
Titac Project NI 43-101 | Page 23 |
3.3 |
Permits and Authorization |
All licenses, permits, and registrations required to conduct exploratory drilling in Minnesota have been obtained by CIOUS, and are up to date. The required licenses, permits, and registrations that CIOUS has obtained are listed below: |
|
Licensed Exploratory Borer with the Minnesota Department of Natural Resources (MDNR); License number: A10-0102 (annual renewal); | |
|
Licensed Explorer Company with the Minnesota Department of Health (MDH); License number 2850 (annual renewal); | |
|
Licensed Explorer Responsible Individual with the Minnesota Department of Health: License number: 2841 (Chris White; lifetime license); | |
|
Permit for drilling in wetlands with the United States Army Corp of Engineers for both properties (Permit expires on August 22, 2011); | |
|
Permit with the St. Louis County highway department to install temporary gravel access points along St. Louis County highway 4 to access specific areas of the Project Area (renewed as required); and | |
|
Storm Water Pollution Prevention Plan Permit (SWPPP) with the Minnesota Pollution Control Agency for each property (permit open until project completion, must notify MPCA upon completion of project for closure of permit). |
3.4 |
Environmental Considerations |
MDH regulations require that CIOUS must file a drill plan with the MDNR and the MDH at least 14 days prior to drilling operations, and the Explorer Responsible Individual must file well abandonment forms with the MDNR and the MDH within 30 days of completing each drill hole, and that exploratory bore holes must be sealed upon completion of drilling in compliance with MDH rules and regulations. Upon filling an initial drill plan CIOUS may begin drilling operations after 14 days, and may revise, or expand the drill plan by notifying the MDNR and MDH within 1 day of executing the new drill plan. MPCA regulations state that any ground disturbance greater than 1 acre requires the development, approval, and institution of a SWPPP. The plan must be drafted by a person, or persons certified by the MPCA, and a certified SWPPP site manager must oversee implementation of the plan, and application of the plan throughout the duration of the project. This plan must be modified as the project progresses to reflect any change in operations that warrant additional or different pollution prevention measures. CIOUSs consulting geologist, Chris White, has obtained the proper certification with the MPCA to draft the SWPP, and to act as the SWPPP site manager; and Warren Johnson, a CIOUS contractor, is a certified SWPPP contractor with the MPCA. Chris White has been retained by CIOUS to oversee the overall and day-to-day project operations, and Warren Johnsons company has been retained to install all drill trails and drill pads at the Project Area. |
DJF_MJ/WB | Titac-NI43-101Rpt (4).docx | January 27, 2012 |
2CC031.004 Cardero Resources | |
Titac Project NI 43-101 | Page 24 |
4 |
Accessibility, Climate, Local Resources, Infrastructure and Physiography |
4.1 |
Accessibility |
Accessibility is excellent, with the Project Area located along a paved county highway. | |
The Project Area is located approximately 24.5 miles (39.4 km) south of Aurora, Minnesota. CIOUS is leasing a large portion of an old school building (Cina Building, 200 S. 2nd St. E., Aurora, MN 55705) in Aurora, Minnesota that serves as a field office, a drill core logging, preparation, and sampling facility, and a drill core, coarse sample, and sample pulp storage facility. | |
To access the Project Area from Aurora, MN: Beginning at the intersection between St. Louis County highway 99 and St. Louis County highway 110, travel south on St. Louis County highway 99 for 11.0 miles (17.7 km). Turn right, traveling west on St. Louis County highway 16 for 2.2 miles (3.5 km). Turn left, traveling south on St. Louis County highway 4 for 16.6 miles (26.7 km) to Marshall Trail. | |
4.2 |
Local Resources and Infrastructure |
The population of Aurora, Minnesota is approximately 1,850, and the nearby city of Hoyt Lakes, Minnesota (5 miles east of Aurora) has a population of approximately 2,000 people. Duluth, Minnesota (pop. 84,419) is located approximately 30 miles (48.3 km) south of the Project Area. Virginia, Minnesota (pop. 8,481) is located approximately 70 miles (112.7 km) west-northwest of the Project Area. | |
Northeastern Minnesota has been supporting mining activities since the Soudan mine opened in 1882. Currently, northeastern Minnesota facilitates six taconite (iron ore) mines located approximately within 100 miles (161 km) west-northwest of the Project Area in the Iron Range of Minnesota in the Virginia, and Hibbing, Minnesota area. When at full production, the taconite (iron ore) mining industry directly employs nearly 4,000 people in northeastern Minnesota. | |
The infrastructure in northeastern Minnesota related to mining activities is excellent with low cost electricity, railroads, paved state and county highways, international shipping ports, mining professionals, mining vendors, and trained labor all readily available. International shipping ports are located along the north shore of Lake Superior including Duluth/Superior, Silver Bay, Taconite Harbor, and Two Harbors with linked rail systems to all. | |
Northeastern Minnesota is easily accessible through air travel with three airports located within 60 miles (96.5 km) of Hoyt Lakes, Minnesota including the Eveleth Virginia Municipal Airport located in Virginia, Minnesota; the Range Regional Airport (RRA), located in Hibbing, Minnesota; and the Duluth International Airport (DIA), located in Duluth, Minnesota. Commercial flights are offered by Delta Airlines at RRA and DIA, and also by Allegiant Air at DIA. The Minneapolis/St. Paul airport is located approximately 200 miles (321.7 km) south of Hoyt Lakes, Minnesota. Connecting flights are available from Minneapolis/St. Paul to both DIA, and RRA. | |
The Laskin Energy Center is located near Hoyt Lakes, Minnesota (less than 25 miles, or 40 km, from the Project Area), providing 110 megawatts of electric service. The DM&IR (Canadian National) railway services the Laskin Energy Park, located next to the Laskin Energy Center. The Laskin Energy Park also provides natural gas, water and waste water, and industrial steam power services. |
DJF_MJ/WB | Titac-NI43-101Rpt (4).docx | January 27, 2012 |
2CC031.004 Cardero Resources | |
Titac Project NI 43-101 | Page 25 |
The Erie plant (formerly owned by LTV Steel Mining Company and currently owned by Polymet Mining Corporation), a large crushing, grinding, and milling facility, is located approximately 14 miles (22.5 km) west-northwest of the Aurora. The Erie plant was built in the 1950s, and processed approximately 100,000 tons of taconite (low-grade iron) ore per day until 2001 when LTV Steel Mining Company filed for bankruptcy. Polymet intends to use the Erie plant to process the copper- nickel-platinum group element ore from its NorthMet deposit, and estimates that the plant will provide 400 full-time jobs. | |
The Steel Dynamics, Inc., Mesabi Nugget plant is located just north of Hoyt Lakes, Minnesota. Mesabi Nugget uses an innovative direct-reduction process to produce pig-iron nuggets. Production began at Mesabi Nugget in December of 2009, and the plant has a capacity to produce 500,000 tonnes of pig-iron nuggets a year. The Mesabi Nugget plant currently provides approximately 90 full- time jobs. | |
4.3 |
Climate |
The climate in northeastern Minnesota is mid-continental. Winter conditions usually begin in mid- December and last until mid-March, with frozen ground beginning in late-December to early-January. The spring thaw usually begins in mid-March to late-April, with stable, dry spring-summer-fall conditions occurring from late-April to mid-December. Table 4.1 below displays the monthly average temperatures and precipitation for the Hoyt Lakes area. |
Table 4.1: Average monthly temperatures and
precipitation for the Hoyt Lakes, Minnesota
area (data from weather.com)
MONTH |
Avg. High Temp (degrees F) |
Avg. Low Temp (degrees F) |
Avg. Precipitation (inches) |
January | 16 | -14 | 0.76 |
February | 24 | -8 | 0.7 |
March | 35 | 6 | 0.99 |
April | 51 | 22 | 1.57 |
May | 65 | 33 | 3.05 |
June | 73 | 43 | 4.49 |
July | 77 | 48 | 4.42 |
August | 75 | 45 | 4.29 |
September | 65 | 36 | 4 |
October | 52 | 26 | 2.9 |
November | 34 | 12 | 1.33 |
December | 20 | -5 | 0.61 |
DJF_MJ/WB | Titac-NI43-101Rpt (4).docx | January 27, 2012 |
2CC031.004 Cardero Resources | |
Titac Project NI 43-101 | Page 26 |
4.4 |
Physiography |
Topographic relief on the Project Area is generally low, and the surface is flat-laying. Elevations range between 470 m and 490 m. The ground cover is a mixture of Palustrine, forested wetlands (Cowardin classification system), and higher dry forested ground (Figure 4.1). Bug creek runs through the Project Area. Overburden, consisting of glacial till composed of pebbles, cobbles, and boulders within a sand and clay matrix, covers much of the property. Depth to bedrock is generally between 20 m and 30 m. |
Figure 4.1: Typical Landscape in the Project Area
DJF_MJ/WB | Titac-NI43-101Rpt (4).docx | January 27, 2012 |
2CC031.004 Cardero Resources | |
Titac Project NI 43-101 | Page 27 |
5 |
History |
Northeastern Minnesota has a strong history of iron and taconite mining, as well as copper, nickel, and platinum group element exploration. Titaniferous iron deposits were first discovered in northeastern Minnesota in the mid to late 1800s in the northern portion of the Duluth Complex. Additional titaniferous iron deposits were discovered in the southern part of the Duluth Complex in the mid to late 1900s during reconnaissance exploration for copper and nickel. | |
5.1 |
Titaniferous Iron Oxide Mineralization in the Duluth Complex |
In 1967 several companies began exploring magnetic anomalies delineated from state geophysical surveys in the southern part of the Duluth Complex. Exploration drilling targeted these magnetic anomalies searching for copper-nickel sulfide mineralization. While copper-nickel sulfide mineralization was intersected in many drill holes, the magnetic anomalies were largely composed of titaniferous-iron oxide mineralization. At the time these intrusions were generally thought to be of little importance, because copper-nickel grades were too low to have economic significance during that time period. However, several titaniferous iron oxide intrusions have been explored in detail. The following summarizes the known history of the Project Area. | |
5.2 |
Titac Property |
Exploration of the Project Area, historically known as Section 34, has been limited, though several exploratory bore holes and geophysical surveys have been completed. United States Steel Corp. (USSC) drilled six holes into the Section 34 OUI following a ground magnetic survey conducted in the mid 1960s by USSC (Figure 5.1). Exploration of Section 34 was part of a larger exploration program in which USSC drilled holes into numerous magnetic anomalies, delineated during state run airborne geophysical surveys, proximal to the western contact of the southern portion of the Duluth Complex. USSC was exploring for copper-nickel sulfides, which were intersected, however, the magnetic anomalies were created by titanium-iron oxide mineralization. Three of the six initial drill holes at Titac (Section 34) intersected strong titanium-iron mineralization throughout their length, while the remaining three holes intersected various apophyges of titanium-iron mineralization (Severson, 1995). To the best of the authors knowledge no other exploration has been conducted at the Project Area (Section 34), until the recent (2010-2011) exploration by CIOUS, in which 32 boreholes were completed at the property. |
DJF_MJ/WB | Titac-NI43-101Rpt (4).docx | January 27, 2012 |
2CC031.004 Cardero Resources | |
Titac Project NI 43-101 | Page 28 |
Figure 5.1: Map showing the locations of historic diamond drill holes on the Titac property | |
5.2.1 |
Historic Titac and OUI Metallurgical Analysis |
Metallurgical test work has been completed on a variety of OUI bodies including the Titac deposit itself. | |
Testwork completed on Titac (then Section 34) was based upon composite samples collected from early drilling completed on Titac North. Tests were limited to Davis Tube testing to determine the fraction weight and chemical character of a magnetic fraction of crushed samples from drill core. Approximately 158 m (520 feet) of drill core was composited into two samples. The samples were crushed to minus 20 mesh and screened into two sizes at 150 mesh. Heavy liquid gravity concentrates were made, with the heavy concentrate further separated into magnetic and non/para- magnetic fractions. | |
Heavy liquid concentrates from these samples averaged 49 % Fe and 27.5 % TiO2 , compared to sample head grades of 42.7 % Fe and 22.5 % TiO2 . Magnetic separation produced a non-mag concentrate of 45-47 % TiO2 (Niles, H.B., 1971). |
DJF_MJ/WB | Titac-NI43-101Rpt (4).docx | January 27, 2012 |
2CC031.004 Cardero Resources | |
Titac Project NI 43-101 | Page 29 |
The results of this work lead H.B. Niles to recommend quantifying the Titac material in order to determine if further testwork was warranted to further refine potential processing characteristics. More detailed testwork was completed on the Longnose OUI deposit, 40km north of Titac. This deposit is of a similar style to the Titac deposit.
Three bulk samples weighing 600 kg, 39 tonnes and 60 tonnes respectively were collected by American Shield Corp throughout the 1990s. The larger samples were collected from outcrop within the western part of the Longnose deposit. A processing flow sheet was developed and the sample was beneficiated by grinding, spiral separation, magnetic concentration, and dry high tension concentration. The first full-scale pilot plant run was made on October 3, 1994. (Coleraine Minerals, 1994).
Results of these larger scale tests indicated that it was possible to scale up creation of an ilmenite concentrate >45 % TiO2 as well as complete further beneficiation that results in a high grade TiO2 product suitable for the pigment market. (CMRL, 1994, 1996).
DJF_MJ/WB | Titac-NI43-101Rpt (4).docx | January 27, 2012 |
2CC031.004 Cardero Resources | |
Titac Project NI 43-101 | Page 30 |
6 |
Geological Setting and Mineralization |
6.1 |
Regional Geology |
The Project Area is located within the Superior Province of the Canadian Shield. The regional basement rocks are composed of Archean granitoid intrusions, metasedimentary rocks, and metavolcanic rocks; and Paleoproterozoic sedimentary rocks. Mafic flows, mafic and felsic intrusives, and related interflow sedimentary rocks cut these basement rocks during the development of the Mesoproterozoic Midcontinent Rift System (MCR). | |
The Midcontinent Rift System stretches from Lake Superior to Iowa (Figure 6.1), and is largely buried by sediments; however MCR bedrock is relatively well exposed in the Lake Superior region. In northeastern Minnesota the MCR is dominantly composed of several groups of rocks including: the North Shore Volcanic Group (NSVG), the Beaver Bay Complex, and the Duluth Complex. The roof zone of the MCR is largely composed of NSVG lava flows, and the Duluth Complex is generally the intrusive equivalent of the NSVG lava flows. |
Figure 6.1: Bouguer Gravity Anomaly shows the Mid Continent Rift
Figure 6.1 shows the Bouger Gravity
Anomaly which extends from Lake Superior through Iowa, USA, (source
eo.umn.edu/mgs/nicegeo/pdfs/boug_grav.pdf)
DJF_MJ/WB | Titac-NI43-101Rpt (4).docx | January 27, 2012 |
2CC031.004 Cardero Resources | |
Titac Project NI 43-101 | Page 31 |
The multiple intrusions of the Duluth Complex occur within an arcing band from Duluth to near the Canadian border that is 270 km long and up to 40 km wide. In terms of areal exposure, it is the second largest mafic intrusive complex on Earth after the Bushveld Complex of South Africa. The Duluth Complex is typically subdivided into four intrusive series based on dominant lithology, general age, and internal structure. In order of relative decreasing age, these series are the felsic series, the early gabbroic series, the anorthositic series, and the layered series (Miller et al., 2002). Field evidence suggests that the layered series intruded into the anorthositic series, however U-Pd dates obtained by Paces and Miller (1993) show that the anorthositic series and the layered series are virtually identical in age. This indicates that the layered series likely intruded into the anorthositic series when it was still quite warm, and possibly semi-molten. The anorthositic series has not been subdivided into individual intrusions; however the layered series has been shown to consist of at least 12 distinct mafic layered intrusions (Miller et al., 2002; Figure 6.2) .
Figure 6.2: Geologic Map of northeastern Minnesota
Figure 6.2 displays the Duluth Complex and associated formations with the layered series intrusions. Lithology codes include: TI Tuscarora intrusion, L1T Lake One Troctolite, WLI Wilder Lake intrusion, SKI South Kawishiwi intrusion, BEI Bald Eagle intrusion, OLI Osier Lake intrusion, GLI Greenwood Lake intrusion, PRI Partridge River intrusion, WMI Western Margin intrusion, BLI Boulder Lake intrusion, DLS Layered Series at Duluth (Miller et al. 2002).
DJF_MJ/WB | Titac-NI43-101Rpt (4).docx | January 27, 2012 |
2CC031.004 Cardero Resources | |
Titac Project NI 43-101 | Page 32 |
6.2 |
Property Geology |
| |
Several layered series intrusions host numerous OUIs in the Duluth Complex, including (from north to south) the Partridge River intrusion, the Western Margin intrusion, and the Boulder Lake intrusion. All known OUIs occur proximal to the western contact of the Duluth Complex in a straight line beginning just south of Babbitt, Minnesota, and ending just north of Duluth, Minnesota. Known OUI intrusions in the Duluth Complex include Section 17, Longear, Longnose, Section 22, Skibo, Water Hen, Section 34 (Titac), Boulder Creek, Boulder Lake North, and Boulder Lake South. Oxide Ultramafic intrusions cut the layered series intrusions, and are generally regarded as late occurring events in the development of the MCR. Geometrically, OUIs have various shapes and sizes including pipe-like, sheet-like, and funnel-like, and their emplacement may be structurally controlled (Severson, 1995). | |
| |
6.3 |
Geology of the Titac Property |
| |
Little was known about the Project Area at the time of CIOUSs acquisition of the property. There is no exposed bedrock on the property, as glacial till covers the area, and only six diamond drill holes had been drilled on the property prior to 2010. Everything that is known about the geology of the property comes from geophysical surveys, six historic diamond drill holes, and 32 holes drilled by CIOUS in 2010 and 2011 (Figure 6.3). | |
| |
A ground magnetic survey conducted by USSC in the 1960s, and re-interpreted for Cardero by Quantec in 2010 demonstrates that the Titac intrusion consists of numerous strongly magnetic intrusions (Figure 6.3). Drill core shows that the Titac intrusion is hosted by troctolite and augite troctolite of the Western Margin intrusion, and that there is also a large fraction of anorthositic rocks, which are likely inclusions, or roof pendants of the anorthositic series within the Western Margin intrusion. |
DJF_MJ/WB | Titac-NI43-101Rpt (4).docx | January 27, 2012 |
2CC031.004 Cardero Resources | |
Titac Project NI 43-101 | Page 33 |
Figure 6.3: Magnetic map of the Project Area
Figure 6.3 shows ground magnetic data re-interpreted 1967 USSC ground geophysical survey, showing survey, showing the Titac North, and Titac South OUIs, as well as the six historic diamond drill holes and 30 Cardero 2010 diamond drill holes on the property, and the location of the cross-sections in figures 7-8 (through Titac South) and 7-9 (through Titac North)
DJF_MJ/WB | Titac-NI43-101Rpt (4).docx | January 27, 2012 |
2CC031.004 Cardero Resources | |
Titac Project NI 43-101 | Page 34 |
There are two large intrusions at Titac, herein referred to as Titac North and Titac South (Figure 6.3), with numerous smaller intrusions to the west and northwest of the two main intrusions. Titac North is approximately 500 m north of Titac South. Titac North is approximately 600 m long, between 180 m and 330 m wide, and is at least 450 m thick (the deepest vertical hole at Titac North measures 275 m in length, and ends in titanium-iron oxide mineralization; however, diamond drill hole TTC-005-2010 was an inclined hole that reached a depth of approximately 450 m. Titac South is approximately 270 m by 260 m in dimension, and is at least 490 m thick (the deepest vertical hole at Titac South measure 488 m in length, and ends in titanium-iron oxide mineralization). None of the remaining intrusions at Titac have been drilled.
The Titac intrusion or intrusions dominantly consist of coarse-grained to pegmatitic pyroxenite and peridotite as defined by the Severson and Hauck (1990) rock classification scheme for Duluth Complex rocks (Figure 6.4), with lesser amounts of medium- to coarse-grained dunite, and numerous zones of massive and semi-massive oxide (45-100% titanium-iron oxide mineralization). Pyroxenite, peridotite, and dunite typically contain 15-35% titanium-iron oxide mineralization. Locally, contacts between the Titac OUI intrusions and the hosting country rock are marked by fine- to medium-grained melatroctolite, which features sub-vertical serpentine veining. Contacts between lithologies within the OUI, or OUIs can be sharp or gradational, however they are usually sharp (cm to m).
Both Titac North and Titac South appear to be vertical pipe-like intrusions, with complex sub-vertical sheet-like, and/or zoned stratigraphies/lithological variations (Figures 6.5 and 6.6) . Both Titac North and Titac South are open at depth.
DJF_MJ/WB | Titac-NI43-101Rpt (4).docx | January 27, 2012 |
2CC031.004 Cardero Resources | |
Titac Project NI 43-101 | Page 35 |
Figure 6.4: Rock classification scheme for Duluth Complex rocks, after Severson and Hauck, 1990
DJF_MJ/WB | Titac-NI43-101Rpt (4).docx | January 27, 2012 |
2CC031.004 Cardero Resources | |
Titac Project NI 43-101 | Page 36 |
Figure 6.5: Schematic cross-section through the Titac Oxide-bearing Ultramafic Intrusion (Titac South)
DJF_MJ/WB | Titac-NI43-101Rpt (4).docx | January 27, 2012 |
2CC031.004 Cardero Resources | |
Titac Project NI 43-101 | Page 37 |
Figure 6.6: Schematic cross-section through the Titac Oxide-bearing Ultramafic Intrusion (Titac North)
6.4 |
Mineralization at Titac |
Titaniferous-iron oxide mineralization at Titac consists of disseminated to net-textured, medium- to course-grained, magnetite and ilmentie with some fraction of titaniferous magnetite. It is quite difficult to tell the difference between titanium-rich mineralization and iron-rich mineralization in hand sample, however the general statement could be made that drill core exhibiting a dark-silvery color is ilmenite-rich, drill core exhibiting a dull-black color is rich in titaniferous magnetite, and drill core exhibiting a shiny-black color is magnetite-rich. Olivine-rich ultramafic rocks (peridotite, feldspathic peridotite, and dunite) host the majority of the titanium-iron oxide mineralization found in the Titac OUI, and will often be net-textured with oxide minerals interstitial to silicates. When mineralization is hosted by olivine-rich ultramafic rocks it is typically medium- to coarse-grained, disseminated to net- textured, and interstitial to silicate minerals. However, when the mineralization is hosted by pyroxenite, the oxide mineralization typically occurs as medium- to coarse-grained clumps or clots up to approximately 5 cm in size (typically 2-4 cm). |
DJF_MJ/WB | Titac-NI43-101Rpt (4).docx | January 27, 2012 |
2CC031.004 Cardero Resources | |
Titac Project NI 43-101 | Page 38 |
The Titac intrusion also contains abundant copper-sulfide mineralization. Up to five modal percent (typically 1-2%) copper-sulfide mineralization has been observed, dominantly consisting of chalcopyrite and bornite. Two distinct types of chalcopyrite seem to be present including a bright, golden, metallic colored chalcopyrite and a second duller, brownish-bronze colored chalcopyrite. Bornite exhibits a deep blue-purple metallic color. Copper sulfides typically occur as medium- to coarse-grained disseminations interstitial to silicates and oxides, but also occur as pegmatitic clots up to approximately 5 cm in size (typically 2-3 cm). Very fine-grained disseminations of pyrrhotite can occur near the contacts of the OUI and the country rock (in both OUI rocks and country rocks), and rarely fine-grained pyrite will fill micro-fractures (<1 to 2 mm thick) within the OUI.
Mineralization at Titac North appears to be vertically continuous, as historic diamond drill hole 26002 was drilled vertically near the center of Titac North (Figure 6.6), and encountered strongly mineralized pyroxenite, and massive and semi-massive oxide throughout its length (~275 m). Mineralization at Titac South also appears to be vertically continuous as CIOUS diamond drill hole TTC-019-2010 was drilled vertically near the center of the Titac South (Figure 6.5) magnetic anomaly, and intersected strongly mineralized pyroxenite, peridotite, and numerous zones of massive and semi-massive oxide throughout its length (approximately 490 m). Titac North and Titac South appear to be somewhat laterally continuous as well, though there does seem to be anorthositic, locally basaltic, rarely sedimentary, and possibly troctolitic inclusions within both intrusions, and the lateral stratigraphy of both intrusions seems to be quite heterogeneous.
DJF_MJ/WB | Titac-NI43-101Rpt (4).docx | January 27, 2012 |
2CC031.004 Cardero Resources | |
Titac Project NI 43-101 | Page 39 |
7 |
Deposit Types |
Titaniferous iron oxide intrusions within the Duluth Complex were first discovered in 1867, approximately coincident with the discovery of the Mesabi Range iron ores (Winchell, 1897). Broderick (1917) was the first to classify the intrusions while working in the northern part of the Duluth Complex, subdividing them into 4 groups: A) inclusions of Gunflint Iron-Formation, B) gabbroic banded segregations, C) irregular late intrusions of titaniferous magnetite, and D) dike-like intrusions of titaniferous magnetite. Severson (1988), and Severson and Hauck (1990) recognized types 3 and 4 while working in the western and southern portions of the Duluth Complex and reclassified them together as OUIs, based on their ultramafic composition, high oxide content, and cross-cutting relationships to the layered series troctolitic intrusions that host them. Hauck et al. (1997) reclassified Brodericks (1917) subdivisions into three general types: Type 1, banded or layered, oxide-rich metasedimentary inclusions in mafic and ultramafic rocks; Type 2, banded or layered oxide segregations (cumulates) in mafic rocks; and Type 3, discordant OUIs with semi- massive to massive oxide zones. The Titac intrusion is classified as Type 3 titaniferous iron oxide intrusion (Hauck et al. 1997) as described below. | |
Type 3 titaniferous iron oxide intrusions in the Duluth Complex are somewhat similar to the ultramafic intrusions of the Bushveld Complex, the Stillwater Complex, and the Rio Jacare Intrusion of Brazil (Hauck et al. 1997). They are typically composed of coarse-grained to pegmatitic, oxide- bearing (>5% to 30% oxide minerals) pyroxenite, peridotite, and dunite, which contain lenses of semi-massive (>30% to 90% oxide minerals) and massive oxide (>90% oxide minerals). OUIs in the Duluth Complex vary in size and shape, but generally seem to occur as sheet-like intrusions (sills), funnel-like intrusions, dike-like intrusions, or pipe-like intrusions. They can be zoned with numerous apophyses around a centralized ultramafic core. When they are zoned, they tend to feature pegmatitic pyroxenite generally surrounding a core of coarse-grained to pegmatitic peridotite and dunite. They appear to be deep-seated and several Duluth Complex OUIs seem to be root-less. Genesis of the Duluth Complex OUIs is speculative and several theories have been proposed as described below: |
1) |
Severson (1988, 1991, and 1994), and Severson and Hauck (1990) suggest that a spatial/empirical relationship between the Duluth Complex OUIs and the Biwabik Iron-Formation exists, and that incorporation of the Biwabik Iron-Formation by the Duluth Complex at the basal contact may have inspired the genesis of the Duluth Complex OUIs. This does not directly explain the high titanium content of the Duluth Complex OUIs however; Muhich (1993) finds that the Biwabik Iron-Formation is locally enriched in titanium proximal to the Duluth Complex basal contact. Muhichs (1993) observations suggest that the Duluth Complex OUIs may be genetically related to the Biwabik Iron-Formation, and may be assimilated inclusions of Biwabik Iron-Formation that have been enriched in titanium and iron from Duluth Complex magmas and fluids. | |
2) |
Severson (1988, 1994) and Severson and Hauck (1990) also suggested, as did Ross (1985) that Duluth Complex OUIs formed by infiltration metasomatism. Infiltration metasomatism calls on the upward streaming of intercumulus fluids that are derived from within a crystallizing cumulus pile, or more simply put, the magma itself. This genesis mechanism has been suggested for the formation of similar ultramafic plugs in the Bushveld Complex (Schiffries, 1982; Viljoen and Scoon, 1985). |
DJF_MJ/WB | Titac-NI43-101Rpt (4).docx | January 27, 2012 |
2CC031.004 Cardero Resources | |
Titac Project NI 43-101 | Page 40 |
3) |
Bonnichsen (1972) and Mainwaring and Naldrett (1977) suggested a magmatic origin for the Duluth Complex OUIs. In this empirical magmatic genesis model, the Duluth Complex OUIs would form from ferrogabbroic magmas, containing an abundance of suspended plagioclase crystals which separate from the magma and rise to the top of the magma chamber due to density contrasts, subsequently leaving the much more dense iron-rich titaniferous ultramafic magma toward the bottom. |
Evidence for all three genesis models exists, thus all three models, or a combination of the three may be accurate in specific instances. Mineralization at Titac appears to be largely intrusive in nature, but also exhibits textures near contacts with country rock that could be metasomatic in nature. It also seems apparent that in some instances Biwabik Iron formation could have influenced mineralization, based on the proximity of some OUIs to Biwabik Iron-Formation country rock. However, not all OUIs in the Duluth Complex show obvious proximity to occurrences of Biwabik Iron-Formation.
DJF_MJ/WB | Titac-NI43-101Rpt (4).docx | January 27, 2012 |
2CC031.004 Cardero Resources | |
Titac Project NI 43-101 | Page 41 |
8 |
Exploration |
Exploration of the Project Area by CIOUS began in the summer of 2010 with field searches for historic drill collars. Benchmark Engineering (Mountain Iron, Minnesota) was contracted to conduct the search with key CIOUS personnel on hand to oversee the work. | |
No bedrock is exposed at the Project Area. Because of this, no bedrock mapping has been completed by CIOUS to date (January 2012). | |
An airborne geophysical survey was conducted by the Minnesota Geological Survey which provided the initial template for early exploration. A ground magnetic survey was conducted by USSC in 1967 on the Project Area and has been obtained by CIOUS. A map of this survey, including the original grid, reading stations, readings, and the collar location for the first drill hole drilled on the property (DDH 26000) was obtained from the archives at the Minnesota Department of Natural Resources office in Hibbing, Minnesota in 2010. This map has been georeferenced based on the drill collar and road locations. The grid and station locations were then converted to m in the Universal Trans Mercator projection, using the North American 1983 datum. The station locations and magnetic readings were then entered into a spreadsheet, and the data was re-interpreted by Quantec Geoscience. The results of this re-interpretation confirmed the presence of multiple titaniferous-iron oxide-bearing intrusions at the Project Area (Figure 8.1) including two large intrusions here referred to as Titac North and Titac South, as well as numerous smaller intrusions to the west and northwest. |
DJF_MJ/WB | Titac-NI43-101Rpt (4).docx | January 27, 2012 |
2CC031.004 Cardero Resources | |
Titac Project NI 43-101 | Page 42 |
Figure 8.1: Re-interpretation of 1967 ground magnetic
data, confirms the presence of multiple
titaniferous-iron oxide-bearing
intrusions at Titac, including the two main intrusions
(Titac North and
Titac South)
DJF_MJ/WB | Titac-NI43-101Rpt (4).docx | January 27, 2012 |
2CC031.004 Cardero Resources | |
Titac Project NI 43-101 | Page 43 |
9 |
Drilling |
CIOUS completed drilling of 32 NQ2 diamond drill holes totaling 11,034.4 m (36,202 feet) on the Project Area between February 2010 and April 2011. Drilling depths were recorded in feet, as is the standard in the US. Drilling was completed by licensed drilling contractor Idea International Drilling Ltd. (Idea). In 2010 Idea conducted drilling operations using four different drill rigs (Atlas Copco CS1000, Atlas Copco Diamec U6, Atlas Copco CT14, and a Sandvik DE130) with two rigs operating at any given point in time. Drill rigs were skid-mounted (with the exception of the Atlas Copco CT14), and maneuvered in the field using Caterpillar D5M and D7G tractors. In 2011 one Morooka mounted drill rig (Boart Longyear LF70) was utilized. Licensed contractor Warren Johnson Excavating was contracted to install all drill trails, drill pads, and entrance/exit points. Trails, pads, and entrance/exit points were installed using a combination of Caterpillar tractors, Caterpillar excavators, and various logging skidders. | |
All drill holes were permanently abandoned per Minnesota Department of Health standards, by setting a plug at least 300 feet below the surface of bedrock and filling the portion of the boring above the plug with neat cement. | |
Down-hole surveys have been completed on all contemporary drill holes. The Idea survey crew conducted down-hole surveys of each respective drill hole following completion of each hole. Down- hole surveys were completed using a Gyro-based tool, with survey readings collected every 20 feet. Data consists of a dip reading in degrees, and easting and northing readings in feet relative to the starting position of the survey. | |
Drill hole locations were recorded at the time of drilling using a hand held Garmin GPS unit with accuracy to +/- 6 m. Because casing was pulled upon completion of each drill hole, a steel fence post was used to mark the location of each hole. A location survey was completed by the Idea survey crew upon completion of drilling operations. Licensed surveyors Northern Lights Surveying and Mapping Inc. (Virginia, Minnesota) were contracted by Idea to place 4-5 location pins on site. Upon installation of these pins Idea surveyed drill hole locations with accuracy to 2/10ths of a foot, recording the easting, northing, and elevation of each drill hole. | |
There are also a number of historic drill holes that have been drilled on the Project Area. Only the drill holes completed prior to approximately 1970 have drill collars that still exist on site. These drill collars have been located and surveyed with a differential GPS. Since approximately 1970, drill casings have been mandated to be removed upon remediation of the drill site, so these drill collars do not exist. Evidence, such as drill pad clearings in the forest, has been found to support the location of many of these historic holes and their drill collar locations are believed to be within 10 m accuracy. | |
Tables 9.1a & b document the technical specifications of all contemporary and historic drilling at the Project Area. |
DJF_MJ/WB | Titac-NI43-101Rpt (4).docx | January 27, 2012 |
2CC031.004 Cardero Resources | |
Titac Project NI 43-101 | Page 44 |
Table 9.1a: Contemporary and historic drilling at the Titac property
TITAC PROPERTY CONTEMPORARY (drilled by Cardero Iron Ore Company Ltd.) | ||||||
DDH# | (Survey) mE | (Survey) mN | Total Depth (ft) | Azimuth | Dip | Total Depth (m) |
TTC-001-2010 | 568033.6 | 5228365 | 756 | Vertical | -90 | 230.4 |
TTC-002-2010 | 568005.9 | 5228444.5 | 685 | Vertical | -90 | 208.8 |
TTC-003-2010 | 567915.6 | 5228321 | 1196 | 130 | -60 | 364.5 |
TTC-004-2010 | 567992.4 | 5228225.1 | 1137 | 73 | -60 | 346.6 |
TTC-005-2010 | 568089.8 | 5228109.2 | 1707 | 0 | -60 | 520.3 |
TTC-006-2010 | 568020.5 | 5228360.1 | 867 | 25 | -75 | 264.3 |
TTC-007-2010 | 568317.8 | 5228222.7 | 1256 | 305 | -60 | 382.8 |
TTC-008-2010 | 568320.2 | 5228220.8 | 1206 | 355 | -60 | 367.6 |
TTC-009-2010 | 567966.7 | 5227486 | 1235 | 55 | -45 | 376.4 |
TTC-010-2010 | 567743.4 | 5227519.3 | 1286 | 90 | -60 | 392 |
TTC-011-2010 | 567965.7 | 5227490.9 | 894 | 115 | -45 | 272.5 |
TTC-012-2010 | 567786.7 | 5227652.2 | 1276 | 130 | -60 | 388.9 |
TTC-013-2010 | 567967.1 | 5227493 | 830 | 125 | -45 | 253 |
TTC-014-2010 | 567933.4 | 5227620 | 1986 | 162 | -60 | 605.3 |
TTC-015-2010 | 567970 | 5227486.2 | 855 | 165 | -45 | 260.6 |
TTC-016-2010N | 567968.9 | 5227488.1 | 895 | 187 | -45 | 272.8 |
TTC-017-2010 | 567928.4 | 5227630.4 | 1047 | 332 | -85 | 319.1 |
TTC-018-2010 | 567961.5 | 5227486 | 865 | 219 | -45 | 263.7 |
TTC-019-2010 | 567976.6 | 5227494 | 1607 | Vertical | -90 | 489.8 |
TTC-020-2010 | 567968.2 | 5227482.8 | 1015 | 6 | -45 | 309.4 |
TTC-021-2010 | 567873 | 5227482.3 | 1227 | 82 | -75 | 374 |
TTC-022-2010 | 567964.5 | 5227489.5 | 1148 | 15 | -65 | 349.9 |
TTC-023-2010 | 567849 | 5227555.2 | 1157 | 128 | -75 | 352.7 |
TTC-024-2010 | 567970 | 5227486.7 | 1258 | 72 | -65 | 383.4 |
TTC-025-2010 | 568083.8 | 5227592.6 | 1258 | 220 | -75 | 383.4 |
TTC-026-2010 | 567965.4 | 5227482.8 | 1258 | 112 | -65 | 383.4 |
TTC-027-2010 | 568081.9 | 5227423.5 | 1258 | 308 | -75 | 383.4 |
TTC-028-2010 | 567966.3 | 5227483.9 | 1207 | 201 | -65 | 367.9 |
TTC-029-2010 | 567964.1 | 5227486.6 | 1097 | 249 | -65 | 334.4 |
TTC-030-2010 | 567964.2 | 5227489.7 | 1057 | 308 | -50 | 322.2 |
TTC-031-2011 | 568025.2 | 5227537.0 | 903 | 341 | -45 | 275.2 |
TTC-032-2011 | 568021.6 | 5227533.9 | 773 | 33 | -51 | 235.6 |
DJF_MJ/WB | Titac-NI43-101Rpt (4).docx | January 27, 2012 |
2CC031.004 Cardero Resources | |
Titac Project NI 43-101 | Page 45 |
Table 9.2b: Contemporary and historic drilling at the Titac property
TITAC PROPERTY HISTORIC (drilled by United States Steel Corporation) | ||||||
DDH# | (Survey) mE | (Survey) mN | Total Depth (ft) | Azimuth | Dip | Total Depth (m) |
26000 | 568539 | 5228590 | 730 | 250 | -46 | 222.5 |
26001 | 567927 | 5227501 | 552 | Vertical | -90 | 168.2 |
26002 | 568100 | 5228342 | 901 | Vertical | 90 | 274.6 |
26003 | 567837 | 5227580 | 466 | Vertical | 90 | 142 |
26007 | 568250 | 5228343 | 587 | Vertical | 90 | 178.9 |
26008 | 568158 | 5228219 | 607 | Vertical | 90 | 185 |
9.1 |
Drilling Results |
| |
There are several OUIs at the Project Area of varying sizes. Only the two main intrusions (Titac North and Titac South) have been drilled, and only Titac South has been extensively drilled (Figures 9.1 and 9.2). The Titac North and Titac South OUIs both appear to be oriented sub-vertically, and appear to have complex igneous stratigraphies. The orientation and complexity of these intrusions have posed specific difficulties with regards for drill planning. | |
| |
Drilling at Titac North in the late 1960s by USSC consists of three vertical holes drilled into the main intrusive intrusion, and a fourth angled hole drilled to the northeast of the main intrusion (Table 9.1). Strong titanium-iron oxide mineralization was intercepted in all three vertical holes drilled by USSC, while the fourth angled hole largely missed mineralization. CIOUS drilled a total of eight holes at Titac North in 2010. The first two holes (TTC-001-2010 and TTC-002-2010; Table 9.1) were vertical and largely missed mineralization, while the remaining six holes (TTC-003-2010 through TTC-008- 2010; Table 9.1) were angled and all intercepted strong titanium-iron oxide mineralization to varying degrees of success. Ground cover at Titac North is largely swamp land, and an early spring break- up in 2010 hampered drilling efforts by CIOUS, and forced drilling efforts to Titac South. | |
| |
Two holes were drilled at Titac South by USSC in the late 1960s, both holes are vertical, and both holes intercepted thick intervals of strong titanium-iron oxide mineralization. Twenty-two holes in 2010 and two holes in 2011 were drilled at Titac South by CIOUS. Every hole at Titac South intercepted thick intervals of strong titanium-iron oxide mineralization. Given the sub-vertical orientation, and sheet-like or ring-like stratigraphy of the intrusion, the drill plan at Titac South featured a central fan or (inverted) funnel-like pattern of inside-out drill holes with various azimuths and dips (TTC-009,-011,-013,-015,-016,-018,-020,-022,-024,-026,-028,-029,-030-2010; Table 9.1). Numerous holes were also drilled outside-in toward the center of the intrusion (TTC-010,-012,- 014,-017,-021,-023,-025,-027-2010; Table 9.1). Drill hole density is good at Titac South, with a first round of holes drilled with a dip of -45 degrees (°)from the fan-site, and a second round of holes drilled with a dip of -65° from the fan-site. Holes drilled from the outside-in feature a similar pattern of dips. A vertical hole (TTC-019-2010) was also drilled at the fan-site to a depth of 490 m. Because of the sub-vertical orientation, and complex igneous stratigraphy at both Titac North and Titac South, the true thickness of specific mineralization intervals is not known, though the size and grade of both intrusions can be determined by three-dimensional modeling. | |
| |
Historical assays from the six holes drilled by USSC were favorable enough to lead Cardero to acquisition of the Project Area, however, re-assaying of historic core from the Project Area has not been conducted. Historical assays were not used in the estimation of the resource. |
DJF_MJ/WB | Titac-NI43-101Rpt (4).docx | January 27, 2012 |
2CC031.004 Cardero Resources | |
Titac Project NI 43-101 | Page 46 |
Figure 9.1: Titac North drill holes
Figure 9.2: Titac South drill holes
DJF_MJ/WB | Titac-NI43-101Rpt (4).docx | January 27, 2012 |
2CC031.004 Cardero Resources | |
Titac Project NI 43-101 | Page 47 |
10 |
Sample Preparation, Analyses, and Security |
10.1 |
Sampling Method and Approach |
All samples collected by CIOUS for analysis are from drill core. Drill core sampling is typically continuous through the length of each drill hole, except where drill core is obviously not mineralized. There are no sample biases, and samples are representative of the mineralization found. The rocks are intrusive and competent, typically with limited, localized fracturing. Drill core recovery averages 92.3% and rock quality is typically good. | |
10.2 |
Drill Core and Sample Interval Preparation |
Drill core is logged lithologically as it is drilled, and then stored in original cardboard boxes (10 feet per box) on pallets until additional analysis of core can be performed. As time permits, data is collected on core regarding rock quality, core recovery, magnetic susceptibility, and specific gravity. Sample intervals are then set-up, and all drill core is photographed. All drill core from the 2010 and 2011 drilling programs has been logged and sampled, and all sample results from the 2010 and 2011 drill core sampling campaign are complete. Lithology logging and collection of other data from drill core is done per standard industry practices as follows: | |
Lithology log | |
Lithology intervals are recorded in feet based on run blocks inserted at the time of drilling. Specific data is collected on rock type, texture, grain-size, lithology contacts, modal mineralogy, structures, oxide mineralization, sulfide mineralization, and alteration. | |
Rock quality/Core recovery | |
Intervals are recorded in feet based on run blocks inserted at the time of drilling. Actual lengths of intervals are measured and recorded in inches. The sum of all pieces of core greater than 4 inches is recorded, and total fractures per interval are recorded. RQD for each interval is determined by dividing the sum greater than 4 inches by the actual total inches of core recorded, and multiplying by 100. | |
Magnetic Susceptibility | |
Magnetic susceptibility data is collected on all drill core using a SAIC Exploranium KT-9 magnetic susceptibility meter. Five readings are collected for each core interval so that a reading is collected at least every 2 feet. | |
Specific Gravity | |
Specific gravity measurements are collected approximately every 20 feet. Core pieces measuring approximately 4-5 inches are weighed first in air (grams), and then in water (grams), using a manual balance and custom built work station. | |
Core photography | |
All drill core is photographed using a Sony Cyber-shot digital camera, typically with two core boxes per photo. All pictures are labeled as follows: DDH Box # (#-#). |
DJF_MJ/WB | Titac-NI43-101Rpt (4).docx | January 27, 2012 |
2CC031.004 Cardero Resources | |
Titac Project NI 43-101 | Page 48 |
Sample intervals |
|
All sample intervals are determined by visual inspection of drill core, generally based on a visual estimation of oxide and sulfide mineralization. Attempts are made to not cross lithology boundaries within sample intervals; however given the intrusive, locally lithologically heterogeneous nature of drill core this is not always possible. Drill core is pieced together and a line is drawn parallel to the long axis of all drill core to be sampled. Sample intervals range in length from 0.2 m to approximately 2.5 m, with most sample intervals from 1.5-2.0 m in length. Sample tags are stapled into boxes, and sample identification numbers are written on core for future reference. Sample intervals are recorded, noting the type of sample (i.e. core, ¼ core original, ¼ core duplicate, prep duplicate, standard, or blank), and the general lithology of the sample. |
|
10.3 |
Sample Collection and Preparation |
Samples are collected by sawing core in half along the line drawn parallel to the long axis of core with a diamond tipped blade. The core cutting saw is cleaned at the end of each day, or after 400 feet of core has been cut (whichever is earlier), and the saw is filled with clean water at the time of cleaning. The left half of drill core is kept and remains in the original cardboard boxes, which are securely stored at CIOUS’s field office in Aurora, Minnesota. The right half of core is collected and packaged in clear poly bags, along with a sample tag designating the sample identification number. Bags are labeled in black permanent marker with the corresponding sample identification number and a zip tie is used to close each poly bag. The weight of each sample is then recorded (in grams). Poly bags are packaged in white sand bags (typically five samples per sand bag). Each sand bag is labeled with the sample identification numbers that it contains, and the batch number that the samples belong to. Sand bags are first secured with a standard zip tie, and then a second individually numbered zip tie is placed over the standard zip tie for security. The security number is recorded along with the sample numbers that it represents. The sand bags are then transferred to a standard shipping pallet (generally 10-15 sand bags per pallet). The pallets are shrink wrapped, and labeled with the sample batch numbers. Generally, each drill hole is given a unique sample batch number. |
DJF_MJ/WB | Titac-NI43-101Rpt (4).docx | January 27, 2012 |
2CC031.004 Cardero Resources | |
Titac Project NI 43-101 | Page 49 |
10.4 |
Sample Preparation, Analyses and Security |
| |
Sample preparation of drill core is conducted at the CIOUS facility in Aurora, Minnesota by persons under contract with CIOUS to carry out the exploration, drilling, and sampling programs. | |
| |
10.5 |
Sample Analysis |
| |
Samples are prepared for assay analysis by ALS Laboratory Group (ALS) at their Thunder Bay, Ontario facility. The laboratory prepares samples for assay using code prep-31, in which samples are crushed, and 250 grams of material from each sample is split off and pulverized so that better than 85% pass through 75 micron mesh. Samples are dried if necessary using code DRY-21. The sample pulp is then shipped to the ALS facility in Vancouver, British Columbia, Canada for assay, while the coarse sample is put in temporary storage at ALS in Thunder Bay (and eventually shipped back to CIOUSs field office in Aurora, Minnesota). | |
| |
ALS Laboratory Group laboratories are ISO 17025 certified. The ALS laboratory used for sample preparation is located at 1160 Commerce Street, Thunder Bay, Ontario, Canada P7E 6EP. The ALS laboratory used for sample analysis is located at 2103 Dollarton Hwy, North Vancouver, British Columbia, Canada V7H 0A7. | |
| |
A whole rock analysis (code: ME-ICP06) is conducted on samples, and base metals are analyzed using code ME-4ACD81. Sample analysis method ME-ICP06 returns results for all major oxides from 0.01-100% as displayed in Table 10.1, and sample analysis method ME-4ACD81 returns results for base metals as listed in Table 10.2. Numerous samples have also been analyzed for rare earth and trace elements by ALS using sample method ME-MS81. The elements and respective ranges for sample method MA-MS81 are displayed in Table 10.3. |
Table 10.1: Analytes and Ranges of ALS Laboratory Group sample analysis method ME-ICP06.
Analyte | Range (%) | Analyte | Range (%) | Analyte | Range (%) |
SiO2 | 0.01-100 | Na2O | 0.01-100 | P2O5 | 0.01-100 |
Al2O3 | 0.01-100 | K2O | 0.01-100 | SrO | 0.01-100 |
Fe2O3 | 0.01-100 | Cr2O3 | 0.01-100 | BaO | 0.01-100 |
CaO | 0.01-100 | TiO2 | 0.01-100 | LOI | 0.01-100 |
MgO | 0.01-100 | MnO | 0.01-100 |
Table 10.2: Analytes and Ranges of ALS Laboratory Group sample analysis method ME-4ACD81.
Analyte | Range (ppm) | Analyte | Range (ppm) | Analyte | Range (ppm) |
Ag | 0.5-100 | Cu | 1-10,000 | Ni | 1-10,000 |
As | 5-10,000 | Hg | 1-10,000 | Pb | 2-10,000 |
Cd | 0.5-1,000 | Mo | 1-10,000 | Zn | 2-10,000 |
Co | 1-10,000 |
DJF_MJ/WB | Titac-NI43-101Rpt (4).docx | January 27, 2012 |
2CC031.004 Cardero Resources | |
Titac Project NI 43-101 | Page 50 |
Table 10.3: Analytes and Ranges of ALS Laboratory Group sample analysis method ME-MS81.
Analyte | Range (ppm) | Analyte | Range (ppm) | Analyte | Range (ppm) |
Ag | 1-1,000 | Ho | 0.01-1,000 | Ta | 0.1-10,000 |
Ba | 0.5-10,000 | La | 0.5-10,000 | Tb | 0.01-1,000 |
Ce | 0.5-10,000 | Lu | 0.01-1,000 | Th | 0.05-1,000 |
Co | 0.5-10,000 | Mo | 2-10,000 | Tl | 0.5-1,000 |
Cr | 10-10,000 | Nb | 0.2-10,000 | Tm | 0.01-1,000 |
Cs | 0.01-10,000 | Nd | 0.1-10,000 | U | 0.05-1,000 |
Cu | 5-10,000 | Ni | 5-10,000 | V | 5-10,000 |
Dy | 0.05-1,000 | Pb | 5-10,000 | W | 1-10,000 |
Er | 0.03-1,000 | Pr | 0.03-1,000 | Y | 0.5-10,000 |
Eu | 0.03-1,000 | Rb | 0.2-10,000 | Yb | 0.03-1,000 |
Ga | 0.1-1,000 | Sm | 0.03-1,000 | Zn | 5-10,000 |
Gd | 0.05-1,000 | Sn | 1-10,000 | Zr | 2-10,000 |
Hf | 0.2-10,000 | Sr | 0.1-10,000 |
Copper analyses that return values greater than the detection limits (>10,000 ppm) of sample method ME-4ACD81 are re-analyzed by ALS using sample method Cu-OG62, which has detection limits of 0.01-40%. | |
10.6 |
Sample Security |
Drill core is retrieved from drill sites on a daily basis by CIOUS staff, and delivered directly to the CIOUS field office in Aurora, Minnesota. Drill core is stored on-site at the field office until sampling can be conducted by CIOUS personnel. The CIOUS field office is locked at night and when personnel are not present at the facility and the local Aurora police force regularly patrol the area. There are no issues regarding drill core security. | |
Upon collection of samples they are packaged as described above and shipped via chartered and bonded independent carrier Valley Carthage Transport and Manitoulin Transport for customs brokerage to ALS Laboratory Group Laboratories in Thunder Bay, Ontario, Canada. There have been no reported incidents regarding the individually numbered security zip ties placed on each sand bag, and thus there are no issues regarding the security of sample shipment. | |
There were no issues regarding drill core or sample security. | |
10.7 |
Quality Assurance and Quality Control Programs |
CIOUS has instituted extensive quality assurance/quality control (QA/QC) procedures to ensure the integrity of sample analyses. The QA/QC procedures followed for all drill core sampling conducted by CIOUS at the Project are outlined in Figure 10.1. |
DJF_MJ/WB | Titac-NI43-101Rpt (4).docx | January 27, 2012 |
2CC031.004 Cardero Resources | |
Titac Project NI 43-101 | Page 51 |
Figure 10.1: Quality Control/Quality Assurance
procedures instituted by Cardero for all drill
core sampled from the
Longnose property
Field duplicates (FDUP) in this case refer to ¼ core duplicates of the same sampling interval. A preparation duplicate (CDUP) consists of a poly bag containing only a sample tag with instructions for laboratory personnel to prepare the sample from the preceding standard drill core analysis by taking a split after the coarse crushing stage.
Three different reference materials were used in the sampling program at Titac. TTC-1 and LNC-1, which are in-house reference materials created by Cardero; and SX67-05 which is a certified reference materials manufactured for Brammer Standard Company, Inc. (14603 Benfer Road, Houston, Texas 77069, United States of America) by accredited laboratory Dillinger Hutte Laboratory (GAZ; Association for the Accreditation and Certification GmbH, Attestation no. 91021).
Blank material is collected locally in Minnesota from bedrock outcroppings of the Pokegama quartzite near Virginia, Minnesota. Pokegama quartzite is a suitable blank reference because it is dominantly composed of SiO2.
DJF_MJ/WB | Titac-NI43-101Rpt (4).docx | January 27, 2012 |
2CC031.004 Cardero Resources | |
Titac Project NI 43-101 | Page 52 |
10.8 |
SRK Comments |
In the opinion of SRK the sampling preparation, security and analytical procedures used by CIOUS are consistent with generally accepted industry best practices and are therefore adequate. |
DJF_MJ/WB | Titac-NI43-101Rpt (4).docx | January 27, 2012 |
2CC031.004 Cardero Resources | |
Titac Project NI 43-101 | Page 53 |
11 |
Data Verification |
| |
11.1 |
Quality Control Results |
| |
Quality control samples (duplicates, blanks and standards) are used to monitor laboratory sample preparation, potential for contamination and analytical accuracy. | |
| |
A total of 308 reference materials and 146 Pokegama quartzite blank samples were submitted blindly to the laboratory during the core sampling campaign at Titac in 2010 and 2011. A total of 316 quarter core duplicate pairs were collected and submitted to the laboratory and 305 preparation duplicate pairs were prepared by the laboratory. Only the quarter core duplicates were blind to the laboratory. All analytical data including quality control samples were checked and verified by Carderos senior geochemist, Tansy OConnor-Parsons and reviewed by SRK. | |
| |
Coarse blank samples (Figure 11.1) show a slightly higher than background value for TiO2 , indicating that the blank is not devoid of titanium. SRK normally compares the blank data to five times the detection limit, in this case a value of 0.05 % TiO2 however this blank has an average TiO2 value 10 times the detection limit. When the individual values are compared to a low baseline value of 0.1% TiO2 the blank sample results indicate low-level carryover contamination during the preparation through to analytical stage. |
Figure 11.1: Blank analytical results over time for Pokegama Quartzite Blank samples submitted with Titac deposit samples
Scatter plots, percent relative difference plots and percentile rank charts for quarter-core duplicate titanium data are presented in Figures 11.2, 11.3 and 11.4 respectively. Good correlation is seen between quarter-core duplicate samples with 94% of duplicate pairs having a half absolute relative difference of less than 10%.
DJF_MJ/WB | Titac-NI43-101Rpt (4).docx | January 27, 2012 |
2CC031.004 Cardero Resources | |
Titac Project NI 43-101 | Page 54 |
Figure 11.2: Scatterplot graph of TiO2 data for quarter core field duplicates for the Titac Project
Figure 11.3: Half Relative Deviation Plot of TiO2 data for quarter core field duplicates for the Titac Project
DJF_MJ/WB | Titac-NI43-101Rpt (4).docx | January 27, 2012 |
2CC031.004 Cardero Resources | |
Titac Project NI 43-101 | Page 55 |
Figure 11.4: Ranked Half Absolute Relative Deviation Plot of TiO2 data for quarter core field duplicates for the Titac Project
Scatter plots, percent relative difference plots and percentile rank charts for preparation duplicate titanium data are presented in Figures 11.5, 11.6 and 11.7 respectively. Excellent correlation is seen between preparation duplicate samples with 97.7% of duplicate pairs having a half absolute relative difference of less than 10%.
Figure 11.5:Scatterplot graph of TiO2 data for preparation duplicates for the Titac Project
DJF_MJ/WB | Titac-NI43-101Rpt (4).docx | January 27, 2012 |
2CC031.004 Cardero Resources | |
Titac Project NI 43-101 | Page 56 |
Figure 11.6: Half Relative Deviation Plot of TiO2 data for preparation duplicates for the Titac Project
Figure 11.7: Ranked Half Absolute Relative Deviation Plot of TiO2 data for preparation duplicates for the Titac Project
DJF_MJ/WB | Titac-NI43-101Rpt (4).docx | January 27, 2012 |
2CC031.004 Cardero Resources | |
Titac Project NI 43-101 | Page 57 |
Two internal reference materials (LNC-1 and TTC-1) and one commercial standard reference material (SX67-05) were utilized by CIOUS. Reference material results are plotted against their known TiO2 concentration with tolerance levels within 10% (Figures 11.8, 11.9 and 11.10) .
A number of results for LNC-1 reported TiO2 values similar to the average TiO2 value for internal reference material TTC-1. The corresponding Fe2O3 values reported for these samples were also representative of the expected Fe2O3 values for TTC-1. In these cases, the reference materials have been mislabelled. One result for LNC-1 is clearly more in line with a blank sample, again a case of mislabelling of control samples. TTC-1 shows a slightly high bias and relatively large scatter. A slight negative bias for some SX6705 samples were noted at the beginning of the program, however re-analysis of the reference material and surrounding samples resulted in comparable results.
Figure 11.8: Internal reference material LNC-1 performance for TiO2
DJF_MJ/WB | Titac-NI43-101Rpt (4).docx | January 27, 2012 |
2CC031.004 Cardero Resources | |
Titac Project NI 43-101 | Page 58 |
Figure 11.9: Internal reference material TTC-1 performance for TiO2
Figure 11.10: Standard reference material SX67-05 performance for TiO2
To monitor the analytical accuracy of the laboratory, umpire/check assays were submitted to a second laboratory (Acme Analytical Laboratories in Vancouver, BC) where the sample pulps were analysed by the 4A04 package (lithium metaborate fusion/ICP-ES finish). All 303 samples from a single drill hole (TTC-019) were submitted for the umpire assay, as the drill hole intersected all levels of ferro-titanium mineralization. The results for TiO2 and Fe2O3 are presented in Figure 11.11. The data correlate very well for both analytes, however there is a slight low bias at the concentrations of > 27% TiO2 for the data from the ALS Minerals laboratory. This is not considered to be significant, as the data is within 10% analytical precision.
DJF_MJ/WB | Titac-NI43-101Rpt (4).docx | January 27, 2012 |
2CC031.004 Cardero Resources | |
Titac Project NI 43-101 | Page 59 |
Figure 11.8: Scatterplots presenting analytical umpire
(check) assays versus original assay
results for Fe2O3 (left) and TiO2 (right)
data
SRK has reviewed the results of all QA/QC samples. Duplicate and umpire analysis performed very well and blank samples performed adequately. The results of analytical standards are less ideal. Both internal standard results showed a large amount of scatter and standard TTC-1 showed a slight high bias. In addition, CIOUS did not complete full round robin testing on the standards, making them difficult to properly use as a reference. CIOUS should more carefully scrutinize analytical standards selection and standard results for future programs. If internal reference materials are to be used, these should be submitted to various laboratories to establish an average value and standard deviation for these materials. | |
In the opinion of SRK the results of the analytical QA/QC program used by CIOUS provide sufficient support that the analytical data is viable to support the exploration analysis and the Mineral Resource. | |
11.2 |
Veerifications by Cardero |
Cardero completed several processes to verify the exploration data that has been captured at the Project. | |
Firstly, all exploration data was entered into a database which provided a level of data checking to ensure that errors are minimized. This includes standardized naming conventions and limits on field entries. | |
Secondly, all paper records logging records were retained by Cardero and spot checks were made by Cardero head office staff to ensure that the database accurately reflected the data captured. Data from the site database is backed up weekly to Carderos Vancouver office server. | |
11.3 |
Veerifications by SRK |
SRK completed a series of verifications to ensure that the exploration data is reliable enough for the creation of the Mineral Resource. These verifications included the site visits review of field procedures, reviewing analytical quality control data, independent sampling and independent verification of the assay results. |
DJF_MJ/WB | Titac-NI43-101Rpt (4).docx | January 27, 2012 |
2CC031.004 Cardero Resources | |
Titac Project NI 43-101 | Page 60 |
11.3.1 |
Site Visit |
During the site visit completed on March 12 and 13 2010, SRK was able to verify: |
| Exploration planning; | |
| Selection of drill hole sites; | |
| Mobilization of drill rigs; | |
| Drilling processes and drill rig core handling; | |
| Down-hole surveying; | |
| Collar site marking and surveying; | |
| Core logging; | |
| Core sampling; | |
| Sample QA/QC insertion; | |
| Sample shipping and security; and | |
| Data capture and backup. |
In the opinion of SRK the site procedures used by CIOUS are consistent with generally accepted industry best practices and are therefore adequate. | |
11.3.2 |
Verifications of Analytical Quality Control Data |
Table 11.1 summarizes CIOUSs insertion rate for analytical QA/QC samples. |
Table 11.1: Summary of Analytical Quality Control Data Produced By Cardero on the Project, 2010/11
Quality Control Samples |
Drilling and Sampling Programs |
Percent of Samples (%) |
Comment |
Sample Count | 4943 | ||
Field Blanks | 146 | 3.0% | Locally derived quartzite material |
Standards | 308 | 6.2% | |
TTC-1 | 154 | 3.1% | Internal Cardero reference material |
LNC-1 | 138 | 2.8% | Internal Cardero reference material |
SX67-05 | 16 | 0.3% | Certified Commercial Standard, Brammer |
Field Duplicates | 316 | 6.4% | Quarter Core |
Preparation Duplicates | 305 | 6.2% | Split of course crush |
Total QC Samples | 5421 | 109.7% |
11.3.3 |
Independent Verification Sampling |
During the SRK site visits, two independent verification samples were collected from the Titac deposit and sent to ALS for processing. The results are shown in Table 11-2. Even though only two samples were collected, the samples showed very good correlation between the original Cardero TiO2 and Fe2O3 assays, and the independent duplicate results. |
DJF_MJ/WB | Titac-NI43-101Rpt (4).docx | January 27, 2012 |
2CC031.004 Cardero Resources | |
Titac Project NI 43-101 | Page 61 |
Table 11.2: Assay Results for Verification Samples Collected SRK on the Titac Project
Hole ID |
From (m) |
To (m) |
Original TiO2 (%) |
SRK Duplicate TiO2 (%) |
Original Fe2O3 (%) |
SRK Duplicate Fe2O3 (%) |
TTC-003-2010 | 35.36 | 36.88 | 11.4 | 12.05 | 38.5 | 38.6 |
TTC-003-2010 | 36.88 | 38.41 | 13.25 | 14.55 | 44.4 | 43.4 |
11.3.4 |
Independent Assay Verification |
SRK independently verified a hundred percent of the assay results by downloading the assay certificates directly from the laboratory and comparing the compiled results in an Access database. SRK found no errors in the TiO2 and Fe2 O3 analytical data. |
DJF_MJ/WB | Titac-NI43-101Rpt (4).docx | January 27, 2012 |
2CC031.004 Cardero Resources | |
Titac Project NI 43-101 | Page 62 |
12 |
Mineral Processing and Metallurgical Testing |
Relatively little metallurgical test work has been completed on the Titac deposits. What has been completed can be divided into historic work completed before Carderos involvement in the property and current work completed more recently by Cardero. | |
Historically, significant amounts of historical beneficiation work was completed on other OUI deposits such as Longnose deposit, another OUI body 40k north of Titac. This work was largely conducted by the Coleraine Minerals Research Lab (CMRL) which is part of the University of Minnesota Duluths (UMDs) Natural Resources Research Institute (NRRI), located in Coleraine, Minnesota, USA. The work pre-dates the NI 43-101 standards however the work was completed to high standards and will be useful in designing the future beneficiation work. | |
A description of the historic metallurgical work is contained within Section 5. |
12.1 | Recent Metallurgical Testwork |
Since Carderos involvement in the project, little metallurgical analysis has been completed by Cardero. However, in December 2011, Davis Tube tests were completed in order to determine the proportion of magnetic material and the value of Fe within the magnetic concentrate. At this time, only preliminary results of these tests have been received. | |
| |
Approximately 347 samples from 2010 and 2011 Titac drill holes were selected for Davies Tube processing. Davies Tube tests utilize an electromagnet to separate material into magnetic and non- magnetic/para-magnetic material. Samples were selected to cover a wide range of grades as well as being spatially representative. Analytical pulp rejects were utilized for the tests which were completed at G&T Metallurgical (G&T) in Kamloops BC. | |
| |
At G&T each sample was assayed for Fe% (direct Fe% analysis as opposed to Fe2 O3 that was completed in the main assay work). Then 10 g or 30 g of the material was selected for the tests. This material was pulp reject material (pulverized to 80% passing 200 mesh) and was not further re- crushed in any way by G&T. The material was separated into a magnetic and non-magnetic fraction by passing over a magnet set at 3000 gauss. The magnetic fraction was then weighed and the magnetic concentrate re-assayed for Fe%. | |
| |
A total of 301 of these samples were from the Titac mineralization domains, with the remainder falling outside the modelled domains. | |
| |
In a deposit with magnetite as the dominant Fe bearing mineral, this test provides data to calculate a regression of the proportion of magnetite expected at a range of Fe grades and the conversion of the Fe2 O3 or Fe% analysis into a magnetite estimate. However, due to the fact that Fe partitions into ilmenite and a small but unknown amount of ilmenite would have partitioned into the magnetic concentrate, further work must be performed to properly quantify the magnetite content of these samples. A mineralogical study of a subset of these samples and concentrates would assist with determining the amount of ilmenite in the concentrate and TiO2 assays of the concentrate would allow for determination of the titaniferous magnetite as well. | |
| |
The Davis Tube tests were not utilized in the definition of the Mineral Resource as accurately quantifying magnetite is not possible until further mineralogical work is completed. |
DJF_MJ/WB | Titac-NI43-101Rpt (4).docx | January 27, 2012 |
2CC031.004 Cardero Resources | |
Titac Project NI 43-101 | Page 63 |
13 |
Mineral Resource Estimates |
13.1 |
Introduction |
The Mineral Resource Statement presented herein represents the first Mineral Resource evaluation prepared for the Project in accordance with the Canadian Securities Administrators NI 43-101. | |
The Mineral Resource model prepared by SRK considers 23 core boreholes drilled by CIOUS during 2010 and 2011. The resource estimation work was completed by Darrell Farrow, Pr. Sci. Nat. under the supervision of Mike Johnson, P.Geo. who is responsible for the resource. By virtue of their education, membership to a recognized professional association and relevant work experience, Darrell Farrow and Mike Johnson are independent Qualified Persons as this term is defined by NI 43-101. The effective date of the resource statement is January 19, 2012. | |
This section describes the resource estimation methodology and summarizes the key assumptions considered by SRK. In the opinion of SRK, the resource evaluation reported herein is a reasonable representation of the global TiO2 and Fe2 O3 mineral resources found in the Titac South deposit of the Project at the current level of sampling. The mineral resources have been estimated in conformity with generally accepted CIM Estimation of Mineral Resource and Mineral Reserves Best Practices guidelines and are reported in accordance with the Canadian Securities Administrators NI 43-101. Mineral resources are not mineral reserves and do not have demonstrated economic viability. There is no certainty that all or any part of the mineral resource will be converted into mineral reserve. | |
The database used to estimate the Project mineral resources was audited by SRK. SRK is of the opinion that the current drilling information is sufficiently reliable to interpret with reasonable confidence the boundaries for ilmenite and magnetite mineralization and that the assay data are sufficiently reliable to support mineral resource estimation. | |
Gemcom Gems version 6.3.1 was used to construct the geological solids, prepare assay data for geostatistical analysis, construct the block model, estimate metal grades and tabulate mineral resources. The Geostatistical Software Library (GSLib) family of software were used for geostatistical analysis. Gems was used for the variography analysis. | |
13.2 |
Resource Estimation Procedures |
The resource evaluation methodology involved the following procedures: |
| Database compilation and verification; | |
| Construction of wireframe models for the boundaries of the oxide mineralization in Titac South; | |
| Definition of resource domains; | |
| Data conditioning (compositing and capping) for geostatistical analysis and variography; | |
| Block modelling and grade interpolation; | |
| Resource classification and validation; | |
| Assessment of reasonable prospects for economic extraction and selection of appropriate cut- off grades; and | |
| Preparation of the Mineral Resource Statement. |
13.3 |
Resource Database |
SRK audited and reviewed data provided by Cardero to create a Gems database from which the Mineral Resource estimation was based. The database includes the following tables: |
| Drill hole collar information such as location and length; | |
| Down hole survey information such as direction and dip; |
DJF_MJ/WB | Titac-NI43-101Rpt (4).docx | January 27, 2012 |
2CC031.004 Cardero Resources | |
Titac Project NI 43-101 | Page 64 |
| Lithology information including rock group codes and interpreted geology; | |
| Down hole magnetic susceptibility data; | |
| Down hole specific gravity measurements ; and, | |
| Chemical analytical (assay) records. |
The data encompassed 32 drill holes, 1754 down hole survey readings, 4943 TiO2 and Fe2O3 assays, and 1746 specific gravity measurements of which 24 drill holes, 1322 down hole survey readings, 3929 TiO2 and Fe2O3 assays and 1326 specific gravity measurements pertain to the Titac South deposit (Table 13.1) .
Basic statistics of for the drill hole assay and specific gravity data for Titac South are presented in Tables 13.2 and 13.3.
Table 13.1: Summary of Titac drill hole data
Titac North | Titac South | Total | |
Drill Holes | 8 | 24 | 32 |
Down Hole Survey | 432 | 1322 | 1754 |
Assays | 1014 | 3929 | 4943 |
Specific Gravity | 420 | 1326 | 1746 |
Table 13.2: Statistical Summary of Database Assay Results for Titac South
TiO2 | Fe2O3 | Length | |
Count | 3929 | ||
Minimum | 0.47 | 2.45 | 0.2 |
Maximum | 36.80 | 64.40 | 3.6 |
Mean | 13.60 | 27.49 | 1.6 |
Standard Deviation | 6.67 | 9.48 | 0.3 |
Table 13.3: Statistical Summary of Database Specific Gravity Results for Titac South
SG | |
Count | 1326 |
Minimum | 2.27 |
Maximum | 4.82 |
Mean | 3.43 |
Standard Deviation | 0.39 |
13.4 |
Solid Body Modelling |
Solid models were created to provide spatial limits for each of the mineralization domains within the Titac South Deposit. Drilling on Titac North was deemed to be insufficient to create a reliable solids model. | |
Domains were created by interpretation of the drill hole lithology data from the 2010 and 2011 drill holes. The domains were broadly defined based upon the designation of drill core intervals as peridotite or pyroxenite dominated oxide bearing ultramafic rocks. A marginal zone of mixed peridotite, pyroxenite and country rock was also modeled. The pyroxenite and peridotite domains predominantly contain pyroxenite and peridotite material respectively, however shorter intervals of other rock types do occur within these modeled domains. |
DJF_MJ/WB | Titac-NI43-101Rpt (4).docx | January 27, 2012 |
2CC031.004 Cardero Resources | |
Titac Project NI 43-101 | Page 65 |
Gemcoms GemsTM 6.3.1 software was used to create the wireframes and the boundaries were limited to the overburden surface. Topographic and overburden surfaces were modeled from drill hole data. These surfaces were used to code the appropriate portions of the block model as air or overburden.
Figure 13.1 and 13.2 show the interpreted domains in plan and three dimensional view respectively.
Figure 13.1 Titac South Plan View of modeled domains
DJF_MJ/WB | Titac-NI43-101Rpt (4).docx | January 27, 2012 |
2CC031.004 Cardero Resources | |
Titac Project NI 43-101 | Page 66 |
Figure 13.2 Titac South 3-D model domains
13.5 | Specific Gravity |
The data supplied by Cardero for Titac South included a total of 1326 specific gravity measurements on core samples, 855 of which fall within the modelled solids. Specific gravity was measured on core samples by CIOUS using a laboratory scale and recording the mass of drill hole core pieces in air and water. Drill hole core was not sealed prior to immersion, however porosity is not likely to be an issue with this type of rock. No strong correlation between specific gravity measurements and TiO2 or Fe2 O3 assay results was noted. | |
| |
13.6 |
Compositing |
| |
A total of 2837 diamond drill hole assay intervals fall within the modelled solids for Titac South. Drill hole assay sample lengths are summarized in Figure 13.3 which is a histogram of sample lengths. Approximately 75 % of samples are less than 1.8 m in length and therefore a compositing interval of 1.8 m was selected. | |
| |
The assays were imported into Gems and composited to 1.8 m length weighted intervals within the modeled domains. |
DJF_MJ/WB | Titac-NI43-101Rpt (4).docx | January 27, 2012 |
2CC031.004 Cardero Resources | |
Titac Project NI 43-101 | Page 67 |
Figure 13.3 Histogram of Sample Lengths | |
13.7 |
Capping |
Block grade estimates may be unduly affected by high grade outliers. Before compositing, grade capping analysis was conducted on the domain-coded sample assay data in order to limit the influence of extreme assay values during estimation. The assays from the modeled pyroxenite, peridotie and mixed domains were separately examined using histograms, and cumulative frequency plots. SRK determined that capping was unnecessary for both TiO2 and Fe2 O3 in all three domains. | |
13.8 |
Statistical Analysis and Variography |
13.8.1 |
Sample and Composite Statistics |
Composite statistics for TiO2 and Fe2 03 as well as sample statistics for specific gravity are described below. | |
TiO2 Composites Statistics | |
Figures 13.4, 13.5 and 13.6 show the histograms of the TiO2 composites within the pyroxenite, peridotie and mixed domains respectively, as well as the basic statistics of each. The average peridotite TiO2 value is 17.63%, while the average in the pyroxenite is 16.41%. The average TiO2 value for the mixed domain is 9.64%. |
DJF_MJ/WB | Titac-NI43-101Rpt (4).docx | January 27, 2012 |
2CC031.004 Cardero Resources | |
Titac Project NI 43-101 | Page 68 |
Figure 13.4: Histogram of composite TiO2 Assay samples within the Pyroxenite Domain.
Figure 13.5: Histogram of composite TiO2 Assay samples within the Peridotite Domain.
DJF_MJ/WB | Titac-NI43-101Rpt (4).docx | January 27, 2012 |
2CC031.004 Cardero Resources | |
Titac Project NI 43-101 | Page 69 |
Figure 13.6: Histogram of composite TiO2 Assay samples within the Mixed Domain Fe2O3 Composites Statistics
Histograms of the Fe2O3 composites within each domain, as well as the basic statistics of each are shown in Figures 13.7, 13.8 and 13.9. The average peridotite Fe2O3 value is 36.26%, while the average in the pyroxenite is 30.58% . The average Fe2O3 value for the mixed domain is 23.69% .
DJF_MJ/WB | Titac-NI43-101Rpt (4).docx | January 27, 2012 |
2CC031.004 Cardero Resources | |
Titac Project NI 43-101 | Page 70 |
Figure 13.7: Histogram of composite Fe2O3 Assay samples within the Pyroxenite Domain
Figure 13.8:Histogram of composite Fe2O3 Assay samples within the Peridotite Domain
DJF_MJ/WB | Titac-NI43-101Rpt (4).docx | January 27, 2012 |
2CC031.004 Cardero Resources | |
Titac Project NI 43-101 | Page 71 |
Figure 13.9: Histogram of composite Fe2O3 Assay samples within the Mixed Domain
13.8.2 | Variography |
Experimental semi-variograms were generated for TiO2 from composite grade data for the pyroxenite oxide bearing ultramafic rocks. The nugget effect was established from a down hole linear semi- variogram. Modeled directions of spatial continuity were identified with a principle azimuth of 120 °and principle dip of 65°. Two spherical structures were modeled with rotation defined by the Gems azimuth, dip, azimuth convention within the block model coordinate space. The continuity ellipsoid was displayed as a search ellipsoid in Gems to validate the ellipsoid orientation. Due to limited data for the peridotite and mixed domains, experimental semi-variograms could not be generated for TiO2 and Fe2 O3 from composite grade data for these domains. Experimental semi-variograms could not be generated for Fe2 O3 from composite grade data for the pyroxenite domain. | |
| |
The semi-variogram model used for TiO2 and Fe2 O2 grade estimation within the pyroxenite, peridotite and mixed domains (Figure 13.10) is summarized in Table 13.5. |
DJF_MJ/WB | Titac-NI43-101Rpt (4).docx | January 27, 2012 |
2CC031.004 Cardero Resources | |
Titac Project NI 43-101 | Page 72 |
Figure 13.10: Modelled directional and down hole semi-variograms for the Pyroxenite Domain
DJF_MJ/WB | Titac-NI43-101Rpt (4).docx | January 27, 2012 |
2CC031.004 Cardero Resources | |
Titac Project NI 43-101 | Page 73 |
13.9 | Block Model and Grade Estimation |
A block model was constructed to cover the entire extent of the modeled mineralized domains for Titac South. The block model includes separate sub-models for TiO2 and Fe2 O3 grade estimates as well as estimated specific gravity and validation estimates. A block percentage model was used to accurately determine volume and tonnage values based on the modelled wireframes. The geometrical parameters of the block model are summarized in Table 13.4 | |
Table 13.4: Block model location and setup |
Description | Easting (X) | Northing (Y) | Elevation (Z) |
Block Model Origin NAD 83 | 567500 | 5227000 | 500 |
Block Dimensions (metres) | 10 | 10 | 10 |
Number of Blocks | 100 | 100 | 40 |
Rotation (degree) | 0° |
13.9.1 |
Grade Interpolation |
Ordinary Kriging (OK) of composite values was used for the estimation of block grades. For TiO2 and Fe2 O3 , a two pass series of expanding ellipsoids was used for sample selection and estimation with the primary and secondary axes of the search ellipsoid defined by the semi-variogram ranges. Successive passes only calculate grades into blocks that have not been interpolated by the previous passes. The semi-variogram and continuity ellipsoids generated for TiO2 for the pyroxenite domain were used to estimate Fe2 O3 grades for the pyroxenite domain and TiO2 and Fe2 O3 grades for both the peridotite and mixed domains. | |
Composite data used for estimation was restricted to samples located within the respective domains. Estimation criteria for the pyroxenite, peridotite and mixed domains are summarized in Table 13.6. All interpolated blocks were classified as Inferred Mineral Resource. | |
13.9.2 |
Specific Gravity Interpolation |
Block density data was interpolated from specific gravity point measurements using the inverse distance squared (ID2) method. A two pass series of expanding ellipsoids was used for sample selection and estimation. Specific gravity data used in the interpolation was restricted to samples located within the respective domains. Specific gravity interpolation criteria for all Titac South modelled domains are summarized in Table 13.7. | |
Country rock blocks were assigned an average density value of 2.93 g/cm3 and overburden blocks were assigned an average density value of 2.0 g/cm3 . |
13.10 | Model Validation |
The block model was validated visually by the inspection of successive section lines in order to confirm that the block model correctly reflects the distribution of high-grade and low-grade samples. An inverse distance squared estimate (ID2) was prepared for the blocks using the same search criteria and compared against the OK estimate. The average composite sample grades for all blocks containing composite samples were compared to the OK and ID2 estimates using scatter plots. The scatter plots for TiO2 and Fe2 O3 within each of the pyroxenite, peridotite and mixed domains are shown in Figures 13.11, 13.13 and 13.13 respectively. | |
Good correlation between OK, ID2 and average composite sample grades was observed for both TiO2 and Fe2 O3 grades in the pyroxenite and peridotite domains. |
DJF_MJ/WB | Titac-NI43-101Rpt (4).docx | January 27, 2012 |
2CC031.004 Cardero Resources | |
Titac Project NI 43-101 | Page 74 |
In the mixed zone, good correlation between OK and ID2 was observed for both TiO2 and Fe2O3 grades as well as between OK and average composite sample grades for Fe2O3. However, greater scatter and slightly more smoothing was observed when comparing OK and average sample grades for TiO2 within the mixed zone (Figure 13.13).
DJF_MJ/WB | Titac-NI43-101Rpt (4).docx | January 27, 2012 |
2CC031.004 Cardero Resources | |
Titac Project NI 43-101 | Page 75 |
Table 13.5: Modelled semi-variograms for Titac South Pyroxenite Domain
Domain | Metal | Nugget C0 | Sill 1 | Sill 2 | Gems | Range 1 | Range 2 | ||||||
Principal
Azimuth |
Principal
Dip |
Intermediate
Azimuth |
X- Rot |
Y- Rot |
Z- Rot |
X- Rot |
Y- Rot |
Z- Rot |
|||||
Pyroxenite | TiO2 | 5.68 | 6.85 | 14.89 | 120 | 65 | 132.603 | 29 | 25 | 20 | 58 | 51 | 39 |
Table 13.6: Search ellipse parameters for Titac South Domains
Commodity | Estimator | Search Pass |
Search Type |
Rotation | Search Ellipse Size | Number of Composites |
Max. Samples per DDH |
|||||
Principal
Azimuth |
Principal
Dip |
Intermediate
Azimuth |
X (m) | Y (m) | Z (m) | Min. | Max. | |||||
TiO2 | OK | 1 | Ellipsoidal | 120° | 65° | 132.6° | 60 | 50 | 40 | 6 | 16 | 4 |
OK | 2 | Ellipsoidal | 120° | 65° | 132.6° | 250 | 150 | 150 | 6 | 16 | 4 | |
Fe2O3 | OK | 1 | Ellipsoidal | 120° | 65° | 132.6° | 60 | 50 | 40 | 6 | 16 | 4 |
OK | 2 | Ellipsoidal | 120° | 65° | 132.6° | 250 | 150 | 150 | 6 | 16 | 4 |
Table 13.7: Search ellipse parameters for Titac South Domains
Commodity | Estimator | Search
Pass |
Search
Type |
Rotation | Search Ellipse Size | Number of Composites | Max.
Samples per DDH |
|||||
Principal
Azimuth |
Principal
Dip |
Intermediate
Azimuth |
X (m) | Y (m) | Z (m) | Min. | Max. | |||||
SG | ID2 | 1 | Ellipsoidal | 120° | 65° | 132.6° | 60 | 50 | 40 | 6 | 16 | 4 |
ID2 | 2 | Ellipsoidal | 120° | 65° | 132.6° | 250 | 150 | 150 | 6 | 16 | 4 |
DJF_MJ/WB | Titac-NI43-101Rpt (4).docx | January 27, 2012 |
2CC031.004 Cardero Resources | |
Titac Project NI 43-101 | Page 76 |
Figure 13.11: Scatter plots showing correlation
between OK, ID2 and average composite TiO2
and
Fe2O3 sample grades for Pyroxenite Domain
Figure 13.12: Scatter plots showing correlation
between OK, ID2 and average composite TiO2
and Fe2O3 sample grades for Peridotite Domain
DJF_MJ/WB | Titac-NI43-101Rpt (4).docx | January 27, 2012 |
2CC031.004 Cardero Resources | |
Titac Project NI 43-101 | Page 77 |
Figure 13.13: Scatter plots showing correlation
between OK, ID2 and average composite TiO2
and
Fe2O3 sample grades for Mixed Domain
13.11 |
Mineral Resource Classification |
Mineral resource classification is typically a subjective concept, industry best practices suggest that resource classification should consider both the confidence in the geological continuity of the mineralized structures, the quality and quantity of exploration data supporting the estimates and the geostatistical confidence in the tonnage and grade estimates. Appropriate classification criteria should aim at integrating both concepts to delineate regular areas at similar resource classification. | |
SRK is satisfied that the geological modelling honours the current geological information and knowledge. Although the drilling is good it is insufficient for a confident interpretation of the geological boundaries and mineralization. The location of the samples and the assay data are sufficiently reliable to support resource evaluation. The sampling information was acquired primarily by diamond core drilling of angled holes radiating from the centre of the Titac South deposit outwards with a few drill holes angled from the outside into the deposit. Due to the pipe like shape of the deposit, the drilling configuration and number of drill holes is not considered sufficient to delineate an Indicated Resource and all estimated blocks have been classified as Inferred. | |
13.12 |
Mineral Resource Statement |
CIM Definition Standards for Mineral Resources and Mineral Reserves (December 2005) defines a Mineral Resource as: | |
(A) concentration or occurrence of diamonds, natural solid inorganic material, or natural solid fossilized organic material including base and precious metals, coal, and industrial minerals in or on the Earths crust in such form and quantity and of such a grade or quality that it has reasonable prospects for economic extraction. The location, quantity, grade, geological characteristics and continuity of a Mineral Resource are known, estimated or interpreted from specific geological evidence and knowledge. |
DJF_MJ/WB | Titac-NI43-101Rpt (4).docx | January 27, 2012 |
2CC031.004 Cardero Resources | |
Titac Project NI 43-101 | Page 78 |
The reasonable prospects for economic extraction requirement generally implies that the quantity and grade estimates meet certain economic thresholds and that the mineral resources are reported at an appropriate cut-off grade taking into account extraction scenarios and processing recoveries. In order to meet this requirement, SRK considers that major portions of the Titac South deposit are amenable for open pit extraction.
In order to determine the quantities of material offering reasonable prospects for economic extraction by an open pit, SRK used a pit optimizer and reasonable mining assumptions to evaluate the proportions of the block model that could be reasonably expected to be mined from an open pit.
For this exercise, SRK assumed that all TiO2 was contained within ilmenite, and that the Fe2O3 estimates provided no value in the pit optimizer. In this way, any double counting of material was avoided.
The optimization parameters were selected based on experience and benchmarking against similar projects (Error! Reference source not found.8). The reader is cautioned that the results from the pit optimization are used solely for the purpose of testing the reasonable prospects for economic extraction by an open pit and do not represent an attempt to estimate mineral reserves. There are no mineral reserves on the Project. The results are used as a guide to assist in the preparation of a Mineral Resource Statement and to select an appropriate resource reporting cut-off grade.
Table 13.8: Assumptions Considered for Conceptual Open Pit Optimization.
Parameter | Value | Unit |
TiO2 : Ilmenite Ratio | 0.5264 : 1 | n/a |
Ilmenite Price | 170 | $US per tonne |
Mining Cost | 2.50 | US$ per tonne mined |
Processing | 8 | US$ per tonne of feed |
General and Administrative | 1 | US$ per tonne of feed |
Mining Dilution | 0 | percent |
Mining Loss | 0 | percent |
Overall Pit Slope | 50 | degrees |
Ilmenite Process Recovery | 70 | percent |
Magnetite Process Recovery | 0 | percent |
With industrial mineral such as ilmenite, product pricing is subject to many more modifying factors than precious or base metals. SRK has utilized a consensus of market forecasts to choose this ilmenite price. Site specific product pricing is unrealistic at this stage of the Project. SRK feels that pricing risks are offset by not planning for the potential value of magnetite concentrate which would be an expected by-product at such a deposit. As well, pricing as low at $105 per tonne of Ilmenite had marginal effect on the blocks contained within the conceptual pit shell.
SRK considers that the blocks located within the conceptual pit envelope show reasonable prospects for economic extraction and can be reported as a Mineral Resource. When running the optimizer, SRK found that the mineralized domains were marginally constrained at depth and the Mineral Resource was adjusted to reflect blocks contained within the conceptual pit shell.
Table 13.9 summarizes the Mineral Resource.
DJF_MJ/WB | Titac-NI43-101Rpt (4).docx | January 27, 2012 |
2CC031.004 Cardero Resources | |
Titac Project NI 43-101 | Page 79 |
Table 13.9: Mineral Resource Statement*, Titac Project,
Minnesota, USA, SRK
Consulting (Canada) Inc, effective date, January 19,
2012
Category | Estimated Quantity | Estimated Grade | |
TiO2 | Adjusted Fe2O3*** | ||
Mt | % | % | |
Open Pit** | |||
Inferred | 45.1 | 15.0 | 14.74 |
* |
Mineral resources are reported in relation to a conceptual pit shell. Mineral resources are not mineral reserves and do not have demonstrated economic viability. All figures are rounded to reflect the relative accuracy of the estimate. All composites have been capped where appropriate. | |
** |
Open pit mineral resources are reported at a cut-off grade of 8% TiO2. Cut-off grades are based on a price of US$170 per tonne of ilmenite back calculated to TiO2 and recoveries of 70 percent, without considering revenues from other metals. | |
*** |
Reported Fe2O3 has been lowered to reflect the amount of Fe estimated to be contained in ilmenite based on the assumption that all Ti has been assigned to ilmenite. At this time, accurately quantifying the amount of magnetite contained within this estimate is not possible. |
As stated above, the Mineral Resource has been quantified in terms of TiO2 and Fe2O3, the analytical components captured for assays of titanium and iron. In any potential mining scenario, the Project would produce ilmenite (FeTiO3) and potentially titaniferous magnetite (TiFe2O4) and magnetite (Fe3O4) as a by-product. The Fe2O3 values have been reduced to reflect Fe found within the ilmenite associated with the TiO2, however accurately quantifying magnetite is not possible at this time as further mineralogical work will be needed.
Based on the assumption that all Ti is found within ilmenite, the contained ilmenite metal in the Mineral Resource is summarized in Table 13.10.
Table 13.10: Summary of Titac Project ilmenite content within the Mineral Resource
Category | Quantity | Ilmenite Grade | Contained Ilmenite |
(FeTiO3) | |||
Mt | % | Mt. | |
Inferred | 45.1 | 28.5 | 12.9 |
13.13 |
Grade Sensitivity Analysis |
The mineral resources of the Project are sensitive to the selection of the reporting cut-off grade. To illustrate this sensitivity, the block model quantities and grade estimates within the conceptual pit used to constrain the mineral resources are presented in Table 13.11 at different cut-off grades. The reader is cautioned that the figures presented in this table should not be misconstrued with a Mineral Resource Statement. The figures are only presented to show the sensitivity of the block model estimates to the selection of cut-off grade. Figure 13.14 presents this sensitivity as grade tonnage curves. |
DJF_MJ/WB | Titac-NI43-101Rpt (4).docx | January 27, 2012 |
2CC031.004 Cardero Resources | |
Titac Project NI 43-101 | Page 80 |
Table 13.11: Global Block Model Quantities and Grade Estimates*, Titac Project at Various cut-off Grades
Cut-off Grade TiO2 (%) |
Quantity (Mt) |
Grade TiO2 (%) |
0 | 48.1 | 14.50 |
5 | 48.0 | 14.53 |
6 | 47.8 | 14.57 |
7 | 47.0 | 14.70 |
8 | 45.1 | 15.00 |
9 | 42.0 | 15.48 |
10 | 39.5 | 15.86 |
11 | 36.8 | 16.25 |
12 | 34.2 | 16.61 |
13 | 31.1 | 17.02 |
14 | 27.8 | 17.43 |
15 | 23.2 | 18.01 |
20 | 4.4 | 21.78 |
25 | 0.2 | 26.24 |
* The reader is cautioned that the
figures in this table should not be
misconstrued with a Mineral Resource
Statement. The figures are only
presented to show the sensitivity of the
block model estimates to the
selection of cut-off grade.
Figure 13.14: Grade Tonnage Curves for the Titac Project
DJF_MJ/WB | Titac-NI43-101Rpt (4).docx | January 27, 2012 |
2CC031.004 Cardero Resources | |
Titac Project NI 43-101 | Page 81 |
13.14 | Mineral Resource Risks |
Ilmenite is an industrial mineral and there are risks and uncertainties associated with this ilmenite resource, many of which are common to industrial mineral deposits. Industrial mineral have special risks that are not typically associated with precious or base metal mines. Special concerns include mineralogy of material, deleterious elements (such as silica, calcium, magnesium and manganese), and special market factors such as market size or proprietary technology. Because of these and other issues, industrial mineral deposits carry additional risk compared to more common metal products. |
DJF_MJ/WB | Titac-NI43-101Rpt (4).docx | January 27, 2012 |
2CC031.004 Cardero Resources | |
Titac Project NI 43-101 | Page 82 |
14 |
Adjacent Properties |
The Project is situated at the western edge of the Duluth geological complex, bordering on the archean Granite-Greenstone Terrains of the Canadian Shield. This area is a prolific mining area, including several massive Taconite (Iron ore) mines of the Mesabi Range. | |
The Duluth Complex contains a series of Cu-Ni deposits in close proximity to the Project. These Cu- Ni deposits include Tecks Mesaba deposits and Polymets NorthMet deposit. These deposits lie near the basil contact between the Duluth Complex and the underlying older Precambrian rocks. There are also numerous OUI bodies similar to Titac within 50 km of the Project Area. CIOUSs other OUI ilmenite project, Longnose which is similar but larger and higher grade than the Project, lies approximately 40 km north of the Project Area. |
DJF_MJ/WB | Titac-NI43-101Rpt (4).docx | January 27, 2012 |
2CC031.004 Cardero Resources | |
Titac Project NI 43-101 | Page 83 |
15 |
Other Relevant Data and Information |
There is no additional data or information not contained in this report which is relevant to the Project. |
DJF_MJ/WB | Titac-NI43-101Rpt (4).docx | January 27, 2012 |
2CC031.004 Cardero Resources | |
Titac Project NI 43-101 | Page 84 |
16 |
Interpretation and Conclusions |
The Titac OUIs are geologically interpreted to be late-stage, intrusions that cut early Duluth Complex intrusives, and are associated with magmatism generated by the 1.1 billion year old Midcontinent Rift system. | |
Re-interpretation of a 1967 ground magnetic survey also shows that the Titac intrusion may be a cluster of OUIs. The drilling program conducted in 2010 and 2011 by CIOUS confirmed strong titanium-iron-oxide mineralization at the Project Area, and determined that the Project Area contains at least two intrusions with large zones of titanium-iron-oxide mineralization (Titac North and Titac South). The Titac intrusions are stratigraphically complex with funnel- or pipe-like geometries, and seemingly interlayered peridotite, pyroxenite, massive oxide, and semi-massive oxide. Titac South is at least 490 m thick, and also has a pipe-like geometry. The Titac OUI or OUIs are hosted by a combination of troctolitic rocks of the Western Margin intrusion and anorthositic rocks of the Anorthositic series (Titac). | |
Ilmenite and to a lesser extend titaniferous magnetite is used as a source material for titanium used as pigments and as a metal alloy. Rutile is the ideal source material for titanium as it contains nearly twice as much Ti as ilmenite; however ilmenite is by far the more common source. | |
Ilmenite is an industrial mineral and there are risks and uncertainties associated with this ilmenite resource, many of which are common to industrial mineral deposits. Industrial mineral have special risks that are not typically associated with precious or base metal mines. Special concerns include mineralogy of material, deleterious elements (such as silica, calcium, magnesium and manganese), and special market factors such as market size or proprietary technology. Because of these and other issues, industrial mineral deposits carry additional risk compared to more common metal products. | |
Historic metallurgical tests of the Titac material are very limited. Small scale testing indicates that a viable Ilmenite concentrate could be created from processing of Titac material, although higher than ideal deleterious element values, such as magnesium, may reduce the potential ilmenite product price. The ilmenite may be sold as a concentrate to an existing ilmenite processor as the deposit is amicable to shipping due to its proximity to rail and a short haul to bulk ports on the western shore of Lake Superior. As well, local beneficiation could be considered, particularly when other nearby OUI bodies are considered for increased scale. The main hurdle to overcome with future exploitation of the Titac deposit revolves around metallurgical optimization to create the highest grade concentrate while reducing potential deleterious element contamination of the concentrate. Further economic analysis of this project is anticipated and should include resolution of the mineralogical, metallurgical and processing issues. | |
Based upon a relatively simple processing flow sheet for ilmenite concentrate, a recent increase in demand for Ilmenite and the projects close proximity to other bulk mines and inexpensive shipping routes, SRK believes that the Project meets the criteria for having reasonable prospects of economic extraction. | |
The mineral resources for Titac South presented in this report represent the first time disclosure of Mineral Resource for the Project . Drilling on the Titac North deposit is insufficient for delineation of the deposit and evaluation of a resource for Titac North has not been undertaken. |
DJF_MJ/WB | Titac-NI43-101Rpt (4).docx | January 27, 2012 |
2CC031.004 Cardero Resources | |
Titac Project NI 43-101 | Page 85 |
The Mineral Resource for Titac South at a cut-off grade of 8% TiO2 includes 45.1 million tonnes at an average grade of 15.0% TiO2 . Based on the assumption that all Ti is found within ilmenite, the contained ilmenite in the Mineral Resource includes 12.8 million tonnes at an average grade of 28.5% ilmenite. While not quantified here, the potential for extraction of iron from magnetite exists and would provide an upside to the project. Vanadium may also be of economic interest, but it has not been analyzed by SRK.
DJF_MJ/WB | Titac-NI43-101Rpt (4).docx | January 27, 2012 |
2CC031.004 Cardero Resources | |
Titac Project NI 43-101 | Page 86 |
17 |
Recommendations |
The Project Area is at an early exploration stage and merits additional work. The drilling program conducted in 2010 and 2011 by CIOUS has confirmed strong titanium-iron-oxide mineralization at the Project Area, and determined that the Project Area contains at least two OUIs with large zones of titanium-iron-oxide mineralization (Titac North and Titac South). The Titac South intrusion was extensively drilled by CIOUS in 2010 and 2011, and has been fairly well defined by this drilling. A modest in-fill drilling program is recommended at Titac South to farther define contacts with country rock, and to fill-in local gaps with-in the intrusion. Ore mineral speciation and metallurgical/beneficiation studies, as well as a preliminary economic assessment should also be conducted SRK recommends the following work and expenditures: |
|
An in-fill drilling program consisting of six diamond drill holes and ~1,800 m of core is recommended. | |
|
A petrographic and mineral chemistry study of typical oxide and sulfide mineralization present at Titac should be conducted to identify the specific oxide and sulfide minerals present, and their elemental make-up. | |
|
Metallurgical test work in conjunction with the mineralogical studies, to assist with better understanding of ilmenite an magnetite recovery, project economic analysis: 100 kg composite from sample coarse rejects should be collected that represents average TiO2 grades. | |
|
A preliminary economic assessment should be conducted |
A 2011 budget is presented to complete the recommended work program:
Table 17.1: Estimated Cost for the Exploration Program Proposed for the Project.
Recommendation | Estimated Cost (US$) |
Titac South in-fill drilling (6 holes/1,800 m @ $180/m*) | 324,000 |
Petrographic and mineral chemistry study | 20,000 |
Metallurgical testing | 50,000 |
Preliminary economic assessment study | 100,000 |
TOTAL | 494,000 |
*Drilling cost per metre includes: Site and Trail preparation, drilling, sampling, facility/vehicle lease, and staffing
DJF_MJ/WB | Titac-NI43-101Rpt (4).docx | January 27, 2012 |
2CC031.004 Cardero Resources | |
Titac Project NI 43-101 | Page 87 |
18 | References |
Bonnichsen, B., 1972, Southern part of the Duluth Complex in Sims, P.K., and Morey, G.B., eds., Geology of Minnesota: A centennial volume, St. Paul, Minnesota Geological Survey, p. 361-387. | |
| |
Broderick, T.M., 1917, The relation of the titaniferous magnetites of northeastern Minnesota to the Duluth Gabbro, Economic Geology, v. 12, p. 663-696. | |
| |
Coleraine Minerals Research Laboratory. April 26, 1996. Preliminary, unpublished report by . B. Niles, Research Coordinator. CMRL/TR-96-29. University of Minnesota Duluth, Natural Resources Research Institute, 5013 Miller Trunk Highway, Duluth, Minnesota, 55811. | |
| |
Coleraine Minerals Research Institute,Pilot Plant Beneficiation Tests of a Bulk Sample of Ilmenite Ore Provided by American Shield Company, December 1994. CMRL/TR-94-15. University of Minnesota Duluth, Natural Resources Research Institute, 5013 Miller Trunk Highway, Duluth, Minnesota, 55811. | |
| |
Hauck, S.A., Severson, M.J., Zanko, L., Barnes, S.J., Morton, P., Alminas, H., Foord, E.E., and Dahlberg, E.H., 1997, An overview of the geology and oxide, sulfide, and platinum-group element mineralization along the western and northern contacts of the Duluth Complex, in Ojakangas, R.W., Dickas, A.B., and Green, J.C., eds., Middle Proterozoic to Cambrian Rifting, Central North America: Boulder, Colorado, Geological Society of America Special Paper 312. | |
| |
Mainwaring, P.R., and Naldrett, A.J., 1977, Country rock assimilation and genesis of Cu-Ni sulfides in the Water Hen Intrusion, Duluth Complex, Minnesota, Economic Geology, v. 72, 1269-1284. | |
| |
Miller, J.D., Jr., Green, J.C., Severson, M.J., Chandler, V.W., Hauck, S.A., Peterson, D.M., and Wahl, T.E., 2002, Geology and mineral potential of the Duluth Complex and related rocks of northeastern Minnesota: Minnesota Geological Survey report of Investigations 58, 207 p. | |
| |
Muhich, T.G., 1993, Movement of titanium across the Duluth Complex-Biwabik Iron Formation contact at Dunka Pit, Mesabi Iron Range, northeastern Minnesota [M.S. thesis], Duluth, University of Minnesota, 154 p. | |
| |
Niles, H.B., 1971 Assay and Test Results from drill hole number 26002, A Vanadiferous, Titanifeorus Magnetite in the Duluth Gabbro complex, Research Laboratory Technical Repot, 30.015-099(2), 12 p. | |
| |
Paces, J.B., and Miller, J.D., 1993, Precise U-Pb ages of Duluth Complex and related mafic intrusions, northeastern Minnesota, U.S.A., geochronological insights to physical, petrogenetic, paleomagnetic, and tectono-magmatic processes associated eith the 1.1 Ga Midcontinent Rift System, Journal of Geophysical Research, V. 98, pp. 13997-14013. | |
| |
Ross, B.A., 1985, A petrologic study of the Bardon Peak peridotite, Duluth Complex [M.S. thesis], Duluth, University of Minnesota, 140 p. | |
| |
Schiffries, C.M, 1982, The petrogenesis of a platiniferous dunite pipe in the Bushveld Complex: Infiltration metasomatism by a chloride solution, Economic Geology, v. 77, p. 1439-1453. | |
| |
Severson, M.J., 1988, Geology and structure of a portion of the Partridge River Intrusion: A progress report, Duluth, University of Minnesota, Natural Resources Research Institute, Technical Report, NRRI/GMIN-TR-88-08, 78 p. |
DJF_MJ/WB | Titac-NI43-101Rpt (4).docx | January 27, 2012 |
2CC031.004 Cardero Resources | |
Titac Project NI 43-101 | Page 88 |
Severson, M.J., 1991, Geology, mineralization, and geostatistics of the Minnamax/Babbitt Cu-Ni deposit (Local Boy area), Minnesota, Part I: Geology, Duluth, University of Minnesota, Natural Resources Research Institute, Technical Report, NRRI/TR-91/13a, 96 p.
Severson, M.J., 1994, Igneous stratigraphy of the South Kawishiwi Intrusion, Duluth Complex, northeastern Minnesota, Duluth, University of Minnesota, Natural Resources Research Institute, Technical Report, NRRI/TR-93/34, 210 p.
Severson, M.J., 1995, Geology of the southern portion of the Duluth Complex, Duluth, University of Minnesota, Natural Resources Research Institute, Technical Report, NRRI/TR-95/26, 185 p.
Severson, M.J., and Hauck, S.A., 1990, Geology, geochemistry, and stratigraphy of a portion of the Partridge River Intrusion, Duluth, University of Minnesota, Natural Resources Research Institute, Technical Report, NRRI/GMIN-TR-89-11, 230 p.
Viljoen, M.J., and Scoon, R.N., 1985, Distribution and main geologic features of discordant intrusions of iron-rich ultramafic pegmatite in the Bushveld Complex, Economic Geology, v. 80, p. 1109-1128.
Weather.com, December 20, 2010,
http://www.weather.com/outlook/health/fitness/wxclimatology/monthly/USMN0370
Winchell, H.V., 1897, Reputed nickel mines in Minnesota, Engineering Mining Journal, v. 64, p. 578.
DJF_MJ/WB | Titac-NI43-101Rpt (4).docx | January 27, 2012 |
2CC031.004 Cardero Resources | |
Titac Project NI 43-101 | Page 89 |
19 |
Date and Signature Page |
This technical report was written by the following Qualified Persons. The effective date of this technical report is January 19th , 2012. |
Qualified Person | Signature | Date |
Darrell J. Farrow, Pr.Sci.Nat. | original signed | January 27, 2012 |
Michael D. Johnson, P.Geo | original signed | January 27, 2012 |
Reviewed by
Original signed | |
Dr. Wayne Barnett, Pr.Sci.Nat | |
Project Reviewer |
All data used as source material plus the text, tables, figures, and attachments of this document have been reviewed and prepared in accordance with generally accepted professional engineering and environmental practices.
DJF_MJ/WB | Titac-NI43-101Rpt (4).docx | January 27, 2012 |
CERTIFICATE OF QUALIFIED PERSON
To Accompany the report entitled: Technical Report on the Titac Ilmenite Project, Minnesota, USA, January 27, 2012 (Technical Report)
I, Michael D. Johnson, residing at 2021 Berkshire Crescent, Coquitlam, BC, V3E 3N5, do hereby certify that:
1) |
I am a Senior Geologist with the firm of SRK Consulting (Canada) Inc. (SRK) with an office at Suite 2200, 1066 West Hastings Street, Vancouver, BC, V6E 3X2; |
|
|
2) |
I am a graduate of the Queens University, Kingston, Ontario in 1996, where I obtained a B.Sc. (H) in Geological Sciences. I have practiced my profession continuously since graduation in April, 1996. I have been employed as a geologist, exploration manager, mine geologist and open pit mine manager. I have extensive experience in resource estimation within many deposit types. I have worked with ultramafic intrusions and related mineral deposits for more than 10 years; |
|
|
3) |
I am a Professional Geoscientist registered with the Association of Professional Engineers and Geoscientists of BC (registration # 34923); |
|
|
4) |
I have personally inspected the property that is the subject of the Technical Report in March 2010; |
|
|
5) |
I have read the definition of qualified person set out in National Instrument 43-101 and certify that by virtue of my education, affiliation to a professional association and past relevant work experience, I fulfill the requirements to be a qualified person for the purposes of National Instrument 43-101; |
|
|
6) |
I am responsible for the preparation of Sections 12 and 13 of the Technical Report; |
|
|
7) |
I am independent of the issuer as defined in Section 1.5 of National Instrument 43-101; |
|
|
8) |
I have had no prior involvement with the property that is the subject of the Technical Report. |
|
|
9) |
I have read National Instrument 43-101 and the sections of the Technical Report for which I am responsible have been prepared in compliance therewith; |
|
|
10) |
As of the effective date of the Technical Report, to the best of my knowledge, information and belief, the sections of the Report for which I am responsible contain all scientific and technical information that is required to be disclosed to make the portions of the Technical Report for which I am responsible not misleading; |
January 27, 2012 | [signed and sealed] |
Vancouver | Michael D. Johnson, P.Geo. |
Senior Geologist, SRK |
CERTIFICATE OF QUALIFIED PERSON
To accompany the report entitled: Technical Report on the Titac Ilmenite Project, Minnesota, USA, January 27, 2012
I, Darrell Farrow, residing at 40 4055 Indian River Drive, North Vancouver, Canada, do hereby certify that:
1) |
I am an associate with the firm of SRK Consulting (Canada) Inc. (SRK) with an office at 22nd Floor, 1066 West Hastings Street, Vancouver, BC, Canada; |
|
2) |
I am a graduate of the University of Pretoria, Pretoria, South Africa (M.Sc. Geology 1989) and the University of Cape Town, Cape Town, South Africa (B.Sc.(Hons) 1982). I have practiced my profession continuously since graduation and have been employed as a research geochemist for four years, as a geologist at two mining operations over a period of ten years, as a manager of an exploration laboratory for three years, and as a consulting geologist for eleven years; |
|
3) |
I am a Professional Natural Scientist in the field of practice of Geological Science, registered as a member of the South African Council for Natural Scientific Professions, South Africa, Reg. No. 400163/07; |
|
4) |
I have not personally inspected the property that is the subject of the Technical Report but have relied on a site visit conducted by Mike Johnson P.Geo., co-author of this technical report in March 2010; |
|
5) |
I have read the definition of qualified person set out in National Instrument 43-101 and certify that by virtue of my education, affiliation to a professional association and past relevant work experience, I fulfill the requirements to be a qualified person for the purposes of National Instrument 43-101 and the sections to which I have contributed in this technical report have been prepared in compliance with National Instrument 43-101 and Form 43-101F1; |
|
6) |
I as a qualified person am independent of the issuer as defined in Section 1.5 of National Instrument 43- 101; |
|
7) |
I am a co-author of this report and responsible for all sections except sections 12 and 13; |
|
8) |
I have had no prior involvement with the property that is the subject of the Technical Report; |
|
9) |
I have read National Instrument 43-101 and confirm that the sections of the Technical Report for which I am responsible have been prepared in compliance therewith; |
|
10) |
As of the effective date of the Technical Report, to the best of my knowledge, information and belief, the sections of the Technical Report for which I am responsible contain all scientific and technical information that is required to be disclosed to make the portions of the Technical Report for which I am responsible not misleading. |
[signed and sealed] | |
Vancouver | Darrell Farrow, M.Sc., Pr.Sci.Nat. |
January, 27, 2012 |
CERTIFICATION
I, Michael Hunter, certify that:
1. I have reviewed this annual report on Form 40-F of Cardero Resource Corp.;
2. Based on my knowledge, this report does not contain any untrue statement of a material fact or omit to state a material fact necessary to make the statements made, in light of the circumstances under which such statements were made, not misleading with respect to the period covered by this report;
3. Based on my knowledge, the financial statements, and other financial information included in this report, fairly present in all material respects the financial condition, results of operations and cash flows of the issuer as of, and for, the periods presented in this report;
4. The issuer's other certifying officer and I are responsible for establishing and maintaining disclosure controls and procedures (as defined in Exchange Act Rules 13a-15(e) and 15d-15(e)) and internal control over financial reporting (as defined in Exchange Act Rules 13a-15(f) and 15d-15(f)) for the issuer and have:
(a) Designed such disclosure controls and procedures, or caused such disclosure controls and procedures to be designed under our supervision, to ensure that material information relating to the issuer, including its consolidated subsidiaries, is made known to us by others within those entities, particularly during the period in which this report is being prepared;
(b) Designed such internal control over financial reporting, or caused such internal control over financial reporting to be designed under our supervision, to provide reasonable assurance regarding the reliability of financial reporting and the preparation of financial statements for external purposes in accordance with generally accepted accounting principles;
(c) Evaluated the effectiveness of the issuer's disclosure controls and procedures and presented in this report our conclusions about the effectiveness of the disclosure controls and procedures, as of the end of the period covered by this report based on such evaluation; and
(d) Disclosed in this report any change in the issuer's internal control over financial reporting that occurred during the period covered by the annual report that has materially affected, or is reasonably likely to materially affect, the issuer's internal control over financial reporting; and
5. The issuer's other certifying officer and I have disclosed, based on our most recent evaluation of internal control over financial reporting, to the issuer's auditors and the audit committee of the issuer's board of directors (or persons performing the equivalent functions):
(a) All significant deficiencies and material weaknesses in the design or operation of internal control over financial reporting which are reasonably likely to adversely affect the issuer's ability to record, process, summarize and report financial information; and
(b) Any fraud, whether or not material, that involves management or other employees who have a significant role in the issuer's internal control over financial reporting.
Date: January 30, 2012
(signed) Michael
Hunter
President and Chief Executive
Officer
-2-
CERTIFICATION
I, Blaine Bailey, certify that:
1. I have reviewed this annual report on Form 40-F of Cardero Resource Corp.;
2. Based on my knowledge, this report does not contain any untrue statement of a material fact or omit to state a material fact necessary to make the statements made, in light of the circumstances under which such statements were made, not misleading with respect to the period covered by this report;
3. Based on my knowledge, the financial statements, and other financial information included in this report, fairly present in all material respects the financial condition, results of operations and cash flows of the issuer as of, and for, the periods presented in this report;
4. The issuer's other certifying officer and I are responsible for establishing and maintaining disclosure controls and procedures (as defined in Exchange Act Rules 13a-15(e) and 15d-15(e)) and internal control over financial reporting (as defined in Exchange Act Rules 13a-15(f) and 15d-15(f)) for the issuer and have:
(a) Designed such disclosure controls and procedures, or caused such disclosure controls and procedures to be designed under our supervision, to ensure that material information relating to the issuer, including its consolidated subsidiaries, is made known to us by others within those entities, particularly during the period in which this report is being prepared;
(b) Designed such internal control over financial reporting, or caused such internal control over financial reporting to be designed under our supervision, to provide reasonable assurance regarding the reliability of financial reporting and the preparation of financial statements for external purposes in accordance with generally accepted accounting principles;
(c) Evaluated the effectiveness of the issuer's disclosure controls and procedures and presented in this report our conclusions about the effectiveness of the disclosure controls and procedures, as of the end of the period covered by this report based on such evaluation; and
(d) Disclosed in this report any change in the issuer's internal control over financial reporting that occurred during the period covered by the annual report that has materially affected, or is reasonably likely to materially affect, the issuer's internal control over financial reporting; and
5. The issuer's other certifying officer and I have disclosed, based on our most recent evaluation of internal control over financial reporting, to the issuer's auditors and the audit committee of the issuer's board of directors (or persons performing the equivalent functions):
(a) All significant deficiencies and material weaknesses in the design or operation of internal control over financial reporting which are reasonably likely to adversely affect the issuer's ability to record, process, summarize and report financial information; and
(b) Any fraud, whether or not material, that involves management or other employees who have a significant role in the issuer's internal control over financial reporting.
Date: January 30, 2012
(signed) Blaine
Bailey
Chief Financial Officer
-2-
CERTIFICATION PURSUANT TO
18 U.S.C. §1350,
AS ADOPTED
PURSUANT TO
SECTION 906 OF THE SARBANES-OXLEY ACT OF 2002
In connection with the Annual Report of Cardero Resource Corp. (the Company) on Form 40-F for the fiscal year ended October 31, 2011 as filed with the Securities and Exchange Commission on the date hereof (the Report), I, Michael Hunter, the President and Chief Executive Officer of the Company, certify, pursuant to 18 U.S.C. §1350, as adopted pursuant to Section 906 of the Sarbanes-Oxley Act of 2002, that:
1. |
The Report fully complies with the requirements of Section 13(a) or 15(d) of the Securities Exchange Act of 1934; and | |
2. |
The information contained in the Report fairly presents, in all material respects, the financial condition and results of operations of the Company. |
Date: January 30, 2012
(signed) Michael Hunter | |
Michael Hunter, | |
President and Chief Executive Officer |
CERTIFICATION PURSUANT TO
18 U.S.C. §1350,
AS ADOPTED
PURSUANT TO
SECTION 906 OF THE SARBANES-OXLEY ACT OF 2002
In connection with the Annual Report of Cardero Resource Corp. (the Company) on Form 40-F for the fiscal year ended October 31, 2011 as filed with the Securities and Exchange Commission on the date hereof (the Report), I, Blaine Bailey, the Chief Financial Officer of the Company, certify, pursuant to 18 U.S.C. §1350, as adopted pursuant to Section 906 of the Sarbanes-Oxley Act of 2002, that:
1. |
The Report fully complies with the requirements of Section 13(a) or 15(d) of the Securities Exchange Act of 1934; and | |
2. |
The information contained in the Report fairly presents, in all material respects, the financial condition and results of operations of the Company. |
Date: January 30, 2012
(signed) Blaine Bailey | |
Blaine Bailey, | |
Chief Financial Officer |
CONSENT OF INDEPENDENT REGISTERED PUBLIC ACCOUNTING FIRM
To the Board of Directors of Cardero Resource Corp.
We consent to the inclusion in this annual report on Form 40-F and the incorporation by reference in the registration statement on Form S-8 (No. 333-151385) of Cardero Resource Corp. (the Company) of:
our Report of Independent Registered Public Accounting Firm dated January 26, 2012, on the consolidated balance sheets of the Company as at October 31, 2011 and 2010, and the consolidated statements of operations, shareholders equity and cash flows for each of the years ended October 31, 2011, 2010 and 2009;
our Comments by Auditors for US Readers on Canada-US reporting differences, dated January 26, 2012; and
our Report of Independent Registered Public Accounting Firm dated January
26, 2012, on the
Companys internal control over financial reporting as of
October 31, 2011;
each of which is contained in this annual report on Form 40-F of the Company for the fiscal year ended October 31, 2011.
Chartered Accountants
Vancouver, Canada
January 30, 2012
CONSENT
Each of the undersigned hereby consents to the use of its name and references to, and the use of information derived from, the technical report dated December 6, 2011 entitled Technical Report Carbon Creek Coal Property British Columbia, Canada in the following documents, which are being filed as exhibits to and incorporated by reference into the annual report on Form 40-F of Cardero Resource Corp. (the Company) being filed with the United States Securities and Exchange Commission and which is being incorporated by reference into the registration statement on Form S-8 (No. 333-151385) of the Company:
1. |
The Companys annual information form for the fiscal year ended October 31, 2011; and | |
2. |
The Companys managements discussion and analysis for the fiscal year ended October 31, 2011. |
DATED January 30, 2012
Norwest Corporation | (signed) Lawrence D. Henchel | ||
Lawrence D. Henchel | |||
Per: | (signed) Kirk Weber | ||
Name: | Kirk Weber | (signed) Gary M. Stubblefield | |
Title: | Vice President | Gary M. Stubblefield |
CONSENT
The undersigned hereby consents to the use of his name and references to, and the use of information derived from, the technical report dated January 18, 2012 entitled Technical Report, Sheini Hills Iron Project, Ghana, Africa in the following documents, which are being filed as exhibits to and incorporated by reference into the annual report on Form 40-F of Cardero Resource Corp. (the Company) being filed with the United States Securities and Exchange Commission and which is being incorporated by reference into the registration statement on Form S-8 (No. 333-151385) of the Company:
1. |
The Companys annual information form for the fiscal year ended October 31, 2011; and | |
2. |
The Companys managements discussion and analysis for the fiscal year ended October 31, 2011. |
DATED January 30, 2012
/s/ Keith Henderson
EurGeol Keith J Henderson,
P.Geo
CONSENT
Each of the undersigned hereby consents to the use of its name and references to, and the use of information derived from Technical Report dated January 27, 2012, effective January 19, 2012, entitled Technical Report on the Longnose Ilmenite Project, Minnesota, USA prepared by SRK Consulting (Canada) Inc. and the Technical Report dated January 27, 2012, effective January 19, 2012, entitled Technical Report on the Titac Ilmenite Exploration Project, Minnesota, USA prepared by SRK Consulting (Canada) Inc. in the following documents, which are being filed as exhibits to and incorporated by reference into the annual report on Form 40-F of Cardero Resource Corp. (the Company) being filed with the United States Securities and Exchange Commission and which is being incorporated by reference into the registration statement on Form S-8 (No. 333-151385) of the Company:
1. |
The Companys annual information form for the fiscal year ended October 31, 2011; and | |
2. |
The Companys managements discussion and analysis for the fiscal year ended October 31, 2011. |
DATED January 30, 2012 | |||
SRK Consulting (Canada) Inc. | (signed) Darrell Farrow | ||
Darrell Farrow | |||
Per: | (signed) Wayne Barnett | ||
Name: | Wayne Barnett | (signed) Michael D. Johnson | |
Title: | Practice Lead | Michael D. Johnson |
5M/U,:8$Q%DN.G&:R#B-./M(JN,@\H](S%!7(H6>R_ M9=`+Q;CH$AFGNQY;9M55PV:>HYP\XV)F8CV]4%HU_IH!5BNT=^L2:*S*`ZI" M;;>E1$^L&W?H)?;O_P#>N@(R'N!:4QQ6XLTG#Z;KK8]"0G5".N'58RVG6X+Z MHWE=`(MWY9!1GZH+ZHTP\,9R0L20)==QSHHT.6D(SZGRJ(Y5%]="+CF?=UKM M1(3TTSX5`S&$R<603IDTBD>&.FKB8%%7N/IJ;BX+>EIL0J?(;E(<:IB9T\8S M+KI.(WWFINR268@T9YX:FQ'CN//"AA.``4C%4R)(XB95%1>W?4ZW:U]B+#&- M7+1E19U89D13CTUUUN?-PB(TY'_,Y&J)]*>^HU,D;E EFUPIC8R)0 MSF":-IIS*@[PD`)<3X+Q5$[JF/712:X`HW=MINT^:9/BU%IX@DZ/(9-DFQ=_ M*Y,.")X<]`^7YO1.^EP-*7/V_C-RJC"BQJ +`/$+0]( MG5["+BHJZO.M.7+;^I%BXZS).:`-`&@#0!H`T`:`HUG0:]28%-MU^C\T@2I! MOU1TFU8Z1..N`\QA2<5T^8Y113&2[_<"$MC;FMTO^#Y3IRR>ILR6]48+DM'( MS(.QY0"33?IE2=!$PO;*Z`?TBS;E@UVE70X\;U0ER)*URG+T$!F//%%40<1$ M-SRYL,"F27LBXT!\6?9%P4:;;LN8X]+%@9K4N(^XT;<)7U4VW8_%`7N@]->Y M=B_?0':Q:EP'9IP@8> 'YA0M`/X%%K="VZB42G$+]8A4]J$P[E$!'4!&^I\V/E!?FQ]DT M!4Y>VE>I]+K%$I;Y5&%48$8FW92L-*DRG&"`T2-`VF)#(H*FJ+]/==`3MRP[ MBN&E3A8HZ0S;\B]&"2;22))Q90R7(Y*"N`+:H'$54OJ5?;NH!<4.X:["?>8H MZ12B2J9+BM/FT,F7Y&4DEUHU`C`$PF&LG]657":`8URV[@KO\251F"L-Z;#I M\6G0Y#C8NNK`D.2C4U!7`#FKO` NB)\WMH!6@VG6*/?GX30K:C$*5\- O3! M62-M?1$+C[)H!A3;(N&3;U`H$XSIT6$Y+F5!UI672)WK'Y9GBXCH$*B\KB_+ MV44]]`?+%@UJ;3J#2:LBH-%CSX354$P5T%;<9^&RV\=T N@'=7H=;6\5J5,A M/1'W),#JU".^VL67";(?,!-CN+^8V'41H@#EW'YNRZ`OF@#0!H`T`:`-`&@# D0!H`T`:`-`&@#0!H`T`:`-`&@#0!H`T`:`-`&@#0!H`T!__9 ` end
.IN+;MS=^OO'\H_+00
MR:#>=U*EF6$3-N(+],."#E6_>!'Z4%BVTFYCU&*=B'6/=F9G8R$,@4*1C'&.
M]!I/HEV58Q2`.[.TWF/G!F#JIR#^3([4&OW'6Y[?K09#*K#.=B*QS^H-!#+8ZPB/T99#N+9#
M2;CL$H*A
`91`+]HBI;U"AQ@:`*R/H/[8"JB0I)>
E")3ANWJMW`U$0YB0B[;;B2IEZ7%?QBGSC
M#%#BD R:)SF`DOM<&V_E=9RQJ1;$Z
M$2M!P1C=>WUJ_P#35,U?$S9'"V\0_E"W>1S!5QRF_P#ZDPC'L9@1=L8/+>M1
ME*+J:&G:XO<1(6[KYIEE(J#Z$MDPFSC=V=LK>?ZE;D<:J93M(E;XGQ0+[^]=
M(E$8JH.DVD@#LK`'/=^])@?8/X*S\?2.=X``-'5Y#_\`?2KMBKQVLYDKNGND
M]G_WM=^V2+G[$0PZ/@CZKBD&'AWKS9.N.#1MH#V7-N"N=.FJ$%+24["UUL6(
MNQ'\RMRSJ;Z=N<_F4(4N<6M#W$$?$<0+Y]RU83,%R^0C$T=MFZW)2Y$!U1TG:#6
M$]^?I4O(7#J\EXP&W;F#<`'T=RNV0'1,OV1>W`=Z8YB+F-;$:=QS/:L!R6XD
M9982`"P`D7N.*Z8Y(C%3S6Q_%/%6
(;
MDJ4(S5`9V@X7!6H9MGDTDX[G*ZDY(&NROQ2DM!U8;`7X+5(B:[
RA8_)"W/FM[[>&YO\R!ZK5HH(Z&-Y
MC@9G!R^^WAN;_<@B%95"FYKG/-S[SJ\W8@WJ2@EQ##C,^4CFQW48RN?IE+@.
MCW(%ENK]4=/JYK;QWZO26@REJ'P.J&LO$SNW"VGE'&RTNEZZDJ&QQR.99DWM
M9-M>KAV((\8!P8R\_LQT/=`$'R`6[4%CR9T%738#+45+3'SZ=U1#$?>L(L#Y
MU%=.B"`@("`@("#=PBDWE1SA_1IH.G(\\-.I!%B%7SRO?-[U[NB/%P0;=?A]
M/$VH]A="V$@12DFTA[+'^2#"*DAYC#,*5\[Y,^8M<0!E-NH(,:"AAJ:::YRS
MY@V#LN038^6UD$,M.QE%#+8B5[WM>/BV0;+:&C&+3T\EQ3Q-<[3B+`?QVO?AV"UE
NX'XKN!4B_NROQ9\UGJAY
M3="2:'X+LS?BOU^^Z49>N?R?^&:?_`'G_`$H'KG\G_AFG_P!Y_P!*!ZY_)_X9
MI_\`>?\`2@>N?R?^&:?_`'G_`$H'KG\G_AFG_P!Y_P!*!ZY_)_X9I_\`>?\`
M2@R9RH
6[K'RJ(NI-B=F7R%XIC&UW&&*22**_"^[
M80VZJO?T)V1MWMA/ES$_>@RBV.V5B>'LPVGS#A=N;['7""SBC9"S)"UL;!P:
MP!H^861&2!J@("`@(*W%,%K9*EF,X1:/&J<96D^USQ]<$W:#U'B"MN.+>8:<
M\TF.FTZ>T^T^"34O.)IFT,K"655)5.#)()6]TQP/'Q'K"F6(WV./:9CNKL:V
MVP0876##ZE\U4(7[I]/&]X:ZVA+[91;RK4WN0I\0VDD@B><9K,SV@FSF]8\B
MY9Y$[T^IQ_`,/RXM,SXV[SD:V8KH\0DQ>?>RPY7AE5*;E\K[`VOJ;-737P^:
MY'3U?1X=Y)C,515BEPZ$5TT3K32BP@@[;RZW?V-9<]JK4L[\:UTX_?I?;Z_"Z"FV>?AL.'\\H6M$?,6$!SVWU(+K=+KXK
M>\%S
!%S=Z1"3.N[R?$I9JBGK:5V
M2LK<09'2R&I>:AC6R97,YNRT;66:;ARW5W6>T=W/DBMX[SV?18W36<^:S6\;
M#J"]?#:^MW?/YZ8NKIQ[E!3A\S1B,_=92Z"+J8T]?QB.)6,;F.N?V=.6T4G\
M/3QOO/NTWR/?W1N.I>/?)-O+V\>&M/#Q8-@@AV&H3-MA/B&'LW.'4S#%4N&C
M997>]MPTXJ#OT!`0$!`0$!`0$%K@LIDI*FDE`-,&&0]H/B052"BV\]SO[U2>
MD,0=]L7WO"BK]!R'*'WUP+Y6I]'*"N500$!`0$!`0$!`05&V[:AVR&)BFN9=
MR=!QM<9K?Y4')X0ZG.%4W-_:MV+?S^U4;2`@\