00013035232022-01-012022-12-310001303523dei:BusinessContactMember2022-01-012022-12-310001303523bti:AmericanDepositarySharesEvidencedByAmericanDepositaryReceiptsMember2022-01-012022-12-310001303523ifrs-full:OrdinarySharesMember2022-01-012022-12-310001303523bti:SevenPointSevenZeroPercentageNotesDueTwoThousandAndThirtyTwoMember2022-01-012022-12-310001303523bti:FourPointSevenFourTwoPercentageNotesDueTwoThousandAndThirtyTwoMember2022-01-012022-12-310001303523bti:FivePointSixFiveZeroPercentageNotesDueTwoThousandAndFiftyTwoMember2022-01-012022-12-310001303523bti:FourPointFourFourEightPercentageNotesDueTwoThousandAndTwentyEightMember2022-01-012022-12-310001303523bti:TwoPointTwoFiveNinePercentageNotesDueTwoThousandAndTwentyEightMember2022-01-012022-12-310001303523bti:TwoPointSevenTwoSixPercentageNotesDueTwoThousandAndThirtyOneMember2022-01-012022-12-310001303523bti:ThreePointSevenThreeFourPercentageNotesDueTwoThousandAndFortyMember2022-01-012022-12-310001303523bti:ThreePointNineEightFourPercentageNotesDueTwoThousandAndFiftyMember2022-01-012022-12-310001303523bti:OnePointSixSixEightPercentageNotesDueTwoThousandAndTwentySixMember2022-01-012022-12-310001303523bti:FourPointSevenZeroZeroPercentageNotesDueTwoThousandAndTwentySevenMember2022-01-012022-12-310001303523bti:FourPointNineZeroSixPercentageNotesDueTwoThousandAndThirtyMember2022-01-012022-12-310001303523bti:FivePointTwoEightTwoPercentageNotesDueTwoThousandAndFiftyMember2022-01-012022-12-310001303523bti:TwoPointSevenEightNinePercentageNotesDueTwoThousandAndTwentyFourMember2022-01-012022-12-310001303523bti:ThreePointTwoOneFivePercentageNotesDueTwoThousandAndTwentySixMember2022-01-012022-12-310001303523bti:ThreePointFourSixTwoPercentageNotesDueTwoThousandAndTwentyNineMember2022-01-012022-12-310001303523bti:FourPointSevenFiveEightPercentageNotesDueTwoThousandAndFortyNineMember2022-01-012022-12-310001303523bti:ThreePointTwoTwoTwoPercentageNotesDueTwoThousandAndTwentyFourMember2022-01-012022-12-310001303523bti:ThreePointFiveFiveSevenPercentageNotesDueTwoThousandAndTwentySevenMember2022-01-012022-12-310001303523bti:FourPointThreeNineZeroPercentageNotesDueTwoThousandAndThirtySevenMember2022-01-012022-12-310001303523bti:FourPointFiveFourZeroPercentageNotesDueTwoThousandAndFortySevenMember2022-01-012022-12-3100013035232022-12-31xbrli:sharesiso4217:GBP00013035232021-01-012021-12-3100013035232020-01-012020-12-31iso4217:GBPxbrli:shares0001303523ifrs-full:IssuedCapitalMember2021-12-310001303523bti:SharePremiumCapitalRedemptionAndMergerReservesMember2021-12-310001303523ifrs-full:OtherReservesMember2021-12-310001303523ifrs-full:RetainedEarningsMember2021-12-310001303523bti:ReserveForAssetsHeldForSaleMember2021-12-310001303523ifrs-full:EquityAttributableToOwnersOfParentMember2021-12-310001303523bti:PerpetualHybridBondsMember2021-12-310001303523ifrs-full:NoncontrollingInterestsMember2021-12-3100013035232021-12-310001303523ifrs-full:OtherReservesMember2022-01-012022-12-310001303523ifrs-full:RetainedEarningsMember2022-01-012022-12-310001303523ifrs-full:EquityAttributableToOwnersOfParentMember2022-01-012022-12-310001303523ifrs-full:NoncontrollingInterestsMember2022-01-012022-12-310001303523bti:PresentedInCIEMemberifrs-full:OtherReservesMember2022-01-012022-12-310001303523ifrs-full:EquityAttributableToOwnersOfParentMemberbti:PresentedInCIEMember2022-01-012022-12-310001303523bti:PresentedInCIEMember2022-01-012022-12-310001303523bti:SharePremiumCapitalRedemptionAndMergerReservesMember2022-01-012022-12-310001303523bti:HeldInEmployeeShareOwnershipTrustsMemberifrs-full:RetainedEarningsMember2022-01-012022-12-310001303523bti:HeldInEmployeeShareOwnershipTrustsMember2022-01-012022-12-310001303523bti:ReserveForAssetsHeldForSaleMember2022-01-012022-12-310001303523ifrs-full:IssuedCapitalMember2022-12-310001303523bti:SharePremiumCapitalRedemptionAndMergerReservesMember2022-12-310001303523ifrs-full:OtherReservesMember2022-12-310001303523ifrs-full:RetainedEarningsMember2022-12-310001303523bti:ReserveForAssetsHeldForSaleMember2022-12-310001303523ifrs-full:EquityAttributableToOwnersOfParentMember2022-12-310001303523bti:PerpetualHybridBondsMember2022-12-310001303523ifrs-full:NoncontrollingInterestsMember2022-12-310001303523ifrs-full:IssuedCapitalMember2020-12-310001303523bti:SharePremiumCapitalRedemptionAndMergerReservesMember2020-12-310001303523ifrs-full:OtherReservesMember2020-12-310001303523ifrs-full:RetainedEarningsMember2020-12-310001303523ifrs-full:EquityAttributableToOwnersOfParentMember2020-12-310001303523bti:PerpetualHybridBondsMember2020-12-310001303523ifrs-full:NoncontrollingInterestsMember2020-12-3100013035232020-12-310001303523ifrs-full:OtherReservesMember2021-01-012021-12-310001303523ifrs-full:RetainedEarningsMember2021-01-012021-12-310001303523ifrs-full:EquityAttributableToOwnersOfParentMember2021-01-012021-12-310001303523ifrs-full:NoncontrollingInterestsMember2021-01-012021-12-310001303523bti:PresentedInCIEMemberifrs-full:OtherReservesMember2021-01-012021-12-310001303523ifrs-full:EquityAttributableToOwnersOfParentMemberbti:PresentedInCIEMember2021-01-012021-12-310001303523bti:PresentedInCIEMember2021-01-012021-12-310001303523bti:SharePremiumCapitalRedemptionAndMergerReservesMember2021-01-012021-12-310001303523bti:HeldInEmployeeShareOwnershipTrustsMemberifrs-full:RetainedEarningsMember2021-01-012021-12-310001303523ifrs-full:EquityAttributableToOwnersOfParentMemberbti:HeldInEmployeeShareOwnershipTrustsMember2021-01-012021-12-310001303523bti:HeldInEmployeeShareOwnershipTrustsMember2021-01-012021-12-310001303523bti:PerpetualHybridBondsMember2021-01-012021-12-310001303523ifrs-full:IssuedCapitalMember2019-12-310001303523bti:SharePremiumCapitalRedemptionAndMergerReservesMember2019-12-310001303523ifrs-full:OtherReservesMember2019-12-310001303523ifrs-full:RetainedEarningsMember2019-12-310001303523ifrs-full:EquityAttributableToOwnersOfParentMember2019-12-310001303523ifrs-full:NoncontrollingInterestsMember2019-12-3100013035232019-12-310001303523ifrs-full:OtherReservesMember2020-01-012020-12-310001303523ifrs-full:RetainedEarningsMember2020-01-012020-12-310001303523ifrs-full:EquityAttributableToOwnersOfParentMember2020-01-012020-12-310001303523ifrs-full:NoncontrollingInterestsMember2020-01-012020-12-310001303523bti:PresentedInCIEMemberifrs-full:OtherReservesMember2020-01-012020-12-310001303523ifrs-full:EquityAttributableToOwnersOfParentMemberbti:PresentedInCIEMember2020-01-012020-12-310001303523bti:PresentedInCIEMember2020-01-012020-12-310001303523bti:SharePremiumCapitalRedemptionAndMergerReservesMember2020-01-012020-12-310001303523bti:HeldInEmployeeShareOwnershipTrustsMemberifrs-full:RetainedEarningsMember2020-01-012020-12-310001303523ifrs-full:EquityAttributableToOwnersOfParentMemberbti:HeldInEmployeeShareOwnershipTrustsMember2020-01-012020-12-310001303523bti:HeldInEmployeeShareOwnershipTrustsMember2020-01-012020-12-310001303523ifrs-full:BrandNamesMemberifrs-full:TopOfRangeMember2022-01-012022-12-310001303523ifrs-full:BottomOfRangeMemberifrs-full:ComputerSoftwareMember2022-01-012022-12-310001303523ifrs-full:TopOfRangeMemberifrs-full:ComputerSoftwareMember2022-01-012022-12-310001303523ifrs-full:TopOfRangeMemberbti:GlobalSoftwareSolutionsMember2020-12-312020-12-310001303523ifrs-full:TopOfRangeMemberbti:GlobalSoftwareSolutionsMember2022-01-012022-12-310001303523bti:GlobalSoftwareSolutionsMember2022-01-012022-12-310001303523bti:GlobalSoftwareSolutionsMember2021-01-012021-12-310001303523srt:ScenarioForecastMemberbti:GlobalSoftwareSolutionsMember2023-01-012023-12-310001303523bti:FreeholdLandOrAssetsClassifiedAsHeldForSaleMember2022-01-012022-12-31xbrli:pure0001303523ifrs-full:BottomOfRangeMemberifrs-full:LandAndBuildingsMember2022-01-012022-12-310001303523ifrs-full:TopOfRangeMemberifrs-full:LandAndBuildingsMember2022-01-012022-12-310001303523bti:PlantAndEquipmentMemberifrs-full:BottomOfRangeMember2022-01-012022-12-310001303523ifrs-full:TopOfRangeMemberbti:PlantAndEquipmentMember2022-01-012022-12-3100013035232021-09-272021-09-27bti:BONDiso4217:EUR0001303523bti:ReportedAtConstantRatesMemberbti:UnitedStatesSegmentMember2022-01-012022-12-310001303523bti:UnitedStatesSegmentMemberbti:TranslationExchangeMember2022-01-012022-12-310001303523bti:UnitedStatesSegmentMemberbti:ReportedMember2022-01-012022-12-310001303523bti:UnitedStatesSegmentMemberbti:ReportedMember2021-01-012021-12-310001303523bti:ReportedAtConstantRatesMemberbti:AmericasAndSubSaharanAfricaSegmentMember2022-01-012022-12-310001303523bti:TranslationExchangeMemberbti:AmericasAndSubSaharanAfricaSegmentMember2022-01-012022-12-310001303523bti:AmericasAndSubSaharanAfricaSegmentMemberbti:ReportedMember2022-01-012022-12-310001303523bti:AmericasAndSubSaharanAfricaSegmentMemberbti:ReportedMember2021-01-012021-12-310001303523bti:ReportedAtConstantRatesMemberbti:EuropeSegmentMember2022-01-012022-12-310001303523bti:TranslationExchangeMemberbti:EuropeSegmentMember2022-01-012022-12-310001303523bti:EuropeSegmentMemberbti:ReportedMember2022-01-012022-12-310001303523bti:EuropeSegmentMemberbti:ReportedMember2021-01-012021-12-310001303523bti:ReportedAtConstantRatesMemberbti:AsiaPacificAndMiddleEastSegmentMember2022-01-012022-12-310001303523bti:TranslationExchangeMemberbti:AsiaPacificAndMiddleEastSegmentMember2022-01-012022-12-310001303523bti:AsiaPacificAndMiddleEastSegmentMemberbti:ReportedMember2022-01-012022-12-310001303523bti:AsiaPacificAndMiddleEastSegmentMemberbti:ReportedMember2021-01-012021-12-310001303523bti:ReportedAtConstantRatesMember2022-01-012022-12-310001303523bti:TranslationExchangeMember2022-01-012022-12-310001303523bti:ReportedMember2022-01-012022-12-310001303523bti:ReportedMember2021-01-012021-12-310001303523bti:ReportedAtConstantRatesMemberbti:UnitedStatesSegmentMember2021-01-012021-12-310001303523bti:UnitedStatesSegmentMemberbti:TranslationExchangeMember2021-01-012021-12-310001303523bti:UnitedStatesSegmentMemberbti:ReportedMember2020-01-012020-12-310001303523bti:ReportedAtConstantRatesMemberbti:AmericasAndSubSaharanAfricaSegmentMember2021-01-012021-12-310001303523bti:TranslationExchangeMemberbti:AmericasAndSubSaharanAfricaSegmentMember2021-01-012021-12-310001303523bti:AmericasAndSubSaharanAfricaSegmentMemberbti:ReportedMember2020-01-012020-12-310001303523bti:ReportedAtConstantRatesMemberbti:EuropeSegmentMember2021-01-012021-12-310001303523bti:TranslationExchangeMemberbti:EuropeSegmentMember2021-01-012021-12-310001303523bti:EuropeSegmentMemberbti:ReportedMember2020-01-012020-12-310001303523bti:ReportedAtConstantRatesMemberbti:AsiaPacificAndMiddleEastSegmentMember2021-01-012021-12-310001303523bti:TranslationExchangeMemberbti:AsiaPacificAndMiddleEastSegmentMember2021-01-012021-12-310001303523bti:AsiaPacificAndMiddleEastSegmentMemberbti:ReportedMember2020-01-012020-12-310001303523bti:ReportedAtConstantRatesMember2021-01-012021-12-310001303523bti:TranslationExchangeMember2021-01-012021-12-310001303523bti:ReportedMember2020-01-012020-12-310001303523bti:UnitedStatesSegmentMemberbti:AdjustedAtConstantRatesMember2022-01-012022-12-310001303523bti:UnitedStatesSegmentMemberbti:AdjustedAtCurrentRatesMember2022-01-012022-12-310001303523bti:UnitedStatesSegmentMemberbti:AdjustingItemsMember2022-01-012022-12-310001303523bti:UnitedStatesSegmentMemberbti:AdjustedAtCurrentRatesMember2021-01-012021-12-310001303523bti:UnitedStatesSegmentMemberbti:AdjustingItemsMember2021-01-012021-12-310001303523bti:AdjustedAtConstantRatesMemberbti:AmericasAndSubSaharanAfricaSegmentMember2022-01-012022-12-310001303523bti:AmericasAndSubSaharanAfricaSegmentMemberbti:AdjustedAtCurrentRatesMember2022-01-012022-12-310001303523bti:AmericasAndSubSaharanAfricaSegmentMemberbti:AdjustingItemsMember2022-01-012022-12-310001303523bti:AmericasAndSubSaharanAfricaSegmentMemberbti:AdjustedAtCurrentRatesMember2021-01-012021-12-310001303523bti:AmericasAndSubSaharanAfricaSegmentMemberbti:AdjustingItemsMember2021-01-012021-12-310001303523bti:AdjustedAtConstantRatesMemberbti:EuropeSegmentMember2022-01-012022-12-310001303523bti:EuropeSegmentMemberbti:AdjustedAtCurrentRatesMember2022-01-012022-12-310001303523bti:EuropeSegmentMemberbti:AdjustingItemsMember2022-01-012022-12-310001303523bti:EuropeSegmentMemberbti:AdjustedAtCurrentRatesMember2021-01-012021-12-310001303523bti:EuropeSegmentMemberbti:AdjustingItemsMember2021-01-012021-12-310001303523bti:AdjustedAtConstantRatesMemberbti:AsiaPacificAndMiddleEastSegmentMember2022-01-012022-12-310001303523bti:AsiaPacificAndMiddleEastSegmentMemberbti:AdjustedAtCurrentRatesMember2022-01-012022-12-310001303523bti:AsiaPacificAndMiddleEastSegmentMemberbti:AdjustingItemsMember2022-01-012022-12-310001303523bti:AsiaPacificAndMiddleEastSegmentMemberbti:AdjustedAtCurrentRatesMember2021-01-012021-12-310001303523bti:AsiaPacificAndMiddleEastSegmentMemberbti:AdjustingItemsMember2021-01-012021-12-310001303523bti:AdjustedAtConstantRatesMember2022-01-012022-12-310001303523bti:AdjustedAtCurrentRatesMember2022-01-012022-12-310001303523bti:AdjustingItemsMember2022-01-012022-12-310001303523bti:AdjustedAtCurrentRatesMember2021-01-012021-12-310001303523bti:AdjustingItemsMember2021-01-012021-12-310001303523bti:UnitedStatesSegmentMemberbti:AdjustedAtConstantRatesMember2021-01-012021-12-310001303523bti:UnitedStatesSegmentMemberbti:AdjustedAtCurrentRatesMember2020-01-012020-12-310001303523bti:UnitedStatesSegmentMemberbti:AdjustingItemsMember2020-01-012020-12-310001303523bti:AdjustedAtConstantRatesMemberbti:AmericasAndSubSaharanAfricaSegmentMember2021-01-012021-12-310001303523bti:AmericasAndSubSaharanAfricaSegmentMemberbti:AdjustedAtCurrentRatesMember2020-01-012020-12-310001303523bti:AmericasAndSubSaharanAfricaSegmentMemberbti:AdjustingItemsMember2020-01-012020-12-310001303523bti:AdjustedAtConstantRatesMemberbti:EuropeSegmentMember2021-01-012021-12-310001303523bti:EuropeSegmentMemberbti:AdjustedAtCurrentRatesMember2020-01-012020-12-310001303523bti:EuropeSegmentMemberbti:AdjustingItemsMember2020-01-012020-12-310001303523bti:AdjustedAtConstantRatesMemberbti:AsiaPacificAndMiddleEastSegmentMember2021-01-012021-12-310001303523bti:AsiaPacificAndMiddleEastSegmentMemberbti:AdjustedAtCurrentRatesMember2020-01-012020-12-310001303523bti:AsiaPacificAndMiddleEastSegmentMemberbti:AdjustingItemsMember2020-01-012020-12-310001303523bti:AdjustedAtConstantRatesMember2021-01-012021-12-310001303523bti:AdjustedAtCurrentRatesMember2020-01-012020-12-310001303523bti:AdjustingItemsMember2020-01-012020-12-310001303523bti:AdjustedAtConstantRatesMember2020-01-012020-12-310001303523bti:NewCategoriesMember2022-01-012022-12-310001303523bti:NewCategoriesMember2021-01-012021-12-310001303523bti:NewCategoriesMember2020-01-012020-12-310001303523bti:NewCategoriesMemberbti:VapourMember2022-01-012022-12-310001303523bti:NewCategoriesMemberbti:VapourMember2021-01-012021-12-310001303523bti:NewCategoriesMemberbti:VapourMember2020-01-012020-12-310001303523bti:THPMemberbti:NewCategoriesMember2022-01-012022-12-310001303523bti:THPMemberbti:NewCategoriesMember2021-01-012021-12-310001303523bti:THPMemberbti:NewCategoriesMember2020-01-012020-12-310001303523bti:NewCategoriesMemberbti:ModernOralMember2022-01-012022-12-310001303523bti:NewCategoriesMemberbti:ModernOralMember2021-01-012021-12-310001303523bti:NewCategoriesMemberbti:ModernOralMember2020-01-012020-12-310001303523bti:TraditionalOralMember2022-01-012022-12-310001303523bti:TraditionalOralMember2021-01-012021-12-310001303523bti:TraditionalOralMember2020-01-012020-12-310001303523bti:CombustiblesMember2022-01-012022-12-310001303523bti:CombustiblesMember2021-01-012021-12-310001303523bti:CombustiblesMember2020-01-012020-12-310001303523bti:OthersMember2022-01-012022-12-310001303523bti:OthersMember2021-01-012021-12-310001303523bti:OthersMember2020-01-012020-12-310001303523country:GB2022-01-012022-12-310001303523country:GB2021-01-012021-12-310001303523country:GB2020-01-012020-12-310001303523ifrs-full:ForeignCountriesMember2022-01-012022-12-310001303523ifrs-full:ForeignCountriesMember2021-01-012021-12-310001303523ifrs-full:ForeignCountriesMember2020-01-012020-12-310001303523country:GB2022-12-310001303523country:GB2021-12-310001303523ifrs-full:ForeignCountriesMember2022-12-310001303523ifrs-full:ForeignCountriesMember2021-12-310001303523bti:UnitedStatesSegmentMemberbti:ReynoldsAmericanIncMember2022-01-012022-12-310001303523bti:UnitedStatesSegmentMemberbti:ReynoldsAmericanIncMember2021-01-012021-12-310001303523bti:UnitedStatesSegmentMemberbti:ReynoldsAmericanIncMember2020-01-012020-12-310001303523bti:UnitedStatesSegmentMemberbti:ReynoldsAmericanIncMember2022-12-310001303523bti:UnitedStatesSegmentMemberbti:ReynoldsAmericanIncMember2021-12-310001303523ifrs-full:GoodwillMember2022-12-310001303523ifrs-full:GoodwillMember2021-12-310001303523bti:ITCLtdMember2022-12-310001303523bti:ITCLtdMember2021-12-310001303523bti:ReynoldsAmericanFundedRetirementPlanMembercountry:US2022-12-31iso4217:USD0001303523bti:ReynoldsAmericanFundedRetirementPlanMembercountry:US2021-12-310001303523bti:ReynoldsAmericanFundedRetirementPlanMembercountry:US2022-01-012022-12-310001303523country:US2021-01-012021-12-310001303523ifrs-full:BrandNamesMember2022-01-012022-12-310001303523ifrs-full:BrandNamesMember2021-01-012021-12-310001303523ifrs-full:BrandNamesMember2020-01-012020-12-310001303523ifrs-full:ComputerSoftwareMember2022-01-012022-12-310001303523ifrs-full:ComputerSoftwareMember2021-01-012021-12-310001303523ifrs-full:ComputerSoftwareMember2020-01-012020-12-310001303523ifrs-full:PropertyPlantAndEquipmentMember2022-01-012022-12-310001303523ifrs-full:PropertyPlantAndEquipmentMember2021-01-012021-12-310001303523ifrs-full:PropertyPlantAndEquipmentMember2020-01-012020-12-310001303523ifrs-full:BrandNamesMemberbti:AdjustingItemsMember2022-01-012022-12-310001303523ifrs-full:BrandNamesMemberbti:AdjustingItemsMember2021-01-012021-12-310001303523ifrs-full:BrandNamesMemberbti:AdjustingItemsMember2020-01-012020-12-310001303523country:MM2021-01-012021-12-310001303523bti:COVIDNineteenCrisisMembercountry:PE2021-01-012021-12-310001303523country:MY2020-01-012020-12-310001303523bti:TwispProprietaryLimitedMember2020-01-012020-12-310001303523bti:BlueNileCigaretteCompanyLimitedMember2020-01-012020-12-310001303523country:BR2022-01-012022-12-310001303523country:BR2022-01-012022-12-310001303523country:BR2021-01-012021-12-310001303523country:BR2020-01-012020-12-310001303523bti:RJRTMemberbti:MasterSettlementAgreementMember2021-01-012021-12-310001303523bti:ExciseDisputeInTurkeySouthKoreaAndRussiaMember2022-01-012022-12-310001303523bti:ExciseDisputeInTurkeySouthKoreaAndRussiaMember2021-01-012021-12-310001303523bti:ExciseDisputeInTurkeySouthKoreaAndRussiaMember2020-01-012020-12-310001303523bti:DOJOFACInvestigationMember2022-01-012022-12-310001303523bti:DOJOFACInvestigationMember2021-01-012021-12-310001303523bti:DOJOFACInvestigationMember2020-01-012020-12-310001303523bti:CompetitionInvestigationsMember2022-01-012022-12-310001303523bti:CompetitionInvestigationsMember2021-01-012021-12-310001303523bti:CompetitionInvestigationsMember2020-01-012020-12-310001303523bti:RJReynoldsTobaccoCompanyMemberbti:NonParticipatingManufacturerAdjustmentClaimsRelatedToPeriodFrom2003To2012Memberbti:MasterSettlementAgreementMember2012-01-012012-12-31bti:State0001303523bti:RJReynoldsTobaccoCompanyMemberbti:NonParticipatingManufacturerAdjustmentClaimsRelatedToPeriodFrom2003To2012Memberbti:MasterSettlementAgreementMember2013-01-012013-12-310001303523bti:RJReynoldsTobaccoCompanyMemberbti:NonParticipatingManufacturerAdjustmentClaimsRelatedToPeriodFrom2003To2012Memberbti:MasterSettlementAgreementMember2014-01-012014-12-310001303523bti:NonParticipatingManufacturerAdjustmentClaimsRelatedToPeriodFrom2004To2014Memberbti:RJReynoldsTobaccoCompanyMemberbti:FiveYearPeriodFrom2016Memberbti:MasterSettlementAgreementMember2015-01-012015-12-310001303523bti:NonParticipatingManufacturerAdjustmentClaimsRelatedToPeriodFrom2004To2014Memberbti:RJReynoldsTobaccoCompanyMemberbti:MasterSettlementAgreementMember2014-01-012014-12-310001303523bti:RJReynoldsTobaccoCompanyMemberbti:NonParticipatingManufacturerAdjustmentClaimsRelatedToPeriodFrom2003To2012Memberbti:MasterSettlementAgreementMember2016-01-012016-12-310001303523bti:RJReynoldsTobaccoCompanyMemberbti:NonParticipatingManufacturerAdjustmentClaimsRelatedToPeriodFrom2003To2012Memberbti:MasterSettlementAgreementMember2017-01-012017-12-310001303523bti:NonParticipatingManufacturerAdjustmentClaimsRelatedToPeriodFrom2004To2014Memberbti:RJReynoldsTobaccoCompanyMemberbti:FiveYearPeriodFrom2017Memberbti:MasterSettlementAgreementMember2017-01-012017-12-310001303523bti:RJReynoldsTobaccoCompanyMemberbti:NonParticipatingManufacturerAdjustmentClaimsRelatedToPeriodFrom2004To2019Memberbti:MasterSettlementAgreementMember2018-01-012018-12-310001303523bti:NonParticipatingManufacturerAdjustmentClaimsRelatedToPeriodFrom2004To2017Memberbti:RJReynoldsTobaccoCompanyMemberbti:MasterSettlementAgreementMemberbti:FiveYearPeriodFrom2018Member2018-01-012018-12-310001303523bti:RJReynoldsTobaccoCompanyMemberbti:NonParticipatingManufacturerAdjustmentClaimsRelatedToPeriodFrom2004To2024Memberbti:MasterSettlementAgreementMember2018-01-012018-12-310001303523bti:NonParticipatingManufacturerAdjustmentClaimsRelatedToPeriodFrom2004To2017Memberbti:RJReynoldsTobaccoCompanyMemberbti:FiveYearPeriodFrom2019Memberbti:MasterSettlementAgreementMember2019-01-012019-12-310001303523bti:RJReynoldsTobaccoCompanyMemberbti:NonParticipatingManufacturerAdjustmentClaimsRelatedToPeriodFrom2004To2024Memberbti:MasterSettlementAgreementMember2020-01-012020-03-310001303523bti:RJReynoldsTobaccoCompanyMemberbti:FiveYearPeriodFrom2019Memberbti:NonParticipatingManufacturerAdjustmentClaimsRelatedToPeriodFrom2004To2018Memberbti:MasterSettlementAgreementMember2022-01-012022-12-310001303523bti:RJReynoldsTobaccoCompanyMemberstpr:FLbti:PaymentObligationMember2020-01-012020-12-310001303523bti:ResolutionOfClaimsMemberbti:RJReynoldsTobaccoCompanyMemberbti:TexasMinnesotaAndMississippiMember2020-01-012020-12-310001303523bti:RJReynoldsTobaccoCompanyMemberbti:TexasMinnesotaAndMississippiMember2020-01-012020-12-310001303523bti:RJReynoldsTobaccoCompanyMemberbti:FinalResolutionMemberbti:TexasAndMinnesotaMember2021-01-012021-12-310001303523bti:ResolutionOfClaimsMemberbti:RJReynoldsTobaccoCompanyMember2022-01-012022-12-310001303523bti:RJReynoldsTobaccoCompanyMemberbti:MSAAndStateSettlementAgreementsMember2022-01-012022-12-310001303523bti:RJReynoldsTobaccoCompanyMemberbti:MSAAndStateSettlementAgreementsMember2021-01-012021-12-310001303523bti:RJReynoldsTobaccoCompanyMemberbti:MSAAndStateSettlementAgreementsMember2020-01-012020-12-310001303523bti:EngleAndOtherLitigationsCostsMember2022-01-012022-12-310001303523bti:EngleAndOtherLitigationsCostsMember2021-01-012021-12-310001303523bti:EngleAndOtherLitigationsCostsMember2020-01-012020-12-310001303523bti:RJReynoldsTobaccoCompanyMemberstpr:ILbti:MasterSettlementAgreementMember2014-01-012014-12-310001303523bti:RJReynoldsTobaccoCompanyMemberbti:PaymentObligationMemberbti:FloridaTexasMinnesotaAndMississippiMember2020-01-012020-12-310001303523bti:RJReynoldsTobaccoCompanyMemberbti:TexasMinnesotaAndMississippiMemberbti:PaymentObligationMember2020-01-012020-12-310001303523bti:BATParsCompanyPJSCMember2021-01-012021-12-310001303523bti:BATParsCompanyPJSCMember2021-08-062021-08-060001303523bti:BATParsCompanyPJSCMember2022-01-012022-12-310001303523country:TRbti:BATTutunMember2021-11-012021-11-300001303523country:TRbti:BATTutunMemberbti:TaxDisputesInTurkeyMember2021-11-012021-11-300001303523country:TRbti:BATTutunMemberbti:TaxDisputesInTurkeyMemberbti:ExciseAndPenaltiesDisputesMember2021-11-012021-11-300001303523country:TRbti:BATTutunMemberbti:TaxDisputesInTurkeyMemberbti:InterestInNetFinanceCostsMember2021-11-012021-11-300001303523country:TRbti:BATTutunMemberbti:TaxDisputesInTurkeyMemberbti:TaxationMember2021-11-012021-11-300001303523bti:ValueAddedTaxMemberbti:TaxReassessmentMemberbti:BATKoreaMembercountry:KR2021-09-162021-09-160001303523bti:ExciseDisputeInRussiaMember2019-01-012019-12-310001303523bti:ExciseDisputeInRussiaMember2020-01-012020-12-310001303523ifrs-full:MiscellaneousOtherProvisionsMemberbti:DOJOFACInvestigationMember2022-01-012022-12-310001303523bti:NigerianCourtMemberbti:CompetitionInvestigationsMember2022-01-012022-12-310001303523ifrs-full:DiscontinuedOperationsMemberbti:BATRussiaMember2022-01-012022-12-310001303523bti:ParentCompanyAndGroupAuditMemberbti:KPMGLLPFirmsAndAssociatesMember2022-01-012022-12-310001303523bti:ParentCompanyAndGroupAuditMemberbti:KPMGLLPFirmsAndAssociatesMember2021-01-012021-12-310001303523bti:ParentCompanyAndGroupAuditMemberbti:KPMGLLPFirmsAndAssociatesMember2020-01-012020-12-310001303523bti:KPMGLLPFirmsAndAssociatesMemberbti:LocalStatutoryAndGroupReportingAuditsMember2022-01-012022-12-310001303523bti:KPMGLLPFirmsAndAssociatesMemberbti:LocalStatutoryAndGroupReportingAuditsMember2021-01-012021-12-310001303523bti:KPMGLLPFirmsAndAssociatesMemberbti:LocalStatutoryAndGroupReportingAuditsMember2020-01-012020-12-310001303523bti:ParentCompanyLocalStatutoryAndGroupAuditsMemberbti:KPMGLLPFirmsAndAssociatesMember2022-01-012022-12-310001303523bti:ParentCompanyLocalStatutoryAndGroupAuditsMemberbti:KPMGLLPFirmsAndAssociatesMember2021-01-012021-12-310001303523bti:ParentCompanyLocalStatutoryAndGroupAuditsMemberbti:KPMGLLPFirmsAndAssociatesMember2020-01-012020-12-310001303523bti:KPMGLLPFirmsAndAssociatesMemberbti:OtherFirmsMember2022-01-012022-12-310001303523bti:KPMGLLPFirmsAndAssociatesMemberbti:OtherFirmsMember2021-01-012021-12-310001303523bti:KPMGLLPFirmsAndAssociatesMemberbti:OtherFirmsMember2020-01-012020-12-310001303523bti:KPMGLLPFirmsAndAssociatesMemberbti:AuditProviderMember2022-01-012022-12-310001303523bti:KPMGLLPFirmsAndAssociatesMemberbti:AuditProviderMember2021-01-012021-12-310001303523bti:KPMGLLPFirmsAndAssociatesMemberbti:AuditProviderMember2020-01-012020-12-310001303523bti:AuditRelatedAssuranceServicesMemberbti:KPMGLLPFirmsAndAssociatesMember2022-01-012022-12-310001303523bti:AuditRelatedAssuranceServicesMemberbti:KPMGLLPFirmsAndAssociatesMember2021-01-012021-12-310001303523bti:AuditRelatedAssuranceServicesMemberbti:KPMGLLPFirmsAndAssociatesMember2020-01-012020-12-310001303523bti:OtherAssuranceServicesMemberbti:KPMGLLPFirmsAndAssociatesMember2022-01-012022-12-310001303523bti:OtherAssuranceServicesMemberbti:KPMGLLPFirmsAndAssociatesMember2021-01-012021-12-310001303523bti:OtherAssuranceServicesMemberbti:KPMGLLPFirmsAndAssociatesMember2020-01-012020-12-310001303523bti:TaxAdvisoryServicesMemberbti:KPMGLLPFirmsAndAssociatesMember2022-01-012022-12-310001303523bti:TaxAdvisoryServicesMemberbti:KPMGLLPFirmsAndAssociatesMember2021-01-012021-12-310001303523bti:TaxAdvisoryServicesMemberbti:KPMGLLPFirmsAndAssociatesMember2020-01-012020-12-310001303523bti:TaxComplianceServicesMemberbti:KPMGLLPFirmsAndAssociatesMember2022-01-012022-12-310001303523bti:TaxComplianceServicesMemberbti:KPMGLLPFirmsAndAssociatesMember2021-01-012021-12-310001303523bti:TaxComplianceServicesMemberbti:KPMGLLPFirmsAndAssociatesMember2020-01-012020-12-310001303523bti:KPMGLLPFirmsAndAssociatesMemberbti:DefinedBenefitSchemesMember2022-01-012022-12-310001303523bti:KPMGLLPFirmsAndAssociatesMemberbti:DefinedBenefitSchemesMember2021-01-012021-12-310001303523bti:KPMGLLPFirmsAndAssociatesMemberbti:DefinedBenefitSchemesMember2020-01-012020-12-310001303523bti:OtherNonAuditServicesMemberbti:KPMGLLPFirmsAndAssociatesMember2022-01-012022-12-310001303523bti:OtherNonAuditServicesMemberbti:KPMGLLPFirmsAndAssociatesMember2021-01-012021-12-310001303523bti:OtherNonAuditServicesMemberbti:KPMGLLPFirmsAndAssociatesMember2020-01-012020-12-310001303523bti:KPMGLLPFirmsAndAssociatesMember2022-01-012022-12-310001303523bti:KPMGLLPFirmsAndAssociatesMember2021-01-012021-12-310001303523bti:KPMGLLPFirmsAndAssociatesMember2020-01-012020-12-310001303523bti:KPMGLLPFirmsAndAssociatesMember2022-01-012022-12-310001303523bti:KPMGLLPFirmsAndAssociatesMember2021-01-012021-12-310001303523bti:KPMGLLPFirmsAndAssociatesMember2020-01-012020-12-310001303523bti:SECRegulationsMemberbti:KPMGLLPFirmsAndAssociatesMember2022-01-012022-12-310001303523bti:SECRegulationsMemberbti:KPMGLLPFirmsAndAssociatesMember2021-01-012021-12-310001303523bti:SECRegulationsMemberbti:KPMGLLPFirmsAndAssociatesMember2020-01-012020-12-310001303523bti:AccountingFirmsMemberbti:SECRegulationsMember2022-01-012022-12-310001303523bti:AccountingFirmsMemberbti:SECRegulationsMember2021-01-012021-12-310001303523bti:AccountingFirmsMemberbti:SECRegulationsMember2020-01-012020-12-310001303523bti:FactoryRationalisationPartialReversalOfPreviouslyEstimatedImpairmentMember2021-01-012021-12-310001303523bti:ReynoldsAmericanIncMember2021-01-012021-12-310001303523ifrs-full:MachineryMembercountry:ID2020-01-012020-12-3100013035232020-10-3100013035232020-11-300001303523bti:AdjustingItemsWhichHaveBeenAdjustedWithinNetFinanceCostsMember2021-01-012021-12-310001303523bti:AdjustingItemsWhichHaveBeenAdjustedWithinNetFinanceCostsMember2020-01-012020-12-310001303523bti:AdjustingItemsWhichHaveBeenAdjustedWithinNetFinanceCostsMemberbti:FrankedInvestmentIncomeGroupLitigationOrderMember2022-01-012022-12-310001303523bti:AdjustingItemsWhichHaveBeenAdjustedWithinNetFinanceCostsMemberbti:FrankedInvestmentIncomeGroupLitigationOrderMember2021-01-012021-12-310001303523bti:AdjustingItemsWhichHaveBeenAdjustedWithinNetFinanceCostsMemberbti:FrankedInvestmentIncomeGroupLitigationOrderMember2020-01-012020-12-310001303523bti:FactoryClosureInSwitzerlandMemberbti:AdjustingItemsWhichHaveBeenAdjustedWithinNetFinanceCostsMember2022-01-012022-12-310001303523bti:AdjustingItemsWhichHaveBeenAdjustedWithinNetFinanceCostsMemberbti:AmnestyTaxPaymentInTurkeyMember2021-01-012021-12-310001303523bti:AdjustingItemsWhichHaveBeenAdjustedWithinNetFinanceCostsMemberbti:RussiaExciseDisputeMember2020-01-012020-12-310001303523country:RU2022-01-012022-12-310001303523bti:AdjustingItemsWhichHaveBeenAdjustedWithinNetFinanceCostsMember2021-01-012021-12-310001303523bti:AdjustingItemsWhichHaveBeenAdjustedWithinNetFinanceCostsMember2022-01-012022-12-310001303523bti:AssociatesAndJointVenturesMember2022-01-012022-12-310001303523bti:GroupsShareInAssociatesAndJointVenturesMember2022-01-012022-12-310001303523bti:AssociatesAndJointVenturesMember2021-01-012021-12-310001303523bti:GroupsShareInAssociatesAndJointVenturesMember2021-01-012021-12-310001303523bti:AssociatesAndJointVenturesMember2020-01-012020-12-310001303523bti:GroupsShareInAssociatesAndJointVenturesMember2020-01-012020-12-310001303523bti:ITCLtdMember2021-01-012021-12-310001303523bti:ITCLtdMember2022-01-012022-12-310001303523bti:ITCLtdMember2020-01-012020-12-310001303523bti:ITCLtdMember2019-01-012019-12-310001303523bti:OrganigramIncMember2022-01-012022-12-310001303523bti:OrganigramIncMember2021-01-012021-12-310001303523bti:OrganigramIncMember2020-01-012020-12-310001303523bti:UnitedIndustriesCompanyLimitedMember2022-01-012022-12-310001303523bti:KamaranIndustryAndInvestmentCompanyMember2021-01-012021-12-310001303523bti:TisakDDMember2021-01-012021-12-310001303523bti:OtherAssociatesMember2022-01-012022-12-310001303523bti:GroupsAssociatesAndJointVenturesMember2022-01-012022-12-310001303523bti:OtherAssociatesMember2021-01-012021-12-310001303523bti:GroupsAssociatesAndJointVenturesMember2021-01-012021-12-310001303523bti:OtherAssociatesMember2020-01-012020-12-310001303523bti:GroupsAssociatesAndJointVenturesMember2020-01-012020-12-310001303523ifrs-full:CountryOfDomicileMember2022-01-012022-12-310001303523ifrs-full:CountryOfDomicileMember2021-01-012021-12-310001303523ifrs-full:CountryOfDomicileMember2020-01-012020-12-310001303523bti:FrankedInvestmentIncomeGroupLitigationOrderMember2022-01-012022-12-31bti:CorporateGroup0001303523bti:FrankedInvestmentIncomeGroupLitigationOrderMember2014-01-012014-12-310001303523bti:FrankedInvestmentIncomeGroupLitigationOrderMember2021-07-012021-07-310001303523bti:FrankedInvestmentIncomeGroupLitigationOrderMember2015-01-012015-12-310001303523bti:PerpetualHybridBondsMember2022-01-012022-12-310001303523bti:PerpetualHybridBondsMember2021-01-012021-12-310001303523ifrs-full:SubsidiariesMember2022-01-012022-12-310001303523ifrs-full:SubsidiariesMember2021-01-012021-12-310001303523ifrs-full:SubsidiariesMember2020-01-012020-12-310001303523ifrs-full:AssociatesMember2022-01-012022-12-310001303523ifrs-full:AssociatesMember2021-01-012021-12-310001303523ifrs-full:AssociatesMember2020-01-012020-12-310001303523ifrs-full:GoodwillMemberifrs-full:GrossCarryingAmountMember2021-12-310001303523ifrs-full:ComputerSoftwareMemberifrs-full:GrossCarryingAmountMember2021-12-310001303523ifrs-full:BrandNamesMemberifrs-full:GrossCarryingAmountMember2021-12-310001303523ifrs-full:IntangibleAssetsUnderDevelopmentMemberifrs-full:GrossCarryingAmountMember2021-12-310001303523ifrs-full:GrossCarryingAmountMember2021-12-310001303523ifrs-full:ComputerSoftwareMemberifrs-full:AccumulatedDepreciationAmortisationAndImpairmentMember2021-12-310001303523ifrs-full:BrandNamesMemberifrs-full:AccumulatedDepreciationAmortisationAndImpairmentMember2021-12-310001303523ifrs-full:AccumulatedDepreciationAmortisationAndImpairmentMember2021-12-310001303523ifrs-full:ComputerSoftwareMember2021-12-310001303523ifrs-full:BrandNamesMember2021-12-310001303523ifrs-full:IntangibleAssetsUnderDevelopmentMember2021-12-310001303523ifrs-full:GoodwillMember2022-01-012022-12-310001303523ifrs-full:ComputerSoftwareMember2022-01-012022-12-310001303523ifrs-full:BrandNamesMember2022-01-012022-12-310001303523ifrs-full:IntangibleAssetsUnderDevelopmentMember2022-01-012022-12-310001303523ifrs-full:InternallyGeneratedMemberifrs-full:GoodwillMember2022-01-012022-12-310001303523ifrs-full:InternallyGeneratedMemberifrs-full:ComputerSoftwareMember2022-01-012022-12-310001303523ifrs-full:BrandNamesMemberifrs-full:InternallyGeneratedMember2022-01-012022-12-310001303523ifrs-full:InternallyGeneratedMemberifrs-full:IntangibleAssetsUnderDevelopmentMember2022-01-012022-12-310001303523ifrs-full:InternallyGeneratedMember2022-01-012022-12-310001303523ifrs-full:GoodwillMemberifrs-full:NotInternallyGeneratedMember2022-01-012022-12-310001303523ifrs-full:ComputerSoftwareMemberifrs-full:NotInternallyGeneratedMember2022-01-012022-12-310001303523ifrs-full:BrandNamesMemberifrs-full:NotInternallyGeneratedMember2022-01-012022-12-310001303523ifrs-full:IntangibleAssetsUnderDevelopmentMemberifrs-full:NotInternallyGeneratedMember2022-01-012022-12-310001303523ifrs-full:NotInternallyGeneratedMember2022-01-012022-12-310001303523ifrs-full:GoodwillMemberifrs-full:GrossCarryingAmountMember2022-12-310001303523ifrs-full:ComputerSoftwareMemberifrs-full:GrossCarryingAmountMember2022-12-310001303523ifrs-full:BrandNamesMemberifrs-full:GrossCarryingAmountMember2022-12-310001303523ifrs-full:IntangibleAssetsUnderDevelopmentMemberifrs-full:GrossCarryingAmountMember2022-12-310001303523ifrs-full:GrossCarryingAmountMember2022-12-310001303523ifrs-full:ComputerSoftwareMemberifrs-full:AccumulatedDepreciationAmortisationAndImpairmentMember2022-12-310001303523ifrs-full:BrandNamesMemberifrs-full:AccumulatedDepreciationAmortisationAndImpairmentMember2022-12-310001303523ifrs-full:IntangibleAssetsUnderDevelopmentMemberifrs-full:AccumulatedDepreciationAmortisationAndImpairmentMember2022-12-310001303523ifrs-full:AccumulatedDepreciationAmortisationAndImpairmentMember2022-12-310001303523ifrs-full:ComputerSoftwareMember2022-12-310001303523ifrs-full:BrandNamesMember2022-12-310001303523ifrs-full:IntangibleAssetsUnderDevelopmentMember2022-12-310001303523ifrs-full:GoodwillMemberifrs-full:GrossCarryingAmountMember2020-12-310001303523ifrs-full:ComputerSoftwareMemberifrs-full:GrossCarryingAmountMember2020-12-310001303523ifrs-full:BrandNamesMemberifrs-full:GrossCarryingAmountMember2020-12-310001303523ifrs-full:IntangibleAssetsUnderDevelopmentMemberifrs-full:GrossCarryingAmountMember2020-12-310001303523ifrs-full:GrossCarryingAmountMember2020-12-310001303523ifrs-full:ComputerSoftwareMemberifrs-full:AccumulatedDepreciationAmortisationAndImpairmentMember2020-12-310001303523ifrs-full:BrandNamesMemberifrs-full:AccumulatedDepreciationAmortisationAndImpairmentMember2020-12-310001303523ifrs-full:AccumulatedDepreciationAmortisationAndImpairmentMember2020-12-310001303523ifrs-full:GoodwillMember2020-12-310001303523ifrs-full:ComputerSoftwareMember2020-12-310001303523ifrs-full:BrandNamesMember2020-12-310001303523ifrs-full:IntangibleAssetsUnderDevelopmentMember2020-12-310001303523ifrs-full:GoodwillMember2021-01-012021-12-310001303523ifrs-full:ComputerSoftwareMember2021-01-012021-12-310001303523ifrs-full:BrandNamesMember2021-01-012021-12-310001303523ifrs-full:IntangibleAssetsUnderDevelopmentMember2021-01-012021-12-310001303523ifrs-full:InternallyGeneratedMemberifrs-full:GoodwillMember2021-01-012021-12-310001303523ifrs-full:InternallyGeneratedMemberifrs-full:ComputerSoftwareMember2021-01-012021-12-310001303523ifrs-full:BrandNamesMemberifrs-full:InternallyGeneratedMember2021-01-012021-12-310001303523ifrs-full:InternallyGeneratedMemberifrs-full:IntangibleAssetsUnderDevelopmentMember2021-01-012021-12-310001303523ifrs-full:InternallyGeneratedMember2021-01-012021-12-310001303523ifrs-full:GoodwillMemberifrs-full:NotInternallyGeneratedMember2021-01-012021-12-310001303523ifrs-full:ComputerSoftwareMemberifrs-full:NotInternallyGeneratedMember2021-01-012021-12-310001303523ifrs-full:BrandNamesMemberifrs-full:NotInternallyGeneratedMember2021-01-012021-12-310001303523ifrs-full:IntangibleAssetsUnderDevelopmentMemberifrs-full:NotInternallyGeneratedMember2021-01-012021-12-310001303523ifrs-full:NotInternallyGeneratedMember2021-01-012021-12-310001303523bti:RAIGoodwillMemberbti:ReynoldsAmericanIncMember2022-12-310001303523bti:RAIGoodwillMemberbti:ReynoldsAmericanIncMember2021-12-310001303523bti:RothmansGroupMember2022-12-310001303523bti:RothmansGroupMember2021-12-310001303523bti:ImperialTobaccoCanadaMember2022-12-310001303523bti:ImperialTobaccoCanadaMember2021-12-310001303523bti:ETIMember2022-12-310001303523bti:ETIMember2021-12-310001303523bti:SkandinaviskTobakskompagniMember2022-12-310001303523bti:SkandinaviskTobakskompagniMember2021-12-310001303523ifrs-full:BrandNamesMemberbti:ReynoldsAmericanIncMember2022-12-310001303523ifrs-full:BrandNamesMemberbti:ReynoldsAmericanIncMember2021-12-310001303523ifrs-full:TopOfRangeMemberifrs-full:BrandNamesMemberbti:ReynoldsAmericanIncMember2022-01-012022-12-310001303523bti:TrademarksAndSimilarIntangiblesMemberbti:ReynoldsAmericanIncMember2022-12-310001303523bti:TrademarksAndSimilarIntangiblesMemberbti:ReynoldsAmericanIncMember2021-12-310001303523ifrs-full:InternallyGeneratedMemberbti:ComputerSoftwareAndIntangibleAssetsUnderDevelopmentMemberifrs-full:GrossCarryingAmountMember2022-01-012022-12-310001303523ifrs-full:InternallyGeneratedMemberbti:ComputerSoftwareAndIntangibleAssetsUnderDevelopmentMemberifrs-full:GrossCarryingAmountMember2021-01-012021-12-310001303523bti:NewportMemberifrs-full:BrandNamesMember2022-12-310001303523bti:NewportMemberifrs-full:BrandNamesMember2021-12-310001303523ifrs-full:BrandNamesMemberbti:CamelMember2022-12-310001303523ifrs-full:BrandNamesMemberbti:CamelMember2021-12-310001303523ifrs-full:BrandNamesMemberbti:PallMallMember2022-12-310001303523ifrs-full:BrandNamesMemberbti:PallMallMember2021-12-310001303523ifrs-full:BrandNamesMemberbti:NaturalAmericanSpiritMember2022-12-310001303523ifrs-full:BrandNamesMemberbti:NaturalAmericanSpiritMember2021-12-310001303523ifrs-full:BrandNamesMemberbti:CamelSnusMember2022-12-310001303523ifrs-full:BrandNamesMemberbti:CamelSnusMember2021-12-310001303523ifrs-full:BrandNamesMemberbti:GrizzlyMember2022-12-310001303523ifrs-full:BrandNamesMemberbti:GrizzlyMember2021-12-310001303523ifrs-full:BrandNamesMember2022-12-310001303523ifrs-full:BrandNamesMember2021-12-31bti:CASHGENERATINGUNIT0001303523country:US2022-01-012022-12-310001303523bti:AmericasAndSubSaharanAfricaMember2022-01-012022-12-310001303523bti:AmericasAndSubSaharanAfricaMember2021-01-012021-12-310001303523bti:EuropeAndNorthAfricaMember2022-01-012022-12-310001303523bti:EuropeAndNorthAfricaMember2021-01-012021-12-310001303523bti:AsiaPacificAndMiddleEastMember2022-01-012022-12-310001303523bti:AsiaPacificAndMiddleEastMember2021-01-012021-12-310001303523bti:ReynoldsAmericanIncMember2022-12-310001303523bti:ReynoldsAmericanIncMember2021-12-310001303523srt:EuropeMember2022-12-310001303523srt:EuropeMember2021-12-310001303523country:CA2022-12-310001303523country:CA2021-12-310001303523country:AU2022-12-310001303523country:AU2021-12-310001303523country:ZA2022-12-310001303523country:ZA2021-12-310001303523country:SG2022-12-310001303523country:SG2021-12-310001303523bti:GlobalTravelRetailMember2022-12-310001303523bti:GlobalTravelRetailMember2021-12-310001303523country:MY2022-12-310001303523country:MY2021-12-310001303523country:PE2022-12-310001303523country:PE2021-12-310001303523bti:OtherCountriesMember2022-12-310001303523bti:OtherCountriesMember2021-12-310001303523country:MY2022-01-012022-12-310001303523bti:SouthAfricaCashGeneratingUnitMember2022-01-012022-12-310001303523country:PE2021-01-012021-12-310001303523bti:ReynoldsAmericanIncMember2022-01-012022-12-310001303523bti:NewportMember2022-12-310001303523bti:CamelMember2022-12-310001303523bti:PallMallGrizzlyCamelSnusNaturalAmericanSpiritMember2022-12-310001303523bti:RAIGoodwillMemberbti:ReynoldsAmericanIncMemberbti:DecreaseInRevenueMember2022-12-310001303523bti:NewportMemberbti:ReynoldsAmericanIncMemberbti:DecreaseInRevenueMember2022-12-310001303523bti:ReynoldsAmericanIncMemberbti:DecreaseInRevenueMemberbti:CamelMember2022-12-310001303523bti:ReynoldsAmericanIncMemberbti:DecreaseInRevenueMemberbti:PallMallMember2022-12-310001303523bti:GrizzlyMemberbti:ReynoldsAmericanIncMemberbti:DecreaseInRevenueMember2022-12-310001303523bti:ReynoldsAmericanIncMemberbti:DecreaseInRevenueMemberbti:CamelSnusMember2022-12-310001303523bti:RAIGoodwillMemberbti:ReynoldsAmericanIncMember2022-01-012022-12-310001303523bti:NewportMemberbti:ReynoldsAmericanIncMember2022-01-012022-12-310001303523bti:ReynoldsAmericanIncMemberbti:CamelMember2022-01-012022-12-310001303523bti:ReynoldsAmericanIncMemberbti:PallMallMember2022-01-012022-12-310001303523bti:GrizzlyMemberbti:ReynoldsAmericanIncMember2022-01-012022-12-310001303523bti:ReynoldsAmericanIncMemberbti:CamelSnusMember2022-01-012022-12-310001303523bti:DecreaseInTerminalValueRateMemberbti:RAIGoodwillMemberbti:ReynoldsAmericanIncMember2022-12-310001303523bti:DecreaseInTerminalValueRateMemberbti:NewportMemberbti:ReynoldsAmericanIncMember2022-12-310001303523bti:DecreaseInTerminalValueRateMemberbti:ReynoldsAmericanIncMemberbti:CamelMember2022-12-310001303523bti:DecreaseInTerminalValueRateMemberbti:ReynoldsAmericanIncMemberbti:PallMallMember2022-12-310001303523bti:GrizzlyMemberbti:DecreaseInTerminalValueRateMemberbti:ReynoldsAmericanIncMember2022-12-310001303523bti:DecreaseInTerminalValueRateMemberbti:ReynoldsAmericanIncMemberbti:CamelSnusMember2022-12-310001303523bti:ReynoldsAmericanIncMember2022-12-310001303523bti:IncreaseInPreTaxDiscountRateMemberbti:ReynoldsAmericanIncMember2022-01-012022-12-310001303523bti:ReynoldsAmericanIncMemberbti:DecreaseInLongTermGrowthRatesMember2022-01-012022-12-310001303523bti:CamelSnusMember2022-12-310001303523bti:IncreaseInPreTaxDiscountRateMemberbti:CamelSnusMember2022-01-012022-12-310001303523bti:CamelSnusMemberbti:DecreaseInLongTermGrowthRatesMember2022-01-012022-12-310001303523bti:ImperialTobaccoCanadaMember2022-01-012022-12-310001303523bti:ImperialTobaccoCanadaMemberbti:DecreaseInRevenueMember2022-12-310001303523bti:ImperialTobaccoCanadaMember2022-01-012022-12-310001303523ifrs-full:GrossCarryingAmountMemberbti:FreeholdPropertyMember2021-12-310001303523ifrs-full:GrossCarryingAmountMemberbti:LeaseholdPropertyMember2021-12-310001303523bti:PlantEquipmentAndOtherOwnedMemberifrs-full:GrossCarryingAmountMember2021-12-310001303523bti:PlantEquipmentAndOtherLeasedMemberifrs-full:GrossCarryingAmountMember2021-12-310001303523ifrs-full:ConstructionInProgressMemberifrs-full:GrossCarryingAmountMember2021-12-310001303523ifrs-full:AccumulatedDepreciationAmortisationAndImpairmentMemberbti:FreeholdPropertyMember2021-12-310001303523ifrs-full:AccumulatedDepreciationAmortisationAndImpairmentMemberbti:LeaseholdPropertyMember2021-12-310001303523bti:PlantEquipmentAndOtherOwnedMemberifrs-full:AccumulatedDepreciationAmortisationAndImpairmentMember2021-12-310001303523bti:PlantEquipmentAndOtherLeasedMemberifrs-full:AccumulatedDepreciationAmortisationAndImpairmentMember2021-12-310001303523bti:FreeholdPropertyMember2021-12-310001303523bti:LeaseholdPropertyMember2021-12-310001303523bti:PlantEquipmentAndOtherOwnedMember2021-12-310001303523bti:PlantEquipmentAndOtherLeasedMember2021-12-310001303523ifrs-full:ConstructionInProgressMember2021-12-310001303523bti:FreeholdPropertyMember2022-01-012022-12-310001303523bti:LeaseholdPropertyMember2022-01-012022-12-310001303523bti:PlantEquipmentAndOtherOwnedMember2022-01-012022-12-310001303523bti:PlantEquipmentAndOtherLeasedMember2022-01-012022-12-310001303523ifrs-full:ConstructionInProgressMember2022-01-012022-12-310001303523ifrs-full:RightofuseAssetsMemberbti:FreeholdPropertyMember2022-01-012022-12-310001303523ifrs-full:RightofuseAssetsMemberbti:LeaseholdPropertyMember2022-01-012022-12-310001303523bti:PlantEquipmentAndOtherOwnedMemberifrs-full:RightofuseAssetsMember2022-01-012022-12-310001303523bti:PlantEquipmentAndOtherLeasedMemberifrs-full:RightofuseAssetsMember2022-01-012022-12-310001303523ifrs-full:ConstructionInProgressMemberifrs-full:RightofuseAssetsMember2022-01-012022-12-310001303523ifrs-full:RightofuseAssetsMember2022-01-012022-12-310001303523ifrs-full:GrossCarryingAmountMemberbti:FreeholdPropertyMember2022-12-310001303523ifrs-full:GrossCarryingAmountMemberbti:LeaseholdPropertyMember2022-12-310001303523bti:PlantEquipmentAndOtherOwnedMemberifrs-full:GrossCarryingAmountMember2022-12-310001303523bti:PlantEquipmentAndOtherLeasedMemberifrs-full:GrossCarryingAmountMember2022-12-310001303523ifrs-full:ConstructionInProgressMemberifrs-full:GrossCarryingAmountMember2022-12-310001303523ifrs-full:AccumulatedDepreciationAmortisationAndImpairmentMemberbti:FreeholdPropertyMember2022-12-310001303523ifrs-full:AccumulatedDepreciationAmortisationAndImpairmentMemberbti:LeaseholdPropertyMember2022-12-310001303523bti:PlantEquipmentAndOtherOwnedMemberifrs-full:AccumulatedDepreciationAmortisationAndImpairmentMember2022-12-310001303523bti:PlantEquipmentAndOtherLeasedMemberifrs-full:AccumulatedDepreciationAmortisationAndImpairmentMember2022-12-310001303523bti:FreeholdPropertyMember2022-12-310001303523bti:LeaseholdPropertyMember2022-12-310001303523bti:PlantEquipmentAndOtherOwnedMember2022-12-310001303523bti:PlantEquipmentAndOtherLeasedMember2022-12-310001303523ifrs-full:ConstructionInProgressMember2022-12-310001303523ifrs-full:GrossCarryingAmountMemberbti:FreeholdPropertyMember2020-12-310001303523ifrs-full:GrossCarryingAmountMemberbti:LeaseholdPropertyMember2020-12-310001303523bti:PlantEquipmentAndOtherOwnedMemberifrs-full:GrossCarryingAmountMember2020-12-310001303523bti:PlantEquipmentAndOtherLeasedMemberifrs-full:GrossCarryingAmountMember2020-12-310001303523ifrs-full:ConstructionInProgressMemberifrs-full:GrossCarryingAmountMember2020-12-310001303523ifrs-full:AccumulatedDepreciationAmortisationAndImpairmentMemberbti:FreeholdPropertyMember2020-12-310001303523ifrs-full:AccumulatedDepreciationAmortisationAndImpairmentMemberbti:LeaseholdPropertyMember2020-12-310001303523bti:PlantEquipmentAndOtherOwnedMemberifrs-full:AccumulatedDepreciationAmortisationAndImpairmentMember2020-12-310001303523bti:PlantEquipmentAndOtherLeasedMemberifrs-full:AccumulatedDepreciationAmortisationAndImpairmentMember2020-12-310001303523bti:FreeholdPropertyMember2020-12-310001303523bti:LeaseholdPropertyMember2020-12-310001303523bti:PlantEquipmentAndOtherOwnedMember2020-12-310001303523bti:PlantEquipmentAndOtherLeasedMember2020-12-310001303523ifrs-full:ConstructionInProgressMember2020-12-310001303523bti:FreeholdPropertyMember2021-01-012021-12-310001303523bti:LeaseholdPropertyMember2021-01-012021-12-310001303523bti:PlantEquipmentAndOtherOwnedMember2021-01-012021-12-310001303523bti:PlantEquipmentAndOtherLeasedMember2021-01-012021-12-310001303523ifrs-full:ConstructionInProgressMember2021-01-012021-12-310001303523ifrs-full:RightofuseAssetsMemberbti:FreeholdPropertyMember2021-01-012021-12-310001303523ifrs-full:RightofuseAssetsMemberbti:LeaseholdPropertyMember2021-01-012021-12-310001303523bti:PlantEquipmentAndOtherOwnedMemberifrs-full:RightofuseAssetsMember2021-01-012021-12-310001303523bti:PlantEquipmentAndOtherLeasedMemberifrs-full:RightofuseAssetsMember2021-01-012021-12-310001303523ifrs-full:ConstructionInProgressMemberifrs-full:RightofuseAssetsMember2021-01-012021-12-310001303523ifrs-full:RightofuseAssetsMember2021-01-012021-12-310001303523bti:RussiaAndBelarusSubsidiariesMember2022-01-012022-12-310001303523bti:BatParsCompanyPjscMember2021-01-012021-12-310001303523bti:ESGInvestmentEquipmentMember2022-01-012022-12-310001303523bti:IAS16Memberbti:PropertyAcquiredMember2022-12-310001303523bti:IAS16Memberbti:PropertyAcquiredMember2021-12-310001303523bti:RightOfUsePropertiesMemberbti:IFRS16Member2022-12-310001303523bti:RightOfUsePropertiesMemberbti:IFRS16Member2021-12-310001303523ifrs-full:BottomOfRangeMemberbti:BrazilBangladeshGermanyMexicoRomaniaSingaporeAndVietnamMemberbti:LeaseholdPropertyMember2022-01-012022-12-310001303523bti:LongLeaseholdPropertyMember2022-12-310001303523bti:LongLeaseholdPropertyMember2021-12-310001303523bti:ShortLeaseholdPropertyMember2022-12-310001303523bti:ShortLeaseholdPropertyMember2021-12-310001303523bti:ShortTermAndLongTermLeaseholdPropertyMember2022-12-310001303523bti:ShortTermAndLongTermLeaseholdPropertyMember2021-12-310001303523bti:IAS16Memberbti:PropertyAcquiredMember2022-01-012022-12-310001303523bti:RightOfUsePropertiesMemberbti:IFRS16Member2022-01-012022-12-310001303523bti:ShortTermAndLongTermLeaseholdPropertyMember2022-01-012022-12-310001303523bti:IAS16Memberbti:PropertyAcquiredMember2020-12-310001303523bti:IAS16Memberbti:PropertyAcquiredMember2021-01-012021-12-310001303523bti:RightOfUsePropertiesMemberbti:IFRS16Member2020-12-310001303523bti:RightOfUsePropertiesMemberbti:IFRS16Member2021-01-012021-12-310001303523bti:ShortTermAndLongTermLeaseholdPropertyMember2020-12-310001303523bti:ShortTermAndLongTermLeaseholdPropertyMember2021-01-012021-12-310001303523bti:USUKBangladeshIndonesiaAndSouthKoreaMemberbti:FreeholdPropertyMember2022-12-310001303523bti:USUKBangladeshIndonesiaAndSouthKoreaMemberbti:FreeholdPropertyMember2021-12-310001303523bti:FreeholdLandMemberifrs-full:GrossCarryingAmountMember2022-12-310001303523bti:FreeholdLandMemberifrs-full:GrossCarryingAmountMember2021-12-310001303523bti:AssociatesAndJointVenturesMember2021-12-310001303523bti:AssociatesAndJointVenturesMember2020-12-310001303523bti:AssociatesAndJointVenturesMember2022-12-310001303523bti:OtherLeadAssociatesMember2022-12-310001303523bti:OtherLeadAssociatesMember2021-12-310001303523bti:OtherListedAssociatesMember2022-12-310001303523bti:OtherListedAssociatesMember2021-12-310001303523bti:UnlistedAssociatesMember2022-12-310001303523bti:UnlistedAssociatesMember2021-12-310001303523bti:OrganigramIncMember2021-03-110001303523bti:OrganigramIncMember2022-12-310001303523ifrs-full:IntangibleAssetsOtherThanGoodwillMemberbti:OrganigramIncMember2021-03-112021-03-110001303523ifrs-full:GoodwillMemberbti:OrganigramIncMember2021-03-112021-03-110001303523bti:OrganigramIncMember2021-12-310001303523bti:TisakDDMember2016-01-012016-12-310001303523bti:TisakDDMember2017-01-012017-12-310001303523bti:CharlottesWebHoldingsIncMember2022-11-300001303523bti:CharlottesWebHoldingsIncMember2022-01-012022-12-310001303523ifrs-full:WhollyOrPartlyFundedDefinedBenefitPlansMember2022-01-012022-12-310001303523ifrs-full:WhollyOrPartlyFundedDefinedBenefitPlansMemberbti:FundedDefinedBenefitMember2022-01-012022-12-310001303523ifrs-full:PensionDefinedBenefitPlansMembercountry:US2022-01-012022-12-310001303523bti:ReynoldsAmericanFundedRetirementPlanMembercountry:US2021-01-012021-12-310001303523bti:BritishAmericanTobaccoUkPensionFundMemberifrs-full:WhollyOrPartlyFundedDefinedBenefitPlansMembercountry:GB2020-03-310001303523ifrs-full:PensionDefinedBenefitPlansMembercountry:GBbti:SolvencyLiabilitiesBasisMember2020-01-012020-03-310001303523bti:BritishAmericanTobaccoUkPensionFundMember2022-12-310001303523bti:BritishAmericanTobaccoUkPensionFundMember2021-12-310001303523bti:BritishAmericanTobaccoUkPensionFundMemberifrs-full:WhollyOrPartlyFundedDefinedBenefitPlansMembercountry:GB2021-01-012021-12-310001303523bti:BritishAmericanTobaccoUkPensionFundMemberifrs-full:WhollyOrPartlyFundedDefinedBenefitPlansMembercountry:GB2022-12-310001303523bti:BritishAmericanTobaccoUkPensionFundMemberifrs-full:WhollyOrPartlyFundedDefinedBenefitPlansMembercountry:GB2022-01-012022-12-310001303523bti:InterimPaymentMemberbti:BritishAmericanTobaccoUkPensionFundMemberifrs-full:WhollyOrPartlyFundedDefinedBenefitPlansMembercountry:GB2022-01-012022-12-310001303523bti:BritishAmericanTobaccoUkPensionFundMemberifrs-full:WhollyOrPartlyFundedDefinedBenefitPlansMembercountry:GB2021-12-310001303523bti:BritishAmericanTobaccoUkPensionFundMemberbti:TemporaryLiquidityFacilityMemberifrs-full:WhollyOrPartlyFundedDefinedBenefitPlansMembercountry:GB2022-10-260001303523bti:BritishAmericanTobaccoUkPensionFundMemberbti:TemporaryLiquidityFacilityMemberifrs-full:WhollyOrPartlyFundedDefinedBenefitPlansMembercountry:GB2022-10-262022-10-260001303523bti:BritishAmericanTobaccoUkPensionFundMemberbti:TemporaryLiquidityFacilityMembercountry:GBifrs-full:WhollyOrPartlyFundedDefinedBenefitPlansMemberbti:SONIAMember2022-10-260001303523bti:BuyInContractMembercountry:GB2021-05-192021-05-190001303523bti:BuyInContractMembercountry:GB2022-10-262022-10-260001303523bti:BuyInContractMembercountry:GB2022-10-260001303523bti:BuyInContractMembercountry:GB2022-12-310001303523bti:BuyInContractMembercountry:GB2021-12-310001303523ifrs-full:PensionDefinedBenefitPlansMembercountry:GB2022-01-012022-12-310001303523country:DEifrs-full:PensionDefinedBenefitPlansMemberifrs-full:WhollyOrPartlyFundedDefinedBenefitPlansMember2022-01-012022-12-310001303523country:DEifrs-full:PensionDefinedBenefitPlansMember2022-12-310001303523bti:GroupOfCountriesMemberifrs-full:PensionDefinedBenefitPlansMemberifrs-full:WhollyOrPartlyFundedDefinedBenefitPlansMember2022-01-012022-12-310001303523bti:GroupOfCountriesMemberifrs-full:PensionDefinedBenefitPlansMember2022-12-310001303523country:NLifrs-full:PensionDefinedBenefitPlansMemberbti:SchemesInSurplusOnlyMember2022-12-310001303523country:NLifrs-full:PensionDefinedBenefitPlansMemberbti:SchemesInSurplusOnlyMember2021-12-310001303523country:DEifrs-full:PensionDefinedBenefitPlansMemberbti:SchemesInSurplusOnlyMember2022-12-310001303523country:DEifrs-full:PensionDefinedBenefitPlansMemberbti:SchemesInSurplusOnlyMember2021-12-310001303523ifrs-full:PensionDefinedBenefitPlansMembercountry:CAbti:SchemesInSurplusOnlyMember2022-12-310001303523ifrs-full:PensionDefinedBenefitPlansMembercountry:CAbti:SchemesInSurplusOnlyMember2021-12-310001303523country:CAbti:ImascoPensionFundSocietyPlanMember2021-01-012021-12-31iso4217:CAD0001303523bti:ImascoPensionFundSocietyPlanMember2022-12-310001303523bti:UnitedStatesAndUnitedKingdomMember2022-12-310001303523bti:UnitedStatesAndCanadaMember2022-12-310001303523ifrs-full:PensionDefinedBenefitPlansMemberifrs-full:WhollyOrPartlyFundedDefinedBenefitPlansMember2022-12-310001303523ifrs-full:PensionDefinedBenefitPlansMemberifrs-full:WhollyOrPartlyFundedDefinedBenefitPlansMember2021-12-310001303523ifrs-full:WhollyOrPartlyFundedDefinedBenefitPlansMemberifrs-full:PostemploymentMedicalDefinedBenefitPlansMember2022-12-310001303523ifrs-full:WhollyOrPartlyFundedDefinedBenefitPlansMemberifrs-full:PostemploymentMedicalDefinedBenefitPlansMember2021-12-310001303523ifrs-full:WhollyOrPartlyFundedDefinedBenefitPlansMember2022-12-310001303523ifrs-full:WhollyOrPartlyFundedDefinedBenefitPlansMember2021-12-310001303523ifrs-full:PensionDefinedBenefitPlansMember2022-12-310001303523ifrs-full:PensionDefinedBenefitPlansMember2021-12-310001303523ifrs-full:PostemploymentMedicalDefinedBenefitPlansMember2022-12-310001303523ifrs-full:PostemploymentMedicalDefinedBenefitPlansMember2021-12-310001303523ifrs-full:PensionDefinedBenefitPlansMemberifrs-full:WhollyUnfundedDefinedBenefitPlansMember2022-12-310001303523ifrs-full:PensionDefinedBenefitPlansMemberifrs-full:WhollyUnfundedDefinedBenefitPlansMember2021-12-310001303523ifrs-full:WhollyUnfundedDefinedBenefitPlansMemberifrs-full:PostemploymentMedicalDefinedBenefitPlansMember2022-12-310001303523ifrs-full:WhollyUnfundedDefinedBenefitPlansMemberifrs-full:PostemploymentMedicalDefinedBenefitPlansMember2021-12-310001303523ifrs-full:WhollyUnfundedDefinedBenefitPlansMember2022-12-310001303523ifrs-full:WhollyUnfundedDefinedBenefitPlansMember2021-12-310001303523ifrs-full:PensionDefinedBenefitPlansMembercountry:US2022-12-310001303523ifrs-full:PensionDefinedBenefitPlansMembercountry:US2021-12-310001303523ifrs-full:PensionDefinedBenefitPlansMembercountry:GB2022-12-310001303523ifrs-full:PensionDefinedBenefitPlansMembercountry:GB2021-12-310001303523country:DEifrs-full:PensionDefinedBenefitPlansMember2021-12-310001303523ifrs-full:PensionDefinedBenefitPlansMembercountry:CA2022-12-310001303523ifrs-full:PensionDefinedBenefitPlansMembercountry:CA2021-12-310001303523country:NLifrs-full:PensionDefinedBenefitPlansMember2022-12-310001303523country:NLifrs-full:PensionDefinedBenefitPlansMember2021-12-310001303523ifrs-full:PensionDefinedBenefitPlansMembercountry:CH2022-12-310001303523ifrs-full:PensionDefinedBenefitPlansMembercountry:CH2021-12-310001303523ifrs-full:PensionDefinedBenefitPlansMemberbti:RestOfGroupMember2022-12-310001303523ifrs-full:PensionDefinedBenefitPlansMemberbti:RestOfGroupMember2021-12-310001303523ifrs-full:PensionDefinedBenefitPlansMembercountry:GB2021-01-012021-12-310001303523ifrs-full:PensionDefinedBenefitPlansMembercountry:US2021-01-012021-12-310001303523country:USifrs-full:PostemploymentMedicalDefinedBenefitPlansMember2022-01-012022-12-310001303523country:USifrs-full:PostemploymentMedicalDefinedBenefitPlansMember2021-01-012021-12-310001303523ifrs-full:PensionDefinedBenefitPlansMember2022-01-012022-12-310001303523ifrs-full:PensionDefinedBenefitPlansMember2021-01-012021-12-310001303523ifrs-full:PostemploymentMedicalDefinedBenefitPlansMember2022-01-012022-12-310001303523ifrs-full:PostemploymentMedicalDefinedBenefitPlansMember2021-01-012021-12-310001303523ifrs-full:PensionDefinedBenefitPlansMemberifrs-full:PresentValueOfDefinedBenefitObligationMember2021-12-310001303523ifrs-full:PensionDefinedBenefitPlansMemberifrs-full:PresentValueOfDefinedBenefitObligationMember2020-12-310001303523ifrs-full:PresentValueOfDefinedBenefitObligationMemberifrs-full:PostemploymentMedicalDefinedBenefitPlansMember2021-12-310001303523ifrs-full:PresentValueOfDefinedBenefitObligationMemberifrs-full:PostemploymentMedicalDefinedBenefitPlansMember2020-12-310001303523ifrs-full:PresentValueOfDefinedBenefitObligationMember2021-12-310001303523ifrs-full:PresentValueOfDefinedBenefitObligationMember2020-12-310001303523ifrs-full:PensionDefinedBenefitPlansMemberifrs-full:PresentValueOfDefinedBenefitObligationMember2022-01-012022-12-310001303523ifrs-full:PensionDefinedBenefitPlansMemberifrs-full:PresentValueOfDefinedBenefitObligationMember2021-01-012021-12-310001303523ifrs-full:PresentValueOfDefinedBenefitObligationMemberifrs-full:PostemploymentMedicalDefinedBenefitPlansMember2022-01-012022-12-310001303523ifrs-full:PresentValueOfDefinedBenefitObligationMemberifrs-full:PostemploymentMedicalDefinedBenefitPlansMember2021-01-012021-12-310001303523ifrs-full:PresentValueOfDefinedBenefitObligationMember2022-01-012022-12-310001303523ifrs-full:PresentValueOfDefinedBenefitObligationMember2021-01-012021-12-310001303523ifrs-full:PensionDefinedBenefitPlansMemberifrs-full:PresentValueOfDefinedBenefitObligationMember2022-12-310001303523ifrs-full:PresentValueOfDefinedBenefitObligationMemberifrs-full:PostemploymentMedicalDefinedBenefitPlansMember2022-12-310001303523ifrs-full:PresentValueOfDefinedBenefitObligationMember2022-12-310001303523bti:ActiveMemberifrs-full:PensionDefinedBenefitPlansMember2022-12-310001303523bti:ActiveMemberifrs-full:PensionDefinedBenefitPlansMember2021-12-310001303523bti:ActiveMemberifrs-full:PostemploymentMedicalDefinedBenefitPlansMember2022-12-310001303523bti:ActiveMemberifrs-full:PostemploymentMedicalDefinedBenefitPlansMember2021-12-310001303523bti:ActiveMember2022-12-310001303523bti:ActiveMember2021-12-310001303523ifrs-full:PensionDefinedBenefitPlansMemberbti:DeferredMember2022-12-310001303523ifrs-full:PensionDefinedBenefitPlansMemberbti:DeferredMember2021-12-310001303523bti:DeferredMemberifrs-full:PostemploymentMedicalDefinedBenefitPlansMember2022-12-310001303523bti:DeferredMemberifrs-full:PostemploymentMedicalDefinedBenefitPlansMember2021-12-310001303523bti:DeferredMember2022-12-310001303523bti:DeferredMember2021-12-310001303523bti:RetiredMemberifrs-full:PensionDefinedBenefitPlansMember2022-12-310001303523bti:RetiredMemberifrs-full:PensionDefinedBenefitPlansMember2021-12-310001303523bti:RetiredMemberifrs-full:PostemploymentMedicalDefinedBenefitPlansMember2022-12-310001303523bti:RetiredMemberifrs-full:PostemploymentMedicalDefinedBenefitPlansMember2021-12-310001303523bti:RetiredMember2022-12-310001303523bti:RetiredMember2021-12-310001303523ifrs-full:PensionDefinedBenefitPlansMemberifrs-full:PlanAssetsMember2021-12-310001303523ifrs-full:PensionDefinedBenefitPlansMemberifrs-full:PlanAssetsMember2020-12-310001303523ifrs-full:PlanAssetsMemberifrs-full:PostemploymentMedicalDefinedBenefitPlansMember2021-12-310001303523ifrs-full:PlanAssetsMemberifrs-full:PostemploymentMedicalDefinedBenefitPlansMember2020-12-310001303523ifrs-full:PlanAssetsMember2021-12-310001303523ifrs-full:PlanAssetsMember2020-12-310001303523ifrs-full:PensionDefinedBenefitPlansMemberifrs-full:PlanAssetsMember2022-01-012022-12-310001303523ifrs-full:PensionDefinedBenefitPlansMemberifrs-full:PlanAssetsMember2021-01-012021-12-310001303523ifrs-full:PlanAssetsMemberifrs-full:PostemploymentMedicalDefinedBenefitPlansMember2022-01-012022-12-310001303523ifrs-full:PlanAssetsMemberifrs-full:PostemploymentMedicalDefinedBenefitPlansMember2021-01-012021-12-310001303523ifrs-full:PlanAssetsMember2022-01-012022-12-310001303523ifrs-full:PlanAssetsMember2021-01-012021-12-310001303523ifrs-full:PensionDefinedBenefitPlansMemberifrs-full:PlanAssetsMember2022-12-310001303523ifrs-full:PlanAssetsMemberifrs-full:PostemploymentMedicalDefinedBenefitPlansMember2022-12-310001303523ifrs-full:PlanAssetsMember2022-12-310001303523ifrs-full:PensionDefinedBenefitPlansMemberifrs-full:PlanAssetsMemberbti:ListedMember2022-12-310001303523ifrs-full:PensionDefinedBenefitPlansMemberifrs-full:PlanAssetsMemberbti:ListedMember2021-12-310001303523ifrs-full:PlanAssetsMemberifrs-full:PostemploymentMedicalDefinedBenefitPlansMemberbti:ListedMember2022-12-310001303523ifrs-full:PlanAssetsMemberifrs-full:PostemploymentMedicalDefinedBenefitPlansMemberbti:ListedMember2021-12-310001303523bti:ListedMember2022-12-310001303523bti:ListedMember2021-12-310001303523bti:UnlistedMemberifrs-full:PensionDefinedBenefitPlansMemberifrs-full:PlanAssetsMember2022-12-310001303523bti:UnlistedMemberifrs-full:PensionDefinedBenefitPlansMemberifrs-full:PlanAssetsMember2021-12-310001303523bti:UnlistedMemberifrs-full:PlanAssetsMemberifrs-full:PostemploymentMedicalDefinedBenefitPlansMember2022-12-310001303523bti:UnlistedMemberifrs-full:PlanAssetsMemberifrs-full:PostemploymentMedicalDefinedBenefitPlansMember2021-12-310001303523bti:UnlistedMember2022-12-310001303523bti:UnlistedMember2021-12-310001303523bti:UnlistedMemberifrs-full:PlanAssetsMemberbti:UnitedKingdomAndCanadaMemberifrs-full:PostemploymentMedicalDefinedBenefitPlansMember2022-12-310001303523bti:UnlistedMemberifrs-full:PlanAssetsMemberbti:UnitedKingdomAndCanadaMemberifrs-full:PostemploymentMedicalDefinedBenefitPlansMember2021-12-310001303523ifrs-full:PensionDefinedBenefitPlansMember2020-12-310001303523ifrs-full:PensionDefinedBenefitPlansMember2019-12-310001303523ifrs-full:PostemploymentMedicalDefinedBenefitPlansMember2020-12-310001303523ifrs-full:PostemploymentMedicalDefinedBenefitPlansMember2019-12-310001303523ifrs-full:PensionDefinedBenefitPlansMember2020-01-012020-12-310001303523ifrs-full:PostemploymentMedicalDefinedBenefitPlansMember2020-01-012020-12-310001303523country:US2022-12-310001303523country:DE2022-12-310001303523country:NL2022-12-310001303523country:CH2022-12-310001303523country:US2021-12-310001303523country:DE2021-12-310001303523country:NL2021-12-310001303523country:CH2021-12-310001303523country:DE2022-01-012022-12-310001303523country:CA2022-01-012022-12-310001303523country:NL2022-01-012022-12-310001303523country:CH2022-01-012022-12-310001303523country:DE2021-01-012021-12-310001303523country:CA2021-01-012021-12-310001303523country:NL2021-01-012021-12-310001303523country:CH2021-01-012021-12-310001303523country:USifrs-full:PostemploymentMedicalDefinedBenefitPlansMember2022-12-310001303523country:USifrs-full:PostemploymentMedicalDefinedBenefitPlansMember2021-12-310001303523country:CAifrs-full:PostemploymentMedicalDefinedBenefitPlansMember2022-12-310001303523bti:AllOtherCountriesMemberifrs-full:BottomOfRangeMember2022-12-310001303523ifrs-full:TopOfRangeMemberbti:AllOtherCountriesMember2022-12-310001303523bti:AllOtherCountriesMemberifrs-full:BottomOfRangeMember2021-12-310001303523ifrs-full:TopOfRangeMemberbti:AllOtherCountriesMember2021-12-310001303523bti:OneYearIncreaseMemberifrs-full:ActuarialAssumptionOfLifeExpectancyAfterRetirementMember2022-12-310001303523bti:OneYearDecreaseMemberifrs-full:ActuarialAssumptionOfLifeExpectancyAfterRetirementMember2022-12-310001303523bti:OneYearIncreaseMemberifrs-full:ActuarialAssumptionOfExpectedRatesOfInflationMember2022-12-310001303523bti:OneYearDecreaseMemberifrs-full:ActuarialAssumptionOfExpectedRatesOfInflationMember2022-12-310001303523bti:OneYearIncreaseMemberifrs-full:ActuarialAssumptionOfDiscountRatesMember2022-12-310001303523bti:OneYearDecreaseMemberifrs-full:ActuarialAssumptionOfDiscountRatesMember2022-12-310001303523bti:StockReliefMember2021-12-310001303523bti:ExcessCapitalAllowancesMember2021-12-310001303523ifrs-full:UnusedTaxLossesMember2021-12-310001303523bti:UndistributedEarningsOfAssociatesAndSubsidiariesMember2021-12-310001303523bti:RetirementBenefitsMember2021-12-310001303523bti:TradeMarkMember2021-12-310001303523ifrs-full:OtherTemporaryDifferencesMember2021-12-310001303523bti:StockReliefMember2022-01-012022-12-310001303523bti:ExcessCapitalAllowancesMember2022-01-012022-12-310001303523ifrs-full:UnusedTaxLossesMember2022-01-012022-12-310001303523bti:UndistributedEarningsOfAssociatesAndSubsidiariesMember2022-01-012022-12-310001303523bti:RetirementBenefitsMember2022-01-012022-12-310001303523bti:TradeMarkMember2022-01-012022-12-310001303523ifrs-full:OtherTemporaryDifferencesMember2022-01-012022-12-310001303523bti:StockReliefMember2022-12-310001303523bti:ExcessCapitalAllowancesMember2022-12-310001303523ifrs-full:UnusedTaxLossesMember2022-12-310001303523bti:UndistributedEarningsOfAssociatesAndSubsidiariesMember2022-12-310001303523bti:RetirementBenefitsMember2022-12-310001303523bti:TradeMarkMember2022-12-310001303523ifrs-full:OtherTemporaryDifferencesMember2022-12-310001303523bti:StockReliefMember2020-12-310001303523bti:ExcessCapitalAllowancesMember2020-12-310001303523ifrs-full:UnusedTaxLossesMember2020-12-310001303523bti:UndistributedEarningsOfAssociatesAndSubsidiariesMember2020-12-310001303523bti:RetirementBenefitsMember2020-12-310001303523bti:TradeMarkMember2020-12-310001303523ifrs-full:OtherTemporaryDifferencesMember2020-12-310001303523bti:StockReliefMember2021-01-012021-12-310001303523bti:ExcessCapitalAllowancesMember2021-01-012021-12-310001303523ifrs-full:UnusedTaxLossesMember2021-01-012021-12-310001303523bti:UndistributedEarningsOfAssociatesAndSubsidiariesMember2021-01-012021-12-310001303523bti:RetirementBenefitsMember2021-01-012021-12-310001303523bti:TradeMarkMember2021-01-012021-12-310001303523ifrs-full:OtherTemporaryDifferencesMember2021-01-012021-12-310001303523bti:NoExpiryPeriodMember2022-12-310001303523bti:NoExpiryPeriodMember2021-12-310001303523bti:NotLaterThanTwentyYearsMember2022-12-310001303523bti:NotLaterThanTwentyYearsMember2021-12-310001303523bti:NotLaterThanTenYearsMember2022-12-310001303523bti:NotLaterThanTenYearsMember2021-12-310001303523ifrs-full:FactoringOfReceivablesMemberbti:CollectionAgentMember2022-12-310001303523ifrs-full:FactoringOfReceivablesMemberbti:CollectionAgentMember2021-12-310001303523ifrs-full:FactoringOfReceivablesMemberbti:NonCollectionAgentMember2022-12-310001303523ifrs-full:FactoringOfReceivablesMemberbti:NonCollectionAgentMember2021-12-310001303523bti:SupplyChainFinancingArrangementsMember2022-12-310001303523bti:SupplyChainFinancingArrangementsMember2021-12-310001303523bti:SouzaCruzMember2022-12-310001303523ifrs-full:AccumulatedImpairmentMember2022-12-310001303523ifrs-full:AccumulatedImpairmentMember2021-12-310001303523ifrs-full:TradeReceivablesMember2021-12-310001303523bti:LoansAndOtherReceivablesMember2021-12-310001303523ifrs-full:TradeReceivablesMember2020-12-310001303523bti:LoansAndOtherReceivablesMember2020-12-310001303523ifrs-full:TradeReceivablesMember2022-01-012022-12-310001303523bti:LoansAndOtherReceivablesMember2022-01-012022-12-310001303523ifrs-full:TradeReceivablesMember2021-01-012021-12-310001303523bti:LoansAndOtherReceivablesMember2021-01-012021-12-310001303523ifrs-full:TradeReceivablesMember2022-12-310001303523bti:LoansAndOtherReceivablesMember2022-12-310001303523currency:USD2022-12-310001303523currency:USD2021-12-310001303523currency:GBP2022-12-310001303523currency:GBP2021-12-310001303523currency:EUR2022-12-310001303523currency:EUR2021-12-310001303523bti:OtherCurrencyMember2022-12-310001303523bti:OtherCurrencyMember2021-12-310001303523ifrs-full:FinancialAssetsAtFairValueThroughProfitOrLossCategoryMember2021-12-310001303523ifrs-full:FinancialAssetsAtFairValueThroughOtherComprehensiveIncomeCategoryMember2021-12-310001303523ifrs-full:FinancialAssetsAtFairValueThroughProfitOrLossCategoryMember2020-12-310001303523ifrs-full:FinancialAssetsAtFairValueThroughOtherComprehensiveIncomeCategoryMember2020-12-310001303523ifrs-full:FinancialAssetsAtFairValueThroughProfitOrLossCategoryMember2022-01-012022-12-310001303523ifrs-full:FinancialAssetsAtFairValueThroughOtherComprehensiveIncomeCategoryMember2022-01-012022-12-310001303523ifrs-full:FinancialAssetsAtFairValueThroughProfitOrLossCategoryMember2021-01-012021-12-310001303523ifrs-full:FinancialAssetsAtFairValueThroughOtherComprehensiveIncomeCategoryMember2021-01-012021-12-310001303523ifrs-full:FinancialAssetsAtFairValueThroughProfitOrLossCategoryMember2022-12-310001303523ifrs-full:FinancialAssetsAtFairValueThroughOtherComprehensiveIncomeCategoryMember2022-12-310001303523bti:ImperialTobaccoCanadaMember2022-12-310001303523bti:ImperialTobaccoCanadaMember2021-12-310001303523currency:IRR2021-12-310001303523currency:IRR2022-12-310001303523bti:CharlottesWebHoldingsIncMember2022-01-012022-12-310001303523ifrs-full:Level3OfFairValueHierarchyMember2022-12-310001303523ifrs-full:Level3OfFairValueHierarchyMember2021-12-310001303523ifrs-full:Level3OfFairValueHierarchyMember2022-01-012022-12-310001303523ifrs-full:Level3OfFairValueHierarchyMember2021-01-012021-12-310001303523ifrs-full:FairValueHedgesMemberifrs-full:InterestRateSwapContractMember2022-12-310001303523ifrs-full:FairValueHedgesMemberifrs-full:InterestRateSwapContractMember2021-12-310001303523ifrs-full:FairValueHedgesMemberifrs-full:CurrencySwapContractMember2022-12-310001303523ifrs-full:FairValueHedgesMemberifrs-full:CurrencySwapContractMember2021-12-310001303523ifrs-full:CashFlowHedgesMemberifrs-full:InterestRateSwapContractMember2022-12-310001303523ifrs-full:CashFlowHedgesMemberifrs-full:InterestRateSwapContractMember2021-12-310001303523ifrs-full:CashFlowHedgesMemberifrs-full:CurrencySwapContractMember2022-12-310001303523ifrs-full:CashFlowHedgesMemberifrs-full:CurrencySwapContractMember2021-12-310001303523ifrs-full:CashFlowHedgesMemberifrs-full:ForwardContractMember2022-12-310001303523ifrs-full:CashFlowHedgesMemberifrs-full:ForwardContractMember2021-12-310001303523ifrs-full:HedgesOfNetInvestmentInForeignOperationsMemberifrs-full:ForwardContractMember2022-12-310001303523ifrs-full:HedgesOfNetInvestmentInForeignOperationsMemberifrs-full:ForwardContractMember2021-12-310001303523ifrs-full:InterestRateSwapContractMemberbti:HeldForTradingMember2022-12-310001303523ifrs-full:InterestRateSwapContractMemberbti:HeldForTradingMember2021-12-310001303523ifrs-full:ForwardContractMemberbti:HeldForTradingMember2022-12-310001303523ifrs-full:ForwardContractMemberbti:HeldForTradingMember2021-12-310001303523bti:DerivativeRelatedToNetDebtMember2022-12-310001303523bti:DerivativeRelatedToNetDebtMember2021-12-310001303523ifrs-full:CashFlowHedgesMember2022-12-310001303523ifrs-full:CashFlowHedgesMember2021-12-310001303523ifrs-full:NotLaterThanOneYearMemberifrs-full:CashFlowHedgesMember2022-12-310001303523ifrs-full:NotLaterThanOneYearMemberifrs-full:CashFlowHedgesMember2021-12-310001303523ifrs-full:CashFlowHedgesMemberifrs-full:LaterThanFiveYearsMember2022-12-310001303523ifrs-full:CashFlowHedgesMemberifrs-full:LaterThanFiveYearsMember2021-12-310001303523ifrs-full:NotLaterThanOneYearMemberbti:InflowMemberifrs-full:ForwardContractMemberbti:GrossSettledMember2022-12-310001303523ifrs-full:NotLaterThanOneYearMemberbti:OutflowMemberifrs-full:ForwardContractMemberbti:GrossSettledMember2022-12-310001303523ifrs-full:NotLaterThanOneYearMemberbti:InflowMemberifrs-full:ForwardContractMemberbti:GrossSettledMember2021-12-310001303523ifrs-full:NotLaterThanOneYearMemberbti:OutflowMemberifrs-full:ForwardContractMemberbti:GrossSettledMember2021-12-310001303523ifrs-full:NotLaterThanOneYearMemberbti:InflowMemberifrs-full:CurrencySwapContractMemberbti:GrossSettledMember2022-12-310001303523ifrs-full:NotLaterThanOneYearMemberbti:OutflowMemberifrs-full:CurrencySwapContractMemberbti:GrossSettledMember2022-12-310001303523ifrs-full:NotLaterThanOneYearMemberbti:InflowMemberifrs-full:CurrencySwapContractMemberbti:GrossSettledMember2021-12-310001303523ifrs-full:NotLaterThanOneYearMemberbti:OutflowMemberifrs-full:CurrencySwapContractMemberbti:GrossSettledMember2021-12-310001303523ifrs-full:LaterThanOneYearAndNotLaterThanTwoYearsMemberbti:InflowMemberifrs-full:ForwardContractMemberbti:GrossSettledMember2022-12-310001303523ifrs-full:LaterThanOneYearAndNotLaterThanTwoYearsMemberbti:OutflowMemberifrs-full:ForwardContractMemberbti:GrossSettledMember2022-12-310001303523ifrs-full:LaterThanOneYearAndNotLaterThanTwoYearsMemberbti:InflowMemberifrs-full:ForwardContractMemberbti:GrossSettledMember2021-12-310001303523ifrs-full:LaterThanOneYearAndNotLaterThanTwoYearsMemberbti:OutflowMemberifrs-full:ForwardContractMemberbti:GrossSettledMember2021-12-310001303523ifrs-full:LaterThanOneYearAndNotLaterThanTwoYearsMemberbti:InflowMemberifrs-full:CurrencySwapContractMemberbti:GrossSettledMember2022-12-310001303523ifrs-full:LaterThanOneYearAndNotLaterThanTwoYearsMemberbti:OutflowMemberifrs-full:CurrencySwapContractMemberbti:GrossSettledMember2022-12-310001303523ifrs-full:LaterThanOneYearAndNotLaterThanTwoYearsMemberbti:InflowMemberifrs-full:CurrencySwapContractMemberbti:GrossSettledMember2021-12-310001303523ifrs-full:LaterThanOneYearAndNotLaterThanTwoYearsMemberbti:OutflowMemberifrs-full:CurrencySwapContractMemberbti:GrossSettledMember2021-12-310001303523bti:InflowMemberifrs-full:LaterThanTwoYearsAndNotLaterThanThreeYearsMemberifrs-full:CurrencySwapContractMemberbti:GrossSettledMember2022-12-310001303523bti:OutflowMemberifrs-full:LaterThanTwoYearsAndNotLaterThanThreeYearsMemberifrs-full:CurrencySwapContractMemberbti:GrossSettledMember2022-12-310001303523bti:InflowMemberifrs-full:LaterThanTwoYearsAndNotLaterThanThreeYearsMemberifrs-full:CurrencySwapContractMemberbti:GrossSettledMember2021-12-310001303523bti:OutflowMemberifrs-full:LaterThanTwoYearsAndNotLaterThanThreeYearsMemberifrs-full:CurrencySwapContractMemberbti:GrossSettledMember2021-12-310001303523bti:InflowMemberifrs-full:LaterThanThreeYearsAndNotLaterThanFourYearsMemberifrs-full:CurrencySwapContractMemberbti:GrossSettledMember2022-12-310001303523bti:OutflowMemberifrs-full:LaterThanThreeYearsAndNotLaterThanFourYearsMemberifrs-full:CurrencySwapContractMemberbti:GrossSettledMember2022-12-310001303523bti:InflowMemberifrs-full:LaterThanThreeYearsAndNotLaterThanFourYearsMemberifrs-full:CurrencySwapContractMemberbti:GrossSettledMember2021-12-310001303523bti:OutflowMemberifrs-full:LaterThanThreeYearsAndNotLaterThanFourYearsMemberifrs-full:CurrencySwapContractMemberbti:GrossSettledMember2021-12-310001303523bti:InflowMemberifrs-full:CurrencySwapContractMemberifrs-full:LaterThanFourYearsAndNotLaterThanFiveYearsMemberbti:GrossSettledMember2022-12-310001303523bti:OutflowMemberifrs-full:CurrencySwapContractMemberifrs-full:LaterThanFourYearsAndNotLaterThanFiveYearsMemberbti:GrossSettledMember2022-12-310001303523bti:InflowMemberifrs-full:CurrencySwapContractMemberifrs-full:LaterThanFourYearsAndNotLaterThanFiveYearsMemberbti:GrossSettledMember2021-12-310001303523bti:OutflowMemberifrs-full:CurrencySwapContractMemberifrs-full:LaterThanFourYearsAndNotLaterThanFiveYearsMemberbti:GrossSettledMember2021-12-310001303523ifrs-full:LaterThanFiveYearsMemberbti:InflowMemberifrs-full:CurrencySwapContractMemberbti:GrossSettledMember2022-12-310001303523bti:OutflowMemberifrs-full:LaterThanFiveYearsMemberifrs-full:CurrencySwapContractMemberbti:GrossSettledMember2022-12-310001303523ifrs-full:LaterThanFiveYearsMemberbti:InflowMemberifrs-full:CurrencySwapContractMemberbti:GrossSettledMember2021-12-310001303523bti:OutflowMemberifrs-full:LaterThanFiveYearsMemberifrs-full:CurrencySwapContractMemberbti:GrossSettledMember2021-12-310001303523bti:InflowMemberbti:GrossSettledMember2022-12-310001303523bti:OutflowMemberbti:GrossSettledMember2022-12-310001303523bti:InflowMemberbti:GrossSettledMember2021-12-310001303523bti:OutflowMemberbti:GrossSettledMember2021-12-310001303523ifrs-full:NotLaterThanOneYearMemberbti:NetSettledMemberifrs-full:InterestRateSwapContractMember2022-12-310001303523ifrs-full:NotLaterThanOneYearMemberbti:NetSettledMemberifrs-full:InterestRateSwapContractMember2021-12-310001303523ifrs-full:LaterThanOneYearAndNotLaterThanTwoYearsMemberbti:NetSettledMemberifrs-full:InterestRateSwapContractMember2022-12-310001303523ifrs-full:LaterThanOneYearAndNotLaterThanTwoYearsMemberbti:NetSettledMemberifrs-full:InterestRateSwapContractMember2021-12-310001303523ifrs-full:LaterThanTwoYearsAndNotLaterThanThreeYearsMemberbti:NetSettledMemberifrs-full:InterestRateSwapContractMember2022-12-310001303523ifrs-full:LaterThanTwoYearsAndNotLaterThanThreeYearsMemberbti:NetSettledMemberifrs-full:InterestRateSwapContractMember2021-12-310001303523ifrs-full:LaterThanThreeYearsAndNotLaterThanFourYearsMemberbti:NetSettledMemberifrs-full:InterestRateSwapContractMember2022-12-310001303523ifrs-full:LaterThanThreeYearsAndNotLaterThanFourYearsMemberbti:NetSettledMemberifrs-full:InterestRateSwapContractMember2021-12-310001303523ifrs-full:LaterThanFourYearsAndNotLaterThanFiveYearsMemberbti:NetSettledMemberifrs-full:InterestRateSwapContractMember2022-12-310001303523ifrs-full:LaterThanFourYearsAndNotLaterThanFiveYearsMemberbti:NetSettledMemberifrs-full:InterestRateSwapContractMember2021-12-310001303523ifrs-full:LaterThanFiveYearsMemberbti:NetSettledMemberifrs-full:InterestRateSwapContractMember2022-12-310001303523ifrs-full:LaterThanFiveYearsMemberbti:NetSettledMemberifrs-full:InterestRateSwapContractMember2021-12-310001303523bti:NetSettledMember2022-12-310001303523bti:NetSettledMember2021-12-310001303523ifrs-full:FairValueHedgesMemberbti:InterestRateRiskExposureMemberifrs-full:InterestRateSwapContractMember2022-12-310001303523ifrs-full:FairValueHedgesMemberbti:InterestRateRiskExposureMemberifrs-full:InterestRateSwapContractMember2022-01-012022-12-310001303523ifrs-full:FairValueHedgesMemberbti:InterestRateRiskExposureMemberifrs-full:InterestRateSwapContractMember2021-12-310001303523ifrs-full:FairValueHedgesMemberbti:InterestRateRiskExposureMemberifrs-full:InterestRateSwapContractMember2021-01-012021-12-310001303523ifrs-full:FairValueHedgesMemberbti:InterestRateRiskExposureMemberifrs-full:CurrencySwapContractMember2022-12-310001303523ifrs-full:FairValueHedgesMemberbti:InterestRateRiskExposureMemberifrs-full:CurrencySwapContractMember2022-01-012022-12-310001303523ifrs-full:FairValueHedgesMemberbti:InterestRateRiskExposureMemberifrs-full:CurrencySwapContractMember2021-12-310001303523ifrs-full:FairValueHedgesMemberbti:InterestRateRiskExposureMemberifrs-full:CurrencySwapContractMember2021-01-012021-12-310001303523ifrs-full:CashFlowHedgesMemberbti:InterestRateRiskExposureMemberifrs-full:InterestRateSwapContractMember2022-12-310001303523ifrs-full:CashFlowHedgesMemberbti:InterestRateRiskExposureMemberifrs-full:InterestRateSwapContractMember2022-01-012022-12-310001303523ifrs-full:CashFlowHedgesMemberbti:InterestRateRiskExposureMemberifrs-full:InterestRateSwapContractMember2021-12-310001303523ifrs-full:CashFlowHedgesMemberbti:InterestRateRiskExposureMemberifrs-full:InterestRateSwapContractMember2021-01-012021-12-310001303523ifrs-full:CashFlowHedgesMemberbti:InterestRateRiskExposureMemberifrs-full:CurrencySwapContractMember2022-12-310001303523ifrs-full:CashFlowHedgesMemberbti:InterestRateRiskExposureMemberifrs-full:CurrencySwapContractMember2022-01-012022-12-310001303523ifrs-full:CashFlowHedgesMemberbti:InterestRateRiskExposureMemberifrs-full:CurrencySwapContractMember2021-12-310001303523ifrs-full:CashFlowHedgesMemberbti:InterestRateRiskExposureMemberifrs-full:CurrencySwapContractMember2021-01-012021-12-310001303523bti:ForeignCurrencyRiskExposureMemberifrs-full:CashFlowHedgesMemberifrs-full:ForwardContractMember2022-12-310001303523bti:ForeignCurrencyRiskExposureMemberifrs-full:CashFlowHedgesMemberifrs-full:ForwardContractMember2022-01-012022-12-310001303523bti:ForeignCurrencyRiskExposureMemberifrs-full:CashFlowHedgesMemberifrs-full:ForwardContractMember2021-12-310001303523bti:ForeignCurrencyRiskExposureMemberifrs-full:CashFlowHedgesMemberifrs-full:ForwardContractMember2021-01-012021-12-310001303523bti:ForeignCurrencyRiskExposureMemberbti:DerivativeRelatedNetInvestmentHedgesMemberifrs-full:ForwardContractMember2022-12-310001303523bti:ForeignCurrencyRiskExposureMemberbti:DerivativeRelatedNetInvestmentHedgesMemberifrs-full:ForwardContractMember2022-01-012022-12-310001303523bti:ForeignCurrencyRiskExposureMemberbti:DerivativeRelatedNetInvestmentHedgesMemberifrs-full:ForwardContractMember2021-12-310001303523bti:ForeignCurrencyRiskExposureMemberbti:DerivativeRelatedNetInvestmentHedgesMemberifrs-full:ForwardContractMember2021-01-012021-12-310001303523bti:NonDerivativeRelatedNetInvestmentHedgesMemberifrs-full:LongtermBorrowingsMember2022-12-310001303523bti:NonDerivativeRelatedNetInvestmentHedgesMemberifrs-full:LongtermBorrowingsMember2022-01-012022-12-310001303523bti:NonDerivativeRelatedNetInvestmentHedgesMemberifrs-full:LongtermBorrowingsMember2021-12-310001303523bti:NonDerivativeRelatedNetInvestmentHedgesMemberifrs-full:LongtermBorrowingsMember2021-01-012021-12-310001303523bti:FunctionalCurrencyMember2022-12-310001303523bti:FunctionalCurrencyMember2021-12-310001303523ifrs-full:HedgingInstrumentsMember2022-12-310001303523ifrs-full:HedgingInstrumentsMember2021-12-310001303523ifrs-full:OrdinarySharesMember2021-12-310001303523ifrs-full:OrdinarySharesMember2022-12-310001303523ifrs-full:OrdinarySharesMember2020-12-310001303523ifrs-full:OrdinarySharesMember2021-01-012021-12-310001303523ifrs-full:OrdinarySharesMember2019-12-310001303523ifrs-full:OrdinarySharesMember2020-01-012020-12-310001303523ifrs-full:SharePremiumMember2022-12-310001303523ifrs-full:CapitalRedemptionReserveMember2022-12-310001303523ifrs-full:MergerReserveMember2022-12-310001303523ifrs-full:SharePremiumMember2021-12-310001303523ifrs-full:CapitalRedemptionReserveMember2021-12-310001303523ifrs-full:MergerReserveMember2021-12-310001303523ifrs-full:SharePremiumMember2020-12-310001303523ifrs-full:CapitalRedemptionReserveMember2020-12-310001303523ifrs-full:MergerReserveMember2020-12-310001303523ifrs-full:SharePremiumMemberbti:OrdinarySharesIssuedUnderShareOptionSchemesMember2022-01-012022-12-310001303523ifrs-full:SharePremiumMemberbti:OrdinarySharesIssuedUnderShareOptionSchemesMember2021-01-012021-12-310001303523ifrs-full:SharePremiumMemberbti:OrdinarySharesIssuedUnderShareOptionSchemesMember2020-01-012020-12-310001303523bti:SharesRepurchasedAndNotCancelledMemberifrs-full:SharePremiumMember2022-01-012022-12-310001303523bti:SharesRepurchasedAndNotCancelledMemberifrs-full:SharePremiumMember2021-01-012021-12-310001303523bti:SharesRepurchasedAndNotCancelledMemberifrs-full:SharePremiumMember2020-01-012020-12-310001303523bti:RothmansGroupMemberifrs-full:MergerReserveMember1999-12-310001303523bti:ReynoldsAmericanIncMember2017-07-250001303523bti:ReynoldsAmericanIncMemberifrs-full:MergerReserveMember2017-07-250001303523ifrs-full:ReserveOfExchangeDifferencesOnTranslationMember2021-12-310001303523ifrs-full:ReserveOfCashFlowHedgesMember2021-12-310001303523ifrs-full:ReserveOfGainsAndLossesOnRemeasuringAvailableforsaleFinancialAssetsMember2021-12-310001303523ifrs-full:RevaluationSurplusMember2021-12-310001303523ifrs-full:MiscellaneousOtherReservesMember2021-12-310001303523bti:RetainedEarningsTreasurySharesMember2021-12-310001303523bti:RetainedEarningsOtherMember2021-12-310001303523ifrs-full:ReserveOfExchangeDifferencesOnTranslationMember2022-01-012022-12-310001303523ifrs-full:ReserveOfCashFlowHedgesMember2022-01-012022-12-310001303523ifrs-full:ReserveOfGainsAndLossesOnRemeasuringAvailableforsaleFinancialAssetsMember2022-01-012022-12-310001303523ifrs-full:RevaluationSurplusMember2022-01-012022-12-310001303523ifrs-full:MiscellaneousOtherReservesMember2022-01-012022-12-310001303523bti:RetainedEarningsTreasurySharesMember2022-01-012022-12-310001303523bti:RetainedEarningsOtherMember2022-01-012022-12-310001303523ifrs-full:ReserveOfExchangeDifferencesOnTranslationMemberbti:HeldInEmployeeShareOwnershipTrustsMember2022-01-012022-12-310001303523bti:HeldInEmployeeShareOwnershipTrustsMemberifrs-full:ReserveOfCashFlowHedgesMember2022-01-012022-12-310001303523ifrs-full:ReserveOfGainsAndLossesOnRemeasuringAvailableforsaleFinancialAssetsMemberbti:HeldInEmployeeShareOwnershipTrustsMember2022-01-012022-12-310001303523ifrs-full:RevaluationSurplusMemberbti:HeldInEmployeeShareOwnershipTrustsMember2022-01-012022-12-310001303523ifrs-full:MiscellaneousOtherReservesMemberbti:HeldInEmployeeShareOwnershipTrustsMember2022-01-012022-12-310001303523bti:HeldInEmployeeShareOwnershipTrustsMemberifrs-full:OtherReservesMember2022-01-012022-12-310001303523bti:RetainedEarningsTreasurySharesMemberbti:HeldInEmployeeShareOwnershipTrustsMember2022-01-012022-12-310001303523bti:RetainedEarningsOtherMemberbti:HeldInEmployeeShareOwnershipTrustsMember2022-01-012022-12-310001303523ifrs-full:ReserveOfExchangeDifferencesOnTranslationMemberbti:HeldInTreasuryMember2022-01-012022-12-310001303523bti:HeldInTreasuryMemberifrs-full:ReserveOfCashFlowHedgesMember2022-01-012022-12-310001303523ifrs-full:ReserveOfGainsAndLossesOnRemeasuringAvailableforsaleFinancialAssetsMemberbti:HeldInTreasuryMember2022-01-012022-12-310001303523ifrs-full:RevaluationSurplusMemberbti:HeldInTreasuryMember2022-01-012022-12-310001303523ifrs-full:MiscellaneousOtherReservesMemberbti:HeldInTreasuryMember2022-01-012022-12-310001303523ifrs-full:OtherReservesMemberbti:HeldInTreasuryMember2022-01-012022-12-310001303523bti:RetainedEarningsTreasurySharesMemberbti:HeldInTreasuryMember2022-01-012022-12-310001303523bti:RetainedEarningsOtherMemberbti:HeldInTreasuryMember2022-01-012022-12-310001303523ifrs-full:ReserveOfExchangeDifferencesOnTranslationMember2022-12-310001303523ifrs-full:ReserveOfCashFlowHedgesMember2022-12-310001303523ifrs-full:ReserveOfGainsAndLossesOnRemeasuringAvailableforsaleFinancialAssetsMember2022-12-310001303523ifrs-full:RevaluationSurplusMember2022-12-310001303523ifrs-full:MiscellaneousOtherReservesMember2022-12-310001303523bti:RetainedEarningsTreasurySharesMember2022-12-310001303523bti:RetainedEarningsOtherMember2022-12-310001303523ifrs-full:ReserveOfExchangeDifferencesOnTranslationMember2020-12-310001303523ifrs-full:ReserveOfCashFlowHedgesMember2020-12-310001303523ifrs-full:ReserveOfGainsAndLossesOnRemeasuringAvailableforsaleFinancialAssetsMember2020-12-310001303523ifrs-full:RevaluationSurplusMember2020-12-310001303523ifrs-full:MiscellaneousOtherReservesMember2020-12-310001303523bti:RetainedEarningsTreasurySharesMember2020-12-310001303523bti:RetainedEarningsOtherMember2020-12-310001303523ifrs-full:ReserveOfExchangeDifferencesOnTranslationMember2021-01-012021-12-310001303523ifrs-full:ReserveOfCashFlowHedgesMember2021-01-012021-12-310001303523ifrs-full:ReserveOfGainsAndLossesOnRemeasuringAvailableforsaleFinancialAssetsMember2021-01-012021-12-310001303523ifrs-full:RevaluationSurplusMember2021-01-012021-12-310001303523ifrs-full:MiscellaneousOtherReservesMember2021-01-012021-12-310001303523bti:RetainedEarningsTreasurySharesMember2021-01-012021-12-310001303523bti:RetainedEarningsOtherMember2021-01-012021-12-310001303523ifrs-full:ReserveOfExchangeDifferencesOnTranslationMemberbti:HeldInEmployeeShareOwnershipTrustsMember2021-01-012021-12-310001303523bti:HeldInEmployeeShareOwnershipTrustsMemberifrs-full:ReserveOfCashFlowHedgesMember2021-01-012021-12-310001303523ifrs-full:ReserveOfGainsAndLossesOnRemeasuringAvailableforsaleFinancialAssetsMemberbti:HeldInEmployeeShareOwnershipTrustsMember2021-01-012021-12-310001303523ifrs-full:RevaluationSurplusMemberbti:HeldInEmployeeShareOwnershipTrustsMember2021-01-012021-12-310001303523ifrs-full:MiscellaneousOtherReservesMemberbti:HeldInEmployeeShareOwnershipTrustsMember2021-01-012021-12-310001303523bti:HeldInEmployeeShareOwnershipTrustsMemberifrs-full:OtherReservesMember2021-01-012021-12-310001303523bti:RetainedEarningsTreasurySharesMemberbti:HeldInEmployeeShareOwnershipTrustsMember2021-01-012021-12-310001303523bti:RetainedEarningsOtherMemberbti:HeldInEmployeeShareOwnershipTrustsMember2021-01-012021-12-310001303523ifrs-full:ReserveOfExchangeDifferencesOnTranslationMember2019-12-310001303523ifrs-full:ReserveOfCashFlowHedgesMember2019-12-310001303523ifrs-full:ReserveOfGainsAndLossesOnRemeasuringAvailableforsaleFinancialAssetsMember2019-12-310001303523ifrs-full:RevaluationSurplusMember2019-12-310001303523ifrs-full:MiscellaneousOtherReservesMember2019-12-310001303523bti:RetainedEarningsTreasurySharesMember2019-12-310001303523bti:RetainedEarningsOtherMember2019-12-310001303523ifrs-full:ReserveOfExchangeDifferencesOnTranslationMember2020-01-012020-12-310001303523ifrs-full:ReserveOfCashFlowHedgesMember2020-01-012020-12-310001303523ifrs-full:ReserveOfGainsAndLossesOnRemeasuringAvailableforsaleFinancialAssetsMember2020-01-012020-12-310001303523ifrs-full:RevaluationSurplusMember2020-01-012020-12-310001303523ifrs-full:MiscellaneousOtherReservesMember2020-01-012020-12-310001303523bti:RetainedEarningsTreasurySharesMember2020-01-012020-12-310001303523bti:RetainedEarningsOtherMember2020-01-012020-12-310001303523ifrs-full:ReserveOfExchangeDifferencesOnTranslationMemberbti:HeldInEmployeeShareOwnershipTrustsMember2020-01-012020-12-310001303523bti:HeldInEmployeeShareOwnershipTrustsMemberifrs-full:ReserveOfCashFlowHedgesMember2020-01-012020-12-310001303523ifrs-full:ReserveOfGainsAndLossesOnRemeasuringAvailableforsaleFinancialAssetsMemberbti:HeldInEmployeeShareOwnershipTrustsMember2020-01-012020-12-310001303523ifrs-full:RevaluationSurplusMemberbti:HeldInEmployeeShareOwnershipTrustsMember2020-01-012020-12-310001303523ifrs-full:MiscellaneousOtherReservesMemberbti:HeldInEmployeeShareOwnershipTrustsMember2020-01-012020-12-310001303523bti:HeldInEmployeeShareOwnershipTrustsMemberifrs-full:OtherReservesMember2020-01-012020-12-310001303523bti:RetainedEarningsTreasurySharesMemberbti:HeldInEmployeeShareOwnershipTrustsMember2020-01-012020-12-310001303523bti:RetainedEarningsOtherMemberbti:HeldInEmployeeShareOwnershipTrustsMember2020-01-012020-12-310001303523bti:DifferenceOnExchangeRelatingToEgyptMember2022-01-012022-12-310001303523bti:DifferenceOnExchangeRelatingToOtherEntitiesMember2022-01-012022-12-310001303523bti:DifferenceOnExchangeRelatingToOtherEntitiesMember2021-01-012021-12-310001303523bti:DifferenceOnExchangeRelatingToOtherEntitiesMember2020-01-012020-12-310001303523bti:KamaranIndustryAndInvestmentCompanyMember2022-01-012022-12-310001303523bti:HedgingReserveMember2022-01-012022-12-310001303523bti:HedgingReserveMember2021-01-012021-12-310001303523bti:HedgingReserveMember2020-01-012020-12-310001303523bti:BATIndustriesPlcMember2018-12-310001303523bti:RothmansMember2004-12-3100013035232022-02-102022-02-1000013035232021-09-270001303523bti:PerpetualHybridBondsMember2021-09-270001303523bti:FiveYearTranchesMember2021-09-272021-09-270001303523bti:EightYearTranchesMember2021-09-272021-09-270001303523bti:ThreePointSevenFivePercentPerpetualHybridBondMemberbti:SeptemberTwoThousandAndTwentyOneEquityClassifiedBondsOneAndTwoMemberMember2022-09-012022-09-300001303523bti:EightYearTranchesMember2022-09-012022-09-300001303523bti:SeptemberTwoThousandAndTwentyOneEquityClassifiedBondsOneAndTwoMemberMemberbti:ThreePercentPerpetualHybridBondMemberMember2022-12-012022-12-310001303523bti:SeptemberTwoThousandAndTwentyOneEquityClassifiedBondsOneAndTwoMemberMemberbti:ThreePercentPerpetualHybridBondMemberMember2021-12-012021-12-310001303523bti:FiveYearTranchesMember2021-12-012021-12-310001303523ifrs-full:AtFairValueMember2022-12-310001303523ifrs-full:AtFairValueMember2021-12-3100013035232022-05-312022-05-3100013035232021-05-312021-05-3100013035232022-08-312022-08-3100013035232021-08-312021-08-3100013035232022-11-302022-11-3000013035232021-11-302021-11-300001303523ifrs-full:MajorOrdinaryShareTransactionsMember2023-02-282023-02-2800013035232022-02-282022-02-28bti:INSTALMENT0001303523ifrs-full:MajorOrdinaryShareTransactionsMember2023-05-312023-05-310001303523ifrs-full:MajorOrdinaryShareTransactionsMember2023-08-312023-08-310001303523ifrs-full:MajorOrdinaryShareTransactionsMember2023-11-302023-11-300001303523ifrs-full:MajorOrdinaryShareTransactionsMember2024-02-292024-02-290001303523srt:MinimumMemberbti:EurobondsOneMember2022-12-310001303523srt:MaximumMemberbti:EurobondsOneMember2022-12-310001303523bti:EurobondsOneMember2022-12-310001303523bti:EurobondsOneMember2021-12-310001303523srt:MinimumMemberbti:EurobondsThreeMember2022-12-310001303523srt:MaximumMemberbti:EurobondsThreeMember2022-12-310001303523bti:EurobondsThreeMember2022-12-310001303523bti:EurobondsThreeMember2021-12-310001303523bti:EurobondsFourMember2022-12-310001303523bti:EurobondsFourMember2021-12-310001303523srt:MinimumMember2022-12-310001303523bti:BondsIssuedOneMembersrt:MaximumMember2022-12-310001303523bti:BondsIssuedOneMember2022-12-310001303523bti:BondsIssuedOneMember2021-12-310001303523bti:BondsIssuedTwoMemberbti:LondonInterbankOfferedRateLIBORMember2022-12-310001303523bti:BondsIssuedTwoMember2022-12-310001303523bti:BondsIssuedTwoMember2021-12-310001303523ifrs-full:LiquidityRiskMember2021-12-310001303523bti:BondsIssuedOneMemberifrs-full:FloatingInterestRateMember2022-12-310001303523bti:BondsIssuedOneMemberifrs-full:FloatingInterestRateMember2021-12-310001303523bti:BilateralFacilitiesMember2022-12-310001303523bti:BilateralFacilitiesMember2021-12-310001303523ifrs-full:FairValueHedgesMember2022-12-310001303523ifrs-full:FairValueHedgesMember2021-12-310001303523ifrs-full:AtFairValueMemberifrs-full:MarketComparablePricesMemberifrs-full:Level1OfFairValueHierarchyMember2022-12-310001303523ifrs-full:AtFairValueMemberifrs-full:MarketComparablePricesMemberifrs-full:Level1OfFairValueHierarchyMember2021-12-310001303523ifrs-full:Level3OfFairValueHierarchyMemberifrs-full:AtFairValueMemberifrs-full:DiscountedCashFlowMember2022-12-310001303523ifrs-full:Level3OfFairValueHierarchyMemberifrs-full:AtFairValueMemberifrs-full:DiscountedCashFlowMember2021-12-310001303523bti:PropertyPlantAndEquipmentInventoryAndReceivablesMember2022-12-310001303523bti:PropertyPlantAndEquipmentInventoryAndReceivablesMember2021-12-310001303523ifrs-full:NotLaterThanOneYearMember2022-12-310001303523ifrs-full:NotLaterThanOneYearMember2021-12-310001303523ifrs-full:NotLaterThanOneYearMemberbti:ContractualGrossMaturityAmountMember2022-12-310001303523ifrs-full:NotLaterThanOneYearMemberbti:ContractualGrossMaturityAmountMember2021-12-310001303523ifrs-full:LaterThanOneYearAndNotLaterThanTwoYearsMember2022-12-310001303523ifrs-full:LaterThanOneYearAndNotLaterThanTwoYearsMember2021-12-310001303523ifrs-full:LaterThanOneYearAndNotLaterThanTwoYearsMemberbti:ContractualGrossMaturityAmountMember2022-12-310001303523ifrs-full:LaterThanOneYearAndNotLaterThanTwoYearsMemberbti:ContractualGrossMaturityAmountMember2021-12-310001303523ifrs-full:LaterThanTwoYearsAndNotLaterThanThreeYearsMember2022-12-310001303523ifrs-full:LaterThanTwoYearsAndNotLaterThanThreeYearsMember2021-12-310001303523bti:ContractualGrossMaturityAmountMemberifrs-full:LaterThanTwoYearsAndNotLaterThanThreeYearsMember2022-12-310001303523bti:ContractualGrossMaturityAmountMemberifrs-full:LaterThanTwoYearsAndNotLaterThanThreeYearsMember2021-12-310001303523ifrs-full:LaterThanThreeYearsAndNotLaterThanFourYearsMember2022-12-310001303523ifrs-full:LaterThanThreeYearsAndNotLaterThanFourYearsMember2021-12-310001303523bti:ContractualGrossMaturityAmountMemberifrs-full:LaterThanThreeYearsAndNotLaterThanFourYearsMember2022-12-310001303523bti:ContractualGrossMaturityAmountMemberifrs-full:LaterThanThreeYearsAndNotLaterThanFourYearsMember2021-12-310001303523ifrs-full:LaterThanFourYearsAndNotLaterThanFiveYearsMember2022-12-310001303523ifrs-full:LaterThanFourYearsAndNotLaterThanFiveYearsMember2021-12-310001303523bti:ContractualGrossMaturityAmountMemberifrs-full:LaterThanFourYearsAndNotLaterThanFiveYearsMember2022-12-310001303523bti:ContractualGrossMaturityAmountMemberifrs-full:LaterThanFourYearsAndNotLaterThanFiveYearsMember2021-12-310001303523ifrs-full:LaterThanFiveYearsMember2022-12-310001303523ifrs-full:LaterThanFiveYearsMember2021-12-310001303523bti:ContractualGrossMaturityAmountMemberifrs-full:LaterThanFiveYearsMember2022-12-310001303523bti:ContractualGrossMaturityAmountMemberifrs-full:LaterThanFiveYearsMember2021-12-310001303523bti:ContractualGrossMaturityAmountMember2022-12-310001303523bti:ContractualGrossMaturityAmountMember2021-12-310001303523bti:FunctionalCurrencyMemberifrs-full:CurrencySwapContractMember2022-01-012022-12-310001303523currency:USDifrs-full:CurrencySwapContractMember2022-01-012022-12-310001303523ifrs-full:CurrencySwapContractMembercurrency:GBP2022-01-012022-12-310001303523ifrs-full:CurrencySwapContractMembercurrency:EUR2022-01-012022-12-310001303523ifrs-full:CurrencySwapContractMemberbti:OtherCurrencyMember2022-01-012022-12-310001303523ifrs-full:CurrencySwapContractMember2022-01-012022-12-310001303523bti:FunctionalCurrencyMemberifrs-full:ForwardContractMember2022-01-012022-12-310001303523currency:USDifrs-full:ForwardContractMember2022-01-012022-12-310001303523ifrs-full:ForwardContractMembercurrency:GBP2022-01-012022-12-310001303523ifrs-full:ForwardContractMembercurrency:EUR2022-01-012022-12-310001303523ifrs-full:ForwardContractMemberbti:OtherCurrencyMember2022-01-012022-12-310001303523ifrs-full:ForwardContractMember2022-01-012022-12-310001303523bti:FunctionalCurrencyMember2022-01-012022-12-310001303523currency:USD2022-01-012022-12-310001303523currency:GBP2022-01-012022-12-310001303523currency:EUR2022-01-012022-12-310001303523bti:OtherCurrencyMember2022-01-012022-12-310001303523bti:FunctionalCurrencyMemberifrs-full:CurrencySwapContractMember2021-01-012021-12-310001303523currency:USDifrs-full:CurrencySwapContractMember2021-01-012021-12-310001303523ifrs-full:CurrencySwapContractMembercurrency:GBP2021-01-012021-12-310001303523ifrs-full:CurrencySwapContractMembercurrency:EUR2021-01-012021-12-310001303523ifrs-full:CurrencySwapContractMemberbti:OtherCurrencyMember2021-01-012021-12-310001303523ifrs-full:CurrencySwapContractMember2021-01-012021-12-310001303523bti:FunctionalCurrencyMemberifrs-full:ForwardContractMember2021-01-012021-12-310001303523currency:USDifrs-full:ForwardContractMember2021-01-012021-12-310001303523ifrs-full:ForwardContractMembercurrency:GBP2021-01-012021-12-310001303523ifrs-full:ForwardContractMembercurrency:EUR2021-01-012021-12-310001303523ifrs-full:ForwardContractMemberbti:OtherCurrencyMember2021-01-012021-12-310001303523ifrs-full:ForwardContractMember2021-01-012021-12-310001303523bti:FunctionalCurrencyMember2021-01-012021-12-310001303523currency:USD2021-01-012021-12-310001303523currency:GBP2021-01-012021-12-310001303523currency:EUR2021-01-012021-12-310001303523bti:OtherCurrencyMember2021-01-012021-12-310001303523ifrs-full:InterestRateRiskMemberifrs-full:NotLaterThanOneYearMemberifrs-full:InterestRateSwapContractMember2022-01-012022-12-310001303523ifrs-full:InterestRateRiskMemberifrs-full:LaterThanOneYearAndNotLaterThanTwoYearsMemberifrs-full:InterestRateSwapContractMember2022-01-012022-12-310001303523ifrs-full:InterestRateRiskMemberifrs-full:LaterThanTwoYearsAndNotLaterThanThreeYearsMemberifrs-full:InterestRateSwapContractMember2022-01-012022-12-310001303523ifrs-full:InterestRateRiskMemberifrs-full:LaterThanThreeYearsAndNotLaterThanFourYearsMemberifrs-full:InterestRateSwapContractMember2022-01-012022-12-310001303523ifrs-full:InterestRateRiskMemberifrs-full:LaterThanFourYearsAndNotLaterThanFiveYearsMemberifrs-full:InterestRateSwapContractMember2022-01-012022-12-310001303523ifrs-full:InterestRateRiskMemberifrs-full:LaterThanFiveYearsMemberifrs-full:InterestRateSwapContractMember2022-01-012022-12-310001303523ifrs-full:InterestRateRiskMemberifrs-full:InterestRateSwapContractMember2022-01-012022-12-310001303523ifrs-full:InterestRateRiskMemberifrs-full:NotLaterThanOneYearMemberifrs-full:CurrencySwapContractMember2022-01-012022-12-310001303523ifrs-full:InterestRateRiskMemberifrs-full:LaterThanOneYearAndNotLaterThanTwoYearsMemberifrs-full:CurrencySwapContractMember2022-01-012022-12-310001303523ifrs-full:InterestRateRiskMemberifrs-full:LaterThanTwoYearsAndNotLaterThanThreeYearsMemberifrs-full:CurrencySwapContractMember2022-01-012022-12-310001303523ifrs-full:InterestRateRiskMemberifrs-full:LaterThanThreeYearsAndNotLaterThanFourYearsMemberifrs-full:CurrencySwapContractMember2022-01-012022-12-310001303523ifrs-full:InterestRateRiskMemberifrs-full:CurrencySwapContractMemberifrs-full:LaterThanFourYearsAndNotLaterThanFiveYearsMember2022-01-012022-12-310001303523ifrs-full:InterestRateRiskMemberifrs-full:LaterThanFiveYearsMemberifrs-full:CurrencySwapContractMember2022-01-012022-12-310001303523ifrs-full:InterestRateRiskMemberifrs-full:CurrencySwapContractMember2022-01-012022-12-310001303523ifrs-full:NotLaterThanOneYearMemberifrs-full:InterestRateRiskMember2022-01-012022-12-310001303523ifrs-full:LaterThanOneYearAndNotLaterThanTwoYearsMemberifrs-full:InterestRateRiskMember2022-01-012022-12-310001303523ifrs-full:InterestRateRiskMemberifrs-full:LaterThanTwoYearsAndNotLaterThanThreeYearsMember2022-01-012022-12-310001303523ifrs-full:InterestRateRiskMemberifrs-full:LaterThanThreeYearsAndNotLaterThanFourYearsMember2022-01-012022-12-310001303523ifrs-full:InterestRateRiskMemberifrs-full:LaterThanFourYearsAndNotLaterThanFiveYearsMember2022-01-012022-12-310001303523ifrs-full:InterestRateRiskMemberifrs-full:LaterThanFiveYearsMember2022-01-012022-12-310001303523ifrs-full:InterestRateRiskMember2022-01-012022-12-310001303523ifrs-full:InterestRateRiskMemberifrs-full:NotLaterThanOneYearMemberifrs-full:InterestRateSwapContractMember2021-01-012021-12-310001303523ifrs-full:InterestRateRiskMemberifrs-full:LaterThanOneYearAndNotLaterThanTwoYearsMemberifrs-full:InterestRateSwapContractMember2021-01-012021-12-310001303523ifrs-full:InterestRateRiskMemberifrs-full:LaterThanTwoYearsAndNotLaterThanThreeYearsMemberifrs-full:InterestRateSwapContractMember2021-01-012021-12-310001303523ifrs-full:InterestRateRiskMemberifrs-full:LaterThanThreeYearsAndNotLaterThanFourYearsMemberifrs-full:InterestRateSwapContractMember2021-01-012021-12-310001303523ifrs-full:InterestRateRiskMemberifrs-full:LaterThanFourYearsAndNotLaterThanFiveYearsMemberifrs-full:InterestRateSwapContractMember2021-01-012021-12-310001303523ifrs-full:InterestRateRiskMemberifrs-full:LaterThanFiveYearsMemberifrs-full:InterestRateSwapContractMember2021-01-012021-12-310001303523ifrs-full:InterestRateRiskMemberifrs-full:InterestRateSwapContractMember2021-01-012021-12-310001303523ifrs-full:InterestRateRiskMemberifrs-full:NotLaterThanOneYearMemberifrs-full:CurrencySwapContractMember2021-01-012021-12-310001303523ifrs-full:InterestRateRiskMemberifrs-full:LaterThanOneYearAndNotLaterThanTwoYearsMemberifrs-full:CurrencySwapContractMember2021-01-012021-12-310001303523ifrs-full:InterestRateRiskMemberifrs-full:LaterThanTwoYearsAndNotLaterThanThreeYearsMemberifrs-full:CurrencySwapContractMember2021-01-012021-12-310001303523ifrs-full:InterestRateRiskMemberifrs-full:LaterThanThreeYearsAndNotLaterThanFourYearsMemberifrs-full:CurrencySwapContractMember2021-01-012021-12-310001303523ifrs-full:InterestRateRiskMemberifrs-full:CurrencySwapContractMemberifrs-full:LaterThanFourYearsAndNotLaterThanFiveYearsMember2021-01-012021-12-310001303523ifrs-full:InterestRateRiskMemberifrs-full:LaterThanFiveYearsMemberifrs-full:CurrencySwapContractMember2021-01-012021-12-310001303523ifrs-full:InterestRateRiskMemberifrs-full:CurrencySwapContractMember2021-01-012021-12-310001303523ifrs-full:NotLaterThanOneYearMemberifrs-full:InterestRateRiskMember2021-01-012021-12-310001303523ifrs-full:LaterThanOneYearAndNotLaterThanTwoYearsMemberifrs-full:InterestRateRiskMember2021-01-012021-12-310001303523ifrs-full:InterestRateRiskMemberifrs-full:LaterThanTwoYearsAndNotLaterThanThreeYearsMember2021-01-012021-12-310001303523ifrs-full:InterestRateRiskMemberifrs-full:LaterThanThreeYearsAndNotLaterThanFourYearsMember2021-01-012021-12-310001303523ifrs-full:InterestRateRiskMemberifrs-full:LaterThanFourYearsAndNotLaterThanFiveYearsMember2021-01-012021-12-310001303523ifrs-full:InterestRateRiskMemberifrs-full:LaterThanFiveYearsMember2021-01-012021-12-310001303523ifrs-full:InterestRateRiskMember2021-01-012021-12-310001303523bti:BorrowingsExcludingLeaseLiabilitiesMember2021-12-310001303523bti:BorrowingsExcludingLeaseLiabilitiesMember2022-01-012022-12-310001303523bti:BorrowingsExcludingLeaseLiabilitiesMember2022-12-310001303523ifrs-full:LeaseLiabilitiesMember2021-12-310001303523ifrs-full:LeaseLiabilitiesMember2022-01-012022-12-310001303523ifrs-full:LeaseLiabilitiesMember2022-12-310001303523bti:DerivativeRelatedToNetDebtMember2022-01-012022-12-310001303523bti:CashAndCashEquivalentsRelatedToNetDebtMember2021-12-310001303523bti:CashAndCashEquivalentsRelatedToNetDebtMember2022-01-012022-12-310001303523bti:CashAndCashEquivalentsRelatedToNetDebtMember2022-12-310001303523bti:CurrentFinancialAssetsRelatedToNetDebtMember2021-12-310001303523bti:CurrentFinancialAssetsRelatedToNetDebtMember2022-01-012022-12-310001303523bti:CurrentFinancialAssetsRelatedToNetDebtMember2022-12-310001303523bti:BorrowingsExcludingLeaseLiabilitiesMember2020-12-310001303523bti:BorrowingsExcludingLeaseLiabilitiesMember2021-01-012021-12-310001303523ifrs-full:LeaseLiabilitiesMember2020-12-310001303523ifrs-full:LeaseLiabilitiesMember2021-01-012021-12-310001303523bti:DerivativeRelatedToNetDebtMember2020-12-310001303523bti:DerivativeRelatedToNetDebtMember2021-01-012021-12-310001303523bti:CashAndCashEquivalentsRelatedToNetDebtMember2020-12-310001303523bti:CashAndCashEquivalentsRelatedToNetDebtMember2021-01-012021-12-310001303523bti:CurrentFinancialAssetsRelatedToNetDebtMember2020-12-310001303523bti:CurrentFinancialAssetsRelatedToNetDebtMember2021-01-012021-12-310001303523bti:ReynoldsAmericanIncMember2022-12-310001303523bti:ReynoldsAmericanIncMember2021-12-310001303523ifrs-full:RestructuringProvisionMember2021-12-310001303523bti:EmployeeRelatedBenefitsMember2021-12-310001303523bti:FoxRiverMember2021-12-310001303523ifrs-full:MiscellaneousOtherProvisionsMemberbti:DOJOFACInvestigationMember2021-12-310001303523ifrs-full:MiscellaneousOtherProvisionsMember2021-12-310001303523ifrs-full:RestructuringProvisionMember2022-01-012022-12-310001303523bti:EmployeeRelatedBenefitsMember2022-01-012022-12-310001303523bti:FoxRiverMember2022-01-012022-12-310001303523ifrs-full:MiscellaneousOtherProvisionsMember2022-01-012022-12-310001303523ifrs-full:RestructuringProvisionMember2022-12-310001303523bti:EmployeeRelatedBenefitsMember2022-12-310001303523bti:FoxRiverMember2022-12-310001303523ifrs-full:MiscellaneousOtherProvisionsMemberbti:DOJOFACInvestigationMember2022-12-310001303523ifrs-full:MiscellaneousOtherProvisionsMember2022-12-310001303523ifrs-full:RestructuringProvisionMember2020-12-310001303523bti:EmployeeRelatedBenefitsMember2020-12-310001303523bti:FoxRiverMember2020-12-310001303523ifrs-full:MiscellaneousOtherProvisionsMember2020-12-310001303523ifrs-full:RestructuringProvisionMember2021-01-012021-12-310001303523bti:EmployeeRelatedBenefitsMember2021-01-012021-12-310001303523bti:FoxRiverMember2021-01-012021-12-310001303523ifrs-full:MiscellaneousOtherProvisionsMember2021-01-012021-12-310001303523ifrs-full:RestructuringProvisionMemberbti:MSALitigationMember2021-01-012021-12-310001303523bti:MSALitigationMemberbti:EmployeeRelatedBenefitsMember2021-01-012021-12-310001303523bti:MSALitigationMemberbti:FoxRiverMember2021-01-012021-12-310001303523ifrs-full:MiscellaneousOtherProvisionsMemberbti:MSALitigationMember2021-01-012021-12-310001303523bti:MSALitigationMember2021-01-012021-12-310001303523ifrs-full:RestructuringProvisionMemberbti:OtherProvisionsForLiabilitiesMember2021-01-012021-12-310001303523bti:OtherProvisionsForLiabilitiesMemberbti:EmployeeRelatedBenefitsMember2021-01-012021-12-310001303523bti:OtherProvisionsForLiabilitiesMemberbti:FoxRiverMember2021-01-012021-12-310001303523ifrs-full:MiscellaneousOtherProvisionsMemberbti:OtherProvisionsForLiabilitiesMember2021-01-012021-12-310001303523bti:OtherProvisionsForLiabilitiesMember2021-01-012021-12-310001303523bti:TradeAndOtherPayablesMember2022-01-012022-12-310001303523bti:TradeAndOtherPayablesMember2021-01-012021-12-310001303523ifrs-full:RestructuringProvisionMemberifrs-full:TopOfRangeMember2022-01-012022-12-310001303523ifrs-full:TopOfRangeMemberbti:EmployeeRelatedBenefitsMember2022-01-012022-12-310001303523bti:FoxRiverMember2011-01-012011-12-310001303523ifrs-full:TopOfRangeMemberbti:FoxRiverMember2022-01-012022-12-310001303523bti:TexasMinnesotaAndMississippiMemberbti:ITGBrandsLLCMSALitigationAgreementsMember2020-12-310001303523country:CAbti:ImperialTobaccoCanadaMember2019-03-010001303523bti:QuebecClassActionsMember2019-12-310001303523ifrs-full:FactoringOfReceivablesMember2022-12-310001303523ifrs-full:FactoringOfReceivablesMember2021-12-310001303523ifrs-full:LiquidityRiskMember2022-01-012022-12-310001303523ifrs-full:TopOfRangeMemberifrs-full:LiquidityRiskMember2022-01-012022-12-310001303523ifrs-full:LiquidityRiskMember2022-12-310001303523ifrs-full:LiquidityRiskMemberbti:MoneyMarketFundMember2022-12-310001303523ifrs-full:LiquidityRiskMemberbti:MoneyMarketFundMember2021-12-310001303523ifrs-full:LiquidityRiskMember2022-02-012022-02-280001303523bti:ThreeSixtyFourDayTranchesMemberifrs-full:LiquidityRiskMember2022-02-012022-02-280001303523bti:MarchTwoThousandAndTwentyThreeMemberifrs-full:LiquidityRiskMember2022-02-012022-02-280001303523ifrs-full:LiquidityRiskMemberbti:MarchTwoThousandAndTwentySevenMember2022-02-012022-02-280001303523bti:UntilMarch2025Memberifrs-full:LiquidityRiskMember2022-02-280001303523bti:FromMarch2025ToMarch2026Memberifrs-full:LiquidityRiskMember2022-02-280001303523bti:BilateralFacilitiesMemberifrs-full:LiquidityRiskMember2022-12-310001303523bti:BilateralFacilitiesMemberifrs-full:LiquidityRiskMember2022-01-012022-12-310001303523ifrs-full:LiquidityRiskMember2022-03-162022-03-16bti:tranche0001303523ifrs-full:LiquidityRiskMember2022-05-230001303523ifrs-full:LiquidityRiskMember2022-06-070001303523ifrs-full:LiquidityRiskMember2022-06-290001303523bti:BondRepaidAugust2022OneMemberifrs-full:LiquidityRiskMember2022-08-150001303523bti:BondRepaidAugust2022TwoMemberifrs-full:LiquidityRiskMember2022-08-150001303523ifrs-full:LiquidityRiskMember2022-10-192022-10-190001303523bti:BondRepaidJanuary2023Memberbti:RepaymentsOfBorrowingsMemberifrs-full:LiquidityRiskMember2023-01-310001303523ifrs-full:LiquidityRiskMember2021-01-012021-12-310001303523bti:BilateralFacilitiesMemberifrs-full:LiquidityRiskMember2021-12-310001303523bti:BilateralFacilitiesMemberifrs-full:LiquidityRiskMember2021-01-012021-12-310001303523ifrs-full:LiquidityRiskMember2021-02-280001303523ifrs-full:LiquidityRiskMember2021-06-300001303523ifrs-full:LiquidityRiskMember2020-07-310001303523ifrs-full:LiquidityRiskMember2021-09-300001303523ifrs-full:LiquidityRiskMember2021-07-310001303523ifrs-full:LiquidityRiskMember2021-08-31iso4217:CHF0001303523ifrs-full:LiquidityRiskMember2021-11-300001303523currency:USDifrs-full:CurrencyRiskMember2022-12-310001303523currency:USDifrs-full:CurrencyRiskMember2021-12-310001303523ifrs-full:CurrencyRiskMembercurrency:EUR2022-12-310001303523ifrs-full:CurrencyRiskMembercurrency:EUR2021-12-310001303523ifrs-full:CurrencyRiskMembercurrency:GBP2022-12-310001303523ifrs-full:CurrencyRiskMembercurrency:GBP2021-12-310001303523bti:RestOfGroupMemberifrs-full:CurrencyRiskMember2022-12-310001303523bti:RestOfGroupMemberifrs-full:CurrencyRiskMember2021-12-310001303523ifrs-full:CurrencyRiskMember2022-01-012022-12-310001303523ifrs-full:CurrencyRiskMember2021-01-012021-12-310001303523ifrs-full:CurrencyRiskMember2020-01-012020-12-310001303523ifrs-full:InterestRateRiskMemberifrs-full:FixedInterestRateMember2022-12-310001303523ifrs-full:InterestRateRiskMember2020-01-012020-12-310001303523ifrs-full:InterestRateRiskMember2022-12-310001303523ifrs-full:InterestRateRiskMember2021-12-310001303523ifrs-full:InterestRateRiskMember2022-01-31bti:Derivative0001303523bti:LeafSupplyArrangementsMember2022-12-310001303523bti:LeafSupplyArrangementsMember2021-12-310001303523bti:ShortTermCreditFacilityMember2022-12-310001303523bti:ShortTermCreditFacilityMember2021-12-310001303523ifrs-full:Level1OfFairValueHierarchyMember2022-12-310001303523ifrs-full:Level2OfFairValueHierarchyMember2022-12-310001303523ifrs-full:Level1OfFairValueHierarchyMember2021-12-310001303523ifrs-full:Level2OfFairValueHierarchyMember2021-12-310001303523ifrs-full:InterestRateSwapContractMemberifrs-full:Level1OfFairValueHierarchyMember2022-12-310001303523ifrs-full:Level2OfFairValueHierarchyMemberifrs-full:InterestRateSwapContractMember2022-12-310001303523ifrs-full:Level3OfFairValueHierarchyMemberifrs-full:InterestRateSwapContractMember2022-12-310001303523ifrs-full:InterestRateSwapContractMember2022-12-310001303523ifrs-full:InterestRateSwapContractMemberifrs-full:Level1OfFairValueHierarchyMember2021-12-310001303523ifrs-full:Level2OfFairValueHierarchyMemberifrs-full:InterestRateSwapContractMember2021-12-310001303523ifrs-full:Level3OfFairValueHierarchyMemberifrs-full:InterestRateSwapContractMember2021-12-310001303523ifrs-full:InterestRateSwapContractMember2021-12-310001303523ifrs-full:CurrencySwapContractMemberifrs-full:Level1OfFairValueHierarchyMember2022-12-310001303523ifrs-full:Level2OfFairValueHierarchyMemberifrs-full:CurrencySwapContractMember2022-12-310001303523ifrs-full:Level3OfFairValueHierarchyMemberifrs-full:CurrencySwapContractMember2022-12-310001303523ifrs-full:CurrencySwapContractMember2022-12-310001303523ifrs-full:CurrencySwapContractMemberifrs-full:Level1OfFairValueHierarchyMember2021-12-310001303523ifrs-full:Level2OfFairValueHierarchyMemberifrs-full:CurrencySwapContractMember2021-12-310001303523ifrs-full:Level3OfFairValueHierarchyMemberifrs-full:CurrencySwapContractMember2021-12-310001303523ifrs-full:CurrencySwapContractMember2021-12-310001303523ifrs-full:ForwardContractMemberifrs-full:Level1OfFairValueHierarchyMember2022-12-310001303523ifrs-full:Level2OfFairValueHierarchyMemberifrs-full:ForwardContractMember2022-12-310001303523ifrs-full:Level3OfFairValueHierarchyMemberifrs-full:ForwardContractMember2022-12-310001303523ifrs-full:ForwardContractMember2022-12-310001303523ifrs-full:ForwardContractMemberifrs-full:Level1OfFairValueHierarchyMember2021-12-310001303523ifrs-full:Level2OfFairValueHierarchyMemberifrs-full:ForwardContractMember2021-12-310001303523ifrs-full:Level3OfFairValueHierarchyMemberifrs-full:ForwardContractMember2021-12-310001303523ifrs-full:ForwardContractMember2021-12-310001303523bti:FinancialDerivativeAssetsMember2022-12-310001303523bti:FinancialDerivativeAssetsMember2021-12-310001303523bti:FinancialDerivativeLiabilitiesMember2022-12-310001303523bti:FinancialDerivativeLiabilitiesMember2021-12-310001303523ifrs-full:FairValueHedgesMember2022-01-012022-12-310001303523ifrs-full:CashFlowHedgesMember2022-01-012022-12-310001303523ifrs-full:FairValueHedgesMember2021-01-012021-12-310001303523ifrs-full:CashFlowHedgesMember2021-01-012021-12-310001303523ifrs-full:CashFlowHedgesMemberifrs-full:CurrencyRiskMember2022-12-310001303523ifrs-full:CashFlowHedgesMemberifrs-full:CurrencyRiskMember2021-12-310001303523bti:EasternTobaccoCompanyMember2020-11-120001303523bti:TwispProprietaryLimitedMember2019-09-300001303523bti:TwispProprietaryLimitedMember2021-01-012021-12-310001303523bti:HrvatskiDuhaniDDTobaccoLeafProcessingMember2022-12-310001303523bti:HrvatskiDuhaniDDTobaccoLeafProcessingMember2022-01-012022-12-310001303523bti:HrvatskiDuhaniDDTobaccoLeafProcessingMember2021-12-310001303523bti:HrvatskiDuhaniDDTobaccoLeafProcessingMember2021-01-012021-12-310001303523bti:BrascubaCigarrillosSAMember2021-01-012021-12-310001303523bti:BrascubaCigarrillosSAMember2020-01-012020-12-310001303523bti:GroupsIndonesianSubsidiaryMember2021-01-012021-12-310001303523country:CAbti:OrganigramIncMember2021-03-11bti:director0001303523bti:EdiblesInfusionsCorporationMemberbti:OrganigramIncMember2021-12-310001303523bti:OrganigramIncMemberbti:LaurentianOrganicIncMember2021-12-310001303523country:CAbti:OrganigramIncMember2021-12-312021-12-310001303523bti:SanityGroupGmbHMember2022-09-260001303523country:UZbti:SamfruitMember2022-12-310001303523country:UZbti:SamfruitMember2022-01-012022-12-310001303523country:UZbti:SamfruitMember2021-12-310001303523country:UZbti:SamfruitMember2020-12-310001303523bti:SteadyStateLLCMember2022-12-310001303523ifrs-full:DiscontinuedOperationsMemberbti:BATRussiaMember2022-06-300001303523ifrs-full:DiscontinuedOperationsMemberbti:BATRussiaMember2022-03-112022-06-300001303523ifrs-full:DiscontinuedOperationsMemberbti:BATRussiaMember2022-12-310001303523srt:ScenarioForecastMemberbti:BATRussiaMember2023-01-012023-12-310001303523ifrs-full:DiscontinuedOperationsMember2022-12-310001303523ifrs-full:DiscontinuedOperationsMemberbti:BATRussiaMember2022-03-112022-12-310001303523ifrs-full:DiscontinuedOperationsMemberbti:TerritoriesOtherThanRussiaAndBelarusMember2022-12-310001303523ifrs-full:DiscontinuedOperationsMemberbti:BatParsCompanyPjscMember2021-06-250001303523ifrs-full:DiscontinuedOperationsMemberbti:BatParsCompanyPjscMember2021-06-252021-06-250001303523bti:BatParsCompanyPjscMember2021-01-012021-12-310001303523bti:BatParsCompanyPjscMember2022-01-012022-12-310001303523bti:BatParsCompanyPjscMember2022-12-310001303523bti:AdjustingItemsWhichHaveBeenAdjustedWithinNetFinanceCostsMemberbti:BatParsCompanyPjscMember2021-12-310001303523bti:AdjustingItemsWhichHaveBeenAdjustedWithinNetFinanceCostsMemberbti:BatParsCompanyPjscMember2022-12-310001303523bti:LongTermIncentivePlanMemberbti:PerformanceSharePlansMember2022-01-012022-12-310001303523srt:ExecutiveOfficerMemberbti:LongTermIncentivePlanMemberbti:PerformanceSharePlansMember2022-01-012022-12-310001303523bti:LongTermIncentivePlanMemberbti:PerformanceSharePlansMemberbti:EarningsPerShareMember2021-01-012021-12-310001303523bti:LongTermIncentivePlanMemberbti:PerformanceSharePlansMemberbti:EarningsPerShareMember2019-01-012019-12-310001303523bti:LongTermIncentivePlanMemberbti:PerformanceSharePlansMemberbti:EarningsPerShareMember2020-01-012020-12-310001303523bti:OperatingCashFlowMemberbti:LongTermIncentivePlanMemberbti:PerformanceSharePlansMember2021-01-012021-12-310001303523bti:OperatingCashFlowMemberbti:LongTermIncentivePlanMemberbti:PerformanceSharePlansMember2020-01-012020-12-310001303523bti:OperatingCashFlowMemberbti:LongTermIncentivePlanMemberbti:PerformanceSharePlansMember2019-01-012019-12-310001303523bti:LongTermIncentivePlanMemberbti:ShareholderReturnMemberbti:PerformanceSharePlansMember2019-01-012019-12-310001303523bti:LongTermIncentivePlanMemberbti:ShareholderReturnMemberbti:PerformanceSharePlansMember2021-01-012021-12-310001303523bti:LongTermIncentivePlanMemberbti:ShareholderReturnMemberbti:PerformanceSharePlansMember2020-01-012020-12-310001303523bti:NetTurnoverMemberbti:LongTermIncentivePlanMemberbti:PerformanceSharePlansMember2019-01-012019-12-310001303523bti:NetTurnoverMemberbti:LongTermIncentivePlanMemberbti:PerformanceSharePlansMember2021-01-012021-12-310001303523bti:NetTurnoverMemberbti:LongTermIncentivePlanMemberbti:PerformanceSharePlansMember2020-01-012020-12-310001303523bti:LongTermIncentivePlanMemberbti:PerformanceSharePlansMemberbti:EarningsPerShareMember2022-01-012022-12-310001303523bti:OperatingCashFlowMemberbti:LongTermIncentivePlanMemberbti:PerformanceSharePlansMember2022-01-012022-12-310001303523bti:TotalShareholderReturnMemberbti:LongTermIncentivePlanMemberbti:PerformanceSharePlansMember2022-01-012022-12-310001303523bti:NetTurnoverMemberbti:LongTermIncentivePlanMemberbti:PerformanceSharePlansMember2022-01-012022-12-310001303523bti:NewCategoriesRevenueGrowthMemberbti:LongTermIncentivePlanMemberbti:PerformanceSharePlansMember2022-01-012022-12-310001303523bti:RestrictedSharePlanMemberbti:LongTermIncentivePlanMember2022-01-012022-12-310001303523bti:DeferredShareBonusSchemeMember2022-01-012022-12-310001303523bti:SharesaveSchemeSAYEMember2022-12-310001303523bti:SharesaveSchemeSAYEMemberifrs-full:BottomOfRangeMember2022-01-012022-12-310001303523bti:SharesaveSchemeSAYEMemberifrs-full:TopOfRangeMember2022-01-012022-12-310001303523bti:SharesaveSchemeSAYEMember2022-01-012022-12-310001303523bti:ShareRewardSchemeSRSMember2022-01-012022-12-310001303523bti:InternationalShareRewardSchemeISRSMember2022-01-012022-12-310001303523bti:PartnershipShareSchemeMember2022-01-012022-12-310001303523bti:EquitySettledLongTermIncentivePlanMember2022-01-012022-12-310001303523bti:CashSettledLongTermIncentivePlanMember2022-01-012022-12-310001303523bti:EquitySettledLongTermIncentivePlanMember2021-01-012021-12-310001303523bti:CashSettledLongTermIncentivePlanMember2021-01-012021-12-310001303523bti:EquitySettledLongTermIncentivePlanMember2020-01-012020-12-310001303523bti:CashSettledLongTermIncentivePlanMember2020-01-012020-12-310001303523bti:EquitySettledDeferredShareBonusSchemeMember2022-01-012022-12-310001303523bti:CashSettledDeferredShareBonusSchemeMember2022-01-012022-12-310001303523bti:EquitySettledDeferredShareBonusSchemeMember2021-01-012021-12-310001303523bti:CashSettledDeferredShareBonusSchemeMember2021-01-012021-12-310001303523bti:EquitySettledDeferredShareBonusSchemeMember2020-01-012020-12-310001303523bti:CashSettledDeferredShareBonusSchemeMember2020-01-012020-12-310001303523bti:EquitySettledOtherSchemesMember2022-01-012022-12-310001303523bti:CashSettledOtherSchemesMember2022-01-012022-12-310001303523bti:EquitySettledOtherSchemesMember2021-01-012021-12-310001303523bti:CashSettledOtherSchemesMember2021-01-012021-12-310001303523bti:EquitySettledOtherSchemesMember2020-01-012020-12-310001303523bti:CashSettledOtherSchemesMember2020-01-012020-12-310001303523bti:EquitySettledMember2022-01-012022-12-310001303523bti:CashSettledMember2022-01-012022-12-310001303523bti:EquitySettledMember2021-01-012021-12-310001303523bti:CashSettledMember2021-01-012021-12-310001303523bti:EquitySettledMember2020-01-012020-12-310001303523bti:CashSettledMember2020-01-012020-12-310001303523bti:TrueUpLiabilityNettingMemberbti:VestedLongTermIncentivePlanMember2022-12-310001303523bti:UnvestedLongTermIncentivePlanMember2022-12-310001303523bti:VestedLongTermIncentivePlanMember2021-12-310001303523bti:UnvestedLongTermIncentivePlanMember2021-12-310001303523bti:VestedDeferredShareBonusSchemeMember2022-12-310001303523bti:UnvestedDeferredShareBonusSchemeMember2022-12-310001303523bti:VestedDeferredShareBonusSchemeMember2021-12-310001303523bti:UnvestedDeferredShareBonusSchemeMember2021-12-310001303523bti:VestedAwardsMember2022-12-310001303523bti:UnvestedAwardsMember2022-12-310001303523bti:VestedAwardsMember2021-12-310001303523bti:UnvestedAwardsMember2021-12-310001303523bti:EquitySettledLongTermIncentivePlanMember2021-12-310001303523bti:CashSettledLongTermIncentivePlanMember2021-12-310001303523bti:EquitySettledLongTermIncentivePlanMember2020-12-310001303523bti:CashSettledLongTermIncentivePlanMember2020-12-310001303523bti:EquitySettledLongTermIncentivePlanMember2022-12-310001303523bti:CashSettledLongTermIncentivePlanMember2022-12-310001303523bti:ReynoldsAmericanIncMemberbti:EquitySettledLongTermIncentivePlanMember2022-12-310001303523bti:ReynoldsAmericanIncMemberbti:EquitySettledLongTermIncentivePlanMember2021-12-310001303523bti:ReynoldsAmericanIncMemberbti:EquitySettledLongTermIncentivePlanMember2022-01-012022-12-31iso4217:USDxbrli:shares0001303523bti:ReynoldsAmericanIncMemberbti:EquitySettledLongTermIncentivePlanMember2021-01-012021-12-310001303523bti:ReynoldsAmericanIncMemberbti:EquitySettledLongTermIncentivePlanMember2020-01-012020-12-310001303523bti:EquitySettledDeferredShareBonusSchemeMember2021-12-310001303523bti:CashSettledDeferredShareBonusSchemeMember2021-12-310001303523bti:EquitySettledDeferredShareBonusSchemeMember2020-12-310001303523bti:CashSettledDeferredShareBonusSchemeMember2020-12-310001303523bti:EquitySettledDeferredShareBonusSchemeMember2022-12-310001303523bti:CashSettledDeferredShareBonusSchemeMember2022-12-310001303523bti:AggregateCompanyMemberbti:LongTermIncentivePlanMember2022-01-012022-12-310001303523bti:AggregateCompanyMemberbti:DeferredShareBonusSchemeMember2022-01-012022-12-310001303523bti:AggregateCompanyMemberbti:LongTermIncentivePlanMember2021-01-012021-12-310001303523bti:AggregateCompanyMemberbti:DeferredShareBonusSchemeMember2021-01-012021-12-310001303523bti:AggregateCompanyMemberbti:LongTermIncentivePlanMemberifrs-full:BottomOfRangeMember2022-12-310001303523bti:AggregateCompanyMemberifrs-full:TopOfRangeMemberbti:LongTermIncentivePlanMember2022-12-310001303523bti:AggregateCompanyMemberbti:DeferredShareBonusSchemeMember2022-12-310001303523bti:AggregateCompanyMemberbti:LongTermIncentivePlanMemberifrs-full:BottomOfRangeMember2021-12-310001303523bti:AggregateCompanyMemberifrs-full:TopOfRangeMemberbti:LongTermIncentivePlanMember2021-12-310001303523bti:AggregateCompanyMemberbti:DeferredShareBonusSchemeMember2021-12-310001303523bti:ManagementBoardMemberbti:LongTermIncentivePlanMemberifrs-full:BottomOfRangeMember2022-12-310001303523bti:ManagementBoardMemberifrs-full:TopOfRangeMemberbti:LongTermIncentivePlanMember2022-12-310001303523bti:ManagementBoardMemberbti:DeferredShareBonusSchemeMember2022-12-310001303523bti:ManagementBoardMemberbti:LongTermIncentivePlanMemberifrs-full:BottomOfRangeMember2021-12-310001303523bti:ManagementBoardMemberifrs-full:TopOfRangeMemberbti:LongTermIncentivePlanMember2021-12-310001303523bti:ManagementBoardMemberbti:DeferredShareBonusSchemeMember2021-12-310001303523bti:LongTermIncentivePlanMember2022-01-012022-12-310001303523bti:LongTermIncentivePlanMember2021-01-012021-12-3100013035232017-01-012021-12-31bti:Employee0001303523srt:SubsidiariesMemberbti:UnitedStatesSegmentMember2022-01-012022-12-310001303523srt:SubsidiariesMemberbti:UnitedStatesSegmentMember2021-01-012021-12-310001303523srt:SubsidiariesMemberbti:AmericasAndSubSaharanAfricaMember2022-01-012022-12-310001303523srt:SubsidiariesMemberbti:AmericasAndSubSaharanAfricaMember2021-01-012021-12-310001303523srt:SubsidiariesMemberbti:EuropeSegmentMember2022-01-012022-12-310001303523srt:SubsidiariesMemberbti:EuropeSegmentMember2021-01-012021-12-310001303523bti:AsiaPacificAndMiddleEastMembersrt:SubsidiariesMember2022-01-012022-12-310001303523bti:AsiaPacificAndMiddleEastMembersrt:SubsidiariesMember2021-01-012021-12-310001303523srt:SubsidiariesMember2022-01-012022-12-310001303523srt:SubsidiariesMember2021-01-012021-12-310001303523ifrs-full:AssociatesMember2022-01-012022-12-310001303523ifrs-full:AssociatesMember2021-01-012021-12-310001303523country:UZbti:SamfruitMember2022-01-012022-12-310001303523bti:SamfruitMember2022-12-310001303523country:UZbti:SamfruitMember2021-01-012021-12-310001303523bti:SamfruitMember2021-12-310001303523country:UZbti:SamfruitMember2020-01-012020-12-310001303523bti:SamfruitMember2020-12-310001303523bti:BentoelMember2022-12-310001303523bti:OrganigramMember2021-03-310001303523bti:ExecutiveDirectorsMember2022-01-012022-12-310001303523bti:ExecutiveDirectorsMember2021-01-012021-12-310001303523bti:ExecutiveDirectorsMember2020-01-012020-12-310001303523bti:TotalDirectorsMember2022-01-012022-12-310001303523bti:TotalDirectorsMember2021-01-012021-12-310001303523bti:TotalDirectorsMember2020-01-012020-12-310001303523bti:ChairmanMember2022-01-012022-12-310001303523bti:ChairmanMember2021-01-012021-12-310001303523bti:ChairmanMember2020-01-012020-12-310001303523bti:NonExecutiveDirectorsMember2022-01-012022-12-310001303523bti:NonExecutiveDirectorsMember2021-01-012021-12-310001303523bti:NonExecutiveDirectorsMember2020-01-012020-12-31bti:Case0001303523bti:MedicalReimbursementCasesUSTobaccoRelatedMember2022-01-012022-12-310001303523bti:MedicalReimbursementCasesUSTobaccoRelatedMember2021-01-012021-12-310001303523bti:ClassActionsUSTobaccoRelatedMember2022-01-012022-12-310001303523bti:ClassActionsUSTobaccoRelatedMember2021-01-012021-12-310001303523bti:IndividualSmokingAndHealthCasesUSTobaccoRelatedMember2022-01-012022-12-310001303523bti:IndividualSmokingAndHealthCasesUSTobaccoRelatedMember2021-01-012021-12-310001303523bti:EngleProgenyCasesUSTobaccoRelatedMember2022-01-012022-12-310001303523bti:EngleProgenyCasesUSTobaccoRelatedMember2021-01-012021-12-310001303523bti:BroinIICasesUSTobaccoRelatedMember2022-01-012022-12-310001303523bti:BroinIICasesUSTobaccoRelatedMember2021-01-012021-12-310001303523bti:FilterCasesUSTobaccoRelatedMember2022-01-012022-12-310001303523bti:FilterCasesUSTobaccoRelatedMember2021-01-012021-12-310001303523bti:StateSettlementAgreementsEnforcementAndValidityUSTobaccoRelatedMember2022-01-012022-12-310001303523bti:StateSettlementAgreementsEnforcementAndValidityUSTobaccoRelatedMember2021-01-012021-12-310001303523bti:MedicalReimbursementCasesNonUSTobaccoRelatedMember2022-01-012022-12-310001303523bti:MedicalReimbursementCasesNonUSTobaccoRelatedMember2021-01-012021-12-310001303523bti:ClassActionsNonUSTobaccoRelatedMember2022-01-012022-12-310001303523bti:ClassActionsNonUSTobaccoRelatedMember2021-01-012021-12-310001303523bti:IndividualSmokingAndHealthCasesNonUSTobaccoRelatedMember2022-01-012022-12-310001303523bti:IndividualSmokingAndHealthCasesNonUSTobaccoRelatedMember2021-01-012021-12-310001303523bti:ClassActionsNonUSTobaccoRelatedMemberbti:OutsideUnitedStatesMember2022-01-012022-12-310001303523country:CAbti:ClassActionsNonUSTobaccoRelatedMember2022-01-012022-12-310001303523country:VEbti:ClassActionsNonUSTobaccoRelatedMember2022-01-012022-12-310001303523bti:IndividualSmokingAndHealthCasesNonUSTobaccoRelatedMembercountry:BR2022-01-012022-12-31bti:CASE0001303523bti:IndividualSmokingAndHealthCasesNonUSTobaccoRelatedMembercountry:CL2022-01-012022-12-310001303523bti:IndividualSmokingAndHealthCasesNonUSTobaccoRelatedMembercountry:IT2022-01-012022-12-310001303523bti:IndividualSmokingAndHealthCasesNonUSTobaccoRelatedMembercountry:CA2022-01-012022-12-310001303523bti:IndividualSmokingAndHealthCasesNonUSTobaccoRelatedMembercountry:AR2022-01-012022-12-310001303523bti:IndividualSmokingAndHealthCasesNonUSTobaccoRelatedMembercountry:IE2022-01-012022-12-310001303523bti:IndividualSmokingAndHealthCasesNonUSTobaccoRelatedMemberbti:FurtherTwoJurisdictionsMember2022-01-012022-12-310001303523bti:IndividualSmokingAndHealthCasesNonUSTobaccoRelatedMemberbti:CaseOneMemberbti:CompensatoryDamagesAwardedMembercountry:AR2022-01-012022-12-31iso4217:ARS0001303523bti:IndividualSmokingAndHealthCasesNonUSTobaccoRelatedMemberbti:PunitiveDamagesAwardedMemberbti:CaseOneMembercountry:AR2022-01-012022-12-310001303523bti:IndividualSmokingAndHealthCasesNonUSTobaccoRelatedMemberbti:CaseOneMembercountry:AR2022-01-012022-12-310001303523bti:IndividualSmokingAndHealthCasesNonUSTobaccoRelatedMemberbti:CaseTwoMembercountry:AR2022-01-012022-12-310001303523currency:USD2022-12-310001303523currency:CAD2022-12-310001303523currency:EUR2022-12-310001303523currency:BRL2022-12-31iso4217:BRL0001303523currency:AOA2022-12-31iso4217:AOA0001303523currency:NGN2022-12-31iso4217:NGN0001303523currency:KRW2022-12-31iso4217:KRW0001303523currency:HRK2022-12-31iso4217:HRK0001303523currency:JPY2022-12-31iso4217:JPY0001303523currency:QAR2022-12-31iso4217:QAR0001303523currency:SAR2022-12-31iso4217:SAR0001303523currency:ARS2022-12-310001303523currency:MZN2022-12-31iso4217:MZN0001303523currency:EGP2022-12-31iso4217:EGP0001303523bti:RJRTBAndWAndLorillardTobaccoMembercountry:US2022-01-012022-12-310001303523country:USbti:USTobaccoLitigationMember2022-01-012022-12-310001303523country:USbti:ReynoldsDefendantsMember2022-12-310001303523country:USbti:IndividualSmokingAndHealthCasesMemberbti:ReynoldsDefendantsMember2022-12-310001303523bti:FilterCasesMembercountry:USbti:ReynoldsDefendantsMember2022-12-310001303523country:USbti:OtherNonSmokingAndHealthCasesMemberbti:ReynoldsDefendantsMember2022-12-310001303523bti:EngleProgenyCasesMembercountry:US2022-12-310001303523country:USbti:ReynoldsDefendantsMember2020-01-012022-12-310001303523stpr:FLbti:ReynoldsDefendantsMember2020-01-012022-12-310001303523stpr:ORbti:ReynoldsDefendantsMember2020-01-012022-12-310001303523stpr:MAbti:ReynoldsDefendantsMember2020-01-012022-12-310001303523bti:ReynoldsDefendantsMember2020-01-012022-12-310001303523stpr:NMbti:ReynoldsDefendantsMember2020-01-012022-12-310001303523bti:RJRTBAndWAndLorillardTobaccoMemberbti:CrowCreekSiouxTribeAndAmericanTobaccoCoMember2022-12-31bti:REIMBURSEMENT00013035231999-09-2200013035232006-08-172006-08-17bti:SUBJECTbti:CLASSACTION0001303523bti:USTobaccoRelatedActionsMember2022-01-012022-12-310001303523ifrs-full:TopOfRangeMember2022-01-012022-12-310001303523bti:SFNTCMember2022-12-310001303523bti:SFNTCMembercountry:US2022-01-012022-12-31bti:DISTRICTCOURT0001303523bti:SFNTCMember2022-01-012022-12-310001303523bti:SFNTCMember2016-04-300001303523bti:JonesVAmericanTobaccoCoIncMember2022-01-012022-12-310001303523bti:YoungVAmericanTobaccoCoIncMember2022-01-012022-12-310001303523bti:PhaseIIMember2020-06-302020-07-310001303523bti:PhaseIIMemberbti:RJReynoldsTobaccoCompanyMember2020-06-302020-07-310001303523bti:PhaseIIMemberbti:BrownAndWilliamsonHoldingsIncMember2020-06-302020-07-310001303523bti:LorillardIncMemberbti:PhaseIIMember2020-06-302020-07-31bti:REPRESENTATIVE0001303523bti:EngleClassActionAndEngleProgenyCasesFloridaMember2022-01-012022-12-310001303523bti:EngleProgenyCasesMember2015-01-012015-12-310001303523bti:RJReynoldsTobaccoCompanyMemberbti:EngleProgenyCasesMember2015-01-012015-12-310001303523bti:PhilipMorrisUSAIncMemberbti:EngleProgenyCasesMember2015-01-012015-12-310001303523bti:LorillardTobaccoMemberbti:EngleProgenyCasesMember2015-01-012015-12-310001303523bti:EngleProgenyCasesMember2022-01-012022-12-310001303523stpr:FLbti:EngleProgenyCasesMember2020-01-012022-12-310001303523bti:EngleProgenyCasesMember2020-01-012022-12-310001303523bti:CompensatoryDamagesAwardedMemberbti:EngleProgenyCasesMember2020-01-012022-12-310001303523bti:PunitiveDamagesAwardedMemberbti:EngleProgenyCasesMember2020-01-012022-12-310001303523bti:EngleProgenyCasesMemberifrs-full:ThreeYearsBeforeReportingYearMember2020-01-012022-12-310001303523stpr:FLbti:EngleProgenyCasesMember2022-01-012022-12-310001303523bti:EngleProgenyCasesMember2022-12-310001303523bti:IndividualSmokingAndHealthCasesMember2022-01-012022-12-310001303523bti:IndividualSmokingAndHealthCasesMember2021-01-012021-12-310001303523bti:EngleProgenyCasesMember2021-01-012021-12-310001303523bti:BroinIICasesMember2022-01-012022-12-310001303523bti:BroinIICasesMember2021-01-012021-12-310001303523bti:FilterCasesMember2022-01-012022-12-310001303523bti:FilterCasesMember2021-01-012021-12-310001303523bti:USTobaccoRelatedActionsMemberbti:IndividualSmokingAndHealthCasesUSTobaccoRelatedMember2022-12-310001303523bti:USTobaccoRelatedActionsMemberbti:IndividualSmokingAndHealthCasesUSTobaccoRelatedMember2022-01-012022-12-310001303523stpr:FLbti:BroinVPhilipMorrisIncMember1997-09-301997-10-310001303523stpr:FLbti:RJReynoldsTobaccoCompanyMemberbti:BroinVPhilipMorrisIncMember1997-09-301997-10-310001303523bti:BrownAndWilliamsonHoldingsIncMemberstpr:FLbti:BroinVPhilipMorrisIncMember1997-09-301997-10-310001303523stpr:FLbti:LorillardTobaccoMemberbti:BroinVPhilipMorrisIncMember1997-09-301997-10-310001303523bti:BroinIICasesMember2007-01-312022-12-310001303523bti:FilterCasesMemberbti:LorillardTobaccoAndRJRTMember2022-01-012022-12-310001303523bti:FilterCasesMemberbti:LorillardTobaccoAndRJRTMember2020-01-012022-12-310001303523bti:MasterSettlementAgreementMemberbti:RJReynoldsTobaccoCompanyMember1998-10-311998-11-3000013035231998-11-3000013035232019-01-012019-12-310001303523srt:ScenarioForecastMemberifrs-full:BottomOfRangeMemberifrs-full:LaterThanOneYearMember2023-01-012023-12-310001303523srt:ScenarioForecastMemberifrs-full:BottomOfRangeMemberifrs-full:LaterThanTwoYearsAndNotLaterThanThreeYearsMember2024-01-012024-12-3100013035232013-08-012013-09-30bti:STATE0001303523bti:NPMAdjustmentSettlementAgreementMember2003-01-312012-12-3100013035232021-09-012021-09-300001303523bti:ImperialTobaccoGroupPLCMemberbti:FloridaStateSettlementAgreementRegardingFourBrandsMember2017-01-172017-01-180001303523bti:NPMAdjustmentSettlementAgreementMemberbti:ImperialTobaccoGroupPLCMember2017-01-172017-01-180001303523bti:RJReynoldsTobaccoCompanyMember2021-12-310001303523bti:RJReynoldsTobaccoCompanyMember2020-10-050001303523stpr:FLbti:RJReynoldsTobaccoCompanyMember2020-10-052020-10-050001303523bti:ImperialTobaccoGroupPLCMemberbti:MississippiSettlementAgreementMember2018-01-012018-12-310001303523bti:MississippiSettlementAgreementMember2021-06-142021-06-140001303523country:US2017-01-012017-12-310001303523country:US2018-01-012018-12-310001303523bti:RJRTMember2018-01-012018-12-310001303523bti:RJRTMember2021-01-010001303523bti:RJRTAndITGMember2022-05-272022-05-270001303523bti:RJRTMember2022-06-070001303523bti:MasterSettlementAgreementMemberstpr:IA2022-07-282022-07-280001303523bti:TobaccoProductLiabilityClaimsMember2021-12-31bti:MARKET0001303523country:AO2016-11-012016-11-300001303523bti:ImperialTobaccoCanadaMembercountry:CA2019-03-010001303523bti:ImperialTobaccoCanadaMembercountry:CA2021-01-012021-12-310001303523country:CAbti:TreatmentOfSmokingAndHealthRelatedDiseasesMember2022-01-012022-12-31bti:ACTION0001303523bti:CanadianProvinceMemberbti:TreatmentOfSmokingAndHealthRelatedDiseasesMember2022-01-012022-12-31bti:provincebti:territory0001303523stpr:CA-BCbti:TobaccoDamagesAndHealthCareCostsRecoveryAct2000Member2017-02-132017-02-130001303523bti:TobaccoDamagesAndHealthCareCostsRecoveryAct2000Membercountry:CA2017-02-132017-02-130001303523stpr:CA-BCifrs-full:BottomOfRangeMemberbti:TobaccoDamagesAndHealthCareCostsRecoveryAct2000Member2022-12-310001303523ifrs-full:TopOfRangeMemberstpr:CA-BCbti:TobaccoDamagesAndHealthCareCostsRecoveryAct2000Member2022-12-310001303523stpr:CA-ONifrs-full:BottomOfRangeMemberbti:TobaccoDamagesAndHealthCareCostsRecoveryAct2009Member2018-06-150001303523ifrs-full:TopOfRangeMemberstpr:CA-ONbti:TobaccoDamagesAndHealthCareCostsRecoveryAct2009Member2018-06-150001303523stpr:CA-ONbti:TobaccoDamagesAndHealthCareCostsRecoveryAct2009Member2018-06-152018-06-150001303523stpr:CA-ONifrs-full:BottomOfRangeMemberbti:TobaccoDamagesAndHealthCareCostsRecoveryAct2009Member2019-01-310001303523ifrs-full:TopOfRangeMemberstpr:CA-ONbti:TobaccoDamagesAndHealthCareCostsRecoveryAct2009Member2019-01-310001303523stpr:CA-ABbti:CrownsRightOfRecoveryAct2009Member2022-01-012022-12-310001303523stpr:CA-QCbti:TobaccoDamagesAndHealthCareCostsRecoveryAct2009Member2022-01-012022-12-310001303523bti:NigerianCourtMember2022-01-012022-12-310001303523bti:NationalHealthInsuranceServiceMembercountry:KR2022-01-012022-12-310001303523bti:FederalAttorneysOfficeMembercountry:BR2019-05-212019-05-21bti:DISEASE0001303523bti:KnightClassActionMember2022-12-310001303523bti:GrowersClassActionMembercountry:CA2022-01-012022-12-310001303523bti:QuebecClassActionsMembercountry:CA2022-12-310001303523bti:QuebecClassActionsMembercountry:CA2015-05-272015-05-270001303523bti:QuebecClassActionsMembercountry:CAbti:ImperialTobaccoCanadaLimitedMember2015-05-272015-05-270001303523bti:QuebecClassActionsMembercountry:CA2015-06-062015-06-060001303523bti:QuebecClassActionsMembercountry:CAbti:ImperialTobaccoCanadaLimitedMember2015-06-062015-06-060001303523bti:QuebecClassActionsMembercountry:CA2015-10-272015-10-270001303523bti:QuebecClassActionsMembercountry:CAbti:ImperialTobaccoCanadaLimitedMember2015-10-272015-10-270001303523bti:QuebecClassActionsMembercountry:CAbti:ImperialTobaccoCanadaLimitedMember2019-03-012019-03-010001303523bti:QuebecClassActionsMembercountry:CA2019-03-010001303523bti:QuebecClassActionsMembercountry:CAbti:ImperialTobaccoCanadaLimitedMember2019-03-010001303523bti:OtherCanadianSmokingAndHealthClassActionsMembercountry:CA2022-12-310001303523bti:OtherCanadianSmokingAndHealthClassActionsMembercountry:CA2009-06-300001303523bti:OtherCanadianSmokingAndHealthClassActionsMemberbti:BritishColumbiaMember2010-06-30bti:CLAIM0001303523country:CL2022-01-012022-12-310001303523country:IT2022-01-012022-12-310001303523country:AR2022-01-012022-12-310001303523country:IE2022-01-012022-12-310001303523bti:TwoJurisdictionsMember2022-01-012022-12-310001303523bti:CaseOneMemberbti:CompensatoryDamagesAwardedMember2022-01-012022-12-310001303523bti:PunitiveDamagesAwardedMemberbti:CaseOneMember2022-01-012022-12-310001303523bti:CaseOneMember2022-01-012022-12-310001303523bti:CaseTwoMember2022-01-012022-12-310001303523bti:LitigationOutcomeMemberbti:CamelliaChastainMember2023-01-110001303523bti:NonTobaccoRelatedLitigationMember2017-08-222017-08-220001303523bti:NonTobaccoRelatedLitigationMember2018-04-302018-04-300001303523bti:GloLitigationMember2019-01-172019-01-170001303523bti:AltriaClientServicesLLCMember2020-05-28bti:patent0001303523bti:AltriaClientServicesLLCMemberbti:VuseVibeMember2020-05-280001303523bti:AltriaClientServicesLLCMemberbti:VuseAltoMember2020-05-280001303523bti:AltriaClientServicesLLCMemberbti:VeloOralProductMember2020-05-280001303523bti:AltriaClientServicesLLCMemberbti:VuseAltoMember2021-05-120001303523bti:AltriaClientServicesLLCMember2022-08-292022-09-070001303523bti:AltriaClientServicesLLCMemberbti:LitigationOutcomeMember2023-01-270001303523bti:PhilipMorrisMember2020-04-090001303523bti:PhilipMorrisMember2020-06-290001303523bti:PhilipMorrisMember2022-06-080001303523bti:AltriaClientServicesLLCMember2022-06-080001303523bti:AltriaClientServicesLLCMemberbti:VuseAltoMember2022-06-150001303523bti:AltriaClientServicesLLCMemberbti:SoloMember2022-06-150001303523bti:PhilipMorrisMember2022-06-152022-06-150001303523bti:MozambicanIPLitigationMember2017-07-012018-03-310001303523bti:MozambicanIPLitigationMember2018-12-312018-12-310001303523bti:MalawiGroupMember2020-12-312020-12-31bti:FARMERbti:affiliate0001303523bti:MalawiGroupMember2022-01-012022-01-310001303523bti:AliBinAliEstablishmentMember2020-08-162020-08-16bti:consignment0001303523bti:AliBinAliEstablishmentMember2021-01-072021-01-070001303523bti:AlNaghiMember2021-01-252021-01-250001303523bti:AsbestosLitigationMember2022-03-042022-11-100001303523bti:NCRMemberbti:FoxRiverMember2022-01-012022-12-310001303523bti:NCRMemberbti:FoxRiverMember2019-11-300001303523bti:NCRMemberbti:FoxRiverMember2012-05-012012-05-3100013035232012-05-012012-05-310001303523bti:NCRMemberbti:FoxRiverMember2014-09-012014-09-300001303523bti:WindwardMemberbti:FoxRiverMember2014-09-012014-09-3000013035232014-09-012014-09-300001303523bti:WindwardDividendClaimMember2008-01-012008-12-310001303523bti:WindwardDividendClaimMember2009-01-012009-12-310001303523bti:WindwardDividendClaimMemberbti:SequanaMember2009-01-012009-12-310001303523bti:WindwardDividendClaimMember2019-02-062019-02-060001303523bti:WindwardDividendClaimMemberbti:SequanaMember2019-02-062019-02-060001303523bti:NCRMemberbti:FoxRiverMember2019-01-012019-12-310001303523bti:NCRMemberbti:FoxRiverMember2020-01-012020-12-310001303523bti:NCRMemberbti:FoxRiverMember2021-01-012021-12-310001303523bti:KalamazooRiverMember2019-12-112019-12-110001303523bti:GeorgiaPacificMemberbti:NCRMemberbti:KalamazooRiverMember2019-12-112019-12-110001303523bti:NCRMemberbti:KalamazooRiverMember2022-01-012022-12-310001303523bti:FundingMemberbti:NCRAndAppvionMemberbti:KalamazooRiverMember2015-10-012015-12-310001303523ifrs-full:MiscellaneousOtherProvisionsMemberbti:DOJOFACInvestigationMember2022-01-012022-06-3000013035232019-03-01bti:People0001303523bti:LoewsMember2022-01-012022-12-31bti:ProductLiabilityAction0001303523bti:SFRTIIndemnityMember2022-01-012022-12-310001303523country:BRbti:TaxReassessmentMemberbti:SouzaCruzMember2022-12-310001303523country:BR2015-01-012015-12-310001303523bti:TaxReassessmentMembercountry:BR2022-12-310001303523country:NLbti:TaxReassessmentMember2022-12-310001303523country:NLbti:TaxReassessmentMemberbti:CaseOneMember2022-12-310001303523country:NLbti:TaxReassessmentMemberbti:CaseTwoMember2022-12-310001303523country:BDbti:TaxAssessmentMemberbti:BATBangladeshMember2017-01-012017-12-310001303523country:EGbti:TaxAssessmentMemberbti:BritishAmericanTobaccoEgyptLLCMember2022-01-012022-06-300001303523country:EGbti:TaxReassessmentMemberbti:BritishAmericanTobaccoEgyptLLCMember2022-06-300001303523country:EGbti:TaxAndPenaltiesMemberbti:BritishAmericanTobaccoEgyptLLCMember2022-01-012022-06-300001303523country:EGbti:TaxReassessmentMemberbti:BritishAmericanTobaccoEgyptLLCMember2022-06-012022-06-300001303523bti:BATKoreaMemberbti:TaxAssessmentMembercountry:KR2016-12-310001303523bti:ValueAddedTaxMemberbti:TaxReassessmentMemberbti:BATKoreaMembercountry:KR2019-08-232019-08-230001303523bti:ValueAddedTaxMemberbti:BATKoreaMemberbti:TaxAssessmentMembercountry:KR2019-08-230001303523ifrs-full:LaterThanOneYearAndNotLaterThanFiveYearsMember2022-12-310001303523ifrs-full:LaterThanOneYearAndNotLaterThanFiveYearsMember2021-12-310001303523ifrs-full:BuildingsMember2022-12-310001303523ifrs-full:BuildingsMember2021-12-310001303523bti:PlantEquipmentAndOtherMember2022-12-310001303523bti:PlantEquipmentAndOtherMember2021-12-310001303523bti:BritishAmericanTobaccoBangladeshCompanyLimitedMember2020-01-012020-12-310001303523bti:BritishAmericanTobaccoBangladeshCompanyLimitedMember2021-01-012021-12-310001303523bti:BritishAmericanTobaccoBangladeshCompanyLimitedMember2022-01-012022-12-310001303523bti:BritishAmericanTobaccoBangladeshCompanyLimitedMember2022-12-310001303523bti:BritishAmericanTobaccoBangladeshCompanyLimitedMember2021-12-310001303523bti:BritishAmericanTobaccoBangladeshCompanyLimitedMember2020-12-310001303523bti:BritishAmericanTobaccoBangladeshCompanyLimitedMember2019-12-310001303523country:CAbti:ImperialTobaccoCanadaMember2022-12-310001303523country:CAbti:ImperialTobaccoCanadaMember2021-12-310001303523bti:PTBentoelInternasionalInvestamaTbkMember2022-01-012022-12-310001303523bti:PTBentoelInternasionalInvestamaTbkMember2021-01-012021-12-310001303523bti:PTBentoelInternasionalInvestamaTbkMember2020-01-012020-12-310001303523bti:PTBentoelInternasionalInvestamaTbkMember2011-01-012021-12-310001303523bti:PTBentoelInternasionalInvestamaTbkMember2011-01-012011-12-310001303523bti:PTBentoelInternasionalInvestamaTbkMember2021-12-31bti:shareholder0001303523bti:RegisteredBATCAPBondsInConnectionWithTheAcquisitionOfRAIMember2022-12-310001303523bti:RegisteredBATCAPBondsMember2019-07-170001303523bti:RegisteredBATCAPBondsMember2022-07-010001303523bti:RegisteredBATIFBondsMember2022-12-310001303523bti:ReynoldsAmericanIncMember2020-07-280001303523bti:ReynoldsAmericanIncMember2022-12-310001303523bti:LorillardIncMember2020-07-280001303523bti:LorillardIncMember2022-12-310001303523bti:BATPLCMemberbti:RegisteredBATCAPBondsMember2022-01-012022-12-310001303523bti:BATCAPMemberbti:RegisteredBATCAPBondsMember2022-01-012022-12-310001303523bti:RegisteredBATCAPBondsMemberbti:BATIFMember2022-01-012022-12-310001303523bti:RegisteredBATCAPBondsMemberbti:BATNFMember2022-01-012022-12-310001303523bti:RAIMemberbti:RegisteredBATCAPBondsMember2022-01-012022-12-310001303523bti:RegisteredBATCAPBondsMemberbti:BATHTNMember2022-01-012022-12-310001303523bti:BATPLCMemberbti:TransactionsWithNonIssuerNonGuarantorSubsidiariesMemberbti:RegisteredBATCAPBondsMember2022-01-012022-12-310001303523bti:BATCAPMemberbti:TransactionsWithNonIssuerNonGuarantorSubsidiariesMemberbti:RegisteredBATCAPBondsMember2022-01-012022-12-310001303523bti:TransactionsWithNonIssuerNonGuarantorSubsidiariesMemberbti:RegisteredBATCAPBondsMemberbti:BATIFMember2022-01-012022-12-310001303523bti:TransactionsWithNonIssuerNonGuarantorSubsidiariesMemberbti:RegisteredBATCAPBondsMemberbti:BATNFMember2022-01-012022-12-310001303523bti:RAIMemberbti:TransactionsWithNonIssuerNonGuarantorSubsidiariesMemberbti:RegisteredBATCAPBondsMember2022-01-012022-12-310001303523bti:TransactionsWithNonIssuerNonGuarantorSubsidiariesMemberbti:RegisteredBATCAPBondsMemberbti:BATHTNMember2022-01-012022-12-310001303523bti:BATPLCMemberbti:RegisteredBATCAPBondsMember2021-01-012021-12-310001303523bti:BATCAPMemberbti:RegisteredBATCAPBondsMember2021-01-012021-12-310001303523bti:RegisteredBATCAPBondsMemberbti:BATIFMember2021-01-012021-12-310001303523bti:RegisteredBATCAPBondsMemberbti:BATNFMember2021-01-012021-12-310001303523bti:RAIMemberbti:RegisteredBATCAPBondsMember2021-01-012021-12-310001303523bti:RegisteredBATCAPBondsMemberbti:BATHTNMember2021-01-012021-12-310001303523bti:BATPLCMemberbti:TransactionsWithNonIssuerNonGuarantorSubsidiariesMemberbti:RegisteredBATCAPBondsMember2021-01-012021-12-310001303523bti:BATCAPMemberbti:TransactionsWithNonIssuerNonGuarantorSubsidiariesMemberbti:RegisteredBATCAPBondsMember2021-01-012021-12-310001303523bti:TransactionsWithNonIssuerNonGuarantorSubsidiariesMemberbti:RegisteredBATCAPBondsMemberbti:BATIFMember2021-01-012021-12-310001303523bti:TransactionsWithNonIssuerNonGuarantorSubsidiariesMemberbti:RegisteredBATCAPBondsMemberbti:BATNFMember2021-01-012021-12-310001303523bti:RAIMemberbti:TransactionsWithNonIssuerNonGuarantorSubsidiariesMemberbti:RegisteredBATCAPBondsMember2021-01-012021-12-310001303523bti:TransactionsWithNonIssuerNonGuarantorSubsidiariesMemberbti:RegisteredBATCAPBondsMemberbti:BATHTNMember2021-01-012021-12-310001303523bti:BATPLCMemberbti:RegisteredBATCAPBondsMember2022-12-310001303523bti:BATCAPMemberbti:RegisteredBATCAPBondsMember2022-12-310001303523bti:RegisteredBATCAPBondsMemberbti:BATIFMember2022-12-310001303523bti:RegisteredBATCAPBondsMemberbti:BATNFMember2022-12-310001303523bti:RAIMemberbti:RegisteredBATCAPBondsMember2022-12-310001303523bti:RegisteredBATCAPBondsMemberbti:BATHTNMember2022-12-310001303523bti:BATPLCMemberbti:TransactionsWithNonIssuerNonGuarantorSubsidiariesMemberbti:RegisteredBATCAPBondsMember2022-12-310001303523bti:BATCAPMemberbti:TransactionsWithNonIssuerNonGuarantorSubsidiariesMemberbti:RegisteredBATCAPBondsMember2022-12-310001303523bti:TransactionsWithNonIssuerNonGuarantorSubsidiariesMemberbti:RegisteredBATCAPBondsMemberbti:BATIFMember2022-12-310001303523bti:TransactionsWithNonIssuerNonGuarantorSubsidiariesMemberbti:RegisteredBATCAPBondsMemberbti:BATNFMember2022-12-310001303523bti:RAIMemberbti:TransactionsWithNonIssuerNonGuarantorSubsidiariesMemberbti:RegisteredBATCAPBondsMember2022-12-310001303523bti:TransactionsWithNonIssuerNonGuarantorSubsidiariesMemberbti:RegisteredBATCAPBondsMemberbti:BATHTNMember2022-12-310001303523bti:BATPLCMemberbti:RegisteredBATCAPBondsMember2021-12-310001303523bti:BATCAPMemberbti:RegisteredBATCAPBondsMember2021-12-310001303523bti:RegisteredBATCAPBondsMemberbti:BATIFMember2021-12-310001303523bti:RegisteredBATCAPBondsMemberbti:BATNFMember2021-12-310001303523bti:RAIMemberbti:RegisteredBATCAPBondsMember2021-12-310001303523bti:RegisteredBATCAPBondsMemberbti:BATHTNMember2021-12-310001303523bti:BATPLCMemberbti:TransactionsWithNonIssuerNonGuarantorSubsidiariesMemberbti:RegisteredBATCAPBondsMember2021-12-310001303523bti:BATCAPMemberbti:TransactionsWithNonIssuerNonGuarantorSubsidiariesMemberbti:RegisteredBATCAPBondsMember2021-12-310001303523bti:TransactionsWithNonIssuerNonGuarantorSubsidiariesMemberbti:RegisteredBATCAPBondsMemberbti:BATIFMember2021-12-310001303523bti:TransactionsWithNonIssuerNonGuarantorSubsidiariesMemberbti:RegisteredBATCAPBondsMemberbti:BATNFMember2021-12-310001303523bti:RAIMemberbti:TransactionsWithNonIssuerNonGuarantorSubsidiariesMemberbti:RegisteredBATCAPBondsMember2021-12-310001303523bti:TransactionsWithNonIssuerNonGuarantorSubsidiariesMemberbti:RegisteredBATCAPBondsMemberbti:BATHTNMember2021-12-310001303523bti:BATPLCMember2022-01-012022-12-310001303523bti:BATPLCMember2021-09-270001303523bti:BATPLCMember2022-12-310001303523bti:BATPLCMember2021-12-31
UNITED STATES
SECURITIES AND EXCHANGE COMMISSION
WASHINGTON, D.C. 20549
FORM 20-F
(Mark One)
☐ REGISTRATION STATEMENT PURSUANT TO SECTION 12(b) OR (g) OF THE SECURITIES EXCHANGE ACT OF 1934
OR
☒ ANNUAL REPORT PURSUANT TO SECTION 13 OR 15(d) OF THE SECURITIES EXCHANGE ACT OF 1934
For the fiscal year ended December 31, 2022
OR
☐ TRANSITION REPORT PURSUANT TO SECTION 13 OR 15(d) OF THE SECURITIES EXCHANGE ACT OF 1934
OR
☐ SHELL COMPANY REPORT PURSUANT TO SECTION 13 OR 15(d) OF THE SECURITIES EXCHANGE ACT OF 1934
Date of event requiring this shell company report
For the transition period from to
Commission file number 001-38159
British American Tobacco p.l.c.
(Exact name of Registrant as specified in its charter)
(Translation of Registrant’s name into English)
England and Wales
(Jurisdiction of incorporation or organization)
Globe House, 4 Temple Place, London WC2R 2PG, United Kingdom
(Address of principal executive offices)
Paul McCrory, Company Secretary Tel: +44 (0)20 7845 1000
Fax: +44 (0)20 7240 0555
Globe House, 4 Temple Place, London WC2R 2PG, United Kingdom
(Name, Telephone, E-mail and/or Facsimile number and Address of Company Contact Person)
Securities registered or to be registered pursuant to Section 12(b) of the Act.
| | | | | | | | |
| Title of each class | Trading symbol(s) | Name of each exchange on which registered |
| | |
| American Depositary Shares (evidenced by American Depositary Receipts) | BTI | New York Stock Exchange |
| each representing one ordinary share | | |
| | |
| Ordinary shares, nominal value 25 pence per share | BTI | New York Stock Exchange* |
| 7.750% Notes due 2032 | BTI32A | New York Stock Exchange |
| 4.742% Notes due 2032 | BTI32 | New York Stock Exchange |
| 5.650% Notes due 2052 | BTI52 | New York Stock Exchange |
| 4.448% Notes due 2028 | BTI28A | New York Stock Exchange |
| 2.259% Notes due 2028 | BTI28 | New York Stock Exchange |
| 2.726% Notes due 2031 | BTI31 | New York Stock Exchange |
| 3.734% Notes due 2040 | BTI40 | New York Stock Exchange |
| 3.984% Notes due 2050 | BTI50A | New York Stock Exchange |
| 1.668% Notes due 2026 | BTI26A | New York Stock Exchange |
| 4.700% Notes due 2027 | BTI27A | New York Stock Exchange |
| 4.906% Notes due 2030 | BTI30 | New York Stock Exchange |
| 5.282% Notes due 2050 | BTI50 | New York Stock Exchange |
| 2.789% Notes due 2024 | BTI24 | New York Stock Exchange |
| 3.215% Notes due 2026 | BTI26 | New York Stock Exchange |
| 3.462% Notes due 2029 | BTI29 | New York Stock Exchange |
| 4.758% Notes due 2049 | BTI49 | New York Stock Exchange |
| 3.222% Notes due 2024 | BTI24A | New York Stock Exchange |
| 3.557% Notes due 2027 | BTI27 | New York Stock Exchange |
| 4.390% Notes due 2037 | BTI37 | New York Stock Exchange |
| 4.540% Notes due 2047 | BTI47 | New York Stock Exchange |
* Application made for registration purposes only, not for trading, and only in connection with the registration of the American Depositary Shares pursuant to the requirements of the Securities and Exchange Commission.
Securities registered or to be registered pursuant to Section 12(g) of the Act.
None
Securities for which there is a reporting obligation pursuant to Section 15(d) of the Act.
None
Indicate the number of outstanding shares of each of the issuer’s classes of capital or common stock as of the close of the period covered by the Annual Report.
2,456,867,420 ordinary shares
Indicate by check mark if the registrant is a well-known seasoned issuer, as defined in Rule 405 of the Securities Act. ☒ Yes ☐ No
If this report is an annual or transition report, indicate by check mark if the registrant is not required to file reports pursuant to Section 13 or 15(d) of the Securities Exchange Act of 1934. ☐ Yes ☒ No
Note – Checking the box above will not relieve any registrant required to file reports pursuant to Section 13 or 15(d) of the Securities Exchange Act of 1934 from their obligations under those Sections.
Indicate by check mark whether the registrant (1) has filed all reports required to be filed by Section 13 or 15(d) of the Securities Exchange Act of 1934 during the preceding 12 months (or for such shorter period that the registrant was required to file such reports), and (2) has been subject to such filing requirements for the past 90 days. ☒ Yes ☐ No
Indicate by check mark whether the registrant has submitted electronically every Interactive Data File required to be submitted pursuant to Rule 405 of Regulation S-T (§232.405 of this chapter) during the preceding 12 months (or for such shorter period that the registrant was required to submit such files). ☒ Yes ☐ No
Indicate by check mark whether the registrant is a large accelerated filer, an accelerated filer, a non-accelerated filer, or an emerging growth company. See definition of “large accelerated filer,” “accelerated filer,” and “emerging growth company” in Rule 12b-2 of the Exchange Act.
| | | | | | | | | | | |
| Large accelerated filer | ☒ | Accelerated filer | ☐ |
| Non-accelerated filer | ☐ | Emerging growth company | ☐ |
If an emerging growth company that prepares its financial statements in accordance with US GAAP, indicate by check mark if the registrant has elected not to use the extended transition period for complying with any new or revised financial accounting standards† provided pursuant to Section 13(a) of the Exchange Act. ☐
† The term “new or revised financial accounting standard” refers to any update issued by the Financial Accounting Standards Board to its Accounting Standards Codification after April 5, 2012.
Indicate by check mark whether the registrant has filed a report on and attestation to its management’s assessment of the effectiveness of its internal control over financial reporting under Section 404(b) of the Sarbanes-Oxley Act (15 U.S.C. 7262(b)) by the registered public accounting firm that prepared or issued its audit report. ☒
If securities are registered pursuant to Section 12(b) of the Act, indicate by check mark whether the financial statements of the registrant included in the filing reflect the correction of an error to previously issued financial statements. ☐
Indicate by check mark whether any of those error corrections are restatements that required a recovery analysis of incentive based compensation received by any of the registrant’s executive officers during the relevant recovery period pursuant to §240.10D-1(b). ☐
Indicate by check mark which basis of accounting the registrant has used to prepare the financial statements included in this filing:
| | | | | | | | | | | | | | |
| US GAAP | International Financial Reporting Standards as issued by the | Other ☐ | |
| ☐ | International Accounting Standards Board ☒ | | |
If “Other” has been checked in response to the previous question, indicate by check mark which financial statement item the registrant has elected to follow. ☐ Item 17 ☐ Item 18
If this is an annual report, indicate by check mark whether the registrant is a shell company (as defined in Rule 12b-2 of the Exchange Act). ☐ Yes ☒ No
| | | | | |
| Name of the auditor’s firm | KPMG LLP |
| Auditors’ firm ID/ PCAOB issued Audit Firm Identifier | 1118 |
| Auditors’ Location – City, State/Province, Country | 15 Canada Square, London, E14 5GL |
This Annual Report and Accounts on Form 20-F contains forward-looking non-GAAP measures used by management to monitor the Group’s performance. For the non-GAAP information contained in this Annual Report and Accounts on Form 20-F, no comparable GAAP or IFRS information is available on a forward-looking basis and our forward-looking revenue and other components of the Group’s results, including the revenue generated from combustibles, cannot be estimated with reasonable certainty due to, among other things, the impact of foreign exchange, pricing and volume, which could be significant, are highly variable. As such, no reconciliations for this forward-looking non-GAAP information are available.
| | | | | |
| 12 Months Ended |
| 31 Dec 2022 |
| Entity Central Index Key | 0001303523 |
| Current Fiscal Year End Date | 31 Dec 2022 |
| Document Fiscal Year Focus | 2022 |
| Document Fiscal Period Focus | FY |
| Amendment Flag | false |
| Title of 12(b) Security | NYSE
|
1
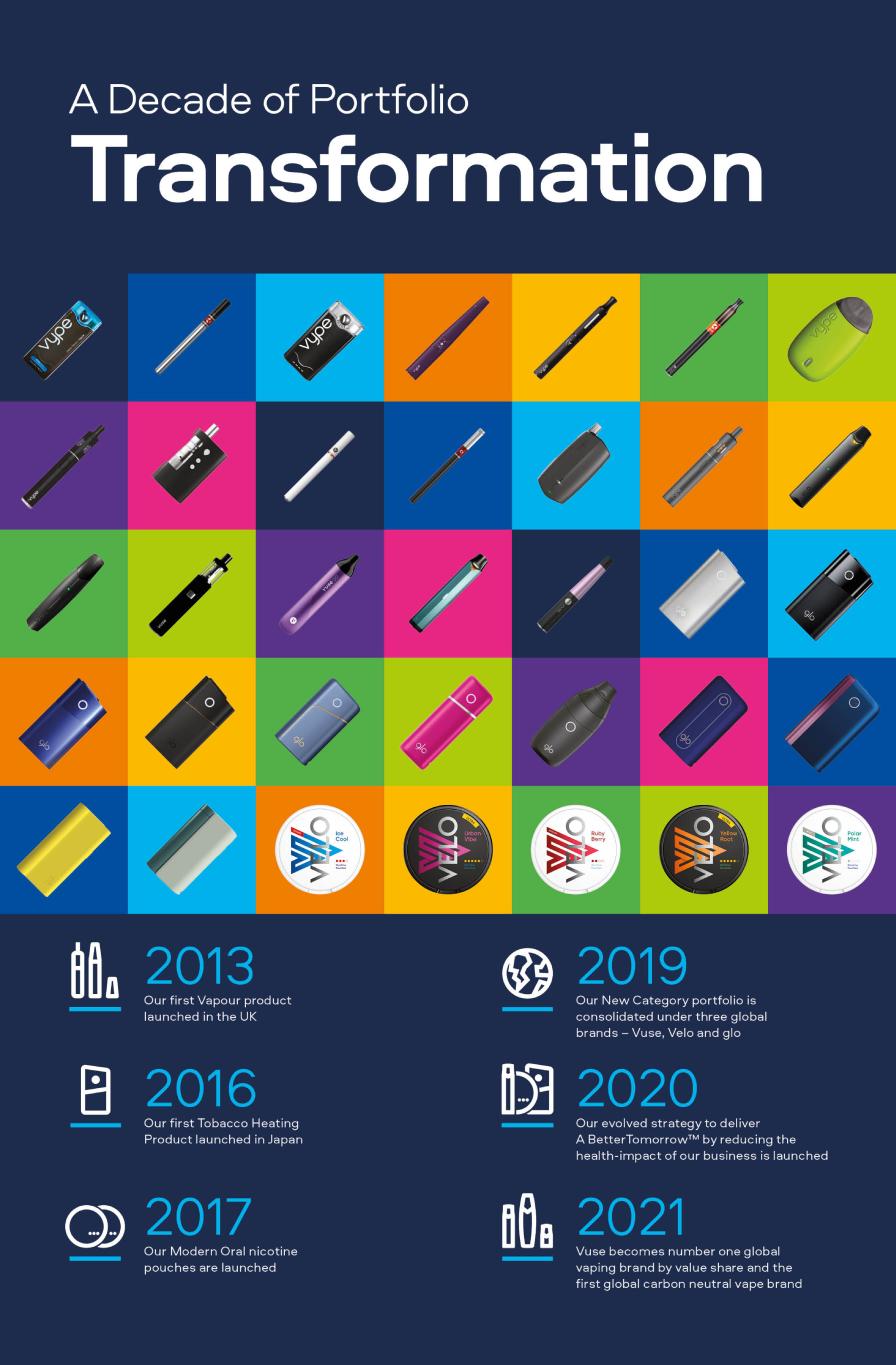
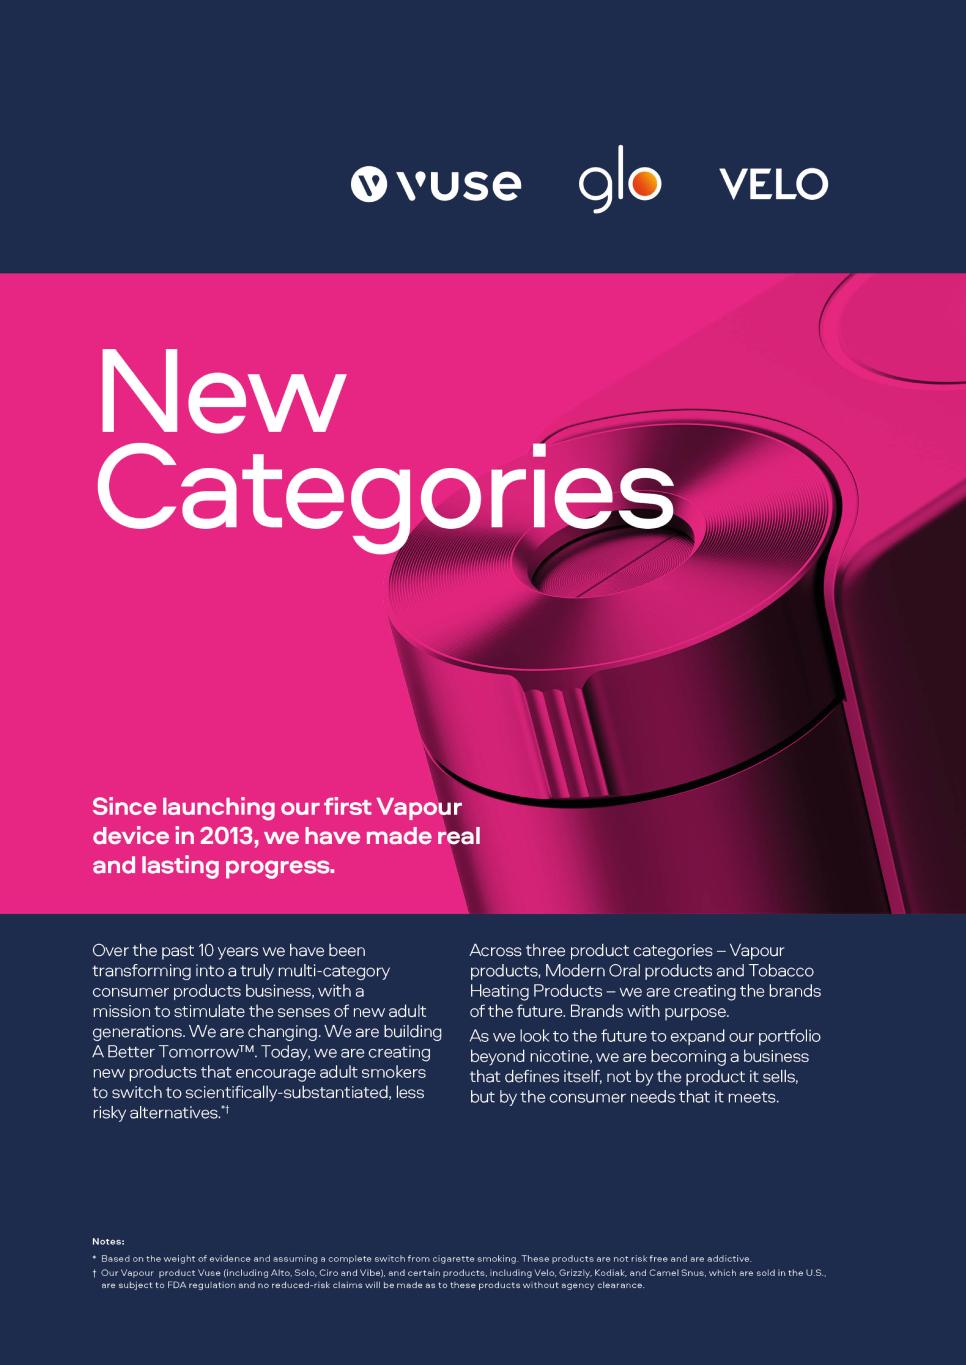

Our purpose is to reduce the health impact of our business by offering a greater choice of enjoyable and less risky*† products for our consumers. We are clear that combustible cigarettes pose serious health risks. The only way to avoid these risks is not to start or to quit. However, we encourage those who would otherwise continue to smoke to switch completely to scientifically-substantiated, reduced-risk alternatives.*† To deliver this, BAT is transforming into a truly multi-category consumer products business, with a mission to stimulate the senses of new adult generations. ESG Front and Centre Our corporate purpose puts ESG front and centre, with a principal focus on reducing the health impact of our global business in order to build A Better TomorrowTM. In 2022, we conducted a Double Materiality Assessment ahead of EU regulatory changes on sustainability reporting. Our new Combined Annual and ESG Report integrates our business and sustainability strategy like never before and is designed to provide stakeholders with a more holistic view of our approach. For more details, see page 26. This Report is prepared with reference to current and future sustainability reporting requirements and frameworks, including: – UK Taskforce on Climate-related Financial Disclosures (TCFD) – EU Sustainable Finance Disclosure Regulation (SFDR) – EU Sustainability Reporting Standards (ESRS) of the EU Corporate Sustainability Reporting Directive (CSRD) – Global Reporting Initiative (GRI) – Sustainable Accounting Standards Board (SASB) – Sustainable Development Goals (SDGs) For more information, please visit bat.com/sustainabilityreporting Notes: BAT’s New Category products are not smoking cessation devices and are not marketed for that purpose. * Based on the weight of evidence and assuming a complete switch from cigarette smoking. These products are not risk free and are addictive. † Our vapour product Vuse (including Alto, Solo, Ciro and Vibe), and certain products, including Velo, Grizzly, Kodiak, and Camel Snus, which are sold in the U.S., are subject to FDA regulation and no reduced-risk claims will be made as to these products without agency clearance.

Strategic Report Governance Overview Chair’s Introduction .................................…........... 2 Chief Executive’s Review ................................…. 4 Our ESG Roadmap .............................................…. 6 Our Year in Numbers ........................................…. 7 Finance and Transformation Director’s Overview .............................................. 8 Investment Case ...............................................…. 10 Strategic Management Our Global Business ............................................ 12 Our Consumer-Centric Multi-Category Portfolio ...............................… 14 Our Business Model ........................................…. 16 Non-Financial Information Statement .............................................................. 18 Engaging with Our Stakeholders..............…. 20 Our Markets and Megatrends ..................…. 22 A Strategy for Accelerated Growth ........... 24 Integrating Sustainability for A Better TomorrowTM ....................................…. 26 QUEST: Simplify the Business ..................…. 28 Explore the story of our year Featuring downloadable versions of this and previous reports, as well as other content – all accessible on desktop, tablet and mobile. www.bat.com/reporting A Better Tomorrow™ For Consumers .....................................….. 30 Our Vapour Products ..................................…... 32 Our Tobacco Heating Products ...............…. 34 Our Modern Oral Products .........................…. 36 Our Traditional Oral Products .................…... 38 Our Combustible Products ........................….. 39 Beyond Nicotine ................................................… 41 For Society and the Environment .…..... 42 ESG Front and Centre ...................................… 44 ESG Framework ................................................… 45 Double Materiality Assessment ..............… 46 SDG Mapping of Our Material Sustainability Topics ..................….................... 49 Strategic Management: Our Material Topics .....................................…................................ 50 TCFD Reporting ................................................… 70 For Employees ........................................... 82 People, Diversity and Culture ....................… 84 Health and Safety ............................................… 92 For Shareholders and Investors .......... 96 Financial Performance Summary ..........… 98 Treasury and Cash Flow .............................… 104 Other .....................................................................… 106 Regional Review ..............................................… 108 Business Environment Group Principal Risks ...................................... 116 Directors’ Report Chair’s Introduction on Governance .................................................... 122 Board of Directors ............................................. 124 Management Board ......................................… 128 Governance Framework ............................… 130 Leadership Overview ...................................… 131 Cultural Oversight .........................................… 132 Principal Decisions Made by the Board .......................................................... 133 Board Activities in 2022 .................................. 134 Board Engagement with Stakeholders .............................................. 136 Division of Responsibilities ........................… 141 Board Effectiveness ......................................... 143 Nominations Committee .............................. 145 Audit Committee ............................................… 150 Remuneration Report Annual Statement on Remuneration ...... 159 Financial Statements Group Financial Statements Group Companies and Undertakings ..... 301 Other Information Additional Disclosures .................................... 319 Shareholder Information ........................….... 374 British American Tobacco p.l.c. (No. 3407696) Annual Report 2022 This document constitutes the Annual Report and Accounts of British American Tobacco p.l.c. (the Company) and the British American Tobacco Group prepared in accordance with UK requirements and the Annual Report on Form 20-F prepared in accordance with the US Securities Exchange Act of 1934 (the Exchange Act) and the rules promulgated thereunder for the year ended 31 December 2022, except that certain phrases, paragraphs or similar sections denoted with a ‘@’ symbol do not form part of the Annual Report on Form 20-F as filed with the US Securities and Exchange Commission (the SEC) and certain phrases, paragraphs or similar sections denoted with a ‘»’ symbol do not form part of the Annual Report and Accounts. In addition, the Report of Independent Registered Public Accounting Firm on pages 194 and 195 will only be included in the Annual Report on Form 20-F. Moreover, the information in this document may be updated or supplemented only for purposes of the Annual Report on Form 20-F at the time of filing with the SEC or later amended if necessary. Any such updates, supplements or amendments will also be denoted with a ‘»’ symbol. Insofar as this document constitutes the Annual Report and Accounts, it has been prepared and is presented in accordance with, and reliance upon, applicable English company law and the liabilities of the Directors in connection with this report shall be subject to the limitations and restrictions provided by such law. This document is made up of the Strategic Report, the Governance Report, the Financial Statements and Notes, and certain other information. Our Strategic Report, pages 2 to 121, includes our purpose and strategy, global market overview, business model, global performance, as well as our financial performance and principal Group risks. The Strategic Report has been approved by the Board of Directors and signed on its behalf by Paul McCrory, Company Secretary. Our Governance Report on pages 122 to 181 contains detailed corporate governance information and our Committee reports. The Directors’ Report on pages 122 to 151 (the Governance pages) and pages 319 to 390 (the Additional Disclosure and Shareholder Information pages) has been approved by the Board of Directors and signed on its behalf by Paul McCrory, Company Secretary. Our Financial Statements and Notes are on pages 182 to 318. The Other Information section commences on page 319. This document provides alternative performance measures (APMs) which are not defined or specified under the requirements of International Financial Reporting Standards (IFRS). We believe these APMs provide readers with important additional information on our business. We have included a Non-GAAP measures section on pages 324 to 336 which provides a comprehensive list of the APMs that we use, an explanation of how they are calculated, why we use them and a reconciliation to the most directly comparable IFRS measure where relevant. British American Tobacco p.l.c. has shares listed on the London Stock Exchange (BATS), the Johannesburg Stock Exchange (BTI), and, as American Depositary Shares, on the New York Stock Exchange (BTI). The Annual Report is published on bat.com. A printed copy is mailed to shareholders on the UK main register who have elected to receive it. Otherwise, shareholders are notified that the Annual Report is available on the website and will, at the time of that notification, receive a short Performance Summary (which sets out an overview of the Group’s performance, headline facts and figures and key dates in the Company’s financial calendar) and Proxy Form. Specific local mailing and/or notification requirements will apply to shareholders on the South Africa branch register. References in this publication to ‘British American Tobacco’, ‘BAT’, ‘Group’, ‘we’, ‘us’ and ‘our’ when denoting opinion refer to British American Tobacco p.l.c. and when denoting business activity refer to British American Tobacco Group operating companies, collectively or individually as the case may be. The material in this Annual Report and Form 20-F is provided for the purpose of giving information about the Company to investors only and is not intended for general consumers. The Company, its Directors, employees, agents or advisers do not accept or assume responsibility to any other person to whom this material is shown or into whose hands it may come and any such responsibility or liability is expressly disclaimed. The material in this Annual Report is not provided for product advertising, promotional or marketing purposes. This material does not constitute and should not be construed as constituting an offer to sell, or a
solicitation of an offer to buy, any of our products. Our products are sold only in compliance with the laws of the particular jurisdictions in which they are sold. References in this document to information on websites, including the web address of BAT, have been included as inactive textual references only. These websites and the information contained therein or connected thereto are not intended to be incorporated into or to form part of the Annual Report and Form 20-F. Cautionary statement This document contains forward-looking statements. For our full cautionary statement, please see page 373. BAT Annual Report and Form 20-F 2022 Strategic Report Governance Report Financial Statements Other Information Inside This Report 1
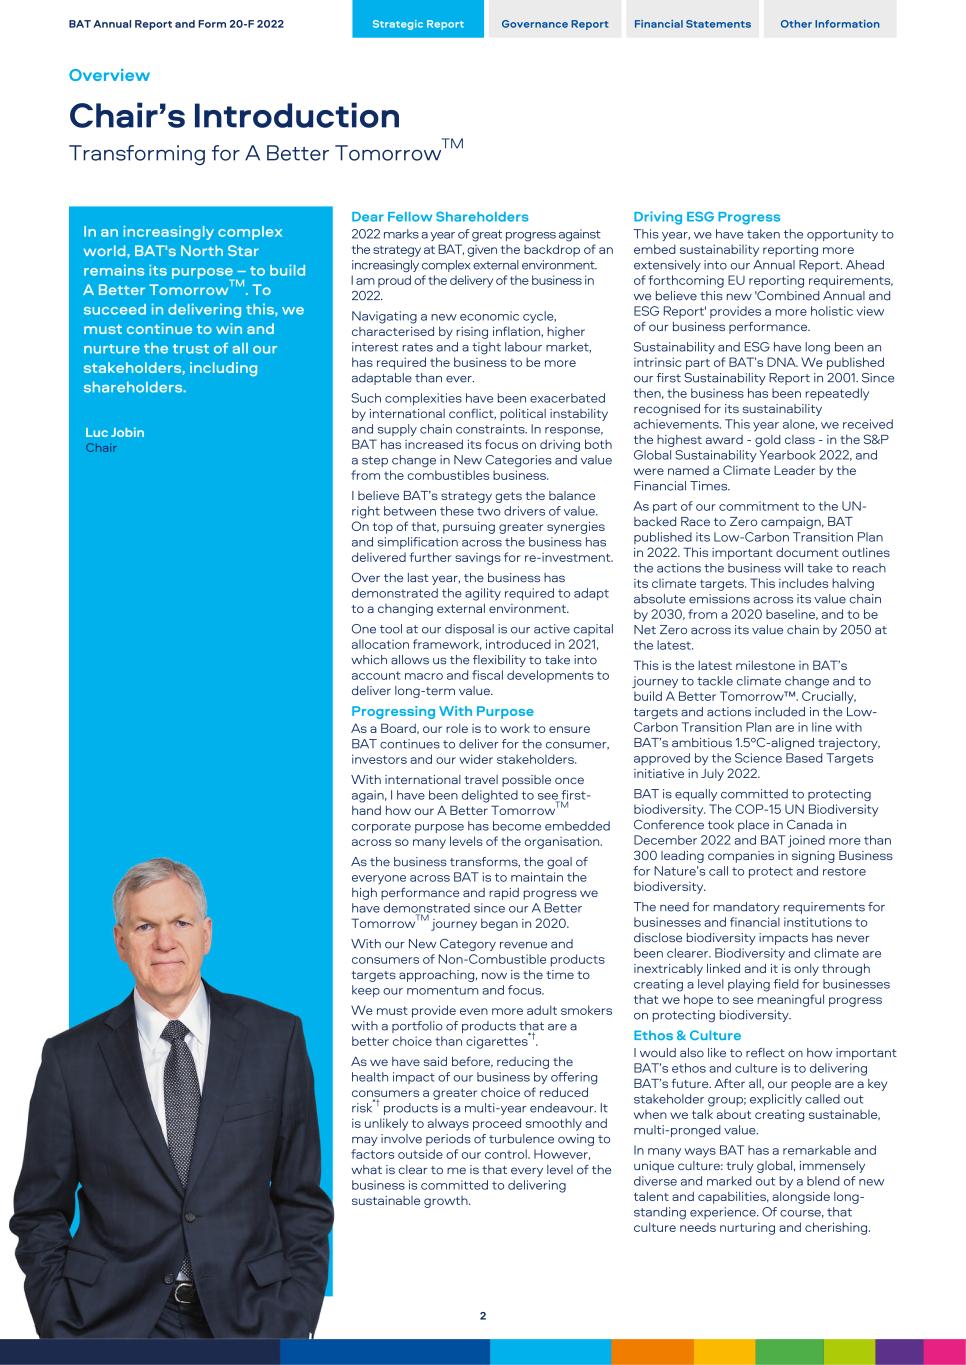
In an increasingly complex world, BAT's North Star remains its purpose – to build A Better TomorrowTM. To succeed in delivering this, we must continue to win and nurture the trust of all our stakeholders, including shareholders. Luc Jobin Chair Dear Fellow Shareholders 2022 marks a year of great progress against the strategy at BAT, given the backdrop of an increasingly complex external environment. I am proud of the delivery of the business in 2022. Navigating a new economic cycle, characterised by rising inflation, higher interest rates and a tight labour market, has required the business to be more adaptable than ever. Such complexities have been exacerbated by international conflict, political instability and supply chain constraints. In response, BAT has increased its focus on driving both a step change in New Categories and value from the combustibles business. I believe BAT’s strategy gets the balance right between these two drivers of value. On top of that, pursuing greater synergies and simplification across the business has delivered further savings for re-investment. Over the last year, the business has demonstrated the agility required to adapt to a changing external environment. One tool at our disposal is our active capital allocation framework, introduced in 2021, which allows us the flexibility to take into account macro and fiscal developments to deliver long-term value. Progressing With Purpose As a Board, our role is to work to ensure BAT continues to deliver for the consumer, investors and our wider stakeholders. With international travel possible once again, I have been delighted to see first- hand how our A Better TomorrowTM corporate purpose has become embedded across so many levels of the organisation. As the business transforms, the goal of everyone across BAT is to maintain the high performance and rapid progress we have demonstrated since our A Better TomorrowTM journey began in 2020. With our New Category revenue and consumers of Non-Combustible products targets approaching, now is the time to keep our momentum and focus. We must provide even more adult smokers with a portfolio of products that are a better choice than cigarettes*†. As we have said before, reducing the health impact of our business by offering consumers a greater choice of reduced risk*† products is a multi-year endeavour. It is unlikely to always proceed smoothly and may involve periods of turbulence owing to factors outside of our control. However, what is clear to me is that every level of the business is committed to delivering sustainable growth. Driving ESG Progress This year, we have taken the opportunity to embed sustainability reporting more extensively into our Annual Report. Ahead of forthcoming EU reporting requirements, we believe this new 'Combined Annual and ESG Report' provides a more holistic view of our business performance. Sustainability and ESG have long been an intrinsic part of BAT’s DNA. We published our first Sustainability Report in 2001. Since then, the business has been repeatedly recognised for its sustainability achievements. This year alone, we received the highest award - gold class - in the S&P Global Sustainability Yearbook 2022, and were named a Climate Leader by the Financial Times. As part of our commitment to the UN- backed Race to Zero campaign, BAT published its Low-Carbon Transition Plan in 2022. This important document outlines the actions the business will take to reach its climate targets. This includes halving absolute emissions across its value chain by 2030, from a 2020 baseline, and to be Net Zero across its value chain by 2050 at the latest. This is the latest milestone in BAT’s journey to tackle climate change and to build A Better Tomorrow™. Crucially, targets and actions included in the Low- Carbon Transition Plan are in line with BAT’s ambitious 1.5ºC-aligned trajectory, approved by the Science Based Targets initiative in July 2022. BAT is equally committed to protecting biodiversity. The COP-15 UN Biodiversity Conference took place in Canada in December 2022 and BAT joined more than 300 leading companies in signing Business for Nature’s call to protect and restore biodiversity. The need for mandatory requirements for businesses and financial institutions to disclose biodiversity impacts has never been clearer. Biodiversity and climate are inextricably linked and it is only through creating a level playing field for businesses that we hope to see meaningful progress on protecting biodiversity. Ethos & Culture I would also like to reflect on how important BAT’s ethos and culture is to delivering BAT’s future. After all, our people are a key stakeholder group; explicitly called out when we talk about creating sustainable, multi-pronged value. In many ways BAT has a remarkable and unique culture: truly global, immensely diverse and marked out by a blend of new talent and capabilities, alongside long- standing experience. Of course, that culture needs nurturing and cherishing. BAT Annual Report and Form 20-F 2022 Strategic Report Governance Report Financial Statements Other Information Overview Chair’s Introduction Transforming for A Better TomorrowTM 2
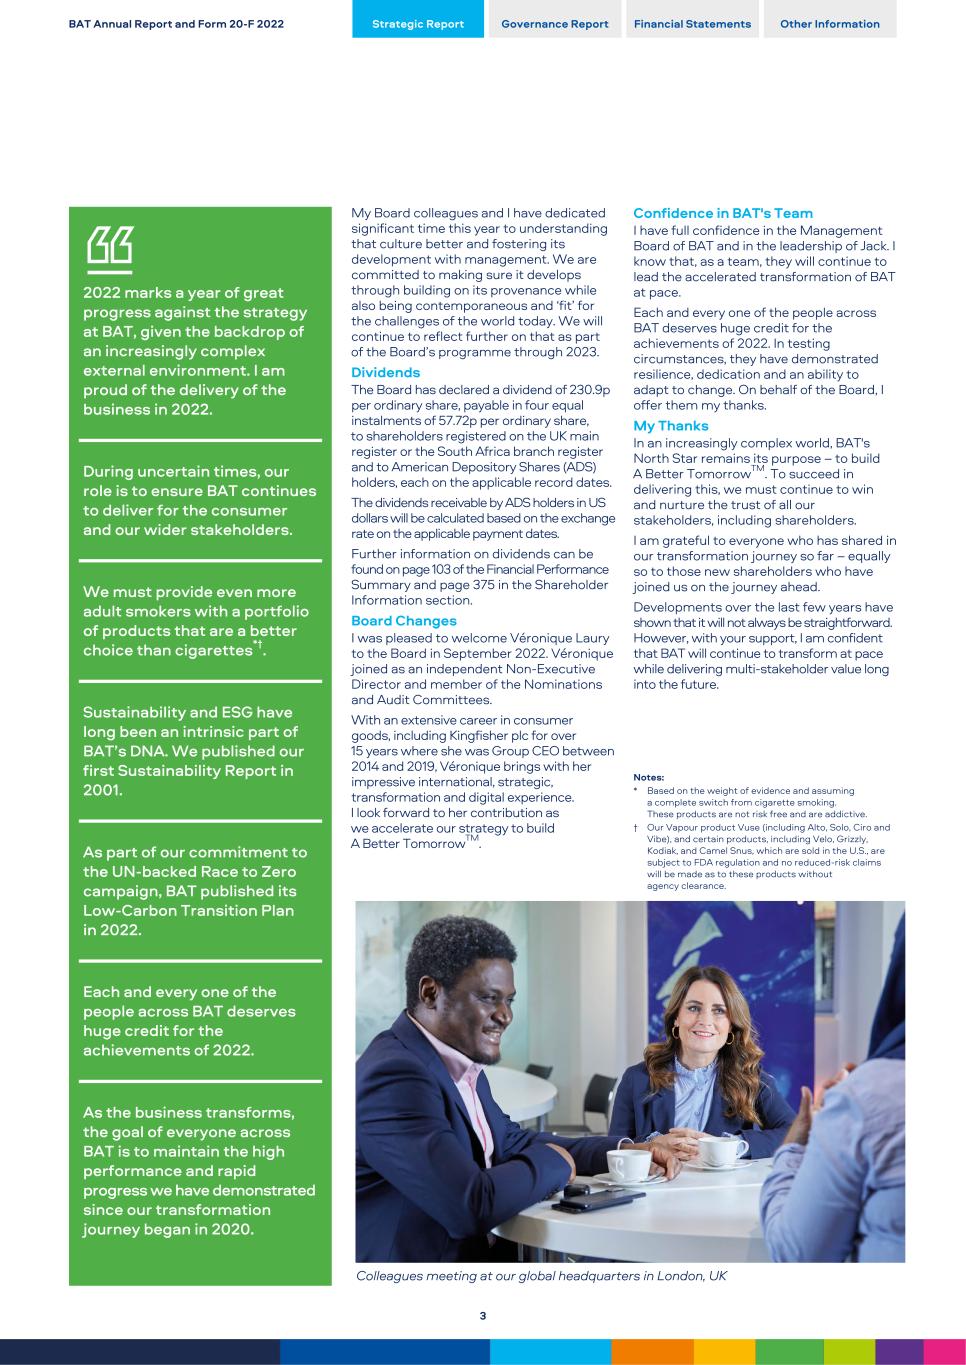
2022 marks a year of great progress against the strategy at BAT, given the backdrop of an increasingly complex external environment. I am proud of the delivery of the business in 2022. During uncertain times, our role is to ensure BAT continues to deliver for the consumer and our wider stakeholders. We must provide even more adult smokers with a portfolio of products that are a better choice than cigarettes*†. Sustainability and ESG have long been an intrinsic part of BAT’s DNA. We published our first Sustainability Report in 2001. As part of our commitment to the UN-backed Race to Zero campaign, BAT published its Low-Carbon Transition Plan in 2022. Each and every one of the people across BAT deserves huge credit for the achievements of 2022. As the business transforms, the goal of everyone across BAT is to maintain the high performance and rapid progress we have demonstrated since our transformation journey began in 2020. My Board colleagues and I have dedicated significant time this year to understanding that culture better and fostering its development with management. We are committed to making sure it develops through building on its provenance while also being contemporaneous and ‘fit’ for the challenges of the world today. We will continue to reflect further on that as part of the Board’s programme through 2023. Dividends The Board has declared a dividend of 230.9p per ordinary share, payable in four equal instalments of 57.72p per ordinary share, to shareholders registered on the UK main register or the South Africa branch register and to American Depository Shares (ADS) holders, each on the applicable record dates. The dividends receivable by ADS holders in US dollars will be calculated based on the exchange rate on the applicable payment dates. Further information on dividends can be found on page 103 of the Financial Performance Summary and page 375 in the Shareholder Information section. Board Changes I was pleased to welcome Véronique Laury to the Board in September 2022. Véronique joined as an independent Non-Executive Director and member of the Nominations and Audit Committees. With an extensive career in consumer goods, including Kingfisher plc for over 15 years where she was Group CEO between 2014 and 2019, Véronique brings with her impressive international, strategic, transformation and digital experience. I look forward to her contribution as we accelerate our strategy to build A Better TomorrowTM. Colleagues meeting at our global headquarters in London, UK Confidence in BAT's Team I have full confidence in the Management Board of BAT and in the leadership of Jack. I know that, as a team, they will continue to lead the accelerated transformation of BAT at pace. Each and every one of the people across BAT deserves huge credit for the achievements of 2022. In testing circumstances, they have demonstrated resilience, dedication and an ability to adapt to change. On behalf of the Board, I offer them my thanks. My Thanks In an increasingly complex world, BAT's North Star remains its purpose – to build A Better TomorrowTM. To succeed in delivering this, we must continue to win and nurture the trust of all our stakeholders, including shareholders. I am grateful to everyone who has shared in our transformation journey so far – equally so to those new shareholders who have joined us on the journey ahead. Developments over the last few years have shown that it will not always be straightforward. However, with your support, I am confident that BAT will continue to transform at pace while delivering multi-stakeholder value long into the future. Notes: * Based on the weight of evidence and assuming a complete switch from cigarette smoking. These products are not risk free and are addictive. † Our Vapour product Vuse (including Alto, Solo, Ciro and Vibe), and certain products, including Velo, Grizzly, Kodiak, and Camel Snus, which are sold in the U.S., are subject to FDA regulation and no reduced-risk claims will be made as to these products without agency clearance. BAT Annual Report and Form 20-F 2022 Strategic Report Governance Report Financial Statements Other Information 3
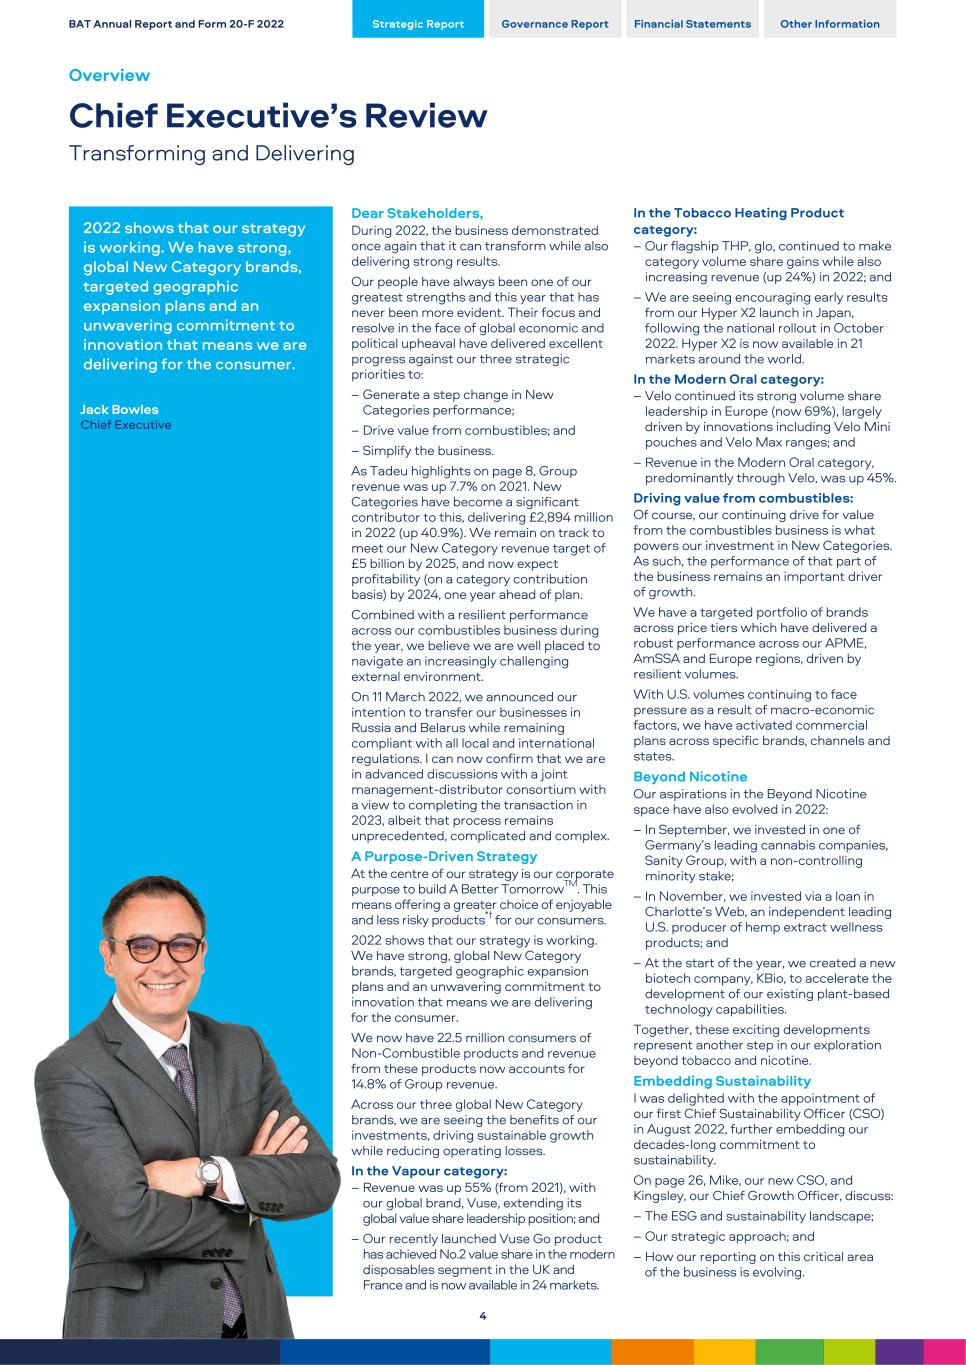
2022 shows that our strategy is working. We have strong, global New Category brands, targeted geographic expansion plans and an unwavering commitment to innovation that means we are delivering for the consumer. Jack Bowles Chief Executive Dear Stakeholders, During 2022, the business demonstrated once again that it can transform while also delivering strong results. Our people have always been one of our greatest strengths and this year that has never been more evident. Their focus and resolve in the face of global economic and political upheaval have delivered excellent progress against our three strategic priorities to: – Generate a step change in New Categories performance; – Drive value from combustibles; and – Simplify the business. As Tadeu highlights on page 8, Group revenue was up 7.7% on 2021. New Categories have become a significant contributor to this, delivering £2,894 million in 2022 (up 40.9%). We remain on track to meet our New Category revenue target of £5 billion by 2025, and now expect profitability (on a category contribution basis) by 2024, one year ahead of plan. Combined with a resilient performance across our combustibles business during the year, we believe we are well placed to navigate an increasingly challenging external environment. On 11 March 2022, we announced our intention to transfer our businesses in Russia and Belarus while remaining compliant with all local and international regulations. I can now confirm that we are in advanced discussions with a joint management-distributor consortium with a view to completing the transaction in 2023, albeit that process remains unprecedented, complicated and complex. A Purpose-Driven Strategy At the centre of our strategy is our corporate purpose to build A Better TomorrowTM. This means offering a greater choice of enjoyable and less risky products*† for our consumers. 2022 shows that our strategy is working. We have strong, global New Category brands, targeted geographic expansion plans and an unwavering commitment to innovation that means we are delivering for the consumer. We now have 22.5 million consumers of Non-Combustible products and revenue from these products now accounts for 14.8% of Group revenue. Across our three global New Category brands, we are seeing the benefits of our investments, driving sustainable growth while reducing operating losses. In the Vapour category: – Revenue was up 55% (from 2021), with our global brand, Vuse, extending its global value share leadership position; and – Our recently launched Vuse Go product has achieved No.2 value share in the modern disposables segment in the UK and France and is now available in 24 markets. In the Tobacco Heating Product category: – Our flagship THP, glo, continued to make category volume share gains while also increasing revenue (up 24%) in 2022; and – We are seeing encouraging early results from our Hyper X2 launch in Japan, following the national rollout in October 2022. Hyper X2 is now available in 21 markets around the world. In the Modern Oral category: – Velo continued its strong volume share leadership in Europe (now 69%), largely driven by innovations including Velo Mini pouches and Velo Max ranges; and – Revenue in the Modern Oral category, predominantly through Velo, was up 45%. Driving value from combustibles: Of course, our continuing drive for value from the combustibles business is what powers our investment in New Categories. As such, the performance of that part of the business remains an important driver of growth. We have a targeted portfolio of brands across price tiers which have delivered a robust performance across our APME, AmSSA and Europe regions, driven by resilient volumes. With U.S. volumes continuing to face pressure as a result of macro-economic factors, we have activated commercial plans across specific brands, channels and states. Beyond Nicotine Our aspirations in the Beyond Nicotine space have also evolved in 2022: – In September, we invested in one of Germany’s leading cannabis companies, Sanity Group, with a non-controlling minority stake; – In November, we invested via a loan in Charlotte’s Web, an independent leading U.S. producer of hemp extract wellness products; and – At the start of the year, we created a new biotech company, KBio, to accelerate the development of our existing plant-based technology capabilities. Together, these exciting developments represent another step in our exploration beyond tobacco and nicotine. Embedding Sustainability I was delighted with the appointment of our first Chief Sustainability Officer (CSO) in August 2022, further embedding our decades-long commitment to sustainability. On page 26, Mike, our new CSO, and Kingsley, our Chief Growth Officer, discuss: – The ESG and sustainability landscape; – Our strategic approach; and – How our reporting on this critical area of the business is evolving. BAT Annual Report and Form 20-F 2022 Strategic Report Governance Report Financial Statements Other Information Overview Chief Executive’s Review Transforming and Delivering 4
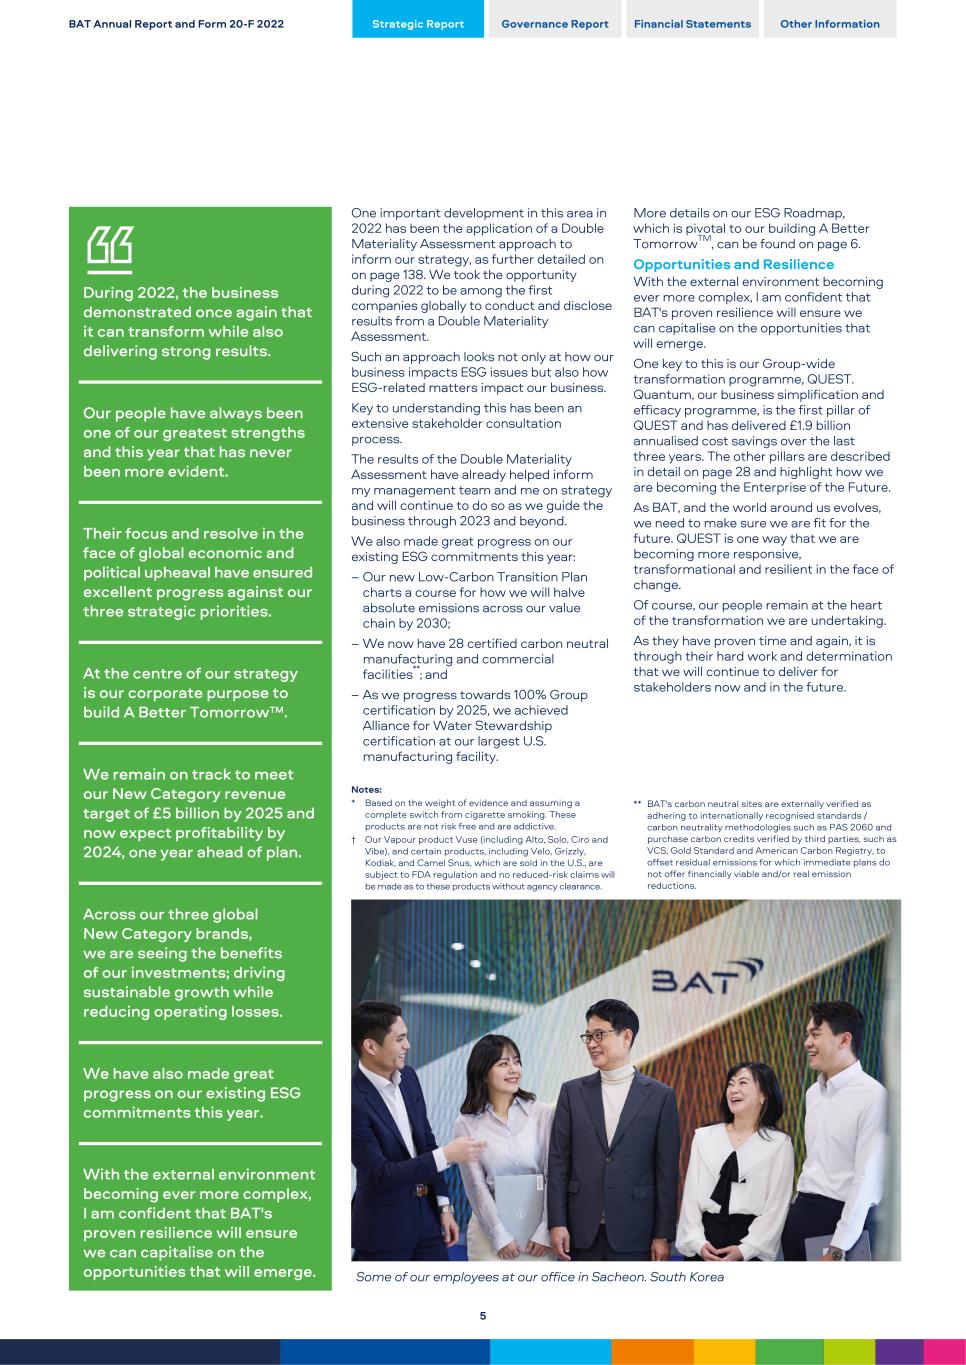
During 2022, the business demonstrated once again that it can transform while also delivering strong results. Our people have always been one of our greatest strengths and this year that has never been more evident. Their focus and resolve in the face of global economic and political upheaval have ensured excellent progress against our three strategic priorities. At the centre of our strategy is our corporate purpose to build A Better Tomorrow™. We remain on track to meet our New Category revenue target of £5 billion by 2025 and now expect profitability by 2024, one year ahead of plan. Across our three global New Category brands, we are seeing the benefits of our investments; driving sustainable growth while reducing operating losses. We have also made great progress on our existing ESG commitments this year. With the external environment becoming ever more complex, I am confident that BAT's proven resilience will ensure we can capitalise on the opportunities that will emerge. One important development in this area in 2022 has been the application of a Double Materiality Assessment approach to inform our strategy, as further detailed on on page 138. We took the opportunity during 2022 to be among the first companies globally to conduct and disclose results from a Double Materiality Assessment. Such an approach looks not only at how our business impacts ESG issues but also how ESG-related matters impact our business. Key to understanding this has been an extensive stakeholder consultation process. The results of the Double Materiality Assessment have already helped inform my management team and me on strategy and will continue to do so as we guide the business through 2023 and beyond. We also made great progress on our existing ESG commitments this year: – Our new Low-Carbon Transition Plan charts a course for how we will halve absolute emissions across our value chain by 2030; – We now have 28 certified carbon neutral manufacturing and commercial facilities**; and – As we progress towards 100% Group certification by 2025, we achieved Alliance for Water Stewardship certification at our largest U.S. manufacturing facility. Notes: * Based on the weight of evidence and assuming a complete switch from cigarette smoking. These products are not risk free and are addictive. † Our Vapour product Vuse (including Alto, Solo, Ciro and Vibe), and certain products, including Velo, Grizzly, Kodiak, and Camel Snus, which are sold in the U.S., are subject to FDA regulation and no reduced-risk claims will be made as to these products without agency clearance. Some of our employees at our office in Sacheon. South Korea More details on our ESG Roadmap, which is pivotal to our building A Better TomorrowTM, can be found on page 6. Opportunities and Resilience With the external environment becoming ever more complex, I am confident that BAT's proven resilience will ensure we can capitalise on the opportunities that will emerge. One key to this is our Group-wide transformation programme, QUEST. Quantum, our business simplification and efficacy programme, is the first pillar of QUEST and has delivered £1.9 billion annualised cost savings over the last three years. The other pillars are described in detail on page 28 and highlight how we are becoming the Enterprise of the Future. As BAT, and the world around us evolves, we need to make sure we are fit for the future. QUEST is one way that we are becoming more responsive, transformational and resilient in the face of change. Of course, our people remain at the heart of the transformation we are undertaking. As they have proven time and again, it is through their hard work and determination that we will continue to deliver for stakeholders now and in the future. ** BAT's carbon neutral sites are externally verified as adhering to internationally recognised standards / carbon neutrality methodologies such as PAS 2060 and purchase carbon credits verified by third parties, such as VCS, Gold Standard and American Carbon Registry, to offset residual emissions for which immediate plans do not offer financially viable and/or real emission reductions. BAT Annual Report and Form 20-F 2022 Strategic Report Governance Report Financial Statements Other Information 5
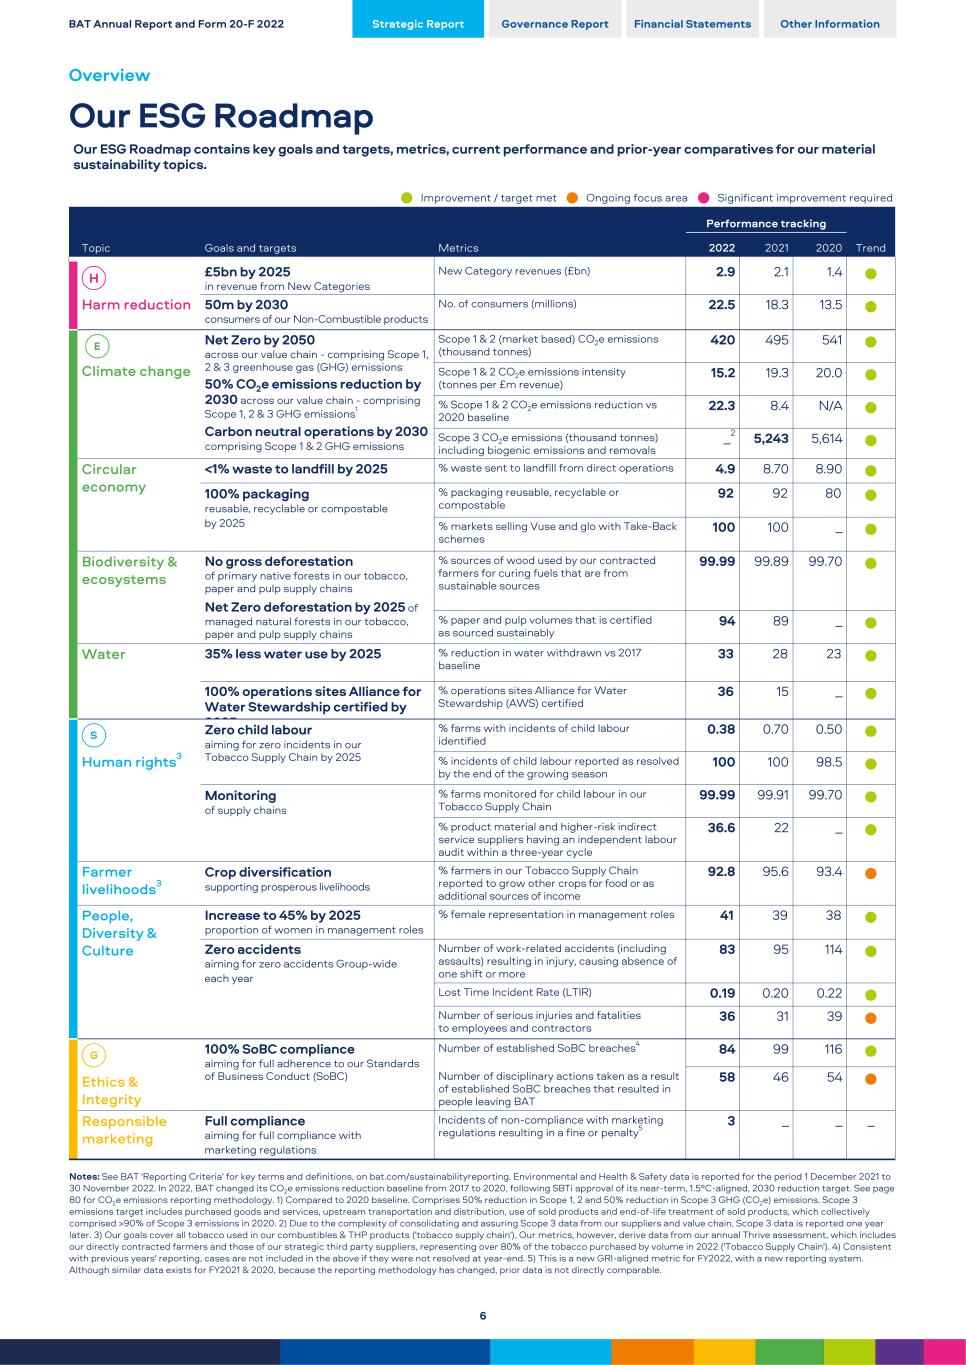
Goals and targets Metrics Performance tracking Topic 2022 2021 2020 Trend Harm reduction £5bn by 2025 in revenue from New Categories New Category revenues (£bn) 2.9 2.1 1.4 l 50m by 2030 consumers of our Non-Combustible products No. of consumers (millions) 22.5 18.3 13.5 l Climate change Net Zero by 2050 across our value chain - comprising Scope 1, 2 & 3 greenhouse gas (GHG) emissions 50% CO2e emissions reduction by 2030 across our value chain - comprising Scope 1, 2 & 3 GHG emissions1 Carbon neutral operations by 2030 comprising Scope 1 & 2 GHG emissions Scope 1 & 2 (market based) CO2e emissions (thousand tonnes) 420 495 541 l Scope 1 & 2 CO2e emissions intensity (tonnes per £m revenue) 15.2 19.3 20.0 l % Scope 1 & 2 CO2e emissions reduction vs 2020 baseline 22.3 8.4 N/A l Scope 3 CO2e emissions (thousand tonnes) including biogenic emissions and removals _2 5,243 5,614 l Circular economy <1% waste to landfill by 2025 % waste sent to landfill from direct operations 4.9 8.70 8.90 l 100% packaging reusable, recyclable or compostable by 2025 % packaging reusable, recyclable or compostable 92 92 80 l % markets selling Vuse and glo with Take-Back schemes 100 100 _ l Biodiversity & ecosystems No gross deforestation of primary native forests in our tobacco, paper and pulp supply chains Net Zero deforestation by 2025 of managed natural forests in our tobacco, paper and pulp supply chains % sources of wood used by our contracted farmers for curing fuels that are from sustainable sources 99.99 99.89 99.70 l % paper and pulp volumes that is certified as sourced sustainably 94 89 _ l Water 35% less water use by 2025 % reduction in water withdrawn vs 2017 baseline 33 28 23 l 100% operations sites Alliance for Water Stewardship certified by 2025 % operations sites Alliance for Water Stewardship (AWS) certified 36 15 _ l Human rights3 Zero child labour aiming for zero incidents in our Tobacco Supply Chain by 2025 % farms with incidents of child labour identified 0.38 0.70 0.50 l % incidents of child labour reported as resolved by the end of the growing season 100 100 98.5 l Monitoring of supply chains % farms monitored for child labour in our Tobacco Supply Chain 99.99 99.91 99.70 l % product material and higher-risk indirect service suppliers having an independent labour audit within a three-year cycle 36.6 22 _ l Farmer livelihoods3 Crop diversification supporting prosperous livelihoods % farmers in our Tobacco Supply Chain reported to grow other crops for food or as additional sources of income 92.8 95.6 93.4 l People, Diversity & Culture Increase to 45% by 2025 proportion of women in management roles % female representation in management roles 41 39 38 l Zero accidents aiming for zero accidents Group-wide each year Number of work-related accidents (including assaults) resulting in injury, causing absence of one shift or more 83 95 114 l Lost Time Incident Rate (LTIR) 0.19 0.20 0.22 l Number of serious injuries and fatalities to employees and contractors 36 31 39 l Ethics & Integrity 100% SoBC compliance aiming for full adherence to our Standards of Business Conduct (SoBC) Number of established SoBC breaches4 84 99 116 l Number of disciplinary actions taken as a result of established SoBC breaches that resulted in people leaving BAT 58 46 54 l Responsible marketing Full compliance aiming for full compliance with marketing regulations Incidents of non-compliance with marketing regulations resulting in a fine or penalty5 3 _ _ _ Notes: See BAT 'Reporting Criteria' for key terms and definitions, on bat.com/sustainabilityreporting. Environmental and Health & Safety data is reported for the period 1 December 2021 to 30 November 2022. In 2022, BAT changed its CO2e emissions reduction baseline from 2017 to 2020, following SBTi approval of its near-term, 1.5°C-aligned, 2030 reduction target. See page 80 for CO2e emissions reporting methodology. 1) Compared to 2020 baseline. Comprises 50% reduction in Scope 1, 2 and 50% reduction in Scope 3 GHG (CO2e) emissions. Scope 3 emissions target includes purchased goods and services, upstream transportation and distribution, use of sold products and end-of-life treatment of sold products, which collectively comprised >90% of Scope 3 emissions in 2020. 2) Due to the complexity of consolidating and assuring Scope 3 data from our suppliers and value chain, Scope 3 data is reported one year later. 3) Our goals cover all tobacco used in our combustibles & THP products ('tobacco supply chain'). Our metrics, however, derive data from our annual Thrive assessment, which includes our directly contracted farmers and those of our strategic third party suppliers, representing over 80% of the tobacco purchased by volume in 2022 ('Tobacco Supply Chain'). 4) Consistent with previous years' reporting, cases are not included in the above if they were not resolved at year-end. 5) This is a new GRI-aligned metric for FY2022, with a new reporting system. Although similar data exists for FY2021 & 2020, because the reporting methodology has changed, prior data is not directly comparable. BAT Annual Report and Form 20-F 2022 Strategic Report Governance Report Financial Statements Other Information Overview Our ESG Roadmap Our ESG Roadmap contains key goals and targets, metrics, current performance and prior-year comparatives for our material sustainability topics. l Improvement / target met l Ongoing focus area l Significant improvement required 6
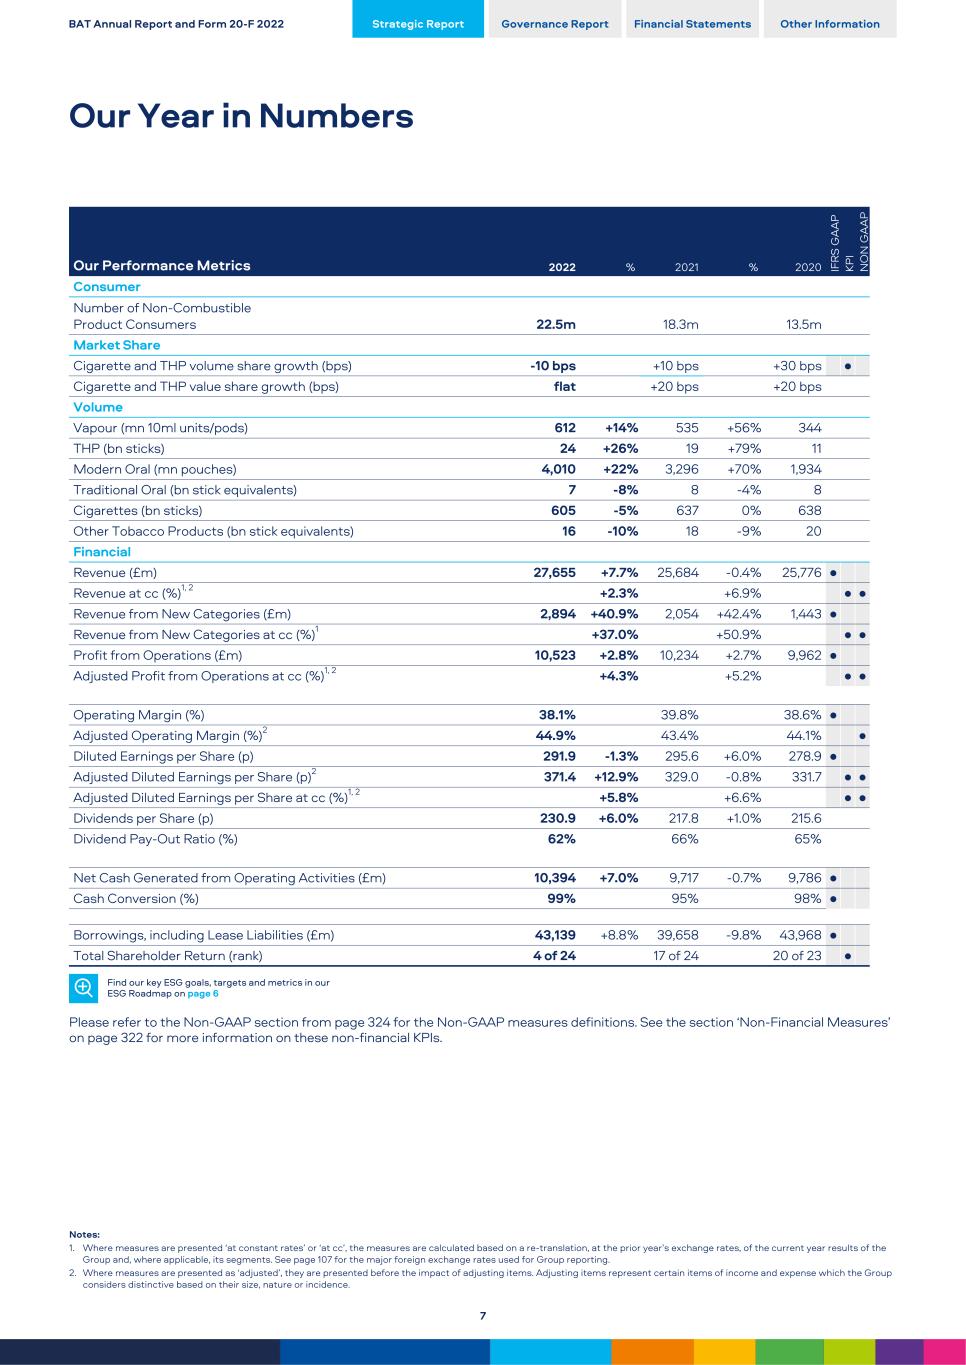
Our Performance Metrics 2022 % 2021 % 2020 IF R S G A A P KP I N O N G A A P Consumer Number of Non-Combustible Product Consumers 22.5m 18.3m 13.5m Market Share Cigarette and THP volume share growth (bps) -10 bps +10 bps +30 bps • Cigarette and THP value share growth (bps) flat +20 bps +20 bps Volume Vapour (mn 10ml units/pods) 612 +14 % 535 +56 % 344 THP (bn sticks) 24 +26 % 19 +79 % 11 Modern Oral (mn pouches) 4,010 +22 % 3,296 +70 % 1,934 Traditional Oral (bn stick equivalents) 7 -8 % 8 -4 % 8 Cigarettes (bn sticks) 605 -5 % 637 0 % 638 Other Tobacco Products (bn stick equivalents) 16 -10 % 18 -9 % 20 Financial Revenue (£m) 27,655 +7.7 % 25,684 -0.4 % 25,776 • Revenue at cc (%)1, 2 +2.3 % +6.9 % • • Revenue from New Categories (£m) 2,894 +40.9 % 2,054 +42.4 % 1,443 • Revenue from New Categories at cc (%)1 +37.0 % +50.9 % • • Profit from Operations (£m) 10,523 +2.8 % 10,234 +2.7 % 9,962 • Adjusted Profit from Operations at cc (%)1, 2 +4.3 % +5.2 % • • Operating Margin (%) 38.1% 39.8% 38.6% • Adjusted Operating Margin (%)2 44.9% 43.4% 44.1% • Diluted Earnings per Share (p) 291.9 -1.3 % 295.6 +6.0 % 278.9 • Adjusted Diluted Earnings per Share (p)2 371.4 +12.9 % 329.0 -0.8 % 331.7 • • Adjusted Diluted Earnings per Share at cc (%)1, 2 +5.8 % +6.6 % • • Dividends per Share (p) 230.9 +6.0 % 217.8 +1.0 % 215.6 Dividend Pay-Out Ratio (%) 62% 66% 65% Net Cash Generated from Operating Activities (£m) 10,394 +7.0 % 9,717 -0.7 % 9,786 • Cash Conversion (%) 99% 95% 98% • Borrowings, including Lease Liabilities (£m) 43,139 +8.8 % 39,658 -9.8 % 43,968 • Total Shareholder Return (rank) 4 of 24 17 of 24 20 of 23 • Find our key ESG goals, targets and metrics in our ESG Roadmap on page 6 Please refer to the Non-GAAP section from page 324 for the Non-GAAP measures definitions. See the section ‘Non-Financial Measures’ on page 322 for more information on these non-financial KPIs. Notes: 1. Where measures are presented ‘at constant rates’ or ‘at cc’, the measures are calculated based on a re-translation, at the prior year’s exchange rates, of the current year results of the Group and, where applicable, its segments. See page 107 for the major foreign exchange rates used for Group reporting. 2. Where measures are presented as ‘adjusted’, they are presented before the impact of adjusting items. Adjusting items represent certain items of income and expense which the Group considers distinctive based on their size, nature or incidence. BAT Annual Report and Form 20-F 2022 Strategic Report Governance Report Financial Statements Other Information Our Year in Numbers 7
We are committed to our active capital allocation framework, which will deliver long-term value to our shareholders, driven by our cash flow generation and deleverage plans. Tadeu Marroco Finance & Transformation Director 2022 was another successful year in our transformational journey. With value delivered from combustibles and improving financial delivery from New Categories, we believe we are well placed to navigate the turbulent macro-economic environment. Furthermore, while translational foreign exchange has negatively impacted the value of our borrowings (in sterling terms), we believe our continued cash generation places the Group in a strong position for future growth. Revenue Higher Driven by New Categories Revenue increased 7.7% to £27,655 million compared to 2021 (while 2021 was marginally lower than 2020, down 0.4% to £25,684 million). Revenue from New Categories was up 40.9% in 2022 and 42.4% in 2021. Combustibles pricing remained strong, with Group price/mix of 4.6% in 2022 compared to 4.3% in 2021. Foreign exchange movements affected the Group's reported results in both periods, being a tailwind of 5.4% in 2022 and a headwind of 7.3% in 2021. On a constant currency basis, revenue was up 2.3% in 2022 and 6.9% in 2021. Improving Financial Performance from New Categories Drives Growth Profit from operations increased 2.8% to £10,523 million, with 2021 up 2.7% to £10,234 million. In 2022, higher revenue, a further reduction in losses from New Categories and a translational foreign exchange tailwind of 7.0% were offset by higher adjusting items, which were largely due to: – The charges recognised related to the proposed transfer of the Russian (and Belarusian) business of £612 million; – Restructuring and integration charges, including in respect of Quantum, of £771 million (2021: £150 million), as we streamline our business to drive agility, and further enhance organisational capabilities as we move forward into the next phase of our transformation; – A charge of £450 million recognised in respect of the investigations by the United States Department of Justice (DOJ) and the United States Department of the Treasury’s Office of Foreign Assets Control (OFAC) into alleged historical breaches of sanctions; and – A charge of £79 million related to the conclusion of the investigation into alleged violations of the Nigerian Competition and Consumer Protection Act and National Tobacco Control Act. These were partly offset by a net credit of £460 million in Brazil related to the calculation of VAT on social contributions in prior periods (as the Group's litigation was successfully concluded in the year). Such adjusting items were higher than those recognised in 2021, which included a charge of £358 million related to the disposal of the Group's Iranian business. Our operating margin was consequently 170 bps lower at 38.1% in 2022 (2021: up 120 bps to 39.8%). On an adjusted constant currency basis, profit from operations grew by 4.3% (2021: up 5.2%). This was driven by higher revenue, a reduction in losses from New Categories and efficiencies delivered in both 2022 and 2021 as part of Project Quantum (which has delivered £1.9 billion of annualised savings since 2020). Adjusted operating margin (at current rates) increased 150 bps to 44.9% (2021: down 70 bps to 43.4%), largely driven by the reduction in New Categories losses. EPS Impacted by Substantial Adjusting Items, Partly Offset by FX Tailwind On a reported basis, basic EPS was down 1.2% at 293.3p (2021: up 6.0% at 296.9p) with diluted EPS down 1.3% to 291.9p (2021: up 6.0% to 295.6p), as the impact of higher adjusting charges in 2022 more than offset the improved operational delivery and a translational foreign exchange tailwind. Excluding the adjusting items (discussed on pages 100 and 101) and the effect of foreign exchange on the Group’s results, adjusted diluted earnings per share, at constant rates, increased by 5.8% to 348.1p, building on the 6.6% growth in 2021. Strong Cash Generation But Currency Negatively Impacts Net Debt We continue to focus on a balanced approach to deleveraging, while investing for the future and providing a return via dividends to shareholders. The Group’s cash conversion ratio, based upon net cash generated from operations, was 99% (2021: 95%) . The Group realised £10.4 billion (2021: £9.7 billion) of net cash generated from operating activities. Due to the relative weakness of sterling against the US dollar (currency headwind of £3,911 million), which more than offset the net repayment of borrowings in the year, in 2022, total borrowings (including lease liabilities) have increased from £39,658 million in 2021 to £43,139 million in 2022. Despite the currency headwind on borrowings, we continue to deleverage. BAT Annual Report and Form 20-F 2022 Strategic Report Governance Report Financial Statements Other Information Overview Finance and Transformation Director’s Overview 8
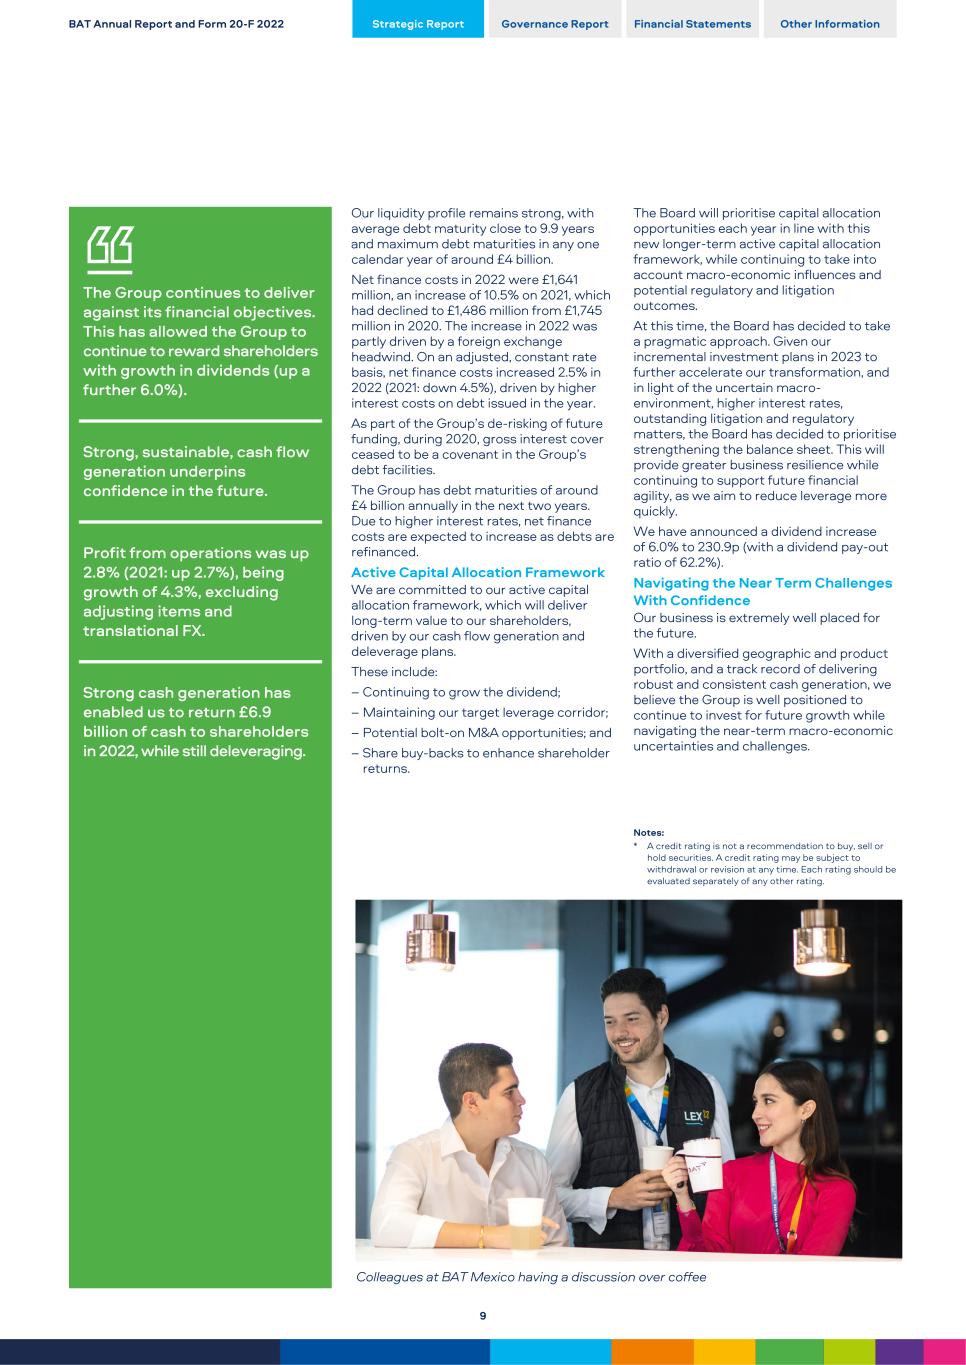
The Group continues to deliver against its financial objectives. This has allowed the Group to continue to reward shareholders with growth in dividends (up a further 6.0%). Strong, sustainable, cash flow generation underpins confidence in the future. Profit from operations was up 2.8% (2021: up 2.7%), being growth of 4.3%, excluding adjusting items and translational FX. Strong cash generation has enabled us to return £6.9 billion of cash to shareholders in 2022, while still deleveraging. Our liquidity profile remains strong, with average debt maturity close to 9.9 years and maximum debt maturities in any one calendar year of around £4 billion. Net finance costs in 2022 were £1,641 million, an increase of 10.5% on 2021, which had declined to £1,486 million from £1,745 million in 2020. The increase in 2022 was partly driven by a foreign exchange headwind. On an adjusted, constant rate basis, net finance costs increased 2.5% in 2022 (2021: down 4.5%), driven by higher interest costs on debt issued in the year. As part of the Group’s de-risking of future funding, during 2020, gross interest cover ceased to be a covenant in the Group’s debt facilities. The Group has debt maturities of around £4 billion annually in the next two years. Due to higher interest rates, net finance costs are expected to increase as debts are refinanced. Active Capital Allocation Framework We are committed to our active capital allocation framework, which will deliver long-term value to our shareholders, driven by our cash flow generation and deleverage plans. These include: – Continuing to grow the dividend; – Maintaining our target leverage corridor; – Potential bolt-on M&A opportunities; and – Share buy-backs to enhance shareholder returns. Colleagues at BAT Mexico having a discussion over coffee The Board will prioritise capital allocation opportunities each year in line with this new longer-term active capital allocation framework, while continuing to take into account macro-economic influences and potential regulatory and litigation outcomes. At this time, the Board has decided to take a pragmatic approach. Given our incremental investment plans in 2023 to further accelerate our transformation, and in light of the uncertain macro- environment, higher interest rates, outstanding litigation and regulatory matters, the Board has decided to prioritise strengthening the balance sheet. This will provide greater business resilience while continuing to support future financial agility, as we aim to reduce leverage more quickly. We have announced a dividend increase of 6.0% to 230.9p (with a dividend pay-out ratio of 62.2%). Navigating the Near Term Challenges With Confidence Our business is extremely well placed for the future. With a diversified geographic and product portfolio, and a track record of delivering robust and consistent cash generation, we believe the Group is well positioned to continue to invest for future growth while navigating the near-term macro-economic uncertainties and challenges. Notes: * A credit rating is not a recommendation to buy, sell or hold securities. A credit rating may be subject to withdrawal or revision at any time. Each rating should be evaluated separately of any other rating. BAT Annual Report and Form 20-F 2022 Strategic Report Governance Report Financial Statements Other Information 9
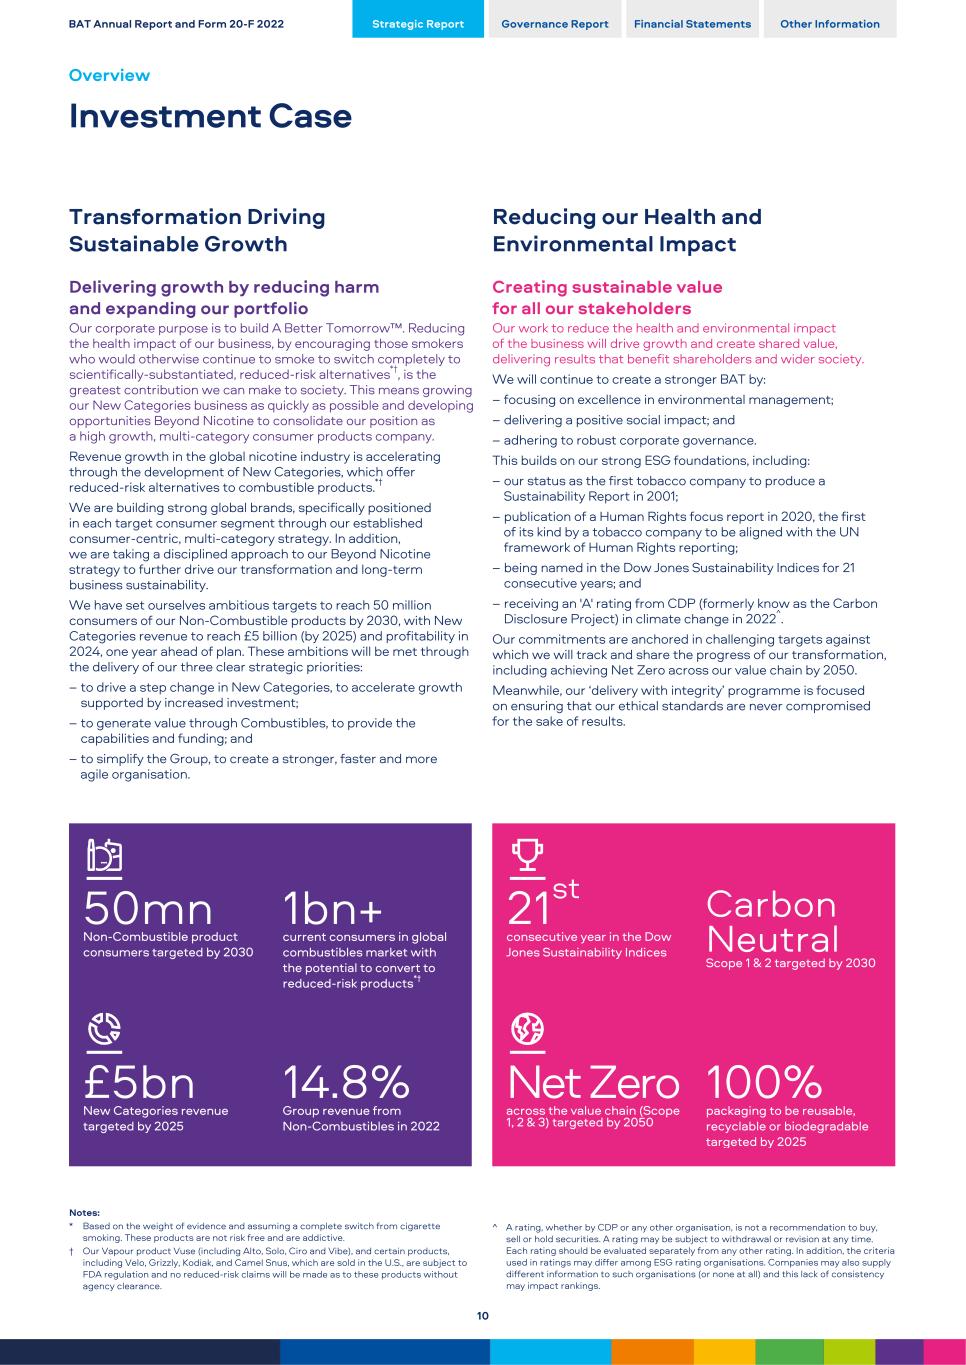
Transformation Driving Sustainable Growth Delivering growth by reducing harm and expanding our portfolio Our corporate purpose is to build A Better Tomorrow™. Reducing the health impact of our business, by encouraging those smokers who would otherwise continue to smoke to switch completely to scientifically-substantiated, reduced-risk alternatives*†, is the greatest contribution we can make to society. This means growing our New Categories business as quickly as possible and developing opportunities Beyond Nicotine to consolidate our position as a high growth, multi-category consumer products company. Revenue growth in the global nicotine industry is accelerating through the development of New Categories, which offer reduced-risk alternatives to combustible products.*† We are building strong global brands, specifically positioned in each target consumer segment through our established consumer-centric, multi-category strategy. In addition, we are taking a disciplined approach to our Beyond Nicotine strategy to further drive our transformation and long-term business sustainability. We have set ourselves ambitious targets to reach 50 million consumers of our Non-Combustible products by 2030, with New Categories revenue to reach £5 billion (by 2025) and profitability in 2024, one year ahead of plan. These ambitions will be met through the delivery of our three clear strategic priorities: – to drive a step change in New Categories, to accelerate growth supported by increased investment; – to generate value through Combustibles, to provide the capabilities and funding; and – to simplify the Group, to create a stronger, faster and more agile organisation. Reducing our Health and Environmental Impact Creating sustainable value for all our stakeholders Our work to reduce the health and environmental impact of the business will drive growth and create shared value, delivering results that benefit shareholders and wider society. We will continue to create a stronger BAT by: – focusing on excellence in environmental management; – delivering a positive social impact; and – adhering to robust corporate governance. This builds on our strong ESG foundations, including: – our status as the first tobacco company to produce a Sustainability Report in 2001; – publication of a Human Rights focus report in 2020, the first of its kind by a tobacco company to be aligned with the UN framework of Human Rights reporting; – being named in the Dow Jones Sustainability Indices for 21 consecutive years; and – receiving an 'A' rating from CDP (formerly know as the Carbon Disclosure Project) in climate change in 2022^. Our commitments are anchored in challenging targets against which we will track and share the progress of our transformation, including achieving Net Zero across our value chain by 2050. Meanwhile, our ‘delivery with integrity’ programme is focused on ensuring that our ethical standards are never compromised for the sake of results. 50mn Non-Combustible product consumers targeted by 2030 1bn+ current consumers in global combustibles market with the potential to convert to reduced-risk products*† £5bn New Categories revenue targeted by 2025 14.8% Group revenue from Non-Combustibles in 2022 Notes: * Based on the weight of evidence and assuming a complete switch from cigarette smoking. These products are not risk free and are addictive. † Our Vapour product Vuse (including Alto, Solo, Ciro and Vibe), and certain products, including Velo, Grizzly, Kodiak, and Camel Snus, which are sold in the U.S., are subject to FDA regulation and no reduced-risk claims will be made as to these products without agency clearance. 21st consecutive year in the Dow Jones Sustainability Indices Carbon Neutral Scope 1 & 2 targeted by 2030 Net Zero across the value chain (Scope 1, 2 & 3) targeted by 2050 100% packaging to be reusable, recyclable or biodegradable targeted by 2025 ^ A rating, whether by CDP or any other organisation, is not a recommendation to buy, sell or hold securities. A rating may be subject to withdrawal or revision at any time. Each rating should be evaluated separately from any other rating. In addition, the criteria used in ratings may differ among ESG rating organisations. Companies may also supply different information to such organisations (or none at all) and this lack of consistency may impact rankings. BAT Annual Report and Form 20-F 2022 Strategic Report Governance Report Financial Statements Other Information Overview Investment Case 10
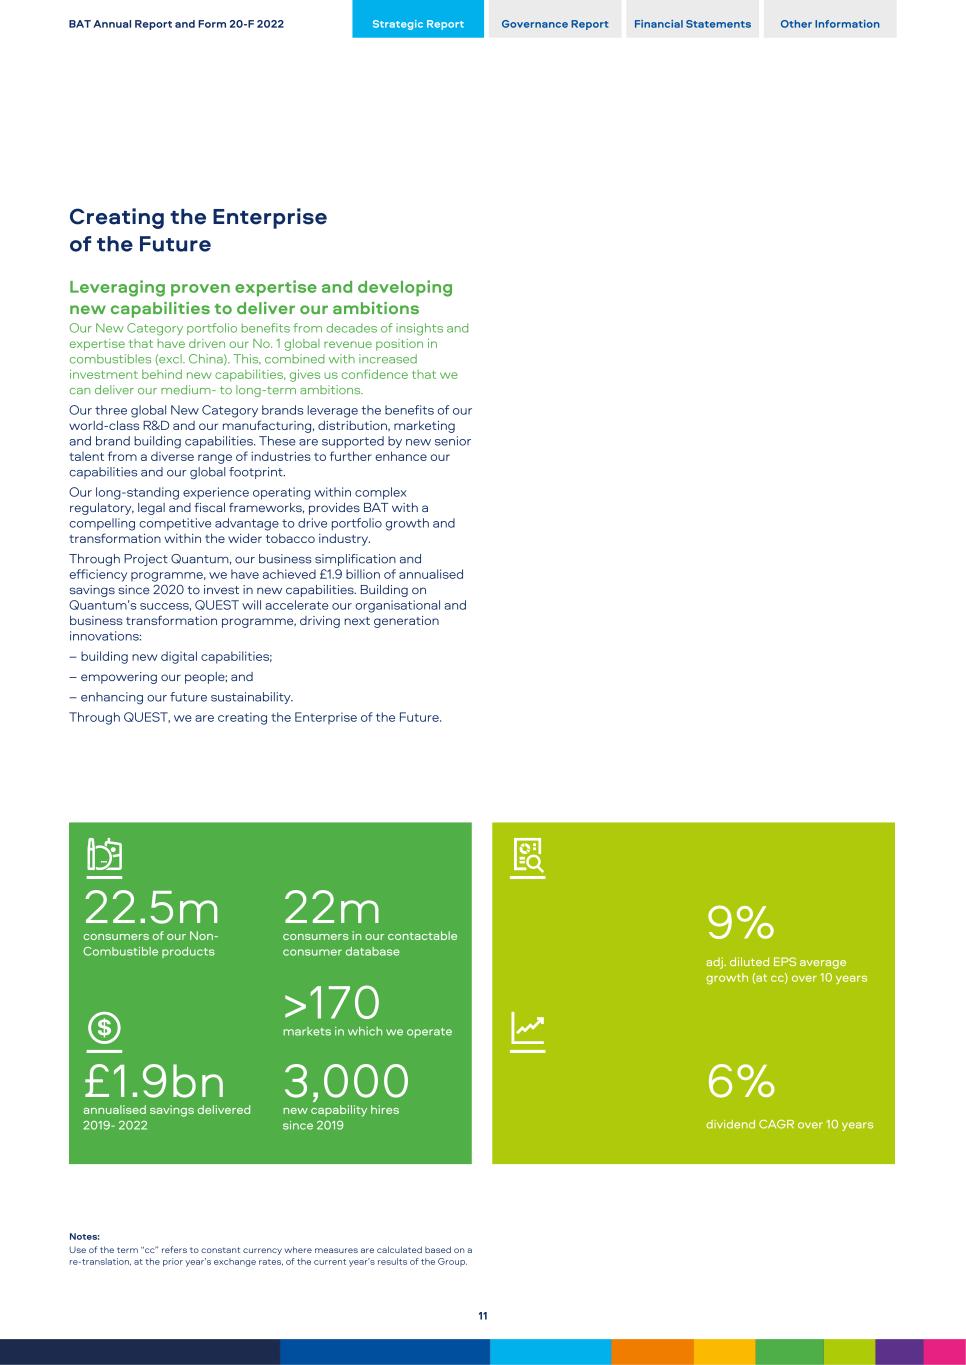
Creating the Enterprise of the Future Leveraging proven expertise and developing new capabilities to deliver our ambitions Our New Category portfolio benefits from decades of insights and expertise that have driven our No. 1 global revenue position in combustibles (excl. China). This, combined with increased investment behind new capabilities, gives us confidence that we can deliver our medium- to long-term ambitions. Our three global New Category brands leverage the benefits of our world-class R&D and our manufacturing, distribution, marketing and brand building capabilities. These are supported by new senior talent from a diverse range of industries to further enhance our capabilities and our global footprint. Our long-standing experience operating within complex regulatory, legal and fiscal frameworks, provides BAT with a compelling competitive advantage to drive portfolio growth and transformation within the wider tobacco industry. Through Project Quantum, our business simplification and efficiency programme, we have achieved £1.9 billion of annualised savings since 2020 to invest in new capabilities. Building on Quantum’s success, QUEST will accelerate our organisational and business transformation programme, driving next generation innovations: – building new digital capabilities; – empowering our people; and – enhancing our future sustainability. Through QUEST, we are creating the Enterprise of the Future. 22.5m consumers of our Non- Combustible products 22m consumers in our contactable consumer database >170 markets in which we operate £1.9bn annualised savings delivered 2019- 2022 3,000 new capability hires since 2019 9% adj. diluted EPS average growth (at cc) over 10 years 6% dividend CAGR over 10 years Notes: Use of the term “cc” refers to constant currency where measures are calculated based on a re-translation, at the prior year’s exchange rates, of the current year’s results of the Group. BAT Annual Report and Form 20-F 2022 Strategic Report Governance Report Financial Statements Other Information 11
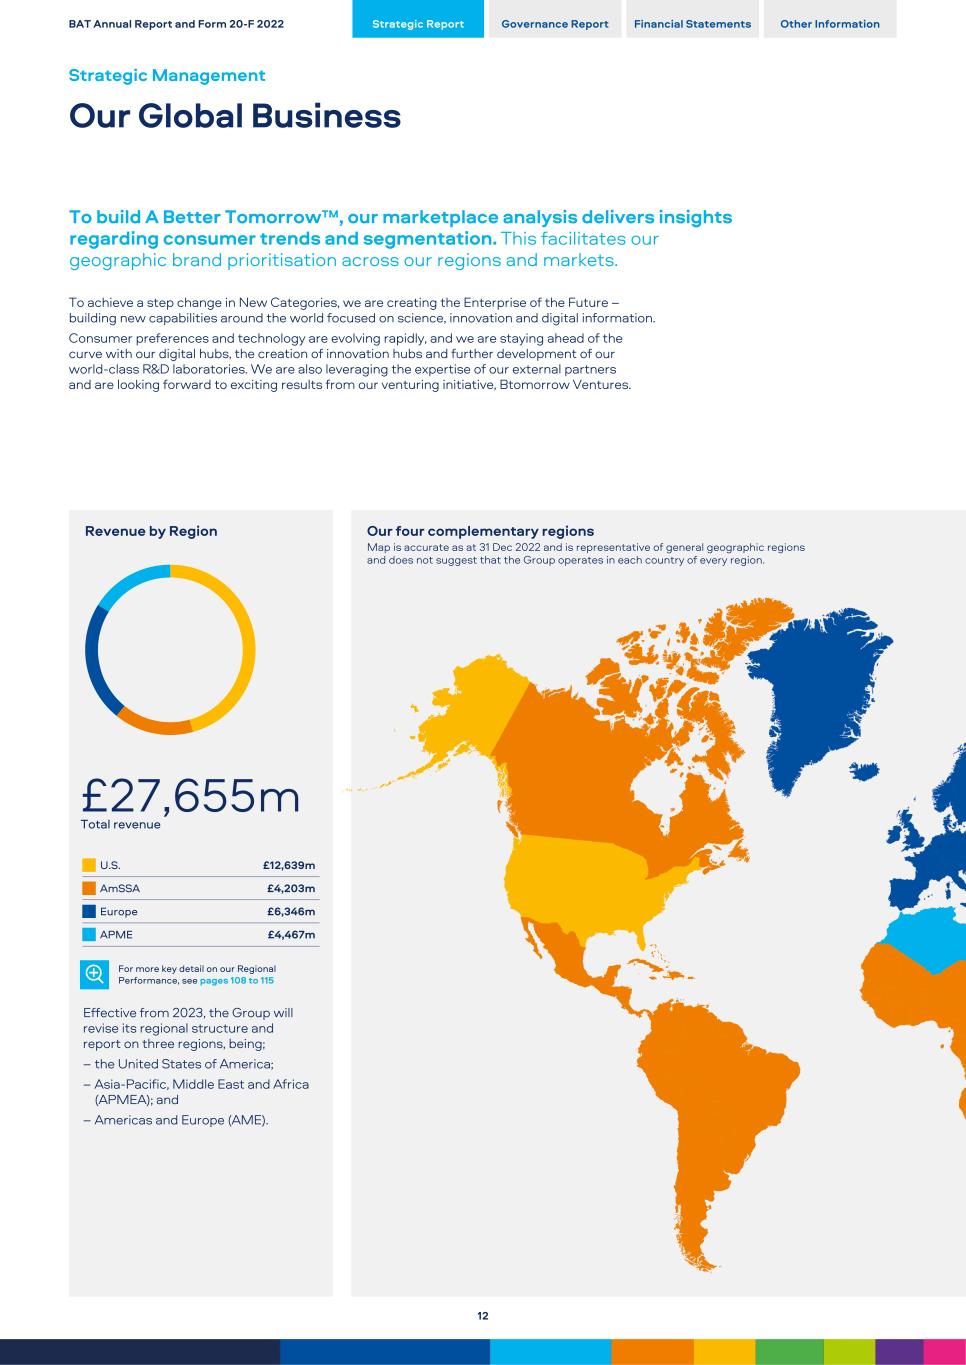
To build A Better Tomorrow™, our marketplace analysis delivers insights regarding consumer trends and segmentation. This facilitates our geographic brand prioritisation across our regions and markets. To achieve a step change in New Categories, we are creating the Enterprise of the Future – building new capabilities around the world focused on science, innovation and digital information. Consumer preferences and technology are evolving rapidly, and we are staying ahead of the curve with our digital hubs, the creation of innovation hubs and further development of our world-class R&D laboratories. We are also leveraging the expertise of our external partners and are looking forward to exciting results from our venturing initiative, Btomorrow Ventures. Revenue by Region £27,655m Total revenue U.S. £12,639m AmSSA £4,203m Europe £6,346m APME £4,467m For more key detail on our Regional Performance, see pages 108 to 115 Effective from 2023, the Group will revise its regional structure and report on three regions, being; – the United States of America; – Asia-Pacific, Middle East and Africa (APMEA); and – Americas and Europe (AME). Our four complementary regions Map is accurate as at 31 Dec 2022 and is representative of general geographic regions and does not suggest that the Group operates in each country of every region. BAT Annual Report and Form 20-F 2022 Strategic Report Governance Report Financial Statements Other Information Strategic Management Our Global Business 12
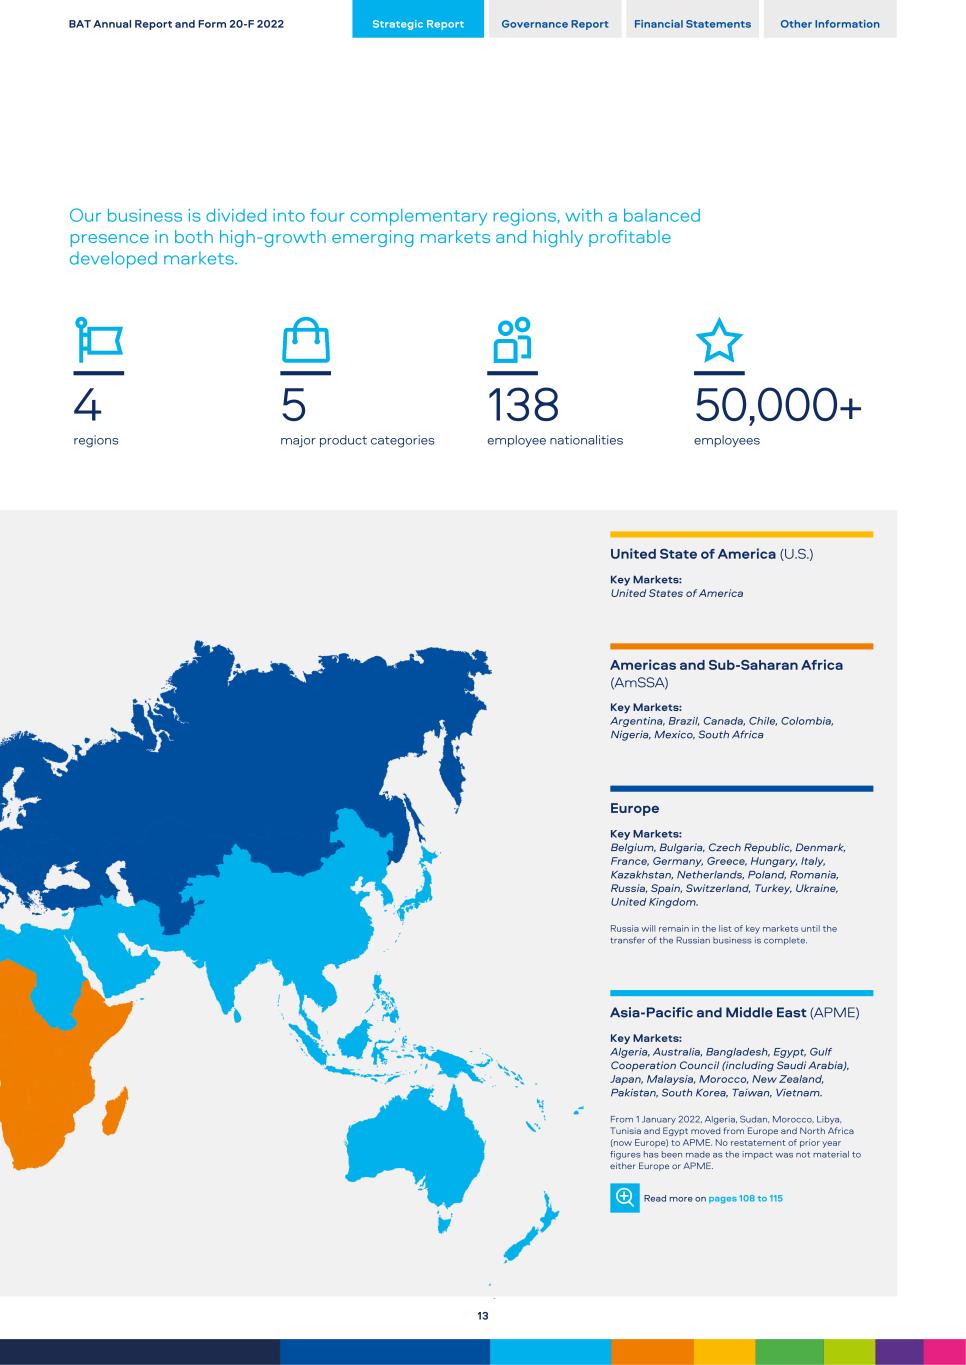
Our business is divided into four complementary regions, with a balanced presence in both high-growth emerging markets and highly profitable developed markets. 4 5 138 50,000+ regions major product categories employee nationalities employees United State of America (U.S.) Key Markets: United States of America Americas and Sub-Saharan Africa (AmSSA) Key Markets: Argentina, Brazil, Canada, Chile, Colombia, Nigeria, Mexico, South Africa Europe Key Markets: Belgium, Bulgaria, Czech Republic, Denmark, France, Germany, Greece, Hungary, Italy, Kazakhstan, Netherlands, Poland, Romania, Russia, Spain, Switzerland, Turkey, Ukraine, United Kingdom. Russia will remain in the list of key markets until the transfer of the Russian business is complete. Asia-Pacific and Middle East (APME) Key Markets: Algeria, Australia, Bangladesh, Egypt, Gulf Cooperation Council (including Saudi Arabia), Japan, Malaysia, Morocco, New Zealand, Pakistan, South Korea, Taiwan, Vietnam. From 1 January 2022, Algeria, Sudan, Morocco, Libya, Tunisia and Egypt moved from Europe and North Africa (now Europe) to APME. No restatement of prior year figures has been made as the impact was not material to either Europe or APME. Read more on pages 108 to 115 BAT Annual Report and Form 20-F 2022 Strategic Report Governance Report Financial Statements Other Information 13
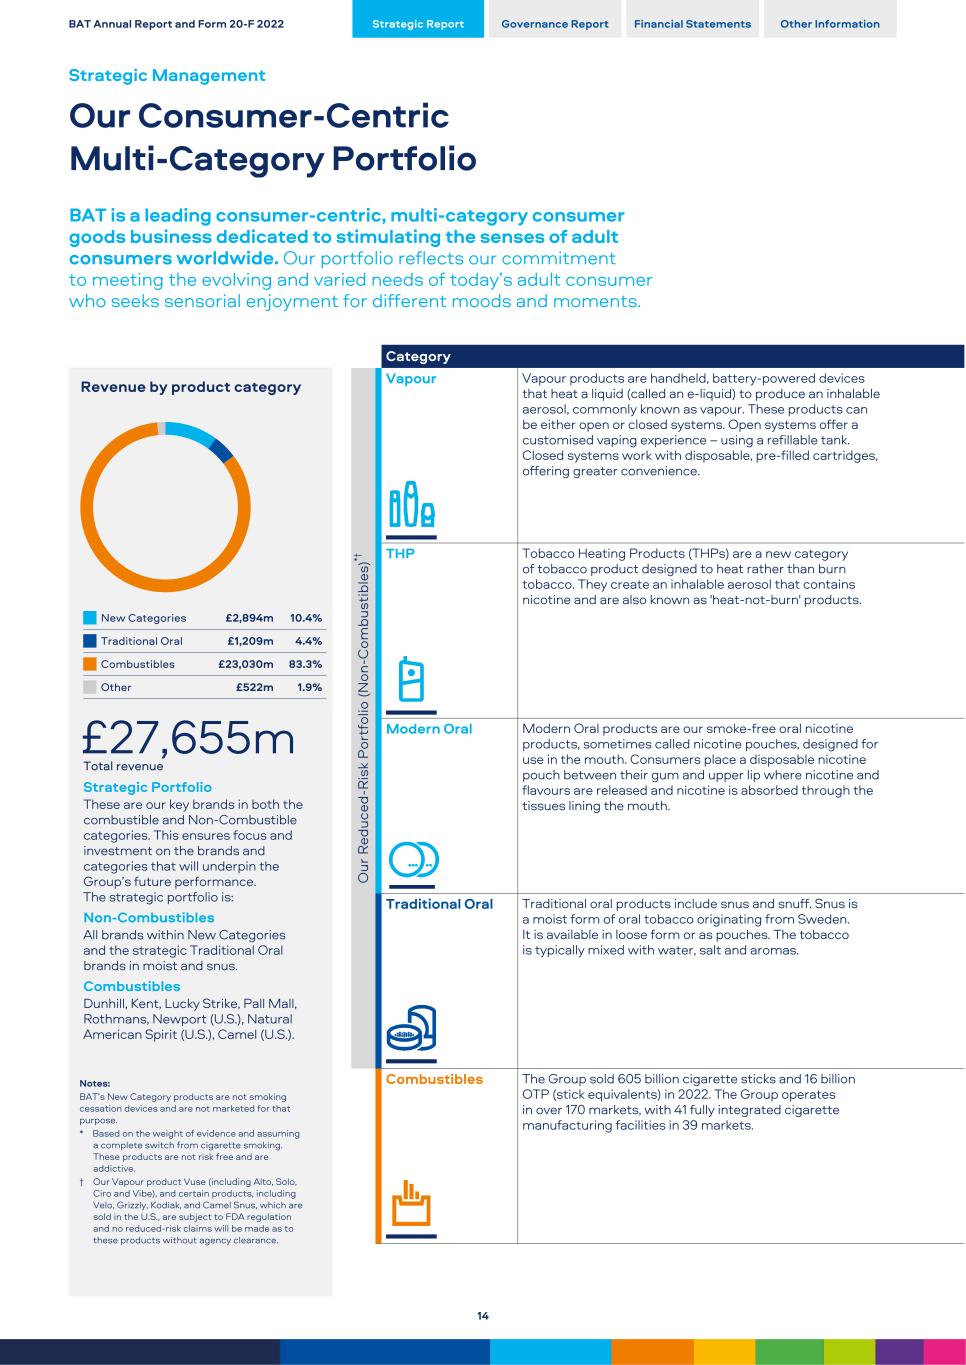
Revenue by product category New Categories £2,894m 10.4% Traditional Oral £1,209m 4.4% Combustibles £23,030m 83.3% Other £522m 1.9% £27,655m Total revenue Strategic Portfolio These are our key brands in both the combustible and Non-Combustible categories. This ensures focus and investment on the brands and categories that will underpin the Group’s future performance. The strategic portfolio is: Non-Combustibles All brands within New Categories and the strategic Traditional Oral brands in moist and snus. Combustibles Dunhill, Kent, Lucky Strike, Pall Mall, Rothmans, Newport (U.S.), Natural American Spirit (U.S.), Camel (U.S.). Notes: BAT’s New Category products are not smoking cessation devices and are not marketed for that purpose. * Based on the weight of evidence and assuming a complete switch from cigarette smoking. These products are not risk free and are addictive. † Our Vapour product Vuse (including Alto, Solo, Ciro and Vibe), and certain products, including Velo, Grizzly, Kodiak, and Camel Snus, which are sold in the U.S., are subject to FDA regulation and no reduced-risk claims will be made as to these products without agency clearance. Category O ur R ed uc ed -R is k P or tf ol io (N on -C om bu st ib le s) *† Vapour Vapour products are handheld, battery-powered devices that heat a liquid (called an e-liquid) to produce an inhalable aerosol, commonly known as vapour. These products can be either open or closed systems. Open systems offer a customised vaping experience – using a refillable tank. Closed systems work with disposable, pre-filled cartridges, offering greater convenience. THP Tobacco Heating Products (THPs) are a new category of tobacco product designed to heat rather than burn tobacco. They create an inhalable aerosol that contains nicotine and are also known as 'heat-not-burn' products. Modern Oral Modern Oral products are our smoke-free oral nicotine products, sometimes called nicotine pouches, designed for use in the mouth. Consumers place a disposable nicotine pouch between their gum and upper lip where nicotine and flavours are released and nicotine is absorbed through the tissues lining the mouth. Traditional Oral Traditional oral products include snus and snuff. Snus is a moist form of oral tobacco originating from Sweden. It is available in loose form or as pouches. The tobacco is typically mixed with water, salt and aromas. Combustibles The Group sold 605 billion cigarette sticks and 16 billion OTP (stick equivalents) in 2022. The Group operates in over 170 markets, with 41 fully integrated cigarette manufacturing facilities in 39 markets. BAT Annual Report and Form 20-F 2022 Strategic Report Governance Report Financial Statements Other Information Strategic Management Our Consumer-Centric Multi-Category Portfolio BAT is a leading consumer-centric, multi-category consumer goods business dedicated to stimulating the senses of adult consumers worldwide. Our portfolio reflects our commitment to meeting the evolving and varied needs of today’s adult consumer who seeks sensorial enjoyment for different moods and moments. 14
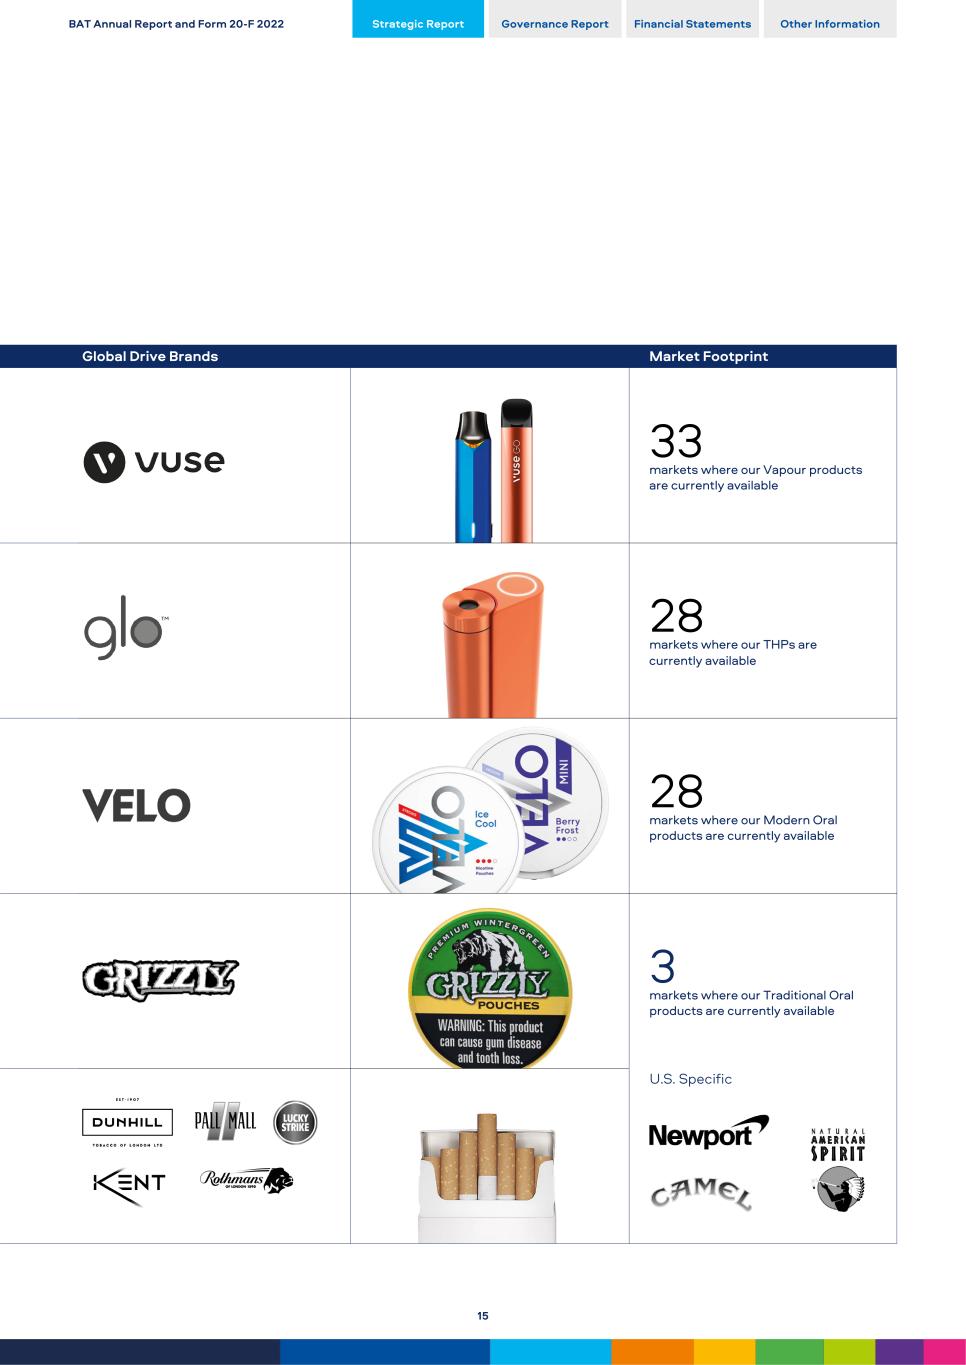
Global Drive Brands Market Footprint 33 markets where our Vapour products are currently available 28 markets where our THPs are currently available 28 markets where our Modern Oral products are currently available 3 markets where our Traditional Oral products are currently available U.S. Specific BAT Annual Report and Form 20-F 2022 Strategic Report Governance Report Financial Statements Other Information 15
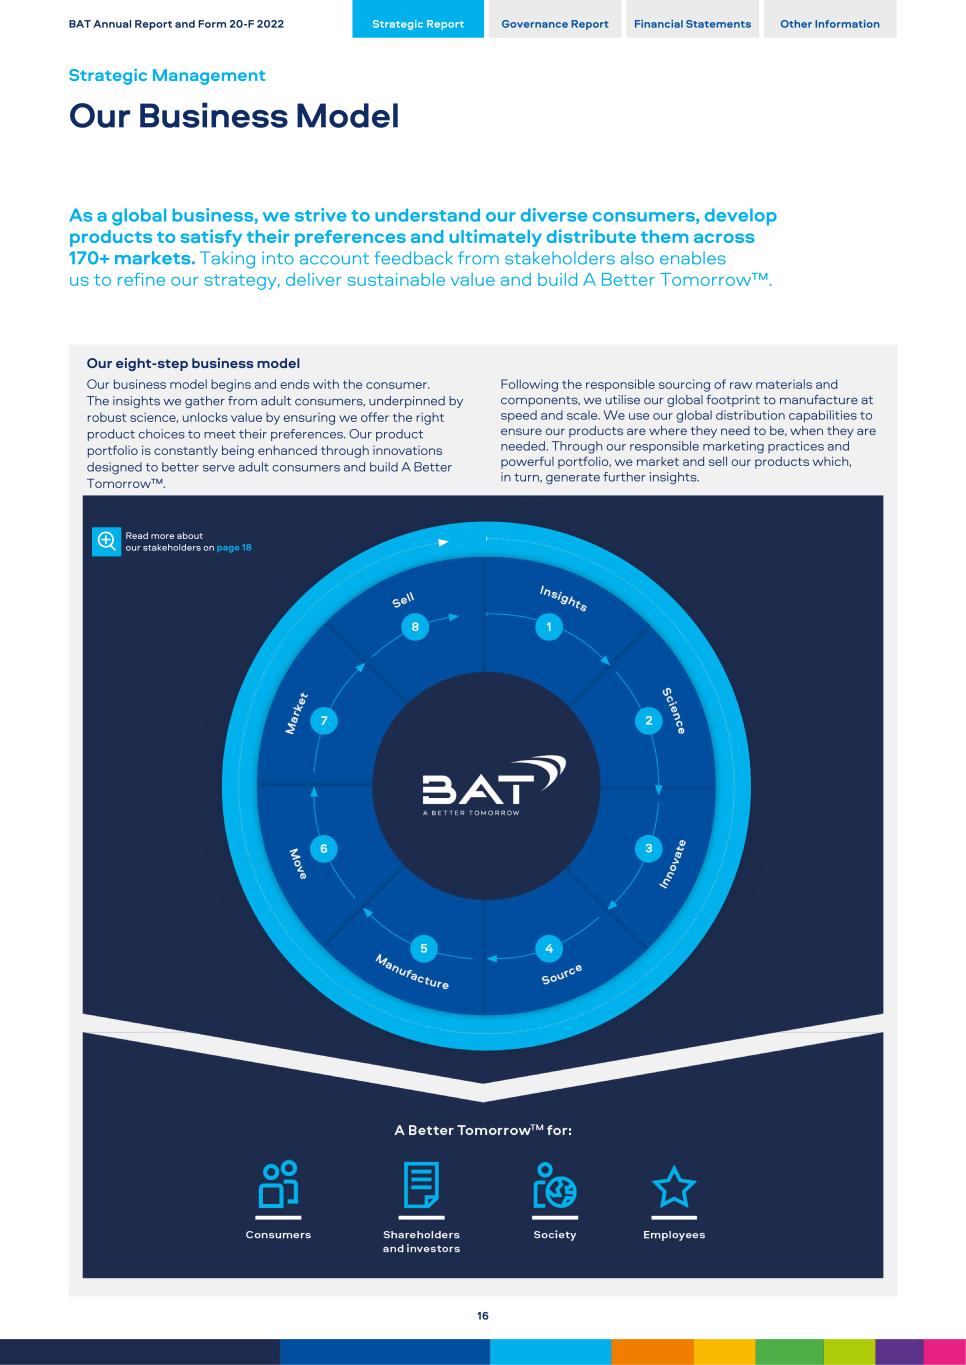
Our eight-step business model Our business model begins and ends with the consumer. The insights we gather from adult consumers, underpinned by robust science, unlocks value by ensuring we offer the right product choices to meet their preferences. Our product portfolio is constantly being enhanced through innovations designed to better serve adult consumers and build A Better Tomorrow™. Following the responsible sourcing of raw materials and components, we utilise our global footprint to manufacture at speed and scale. We use our global distribution capabilities to ensure our products are where they need to be, when they are needed. Through our responsible marketing practices and powerful portfolio, we market and sell our products which, in turn, generate further insights. Read more about our stakeholders on page 18 BAT Annual Report and Form 20-F 2022 Strategic Report Governance Report Financial Statements Other Information Strategic Management Our Business Model As a global business, we strive to understand our diverse consumers, develop products to satisfy their preferences and ultimately distribute them across 170+ markets. Taking into account feedback from stakeholders also enables us to refine our strategy, deliver sustainable value and build A Better Tomorrow™. 16
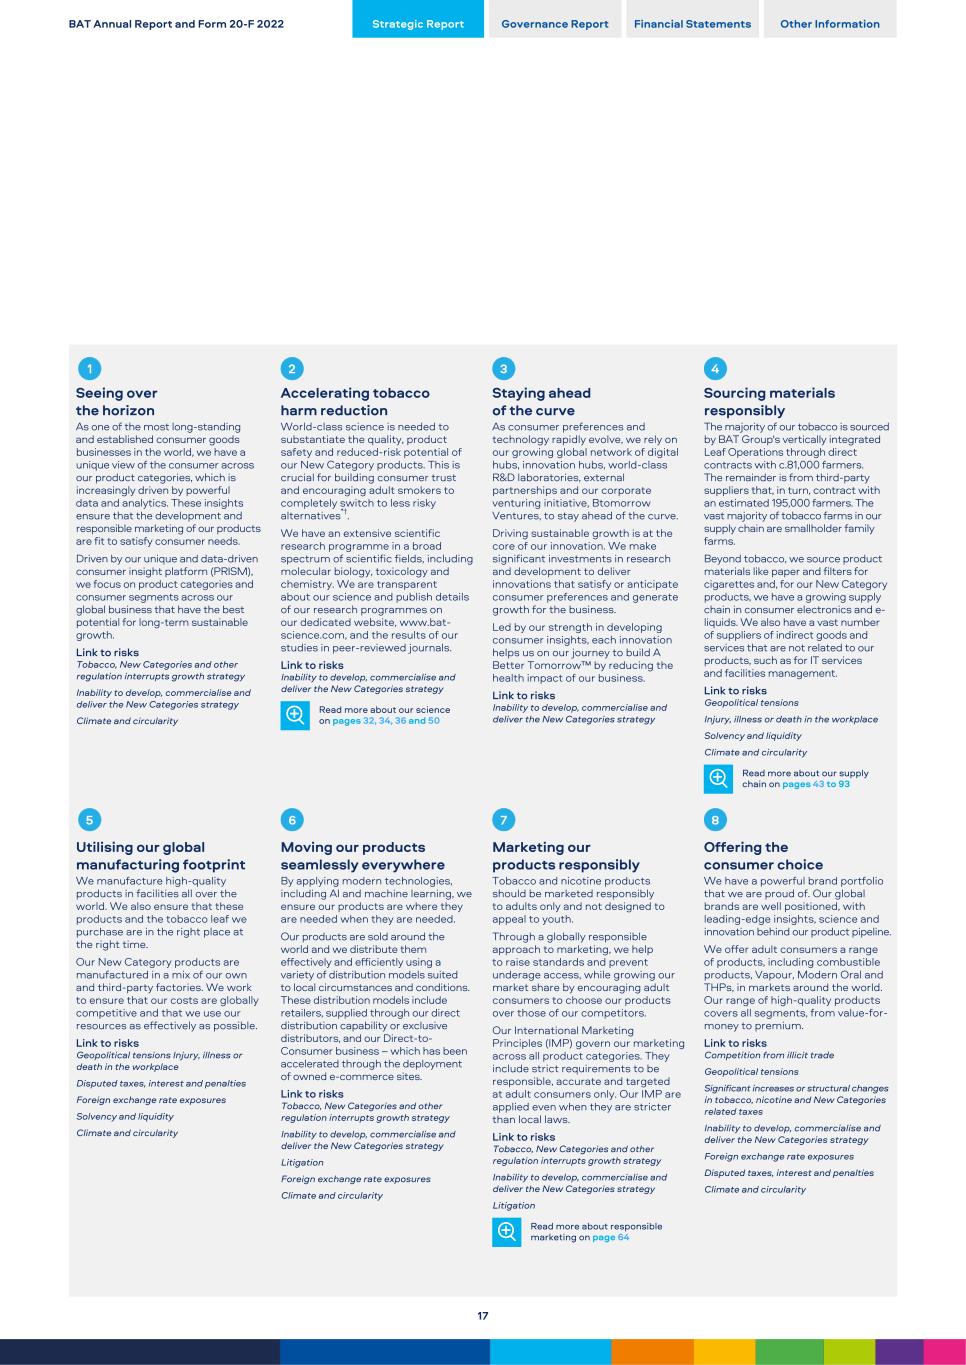
Seeing over the horizon As one of the most long-standing and established consumer goods businesses in the world, we have a unique view of the consumer across our product categories, which is increasingly driven by powerful data and analytics. These insights ensure that the development and responsible marketing of our products are fit to satisfy consumer needs. Driven by our unique and data-driven consumer insight platform (PRISM), we focus on product categories and consumer segments across our global business that have the best potential for long-term sustainable growth. Link to risks Tobacco, New Categories and other regulation interrupts growth strategy Inability to develop, commercialise and deliver the New Categories strategy Climate and circularity Accelerating tobacco harm reduction World-class science is needed to substantiate the quality, product safety and reduced-risk potential of our New Category products. This is crucial for building consumer trust and encouraging adult smokers to completely switch to less risky alternatives*†. We have an extensive scientific research programme in a broad spectrum of scientific fields, including molecular biology, toxicology and chemistry. We are transparent about our science and publish details of our research programmes on our dedicated website, www.bat- science.com, and the results of our studies in peer-reviewed journals. Link to risks Inability to develop, commercialise and deliver the New Categories strategy Read more about our science on pages 32, 34, 36 and 50 Staying ahead of the curve As consumer preferences and technology rapidly evolve, we rely on our growing global network of digital hubs, innovation hubs, world-class R&D laboratories, external partnerships and our corporate venturing initiative, Btomorrow Ventures, to stay ahead of the curve. Driving sustainable growth is at the core of our innovation. We make significant investments in research and development to deliver innovations that satisfy or anticipate consumer preferences and generate growth for the business. Led by our strength in developing consumer insights, each innovation helps us on our journey to build A Better Tomorrow™ by reducing the health impact of our business. Link to risks Inability to develop, commercialise and deliver the New Categories strategy Sourcing materials responsibly The majority of our tobacco is sourced by BAT Group's vertically integrated Leaf Operations through direct contracts with c.81,000 farmers. The remainder is from third-party suppliers that, in turn, contract with an estimated 195,000 farmers. The vast majority of tobacco farms in our supply chain are smallholder family farms. Beyond tobacco, we source product materials like paper and filters for cigarettes and, for our New Category products, we have a growing supply chain in consumer electronics and e- liquids. We also have a vast number of suppliers of indirect goods and services that are not related to our products, such as for IT services and facilities management. Link to risks Geopolitical tensions Injury, illness or death in the workplace Solvency and liquidity Climate and circularity Read more about our supply chain on pages 43 to 93 Utilising our global manufacturing footprint We manufacture high-quality products in facilities all over the world. We also ensure that these products and the tobacco leaf we purchase are in the right place at the right time. Our New Category products are manufactured in a mix of our own and third-party factories. We work to ensure that our costs are globally competitive and that we use our resources as effectively as possible. Link to risks Geopolitical tensions Injury, illness or death in the workplace Disputed taxes, interest and penalties Foreign exchange rate exposures Solvency and liquidity Climate and circularity Moving our products seamlessly everywhere By applying modern technologies, including AI and machine learning, we ensure our products are where they are needed when they are needed. Our products are sold around the world and we distribute them effectively and efficiently using a variety of distribution models suited to local circumstances and conditions. These distribution models include retailers, supplied through our direct distribution capability or exclusive distributors, and our Direct-to- Consumer business – which has been accelerated through the deployment of owned e-commerce sites. Link to risks Tobacco, New Categories and other regulation interrupts growth strategy Inability to develop, commercialise and deliver the New Categories strategy Litigation Foreign exchange rate exposures Climate and circularity Marketing our products responsibly Tobacco and nicotine products should be marketed responsibly to adults only and not designed to appeal to youth. Through a globally responsible approach to marketing, we help to raise standards and prevent underage access, while growing our market share by encouraging adult consumers to choose our products over those of our competitors. Our International Marketing Principles (IMP) govern our marketing across all product categories. They include strict requirements to be responsible, accurate and targeted at adult consumers only. Our IMP are applied even when they are stricter than local laws. Link to risks Tobacco, New Categories and other regulation interrupts growth strategy Inability to develop, commercialise and deliver the New Categories strategy Litigation Read more about responsible marketing on page 64 Offering the consumer choice We have a powerful brand portfolio that we are proud of. Our global brands are well positioned, with leading-edge insights, science and innovation behind our product pipeline. We offer adult consumers a range of products, including combustible products, Vapour, Modern Oral and THPs, in markets around the world. Our range of high-quality products covers all segments, from value-for- money to premium. Link to risks Competition from illicit trade Geopolitical tensions Significant increases or structural changes in tobacco, nicotine and New Categories related taxes Inability to develop, commercialise and deliver the New Categories strategy Foreign exchange rate exposures Disputed taxes, interest and penalties Climate and circularity BAT Annual Report and Form 20-F 2022 Strategic Report Governance Report Financial Statements Other Information 17
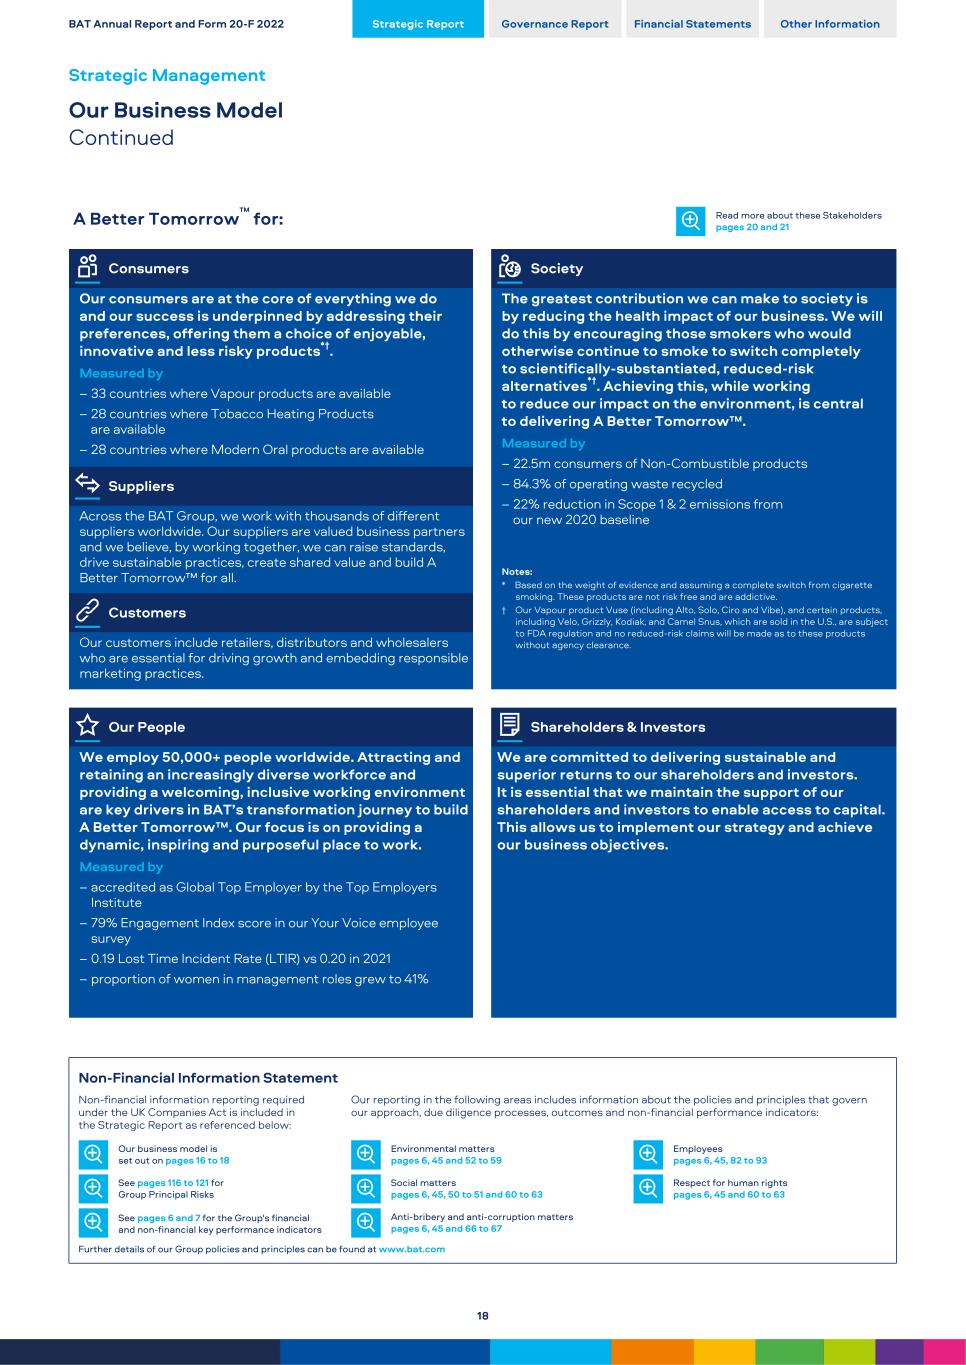
A Better Tomorrow™ for: Read more about these Stakeholders pages 20 and 21 Consumers Society Our consumers are at the core of everything we do and our success is underpinned by addressing their preferences, offering them a choice of enjoyable, innovative and less risky products*†. Measured by – 33 countries where Vapour products are available – 28 countries where Tobacco Heating Products are available – 28 countries where Modern Oral products are available The greatest contribution we can make to society is by reducing the health impact of our business. We will do this by encouraging those smokers who would otherwise continue to smoke to switch completely to scientifically-substantiated, reduced-risk alternatives*†. Achieving this, while working to reduce our impact on the environment, is central to delivering A Better Tomorrow™. Measured by – 22.5m consumers of Non-Combustible products – 84.3% of operating waste recycled – 22% reduction in Scope 1 & 2 emissions from our new 2020 baseline Notes: * Based on the weight of evidence and assuming a complete switch from cigarette smoking. These products are not risk free and are addictive. † Our Vapour product Vuse (including Alto, Solo, Ciro and Vibe), and certain products, including Velo, Grizzly, Kodiak, and Camel Snus, which are sold in the U.S., are subject to FDA regulation and no reduced-risk claims will be made as to these products without agency clearance. Suppliers Across the BAT Group, we work with thousands of different suppliers worldwide. Our suppliers are valued business partners and we believe, by working together, we can raise standards, drive sustainable practices, create shared value and build A Better Tomorrow™ for all. Customers Our customers include retailers, distributors and wholesalers who are essential for driving growth and embedding responsible marketing practices. Our People Shareholders & Investors We employ 50,000+ people worldwide. Attracting and retaining an increasingly diverse workforce and providing a welcoming, inclusive working environment are key drivers in BAT’s transformation journey to build A Better Tomorrow™. Our focus is on providing a dynamic, inspiring and purposeful place to work. Measured by – accredited as Global Top Employer by the Top Employers Institute – 79% Engagement Index score in our Your Voice employee survey – 0.19 Lost Time Incident Rate (LTIR) vs 0.20 in 2021 – proportion of women in management roles grew to 41% We are committed to delivering sustainable and superior returns to our shareholders and investors. It is essential that we maintain the support of our shareholders and investors to enable access to capital. This allows us to implement our strategy and achieve our business objectives. Non-Financial Information Statement Non-financial information reporting required under the UK Companies Act is included in the Strategic Report as referenced below: Our reporting in the following areas includes information about the policies and principles that govern our approach, due diligence processes, outcomes and non-financial performance indicators: Our business model is set out on pages 16 to 18 Environmental matters pages 6, 45 and 52 to 59 Employees pages 6, 45, 82 to 93 See pages 116 to 121 for Group Principal Risks Social matters pages 6, 45, 50 to 51 and 60 to 63 Respect for human rights pages 6, 45 and 60 to 63 See pages 6 and 7 for the Group's financial and non-financial key performance indicators Anti-bribery and anti-corruption matters pages 6, 45 and 66 to 67 Further details of our Group policies and principles can be found at www.bat.com BAT Annual Report and Form 20-F 2022 Strategic Report Governance Report Financial Statements Other Information Strategic Management Our Business Model Continued 18

BAT Annual Report and Form 20-F 2022 Strategic Report Governance Report Financial Statements Other Information 19
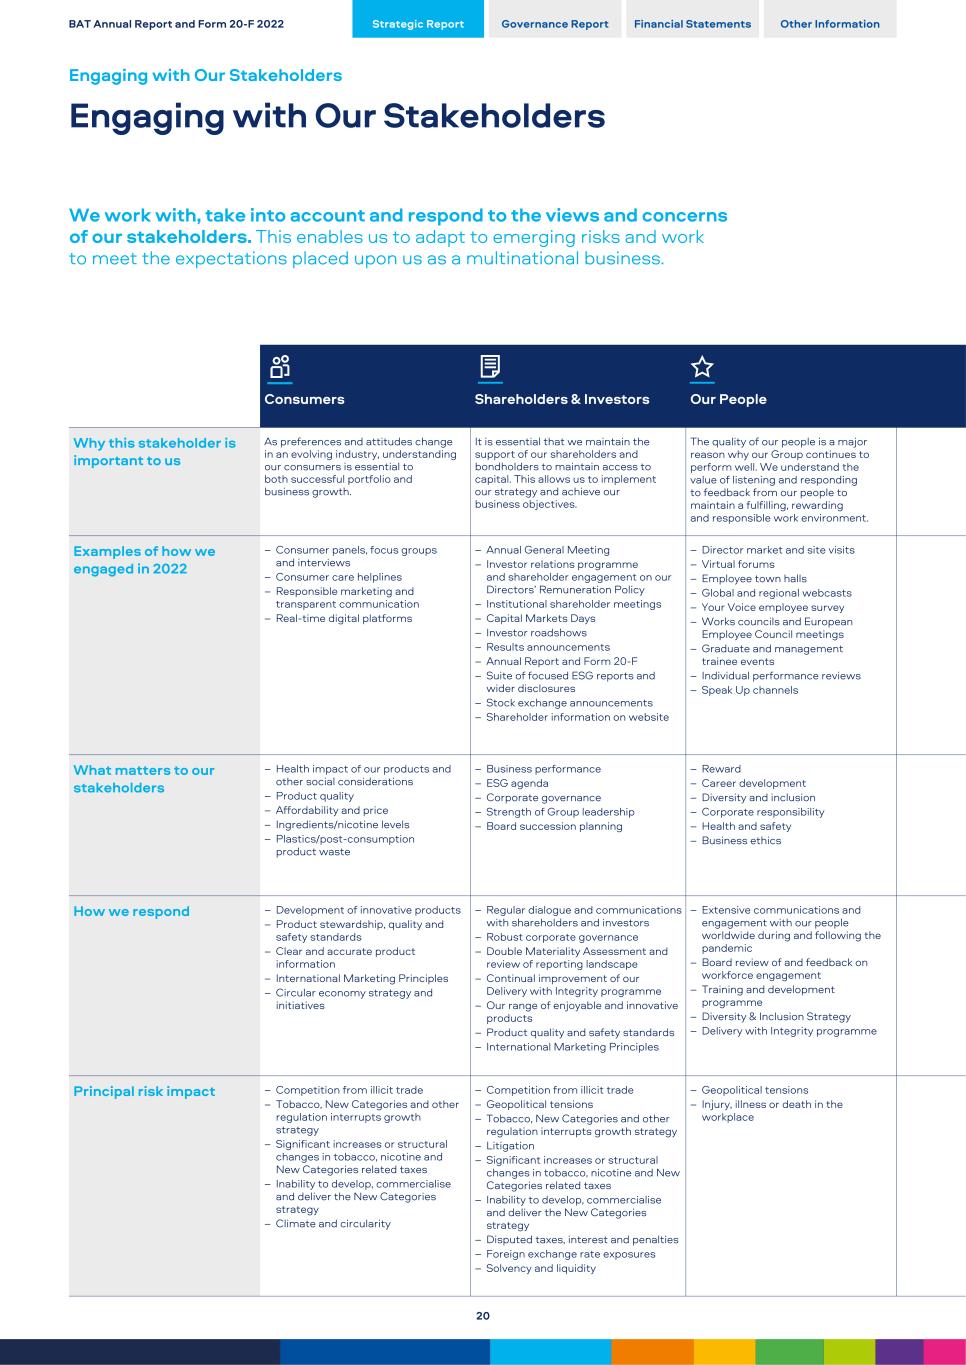
Consumers Shareholders & Investors Our People Why this stakeholder is important to us As preferences and attitudes change in an evolving industry, understanding our consumers is essential to both successful portfolio and business growth. It is essential that we maintain the support of our shareholders and bondholders to maintain access to capital. This allows us to implement our strategy and achieve our business objectives. The quality of our people is a major reason why our Group continues to perform well. We understand the value of listening and responding to feedback from our people to maintain a fulfilling, rewarding and responsible work environment. Examples of how we engaged in 2022 – Consumer panels, focus groups and interviews – Consumer care helplines – Responsible marketing and transparent communication – Real-time digital platforms – Annual General Meeting – Investor relations programme and shareholder engagement on our Directors’ Remuneration Policy – Institutional shareholder meetings – Capital Markets Days – Investor roadshows – Results announcements – Annual Report and Form 20-F – Suite of focused ESG reports and wider disclosures – Stock exchange announcements – Shareholder information on website – Director market and site visits – Virtual forums – Employee town halls – Global and regional webcasts – Your Voice employee survey – Works councils and European Employee Council meetings – Graduate and management trainee events – Individual performance reviews – Speak Up channels What matters to our stakeholders – Health impact of our products and other social considerations – Product quality – Affordability and price – Ingredients/nicotine levels – Plastics/post-consumption product waste – Business performance – ESG agenda – Corporate governance – Strength of Group leadership – Board succession planning – Reward – Career development – Diversity and inclusion – Corporate responsibility – Health and safety – Business ethics How we respond – Development of innovative products – Product stewardship, quality and safety standards – Clear and accurate product information – International Marketing Principles – Circular economy strategy and initiatives – Regular dialogue and communications with shareholders and investors – Robust corporate governance – Double Materiality Assessment and review of reporting landscape – Continual improvement of our Delivery with Integrity programme – Our range of enjoyable and innovative products – Product quality and safety standards – International Marketing Principles – Extensive communications and engagement with our people worldwide during and following the pandemic – Board review of and feedback on workforce engagement – Training and development programme – Diversity & Inclusion Strategy – Delivery with Integrity programme Principal risk impact – Competition from illicit trade – Tobacco, New Categories and other regulation interrupts growth strategy – Significant increases or structural changes in tobacco, nicotine and New Categories related taxes – Inability to develop, commercialise and deliver the New Categories strategy – Climate and circularity – Competition from illicit trade – Geopolitical tensions – Tobacco, New Categories and other regulation interrupts growth strategy – Litigation – Significant increases or structural changes in tobacco, nicotine and New Categories related taxes – Inability to develop, commercialise and deliver the New Categories strategy – Disputed taxes, interest and penalties – Foreign exchange rate exposures – Solvency and liquidity – Geopolitical tensions – Injury, illness or death in the workplace BAT Annual Report and Form 20-F 2022 Strategic Report Governance Report Financial Statements Other Information Engaging with Our Stakeholders Engaging with Our Stakeholders We work with, take into account and respond to the views and concerns of our stakeholders. This enables us to adapt to emerging risks and work to meet the expectations placed upon us as a multinational business. 20
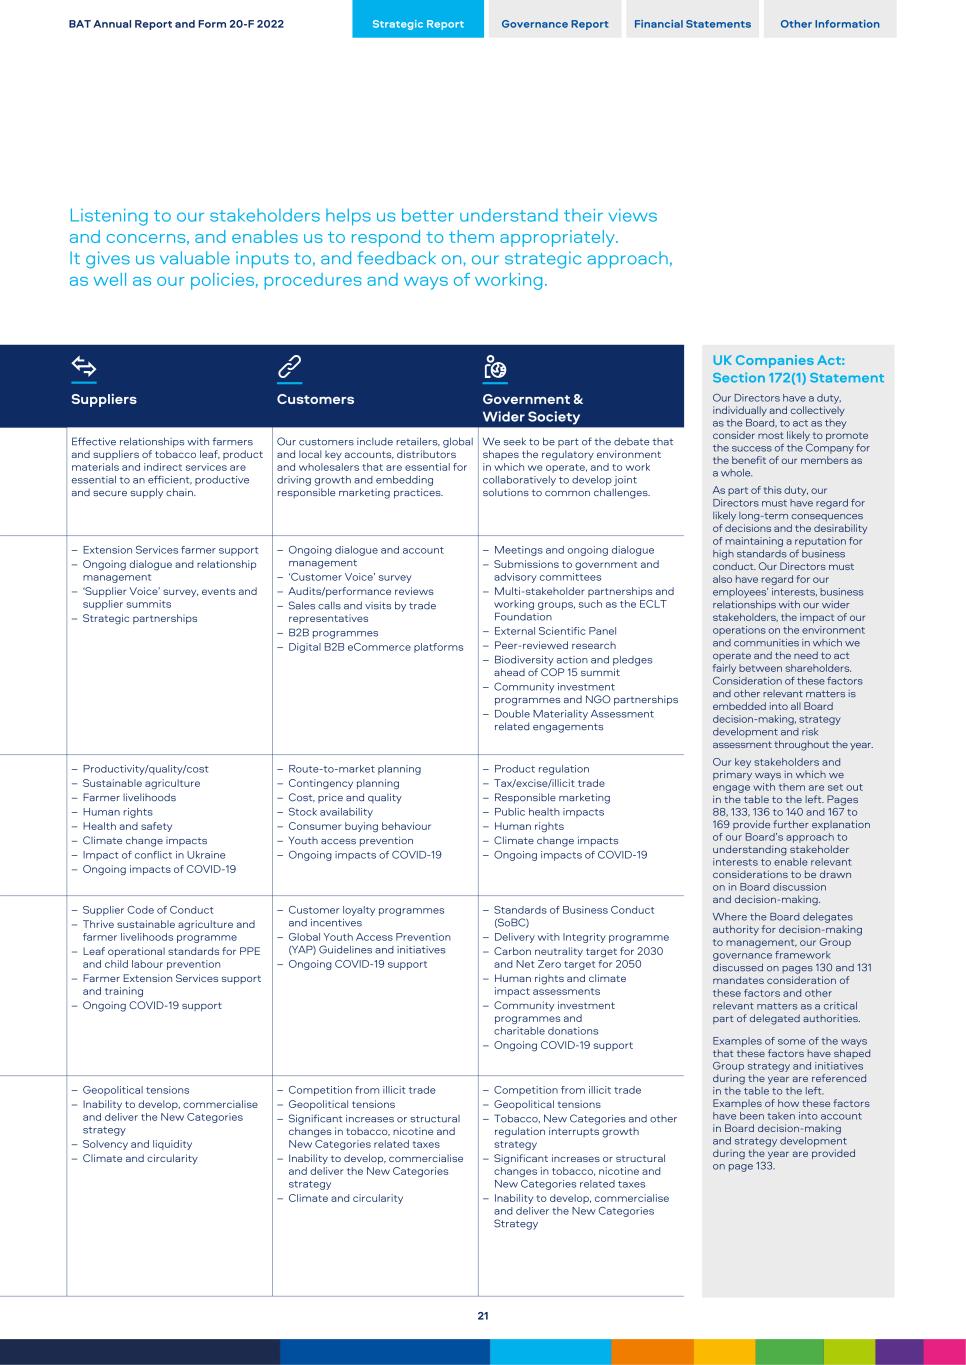
UK Companies Act: Section 172(1) Statement Suppliers Customers Government & Wider Society Our Directors have a duty, individually and collectively as the Board, to act as they consider most likely to promote the success of the Company for the benefit of our members as a whole. As part of this duty, our Directors must have regard for likely long-term consequences of decisions and the desirability of maintaining a reputation for high standards of business conduct. Our Directors must also have regard for our employees’ interests, business relationships with our wider stakeholders, the impact of our operations on the environment and communities in which we operate and the need to act fairly between shareholders. Consideration of these factors and other relevant matters is embedded into all Board decision-making, strategy development and risk assessment throughout the year. Our key stakeholders and primary ways in which we engage with them are set out in the table to the left. Pages 88, 133, 136 to 140 and 167 to 169 provide further explanation of our Board’s approach to understanding stakeholder interests to enable relevant considerations to be drawn on in Board discussion and decision-making. Where the Board delegates authority for decision-making to management, our Group governance framework discussed on pages 130 and 131 mandates consideration of these factors and other relevant matters as a critical part of delegated authorities. Examples of some of the ways that these factors have shaped Group strategy and initiatives during the year are referenced in the table to the left. Examples of how these factors have been taken into account in Board decision-making and strategy development during the year are provided on page 133. Effective relationships with farmers and suppliers of tobacco leaf, product materials and indirect services are essential to an efficient, productive and secure supply chain. Our customers include retailers, global and local key accounts, distributors and wholesalers that are essential for driving growth and embedding responsible marketing practices. We seek to be part of the debate that shapes the regulatory environment in which we operate, and to work collaboratively to develop joint solutions to common challenges. – Extension Services farmer support – Ongoing dialogue and relationship management – ‘Supplier Voice’ survey, events and supplier summits – Strategic partnerships – Ongoing dialogue and account management – ‘Customer Voice’ survey – Audits/performance reviews – Sales calls and visits by trade representatives – B2B programmes – Digital B2B eCommerce platforms – Meetings and ongoing dialogue – Submissions to government and advisory committees – Multi-stakeholder partnerships and working groups, such as the ECLT Foundation – External Scientific Panel – Peer-reviewed research – Biodiversity action and pledges ahead of COP 15 summit – Community investment programmes and NGO partnerships – Double Materiality Assessment related engagements •– Productivity/quality/cost – Sustainable agriculture – Farmer livelihoods – Human rights – Health and safety – Climate change impacts – Impact of conflict in Ukraine – Ongoing impacts of COVID-19 – Route-to-market planning – Contingency planning – Cost, price and quality – Stock availability – Consumer buying behaviour – Youth access prevention – Ongoing impacts of COVID-19 – Product regulation – Tax/excise/illicit trade – Responsible marketing – Public health impacts – Human rights – Climate change impacts – Ongoing impacts of COVID-19 – Supplier Code of Conduct – Thrive sustainable agriculture and farmer livelihoods programme – Leaf operational standards for PPE and child labour prevention – Farmer Extension Services support and training – Ongoing COVID-19 support – Customer loyalty programmes and incentives – Global Youth Access Prevention (YAP) Guidelines and initiatives – Ongoing COVID-19 support – Standards of Business Conduct (SoBC) – Delivery with Integrity programme – Carbon neutrality target for 2030 and Net Zero target for 2050 – Human rights and climate impact assessments – Community investment programmes and charitable donations – Ongoing COVID-19 support – Geopolitical tensions – Inability to develop, commercialise and deliver the New Categories strategy – Solvency and liquidity – Climate and circularity – Competition from illicit trade – Geopolitical tensions – Significant increases or structural changes in tobacco, nicotine and New Categories related taxes – Inability to develop, commercialise and deliver the New Categories strategy – Climate and circularity – Competition from illicit trade – Geopolitical tensions – Tobacco, New Categories and other regulation interrupts growth strategy – Significant increases or structural changes in tobacco, nicotine and New Categories related taxes – Inability to develop, commercialise and deliver the New Categories Strategy BAT Annual Report and Form 20-F 2022 Strategic Report Governance Report Financial Statements Other Information Listening to our stakeholders helps us better understand their views and concerns, and enables us to respond to them appropriately. It gives us valuable inputs to, and feedback on, our strategic approach, as well as our policies, procedures and ways of working. 21
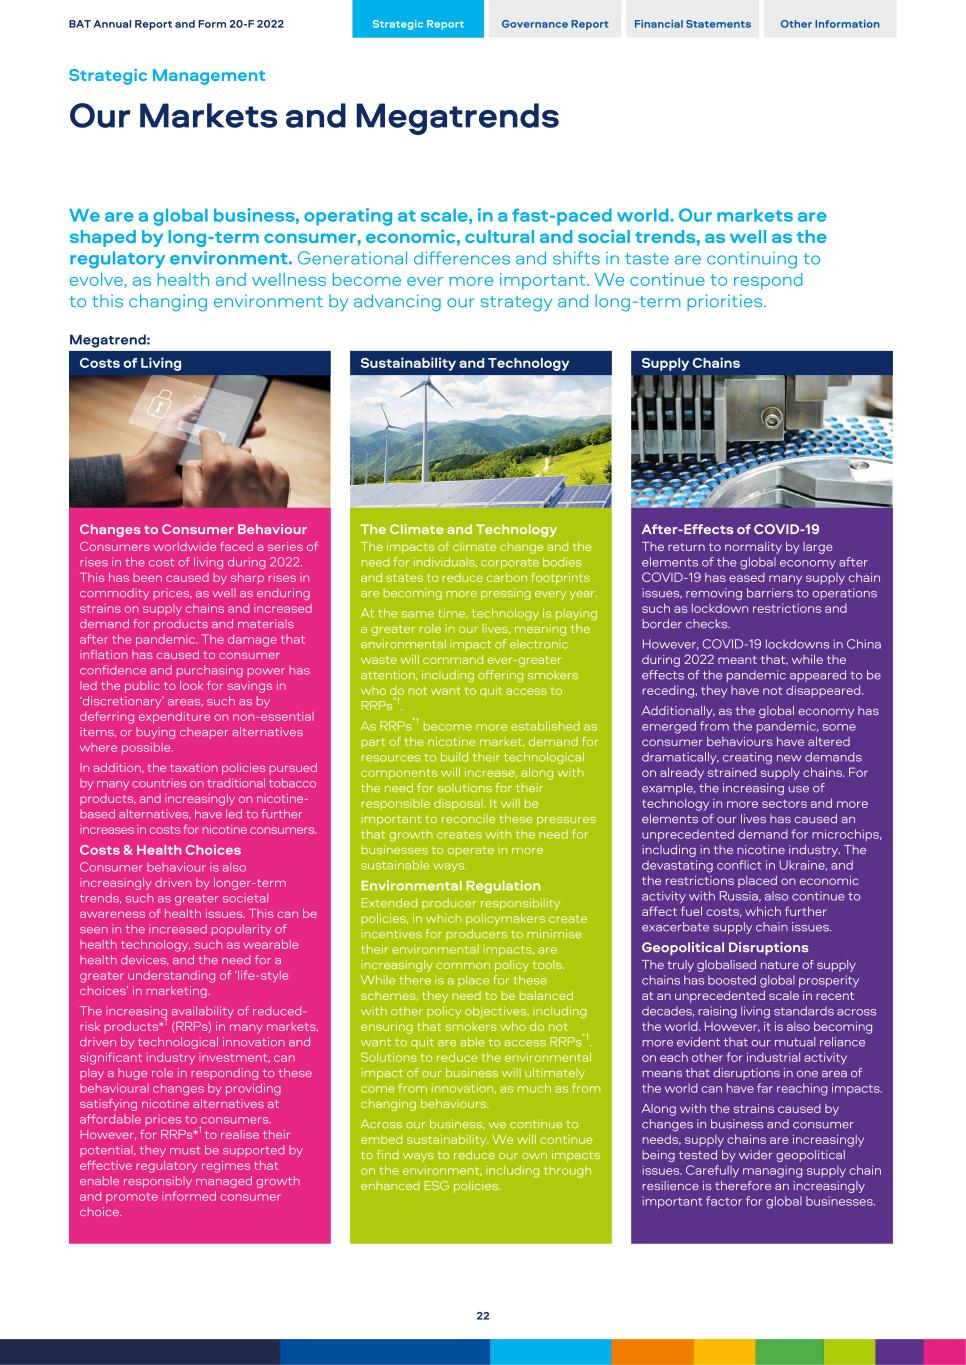
We are a global business, operating at scale, in a fast-paced world. Our markets are shaped by long-term consumer, economic, cultural and social trends, as well as the regulatory environment. Generational differences and shifts in taste are continuing to evolve, as health and wellness become ever more important. We continue to respond to this changing environment by advancing our strategy and long-term priorities. Megatrend: Costs of Living Sustainability and Technology Supply Chains Changes to Consumer Behaviour Consumers worldwide faced a series of rises in the cost of living during 2022. This has been caused by sharp rises in commodity prices, as well as enduring strains on supply chains and increased demand for products and materials after the pandemic. The damage that inflation has caused to consumer confidence and purchasing power has led the public to look for savings in ‘discretionary’ areas, such as by deferring expenditure on non-essential items, or buying cheaper alternatives where possible. In addition, the taxation policies pursued by many countries on traditional tobacco products, and increasingly on nicotine- based alternatives, have led to further increases in costs for nicotine consumers. Costs & Health Choices Consumer behaviour is also increasingly driven by longer-term trends, such as greater societal awareness of health issues. This can be seen in the increased popularity of health technology, such as wearable health devices, and the need for a greater understanding of ‘life-style choices’ in marketing. The increasing availability of reduced- risk products*† (RRPs) in many markets, driven by technological innovation and significant industry investment, can play a huge role in responding to these behavioural changes by providing satisfying nicotine alternatives at affordable prices to consumers. However, for RRPs*† to realise their potential, they must be supported by effective regulatory regimes that enable responsibly managed growth and promote informed consumer choice. The Climate and Technology The impacts of climate change and the need for individuals, corporate bodies and states to reduce carbon footprints are becoming more pressing every year. At the same time, technology is playing a greater role in our lives, meaning the environmental impact of electronic waste will command ever-greater attention, including offering smokers who do not want to quit access to RRPs*†. As RRPs*† become more established as part of the nicotine market, demand for resources to build their technological components will increase, along with the need for solutions for their responsible disposal. It will be important to reconcile these pressures that growth creates with the need for businesses to operate in more sustainable ways. Environmental Regulation Extended producer responsibility policies, in which policymakers create incentives for producers to minimise their environmental impacts, are increasingly common policy tools. While there is a place for these schemes, they need to be balanced with other policy objectives, including ensuring that smokers who do not want to quit are able to access RRPs*†. Solutions to reduce the environmental impact of our business will ultimately come from innovation, as much as from changing behaviours. Across our business, we continue to embed sustainability. We will continue to find ways to reduce our own impacts on the environment, including through enhanced ESG policies. After-Effects of COVID-19 The return to normality by large elements of the global economy after COVID-19 has eased many supply chain issues, removing barriers to operations such as lockdown restrictions and border checks. However, COVID-19 lockdowns in China during 2022 meant that, while the effects of the pandemic appeared to be receding, they have not disappeared. Additionally, as the global economy has emerged from the pandemic, some consumer behaviours have altered dramatically, creating new demands on already strained supply chains. For example, the increasing use of technology in more sectors and more elements of our lives has caused an unprecedented demand for microchips, including in the nicotine industry. The devastating conflict in Ukraine, and the restrictions placed on economic activity with Russia, also continue to affect fuel costs, which further exacerbate supply chain issues. Geopolitical Disruptions The truly globalised nature of supply chains has boosted global prosperity at an unprecedented scale in recent decades, raising living standards across the world. However, it is also becoming more evident that our mutual reliance on each other for industrial activity means that disruptions in one area of the world can have far reaching impacts. Along with the strains caused by changes in business and consumer needs, supply chains are increasingly being tested by wider geopolitical issues. Carefully managing supply chain resilience is therefore an increasingly important factor for global businesses. BAT Annual Report and Form 20-F 2022 Strategic Report Governance Report Financial Statements Other Information Strategic Management Our Markets and Megatrends 22
Overview The modern nicotine market is evolving to increasingly comprise a wider range of products which cater to a broader set of consumer tastes and needs. As a result, traditional tobacco products, along with new nicotine products, such as Vapour, THP and Modern Oral, meet the needs of more than a billion consumers globally. Global Combustible Market The most recent sales data for the legal global tobacco market indicated that it was worth approximately US$935 billion. Combustible cigarettes were the largest product category within the market, representing 83% of the total value of tobacco sales worldwide and with over 2.8 billion cigarettes consumed (excl. China). This amounts to a cigarette market with a global value of US$518 billion (excl. China). The value of the global Non-Combustible products market stands at some US$68 billion. 18% of the world’s adult population (incl. China) still choose to smoke. Having remained broadly stable for a number of years, this figure indicates that a very sizable proportion of the global population is likely to continue to smoke unless they are offered suitable, Non-Combustible, alternatives. While the regulation of combustibles and changes in societal attitudes have contributed to declines in smoking prevalence in many countries, research is also increasingly attributing reductions in cigarette smoking to the uptake of RRPs*† among smokers, for example in Japan. The illicit market With the end of mobility restrictions in most jurisdictions after the pandemic, the size of the illicit tobacco market appears to be growing again. Illicit volumes are forecast to approach 14% of all sales by 2026, compared with 12.6% (excl. China) in 2021. The tragic conflict in Ukraine has also had a destabilising impact on the market, leading to a dramatic rise in the illegal segment of the tobacco market in that part of the world: a quarter of Russians have switched to illegal cigarettes, according to some surveys. Within the European Union, a 2021 KPMG report noted that illicit cigarette consumption was estimated to have increased by 3.9% vs 2020. Price differentials between markets, regulatory changes and broader macro- economic pressures have the potential to exacerbate the problem. It is generally accepted that there is a direct correlation between steep and/or ad hoc increases in taxes and illicit sales. Global combustible regulation Combustible tobacco products are among the most highly regulated consumer products in the world. To date, legislators have focused on the introduction of demand-side regulatory measures. This has included plain packaging, product- specific regulations, graphic health warnings on packs, tougher restrictions on smoking in enclosed public places, bans on shops displaying tobacco products at the point of sale and restrictions on flavourings in tobacco. While regulation is in many cases driven by global agreements on tobacco product regulation, it varies considerably from market to market. In recent years, numerous countries have committed to smoke-free targets, setting a date by which they expect to reduce or contain the prevalence of tobacco use to less than 5%. An example of this is in New Zealand where, as part of their plan to achieve their smoke-free target by 2025, the Parliament in December 2022 passed a bill to ban “the sale of smoked tobacco products to anyone born on or after 1 January 2009”. Environmental concerns regarding litter associated with cigarette consumption have also led to an increased number of policy initiatives. The EU’s Single-Use Plastics legislation has led the way by requiring EU Member States to introduce extended producer responsibility schemes for, amongst other things, cigarette filters. Global New Categories Market Technology and innovation continue to revolutionise the nicotine market. Non- Combustible products offer consumers less risky*† but compelling alternatives to cigarettes. These products include Vapour products, THPs and Modern Oral nicotine pouches. These can deliver nicotine without the process of combustion and are increasingly popular among smokers who are looking for alternatives to smoking but do not want to give up nicotine consumption completely. Evidence of this shift can be seen in global revenues from these products, which are estimated to comprise US$55 billion for Vapour products, THPs and nicotine pouches, an increase from US$43 billion in 2020. The most recent external estimates value the Vapour product market at US$23 billion, with THPs valued at US$29 billion and Modern Oral estimated to be worth US$3 billion. Nicotine pouches, the newest innovation in RRPs*†, are expected to achieve the fastest rate of growth among new nicotine products between 2021 and 2026, with some estimates projecting 500% growth in market value within that timeframe. New Categories regulations Globally, while the RRP*† market is becoming more established, regulation of the sector is still developing. In some cases, the role that RRPs*† can play in reducing the harms from smoking has been embraced by regulators, such as in the UK, New Zealand and Canada. These markets have aimed to communicate to consumers that RRPs are better alternatives*† to smoking and have regulated these products accordingly, while at the same time being mindful of the need to prevent usage by youth. Other markets, however, have not yet been convinced of the public health benefits that RRPs*† could provide and have sought instead to limit access to them, such as in Australia, Brazil and India, where sales of RRPs*† are currently banned. Some markets have also inadvertently confused nicotine consumers by seeking to treat the products in the same way as combustibles. Public policy will play an important role in how RRPs*† are perceived among nicotine consumers, impacting their uptake and success, making this debate of increasing importance as the RRP*† market develops. Other developments The emerging and rapidly growing market for wellbeing products is expected to continue to grow. One such market, cannabidiol (CBD), is expected to gain wider use, as evidenced by its recent growth in market size and the increase in governments considering potential legalisation of its recreational use. Some markets, such as Germany and the Czech Republic, are also re-examining the merits of maintaining their current prohibitionist stances on cannabis, in response to projected increases in adults using the black market to procure these products. See pages 116 to 121 to read more about our Group Principal Risks Notes: All data sources on this page are from Euromonitor International research published in 2022 and based on 2021 data (the latest full year available), unless otherwise stated. * Based on the weight of evidence and assuming a complete switch from cigarette smoking. These products are not risk free and are addictive. † Our Vapour product Vuse (including Alto, Solo, Ciro and Vibe), and certain products including Velo, Grizzly, Kodiak, and Camel Snus, which are sold in the U.S., are subject to FDA regulation and no reduced-risk claims will be made as to these products without agency clearance. For further discussion regarding the regulation of our business, please see pages 362 to 366 BAT Annual Report and Form 20-F 2022 Strategic Report Governance Report Financial Statements Other Information 23

Our Mission Stimulating the Senses of New Adult Generations Today, we see opportunities to capture consumer moments which have, over time, become limited by societal and regulatory shifts, and to satisfy evolving consumer needs and preferences. Our mission is to anticipate and satisfy this ever-evolving consumer: provide pleasure, reduce risk, increase choice and stimulate the senses of adult consumers worldwide. We made great progress on our strategic targets in 2022. As part of our growth strategy, New Category revenue grew 41% and we now have a total of 22.5 million consumers of our Non-Combustible products (up 4.2 million). Kingsley Wheaton Chief Growth Officer Must Wins High Growth Segments Driven by our unique and data-driven consumer insight platform (PRISM), we will focus on product categories and consumer segments across our global business that have the best potential for long-term sustainable growth. Priority Markets By relying on a rigorous market prioritisation system (MAPS), we will focus the strengths of our unparalleled retail and marketing reach, as well as our regulatory and scientific expertise, on those markets and marketplaces with the greatest opportunities for growth. Notes: * Based on the weight of evidence and assuming a complete switch from cigarette smoking. These products are not risk free and are addictive. † Our Vapour product Vuse (including Alto, Solo, Ciro and Vibe), and certain products, including Velo, Grizzly, Kodiak, and Camel Snus, which are sold in the U.S., are subject to FDA regulation and no reduced-risk claims will be made as to these products without agency clearance. How We Win Inspirational Foresights Built on our successful history, we have a unique view of the consumer across all of our product categories, which is increasingly driven by powerful data and analytics. These insights ensure that the development and responsible marketing of our products are fit to satisfy consumer needs. Remarkable Innovation As consumer preferences and technology evolve rapidly, we rely on our growing global network of digital hubs, innovation super centres, world-class R&D laboratories, external partnerships and our corporate venturing initiative to stay ahead of the curve. Powerful Brands For over a century, we have built trusted and powerful brands that satisfy our consumers and serve as a promise for quality and enjoyment. We will build the brands of the future by focusing on fewer, stronger and global brands across all our product categories, delivered through our deep understanding and segmenting of our consumers. BAT Annual Report and Form 20-F 2022 Strategic Report Governance Report Financial Statements Other Information Strategic Management A Strategy for Accelerated Growth In 2022, 15% of Group revenue was from non-combustible products. This was achieved through a multi-category approach which is the very essence of our purpose to build A Better Tomorrow™ – providing adult consumers with a range of enjoyable and less risky*† choices for every mood and moment. 24
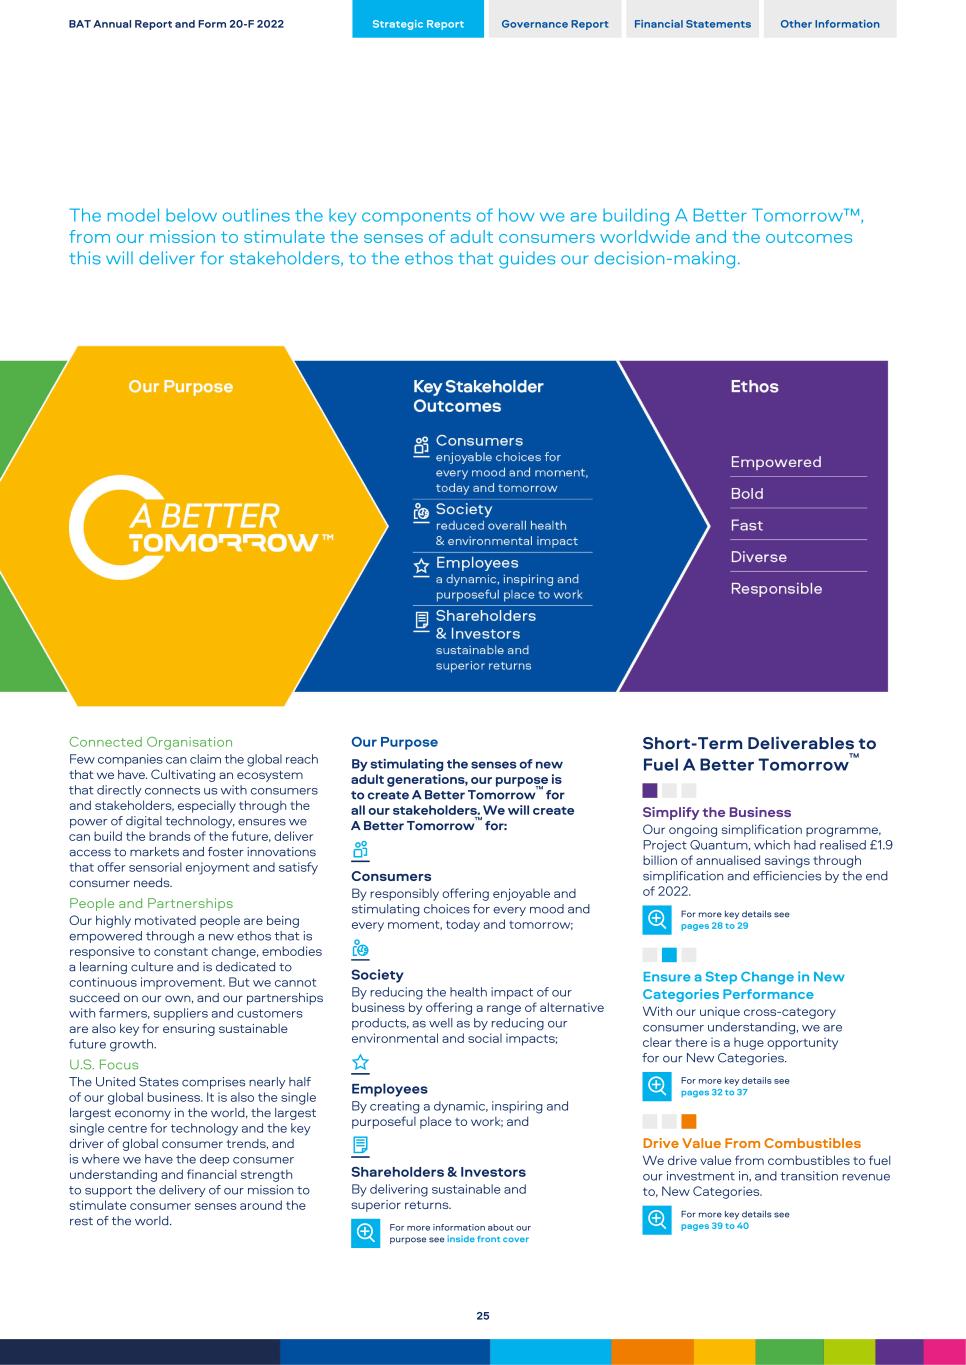
Connected Organisation Few companies can claim the global reach that we have. Cultivating an ecosystem that directly connects us with consumers and stakeholders, especially through the power of digital technology, ensures we can build the brands of the future, deliver access to markets and foster innovations that offer sensorial enjoyment and satisfy consumer needs. People and Partnerships Our highly motivated people are being empowered through a new ethos that is responsive to constant change, embodies a learning culture and is dedicated to continuous improvement. But we cannot succeed on our own, and our partnerships with farmers, suppliers and customers are also key for ensuring sustainable future growth. U.S. Focus The United States comprises nearly half of our global business. It is also the single largest economy in the world, the largest single centre for technology and the key driver of global consumer trends, and is where we have the deep consumer understanding and financial strength to support the delivery of our mission to stimulate consumer senses around the rest of the world. Our Purpose By stimulating the senses of new adult generations, our purpose is to create A Better Tomorrow™ for all our stakeholders. We will create A Better Tomorrow™ for: Consumers By responsibly offering enjoyable and stimulating choices for every mood and every moment, today and tomorrow; Society By reducing the health impact of our business by offering a range of alternative products, as well as by reducing our environmental and social impacts; Employees By creating a dynamic, inspiring and purposeful place to work; and Shareholders & Investors By delivering sustainable and superior returns. For more information about our purpose see inside front cover Short-Term Deliverables to Fuel A Better Tomorrow™ Simplify the Business Our ongoing simplification programme, Project Quantum, which had realised £1.9 billion of annualised savings through simplification and efficiencies by the end of 2022. For more key details see pages 28 to 29 Ensure a Step Change in New Categories Performance With our unique cross-category consumer understanding, we are clear there is a huge opportunity for our New Categories. For more key details see pages 32 to 37 Drive Value From Combustibles We drive value from combustibles to fuel our investment in, and transition revenue to, New Categories. For more key details see pages 39 to 40 BAT Annual Report and Form 20-F 2022 Strategic Report Governance Report Financial Statements Other Information The model below outlines the key components of how we are building A Better Tomorrow™, from our mission to stimulate the senses of adult consumers worldwide and the outcomes this will deliver for stakeholders, to the ethos that guides our decision-making. 25
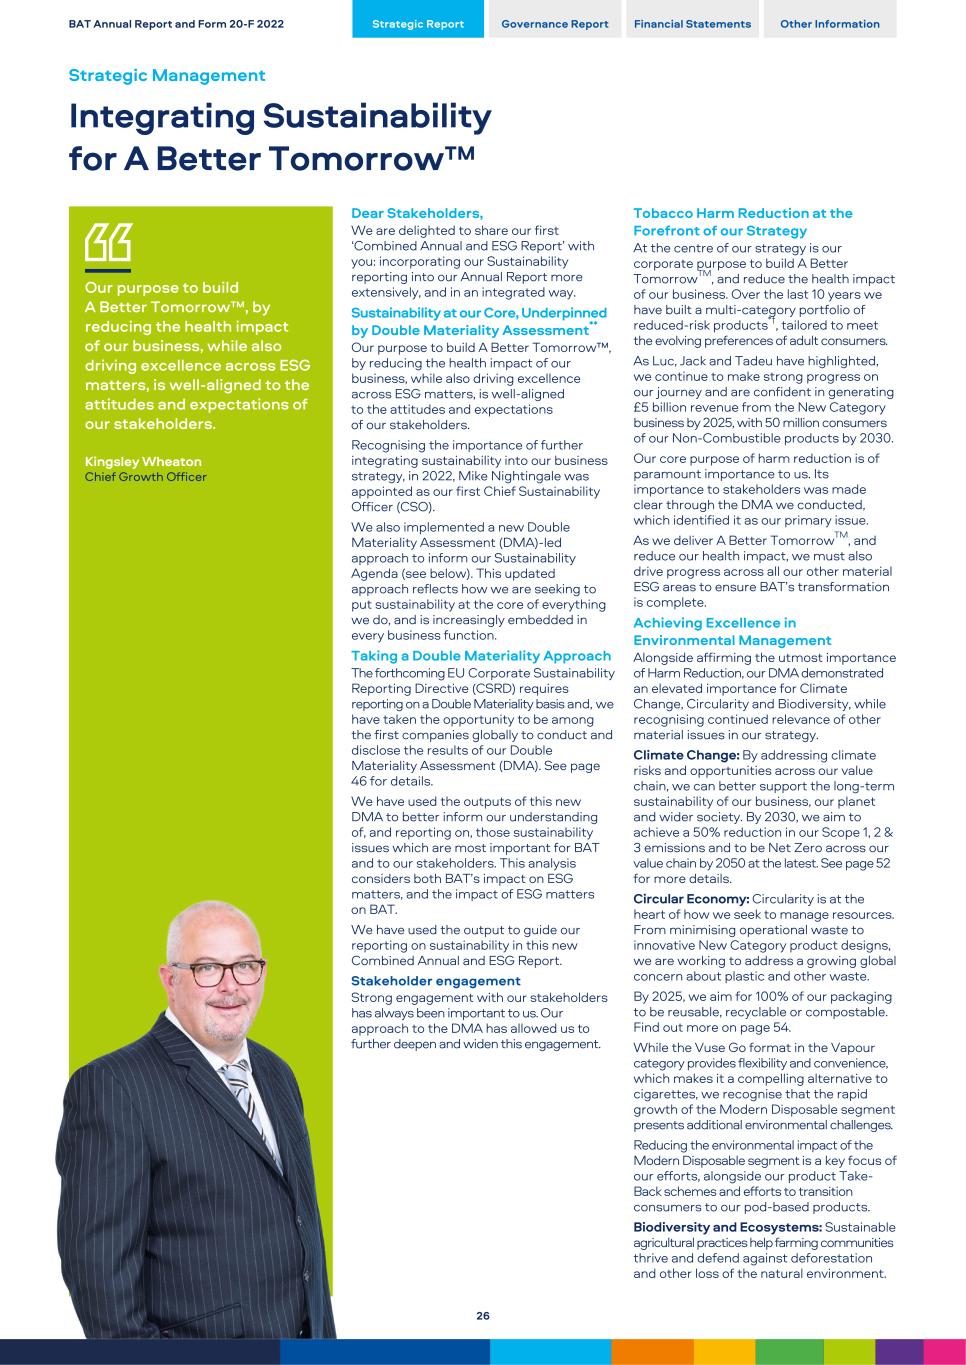
Our purpose to build A Better Tomorrow™, by reducing the health impact of our business, while also driving excellence across ESG matters, is well-aligned to the attitudes and expectations of our stakeholders. Kingsley Wheaton Chief Growth Officer Dear Stakeholders, We are delighted to share our first ‘Combined Annual and ESG Report’ with you: incorporating our Sustainability reporting into our Annual Report more extensively, and in an integrated way. Sustainability at our Core, Underpinned by Double Materiality Assessment** Our purpose to build A Better Tomorrow™, by reducing the health impact of our business, while also driving excellence across ESG matters, is well-aligned to the attitudes and expectations of our stakeholders. Recognising the importance of further integrating sustainability into our business strategy, in 2022, Mike Nightingale was appointed as our first Chief Sustainability Officer (CSO). We also implemented a new Double Materiality Assessment (DMA)-led approach to inform our Sustainability Agenda (see below). This updated approach reflects how we are seeking to put sustainability at the core of everything we do, and is increasingly embedded in every business function. Taking a Double Materiality Approach The forthcoming EU Corporate Sustainability Reporting Directive (CSRD) requires reporting on a Double Materiality basis and, we have taken the opportunity to be among the first companies globally to conduct and disclose the results of our Double Materiality Assessment (DMA). See page 46 for details. We have used the outputs of this new DMA to better inform our understanding of, and reporting on, those sustainability issues which are most important for BAT and to our stakeholders. This analysis considers both BAT’s impact on ESG matters, and the impact of ESG matters on BAT. We have used the output to guide our reporting on sustainability in this new Combined Annual and ESG Report. Stakeholder engagement Strong engagement with our stakeholders has always been important to us. Our approach to the DMA has allowed us to further deepen and widen this engagement. Tobacco Harm Reduction at the Forefront of our Strategy At the centre of our strategy is our corporate purpose to build A Better TomorrowTM, and reduce the health impact of our business. Over the last 10 years we have built a multi-category portfolio of reduced-risk products*†, tailored to meet the evolving preferences of adult consumers. As Luc, Jack and Tadeu have highlighted, we continue to make strong progress on our journey and are confident in generating £5 billion revenue from the New Category business by 2025, with 50 million consumers of our Non-Combustible products by 2030. Our core purpose of harm reduction is of paramount importance to us. Its importance to stakeholders was made clear through the DMA we conducted, which identified it as our primary issue. As we deliver A Better TomorrowTM, and reduce our health impact, we must also drive progress across all our other material ESG areas to ensure BAT’s transformation is complete. Achieving Excellence in Environmental Management Alongside affirming the utmost importance of Harm Reduction, our DMA demonstrated an elevated importance for Climate Change, Circularity and Biodiversity, while recognising continued relevance of other material issues in our strategy. Climate Change: By addressing climate risks and opportunities across our value chain, we can better support the long-term sustainability of our business, our planet and wider society. By 2030, we aim to achieve a 50% reduction in our Scope 1, 2 & 3 emissions and to be Net Zero across our value chain by 2050 at the latest. See page 52 for more details. Circular Economy: Circularity is at the heart of how we seek to manage resources. From minimising operational waste to innovative New Category product designs, we are working to address a growing global concern about plastic and other waste. By 2025, we aim for 100% of our packaging to be reusable, recyclable or compostable. Find out more on page 54. While the Vuse Go format in the Vapour category provides flexibility and convenience, which makes it a compelling alternative to cigarettes, we recognise that the rapid growth of the Modern Disposable segment presents additional environmental challenges. Reducing the environmental impact of the Modern Disposable segment is a key focus of our efforts, alongside our product Take- Back schemes and efforts to transition consumers to our pod-based products. Biodiversity and Ecosystems: Sustainable agricultural practices help farming communities thrive and defend against deforestation and other loss of the natural environment. BAT Annual Report and Form 20-F 2022 Strategic Report Governance Report Financial Statements Other Information Strategic Management Integrating Sustainability for A Better Tomorrow™ 26
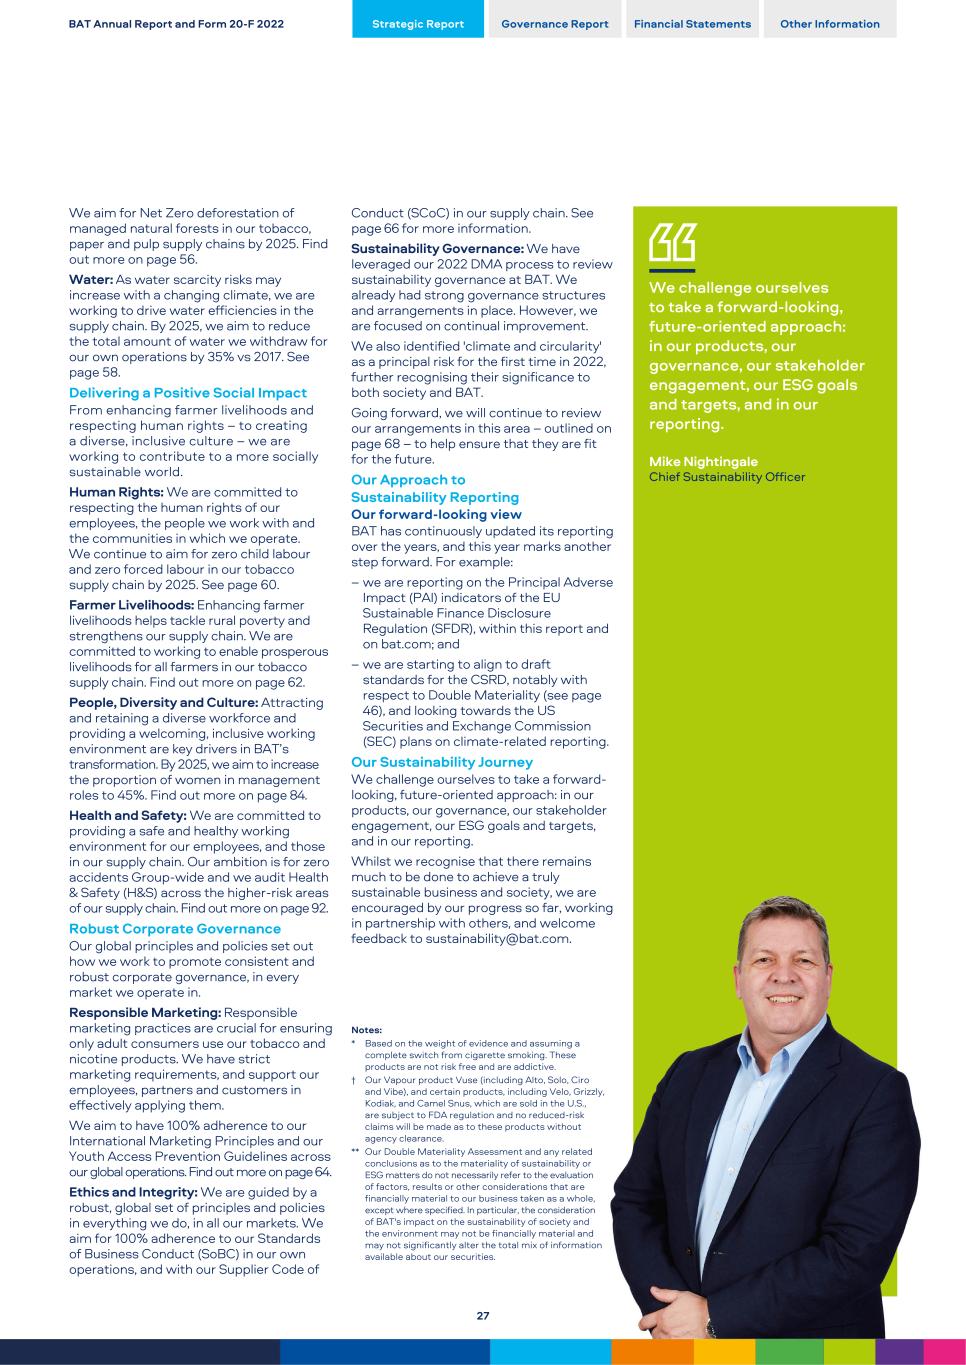
We aim for Net Zero deforestation of managed natural forests in our tobacco, paper and pulp supply chains by 2025. Find out more on page 56. Water: As water scarcity risks may increase with a changing climate, we are working to drive water efficiencies in the supply chain. By 2025, we aim to reduce the total amount of water we withdraw for our own operations by 35% vs 2017. See page 58. Delivering a Positive Social Impact From enhancing farmer livelihoods and respecting human rights – to creating a diverse, inclusive culture – we are working to contribute to a more socially sustainable world. Human Rights: We are committed to respecting the human rights of our employees, the people we work with and the communities in which we operate. We continue to aim for zero child labour and zero forced labour in our tobacco supply chain by 2025. See page 60. Farmer Livelihoods: Enhancing farmer livelihoods helps tackle rural poverty and strengthens our supply chain. We are committed to working to enable prosperous livelihoods for all farmers in our tobacco supply chain. Find out more on page 62. People, Diversity and Culture: Attracting and retaining a diverse workforce and providing a welcoming, inclusive working environment are key drivers in BAT’s transformation. By 2025, we aim to increase the proportion of women in management roles to 45%. Find out more on page 84. Health and Safety: We are committed to providing a safe and healthy working environment for our employees, and those in our supply chain. Our ambition is for zero accidents Group-wide and we audit Health & Safety (H&S) across the higher-risk areas of our supply chain. Find out more on page 92. Robust Corporate Governance Our global principles and policies set out how we work to promote consistent and robust corporate governance, in every market we operate in. Responsible Marketing: Responsible marketing practices are crucial for ensuring only adult consumers use our tobacco and nicotine products. We have strict marketing requirements, and support our employees, partners and customers in effectively applying them. We aim to have 100% adherence to our International Marketing Principles and our Youth Access Prevention Guidelines across our global operations. Find out more on page 64. Ethics and Integrity: We are guided by a robust, global set of principles and policies in everything we do, in all our markets. We aim for 100% adherence to our Standards of Business Conduct (SoBC) in our own operations, and with our Supplier Code of Conduct (SCoC) in our supply chain. See page 66 for more information. Sustainability Governance: We have leveraged our 2022 DMA process to review sustainability governance at BAT. We already had strong governance structures and arrangements in place. However, we are focused on continual improvement. We also identified 'climate and circularity' as a principal risk for the first time in 2022, further recognising their significance to both society and BAT. Going forward, we will continue to review our arrangements in this area – outlined on page 68 – to help ensure that they are fit for the future. Our Approach to Sustainability Reporting Our forward-looking view BAT has continuously updated its reporting over the years, and this year marks another step forward. For example: – we are reporting on the Principal Adverse Impact (PAI) indicators of the EU Sustainable Finance Disclosure Regulation (SFDR), within this report and on bat.com; and – we are starting to align to draft standards for the CSRD, notably with respect to Double Materiality (see page 46), and looking towards the US Securities and Exchange Commission (SEC) plans on climate-related reporting. Our Sustainability Journey We challenge ourselves to take a forward- looking, future-oriented approach: in our products, our governance, our stakeholder engagement, our ESG goals and targets, and in our reporting. Whilst we recognise that there remains much to be done to achieve a truly sustainable business and society, we are encouraged by our progress so far, working in partnership with others, and welcome feedback to sustainability@bat.com. Notes: * Based on the weight of evidence and assuming a complete switch from cigarette smoking. These products are not risk free and are addictive. † Our Vapour product Vuse (including Alto, Solo, Ciro and Vibe), and certain products, including Velo, Grizzly, Kodiak, and Camel Snus, which are sold in the U.S., are subject to FDA regulation and no reduced-risk claims will be made as to these products without agency clearance. ** Our Double Materiality Assessment and any related conclusions as to the materiality of sustainability or ESG matters do not necessarily refer to the evaluation of factors, results or other considerations that are financially material to our business taken as a whole, except where specified. In particular, the consideration of BAT's impact on the sustainability of society and the environment may not be financially material and may not significantly alter the total mix of information available about our securities. We challenge ourselves to take a forward-looking, future-oriented approach: in our products, our governance, our stakeholder engagement, our ESG goals and targets, and in our reporting. Mike Nightingale Chief Sustainability Officer BAT Annual Report and Form 20-F 2022 Strategic Report Governance Report Financial Statements Other Information 27
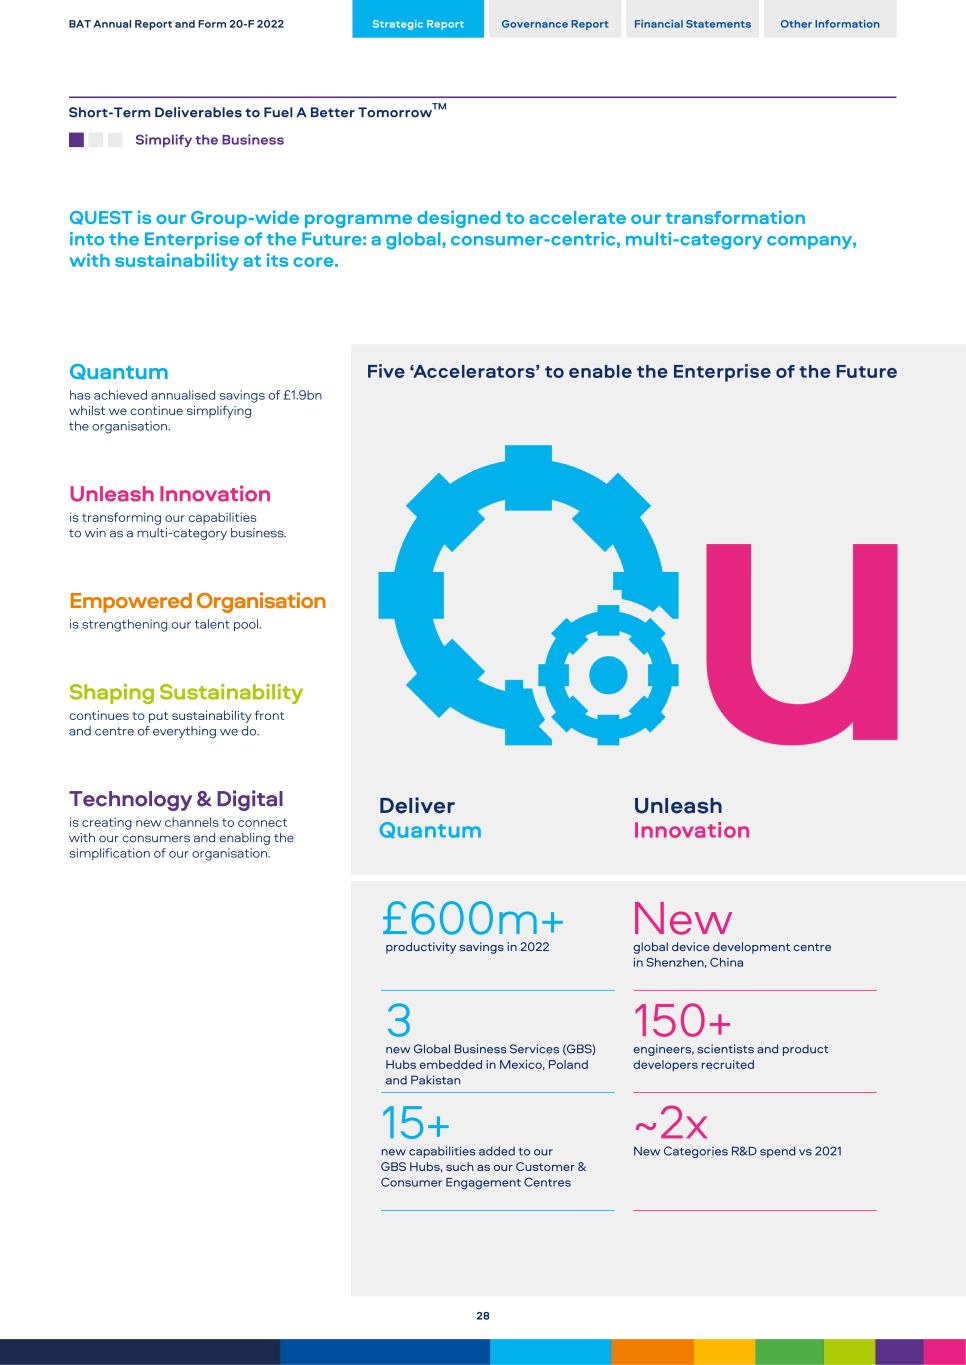
Quantum has achieved annualised savings of £1.9bn whilst we continue simplifying the organisation. Unleash Innovation is transforming our capabilities to win as a multi-category business. Empowered Organisation is strengthening our talent pool. Shaping Sustainability continues to put sustainability front and centre of everything we do. Technology & Digital is creating new channels to connect with our consumers and enabling the simplification of our organisation. £600m+ productivity savings in 2022 3 new Global Business Services (GBS) Hubs embedded in Mexico, Poland and Pakistan 15+ new capabilities added to our GBS Hubs, such as our Customer & Consumer Engagement Centres New global device development centre in Shenzhen, China 150+ engineers, scientists and product developers recruited ~2x New Categories R&D spend vs 2021 BAT Annual Report and Form 20-F 2022 Strategic Report Governance Report Financial Statements Other Information Short-Term Deliverables to Fuel A Better TomorrowTM Simplify the Business QUEST is our Group-wide programme designed to accelerate our transformation into the Enterprise of the Future: a global, consumer-centric, multi-category company, with sustainability at its core. 28
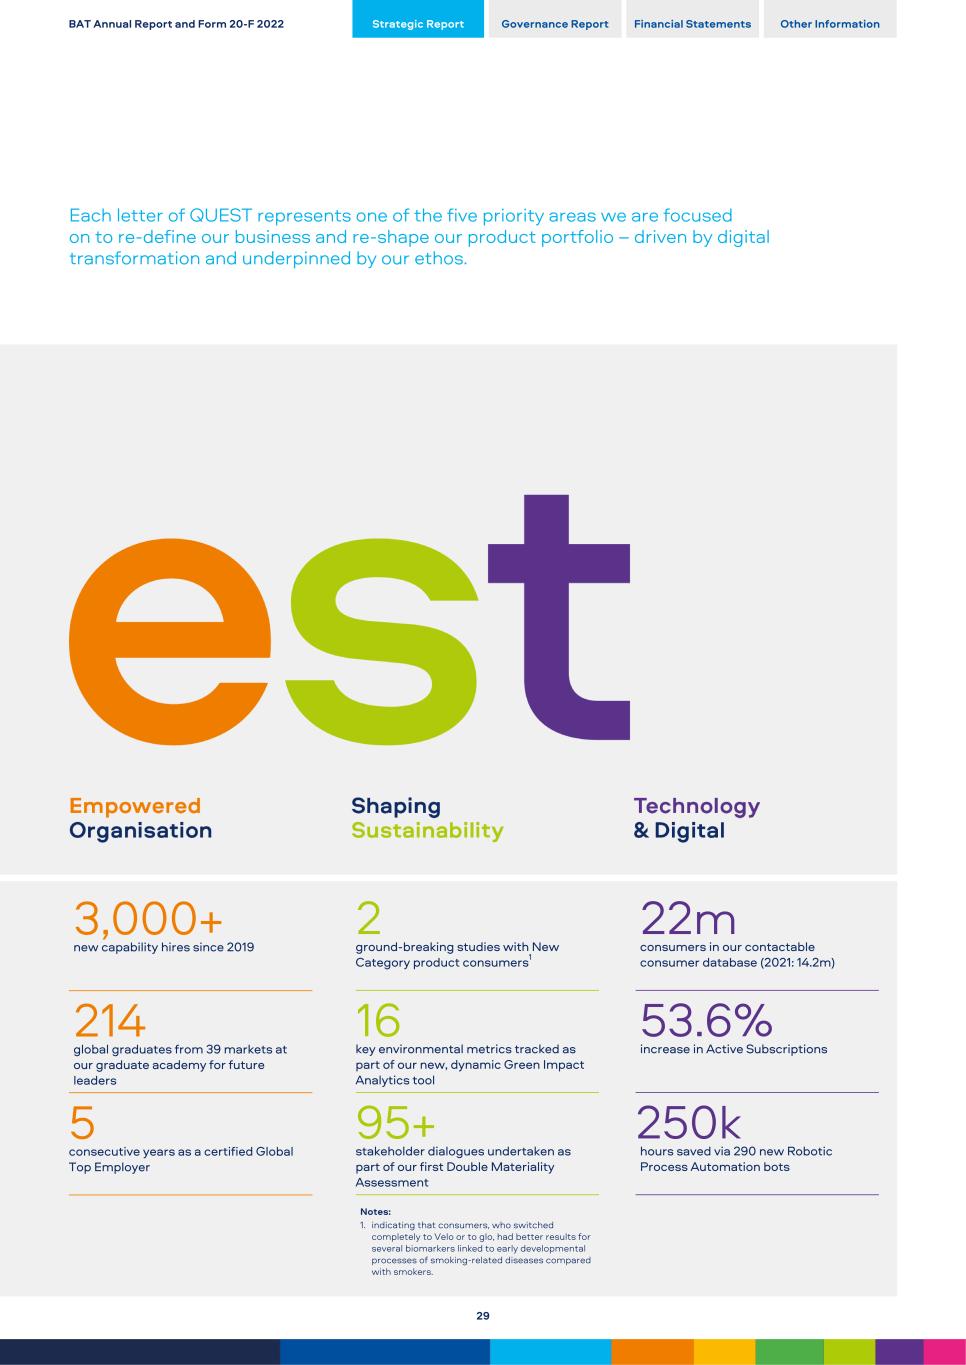
3,000+ new capability hires since 2019 214 global graduates from 39 markets at our graduate academy for future leaders 5 consecutive years as a certified Global Top Employer 2 ground-breaking studies with New Category product consumers1 16 key environmental metrics tracked as part of our new, dynamic Green Impact Analytics tool 95+ stakeholder dialogues undertaken as part of our first Double Materiality Assessment Notes: 1. indicating that consumers, who switched completely to Velo or to glo, had better results for several biomarkers linked to early developmental processes of smoking-related diseases compared with smokers. 22m consumers in our contactable consumer database (2021: 14.2m) 53.6% increase in Active Subscriptions 250k hours saved via 290 new Robotic Process Automation bots BAT Annual Report and Form 20-F 2022 Strategic Report Governance Report Financial Statements Other Information Each letter of QUEST represents one of the five priority areas we are focused on to re-define our business and re-shape our product portfolio – driven by digital transformation and underpinned by our ethos. 29

For Consumers BAT Annual Report and Form 20-F 2022 Strategic Report Governance Report Financial Statements Other Information 30
We are enabling consumer choice We prioritise product quality We market and communicate responsibly We are building brands with purpose Multi-Category +150 Peer-Reviewed Papers Adult Only 100% Markets portfolio of less risky products*† tailored to meet the evolving preferences of adult consumers published to date on our cutting-edge research into New Category products consumers targeted for all our product marketing, enshrined in our International Marketing Principles (IMP) glo and Vuse markets with Take-Back schemes in place 22.5 Million High Product Standards Digital Confidence Unit 92% of Packaging adult consumers who have already chosen our reduced- risk*† products based on decades of product stewardship experience, which we hope will become industry benchmarks and a basis for future regulation conducting 24/7 monitoring of all BAT digital channels globally for responsible marketing using cutting-edge technology capable of being reused, recyclable or compostable in 2022 New Thousands of Hours of Testing iCommit Training 30% Recycled Plastic Global Device Development Centre in Shenzhen, China, to generate further consumer insights undertaken before our products reach the consumer, in line with our Group Quality Policy Statement to drive IMP and YAP compliance across our digital channels target for average recycled content in plastic packaging by 2025 60 Markets Quality Responsible Flavour <1% to Landfill where our New Category products are available, offering adult smokers greater choice ingredients and clear and accurate product information descriptors for our e-liquids that do not appeal to youth, or are not associated with youth culture target for operating waste going to landfill by 2025 Notes: * Based on the weight of evidence and assuming a complete switch from cigarette smoking. These products are not risk free and are addictive. † Our Vapour product Vuse (including Alto, Solo, Ciro and Vibe), and certain products, including Velo, Grizzly, Kodiak, and Camel Snus, which are sold in the U.S., are subject to FDA regulation and no reduced-risk claims will be made as to these products without agency clearance. Having launched our first Vapour product in 2013, 2022 marked a decade of portfolio transformation. Kingsley Wheaton Chief Growth Officer BAT Annual Report and Form 20-F 2022 Strategic Report Governance Report Financial Statements Other Information A Better Tomorrow™ For Consumers 31
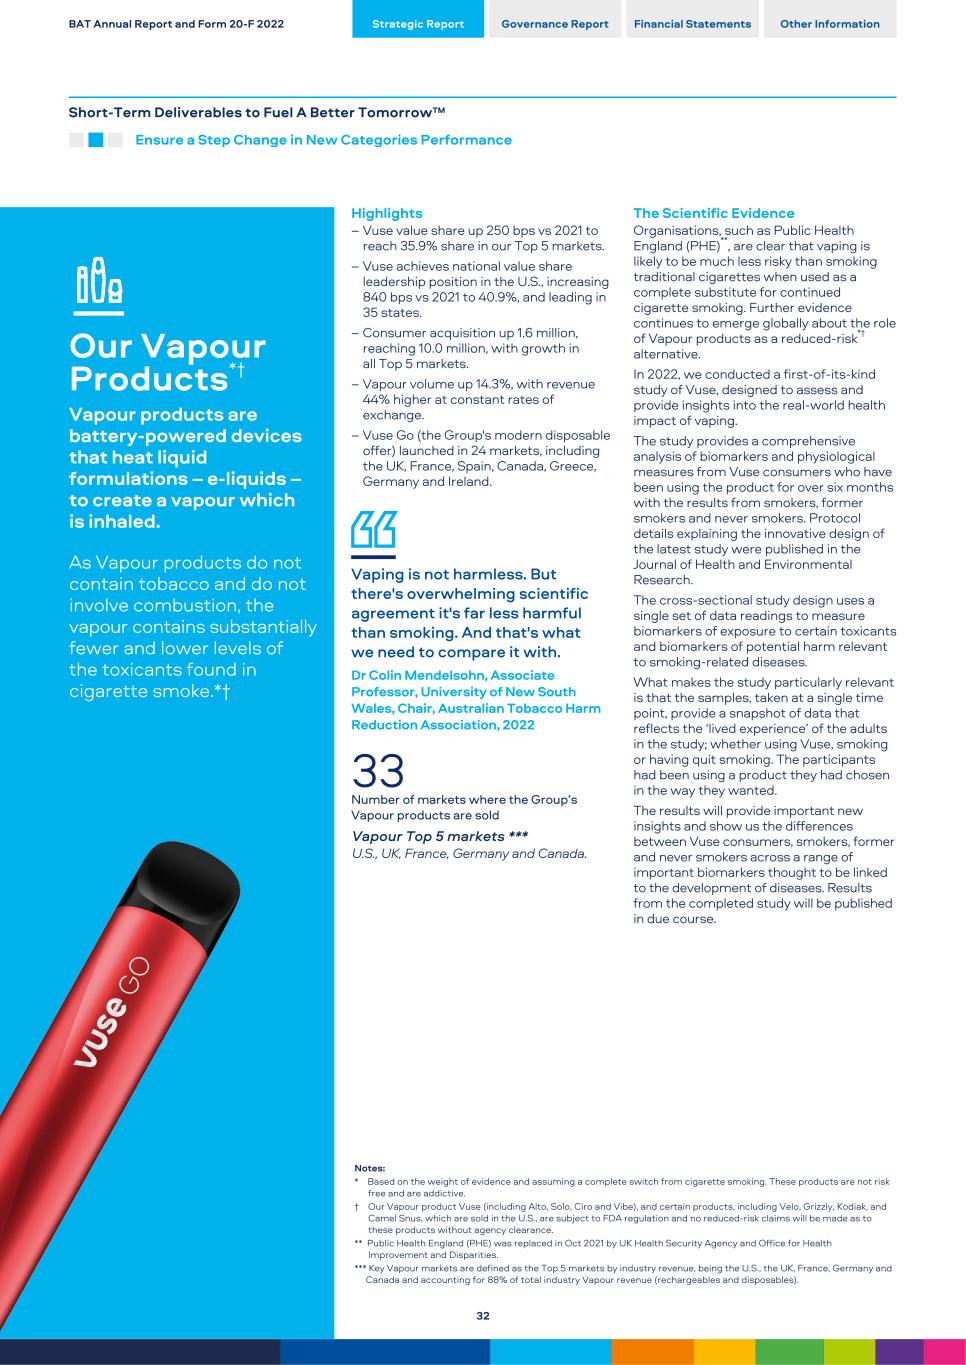
Our Vapour Products*† Vapour products are battery-powered devices that heat liquid formulations – e-liquids – to create a vapour which is inhaled. As Vapour products do not contain tobacco and do not involve combustion, the vapour contains substantially fewer and lower levels of the toxicants found in cigarette smoke.*† Highlights – Vuse value share up 250 bps vs 2021 to reach 35.9% share in our Top 5 markets. – Vuse achieves national value share leadership position in the U.S., increasing 840 bps vs 2021 to 40.9%, and leading in 35 states. – Consumer acquisition up 1.6 million, reaching 10.0 million, with growth in all Top 5 markets. – Vapour volume up 14.3%, with revenue 44% higher at constant rates of exchange. – Vuse Go (the Group's modern disposable offer) launched in 24 markets, including the UK, France, Spain, Canada, Greece, Germany and Ireland. Vaping is not harmless. But there's overwhelming scientific agreement it's far less harmful than smoking. And that's what we need to compare it with. Dr Colin Mendelsohn, Associate Professor, University of New South Wales, Chair, Australian Tobacco Harm Reduction Association, 2022 33 Number of markets where the Group’s Vapour products are sold Vapour Top 5 markets *** U.S., UK, France, Germany and Canada. The Scientific Evidence Organisations, such as Public Health England (PHE)**, are clear that vaping is likely to be much less risky than smoking traditional cigarettes when used as a complete substitute for continued cigarette smoking. Further evidence continues to emerge globally about the role of Vapour products as a reduced-risk*† alternative. In 2022, we conducted a first-of-its-kind study of Vuse, designed to assess and provide insights into the real-world health impact of vaping. The study provides a comprehensive analysis of biomarkers and physiological measures from Vuse consumers who have been using the product for over six months with the results from smokers, former smokers and never smokers. Protocol details explaining the innovative design of the latest study were published in the Journal of Health and Environmental Research. The cross-sectional study design uses a single set of data readings to measure biomarkers of exposure to certain toxicants and biomarkers of potential harm relevant to smoking-related diseases. What makes the study particularly relevant is that the samples, taken at a single time point, provide a snapshot of data that reflects the ‘lived experience’ of the adults in the study; whether using Vuse, smoking or having quit smoking. The participants had been using a product they had chosen in the way they wanted. The results will provide important new insights and show us the differences between Vuse consumers, smokers, former and never smokers across a range of important biomarkers thought to be linked to the development of diseases. Results from the completed study will be published in due course. Notes: * Based on the weight of evidence and assuming a complete switch from cigarette smoking. These products are not risk free and are addictive. † Our Vapour product Vuse (including Alto, Solo, Ciro and Vibe), and certain products, including Velo, Grizzly, Kodiak, and Camel Snus, which are sold in the U.S., are subject to FDA regulation and no reduced-risk claims will be made as to these products without agency clearance. ** Public Health England (PHE) was replaced in Oct 2021 by UK Health Security Agency and Office for Health Improvement and Disparities. *** Key Vapour markets are defined as the Top 5 markets by industry revenue, being the U.S., the UK, France, Germany and Canada and accounting for 88% of total industry Vapour revenue (rechargeables and disposables). BAT Annual Report and Form 20-F 2022 Strategic Report Governance Report Financial Statements Other Information Short-Term Deliverables to Fuel A Better Tomorrow™ Ensure a Step Change in New Categories Performance 32
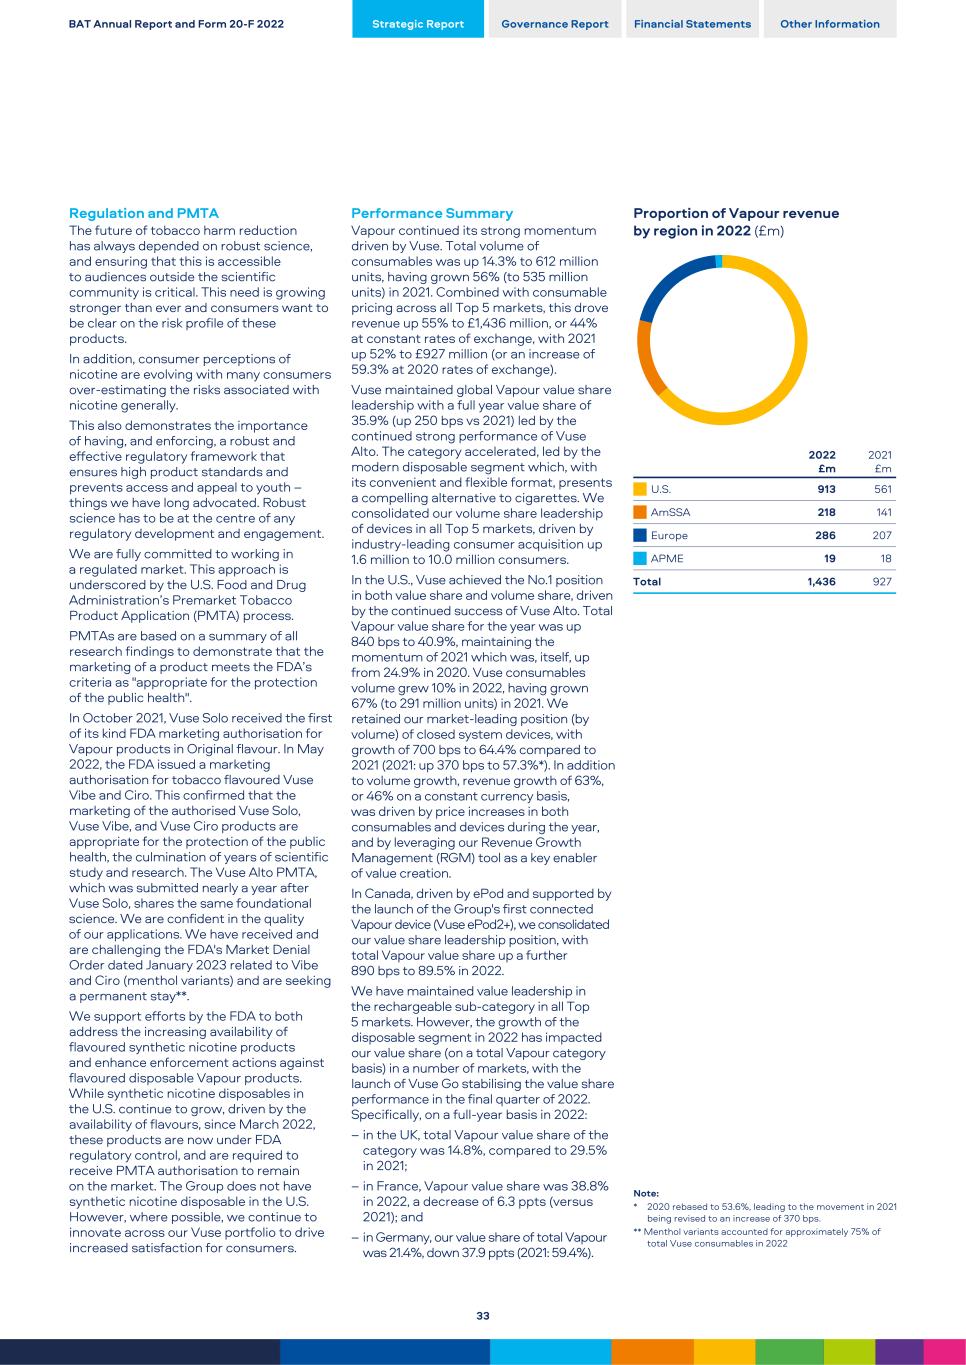
Regulation and PMTA The future of tobacco harm reduction has always depended on robust science, and ensuring that this is accessible to audiences outside the scientific community is critical. This need is growing stronger than ever and consumers want to be clear on the risk profile of these products. In addition, consumer perceptions of nicotine are evolving with many consumers over-estimating the risks associated with nicotine generally. This also demonstrates the importance of having, and enforcing, a robust and effective regulatory framework that ensures high product standards and prevents access and appeal to youth – things we have long advocated. Robust science has to be at the centre of any regulatory development and engagement. We are fully committed to working in a regulated market. This approach is underscored by the U.S. Food and Drug Administration’s Premarket Tobacco Product Application (PMTA) process. PMTAs are based on a summary of all research findings to demonstrate that the marketing of a product meets the FDA’s criteria as "appropriate for the protection of the public health". In October 2021, Vuse Solo received the first of its kind FDA marketing authorisation for Vapour products in Original flavour. In May 2022, the FDA issued a marketing authorisation for tobacco flavoured Vuse Vibe and Ciro. This confirmed that the marketing of the authorised Vuse Solo, Vuse Vibe, and Vuse Ciro products are appropriate for the protection of the public health, the culmination of years of scientific study and research. The Vuse Alto PMTA, which was submitted nearly a year after Vuse Solo, shares the same foundational science. We are confident in the quality of our applications. We have received and are challenging the FDA's Market Denial Order dated January 2023 related to Vibe and Ciro (menthol variants) and are seeking a permanent stay**. We support efforts by the FDA to both address the increasing availability of flavoured synthetic nicotine products and enhance enforcement actions against flavoured disposable Vapour products. While synthetic nicotine disposables in the U.S. continue to grow, driven by the availability of flavours, since March 2022, these products are now under FDA regulatory control, and are required to receive PMTA authorisation to remain on the market. The Group does not have synthetic nicotine disposable in the U.S. However, where possible, we continue to innovate across our Vuse portfolio to drive increased satisfaction for consumers. Performance Summary Vapour continued its strong momentum driven by Vuse. Total volume of consumables was up 14.3% to 612 million units, having grown 56% (to 535 million units) in 2021. Combined with consumable pricing across all Top 5 markets, this drove revenue up 55% to £1,436 million, or 44% at constant rates of exchange, with 2021 up 52% to £927 million (or an increase of 59.3% at 2020 rates of exchange). Vuse maintained global Vapour value share leadership with a full year value share of 35.9% (up 250 bps vs 2021) led by the continued strong performance of Vuse Alto. The category accelerated, led by the modern disposable segment which, with its convenient and flexible format, presents a compelling alternative to cigarettes. We consolidated our volume share leadership of devices in all Top 5 markets, driven by industry-leading consumer acquisition up 1.6 million to 10.0 million consumers. In the U.S., Vuse achieved the No.1 position in both value share and volume share, driven by the continued success of Vuse Alto. Total Vapour value share for the year was up 840 bps to 40.9%, maintaining the momentum of 2021 which was, itself, up from 24.9% in 2020. Vuse consumables volume grew 10% in 2022, having grown 67% (to 291 million units) in 2021. We retained our market-leading position (by volume) of closed system devices, with growth of 700 bps to 64.4% compared to 2021 (2021: up 370 bps to 57.3%*). In addition to volume growth, revenue growth of 63%, or 46% on a constant currency basis, was driven by price increases in both consumables and devices during the year, and by leveraging our Revenue Growth Management (RGM) tool as a key enabler of value creation. In Canada, driven by ePod and supported by the launch of the Group's first connected Vapour device (Vuse ePod2+), we consolidated our value share leadership position, with total Vapour value share up a further 890 bps to 89.5% in 2022. We have maintained value leadership in the rechargeable sub-category in all Top 5 markets. However, the growth of the disposable segment in 2022 has impacted our value share (on a total Vapour category basis) in a number of markets, with the launch of Vuse Go stabilising the value share performance in the final quarter of 2022. Specifically, on a full-year basis in 2022: – in the UK, total Vapour value share of the category was 14.8%, compared to 29.5% in 2021; – in France, Vapour value share was 38.8% in 2022, a decrease of 6.3 ppts (versus 2021); and – in Germany, our value share of total Vapour was 21.4%, down 37.9 ppts (2021: 59.4%). Proportion of Vapour revenue by region in 2022 (£m) 2022 £m 2021 £m U.S. 913 561 AmSSA 218 141 Europe 286 207 APME 19 18 Total 1,436 927 Note: * 2020 rebased to 53.6%, leading to the movement in 2021 being revised to an increase of 370 bps. ** Menthol variants accounted for approximately 75% of total Vuse consumables in 2022 BAT Annual Report and Form 20-F 2022 Strategic Report Governance Report Financial Statements Other Information 33
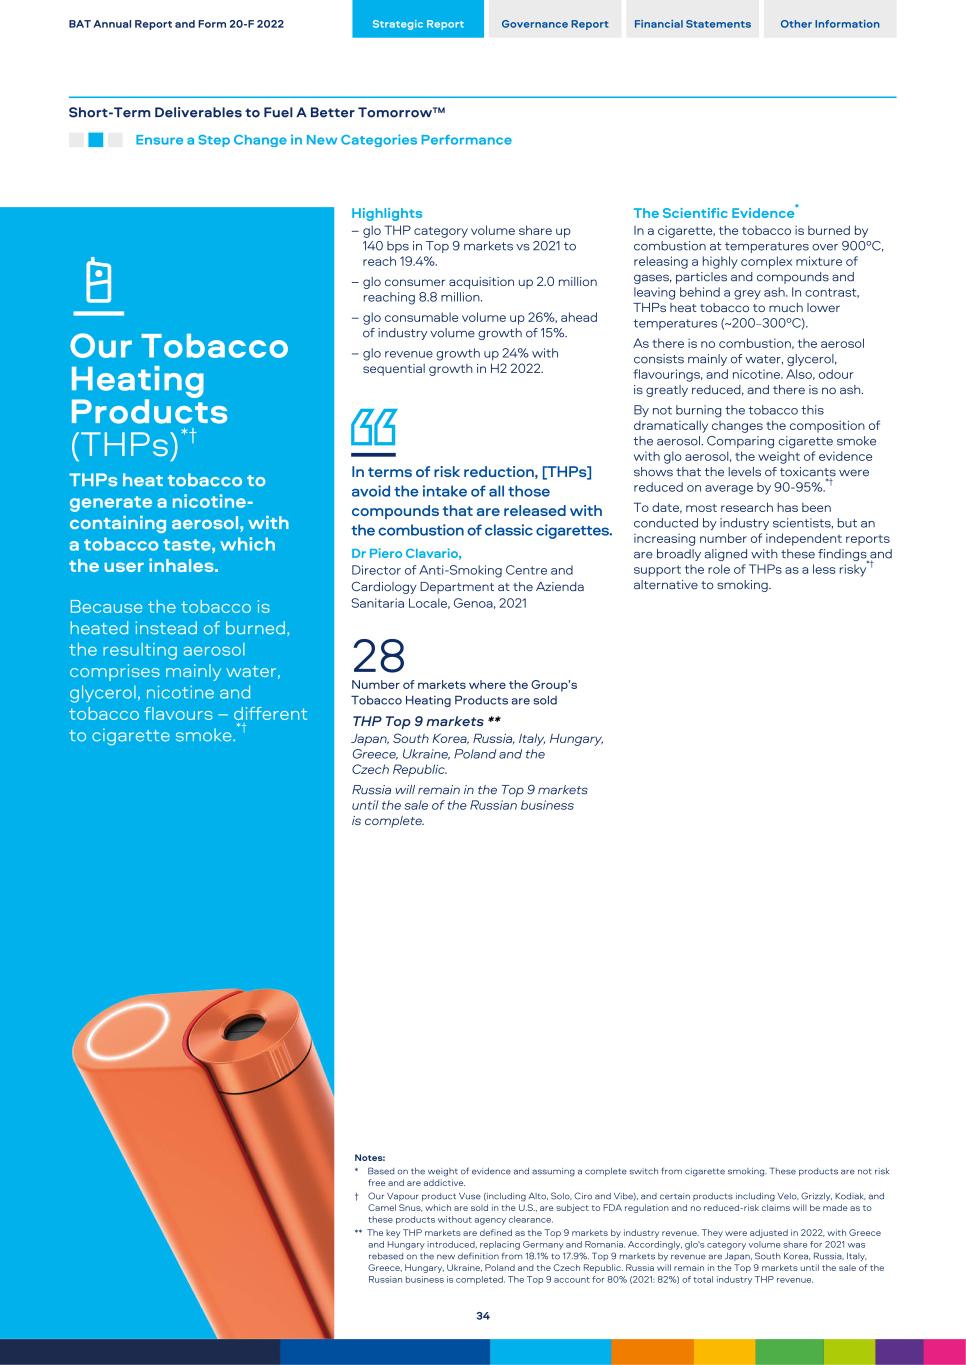
Our Tobacco Heating Products (THPs)*† THPs heat tobacco to generate a nicotine- containing aerosol, with a tobacco taste, which the user inhales. Because the tobacco is heated instead of burned, the resulting aerosol comprises mainly water, glycerol, nicotine and tobacco flavours – different to cigarette smoke.*† Highlights – glo THP category volume share up 140 bps in Top 9 markets vs 2021 to reach 19.4%. – glo consumer acquisition up 2.0 million reaching 8.8 million. – glo consumable volume up 26%, ahead of industry volume growth of 15%. – glo revenue growth up 24% with sequential growth in H2 2022. In terms of risk reduction, [THPs] avoid the intake of all those compounds that are released with the combustion of classic cigarettes. Dr Piero Clavario, Director of Anti-Smoking Centre and Cardiology Department at the Azienda Sanitaria Locale, Genoa, 2021 28 Number of markets where the Group’s Tobacco Heating Products are sold THP Top 9 markets ** Japan, South Korea, Russia, Italy, Hungary, Greece, Ukraine, Poland and the Czech Republic. Russia will remain in the Top 9 markets until the sale of the Russian business is complete. The Scientific Evidence* In a cigarette, the tobacco is burned by combustion at temperatures over 900ºC, releasing a highly complex mixture of gases, particles and compounds and leaving behind a grey ash. In contrast, THPs heat tobacco to much lower temperatures (~200‒300ºC). As there is no combustion, the aerosol consists mainly of water, glycerol, flavourings, and nicotine. Also, odour is greatly reduced, and there is no ash. By not burning the tobacco this dramatically changes the composition of the aerosol. Comparing cigarette smoke with glo aerosol, the weight of evidence shows that the levels of toxicants were reduced on average by 90-95%.*† To date, most research has been conducted by industry scientists, but an increasing number of independent reports are broadly aligned with these findings and support the role of THPs as a less risky*† alternative to smoking. Notes: * Based on the weight of evidence and assuming a complete switch from cigarette smoking. These products are not risk free and are addictive. † Our Vapour product Vuse (including Alto, Solo, Ciro and Vibe), and certain products including Velo, Grizzly, Kodiak, and Camel Snus, which are sold in the U.S., are subject to FDA regulation and no reduced-risk claims will be made as to these products without agency clearance. ** The key THP markets are defined as the Top 9 markets by industry revenue. They were adjusted in 2022, with Greece and Hungary introduced, replacing Germany and Romania. Accordingly, glo's category volume share for 2021 was rebased on the new definition from 18.1% to 17.9%. Top 9 markets by revenue are Japan, South Korea, Russia, Italy, Greece, Hungary, Ukraine, Poland and the Czech Republic. Russia will remain in the Top 9 markets until the sale of the Russian business is completed. The Top 9 account for 80% (2021: 82%) of total industry THP revenue. BAT Annual Report and Form 20-F 2022 Strategic Report Governance Report Financial Statements Other Information Short-Term Deliverables to Fuel A Better Tomorrow™ Ensure a Step Change in New Categories Performance 34
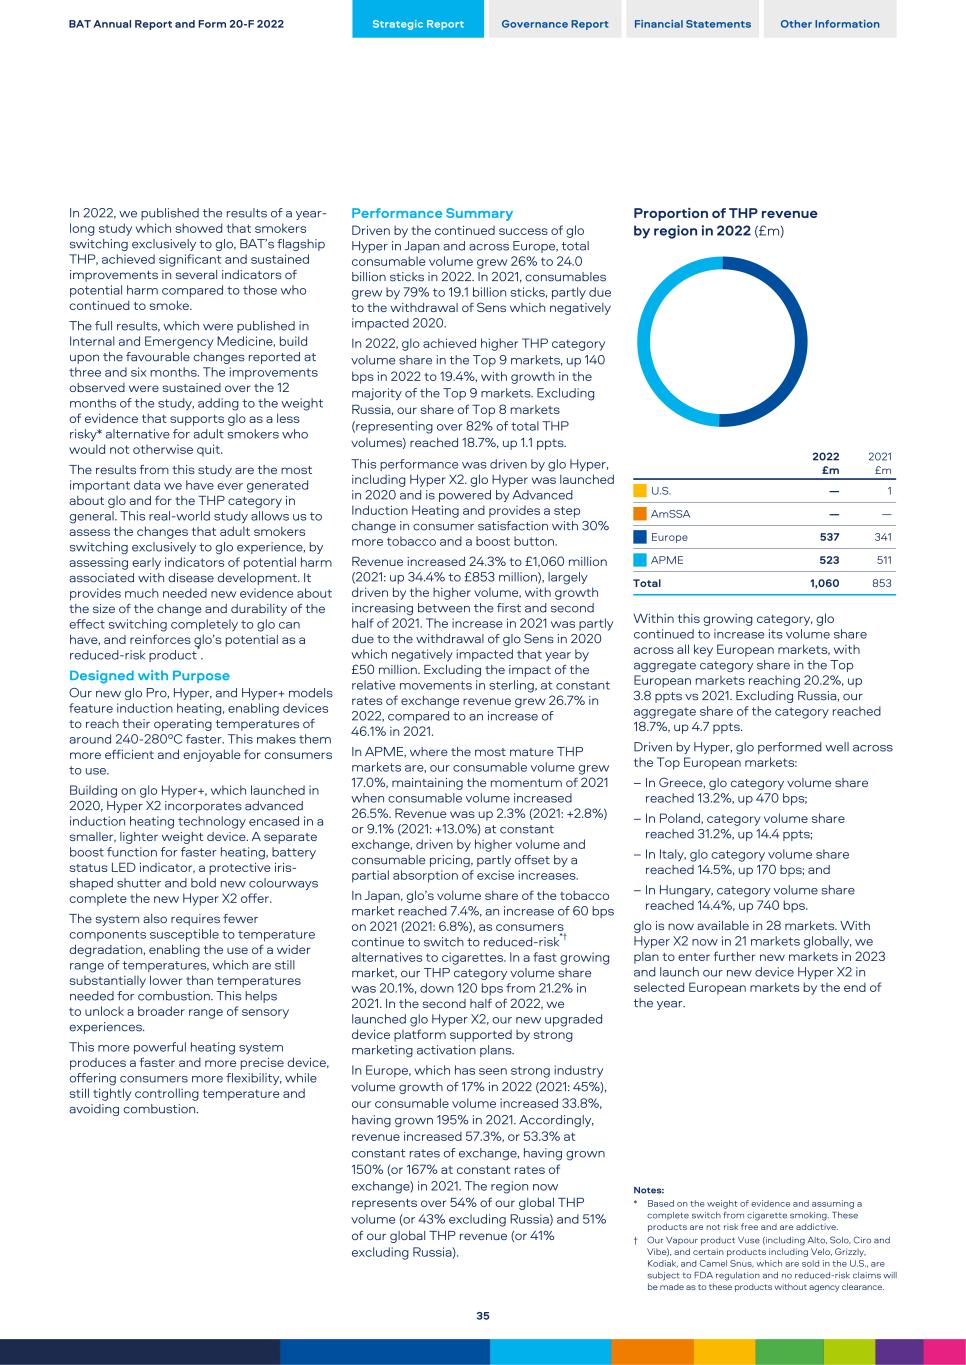
In 2022, we published the results of a year- long study which showed that smokers switching exclusively to glo, BAT’s flagship THP, achieved significant and sustained improvements in several indicators of potential harm compared to those who continued to smoke. The full results, which were published in Internal and Emergency Medicine, build upon the favourable changes reported at three and six months. The improvements observed were sustained over the 12 months of the study, adding to the weight of evidence that supports glo as a less risky* alternative for adult smokers who would not otherwise quit. The results from this study are the most important data we have ever generated about glo and for the THP category in general. This real-world study allows us to assess the changes that adult smokers switching exclusively to glo experience, by assessing early indicators of potential harm associated with disease development. It provides much needed new evidence about the size of the change and durability of the effect switching completely to glo can have, and reinforces glo’s potential as a reduced-risk product*. Designed with Purpose Our new glo Pro, Hyper, and Hyper+ models feature induction heating, enabling devices to reach their operating temperatures of around 240-280ºC faster. This makes them more efficient and enjoyable for consumers to use. Building on glo Hyper+, which launched in 2020, Hyper X2 incorporates advanced induction heating technology encased in a smaller, lighter weight device. A separate boost function for faster heating, battery status LED indicator, a protective iris- shaped shutter and bold new colourways complete the new Hyper X2 offer. The system also requires fewer components susceptible to temperature degradation, enabling the use of a wider range of temperatures, which are still substantially lower than temperatures needed for combustion. This helps to unlock a broader range of sensory experiences. This more powerful heating system produces a faster and more precise device, offering consumers more flexibility, while still tightly controlling temperature and avoiding combustion. Performance Summary Driven by the continued success of glo Hyper in Japan and across Europe, total consumable volume grew 26% to 24.0 billion sticks in 2022. In 2021, consumables grew by 79% to 19.1 billion sticks, partly due to the withdrawal of Sens which negatively impacted 2020. In 2022, glo achieved higher THP category volume share in the Top 9 markets, up 140 bps in 2022 to 19.4%, with growth in the majority of the Top 9 markets. Excluding Russia, our share of Top 8 markets (representing over 82% of total THP volumes) reached 18.7%, up 1.1 ppts. This performance was driven by glo Hyper, including Hyper X2. glo Hyper was launched in 2020 and is powered by Advanced Induction Heating and provides a step change in consumer satisfaction with 30% more tobacco and a boost button. Revenue increased 24.3% to £1,060 million (2021: up 34.4% to £853 million), largely driven by the higher volume, with growth increasing between the first and second half of 2021. The increase in 2021 was partly due to the withdrawal of glo Sens in 2020 which negatively impacted that year by £50 million. Excluding the impact of the relative movements in sterling, at constant rates of exchange revenue grew 26.7% in 2022, compared to an increase of 46.1% in 2021. In APME, where the most mature THP markets are, our consumable volume grew 17.0%, maintaining the momentum of 2021 when consumable volume increased 26.5%. Revenue was up 2.3% (2021: +2.8%) or 9.1% (2021: +13.0%) at constant exchange, driven by higher volume and consumable pricing, partly offset by a partial absorption of excise increases. In Japan, glo’s volume share of the tobacco market reached 7.4%, an increase of 60 bps on 2021 (2021: 6.8%), as consumers continue to switch to reduced-risk*† alternatives to cigarettes. In a fast growing market, our THP category volume share was 20.1%, down 120 bps from 21.2% in 2021. In the second half of 2022, we launched glo Hyper X2, our new upgraded device platform supported by strong marketing activation plans. In Europe, which has seen strong industry volume growth of 17% in 2022 (2021: 45%), our consumable volume increased 33.8%, having grown 195% in 2021. Accordingly, revenue increased 57.3%, or 53.3% at constant rates of exchange, having grown 150% (or 167% at constant rates of exchange) in 2021. The region now represents over 54% of our global THP volume (or 43% excluding Russia) and 51% of our global THP revenue (or 41% excluding Russia). Proportion of THP revenue by region in 2022 (£m) 2022 £m 2021 £m U.S. — 1 AmSSA — — Europe 537 341 APME 523 511 Total 1,060 853 Within this growing category, glo continued to increase its volume share across all key European markets, with aggregate category share in the Top European markets reaching 20.2%, up 3.8 ppts vs 2021. Excluding Russia, our aggregate share of the category reached 18.7%, up 4.7 ppts. Driven by Hyper, glo performed well across the Top European markets: – In Greece, glo category volume share reached 13.2%, up 470 bps; – In Poland, category volume share reached 31.2%, up 14.4 ppts; – In Italy, glo category volume share reached 14.5%, up 170 bps; and – In Hungary, category volume share reached 14.4%, up 740 bps. glo is now available in 28 markets. With Hyper X2 now in 21 markets globally, we plan to enter further new markets in 2023 and launch our new device Hyper X2 in selected European markets by the end of the year. Notes: * Based on the weight of evidence and assuming a complete switch from cigarette smoking. These products are not risk free and are addictive. † Our Vapour product Vuse (including Alto, Solo, Ciro and Vibe), and certain products including Velo, Grizzly, Kodiak, and Camel Snus, which are sold in the U.S., are subject to FDA regulation and no reduced-risk claims will be made as to these products without agency clearance. BAT Annual Report and Form 20-F 2022 Strategic Report Governance Report Financial Statements Other Information 35
Our Modern Oral Products*† In recent years, a new category of Modern Oral products has emerged. These come in the form of nicotine pouches that are placed under the lip so that nicotine can be effectively absorbed. Highlights – Continued strong global volume growth (up 21.7%), with consumer numbers up 0.6m to 2.7m. – Category volume share in key Top 5 markets was 30.4%, down 440 bps, driven by a decline in the highly competitive U.S. market. – Volume share leadership in Modern Oral in Europe at 68.8%. – Europe revenue up 30.8%, with volume up 29.9%, as Velo remains volume share leader in 15 Modern Oral markets in Europe. – U.S. revenue up significantly to £36 million despite 50.1% decline in volume. One of the best solutions for smokers is snus (an oral smokeless tobacco product which is usually placed behind the upper lip), sold in Scandinavia, where they have reduced the number of smokers to 5%. Dr David Khayat Former president of France’s National Cancer Institute and head of medical oncology at the Clinique Bizet, Paris, 2022 28 Number of markets where the Group’s Modern Oral Products are sold Modern Oral Top 5 markets ** U.S., Sweden, Norway, Denmark and Switzerland. The Scientific Evidence* Modern Oral nicotine pouches are a relatively new product category, which build upon the extensive scientific evidence available for snus. However, Modern Oral products are designed to offer adult consumers an improved, tobacco-free reduced-risk*† alternative. The weight of laboratory chemical studies for Velo, our flagship Modern Oral brand, show the pouches produce substantially lower levels of toxicants than is contained in cigarette smoke and lower levels than in snus. The weight of evidence suggests Modern Oral nicotine pouches have a profile that is comparable to nicotine replacement therapy products (NRT). In 2022, results from an innovative cross- sectional clinical studyi of Veloii were published in Biomarkers Journal. The study shows Velo consumers had significantly better results for several indicators linked to smoking-related diseases compared with smokers. In the study, consumers exclusively using Velo for over six months had significant favourable differences in several biomarkers of exposure and biomarkers of potential harm relevant to smoking-related diseases compared to the adults who smoked. These results are very important for Velo and the Modern Oral nicotine product category. They build on the extensive scientific evidence, including epidemiological data, that already exists for snus. The results also add to the weight of evidence that supports our belief that Velo is a reduced-risk*† product for smokers who completely switch from cigarettes as compared to continued smoking. Notes: i Azzopardi, D. et al (2022). Assessment of biomarkers of exposure and potential harm, and physiological and subjective health measures in exclusive users of nicotine pouches and current, former and never smokers. ii The study was conducted using Lyft, since re-branded as Velo. * Based on the weight of evidence and assuming a complete switch from cigarette smoking. These products are not risk free and are addictive. † Our Vapour product Vuse (including Alto, Solo, Ciro and Vibe), and certain products, including Velo, Grizzly, Kodiak, and Camel Snus, which are sold in the U.S., are subject to FDA regulation and no reduced-risk claims will be made as to these products without agency clearance. ** Key Modern Oral markets are defined as the Top 5 markets by industry revenue, being the U.S., Sweden, Norway, Denmark and Switzerland and accounting for 80% of total industry revenue. BAT Annual Report and Form 20-F 2022 Strategic Report Governance Report Financial Statements Other Information Short-Term Deliverables to Fuel A Better Tomorrow™ Ensure a Step Change in New Categories Performance 36
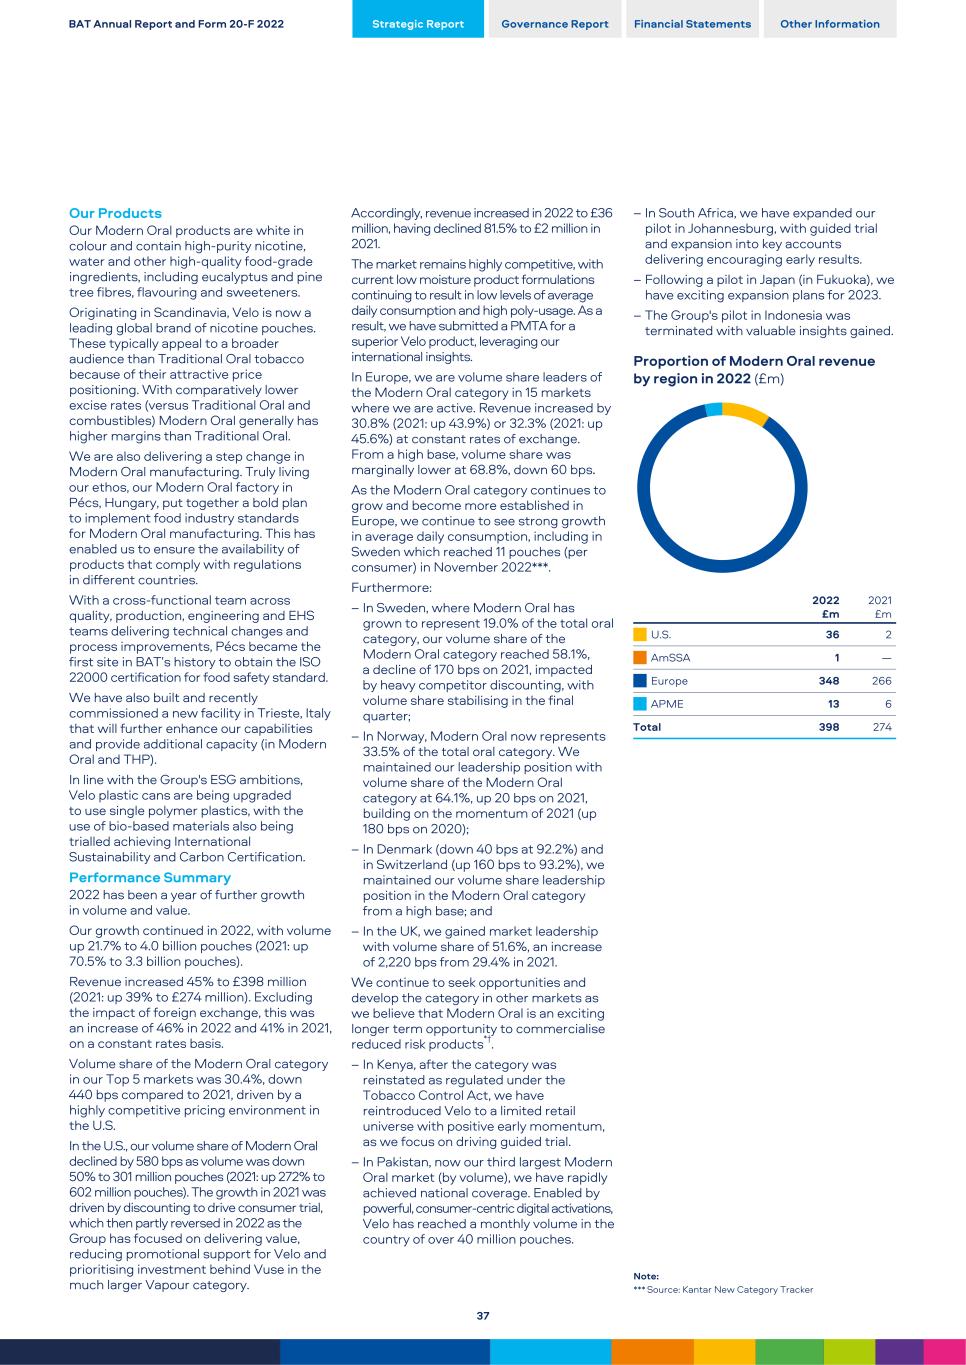
Our Products Our Modern Oral products are white in colour and contain high-purity nicotine, water and other high-quality food-grade ingredients, including eucalyptus and pine tree fibres, flavouring and sweeteners. Originating in Scandinavia, Velo is now a leading global brand of nicotine pouches. These typically appeal to a broader audience than Traditional Oral tobacco because of their attractive price positioning. With comparatively lower excise rates (versus Traditional Oral and combustibles) Modern Oral generally has higher margins than Traditional Oral. We are also delivering a step change in Modern Oral manufacturing. Truly living our ethos, our Modern Oral factory in Pécs, Hungary, put together a bold plan to implement food industry standards for Modern Oral manufacturing. This has enabled us to ensure the availability of products that comply with regulations in different countries. With a cross-functional team across quality, production, engineering and EHS teams delivering technical changes and process improvements, Pécs became the first site in BAT’s history to obtain the ISO 22000 certification for food safety standard. We have also built and recently commissioned a new facility in Trieste, Italy that will further enhance our capabilities and provide additional capacity (in Modern Oral and THP). In line with the Group's ESG ambitions, Velo plastic cans are being upgraded to use single polymer plastics, with the use of bio-based materials also being trialled achieving International Sustainability and Carbon Certification. Performance Summary 2022 has been a year of further growth in volume and value. Our growth continued in 2022, with volume up 21.7% to 4.0 billion pouches (2021: up 70.5% to 3.3 billion pouches). Revenue increased 45% to £398 million (2021: up 39% to £274 million). Excluding the impact of foreign exchange, this was an increase of 46% in 2022 and 41% in 2021, on a constant rates basis. Volume share of the Modern Oral category in our Top 5 markets was 30.4%, down 440 bps compared to 2021, driven by a highly competitive pricing environment in the U.S. In the U.S., our volume share of Modern Oral declined by 580 bps as volume was down 50% to 301 million pouches (2021: up 272% to 602 million pouches). The growth in 2021 was driven by discounting to drive consumer trial, which then partly reversed in 2022 as the Group has focused on delivering value, reducing promotional support for Velo and prioritising investment behind Vuse in the much larger Vapour category. Accordingly, revenue increased in 2022 to £36 million, having declined 81.5% to £2 million in 2021. The market remains highly competitive, with current low moisture product formulations continuing to result in low levels of average daily consumption and high poly-usage. As a result, we have submitted a PMTA for a superior Velo product, leveraging our international insights. In Europe, we are volume share leaders of the Modern Oral category in 15 markets where we are active. Revenue increased by 30.8% (2021: up 43.9%) or 32.3% (2021: up 45.6%) at constant rates of exchange. From a high base, volume share was marginally lower at 68.8%, down 60 bps. As the Modern Oral category continues to grow and become more established in Europe, we continue to see strong growth in average daily consumption, including in Sweden which reached 11 pouches (per consumer) in November 2022***. Furthermore: – In Sweden, where Modern Oral has grown to represent 19.0% of the total oral category, our volume share of the Modern Oral category reached 58.1%, a decline of 170 bps on 2021, impacted by heavy competitor discounting, with volume share stabilising in the final quarter; – In Norway, Modern Oral now represents 33.5% of the total oral category. We maintained our leadership position with volume share of the Modern Oral category at 64.1%, up 20 bps on 2021, building on the momentum of 2021 (up 180 bps on 2020); – In Denmark (down 40 bps at 92.2%) and in Switzerland (up 160 bps to 93.2%), we maintained our volume share leadership position in the Modern Oral category from a high base; and – In the UK, we gained market leadership with volume share of 51.6%, an increase of 2,220 bps from 29.4% in 2021. We continue to seek opportunities and develop the category in other markets as we believe that Modern Oral is an exciting longer term opportunity to commercialise reduced risk products*†. – In Kenya, after the category was reinstated as regulated under the Tobacco Control Act, we have reintroduced Velo to a limited retail universe with positive early momentum, as we focus on driving guided trial. – In Pakistan, now our third largest Modern Oral market (by volume), we have rapidly achieved national coverage. Enabled by powerful, consumer-centric digital activations, Velo has reached a monthly volume in the country of over 40 million pouches. – In South Africa, we have expanded our pilot in Johannesburg, with guided trial and expansion into key accounts delivering encouraging early results. – Following a pilot in Japan (in Fukuoka), we have exciting expansion plans for 2023. – The Group's pilot in Indonesia was terminated with valuable insights gained. Proportion of Modern Oral revenue by region in 2022 (£m) 2022 £m 2021 £m U.S. 36 2 AmSSA 1 — Europe 348 266 APME 13 6 Total 398 274 Note: *** Source: Kantar New Category Tracker BAT Annual Report and Form 20-F 2022 Strategic Report Governance Report Financial Statements Other Information 37
Our Traditional Oral Products The most common products in Traditional Oral are largely moist oral tobacco popular in the U.S., with the main brands being Grizzly and Kodiak. These products are less finely ground than another Traditional Oral product referred to as Swedish- style snus. Both of these Traditional Oral products are available in loose form, as well as in pre-packed pouches. Our Products We also sell a range of Traditional Oral products, including Swedish-style snus and American moist snuff, available in loose tobacco form or as pre-packed pouches. We have long sold snus in Sweden and Norway through our Fiedler & Lundgren business, whose brands include Granit and Mocca; and in the U.S. we market snus under the Camel brand. Our American moist snuff products include our flagship Grizzly brand, as well as the premium moist snuff brand Kodiak. During 2022, the decision was taken to withdraw the Modified Risk Tobacco Product (MRTP) applications for Camel Snus, as we have adjusted our near-term priorities and are focusing on providing a diverse portfolio of New Category products in line with our global harm reduction strategy. We remain committed to offering potentially reduced-risk*† products that help adult smokers migrate from combustible cigarettes while meeting the evolving needs of other adult nicotine consumers. Performance Summary Total revenue increased 8.2% to £1,209 million (2021: down 3.6% to £1,118 million), as pricing underpinned both 2022 and 2021. However, in 2022, volume was lower (down 8.3%) than the prior year (at 7.4 billion stick equivalents), with 2021 3.9% lower than 2020. Translational foreign exchange impacted both years, being a tailwind in 2022 of 10.5% (compared to a headwind of 6.6% in 2021) due to the relative movement of sterling. On a constant rates basis, revenue fell 2.3% in 2022 having grown 3.0% in 2021. In the U.S., which accounts for approximately 97.1% of the Group’s revenue from Traditional Oral, volume declined 8.1% in 2022 (2021: down 5.1%). Value share of Traditional Oral was down 60 bps (2021: up 10 bps), while volume share was down 70 bps (2021: down 50 bps). The decline in 2022 was driven by strong macro-economic headwinds leading to downtrading, accelerated cross- category switching and reduced consumption. Outside the U.S., being 2.9% of the Group's revenue from the category, volume was 9.8% lower in 2022, driven by Sweden where the Group’s volume share (as a proportion of total oral) declined 10 bps (2021: increased 50 bps). This was driven by Lundgrens Modern Oral launch and Granit’s price strategy to drive value. Notes: * Based on the weight of evidence and assuming a complete switch from cigarette smoking. These products are not risk free and are addictive. † Our Vapour product Vuse (including Alto, Solo, Ciro and Vibe), and certain products including Velo, Grizzly, Kodiak, and Camel Snus, which are sold in the U.S., are subject to FDA regulation and no reduced-risk claims will be made as to these products without agency clearance. Proportion of Traditional Oral revenue by region in 2022 (£m) 2022 £m 2021 £m U.S. 1,174 1,077 AmSSA — — Europe 35 41 APME — — Total 1,209 1,118 BAT Annual Report and Form 20-F 2022 Strategic Report Governance Report Financial Statements Other Information Short-Term Deliverables to Fuel A Better Tomorrow™ Ensure a Step Change in New Categories Performance 38
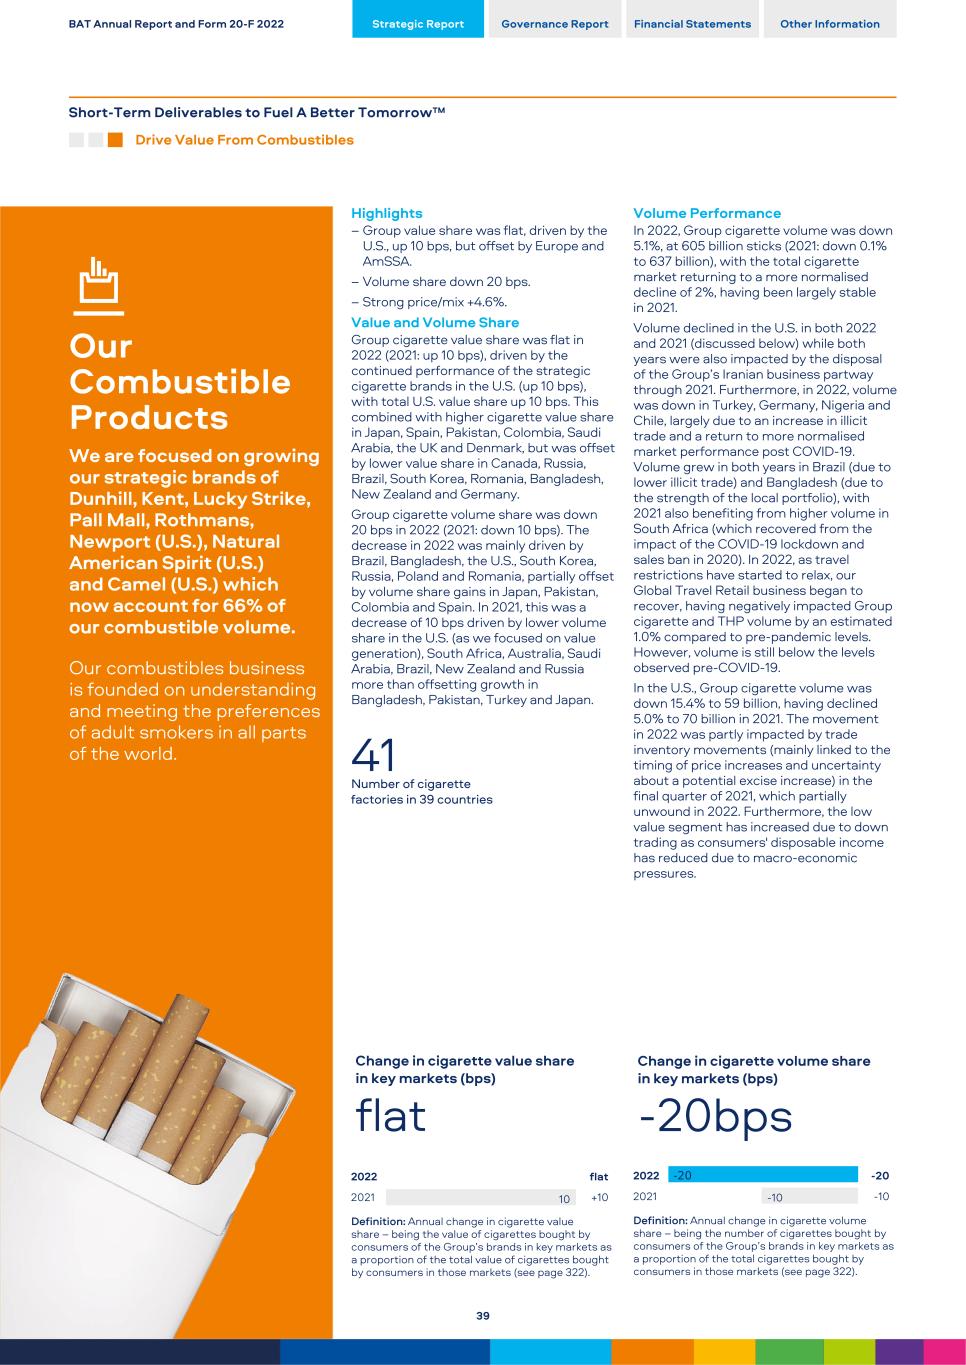
Our Combustible Products We are focused on growing our strategic brands of Dunhill, Kent, Lucky Strike, Pall Mall, Rothmans, Newport (U.S.), Natural American Spirit (U.S.) and Camel (U.S.) which now account for 66% of our combustible volume. Our combustibles business is founded on understanding and meeting the preferences of adult smokers in all parts of the world. Highlights – Group value share was flat, driven by the U.S., up 10 bps, but offset by Europe and AmSSA. – Volume share down 20 bps. – Strong price/mix +4.6%. Value and Volume Share Group cigarette value share was flat in 2022 (2021: up 10 bps), driven by the continued performance of the strategic cigarette brands in the U.S. (up 10 bps), with total U.S. value share up 10 bps. This combined with higher cigarette value share in Japan, Spain, Pakistan, Colombia, Saudi Arabia, the UK and Denmark, but was offset by lower value share in Canada, Russia, Brazil, South Korea, Romania, Bangladesh, New Zealand and Germany. Group cigarette volume share was down 20 bps in 2022 (2021: down 10 bps). The decrease in 2022 was mainly driven by Brazil, Bangladesh, the U.S., South Korea, Russia, Poland and Romania, partially offset by volume share gains in Japan, Pakistan, Colombia and Spain. In 2021, this was a decrease of 10 bps driven by lower volume share in the U.S. (as we focused on value generation), South Africa, Australia, Saudi Arabia, Brazil, New Zealand and Russia more than offsetting growth in Bangladesh, Pakistan, Turkey and Japan. 41 Number of cigarette factories in 39 countries Change in cigarette value share in key markets (bps) flat 2022 2021 10 flat +10 Definition: Annual change in cigarette value share – being the value of cigarettes bought by consumers of the Group’s brands in key markets as a proportion of the total value of cigarettes bought by consumers in those markets (see page 322). Volume Performance In 2022, Group cigarette volume was down 5.1%, at 605 billion sticks (2021: down 0.1% to 637 billion), with the total cigarette market returning to a more normalised decline of 2%, having been largely stable in 2021. Volume declined in the U.S. in both 2022 and 2021 (discussed below) while both years were also impacted by the disposal of the Group’s Iranian business partway through 2021. Furthermore, in 2022, volume was down in Turkey, Germany, Nigeria and Chile, largely due to an increase in illicit trade and a return to more normalised market performance post COVID-19. Volume grew in both years in Brazil (due to lower illicit trade) and Bangladesh (due to the strength of the local portfolio), with 2021 also benefiting from higher volume in South Africa (which recovered from the impact of the COVID-19 lockdown and sales ban in 2020). In 2022, as travel restrictions have started to relax, our Global Travel Retail business began to recover, having negatively impacted Group cigarette and THP volume by an estimated 1.0% compared to pre-pandemic levels. However, volume is still below the levels observed pre-COVID-19. In the U.S., Group cigarette volume was down 15.4% to 59 billion, having declined 5.0% to 70 billion in 2021. The movement in 2022 was partly impacted by trade inventory movements (mainly linked to the timing of price increases and uncertainty about a potential excise increase) in the final quarter of 2021, which partially unwound in 2022. Furthermore, the low value segment has increased due to down trading as consumers' disposable income has reduced due to macro-economic pressures. Change in cigarette volume share in key markets (bps) -20bps 2022 2021 -10 -20 -10 Definition: Annual change in cigarette volume share – being the number of cigarettes bought by consumers of the Group’s brands in key markets as a proportion of the total cigarettes bought by consumers in those markets (see page 322). BAT Annual Report and Form 20-F 2022 Strategic Report Governance Report Financial Statements Other Information Short-Term Deliverables to Fuel A Better Tomorrow™ Drive Value From Combustibles 39
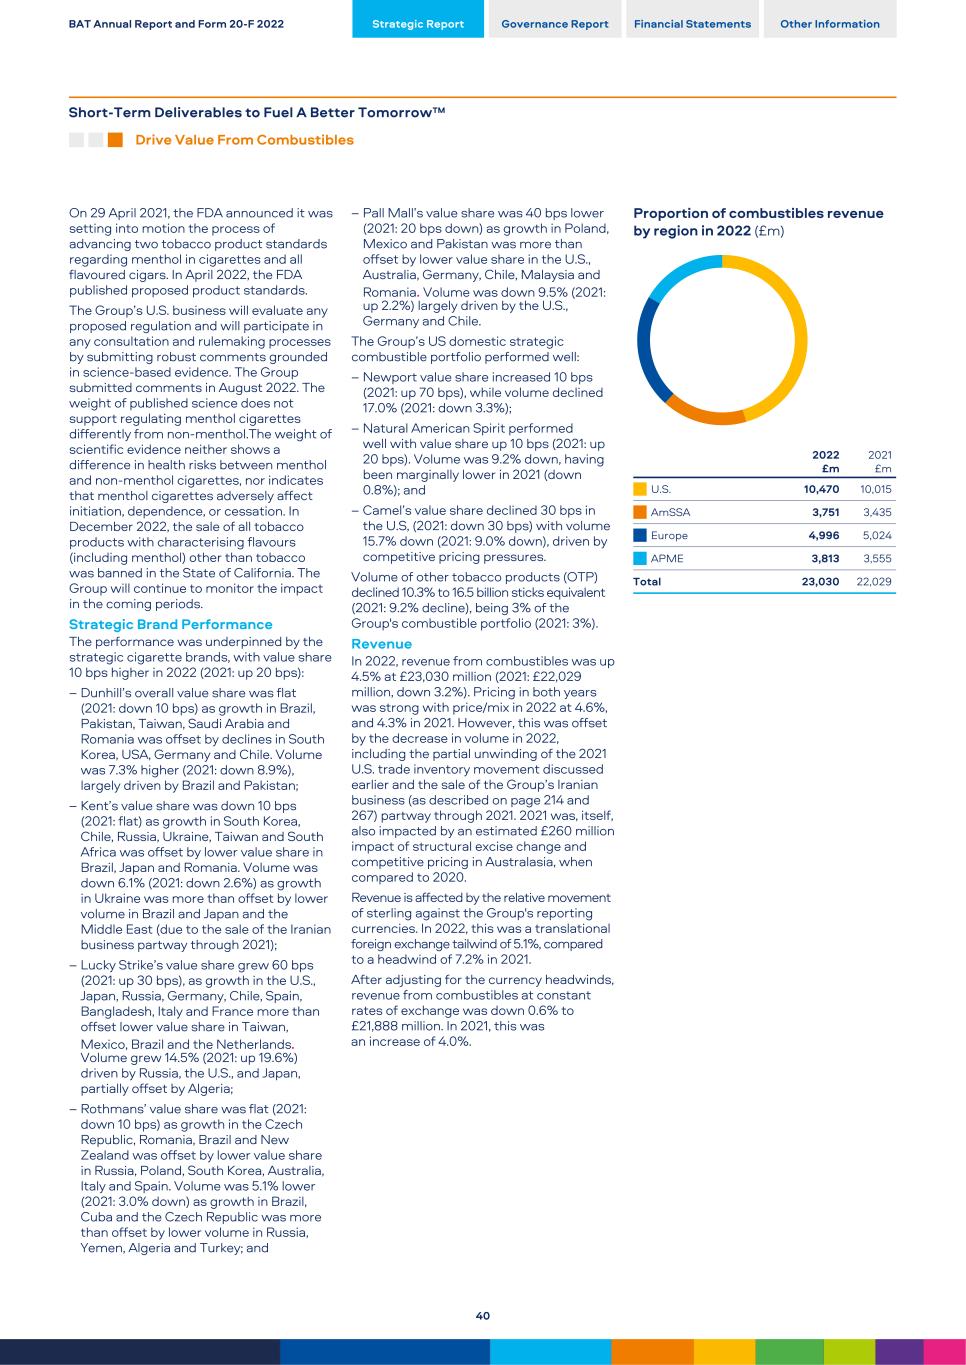
On 29 April 2021, the FDA announced it was setting into motion the process of advancing two tobacco product standards regarding menthol in cigarettes and all flavoured cigars. In April 2022, the FDA published proposed product standards. The Group’s U.S. business will evaluate any proposed regulation and will participate in any consultation and rulemaking processes by submitting robust comments grounded in science-based evidence. The Group submitted comments in August 2022. The weight of published science does not support regulating menthol cigarettes differently from non-menthol.The weight of scientific evidence neither shows a difference in health risks between menthol and non-menthol cigarettes, nor indicates that menthol cigarettes adversely affect initiation, dependence, or cessation. In December 2022, the sale of all tobacco products with characterising flavours (including menthol) other than tobacco was banned in the State of California. The Group will continue to monitor the impact in the coming periods. Strategic Brand Performance The performance was underpinned by the strategic cigarette brands, with value share 10 bps higher in 2022 (2021: up 20 bps): – Dunhill’s overall value share was flat (2021: down 10 bps) as growth in Brazil, Pakistan, Taiwan, Saudi Arabia and Romania was offset by declines in South Korea, USA, Germany and Chile. Volume was 7.3% higher (2021: down 8.9%), largely driven by Brazil and Pakistan; – Kent’s value share was down 10 bps (2021: flat) as growth in South Korea, Chile, Russia, Ukraine, Taiwan and South Africa was offset by lower value share in Brazil, Japan and Romania. Volume was down 6.1% (2021: down 2.6%) as growth in Ukraine was more than offset by lower volume in Brazil and Japan and the Middle East (due to the sale of the Iranian business partway through 2021); – Lucky Strike’s value share grew 60 bps (2021: up 30 bps), as growth in the U.S., Japan, Russia, Germany, Chile, Spain, Bangladesh, Italy and France more than offset lower value share in Taiwan, Mexico, Brazil and the Netherlands. Volume grew 14.5% (2021: up 19.6%) driven by Russia, the U.S., and Japan, partially offset by Algeria; – Rothmans’ value share was flat (2021: down 10 bps) as growth in the Czech Republic, Romania, Brazil and New Zealand was offset by lower value share in Russia, Poland, South Korea, Australia, Italy and Spain. Volume was 5.1% lower (2021: 3.0% down) as growth in Brazil, Cuba and the Czech Republic was more than offset by lower volume in Russia, Yemen, Algeria and Turkey; and – Pall Mall’s value share was 40 bps lower (2021: 20 bps down) as growth in Poland, Mexico and Pakistan was more than offset by lower value share in the U.S., Australia, Germany, Chile, Malaysia and Romania. Volume was down 9.5% (2021: up 2.2%) largely driven by the U.S., Germany and Chile. The Group’s US domestic strategic combustible portfolio performed well: – Newport value share increased 10 bps (2021: up 70 bps), while volume declined 17.0% (2021: down 3.3%); – Natural American Spirit performed well with value share up 10 bps (2021: up 20 bps). Volume was 9.2% down, having been marginally lower in 2021 (down 0.8%); and – Camel’s value share declined 30 bps in the U.S, (2021: down 30 bps) with volume 15.7% down (2021: 9.0% down), driven by competitive pricing pressures. Volume of other tobacco products (OTP) declined 10.3% to 16.5 billion sticks equivalent (2021: 9.2% decline), being 3% of the Group's combustible portfolio (2021: 3%). Revenue In 2022, revenue from combustibles was up 4.5% at £23,030 million (2021: £22,029 million, down 3.2%). Pricing in both years was strong with price/mix in 2022 at 4.6%, and 4.3% in 2021. However, this was offset by the decrease in volume in 2022, including the partial unwinding of the 2021 U.S. trade inventory movement discussed earlier and the sale of the Group’s Iranian business (as described on page 214 and 267) partway through 2021. 2021 was, itself, also impacted by an estimated £260 million impact of structural excise change and competitive pricing in Australasia, when compared to 2020. Revenue is affected by the relative movement of sterling against the Group's reporting currencies. In 2022, this was a translational foreign exchange tailwind of 5.1%, compared to a headwind of 7.2% in 2021. After adjusting for the currency headwinds, revenue from combustibles at constant rates of exchange was down 0.6% to £21,888 million. In 2021, this was an increase of 4.0%. Proportion of combustibles revenue by region in 2022 (£m) 2022 £m 2021 £m U.S. 10,470 10,015 AmSSA 3,751 3,435 Europe 4,996 5,024 APME 3,813 3,555 Total 23,030 22,029 BAT Annual Report and Form 20-F 2022 Strategic Report Governance Report Financial Statements Other Information Short-Term Deliverables to Fuel A Better Tomorrow™ Drive Value From Combustibles 40
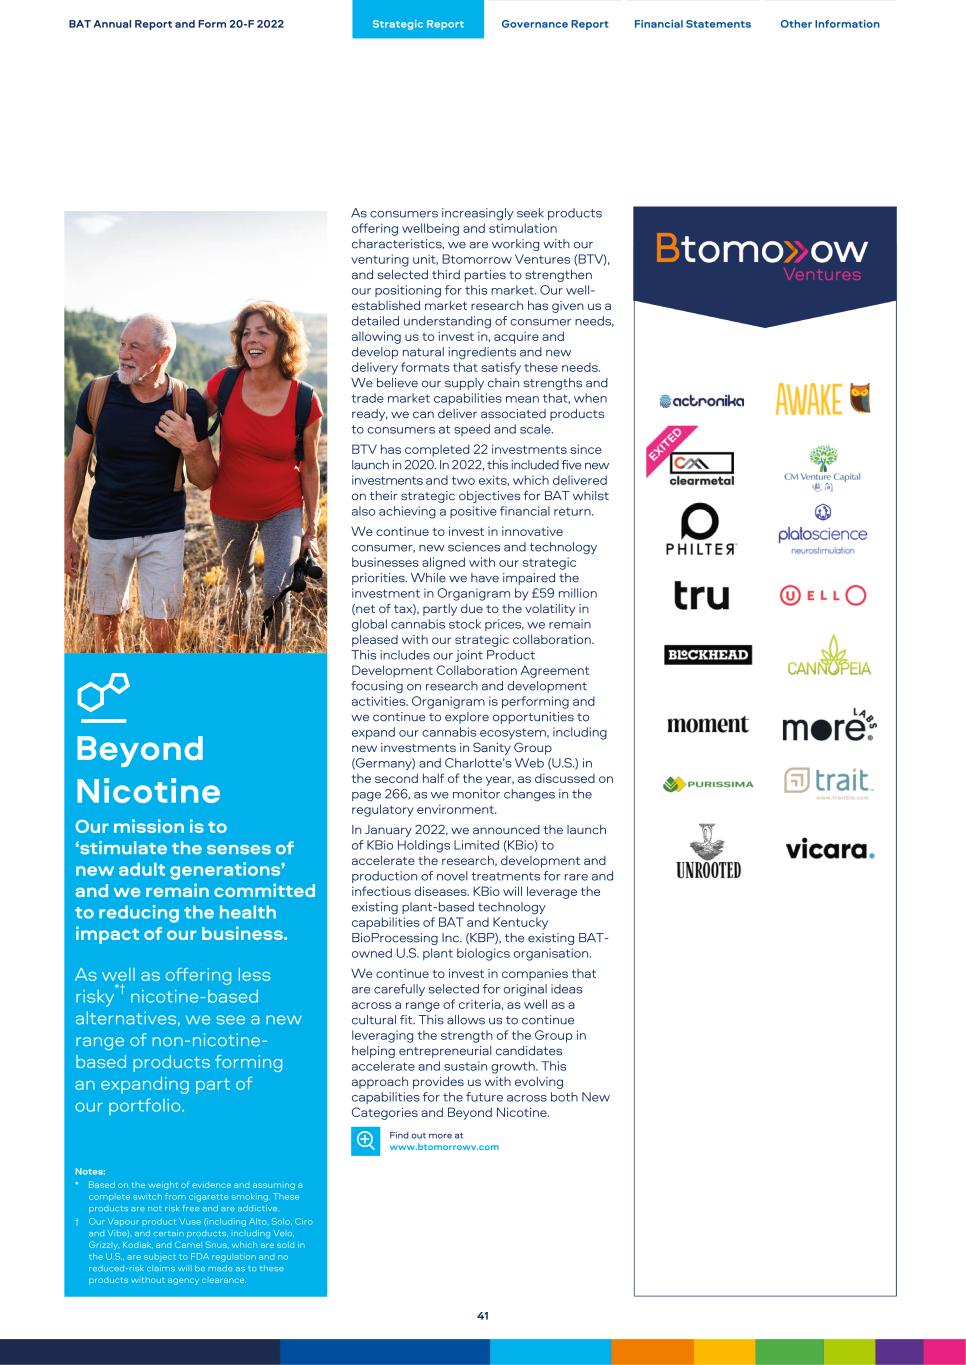
Beyond Nicotine Our mission is to ‘stimulate the senses of new adult generations’ and we remain committed to reducing the health impact of our business. As well as offering less risky*† nicotine-based alternatives, we see a new range of non-nicotine- based products forming an expanding part of our portfolio. Notes: * Based on the weight of evidence and assuming a complete switch from cigarette smoking. These products are not risk free and are addictive. † Our Vapour product Vuse (including Alto, Solo, Ciro and Vibe), and certain products, including Velo, Grizzly, Kodiak, and Camel Snus, which are sold in the U.S., are subject to FDA regulation and no reduced-risk claims will be made as to these products without agency clearance. As consumers increasingly seek products offering wellbeing and stimulation characteristics, we are working with our venturing unit, Btomorrow Ventures (BTV), and selected third parties to strengthen our positioning for this market. Our well- established market research has given us a detailed understanding of consumer needs, allowing us to invest in, acquire and develop natural ingredients and new delivery formats that satisfy these needs. We believe our supply chain strengths and trade market capabilities mean that, when ready, we can deliver associated products to consumers at speed and scale. BTV has completed 22 investments since launch in 2020. In 2022, this included five new investments and two exits, which delivered on their strategic objectives for BAT whilst also achieving a positive financial return. We continue to invest in innovative consumer, new sciences and technology businesses aligned with our strategic priorities. While we have impaired the investment in Organigram by £59 million (net of tax), partly due to the volatility in global cannabis stock prices, we remain pleased with our strategic collaboration. This includes our joint Product Development Collaboration Agreement focusing on research and development activities. Organigram is performing and we continue to explore opportunities to expand our cannabis ecosystem, including new investments in Sanity Group (Germany) and Charlotte’s Web (U.S.) in the second half of the year, as discussed on page 266, as we monitor changes in the regulatory environment. In January 2022, we announced the launch of KBio Holdings Limited (KBio) to accelerate the research, development and production of novel treatments for rare and infectious diseases. KBio will leverage the existing plant-based technology capabilities of BAT and Kentucky BioProcessing Inc. (KBP), the existing BAT- owned U.S. plant biologics organisation. We continue to invest in companies that are carefully selected for original ideas across a range of criteria, as well as a cultural fit. This allows us to continue leveraging the strength of the Group in helping entrepreneurial candidates accelerate and sustain growth. This approach provides us with evolving capabilities for the future across both New Categories and Beyond Nicotine. Find out more at www.btomorrowv.com BAT Annual Report and Form 20-F 2022 Strategic Report Governance Report Financial Statements Other Information 41
For Society and the Environment BAT Annual Report and Form 20-F 2022 Strategic Report Governance Report Financial Statements Other Information 42
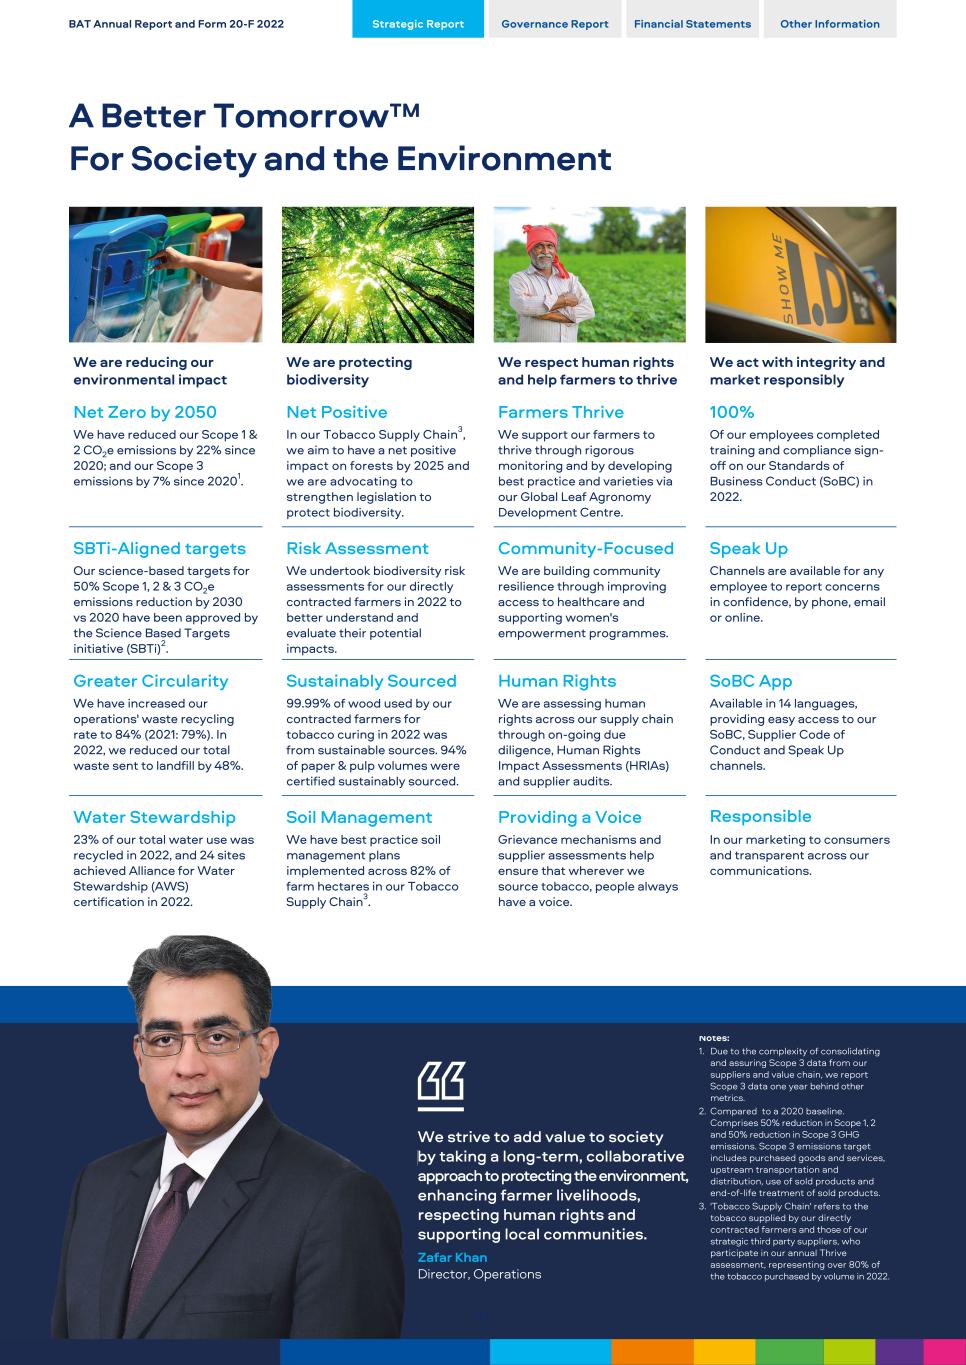
We are reducing our environmental impact We are protecting biodiversity We respect human rights and help farmers to thrive We act with integrity and market responsibly Net Zero by 2050 Net Positive Farmers Thrive 100% We have reduced our Scope 1 & 2 CO2e emissions by 22% since 2020; and our Scope 3 emissions by 7% since 20201. In our Tobacco Supply Chain3, we aim to have a net positive impact on forests by 2025 and we are advocating to strengthen legislation to protect biodiversity. We support our farmers to thrive through rigorous monitoring and by developing best practice and varieties via our Global Leaf Agronomy Development Centre. Of our employees completed training and compliance sign- off on our Standards of Business Conduct (SoBC) in 2022. SBTi-Aligned targets Risk Assessment Community-Focused Speak Up Our science-based targets for 50% Scope 1, 2 & 3 CO2e emissions reduction by 2030 vs 2020 have been approved by the Science Based Targets initiative (SBTi)2. We undertook biodiversity risk assessments for our directly contracted farmers in 2022 to better understand and evaluate their potential impacts. We are building community resilience through improving access to healthcare and supporting women's empowerment programmes. Channels are available for any employee to report concerns in confidence, by phone, email or online. Greater Circularity Sustainably Sourced Human Rights SoBC App We have increased our operations' waste recycling rate to 84% (2021: 79%). In 2022, we reduced our total waste sent to landfill by 48%. 99.99% of wood used by our contracted farmers for tobacco curing in 2022 was from sustainable sources. 94% of paper & pulp volumes were certified sustainably sourced. We are assessing human rights across our supply chain through on-going due diligence, Human Rights Impact Assessments (HRIAs) and supplier audits. Available in 14 languages, providing easy access to our SoBC, Supplier Code of Conduct and Speak Up channels. Water Stewardship Soil Management Providing a Voice Responsible 23% of our total water use was recycled in 2022, and 24 sites achieved Alliance for Water Stewardship (AWS) certification in 2022. We have best practice soil management plans implemented across 82% of farm hectares in our Tobacco Supply Chain3. Grievance mechanisms and supplier assessments help ensure that wherever we source tobacco, people always have a voice. In our marketing to consumers and transparent across our communications. Notes: 1. Due to the complexity of consolidating and assuring Scope 3 data from our suppliers and value chain, we report Scope 3 data one year behind other metrics. 2. Compared to a 2020 baseline. Comprises 50% reduction in Scope 1, 2 and 50% reduction in Scope 3 GHG emissions. Scope 3 emissions target includes purchased goods and services, upstream transportation and distribution, use of sold products and end-of-life treatment of sold products. 3. 'Tobacco Supply Chain' refers to the tobacco supplied by our directly contracted farmers and those of our strategic third party suppliers, who participate in our annual Thrive assessment, representing over 80% of the tobacco purchased by volume in 2022. We strive to add value to society by taking a long-term, collaborative approach to protecting the environment, enhancing farmer livelihoods, respecting human rights and supporting local communities. Zafar Khan Director, Operations BAT Annual Report and Form 20-F 2022 Strategic Report Governance Report Financial Statements Other Information A Better Tomorrow™ For Society and the Environment 43
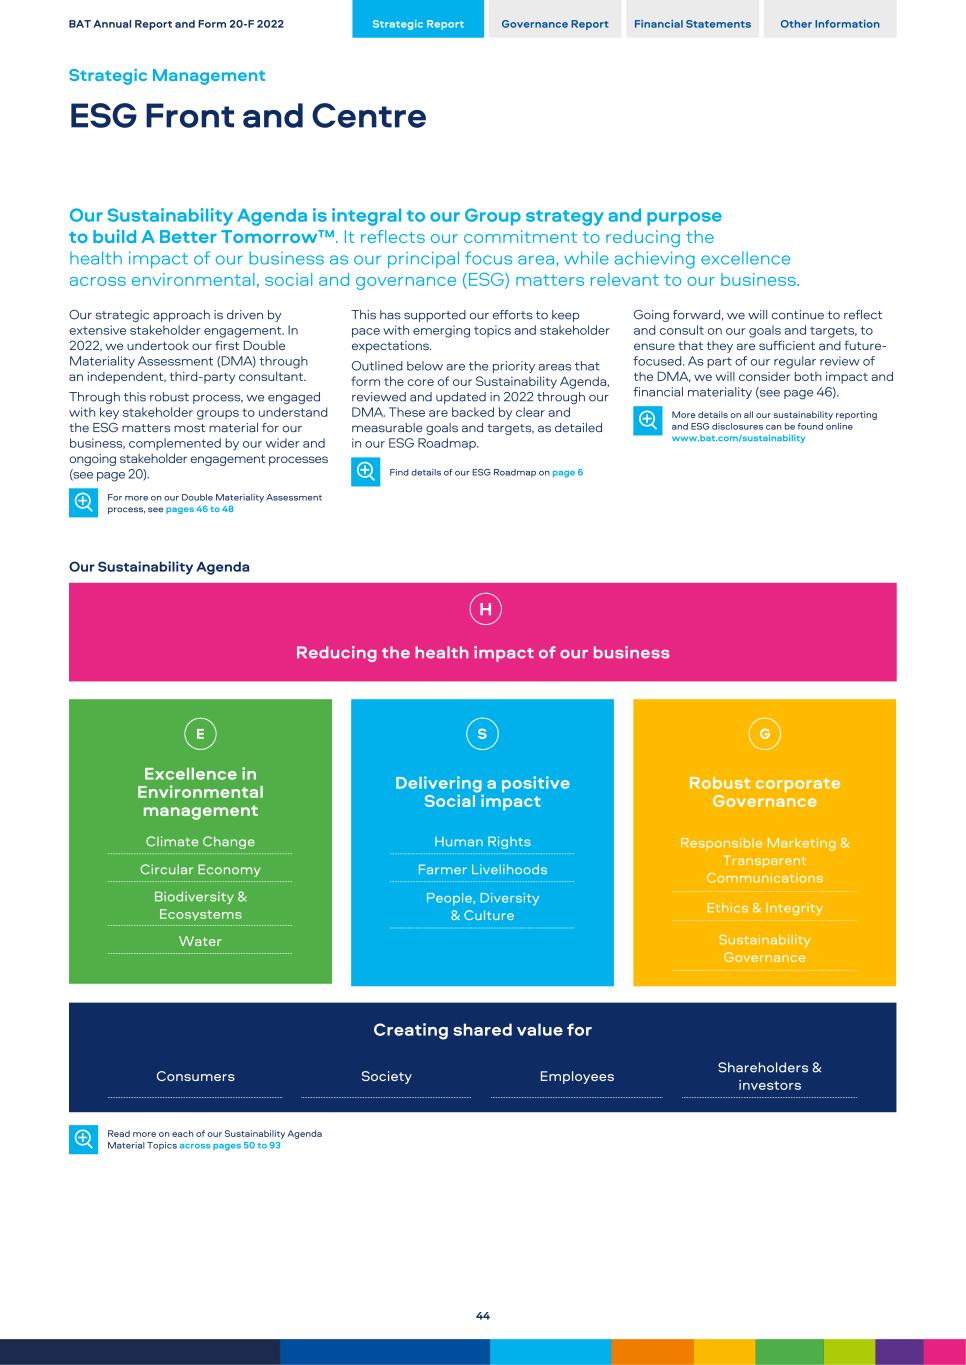
Our Sustainability Agenda is integral to our Group strategy and purpose to build A Better Tomorrow™. It reflects our commitment to reducing the health impact of our business as our principal focus area, while achieving excellence across environmental, social and governance (ESG) matters relevant to our business. Our strategic approach is driven by extensive stakeholder engagement. In 2022, we undertook our first Double Materiality Assessment (DMA) through an independent, third-party consultant. Through this robust process, we engaged with key stakeholder groups to understand the ESG matters most material for our business, complemented by our wider and ongoing stakeholder engagement processes (see page 20). For more on our Double Materiality Assessment process, see pages 46 to 48 This has supported our efforts to keep pace with emerging topics and stakeholder expectations. Outlined below are the priority areas that form the core of our Sustainability Agenda, reviewed and updated in 2022 through our DMA. These are backed by clear and measurable goals and targets, as detailed in our ESG Roadmap. Find details of our ESG Roadmap on page 6 Going forward, we will continue to reflect and consult on our goals and targets, to ensure that they are sufficient and future- focused. As part of our regular review of the DMA, we will consider both impact and financial materiality (see page 46). More details on all our sustainability reporting and ESG disclosures can be found online www.bat.com/sustainability Our Sustainability Agenda Reducing the health impact of our business Excellence in Environmental management Climate Change Circular Economy Biodiversity & Ecosystems Water Delivering a positive Social impact Human Rights Farmer Livelihoods People, Diversity & Culture Robust corporate Governance Responsible Marketing & Transparent Communications Ethics & Integrity Sustainability Governance Creating shared value for Consumers Society Employees Shareholders & investors Read more on each of our Sustainability Agenda Material Topics across pages 50 to 93 BAT Annual Report and Form 20-F 2022 Strategic Report Governance Report Financial Statements Other Information Strategic Management ESG Front and Centre 44
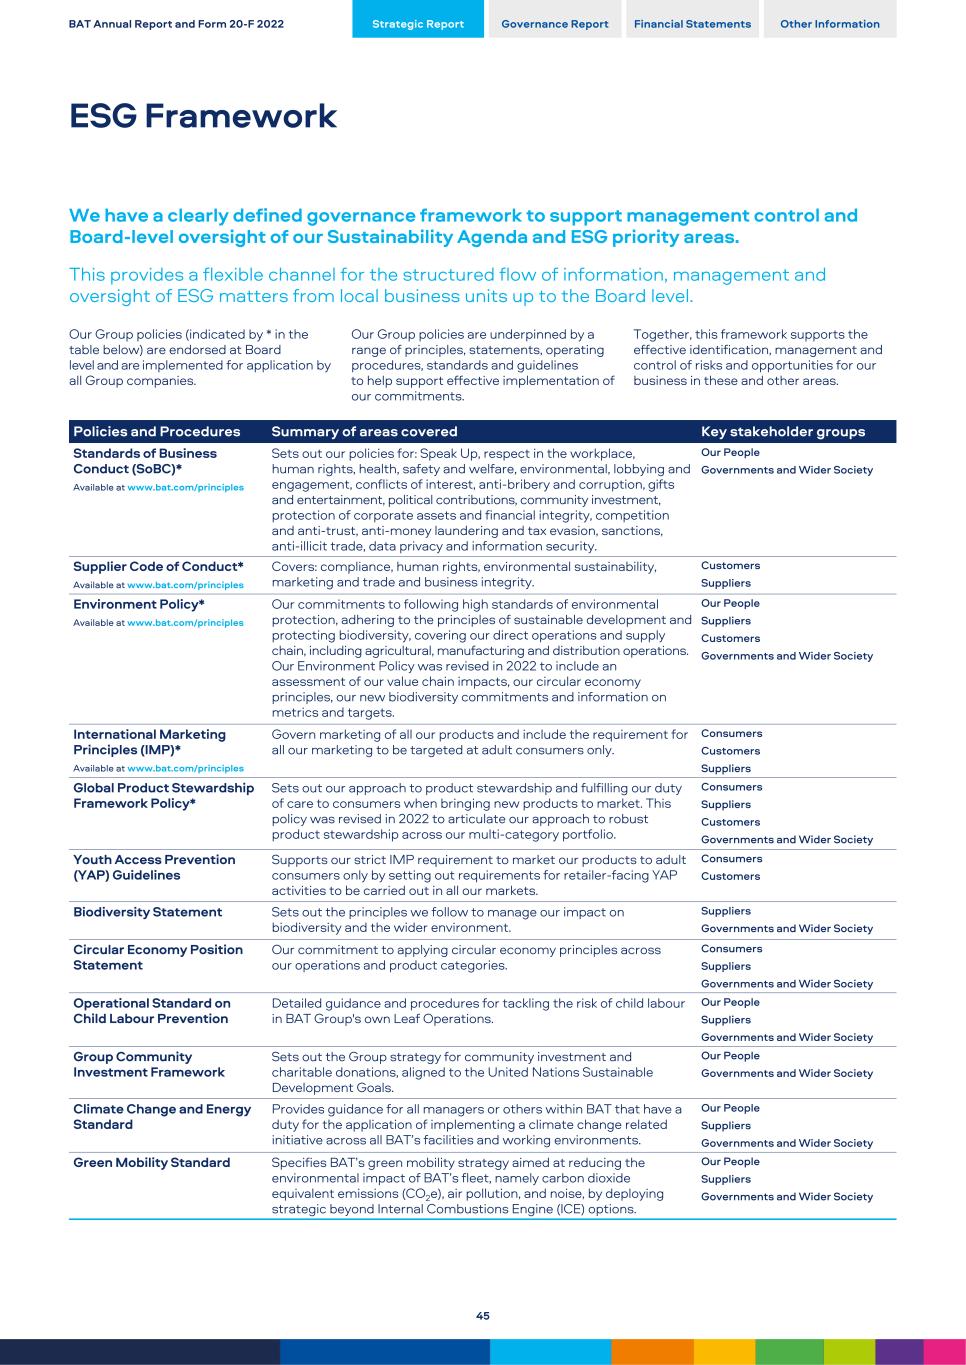
We have a clearly defined governance framework to support management control and Board-level oversight of our Sustainability Agenda and ESG priority areas. This provides a flexible channel for the structured flow of information, management and oversight of ESG matters from local business units up to the Board level. Our Group policies (indicated by * in the table below) are endorsed at Board level and are implemented for application by all Group companies. Our Group policies are underpinned by a range of principles, statements, operating procedures, standards and guidelines to help support effective implementation of our commitments. Together, this framework supports the effective identification, management and control of risks and opportunities for our business in these and other areas. Policies and Procedures Summary of areas covered Key stakeholder groups Standards of Business Conduct (SoBC)* Available at www.bat.com/principles Sets out our policies for: Speak Up, respect in the workplace, human rights, health, safety and welfare, environmental, lobbying and engagement, conflicts of interest, anti-bribery and corruption, gifts and entertainment, political contributions, community investment, protection of corporate assets and financial integrity, competition and anti-trust, anti-money laundering and tax evasion, sanctions, anti-illicit trade, data privacy and information security. Our People Governments and Wider Society Supplier Code of Conduct* Available at www.bat.com/principles Covers: compliance, human rights, environmental sustainability, marketing and trade and business integrity. Customers Suppliers Environment Policy* Available at www.bat.com/principles Our commitments to following high standards of environmental protection, adhering to the principles of sustainable development and protecting biodiversity, covering our direct operations and supply chain, including agricultural, manufacturing and distribution operations. Our Environment Policy was revised in 2022 to include an assessment of our value chain impacts, our circular economy principles, our new biodiversity commitments and information on metrics and targets. Our People Suppliers Customers Governments and Wider Society International Marketing Principles (IMP)* Available at www.bat.com/principles Govern marketing of all our products and include the requirement for all our marketing to be targeted at adult consumers only. Consumers Customers Suppliers Global Product Stewardship Framework Policy* Sets out our approach to product stewardship and fulfilling our duty of care to consumers when bringing new products to market. This policy was revised in 2022 to articulate our approach to robust product stewardship across our multi-category portfolio. Consumers Suppliers Customers Governments and Wider Society Youth Access Prevention (YAP) Guidelines Supports our strict IMP requirement to market our products to adult consumers only by setting out requirements for retailer-facing YAP activities to be carried out in all our markets. Consumers Customers Biodiversity Statement Sets out the principles we follow to manage our impact on biodiversity and the wider environment. Suppliers Governments and Wider Society Circular Economy Position Statement Our commitment to applying circular economy principles across our operations and product categories. Consumers Suppliers Governments and Wider Society Operational Standard on Child Labour Prevention Detailed guidance and procedures for tackling the risk of child labour in BAT Group's own Leaf Operations. Our People Suppliers Governments and Wider Society Group Community Investment Framework Sets out the Group strategy for community investment and charitable donations, aligned to the United Nations Sustainable Development Goals. Our People Governments and Wider Society Climate Change and Energy Standard Provides guidance for all managers or others within BAT that have a duty for the application of implementing a climate change related initiative across all BAT’s facilities and working environments. Our People Suppliers Governments and Wider Society Green Mobility Standard Specifies BAT’s green mobility strategy aimed at reducing the environmental impact of BAT’s fleet, namely carbon dioxide equivalent emissions (CO2e), air pollution, and noise, by deploying strategic beyond Internal Combustions Engine (ICE) options. Our People Suppliers Governments and Wider Society BAT Annual Report and Form 20-F 2022 Strategic Report Governance Report Financial Statements Other Information ESG Framework 45
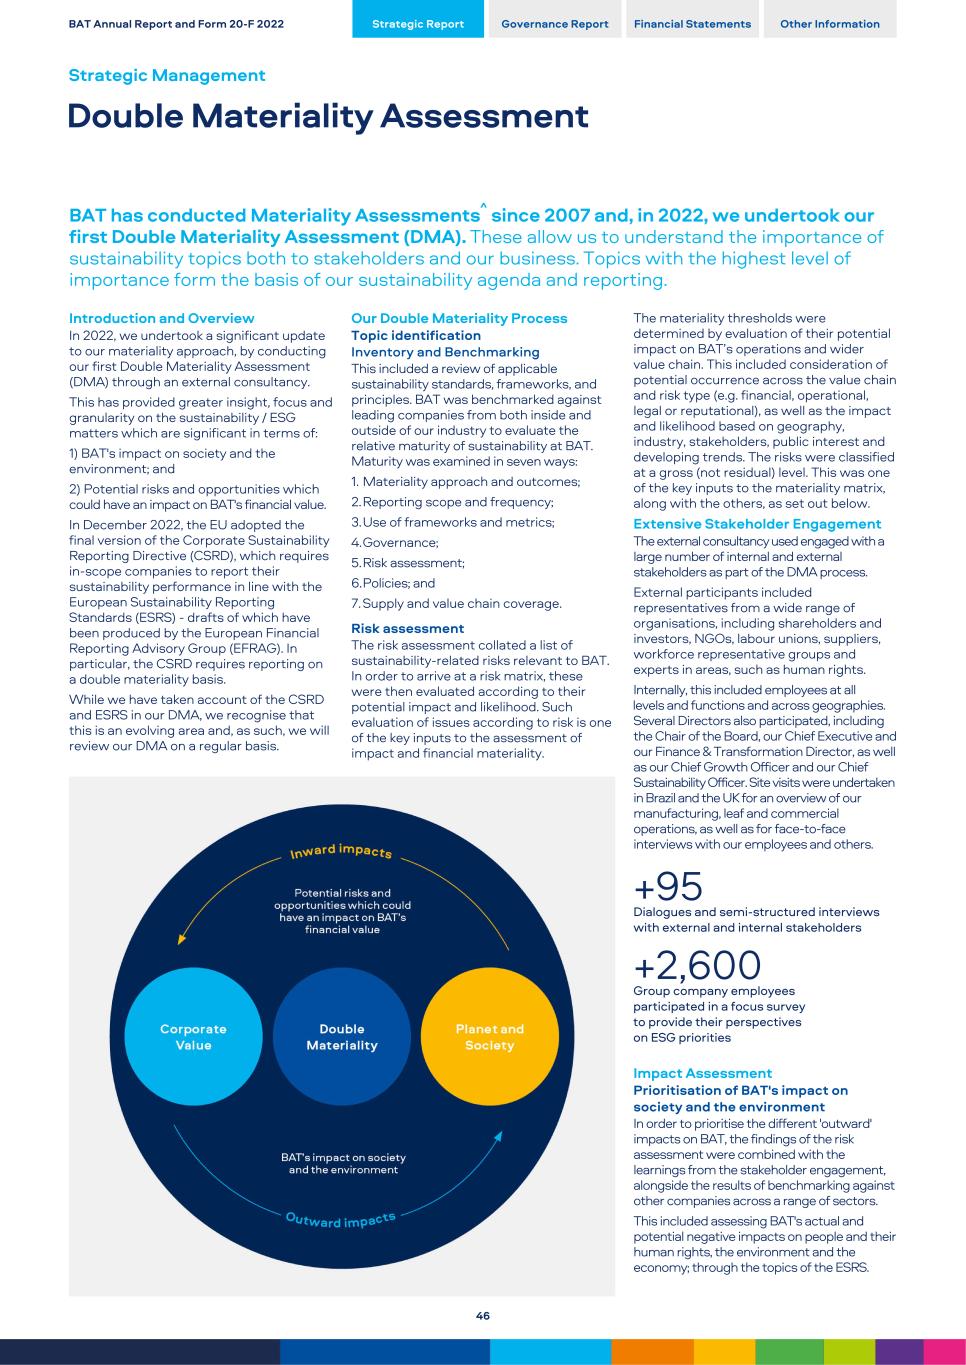
BAT has conducted Materiality Assessments^ since 2007 and, in 2022, we undertook our first Double Materiality Assessment (DMA). These allow us to understand the importance of sustainability topics both to stakeholders and our business. Topics with the highest level of importance form the basis of our sustainability agenda and reporting. Introduction and Overview In 2022, we undertook a significant update to our materiality approach, by conducting our first Double Materiality Assessment (DMA) through an external consultancy. This has provided greater insight, focus and granularity on the sustainability / ESG matters which are significant in terms of: 1) BAT's impact on society and the environment; and 2) Potential risks and opportunities which could have an impact on BAT's financial value. In December 2022, the EU adopted the final version of the Corporate Sustainability Reporting Directive (CSRD), which requires in-scope companies to report their sustainability performance in line with the European Sustainability Reporting Standards (ESRS) - drafts of which have been produced by the European Financial Reporting Advisory Group (EFRAG). In particular, the CSRD requires reporting on a double materiality basis. While we have taken account of the CSRD and ESRS in our DMA, we recognise that this is an evolving area and, as such, we will review our DMA on a regular basis. Our Double Materiality Process Topic identification Inventory and Benchmarking This included a review of applicable sustainability standards, frameworks, and principles. BAT was benchmarked against leading companies from both inside and outside of our industry to evaluate the relative maturity of sustainability at BAT. Maturity was examined in seven ways: 1. Materiality approach and outcomes; 2.Reporting scope and frequency; 3.Use of frameworks and metrics; 4.Governance; 5.Risk assessment; 6.Policies; and 7.Supply and value chain coverage. Risk assessment The risk assessment collated a list of sustainability-related risks relevant to BAT. In order to arrive at a risk matrix, these were then evaluated according to their potential impact and likelihood. Such evaluation of issues according to risk is one of the key inputs to the assessment of impact and financial materiality. The materiality thresholds were determined by evaluation of their potential impact on BAT’s operations and wider value chain. This included consideration of potential occurrence across the value chain and risk type (e.g. financial, operational, legal or reputational), as well as the impact and likelihood based on geography, industry, stakeholders, public interest and developing trends. The risks were classified at a gross (not residual) level. This was one of the key inputs to the materiality matrix, along with the others, as set out below. Extensive Stakeholder Engagement The external consultancy used engaged with a large number of internal and external stakeholders as part of the DMA process. External participants included representatives from a wide range of organisations, including shareholders and investors, NGOs, labour unions, suppliers, workforce representative groups and experts in areas, such as human rights. Internally, this included employees at all levels and functions and across geographies. Several Directors also participated, including the Chair of the Board, our Chief Executive and our Finance & Transformation Director, as well as our Chief Growth Officer and our Chief Sustainability Officer. Site visits were undertaken in Brazil and the UK for an overview of our manufacturing, leaf and commercial operations, as well as for face-to-face interviews with our employees and others. +95 Dialogues and semi-structured interviews with external and internal stakeholders +2,600 Group company employees participated in a focus survey to provide their perspectives on ESG priorities Impact Assessment Prioritisation of BAT's impact on society and the environment In order to prioritise the different 'outward' impacts on BAT, the findings of the risk assessment were combined with the learnings from the stakeholder engagement, alongside the results of benchmarking against other companies across a range of sectors. This included assessing BAT's actual and potential negative impacts on people and their human rights, the environment and the economy; through the topics of the ESRS. BAT Annual Report and Form 20-F 2022 Strategic Report Governance Report Financial Statements Other Information Strategic Management Double Materiality Assessment 46
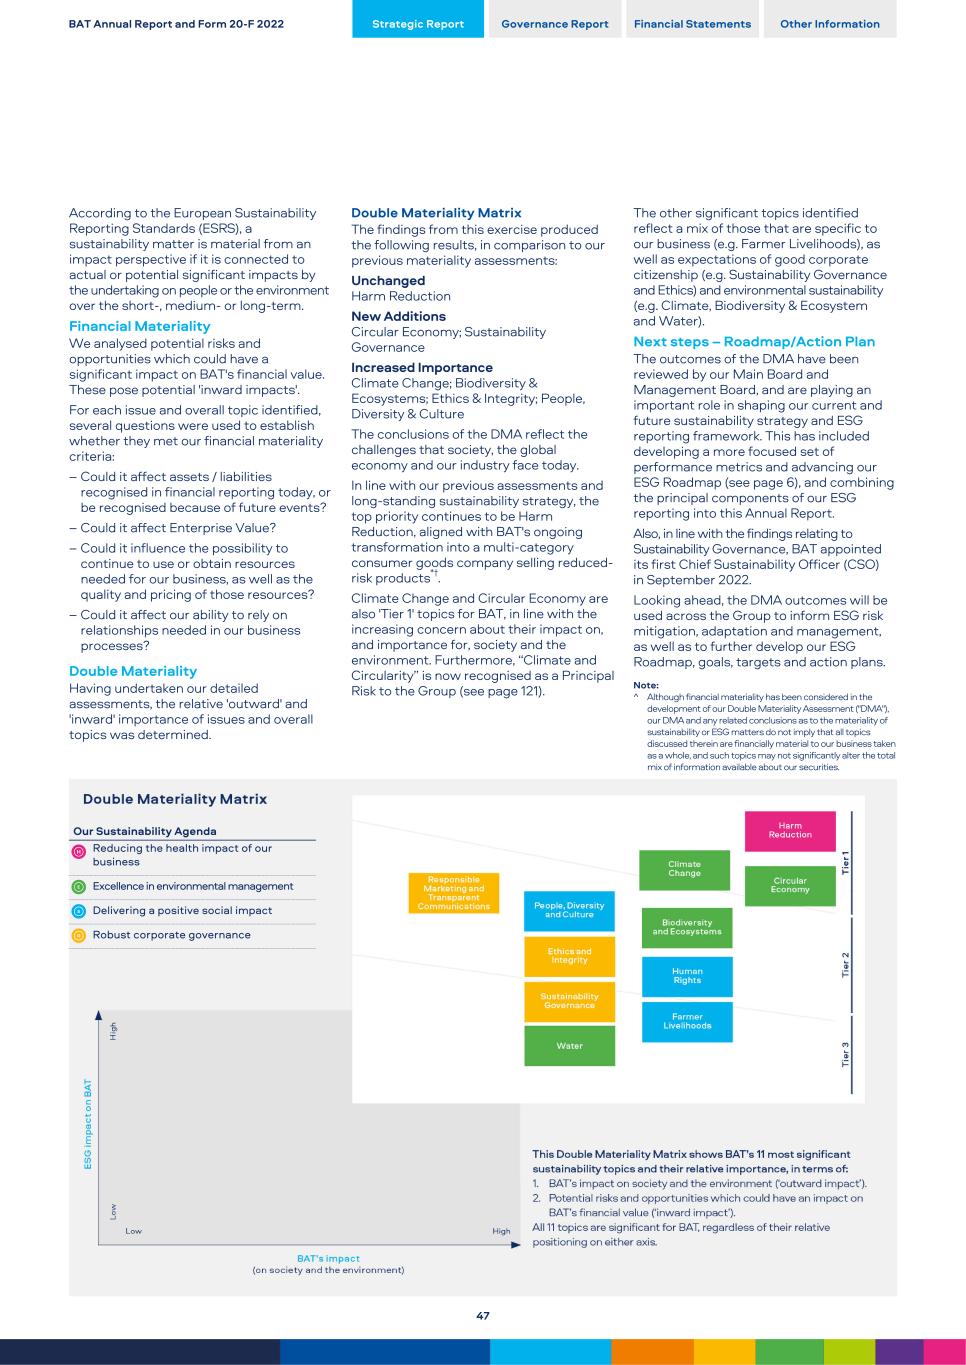
According to the European Sustainability Reporting Standards (ESRS), a sustainability matter is material from an impact perspective if it is connected to actual or potential significant impacts by the undertaking on people or the environment over the short-, medium- or long-term. Financial Materiality We analysed potential risks and opportunities which could have a significant impact on BAT's financial value. These pose potential 'inward impacts'. For each issue and overall topic identified, several questions were used to establish whether they met our financial materiality criteria: – Could it affect assets / liabilities recognised in financial reporting today, or be recognised because of future events? – Could it affect Enterprise Value? – Could it influence the possibility to continue to use or obtain resources needed for our business, as well as the quality and pricing of those resources? – Could it affect our ability to rely on relationships needed in our business processes? Double Materiality Having undertaken our detailed assessments, the relative 'outward' and 'inward' importance of issues and overall topics was determined. Our Sustainability Agenda Reducing the health impact of our business Excellence in environmental management Delivering a positive social impact Robust corporate governance Double Materiality Matrix The findings from this exercise produced the following results, in comparison to our previous materiality assessments: Unchanged Harm Reduction New Additions Circular Economy; Sustainability Governance Increased Importance Climate Change; Biodiversity & Ecosystems; Ethics & Integrity; People, Diversity & Culture The conclusions of the DMA reflect the challenges that society, the global economy and our industry face today. In line with our previous assessments and long-standing sustainability strategy, the top priority continues to be Harm Reduction, aligned with BAT's ongoing transformation into a multi-category consumer goods company selling reduced- risk products*†.  Climate Change and Circular Economy are also 'Tier 1' topics for BAT, in line with the increasing concern about their impact on, and importance for, society and the environment. Furthermore, “Climate and Circularity” is now recognised as a Principal Risk to the Group (see page 121). The other significant topics identified reflect a mix of those that are specific to our business (e.g. Farmer Livelihoods), as well as expectations of good corporate citizenship (e.g. Sustainability Governance and Ethics) and environmental sustainability (e.g. Climate, Biodiversity & Ecosystem and Water). Next steps – Roadmap/Action Plan The outcomes of the DMA have been reviewed by our Main Board and Management Board, and are playing an important role in shaping our current and future sustainability strategy and ESG reporting framework. This has included developing a more focused set of performance metrics and advancing our ESG Roadmap (see page 6), and combining the principal components of our ESG reporting into this Annual Report. Also, in line with the findings relating to Sustainability Governance, BAT appointed its first Chief Sustainability Officer (CSO) in September 2022. Looking ahead, the DMA outcomes will be used across the Group to inform ESG risk mitigation, adaptation and management, as well as to further develop our ESG Roadmap, goals, targets and action plans. Note: ^ Although financial materiality has been considered in the development of our Double Materiality Assessment ("DMA"), our DMA and any related conclusions as to the materiality of sustainability or ESG matters do not imply that all topics discussed therein are financially material to our business taken as a whole, and such topics may not significantly alter the total mix of information available about our securities. BAT Annual Report and Form 20-F 2022 Strategic Report Governance Report Financial Statements Other Information 47
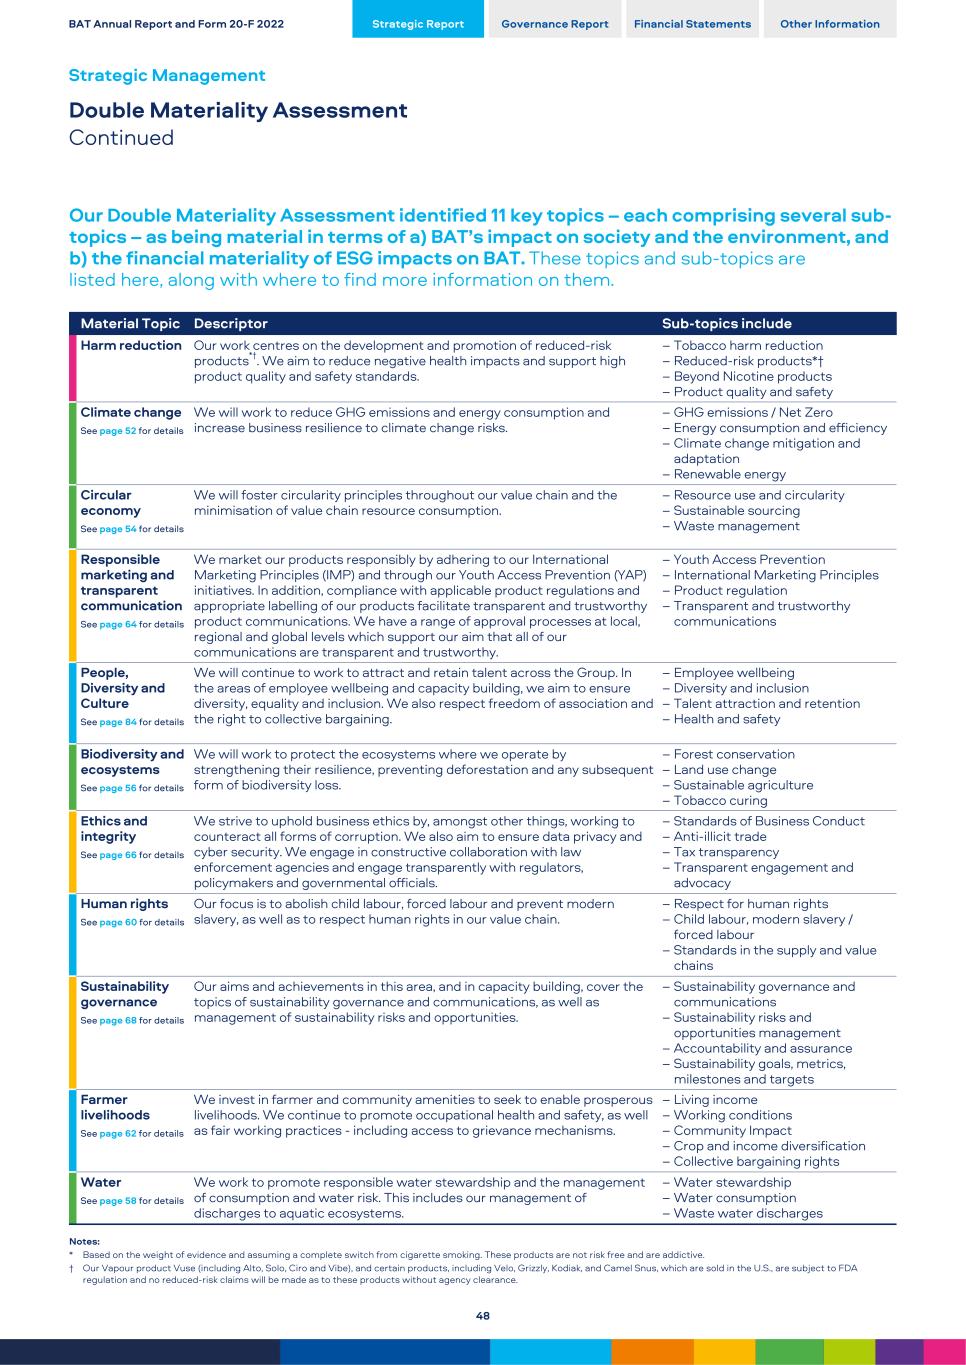
Our Double Materiality Assessment identified 11 key topics – each comprising several sub- topics – as being material in terms of a) BAT’s impact on society and the environment, and b) the financial materiality of ESG impacts on BAT. These topics and sub-topics are listed here, along with where to find more information on them. Material Topic Descriptor Sub-topics include Harm reduction Our work centres on the development and promotion of reduced-risk products*†. We aim to reduce negative health impacts and support high product quality and safety standards. – Tobacco harm reduction – Reduced-risk products*† – Beyond Nicotine products – Product quality and safety Climate change See page 52 for details We will work to reduce GHG emissions and energy consumption and increase business resilience to climate change risks. – GHG emissions / Net Zero – Energy consumption and efficiency – Climate change mitigation and adaptation – Renewable energy Circular economy See page 54 for details We will foster circularity principles throughout our value chain and the minimisation of value chain resource consumption. – Resource use and circularity – Sustainable sourcing – Waste management Responsible marketing and transparent communication See page 64 for details We market our products responsibly by adhering to our International Marketing Principles (IMP) and through our Youth Access Prevention (YAP) initiatives. In addition, compliance with applicable product regulations and appropriate labelling of our products facilitate transparent and trustworthy product communications. We have a range of approval processes at local, regional and global levels which support our aim that all of our communications are transparent and trustworthy. – Youth Access Prevention – International Marketing Principles – Product regulation – Transparent and trustworthy communications People, Diversity and Culture See page 84 for details We will continue to work to attract and retain talent across the Group. In the areas of employee wellbeing and capacity building, we aim to ensure diversity, equality and inclusion. We also respect freedom of association and the right to collective bargaining. – Employee wellbeing – Diversity and inclusion – Talent attraction and retention – Health and safety Biodiversity and ecosystems See page 56 for details We will work to protect the ecosystems where we operate by strengthening their resilience, preventing deforestation and any subsequent form of biodiversity loss. – Forest conservation – Land use change – Sustainable agriculture – Tobacco curing Ethics and integrity See page 66 for details We strive to uphold business ethics by, amongst other things, working to counteract all forms of corruption. We also aim to ensure data privacy and cyber security. We engage in constructive collaboration with law enforcement agencies and engage transparently with regulators, policymakers and governmental officials. – Standards of Business Conduct – Anti-illicit trade – Tax transparency – Transparent engagement and advocacy Human rights See page 60 for details Our focus is to abolish child labour, forced labour and prevent modern slavery, as well as to respect human rights in our value chain. – Respect for human rights – Child labour, modern slavery / forced labour – Standards in the supply and value chains Sustainability governance See page 68 for details Our aims and achievements in this area, and in capacity building, cover the topics of sustainability governance and communications, as well as management of sustainability risks and opportunities. – Sustainability governance and communications – Sustainability risks and opportunities management – Accountability and assurance – Sustainability goals, metrics, milestones and targets Farmer livelihoods See page 62 for details We invest in farmer and community amenities to seek to enable prosperous livelihoods. We continue to promote occupational health and safety, as well as fair working practices - including access to grievance mechanisms. – Living income – Working conditions – Community Impact – Crop and income diversification – Collective bargaining rights Water See page 58 for details We work to promote responsible water stewardship and the management of consumption and water risk. This includes our management of discharges to aquatic ecosystems. – Water stewardship – Water consumption – Waste water discharges Notes: * Based on the weight of evidence and assuming a complete switch from cigarette smoking. These products are not risk free and are addictive. † Our Vapour product Vuse (including Alto, Solo, Ciro and Vibe), and certain products, including Velo, Grizzly, Kodiak, and Camel Snus, which are sold in the U.S., are subject to FDA regulation and no reduced-risk claims will be made as to these products without agency clearance. BAT Annual Report and Form 20-F 2022 Strategic Report Governance Report Financial Statements Other Information Strategic Management Double Materiality Assessment Continued 48
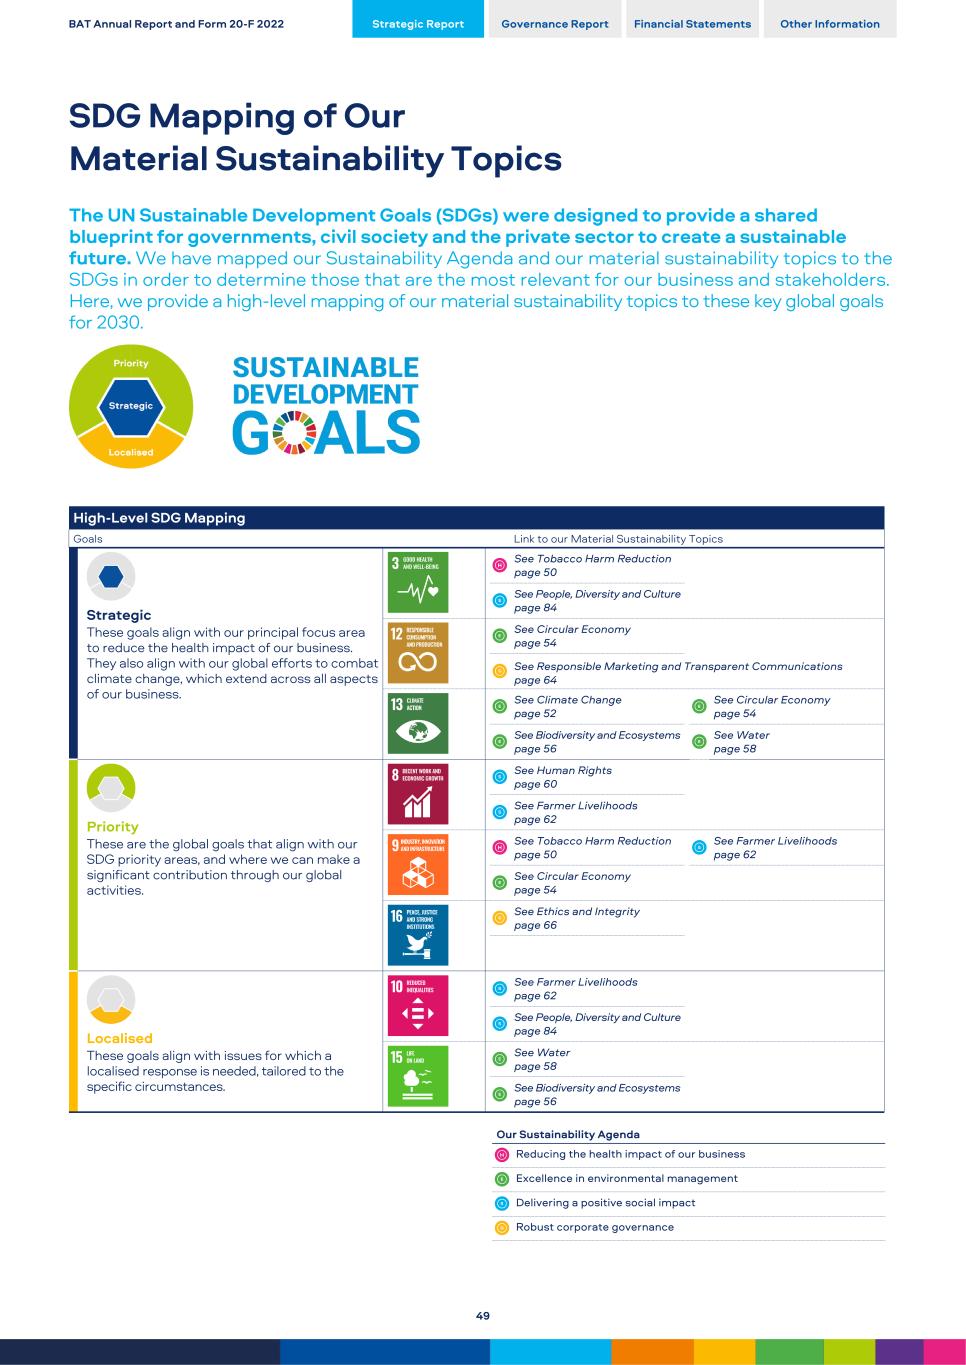
High-Level SDG Mapping Goals Link to our Material Sustainability Topics Strategic These goals align with our principal focus area to reduce the health impact of our business. They also align with our global efforts to combat climate change, which extend across all aspects of our business. See Tobacco Harm Reduction page 50 See People, Diversity and Culture page 84 See Circular Economy page 54 See Responsible Marketing and Transparent Communications page 64 See Climate Change page 52 See Circular Economy page 54 See Biodiversity and Ecosystems page 56 See Water page 58 Priority These are the global goals that align with our SDG priority areas, and where we can make a significant contribution through our global activities. See Human Rights page 60 See Farmer Livelihoods page 62 See Tobacco Harm Reduction page 50 See Farmer Livelihoods page 62 See Circular Economy page 54 See Ethics and Integrity page 66 Localised These goals align with issues for which a localised response is needed, tailored to the specific circumstances. See Farmer Livelihoods page 62 See People, Diversity and Culture page 84 See Water page 58 See Biodiversity and Ecosystems page 56 Our Sustainability Agenda Reducing the health impact of our business Excellence in environmental management Delivering a positive social impact Robust corporate governance BAT Annual Report and Form 20-F 2022 Strategic Report Governance Report Financial Statements Other Information SDG Mapping of Our Material Sustainability Topics The UN Sustainable Development Goals (SDGs) were designed to provide a shared blueprint for governments, civil society and the private sector to create a sustainable future. We have mapped our Sustainability Agenda and our material sustainability topics to the SDGs in order to determine those that are the most relevant for our business and stakeholders. Here, we provide a high-level mapping of our material sustainability topics to these key global goals for 2030. 49
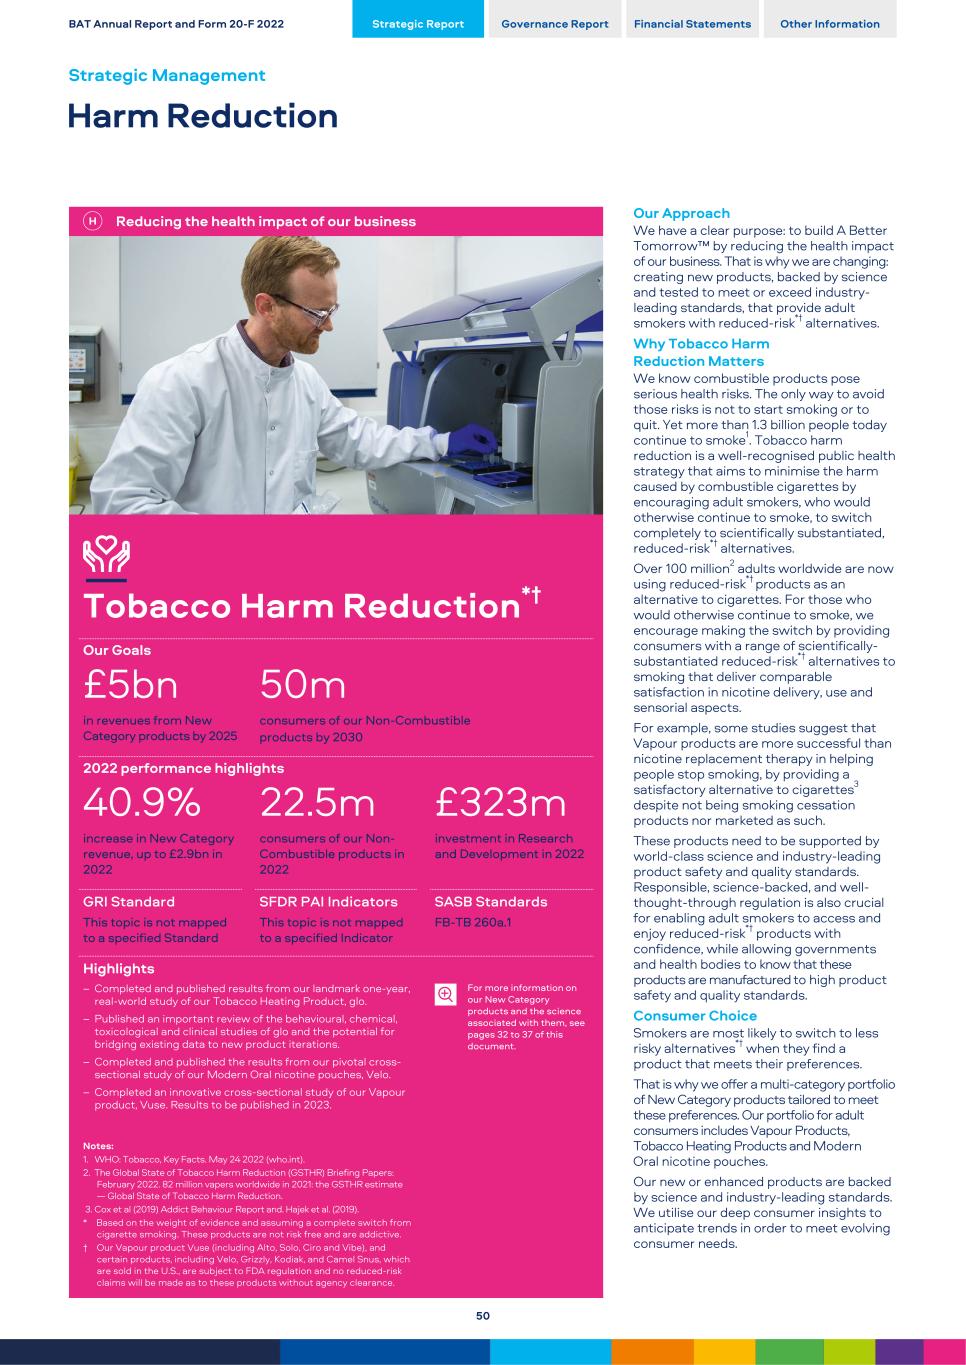
Reducing the health impact of our business Tobacco Harm Reduction*† Our Goals £5bn 50m in revenues from New Category products by 2025 consumers of our Non-Combustible products by 2030 2022 performance highlights 40.9% 22.5m £323m increase in New Category revenue, up to £2.9bn in 2022 consumers of our Non- Combustible products in 2022 investment in Research and Development in 2022 GRI Standard SFDR PAI Indicators SASB Standards This topic is not mapped to a specified Standard This topic is not mapped to a specified Indicator FB-TB 260a.1 Highlights – Completed and published results from our landmark one-year, real-world study of our Tobacco Heating Product, glo. – Published an important review of the behavioural, chemical, toxicological and clinical studies of glo and the potential for bridging existing data to new product iterations. – Completed and published the results from our pivotal cross- sectional study of our Modern Oral nicotine pouches, Velo. – Completed an innovative cross-sectional study of our Vapour product, Vuse. Results to be published in 2023. Notes: 1. WHO: Tobacco, Key Facts. May 24 2022 (who.int). 2. The Global State of Tobacco Harm Reduction (GSTHR) Briefing Papers: February 2022. 82 million vapers worldwide in 2021: the GSTHR estimate — Global State of Tobacco Harm Reduction. 3. Cox et al (2019) Addict Behaviour Report and. Hajek et al. (2019). * Based on the weight of evidence and assuming a complete switch from cigarette smoking. These products are not risk free and are addictive. † Our Vapour product Vuse (including Alto, Solo, Ciro and Vibe), and certain products, including Velo, Grizzly, Kodiak, and Camel Snus, which are sold in the U.S., are subject to FDA regulation and no reduced-risk claims will be made as to these products without agency clearance. For more information on our New Category products and the science associated with them, see pages 32 to 37 of this document. Our Approach We have a clear purpose: to build A Better Tomorrow™ by reducing the health impact of our business. That is why we are changing: creating new products, backed by science and tested to meet or exceed industry- leading standards, that provide adult smokers with reduced-risk*† alternatives. Why Tobacco Harm Reduction Matters We know combustible products pose serious health risks. The only way to avoid those risks is not to start smoking or to quit. Yet more than 1.3 billion people today continue to smoke1. Tobacco harm reduction is a well-recognised public health strategy that aims to minimise the harm caused by combustible cigarettes by encouraging adult smokers, who would otherwise continue to smoke, to switch completely to scientifically substantiated, reduced-risk*† alternatives. Over 100 million2 adults worldwide are now using reduced-risk*† products as an alternative to cigarettes. For those who would otherwise continue to smoke, we encourage making the switch by providing consumers with a range of scientifically- substantiated reduced-risk*† alternatives to smoking that deliver comparable satisfaction in nicotine delivery, use and sensorial aspects. For example, some studies suggest that Vapour products are more successful than nicotine replacement therapy in helping people stop smoking, by providing a satisfactory alternative to cigarettes3 despite not being smoking cessation products nor marketed as such. These products need to be supported by world-class science and industry-leading product safety and quality standards. Responsible, science-backed, and well- thought-through regulation is also crucial for enabling adult smokers to access and enjoy reduced-risk*† products with confidence, while allowing governments and health bodies to know that these products are manufactured to high product safety and quality standards. Consumer Choice Smokers are most likely to switch to less risky alternatives*† when they find a product that meets their preferences. That is why we offer a multi-category portfolio of New Category products tailored to meet these preferences. Our portfolio for adult consumers includes Vapour Products, Tobacco Heating Products and Modern Oral nicotine pouches. Our new or enhanced products are backed by science and industry-leading standards. We utilise our deep consumer insights to anticipate trends in order to meet evolving consumer needs. BAT Annual Report and Form 20-F 2022 Strategic Report Governance Report Financial Statements Other Information Strategic Management Harm Reduction 50
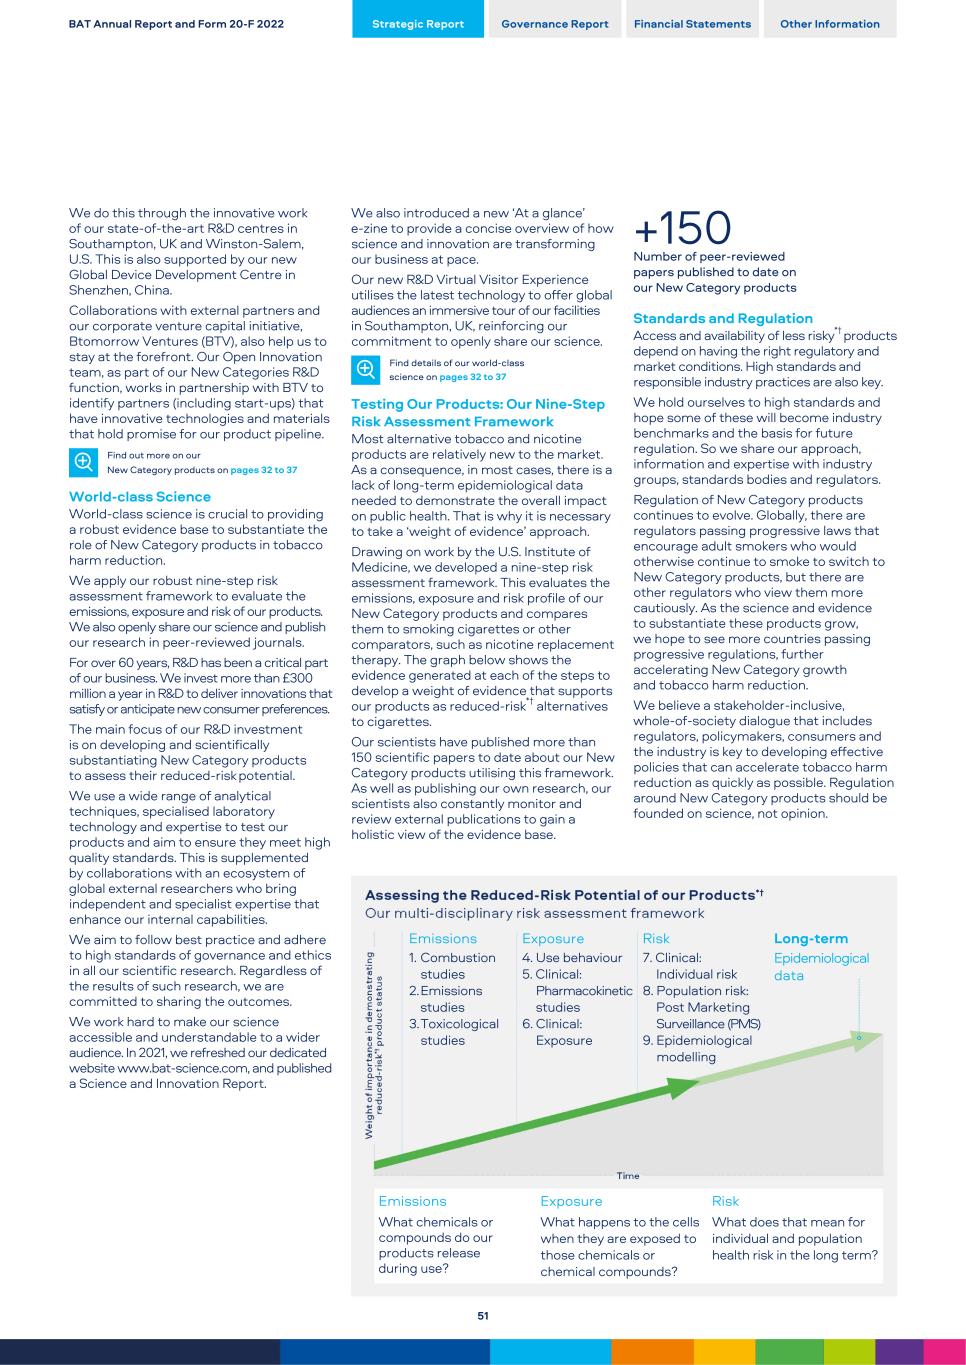
We do this through the innovative work of our state-of-the-art R&D centres in Southampton, UK and Winston-Salem, U.S. This is also supported by our new Global Device Development Centre in Shenzhen, China. Collaborations with external partners and our corporate venture capital initiative, Btomorrow Ventures (BTV), also help us to stay at the forefront. Our Open Innovation team, as part of our New Categories R&D function, works in partnership with BTV to identify partners (including start-ups) that have innovative technologies and materials that hold promise for our product pipeline. Find out more on our New Category products on pages 32 to 37 World-class Science World-class science is crucial to providing a robust evidence base to substantiate the role of New Category products in tobacco harm reduction. We apply our robust nine-step risk assessment framework to evaluate the emissions, exposure and risk of our products. We also openly share our science and publish our research in peer-reviewed journals. For over 60 years, R&D has been a critical part of our business. We invest more than £300 million a year in R&D to deliver innovations that satisfy or anticipate new consumer preferences. The main focus of our R&D investment is on developing and scientifically substantiating New Category products to assess their reduced-risk potential. We use a wide range of analytical techniques, specialised laboratory technology and expertise to test our products and aim to ensure they meet high quality standards. This is supplemented by collaborations with an ecosystem of global external researchers who bring independent and specialist expertise that enhance our internal capabilities. We aim to follow best practice and adhere to high standards of governance and ethics in all our scientific research. Regardless of the results of such research, we are committed to sharing the outcomes. We work hard to make our science accessible and understandable to a wider audience. In 2021, we refreshed our dedicated website www.bat-science.com, and published a Science and Innovation Report. We also introduced a new ‘At a glance’ e-zine to provide a concise overview of how science and innovation are transforming our business at pace. Our new R&D Virtual Visitor Experience utilises the latest technology to offer global audiences an immersive tour of our facilities in Southampton, UK, reinforcing our commitment to openly share our science. Find details of our world-class science on pages 32 to 37 Testing Our Products: Our Nine-Step Risk Assessment Framework Most alternative tobacco and nicotine products are relatively new to the market. As a consequence, in most cases, there is a lack of long-term epidemiological data needed to demonstrate the overall impact on public health. That is why it is necessary to take a ‘weight of evidence’ approach. Drawing on work by the U.S. Institute of Medicine, we developed a nine-step risk assessment framework. This evaluates the emissions, exposure and risk profile of our New Category products and compares them to smoking cigarettes or other comparators, such as nicotine replacement therapy. The graph below shows the evidence generated at each of the steps to develop a weight of evidence that supports our products as reduced-risk*† alternatives to cigarettes. Our scientists have published more than 150 scientific papers to date about our New Category products utilising this framework. As well as publishing our own research, our scientists also constantly monitor and review external publications to gain a holistic view of the evidence base. Emissions Exposure Risk Long-term 1. Combustion studies 2.Emissions studies 3.Toxicological studies 4. Use behaviour 5. Clinical: Pharmacokinetic studies 6. Clinical: Exposure 7. Clinical: Individual risk 8. Population risk: Post Marketing Surveillance (PMS) 9. Epidemiological modelling Epidemiological data Emissions Exposure Risk What chemicals or compounds do our products release during use? What happens to the cells when they are exposed to those chemicals or chemical compounds? What does that mean for individual and population health risk in the long term? +150 Number of peer-reviewed papers published to date on our New Category products Standards and Regulation Access and availability of less risky*† products depend on having the right regulatory and market conditions. High standards and responsible industry practices are also key. We hold ourselves to high standards and hope some of these will become industry benchmarks and the basis for future regulation. So we share our approach, information and expertise with industry groups, standards bodies and regulators. Regulation of New Category products continues to evolve. Globally, there are regulators passing progressive laws that encourage adult smokers who would otherwise continue to smoke to switch to New Category products, but there are other regulators who view them more cautiously. As the science and evidence to substantiate these products grow, we hope to see more countries passing progressive regulations, further accelerating New Category growth and tobacco harm reduction. We believe a stakeholder-inclusive, whole-of-society dialogue that includes regulators, policymakers, consumers and the industry is key to developing effective policies that can accelerate tobacco harm reduction as quickly as possible. Regulation around New Category products should be founded on science, not opinion. BAT Annual Report and Form 20-F 2022 Strategic Report Governance Report Financial Statements Other Information 51
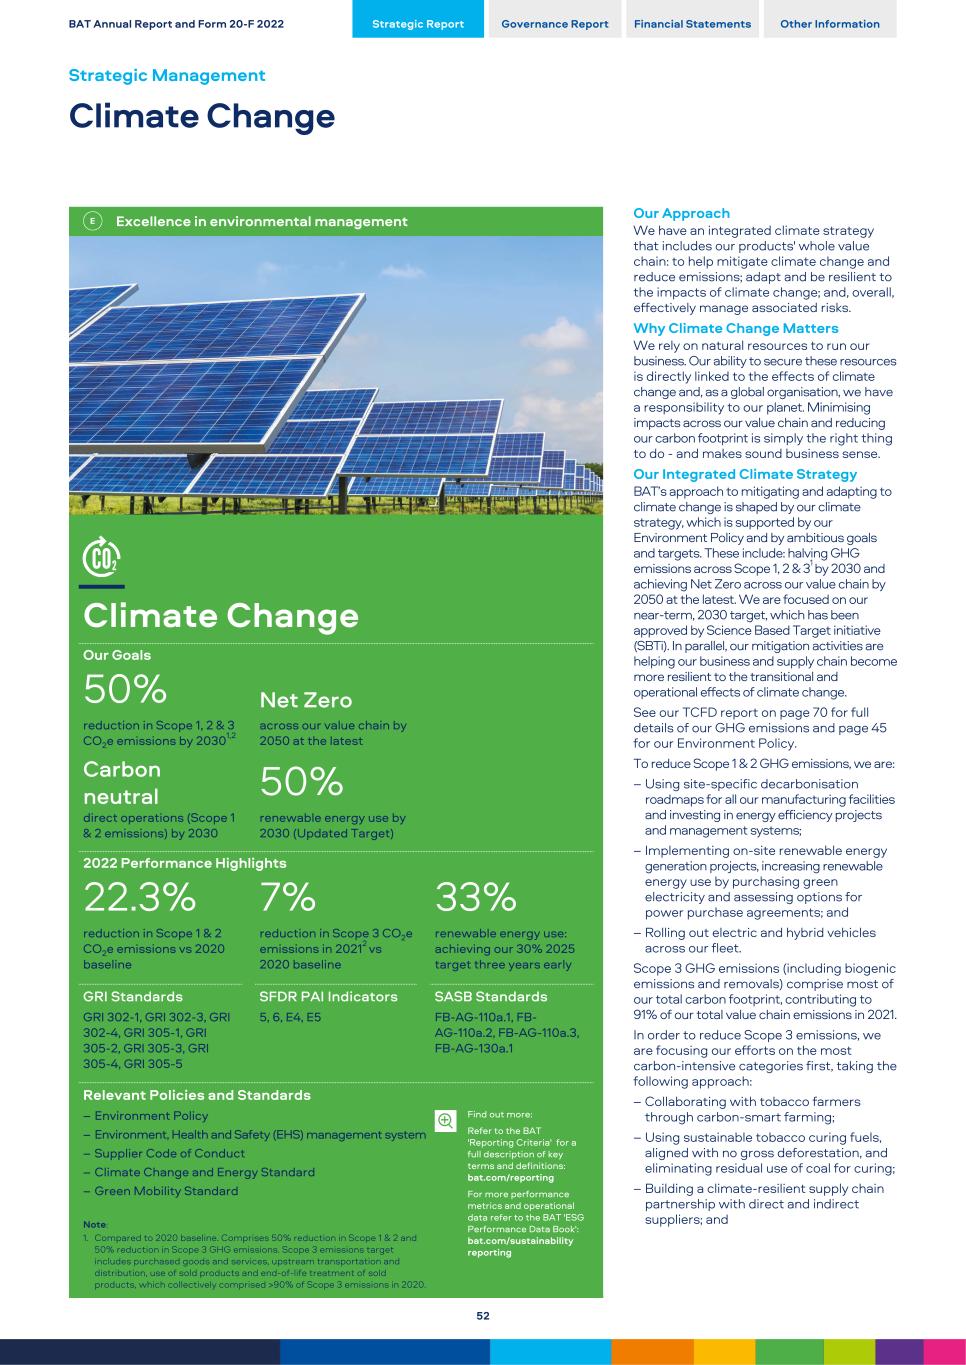
Excellence in environmental management Climate Change Our Goals 50% Net Zero reduction in Scope 1, 2 & 3 CO2e emissions by 20301,2 across our value chain by 2050 at the latest Carbon neutral 50% direct operations (Scope 1 & 2 emissions) by 2030 renewable energy use by 2030 (Updated Target) 2022 Performance Highlights 22.3% 7% 33% reduction in Scope 1 & 2 CO2e emissions vs 2020 baseline reduction in Scope 3 CO2e emissions in 20212 vs 2020 baseline renewable energy use: achieving our 30% 2025 target three years early GRI Standards SFDR PAI Indicators SASB Standards GRI 302-1, GRI 302-3, GRI 302-4, GRI 305-1, GRI 305-2, GRI 305-3, GRI 305-4, GRI 305-5 5, 6, E4, E5 FB-AG-110a.1, FB- AG-110a.2, FB-AG-110a.3, FB-AG-130a.1 Relevant Policies and Standards – Environment Policy – Environment, Health and Safety (EHS) management system – Supplier Code of Conduct – Climate Change and Energy Standard – Green Mobility Standard Note: 1. Compared to 2020 baseline. Comprises 50% reduction in Scope 1 & 2 and 50% reduction in Scope 3 GHG emissions. Scope 3 emissions target includes purchased goods and services, upstream transportation and distribution, use of sold products and end-of-life treatment of sold products, which collectively comprised >90% of Scope 3 emissions in 2020. Find out more: Refer to the BAT 'Reporting Criteria' for a full description of key terms and definitions: bat.com/reporting For more performance metrics and operational data refer to the BAT 'ESG Performance Data Book': bat.com/sustainability reporting Our Approach We have an integrated climate strategy that includes our products' whole value chain: to help mitigate climate change and reduce emissions; adapt and be resilient to the impacts of climate change; and, overall, effectively manage associated risks. Why Climate Change Matters We rely on natural resources to run our business. Our ability to secure these resources is directly linked to the effects of climate change and, as a global organisation, we have a responsibility to our planet. Minimising impacts across our value chain and reducing our carbon footprint is simply the right thing to do - and makes sound business sense. Our Integrated Climate Strategy BAT’s approach to mitigating and adapting to climate change is shaped by our climate strategy, which is supported by our Environment Policy and by ambitious goals and targets. These include: halving GHG emissions across Scope 1, 2 & 31 by 2030 and achieving Net Zero across our value chain by 2050 at the latest. We are focused on our near-term, 2030 target, which has been approved by Science Based Target initiative (SBTi). In parallel, our mitigation activities are helping our business and supply chain become more resilient to the transitional and operational effects of climate change. See our TCFD report on page 70 for full details of our GHG emissions and page 45 for our Environment Policy. To reduce Scope 1 & 2 GHG emissions, we are: – Using site-specific decarbonisation roadmaps for all our manufacturing facilities and investing in energy efficiency projects and management systems; – Implementing on-site renewable energy generation projects, increasing renewable energy use by purchasing green electricity and assessing options for power purchase agreements; and – Rolling out electric and hybrid vehicles across our fleet. Scope 3 GHG emissions (including biogenic emissions and removals) comprise most of our total carbon footprint, contributing to 91% of our total value chain emissions in 2021. In order to reduce Scope 3 emissions, we are focusing our efforts on the most carbon-intensive categories first, taking the following approach: – Collaborating with tobacco farmers through carbon-smart farming; – Using sustainable tobacco curing fuels, aligned with no gross deforestation, and eliminating residual use of coal for curing; – Building a climate-resilient supply chain partnership with direct and indirect suppliers; and BAT Annual Report and Form 20-F 2022 Strategic Report Governance Report Financial Statements Other Information Strategic Management Climate Change 52
– Fostering a circular economy throughout our value chain by increasingly using readily recyclable materials, designing for end-of- life, and implementing product Take-Back schemes3 for our New Category devices. For more information on our decarbonisation strategy, read our Low-Carbon Transition Plan on www.bat.com/LCTP Scope 1 & 2: Decarbonising our Operations Our Climate Change and Energy Standard provides guidance and consistency on our approach to decarbonisation and its implementation across our global operations. In 2022, we continued to enhance our decarbonisation strategy by engaging with stakeholders and other third-parties, which is helping us address harder-to-tackle decarbonisation areas. For example, for Scope 1, we are assessing renewable hydrogen development based on region-specific factors. Additionally, we implemented initiatives which resulted in the reduction of some 10,000 tCO2e of emissions vs 2021. This is equivalent to 2% of our 2020 baseline. Initiatives included smart energy management systems that optimise consumption using artificial intelligence (AI), for example in Singapore, Mexico and Bangladesh; upgrading and replacing heating, lighting and air-conditioning systems; installing solar heating; and replacing fossil fuel boilers with low carbon alternatives, such as sustainable biomass in Germany and South Korea. We monitor energy consumption across our business by comparing production output to benchmarks, setting high-usage alarms, and having experienced staff available to monitor energy consumption and address breakdowns or faults. In 2022, we reduced our absolute Scope 1 & 2 GHG emissions by 120,000 tCO2e, vs 2020, a decrease of 22.3%. We continued to expand the number of externally verified carbon neutral sites4, reaching a total of 28 manufacturing and commercial facilities. At those carbon neutral sites, we purchased verified carbon offsets to offset the residual emissions. These credits are generated from projects such as improved forest management, afforestation and reforestation. Renewable energy: Accelerating our progress In 2022, 33% of our direct energy usage came from renewable sources, an increase of 4.3 pps from 2021. This includes biomass. By the end of 2022, 39 of our operations sites were purchasing 100% renewable electricity and 26 were generating renewable energy on-site, avoiding some 36,000 tCO2e emissions. In 2022, we achieved our 2025 target to increase our renewable energy use to 30%. In doing so, we have increased our target to reach 50% renewable energy use by 2030. For more information and a breakdown of our energy usage see our ESG Performance Data Book Our journey to reducing fleet emissions In 2022, our vehicle fleet accounted for approximately 20% of our Scope 1 & 2 GHG emissions. Our Green Mobility Standard outlines our strategy to reduce the environmental impact of our fleet. We are working with our fleet partners to transition to electric battery, plug-in hybrid and self-charging hybrid vehicles, for example, in Australia, Italy, the U.S., South Korea and Jordan. While we transition our fleet, we are also reducing associated emissions through several initiatives. We optimise travel routes through telematic systems in vehicles. These systems help alert drivers and us to improvements in driving that are designed to enhance both road safety, as well as fuel efficiency, which could lead to reduced emissions. Between 2020 and 2022, these combined efforts have reduced fleet emissions by around 10%. Scope 3: Engaging with our Value Chain Our Supplier Code of Conduct outlines the minimum expectations for suppliers, including specific elements related to environmental impacts and carbon reduction plans. To reach our near-term Scope 3 reduction target, we are focusing our efforts on our most carbon- intensive areas first, namely purchased tobacco and our largest direct and indirect suppliers of goods and services. Purchased Tobacco Tobacco growing is a key contributor to the emissions within our value chain. Almost 31% of our Scope 3 GHG emissions come from the tobacco we source, contributing 1,600,000 tCO2e in 2021, with the majority coming from fuels used to cure tobacco leaves. To help farmers reduce emissions, we have a range of initiatives covering farming practices, exploring new curing technologies, alternate fuel sources and new fertilisers with lower emissions, as well as ‘carbon-smart’ farming practices throughout the growing cycle. The aim of carbon-smart farming is to reduce emissions from farming activities, whilst removing carbon from the atmosphere through reforestation and reduction of soil disturbance. The programme is currently underway in the Group's own Leaf Operations in Brazil, Bangladesh, Mexico, Pakistan and the U.S. - which represent our highest directly contracted tobacco volumes. We are monitoring GHG emissions, removals and different agricultural practices in these countries to further develop and scale-up the programme as part of our broader climate strategy. The methods used also have additional benefits, such as increasing water retention capacity and improving drainage, as well as improving soil quality. As a result, many farmers are seeing increased yields and better-quality crops. We have continued to support the elimination of the residual use of coal as a fuel for curing. In 2022, the Group's own Leaf Operations in China and Vietnam eliminated coal from their tobacco curing and replaced it with biomass, thereby reducing the use of coal for curing across our purchased tobacco to around 5%. Direct and Indirect suppliers Group-wide, we have more than 30,000 direct and indirect suppliers. For example, we source product materials, such as paper and filters for cigarettes, THPs, and packaging for all our products. For our New Category products, we have a growing supply chain in consumer electronics and e-liquids. We also have a large number of suppliers of indirect goods and service, such as IT services and facilities management. In 2022, we invited over 200 priority suppliers to make climate change disclosures via CDP, with a completion rate of over 90%. We have also requested those suppliers to commit to a series of environmental pledges, including: – Submitting an annual climate change disclosure via CDP; – Setting science-based targets via SBTi; and – Initiatives to support removal and/or reduction of single-use plastics. We estimate c.50% of our direct and indirect supplier emissions can be attributed to 60 suppliers. By engaging with these suppliers through data collection, information sharing, direct discussions and asking them to participate in the CDP Supply Chain Programme, we are focusing on areas where we believe we can make the biggest impact. Our goal is to have 20% of suppliers of purchased goods and services by spend to set Science-Based Targets by 2025. At the end of 2022, we were more than half-way to achieving this goal, with 13% of suppliers having Science-Based Targets in place. In 2023, we will continue to engage with our purchased goods and services supply base. We are aiming to cover 95% of the emissions in this area through our engagement, to make further progress towards our Scope 3 target. For more information about our targets see TCFD report on page 70 Notes: 2. Due to the complexity of consolidating and assuring Scope 3 data from our suppliers and value chain, we report Scope 3 data one year behind other metrics. 3. For more information on our approach to Take-Back schemes, see page 55 4. BAT's carbon neutral sites are externally verified as adhering to internationally recognised standards / carbon neutrality methodologies such as PAS 2060 and purchase carbon credits verified by third parties, such as VCS, Gold Standard and American Carbon Registry, to offset residual emissions for which immediate plans do not offer financially viable and/or real emission reductions. BAT Annual Report and Form 20-F 2022 Strategic Report Governance Report Financial Statements Other Information 53
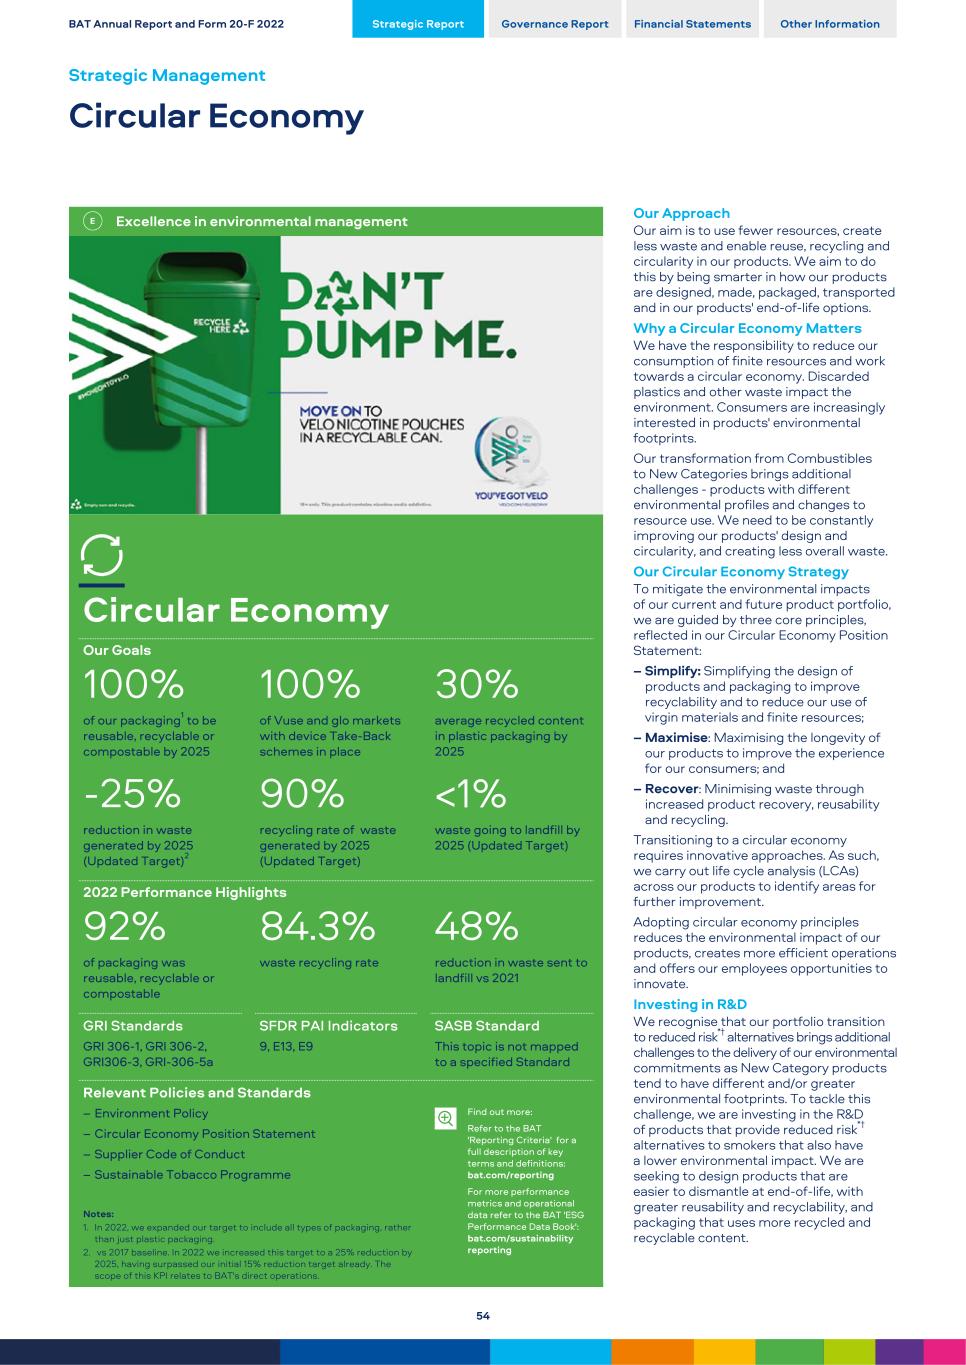
Excellence in environmental management Circular Economy Our Goals 100% 100% 30% of our packaging1 to be reusable, recyclable or compostable by 2025 of Vuse and glo markets with device Take-Back schemes in place average recycled content in plastic packaging by 2025 -25% 90% <1% reduction in waste generated by 2025 (Updated Target)2 recycling rate of waste generated by 2025 (Updated Target) waste going to landfill by 2025 (Updated Target) 2022 Performance Highlights 92% 84.3% 48% of packaging was reusable, recyclable or compostable waste recycling rate reduction in waste sent to landfill vs 2021 GRI Standards SFDR PAI Indicators SASB Standard GRI 306-1, GRI 306-2, GRI306-3, GRI-306-5a 9, E13, E9 This topic is not mapped to a specified Standard Relevant Policies and Standards – Environment Policy – Circular Economy Position Statement – Supplier Code of Conduct – Sustainable Tobacco Programme Notes: 1. In 2022, we expanded our target to include all types of packaging, rather than just plastic packaging. 2. vs 2017 baseline. In 2022 we increased this target to a 25% reduction by 2025, having surpassed our initial 15% reduction target already. The scope of this KPI relates to BAT's direct operations. Find out more: Refer to the BAT 'Reporting Criteria' for a full description of key terms and definitions: bat.com/reporting For more performance metrics and operational data refer to the BAT 'ESG Performance Data Book': bat.com/sustainability reporting Our Approach Our aim is to use fewer resources, create less waste and enable reuse, recycling and circularity in our products. We aim to do this by being smarter in how our products are designed, made, packaged, transported and in our products' end-of-life options. Why a Circular Economy Matters We have the responsibility to reduce our consumption of finite resources and work towards a circular economy. Discarded plastics and other waste impact the environment. Consumers are increasingly interested in products' environmental footprints. Our transformation from Combustibles to New Categories brings additional challenges - products with different environmental profiles and changes to resource use. We need to be constantly improving our products' design and circularity, and creating less overall waste. Our Circular Economy Strategy To mitigate the environmental impacts of our current and future product portfolio, we are guided by three core principles, reflected in our Circular Economy Position Statement: – Simplify: Simplifying the design of products and packaging to improve recyclability and to reduce our use of virgin materials and finite resources; – Maximise: Maximising the longevity of our products to improve the experience for our consumers; and – Recover: Minimising waste through increased product recovery, reusability and recycling. Transitioning to a circular economy requires innovative approaches. As such, we carry out life cycle analysis (LCAs) across our products to identify areas for further improvement. Adopting circular economy principles reduces the environmental impact of our products, creates more efficient operations and offers our employees opportunities to innovate. Investing in R&D We recognise that our portfolio transition to reduced risk*† alternatives brings additional challenges to the delivery of our environmental commitments as New Category products tend to have different and/or greater environmental footprints. To tackle this challenge, we are investing in the R&D of products that provide reduced risk*† alternatives to smokers that also have a lower environmental impact. We are seeking to design products that are easier to dismantle at end-of-life, with greater reusability and recyclability, and packaging that uses more recycled and recyclable content. BAT Annual Report and Form 20-F 2022 Strategic Report Governance Report Financial Statements Other Information Strategic Management Circular Economy 54
As part of our efforts towards a circular economy, we have a growing pipeline of initiatives that seek to develop products with lower environmental impact. Over the course of 2022, we have been working with an external partner in developing an integrated ‘tool kit’ to measure and inform the environmental impacts arising from any design decisions. Promoting a Culture of Circularity Improving product circularity is a key pillar of our circular economy strategy. However, we are also not losing sight of other opportunities to embed circularity across our business and value chain. We continue to improve efficiencies in our manufacturing operations and logistics, as well as seeking to leverage our purchasing power, where possible, to drive materials, goods and services that have a lower environmental impact. We are committed to implementing new solutions and technologies that will accelerate this journey, while nurturing a culture of innovation and collaboration with business partners across our value chain and other external partners in order to develop new solutions. Reducing Product-related Waste Our goals for 2025 include further eliminating plastic in our packaging, and increasing the recycled content of the plastic packaging that we do use. This sits alongside our efforts to minimise packaging overall, and our aim for all of our packaging to be reusable, recyclable or compostable by 2025. We are implementing this across our product categories: Vapour products In 2022, we changed the pack profile of our Vapour refills in Canada and included recycled cardboard content in them. The reduced pack profile has resulted in a 15% reduction in CO2e per refill and a 45% saving in paper use in Canada. We plan to roll out the reduced pack profile and recycled board content across the Group over the course of 2023. Tobacco Heating Products (THPs) Our glo device packaging is recyclable, where local facilities exist, and we have worked to eliminate any unnecessary plastic packaging1 from it. We've removed all plastic wrap from glo device packaging, which has resulted in a saving of 20 metric tonnes of plastic per year. In 2022, we also reduced the device box size by over 55% vs 2021, which has resulted in a saving of 300 metric tonnes of paper per year, and a 65% reduction in CO2e footprint from the changes to our device packaging. Traditional and Modern Oral products Globally, over 80% of the cans used in our Velo products are recyclable, where local facilities exist. In the U.S., Traditional Oral product containers (Grizzly moist snuff and Camel Snus) are made from plastic (polypropylene) and steel, which are recyclable, where facilities exist. Transforming cigarettes We have made progress in improving the recyclability of plastic packaging in FMC. For example, 93% of our plastic packaging for cigarettes can be recycled and all poly film, as well as tear-off strips used on packs, can be recycled (subject to local recycling infrastructure). We are also conducting trials on alternative plastic-free materials for cellulose acetate cigarette filters (filters classified as having plastic content). Other Tobacco Products (OTP) In our OTP category, we are working on several projects to maximise recyclable material in our portfolio. The focus is on converting all non-recyclable plastic laminate pouches and standing bags to recyclable plastic. Our ambition is to have this portfolio migrated by 2025. Designing for End-of-Life Butt littering and disposal of New Category products are two big challenges we face. Tackling cigarette butt littering BAT recognises the impacts of cigarette butt littering. It is a complex topic with no easy answers. We are committed to working with consumers to enhance their understanding of the impact of butt littering and encourage responsible disposal. Research shows that consumer education and awareness-raising initiatives are likely to be some of the most successful measures. At BAT, we support a number of such initiatives and education campaigns. We have developed a new butt littering toolkit that will be rolled out across BAT in 2023. This utilises learning from our existing initiatives to focus on approaches that have proved to be most effective and resonated best with consumers. In 2022, we continued to implement campaigns across Italy, Denmark, France and Romania - among other countries. Take-Back schemes Since the end of 2021, BAT has had Take- Back schemes in all markets where we sell New Category devices. These comprise one or both of: device return containers in our directly-operated and third-party retail outlets; and participation in national electrical equipment return and recycling schemes. Take-Back schemes allow for the responsible disposal of end-of-life products, which can range from recycling to incineration with energy recovery, depending on local infrastructure, capacities and regulatory environment. Reducing Waste In 2022, as well as achieving a further 8.6% reduction in absolute waste versus 2021, we also passed our initial target of a 15% reduction in waste from operations by 2025 against a 2017 baseline, achieving a 21.5% reduction. As a result, we have increased our target to a 25% reduction in waste from operations by 2025, against a 2017 baseline. In 2022, we also increased the percentage of absolute waste we recycle by an additional 5.4pps, up to 84.3% against our updated target of 90%, by 2025. In 2022, 52% of our operations sites achieved zero waste to landfill. To address waste to landfill more broadly across our direct operations, we have also updated our waste to landfill target to <1% globally by 2025. These improvements were achieved by utilising existing processes from our Integrated Work System (IWS), conducting loss analysis and value stream mapping. This enabled a targeted approach to our more challenging waste streams, allowing our Global Waste Centre of Excellence (CoE) to focus on the 'waste top losses' and implement action plans, such as waste segregation and recycling programmes. The CoE brings together subject matter experts from across our global operations to support the identification and implementation of solutions and best practices at a local level. Optimising Agricultural Waste Our approach is for all of our tobacco suppliers and their contracted farmers to dispose of empty agrochemical containers safely. For example, in Brazil, we partner with an industry scheme that collects and recycles agrochemical containers from more than 100,000 farms through 1,800 collection points in almost 400 municipalities across the country. In Croatia, almost 80% of our directly contracted farmers participate in a municipal waste programme for recycling seedling trays and empty agrochemical containers. We are also helping to reduce waste and by-products from other types of agriculture by using them as alternative, sustainable fuels for tobacco curing. Examples include jute sticks, rice husk briquettes and other agricultural waste in Bangladesh; candle nut shells in Indonesia; and rice husks in Sri Lanka and Vietnam. Notes: 1. Any plastic packaging element technically replaceable by non-plastic materials without compromising product properties (i.e. quality, safety or other regulatory requirements), as classified by our R&D teams. * Based on the weight of evidence and assuming a complete switch from cigarette smoking. These products are not risk free and are addictive. † Our Vapour product Vuse (including Alto, Solo, Ciro and Vibe), and certain products, including Velo, Grizzly, Kodiak, and Camel Snus, which are sold in the U.S., are subject to FDA regulation and no reduced-risk claims will be made as to these products without agency clearance. BAT Annual Report and Form 20-F 2022 Strategic Report Governance Report Financial Statements Other Information 55
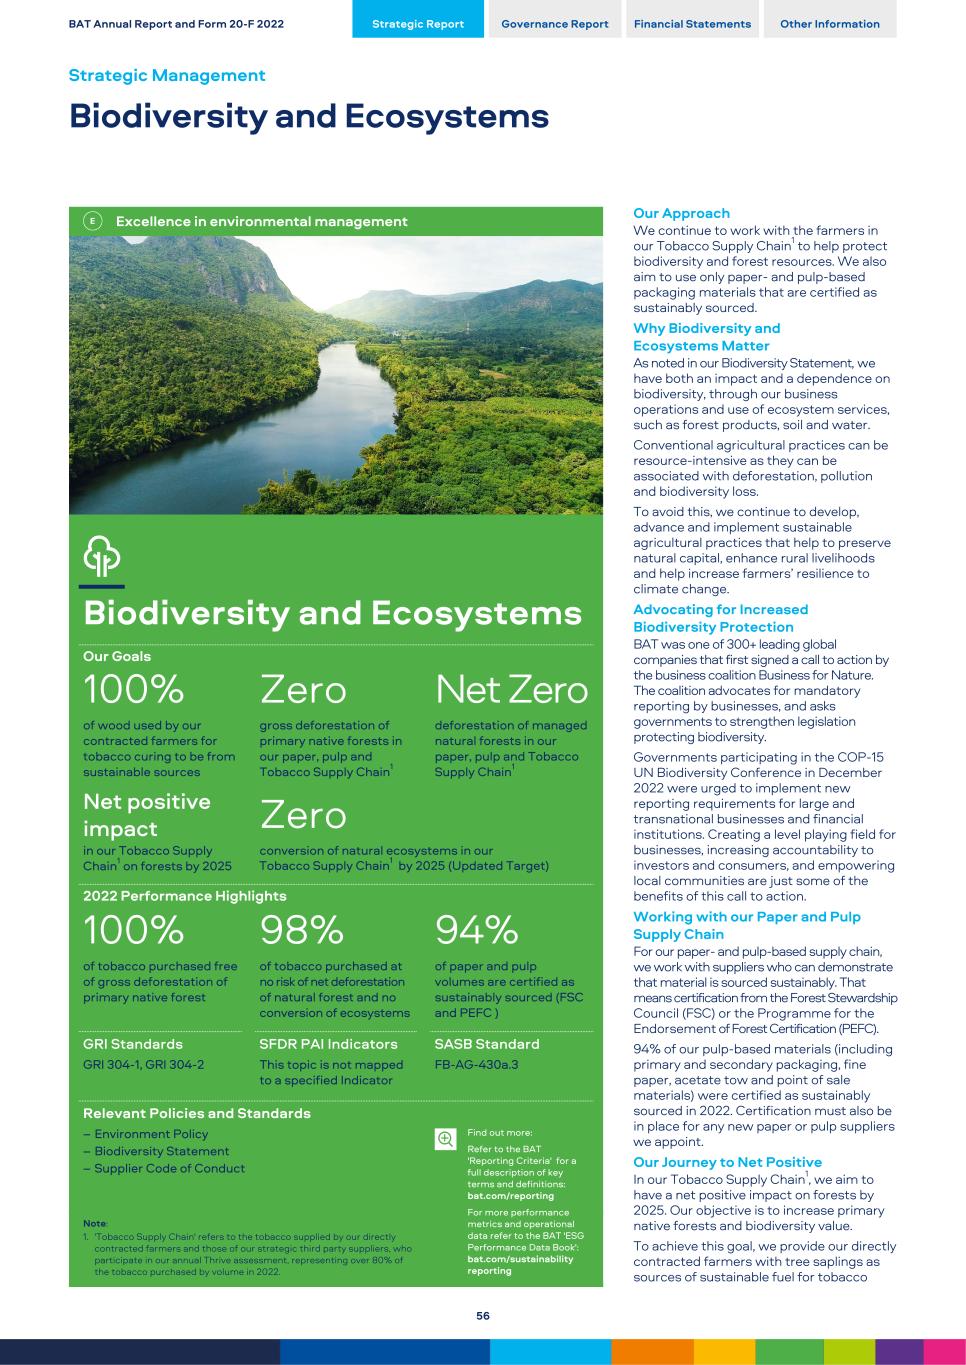
Excellence in environmental management Biodiversity and Ecosystems Our Goals 100% Zero Net Zero of wood used by our contracted farmers for tobacco curing to be from sustainable sources gross deforestation of primary native forests in our paper, pulp and Tobacco Supply Chain1 deforestation of managed natural forests in our paper, pulp and Tobacco Supply Chain1 Net positive impact Zero in our Tobacco Supply Chain1 on forests by 2025 conversion of natural ecosystems in our Tobacco Supply Chain1 by 2025 (Updated Target) 2022 Performance Highlights 100% 98% 94% of tobacco purchased free of gross deforestation of primary native forest of tobacco purchased at no risk of net deforestation of natural forest and no conversion of ecosystems of paper and pulp volumes are certified as sustainably sourced (FSC and PEFC ) GRI Standards SFDR PAI Indicators SASB Standard GRI 304-1, GRI 304-2 This topic is not mapped to a specified Indicator FB-AG-430a.3 Relevant Policies and Standards – Environment Policy – Biodiversity Statement – Supplier Code of Conduct Find out more: Refer to the BAT 'Reporting Criteria' for a full description of key terms and definitions: bat.com/reporting For more performance metrics and operational data refer to the BAT 'ESG Performance Data Book': bat.com/sustainability reporting Note: 1. 'Tobacco Supply Chain' refers to the tobacco supplied by our directly contracted farmers and those of our strategic third party suppliers, who participate in our annual Thrive assessment, representing over 80% of the tobacco purchased by volume in 2022. Our Approach We continue to work with the farmers in our Tobacco Supply Chain1 to help protect biodiversity and forest resources. We also aim to use only paper- and pulp-based packaging materials that are certified as sustainably sourced. Why Biodiversity and Ecosystems Matter As noted in our Biodiversity Statement, we have both an impact and a dependence on biodiversity, through our business operations and use of ecosystem services, such as forest products, soil and water. Conventional agricultural practices can be resource-intensive as they can be associated with deforestation, pollution and biodiversity loss. To avoid this, we continue to develop, advance and implement sustainable agricultural practices that help to preserve natural capital, enhance rural livelihoods and help increase farmers’ resilience to climate change. Advocating for Increased Biodiversity Protection BAT was one of 300+ leading global companies that first signed a call to action by the business coalition Business for Nature. The coalition advocates for mandatory reporting by businesses, and asks governments to strengthen legislation protecting biodiversity. Governments participating in the COP-15 UN Biodiversity Conference in December 2022 were urged to implement new reporting requirements for large and transnational businesses and financial institutions. Creating a level playing field for businesses, increasing accountability to investors and consumers, and empowering local communities are just some of the benefits of this call to action. Working with our Paper and Pulp Supply Chain For our paper- and pulp-based supply chain, we work with suppliers who can demonstrate that material is sourced sustainably. That means certification from the Forest Stewardship Council (FSC) or the Programme for the Endorsement of Forest Certification (PEFC). 94% of our pulp-based materials (including primary and secondary packaging, fine paper, acetate tow and point of sale materials) were certified as sustainably sourced in 2022. Certification must also be in place for any new paper or pulp suppliers we appoint. Our Journey to Net Positive In our Tobacco Supply Chain1, we aim to have a net positive impact on forests by 2025. Our objective is to increase primary native forests and biodiversity value. To achieve this goal, we provide our directly contracted farmers with tree saplings as sources of sustainable fuel for tobacco BAT Annual Report and Form 20-F 2022 Strategic Report Governance Report Financial Statements Other Information Strategic Management Biodiversity and Ecosystems 56
curing, as well as training in forest and biodiversity management. Our third-party suppliers are expected to follow similar practices with their contracted farmers. Since the 1970s, we have provided more than 400 million saplings to our contracted farmers and their local communities to promote wood self-sufficiency in Brazil, Kenya, Bangladesh and Pakistan. 22% of our contracted farmers used alternative, locally available biomass fuels for tobacco curing in 2022. These include sugarcane bagasse briquettes in Kenya, and jute sticks and rice husks in Sri Lanka and Bangladesh. In 2022, as part of our Thrive programme, we continued to engage with farmers on training. Training was delivered by the Group's own Leaf Operations and strategic third-party suppliers through farm visits and communication material, covering best practices on natural resource preservation, forest, biodiversity and soil management. Protecting Forests in Partnership with Farmers and Suppliers Forests or other natural areas being cleared to create farmland for tobacco is a risk that we are working hard to reduce. We monitored 100% of our directly contracted farmers in 2022, regarding farmland expansion and the risk of natural ecosystems conversion (including wetlands, peatlands, grasslands, woodlands, and wet and dry savannah - in addition to forests). This includes the risk of encroaching on legally protected areas and/or recognised biodiversity areas. Regular, scheduled farm visits are used alongside unannounced visits. Where non- compliance is found, prompt action is taken. Before we contract with new farmers, we undertake due diligence to check for no deforestation, no natural ecosystems conversion and relevant biodiversity practices. If any cases of deforestation are observed, the relevant farmer will be put under remediation to reforest in the same eco- region and/or jurisdiction. We ask our third-party suppliers to take equivalent steps. Driving Actions Through our 2022 Biodiversity Risk Assessment In 2022, we commissioned a new Biodiversity Risk Assessment. This mapped our directly contracted farmers against five global biodiversity risk indicators and categorised their farms as low, medium & high risk. The work was carried out by an external consultancy, which assessed data from 69,200 (91.5%) of our directly contracted farmers in the 2021 crop year. Based on a combined Biodiversity Risk Score, 98% of farms assessed (representing 96.4% of the total assessed farmed area) were classified as low biodiversity risk. High risk areas were identified in Brazil and Sri Lanka. Medium biodiversity risk areas were found in Brazil, Kenya and Venezuela. Overall, high and medium risk areas represented less than 1% of the total farm area assessed in each country. One of the most relevant indicators assessed is proximity to World Heritage Sites (WHS) or Alliance for Zero Extinction (AZE) sites. Results showed a total of 127 farmers (0.2%) with farms covering 974 hectares (0.3%) of the total farmland assessed near or adjacent to WHS and / or AZE areas. Additionally, 854 farmers (1.2%), covering 9,027 hectares of land (2.8% of the total farmland assessed), are near or adjacent to protected areas or Key Biodiversity Areas. In total, there are 10,001 hectares - representing 3% of the assess area - near critical biodiversity areas. Sites were also assessed using the Species Threat Abatement and Restoration (STAR) indicator, a biodiversity metric based on the IUCN Red List of Threatened Species. Our assessment results showed a relatively low level of risk to areas of high biodiversity significance. 75 hectares were classified with high Threat significance and one hectare with high Restoration significance. These are regions with high significance for threatened or endemic species of birds, mammals and/or amphibians. It does not mean the farmers are causing the threat or damaging the environment, but that there is increased risk or significance in areas relatively near to them. Over the course of 2023, we will work with the Group's own Leaf Operations to develop management plans to mitigate these risks. We are also working on a new Biodiversity Operating Standard, further outlining requirements on biodiversity risk management and protection. This includes operational requirements and procedures mandatory for the Group's own Leaf Operations and to serve as guidance for the third-party Leaf suppliers in order for the Group to meet its forest-related targets. Supporting Biodiversity and Natural Capital To further support biodiversity and natural capital, we work to reduce the use of agrochemicals, reduce soil erosion and preserve soil fertility. Training on best practices in sustainable agriculture, appropriate to growing conditions, are provided to our directly contracted farmers in collaboration with our Global Leaf Agronomy Development Centre in Brazil. Reducing agrochemical usage Our standard is that only approved agrochemicals with the lowest possible toxicity according to the World Health Organization (WHO) classification are used in our purchased tobacco, avoiding any highly hazardous pesticides (HHPs). We monitor the level of adherence to our agrochemical standard from crop planning to the final packed leaf, ensuring suppliers' compliance. Any HHPs used prior to 2018 were replaced or withdrawn by the Group's own Leaf Operations and third-party suppliers. Our Global Leaf Agronomy Development Centre works to continuously enhance integrated pest management strategies, which are then deployed to the farmers by our Field Technicians. Ongoing developments include: selection of disease- resistant tobacco varieties; the use of biological control strategies that can lead to a reduction in the use of agrochemicals and biodiversity preservation. In 2022, biological control strategies were recommended in 9 of the Group's own Leaf Operations. For example, in Brazil, 33% of our directly contracted farmers use some form of biological control techniques for pest control. Additionally, an independent study found that the level of active chemicals used per hectare of tobacco in Brazil is 1.01 kilograms – the second lowest among 19 different crops analysed. Promoting best practice in soil management Soil plays a vital role in removing carbon from the atmosphere, storing and purifying water, preventing land erosion and supporting habitats. In farms where we source tobacco, farmers receive training on best practice soil management and other land management practices. In 2022, it was reported via our Thrive assessments that 82% of tobacco hectares in our Tobacco Supply Chain1 had best practice soil and water management plans in place. Mono-cropping - growing the same crop continuously on the same land - is known to contribute to the depletion of soil nutrients. Crop rotation is a recognised best practice approach to protecting and enhancing soil health, which we encourage alongside diversification. Both increase farmers’ resilience to economic factors, weather, climate issues and pests and they also help to enhance food security and preserve soil health. In 2022, 92.8%2 of farmers in our Tobacco Supply Chain1 were growing other crops - such as rice, corn, vegetables, wheat, maize and soy - in addition to tobacco. For more information on the scope and criteria of our Biodiversity Risk Assessment see: bat.com/sustainabilityreporting Note: 2. This was marginally lower in comparison to 2021, due to changes in our purchasing mix. BAT Annual Report and Form 20-F 2022 Strategic Report Governance Report Financial Statements Other Information 57
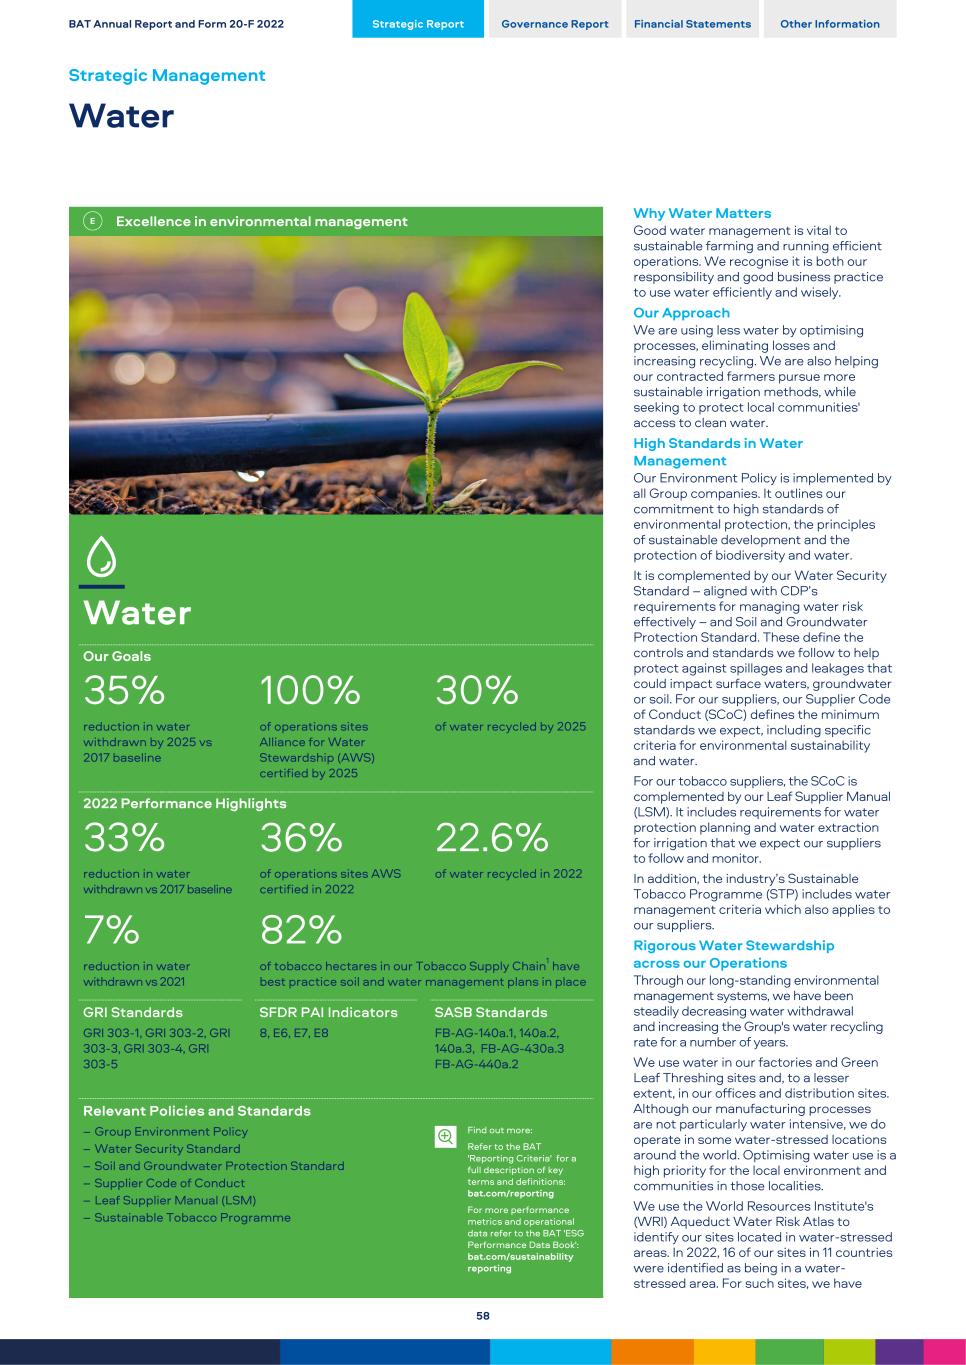
Excellence in environmental management Water Our Goals 35% 100% 30% reduction in water withdrawn by 2025 vs 2017 baseline of operations sites Alliance for Water Stewardship (AWS) certified by 2025 of water recycled by 2025 2022 Performance Highlights 33% 36% 22.6% reduction in water withdrawn vs 2017 baseline of operations sites AWS certified in 2022 of water recycled in 2022 7% 82% reduction in water withdrawn vs 2021 of tobacco hectares in our Tobacco Supply Chain1 have best practice soil and water management plans in place GRI Standards SFDR PAI Indicators SASB Standards GRI 303-1, GRI 303-2, GRI 303-3, GRI 303-4, GRI 303-5 8, E6, E7, E8 FB-AG-140a.1, 140a.2, 140a.3, FB-AG-430a.3 FB-AG-440a.2 Relevant Policies and Standards – Group Environment Policy – Water Security Standard – Soil and Groundwater Protection Standard – Supplier Code of Conduct – Leaf Supplier Manual (LSM) – Sustainable Tobacco Programme Find out more: Refer to the BAT 'Reporting Criteria' for a full description of key terms and definitions: bat.com/reporting For more performance metrics and operational data refer to the BAT 'ESG Performance Data Book': bat.com/sustainability reporting Why Water Matters Good water management is vital to sustainable farming and running efficient operations. We recognise it is both our responsibility and good business practice to use water efficiently and wisely. Our Approach We are using less water by optimising processes, eliminating losses and increasing recycling. We are also helping our contracted farmers pursue more sustainable irrigation methods, while seeking to protect local communities' access to clean water. High Standards in Water Management Our Environment Policy is implemented by all Group companies. It outlines our commitment to high standards of environmental protection, the principles of sustainable development and the protection of biodiversity and water. It is complemented by our Water Security Standard – aligned with CDP’s requirements for managing water risk effectively – and Soil and Groundwater Protection Standard. These define the controls and standards we follow to help protect against spillages and leakages that could impact surface waters, groundwater or soil. For our suppliers, our Supplier Code of Conduct (SCoC) defines the minimum standards we expect, including specific criteria for environmental sustainability and water. For our tobacco suppliers, the SCoC is complemented by our Leaf Supplier Manual (LSM). It includes requirements for water protection planning and water extraction for irrigation that we expect our suppliers to follow and monitor. In addition, the industry’s Sustainable Tobacco Programme (STP) includes water management criteria which also applies to our suppliers. Rigorous Water Stewardship across our Operations Through our long-standing environmental management systems, we have been steadily decreasing water withdrawal and increasing the Group's water recycling rate for a number of years. We use water in our factories and Green Leaf Threshing sites and, to a lesser extent, in our offices and distribution sites. Although our manufacturing processes are not particularly water intensive, we do operate in some water-stressed locations around the world. Optimising water use is a high priority for the local environment and communities in those localities. We use the World Resources Institute's (WRI) Aqueduct Water Risk Atlas to identify our sites located in water-stressed areas. In 2022, 16 of our sites in 11 countries were identified as being in a water- stressed area. For such sites, we have BAT Annual Report and Form 20-F 2022 Strategic Report Governance Report Financial Statements Other Information Strategic Management Water 58
more stringent requirements for water management on site and water recycling rates, in line with our Water Security Standard. Sites in water-stressed areas are required to have a plan to achieve a water recycling rate of at least 25% and a score of 3.5 out of 4 as per the Water Roadmap – an internal tool that allows us to assess key aspects of water management, such as water withdrawal, water efficiency and water discharge. At a Group level, we seek to ensure all sites in water-stressed areas regularly self- assess in accordance with the 'Water use and discharge management' section of our EHS Roadmap. This covers water withdrawal and discharge compliance, as well as links to the Alliance for Water Stewardship (AWS) process. Our sites implement a range of initiatives to eliminate water losses, improve water efficiency and replace fresh water with recycled water, wherever possible. Examples of water saving initiatives include replacing water-cooled chillers with air- cooled chillers in Turkey, and optimising water consumption when 'stem washing' across our green leaf threshing (GLT) operations. 70% of our operations sites currently reduce water withdrawn by recycling water on site, in manufacturing operations and utilities. Examples include upgrading our ultra-filtration and Reverse Osmosis (RO) systems - with significant success in our Sacheon factory, South Korea; condensate return to boilers; and reusing water for utilities and other technical needs after it has been treated for effluent. These initiatives are in operation across our sites in Pakistan, Croatia, Brazil, Indonesia and Turkey. 33% Reduction in water withdrawn vs 2017 baseline Across the Group, we achieved a 33% reduction in water withdrawn in 2022, versus our 2017 baseline. We have also increased the amount of water we recycle to 22.6% through our zero-loss mindset and focusing on identifying our 'top losses' across operations. As members of the AWS, we committed to 100% of our operations sites to be certified against the AWS Standard by 2025. The AWS Standard is a globally recognised framework that allows water users to better understand their water use and impacts, and to work collaboratively and transparently towards sustainable water management within a catchment context. At BAT, we use it across our operations, and believe its implementation can bring about many benefits for our sites on issues such as understanding water dependencies and impacts, mitigating operational and supply chain water risks, ensuring responsible water procedures are in place, building relationships with local water-related stakeholders and addressing challenges shared with others in the catchment. In 2022, a further 24 sites were audited and recommended for AWS certification, which now takes the Group total to 34 sites. We plan to seek certifications for 19 additional sites during 2023. 34 sites Group sites now audited/ recommended for AWS certification Throughout the year, we delivered training on the AWS Standard for EHS practitioners across our operating sites. Further training is underway to equip key regional teams as specialist assessors to support the Group in meeting the governance and compliance requirements of AWS. Water discharge monitoring Monitoring water discharges means we are better able to assess and reduce our impact on the environment and comply with regulatory requirements. Across the Group, we track water discharge destination, treatment method, quantity and quality. In 2022, we performed a screening for priority substances and pesticides, phosphates and nitrates. 100% of our operational sites reported no process use of these substances, and 38% reported not using them in any on-site ancillary or support services. BAT operates control measures globally in line with its Group procedures for hazardous substances management designed to avoid any uncontrolled emissions to water, soil or groundwater across its operations – including for ancillary and support processes. An Active Approach to Water Stewardship in Tobacco Growing Adopting a comprehensive approach - from assessing water risks and any subsequent water deficits from rainfall - is at the centre of how we support our contracted farmers in water stewardship. Across many regions of the world where we operate, there is sufficient annual rainfall to satisfy tobacco growing requirements. Where rainfall levels are insufficient, farmers may also use irrigation to grow the crop. In 2022, 33% of the hectares of our tobacco sourcing area made some use of irrigation systems. A number of the locations where we source tobacco are identified as areas of ‘water stress’. We actively monitor the proportion of tobacco crops in areas with higher risk for water stress. We map tobacco supplier locations via the WRI Aqueduct tool, which is incorporated into the industry-led Sustainable Tobacco Programme. In 2022, mapping identified that some of our tobacco sourcing areas in 18 countries - including India, Chile and Turkey - are located in water-stressed areas. 18.3% of the tobacco we purchased in 2022 originated from areas designated as water-stressed. In those areas, we seek to work directly with farmers to optimise and reduce crop water usage. Where irrigation is used for tobacco growing, we monitor and report water use with our Thrive programme, which we also use to monitor wider best practice water and soil management. In 2022, these plans were in place for 82% of tobacco hectares in our Tobacco Supply Chain1. Through our Global Leaf Agronomy Development Centre, we are actively looking at ways to work with directly contracted farmers to reduce water usage, with different techniques applied depending on the local circumstances and growing conditions. Where implemented, we believe our technology-driven approach is leading to increases in water efficiency, reducing the volume required of water per hectare. For example, we have introduced our directly contracted farmers to drip irrigation technology in seven countries, including Brazil, Mexico and Pakistan. This helps save water, reduce soil erosion and salination, and boosts yields. In 2022, we ran pilot programmes in Bangladesh, Pakistan and Vietnam. Initial results showed savings of between 25-50% of water use when compared to traditional furrow irrigation methods. We are currently running a global project using our Asian Agri-Tech Hub in Bangladesh, to identify opportunities for reducing the cost of the drip irrigation system by simplifying the components. Another important initiative for water saving is the Alternate Furrow Irrigation system. In 2022, we continued with trials and commercial evaluations in Bangladesh and Pakistan. Initial results are promising and show potential water savings of up to 8% compared to traditional furrow irrigation - without compromising crop yield or quality. Looking forward, new programmes to anticipate future challenges with water scarcity, water reduction and engagement with local communities are in development. These include innovative seedling floating systems, smart irrigation using real-time sensors and new drought resistant tobacco varieties. Note: 1. Tobacco Supply Chain' refers to the tobacco supplied by our directly contracted farmers and those of our strategic third party suppliers, who participate in our annual Thrive assessment, representing over 80% of the tobacco purchased by volume in 2022. BAT Annual Report and Form 20-F 2022 Strategic Report Governance Report Financial Statements Other Information 59
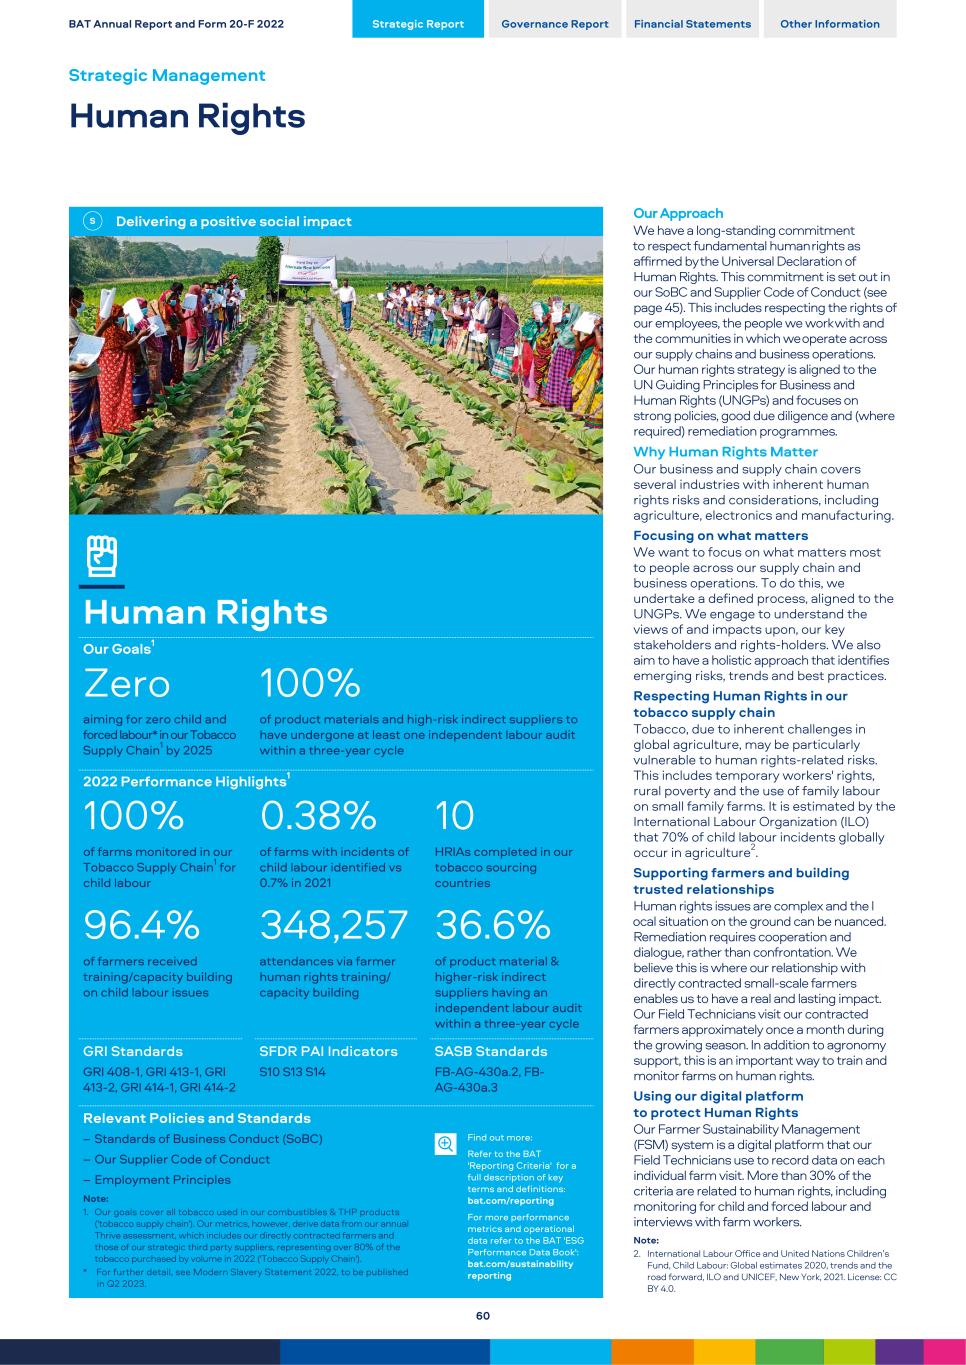
Delivering a positive social impact Human Rights Our Goals1 Zero 100% aiming for zero child and forced labour* in our Tobacco Supply Chain1 by 2025 of product materials and high-risk indirect suppliers to have undergone at least one independent labour audit within a three-year cycle 2022 Performance Highlights1 100% 0.38% 10 of farms monitored in our Tobacco Supply Chain1 for child labour of farms with incidents of child labour identified vs 0.7% in 2021 HRIAs completed in our tobacco sourcing countries 96.4% 348,257 36.6% of farmers received training/capacity building on child labour issues attendances via farmer human rights training/ capacity building of product material & higher-risk indirect suppliers having an independent labour audit within a three-year cycle GRI Standards SFDR PAI Indicators SASB Standards GRI 408-1, GRI 413-1, GRI 413-2, GRI 414-1, GRI 414-2 S10 S13 S14 FB-AG-430a.2, FB- AG-430a.3 Relevant Policies and Standards – Standards of Business Conduct (SoBC) – Our Supplier Code of Conduct – Employment Principles Note: 1. Our goals cover all tobacco used in our combustibles & THP products ('tobacco supply chain'). Our metrics, however, derive data from our annual Thrive assessment, which includes our directly contracted farmers and those of our strategic third party suppliers, representing over 80% of the tobacco purchased by volume in 2022 ('Tobacco Supply Chain'). * For further detail, see Modern Slavery Statement 2022, to be published in Q2 2023. Find out more: Refer to the BAT 'Reporting Criteria' for a full description of key terms and definitions: bat.com/reporting For more performance metrics and operational data refer to the BAT 'ESG Performance Data Book': bat.com/sustainability reporting Our Approach We have a long-standing commitment to respect fundamental human rights as affirmed by the Universal Declaration of Human Rights. This commitment is set out in our SoBC and Supplier Code of Conduct (see page 45). This includes respecting the rights of our employees, the people we work with and the communities in which we operate across our supply chains and business operations. Our human rights strategy is aligned to the UN Guiding Principles for Business and Human Rights (UNGPs) and focuses on strong policies, good due diligence and (where required) remediation programmes. Why Human Rights Matter Our business and supply chain covers several industries with inherent human rights risks and considerations, including agriculture, electronics and manufacturing. Focusing on what matters We want to focus on what matters most to people across our supply chain and business operations. To do this, we undertake a defined process, aligned to the UNGPs. We engage to understand the views of and impacts upon, our key stakeholders and rights-holders. We also aim to have a holistic approach that identifies emerging risks, trends and best practices. Respecting Human Rights in our tobacco supply chain Tobacco, due to inherent challenges in global agriculture, may be particularly vulnerable to human rights-related risks. This includes temporary workers' rights, rural poverty and the use of family labour on small family farms. It is estimated by the International Labour Organization (ILO) that 70% of child labour incidents globally occur in agriculture2. Supporting farmers and building trusted relationships Human rights issues are complex and the l ocal situation on the ground can be nuanced. Remediation requires cooperation and dialogue, rather than confrontation. We believe this is where our relationship with directly contracted small-scale farmers enables us to have a real and lasting impact. Our Field Technicians visit our contracted farmers approximately once a month during the growing season. In addition to agronomy support, this is an important way to train and monitor farms on human rights. Using our digital platform to protect Human Rights Our Farmer Sustainability Management (FSM) system is a digital platform that our Field Technicians use to record data on each individual farm visit. More than 30% of the criteria are related to human rights, including monitoring for child and forced labour and interviews with farm workers. Note: 2. International Labour Office and United Nations Children’s Fund, Child Labour: Global estimates 2020, trends and the road forward, ILO and UNICEF, New York, 2021. License: CC BY 4.0. BAT Annual Report and Form 20-F 2022 Strategic Report Governance Report Financial Statements Other Information Strategic Management Human Rights 60
Playing Our Part in the Sustainable Tobacco Programme All of our Leaf suppliers are expected to participate in the industry’s Sustainable Tobacco Programme (STP), which requires an annual self-assessment against priority themes, including Human Rights. Suppliers are assessed against Verisk Maplecroft’s risk indices, including for human rights. As part of a new STP pilot, those suppliers with a higher risk profile are prioritised for in- depth, on-site reviews conducted by an independent third party. Based on this process, during 2022, the overall STP programme piloted 10 in-depth assessments (IDAs) in four countries (Argentina, Brazil, North Macedonia and Mozambique), covering six Leaf suppliers which BAT sourced from. At this stage, there are plans to expand this pilot to an additional 22 suppliers in six countries during the course of 2023. Reporting and Resolving Incidents of Child Labour in our Tobacco Supply Chain The Operational Standard on Child Labour is mandatory for all of the Group's own Leaf Operations and is used as a guidance across our third-party leaf suppliers. In 2022, a total of 942 incidents (2021: 1,790) of child labour were reported on 0.38% (2021; 0.70%) of farms in our Tobacco Supply Chain1, of which 100% were reported as resolved during the growing season. The majority of these cases related to under-18-year-olds working on tasks such as harvesting. The 2022 reduction was supported by: ongoing implementation of child labour mitigation programmes, farmers training and stakeholder engagement within our Tobacco Supply Chain1; and improved data for our strategic third-party leaf suppliers, which, for 2022, comprised farmers specifically supplying BAT, when possible. We recognise the complexity of child labour and that monitoring cannot take place on every farm every day of the growing season, so incidents may be hidden or under-reported. That is why it is so important to work to address root causes. We monitor the recurrence of child labour instances and remediation plans often involve local community support. In 2022, more than 90% of the farmers reporting child labour incidents identified this type of non-compliance for the first time. Where we identify recurring non-compliance, the farmer’s contract is not renewed for the next growing season. Delivering Human Rights Training to Farmers and Their Communities The Group's own Leaf Operations and strategic third-party suppliers provide human rights training and awareness programmes for farmers and community members, with a focus on child labour and workers’ rights / forced labour. In 2022, 348,257 attendees were reported to have received this training and we also provided refresher training about Prompt Action procedures and governance to the Group's own Leaf Technicians. Giving Farmers a Voice We track access to grievance mechanisms across our Tobacco Supply Chain1 as part of our Thrive assessments. In 2022, Thrive identified that 100% of the farms are monitored for grievances, and 99.3% of farmers and farm labourers reported having access to at least one type of grievance mechanism. Our Human Rights Impact Assessment Programmes In recognising the need for a greater understanding of the root causes of human rights issues and complementing our own farm monitoring, we also undertake Human Rights Impact Assessments (HRIAs) for selected tobacco-sourcing countries, in line with the UNGPs and conducted by independent human rights experts. By the end of 2022, 10 HRIAs had been completed in eight of our tobacco sourcing countries, namely: Bangladesh, India, Indonesia, Mozambique, Pakistan,Turkey, Zimbabwe and North Macedonia. Collectively, these assessments have engaged more than 5,239 rights-holders in tobacco-growing communities. The outcomes include additional actions to address any impacts found and increased awareness - for example the use of Personal Protective Equipment at key stages during the crop cycle, women’s empowerment training or farmer monitoring procedures. Respecting Human Rights in our Product Materials Supply Chain Beyond tobacco, we source product materials such as paper and filters for cigarettes, and electronics and e-liquids for our New Category products. Prior to approval, suppliers must undergo an independent due diligence audit, performed by our partner Intertek and aligned to ILO standards. This covers forced labour, child labour, wages and hours, Health and Safety, Environment and Management systems. We expect suppliers to achieve a score of 70% to qualify. Existing suppliers are externally audited using a risk-based approach. In addition, we have partnered with external provider EcoVadis to expand our due diligence programme. This means that direct materials suppliers identified as higher risk continue to be audited by Intertek, while all suppliers outside Intertek's scope are assessed through EcoVadis. In 2022, 354 social assessments of suppliers located in 55 countries were conducted through our appointed third parties, Intertek and EcoVadis. This comprised: – Tier 1 product materials suppliers: 314; – Lower tier product materials suppliers: 12; – Indirect suppliers: 28. Supplier audit findings 2022 Of all the issues identified, 82% were classified as 'moderate' and 18% as 'major'. The 'major' non-compliances identified in these audits and actions included: – Labour Standards/Human Rights 86% – Environmental issues 14% 73% of corrective actions identified were completed and verified by year-end 2022, with the remainder on track to close by the end of Q2 2023. By 2025, we are aiming for all our product materials and higher risk indirect suppliers to have undergone at least one independent labour audit within a three- year cycle. By the end of 2022, this had been achieved for 36.6% of those suppliers. Respecting Human Rights in our Business Operations The policies, procedures and controls adopted by businesses across our Group seek to mitigate human rights risks. We recognise that circumstances in some countries present a higher risk for human rights issues, such as higher levels of corruption, criminality or unrest. Therefore, in addition to Group-wide procedures and controls, we have a process to identify and monitor BAT operations in higher-risk countries. This includes an annual risk assessment process for countries with Group companies present, using Verisk Maplecroft’s human rights indices, including its Modern Slavery Index. The outcomes are submitted to and noted by the Group Corporate Committee and Audit Committee, and, by the relevant Regional Audit & Corporate Social Responsibility Committee (RACC), including action plans for any areas for improvement identified. In 2022, 28 countries with BAT operations were identified as higher risk and underwent the enhanced human rights monitoring process and assessment. Investigating and Remediating Workplace Breaches Our Standards of Business Conduct (SoBC) set out how allegations of wrongdoing or SoBC breaches should be investigated and dealt with fairly and objectively. In 2022, we received 117 reports of alleged SoBC breaches relating to our Respect in the Workplace and Human Rights Policy. Upon investigation, actual breaches were found to have occurred in 33 cases - related to Workplace issues - and appropriate actions were taken, including disciplinary actions that resulted in 8 people leaving BAT. In 40 cases, no evidence of wrongdoing was found, and the remaining cases were still under investigation at the end of the year. BAT Annual Report and Form 20-F 2022 Strategic Report Governance Report Financial Statements Other Information 61
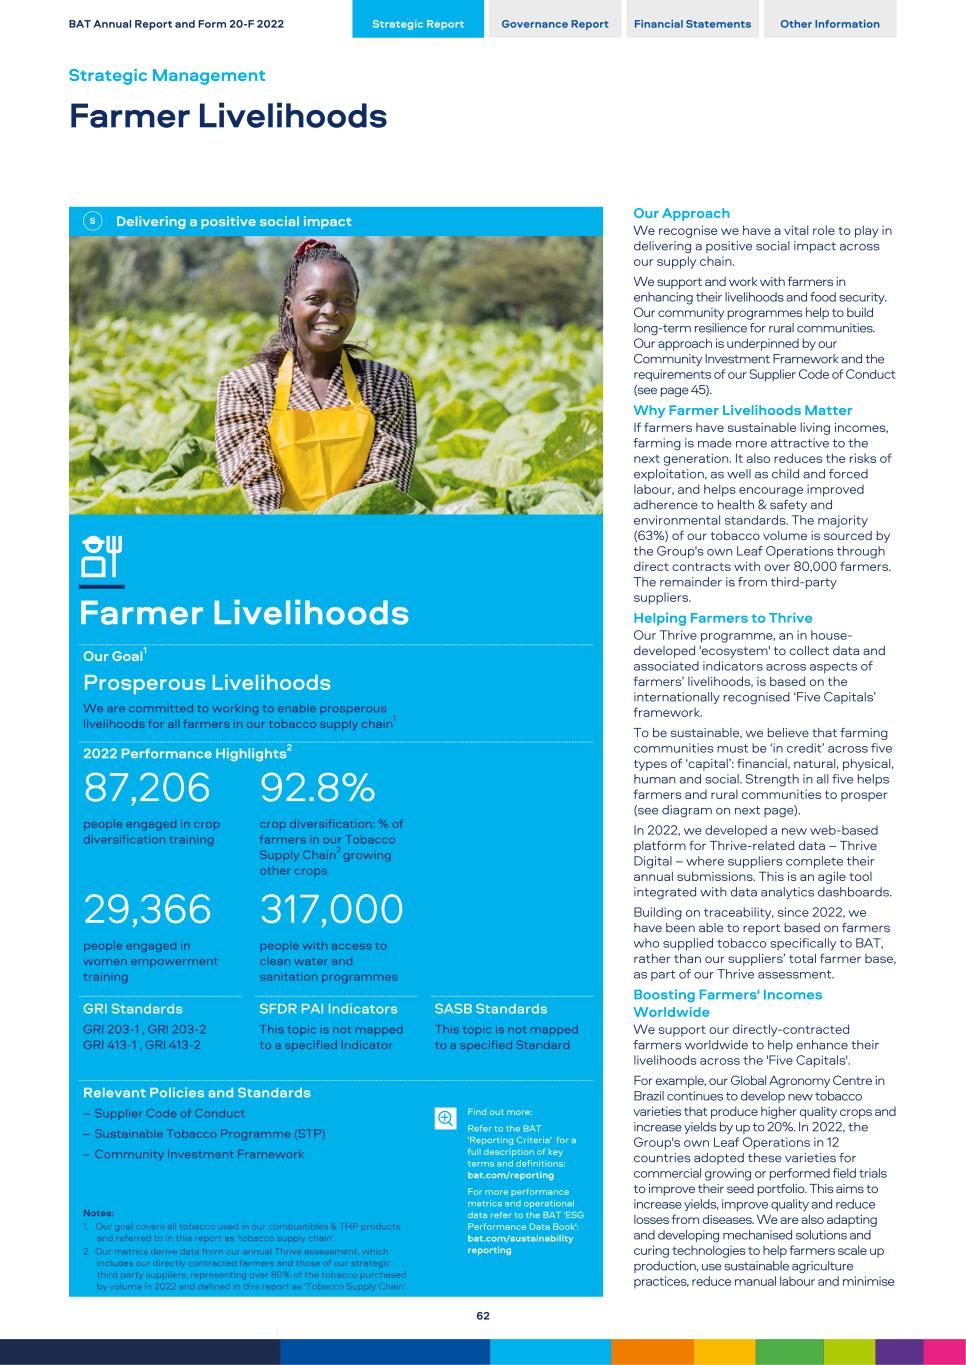
Delivering a positive social impact Farmer Livelihoods Our Goal1 Prosperous Livelihoods We are committed to working to enable prosperous livelihoods for all farmers in our tobacco supply chain1 2022 Performance Highlights2 87,206 92.8% people engaged in crop diversification training crop diversification: % of farmers in our Tobacco Supply Chain2 growing other crops 29,366 317,000 people engaged in women empowerment training people with access to clean water and sanitation programmes GRI Standards SFDR PAI Indicators SASB Standards GRI 203-1 , GRI 203-2 GRI 413-1 , GRI 413-2 This topic is not mapped to a specified Indicator This topic is not mapped to a specified Standard Relevant Policies and Standards – Supplier Code of Conduct – Sustainable Tobacco Programme (STP) – Community Investment Framework Notes: 1. Our goal covers all tobacco used in our combustibles & THP products and referred to in this report as 'tobacco supply chain'. 2. Our metrics derive data from our annual Thrive assessment, which includes our directly contracted farmers and those of our strategic third party suppliers, representing over 80% of the tobacco purchased by volume in 2022 and defined in this report as 'Tobacco Supply Chain'. Find out more: Refer to the BAT 'Reporting Criteria' for a full description of key terms and definitions: bat.com/reporting For more performance metrics and operational data refer to the BAT 'ESG Performance Data Book': bat.com/sustainability reporting Our Approach We recognise we have a vital role to play in delivering a positive social impact across our supply chain. We support and work with farmers in enhancing their livelihoods and food security. Our community programmes help to build long-term resilience for rural communities. Our approach is underpinned by our Community Investment Framework and the requirements of our Supplier Code of Conduct (see page 45). Why Farmer Livelihoods Matter If farmers have sustainable living incomes, farming is made more attractive to the next generation. It also reduces the risks of exploitation, as well as child and forced labour, and helps encourage improved adherence to health & safety and environmental standards. The majority (63%) of our tobacco volume is sourced by the Group's own Leaf Operations through direct contracts with over 80,000 farmers. The remainder is from third-party suppliers. Helping Farmers to Thrive Our Thrive programme, an in house- developed 'ecosystem' to collect data and associated indicators across aspects of farmers’ livelihoods, is based on the internationally recognised ‘Five Capitals’ framework. To be sustainable, we believe that farming communities must be ‘in credit’ across five types of ‘capital’: financial, natural, physical, human and social. Strength in all five helps farmers and rural communities to prosper (see diagram on next page). In 2022, we developed a new web-based platform for Thrive-related data – Thrive Digital – where suppliers complete their annual submissions. This is an agile tool integrated with data analytics dashboards. Building on traceability, since 2022, we have been able to report based on farmers who supplied tobacco specifically to BAT, rather than our suppliers’ total farmer base, as part of our Thrive assessment. Boosting Farmers' Incomes Worldwide We support our directly-contracted farmers worldwide to help enhance their livelihoods across the 'Five Capitals'. For example, our Global Agronomy Centre in Brazil continues to develop new tobacco varieties that produce higher quality crops and increase yields by up to 20%. In 2022, the Group's own Leaf Operations in 12 countries adopted these varieties for commercial growing or performed field trials to improve their seed portfolio. This aims to increase yields, improve quality and reduce losses from diseases. We are also adapting and developing mechanised solutions and curing technologies to help farmers scale up production, use sustainable agriculture practices, reduce manual labour and minimise BAT Annual Report and Form 20-F 2022 Strategic Report Governance Report Financial Statements Other Information Strategic Management Farmer Livelihoods 62
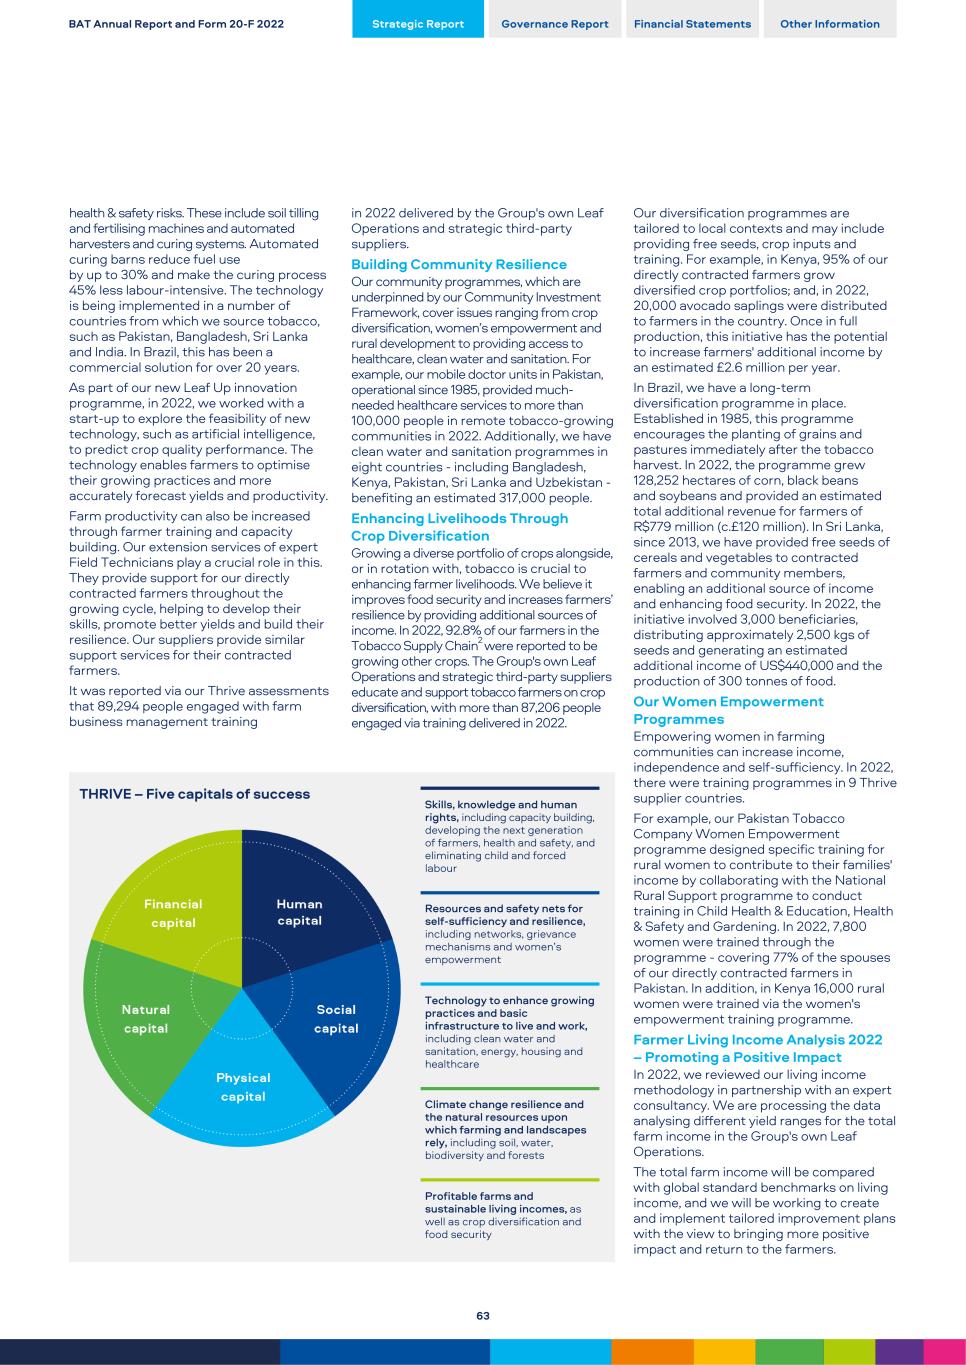
health & safety risks. These include soil tilling and fertilising machines and automated harvesters and curing systems. Automated curing barns reduce fuel use by up to 30% and make the curing process 45% less labour-intensive. The technology is being implemented in a number of countries from which we source tobacco, such as Pakistan, Bangladesh, Sri Lanka and India. In Brazil, this has been a commercial solution for over 20 years. As part of our new Leaf Up innovation programme, in 2022, we worked with a start-up to explore the feasibility of new technology, such as artificial intelligence, to predict crop quality performance. The technology enables farmers to optimise their growing practices and more accurately forecast yields and productivity. Farm productivity can also be increased through farmer training and capacity building. Our extension services of expert Field Technicians play a crucial role in this. They provide support for our directly contracted farmers throughout the growing cycle, helping to develop their skills, promote better yields and build their resilience. Our suppliers provide similar support services for their contracted farmers. It was reported via our Thrive assessments that 89,294 people engaged with farm business management training THRIVE – Five capitals of success Skills, knowledge and human rights, including capacity building, developing the next generation of farmers, health and safety, and eliminating child and forced labour Resources and safety nets for self-sufficiency and resilience, including networks, grievance mechanisms and women’s empowerment Technology to enhance growing practices and basic infrastructure to live and work, including clean water and sanitation, energy, housing and healthcare Climate change resilience and the natural resources upon which farming and landscapes rely, including soil, water, biodiversity and forests Profitable farms and sustainable living incomes, as well as crop diversification and food security in 2022 delivered by the Group's own Leaf Operations and strategic third-party suppliers. Building Community Resilience Our community programmes, which are underpinned by our Community Investment Framework, cover issues ranging from crop diversification, women’s empowerment and rural development to providing access to healthcare, clean water and sanitation. For example, our mobile doctor units in Pakistan, operational since 1985, provided much- needed healthcare services to more than 100,000 people in remote tobacco-growing communities in 2022. Additionally, we have clean water and sanitation programmes in eight countries - including Bangladesh, Kenya, Pakistan, Sri Lanka and Uzbekistan - benefiting an estimated 317,000 people. Enhancing Livelihoods Through Crop Diversification Growing a diverse portfolio of crops alongside, or in rotation with, tobacco is crucial to enhancing farmer livelihoods. We believe it improves food security and increases farmers’ resilience by providing additional sources of income. In 2022, 92.8% of our farmers in the Tobacco Supply Chain2 were reported to be growing other crops. The Group's own Leaf Operations and strategic third-party suppliers educate and support tobacco farmers on crop diversification, with more than 87,206 people engaged via training delivered in 2022. Our diversification programmes are tailored to local contexts and may include providing free seeds, crop inputs and training. For example, in Kenya, 95% of our directly contracted farmers grow diversified crop portfolios; and, in 2022, 20,000 avocado saplings were distributed to farmers in the country. Once in full production, this initiative has the potential to increase farmers' additional income by an estimated £2.6 million per year. In Brazil, we have a long-term diversification programme in place. Established in 1985, this programme encourages the planting of grains and pastures immediately after the tobacco harvest. In 2022, the programme grew 128,252 hectares of corn, black beans and soybeans and provided an estimated total additional revenue for farmers of R$779 million (c.£120 million). In Sri Lanka, since 2013, we have provided free seeds of cereals and vegetables to contracted farmers and community members, enabling an additional source of income and enhancing food security. In 2022, the initiative involved 3,000 beneficiaries, distributing approximately 2,500 kgs of seeds and generating an estimated additional income of US$440,000 and the production of 300 tonnes of food. Our Women Empowerment Programmes Empowering women in farming communities can increase income, independence and self-sufficiency. In 2022, there were training programmes in 9 Thrive supplier countries. For example, our Pakistan Tobacco Company Women Empowerment programme designed specific training for rural women to contribute to their families' income by collaborating with the National Rural Support programme to conduct training in Child Health & Education, Health & Safety and Gardening. In 2022, 7,800 women were trained through the programme - covering 77% of the spouses of our directly contracted farmers in Pakistan. In addition, in Kenya 16,000 rural women were trained via the women's empowerment training programme. Farmer Living Income Analysis 2022 – Promoting a Positive Impact In 2022, we reviewed our living income methodology in partnership with an expert consultancy. We are processing the data analysing different yield ranges for the total farm income in the Group's own Leaf Operations. The total farm income will be compared with global standard benchmarks on living income, and we will be working to create and implement tailored improvement plans with the view to bringing more positive impact and return to the farmers. BAT Annual Report and Form 20-F 2022 Strategic Report Governance Report Financial Statements Other Information 63
Robust corporate governance Responsible Marketing & Transparency in Communications Our Goal 100% of our marketing to be responsible 2022 Performance Highlights 3 2 Incidents of non- compliance with regulations resulting in a fine or penalty1 Incidents of non-compliance with regulations resulting in a regulatory warning1 GRI Standards SFDR PAI Indicator SASB Standards GRI 417-2, GRI 417-3 This topic is not mapped to a specified Indicator FB-TB-270.a.1, FB- TB-270.a.2 Relevant Policies and Standard(s) – International Marketing Principles (IMP) – Youth Access Prevention (YAP) Guidelines – Supplier Code of Conduct (SCoC) Notes: 1. Incidents of non-compliance with regulations that result in warning or in fine or penalty are dealt with at end market level. To collect the 'Incidents of non-compliance with regulations resulting in warning/fine or penalty' compliance data, the local teams are asked to report any instances or potential instances of breach, which may include allegations of inappropriate marketing, or investigations regarding marketing non-compliance, that they are aware of in their market. Find out more: Refer to the BAT 'Reporting Criteria' for a full description of key terms and definitions: bat.com/reporting For more performance metrics and operational data refer to the BAT 'ESG Performance Data Book': bat.com/sustainability reporting Why Responsible Marketing and Transparent Communications Matter We firmly believe that tobacco and nicotine products should be marketed responsibly and to adults only. We also believe that, with respect to our New Category products, marketing freedoms are critical for our ability to deliver on tobacco harm reduction. This is because informing adult tobacco and nicotine users about their attributes, including their reduced-risk*† profile in comparison to cigarettes , is key to motivating adult tobacco and nicotine users to switch to New Category products which would, in turn, reduce rates of smoking and smoking-related diseases. Our Well-Established Approach to Marketing Products Responsibly We grow our market share by encouraging adult consumers to choose our products over those of our competitors. In doing so, we aim to market our products responsibly while raising standards and preventing our products from ending up in the hands of those who are underage. International Marketing Principles (IMP) Our IMP govern our approach to marketing. They include five key principles, which mandate strict requirements for our marketing to be: – Responsible; – Accurate and not misleading; – Targeted at adult consumers only; – Transparent; and – Compliant with all applicable laws. We aim to apply these principles consistently across our product categories, even when they are stricter than local laws. We hold our marketing suppliers to the same high standards. Compliance with the IMP is part of our Supplier Code of Conduct (SCoC), which sets the minimum standards expected of our suppliers. In addition, IMP compliance is explicitly set out as a requirement in our contracts with our marketing suppliers. In addition to the IMP, detailed compliance procedures, guidance and toolkits help our IMP to be applied consistently and effectively in the market. Youth Access Prevention (YAP) is key to responsible marketing. We have a number of guidelines, standards and toolkits relating to YAP. These apply to all markets where our products are sold, including where they are distributed through third parties. BAT Annual Report and Form 20-F 2022 Strategic Report Governance Report Financial Statements Other Information Strategic Management Responsible Marketing 64
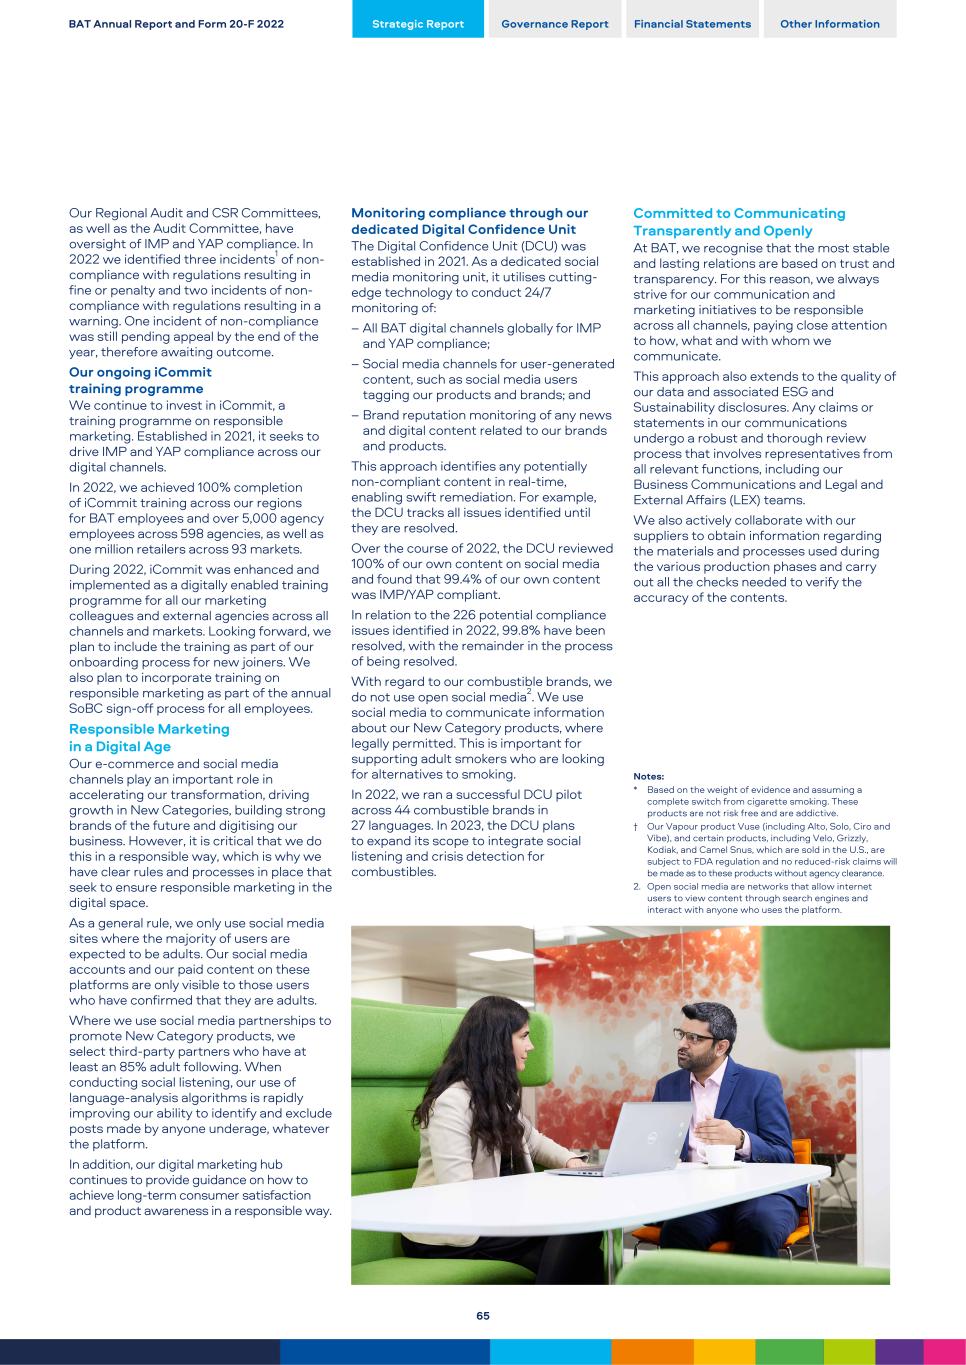
Our Regional Audit and CSR Committees, as well as the Audit Committee, have oversight of IMP and YAP compliance. In 2022 we identified three incidents1 of non- compliance with regulations resulting in fine or penalty and two incidents of non- compliance with regulations resulting in a warning. One incident of non-compliance was still pending appeal by the end of the year, therefore awaiting outcome. Our ongoing iCommit training programme We continue to invest in iCommit, a training programme on responsible marketing. Established in 2021, it seeks to drive IMP and YAP compliance across our digital channels. In 2022, we achieved 100% completion of iCommit training across our regions for BAT employees and over 5,000 agency employees across 598 agencies, as well as one million retailers across 93 markets. During 2022, iCommit was enhanced and implemented as a digitally enabled training programme for all our marketing colleagues and external agencies across all channels and markets. Looking forward, we plan to include the training as part of our onboarding process for new joiners. We also plan to incorporate training on responsible marketing as part of the annual SoBC sign-off process for all employees. Responsible Marketing in a Digital Age Our e-commerce and social media channels play an important role in accelerating our transformation, driving growth in New Categories, building strong brands of the future and digitising our business. However, it is critical that we do this in a responsible way, which is why we have clear rules and processes in place that seek to ensure responsible marketing in the digital space. As a general rule, we only use social media sites where the majority of users are expected to be adults. Our social media accounts and our paid content on these platforms are only visible to those users who have confirmed that they are adults. Where we use social media partnerships to promote New Category products, we select third-party partners who have at least an 85% adult following. When conducting social listening, our use of language-analysis algorithms is rapidly improving our ability to identify and exclude posts made by anyone underage, whatever the platform. In addition, our digital marketing hub continues to provide guidance on how to achieve long-term consumer satisfaction and product awareness in a responsible way. Monitoring compliance through our dedicated Digital Confidence Unit The Digital Confidence Unit (DCU) was established in 2021. As a dedicated social media monitoring unit, it utilises cutting- edge technology to conduct 24/7 monitoring of: – All BAT digital channels globally for IMP and YAP compliance; – Social media channels for user-generated content, such as social media users tagging our products and brands; and – Brand reputation monitoring of any news and digital content related to our brands and products. This approach identifies any potentially non-compliant content in real-time, enabling swift remediation. For example, the DCU tracks all issues identified until they are resolved. Over the course of 2022, the DCU reviewed 100% of our own content on social media and found that 99.4% of our own content was IMP/YAP compliant. In relation to the 226 potential compliance issues identified in 2022, 99.8% have been resolved, with the remainder in the process of being resolved. With regard to our combustible brands, we do not use open social media2. We use social media to communicate information about our New Category products, where legally permitted. This is important for supporting adult smokers who are looking for alternatives to smoking. In 2022, we ran a successful DCU pilot across 44 combustible brands in 27 languages. In 2023, the DCU plans to expand its scope to integrate social listening and crisis detection for combustibles. Committed to Communicating Transparently and Openly At BAT, we recognise that the most stable and lasting relations are based on trust and transparency. For this reason, we always strive for our communication and marketing initiatives to be responsible across all channels, paying close attention to how, what and with whom we communicate. This approach also extends to the quality of our data and associated ESG and Sustainability disclosures. Any claims or statements in our communications undergo a robust and thorough review process that involves representatives from all relevant functions, including our Business Communications and Legal and External Affairs (LEX) teams. We also actively collaborate with our suppliers to obtain information regarding the materials and processes used during the various production phases and carry out all the checks needed to verify the accuracy of the contents. Notes: * Based on the weight of evidence and assuming a complete switch from cigarette smoking. These products are not risk free and are addictive. † Our Vapour product Vuse (including Alto, Solo, Ciro and Vibe), and certain products, including Velo, Grizzly, Kodiak, and Camel Snus, which are sold in the U.S., are subject to FDA regulation and no reduced-risk claims will be made as to these products without agency clearance. 2. Open social media are networks that allow internet users to view content through search engines and interact with anyone who uses the platform. BAT Annual Report and Form 20-F 2022 Strategic Report Governance Report Financial Statements Other Information 65
Robust corporate governance Ethics and Integrity Our Goal 100% aiming for adherence to our Standards of Business Conduct (SoBC) 2022 Performance Highlights 100% 84 58 of Group employees completed SoBC training and compliance sign-off procedure number of established SoBC breaches1 number of disciplinary actions resulting in people leaving BAT GRI Standards SFDR PAI Indicators SASB Standard GRI2-26, GRI 205-2, GRI 205-3, GRI 415-1 10, 11, 14, S5, S6, S7, S15, S16, S17 This topic is not mapped to a specified Standard Relevant Policies and Standards – Standards of Business Conduct (SoBC) – Supplier Code of Conduct (SCoC) – Anti-Illicit Trade (AIT) Policy – Supply Chain Compliance Procedure (SCCP) Notes: 1. Consistent with previous years' reporting, cases are not included in the above if they were not resolved at year-end. 2. Euromonitor International estimates. Find out more: Refer to the BAT 'Reporting Criteria' for a full description of key terms and definitions: bat.com/reporting For more performance metrics and operational data refer to the BAT 'ESG Performance Data Book': bat.com/sustainability reporting Our Approach Our Standards of Business Conduct (SoBC) cover areas such as: anti-bribery and anti- corruption (ABAC), political contributions, anti- money laundering and tax evasion. Our Supplier Code of Conduct (SCoC) outlines the minimum standards expected of our suppliers and also includes provisions relating to ABAC, sanctions, anti-tax evasion and anti-illicit trade. We conduct a detailed review of our SoBC and SCoC every two years. The most recent reviews were undertaken in 2021. Why Ethics and Integrity Matter In an organisation as diverse and multinational as BAT, it is essential that we work to a consistent set of rules and standards of behaviour across the Group. Our culture is based on ethical values. Our Delivery with Integrity programme drives our consistent approach to managing key risks, including bribery and corruption. Read about our Group Risk Factors relating to corporate behaviour and compliance with sanctions and competition laws on pages 353 to 355 Promoting an Ethical Culture Our Delivery with Integrity global compliance programme was established in 2017. It promotes an ethical culture and communicates expected behaviours as set out in our SoBC. For example, our SoBC app provides easy access to policies, procedures and guidance, including our SCoC and our global ‘Speak Up’ channels. To date, the app has been downloaded c.36,000 times. The programme includes the Third-Party Anti-Financial Crime Procedure, an updated AIT Intelligence Compliance Procedure, the Sanctions Compliance Procedure and the use of newly developed systems to conduct risk assessments. In addition, our Mergers and Acquisitions (M&A) Transactions Compliance Procedure is in place and defines due diligence requirements for corporate M&A transactions (including joint-ventures, acquisitions and disposals). Enabling Everyone to 'Speak-Up' Our SoBC and SCoC make it clear that our employees, business partners and suppliers should speak up if they have a concern about actual or suspected wrongdoing. We always listen to these concerns and treat them as a serious matter. We do not tolerate harassment, victimisation or reprisals of any kind against anyone raising a concern – such conduct is itself a breach of the SoBC. People can speak up in various ways, including talking directly to a Group Designated Officer, Human Resources, Legal or to their line manager. Our externally managed global Speak Up channels can be used anonymously, and are available in multiple languages, 24 hours a day online, by text, or telephone. We have worked hard, via ongoing training and communication and the Integrity BAT Annual Report and Form 20-F 2022 Strategic Report Governance Report Financial Statements Other Information Strategic Management Ethics and Integrity 66
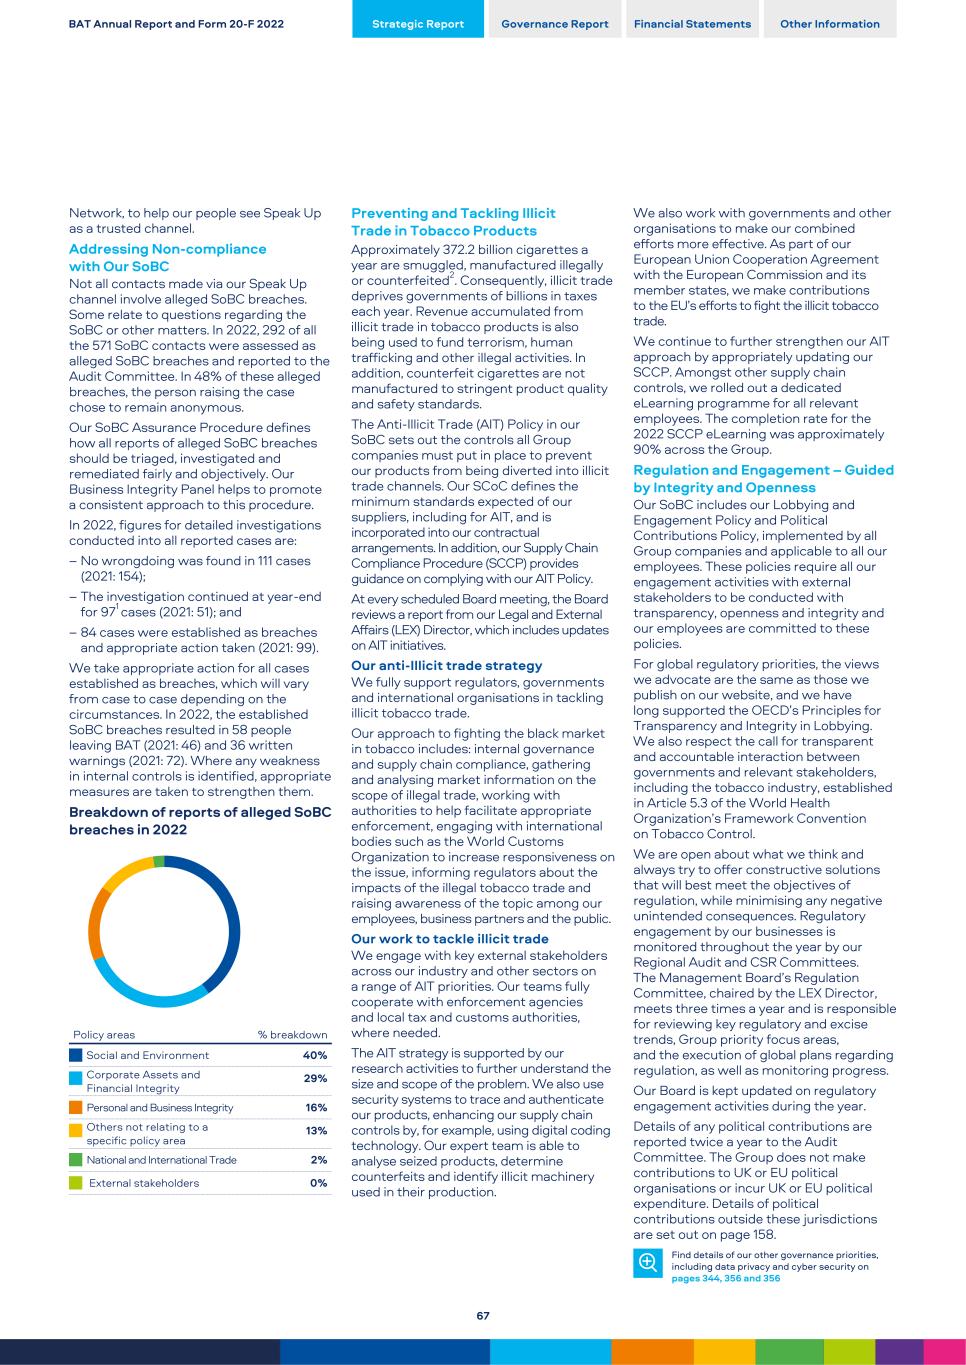
Network, to help our people see Speak Up as a trusted channel. Addressing Non-compliance with Our SoBC Not all contacts made via our Speak Up channel involve alleged SoBC breaches. Some relate to questions regarding the SoBC or other matters. In 2022, 292 of all the 571 SoBC contacts were assessed as alleged SoBC breaches and reported to the Audit Committee. In 48% of these alleged breaches, the person raising the case chose to remain anonymous. Our SoBC Assurance Procedure defines how all reports of alleged SoBC breaches should be triaged, investigated and remediated fairly and objectively. Our Business Integrity Panel helps to promote a consistent approach to this procedure. In 2022, figures for detailed investigations conducted into all reported cases are: – No wrongdoing was found in 111 cases (2021: 154); – The investigation continued at year-end for 971 cases (2021: 51); and – 84 cases were established as breaches and appropriate action taken (2021: 99). We take appropriate action for all cases established as breaches, which will vary from case to case depending on the circumstances. In 2022, the established SoBC breaches resulted in 58 people leaving BAT (2021: 46) and 36 written warnings (2021: 72). Where any weakness in internal controls is identified, appropriate measures are taken to strengthen them. Breakdown of reports of alleged SoBC breaches in 2022 Policy areas % breakdown Social and Environment 40% Corporate Assets and Financial Integrity 29% Personal and Business Integrity 16% Others not relating to a specific policy area 13% National and International Trade 2% External stakeholders 0% Preventing and Tackling Illicit Trade in Tobacco Products Approximately 372.2 billion cigarettes a year are smuggled, manufactured illegally or counterfeited2. Consequently, illicit trade deprives governments of billions in taxes each year. Revenue accumulated from illicit trade in tobacco products is also being used to fund terrorism, human trafficking and other illegal activities. In addition, counterfeit cigarettes are not manufactured to stringent product quality and safety standards. The Anti-Illicit Trade (AIT) Policy in our SoBC sets out the controls all Group companies must put in place to prevent our products from being diverted into illicit trade channels. Our SCoC defines the minimum standards expected of our suppliers, including for AIT, and is incorporated into our contractual arrangements. In addition, our Supply Chain Compliance Procedure (SCCP) provides guidance on complying with our AIT Policy. At every scheduled Board meeting, the Board reviews a report from our Legal and External Affairs (LEX) Director, which includes updates on AIT initiatives. Our anti-Illicit trade strategy We fully support regulators, governments and international organisations in tackling illicit tobacco trade. Our approach to fighting the black market in tobacco includes: internal governance and supply chain compliance, gathering and analysing market information on the scope of illegal trade, working with authorities to help facilitate appropriate enforcement, engaging with international bodies such as the World Customs Organization to increase responsiveness on the issue, informing regulators about the impacts of the illegal tobacco trade and raising awareness of the topic among our employees, business partners and the public. Our work to tackle illicit trade We engage with key external stakeholders across our industry and other sectors on a range of AIT priorities. Our teams fully cooperate with enforcement agencies and local tax and customs authorities, where needed. The AIT strategy is supported by our research activities to further understand the size and scope of the problem. We also use security systems to trace and authenticate our products, enhancing our supply chain controls by, for example, using digital coding technology. Our expert team is able to analyse seized products, determine counterfeits and identify illicit machinery used in their production. We also work with governments and other organisations to make our combined efforts more effective. As part of our European Union Cooperation Agreement with the European Commission and its member states, we make contributions to the EU’s efforts to fight the illicit tobacco trade. We continue to further strengthen our AIT approach by appropriately updating our SCCP. Amongst other supply chain controls, we rolled out a dedicated eLearning programme for all relevant employees. The completion rate for the 2022 SCCP eLearning was approximately 90% across the Group. Regulation and Engagement – Guided by Integrity and Openness Our SoBC includes our Lobbying and Engagement Policy and Political Contributions Policy, implemented by all Group companies and applicable to all our employees. These policies require all our engagement activities with external stakeholders to be conducted with transparency, openness and integrity and our employees are committed to these policies. For global regulatory priorities, the views we advocate are the same as those we publish on our website, and we have long supported the OECD’s Principles for Transparency and Integrity in Lobbying. We also respect the call for transparent and accountable interaction between governments and relevant stakeholders, including the tobacco industry, established in Article 5.3 of the World Health Organization’s Framework Convention on Tobacco Control. We are open about what we think and always try to offer constructive solutions that will best meet the objectives of regulation, while minimising any negative unintended consequences. Regulatory engagement by our businesses is monitored throughout the year by our Regional Audit and CSR Committees. The Management Board’s Regulation Committee, chaired by the LEX Director, meets three times a year and is responsible for reviewing key regulatory and excise trends, Group priority focus areas, and the execution of global plans regarding regulation, as well as monitoring progress. Our Board is kept updated on regulatory engagement activities during the year. Details of any political contributions are reported twice a year to the Audit Committee. The Group does not make contributions to UK or EU political organisations or incur UK or EU political expenditure. Details of political contributions outside these jurisdictions are set out on page 158. Find details of our other governance priorities, including data privacy and cyber security on pages 344, 356 and 356 BAT Annual Report and Form 20-F 2022 Strategic Report Governance Report Financial Statements Other Information 67
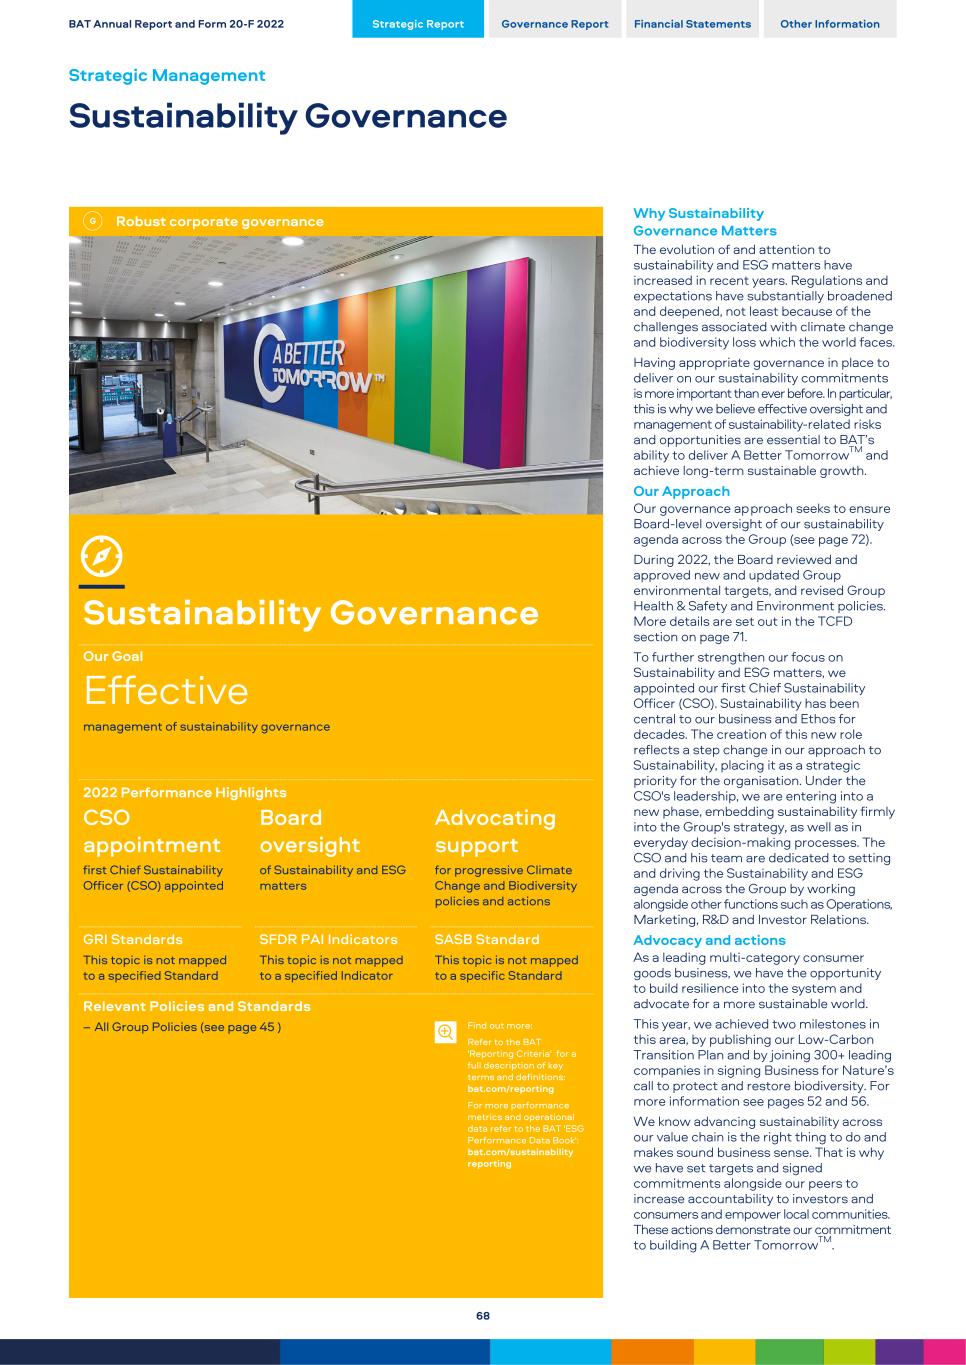
Robust corporate governance Sustainability Governance Our Goal Effective management of sustainability governance 2022 Performance Highlights CSO appointment Board oversight Advocating support first Chief Sustainability Officer (CSO) appointed of Sustainability and ESG matters for progressive Climate Change and Biodiversity policies and actions GRI Standards SFDR PAI Indicators SASB Standard This topic is not mapped to a specified Standard This topic is not mapped to a specified Indicator This topic is not mapped to a specific Standard Relevant Policies and Standards – All Group Policies (see page 45 ) Find out more: Refer to the BAT 'Reporting Criteria' for a full description of key terms and definitions: bat.com/reporting For more performance metrics and operational data refer to the BAT 'ESG Performance Data Book': bat.com/sustainability reporting Why Sustainability Governance Matters The evolution of and attention to sustainability and ESG matters have increased in recent years. Regulations and expectations have substantially broadened and deepened, not least because of the challenges associated with climate change and biodiversity loss which the world faces. Having appropriate governance in place to deliver on our sustainability commitments is more important than ever before. In particular, this is why we believe effective oversight and management of sustainability-related risks and opportunities are essential to BAT’s ability to deliver A Better TomorrowTM and achieve long-term sustainable growth. Our Approach Our governance ap proach seeks to ensure Board-level oversight of our sustainability agenda across the Group (see page 72). During 2022, the Board reviewed and approved new and updated Group environmental targets, and revised Group Health & Safety and Environment policies. More details are set out in the TCFD section on page 71. To further strengthen our focus on Sustainability and ESG matters, we appointed our first Chief Sustainability Officer (CSO). Sustainability has been central to our business and Ethos for decades. The creation of this new role reflects a step change in our approach to Sustainability, placing it as a strategic priority for the organisation. Under the CSO's leadership, we are entering into a new phase, embedding sustainability firmly into the Group's strategy, as well as in everyday decision-making processes. The CSO and his team are dedicated to setting and driving the Sustainability and ESG agenda across the Group by working alongside other functions such as Operations, Marketing, R&D and Investor Relations. Advocacy and actions As a leading multi-category consumer goods business, we have the opportunity to build resilience into the system and advocate for a more sustainable world. This year, we achieved two milestones in this area, by publishing our Low-Carbon Transition Plan and by joining 300+ leading companies in signing Business for Nature’s call to protect and restore biodiversity. For more information see pages 52 and 56. We know advancing sustainability across our value chain is the right thing to do and makes sound business sense. That is why we have set targets and signed commitments alongside our peers to increase accountability to investors and consumers and empower local communities. These actions demonstrate our commitment to building A Better TomorrowTM. BAT Annual Report and Form 20-F 2022 Strategic Report Governance Report Financial Statements Other Information Strategic Management Sustainability Governance 68
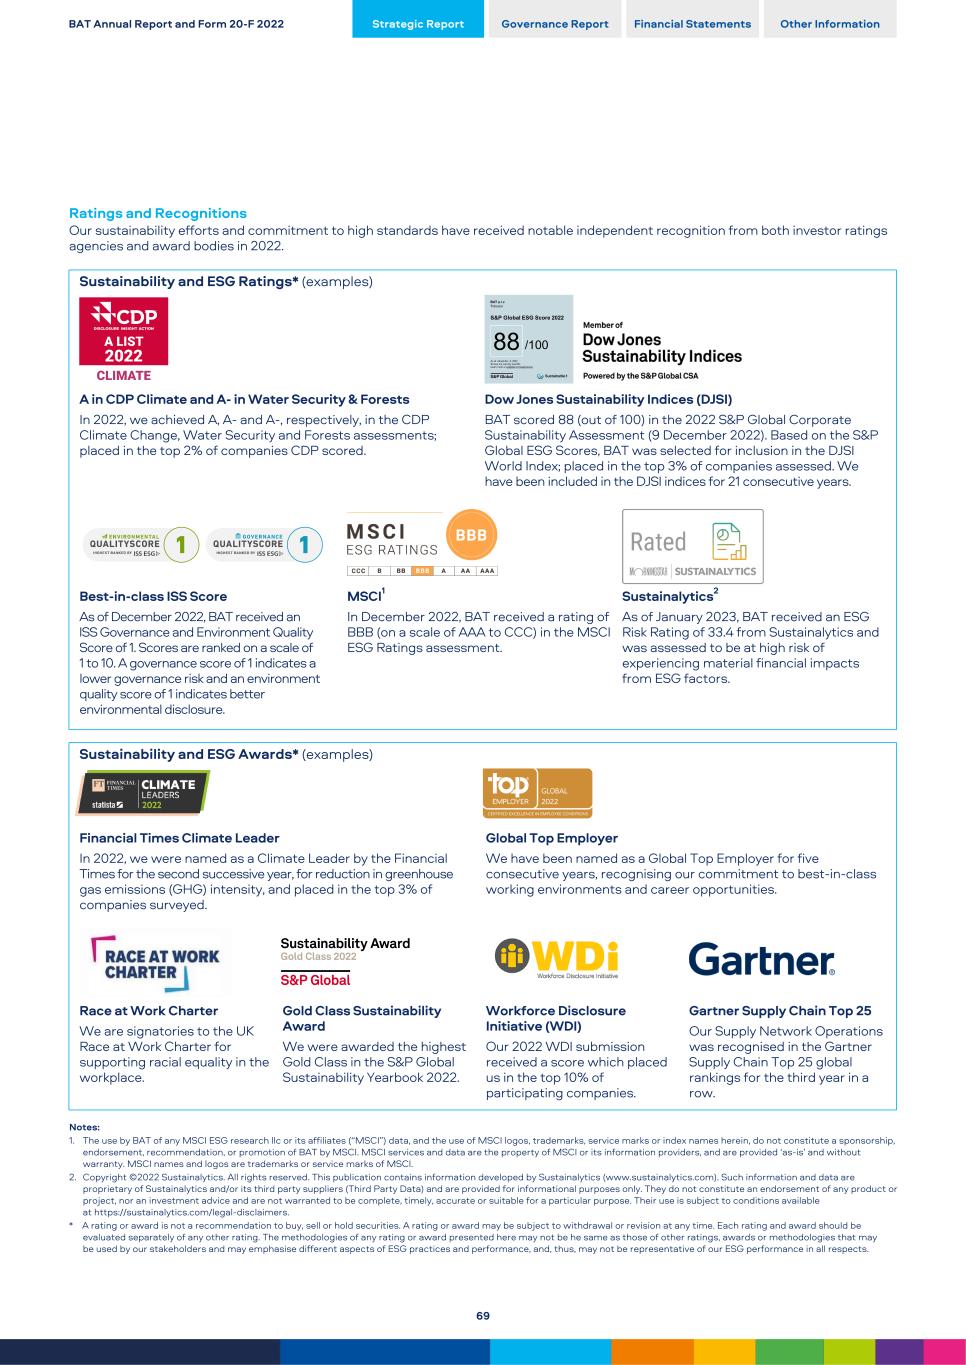
Ratings and Recognitions Our sustainability efforts and commitment to high standards have received notable independent recognition from both investor ratings agencies and award bodies in 2022. Sustainability and ESG Ratings* (examples) A in CDP Climate and A- in Water Security & Forests In 2022, we achieved A, A- and A-, respectively, in the CDP Climate Change, Water Security and Forests assessments; placed in the top 2% of companies CDP scored. Dow Jones Sustainability Indices (DJSI) BAT scored 88 (out of 100) in the 2022 S&P Global Corporate Sustainability Assessment (9 December 2022). Based on the S&P Global ESG Scores, BAT was selected for inclusion in the DJSI World Index; placed in the top 3% of companies assessed. We have been included in the DJSI indices for 21 consecutive years. Best-in-class ISS Score As of December 2022, BAT received an ISS Governance and Environment Quality Score of 1. Scores are ranked on a scale of 1 to 10. A governance score of 1 indicates a lower governance risk and an environment quality score of 1 indicates better environmental disclosure. MSCI1 In December 2022, BAT received a rating of BBB (on a scale of AAA to CCC) in the MSCI ESG Ratings assessment. Sustainalytics2 As of January 2023, BAT received an ESG Risk Rating of 33.4 from Sustainalytics and was assessed to be at high risk of experiencing material financial impacts from ESG factors. Sustainability and ESG Awards* (examples) Financial Times Climate Leader In 2022, we were named as a Climate Leader by the Financial Times for the second successive year, for reduction in greenhouse gas emissions (GHG) intensity, and placed in the top 3% of companies surveyed. Global Top Employer We have been named as a Global Top Employer for five consecutive years, recognising our commitment to best-in-class working environments and career opportunities. Race at Work Charter We are signatories to the UK Race at Work Charter for supporting racial equality in the workplace. Gold Class Sustainability Award We were awarded the highest Gold Class in the S&P Global Sustainability Yearbook 2022. Workforce Disclosure Initiative (WDI) Our 2022 WDI submission received a score which placed us in the top 10% of participating companies. Gartner Supply Chain Top 25 Our Supply Network Operations was recognised in the Gartner Supply Chain Top 25 global rankings for the third year in a row. Notes: 1. The use by BAT of any MSCI ESG research llc or its affiliates (“MSCI”) data, and the use of MSCI logos, trademarks, service marks or index names herein, do not constitute a sponsorship, endorsement, recommendation, or promotion of BAT by MSCI. MSCI services and data are the property of MSCI or its information providers, and are provided ‘as-is’ and without warranty. MSCI names and logos are trademarks or service marks of MSCI. 2. Copyright ©2022 Sustainalytics. All rights reserved. This publication contains information developed by Sustainalytics (www.sustainalytics.com). Such information and data are proprietary of Sustainalytics and/or its third party suppliers (Third Party Data) and are provided for informational purposes only. They do not constitute an endorsement of any product or project, nor an investment advice and are not warranted to be complete, timely, accurate or suitable for a particular purpose. Their use is subject to conditions available at https://sustainalytics.com/legal-disclaimers. * A rating or award is not a recommendation to buy, sell or hold securities. A rating or award may be subject to withdrawal or revision at any time. Each rating and award should be evaluated separately of any other rating. The methodologies of any rating or award presented here may not be he same as those of other ratings, awards or methodologies that may be used by our stakeholders and may emphasise different aspects of ESG practices and performance, and, thus, may not be representative of our ESG performance in all respects. BAT Annual Report and Form 20-F 2022 Strategic Report Governance Report Financial Statements Other Information 69
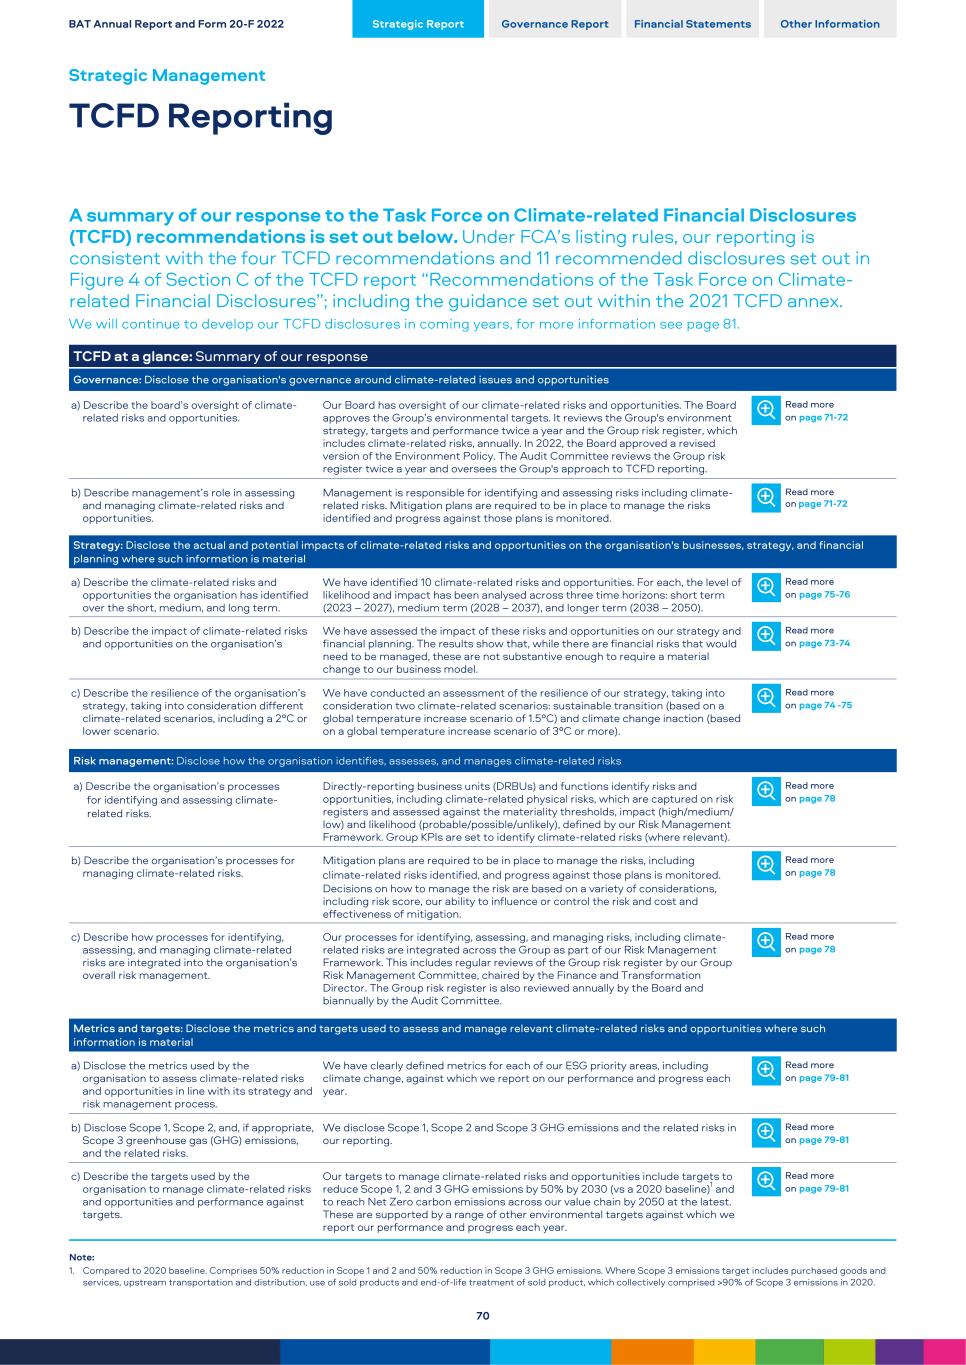
TCFD at a glance: Summary of our response Governance: Disclose the organisation's governance around climate-related issues and opportunities a) Describe the board’s oversight of climate- related risks and opportunities. Our Board has oversight of our climate-related risks and opportunities. The Board approves the Group’s environmental targets. It reviews the Group's environment strategy, targets and performance twice a year and the Group risk register, which includes climate-related risks, annually. In 2022, the Board approved a revised version of the Environment Policy. The Audit Committee reviews the Group risk register twice a year and oversees the Group's approach to TCFD reporting. Read more on page 71-72 b) Describe management’s role in assessing and managing climate-related risks and opportunities. Management is responsible for identifying and assessing risks including climate- related risks. Mitigation plans are required to be in place to manage the risks identified and progress against those plans is monitored. Read more on page 71-72 Strategy: Disclose the actual and potential impacts of climate-related risks and opportunities on the organisation's businesses, strategy, and financial planning where such information is material a) Describe the climate-related risks and opportunities the organisation has identified over the short, medium, and long term. We have identified 10 climate-related risks and opportunities. For each, the level of likelihood and impact has been analysed across three time horizons: short term (2023 – 2027), medium term (2028 – 2037), and longer term (2038 – 2050). Read more on page 75-76 b) Describe the impact of climate-related risks and opportunities on the organisation’s We have assessed the impact of these risks and opportunities on our strategy and financial planning. The results show that, while there are financial risks that would need to be managed, these are not substantive enough to require a material change to our business model. Read more on page 73-74 c) Describe the resilience of the organisation’s strategy, taking into consideration different climate-related scenarios, including a 2°C or lower scenario. We have conducted an assessment of the resilience of our strategy, taking into consideration two climate-related scenarios: sustainable transition (based on a global temperature increase scenario of 1.5°C) and climate change inaction (based on a global temperature increase scenario of 3°C or more). Read more on page 74 -75 Risk management: Disclose how the organisation identifies, assesses, and manages climate-related risks a) Describe the organisation’s processes for identifying and assessing climate- related risks. Directly-reporting business units (DRBUs) and functions identify risks and opportunities, including climate-related physical risks, which are captured on risk registers and assessed against the materiality thresholds, impact (high/medium/ low) and likelihood (probable/possible/unlikely), defined by our Risk Management Framework. Group KPIs are set to identify climate-related risks (where relevant). Read more on page 78 b) Describe the organisation’s processes for managing climate-related risks. Mitigation plans are required to be in place to manage the risks, including climate-related risks identified, and progress against those plans is monitored. Decisions on how to manage the risk are based on a variety of considerations, including risk score, our ability to influence or control the risk and cost and effectiveness of mitigation. Read more on page 78 c) Describe how processes for identifying, assessing, and managing climate-related risks are integrated into the organisation’s overall risk management. Our processes for identifying, assessing, and managing risks, including climate- related risks are integrated across the Group as part of our Risk Management Framework. This includes regular reviews of the Group risk register by our Group Risk Management Committee, chaired by the Finance and Transformation Director. The Group risk register is also reviewed annually by the Board and biannually by the Audit Committee. Read more on page 78 Metrics and targets: Disclose the metrics and targets used to assess and manage relevant climate-related risks and opportunities where such information is material a) Disclose the metrics used by the organisation to assess climate-related risks and opportunities in line with its strategy and risk management process. We have clearly defined metrics for each of our ESG priority areas, including climate change, against which we report on our performance and progress each year. Read more on page 79-81 b) Disclose Scope 1, Scope 2, and, if appropriate, Scope 3 greenhouse gas (GHG) emissions, and the related risks. We disclose Scope 1, Scope 2 and Scope 3 GHG emissions and the related risks in our reporting. Read more on page 79-81 c) Describe the targets used by the organisation to manage climate-related risks and opportunities and performance against targets. Our targets to manage climate-related risks and opportunities include targets to reduce Scope 1, 2 and 3 GHG emissions by 50% by 2030 (vs a 2020 baseline)1 and to reach Net Zero carbon emissions across our value chain by 2050 at the latest. These are supported by a range of other environmental targets against which we report our performance and progress each year. Read more on page 79-81 Note: 1. Compared to 2020 baseline. Comprises 50% reduction in Scope 1 and 2 and 50% reduction in Scope 3 GHG emissions. Where Scope 3 emissions target includes purchased goods and services, upstream transportation and distribution, use of sold products and end-of-life treatment of sold product, which collectively comprised >90% of Scope 3 emissions in 2020. BAT Annual Report and Form 20-F 2022 Strategic Report Governance Report Financial Statements Other Information Strategic Management TCFD Reporting A summary of our response to the Task Force on Climate-related Financial Disclosures (TCFD) recommendations is set out below. Under FCA’s listing rules, our reporting is consistent with the four TCFD recommendations and 11 recommended disclosures set out in Figure 4 of Section C of the TCFD report “Recommendations of the Task Force on Climate- related Financial Disclosures”; including the guidance set out within the 2021 TCFD annex. We will continue to develop our TCFD disclosures in coming years, for more information see page 81. 70
In 2022, the Group progressed its work to further understand our resilience against key risks and opportunities. This process included: – Developing our first Double Materiality Assessment; – Developing our Low Carbon Transition Plan to achieve Net Zero GHG emission by 2050; – Working to embed best practice recommendations into our TCFD disclosures; and – Trialling a balanced scorecard to further enhance consideration of environmental and social impacts into investment appraisal. Details are outlined in the following pages. Governance Board oversight The Board is collectively responsible for the sustainable, long-term success of the Company and the Group’s strategic direction, purpose, values and governance. This includes responsibility for the Group's strategy and ensuring that resources are in place to meet the objectives and to manage risks, including internal controls. Our Board has strategic oversight of our sustainability agenda and takes climate- related considerations into account where applicable when making strategic decisions, including in relation to budgeting, risk management and overseeing capital expenditure. The Board has approved all Group environmental targets (including for carbon emissions) and receives an update on performance twice a year from the Director, Operations. The Board reviews the Group risk register annually, which incorporates climate- related risks, and the Group budget which takes into account capital allocation to deliver the Group’s sustainability agenda and associated targets. In 2022, the Board approved a revised version of the Group's Environment Policy, with policy reviews developed by management, and the Board was briefed on preparations for the Group's first Low Carbon Transition Plan, detailing the Group's roadmap to reach Net Zero emissions by 2050. Details of Board oversight of climate-related matters and related activities can be found on pages 135 and 139 The Board has delegated certain responsibilities to the Audit Committee which is responsible for reviewing the effectiveness of the Group’s risk management and internal controls systems, including those relating to climate change. Read more about our Climate and Circularity risk in the Group Principal Risks on page 121 and in the Group Risk Factors on page 344 The Audit Committee reviews the Group risk register twice a year and regularly reviews the Group’s progress against sustainability and ESG targets, including emission targets that address climate-related issues (including carbon neutrality across Scope 1 and 2 GHG emissions by 2030, and Net Zero emissions across our value chain by 2050). The Audit Committee also receives reports from the Group’s Regional Audit and CSR committees and Corporate Audit Committee, which monitor the effectiveness of business risk management and internal controls across regions and central functions. In 2022, the Audit Committee oversaw the evolution of our approach to reporting in alignment with the TCFD framework. The Chair of the Audit Committee provides a full briefing to the Board following each Audit Committee meeting, including decisions taken and key topics discussed by the Audit Committee. Details of Audit Committee oversight of climate- related matters, metrics and reporting can be found on pages 150 to 151, 153, 155 and 157 Management’s role The assessment and management of climate- related risks is embedded across relevant business areas at Group, regional and local levels, with appropriate management oversight at each level, as shown on the chart on page 72. This approach provides a flexible channel for the structured flow of information, monitoring and oversight of climate-related risks and environmental matters at the level and format best suited to the context. Our Management Board, chaired by our Chief Executive, is responsible for overseeing the implementation of the Group’s strategy and policies set by the Board, and for creating the framework for the day-to-day operation of the Group’s subsidiaries. Management Board members receive regular updates on material risks and strategic plans, including those relating to climate change, along with associated risk mitigation plans, from risk owners, risk managers and their respective teams. This includes regular monitoring by the Group Risk Management Committee, chaired by the Finance and Transformation Director. The Chief Growth Officer has overall responsibility for the delivery of the Group Sustainability Agenda, supported by the Sustainability team, including our newly appointed Chief Sustainability Officer, Head of Corporate Sustainability and sustainability subject- matter experts across the Group. The Shaping Sustainability Programme Board oversees the cross-functional delivery of the ‘Shaping Sustainability’ pillar of our QUEST transformation programme. Members of the programme board include the Chief Growth Officer and the Director, Operations. The programme is underpinned by a drive team, including the Head of Corporate Sustainability and Head of Operations Development and Sustainability. The Chief Sustainability Officer has overall responsibility for delivery of the Group’s climate strategy and environmental targets, supported by the Group Head of Operations Development and Sustainability, and the Operations Sustainability team, including the central Sustainability team and regional sustainability managers. Each reporting unit reports on a monthly basis. In 2022, we strengthened our reporting approach by increasing the frequency of reporting from quarterly in the first quarter of the year to monthly from March onwards. Monitoring and reporting of consolidated Group performance and metrics is completed quarterly by the Group Operations Sustainability team. Each directly- reporting business unit of the Group (DRBU) has an Environment, Health & Safety (EHS) Steering Committee, with overall responsibility to deliver environmental targets at site level held by the General Manager or site manager. EHS is also a standing agenda item for management meetings and governance committees at area, regional and global levels. These local management meetings and committees report into the Operations Sustainability Forum, chaired by the Director, Operations. This acts as a conduit to track delivery of environmental targets and gain visibility of new and emerging risks posed by climate change. The Operations Sustainability Forum oversees business plans to mitigate risks identified, reviews performance and tracks progress of our regions and business units in delivering the Group’s environmental targets. The Environmental Sustainability Committee, also chaired by the Director, Operations, is responsible for reviewing environmental strategies for the Operations Leadership Team. Read more about our QUEST programme on pages 28 to 29 BAT Annual Report and Form 20-F 2022 Strategic Report Governance Report Financial Statements Other Information We recognise the importance of providing consistent and reliable climate-related information to investors and other stakeholders. Our reporting with reference to other frameworks, including the Sustainable Accounting Standards Board (SASB) framework and the Sustainable Finance Disclosure Regulation (SFDR PAI), can be found at www.bat.com/ sustainabilityreporting. 71
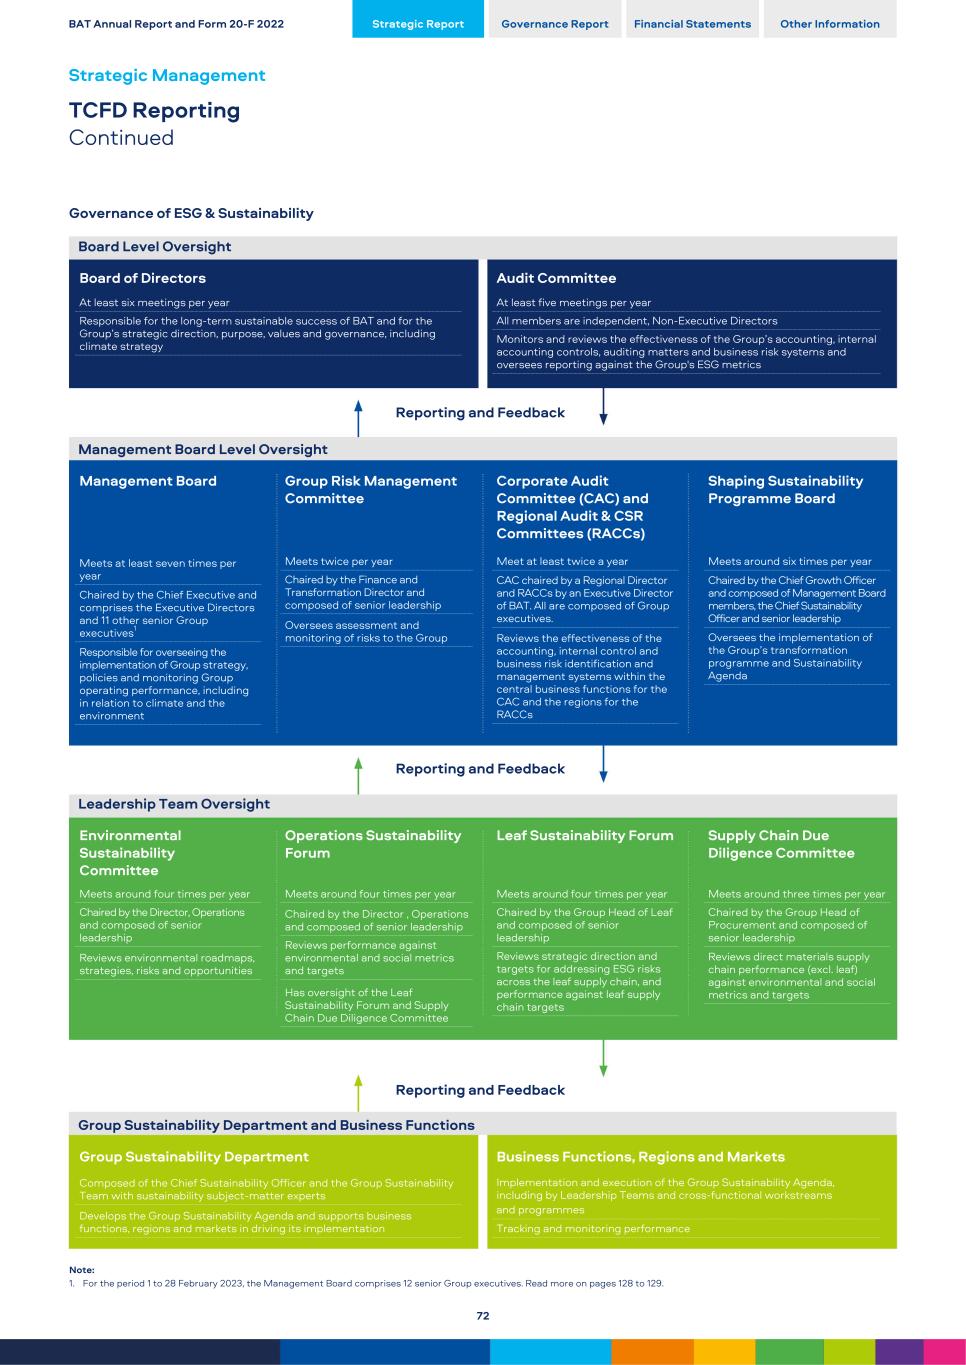
Governance of ESG & Sustainability Board Level Oversight Board of Directors At least six meetings per year Responsible for the long-term sustainable success of BAT and for the Group’s strategic direction, purpose, values and governance, including climate strategy Audit Committee At least five meetings per year All members are independent, Non-Executive Directors Monitors and reviews the effectiveness of the Group’s accounting, internal accounting controls, auditing matters and business risk systems and oversees reporting against the Group's ESG metrics Reporting and Feedback Management Board Level Oversight Management Board Meets at least seven times per year Chaired by the Chief Executive and comprises the Executive Directors and 11 other senior Group executives1 Responsible for overseeing the implementation of Group strategy, policies and monitoring Group operating performance, including in relation to climate and the environment Group Risk Management Committee Meets twice per year Chaired by the Finance and Transformation Director and composed of senior leadership Oversees assessment and monitoring of risks to the Group Corporate Audit Committee (CAC) and Regional Audit & CSR Committees (RACCs) Meet at least twice a year CAC chaired by a Regional Director and RACCs by an Executive Director of BAT. All are composed of Group executives. Reviews the effectiveness of the accounting, internal control and business risk identification and management systems within the central business functions for the CAC and the regions for the RACCs Shaping Sustainability Programme Board Meets around six times per year Chaired by the Chief Growth Officer and composed of Management Board members, the Chief Sustainability Officer and senior leadership Oversees the implementation of the Group’s transformation programme and Sustainability Agenda Reporting and Feedback Leadership Team Oversight Environmental Sustainability Committee Meets around four times per year Chaired by the Director, Operations and composed of senior leadership Reviews environmental roadmaps, strategies, risks and opportunities Operations Sustainability Forum Meets around four times per year Chaired by the Director , Operations and composed of senior leadership Reviews performance against environmental and social metrics and targets Has oversight of the Leaf Sustainability Forum and Supply Chain Due Diligence Committee Leaf Sustainability Forum Meets around four times per year Chaired by the Group Head of Leaf and composed of senior leadership Reviews strategic direction and targets for addressing ESG risks across the leaf supply chain, and performance against leaf supply chain targets Supply Chain Due Diligence Committee Meets around three times per year Chaired by the Group Head of Procurement and composed of senior leadership Reviews direct materials supply chain performance (excl. leaf) against environmental and social metrics and targets Reporting and Feedback Group Sustainability Department and Business Functions Group Sustainability Department Composed of the Chief Sustainability Officer and the Group Sustainability Team with sustainability subject-matter experts Develops the Group Sustainability Agenda and supports business functions, regions and markets in driving its implementation Business Functions, Regions and Markets Implementation and execution of the Group Sustainability Agenda, including by Leadership Teams and cross-functional workstreams and programmes Tracking and monitoring performance Note: 1. For the period 1 to 28 February 2023, the Management Board comprises 12 senior Group executives. Read more on pages 128 to 129. BAT Annual Report and Form 20-F 2022 Strategic Report Governance Report Financial Statements Other Information Strategic Management TCFD Reporting Continued 72
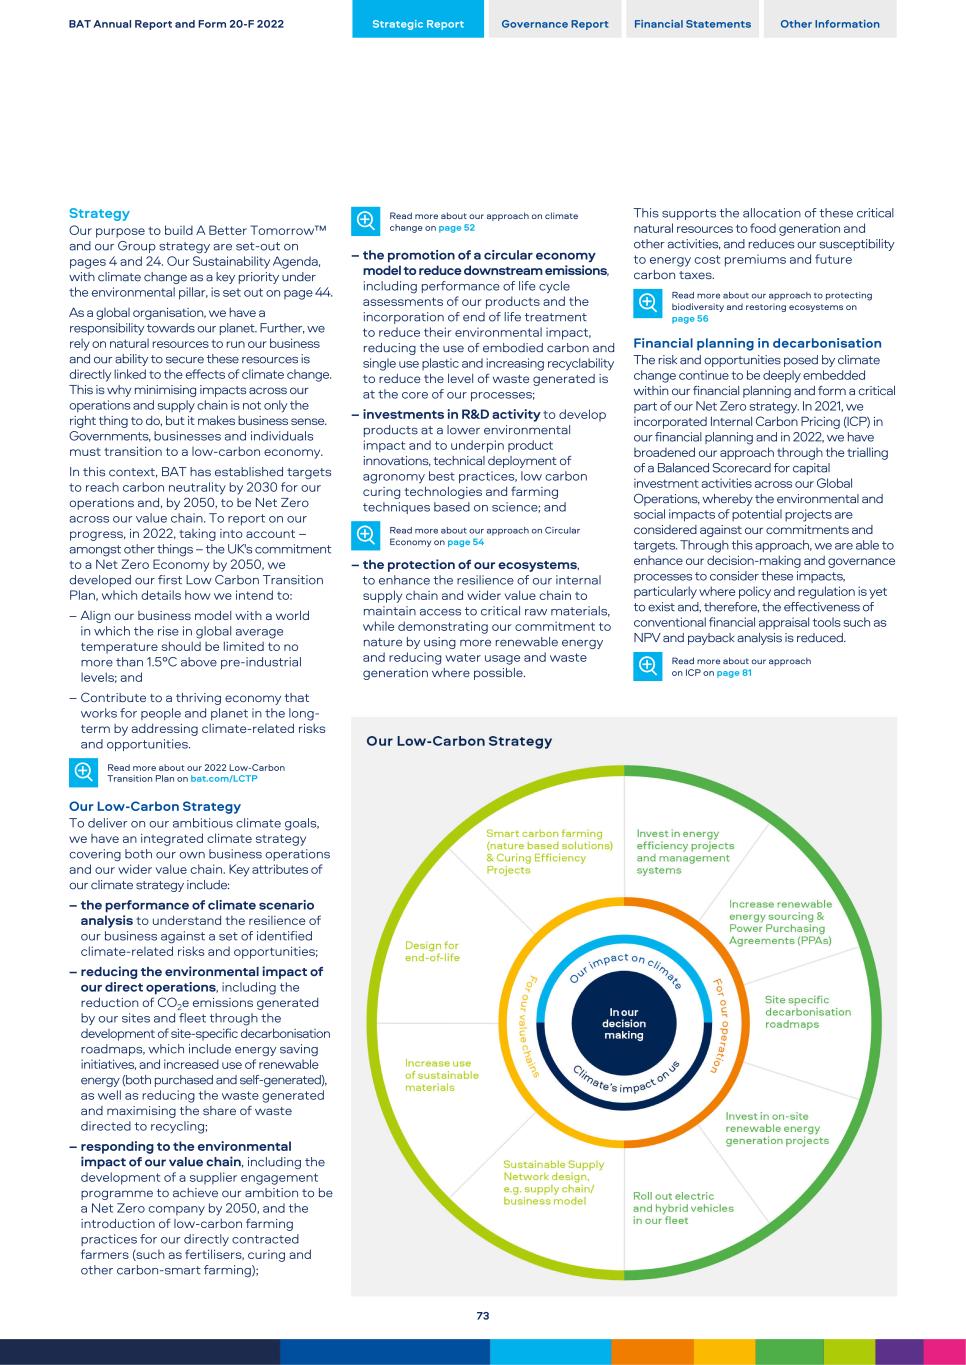
Strategy Our purpose to build A Better Tomorrow™ and our Group strategy are set-out on pages 4 and 24. Our Sustainability Agenda, with climate change as a key priority under the environmental pillar, is set out on page 44. As a global organisation, we have a responsibility towards our planet. Further, we rely on natural resources to run our business and our ability to secure these resources is directly linked to the effects of climate change. This is why minimising impacts across our operations and supply chain is not only the right thing to do, but it makes business sense. Governments, businesses and individuals must transition to a low-carbon economy. In this context, BAT has established targets to reach carbon neutrality by 2030 for our operations and, by 2050, to be Net Zero across our value chain. To report on our progress, in 2022, taking into account – amongst other things – the UK's commitment to a Net Zero Economy by 2050, we developed our first Low Carbon Transition Plan, which details how we intend to: – Align our business model with a world in which the rise in global average temperature should be limited to no more than 1.5°C above pre-industrial levels; and – Contribute to a thriving economy that works for people and planet in the long- term by addressing climate-related risks and opportunities. Read more about our 2022 Low-Carbon Transition Plan on bat.com/LCTP Our Low-Carbon Strategy To deliver on our ambitious climate goals, we have an integrated climate strategy covering both our own business operations and our wider value chain. Key attributes of our climate strategy include: – the performance of climate scenario analysis to understand the resilience of our business against a set of identified climate-related risks and opportunities; – reducing the environmental impact of our direct operations, including the reduction of CO2e emissions generated by our sites and fleet through the development of site-specific decarbonisation roadmaps, which include energy saving initiatives, and increased use of renewable energy (both purchased and self-generated), as well as reducing the waste generated and maximising the share of waste directed to recycling; – responding to the environmental impact of our value chain, including the development of a supplier engagement programme to achieve our ambition to be a Net Zero company by 2050, and the introduction of low-carbon farming practices for our directly contracted farmers (such as fertilisers, curing and other carbon-smart farming); Read more about our approach on climate change on page 52 – the promotion of a circular economy model to reduce downstream emissions, including performance of life cycle assessments of our products and the incorporation of end of life treatment to reduce their environmental impact, reducing the use of embodied carbon and single use plastic and increasing recyclability to reduce the level of waste generated is at the core of our processes; – investments in R&D activity to develop products at a lower environmental impact and to underpin product innovations, technical deployment of agronomy best practices, low carbon curing technologies and farming techniques based on science; and Read more about our approach on Circular Economy on page 54 – the protection of our ecosystems, to enhance the resilience of our internal supply chain and wider value chain to maintain access to critical raw materials, while demonstrating our commitment to nature by using more renewable energy and reducing water usage and waste generation where possible. This supports the allocation of these critical natural resources to food generation and other activities, and reduces our susceptibility to energy cost premiums and future carbon taxes. Read more about our approach to protecting biodiversity and restoring ecosystems on page 56 Financial planning in decarbonisation The risk and opportunities posed by climate change continue to be deeply embedded within our financial planning and form a critical part of our Net Zero strategy. In 2021, we incorporated Internal Carbon Pricing (ICP) in our financial planning and in 2022, we have broadened our approach through the trialling of a Balanced Scorecard for capital investment activities across our Global Operations, whereby the environmental and social impacts of potential projects are considered against our commitments and targets. Through this approach, we are able to enhance our decision-making and governance processes to consider these impacts, particularly where policy and regulation is yet to exist and, therefore, the effectiveness of conventional financial appraisal tools such as NPV and payback analysis is reduced. Read more about our approach on ICP on page 81 BAT Annual Report and Form 20-F 2022 Strategic Report Governance Report Financial Statements Other Information 73
Short-, medium-, and long-term financial planning is performed by the Group and considers factors likely to influence business performance as outlined on pages 75-76. In 2022, financial planning has been influenced by climate-related risks and opportunities. Revenue and operating costs Physical risks of climate change have the potential to impact business continuity and supply chain constraints; our business planning helps us to mitigate impacts on revenue. Climate change-related risks and opportunities also have the potential to impact our operating costs through: – Tobacco leaf cost increases due to potential supply constraints caused by chronic or extreme weather events; – Raw materials and innovation cost increases due to raw material shortages and enhancements to our product designs to reduce waste and increase recyclability; and – The cost of emerging regulation, as well as taxes on carbon emissions and potential increases to the cost of energy impacting our direct operations and our wider value chain as we transition to a low carbon model. Assets and capital expenditure Climate change considerations are integrated in our approach to capital expenditure as follows: – Capital allocation: We require that significant resource allocation includes climate-related considerations through the use of ICP, marginal abatement cost, and most recently, balanced scorecard appraisal tools; – Capital investments: We fund a dedicated capital investment budget used to progress the delivery of our ESG commitments. In 2022, this amounted to £27.1 million, with investments directed towards equipment to drive energy efficiency and renewable energy generation, water recycling and efficiency projects, waste reduction, and product innovation-led specification improvements to drive recyclability and reduce waste; and – Physical risks also influence our financial planning strategy to enable us to mitigate supply constraints from impacting our consumers and business continuity. By having clear visibility of climate-related risks and opportunities and mitigating these where possible, the Group expects to be able to continue to access capital and to be in a position to undertake acquisitions or divestments, as needed. Read more about our approach to Financial Planning in Decarbonisation in 2022 Low-Carbon Transition Plan on bat.com/LCTP Climate scenario modelling Identification Identification of risks and opportunities posed by climate change is an ongoing process and draws upon internal and external expertise, resources and other information, including: – internal senior management spanning all functions of the Group, based at DRBU, Regional, and Group levels; – external consultants supporting our preparations for and resilience to climate change; – relevant industry publications outlining expected impacts of climate change on our key inputs (including agriculture); – relevant regulation (enacted or draft) that may impact the Group’s products, locations or operations; – TCFD guidance on potential risks and opportunities; and – existing risks and opportunities identified and managed as part of our Group risk management processes. The selection of the risks and opportunities in our TCFD report was the result of a thorough identification and materiality assessment process, which was undertaken with the assistance of an external party. Initially, 30 risks and opportunities were identified, which were subsequently reduced down to the 10 key risks and opportunities detailed on pages 75-77 based on climate scenario analysis, further materiality assessment, the input from BAT’s subject matter specialists and using the methodology defined in the Group Risk Management Framework. The classification of low/medium/high impact and likelihood is described on page 78 in the Risk Management section. This assessment will be reviewed annually to help ensure it remains appropriate in the context of a dynamic business and physical environment, and to take account of improved data or modelling which may become available. Understanding climate scenario analysis We have considered the impact of risks and opportunities arising from climate change to help inform our strategies and financial planning to enhance the overall resilience of our business. In this assessment we considered two climate scenarios across three time horizons. The most recent Intergovernmental Panel on Climate Change (IPCC) assessment indicates that limiting global warming to 1.5°C is necessary to prevent the most severe consequences of climate change and as such we have aligned our analysis to this IPCC methodology, and GHG concentration trajectories known as Representative Concentration Pathways (RCP) 2.6 and 8.5, specifically considering climate scenarios of 1.5°C and 3-4°C. In containing global warming to 1.5°C, a wide-ranging transition of our global economy would be required, encompassing policy and regulation, economic and societal shifts, and the development and deployment of new infrastructure and technologies. In this scenario, transition risks are most significant but the severity of physical risks that may otherwise arise is reduced. Conversely, in a scenario of continued warming of 3-4°C, transition risks are considered to be much lower, and physical risks much higher. Our analysis was performed against three time horizons reflecting how risks and opportunities are internally considered and prioritised and are aligned to a number of our key ESG-related targets, including: – Short-term (2023–2027): This time period is linked to our most recent business plans, including glide-paths across our operations to mitigate risks posed, maximise opportunities that may arise and the delivery of our business objectives and external commitments; – Medium-term (2028–2037): This time period is focused on monitoring of risks and opportunities, considering how these may impact our Transformation strategy and investment requirements to deliver future business objectives and external committments; and – Longer-term (2038–2050): This time frame aligns to our Low Carbon Transition Plan across our value chain, which incorporates an awareness of the highly uncertain potential risks and opportunities. Qualitative assessments were performed to understand how the potential impact and likelihood of risks and opportunities may change under each time horizon and climate scenario, with more detailed modelling undertaken to quantitatively assess those risks and opportunities that were considered to be most material to our business. Material risks are those that could have a significant effect on our operations, strategy, and financial planning if they are not managed appropriately. In contrast, material opportunities may improve our financial performance over time in the event they can be realised. The modelling performed drew on internal and external data sources, such as carbon and energy pricing projections, potential future surcharges on single-use plastics in our products, Group financial data, energy consumption and costs by BAT site, business growth projections and consumer trends. This allowed us to refine our initial qualitative assessment and quantify the expected financial impact based on assumptions of future developments. BAT Annual Report and Form 20-F 2022 Strategic Report Governance Report Financial Statements Other Information Strategic Management TCFD Reporting Continued 74
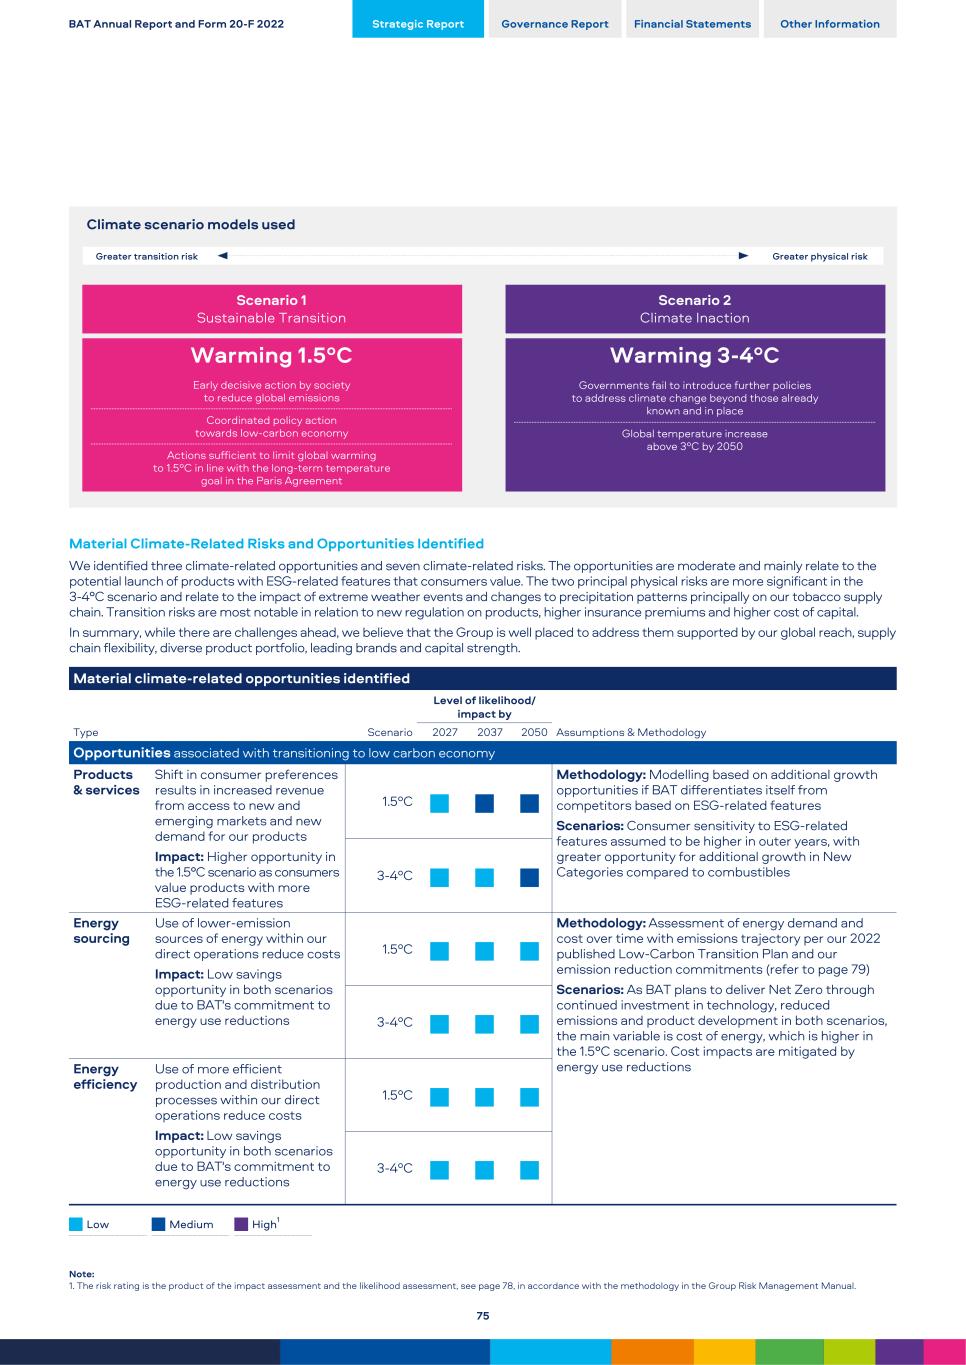
Climate scenario models used Greater transition risk Scenario 1 Sustainable Transition Warming 1.5ºC Early decisive action by society to reduce global emissions Coordinated policy action towards low-carbon economy Actions sufficient to limit global warming to 1.5ºC in line with the long-term temperature goal in the Paris Agreement Greater physical risk Scenario 2 Climate Inaction Warming 3-4ºC Governments fail to introduce further policies to address climate change beyond those already known and in place Global temperature increase above 3ºC by 2050 Material Climate-Related Risks and Opportunities Identified We identified three climate-related opportunities and seven climate-related risks. The opportunities are moderate and mainly relate to the potential launch of products with ESG-related features that consumers value. The two principal physical risks are more significant in the 3-4°C scenario and relate to the impact of extreme weather events and changes to precipitation patterns principally on our tobacco supply chain. Transition risks are most notable in relation to new regulation on products, higher insurance premiums and higher cost of capital. In summary, while there are challenges ahead, we believe that the Group is well placed to address them supported by our global reach, supply chain flexibility, diverse product portfolio, leading brands and capital strength. Material climate-related opportunities identified Type Scenario Level of likelihood/ impact by 2027 2037 2050 Assumptions & Methodology Opportunities associated with transitioning to low carbon economy Products & services Shift in consumer preferences results in increased revenue from access to new and emerging markets and new demand for our products Impact: Higher opportunity in the 1.5°C scenario as consumers value products with more ESG-related features 1.5ºC ■ ■ ■ Methodology: Modelling based on additional growth opportunities if BAT differentiates itself from competitors based on ESG-related features Scenarios: Consumer sensitivity to ESG-related features assumed to be higher in outer years, with greater opportunity for additional growth in New Categories compared to combustibles 3-4ºC ■ ■ ■ Energy sourcing Use of lower-emission sources of energy within our direct operations reduce costs Impact: Low savings opportunity in both scenarios due to BAT's commitment to energy use reductions 1.5ºC ■ ■ ■ Methodology: Assessment of energy demand and cost over time with emissions trajectory per our 2022 published Low-Carbon Transition Plan and our emission reduction commitments (refer to page 79) Scenarios: As BAT plans to deliver Net Zero through continued investment in technology, reduced emissions and product development in both scenarios, the main variable is cost of energy, which is higher in the 1.5°C scenario. Cost impacts are mitigated by energy use reductions 3-4ºC ■ ■ ■ Energy efficiency Use of more efficient production and distribution processes within our direct operations reduce costs Impact: Low savings opportunity in both scenarios due to BAT's commitment to energy use reductions 1.5ºC ■ ■ ■ 3-4ºC ■ ■ ■ Low Medium High1 Note: 1. The risk rating is the product of the impact assessment and the likelihood assessment, see page 78, in accordance with the methodology in the Group Risk Management Manual. BAT Annual Report and Form 20-F 2022 Strategic Report Governance Report Financial Statements Other Information 75
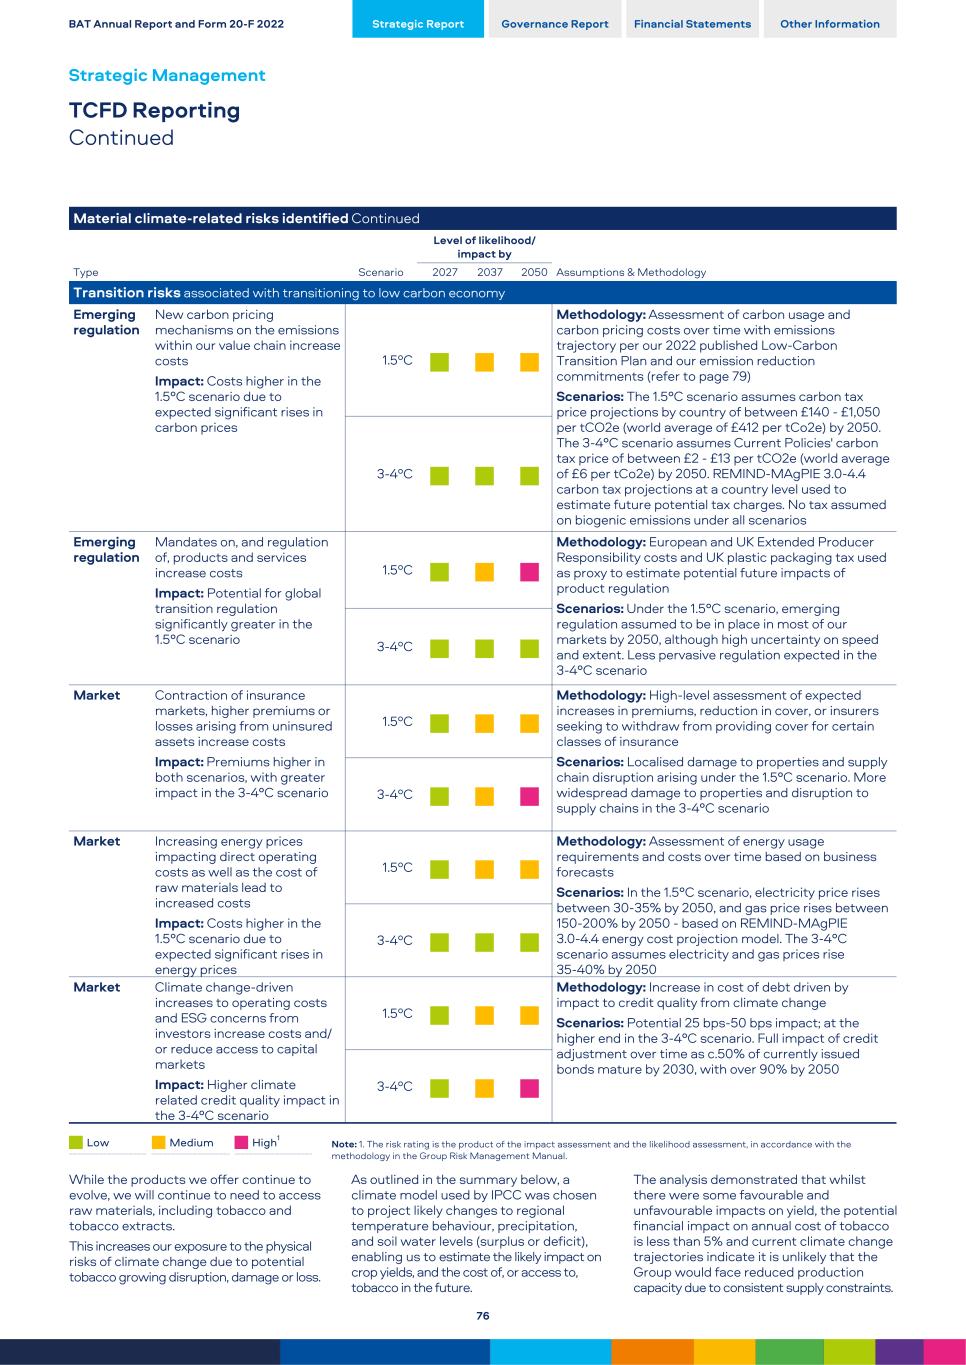
Material climate-related risks identified Continued Type Scenario Level of likelihood/ impact by 2027 2037 2050 Assumptions & Methodology Transition risks associated with transitioning to low carbon economy Emerging regulation New carbon pricing mechanisms on the emissions within our value chain increase costs Impact: Costs higher in the 1.5°C scenario due to expected significant rises in carbon prices 1.5ºC ■ ■ ■ Methodology: Assessment of carbon usage and carbon pricing costs over time with emissions trajectory per our 2022 published Low-Carbon Transition Plan and our emission reduction commitments (refer to page 79) Scenarios: The 1.5°C scenario assumes carbon tax price projections by country of between £140 - £1,050 per tCO2e (world average of £412 per tCo2e) by 2050. The 3-4°C scenario assumes Current Policies' carbon tax price of between £2 - £13 per tCO2e (world average of £6 per tCo2e) by 2050. REMIND-MAgPIE 3.0-4.4 carbon tax projections at a country level used to estimate future potential tax charges. No tax assumed on biogenic emissions under all scenarios 3-4ºC ■ ■ ■ Emerging regulation Mandates on, and regulation of, products and services increase costs Impact: Potential for global transition regulation significantly greater in the 1.5°C scenario 1.5ºC ■ ■ ■ Methodology: European and UK Extended Producer Responsibility costs and UK plastic packaging tax used as proxy to estimate potential future impacts of product regulation Scenarios: Under the 1.5°C scenario, emerging regulation assumed to be in place in most of our markets by 2050, although high uncertainty on speed and extent. Less pervasive regulation expected in the 3-4°C scenario 3-4ºC ■ ■ ■ Market Contraction of insurance markets, higher premiums or losses arising from uninsured assets increase costs Impact: Premiums higher in both scenarios, with greater impact in the 3-4°C scenario 1.5ºC ■ ■ ■ Methodology: High-level assessment of expected increases in premiums, reduction in cover, or insurers seeking to withdraw from providing cover for certain classes of insurance Scenarios: Localised damage to properties and supply chain disruption arising under the 1.5°C scenario. More widespread damage to properties and disruption to supply chains in the 3-4°C scenario 3-4ºC ■ ■ ■ Market Increasing energy prices impacting direct operating costs as well as the cost of raw materials lead to increased costs Impact: Costs higher in the 1.5°C scenario due to expected significant rises in energy prices 1.5ºC ■ ■ ■ Methodology: Assessment of energy usage requirements and costs over time based on business forecasts Scenarios: In the 1.5°C scenario, electricity price rises between 30-35% by 2050, and gas price rises between 150-200% by 2050 - based on REMIND-MAgPIE 3.0-4.4 energy cost projection model. The 3-4°C scenario assumes electricity and gas prices rise 35-40% by 2050 3-4ºC ■ ■ ■ Market Climate change-driven increases to operating costs and ESG concerns from investors increase costs and/ or reduce access to capital markets Impact: Higher climate related credit quality impact in the 3-4°C scenario 1.5ºC ■ ■ ■ Methodology: Increase in cost of debt driven by impact to credit quality from climate change Scenarios: Potential 25 bps-50 bps impact; at the higher end in the 3-4°C scenario. Full impact of credit adjustment over time as c.50% of currently issued bonds mature by 2030, with over 90% by 2050 3-4ºC ■ ■ ■ Low Medium High1 Note: 1. The risk rating is the product of the impact assessment and the likelihood assessment, in accordance with the methodology in the Group Risk Management Manual. While the products we offer continue to evolve, we will continue to need to access raw materials, including tobacco and tobacco extracts. This increases our exposure to the physical risks of climate change due to potential tobacco growing disruption, damage or loss. As outlined in the summary below, a climate model used by IPCC was chosen to project likely changes to regional temperature behaviour, precipitation, and soil water levels (surplus or deficit), enabling us to estimate the likely impact on crop yields, and the cost of, or access to, tobacco in the future. The analysis demonstrated that whilst there were some favourable and unfavourable impacts on yield, the potential financial impact on annual cost of tobacco is less than 5% and current climate change trajectories indicate it is unlikely that the Group would face reduced production capacity due to consistent supply constraints. BAT Annual Report and Form 20-F 2022 Strategic Report Governance Report Financial Statements Other Information Strategic Management TCFD Reporting Continued 76
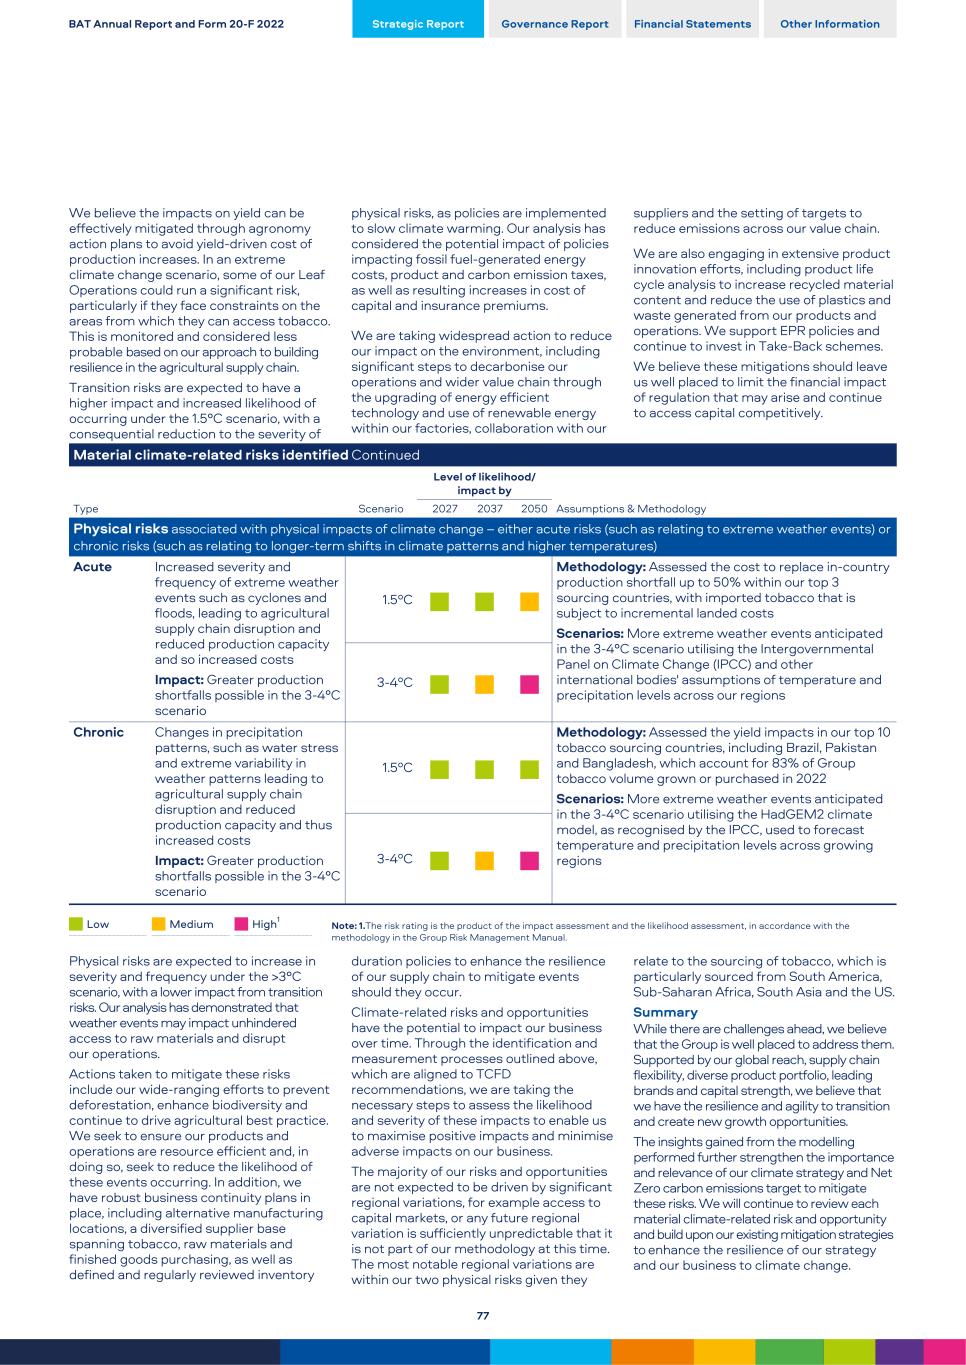
We believe the impacts on yield can be effectively mitigated through agronomy action plans to avoid yield-driven cost of production increases. In an extreme climate change scenario, some of our Leaf Operations could run a significant risk, particularly if they face constraints on the areas from which they can access tobacco. This is monitored and considered less probable based on our approach to building resilience in the agricultural supply chain. Transition risks are expected to have a higher impact and increased likelihood of occurring under the 1.5°C scenario, with a consequential reduction to the severity of physical risks, as policies are implemented to slow climate warming. Our analysis has considered the potential impact of policies impacting fossil fuel-generated energy costs, product and carbon emission taxes, as well as resulting increases in cost of capital and insurance premiums. We are taking widespread action to reduce our impact on the environment, including significant steps to decarbonise our operations and wider value chain through the upgrading of energy efficient technology and use of renewable energy within our factories, collaboration with our suppliers and the setting of targets to reduce emissions across our value chain. We are also engaging in extensive product innovation efforts, including product life cycle analysis to increase recycled material content and reduce the use of plastics and waste generated from our products and operations. We support EPR policies and continue to invest in Take-Back schemes. We believe these mitigations should leave us well placed to limit the financial impact of regulation that may arise and continue to access capital competitively. Material climate-related risks identified Continued Type Scenario Level of likelihood/ impact by 2027 2037 2050 Assumptions & Methodology Physical risks associated with physical impacts of climate change – either acute risks (such as relating to extreme weather events) or chronic risks (such as relating to longer-term shifts in climate patterns and higher temperatures) Acute Increased severity and frequency of extreme weather events such as cyclones and floods, leading to agricultural supply chain disruption and reduced production capacity and so increased costs Impact: Greater production shortfalls possible in the 3-4°C scenario 1.5ºC ■ ■ ■ Methodology: Assessed the cost to replace in-country production shortfall up to 50% within our top 3 sourcing countries, with imported tobacco that is subject to incremental landed costs Scenarios: More extreme weather events anticipated in the 3-4°C scenario utilising the Intergovernmental Panel on Climate Change (IPCC) and other international bodies' assumptions of temperature and precipitation levels across our regions 3-4ºC ■ ■ ■ Chronic Changes in precipitation patterns, such as water stress and extreme variability in weather patterns leading to agricultural supply chain disruption and reduced production capacity and thus increased costs Impact: Greater production shortfalls possible in the 3-4°C scenario 1.5ºC ■ ■ ■ Methodology: Assessed the yield impacts in our top 10 tobacco sourcing countries, including Brazil, Pakistan and Bangladesh, which account for 83% of Group tobacco volume grown or purchased in 2022 Scenarios: More extreme weather events anticipated in the 3-4°C scenario utilising the HadGEM2 climate model, as recognised by the IPCC, used to forecast temperature and precipitation levels across growing regions 3-4ºC ■ ■ ■ Low Medium High1 Note: 1.The risk rating is the product of the impact assessment and the likelihood assessment, in accordance with the methodology in the Group Risk Management Manual. Physical risks are expected to increase in severity and frequency under the >3°C scenario, with a lower impact from transition risks. Our analysis has demonstrated that weather events may impact unhindered access to raw materials and disrupt our operations. Actions taken to mitigate these risks include our wide-ranging efforts to prevent deforestation, enhance biodiversity and continue to drive agricultural best practice. We seek to ensure our products and operations are resource efficient and, in doing so, seek to reduce the likelihood of these events occurring. In addition, we have robust business continuity plans in place, including alternative manufacturing locations, a diversified supplier base spanning tobacco, raw materials and finished goods purchasing, as well as defined and regularly reviewed inventory duration policies to enhance the resilience of our supply chain to mitigate events should they occur. Climate-related risks and opportunities have the potential to impact our business over time. Through the identification and measurement processes outlined above, which are aligned to TCFD recommendations, we are taking the necessary steps to assess the likelihood and severity of these impacts to enable us to maximise positive impacts and minimise adverse impacts on our business. The majority of our risks and opportunities are not expected to be driven by significant regional variations, for example access to capital markets, or any future regional variation is sufficiently unpredictable that it is not part of our methodology at this time. The most notable regional variations are within our two physical risks given they relate to the sourcing of tobacco, which is particularly sourced from South America, Sub-Saharan Africa, South Asia and the US. Summary While there are challenges ahead, we believe that the Group is well placed to address them. Supported by our global reach, supply chain flexibility, diverse product portfolio, leading brands and capital strength, we believe that we have the resilience and agility to transition and create new growth opportunities. The insights gained from the modelling performed further strengthen the importance and relevance of our climate strategy and Net Zero carbon emissions target to mitigate these risks. We will continue to review each material climate-related risk and opportunity and build upon our existing mitigation strategies to enhance the resilience of our strategy and our business to climate change. BAT Annual Report and Form 20-F 2022 Strategic Report Governance Report Financial Statements Other Information 77
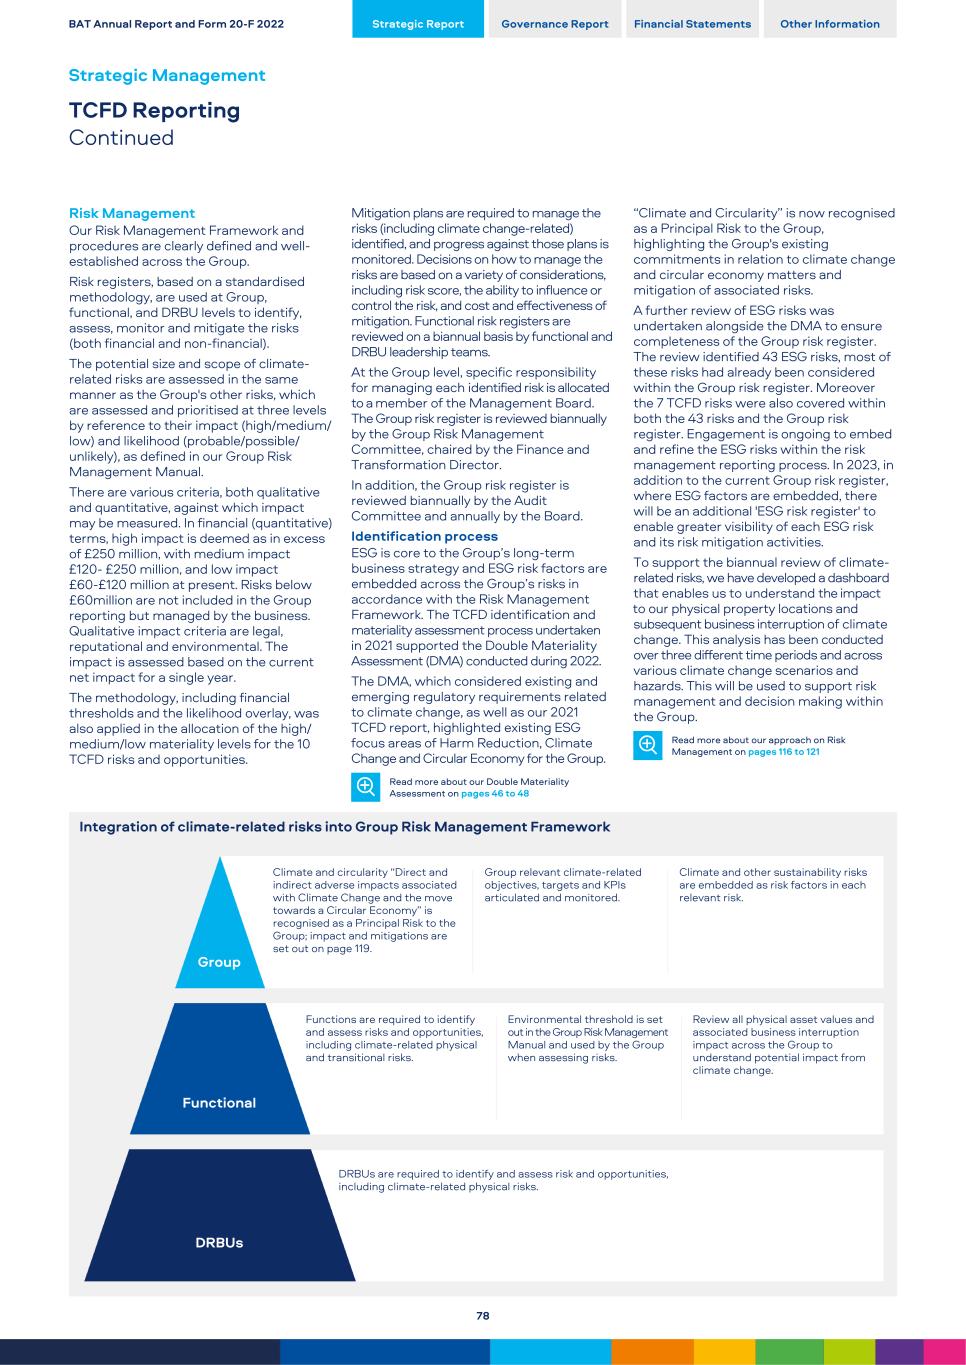
Risk Management Our Risk Management Framework and procedures are clearly defined and well- established across the Group. Risk registers, based on a standardised methodology, are used at Group, functional, and DRBU levels to identify, assess, monitor and mitigate the risks (both financial and non-financial). The potential size and scope of climate- related risks are assessed in the same manner as the Group's other risks, which are assessed and prioritised at three levels by reference to their impact (high/medium/ low) and likelihood (probable/possible/ unlikely), as defined in our Group Risk Management Manual. There are various criteria, both qualitative and quantitative, against which impact may be measured. In financial (quantitative) terms, high impact is deemed as in excess of £250 million, with medium impact £120- £250 million, and low impact £60-£120 million at present. Risks below £60million are not included in the Group reporting but managed by the business. Qualitative impact criteria are legal, reputational and environmental. The impact is assessed based on the current net impact for a single year. The methodology, including financial thresholds and the likelihood overlay, was also applied in the allocation of the high/ medium/low materiality levels for the 10 TCFD risks and opportunities. Integration of climate-related risks into Group Risk Management Framework Climate and circularity “Direct and indirect adverse impacts associated with Climate Change and the move towards a Circular Economy” is recognised as a Principal Risk to the Group; impact and mitigations are set out on page 119. Group relevant climate-related objectives, targets and KPIs articulated and monitored. Climate and other sustainability risks are embedded as risk factors in each relevant risk. Group Functions are required to identify and assess risks and opportunities, including climate-related physical and transitional risks. Environmental threshold is set out in the Group Risk Management Manual and used by the Group when assessing risks. Review all physical asset values and associated business interruption impact across the Group to understand potential impact from climate change. Functional DRBUs are required to identify and assess risk and opportunities, including climate-related physical risks. DRBUs Mitigation plans are required to manage the risks (including climate change-related) identified, and progress against those plans is monitored. Decisions on how to manage the risks are based on a variety of considerations, including risk score, the ability to influence or control the risk, and cost and effectiveness of mitigation. Functional risk registers are reviewed on a biannual basis by functional and DRBU leadership teams. At the Group level, specific responsibility for managing each identified risk is allocated to a member of the Management Board. The Group risk register is reviewed biannually by the Group Risk Management Committee, chaired by the Finance and Transformation Director. In addition, the Group risk register is reviewed biannually by the Audit Committee and annually by the Board. Identification process ESG is core to the Group’s long-term business strategy and ESG risk factors are embedded across the Group’s risks in accordance with the Risk Management Framework. The TCFD identification and materiality assessment process undertaken in 2021 supported the Double Materiality Assessment (DMA) conducted during 2022. The DMA, which considered existing and emerging regulatory requirements related to climate change, as well as our 2021 TCFD report, highlighted existing ESG focus areas of Harm Reduction, Climate Change and Circular Economy for the Group. Read more about our Double Materiality Assessment on pages 46 to 48 “Climate and Circularity” is now recognised as a Principal Risk to the Group, highlighting the Group's existing commitments in relation to climate change and circular economy matters and mitigation of associated risks. A further review of ESG risks was undertaken alongside the DMA to ensure completeness of the Group risk register. The review identified 43 ESG risks, most of these risks had already been considered within the Group risk register. Moreover the 7 TCFD risks were also covered within both the 43 risks and the Group risk register. Engagement is ongoing to embed and refine the ESG risks within the risk management reporting process. In 2023, in addition to the current Group risk register, where ESG factors are embedded, there will be an additional 'ESG risk register' to enable greater visibility of each ESG risk and its risk mitigation activities. To support the biannual review of climate- related risks, we have developed a dashboard that enables us to understand the impact to our physical property locations and subsequent business interruption of climate change. This analysis has been conducted over three different time periods and across various climate change scenarios and hazards. This will be used to support risk management and decision making within the Group. Read more about our approach on Risk Management on pages 116 to 121 BAT Annual Report and Form 20-F 2022 Strategic Report Governance Report Financial Statements Other Information Strategic Management TCFD Reporting Continued 78
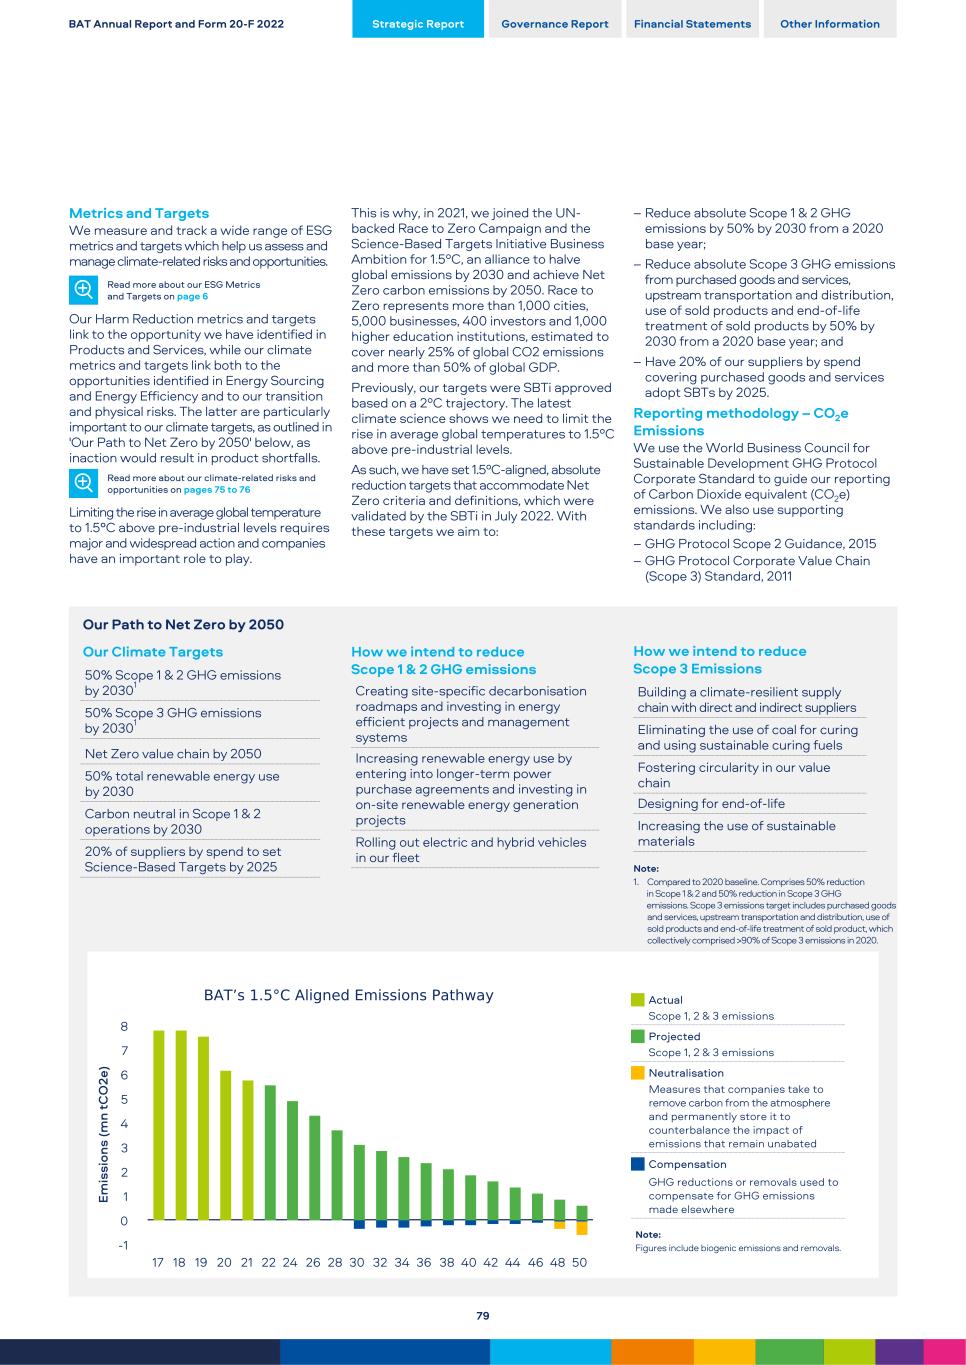
Metrics and Targets We measure and track a wide range of ESG metrics and targets which help us assess and manage climate-related risks and opportunities. Read more about our ESG Metrics and Targets on page 6 Our Harm Reduction metrics and targets link to the opportunity we have identified in Products and Services, while our climate metrics and targets link both to the opportunities identified in Energy Sourcing and Energy Efficiency and to our transition and physical risks. The latter are particularly important to our climate targets, as outlined in 'Our Path to Net Zero by 2050' below, as inaction would result in product shortfalls. Read more about our climate-related risks and opportunities on pages 75 to 76 Limiting the rise in average global temperature to 1.5°C above pre-industrial levels requires major and widespread action and companies have an important role to play. Our Path to Net Zero by 2050 Our Climate Targets 50% Scope 1 & 2 GHG emissions by 20301 50% Scope 3 GHG emissions by 20301 Net Zero value chain by 2050 50% total renewable energy use by 2030 Carbon neutral in Scope 1 & 2 operations by 2030 20% of suppliers by spend to set Science-Based Targets by 2025 Em is si on s (m n tC O 2e ) 17 18 19 20 21 22 24 26 28 30 32 34 36 38 40 42 44 46 48 50 -1 0 1 2 3 4 5 6 7 8 This is why, in 2021, we joined the UN- backed Race to Zero Campaign and the Science-Based Targets Initiative Business Ambition for 1.5ºC, an alliance to halve global emissions by 2030 and achieve Net Zero carbon emissions by 2050. Race to Zero represents more than 1,000 cities, 5,000 businesses, 400 investors and 1,000 higher education institutions, estimated to cover nearly 25% of global CO2 emissions and more than 50% of global GDP. Previously, our targets were SBTi approved based on a 2ºC trajectory. The latest climate science shows we need to limit the rise in average global temperatures to 1.5ºC above pre-industrial levels. As such, we have set 1.5ºC-aligned, absolute reduction targets that accommodate Net Zero criteria and definitions, which were validated by the SBTi in July 2022. With these targets we aim to: How we intend to reduce Scope 1 & 2 GHG emissions Creating site-specific decarbonisation roadmaps and investing in energy efficient projects and management systems Increasing renewable energy use by entering into longer-term power purchase agreements and investing in on-site renewable energy generation projects Rolling out electric and hybrid vehicles in our fleet – Reduce absolute Scope 1 & 2 GHG emissions by 50% by 2030 from a 2020 base year; – Reduce absolute Scope 3 GHG emissions from purchased goods and services, upstream transportation and distribution, use of sold products and end-of-life treatment of sold products by 50% by 2030 from a 2020 base year; and – Have 20% of our suppliers by spend covering purchased goods and services adopt SBTs by 2025. Reporting methodology – CO2e Emissions We use the World Business Council for Sustainable Development GHG Protocol Corporate Standard to guide our reporting of Carbon Dioxide equivalent (CO2e) emissions. We also use supporting standards including: – GHG Protocol Scope 2 Guidance, 2015 – GHG Protocol Corporate Value Chain (Scope 3) Standard, 2011 How we intend to reduce Scope 3 Emissions Building a climate-resilient supply chain with direct and indirect suppliers Eliminating the use of coal for curing and using sustainable curing fuels Fostering circularity in our value chain Designing for end-of-life Increasing the use of sustainable materials Note: 1. Compared to 2020 baseline. Comprises 50% reduction in Scope 1 & 2 and 50% reduction in Scope 3 GHG emissions. Scope 3 emissions target includes purchased goods and services, upstream transportation and distribution, use of sold products and end-of-life treatment of sold product, which collectively comprised >90% of Scope 3 emissions in 2020. Actual Scope 1, 2 & 3 emissions Projected Scope 1, 2 & 3 emissions Neutralisation Measures that companies take to remove carbon from the atmosphere and permanently store it to counterbalance the impact of emissions that remain unabated Compensation GHG reductions or removals used to compensate for GHG emissions made elsewhere Note: Figures include biogenic emissions and removals. BAT Annual Report and Form 20-F 2022 Strategic Report Governance Report Financial Statements Other Information 79
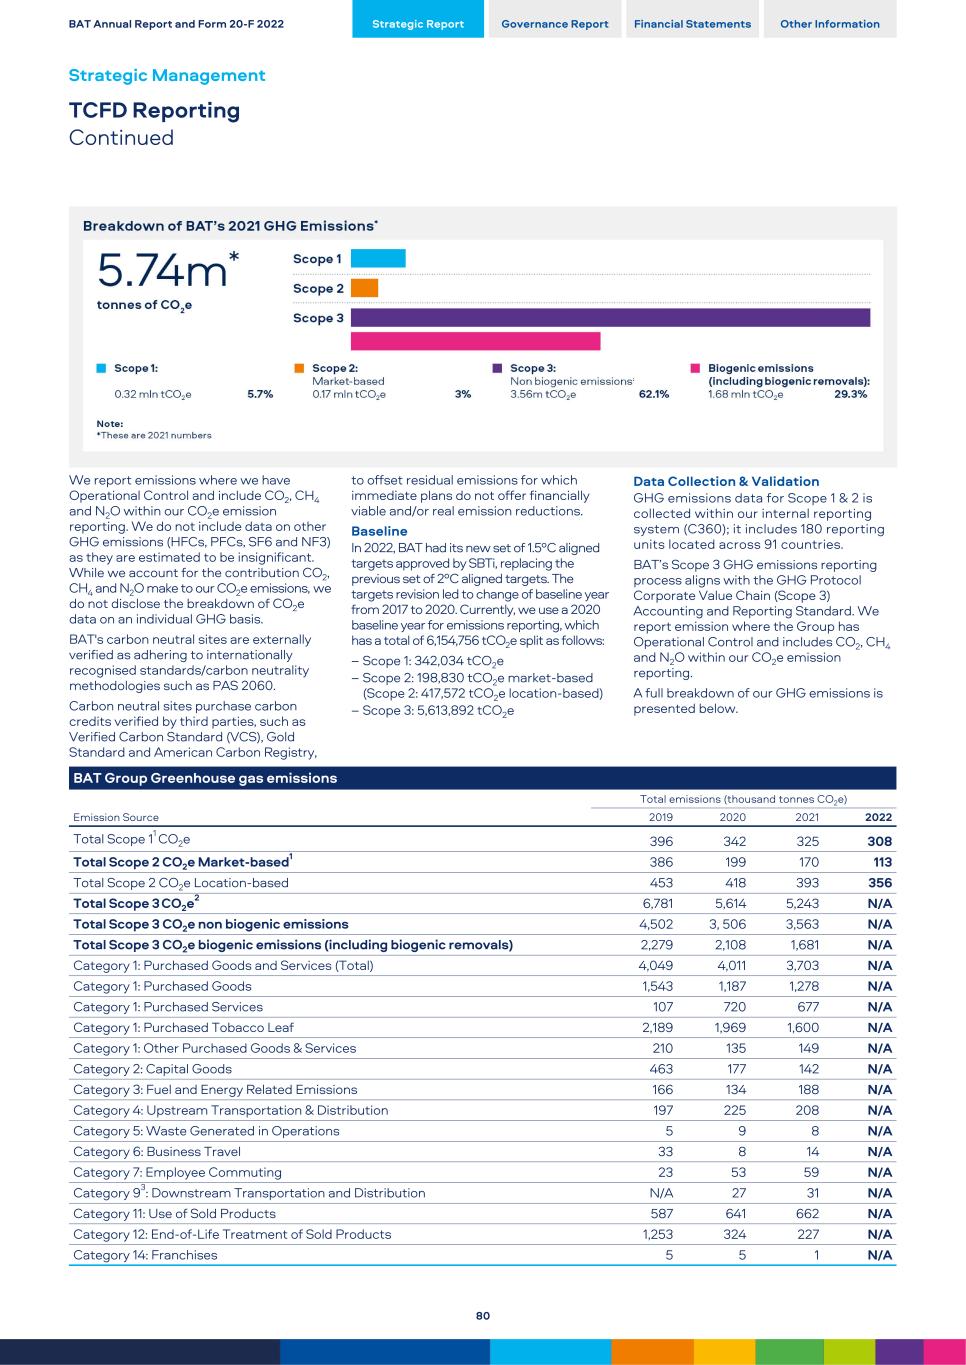
We report emissions where we have Operational Control and include CO2, CH4 and N2O within our CO2e emission reporting. We do not include data on other GHG emissions (HFCs, PFCs, SF6 and NF3) as they are estimated to be insignificant. While we account for the contribution CO2, CH4 and N2O make to our CO2e emissions, we do not disclose the breakdown of CO2e data on an individual GHG basis. BAT's carbon neutral sites are externally verified as adhering to internationally recognised standards/carbon neutrality methodologies such as PAS 2060. Carbon neutral sites purchase carbon credits verified by third parties, such as Verified Carbon Standard (VCS), Gold Standard and American Carbon Registry, to offset residual emissions for which immediate plans do not offer financially viable and/or real emission reductions. Baseline In 2022, BAT had its new set of 1.5ºC aligned targets approved by SBTi, replacing the previous set of 2ºC aligned targets. The targets revision led to change of baseline year from 2017 to 2020. Currently, we use a 2020 baseline year for emissions reporting, which has a total of 6,154,756 tCO2e split as follows: – Scope 1: 342,034 tCO2e – Scope 2: 198,830 tCO2e market-based (Scope 2: 417,572 tCO2e location-based) – Scope 3: 5,613,892 tCO2e Data Collection & Validation GHG emissions data for Scope 1 & 2 is collected within our internal reporting system (C360); it includes 180 reporting units located across 91 countries. BAT’s Scope 3 GHG emissions reporting process aligns with the GHG Protocol Corporate Value Chain (Scope 3) Accounting and Reporting Standard. We report emission where the Group has Operational Control and includes CO2, CH4 and N2O within our CO2e emission reporting. A full breakdown of our GHG emissions is presented below. BAT Group Greenhouse gas emissions Total emissions (thousand tonnes CO2e) Emission Source 2019 2020 2021 2022 Total Scope 11 CO2e 396 342 325 308 Total Scope 2 CO2e Market-based1 386 199 170 113 Total Scope 2 CO2e Location-based 453 418 393 356 Total Scope 3 CO2e2 6,781 5,614 5,243 N/A Total Scope 3 CO2e non biogenic emissions 4,502 3, 506 3,563 N/A Total Scope 3 CO2e biogenic emissions (including biogenic removals) 2,279 2,108 1,681 N/A Category 1: Purchased Goods and Services (Total) 4,049 4,011 3,703 N/A Category 1: Purchased Goods 1,543 1,187 1,278 N/A Category 1: Purchased Services 107 720 677 N/A Category 1: Purchased Tobacco Leaf 2,189 1,969 1,600 N/A Category 1: Other Purchased Goods & Services 210 135 149 N/A Category 2: Capital Goods 463 177 142 N/A Category 3: Fuel and Energy Related Emissions 166 134 188 N/A Category 4: Upstream Transportation & Distribution 197 225 208 N/A Category 5: Waste Generated in Operations 5 9 8 N/A Category 6: Business Travel 33 8 14 N/A Category 7: Employee Commuting 23 53 59 N/A Category 93: Downstream Transportation and Distribution N/A 27 31 N/A Category 11: Use of Sold Products 587 641 662 N/A Category 12: End-of-Life Treatment of Sold Products 1,253 324 227 N/A Category 14: Franchises 5 5 1 N/A BAT Annual Report and Form 20-F 2022 Strategic Report Governance Report Financial Statements Other Information Strategic Management TCFD Reporting Continued 80
2022 Performance Our combined Scope 1 & 2 (market-based) emissions are decreasing year on year. In 2022 these reduced by 15% vs 2021 (-22% vs 2020 baseline). Scope 1 emissions decreased by 5% vs 2021 (-10% vs 2020 baseline).This is driven by energy efficiency activities and projects across our operational sites, lower production output and changes in footprint in certain geographies. Scope 2 emissions decreased by 34% vs 2021 (-43% vs 2020 baseline). This is driven by an increase in renewable energy sourcing for our sites, including an expansion to new geographies where renewable energy sourcing opportunities emerged and maximised the proportion of renewable electricity we source. This was further supported by energy efficiency activities and increase of on-site renewable energy generation, mostly from solar technologies. Our targets cover Scope 2 emissions aligned with the market-based approach, but we are also monitoring and disclosing Scope 2 emissions as per the location-based approach. Scope 2 emissions (location based) decreased by 9% vs 2021 (-15% vs 2020 baseline). Our total Scope 32 emissions decreased by 7% vs 2020. This reduction includes strengthening our approach to on-the- ground farmer-related data collection and associated wood density factors, in order to be able to more accurately calculate their associated emissions. Reporting methodology - Energy Energy consumption is reported in line with GRI 302, Energy, 2016, Disclosure 302-1, Energy consumption within the organisation. Energy Consumption is calculated from raw data of fuel, electricity, hot water and steam consumption, which is submitted by reporting units across the Group via our Internal Reporting Tool. The data used in calculations is the same as used for Scope 1 and 2 CO2e emissions. 2022 Performance While details of the principal measures taken for the purpose of increasing energy efficiency across the Group are available at pages 53-54, our energy consumption performance is outlined as follows: – Energy consumption4 from activities for which the Group is responsible (in million kWh): 2022: 1,435; 2021: 1,508; 2020: 1,572. Of the total figure reported for the Group for 2022, 11 million kWh is from UK-based activities (2021: 10 million kWh, 2020: 10 million kWh). – Energy consumption resulting from the purchase of energy by the Group for its own use (in million kWh): 2022: 909; 2021: 972; 2020: 996. – Of the total figure reported for the Group for 2022, 15 million kWh is from UK-based activities (2021: 16 million, 2020: 17million). Other Metrics and Targets Internal Carbon Pricing As part of our decarbonisation strategy, in 2021, we incorporated Internal Carbon Pricing (ICP) into our financial appraisal to facilitate delivery against our targets. ICP is helping enhance decision-making and prioritise capital expenditure allocation. Prices are reviewed annually because we aim to ensure they remain appropriate drawing on a number of benchmarks, including UNFCCC initiatives. For 2022, a price of £60 per tCO2e was used, with assumptions that prices will increase between 2022 and 2030 up to £120 per tCO2e as a consequence of anticipated increasing demand for carbon credits. The trialling of a scorecard in appraising capital investment across the Group's operations in 2022 allowed us to enhance our consideration of the cost of carbon to more widely consider the environmental and social impacts of projects against our external commitments and targets, further strengthening our decision-making and internal governance processes. Read more about our Internal Carbon Pricing in 2022 in our Low Carbon Transition Plan on bat.com/reporting Remuneration Where relevant, employees, from the Management Board (including the Director, Operations) to local management, have individual performance objectives that form part of their responsibilities and are linked to remuneration, including delivery against ESG and climate-related priorities and metrics. Delivery against individual performance objectives is a key consideration in determining employee performance ratings, which in turn have a direct impact on compensation as they are used to determine salary adjustments. In addition, the Group retains the discretion to make downward adjustments to individual bonus payments in the event of persistent underperformance against performance objectives. The ESG objectives within the remuneration of Jack Bowles, Chief Executive, and Tadeu Marroco, Finance and Transformation Director, are focused on Harm Reduction. We intend to keep further integration of ESG and climate-related metrics in Management Board remuneration under active review.	 Read more about our approach to Remuneration for directors and employees on pages 159 to 169 Next steps We know that the effects of climate change are undeniable and they will continue to impact the world, including the countries where we operate and the communities who live in them. Through the adoption of the TCFD recommendations and recommended disclosures, we continue to analyse the resilience of our strategy and business against two potential climate scenarios and three time horizons. We recognise that this is a process of continuous improvement, therefore we will keep mitigating risks, adapting to a changing landscape, seeking new opportunities and responding to new regulations. In light of this evolving landscape, we will keep strengthening our understanding and management of climate-related risks and opportunities by: – Reviewing our governance structure, reflecting the leadership of our newly appointed Chief Sustainability Officer; – Reviewing the assessment of our identified climate-related risks and opportunities on an annual basis; – Embedding the dashboard that enables us to understand the potential impact of climate change on our physical property locations across the Group and subsequent business interruptions; – Outlining our mitigation activities' approach in relation to climate-related risks and opportunities identified in addition to keeping those under review; – Further aligning our metrics and targets to our identified climate-related risks and opportunities; – Keeping further integration of ESG- and climate-related metrics in Management Board remuneration under active review; and – Continuing to work with other BAT colleagues and external partners and suppliers to reduce the environmental impact of our operations and value chain. Notes: 1. In 2022, UK-based activities included 2,376 tonnes of Scope 1 CO2e emissions (2021: 2,276) and 10 tonnes of our Scope 2 CO2e emissions (2021: 173). Scope 1 & 2 CO2e emissions intensity (tonnes per £m revenue) 15.2 (2021: 19.3), (2020: 20.0). 2. Total Scope 3 includes biogenic emissions and biogenic removals. Due to the complexity of consolidating and verifying Scope 3 data in accordance with the GHG Protocol, we report one year behind. As such 2022 Scope 3 data will be reported in the 2023 Annual Report and Accounts and Form 20-F. 3. As part of our 1.5ºC Science-Based Targets approval process we have added Scope 3 Category 9 (Downstream Transportation and Distribution) to our 2020 baseline. 4. Energy intensity (GWh per £ million of revenue): 2022: 0.085; 2021: 0.097. BAT Annual Report and Form 20-F 2022 Strategic Report Governance Report Financial Statements Other Information 81

For Employees BAT Annual Report and Form 20-F 2022 Strategic Report Governance Report Financial Statements Other Information 82
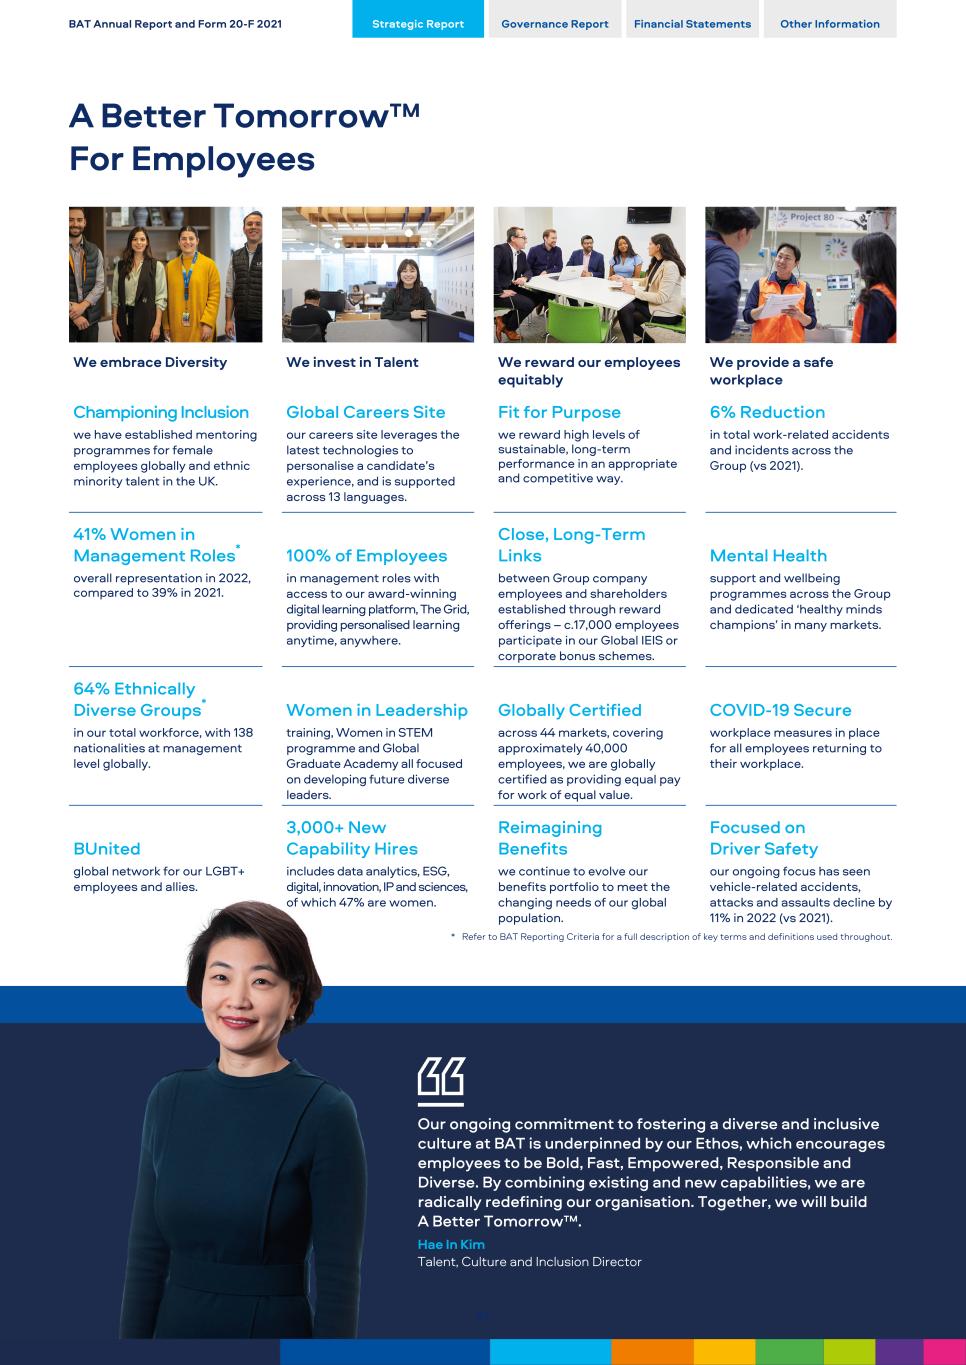
We embrace Diversity We invest in Talent We reward our employees equitably We provide a safe workplace Championing Inclusion Global Careers Site Fit for Purpose 6% Reduction we have established mentoring programmes for female employees globally and ethnic minority talent in the UK. our careers site leverages the latest technologies to personalise a candidate’s experience, and is supported across 13 languages. we reward high levels of sustainable, long-term performance in an appropriate and competitive way. in total work-related accidents and incidents across the Group (vs 2021). 41% Women in Management Roles* 100% of Employees Close, Long-Term Links Mental Health overall representation in 2022, compared to 39% in 2021. in management roles with access to our award-winning digital learning platform, The Grid, providing personalised learning anytime, anywhere. between Group company employees and shareholders established through reward offerings – c.17,000 employees participate in our Global IEIS or corporate bonus schemes. support and wellbeing programmes across the Group and dedicated ‘healthy minds champions’ in many markets. 64% Ethnically Diverse Groups* Women in Leadership Globally Certified COVID-19 Secure in our total workforce, with 138 nationalities at management level globally. training, Women in STEM programme and Global Graduate Academy all focused on developing future diverse leaders. across 44 markets, covering approximately 40,000 employees, we are globally certified as providing equal pay for work of equal value. workplace measures in place for all employees returning to their workplace. BUnited 3,000+ New Capability Hires Reimagining Benefits Focused on Driver Safety global network for our LGBT+ employees and allies. includes data analytics, ESG, digital, innovation, IP and sciences, of which 47% are women. we continue to evolve our benefits portfolio to meet the changing needs of our global population. our ongoing focus has seen vehicle-related accidents, attacks and assaults decline by 11% in 2022 (vs 2021). * Refer to BAT Reporting Criteria for a full description of key terms and definitions used throughout. Our ongoing commitment to fostering a diverse and inclusive culture at BAT is underpinned by our Ethos, which encourages employees to be Bold, Fast, Empowered, Responsible and Diverse. By combining existing and new capabilities, we are radically redefining our organisation. Together, we will build A Better Tomorrow™. Hae In Kim Talent, Culture and Inclusion Director BAT Annual Report and Form 20-F 2021 Strategic Report Governance Report Financial Statements Other Information A Better Tomorrow™ For Employees 83
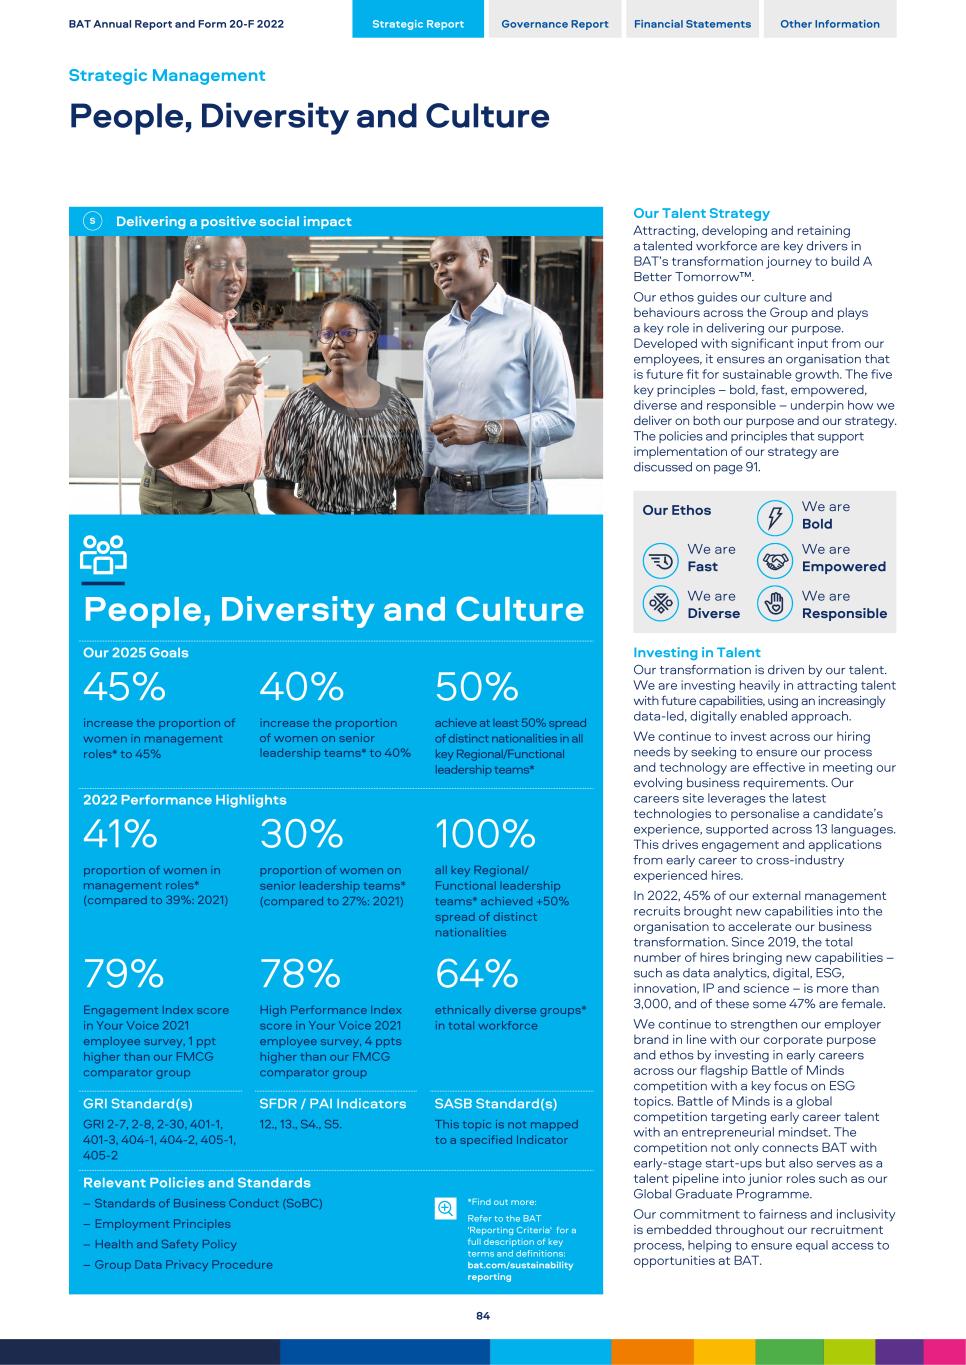
Delivering a positive social impact People, Diversity and Culture Our 2025 Goals 45% 40% 50% increase the proportion of women in management roles* to 45% increase the proportion of women on senior leadership teams* to 40% achieve at least 50% spread of distinct nationalities in all key Regional/Functional leadership teams* 2022 Performance Highlights 41% 30% 100% proportion of women in management roles* (compared to 39%: 2021) proportion of women on senior leadership teams* (compared to 27%: 2021) all key Regional/ Functional leadership teams* achieved +50% spread of distinct nationalities 79% 78% 64% Engagement Index score in Your Voice 2021 employee survey, 1 ppt higher than our FMCG comparator group High Performance Index score in Your Voice 2021 employee survey, 4 ppts higher than our FMCG comparator group ethnically diverse groups* in total workforce GRI Standard(s) SFDR / PAI Indicators SASB Standard(s) GRI 2-7, 2-8, 2-30, 401-1, 401-3, 404-1, 404-2, 405-1, 405-2 12., 13., S4., S5. This topic is not mapped to a specified Indicator Relevant Policies and Standards – Standards of Business Conduct (SoBC) – Employment Principles – Health and Safety Policy – Group Data Privacy Procedure *Find out more: Refer to the BAT 'Reporting Criteria' for a full description of key terms and definitions: bat.com/sustainability reporting Our Talent Strategy Attracting, developing and retaining a talented workforce are key drivers in BAT’s transformation journey to build A Better Tomorrow™. Our ethos guides our culture and behaviours across the Group and plays a key role in delivering our purpose. Developed with significant input from our employees, it ensures an organisation that is future fit for sustainable growth. The five key principles – bold, fast, empowered, diverse and responsible – underpin how we deliver on both our purpose and our strategy. The policies and principles that support implementation of our strategy are discussed on page 91. Our Ethos We are Bold We are Fast We are Empowered We are Diverse We are Responsible Investing in Talent Our transformation is driven by our talent. We are investing heavily in attracting talent with future capabilities, using an increasingly data-led, digitally enabled approach. We continue to invest across our hiring needs by seeking to ensure our process and technology are effective in meeting our evolving business requirements. Our careers site leverages the latest technologies to personalise a candidate’s experience, supported across 13 languages. This drives engagement and applications from early career to cross-industry experienced hires. In 2022, 45% of our external management recruits brought new capabilities into the organisation to accelerate our business transformation. Since 2019, the total number of hires bringing new capabilities – such as data analytics, digital, ESG, innovation, IP and science – is more than 3,000, and of these some 47% are female. We continue to strengthen our employer brand in line with our corporate purpose and ethos by investing in early careers across our flagship Battle of Minds competition with a key focus on ESG topics. Battle of Minds is a global competition targeting early career talent with an entrepreneurial mindset. The competition not only connects BAT with early-stage start-ups but also serves as a talent pipeline into junior roles such as our Global Graduate Programme. Our commitment to fairness and inclusivity is embedded throughout our recruitment process, helping to ensure equal access to opportunities at BAT. BAT Annual Report and Form 20-F 2022 Strategic Report Governance Report Financial Statements Other Information Strategic Management People, Diversity and Culture 84
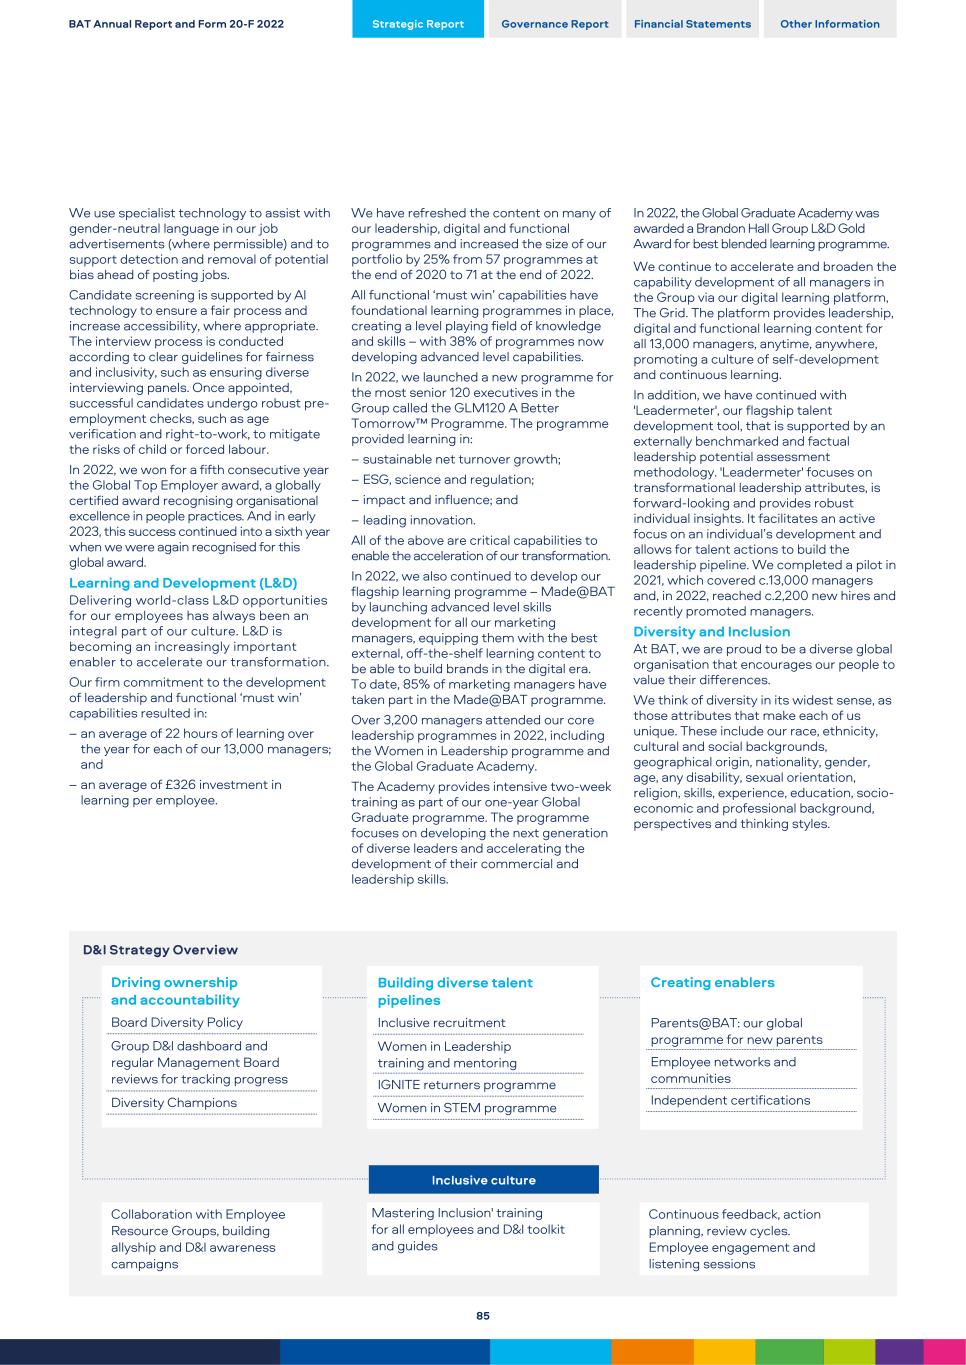
We use specialist technology to assist with gender-neutral language in our job advertisements (where permissible) and to support detection and removal of potential bias ahead of posting jobs. Candidate screening is supported by AI technology to ensure a fair process and increase accessibility, where appropriate. The interview process is conducted according to clear guidelines for fairness and inclusivity, such as ensuring diverse interviewing panels. Once appointed, successful candidates undergo robust pre- employment checks, such as age verification and right-to-work, to mitigate the risks of child or forced labour. In 2022, we won for a fifth consecutive year the Global Top Employer award, a globally certified award recognising organisational excellence in people practices. And in early 2023, this success continued into a sixth year when we were again recognised for this global award. Learning and Development (L&D) Delivering world-class L&D opportunities for our employees has always been an integral part of our culture. L&D is becoming an increasingly important enabler to accelerate our transformation. Our firm commitment to the development of leadership and functional ‘must win’ capabilities resulted in: – an average of 22 hours of learning over the year for each of our 13,000 managers; and – an average of £326 investment in learning per employee. Driving ownership and accountability Board Diversity Policy Group D&I dashboard and regular Management Board reviews for tracking progress Diversity Champions We have refreshed the content on many of our leadership, digital and functional programmes and increased the size of our portfolio by 25% from 57 programmes at the end of 2020 to 71 at the end of 2022. All functional ‘must win’ capabilities have foundational learning programmes in place, creating a level playing field of knowledge and skills – with 38% of programmes now developing advanced level capabilities. In 2022, we launched a new programme for the most senior 120 executives in the Group called the GLM120 A Better Tomorrow™ Programme. The programme provided learning in: – sustainable net turnover growth; – ESG, science and regulation; – impact and influence; and – leading innovation. All of the above are critical capabilities to enable the acceleration of our transformation. In 2022, we also continued to develop our flagship learning programme – Made@BAT by launching advanced level skills development for all our marketing managers, equipping them with the best external, off-the-shelf learning content to be able to build brands in the digital era. To date, 85% of marketing managers have taken part in the Made@BAT programme. Over 3,200 managers attended our core leadership programmes in 2022, including the Women in Leadership programme and the Global Graduate Academy. The Academy provides intensive two-week training as part of our one-year Global Graduate programme. The programme focuses on developing the next generation of diverse leaders and accelerating the development of their commercial and leadership skills. Building diverse talent pipelines Inclusive recruitment Women in Leadership training and mentoring IGNITE returners programme Women in STEM programme In 2022, the Global Graduate Academy was awarded a Brandon Hall Group L&D Gold Award for best blended learning programme. We continue to accelerate and broaden the capability development of all managers in the Group via our digital learning platform, The Grid. The platform provides leadership, digital and functional learning content for all 13,000 managers, anytime, anywhere, promoting a culture of self-development and continuous learning. In addition, we have continued with 'Leadermeter', our flagship talent development tool, that is supported by an externally benchmarked and factual leadership potential assessment methodology. 'Leadermeter' focuses on transformational leadership attributes, is forward-looking and provides robust individual insights. It facilitates an active focus on an individual’s development and allows for talent actions to build the leadership pipeline. We completed a pilot in 2021, which covered c.13,000 managers and, in 2022, reached c.2,200 new hires and recently promoted managers. Diversity and Inclusion At BAT, we are proud to be a diverse global organisation that encourages our people to value their differences. We think of diversity in its widest sense, as those attributes that make each of us unique. These include our race, ethnicity, cultural and social backgrounds, geographical origin, nationality, gender, age, any disability, sexual orientation, religion, skills, experience, education, socio- economic and professional background, perspectives and thinking styles. Creating enablers Parents@BAT: our global programme for new parents Employee networks and communities Independent certifications Collaboration with Employee Resource Groups, building allyship and D&I awareness campaigns Mastering Inclusion' training for all employees and D&I toolkit and guides Continuous feedback, action planning, review cycles. Employee engagement and listening sessions BAT Annual Report and Form 20-F 2022 Strategic Report Governance Report Financial Statements Other Information 85
In 2020, we set ourselves bold ambitions for 2025, to accelerate the pace of progress. We have made great progress in all three of our strategic pillars, driving ownership and accountability, building diverse talent pipelines, and creating enablers that support our commitment to creating a diverse and inclusive culture. Find more details of our efforts to accelerate gender diversity in our Diversity and Inclusion Report 2022 Driving Ownership and Accountability We seek to monitor, track and support the progression of diverse groups. In 2022, we expanded the scope of our confidential voluntary ethnicity identity collection and reporting beyond the UK to six additional markets (Australia, Brazil, Canada, Malaysia, South Africa and the US). Together with the UK, these countries represent approximately 30% of all our Group company employees worldwide, covering approximately 14,000 people. In these seven markets, 92% of our employees and 82% of our senior teams have confidentially disclosed their ethnic background. Collecting this data offers an opportunity to better understand the experience of different groups and their movement throughout the talent lifecycle at BAT and subsequently inform further targeted initiatives. Our D&I governance structure ensures clear accountability for our business leaders and leadership teams for achieving our 2025 D&I ambitions. This includes a D&I dashboard and regular reviews by our Management Board to ensure close monitoring of progress and plans. D&I remains fully embedded in our talent review processes and meetings. Each Region and Function has five-year glidepaths to showcase plans and estimated year-end forecasts. In 2021, we released our first Group D&I report which outlined a more complete picture of gender, ethnicity and pay, allowing us to measure our progress in building a diverse and inclusive culture. We voluntarily reported UK ethnicity pay and expanded gender pay reporting to eight new markets which represented c.40% of all our employees worldwide. Building on the progress made in 2021, we are further expanding our reporting in 2022, with more than 80% of our employees now included in our Gender Pay Equity Reporting, and for the first time, approximately 14,000 employees were included in an Ethnicity Pay Equity review. Our focus on pay equity is intended to ensure that all employees performing the same work or work of equal value are paid equitably and pay is not influenced by factors such as gender or ethnicity. Building Diverse Talent Pipelines We require all recruitment agencies we work with to provide gender-balanced longlists of candidates. In the UK, we partner with firms accredited under the UK Government’s Enhanced Code of Conduct for Executive Search Firms. This acknowledges firms with a strong track record in, and promotion of, gender diversity in the FTSE 350. Since 2019, our Women in STEM strategy has focused on attracting, developing, and retaining more women in our R&D, Operations, Finance and Digital Business Solutions functions. In the UK, we continue to be members of the multi-stakeholder group WISE and official signatories of its 10-step framework. This provides evidence- based action, knowledge, and tools for achieving gender balance in the STEM workforce, and against which we achieved Rank 1 in 2022. These activities help increase the level of STEM representation, as we work to our goal of 40% female representation on senior leadership teams. Delivering development opportunities for our employees and contributing to the strengthening of our talent pipelines has always been an integral part of our D&I strategy. 'Women in Leadership' (WIL) is our long-running programme within our leadership portfolio, which supports the accelerated development of women at middle to senior levels. It is a key initiative within our D&I agenda to grow the proportion of women in management roles across the business to 45% by 2025. In 2022, we expanded the scope and launched new WIL Foundation programmes for women at a junior management level and have grown the coverage to c.1,000 women managers. Following a successful launch of our global IGNITE returners programme in nine markets (Argentina, Australia, Colombia, Mexico, Pakistan, Poland, Trinidad & Tobago, Turkey and the UK), we have continued to recruit returners across the world. IGNITE focuses on supporting experienced professionals returning to the workplace after a career break. It includes flexible working, training and coaching for returners, and training for line managers on how to best support them. We launched a new training programme ‘Mastering Inclusion’ with the main purpose to raise awareness and build skill sets around key D&I concepts and opened it up to all our non-management employees too. It is compulsory for all new hires and new managers and, so far, more than 9,500 employees have completed the training. D&I toolkits are available for all our managers. Along with Allyship Guides on LGBT+, Race and Ethnicity and Disability Allyship, these continue to provide practical information to help debunk myths and misconceptions, understand unconscious bias, micro-aggressions and micro- inequalities, and provide tips on how to proactively create an inclusive environment and promote a sense of belonging for us all. These guides were built through a robust co-creation process and they complement existing D&I training embedded across the business, such as our 'Mastering Inclusion' e-learning available to all colleagues, and the D&I modules of our leadership programmes like Leading Self; Leading Teams; and Leading Through People. We expanded the scope of 'Mission Gender Equity' which is a cross-company mentoring programme focusing on female talent to build and strengthen our internal talent pipeline to markets outside the UK and the programme will cover 73 pairs of mentors- mentees. We are piloting 'Mission Include' in the UK, which is a similar cross-company mentoring programme focusing on talent from ethnic minority under-represented groups, covering 13 pairs of mentors- mentees. Both these programmes are provided by our external partner Moving Ahead. Creating Enablers 'We are Diverse' is at the core of BAT’s Ethos. As well as striving for gender balance, our D&I strategy focuses on diversity of nationalities and ethnicities. Our employees remain at the heart of our success without whom we are unable to achieve our strategy. Together we continue to build an inclusive culture where difference is valued, where employees from diverse backgrounds and experience feel they belong, are at their best and inspired. We have worked hard to set strong foundations and create enablers to realise genuine change. We are signatories to the UK Race at Work Charter for supporting racial equality in the workplace. We strive to get the full value and potential of diversity through inclusion. BAT Annual Report and Form 20-F 2022 Strategic Report Governance Report Financial Statements Other Information Strategic Management People, Diversity and Culture Continued 86
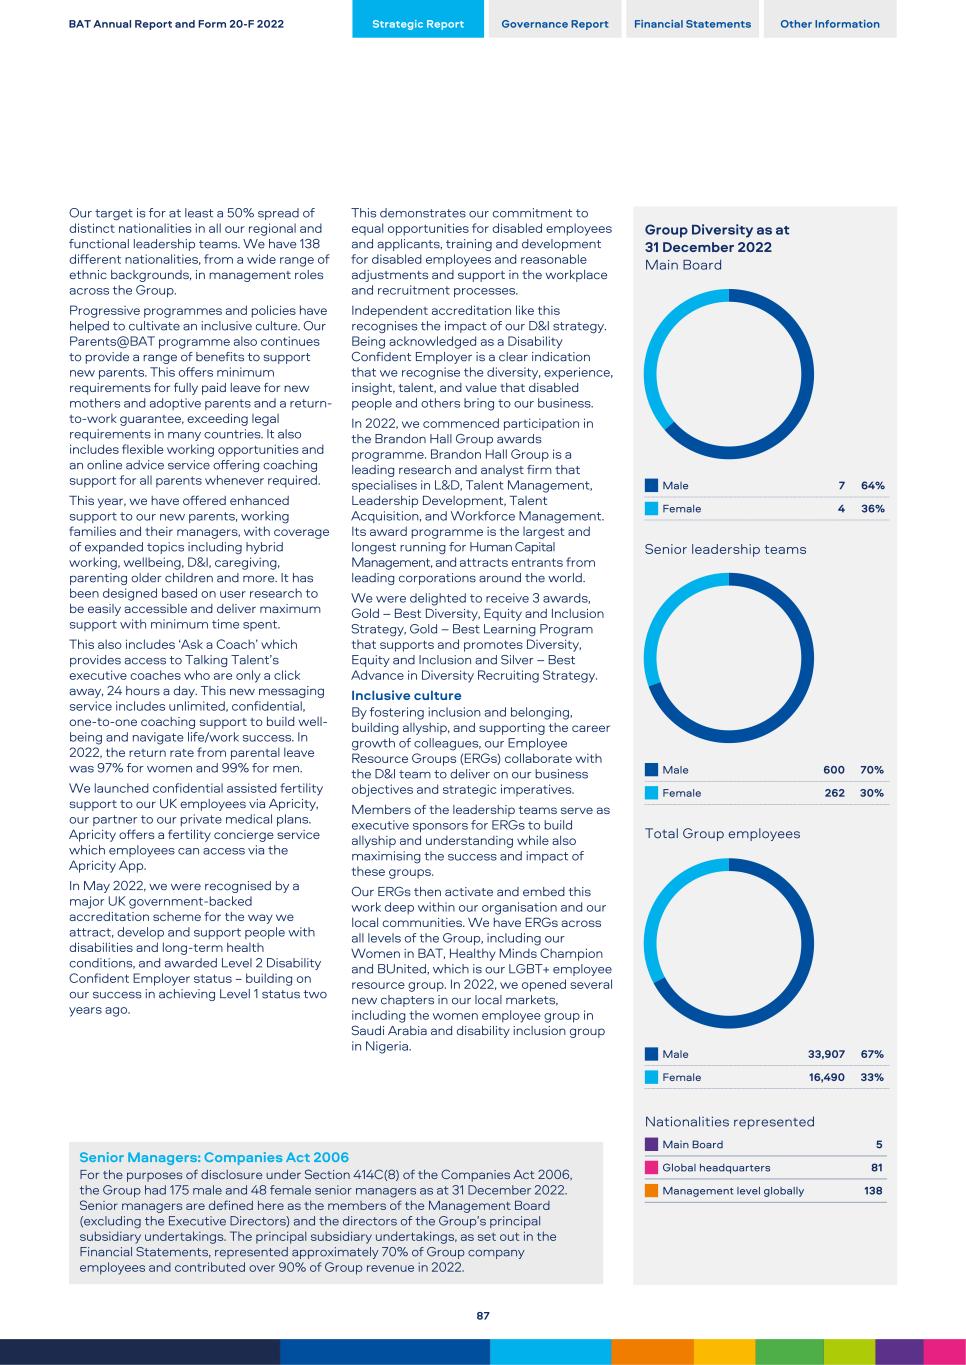
Our target is for at least a 50% spread of distinct nationalities in all our regional and functional leadership teams. We have 138 different nationalities, from a wide range of ethnic backgrounds, in management roles across the Group. Progressive programmes and policies have helped to cultivate an inclusive culture. Our Parents@BAT programme also continues to provide a range of benefits to support new parents. This offers minimum requirements for fully paid leave for new mothers and adoptive parents and a return- to-work guarantee, exceeding legal requirements in many countries. It also includes flexible working opportunities and an online advice service offering coaching support for all parents whenever required. This year, we have offered enhanced support to our new parents, working families and their managers, with coverage of expanded topics including hybrid working, wellbeing, D&I, caregiving, parenting older children and more. It has been designed based on user research to be easily accessible and deliver maximum support with minimum time spent. This also includes ‘Ask a Coach’ which provides access to Talking Talent’s executive coaches who are only a click away, 24 hours a day. This new messaging service includes unlimited, confidential, one-to-one coaching support to build well- being and navigate life/work success. In 2022, the return rate from parental leave was 97% for women and 99% for men. We launched confidential assisted fertility support to our UK employees via Apricity, our partner to our private medical plans. Apricity offers a fertility concierge service which employees can access via the Apricity App. In May 2022, we were recognised by a major UK government-backed accreditation scheme for the way we attract, develop and support people with disabilities and long-term health conditions, and awarded Level 2 Disability Confident Employer status − building on our success in achieving Level 1 status two years ago. Senior Managers: Companies Act 2006 For the purposes of disclosure under Section 414C(8) of the Companies Act 2006, the Group had 175 male and 48 female senior managers as at 31 December 2022. Senior managers are defined here as the members of the Management Board (excluding the Executive Directors) and the directors of the Group’s principal subsidiary undertakings. The principal subsidiary undertakings, as set out in the Financial Statements, represented approximately 70% of Group company employees and contributed over 90% of Group revenue in 2022. This demonstrates our commitment to equal opportunities for disabled employees and applicants, training and development for disabled employees and reasonable adjustments and support in the workplace and recruitment processes. Independent accreditation like this recognises the impact of our D&I strategy. Being acknowledged as a Disability Confident Employer is a clear indication that we recognise the diversity, experience, insight, talent, and value that disabled people and others bring to our business. In 2022, we commenced participation in the Brandon Hall Group awards programme. Brandon Hall Group is a leading research and analyst firm that specialises in L&D, Talent Management, Leadership Development, Talent Acquisition, and Workforce Management. Its award programme is the largest and longest running for Human Capital Management, and attracts entrants from leading corporations around the world. We were delighted to receive 3 awards, Gold – Best Diversity, Equity and Inclusion Strategy, Gold – Best Learning Program that supports and promotes Diversity, Equity and Inclusion and Silver – Best Advance in Diversity Recruiting Strategy. Inclusive culture By fostering inclusion and belonging, building allyship, and supporting the career growth of colleagues, our Employee Resource Groups (ERGs) collaborate with the D&I team to deliver on our business objectives and strategic imperatives. Members of the leadership teams serve as executive sponsors for ERGs to build allyship and understanding while also maximising the success and impact of these groups. Our ERGs then activate and embed this work deep within our organisation and our local communities. We have ERGs across all levels of the Group, including our Women in BAT, Healthy Minds Champion and BUnited, which is our LGBT+ employee resource group. In 2022, we opened several new chapters in our local markets, including the women employee group in Saudi Arabia and disability inclusion group in Nigeria. Group Diversity as at 31 December 2022 Main Board Male 7 64% Female 4 36% Senior leadership teams Male 600 70% Female 262 30% Total Group employees Male 33,907 67% Female 16,490 33% Nationalities represented Main Board 5 Global headquarters 81 Management level globally 138 BAT Annual Report and Form 20-F 2022 Strategic Report Governance Report Financial Statements Other Information 87
Global Top Employer In 2022, we won the Global Top Employer award, for the fifth consecutive year, a globally certified award recognising organisational excellence in people practices. Disability Confident Employer BAT was recognised by a major UK government-backed accreditation scheme for the way we attract, develop and support people with disabilities and long-term health conditions. Race at Work Charter We are signatories to the UK Race at Work Charter for supporting racial equality in the workplace. Corporate Equality Index In 2022, our U.S. and Mexico businesses scored 100% on the Human Rights Campaign Foundation’s Corporate Equality Index for LGBT+ workplace equality. Women in STEM awards (WISE) In 2022, we achieved a Rank 1 certification in the UK for our Science, Technology & Engineering strategy. Brandon Hall Awards In 2022, we achieved Gold Awards from the Brandon Hall Group. Workforce Engagement Ensuring we have open engagement, where we can listen to and learn from our employees, is crucial to an inclusive culture. We have a range of engagement channels covering our global workforce, including: – Market and site visits by our Directors and Management Board members to meet local employees; – Town halls and Q&A sessions; – Meetings with works councils, trade unions and the European Employee Council; – Our annual global leaders meeting with the top 120 senior leaders across the Group; – Global, functional and regional webcasts; – Webcasts and podcasts with the Chief Executive and Management Board members; – Global, independently-managed and multilingual Speak Up channels; and – Our global Your Voice employee survey every two years, most recently in 2021. Our 'Workforce Voice in the Boardroom' programme focuses on ensuring the Board understands the views of our workforce, and reviews details of the key themes identified and how we have responded to them. Feedback from the Board, with associated action, is cascaded back across our workforce and the Board is kept updated on progress against identified actions during the year. In 2022, the key themes identified were related to continuation of regular updates on transformation, including sustainability and innovation, and continuous focus on prioritisation. We have responded to this feedback with a range of activities. For example, during a five-day long Sustainability Week of events held in July, we welcomed c.14,000 attendees to various webcast panel sessions. Each day was allocated to key ESG agenda themes, including operations, diversity and innovation. During the week, senior leaders explained our ESG ambitions and initiatives that we are undertaking and attendees also had the opportunity to ask questions and were able to share their views on ESG topics. In the Year-End and Half-Year Results live webcasts, the Chief Executive, Finance and Transformation Director, and Chief Growth Officer re-emphasised the Group’s purpose and ambitions, shared the progress made by the Group and highlighted the priorities for the upcoming period. These live events are also supported by complementary communications which are accessible to all employees. For example, the Year-End Results email sent by the Chief Executive was read by more than 25,000 employees. Bloomberg Gender-Equality We are proud to be included in the 2023 Bloomberg Gender-Equality Index (GEI). The GEI helps bring transparency to gender-related practices and policies. This recognition is a demonstration of our continued commitment and focus on providing an inclusive work environment and our desire to build on the strengths gained through gender diversity, equality and transparency. Our efforts to create an inclusive culture for women through our recruiting initiatives, adoption of family- friendly policies, sponsoring programmes dedicated to educating women and support of community programmes, were identified as strengths. Your Voice We conduct our global Your Voice survey every two years, with the most recent survey conducted in 2021. In the 2021 Your Voice survey, we were pleased to surpass our 2019 response rate with 93% of all employees globally choosing to respond (seven percentage points higher than the average of our global FMCG comparator group). Our 2021 Your Voice results outperform our FMCG comparator group in most categories, with strong results in D&I, people management, corporate responsibility and empowerment. Our 2021 results were one percentage point higher than our global FMCG comparator group for our Employee Engagement Index and four percentage points higher than the average of our FMCG comparator group for our High Performance Index. These results reflect a connected, committed, energised and high performing organisation. The next Your Voice survey will be undertaken in 2023. Results from that survey will serve as the basis for further shaping the priorities for the organisation. Find out more about how our Board engages with our global workforce on pages 132, 140 and 169 BAT Annual Report and Form 20-F 2022 Strategic Report Governance Report Financial Statements Other Information Strategic Management People, Diversity and Culture Continued 88
Rewarding People Our SoBC makes clear our commitment to providing fair, clear and competitive wages and benefits. In line with good equal pay practices, we have clearly defined pay scales for all roles across the Group worldwide. This approach ensures pay, bonuses and benefits are consistently applied and not influenced by factors such as gender or ethnicity. Reward is a key pillar in ensuring that we have the right people to drive the business forward. Reward is necessarily local and we strongly support this approach through global frameworks to ensure leading-edge policies, processes and technology are available to all markets. Base pay rewards core competence relative to skills, experience and contribution to the Group, while annual bonuses, long-term incentives, recognition schemes and ad hoc incentives provide the right mix to ensure that sustained high performance is recognised and rewarded. Our annual bonus and long-term incentive plans are aligned throughout the organisation, with eligible employees participating in plans with the same performance metrics as the Executive Directors, supporting line of sight throughout the organisation. We also offer our UK employees the chance to share in our success via our Sharesave Scheme, Partnership Share Scheme and Share Reward Scheme, and operate several similar schemes for employees in our Group companies. Find details of our Directors’ Remuneration Policy on pages 163 to 169 Benefits and Reward Our benefits offering is a core component of our reward strategy. We aim to deliver benefits that are fair and competitive. During 2022, we reviewed our global benefits strategy and introduced new innovations to provide employees with greater choice and flexibility, including investments in technology. Changes were accompanied by enhancements to our benefit programmes in the areas of financial wellbeing, employee health and assistance while re-appraising benefit design to create greater value for employees. Our approach to rewarding Group company employees and engagement on remuneration matters is discussed further on pages 167 to 169. Equal Pay for Equal Work Our focus on pay equity is intended to ensure that all employees performing the same work or work of equal value are paid equitably and pay is not influenced by factors such as gender or ethnicity. In 2022, we partnered with Fair Pay Workplace (FPW) to conduct a Pay Equity Review. FPW is an independent specialist consultancy that supports companies to gain recognition for their commitment to true pay equity using a trusted and transparent methodology. The review covered approximately 40,000 employees in 44 markets from a gender perspective. Our broader D&I strategy also focuses on diversity of ethnicities across our business. This allowed us, for the first time, to undertake an Ethnicity Pay Equity Review for our employees in seven countries, approximately 14,000 of our people. The markets were selected to ensure relevant international representation comprising employees across all regions and to provide a cross-sectional view of BAT’s business operations. We evaluated the base salary for each employee at each level of the organisation, considering any reasons for any salary determinations, such as level or type of work performed, individual performance, location and experience. The consolidated results of our global pay equity assessment show: – Women and men are paid within 1% of one another for doing the same work or work of equal value – Ethnically diverse groups and non- ethnically diverse groups are paid within 1% of each other for doing the same work or work of equal value This confirms that our global efforts to provide consistent and fair compensation based on legitimate drivers of pay are working. We were pleased to receive further accreditation from FPW for all the countries included in the scope of our Pay Equity review. FPW certification is a transparent and trusted standard of measurement to differentiate organisations dedicated to true pay equity, and this milestone represents another important step in the Group’s D&I agenda. Globally Certified across 44 markets Certified organisations are recognised leaders in ensuring equal pay for equal work. Find more details in our Diversity and Inclusion Report 2022 Responsible Restructuring Where restructuring is necessary, we are committed to doing so in a responsible manner. Responsible local approaches and procedures to address each instance include employee consultation periods, severance pay and any other measures that may be appropriate to the situation and location. Examples include outplacement support, career transition services, financial advice and training to help displaced employees to find alternative employment. You can read about our Group risk factor related to talent on page 343 Employee retention – 1,502 voluntary turnover of management-grade employees in 2022 – 10.6% voluntary turnover rate of management-grade employees in 2022 – 10.5% voluntary turnover rate for all employees in 2022 Collective bargaining – 28.6% Group company employees covered by an independent trade union or collective bargaining agreement Diversity – 30.4% representation of women on senior leadership teams in 2022 – 27.1% representation of women on senior leadership teams in 2021 – 26.7% representation of women on senior leadership teams in 2020 BAT Annual Report and Form 20-F 2022 Strategic Report Governance Report Financial Statements Other Information 89
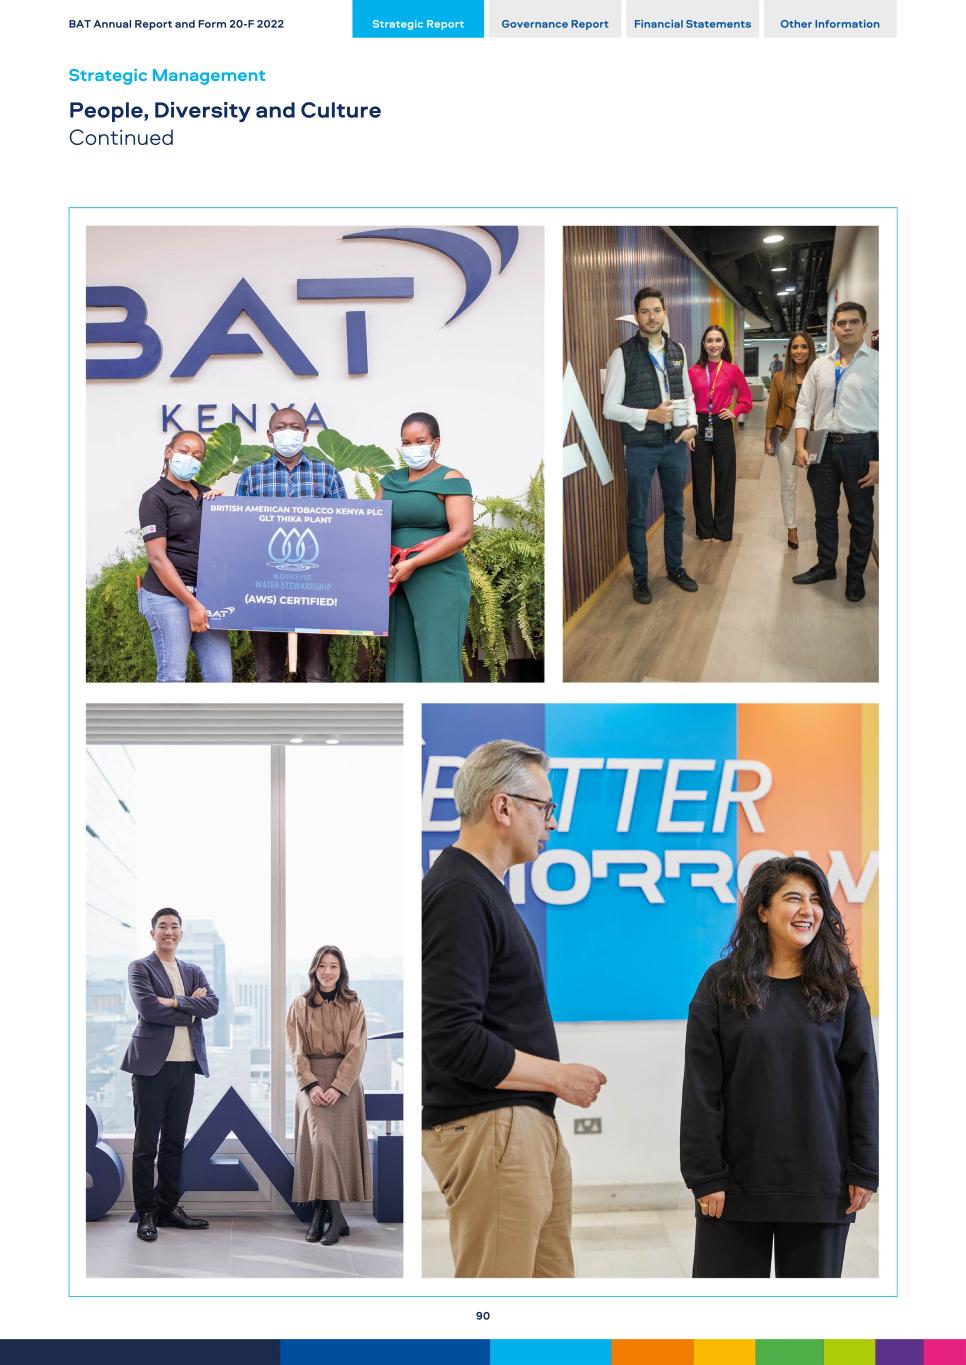
BAT Annual Report and Form 20-F 2022 Strategic Report Governance Report Financial Statements Other Information Strategic Management People, Diversity and Culture Continued 90
Our Employment Principles Our Employment Principles set out a common approach for our Group companies’ policies and procedures, recognising that each Group company must take account of local labour law and practice, and the local political, economic and cultural context. In developing our Employment Principles, we have sought the views of a cross-section of internal and external stakeholders, and have consulted with employee representatives and (where relevant) with our works councils. Our Employment Principles are implemented by Group companies and, through our internal audit processes, Group companies are required to demonstrate how these are embedded into the workplace. In addition to our Employment Principles, our Board Diversity Policy applies specifically to our Board and Management Board, discussed on page 148. Our policies and principles Summary of areas covered Stakeholder groups Employment Principles* Available at www.bat.com/principles Employment practices, including commitments to diversity, reasonable working hours, family-friendly policies, employee wellbeing, talent, performance, equal opportunities, and fair, clear and competitive remuneration and benefits and responsible restructuring. Our People Health and Safety Policy * Available at www.bat.com/principles Health, safety and welfare of BAT employees, contractors, visitors and other relevant stakeholders. Our People Customers Suppliers Standards of Business Conduct* Available at www.bat.com/principles Topics include respect in the workplace, promoting equality and diversity, preventing harassment and bullying, fair wages and benefits, and supporting work-life balance. As well as human rights, health, safety, welfare and compliance with our Group Data Privacy Procedures. Our People Group Data Privacy Procedure The manner in which BAT processes personal data about all individuals, including consumers and employees, contractors and employees of suppliers. Our People Suppliers Consumers Customers Note: * These policies and principles are endorsed by our Board, implemented for application by all Group companies and support the effective identification, management and mitigation of risks and issues for our business in these and other areas. Available at www.bat.com/principles. BAT Annual Report and Form 20-F 2022 Strategic Report Governance Report Financial Statements Other Information 91
Providing a safe working environment for all Health and Safety Our Goals Zero 100% accidents Group-wide each year of farmers and workers each year with sufficient PPE for agrochemical use and tobacco harvesting 2022 Performance Highlights 6% 0.19 99.6% reduction in total Group- wide accidents vs 2021 Lost Time Incident Rate (LTIR) vs 0.20 in 2021 farmers and workers in our Tobacco Supply Chain1 with sufficient PPE for tobacco harvesting 83 82% 99.9% Lost Time Incidents vs 95 in 2021 of our sites achieved zero accidents in 2022 farmers and workers Tobacco Supply Chain1 with sufficient PPE for agrochemical use GRI Standard(s) SFDR / PAI Indicators SASB Standard(s) GRI 403.1-10 (Inclusive) S1. , S2., S3., S4., S5. FB-AG-320a.1 Relevant Policies and Standards – Group Health and Safety – Supplier Code of Conduct (SCoC) – Operational Standard for PPE Notes: 1. 'Tobacco Supply Chain' refers to the tobacco supplied by our directly contracted farmers and those of our strategic third party suppliers, who participate in our annual Thrive assessment, representing over 80% of the tobacco purchased by volume in 2022. 2. Reference to 'tobacco supply chain' covers all tobacco used in our combustibles and THP products. Find out more: Refer to the BAT 'Reporting Criteria' for a full description of key terms and definitions: bat.com/reporting For more performance metrics and operational data refer to the BAT 'ESG Performance Data Book' : bat.com/sustainability reporting Our Approach We are committed to providing a safe working environment for all our employees and contractors. We also require farmers in our Tobacco Supply Chain1 to have access to personal protective equipment (PPE) for agrochemical use and harvesting. Why Health and Safety Matters Providing safe working conditions and continuing to strive for zero accidents across the Group supports the wellbeing of our employees, while enhancing our reputation as an employer of choice. Safety risks vary across our business operations. For example, for our Trade Marketing & Distribution (TM&D) teams, the highest risks relate to road traffic accidents or attacks and assaults from armed robberies where our goods have a high street value. In our Tobacco Supply Chain1, farmers and workers can be at risk of pesticide poisoning from handling agrochemicals when growing tobacco. Green tobacco sickness (GTS) from handling wet, green tobacco leaves during harvesting is also a risk. Policies and Accountabilities Our Group Health and Safety Policy is implemented for application by all Group companies. It outlines our commitment to applying the highest international standards of health and safety for our employees, as well as third-party personnel on company premises. For our suppliers, our Supplier Code of Conduct (the Code) defines the minimum standards we expect, including specific health and safety criteria. Additionally, our Operational Standard for PPE in tobacco farming applies to all 81,285 farmers directly contracted by the Group's own Leaf Operations. It requires all our directly contracted farmers and their workers to have access to PPE for agrochemical use and harvesting. Training and monitoring must be carried out for all our contracted farms on PPE, agrochemical use and GTS. We ask our third-party leaf suppliers to implement similar standards in their own operations. Twice a year, the Board reviews performance against our health and safety targets and key performance indicators. The Board also regularly reviews our tobacco supply chain2 strategy. Protecting Health and Safety Across our Business Operations Operating in diverse markets - including some of the world’s most volatile regions - can be challenging. That is why we have a well-established approach to protect the health and safety of our employees and contractors across the Group. BAT Annual Report and Form 20-F 2022 Strategic Report Governance Report Financial Statements Other Information Strategic Management Health and Safety 92
We track health and safety performance across all our sites. A dedicated team analyses the information to identify trends or high-risk areas that require coordinated cross-functional action. Our comprehensive approach is based on risk management. We then develop tailored initiatives for specific priorities and high-risk areas. For example, in manufacturing, our accident prevention programme focuses on preventing injuries when using equipment or machinery. The result has been a steady reduction in accidents across the whole Group. Overall, there was a 6% reduction in reported incidents in 2022, to 116 (vs 123 in 2021), which mainly comprised a 10% reduction in Operations and 3.5% reduction in non- Operations activities (such as TM&D and commercial activities). In 2022, 82% of our sites achieved zero accidents. This performance was consistent with a positive downward trend of our global historical data in this area. 82% of our operational sites achieved zero accidents during the year In TM&D, where there are high risks of road traffic accidents or attacks and assaults, we have comprehensive driver safety and security programmes. This also includes telematic systems in all our vehicles to monitor driving behaviour and identify areas for improvements. In locations that are high-risk for attacks and assaults, we constantly assess threats to ensure appropriate protocols are in place to keep our people safe. This can include placing limits on loads carried to reduce value, strategic route planning to avoid predictability, and providing security escorts. In addition to our official and regular Health and Safety (H&S) forums, in 2022 we established a Centre of Excellence (COE) approach for our top four H&S losses (attacks and assaults, vehicle-related, slips and trips and manual handling), with monthly meetings providing solutions, guidelines and technical knowledge to the Group. Every COE has representatives from all our Regions and Functions, with the main objectives of: – Defining and updating global H&S guidelines and process standardisation; and – Guiding end markets and sharing best practices. Our work to develop or upgrade processes, and organise training and communication has seen vehicle-related accidents and attacks and assaults decline over recent years. In 2022, we recorded an 11% reduction, compared to 2021. Sadly, there were four fatalities in 2022: a contractor in Papua New Guinea; a contractor in Brazil; an employee in Mexico; and a member of the public in South Africa. We deeply regret this loss of life and the suffering it has caused to family, friends and colleagues. For every serious incident or fatality that occurs, we work with the relevant authorities on their investigations. These incidents were investigated by local teams and reviewed by the regional and global EHS teams to avoid recurrences. Learnings and action plans were disseminated across all regions. To prevent similar incidents from happening again, we conduct rigorous internal investigations to determine the cause, identify lessons and develop an action plan. The Management Board receives details of any serious incidents and associated investigations that arise in the context of Group operations. The Board is also updated on such incidents and the implementation of action plans. Protecting the Occupational Health and Wellbeing of all Employees We aim to be among the leaders in occupational health management. We focus on identifying hazards, assessing risks to people’s health at work and introducing appropriate controls and support. We also have programmes around the world that protect and promote health and wellbeing for employees, their families and local communities. These include: – Medical services, health screening, vaccinations and insurance; – Mental health support and counselling services; – Healthy lifestyle and fitness schemes; – Family-friendly initiatives, such as flexible working and help with childcare; and – Where relevant, targeted programmes to address significant endemic diseases, such as HIV and malaria. Throughout the COVID-19 pandemic, our digital transformation enabled us to swiftly shift to remote home working where needed. In many parts of the world, including our global headquarters in the UK, we now have a hybrid working model. We introduced ‘COVID-19-secure’ workplace measures for employees who returned to their workplace. These include regular cleaning and sanitising, temperature checkpoints and free access to COVID-19 testing. We also provide our employees with regular communications regarding vaccination programmes and how to access them. And, in over 25 countries, we provided direct vaccine support, with vaccines available on-site or free transportation to vaccination centres. Promoting Health and Safety Throughout our Tobacco Supply Chain The main health and safety risks when growing tobacco relate to exposure to pesticides, and GTS, which can be contracted from handling wet green tobacco leaves during harvesting. However, both these risks can be minimised with appropriate use of PPE. Our operational standard for PPE in tobacco farming details our mandatory requirements for 100% access and use of PPE for contracted farmers and their workers. This includes technical specifications for the types of PPE appropriate for agrochemical use and harvesting, and for different climates and conditions. Our Extension Services team monitor our contracted farms for compliance with our standards. Our third-party suppliers are responsible for monitoring the farmers they buy tobacco from. In 2022, 99.9% of our contracted farmers and those supplying our strategic third-party suppliers were reported to have sufficient PPE for agrochemical use and 99.6% for use when harvesting. The Group's own Leaf Operations and strategic third-party suppliers provide regular training and guidance on how to use, clean and care for PPE. The training also covers health and safety best practice and preventative measures against GTS, and is supported by ongoing farmer communications. Training is also provided on the correct and safe use, storage and disposal of agrochemicals to protect the environment and farmers’ health. During 2022 these health and safety training sessions reached 325,260 attendants. Find out about our Group risk factors related to workplace health and safety on pages 120 and 352 BAT Annual Report and Form 20-F 2022 Strategic Report Governance Report Financial Statements Other Information 93

This page is intentionally left blank BAT Annual Report and Form 20-F 2022 Strategic Report Governance Report Financial Statements Other Information Strategic Management 94
This page is intentionally left blank BAT Annual Report and Form 20-F 2022 Strategic Report Governance Report Financial Statements Other Information 95
For Shareholders and Investors BAT Annual Report and Form 20-F 2022 Strategic Report Governance Report Financial Statements Other Information 96
We have strong foundations We have a strategy for accelerated growth We are transforming our business We are building a sustainable enterprise of the future Founded in 1902 Consumer-Centric Investing Brands With Purpose and first listed on the London Stock Exchange in 1912 – a constituent of the FTSE 100 since its creation in 1984 multi-category strategy focused on being a high- growth, consumer goods business in New Category products and expanding our portfolio ‘beyond nicotine’ to satisfy the evolving preferences of adult consumers 6.0% Driving Value 14.8% of Group Revenues 21 Years dividend growth, to 230.9p per share from our combustibles business to generate the funds for investment in Non-Combustible, reduced- risk products*† in the Dow Jones Sustainability Indices, as well as open and transparent ESG reporting aligned to best practice frameworks 200+ Accelerated growth £629m Savings Sustainability brands in our portfolio specifically positioned in each target consumer segment in New Categories supported by continuous investment in 2022 (annualised), with £1.9 billion realised over 3 years, in excess of original £1.0 billion target front and centre in all that we do, focused on reducing the health impact of our business, underpinned by excellence across our ESG priorities Long History Simplifying New Capabilities 60 Markets of delivering returns and cash flow to our shareholders with £6.9 billion paid in 2022 the business to create the Enterprise of the Future combined with our existing skills and experience are helping to radically redefine our organisation where our New Category products are available Notes: * Based on the weight of evidence and assuming a complete switch from cigarette smoking. These products are not risk free and are addictive. † Our Vapour product Vuse (including Alto, Solo, Ciro and Vibe), and certain products, including Velo, Grizzly, Kodiak, and Camel Snus, which are sold in the U.S., are subject to FDA regulation and no reduced-risk claims will be made as to these products without agency clearance. Our 2022 full year performance demonstrates that we are delivering and transforming at speed, driven by the strength of our multi-category portfolio of global brands. Tadeu Marroco Finance and Transformation Director BAT Annual Report and Form 20-F 2022 Strategic Report Governance Report Financial Statements Other Information A Better Tomorrow™ For Shareholders and Investors 97
Highlights Revenue up +7.7% New Categories revenue growth and strong pricing in combustibles supported by currency tailwinds, with revenue up 7.7% Profit from Operations +2.8% Profit from operations was up 2.8%. On an adjusted, constant currency basis, profit from operations grew 4.3%, with an improvement in the financial performance of New Categories as losses reduced Diluted EPS down -1.3% Adjusted diluted EPS up 5.8% at constant rates of exchange Dividend per share 230.9p Dividend per share up 6.0% at 230.9p Non-GAAP Measures In the reporting of financial information, the Group uses certain measures that are not defined by IFRS, the Generally Accepted Accounting Principles (GAAP) under which the Group reports. The Group believes that these additional measures, which are used internally, are useful to users of the financial information in helping them understand the underlying business performance. The principal non-GAAP measures which the Group uses are revenue at constant rates of exchange, revenue from New Categories, Category contribution, adjusted profit from operations, adjusted diluted earnings per share, adjusted net finance costs and adjusted taxation. Adjusting items are significant items in profit from operations, net finance costs, taxation, the Group’s share of the post-tax results of associates and joint ventures and cash flow which individually or, if of a similar type, in aggregate, are relevant to an understanding of the Group’s underlying financial performance. As an additional measure to indicate the results of the Group before the impact of exchange rates on the Group’s results, the movement in revenue from New Categories, Category contribution, adjusted profit from operations, adjusted net finance costs and adjusted diluted earnings per share are all shown at constant rates of exchange. These non-GAAP measures are explained, defined and reconciled from the most comparable GAAP metric on pages 324 to 336 and note 2 in the Notes on the Accounts. The discussion of 2020 results that are not necessary to an understanding of the Group’s financial condition, changes in financial condition and results of operations is excluded from this Financial Review in accordance with applicable US securities laws. Discussion of such 2020 metrics is contained in the Group’s Annual Report on Form 20-F 2021, which is available at bat.com/annualreport and has been filed with the SEC. Information contained in pages 34 to 43, pages 75 to the first column on page 82 and from the heading ‘Retirement benefit schemes’ on page 82 to page 83 of the Annual Report on Form 20-F 2021 are accordingly incorporated by reference into this Annual Report on Form 20-F 2022 only to the extent such information pertains to the Group’s financial condition and results of operations for the fiscal year ended 31 December 2020. BAT Annual Report and Form 20-F 2022 Strategic Report Governance Report Financial Statements Other Information Financial Review Financial Performance Summary 98
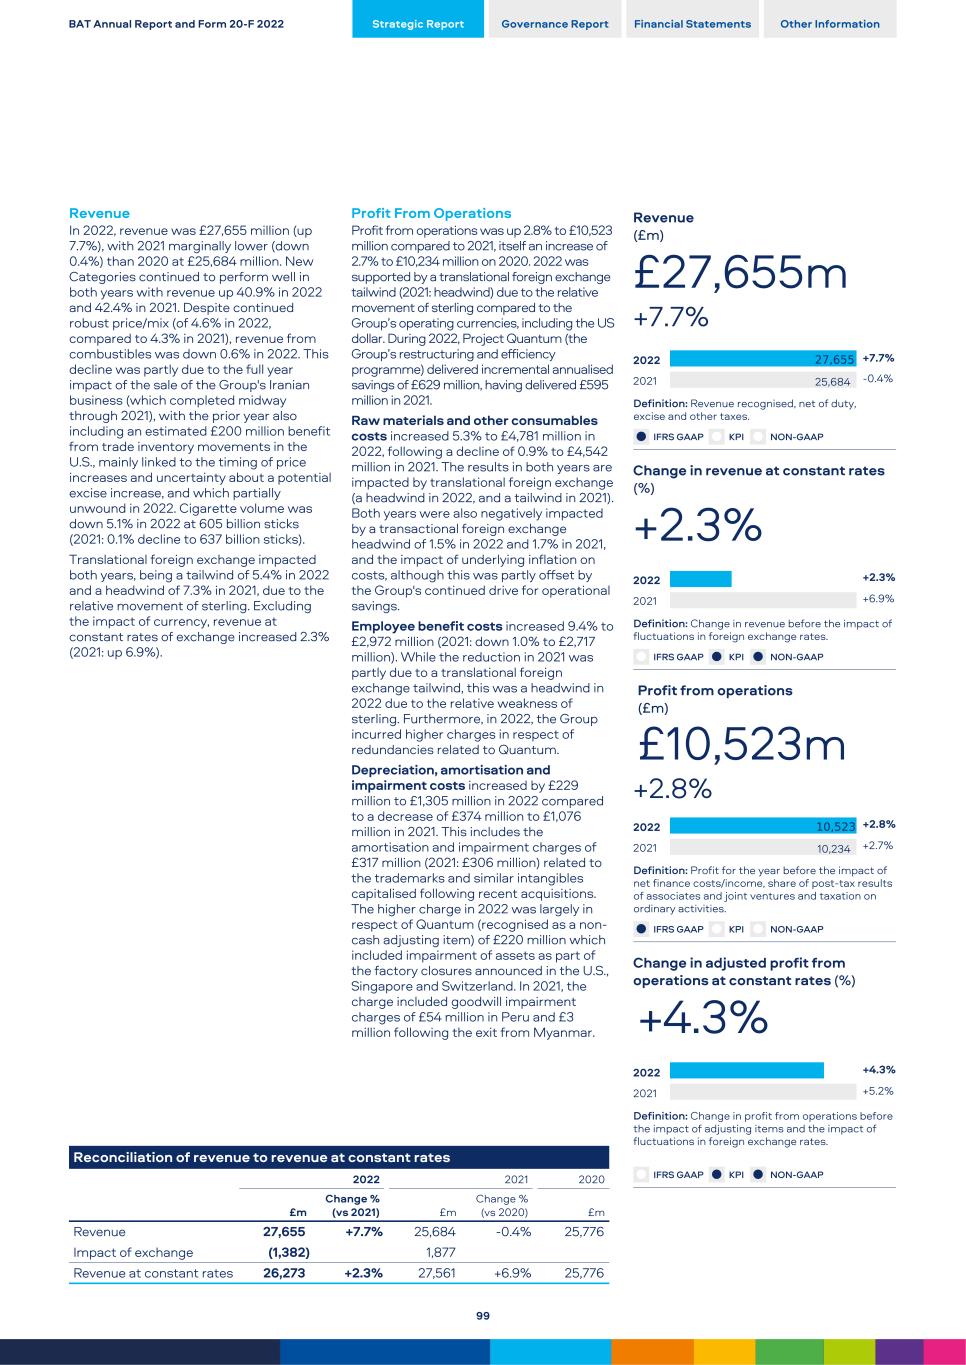
Revenue In 2022, revenue was £27,655 million (up 7.7%), with 2021 marginally lower (down 0.4%) than 2020 at £25,684 million. New Categories continued to perform well in both years with revenue up 40.9% in 2022 and 42.4% in 2021. Despite continued robust price/mix (of 4.6% in 2022, compared to 4.3% in 2021), revenue from combustibles was down 0.6% in 2022. This decline was partly due to the full year impact of the sale of the Group's Iranian business (which completed midway through 2021), with the prior year also including an estimated £200 million benefit from trade inventory movements in the U.S., mainly linked to the timing of price increases and uncertainty about a potential excise increase, and which partially unwound in 2022. Cigarette volume was down 5.1% in 2022 at 605 billion sticks (2021: 0.1% decline to 637 billion sticks). Translational foreign exchange impacted both years, being a tailwind of 5.4% in 2022 and a headwind of 7.3% in 2021, due to the relative movement of sterling. Excluding the impact of currency, revenue at constant rates of exchange increased 2.3% (2021: up 6.9%). Reconciliation of revenue to revenue at constant rates 2022 2021 2020 £m Change % (vs 2021) £m Change % (vs 2020) £m Revenue 27,655 +7.7 % 25,684 -0.4 % 25,776 Impact of exchange (1,382) 1,877 Revenue at constant rates 26,273 +2.3 % 27,561 +6.9 % 25,776 Profit From Operations Profit from operations was up 2.8% to £10,523 million compared to 2021, itself an increase of 2.7% to £10,234 million on 2020. 2022 was supported by a translational foreign exchange tailwind (2021: headwind) due to the relative movement of sterling compared to the Group’s operating currencies, including the US dollar. During 2022, Project Quantum (the Group’s restructuring and efficiency programme) delivered incremental annualised savings of £629 million, having delivered £595 million in 2021. Raw materials and other consumables costs increased 5.3% to £4,781 million in 2022, following a decline of 0.9% to £4,542 million in 2021. The results in both years are impacted by translational foreign exchange (a headwind in 2022, and a tailwind in 2021). Both years were also negatively impacted by a transactional foreign exchange headwind of 1.5% in 2022 and 1.7% in 2021, and the impact of underlying inflation on costs, although this was partly offset by the Group's continued drive for operational savings. Employee benefit costs increased 9.4% to £2,972 million (2021: down 1.0% to £2,717 million). While the reduction in 2021 was partly due to a translational foreign exchange tailwind, this was a headwind in 2022 due to the relative weakness of sterling. Furthermore, in 2022, the Group incurred higher charges in respect of redundancies related to Quantum. Depreciation, amortisation and impairment costs increased by £229 million to £1,305 million in 2022 compared to a decrease of £374 million to £1,076 million in 2021. This includes the amortisation and impairment charges of £317 million (2021: £306 million) related to the trademarks and similar intangibles capitalised following recent acquisitions. The higher charge in 2022 was largely in respect of Quantum (recognised as a non- cash adjusting item) of £220 million which included impairment of assets as part of the factory closures announced in the U.S., Singapore and Switzerland. In 2021, the charge included goodwill impairment charges of £54 million in Peru and £3 million following the exit from Myanmar. Revenue (£m) £27,655m +7.7% 2022 2021 25,684 +7.7% -0.4% Definition: Revenue recognised, net of duty, excise and other taxes. l IFRS GAAP l KPI l NON-GAAP Change in revenue at constant rates (%) +2.3% 2022 2021 +2.3% +6.9% Definition: Change in revenue before the impact of fluctuations in foreign exchange rates. l IFRS GAAP l KPI l NON-GAAP Profit from operations (£m) £10,523m +2.8% 2022 2021 10,234 +2.8% +2.7% Definition: Profit for the year before the impact of net finance costs/income, share of post-tax results of associates and joint ventures and taxation on ordinary activities. l IFRS GAAP l KPI l NON-GAAP Change in adjusted profit from operations at constant rates (%) +4.3% 2022 2021 +4.3% +5.2% Definition: Change in profit from operations before the impact of adjusting items and the impact of fluctuations in foreign exchange rates. l IFRS GAAP l KPI l NON-GAAP BAT Annual Report and Form 20-F 2022 Strategic Report Governance Report Financial Statements Other Information 99
Expenditure on research and development was £323 million in 2022 (2021: £304 million) with a focus on products that could potentially reduce the risk associated with smoking conventional cigarettes. Other operating income increased by £526 million to £722 million (2021: £196 million), largely due to the resolution of the Brazilian VAT on social contributions claims in the Group's favour, as the Group recognised gross income of £472 million, which has been included within adjusting items. Other operating expenses increased by £1,550 million to £9,018 million (2021: decrease of £199 million to £7,468 million). The Group continued to invest in New Categories, maintaining the gross investment in line with 2021, itself an increase on 2020 of £377 million, in part funded by the efficiencies delivered by Quantum. Adjusting items included within profit from operations totalled £1,885 million in 2022 (2021: £916 million). These related to: – trademark amortisation and impairment (2022: £285 million; 2021: £306 million); – other litigation costs of £170 million (2021: £80 million) which in 2022 was mainly in respect of U.S. litigation costs including Engle progeny. In 2021, the Group recognised a net charge from settlements in Turkey and South Korea of £26 million; – restructuring and integration costs of £771 million (2021: £150 million) largely related to Quantum which will simplify the business and create a more efficient and agile organisation to support the growth of New Categories; – charges of £612 million in respect of the proposed sale of the Group's operations in Russia and Belarus, with the assets and liabilities classified as held for sale at 31 December 2022. In 2021, the Group sold its operations in Iran recognising a charge of £358 million, largely in respect of the write-off of certain assets and the reclassification, from reserves to the income statement, of foreign exchange; – a charge of £450 million, in 2022, recognised in respect of the investigations by the DOJ and OFAC into alleged historical breaches of sanctions; – a charge of £79 million (related to the conclusion of the investigation into alleged violations of the Nigerian Competition and Consumer Protection Act and National Tobacco Control Act); – a credit of £460 million, in 2022, related to the calculation of VAT on social contributions in Brazil; and – a credit, in 2022, of £16 million (2021: credit of £35 million) following the partial buy-out of the pension fund in the U.S. In 2021, the Group also recognised charges in respect of the impairment of goodwill of £57 million (related to Peru and Myanmar) and a credit of £59 million as an accrual related to the Reynolds American dissenting shareholders was released on successful conclusion of that complaint. Adjusted profit from operations is the Group’s profit from operations before adjusting items referred to above. Adjusted profit from operations increased by 11.3% to £12,408 million, partly driven by the foreign exchange tailwind. On a constant currency basis this would have been an increase of 4.3%. In 2021, adjusted profit from operations fell 1.9% to £11,150 million, being an increase of 5.2% on a constant currency basis. Analysis of profit from operations, net finance costs and results from associates and joint ventures 2022 2021 Reported £m Adjusting items £m Adjusted £m Impact of exchange £m Adjusted at CC £m Reported £m Adjusting items £m Adjusted £m Profit from operations U.S. 6,205 630 6,835 (740) 6,095 5,566 321 5,887 AmSSA 2,022 (280) 1,742 (83) 1,659 1,496 94 1,590 Europe 1,270 812 2,082 21 2,103 1,885 71 1,956 APME 1,026 723 1,749 20 1,769 1,287 430 1,717 Total regions 10,523 1,885 12,408 (782) 11,626 10,234 916 11,150 Net finance (costs)/income (1,641) 34 (1,607) 140 (1,467) (1,486) 55 (1,431) Associates and joint ventures 442 92 534 (24) 510 415 12 427 Profit before tax 9,324 2,011 11,335 (666) 10,669 9,163 983 10,146 Analysis of profit from operations, net finance costs and results from associates and joint ventures 2021 2020 Reported £m Adjusting items £m Adjusted £m Impact of exchange £m Adjusted at CC £m Reported £m Adjusting items £m Adjusted £m Profit from operations U.S. 5,566 321 5,887 456 6,343 4,975 809 5,784 AmSSA 1,496 94 1,590 98 1,688 1,553 65 1,618 Europe 1,885 71 1,956 132 2,088 1,962 148 2,110 APME 1,287 430 1,717 116 1,833 1,472 381 1,853 Total regions 10,234 916 11,150 802 11,952 9,962 1,403 11,365 Net finance (costs)/income (1,486) 55 (1,431) (89) (1,520) (1,745) 153 (1,592) Associates and joint ventures 415 12 427 29 456 455 (13) 442 Profit before tax 9,163 983 10,146 742 10,888 8,672 1,543 10,215 BAT Annual Report and Form 20-F 2022 Strategic Report Governance Report Financial Statements Other Information Financial Review Financial Performance Summary Continued 100
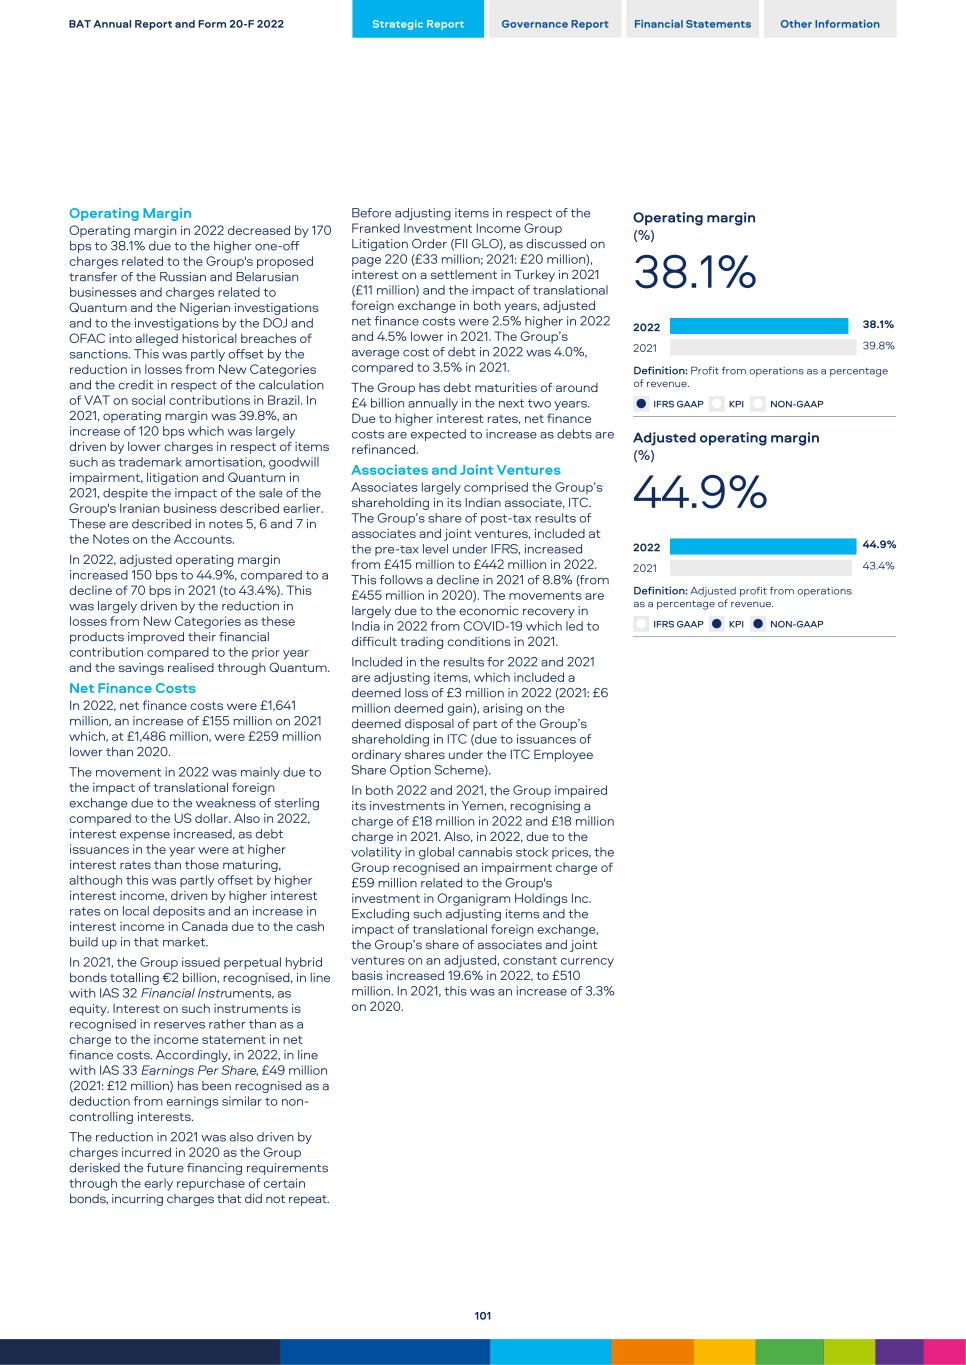
Operating Margin Operating margin in 2022 decreased by 170 bps to 38.1% due to the higher one-off charges related to the Group's proposed transfer of the Russian and Belarusian businesses and charges related to Quantum and the Nigerian investigations and to the investigations by the DOJ and OFAC into alleged historical breaches of sanctions. This was partly offset by the reduction in losses from New Categories and the credit in respect of the calculation of VAT on social contributions in Brazil. In 2021, operating margin was 39.8%, an increase of 120 bps which was largely driven by lower charges in respect of items such as trademark amortisation, goodwill impairment, litigation and Quantum in 2021, despite the impact of the sale of the Group's Iranian business described earlier. These are described in notes 5, 6 and 7 in the Notes on the Accounts. In 2022, adjusted operating margin increased 150 bps to 44.9%, compared to a decline of 70 bps in 2021 (to 43.4%). This was largely driven by the reduction in losses from New Categories as these products improved their financial contribution compared to the prior year and the savings realised through Quantum. Net Finance Costs In 2022, net finance costs were £1,641 million, an increase of £155 million on 2021 which, at £1,486 million, were £259 million lower than 2020. The movement in 2022 was mainly due to the impact of translational foreign exchange due to the weakness of sterling compared to the US dollar. Also in 2022, interest expense increased, as debt issuances in the year were at higher interest rates than those maturing, although this was partly offset by higher interest income, driven by higher interest rates on local deposits and an increase in interest income in Canada due to the cash build up in that market. In 2021, the Group issued perpetual hybrid bonds totalling €2 billion, recognised, in line with IAS 32 Financial Instruments, as equity. Interest on such instruments is recognised in reserves rather than as a charge to the income statement in net finance costs. Accordingly, in 2022, in line with IAS 33 Earnings Per Share, £49 million (2021: £12 million) has been recognised as a deduction from earnings similar to non- controlling interests. The reduction in 2021 was also driven by charges incurred in 2020 as the Group derisked the future financing requirements through the early repurchase of certain bonds, incurring charges that did not repeat. Before adjusting items in respect of the Franked Investment Income Group Litigation Order (FII GLO), as discussed on page 220 (£33 million; 2021: £20 million), interest on a settlement in Turkey in 2021 (£11 million) and the impact of translational foreign exchange in both years, adjusted net finance costs were 2.5% higher in 2022 and 4.5% lower in 2021. The Group’s average cost of debt in 2022 was 4.0%, compared to 3.5% in 2021. The Group has debt maturities of around £4 billion annually in the next two years. Due to higher interest rates, net finance costs are expected to increase as debts are refinanced. Associates and Joint Ventures Associates largely comprised the Group’s shareholding in its Indian associate, ITC. The Group’s share of post-tax results of associates and joint ventures, included at the pre-tax level under IFRS, increased from £415 million to £442 million in 2022. This follows a decline in 2021 of 8.8% (from £455 million in 2020). The movements are largely due to the economic recovery in India in 2022 from COVID-19 which led to difficult trading conditions in 2021. Included in the results for 2022 and 2021 are adjusting items, which included a deemed loss of £3 million in 2022 (2021: £6 million deemed gain), arising on the deemed disposal of part of the Group’s shareholding in ITC (due to issuances of ordinary shares under the ITC Employee Share Option Scheme). In both 2022 and 2021, the Group impaired its investments in Yemen, recognising a charge of £18 million in 2022 and £18 million charge in 2021. Also, in 2022, due to the volatility in global cannabis stock prices, the Group recognised an impairment charge of £59 million related to the Group's investment in Organigram Holdings Inc. Excluding such adjusting items and the impact of translational foreign exchange, the Group’s share of associates and joint ventures on an adjusted, constant currency basis increased 19.6% in 2022, to £510 million. In 2021, this was an increase of 3.3% on 2020. Operating margin (%) 38.1% 2022 2021 38.1% 39.8% Definition: Profit from operations as a percentage of revenue. l IFRS GAAP l KPI l NON-GAAP Adjusted operating margin (%) 44.9% 2022 2021 44.9% 43.4% Definition: Adjusted profit from operations as a percentage of revenue. l IFRS GAAP l KPI l NON-GAAP BAT Annual Report and Form 20-F 2022 Strategic Report Governance Report Financial Statements Other Information 101
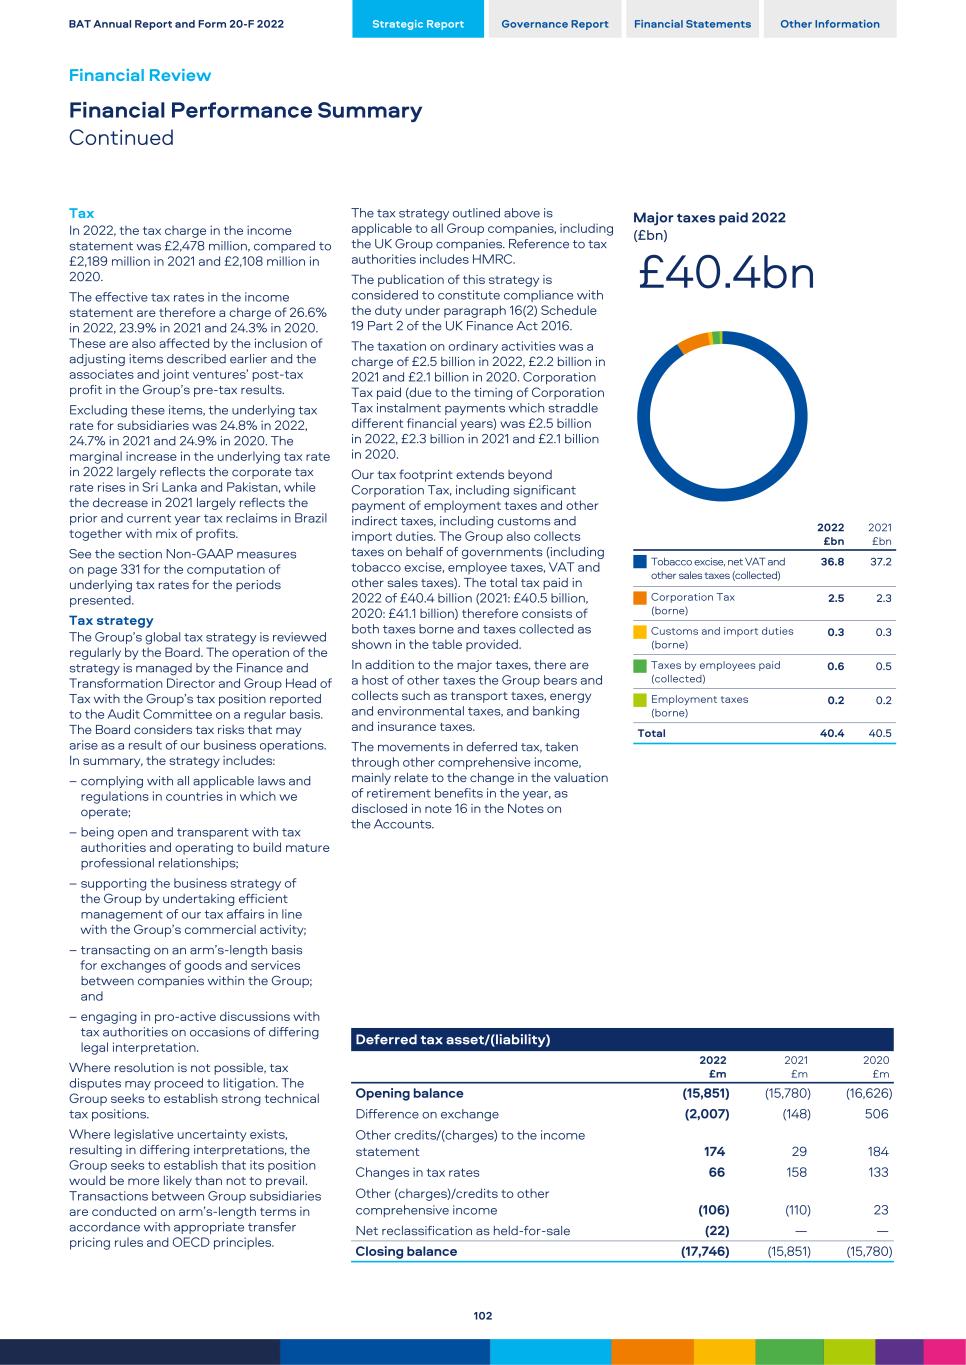
Tax In 2022, the tax charge in the income statement was £2,478 million, compared to £2,189 million in 2021 and £2,108 million in 2020. The effective tax rates in the income statement are therefore a charge of 26.6% in 2022, 23.9% in 2021 and 24.3% in 2020. These are also affected by the inclusion of adjusting items described earlier and the associates and joint ventures’ post-tax profit in the Group’s pre-tax results. Excluding these items, the underlying tax rate for subsidiaries was 24.8% in 2022, 24.7% in 2021 and 24.9% in 2020. The marginal increase in the underlying tax rate in 2022 largely reflects the corporate tax rate rises in Sri Lanka and Pakistan, while the decrease in 2021 largely reflects the prior and current year tax reclaims in Brazil together with mix of profits. See the section Non-GAAP measures on page 331 for the computation of underlying tax rates for the periods presented. Tax strategy The Group’s global tax strategy is reviewed regularly by the Board. The operation of the strategy is managed by the Finance and Transformation Director and Group Head of Tax with the Group’s tax position reported to the Audit Committee on a regular basis. The Board considers tax risks that may arise as a result of our business operations. In summary, the strategy includes: – complying with all applicable laws and regulations in countries in which we operate; – being open and transparent with tax authorities and operating to build mature professional relationships; – supporting the business strategy of the Group by undertaking efficient management of our tax affairs in line with the Group’s commercial activity; – transacting on an arm’s-length basis for exchanges of goods and services between companies within the Group; and – engaging in pro-active discussions with tax authorities on occasions of differing legal interpretation. Where resolution is not possible, tax disputes may proceed to litigation. The Group seeks to establish strong technical tax positions. Where legislative uncertainty exists, resulting in differing interpretations, the Group seeks to establish that its position would be more likely than not to prevail. Transactions between Group subsidiaries are conducted on arm’s-length terms in accordance with appropriate transfer pricing rules and OECD principles. The tax strategy outlined above is applicable to all Group companies, including the UK Group companies. Reference to tax authorities includes HMRC. The publication of this strategy is considered to constitute compliance with the duty under paragraph 16(2) Schedule 19 Part 2 of the UK Finance Act 2016. The taxation on ordinary activities was a charge of £2.5 billion in 2022, £2.2 billion in 2021 and £2.1 billion in 2020. Corporation Tax paid (due to the timing of Corporation Tax instalment payments which straddle different financial years) was £2.5 billion in 2022, £2.3 billion in 2021 and £2.1 billion in 2020. Our tax footprint extends beyond Corporation Tax, including significant payment of employment taxes and other indirect taxes, including customs and import duties. The Group also collects taxes on behalf of governments (including tobacco excise, employee taxes, VAT and other sales taxes). The total tax paid in 2022 of £40.4 billion (2021: £40.5 billion, 2020: £41.1 billion) therefore consists of both taxes borne and taxes collected as shown in the table provided. In addition to the major taxes, there are a host of other taxes the Group bears and collects such as transport taxes, energy and environmental taxes, and banking and insurance taxes. The movements in deferred tax, taken through other comprehensive income, mainly relate to the change in the valuation of retirement benefits in the year, as disclosed in note 16 in the Notes on the Accounts. Deferred tax asset/(liability) 2022 £m 2021 £m 2020 £m Opening balance (15,851) (15,780) (16,626) Difference on exchange (2,007) (148) 506 Other credits/(charges) to the income statement 174 29 184 Changes in tax rates 66 158 133 Other (charges)/credits to other comprehensive income (106) (110) 23 Net reclassification as held-for-sale (22) — — Closing balance (17,746) (15,851) (15,780) Major taxes paid 2022 (£bn) £40.4bn 2022 £bn 2021 £bn Tobacco excise, net VAT and other sales taxes (collected) 36.8 37.2 Corporation Tax (borne) 2.5 2.3 Customs and import duties (borne) 0.3 0.3 Taxes by employees paid (collected) 0.6 0.5 Employment taxes (borne) 0.2 0.2 Total 40.4 40.5 BAT Annual Report and Form 20-F 2022 Strategic Report Governance Report Financial Statements Other Information Financial Review Financial Performance Summary Continued 102
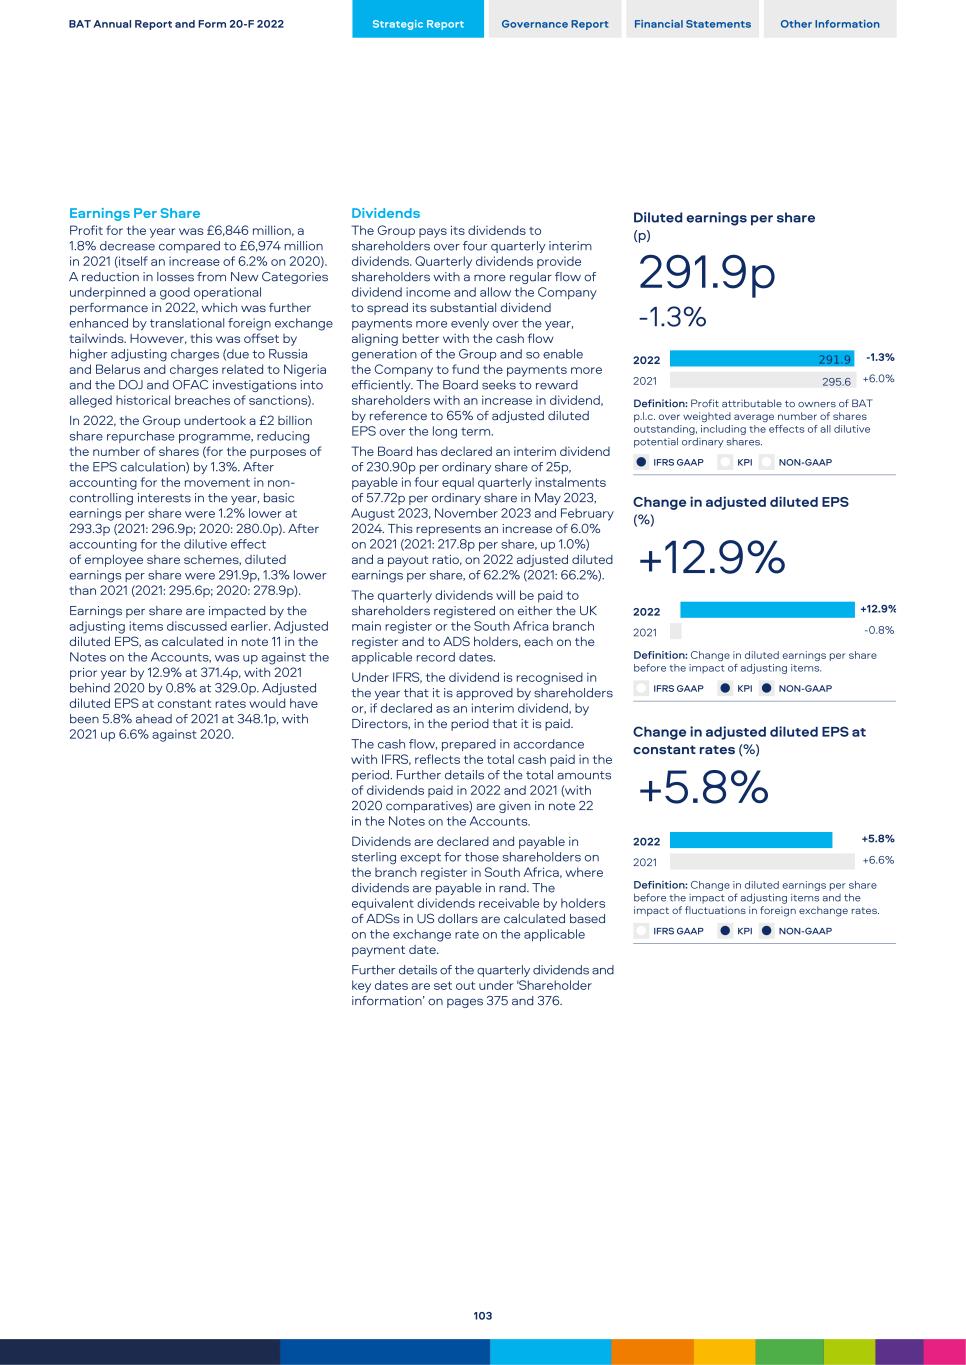
Earnings Per Share Profit for the year was £6,846 million, a 1.8% decrease compared to £6,974 million in 2021 (itself an increase of 6.2% on 2020). A reduction in losses from New Categories underpinned a good operational performance in 2022, which was further enhanced by translational foreign exchange tailwinds. However, this was offset by higher adjusting charges (due to Russia and Belarus and charges related to Nigeria and the DOJ and OFAC investigations into alleged historical breaches of sanctions). In 2022, the Group undertook a £2 billion share repurchase programme, reducing the number of shares (for the purposes of the EPS calculation) by 1.3%. After accounting for the movement in non- controlling interests in the year, basic earnings per share were 1.2% lower at 293.3p (2021: 296.9p; 2020: 280.0p). After accounting for the dilutive effect of employee share schemes, diluted earnings per share were 291.9p, 1.3% lower than 2021 (2021: 295.6p; 2020: 278.9p). Earnings per share are impacted by the adjusting items discussed earlier. Adjusted diluted EPS, as calculated in note 11 in the Notes on the Accounts, was up against the prior year by 12.9% at 371.4p, with 2021 behind 2020 by 0.8% at 329.0p. Adjusted diluted EPS at constant rates would have been 5.8% ahead of 2021 at 348.1p, with 2021 up 6.6% against 2020. Dividends The Group pays its dividends to shareholders over four quarterly interim dividends. Quarterly dividends provide shareholders with a more regular flow of dividend income and allow the Company to spread its substantial dividend payments more evenly over the year, aligning better with the cash flow generation of the Group and so enable the Company to fund the payments more efficiently. The Board seeks to reward shareholders with an increase in dividend, by reference to 65% of adjusted diluted EPS over the long term. The Board has declared an interim dividend of 230.90p per ordinary share of 25p, payable in four equal quarterly instalments of 57.72p per ordinary share in May 2023, August 2023, November 2023 and February 2024. This represents an increase of 6.0% on 2021 (2021: 217.8p per share, up 1.0%) and a payout ratio, on 2022 adjusted diluted earnings per share, of 62.2% (2021: 66.2%). The quarterly dividends will be paid to shareholders registered on either the UK main register or the South Africa branch register and to ADS holders, each on the applicable record dates. Under IFRS, the dividend is recognised in the year that it is approved by shareholders or, if declared as an interim dividend, by Directors, in the period that it is paid. The cash flow, prepared in accordance with IFRS, reflects the total cash paid in the period. Further details of the total amounts of dividends paid in 2022 and 2021 (with 2020 comparatives) are given in note 22 in the Notes on the Accounts. Dividends are declared and payable in sterling except for those shareholders on the branch register in South Africa, where dividends are payable in rand. The equivalent dividends receivable by holders of ADSs in US dollars are calculated based on the exchange rate on the applicable payment date. Further details of the quarterly dividends and key dates are set out under 'Shareholder information’ on pages 375 and 376. Diluted earnings per share (p) 291.9p -1.3% 2022 2021 295.6 -1.3% +6.0% Definition: Profit attributable to owners of BAT p.l.c. over weighted average number of shares outstanding, including the effects of all dilutive potential ordinary shares. l IFRS GAAP l KPI l NON-GAAP Change in adjusted diluted EPS (%) +12.9% 2022 2021 +12.9% -0.8% Definition: Change in diluted earnings per share before the impact of adjusting items. l IFRS GAAP l KPI l NON-GAAP Change in adjusted diluted EPS at constant rates (%) +5.8% 2022 2021 +5.8% +6.6% Definition: Change in diluted earnings per share before the impact of adjusting items and the impact of fluctuations in foreign exchange rates. l IFRS GAAP l KPI l NON-GAAP BAT Annual Report and Form 20-F 2022 Strategic Report Governance Report Financial Statements Other Information 103
Treasury, Liquidity and Capital Structure The Treasury Function is responsible for raising finance for the Group and managing the Group’s cash resources and the financial risks arising from underlying operations. Clear parameters have been established, including levels of authority, on the type and use of financial instruments to manage the financial risks facing the Group. Such instruments are only used if they relate to an underlying exposure; speculative transactions are expressly forbidden under the Group’s treasury policy. All these activities are carried out under defined policies, procedures and limits, reviewed and approved by the Board, delegating oversight to the Finance and Transformation Director and Treasury Function. See note 26 in the Notes on the Accounts for further detail. It is the policy of the Group to maximise financial flexibility and minimise refinancing risk by issuing debt with a range of maturities, generally matching the projected cash flows of the Group and obtaining this financing from a wide range of sources. The Group targets an average centrally managed debt maturity of at least five years of which no more than 20% matures in a single rolling year. As at 31 December 2022, the average centrally managed debt maturity was 9.9 years (2021: 10.1 years) with the highest proportion maturing in a single rolling 12-month period being 18.6% (2021: 18.6%). In order to manage its interest rate risk, the Group maintains both floating rate and fixed rate debt. The Group sets targets (within overall guidelines) for the desired ratio of floating to fixed rate debt on a net basis (at least 50% fixed on a net basis in the short to medium term). The interest rate profile of liquid assets included in net debt are considered to offset floating rate debt and are taken into account in determining the net interest rate exposure. At 31 December 2022, the relevant ratios of floating to fixed rate borrowings after the impact of derivatives were 12:88 (2021: 18:82). On a net debt basis, after offsetting liquid assets, the relevant ratios of floating to fixed rate borrowings were 3:97 (2021: 10:90). Excluding cash and other liquid assets in Canada, which are subject to certain restrictions under Companies' Creditors Arrangement Act (CCAA) protection, the ratios of floating to fixed rate borrowings were 7:93 (2021: 13:87). As part of the management of liquidity, funding and interest rate risk, the Group regularly evaluates market conditions and may enter into transactions, from time to time, to repurchase outstanding debt, pursuant to open market purchases, tender offers or other means. The Group continues to maintain investment‑grade credit ratings*, with ratings from Baa2 (stable outlook)/BBB+ (negative outlook), respectively. The strength of the ratings has underpinned debt issuance and the Group is confident of its ability to successfully access the debt capital markets. The Group is party to the ISDA fallback protocol and in January 2022, it automatically replaced GBP LIBOR with an economically equivalent interest rate referencing SONIA for derivatives on their reset date. For further information please refer to note 26 in the Notes on the Accounts. Available facilities The Group maintains a £25 billion Euro Medium Term Note (EMTN) programme, and U.S. (US$4 billion) and European (£3 billion) commercial paper programmes to accommodate the liquidity needs of the Group. At 31 December 2022, there was £27 million commercial paper outstanding (2021: £269 million outstanding). Cash flows relating to commercial paper that have maturity periods of three months or less are presented on a net basis in the Group’s cash flow statement. The Group’s main bank facility is a syndicated £5.7 billion committed revolving credit facility. This facility was undrawn at 31 December 2022 (31 December 2021: undrawn). In 2022, the Group exercised the second of the one-year extension options in February 2022. Therefore, the £2.85 billion 364-day tranche was extended to March 2023 at the reduced amount of £2.7 billion and £2.5 billion of the five-year tranche was extended from March 2026 to March 2027 (with £3.0 billion of this tranche remaining available until March 2025 and £2.85 billion remaining available from March 2025 to March 2026). The Group expects to refinance the £2.7 billion 364-day tranche in the first half of 2023. During 2022, the Group extended short- term bilateral facilities totalling £3 billion from March to December 2023, some with extension options to extend for further periods. As at 31 December 2022, £875 million was drawn on a short-term basis. Note: * A credit rating is not a recommendation to buy, sell or hold securities. A credit rating may be subject to withdrawal or revision at any time. Each rating should be evaluated separately of any other rating. Cash flows relating to bilateral facilities that have maturity periods of three months or less are presented on a net basis in the Group’s cash flow statement. Following the initial filing in 2019, the Group's shelf registration statement on Form F-3 was renewed with the SEC in 2022, pursuant to which B.A.T Capital Corporation, BAT p.l.c. and B.A.T. International Finance p.l.c. may issue debt securities guaranteed by certain members of the Group from time to time. This forms part of the Group’s strategy to ensure flexible and agile access to capital markets and the registration statement is initially valid for three years. Use of facilities These facilities ensure that the Group has access to funding to supplement the cash available or generated by the business in the period to meet the operational (including working capital) and general corporate requirements including, but not limited to, the timing of payments in relation to: – dividends (2022: £4.9 billion; 2021: £4.9 billion); – capital expenditure (2022: £0.6 billion; 2021: £0.6 billion); – MSA in the U.S. (2022: £2.5 billion; 2021: £2.7 billion); – refinancing obligations; – share repurchase programme, as applicable; and – other corporate activity, such as litigation or acquisitions as relevant. Management believes that the Group has sufficient working capital for present requirements, taking into account the amounts of undrawn borrowing facilities and levels of cash and cash equivalents, and the ongoing ability to generate cash. Issuance, drawdowns and repayment in the period – In March 2022, the Group accessed the US dollar market under its SEC Shelf Programme, raising a total of US$2.5 billion across two tranches; – In May 2022, the Group repaid €600 million bond at maturity; – In June 2022, the Group repaid US$419 million and £180 million bonds at maturity; – In August 2022, the Group repaid US$750 million and US$601 million bonds at maturity; and – In October 2022, the Group raised US$600 million in the US dollar market under its SEC Shelf Programme. In 2021, the Group repaid €650 million, £500 million, €1.1 billion, CHF 400 million and €500 million bonds at maturity, and a £1,929 million term loan that had a maturity date in January 2022. BAT Annual Report and Form 20-F 2022 Strategic Report Governance Report Financial Statements Other Information Financial Review Treasury and Cash Flow 104
Also in 2021, the Group issued perpetual hybrid bonds totalling €2 billion. The issuance allowed the Group to raise incremental euro-denominated securities, which contributed to a more efficient alignment of the Group’s earnings currency. It also contributed to the diversification of the Group’s sources of funding and further strengthened its capital structure. The issuance provided the additional benefit of supporting the deleveraging journey with the addition of a small benefit to the credit metrics. Cash Flow Net cash generated from operating activities Net cash generated from operating activities increased by 7.0% to £10,394 million in 2022, compared to a decrease of £69 million to £9,717 million in 2021. In 2022, translational foreign exchange was a tailwind, while it was a headwind in 2021 due to the relative movements of sterling against the Group reporting currencies, notably the US dollar, in those periods. The growth in 2022 was also due to an increase in provisions (partly related to the DOJ and OFAC investigations) and other non-cash items, including depreciation, amortisation and impairment, while payments in respect of litigation were £231 million in 2022, compared to £248 million in 2021. 2021 was also impacted by the timing of MSA payments in the U.S. and higher tax payments (mainly in Canada and the U.S.), compared to 2020. Net cash used in investing activities In 2022, net cash used in investing activities decreased to £705 million (2021: £1,140 million), partly due to a lower net outflow of £129 million from short-term investment products, including treasury bills (2021: £228 million net outflow). 2021 was negatively impacted by the disposal of the Group’s operations in Iran (£98 million) and the purchase of the equity stake in Organigram. Purchases of property, plant and equipment were largely in line with 2021, at £523 million (2021: £527 million). In 2022, the Group invested £630 million in gross capital expenditure, a decrease of 5.0% on the prior year (2021: £664 million). This includes purchases of property, plant and equipment and certain intangibles, and the investment in the Group’s global operational infrastructure (including, but not limited to, the manufacturing network, trade marketing software and IT systems and the expansion of our New Categories portfolio). The Group expects gross capital expenditure in 2023 of £600 million. Net cash used in financing activities Net cash used in financing activities was an outflow of £8,878 million in 2022 (2021: £8,749 million outflow), with the outflow in each year largely driven by: – dividend payments (2022: £4,915 million, up 0.2%; 2021: £4,904 million, up 3.4%). The movement in both years was affected by the higher dividend per share. The marginal increase in 2022 was partially offset by the reduction in number of shares due to the share buy- back programme undertaken in 2022; – purchases of shares under the share buy- back programme in 2022 of £2,012 million and – the net issuance of borrowings (2022: £223 million; 2021: £3,865 million net repayment). In 2021, this was partly due to the issuance of the hybrid bonds totalling £1,685 million. In 2022, interest paid increased 7% to £1,578 million (2021: £1,479 million), driven by higher interest charges as new debt issued replaced cheaper debt on maturity. In 2022, the Group repaid borrowings of £3.0 billion and issued £3.3 billion of new borrowings. The Group repaid borrowings of £4.8 billion in 2021, and issued £1.0 billion of new borrowings and issued perpetual hybrid bonds totalling €2 billion (£1.7 billion). Please refer to note 26 in the Notes on the Accounts for further details. Summary cash flow 2022 £m 2021 £m 2020 £m Cash generated from operating activities 12,537 11,678 11,567 Dividends received from associates 394 353 351 Tax paid (2,537) (2,314) (2,132) Net cash generated from operating activities 10,394 9,717 9,786 Net cash used in investing activities (705) (1,140) (783) Net cash used in financing activities (8,878) (8,749) (7,897) Transferred to held-for-sale (368) — — Differences on exchange 431 (253) (253) (Decrease)/increase in net cash and cash equivalents in the year 874 (425) 853 Cash flow conversion The conversion of profit from operations to net cash generated from operating activities may indicate the Group’s ability to generate cash from the profits earned. Net capital expenditure was marginally lower (2022: £599 million; 2021: £632 million). Based upon net cash generated from operating activities, the Group’s conversion rate was 99% compared to 95% in 2021, which was largely in line with 2020. Restricted cash Cash and cash equivalents include restricted amounts of £1,411 million (2021: £1,024 million) due to subsidiaries in CCAA protection (note 32 in the Notes on the Accounts) as well as £324 million (2021: £305 million) principally due to exchange control restrictions. BAT Annual Report and Form 20-F 2022 Strategic Report Governance Report Financial Statements Other Information 105
Borrowings and Net Debt Total borrowings (which includes lease liabilities) increased to £43,139 million in 2022 (2021: £39,658 million) largely due to the relative movement of sterling against other currencies, particularly the US dollar and the euro. In 2022, this was a headwind of £3,911 million (2021: £409 million tailwind). Total borrowings include £798 million (31 December 2021: £754 million) in respect of the purchase price adjustments related to the acquisition of Reynolds American Inc. As discussed on page 104, the Group remains confident about its ability to access the debt capital markets successfully and reviews its options on a continuing basis. Net debt is a non-GAAP measure and is defined as total borrowings (including related derivatives and lease liabilities) less cash and cash equivalents and current investments held at fair value. Net debt, at 31 December 2022, was £39,281 million (2021: £36,302 million; 2020: £40,241 million), with the movement in net debt largely due to the relative movement of sterling against other currencies, particularly the US dollar and the euro, which was a headwind of £3,030 million in 2022 (2021: £124 million tailwind). Retirement Benefit Schemes The Group’s subsidiary undertakings operate defined benefit schemes, including pension and post-retirement healthcare schemes, and defined contribution schemes. The most significant arrangements are in the U.S., the UK, Canada, Germany, Switzerland and the Netherlands. Together, schemes in these territories account for over 90% of the total underlying obligations of the Group’s defined benefit arrangements and over 70% of the current service cost. Benefits provided through defined contribution schemes are charged as an expense as payments fall due. The liabilities arising in respect of defined benefit schemes are determined in accordance with the advice of independent, professionally qualified actuaries, using the projected unit credit method. It is Group policy that all schemes are formally valued at least every three years. Contributions to the defined benefit schemes are determined after consultation with the respective trustees and actuaries of the individual externally funded schemes, taking into account regulatory environments. The present total value of funded scheme liabilities as at 31 December 2022 was £6,515 million (2021: £10,084 million), while unfunded scheme liabilities amounted to £797 million (2021: £1,037 million). The schemes’ assets decreased to £7,424 million from £10,816 million in 2021, itself a decrease from £12,576 million in 2020. The overall position for all pension and healthcare schemes in Group subsidiaries amounted to a net asset of £51 million at the end of 2022, compared to a net liability of £321 million at the end of 2021, driven by the impact of higher discount rates applied in the U.S. (2022: 5.5%; 2021: 3.0%) and elsewhere, offset by inflation-related experience adjustments and increases in the assumptions for the impact of future inflation on pensions across the Group. In addition, during 2022 and 2021, the risk profiles and values of amounts relating to retirement benefit arrangements were impacted by partial buy-outs in the U.S. and through buy-ins in the UK. Furthermore, in 2021, there was also a buy- in in Canada. Please refer to note 15 in the Notes on the Accounts for further details. Litigation and Settlements As discussed in note 31 in the Notes on the Accounts, various legal proceedings or claims are pending or may be instituted against the Group. Government Activity The marketing, sale, taxation and use of tobacco products have been subject to substantial regulation by government and health officials for many years. For information about the risks related to regulation, see page 118 and pages 348 to 356. BAT Annual Report and Form 20-F 2022 Strategic Report Governance Report Financial Statements Other Information Financial Review Other 106
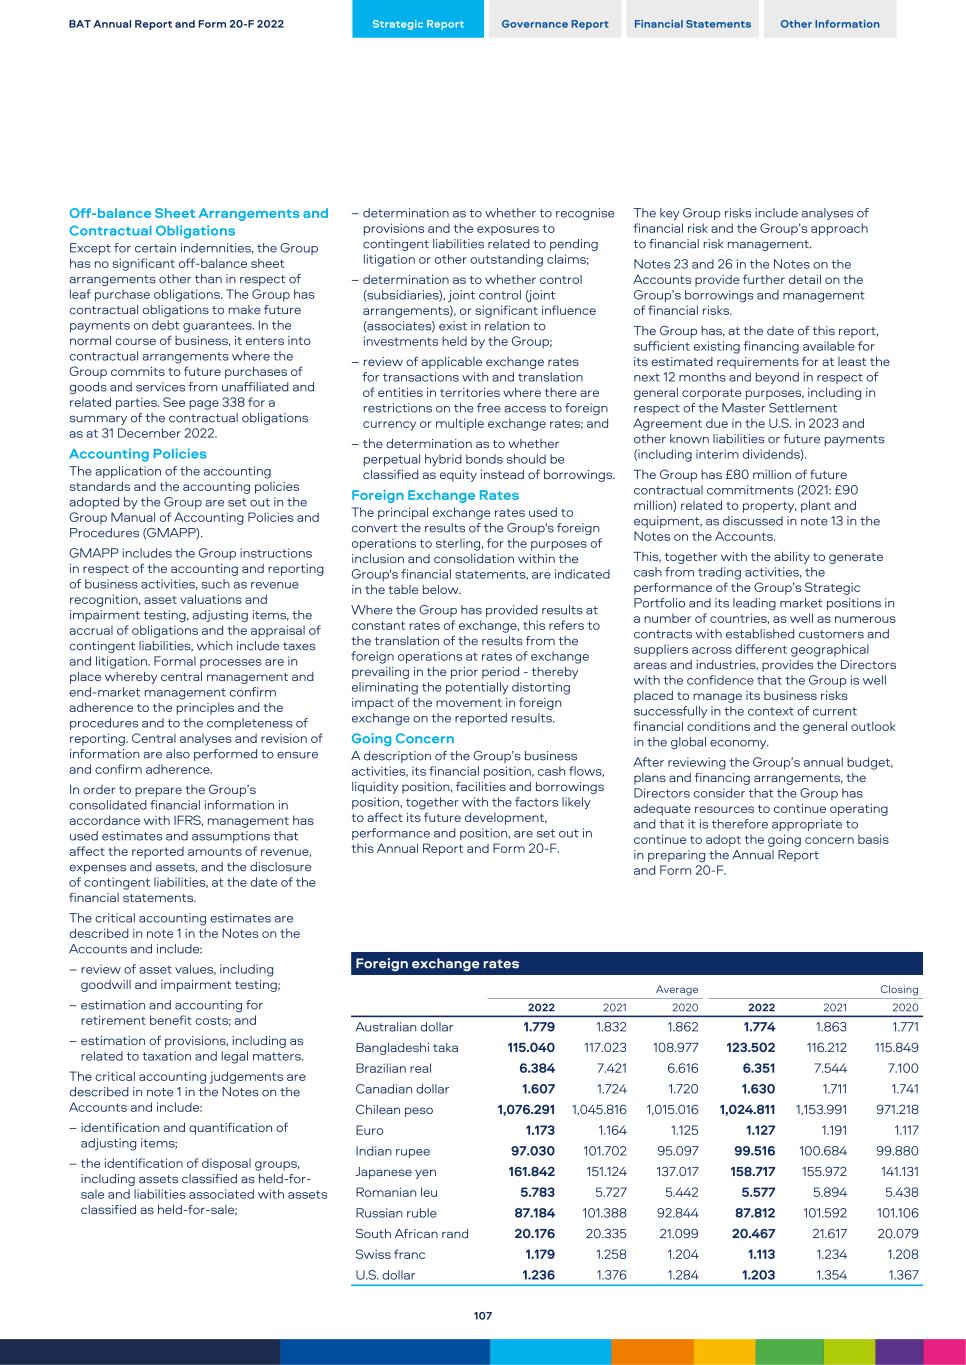
Off-balance Sheet Arrangements and Contractual Obligations Except for certain indemnities, the Group has no significant off-balance sheet arrangements other than in respect of leaf purchase obligations. The Group has contractual obligations to make future payments on debt guarantees. In the normal course of business, it enters into contractual arrangements where the Group commits to future purchases of goods and services from unaffiliated and related parties. See page 338 for a summary of the contractual obligations as at 31 December 2022. Accounting Policies The application of the accounting standards and the accounting policies adopted by the Group are set out in the Group Manual of Accounting Policies and Procedures (GMAPP). GMAPP includes the Group instructions in respect of the accounting and reporting of business activities, such as revenue recognition, asset valuations and impairment testing, adjusting items, the accrual of obligations and the appraisal of contingent liabilities, which include taxes and litigation. Formal processes are in place whereby central management and end-market management confirm adherence to the principles and the procedures and to the completeness of reporting. Central analyses and revision of information are also performed to ensure and confirm adherence. In order to prepare the Group’s consolidated financial information in accordance with IFRS, management has used estimates and assumptions that affect the reported amounts of revenue, expenses and assets, and the disclosure of contingent liabilities, at the date of the financial statements. The critical accounting estimates are described in note 1 in the Notes on the Accounts and include: – review of asset values, including goodwill and impairment testing; – estimation and accounting for retirement benefit costs; and – estimation of provisions, including as related to taxation and legal matters. The critical accounting judgements are described in note 1 in the Notes on the Accounts and include: – identification and quantification of adjusting items; – the identification of disposal groups, including assets classified as held-for- sale and liabilities associated with assets classified as held-for-sale; – determination as to whether to recognise provisions and the exposures to contingent liabilities related to pending litigation or other outstanding claims; – determination as to whether control (subsidiaries), joint control (joint arrangements), or significant influence (associates) exist in relation to investments held by the Group; – review of applicable exchange rates for transactions with and translation of entities in territories where there are restrictions on the free access to foreign currency or multiple exchange rates; and – the determination as to whether perpetual hybrid bonds should be classified as equity instead of borrowings. Foreign Exchange Rates The principal exchange rates used to convert the results of the Group's foreign operations to sterling, for the purposes of inclusion and consolidation within the Group's financial statements, are indicated in the table below. Where the Group has provided results at constant rates of exchange, this refers to the translation of the results from the foreign operations at rates of exchange prevailing in the prior period - thereby eliminating the potentially distorting impact of the movement in foreign exchange on the reported results. Going Concern A description of the Group’s business activities, its financial position, cash flows, liquidity position, facilities and borrowings position, together with the factors likely to affect its future development, performance and position, are set out in this Annual Report and Form 20‑F. Foreign exchange rates Average Closing 2022 2021 2020 2022 2021 2020 Australian dollar 1.779 1.832 1.862 1.774 1.863 1.771 Bangladeshi taka 115.040 117.023 108.977 123.502 116.212 115.849 Brazilian real 6.384 7.421 6.616 6.351 7.544 7.100 Canadian dollar 1.607 1.724 1.720 1.630 1.711 1.741 Chilean peso 1,076.291 1,045.816 1,015.016 1,024.811 1,153.991 971.218 Euro 1.173 1.164 1.125 1.127 1.191 1.117 Indian rupee 97.030 101.702 95.097 99.516 100.684 99.880 Japanese yen 161.842 151.124 137.017 158.717 155.972 141.131 Romanian leu 5.783 5.727 5.442 5.577 5.894 5.438 Russian ruble 87.184 101.388 92.844 87.812 101.592 101.106 South African rand 20.176 20.335 21.099 20.467 21.617 20.079 Swiss franc 1.179 1.258 1.204 1.113 1.234 1.208 U.S. dollar 1.236 1.376 1.284 1.203 1.354 1.367 The key Group risks include analyses of financial risk and the Group’s approach to financial risk management. Notes 23 and 26 in the Notes on the Accounts provide further detail on the Group’s borrowings and management of financial risks. The Group has, at the date of this report, sufficient existing financing available for its estimated requirements for at least the next 12 months and beyond in respect of general corporate purposes, including in respect of the Master Settlement Agreement due in the U.S. in 2023 and other known liabilities or future payments (including interim dividends). The Group has £80 million of future contractual commitments (2021: £90 million) related to property, plant and equipment, as discussed in note 13 in the Notes on the Accounts. This, together with the ability to generate cash from trading activities, the performance of the Group’s Strategic Portfolio and its leading market positions in a number of countries, as well as numerous contracts with established customers and suppliers across different geographical areas and industries, provides the Directors with the confidence that the Group is well placed to manage its business risks successfully in the context of current financial conditions and the general outlook in the global economy. After reviewing the Group’s annual budget, plans and financing arrangements, the Directors consider that the Group has adequate resources to continue operating and that it is therefore appropriate to continue to adopt the going concern basis in preparing the Annual Report and Form 20‑F. BAT Annual Report and Form 20-F 2022 Strategic Report Governance Report Financial Statements Other Information 107
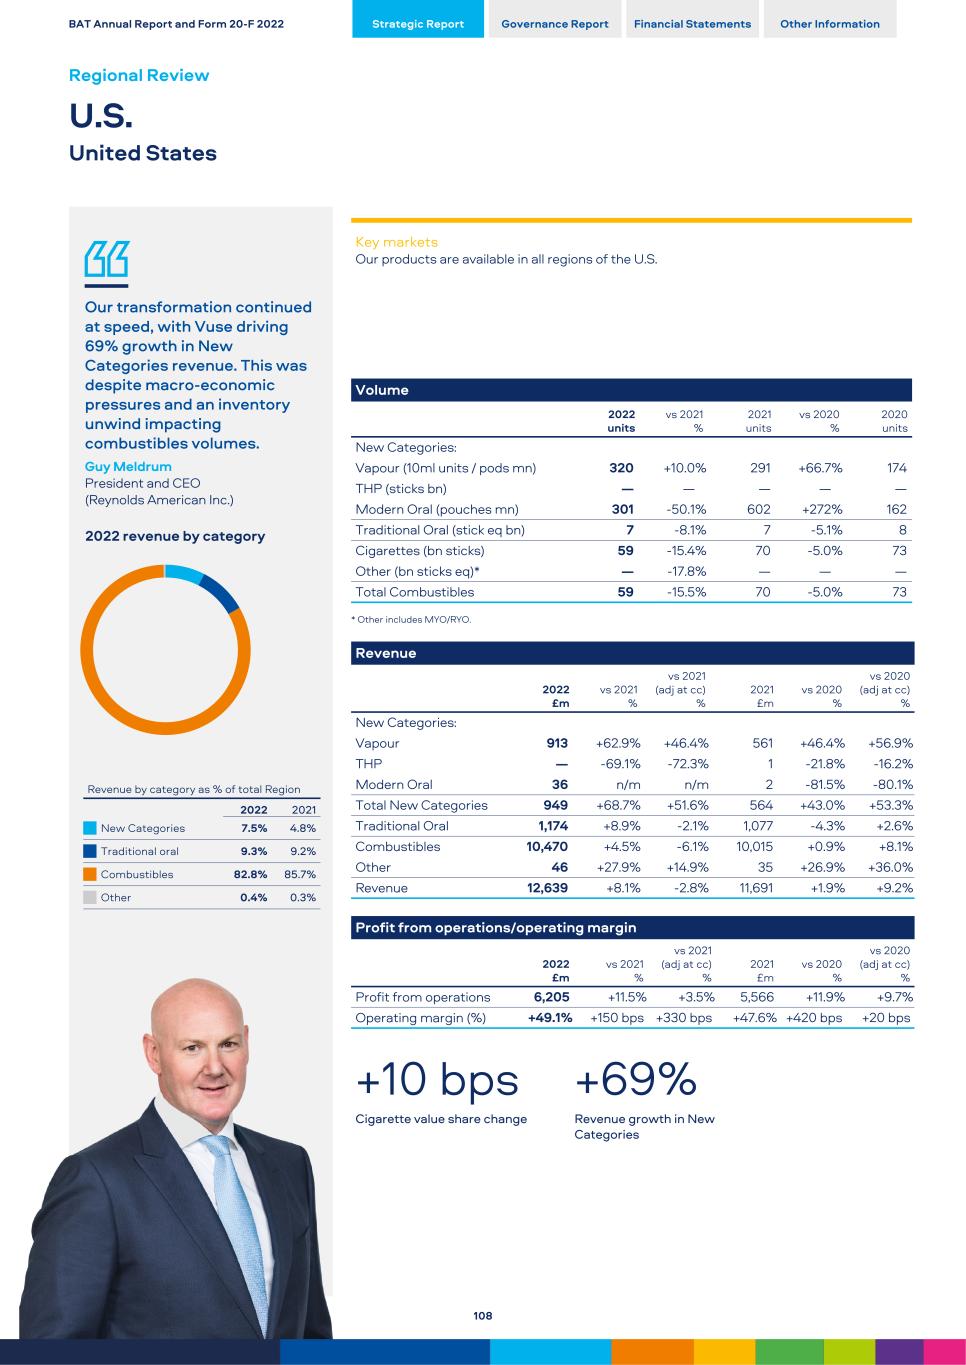
Our transformation continued at speed, with Vuse driving 69% growth in New Categories revenue. This was despite macro-economic pressures and an inventory unwind impacting combustibles volumes. Guy Meldrum President and CEO (Reynolds American Inc.) 2022 revenue by category Revenue by category as % of total Region 2022 2021 New Categories 7.5% 4.8% Traditional oral 9.3% 9.2% Combustibles 82.8% 85.7% Other 0.4% 0.3% Key markets Our products are available in all regions of the U.S. Volume 2022 units vs 2021 % 2021 units vs 2020 % 2020 units New Categories: Vapour (10ml units / pods mn) 320 +10.0 % 291 +66.7 % 174 THP (sticks bn) — — — — — Modern Oral (pouches mn) 301 -50.1 % 602 +272 % 162 Traditional Oral (stick eq bn) 7 -8.1 % 7 -5.1 % 8 Cigarettes (bn sticks) 59 -15.4 % 70 -5.0 % 73 Other (bn sticks eq)* — -17.8 % — — — Total Combustibles 59 -15.5 % 70 -5.0 % 73 * Other includes MYO/RYO. Revenue 2022 £m vs 2021 % vs 2021 (adj at cc) % 2021 £m vs 2020 % vs 2020 (adj at cc) % New Categories: Vapour 913 +62.9 % +46.4 % 561 +46.4 % +56.9 % THP — -69.1 % -72.3 % 1 -21.8 % -16.2 % Modern Oral 36 n/m n/m 2 -81.5 % -80.1 % Total New Categories 949 +68.7 % +51.6 % 564 +43.0 % +53.3 % Traditional Oral 1,174 +8.9 % -2.1 % 1,077 -4.3 % +2.6 % Combustibles 10,470 +4.5 % -6.1 % 10,015 +0.9 % +8.1 % Other 46 +27.9 % +14.9 % 35 +26.9 % +36.0 % Revenue 12,639 +8.1 % -2.8 % 11,691 +1.9 % +9.2 % Profit from operations/operating margin 2022 £m vs 2021 % vs 2021 (adj at cc) % 2021 £m vs 2020 % vs 2020 (adj at cc) % Profit from operations 6,205 +11.5 % +3.5 % 5,566 +11.9 % +9.7 % Operating margin (%) +49.1 % +150 bps +330 bps +47.6 % +420 bps +20 bps +10 bps +69% Cigarette value share change Revenue growth in New Categories BAT Annual Report and Form 20-F 2022 Strategic Report Governance Report Financial Statements Other Information Regional Review U.S. United States 108
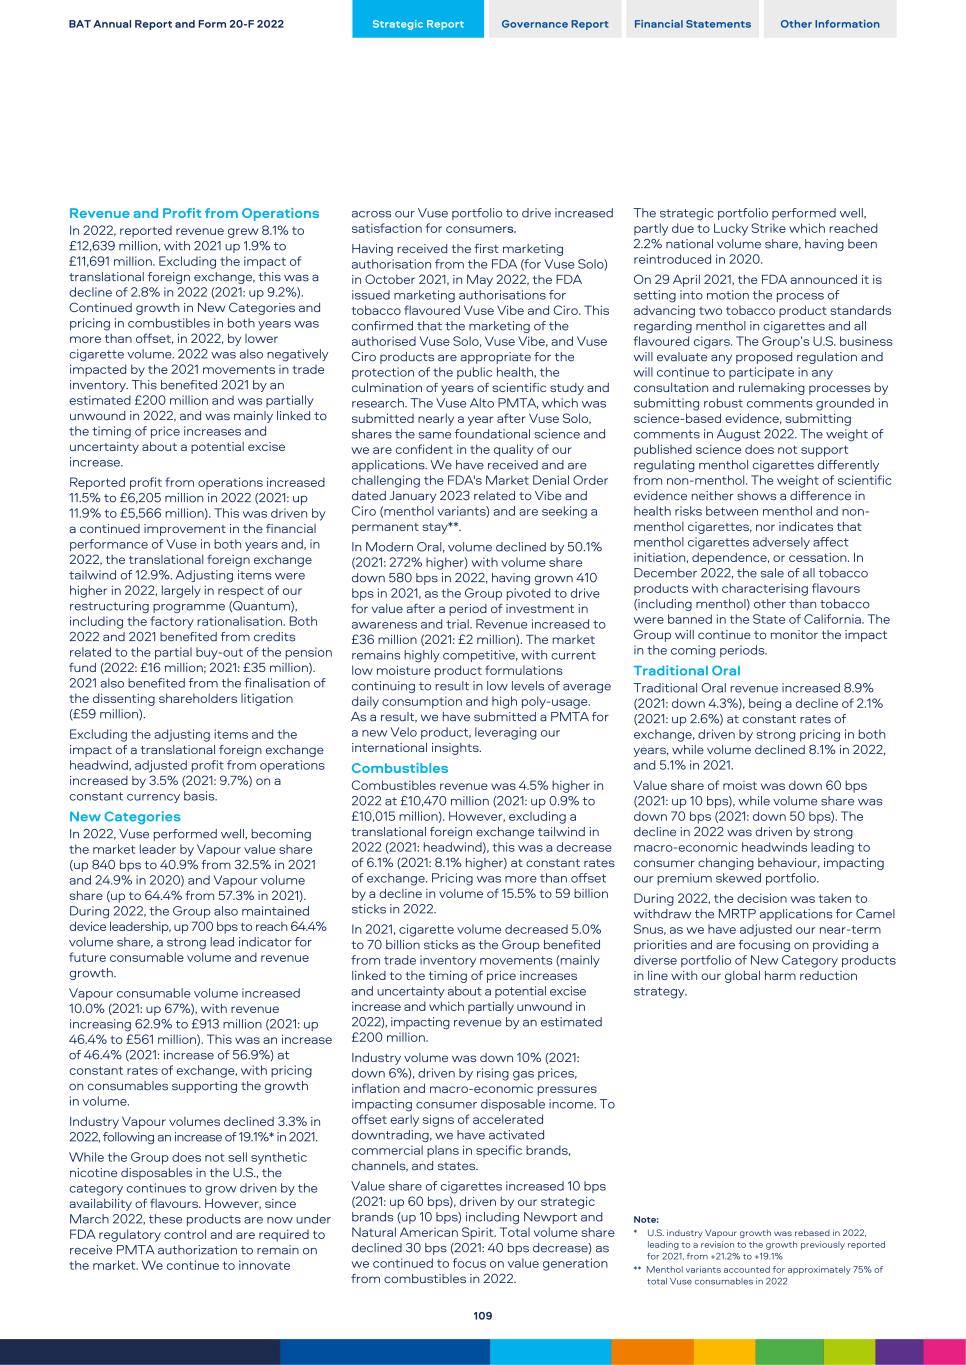
Revenue and Profit from Operations In 2022, reported revenue grew 8.1% to £12,639 million, with 2021 up 1.9% to £11,691 million. Excluding the impact of translational foreign exchange, this was a decline of 2.8% in 2022 (2021: up 9.2%). Continued growth in New Categories and pricing in combustibles in both years was more than offset, in 2022, by lower cigarette volume. 2022 was also negatively impacted by the 2021 movements in trade inventory. This benefited 2021 by an estimated £200 million and was partially unwound in 2022, and was mainly linked to the timing of price increases and uncertainty about a potential excise increase. Reported profit from operations increased 11.5% to £6,205 million in 2022 (2021: up 11.9% to £5,566 million). This was driven by a continued improvement in the financial performance of Vuse in both years and, in 2022, the translational foreign exchange tailwind of 12.9%. Adjusting items were higher in 2022, largely in respect of our restructuring programme (Quantum), including the factory rationalisation. Both 2022 and 2021 benefited from credits related to the partial buy-out of the pension fund (2022: £16 million; 2021: £35 million). 2021 also benefited from the finalisation of the dissenting shareholders litigation (£59 million). Excluding the adjusting items and the impact of a translational foreign exchange headwind, adjusted profit from operations increased by 3.5% (2021: 9.7%) on a constant currency basis. New Categories In 2022, Vuse performed well, becoming the market leader by Vapour value share (up 840 bps to 40.9% from 32.5% in 2021 and 24.9% in 2020) and Vapour volume share (up to 64.4% from 57.3% in 2021). During 2022, the Group also maintained device leadership, up 700 bps to reach 64.4% volume share, a strong lead indicator for future consumable volume and revenue growth. Vapour consumable volume increased 10.0% (2021: up 67%), with revenue increasing 62.9% to £913 million (2021: up 46.4% to £561 million). This was an increase of 46.4% (2021: increase of 56.9%) at constant rates of exchange, with pricing on consumables supporting the growth in volume. Industry Vapour volumes declined 3.3% in 2022, following an increase of 19.1%* in 2021. While the Group does not sell synthetic nicotine disposables in the U.S., the category continues to grow driven by the availability of flavours. However, since March 2022, these products are now under FDA regulatory control and are required to receive PMTA authorization to remain on the market. We continue to innovate across our Vuse portfolio to drive increased satisfaction for consumers. Having received the first marketing authorisation from the FDA (for Vuse Solo) in October 2021, in May 2022, the FDA issued marketing authorisations for tobacco flavoured Vuse Vibe and Ciro. This confirmed that the marketing of the authorised Vuse Solo, Vuse Vibe, and Vuse Ciro products are appropriate for the protection of the public health, the culmination of years of scientific study and research. The Vuse Alto PMTA, which was submitted nearly a year after Vuse Solo, shares the same foundational science and we are confident in the quality of our applications. We have received and are challenging the FDA's Market Denial Order dated January 2023 related to Vibe and Ciro (menthol variants) and are seeking a permanent stay**. In Modern Oral, volume declined by 50.1% (2021: 272% higher) with volume share down 580 bps in 2022, having grown 410 bps in 2021, as the Group pivoted to drive for value after a period of investment in awareness and trial. Revenue increased to £36 million (2021: £2 million). The market remains highly competitive, with current low moisture product formulations continuing to result in low levels of average daily consumption and high poly-usage. As a result, we have submitted a PMTA for a new Velo product, leveraging our international insights. Combustibles Combustibles revenue was 4.5% higher in 2022 at £10,470 million (2021: up 0.9% to £10,015 million). However, excluding a translational foreign exchange tailwind in 2022 (2021: headwind), this was a decrease of 6.1% (2021: 8.1% higher) at constant rates of exchange. Pricing was more than offset by a decline in volume of 15.5% to 59 billion sticks in 2022. In 2021, cigarette volume decreased 5.0% to 70 billion sticks as the Group benefited from trade inventory movements (mainly linked to the timing of price increases and uncertainty about a potential excise increase and which partially unwound in 2022), impacting revenue by an estimated £200 million. Industry volume was down 10% (2021: down 6%), driven by rising gas prices, inflation and macro-economic pressures impacting consumer disposable income. To offset early signs of accelerated downtrading, we have activated commercial plans in specific brands, channels, and states. Value share of cigarettes increased 10 bps (2021: up 60 bps), driven by our strategic brands (up 10 bps) including Newport and Natural American Spirit. Total volume share declined 30 bps (2021: 40 bps decrease) as we continued to focus on value generation from combustibles in 2022. The strategic portfolio performed well, partly due to Lucky Strike which reached 2.2% national volume share, having been reintroduced in 2020. On 29 April 2021, the FDA announced it is setting into motion the process of advancing two tobacco product standards regarding menthol in cigarettes and all flavoured cigars. The Group’s U.S. business will evaluate any proposed regulation and will continue to participate in any consultation and rulemaking processes by submitting robust comments grounded in science-based evidence, submitting comments in August 2022. The weight of published science does not support regulating menthol cigarettes differently from non-menthol. The weight of scientific evidence neither shows a difference in health risks between menthol and non- menthol cigarettes, nor indicates that menthol cigarettes adversely affect initiation, dependence, or cessation. In December 2022, the sale of all tobacco products with characterising flavours (including menthol) other than tobacco were banned in the State of California. The Group will continue to monitor the impact in the coming periods. Traditional Oral Traditional Oral revenue increased 8.9% (2021: down 4.3%), being a decline of 2.1% (2021: up 2.6%) at constant rates of exchange, driven by strong pricing in both years, while volume declined 8.1% in 2022, and 5.1% in 2021. Value share of moist was down 60 bps (2021: up 10 bps), while volume share was down 70 bps (2021: down 50 bps). The decline in 2022 was driven by strong macro-economic headwinds leading to consumer changing behaviour, impacting our premium skewed portfolio. During 2022, the decision was taken to withdraw the MRTP applications for Camel Snus, as we have adjusted our near-term priorities and are focusing on providing a diverse portfolio of New Category products in line with our global harm reduction strategy. Note: * U.S. industry Vapour growth was rebased in 2022, leading to a revision to the growth previously reported for 2021, from +21.2% to +19.1% ** Menthol variants accounted for approximately 75% of total Vuse consumables in 2022 BAT Annual Report and Form 20-F 2022 Strategic Report Governance Report Financial Statements Other Information 109
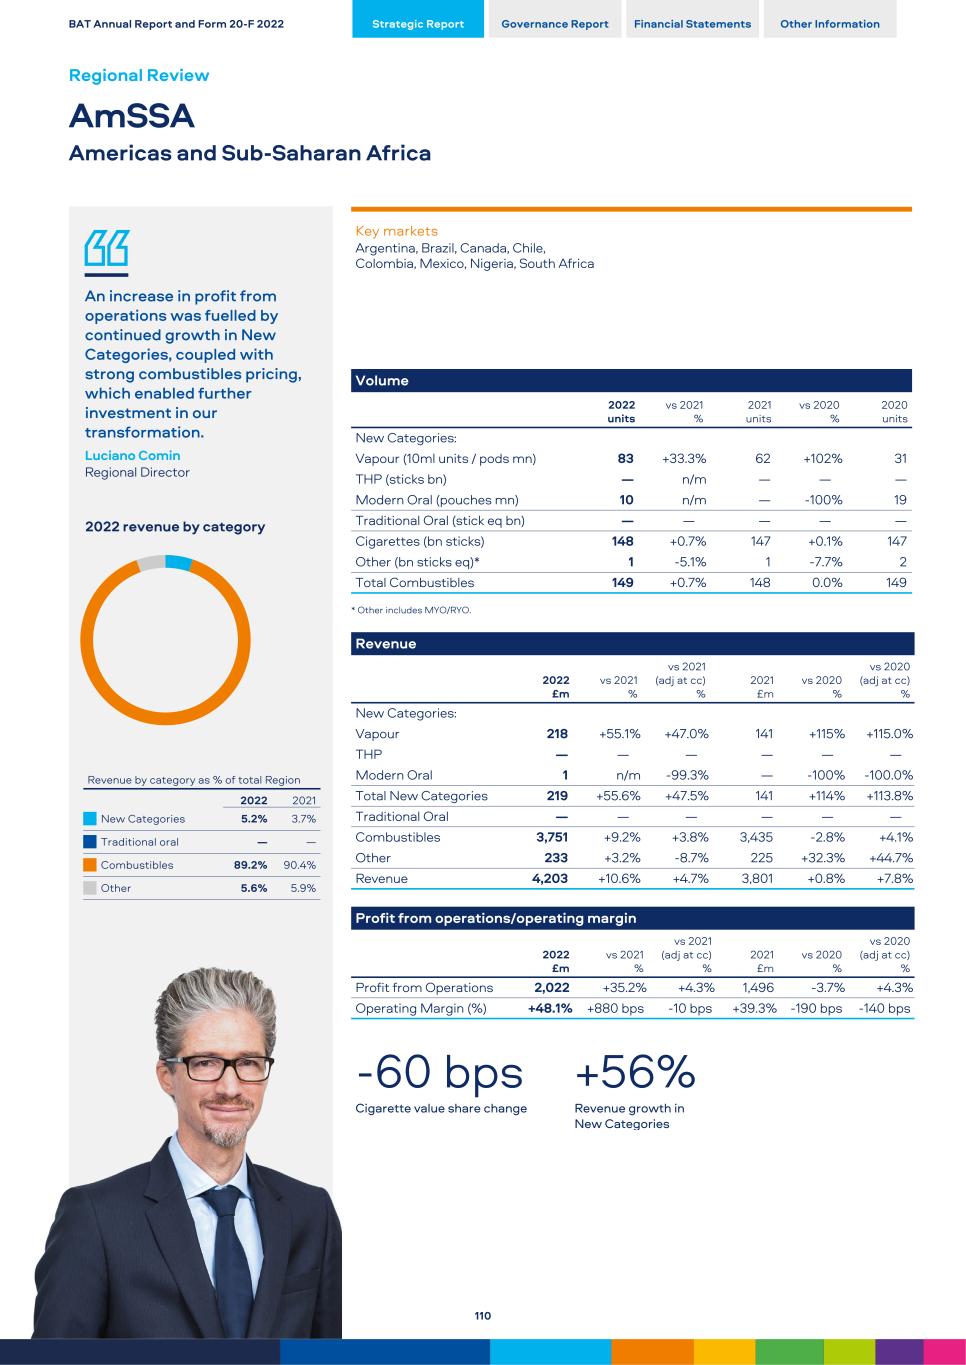
An increase in profit from operations was fuelled by continued growth in New Categories, coupled with strong combustibles pricing, which enabled further investment in our transformation. Luciano Comin Regional Director 2022 revenue by category Revenue by category as % of total Region 2022 2021 New Categories 5.2% 3.7% Traditional oral — — Combustibles 89.2% 90.4% Other 5.6% 5.9% Key markets Argentina, Brazil, Canada, Chile, Colombia, Mexico, Nigeria, South Africa Volume 2022 units vs 2021 % 2021 units vs 2020 % 2020 units New Categories: Vapour (10ml units / pods mn) 83 +33.3 % 62 +102 % 31 THP (sticks bn) — n/m — — — Modern Oral (pouches mn) 10 n/m — -100 % 19 Traditional Oral (stick eq bn) — — — — — Cigarettes (bn sticks) 148 +0.7 % 147 +0.1 % 147 Other (bn sticks eq)* 1 -5.1 % 1 -7.7 % 2 Total Combustibles 149 +0.7 % 148 0.0 % 149 * Other includes MYO/RYO. Revenue 2022 £m vs 2021 % vs 2021 (adj at cc) % 2021 £m vs 2020 % vs 2020 (adj at cc) % New Categories: Vapour 218 +55.1 % +47.0 % 141 +115 % +115.0 % THP — — — — — — Modern Oral 1 n/m -99.3 % — -100 % -100.0 % Total New Categories 219 +55.6 % +47.5 % 141 +114 % +113.8 % Traditional Oral — — — — — — Combustibles 3,751 +9.2 % +3.8 % 3,435 -2.8 % +4.1 % Other 233 +3.2 % -8.7 % 225 +32.3 % +44.7 % Revenue 4,203 +10.6 % +4.7 % 3,801 +0.8 % +7.8 % Profit from operations/operating margin 2022 £m vs 2021 % vs 2021 (adj at cc) % 2021 £m vs 2020 % vs 2020 (adj at cc) % Profit from Operations 2,022 +35.2 % +4.3 % 1,496 -3.7 % +4.3 % Operating Margin (%) +48.1 % +880 bps -10 bps +39.3 % -190 bps -140 bps -60 bps +56% Cigarette value share change Revenue growth in New Categories BAT Annual Report and Form 20-F 2022 Strategic Report Governance Report Financial Statements Other Information Regional Review AmSSA Americas and Sub-Saharan Africa 110
Revenue and Profit from Operations In 2022, reported revenue increased 10.6% to £4,203 million (2021: 0.8% increased to £3,801 million). Excluding the translational tailwind (2021: headwind), on a constant currency basis, revenue grew by 4.7% in 2022 (2021: increase of 7.8%), driven by combustibles pricing and growth in New Categories in both years. The reported results are impacted by translational foreign exchange due to the relative movement of sterling against a number of currencies, particularly the Brazilian real, Argentinian peso, Nigerian naira and Kenyan shilling. Reported profit from operations increased 35.2% to £2,022 million, mainly due to the recognition (in the second half of 2022) of £460 million in Brazil in relation to the calculation of VAT on social contributions in prior periods (as the Group's litigation was successfully concluded in the year). This was partly offset by a charge of £79 million (related to the conclusion of the investigation into alleged violations of the Nigerian Competition and Consumer Protection Act and National Tobacco Control Act). In 2021, reported profit from operations declined by 3.7% to £1,496 million, partly due to the recognition of a £54 million charge related to goodwill in Peru and by the impact of translational foreign exchange on our reported results. Excluding the adjusting items (largely related to credit of the VAT on social contributions in Brazil and charges in respect of the Nigerian investigation in 2022, Peru in 2021 and Quantum in both periods) and the impact of foreign exchange in both periods, adjusted profit from operations increased 4.3% (2021: increase of 4.3%) on a constant currency basis, largely driven by the growth in revenue. New Categories In 2022, New Categories revenue grew 56% to £219 million (2021: up 114% to £141 million) driven by the growth of Vapour (notably in Canada and South Africa) in both years. In Canada, Vuse consolidated its leadership position with total value share up 8.9 ppts in 2022 (to 89.5%), having grown 34.3 ppts in 2021. This was driven by the launch of the Group's first connected Vapour device (Vuse ePod2+). In Kenya, after the category was reinstated as regulated under the Tobacco Control Act, we reintroduced Velo to a limited retail universe with positive early momentum, as we focus on driving guided trial. In South Africa, we have expanded our pilot in Johannesburg, with guided trial and expansion into key accounts, delivering encouraging early results. We continue to believe that Modern Oral represents an exciting opportunity to offer affordable New Category alternatives* to adult nicotine consumers in emerging markets, given the absence of an electronic device and a pre-existing ritual of oral product consumption in a number of markets. Combustibles Combustibles revenue increased 9.2% to £3,751 million (2021: 2.8% decrease to £3,435 million). Excluding a translational foreign exchange tailwind in 2022 (2021: headwind) revenue, on a constant currency basis, was up 3.8% in 2022 and 4.1% in 2021. Combustibles pricing was strong in both years. An improvement in mix in 2022 was supported by marginally higher combustibles volume (up 0.7% in 2022 to 149 billion sticks), as volume benefited from a reduction in illicit trade in Brazil. This is in comparison to 2021 where regional revenue fell, partly due to a negative mix as volume recovered from the impact of COVID-19 in a number of markets including in South Africa (impacted by the sales suspension in 2020, with the market still recovering from the growth in illicit trade in 2020) and Colombia. In 2021, combustible volume in AmSSA was flat compared to 2020. Value share declined 60 bps driven by Canada, Brazil, Mexico and South Africa. This compared to a decline in 2021 of 70 bps. Note: * Based on the weight of evidence and assuming a complete switch from cigarette smoking. These products are not risk free and are addictive. BAT Annual Report and Form 20-F 2022 Strategic Report Governance Report Financial Statements Other Information 111
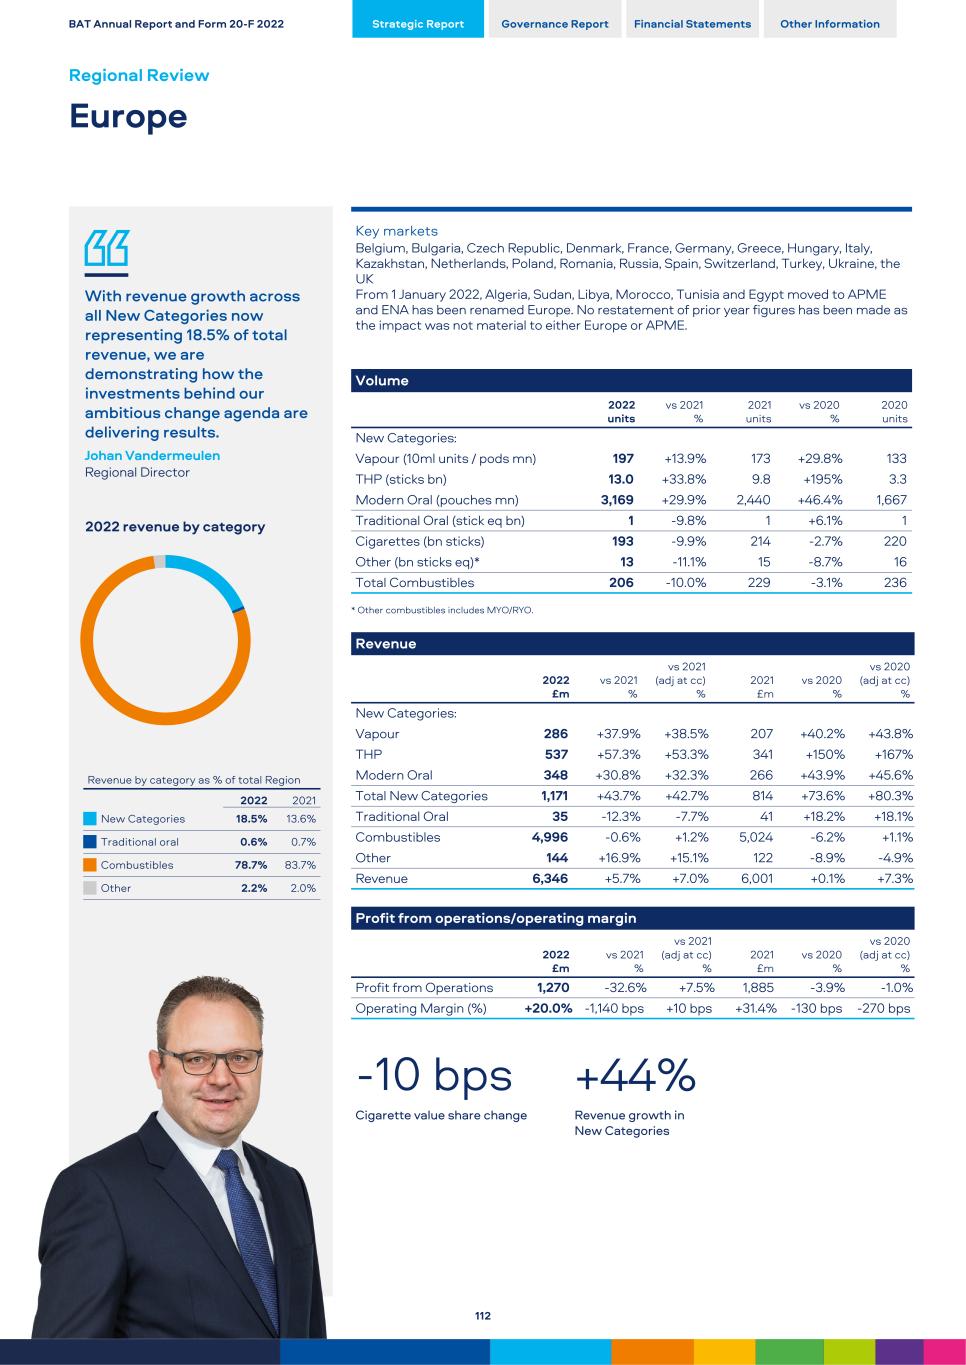
With revenue growth across all New Categories now representing 18.5% of total revenue, we are demonstrating how the investments behind our ambitious change agenda are delivering results. Johan Vandermeulen Regional Director 2022 revenue by category Revenue by category as % of total Region 2022 2021 New Categories 18.5% 13.6% Traditional oral 0.6% 0.7% Combustibles 78.7% 83.7% Other 2.2% 2.0% Key markets Belgium, Bulgaria, Czech Republic, Denmark, France, Germany, Greece, Hungary, Italy, Kazakhstan, Netherlands, Poland, Romania, Russia, Spain, Switzerland, Turkey, Ukraine, the UK From 1 January 2022, Algeria, Sudan, Libya, Morocco, Tunisia and Egypt moved to APME and ENA has been renamed Europe. No restatement of prior year figures has been made as the impact was not material to either Europe or APME. Volume 2022 units vs 2021 % 2021 units vs 2020 % 2020 units New Categories: Vapour (10ml units / pods mn) 197 +13.9 % 173 +29.8 % 133 THP (sticks bn) 13.0 +33.8 % 9.8 +195 % 3.3 Modern Oral (pouches mn) 3,169 +29.9 % 2,440 +46.4 % 1,667 Traditional Oral (stick eq bn) 1 -9.8 % 1 +6.1 % 1 Cigarettes (bn sticks) 193 -9.9 % 214 -2.7 % 220 Other (bn sticks eq)* 13 -11.1 % 15 -8.7 % 16 Total Combustibles 206 -10.0 % 229 -3.1 % 236 * Other combustibles includes MYO/RYO. Revenue 2022 £m vs 2021 % vs 2021 (adj at cc) % 2021 £m vs 2020 % vs 2020 (adj at cc) % New Categories: Vapour 286 +37.9 % +38.5 % 207 +40.2 % +43.8 % THP 537 +57.3 % +53.3 % 341 +150 % +167 % Modern Oral 348 +30.8 % +32.3 % 266 +43.9 % +45.6 % Total New Categories 1,171 +43.7 % +42.7 % 814 +73.6 % +80.3 % Traditional Oral 35 -12.3 % -7.7 % 41 +18.2 % +18.1 % Combustibles 4,996 -0.6 % +1.2 % 5,024 -6.2 % +1.1 % Other 144 +16.9 % +15.1 % 122 -8.9 % -4.9 % Revenue 6,346 +5.7 % +7.0 % 6,001 +0.1 % +7.3 % Profit from operations/operating margin 2022 £m vs 2021 % vs 2021 (adj at cc) % 2021 £m vs 2020 % vs 2020 (adj at cc) % Profit from Operations 1,270 -32.6 % +7.5 % 1,885 -3.9 % -1.0 % Operating Margin (%) +20.0 % -1,140 bps +10 bps +31.4 % -130 bps -270 bps -10 bps +44% Cigarette value share change Revenue growth in New Categories BAT Annual Report and Form 20-F 2022 Strategic Report Governance Report Financial Statements Other Information Regional Review Europe 112
Revenue and Profit from Operations Reported revenue in 2022 was 5.7% higher than 2021 (2021: up 0.1%) driven by pricing in combustibles and the continued growth in New Categories revenue (2022: up 44%, 2021: up 74%). This was, in 2022, partly offset by lower combustible volume (down 10.0% in 2022 (impacted by the regional re- allocation of North Africa to APME) and 3.1% lower in 2021). While translational foreign exchange was a marginal headwind in 2022 of 1.3%, in 2021 it was a headwind of 7.2%. Excluding the impact of currency, revenue grew 7.0% on an adjusted constant rates basis (2021: up 7.3%), driven by higher revenue in Romania, Poland, Italy and the Czech Republic. Reported profit from operations declined by 32.6% to £1,270 million, largely due to the charges recognised in respect of the proposed transfer of the Group's operations in Russia and Belarus (which have been classified as held-for-sale at 31 December 2022, with an associated charge of £612 million in the period) and charges related to Quantum and the factory rationalisation programme. In 2021, reported profit from operations decreased 3.9% to £1,885 million, as the strong New Category revenue growth, in combination with tight control of overheads and Quantum cost savings, were more than offset by incremental investment in New Categories and foreign exchange headwinds (2020: up 19%). Excluding the impact of currency and adjusting items (in respect of Russia and Belarus, Quantum and the factory rationalisation programme), adjusted profit from operations at constant rates was up 7.5% in 2022 (2021: down 1.0%) driven by the performance of New Categories, together with tight control of overheads and Quantum cost savings. The decline in 2021 was largely driven by the net investment in New Categories in that year. New Categories In 2022, revenue from Vapour was up 37.9% reflecting volume growth (up 13.9%) and pricing. In 2021, revenue from Vapour was 40.2% higher as volume grew 29.8%, driven by an increase in industry volume and higher consumables pricing. However, the growth of the disposable segment in 2022 has impacted our value share of total Vapour across a number of markets. For example: – In France, we maintained value share leadership despite a decline of 6.3 ppts to 38.8%; – In Germany, we also maintained value share leadership despite a decline of 37.9 ppts to 21.4%; and – In the UK, having been value share leader in previous periods, Vuse's value share declined 14.7 ppts to 14.8%, but stabilised in the final quarter post Vuse Go launch (May 2022) . We rapidly rolled out our new modern disposable product, Vuse Go, over the second half through our broad distribution footprint and consumer reach in multiple markets including the UK, France, Spain, Germany, Greece and Ireland. In 2022, Vuse won the Gold award at the Transform Awards Europe 2022 for "Best Use of Sustainable Packaging", as well as the SEAL business sustainability award. In 2022, THP volume grew by 33.8% (2021: up 195%), with revenue 57.3% higher at £537 million (2021: up 150% to £341 million). The region now represents over 54% of our global THP volume (or 43% excluding Russia) and 51% of our global THP revenue (or 41% excluding Russia). glo continued to grow category volume share across all key European markets, with aggregate category volume share in key THP markets reaching 20.2%, up 380 bps on 2021. Excluding Russia, our aggregate share of the category reached 18.7% up 470 bps. Driven by Hyper, glo performed well across the top European markets: – Poland (up 14.4 ppts to 31.2%); – Italy (up 170 bps to 14.5%); – Greece (up 470 bps to 13.2%); and – Hungary (up 740 bps to 14.4%). Hyper also continued to make good progress in Kazakhstan, the Czech Republic and across other smaller European launch markets. In the final quarter of 2022, we launched the new Hyper X2 device in our THP markets with encouraging early results. In 2022, Modern Oral revenue grew 30.8% (2021: up 43.9%), led by 29.9% volume growth (2021: 46.4% increase). We remain the clear market leaders (by volume share) in 15 Modern Oral markets. From a high base, volume share was marginally lower at 68.8%, down 60 bps. As the Modern Oral category continues to grow and become more established in Europe, we continue to see strong growth in average daily consumption, including in Sweden which reached 11 pouches (per consumer) in November 2022***. Specifically in respect of the key markets: – In Sweden, where Modern Oral has grown to represent 19.0% of the total oral category, our volume share of the Modern Oral category was 58.1%, a decrease of 170 bps on 2021, impacted by heavy competitor discounting, with volume share stabilising in the final quarter; – In Norway, where Modern Oral now represents 33.5% of the total oral category, we maintained our leadership position with volume share of the Modern Oral reaching 64.1%, up 20 bps vs 2021; – In Denmark (with volume share marginally lower than 2021, down 40 bps at 92.2%) and in Switzerland (volume share up 160 bps to 93.2%), we maintained our volume share leadership position in the Modern Oral category from a high base; and – In the UK, we gained market leadership with volume share reaching 51.6%, an increase of 2,220 bps from 29.4% in 2021. Combustibles In 2022, revenue was 0.6% lower, compared to a decline of 6.2% in 2021. Good price/mix in both years (of 11.2% in 2022 and 4.2% in 2021) was offset by the impact of lower combustible volume, down 10.0% in 2022 and 3.1% in 2021. In both years revenue was impacted by the foreign exchange headwind described earlier. At constant rates of exchange, revenue increased 1.2% (2021: 1.1%). The decrease in combustible volume in 2022 was driven by the move of the North African markets to APME and lower volume in Turkey, Germany, Denmark and France. The decrease in combustible volume in 2021 was driven by lower volume in Ukraine, Russia and Kazakhstan, in part due to industry contraction in those markets. Cigarette value share was down 10 bps in 2022, while 2021 was down 20 bps. Cigarette volume share declined 20 bps (2021: down 30 bps) with volume share up in Spain, the UK, Denmark, France and the Ukraine, which was more than offset by reductions in Russia, Poland, Romania, Germany, Hungary, Italy, the Netherlands, Switzerland, Greece and Belgium. Note: *** Source: Kantar New Category Tracker. BAT Annual Report and Form 20-F 2022 Strategic Report Governance Report Financial Statements Other Information 113
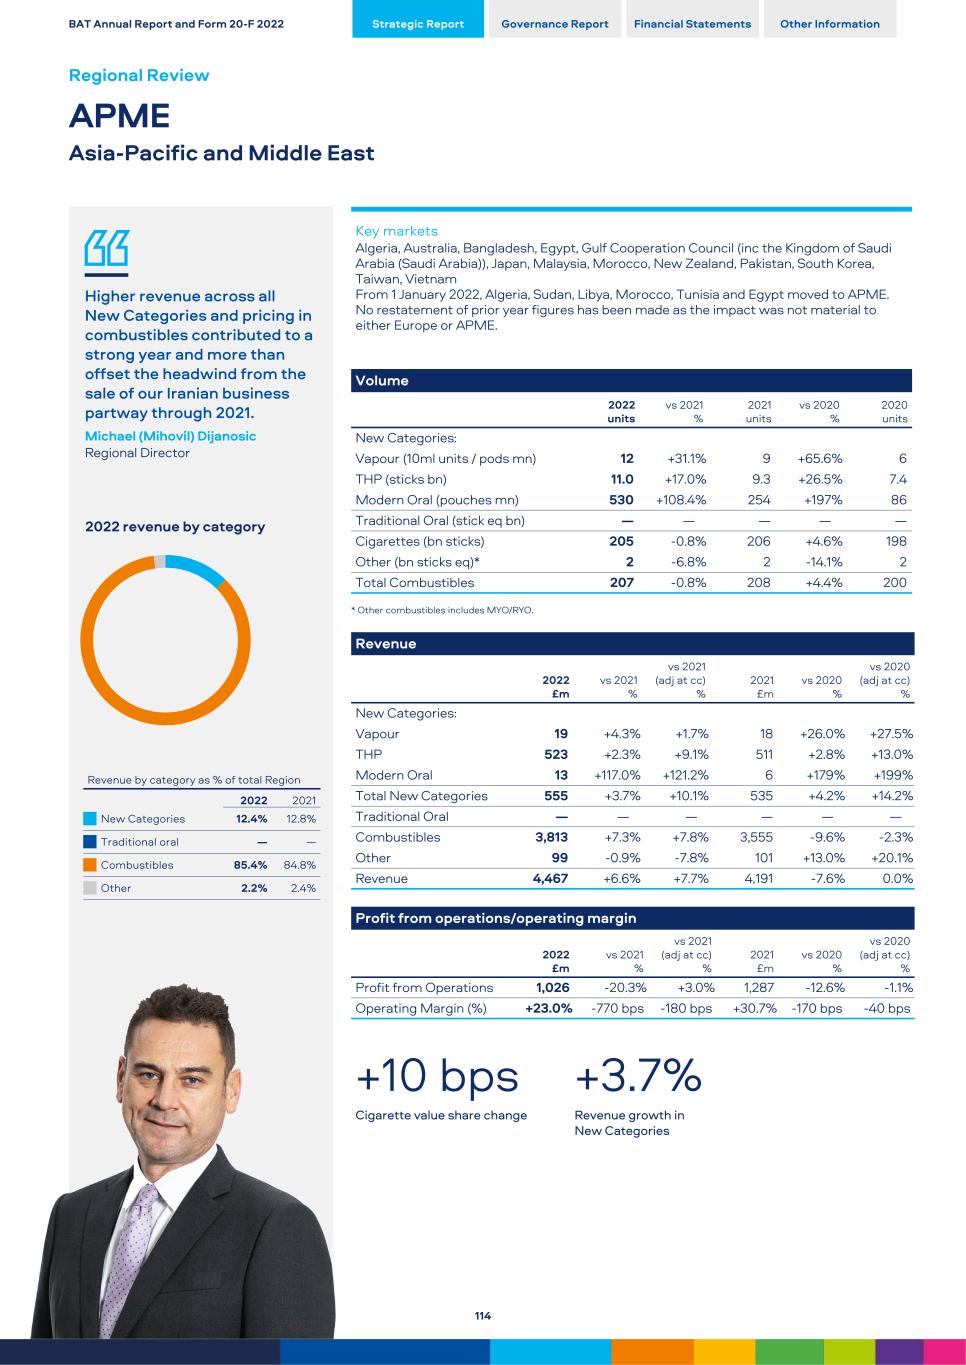
Higher revenue across all New Categories and pricing in combustibles contributed to a strong year and more than offset the headwind from the sale of our Iranian business partway through 2021. Michael (Mihovil) Dijanosic Regional Director 2022 revenue by category Revenue by category as % of total Region 2022 2021 New Categories 12.4% 12.8% Traditional oral — — Combustibles 85.4% 84.8% Other 2.2% 2.4% Key markets Algeria, Australia, Bangladesh, Egypt, Gulf Cooperation Council (inc the Kingdom of Saudi Arabia (Saudi Arabia)), Japan, Malaysia, Morocco, New Zealand, Pakistan, South Korea, Taiwan, Vietnam From 1 January 2022, Algeria, Sudan, Libya, Morocco, Tunisia and Egypt moved to APME. No restatement of prior year figures has been made as the impact was not material to either Europe or APME. Volume 2022 units vs 2021 % 2021 units vs 2020 % 2020 units New Categories: Vapour (10ml units / pods mn) 12 +31.1 % 9 +65.6 % 6 THP (sticks bn) 11.0 +17.0 % 9.3 +26.5 % 7.4 Modern Oral (pouches mn) 530 +108.4 % 254 +197 % 86 Traditional Oral (stick eq bn) — — — — — Cigarettes (bn sticks) 205 -0.8 % 206 +4.6 % 198 Other (bn sticks eq)* 2 -6.8 % 2 -14.1 % 2 Total Combustibles 207 -0.8 % 208 +4.4 % 200 * Other combustibles includes MYO/RYO. Revenue 2022 £m vs 2021 % vs 2021 (adj at cc) % 2021 £m vs 2020 % vs 2020 (adj at cc) % New Categories: Vapour 19 +4.3 % +1.7 % 18 +26.0 % +27.5 % THP 523 +2.3 % +9.1 % 511 +2.8 % +13.0 % Modern Oral 13 +117.0 % +121.2 % 6 +179 % +199 % Total New Categories 555 +3.7 % +10.1 % 535 +4.2 % +14.2 % Traditional Oral — — — — — — Combustibles 3,813 +7.3 % +7.8 % 3,555 -9.6 % -2.3 % Other 99 -0.9 % -7.8 % 101 +13.0 % +20.1 % Revenue 4,467 +6.6 % +7.7 % 4,191 -7.6 % 0.0 % Profit from operations/operating margin 2022 £m vs 2021 % vs 2021 (adj at cc) % 2021 £m vs 2020 % vs 2020 (adj at cc) % Profit from Operations 1,026 -20.3 % +3.0 % 1,287 -12.6 % -1.1 % Operating Margin (%) +23.0 % -770 bps -180 bps +30.7 % -170 bps -40 bps +10 bps +3.7% Cigarette value share change Revenue growth in New Categories BAT Annual Report and Form 20-F 2022 Strategic Report Governance Report Financial Statements Other Information Regional Review APME Asia-Pacific and Middle East 114
Revenue and Profit from Operations Reported revenue increased 6.6% to £4,467 million (2021: declined 7.6% to £4,191 million). The performance in 2022 was driven by the continued growth in New Categories and pricing in combustibles, which more than offset marginally lower combustibles volume (down 0.8%). Volume benefited from the continuing emerging market recovery from COVID-19 and the regional re-allocation of North Africa, partly offset by the sale of the Group's Iranian business midway through 2021. Revenue in 2021 (when compared to 2020) was impacted by the structural excise changes in Australia and New Zealand, and competitive pricing dynamics in Australia (in combination, an estimated headwind of £260 million), and negative geographic mix due to volume share growth and recovery from COVID-19 in emerging markets, leading to a growth in combustible volume of 4.4% (largely due to Bangladesh, Vietnam and Pakistan). Revenue in 2021 was also negatively impacted by the sale of the Group's Iranian business partway through the year. Excluding the impact of translational foreign exchange, in 2022 revenue was up 7.7% against 2021 (2021: in line with 2020) on an adjusted constant rate basis. Reported profit from operations declined 20.3% to £1,026 million, while 2021 was down 12.6% to £1,287 million. 2022 was impacted by increased one-off charges related to the allegations of historical breaches of sanctions (£450 million) and the exit from Egypt (£118 million). In 2021, the Group recognised a charge of £358 million in relation to the disposal of the Group's Iranian business (mainly in respect of foreign exchange previously charged to other comprehensive income). Excluding adjusting items and the impact of translational foreign exchange, adjusted profit from operations at constant rates of exchange increased 3.0% in 2022 (2021: fell 1.1%), driven by the top line growth (despite negative mix due to volume growth in lower margin markets) and efficiencies delivered through Quantum, which more than offset a transactional foreign exchange headwind of 4.5%. Furthermore, the sale of the Iranian business, due to its timing in 2021, acted as a drag on adjusted profit from operations in both years. New Categories Total revenue from New Categories increased 3.7% to £555 million (2021: increased 4.2% to £535 million). In 2022, this was driven by a 17.0% increase in THP consumable volume to 11 billion sticks, compared to an increase of 26.5% to 9 billion sticks in 2021. This was driven by the success of glo Hyper including the new variant Hyper X2. glo Hyper is powered by Advanced Induction Heating and provides a step change in consumer satisfaction with 30% more tobacco and a boost function. THP revenue increased 2.3% (2021: increase of 2.8%), or 9.1% (2021: up 13.0%) excluding the impact of translational foreign exchange. The growth in both years was driven by increased Hyper volume, while the growth in 2021 was also due to a £50 million charge to revenue in 2020, that did not repeat in 2021, in respect of the withdrawal of glo Sens. In Japan, the largest THP market in the world, glo performed well, maintaining the momentum of 2021 with volume share of total tobacco (being FMC and THP combined) increasing to 7.4% in 2022, up 60 bps, having grown 140 bps in 2021. However, in 2022, glo's volume share of the THP category declined 120 bps to 20.1% from 21.2% in 2021 as glo volume grew at a slower rate than the category due to competitive competitor pricing. In Modern Oral, revenue grew 117% (or 121% at constant rates of exchange) with volume up 108% to 530 million pouches. We believe that Modern Oral is an exciting longer-term opportunity to unlock reduced risk products*† in Emerging Markets. We are particularly proud of Velo’s performance in Pakistan, now our third largest Modern Oral market by volume, where we have rapidly achieved national coverage. Enabled by powerful, consumer- centric digital activations, Velo has reached a monthly volume in the country of over 40 million pouches. Combustibles Revenue from combustibles increased by 7.3% to £3,813 million (2021: down 9.6% to £3,555 million), or by 7.8% (2021: down 2.3%) at constant rates of exchange. In 2022, this was driven by improved pricing and a partial recovery of Global Travel Retail following the COVID-19 restrictions of 2020 and 2021. These more than offset a decrease in combustible volume of 0.8% and the negative impact of the sale of the Group's Iranian business partway through 2021. The sale of the Iranian business also impacted 2021 (versus 2020) which contributed to the decline in combustibles revenue despite an increase in combustible volume (up 4.4%) as emerging markets recovered from COVID-19. However, this led to a negative geographic mix which, combined with structural excise changes in Australia and New Zealand and competitive pricing dynamics in Australia (totalling approximately £260 million), drove revenue down. In 2022, value share increased 10 bps (2021: down 20 bps), with volume share flat (2021: 20 bps higher), as volume share gains (including in Japan, Pakistan and Saudi Arabia) were offset by losses in Bangladesh and South Korea. Notes: * Based on the weight of evidence and assuming a complete switch from cigarette smoking. These products are not risk free and are addictive. † Our Vapour product Vuse (including Alto, Solo, Ciro and Vibe), and certain products including Velo, Grizzly, Kodiak, and Camel Snus, which are sold in the U.S., are subject to FDA regulation and no reduced-risk claims will be made as to these products without agency clearance. BAT Annual Report and Form 20-F 2022 Strategic Report Governance Report Financial Statements Other Information 115
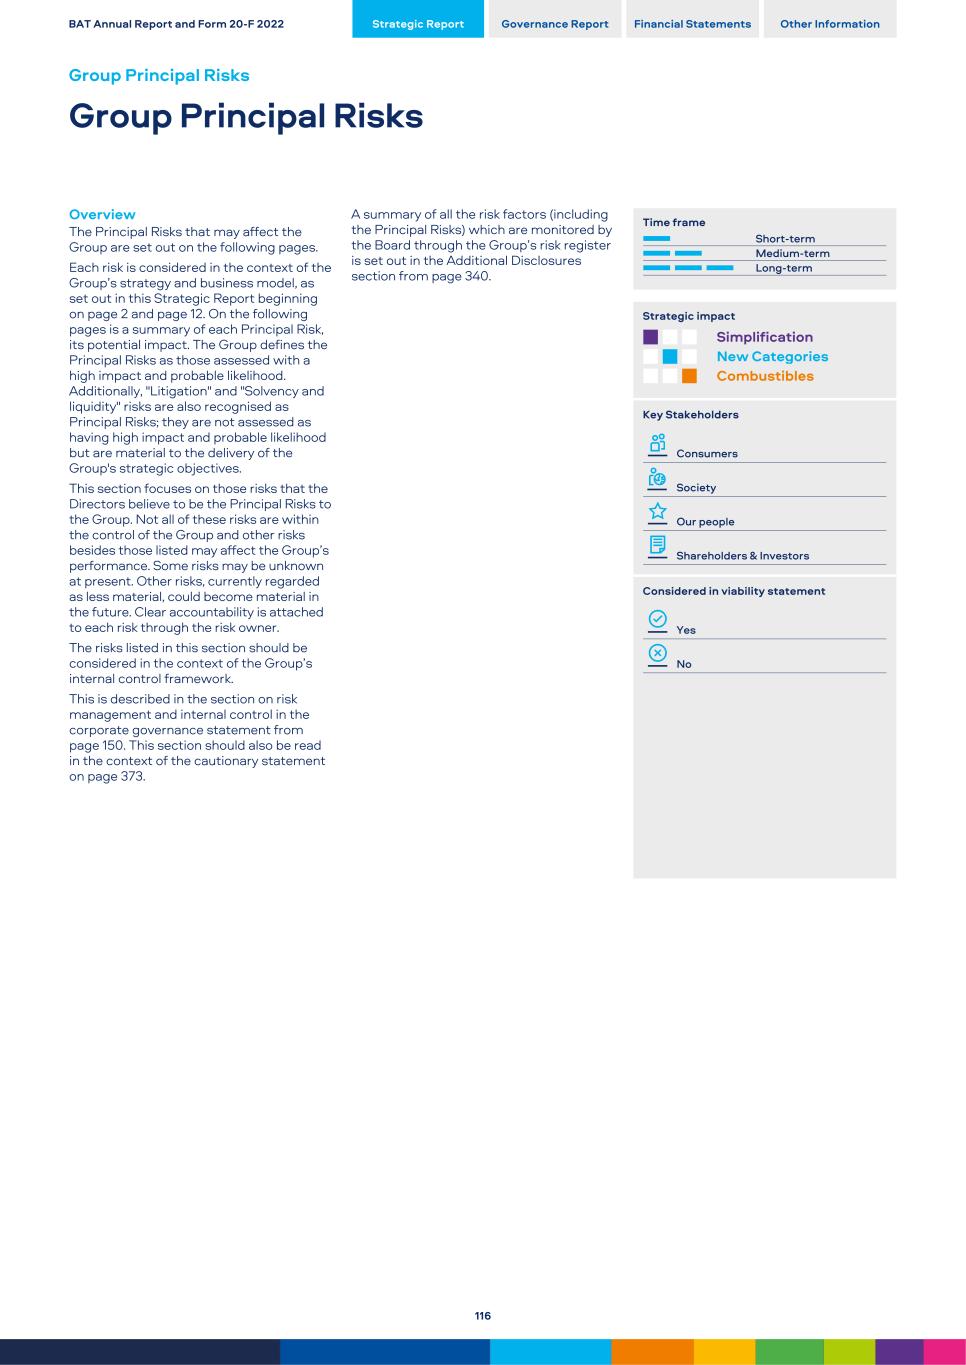
Overview The Principal Risks that may affect the Group are set out on the following pages. Each risk is considered in the context of the Group’s strategy and business model, as set out in this Strategic Report beginning on page 2 and page 12. On the following pages is a summary of each Principal Risk, its potential impact. The Group defines the Principal Risks as those assessed with a high impact and probable likelihood. Additionally, "Litigation" and "Solvency and liquidity" risks are also recognised as Principal Risks; they are not assessed as having high impact and probable likelihood but are material to the delivery of the Group's strategic objectives. This section focuses on those risks that the Directors believe to be the Principal Risks to the Group. Not all of these risks are within the control of the Group and other risks besides those listed may affect the Group’s performance. Some risks may be unknown at present. Other risks, currently regarded as less material, could become material in the future. Clear accountability is attached to each risk through the risk owner. The risks listed in this section should be considered in the context of the Group’s internal control framework. This is described in the section on risk management and internal control in the corporate governance statement from page 150. This section should also be read in the context of the cautionary statement on page 373. A summary of all the risk factors (including the Principal Risks) which are monitored by the Board through the Group’s risk register is set out in the Additional Disclosures section from page 340. Time frame Short-term Medium-term Long-term Strategic impact Simplification New Categories Combustibles Key Stakeholders Consumers Society Our people Shareholders & Investors Considered in viability statement Yes No BAT Annual Report and Form 20-F 2022 Strategic Report Governance Report Financial Statements Other Information Group Principal Risks Group Principal Risks 116
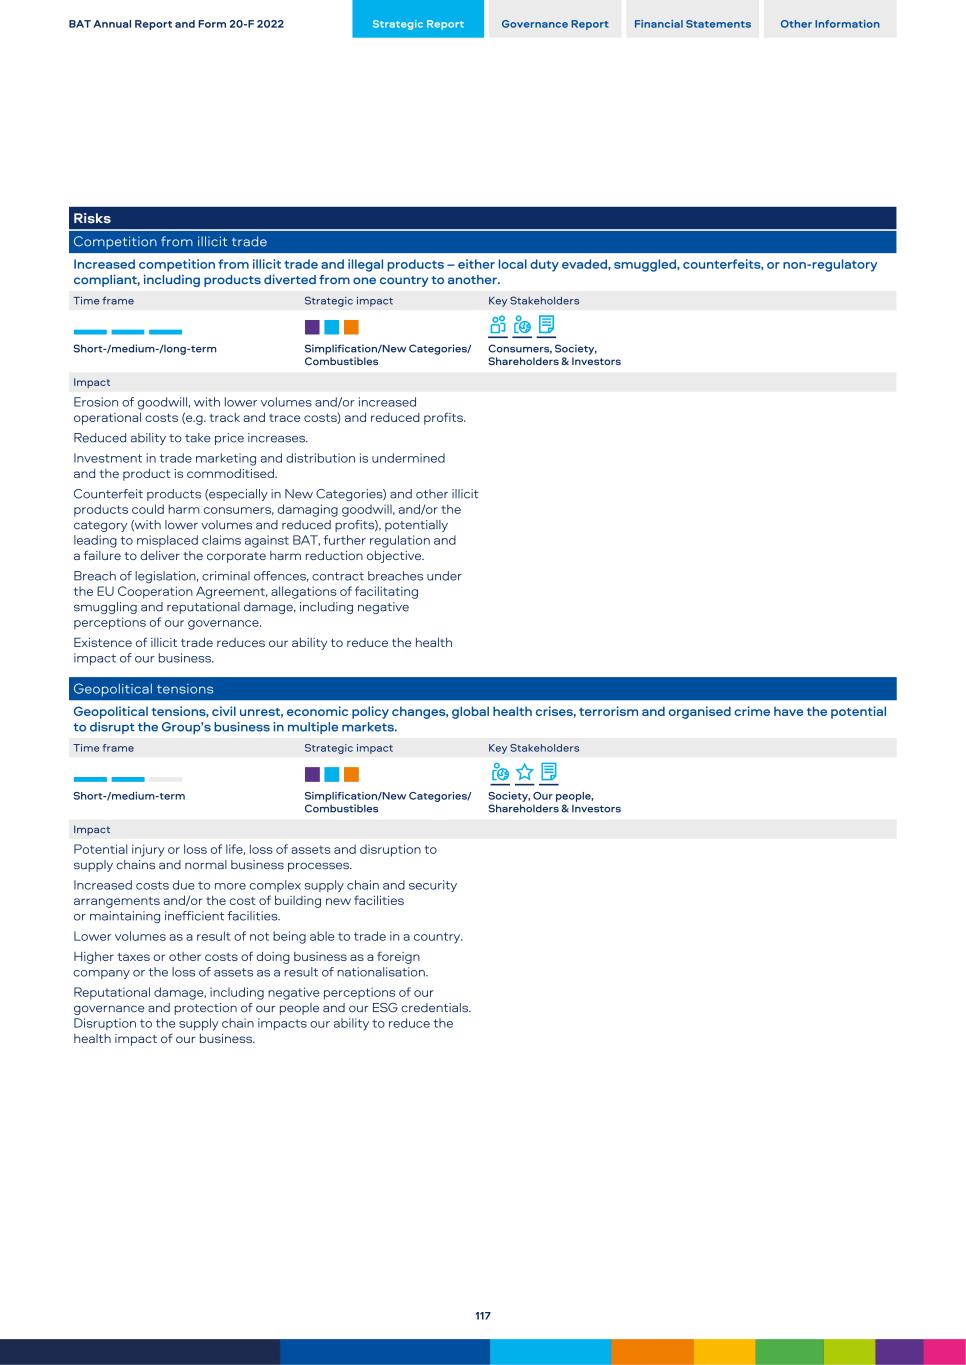
Risks Competition from illicit trade Increased competition from illicit trade and illegal products – either local duty evaded, smuggled, counterfeits, or non-regulatory compliant, including products diverted from one country to another. Time frame Strategic impact Key Stakeholders Short-/medium-/long-term Simplification/New Categories/ Combustibles Consumers, Society, Shareholders & Investors Impact Erosion of goodwill, with lower volumes and/or increased operational costs (e.g. track and trace costs) and reduced profits. Reduced ability to take price increases. Investment in trade marketing and distribution is undermined and the product is commoditised. Counterfeit products (especially in New Categories) and other illicit products could harm consumers, damaging goodwill, and/or the category (with lower volumes and reduced profits), potentially leading to misplaced claims against BAT, further regulation and a failure to deliver the corporate harm reduction objective. Breach of legislation, criminal offences, contract breaches under the EU Cooperation Agreement, allegations of facilitating smuggling and reputational damage, including negative perceptions of our governance. Existence of illicit trade reduces our ability to reduce the health impact of our business. Geopolitical tensions Geopolitical tensions, civil unrest, economic policy changes, global health crises, terrorism and organised crime have the potential to disrupt the Group’s business in multiple markets. Time frame Strategic impact Key Stakeholders Short-/medium-term Simplification/New Categories/ Combustibles Society, Our people, Shareholders & Investors Impact Potential injury or loss of life, loss of assets and disruption to supply chains and normal business processes. Increased costs due to more complex supply chain and security arrangements and/or the cost of building new facilities or maintaining inefficient facilities. Lower volumes as a result of not being able to trade in a country. Higher taxes or other costs of doing business as a foreign company or the loss of assets as a result of nationalisation. Reputational damage, including negative perceptions of our governance and protection of our people and our ESG credentials. Disruption to the supply chain impacts our ability to reduce the health impact of our business. BAT Annual Report and Form 20-F 2022 Strategic Report Governance Report Financial Statements Other Information 117
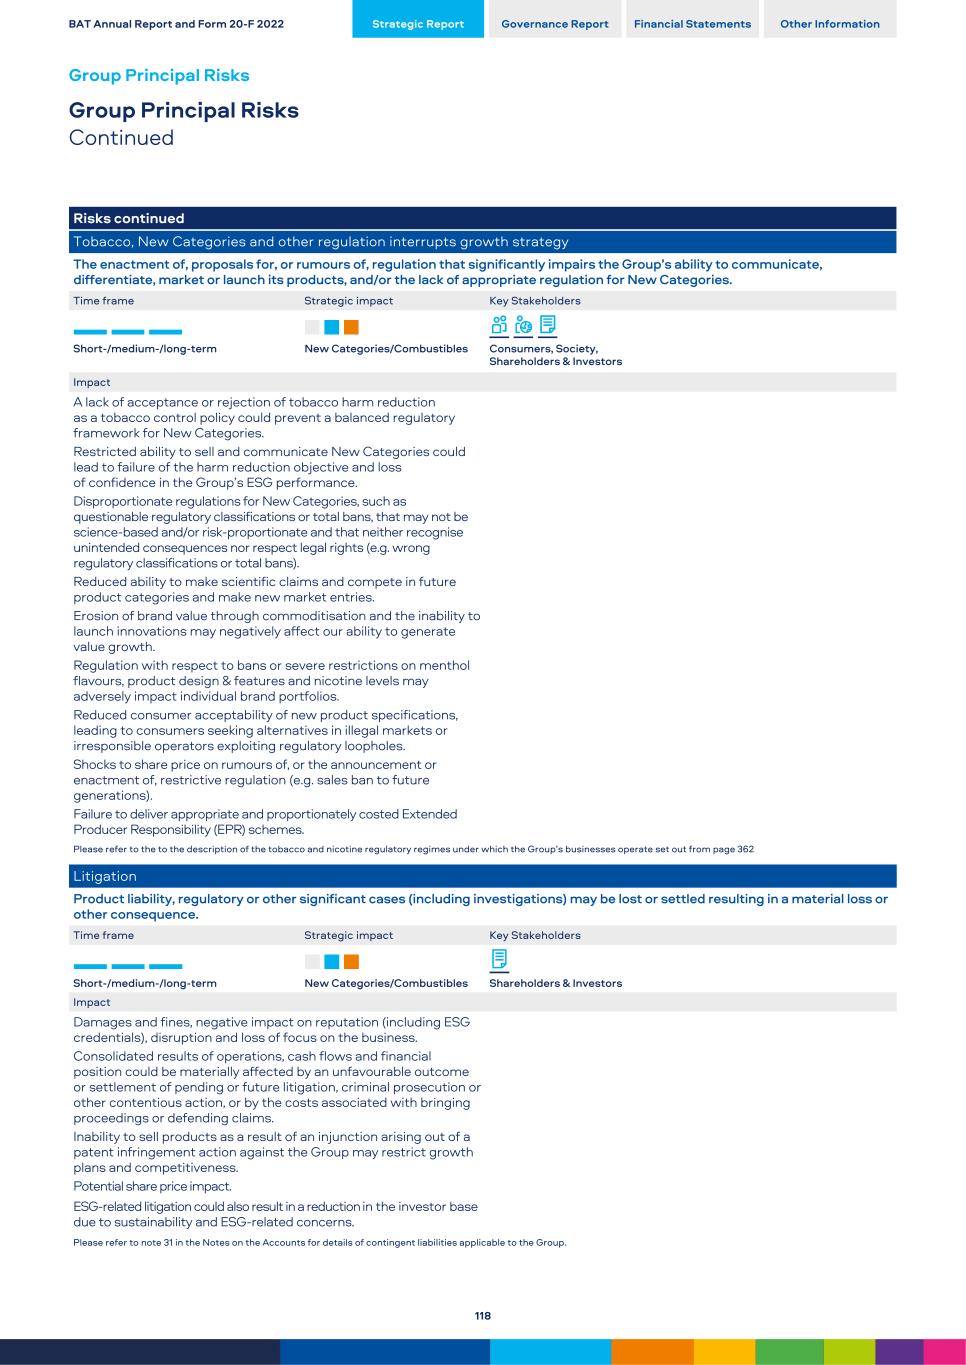
Risks continued Tobacco, New Categories and other regulation interrupts growth strategy The enactment of, proposals for, or rumours of, regulation that significantly impairs the Group’s ability to communicate, differentiate, market or launch its products, and/or the lack of appropriate regulation for New Categories. Time frame Strategic impact Key Stakeholders Short-/medium-/long-term New Categories/Combustibles Consumers, Society, Shareholders & Investors Impact A lack of acceptance or rejection of tobacco harm reduction as a tobacco control policy could prevent a balanced regulatory framework for New Categories. Restricted ability to sell and communicate New Categories could lead to failure of the harm reduction objective and loss of confidence in the Group’s ESG performance. Disproportionate regulations for New Categories, such as questionable regulatory classifications or total bans, that may not be science-based and/or risk-proportionate and that neither recognise unintended consequences nor respect legal rights (e.g. wrong regulatory classifications or total bans). Reduced ability to make scientific claims and compete in future product categories and make new market entries. Erosion of brand value through commoditisation and the inability to launch innovations may negatively affect our ability to generate value growth. Regulation with respect to bans or severe restrictions on menthol flavours, product design & features and nicotine levels may adversely impact individual brand portfolios. Reduced consumer acceptability of new product specifications, leading to consumers seeking alternatives in illegal markets or irresponsible operators exploiting regulatory loopholes. Shocks to share price on rumours of, or the announcement or enactment of, restrictive regulation (e.g. sales ban to future generations). Failure to deliver appropriate and proportionately costed Extended Producer Responsibility (EPR) schemes. Please refer to the to the description of the tobacco and nicotine regulatory regimes under which the Group’s businesses operate set out from page 362 Litigation Product liability, regulatory or other significant cases (including investigations) may be lost or settled resulting in a material loss or other consequence. Time frame Strategic impact Key Stakeholders Short-/medium-/long-term New Categories/Combustibles Shareholders & Investors Impact Damages and fines, negative impact on reputation (including ESG credentials), disruption and loss of focus on the business. Consolidated results of operations, cash flows and financial position could be materially affected by an unfavourable outcome or settlement of pending or future litigation, criminal prosecution or other contentious action, or by the costs associated with bringing proceedings or defending claims. Inability to sell products as a result of an injunction arising out of a patent infringement action against the Group may restrict growth plans and competitiveness. Potential share price impact. ESG-related litigation could also result in a reduction in the investor base due to sustainability and ESG-related concerns. Please refer to note 31 in the Notes on the Accounts for details of contingent liabilities applicable to the Group. BAT Annual Report and Form 20-F 2022 Strategic Report Governance Report Financial Statements Other Information Group Principal Risks Group Principal Risks Continued 118
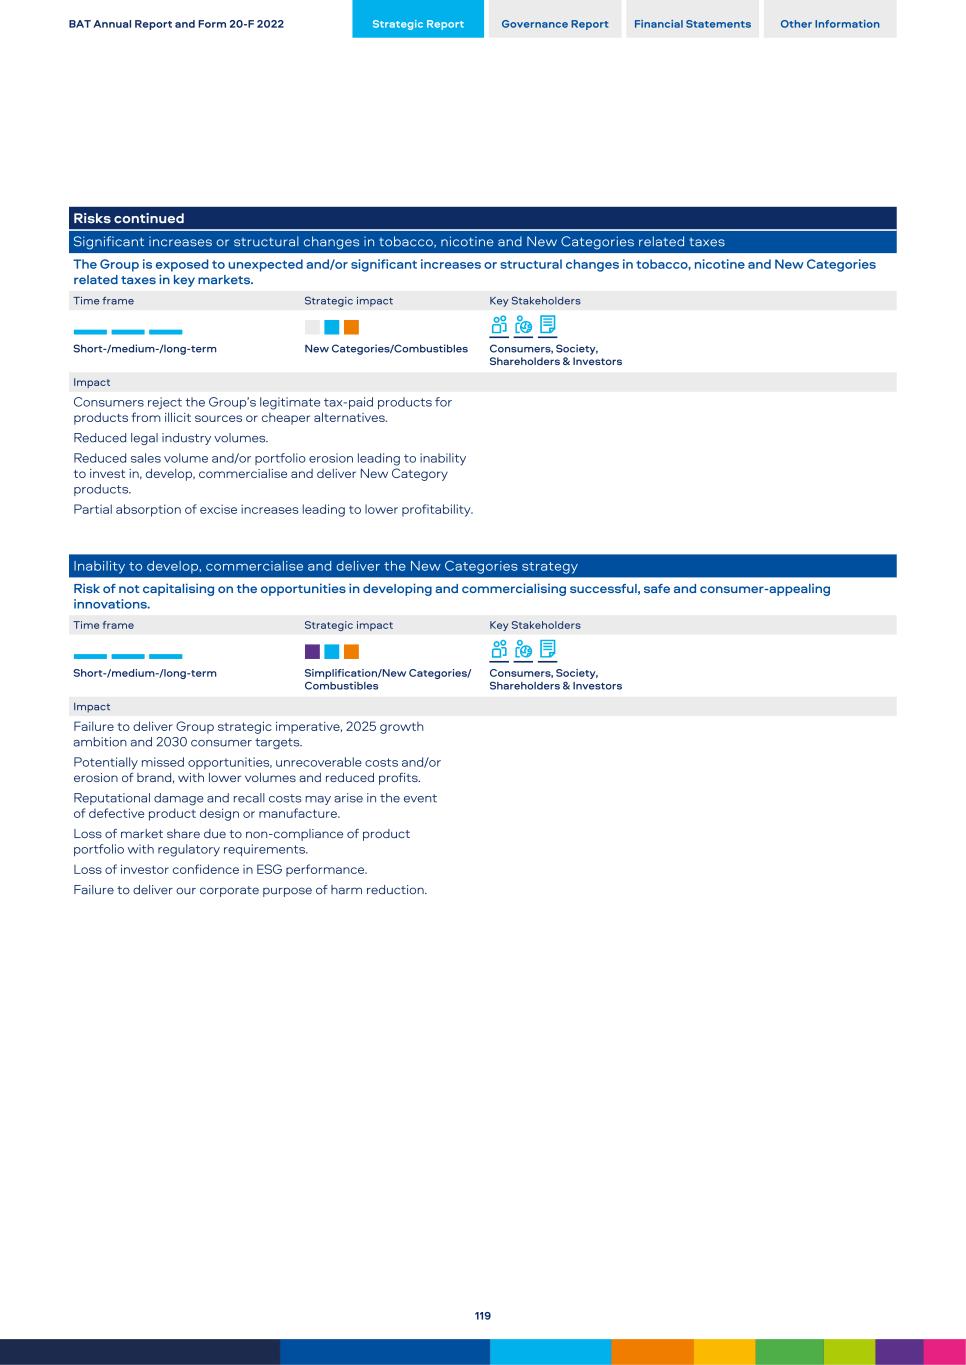
Risks continued Significant increases or structural changes in tobacco, nicotine and New Categories related taxes The Group is exposed to unexpected and/or significant increases or structural changes in tobacco, nicotine and New Categories related taxes in key markets. Time frame Strategic impact Key Stakeholders Short-/medium-/long-term New Categories/Combustibles Consumers, Society, Shareholders & Investors Impact Consumers reject the Group’s legitimate tax-paid products for products from illicit sources or cheaper alternatives. Reduced legal industry volumes. Reduced sales volume and/or portfolio erosion leading to inability to invest in, develop, commercialise and deliver New Category products. Partial absorption of excise increases leading to lower profitability. Inability to develop, commercialise and deliver the New Categories strategy Risk of not capitalising on the opportunities in developing and commercialising successful, safe and consumer-appealing innovations. Time frame Strategic impact Key Stakeholders Short-/medium-/long-term Simplification/New Categories/ Combustibles Consumers, Society, Shareholders & Investors Impact Failure to deliver Group strategic imperative, 2025 growth ambition and 2030 consumer targets. Potentially missed opportunities, unrecoverable costs and/or erosion of brand, with lower volumes and reduced profits. Reputational damage and recall costs may arise in the event of defective product design or manufacture. Loss of market share due to non-compliance of product portfolio with regulatory requirements. Loss of investor confidence in ESG performance. Failure to deliver our corporate purpose of harm reduction. BAT Annual Report and Form 20-F 2022 Strategic Report Governance Report Financial Statements Other Information 119
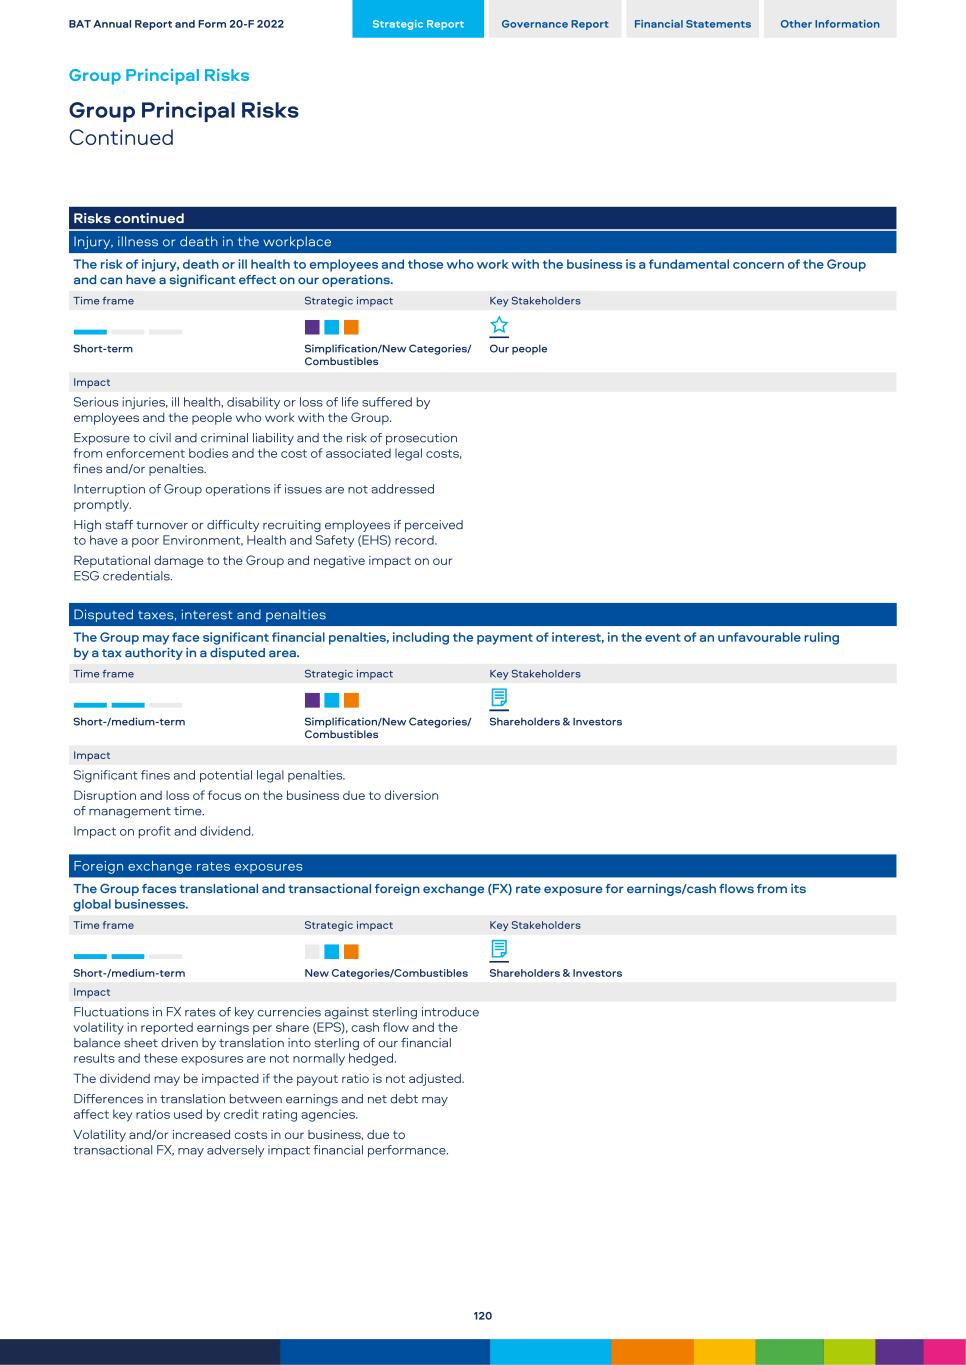
Risks continued Injury, illness or death in the workplace The risk of injury, death or ill health to employees and those who work with the business is a fundamental concern of the Group and can have a significant effect on our operations. Time frame Strategic impact Key Stakeholders Short-term Simplification/New Categories/ Combustibles Our people Impact Serious injuries, ill health, disability or loss of life suffered by employees and the people who work with the Group. Exposure to civil and criminal liability and the risk of prosecution from enforcement bodies and the cost of associated legal costs, fines and/or penalties. Interruption of Group operations if issues are not addressed promptly. High staff turnover or difficulty recruiting employees if perceived to have a poor Environment, Health and Safety (EHS) record. Reputational damage to the Group and negative impact on our ESG credentials. Disputed taxes, interest and penalties The Group may face significant financial penalties, including the payment of interest, in the event of an unfavourable ruling by a tax authority in a disputed area. Time frame Strategic impact Key Stakeholders Short-/medium-term Simplification/New Categories/ Combustibles Shareholders & Investors Impact Significant fines and potential legal penalties. Disruption and loss of focus on the business due to diversion of management time. Impact on profit and dividend. Foreign exchange rates exposures The Group faces translational and transactional foreign exchange (FX) rate exposure for earnings/cash flows from its global businesses. Time frame Strategic impact Key Stakeholders Short-/medium-term New Categories/Combustibles Shareholders & Investors Impact Fluctuations in FX rates of key currencies against sterling introduce volatility in reported earnings per share (EPS), cash flow and the balance sheet driven by translation into sterling of our financial results and these exposures are not normally hedged. The dividend may be impacted if the payout ratio is not adjusted. Differences in translation between earnings and net debt may affect key ratios used by credit rating agencies. Volatility and/or increased costs in our business, due to transactional FX, may adversely impact financial performance. BAT Annual Report and Form 20-F 2022 Strategic Report Governance Report Financial Statements Other Information Group Principal Risks Group Principal Risks Continued 120
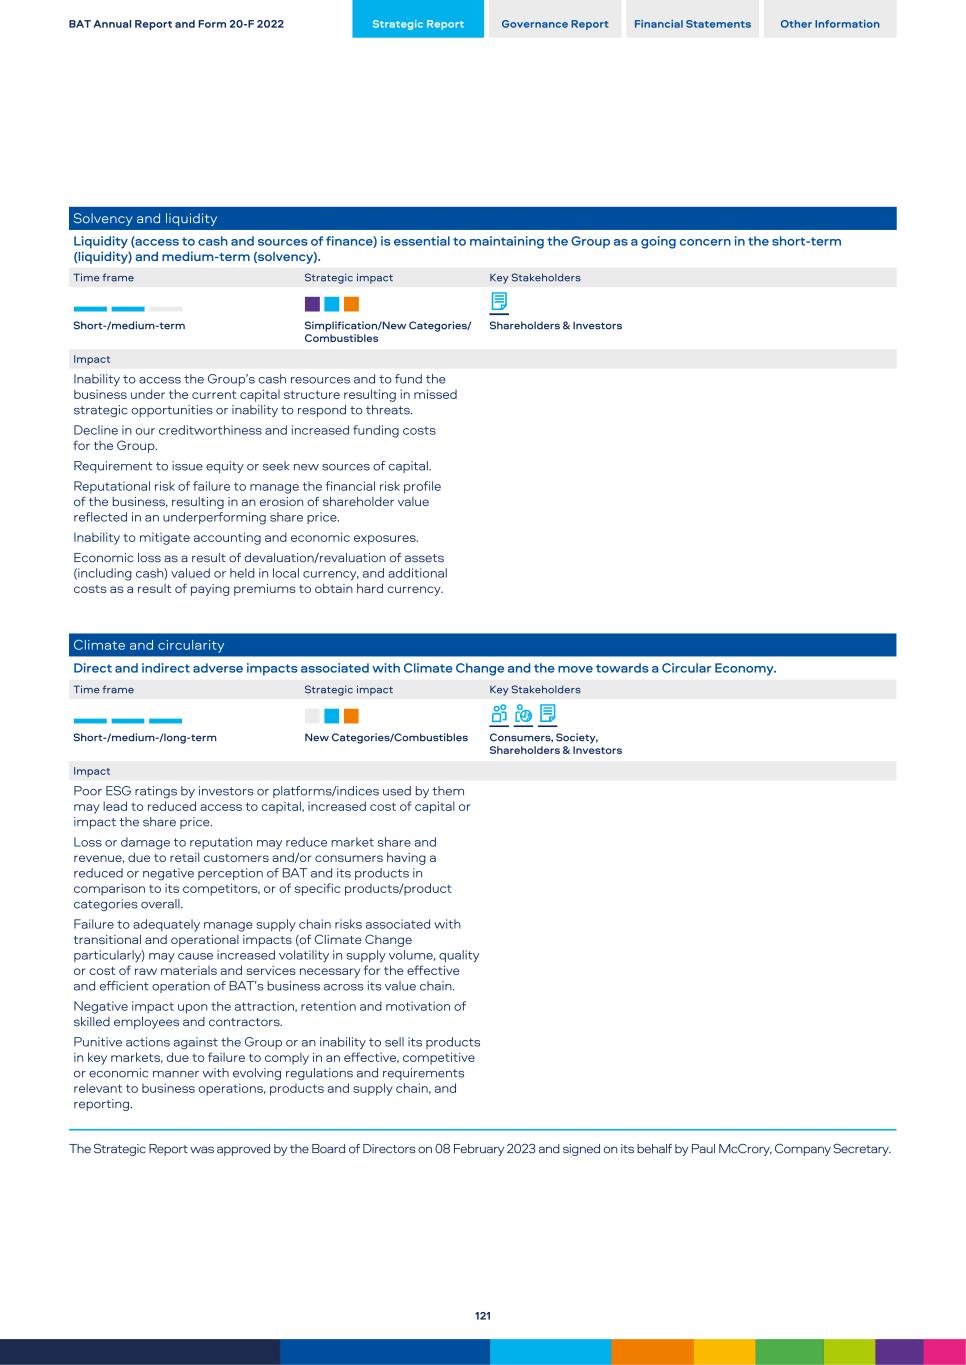
Solvency and liquidity Liquidity (access to cash and sources of finance) is essential to maintaining the Group as a going concern in the short-term (liquidity) and medium-term (solvency). Time frame Strategic impact Key Stakeholders Short-/medium-term Simplification/New Categories/ Combustibles Shareholders & Investors Impact Inability to access the Group’s cash resources and to fund the business under the current capital structure resulting in missed strategic opportunities or inability to respond to threats. Decline in our creditworthiness and increased funding costs for the Group. Requirement to issue equity or seek new sources of capital. Reputational risk of failure to manage the financial risk profile of the business, resulting in an erosion of shareholder value reflected in an underperforming share price. Inability to mitigate accounting and economic exposures. Economic loss as a result of devaluation/revaluation of assets (including cash) valued or held in local currency, and additional costs as a result of paying premiums to obtain hard currency. Climate and circularity Direct and indirect adverse impacts associated with Climate Change and the move towards a Circular Economy. Time frame Strategic impact Key Stakeholders Short-/medium-/long-term New Categories/Combustibles Consumers, Society, Shareholders & Investors Impact Poor ESG ratings by investors or platforms/indices used by them may lead to reduced access to capital, increased cost of capital or impact the share price. Loss or damage to reputation may reduce market share and revenue, due to retail customers and/or consumers having a reduced or negative perception of BAT and its products in comparison to its competitors, or of specific products/product categories overall. Failure to adequately manage supply chain risks associated with transitional and operational impacts (of Climate Change particularly) may cause increased volatility in supply volume, quality or cost of raw materials and services necessary for the effective and efficient operation of BAT’s business across its value chain. Negative impact upon the attraction, retention and motivation of skilled employees and contractors. Punitive actions against the Group or an inability to sell its products in key markets, due to failure to comply in an effective, competitive or economic manner with evolving regulations and requirements relevant to business operations, products and supply chain, and reporting. The Strategic Report was approved by the Board of Directors on 08 February 2023 and signed on its behalf by Paul McCrory, Company Secretary. BAT Annual Report and Form 20-F 2022 Strategic Report Governance Report Financial Statements Other Information 121
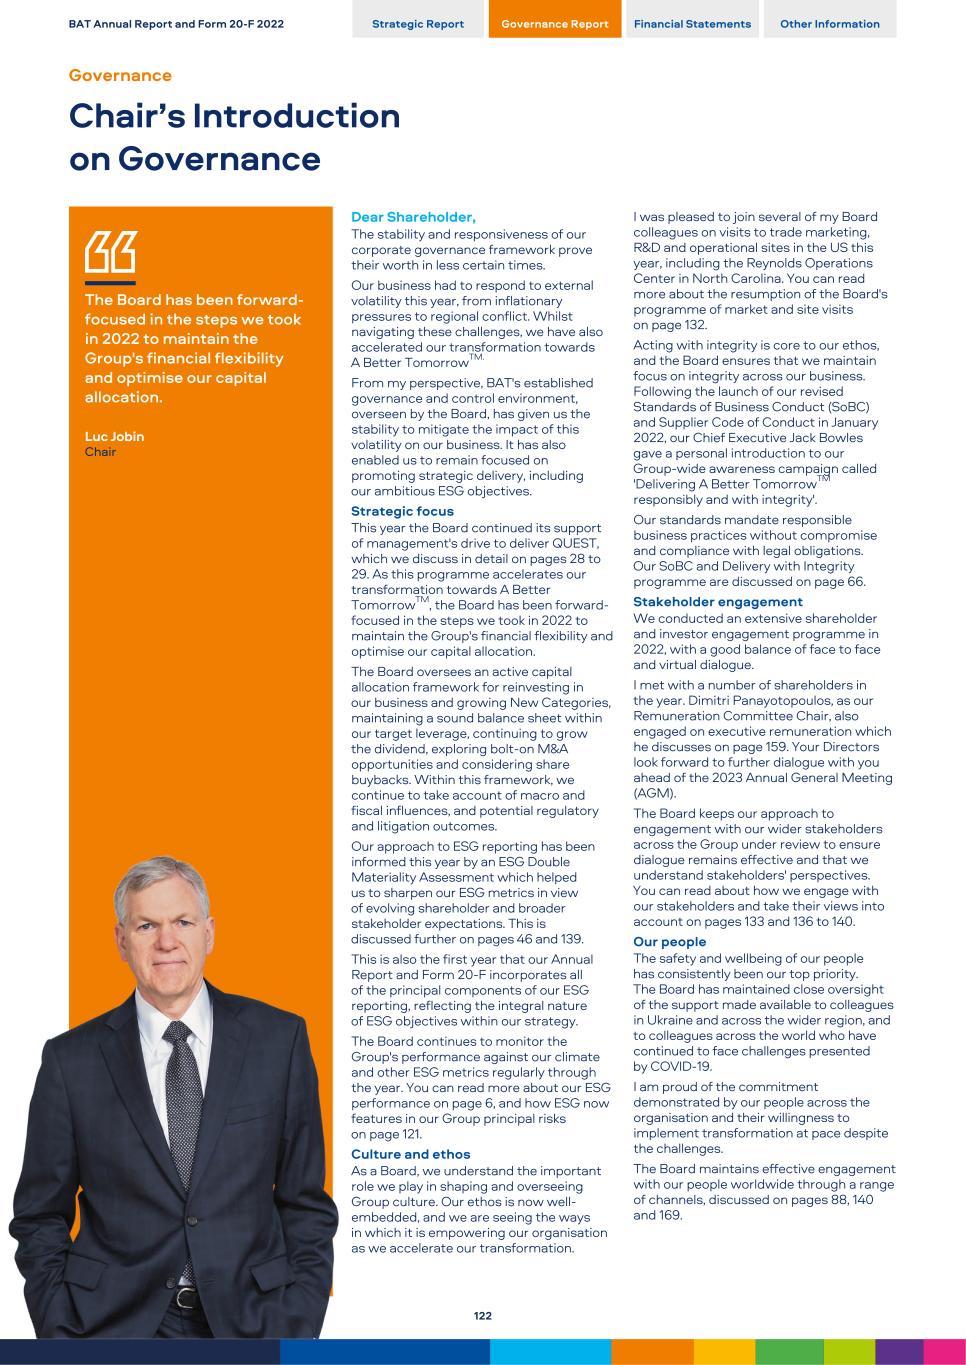
The Board has been forward- focused in the steps we took in 2022 to maintain the Group's financial flexibility and optimise our capital allocation. Luc Jobin Chair Dear Shareholder, The stability and responsiveness of our corporate governance framework prove their worth in less certain times. Our business had to respond to external volatility this year, from inflationary pressures to regional conflict. Whilst navigating these challenges, we have also accelerated our transformation towards A Better TomorrowTM. From my perspective, BAT's established governance and control environment, overseen by the Board, has given us the stability to mitigate the impact of this volatility on our business. It has also enabled us to remain focused on promoting strategic delivery, including our ambitious ESG objectives. Strategic focus This year the Board continued its support of management's drive to deliver QUEST, which we discuss in detail on pages 28 to 29. As this programme accelerates our transformation towards A Better TomorrowTM, the Board has been forward- focused in the steps we took in 2022 to maintain the Group's financial flexibility and optimise our capital allocation. The Board oversees an active capital allocation framework for reinvesting in our business and growing New Categories, maintaining a sound balance sheet within our target leverage, continuing to grow the dividend, exploring bolt-on M&A opportunities and considering share buybacks. Within this framework, we continue to take account of macro and fiscal influences, and potential regulatory and litigation outcomes. Our approach to ESG reporting has been informed this year by an ESG Double Materiality Assessment which helped us to sharpen our ESG metrics in view of evolving shareholder and broader stakeholder expectations. This is discussed further on pages 46 and 139. This is also the first year that our Annual Report and Form 20-F incorporates all of the principal components of our ESG reporting, reflecting the integral nature of ESG objectives within our strategy. The Board continues to monitor the Group's performance against our climate and other ESG metrics regularly through the year. You can read more about our ESG performance on page 6, and how ESG now features in our Group principal risks on page 121. Culture and ethos As a Board, we understand the important role we play in shaping and overseeing Group culture. Our ethos is now well- embedded, and we are seeing the ways in which it is empowering our organisation as we accelerate our transformation. I was pleased to join several of my Board colleagues on visits to trade marketing, R&D and operational sites in the US this year, including the Reynolds Operations Center in North Carolina. You can read more about the resumption of the Board's programme of market and site visits on page 132. Acting with integrity is core to our ethos, and the Board ensures that we maintain focus on integrity across our business. Following the launch of our revised Standards of Business Conduct (SoBC) and Supplier Code of Conduct in January 2022, our Chief Executive Jack Bowles gave a personal introduction to our Group-wide awareness campaign called 'Delivering A Better TomorrowTM responsibly and with integrity'. Our standards mandate responsible business practices without compromise and compliance with legal obligations. Our SoBC and Delivery with Integrity programme are discussed on page 66. Stakeholder engagement We conducted an extensive shareholder and investor engagement programme in 2022, with a good balance of face to face and virtual dialogue. I met with a number of shareholders in the year. Dimitri Panayotopoulos, as our Remuneration Committee Chair, also engaged on executive remuneration which he discusses on page 159. Your Directors look forward to further dialogue with you ahead of the 2023 Annual General Meeting (AGM). The Board keeps our approach to engagement with our wider stakeholders across the Group under review to ensure dialogue remains effective and that we understand stakeholders' perspectives. You can read about how we engage with our stakeholders and take their views into account on pages 133 and 136 to 140. Our people The safety and wellbeing of our people has consistently been our top priority. The Board has maintained close oversight of the support made available to colleagues in Ukraine and across the wider region, and to colleagues across the world who have continued to face challenges presented by COVID-19. I am proud of the commitment demonstrated by our people across the organisation and their willingness to implement transformation at pace despite the challenges. The Board maintains effective engagement with our people worldwide through a range of channels, discussed on pages 88, 140 and 169. BAT Annual Report and Form 20-F 2022 Strategic Report Governance Report Financial Statements Other Information Governance Chair’s Introduction on Governance 122
Board efficacy We made several changes to the non- executive membership of the Board in 2022, bringing new perspectives and experience to support successful delivery of our strategy. Following our commitment to improve the gender balance of the Board, I am pleased to report that women now represent 36% of the Board. In addition, three of our Directors are from an ethnic minority background. At the close of our AGM in 2023, it is anticipated that women will represent 40% of the Board, with two Directors from an ethnic minority background. This year, the evaluation of the Board, its Committees and each individual Director, was externally facilitated to provide an objective opinion on our performance and effectiveness. This external review concluded that the Board and its Committees continue to function effectively. It also highlighted some opportunities to enhance our effectiveness and the Board and its Committees have developed an action plan for implementation in 2023. You can read about the review on pages 143 to 144. I would like to express my thanks to both Dimitri, who stepped down as our Senior Independent Director in August, and to Sue Farr for taking on this important role. Dimitri remains Chair of our Remuneration Committee and a valued member of the Board. Savio Kwan will step down from the Board at the close of the 2023 AGM and I would also like to thank him for his valuable contribution to the Board over his nine years of service. On behalf of the Board, I confirm that we consider that this Annual Report and Form 20-F is fair, balanced and understandable, and presents the information necessary to assess the Company’s position, performance, business model and strategy. Luc Jobin Chair Throughout the year ended 31 December 2022, we applied the Principles of the UK Corporate Governance Code 2018. The Company was compliant with all provisions of the Code during the year. The Board considers that this Annual Report and Form 20-F, and notably this Governance section, provides the information shareholders need to evaluate how we have complied with our obligations under the Code. Pages noted opposite refer to particular discussion on the application of Principles of the Code in this Annual Report and Form 20-F. Disclosure guidance and transparency rules We comply with the Disclosure Guidance and Transparency Rules requirements for corporate governance statements by virtue of the information included in this section, together with the information contained in the Other Information section. The UK Corporate Governance Code 2018 is available at frc.org.uk. US corporate governance As a result of the listing of the Company’s American Depositary Shares (ADSs) on the NYSE, the Company is required to meet certain NYSE requirements relating to corporate governance matters. Certain exceptions to these requirements apply to the Company as a foreign private issuer. For details of the significant differences between the NYSE requirements and the Company’s practices, please see page 370. Board Leadership and Company Purpose Principle A. Long-Term Sustainable Success pages 2 to 115, 122 to 144 B. Purpose, Values and Culture pages 2 to 27, 82 to 91, 122, 131, 132, 135, 144, 148 C. Resources and Control Framework pages 4 to 18, 116 to 121, 130, 131, 135, 150 to 158 D. Shareholder and Stakeholder Engagement pages 20 to 21, 88, 136 to 140, 159 and 169 E. Workforce Engagement, Policies, Practices pages 66 to 67, 82 to 91, 131, 132, 140, 167, 169 Division of Responsibilities Principle F. Leadership of the Board pages 122 to 144 G. Board Composition and Division of Responsibilities pages 123 to 127, 141 to 142 H. Role and Commitment of Non-Executive Directors pages 124 to 127, 141 to 142, 146 I. Board Support pages 141 to 143 Composition, Succession, Evaluation Principle J. Board Appointments, Succession and Diversity pages 123 to 127, 135, 145 to 149 K. Board Skills and Experience pages 124 to to 127, 145 to 146 L. Board Evaluation pages 143 to 144 Audit, Risk, Internal Control Principle M. Internal and External Audit Functions pages 153 to 158 N. Fair, Balanced and Understandable Assessment pages 157 and 181 O. Risk Management and Internal Controls pages 116 to 121, 135, 150 to 158, 371 Remuneration Principle P. Remuneration Policies and Practices pages 159 to 180 Q. Development of Policy on Remuneration pages 159 to 180 R. Judgement and Discretion pages 159 to 180 For reference, we prepare a separate voluntary annual compliance report by reference to each Principle and Provision of the Code, available at bat.com/governance BAT Annual Report and Form 20-F 2022 Strategic Report Governance Report Financial Statements Other Information 123
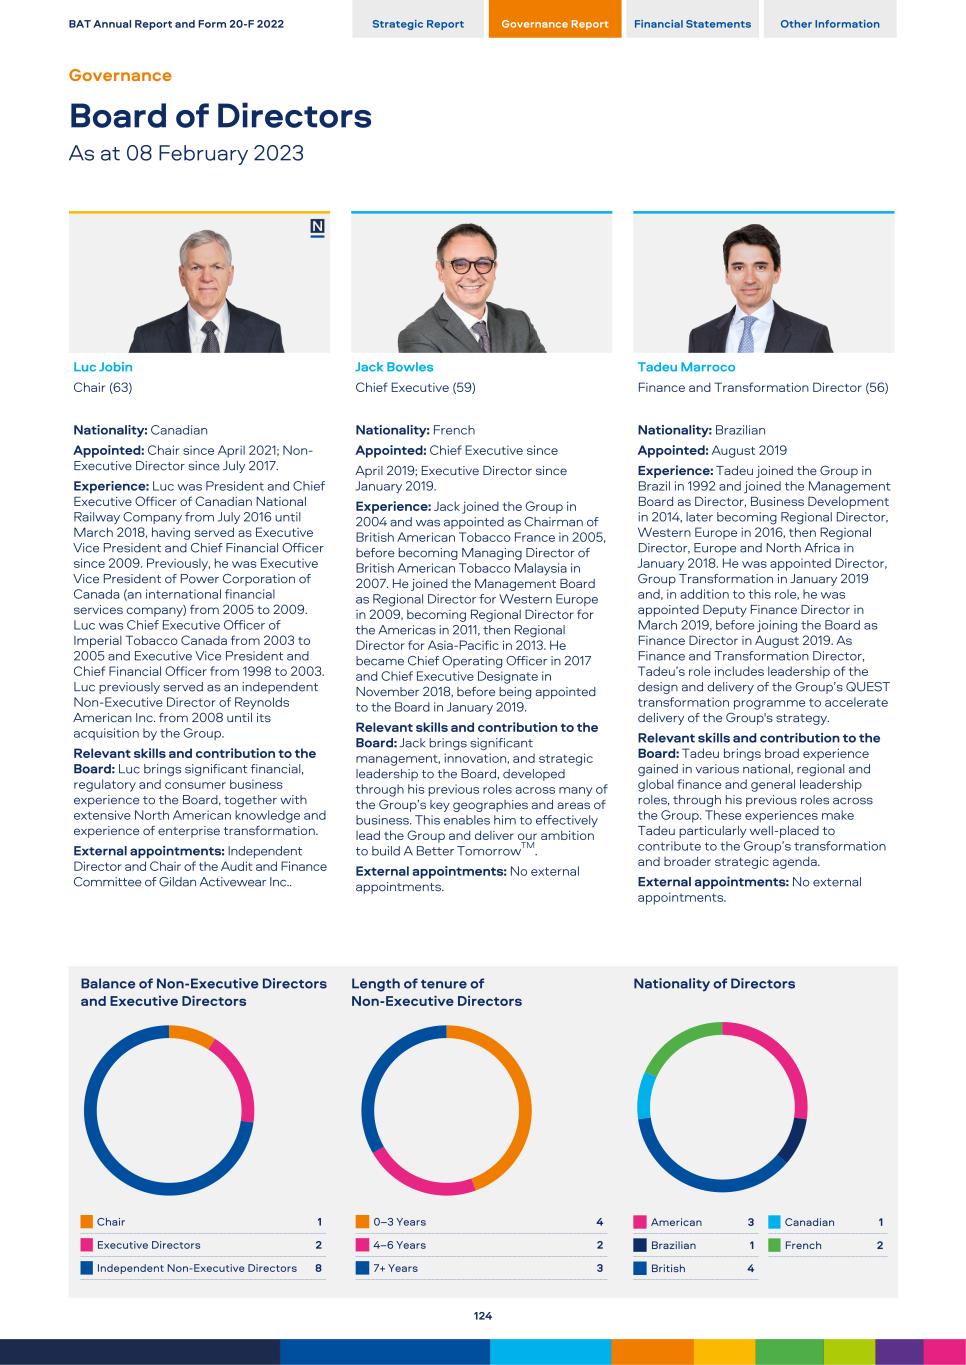
Luc Jobin Chair (63) Nationality: Canadian Appointed: Chair since April 2021; Non- Executive Director since July 2017. Experience: Luc was President and Chief Executive Officer of Canadian National Railway Company from July 2016 until March 2018, having served as Executive Vice President and Chief Financial Officer since 2009. Previously, he was Executive Vice President of Power Corporation of Canada (an international financial services company) from 2005 to 2009. Luc was Chief Executive Officer of Imperial Tobacco Canada from 2003 to 2005 and Executive Vice President and Chief Financial Officer from 1998 to 2003. Luc previously served as an independent Non-Executive Director of Reynolds American Inc. from 2008 until its acquisition by the Group. Relevant skills and contribution to the Board: Luc brings significant financial, regulatory and consumer business experience to the Board, together with extensive North American knowledge and experience of enterprise transformation. External appointments: Independent Director and Chair of the Audit and Finance Committee of Gildan Activewear Inc.. Balance of Non-Executive Directors and Executive Directors Chair 1 Executive Directors 2 Independent Non-Executive Directors 8 Jack Bowles Chief Executive (59) Nationality: French Appointed: Chief Executive since April 2019; Executive Director since January 2019. Experience: Jack joined the Group in 2004 and was appointed as Chairman of British American Tobacco France in 2005, before becoming Managing Director of British American Tobacco Malaysia in 2007. He joined the Management Board as Regional Director for Western Europe in 2009, becoming Regional Director for the Americas in 2011, then Regional Director for Asia-Pacific in 2013. He became Chief Operating Officer in 2017 and Chief Executive Designate in November 2018, before being appointed to the Board in January 2019. Relevant skills and contribution to the Board: Jack brings significant management, innovation, and strategic leadership to the Board, developed through his previous roles across many of the Group’s key geographies and areas of business. This enables him to effectively lead the Group and deliver our ambition to build A Better TomorrowTM. External appointments: No external appointments. Length of tenure of Non-Executive Directors 0–3 Years 4 4–6 Years 2 7+ Years 3 Tadeu Marroco Finance and Transformation Director (56) Nationality: Brazilian Appointed: August 2019 Experience: Tadeu joined the Group in Brazil in 1992 and joined the Management Board as Director, Business Development in 2014, later becoming Regional Director, Western Europe in 2016, then Regional Director, Europe and North Africa in January 2018. He was appointed Director, Group Transformation in January 2019 and, in addition to this role, he was appointed Deputy Finance Director in March 2019, before joining the Board as Finance Director in August 2019. As Finance and Transformation Director, Tadeu’s role includes leadership of the design and delivery of the Group’s QUEST transformation programme to accelerate delivery of the Group's strategy. Relevant skills and contribution to the Board: Tadeu brings broad experience gained in various national, regional and global finance and general leadership roles, through his previous roles across the Group. These experiences make Tadeu particularly well-placed to contribute to the Group’s transformation and broader strategic agenda. External appointments: No external appointments. Nationality of Directors American 3 Canadian 1 Brazilian 1 French 2 British 4 BAT Annual Report and Form 20-F 2022 Strategic Report Governance Report Financial Statements Other Information Governance Board of Directors As at 08 February 2023 124
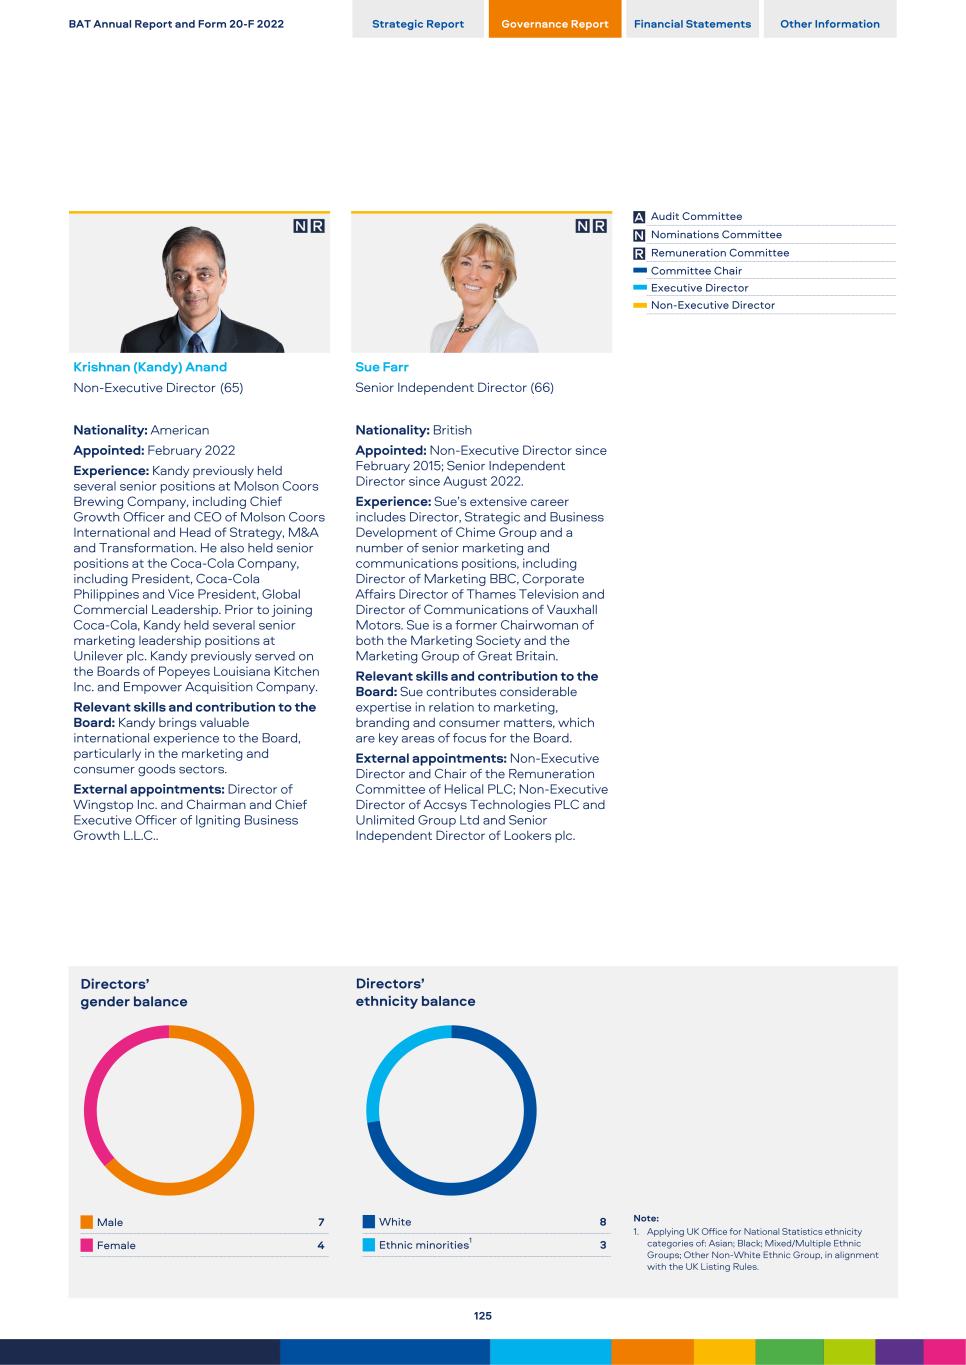
Krishnan (Kandy) Anand Non-Executive Director (65) Nationality: American Appointed: February 2022 Experience: Kandy previously held several senior positions at Molson Coors Brewing Company, including Chief Growth Officer and CEO of Molson Coors International and Head of Strategy, M&A and Transformation. He also held senior positions at the Coca-Cola Company, including President, Coca-Cola Philippines and Vice President, Global Commercial Leadership. Prior to joining Coca-Cola, Kandy held several senior marketing leadership positions at Unilever plc. Kandy previously served on the Boards of Popeyes Louisiana Kitchen Inc. and Empower Acquisition Company. Relevant skills and contribution to the Board: Kandy brings valuable international experience to the Board, particularly in the marketing and consumer goods sectors. External appointments: Director of Wingstop Inc. and Chairman and Chief Executive Officer of Igniting Business Growth L.L.C.. Directors’ gender balance Male 7 Female 4 Sue Farr Senior Independent Director (66) Nationality: British Appointed: Non-Executive Director since February 2015; Senior Independent Director since August 2022. Experience: Sue’s extensive career includes Director, Strategic and Business Development of Chime Group and a number of senior marketing and communications positions, including Director of Marketing BBC, Corporate Affairs Director of Thames Television and Director of Communications of Vauxhall Motors. Sue is a former Chairwoman of both the Marketing Society and the Marketing Group of Great Britain. Relevant skills and contribution to the Board: Sue contributes considerable expertise in relation to marketing, branding and consumer matters, which are key areas of focus for the Board. External appointments: Non-Executive Director and Chair of the Remuneration Committee of Helical PLC; Non-Executive Director of Accsys Technologies PLC and Unlimited Group Ltd and Senior Independent Director of Lookers plc. Directors’ ethnicity balance White 8 Ethnic minorities1 3 Audit Committee Nominations Committee Remuneration Committee Committee Chair Executive Director Non-Executive Director Note: 1. Applying UK Office for National Statistics ethnicity categories of: Asian; Black; Mixed/Multiple Ethnic Groups; Other Non-White Ethnic Group, in alignment with the UK Listing Rules. BAT Annual Report and Form 20-F 2022 Strategic Report Governance Report Financial Statements Other Information 125
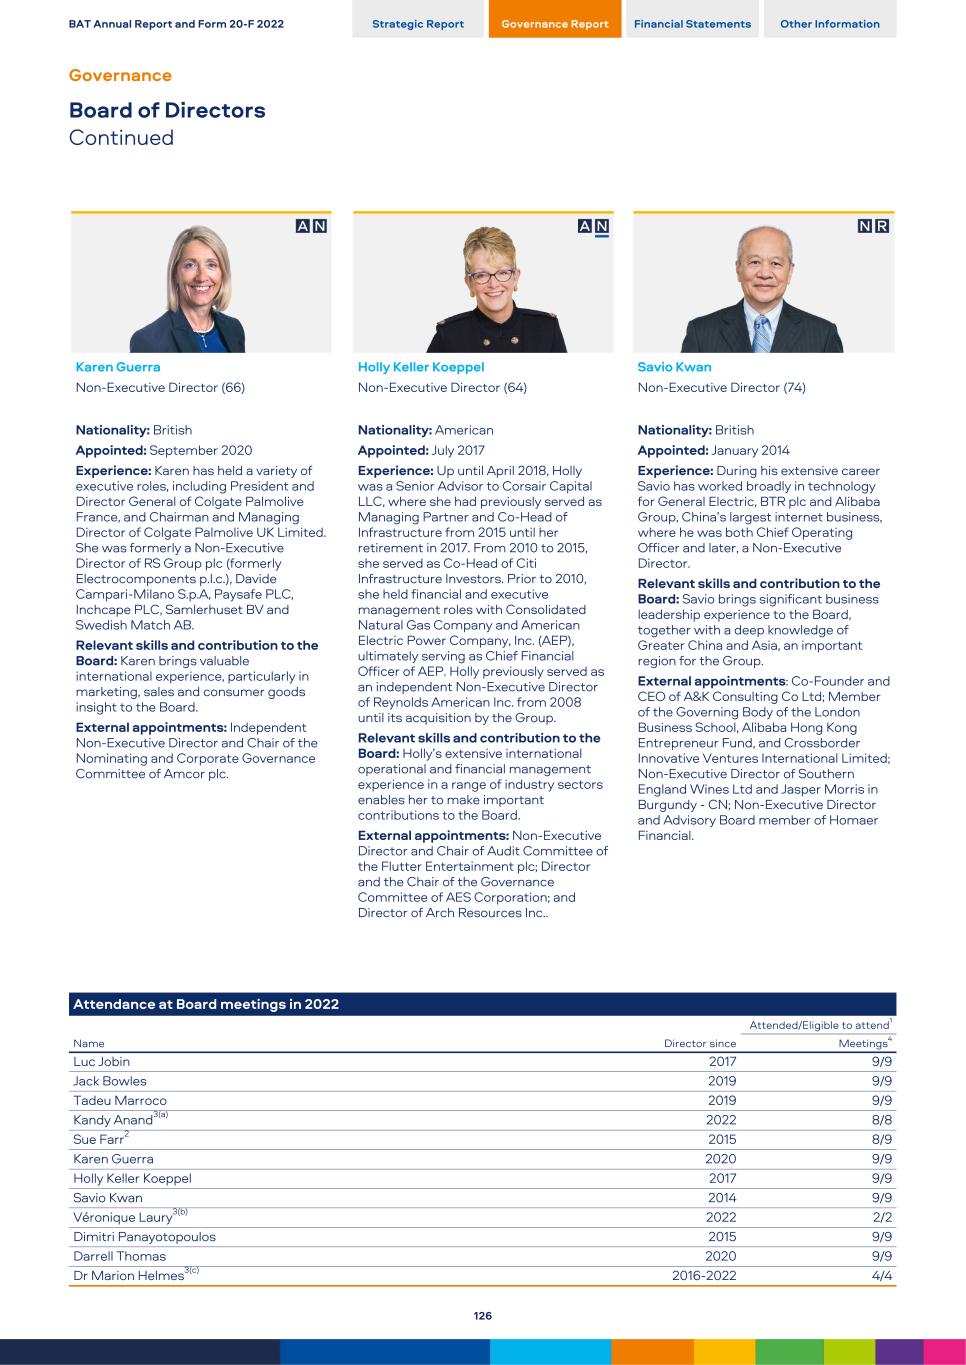
Karen Guerra Non-Executive Director (66) Nationality: British Appointed: September 2020 Experience: Karen has held a variety of executive roles, including President and Director General of Colgate Palmolive France, and Chairman and Managing Director of Colgate Palmolive UK Limited. She was formerly a Non-Executive Director of RS Group plc (formerly Electrocomponents p.l.c.), Davide Campari-Milano S.p.A, Paysafe PLC, Inchcape PLC, Samlerhuset BV and Swedish Match AB. Relevant skills and contribution to the Board: Karen brings valuable international experience, particularly in marketing, sales and consumer goods insight to the Board. External appointments: Independent Non-Executive Director and Chair of the Nominating and Corporate Governance Committee of Amcor plc. Attendance at Board meetings in 2022 Attended/Eligible to attend1 Name Director since Meetings4 Luc Jobin 2017 9/9 Jack Bowles 2019 9/9 Tadeu Marroco 2019 9/9 Kandy Anand3(a) 2022 8/8 Sue Farr2 2015 8/9 Karen Guerra 2020 9/9 Holly Keller Koeppel 2017 9/9 Savio Kwan 2014 9/9 Véronique Laury3(b) 2022 2/2 Dimitri Panayotopoulos 2015 9/9 Darrell Thomas 2020 9/9 Dr Marion Helmes3(c) 2016-2022 4/4 Holly Keller Koeppel Non-Executive Director (64) Nationality: American Appointed: July 2017 Experience: Up until April 2018, Holly was a Senior Advisor to Corsair Capital LLC, where she had previously served as Managing Partner and Co-Head of Infrastructure from 2015 until her retirement in 2017. From 2010 to 2015, she served as Co-Head of Citi Infrastructure Investors. Prior to 2010, she held financial and executive management roles with Consolidated Natural Gas Company and American Electric Power Company, Inc. (AEP), ultimately serving as Chief Financial Officer of AEP. Holly previously served as an independent Non-Executive Director of Reynolds American Inc. from 2008 until its acquisition by the Group. Relevant skills and contribution to the Board: Holly’s extensive international operational and financial management experience in a range of industry sectors enables her to make important contributions to the Board. External appointments: Non-Executive Director and Chair of Audit Committee of the Flutter Entertainment plc; Director and the Chair of the Governance Committee of AES Corporation; and Director of Arch Resources Inc.. Savio Kwan Non-Executive Director (74) Nationality: British Appointed: January 2014 Experience: During his extensive career Savio has worked broadly in technology for General Electric, BTR plc and Alibaba Group, China’s largest internet business, where he was both Chief Operating Officer and later, a Non-Executive Director. Relevant skills and contribution to the Board: Savio brings significant business leadership experience to the Board, together with a deep knowledge of Greater China and Asia, an important region for the Group. External appointments: Co-Founder and CEO of A&K Consulting Co Ltd; Member of the Governing Body of the London Business School, Alibaba Hong Kong Entrepreneur Fund, and Crossborder Innovative Ventures International Limited; Non-Executive Director of Southern England Wines Ltd and Jasper Morris in Burgundy - CN; Non-Executive Director and Advisory Board member of Homaer Financial. BAT Annual Report and Form 20-F 2022 Strategic Report Governance Report Financial Statements Other Information Governance Board of Directors Continued 126
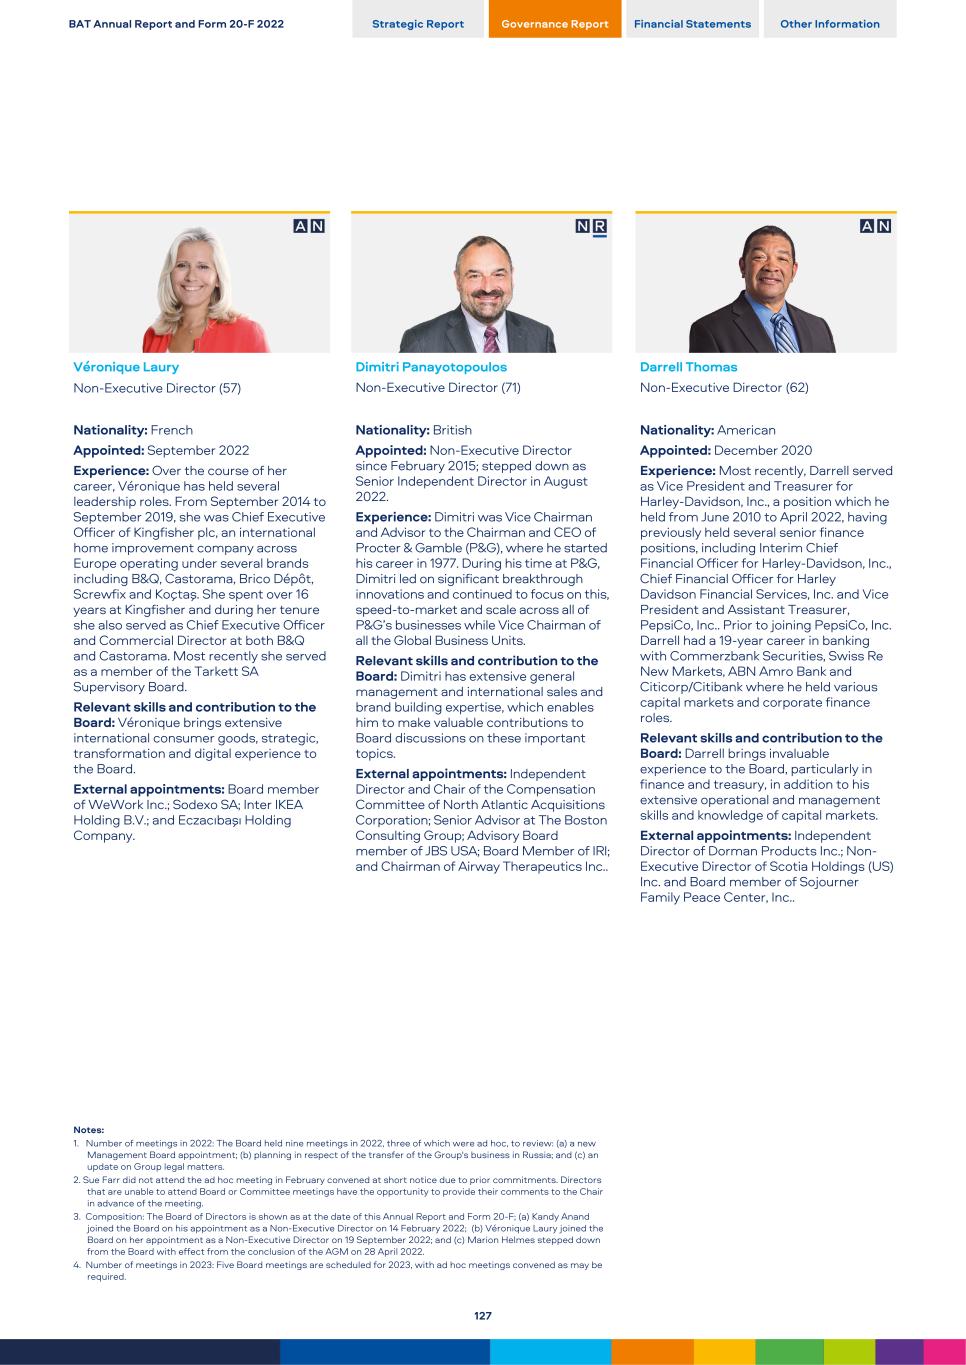
Véronique Laury Non-Executive Director (57) Nationality: French Appointed: September 2022 Experience: Over the course of her career, Véronique has held several leadership roles. From September 2014 to September 2019, she was Chief Executive Officer of Kingfisher plc, an international home improvement company across Europe operating under several brands including B&Q, Castorama, Brico Dépôt, Screwfix and Koçtaş. She spent over 16 years at Kingfisher and during her tenure she also served as Chief Executive Officer and Commercial Director at both B&Q and Castorama. Most recently she served as a member of the Tarkett SA Supervisory Board. Relevant skills and contribution to the Board: Véronique brings extensive international consumer goods, strategic, transformation and digital experience to the Board. External appointments: Board member of WeWork Inc.; Sodexo SA; Inter IKEA Holding B.V.; and Eczacıbaşı Holding Company. Notes: 1. Number of meetings in 2022: The Board held nine meetings in 2022, three of which were ad hoc, to review: (a) a new Management Board appointment; (b) planning in respect of the transfer of the Group's business in Russia; and (c) an update on Group legal matters. 2. Sue Farr did not attend the ad hoc meeting in February convened at short notice due to prior commitments. Directors that are unable to attend Board or Committee meetings have the opportunity to provide their comments to the Chair in advance of the meeting. 3. Composition: The Board of Directors is shown as at the date of this Annual Report and Form 20-F; (a) Kandy Anand joined the Board on his appointment as a Non-Executive Director on 14 February 2022; (b) Véronique Laury joined the Board on her appointment as a Non-Executive Director on 19 September 2022; and (c) Marion Helmes stepped down from the Board with effect from the conclusion of the AGM on 28 April 2022. 4. Number of meetings in 2023: Five Board meetings are scheduled for 2023, with ad hoc meetings convened as may be required. Dimitri Panayotopoulos Non-Executive Director (71) Nationality: British Appointed: Non-Executive Director since February 2015; stepped down as Senior Independent Director in August 2022. Experience: Dimitri was Vice Chairman and Advisor to the Chairman and CEO of Procter & Gamble (P&G), where he started his career in 1977. During his time at P&G, Dimitri led on significant breakthrough innovations and continued to focus on this, speed-to-market and scale across all of P&G’s businesses while Vice Chairman of all the Global Business Units. Relevant skills and contribution to the Board: Dimitri has extensive general management and international sales and brand building expertise, which enables him to make valuable contributions to Board discussions on these important topics. External appointments: Independent Director and Chair of the Compensation Committee of North Atlantic Acquisitions Corporation; Senior Advisor at The Boston Consulting Group; Advisory Board member of JBS USA; Board Member of IRI; and Chairman of Airway Therapeutics Inc.. Darrell Thomas Non-Executive Director (62) Nationality: American Appointed: December 2020 Experience: Most recently, Darrell served as Vice President and Treasurer for Harley-Davidson, Inc., a position which he held from June 2010 to April 2022, having previously held several senior finance positions, including Interim Chief Financial Officer for Harley-Davidson, Inc., Chief Financial Officer for Harley Davidson Financial Services, Inc. and Vice President and Assistant Treasurer, PepsiCo, Inc.. Prior to joining PepsiCo, Inc. Darrell had a 19-year career in banking with Commerzbank Securities, Swiss Re New Markets, ABN Amro Bank and Citicorp/Citibank where he held various capital markets and corporate finance roles. Relevant skills and contribution to the Board: Darrell brings invaluable experience to the Board, particularly in finance and treasury, in addition to his extensive operational and management skills and knowledge of capital markets. External appointments: Independent Director of Dorman Products Inc.; Non- Executive Director of Scotia Holdings (US) Inc. and Board member of Sojourner Family Peace Center, Inc.. BAT Annual Report and Form 20-F 2022 Strategic Report Governance Report Financial Statements Other Information 127

Jack Bowles Chief Executive (59) Tadeu Marroco Finance and Transformation Director (56) Read more on page 124 Jerome Abelman Director, Legal and External Affairs and General Counsel (59) Nationality: American Jerome was appointed General Counsel and Director, Legal and External Affairs in May 2015 after joining the Management Board as Director, Corporate and Regulatory Affairs in January 2015. He served as a Director on the Board of Reynolds American Inc. from February 2016 until July 2017. Luciano Comin Regional Director, Americas and Sub-Saharan Africa (53) Nationality: Italian/Argentinian Luciano joined the Management Board as Regional Director, Americas and Sub-Saharan Africa in January 2019. He joined the Group in 1992 and has held a wide range of roles, including Marketing Director in Venezuela, Marketing Director in Mexico and General Manager of BAT Mexico. Luciano was also Regional Marketing Manager for Western Europe and then Regional Head of Marketing, Americas and Sub-Saharan Africa before his appointment to the Management Board. Michael Dijanosic Regional Director, Asia- Pacific and Middle East (51) Nationality: Australian Michael was appointed Regional Director for Asia- Pacific and Middle East in September 2020 and joined the Management Board at the same time. Previously, he was Area Director for Asia- Pacific and Global Travel Retail. Michael joined the Group in 1999 and has held several senior roles in the Group including General Manager (Papua New Guinea and Cambodia) and Regional Manager, Asia-Pacific. Javed Iqbal Director, Digital and Information (50) Nationality: Pakistani Javed joined the Group as a Management Trainee, Finance in 1996 having previously held a number of senior roles, most recently as the Area Director for Middle East, South Asia and North Africa. He joined the Management Board as Director, Digital and Information in April 2022 to lead the next phase of BAT’s strategic digital transformation. Zafar Khan Director, Operations (50) Nationality: Pakistani Zafar was appointed Director, Operations in February 2021 and became a member of the Management Board at the same time. Previously, he was Group Head of New Categories Operations. Zafar joined BAT in 1996 and has held several senior roles in the Group, including Regional Head of Operations Asia Pacific & Middle East, Group Head of Plan, Service & Logistics, Regional Head of Plan and Service for Western Europe and Head of Operations, Bangladesh. Hae In Kim Director, Talent, Culture and Inclusion (48) Nationality: Korean Hae In joined the Management Board as Director, Talent and Culture Designate in January 2019 and became Director, Talent and Culture in April 2019, subsequently the role title changed to Talent, Culture and Inclusion. She was previously Group Head of Talent and Organisational Effectiveness and has held several other senior HR roles in the Group. Prior to joining the Group in 2008, she gained experience at Samsung, IBM Consulting Services and PricewaterhouseCoopers. BAT Annual Report and Form 20-F 2022 Strategic Report Governance Report Financial Statements Other Information Governance Management Board As at 08 February 2023 128

Paul Lageweg Director, New Categories (53) Nationality: Dutch Paul joined the Management Board as Director, New Categories in January 2019. He has been with the Group for 14 years in various senior roles, including Regional Marketing Manager, Asia- Pacific and Middle East, Area Director, East Asia and Global Head of Marketing Futures. Guy Meldrum President and CEO, Reynolds American Inc. (51) Nationality: New Zealander Guy was appointed President and CEO of Reynolds American Inc. in September 2020, having joined the Management Board as Regional Director, Asia- Pacific and Middle East in January 2019. Previously, he was Area Director, Australasia Area. Guy joined the Group in 1993 and has held several senior roles in the Group including Area Director, North Asia Area and Marketing Director, Russia. Dr James Murphy Director, Research and Science Designate (47) Nationality: Irish James was appointed Director, Research and Science Designate in February 2023 and became a member of the Management Board at the same time. He has been with the Group for more than 17 years in various senior roles in the Group, including EVP U.S. Scientific Research & Development based in the US, as well as Group Head of PRRP Science and Regional Product Manager for Americas and Sub-Saharan Africa. Dr David O’Reilly Director, Research and Science (56) Nationality: British David was appointed Director, Research and Science in January 2019, having joined the Management Board as Group Scientific Director in 2012, leading R&D’s focus on potentially reduced-risk products. He has been with the Group for more than 20 years and was previously Head of International Public Health and Scientific Affairs, responsible for engagement with scientific, medical and public health communities. Johan Vandermeulen Regional Director, Europe (55) Nationality: Belgian Johan was appointed Regional Director, Europe and North Africa in January 2019. From 1 January 2022, his role title is Regional Director, Europe. Johan joined the Management Board in 2014 as Regional Director for Eastern Europe, Middle East and Africa, then became Regional Director, Asia- Pacific and Middle East in January 2018. He has been with the Group for more than 30 years and his previous roles include General Manager in Russia and Turkey and Global Brand Director for the Kent brand. Kingsley Wheaton Chief Growth Officer (49) Nationality: British In September 2022, Kingsley was appointed Chief Growth Officer. He joined the Group in 1996 and has held various senior marketing positions, most recently as Chief Marketing Officer. He was appointed to the Management Board as Corporate and Regulatory Affairs Director in 2012. In January 2015, he became Managing Director, Next Generation Products and then Regional Director, Americas and Sub-Saharan Africa in January 2018. Note: Effective 28 February 2023, Dr David O'Reilly will step down from the Management Board. David will be succeeded by Dr. James Murphy who joined the Management Board as the Director, Research and Science Designate with effect from 1 February 2023, before assuming the role of Director, Research and Science, reporting to the Chief Executive, on 1 March 2023. BAT Annual Report and Form 20-F 2022 Strategic Report Governance Report Financial Statements Other Information 129
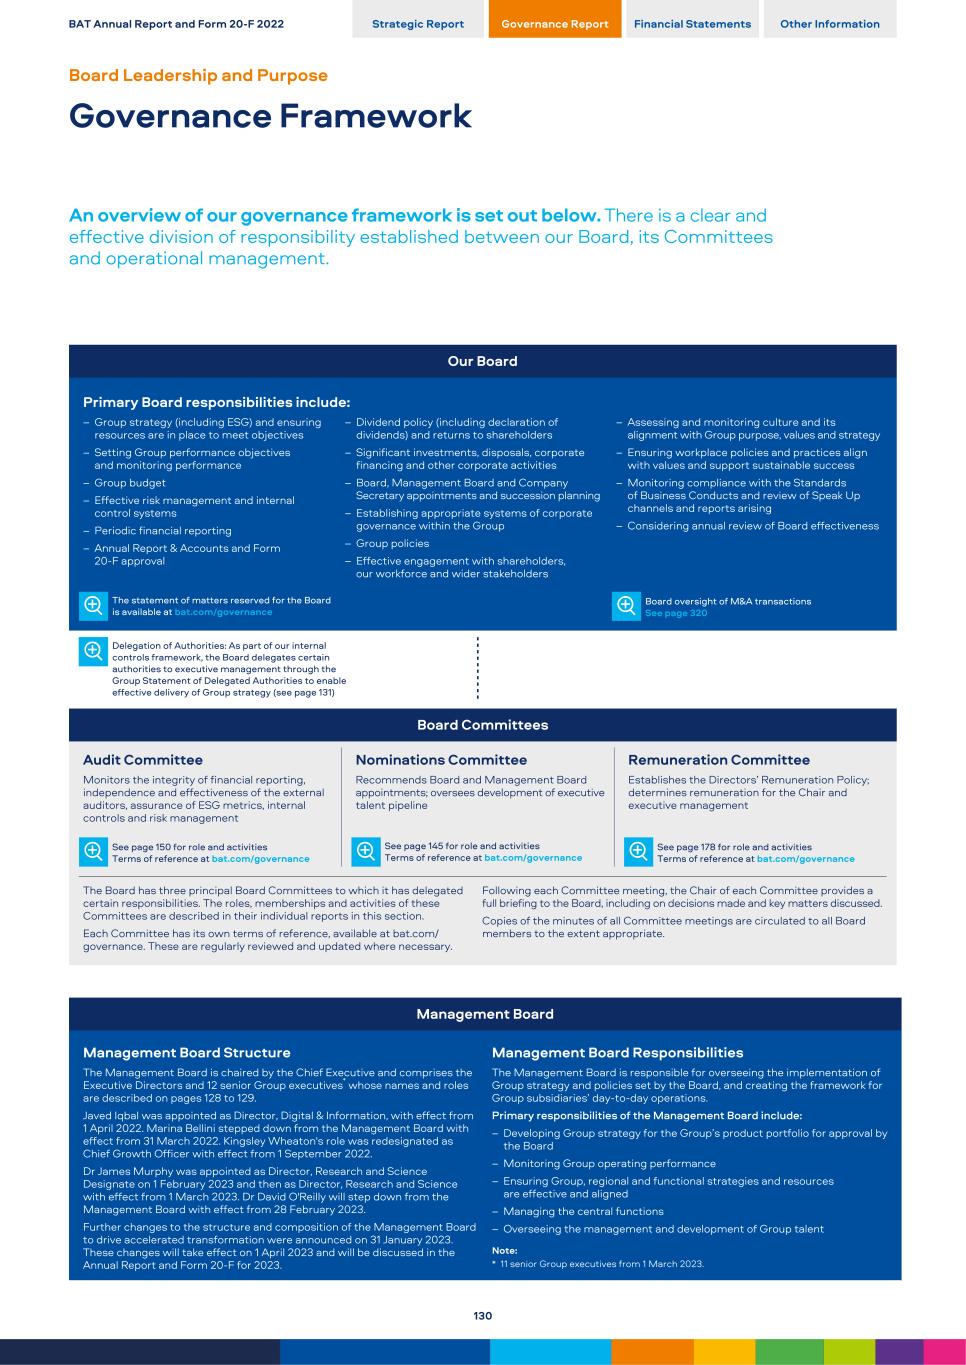
Our Board Primary Board responsibilities include: – Group strategy (including ESG) and ensuring resources are in place to meet objectives – Setting Group performance objectives and monitoring performance – Group budget – Effective risk management and internal control systems – Periodic financial reporting – Annual Report & Accounts and Form 20-F approval – Dividend policy (including declaration of dividends) and returns to shareholders – Significant investments, disposals, corporate financing and other corporate activities – Board, Management Board and Company Secretary appointments and succession planning – Establishing appropriate systems of corporate governance within the Group – Group policies – Effective engagement with shareholders, our workforce and wider stakeholders – Assessing and monitoring culture and its alignment with Group purpose, values and strategy – Ensuring workplace policies and practices align with values and support sustainable success – Monitoring compliance with the Standards of Business Conducts and review of Speak Up channels and reports arising – Considering annual review of Board effectiveness The statement of matters reserved for the Board is available at bat.com/governance Board oversight of M&A transactions See page 320 Delegation of Authorities: As part of our internal controls framework, the Board delegates certain authorities to executive management through the Group Statement of Delegated Authorities to enable effective delivery of Group strategy (see page 131) Board Committees Audit Committee Nominations Committee Remuneration Committee Monitors the integrity of financial reporting, independence and effectiveness of the external auditors, assurance of ESG metrics, internal controls and risk management Recommends Board and Management Board appointments; oversees development of executive talent pipeline Establishes the Directors’ Remuneration Policy; determines remuneration for the Chair and executive management See page 150 for role and activities Terms of reference at bat.com/governance See page 145 for role and activities Terms of reference at bat.com/governance See page 178 for role and activities Terms of reference at bat.com/governance The Board has three principal Board Committees to which it has delegated certain responsibilities. The roles, memberships and activities of these Committees are described in their individual reports in this section. Each Committee has its own terms of reference, available at bat.com/ governance. These are regularly reviewed and updated where necessary. Following each Committee meeting, the Chair of each Committee provides a full briefing to the Board, including on decisions made and key matters discussed. Copies of the minutes of all Committee meetings are circulated to all Board members to the extent appropriate. Management Board Management Board Structure Management Board Responsibilities The Management Board is chaired by the Chief Executive and comprises the Executive Directors and 12 senior Group executives* whose names and roles are described on pages 128 to 129. Javed Iqbal was appointed as Director, Digital & Information, with effect from 1 April 2022. Marina Bellini stepped down from the Management Board with effect from 31 March 2022. Kingsley Wheaton's role was redesignated as Chief Growth Officer with effect from 1 September 2022. Dr James Murphy was appointed as Director, Research and Science Designate on 1 February 2023 and then as Director, Research and Science with effect from 1 March 2023. Dr David O'Reilly will step down from the Management Board with effect from 28 February 2023. Further changes to the structure and composition of the Management Board to drive accelerated transformation were announced on 31 January 2023. These changes will take effect on 1 April 2023 and will be discussed in the Annual Report and Form 20-F for 2023. The Management Board is responsible for overseeing the implementation of Group strategy and policies set by the Board, and creating the framework for Group subsidiaries’ day-to-day operations. Primary responsibilities of the Management Board include: – Developing Group strategy for the Group’s product portfolio for approval by the Board – Monitoring Group operating performance – Ensuring Group, regional and functional strategies and resources are effective and aligned – Managing the central functions – Overseeing the management and development of Group talent Note: * 11 senior Group executives from 1 March 2023. BAT Annual Report and Form 20-F 2022 Strategic Report Governance Report Financial Statements Other Information Board Leadership and Purpose Governance Framework An overview of our governance framework is set out below. There is a clear and effective division of responsibility established between our Board, its Committees and operational management. 130
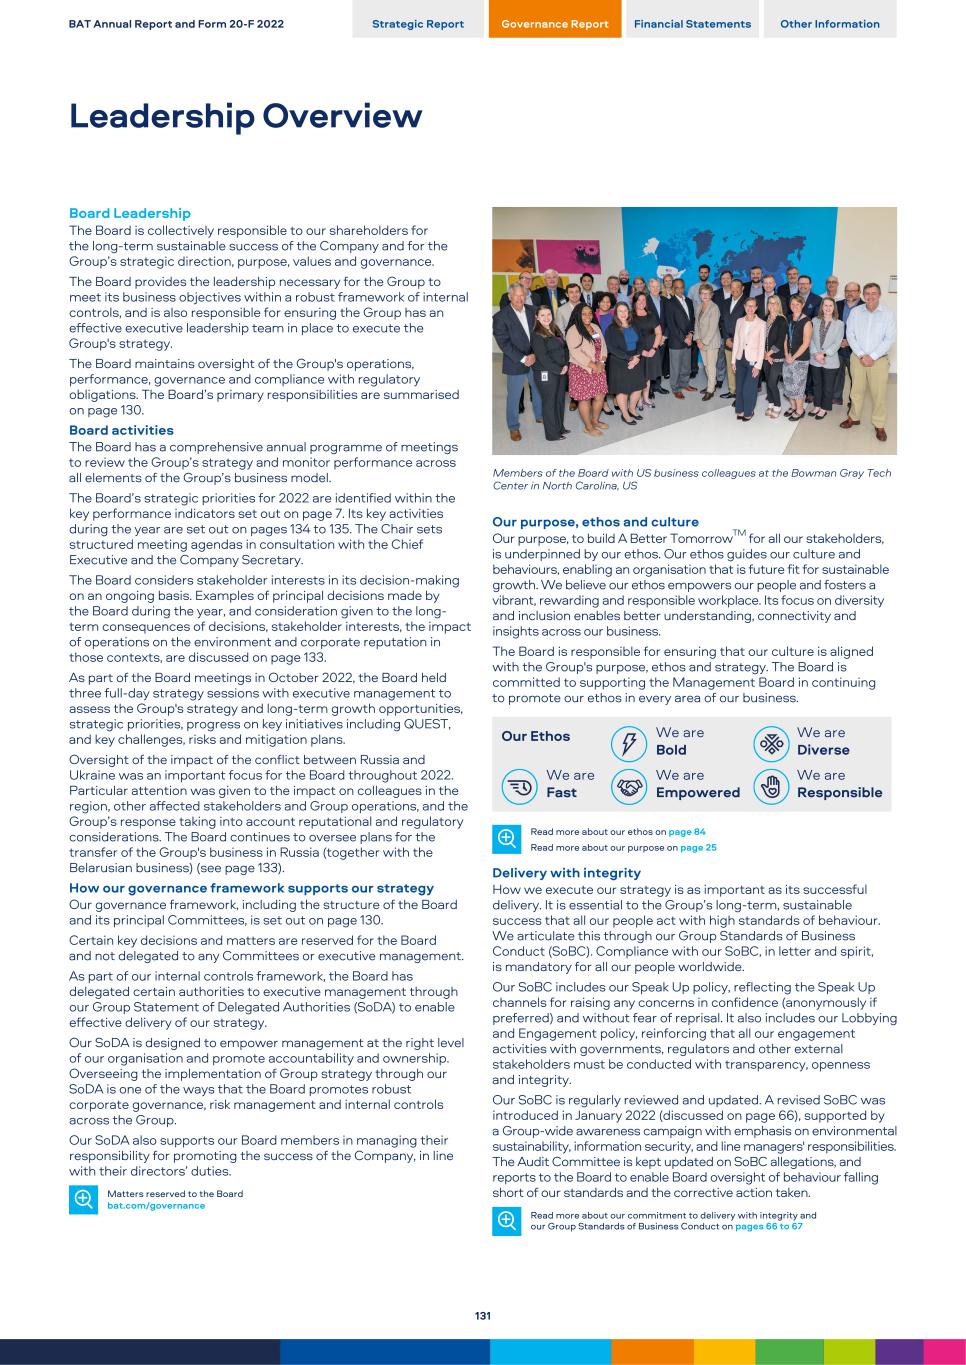
Board Leadership The Board is collectively responsible to our shareholders for the long-term sustainable success of the Company and for the Group’s strategic direction, purpose, values and governance. The Board provides the leadership necessary for the Group to meet its business objectives within a robust framework of internal controls, and is also responsible for ensuring the Group has an effective executive leadership team in place to execute the Group's strategy. The Board maintains oversight of the Group's operations, performance, governance and compliance with regulatory obligations. The Board’s primary responsibilities are summarised on page 130. Board activities The Board has a comprehensive annual programme of meetings to review the Group’s strategy and monitor performance across all elements of the Group’s business model. The Board’s strategic priorities for 2022 are identified within the key performance indicators set out on page 7. Its key activities during the year are set out on pages 134 to 135. The Chair sets structured meeting agendas in consultation with the Chief Executive and the Company Secretary. The Board considers stakeholder interests in its decision-making on an ongoing basis. Examples of principal decisions made by the Board during the year, and consideration given to the long- term consequences of decisions, stakeholder interests, the impact of operations on the environment and corporate reputation in those contexts, are discussed on page 133. As part of the Board meetings in October 2022, the Board held three full-day strategy sessions with executive management to assess the Group's strategy and long-term growth opportunities, strategic priorities, progress on key initiatives including QUEST, and key challenges, risks and mitigation plans. Oversight of the impact of the conflict between Russia and Ukraine was an important focus for the Board throughout 2022. Particular attention was given to the impact on colleagues in the region, other affected stakeholders and Group operations, and the Group’s response taking into account reputational and regulatory considerations. The Board continues to oversee plans for the transfer of the Group's business in Russia (together with the Belarusian business) (see page 133). How our governance framework supports our strategy Our governance framework, including the structure of the Board and its principal Committees, is set out on page 130. Certain key decisions and matters are reserved for the Board and not delegated to any Committees or executive management. As part of our internal controls framework, the Board has delegated certain authorities to executive management through our Group Statement of Delegated Authorities (SoDA) to enable effective delivery of our strategy. Our SoDA is designed to empower management at the right level of our organisation and promote accountability and ownership. Overseeing the implementation of Group strategy through our SoDA is one of the ways that the Board promotes robust corporate governance, risk management and internal controls across the Group. Our SoDA also supports our Board members in managing their responsibility for promoting the success of the Company, in line with their directors’ duties. Matters reserved to the Board bat.com/governance Members of the Board with US business colleagues at the Bowman Gray Tech Center in North Carolina, US Our purpose, ethos and culture Our purpose, to build A Better TomorrowTM for all our stakeholders, is underpinned by our ethos. Our ethos guides our culture and behaviours, enabling an organisation that is future fit for sustainable growth. We believe our ethos empowers our people and fosters a vibrant, rewarding and responsible workplace. Its focus on diversity and inclusion enables better understanding, connectivity and insights across our business. The Board is responsible for ensuring that our culture is aligned with the Group's purpose, ethos and strategy. The Board is committed to supporting the Management Board in continuing to promote our ethos in every area of our business. Our Ethos We are Bold We are Diverse We are Fast We are Empowered We are Responsible Read more about our ethos on page 84 Read more about our purpose on page 25 Delivery with integrity How we execute our strategy is as important as its successful delivery. It is essential to the Group’s long-term, sustainable success that all our people act with high standards of behaviour. We articulate this through our Group Standards of Business Conduct (SoBC). Compliance with our SoBC, in letter and spirit, is mandatory for all our people worldwide. Our SoBC includes our Speak Up policy, reflecting the Speak Up channels for raising any concerns in confidence (anonymously if preferred) and without fear of reprisal. It also includes our Lobbying and Engagement policy, reinforcing that all our engagement activities with governments, regulators and other external stakeholders must be conducted with transparency, openness and integrity. Our SoBC is regularly reviewed and updated. A revised SoBC was introduced in January 2022 (discussed on page 66), supported by a Group-wide awareness campaign with emphasis on environmental sustainability, information security, and line managers' responsibilities. The Audit Committee is kept updated on SoBC allegations, and reports to the Board to enable Board oversight of behaviour falling short of our standards and the corrective action taken. Read more about our commitment to delivery with integrity and our Group Standards of Business Conduct on pages 66 to 67 BAT Annual Report and Form 20-F 2022 Strategic Report Governance Report Financial Statements Other Information Leadership Overview 131
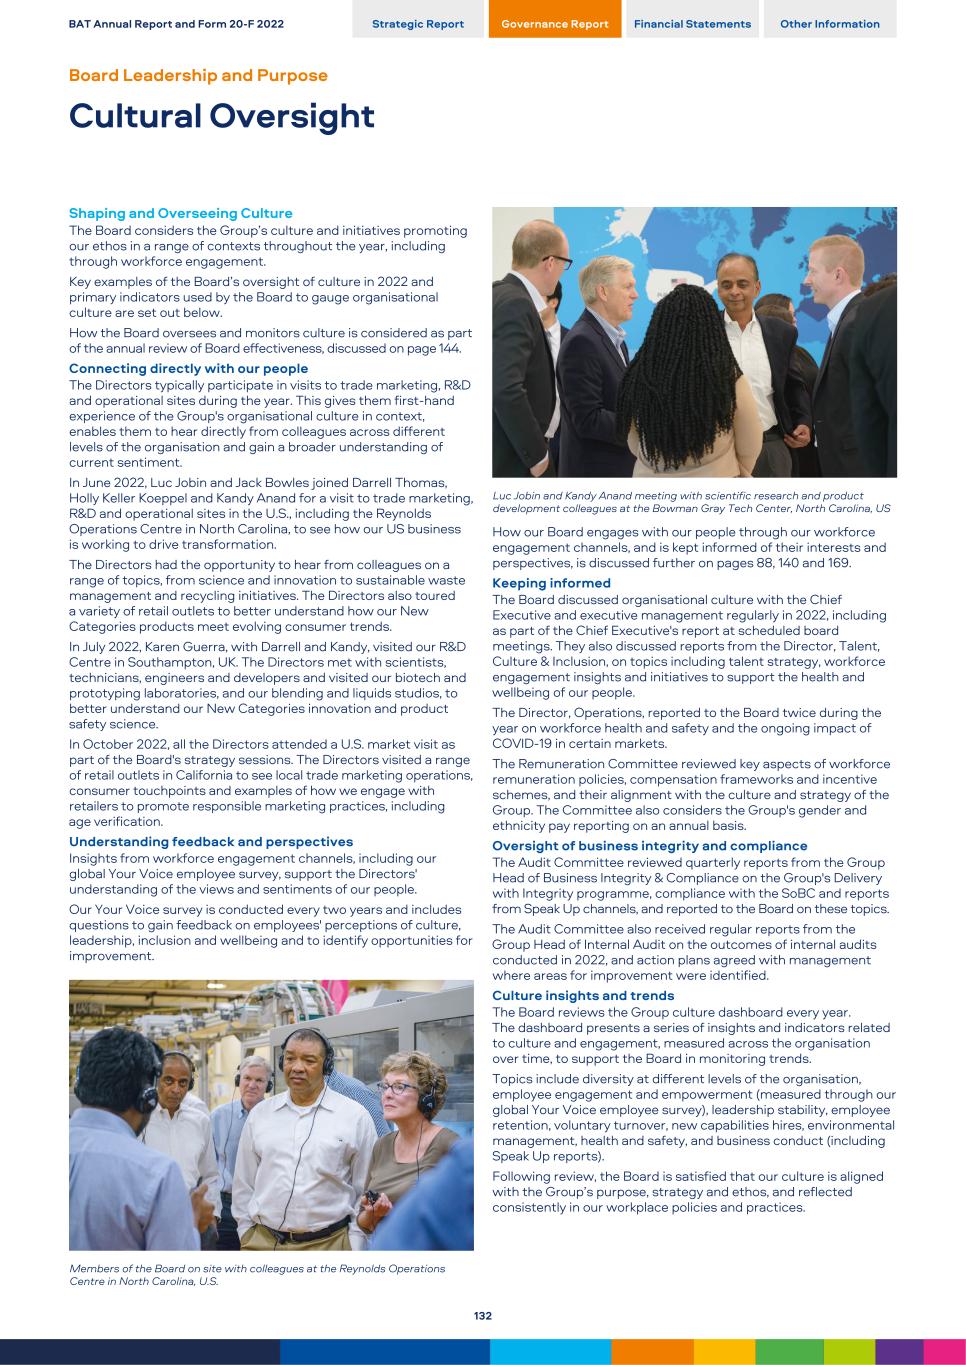
Shaping and Overseeing Culture The Board considers the Group’s culture and initiatives promoting our ethos in a range of contexts throughout the year, including through workforce engagement. Key examples of the Board’s oversight of culture in 2022 and primary indicators used by the Board to gauge organisational culture are set out below. How the Board oversees and monitors culture is considered as part of the annual review of Board effectiveness, discussed on page 144. Connecting directly with our people The Directors typically participate in visits to trade marketing, R&D and operational sites during the year. This gives them first-hand experience of the Group's organisational culture in context, enables them to hear directly from colleagues across different levels of the organisation and gain a broader understanding of current sentiment. In June 2022, Luc Jobin and Jack Bowles joined Darrell Thomas, Holly Keller Koeppel and Kandy Anand for a visit to trade marketing, R&D and operational sites in the U.S., including the Reynolds Operations Centre in North Carolina, to see how our US business is working to drive transformation. The Directors had the opportunity to hear from colleagues on a range of topics, from science and innovation to sustainable waste management and recycling initiatives. The Directors also toured a variety of retail outlets to better understand how our New Categories products meet evolving consumer trends. In July 2022, Karen Guerra, with Darrell and Kandy, visited our R&D Centre in Southampton, UK. The Directors met with scientists, technicians, engineers and developers and visited our biotech and prototyping laboratories, and our blending and liquids studios, to better understand our New Categories innovation and product safety science. In October 2022, all the Directors attended a U.S. market visit as part of the Board's strategy sessions. The Directors visited a range of retail outlets in California to see local trade marketing operations, consumer touchpoints and examples of how we engage with retailers to promote responsible marketing practices, including age verification. Understanding feedback and perspectives Insights from workforce engagement channels, including our global Your Voice employee survey, support the Directors' understanding of the views and sentiments of our people. Our Your Voice survey is conducted every two years and includes questions to gain feedback on employees' perceptions of culture, leadership, inclusion and wellbeing and to identify opportunities for improvement. Members of the Board on site with colleagues at the Reynolds Operations Centre in North Carolina, U.S. Luc Jobin and Kandy Anand meeting with scientific research and product development colleagues at the Bowman Gray Tech Center, North Carolina, US How our Board engages with our people through our workforce engagement channels, and is kept informed of their interests and perspectives, is discussed further on pages 88, 140 and 169. Keeping informed The Board discussed organisational culture with the Chief Executive and executive management regularly in 2022, including as part of the Chief Executive's report at scheduled board meetings. They also discussed reports from the Director, Talent, Culture & Inclusion, on topics including talent strategy, workforce engagement insights and initiatives to support the health and wellbeing of our people. The Director, Operations, reported to the Board twice during the year on workforce health and safety and the ongoing impact of COVID-19 in certain markets. The Remuneration Committee reviewed key aspects of workforce remuneration policies, compensation frameworks and incentive schemes, and their alignment with the culture and strategy of the Group. The Committee also considers the Group's gender and ethnicity pay reporting on an annual basis. Oversight of business integrity and compliance The Audit Committee reviewed quarterly reports from the Group Head of Business Integrity & Compliance on the Group's Delivery with Integrity programme, compliance with the SoBC and reports from Speak Up channels, and reported to the Board on these topics. The Audit Committee also received regular reports from the Group Head of Internal Audit on the outcomes of internal audits conducted in 2022, and action plans agreed with management where areas for improvement were identified. Culture insights and trends The Board reviews the Group culture dashboard every year. The dashboard presents a series of insights and indicators related to culture and engagement, measured across the organisation over time, to support the Board in monitoring trends. Topics include diversity at different levels of the organisation, employee engagement and empowerment (measured through our global Your Voice employee survey), leadership stability, employee retention, voluntary turnover, new capabilities hires, environmental management, health and safety, and business conduct (including Speak Up reports). Following review, the Board is satisfied that our culture is aligned with the Group’s purpose, strategy and ethos, and reflected consistently in our workplace policies and practices. BAT Annual Report and Form 20-F 2022 Strategic Report Governance Report Financial Statements Other Information Board Leadership and Purpose Cultural Oversight 132
Capital Allocation Fit for Growth Through its review and approval of the 2023 budget, the Board assessed capital allocation priorities to support the Group's long-term, sustainable growth in the context of a volatile macro-economic environment and inflationary pressures. The 2023 budget enables acceleration of New Categories performance towards our targets for revenue and profitability, supports EPS growth and continued deleveraging in accordance with our guidance and shareholder expectations, and takes account of the importance of maintaining financial flexibility and focus on dividend distribution. Capital allocation decisions made as part of the budget also take account of continued investment in robust product stewardship and scientific research, delivery of ESG targets including those aimed at reducing the environmental impact of our operations, workforce remuneration in an inflationary environment, and commercial arrangements with suppliers and customers. Key stakeholder perspectives taken into account Shareholders and Investors Consumers Customers Suppliers Our people Governments and wider society Quantum Phase 4 Strategic Review The Board reviewed plans to commence a strategic review of the Group's regional and business unit structures under Phase 4 of Quantum to support acceleration of the Group's transformation. The Board considered the longer-term benefits anticipated through restructuring, including enhanced resource allocation, potential to build new capabilities and development of the Group's marketing, product and science functions to steward world- class brands. In view of some anticipated reduction in headcount associated with the restructuring, the Board also took into account the impact on Group company employees and the importance of adopting a responsible approach to restructuring, including applicable information and consultation requirements in relevant markets. Key stakeholder perspectives taken into account Shareholders and Investors Our people Consumers Governments and wider society Transfer of the Group's Business in Russia The Board has closely monitored the impact of the evolving conflict in Ukraine on the Group and its operations, with the safety and wellbeing of Group company employees across the region as the first priority. In March 2022, the Board concluded that ownership of the Russian business was no longer sustainable and we announced initiation of the process to transfer that business. In reaching this conclusion, the Board considered the interests of our people in the region and measures taken to safeguard their physical security and welfare, expectations across all our stakeholders for high standards of business conduct, compliance with applicable sanctions and other regulatory considerations, and the impact on the Group's broader supply chain. Subsequently, the Board has overseen progress of activities towards transfer of the Russian business (together with the Belarusian business) within a complex and volatile context. Key stakeholder perspectives taken into account Shareholders and Investors Our people Consumers Customers Suppliers Governments and wider society Global Product Stewardship Framework Policy The Board approved a revised Global Product Stewardship Framework Policy with effect from 1 January 2023. The revised policy articulates our approach to robust product stewardship across our multi-category portfolio and our commitment to scientific engagement. Updates to the policy were informed by input from our research scientists, external benchmarking, current industry best practice and evolving product regulation. In approving the revised policy, the Board took into account the expectations of our consumers and wider stakeholders for consistently high standards of product stewardship and the importance of maintaining those standards as part of our long-term sustainable success. The Board also took account of our commitment to offer adult consumers brands they can trust that are manufactured to high quality and safety standards. Key stakeholder perspectives taken into account Shareholders and Investors Consumers Customers Suppliers Governments and wider society We define principal decisions as those decisions and discussions by the Board that are strategic or material to the Group and those of significance to any of our key stakeholders. BAT Annual Report and Form 20-F 2022 Strategic Report Governance Report Financial Statements Other Information Principal Decisions Made by the Board Outlined below are some of the principal decisions made by the Board over the year, highlighting how the Board considered relevant factors, including key stakeholder perspectives, the environment, reputation for high standards of business conduct, and the long-term impact of decisions. Our key stakeholders and how the Board engages with them are discussed further on pages 136 to 140. Board activities in 2022 are set out in pages 134 to 135. 133
Simplify the Business The Board understands our business is enabled by simplifying our structures, embracing digital transformation, and rigorous cost management Activities in 2022 – reviewing progress of Quantum implementation (part of QUEST), across Phase 1 organisational design and business simplification; Phase 2 End Market operating model optimisation; and Phase 3 head office restructuring and leverage of Global Business Solutions to increase efficiencies, and savings delivered against target to release funds for investment; – reviewing design and planning activities for Quantum Phase 4 operating model to optimise the Group's geographical footprint and develop foundations for a multi-category future; – oversight of broader QUEST programme implementation to accelerate enterprise capabilities and enablers, highlighted below; – reviewing plans to further drive Global Business Solutions efficiency and effectiveness in delivering end-to-end business processes; and – oversight of New Categories initiatives to optimise cost of goods, drive marketing spend efficiencies and reduce portfolio complexity as part of the Group’s focus on stronger, global brands. Step change in New Categories Performance Continued investment and development of New Categories to accelerate growth is a strategic focus of the Board’s agenda Activities in 2022 – reviewing Group and regional performance against strategy to accelerate New Categories growth and key performance indicators, including New Categories revenue, contribution and market share; – reviewing industry, Group and regional performance outlook and the competitive environment; – reviewing our New Categories investment glidepath and innovation pipeline across product portfolios, with focus on the new glo Hyper X2 product; – evaluating consumer adoption, trading environment and competitor landscape across New Categories portfolios; – reviewing the Group’s New Categories supply chain, its resilience, sourcing footprint, impact of inflationary pressures and optimisation strategies developed to mitigate impacts; – overseeing the development of strategic opportunities beyond nicotine, including Btomorrow Ventures’ strategic mandate and portfolio investments; – reviewing the regulatory landscape in New Categories and beyond nicotine across key markets, with deep dive reviews on Europe and the US; and – assessing strategic options for developing beyond nicotine foundations in wellbeing and stimulation. Drive value from Combustibles Driving value from combustibles is a core priority for the Board, to deliver today and build A Better Tomorrow™ Activities in 2022 – assessing strategic approach to drive value from combustibles to fund New Categories investment, including review of market archetypes, portfolio complexity reduction, revenue growth management and marketing spend efficiency initiatives; – reviewing Group and regional performance against strategy and key performance indicators, including value share growth and stock-keeping unit rationalisation; – reviewing industry outlook, trading environment and competitor landscape through a global and regional lens; – reviewing combustible product portfolios, product development pipelines and leaf blend optimisation across the Group’s global drive brand portfolio; – understanding the impact of growth in illicit trade, particularly in developing markets; – reviewing evolving global product regulation, including regulation of menthol and flavours, particularly in the US; and – reviewing the impact of evolving tax regimes, with focus in particular on excise tax developments in the US. The five QUEST enablers are: Quantum Quantum’s objective is to simplify the organisation and generate funds through cost savings to reinvest in New Categories. Board oversight of Quantum in 2022 is discussed above. Unleash Innovation Strategy to sharpen BAT's R&D innovation model, including focus for investment, partnering with external innovation partners and development of talent capabilities. Empowered organisation Building an engaged, agile and high performing organisation, with winning capabilities, accountable and empowered leaders, and a fit-for- growth organisational design with an ambitious diversity and inclusion agenda. Shaping Sustainability Accelerating our path to becoming a truly sustainable enterprise through transparent engagement with scientists, regulators and policy-makers so that our strategy takes account of their views, developing our New Categories science programmes while advocating for appropriate standards and regulations and evolving our approach to ESG reporting in line with stakeholder expectations. Technology and digital Driving digital transformation across our organisation, using data and analytics and developing enhanced digital capabilities. Fit for future growth The Board oversees the implementation of our QUEST programme, which lays the foundations for the Group's multi-category future. The Finance and Transformation Director is the programme director for Quest and responsible for QUEST implementation. In 2022, the Board reviewed progress on QUEST’s five capability accelerators with the Management Board, including in depth reviews at the Board's strategy sessions in October. Read more about our QUEST programme and capability accelerators on pages 24 to 25 BAT Annual Report and Form 20-F 2022 Strategic Report Governance Report Financial Statements Other Information Board Leadership and Purpose Board Activities 134
Financial and Risk The Board pays close attention to Group performance and financial matters, internal control, and integrity of reporting and risk management Activities in 2022 – approving the Group budget, reviewing the application of the Group's flexible capital allocation strategy, and oversight of resource allocation activities to support strategy execution; – reviewing Group financial performance against key performance metrics, current outlook, challenges and opportunities for growth in each region, and FX impacts; – reviewing Group half-year results, trading updates, year-end results and the Annual Report and Form 20-F; – approving the share buyback programme for 2022; – reviewing share price performance and investor and broker perspectives; – approving interim dividend proposals and assessing distributable reserves of the Company prior to dividend payments; – determining Group viability, taking into account current position and principal risks; – reviewing compliance with Group financing principles, including liquidity, capital allocation and net debt/EBITDA; – reviewing the Group’s revolving credit facilities, refinancings, the Euro hybrid bond issuance, and debt issuance programmes; – reviewing Group cash flow performance and opportunities to optimise the balance sheet to enable investment, while reducing the carrying value of debt; – assessing the impact of macro-economic trends on Group performance, outlook and operations due to geopolitical instability, increasing inflation and rising interest rates; – reviewing the Group risk register, and risk appetite in the context of strategic objectives and emerging risks, with focus on the impacts of the conflict in Ukraine and inflationary pressures on supply chains; – reviewing status of litigation involving Group companies; – reviewing Group insurance coverage; and – reviewing financial performance of associates of the Group periodically. Environmental, Social, Governance The Board emphasises that our strategy, business, and product portfolio be sustainable for the long term and meet our evolving societal responsibilities Activities in 2022 – assessing the impact of the evolving conflict in Ukraine on Group company personnel in the region and other affected stakeholders, reputational and regulatory considerations, and Group business continuity structures and plans to manage the Group’s response; – overseeing the Group's ESG strategy, including climate-related issues and opportunities for the Group, and reviewing performance against the Group's ESG metrics; – reviewing environmental performance for the preceding year and progress against glidepaths towards achieving the Group’s environmental targets, including in relation to climate (targets aligned to net zero emissions by 2050), renewable energy, water stewardship and recycling; – approving revised versions of the Group's Environment and Health & Safety Policies, effective from July 2022; – approving the Group's new Global Product Stewardship Framework, effective from January 2023; – reviewing the perspectives of the Group’s key stakeholders, the Group’s response to stakeholder perspectives, and the effectiveness of engagement mechanisms; – reviewing the outcomes of the Investor Perception Survey conducted in 2022; – reviewing the outcomes of the ESG Double Materiality Assessment conducted in 2022 and oversight of the creation of a new leadership role of Chief Sustainability Officer as a resulting action; – approving the annual Modern Slavery Act statement and annual Conflict Minerals Report; – approving revised Articles of Association for the Company, to be proposed to shareholders for approval at the 2023 AGM; and – reviewing updates on compliance matters, including allegations of misconduct, reports from Speak Up channels and investigations, and the Group’s Delivery with Integrity programme initiatives. Ethos, Culture, People The Board shapes and oversees the Group’s culture and ethos. Setting the ‘tone from the top’ is an important part of the Board’s role Activities in 2022 – approving the appointment of Kandy Anand and Véronique Laury as Non-Executive Directors, on the recommendation of the Nominations Committee; – approving changes to Management Board composition, on the recommendations of the Nominations Committee; – approving a revised version of the Board Diversity Policy, effective from November 2022; – determining the independence of Non-Executive Directors prior to proposing them for appointment at the Company’s AGM; – approving revisions to Non-Executive Director fees; – monitoring corporate culture and its alignment with the Group’s purpose, ethos and strategy; – reviewing the Group’s talent strategy, diversity and inclusion agenda, and progress against objectives; – reviewing feedback from the Group’s workforce engagement mechanisms; – overseeing measures implemented to prioritise and protect the health, safety and wellbeing of the Group's workforce, including support for colleagues based in Ukraine and the wider region, strategies for safe and engaging returns to workplaces as COVID-19 restrictions eased, and provision of vaccination support in various markets; – reviewing health and safety performance for the preceding year, outcomes of Environment, Health & Safety roadmap assessments, targets for the coming year and action plans; – reviewing the effectiveness of Speak Up channels; – reviewing the outcomes of the externally- facilitated Board evaluation in 2022; – reviewing the funding positions relating to the Group’s post-employment benefit schemes; and – approving amendments to share and incentive plan rules to update malus and clawback provisions in alignment with the 2022 Directors' Remuneration Policy. BAT Annual Report and Form 20-F 2022 Strategic Report Governance Report Financial Statements Other Information 135
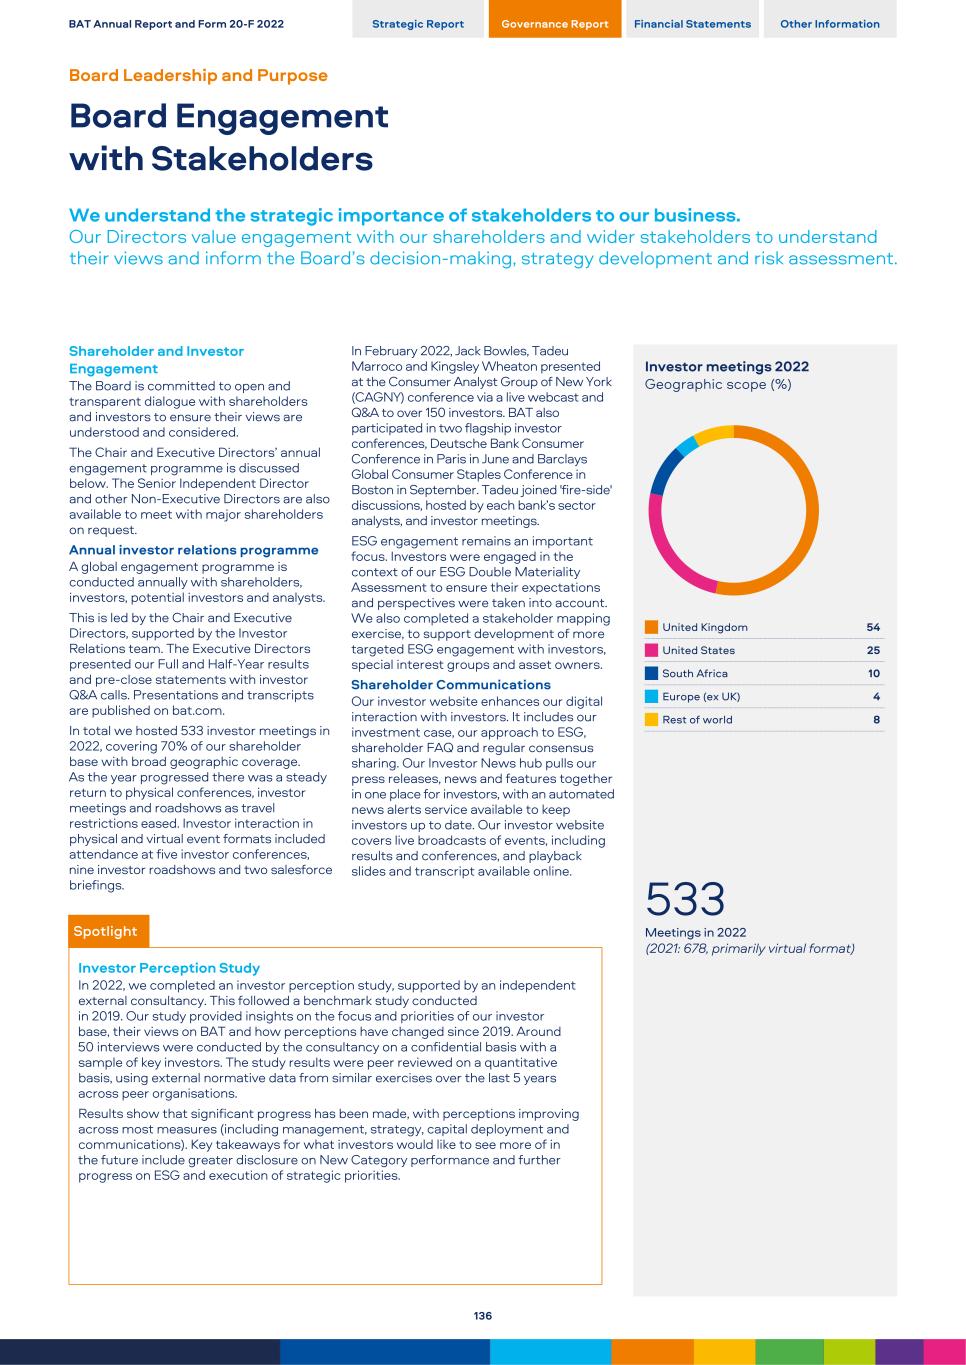
Shareholder and Investor Engagement The Board is committed to open and transparent dialogue with shareholders and investors to ensure their views are understood and considered. The Chair and Executive Directors’ annual engagement programme is discussed below. The Senior Independent Director and other Non-Executive Directors are also available to meet with major shareholders on request. Annual investor relations programme A global engagement programme is conducted annually with shareholders, investors, potential investors and analysts. This is led by the Chair and Executive Directors, supported by the Investor Relations team. The Executive Directors presented our Full and Half-Year results and pre-close statements with investor Q&A calls. Presentations and transcripts are published on bat.com. In total we hosted 533 investor meetings in 2022, covering 70% of our shareholder base with broad geographic coverage. As the year progressed there was a steady return to physical conferences, investor meetings and roadshows as travel restrictions eased. Investor interaction in physical and virtual event formats included attendance at five investor conferences, nine investor roadshows and two salesforce briefings. Spotlight Investor Perception Study In 2022, we completed an investor perception study, supported by an independent external consultancy. This followed a benchmark study conducted in 2019. Our study provided insights on the focus and priorities of our investor base, their views on BAT and how perceptions have changed since 2019. Around 50 interviews were conducted by the consultancy on a confidential basis with a sample of key investors. The study results were peer reviewed on a quantitative basis, using external normative data from similar exercises over the last 5 years across peer organisations. Results show that significant progress has been made, with perceptions improving across most measures (including management, strategy, capital deployment and communications). Key takeaways for what investors would like to see more of in the future include greater disclosure on New Category performance and further progress on ESG and execution of strategic priorities. In February 2022, Jack Bowles, Tadeu Marroco and Kingsley Wheaton presented at the Consumer Analyst Group of New York (CAGNY) conference via a live webcast and Q&A to over 150 investors. BAT also participated in two flagship investor conferences, Deutsche Bank Consumer Conference in Paris in June and Barclays Global Consumer Staples Conference in Boston in September. Tadeu joined 'fire-side' discussions, hosted by each bank’s sector analysts, and investor meetings. ESG engagement remains an important focus. Investors were engaged in the context of our ESG Double Materiality Assessment to ensure their expectations and perspectives were taken into account. We also completed a stakeholder mapping exercise, to support development of more targeted ESG engagement with investors, special interest groups and asset owners. Shareholder Communications Our investor website enhances our digital interaction with investors. It includes our investment case, our approach to ESG, shareholder FAQ and regular consensus sharing. Our Investor News hub pulls our press releases, news and features together in one place for investors, with an automated news alerts service available to keep investors up to date. Our investor website covers live broadcasts of events, including results and conferences, and playback slides and transcript available online. Investor meetings 2022 Geographic scope (%) United Kingdom 54 United States 25 South Africa 10 Europe (ex UK) 4 Rest of world 8 533 Meetings in 2022 (2021: 678, primarily virtual format) BAT Annual Report and Form 20-F 2022 Strategic Report Governance Report Financial Statements Other Information Board Leadership and Purpose Board Engagement with Stakeholders We understand the strategic importance of stakeholders to our business. Our Directors value engagement with our shareholders and wider stakeholders to understand their views and inform the Board’s decision-making, strategy development and risk assessment. 136
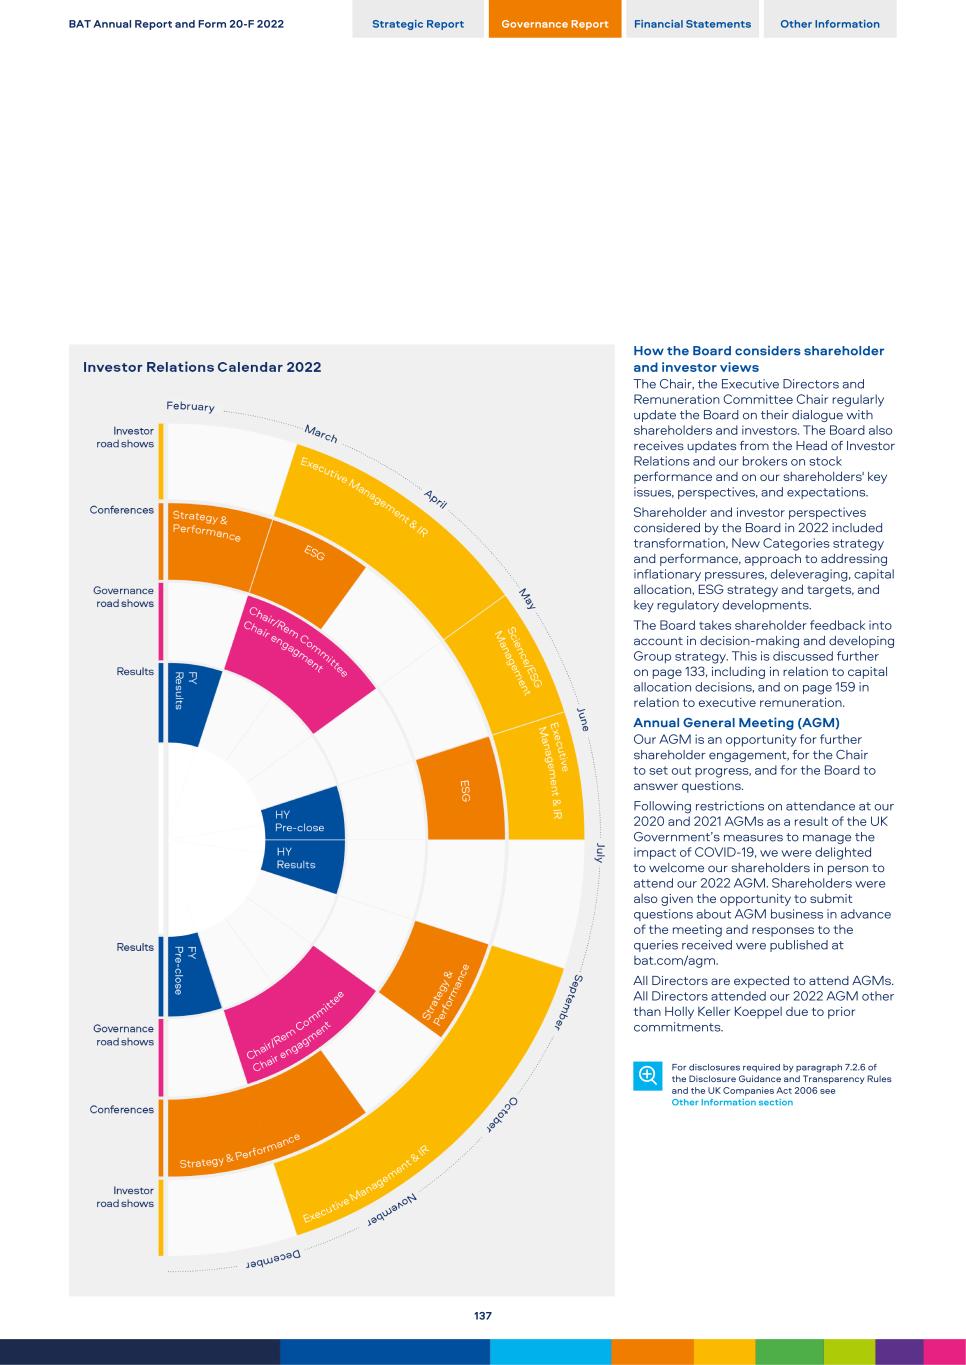
How the Board considers shareholder and investor views The Chair, the Executive Directors and Remuneration Committee Chair regularly update the Board on their dialogue with shareholders and investors. The Board also receives updates from the Head of Investor Relations and our brokers on stock performance and on our shareholders' key issues, perspectives, and expectations. Shareholder and investor perspectives considered by the Board in 2022 included transformation, New Categories strategy and performance, approach to addressing inflationary pressures, deleveraging, capital allocation, ESG strategy and targets, and key regulatory developments. The Board takes shareholder feedback into account in decision-making and developing Group strategy. This is discussed further on page 133, including in relation to capital allocation decisions, and on page 159 in relation to executive remuneration. Annual General Meeting (AGM) Our AGM is an opportunity for further shareholder engagement, for the Chair to set out progress, and for the Board to answer questions. Following restrictions on attendance at our 2020 and 2021 AGMs as a result of the UK Government’s measures to manage the impact of COVID-19, we were delighted to welcome our shareholders in person to attend our 2022 AGM. Shareholders were also given the opportunity to submit questions about AGM business in advance of the meeting and responses to the queries received were published at bat.com/agm. All Directors are expected to attend AGMs. All Directors attended our 2022 AGM other than Holly Keller Koeppel due to prior commitments. For disclosures required by paragraph 7.2.6 of the Disclosure Guidance and Transparency Rules and the UK Companies Act 2006 see Other Information section BAT Annual Report and Form 20-F 2022 Strategic Report Governance Report Financial Statements Other Information 137
Wider Stakeholder Engagement A broad range of stakeholders are important to the Group at local, regional and functional levels. Key stakeholders are strategically important to our business and essential to our ability to generate long-term, sustainable value. We identify them by applying an established stakeholder engagement framework, which takes into account strategic objectives and risks to the Group. In 2022, the Board's assessment of key stakeholders was further informed by the outcomes of an ESG Double Materiality Assessment (discussed further on pages 46 to 48 and 139). Our key stakeholders are referenced in our business model on page 18, with an overview of their importance, what matters to them, and how we engage and respond to them on pages 20 to 21. Transparency of engagement is woven into our Group policies, such as our Standards of Business Conduct and specific frameworks for stakeholder engagement. The Board conducted a review of key stakeholders in 2022. This included how engagement is conducted across the Group, stakeholders’ perspectives, and how the Board is kept informed of those perspectives where engagement is not at Board level. Following its review, the Board remains satisfied there is well- established and effective engagement with the Group’s key stakeholders, enabling the Board to understand their perspectives. The Board will continue to monitor the ongoing effectiveness of stakeholder engagement. Where the Board does not engage directly with our stakeholders, it is kept updated by reports from management so Directors maintain an effective understanding of what matters to them and can draw on these perspectives, including in Board decision- making and strategy development. An overview of how the Board engaged with wider stakeholders and maintained its understanding of their interests during the year is set out below. Consumers Suppliers Our consumers are at the core of everything we do. Consumer- led innovation and product development are central to achieving our purpose of building A Better TomorrowTM. We believe that our multi-category approach is the most effective way to appeal to the diverse preferences of adult consumers worldwide. The Board is regularly briefed by the Executive Directors and senior management on product performance across all portfolio categories and how our product innovation is focused on satisfying adult consumer preferences underpinned by consumer insights and foresights. In 2022, the Board was updated on how consumer insights continuously inform our plans for product development and roll-out, for example understanding how sustainability concepts such as reduced plastics and increased recyclability resonate with consumers and reflecting insights into packaging development; how consumer perceptions on nicotine risks are used to monitor the relevance of information provided to inform consumers about New Categories products; and how the Group has responded to consumer expectations for responsible product marketing. Through its strategy sessions in 2022, the Board reviewed how we continue to act on the depth of our consumer insights to support innovation in New Category product pipelines and drive a step change in New Categories performance. Our relationships with suppliers and contracted farmers are managed day-to-day by the Group’s Operations function and at local market level. The Board oversees the Group’s supply chain strategies and progress on sustainable agriculture and farmer livelihoods programmes. In 2022, the Board was regularly updated on the impact of the conflict in Ukraine on our operations and our suppliers, and the business continuity plans developed to avoid supply chain disruption. The Board reviewed the evolving impact of inflationary pressures on the Group’s supply chain network and key drivers, including geopolitical uncertainties and continued COVID-19 impacts. The Board reviewed our annual Modern Slavery Statement (available at www.bat.com/msa), which reports on our progress to ensure that our operations are free from labour exploitation, and on human rights impact assessments and monitoring programmes conducted in support of this commitment. The Board also reviewed the annual conflict minerals statement and continuous improvement efforts implemented with our New Categories material suppliers to mitigate supply chain risks. The Board was updated on the deployment of supplier water and emissions assessments to support efforts to reduce carbon emissions and promote best practice in water stewardship in our supply chain. Read more about our approach to engaging with consumers Pages 14 to 21 and 30 to 38 Read more about our approach to engaging with suppliers Pages 20 to 21. 43, 48, 53, 57, and 60 to 65 Customers Whilst retailer, wholesaler and distributor relationships are managed at local market and business unit levels, the Board is briefed regularly on the global retail environment, promotion of responsible marketing practices and Youth Access Prevention (YAP) controls including in New Categories online channels. In 2022, the Board was also updated on progress in New Categories recycling take back schemes and how increased digitalisation enhances customer engagement through B2B service models. The Audit Committee reviews the development of the Group’s responsible marketing and YAP procedures and approach to embedding these with retail customers across our product portfolios on a regular basis. Read more about customers and our approach to responsible marketing Pages 20 to 21 and 64 to 65 BAT Annual Report and Form 20-F 2022 Strategic Report Governance Report Financial Statements Other Information Board Leadership and Purpose Board Engagement with Stakeholders Continued 138
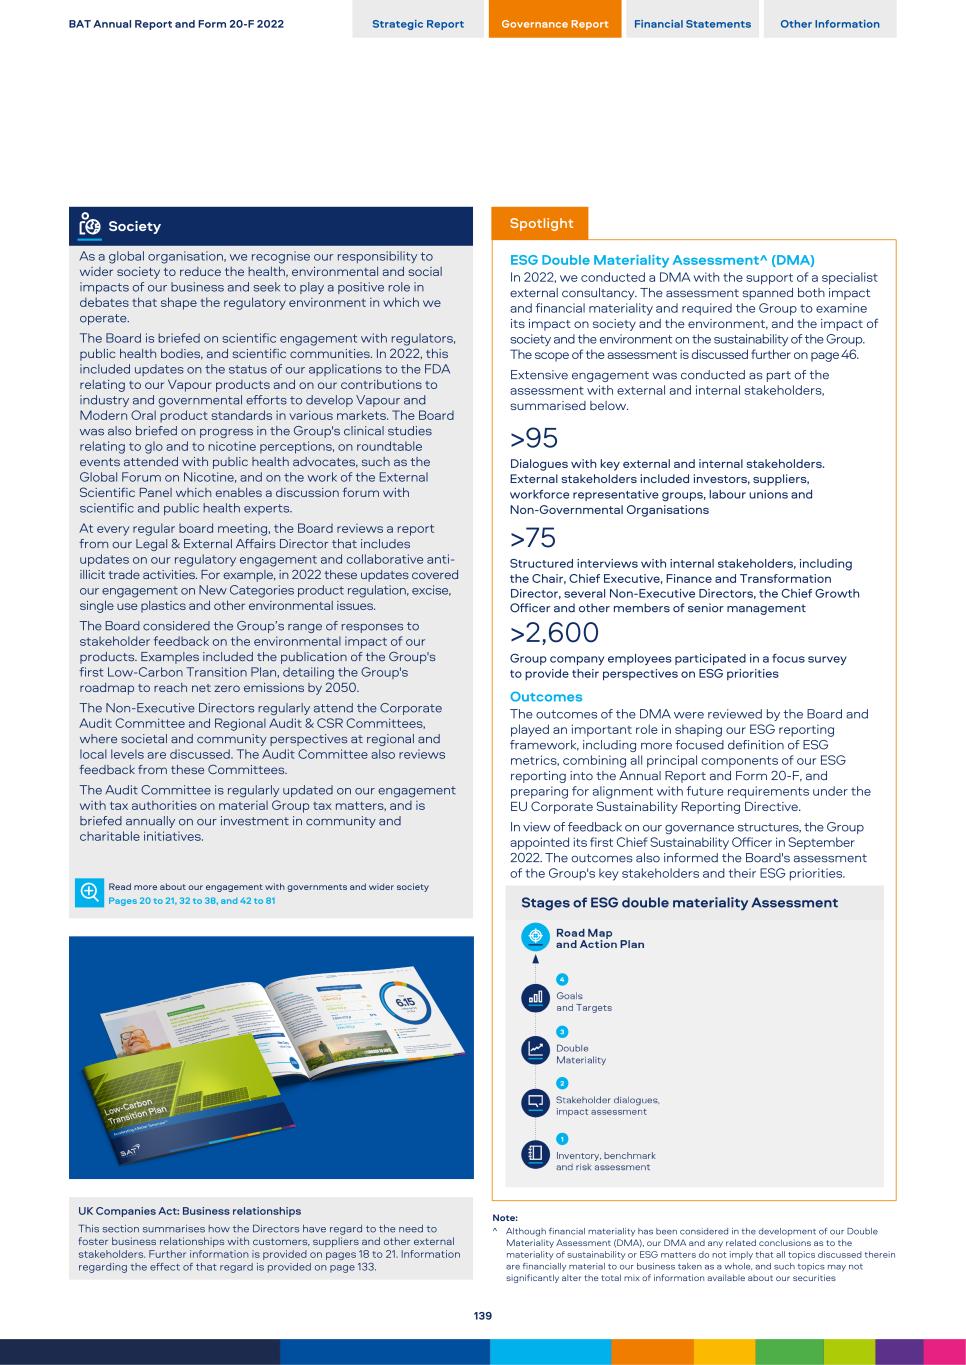
Society As a global organisation, we recognise our responsibility to wider society to reduce the health, environmental and social impacts of our business and seek to play a positive role in debates that shape the regulatory environment in which we operate. The Board is briefed on scientific engagement with regulators, public health bodies, and scientific communities. In 2022, this included updates on the status of our applications to the FDA relating to our Vapour products and on our contributions to industry and governmental efforts to develop Vapour and Modern Oral product standards in various markets. The Board was also briefed on progress in the Group's clinical studies relating to glo and to nicotine perceptions, on roundtable events attended with public health advocates, such as the Global Forum on Nicotine, and on the work of the External Scientific Panel which enables a discussion forum with scientific and public health experts. At every regular board meeting, the Board reviews a report from our Legal & External Affairs Director that includes updates on our regulatory engagement and collaborative anti- illicit trade activities. For example, in 2022 these updates covered our engagement on New Categories product regulation, excise, single use plastics and other environmental issues. The Board considered the Group’s range of responses to stakeholder feedback on the environmental impact of our products. Examples included the publication of the Group's first Low-Carbon Transition Plan, detailing the Group's roadmap to reach net zero emissions by 2050. The Non-Executive Directors regularly attend the Corporate Audit Committee and Regional Audit & CSR Committees, where societal and community perspectives at regional and local levels are discussed. The Audit Committee also reviews feedback from these Committees. The Audit Committee is regularly updated on our engagement with tax authorities on material Group tax matters, and is briefed annually on our investment in community and charitable initiatives. Read more about our engagement with governments and wider society Pages 20 to 21, 32 to 38, and 42 to 81 UK Companies Act: Business relationships This section summarises how the Directors have regard to the need to foster business relationships with customers, suppliers and other external stakeholders. Further information is provided on pages 18 to 21. Information regarding the effect of that regard is provided on page 133. Spotlight ESG Double Materiality Assessment^ (DMA) In 2022, we conducted a DMA with the support of a specialist external consultancy. The assessment spanned both impact and financial materiality and required the Group to examine its impact on society and the environment, and the impact of society and the environment on the sustainability of the Group. The scope of the assessment is discussed further on page 46. Extensive engagement was conducted as part of the assessment with external and internal stakeholders, summarised below. >95 Dialogues with key external and internal stakeholders. External stakeholders included investors, suppliers, workforce representative groups, labour unions and Non-Governmental Organisations >75 Structured interviews with internal stakeholders, including the Chair, Chief Executive, Finance and Transformation Director, several Non-Executive Directors, the Chief Growth Officer and other members of senior management >2,600 Group company employees participated in a focus survey to provide their perspectives on ESG priorities Outcomes The outcomes of the DMA were reviewed by the Board and played an important role in shaping our ESG reporting framework, including more focused definition of ESG metrics, combining all principal components of our ESG reporting into the Annual Report and Form 20-F, and preparing for alignment with future requirements under the EU Corporate Sustainability Reporting Directive. In view of feedback on our governance structures, the Group appointed its first Chief Sustainability Officer in September 2022. The outcomes also informed the Board's assessment of the Group's key stakeholders and their ESG priorities. Stages of ESG double materiality Assessment Note: ^ Although financial materiality has been considered in the development of our Double Materiality Assessment (DMA), our DMA and any related conclusions as to the materiality of sustainability or ESG matters do not imply that all topics discussed therein are financially material to our business taken as a whole, and such topics may not significantly alter the total mix of information available about our securities BAT Annual Report and Form 20-F 2022 Strategic Report Governance Report Financial Statements Other Information 139
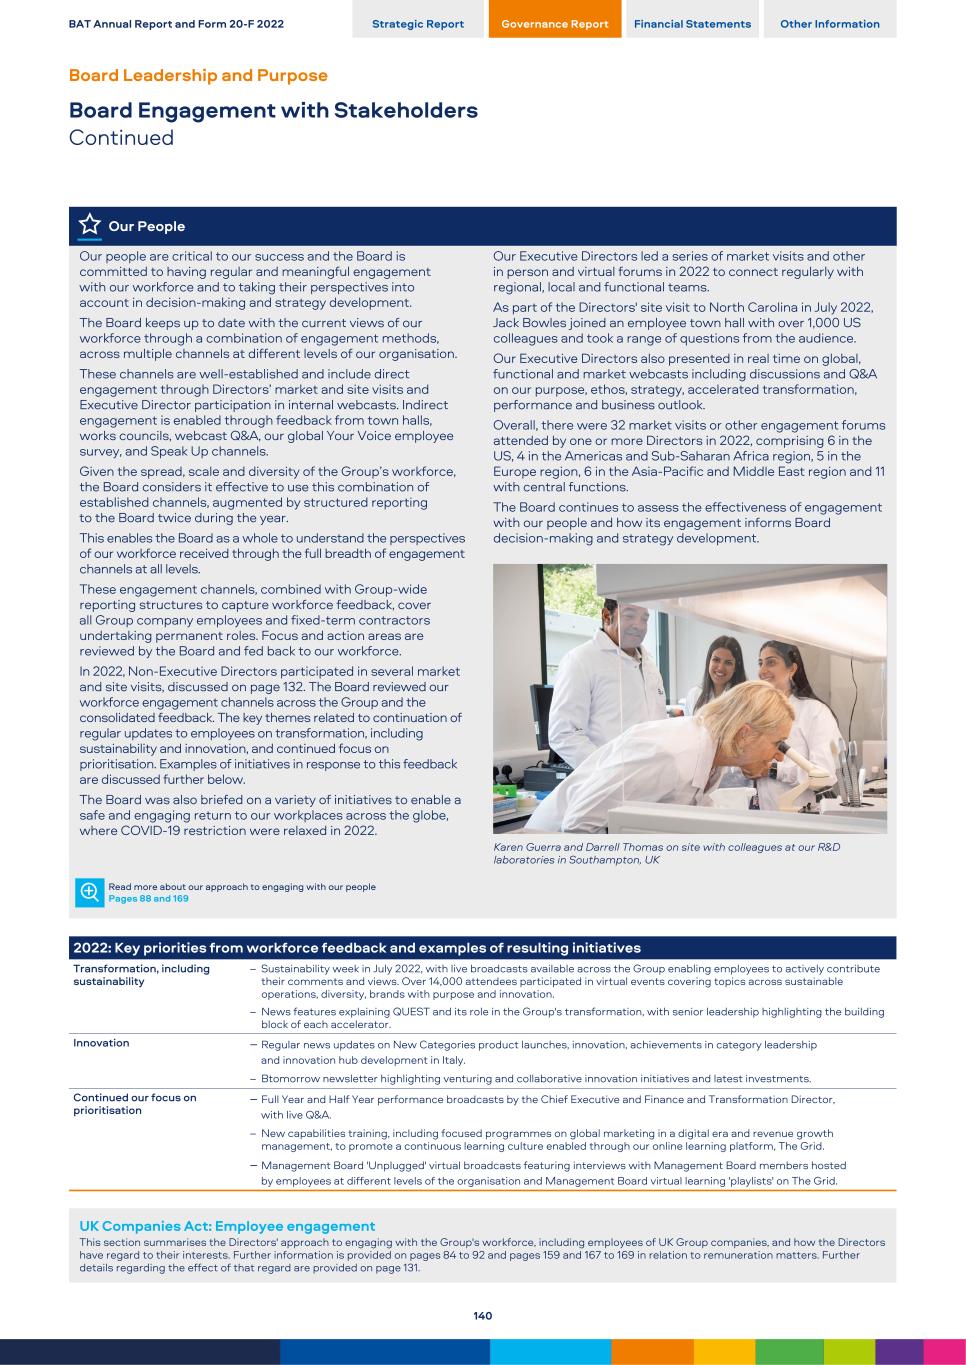
Our People Our people are critical to our success and the Board is committed to having regular and meaningful engagement with our workforce and to taking their perspectives into account in decision-making and strategy development. The Board keeps up to date with the current views of our workforce through a combination of engagement methods, across multiple channels at different levels of our organisation. These channels are well-established and include direct engagement through Directors’ market and site visits and Executive Director participation in internal webcasts. Indirect engagement is enabled through feedback from town halls, works councils, webcast Q&A, our global Your Voice employee survey, and Speak Up channels. Given the spread, scale and diversity of the Group’s workforce, the Board considers it effective to use this combination of established channels, augmented by structured reporting to the Board twice during the year. This enables the Board as a whole to understand the perspectives of our workforce received through the full breadth of engagement channels at all levels. These engagement channels, combined with Group-wide reporting structures to capture workforce feedback, cover all Group company employees and fixed-term contractors undertaking permanent roles. Focus and action areas are reviewed by the Board and fed back to our workforce. In 2022, Non-Executive Directors participated in several market and site visits, discussed on page 132. The Board reviewed our workforce engagement channels across the Group and the consolidated feedback. The key themes related to continuation of regular updates to employees on transformation, including sustainability and innovation, and continued focus on prioritisation. Examples of initiatives in response to this feedback are discussed further below. The Board was also briefed on a variety of initiatives to enable a safe and engaging return to our workplaces across the globe, where COVID-19 restriction were relaxed in 2022. Our Executive Directors led a series of market visits and other in person and virtual forums in 2022 to connect regularly with regional, local and functional teams. As part of the Directors' site visit to North Carolina in July 2022, Jack Bowles joined an employee town hall with over 1,000 US colleagues and took a range of questions from the audience. Our Executive Directors also presented in real time on global, functional and market webcasts including discussions and Q&A on our purpose, ethos, strategy, accelerated transformation, performance and business outlook. Overall, there were 32 market visits or other engagement forums attended by one or more Directors in 2022, comprising 6 in the US, 4 in the Americas and Sub-Saharan Africa region, 5 in the Europe region, 6 in the Asia-Pacific and Middle East region and 11 with central functions. The Board continues to assess the effectiveness of engagement with our people and how its engagement informs Board decision-making and strategy development. Karen Guerra and Darrell Thomas on site with colleagues at our R&D laboratories in Southampton, UK Read more about our approach to engaging with our people Pages 88 and 169 2022: Key priorities from workforce feedback and examples of resulting initiatives Transformation, including sustainability – Sustainability week in July 2022, with live broadcasts available across the Group enabling employees to actively contribute their comments and views. Over 14,000 attendees participated in virtual events covering topics across sustainable operations, diversity, brands with purpose and innovation. – News features explaining QUEST and its role in the Group's transformation, with senior leadership highlighting the building block of each accelerator. Innovation – Regular news updates on New Categories product launches, innovation, achievements in category leadership and innovation hub development in Italy. – Btomorrow newsletter highlighting venturing and collaborative innovation initiatives and latest investments. Continued our focus on prioritisation – Full Year and Half Year performance broadcasts by the Chief Executive and Finance and Transformation Director, with live Q&A. – New capabilities training, including focused programmes on global marketing in a digital era and revenue growth management, to promote a continuous learning culture enabled through our online learning platform, The Grid. – Management Board 'Unplugged' virtual broadcasts featuring interviews with Management Board members hosted by employees at different levels of the organisation and Management Board virtual learning 'playlists' on The Grid. UK Companies Act: Employee engagement This section summarises the Directors' approach to engaging with the Group's workforce, including employees of UK Group companies, and how the Directors have regard to their interests. Further information is provided on pages 84 to 92 and pages 159 and 167 to 169 in relation to remuneration matters. Further details regarding the effect of that regard are provided on page 131. BAT Annual Report and Form 20-F 2022 Strategic Report Governance Report Financial Statements Other Information Board Leadership and Purpose Board Engagement with Stakeholders Continued 140
The Board comprises the Non-Executive Chair, two Executive Directors and eight independent Non-Executive Directors. This section sets out the roles and division of responsibilities between the Chair, Executive Directors and Non-Executive Directors. Roles and Division of Responsibilities Role Responsibilities Chair – Leadership of the Board and its overall effectiveness – Promotes constructive debate and effective decision-making – Sets the Board agenda – Facilitates Directors’ contributions – Interfaces with shareholders – Ensures effective shareholder engagement – Representational duties on behalf of the Company Chief Executive – Overall responsibility for Group performance – Leadership of the Group – Enables planning and execution of Group objectives and strategies – Stewardship of Group assets – Drives the cultural tone of the organisation Finance and Transformation Director – Leadership of the Group in respect of financial matters – Enables planning and execution of Group financial objectives and strategies – Leadership of the design and delivery of the QUEST programme to accelerate delivery of Group strategy – Provision of accurate, timely and clear information to the Board on the Group's financial performance Senior Independent Director – Leads review of the Chair’s performance – Presides at Board meetings in the Chair’s absence – Chairs the Nominations Committee when Chair succession considered – Sounding board for the Chair – Intermediary for other Directors – Available to meet with shareholders Non-Executive Directors – Oversee Group strategy and resource allocation – Monitor Group performance and delivery of Group strategy – Oversee systems of control and risk management – Review management proposals and provide strategic guidance – Scrutinise and hold to account performance against objectives – Bring external judgement, perspective and effective challenge to management The responsibilities of the Chair, Executive Directors and Senior Independent Directors are available at bat.com/governance Board Efficacy Scheduled board meetings during the year were convened in person. Board strategy sessions in October 2022 were held in the US. Feedback from the annual Board evaluation confirmed that board meetings continued to operate well and are considered to be chaired effectively. The Chair facilitates constructive Board relations, supporting effective contribution from Non-Executive Directors and promoting a culture of openness and debate. The Chair seeks a consensus at Board meetings but, if necessary, decisions are taken by majority decision. If any Director has concerns on any issues that cannot be resolved, such concerns are noted in the Board minutes. No such concerns arose in 2022. Non-Executive Director meetings The Non-Executive Directors, led by the Chair, meet following Board meetings on a regular basis. Additional meetings led by the Chair, and without the Executive Directors present, are scheduled in the Board calendar. The Executive and the Non-Executive Directors also meet annually, led by the Senior Independent Director and without the Chair present, to discuss the Chair’s performance. Independence The Board considers all Non-Executive Directors to be independent, as they are free from any business or other relationships that could interfere materially with, or appear to affect, their judgement. Luc Jobin was determined by the Board to be independent on his appointment as Chair, as reported in the Company’s Annual Report and Form 20-F for 2020. The Board has determined Holly Keller Koeppel to be independent, having taken into account her service on the board of Reynolds American Inc. (Reynolds American) as an independent, non- executive director. Luc and Holly were originally appointed to the Board in 2017 following the acquisition of Reynolds American and pursuant to the Agreement and Plan of Merger with Reynolds American. The Board has also considered the independence requirements outlined in the NYSE’s listing standards and has determined that these are met by the Chair and all the Non-Executive Directors. The Board considers that it includes an appropriate combination of Executive and Non-Executive Directors. BAT Annual Report and Form 20-F 2022 Strategic Report Governance Report Financial Statements Other Information Our Approach to Division of Responsibilities 141
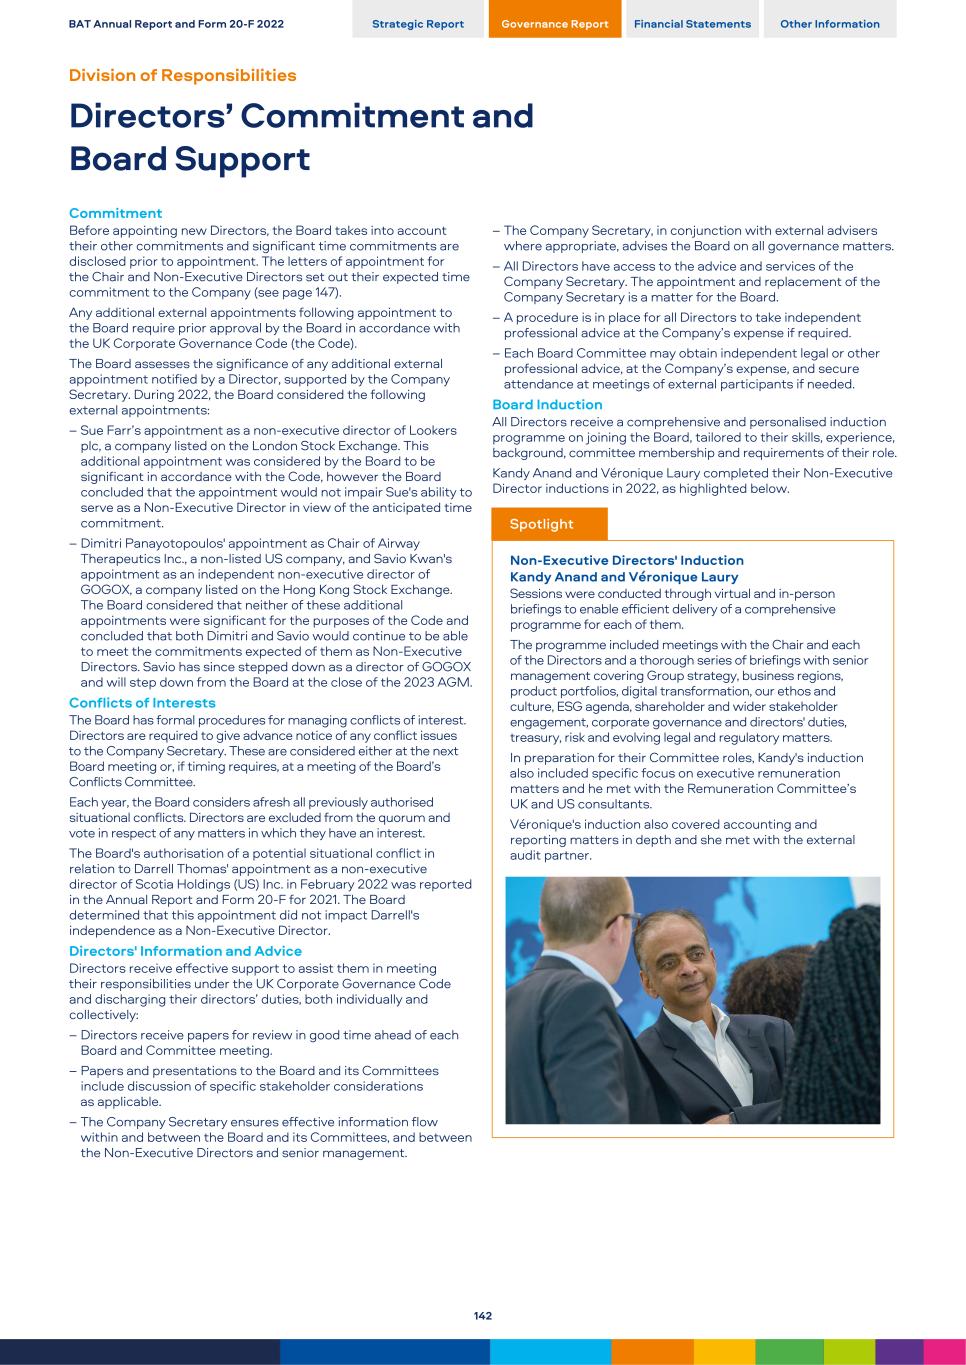
Commitment Before appointing new Directors, the Board takes into account their other commitments and significant time commitments are disclosed prior to appointment. The letters of appointment for the Chair and Non-Executive Directors set out their expected time commitment to the Company (see page 147). Any additional external appointments following appointment to the Board require prior approval by the Board in accordance with the UK Corporate Governance Code (the Code). The Board assesses the significance of any additional external appointment notified by a Director, supported by the Company Secretary. During 2022, the Board considered the following external appointments: – Sue Farr’s appointment as a non-executive director of Lookers plc, a company listed on the London Stock Exchange. This additional appointment was considered by the Board to be significant in accordance with the Code, however the Board concluded that the appointment would not impair Sue's ability to serve as a Non-Executive Director in view of the anticipated time commitment. – Dimitri Panayotopoulos' appointment as Chair of Airway Therapeutics Inc., a non-listed US company, and Savio Kwan's appointment as an independent non-executive director of GOGOX, a company listed on the Hong Kong Stock Exchange. The Board considered that neither of these additional appointments were significant for the purposes of the Code and concluded that both Dimitri and Savio would continue to be able to meet the commitments expected of them as Non-Executive Directors. Savio has since stepped down as a director of GOGOX and will step down from the Board at the close of the 2023 AGM. Conflicts of Interests The Board has formal procedures for managing conflicts of interest. Directors are required to give advance notice of any conflict issues to the Company Secretary. These are considered either at the next Board meeting or, if timing requires, at a meeting of the Board’s Conflicts Committee. Each year, the Board considers afresh all previously authorised situational conflicts. Directors are excluded from the quorum and vote in respect of any matters in which they have an interest. The Board's authorisation of a potential situational conflict in relation to Darrell Thomas' appointment as a non-executive director of Scotia Holdings (US) Inc. in February 2022 was reported in the Annual Report and Form 20-F for 2021. The Board determined that this appointment did not impact Darrell's independence as a Non-Executive Director. Directors' Information and Advice Directors receive effective support to assist them in meeting their responsibilities under the UK Corporate Governance Code and discharging their directors’ duties, both individually and collectively: – Directors receive papers for review in good time ahead of each Board and Committee meeting. – Papers and presentations to the Board and its Committees include discussion of specific stakeholder considerations as applicable. – The Company Secretary ensures effective information flow within and between the Board and its Committees, and between the Non-Executive Directors and senior management. – The Company Secretary, in conjunction with external advisers where appropriate, advises the Board on all governance matters. – All Directors have access to the advice and services of the Company Secretary. The appointment and replacement of the Company Secretary is a matter for the Board. – A procedure is in place for all Directors to take independent professional advice at the Company’s expense if required. – Each Board Committee may obtain independent legal or other professional advice, at the Company’s expense, and secure attendance at meetings of external participants if needed. Board Induction All Directors receive a comprehensive and personalised induction programme on joining the Board, tailored to their skills, experience, background, committee membership and requirements of their role. Kandy Anand and Véronique Laury completed their Non-Executive Director inductions in 2022, as highlighted below. Spotlight Non-Executive Directors' Induction Kandy Anand and Véronique Laury Sessions were conducted through virtual and in-person briefings to enable efficient delivery of a comprehensive programme for each of them. The programme included meetings with the Chair and each of the Directors and a thorough series of briefings with senior management covering Group strategy, business regions, product portfolios, digital transformation, our ethos and culture, ESG agenda, shareholder and wider stakeholder engagement, corporate governance and directors' duties, treasury, risk and evolving legal and regulatory matters. In preparation for their Committee roles, Kandy's induction also included specific focus on executive remuneration matters and he met with the Remuneration Committee’s UK and US consultants. Véronique's induction also covered accounting and reporting matters in depth and she met with the external audit partner. BAT Annual Report and Form 20-F 2022 Strategic Report Governance Report Financial Statements Other Information Division of Responsibilities Directors’ Commitment and Board Support 142
Professional Development Non-Executive Directors receive a full programme of briefings during the year across all areas of the Group’s activities from the Executive Directors, members of the Management Board, the Company Secretary, other senior executives and outside advisors. During 2022, key briefings for the Board included the status of rapidly evolving international sanctions during the year and the governance in place to support sanctions compliance. Briefings were also provided to the Board on developments in product regulation, particularly in the US and Europe, and other regulatory developments impacting the Group’s business and governance arrangements, for example, revisions to the UK Listing Rules to introduce new requirements for the disclosure of the diversity of boards and executive management. The Audit Committee was briefed on key developments in the ESG reporting landscape, including the UK Financial Conduct Authority's guidance on TCFD reporting, and consultations conducted by the US Securities and Exchange Commission (SEC) and the International Sustainability Standards Board on enhanced ESG reporting. The Remuneration Committee was kept updated by its external consultants on UK and US corporate governance developments impacting executive remuneration and wider workforce remuneration. Non-Executive Directors regularly attended meetings of the Group’s Regional Audit and Corporate and Social Responsibility Committees and Corporate Audit Committee to gain a better understanding of the Group’s regions and central functions and the risks faced by the business at market, regional and functional levels. The Chair met with each Non-Executive Director individually towards the end of the year to discuss their individual training and development plans. Board Review Process Annually, the Board undertakes a rigorous review of its effectiveness and performance, and that of its Committees and individual Directors. The Chair is responsible for the overall review process and each Committee Chair is responsible for the review of the performance and effectiveness of their Committee. An externally-facilitated review of the performance and effectiveness of the Board, its Committees, each of the Directors was conducted in 2022. The review included a series of interviews conducted by an external consultancy individually with each of the Directors, the Company Secretary and several members of senior management. The facilitator observed meetings of the Board and the Audit and Remuneration Committees and Board strategy sessions in October 2022. In addition, the facilitator reviewed corporate governance arrangements and relevant Board and Committee meeting minutes and papers. All Directors participated fully in the review in 2022, with the exception of Véronique Laury who joined the Board in September, shortly before the review was conducted. Véronique participated in the Board discussion and feedback sessions. A report setting out the findings of the review and recommendations for consideration was prepared by Boardroom Review. The Board then reviewed and discussed the report with the external consultancy and identified action areas for 2023, taking into account the review findings. The Chair received feedback from the external consultancy on the performance and effectiveness of all Executive and Non-Executive Directors (other than himself). Both the Chair and the facilitator provided individual feedback to each Director. The Senior Independent Director received feedback from the external consultancy on the Chair’s performance and effectiveness, and led a discussion reviewing the Chair’s effectiveness with the other Directors (without the Chair present). Both the Senior Independent Director and the facilitator provided feedback to the Chair. 2022: Externally facilitated Board review process Plan and Evaluate Reporting Review and Action – The facilitator conducted initial briefing sessions with the Chair and Company Secretary – The facilitator conducted a series of interviews with each of the Directors, the Company Secretary and several members of senior management – The facilitator observed Board, Audit and Remuneration Committee meetings and Board strategy sessions over two days in October 2022 – The facilitator assessed feedback and prepared a report for the Board – The facilitator discussed overall findings with the Chair – The facilitator held feedback sessions with each of the Directors – The Board reviewed evaluation outcomes and recommendations, and identified action areas – The Chair provided feedback to the other Directors – The Senior Independent Director provided feedback to the Chair BAT Annual Report and Form 20-F 2022 Strategic Report Governance Report Financial Statements Other Information Composition, Succession, Evaluation Board Effectiveness 143
2022 Board review Overview of Outcomes The outcomes of the review support the overall conclusion that the Board is effective and has a sound working relationship with its Committees. The Board has diversity of tenure, voice and experience and its relationships are based on positive dynamics. It is recognised that the Board has a shared strategic perspective, is appropriately engaged and focused, and is well informed by the Chair, the Committee Chairs, Chief Executive and Finance and Transformation Director. The review found the Board’s time to be planned effectively, with an appropriate balance of formal and informal meetings enabled through easing of travel restrictions in 2022 (such as informal in person meetings and site visits, in addition to physical board meetings). Significant attention is given to risk, control and compliance matters and there is increased focus on digital and cyber security, with appropriate oversight provided by Committees. Committees were noted to be well-chaired, composed and attended, delivering thorough and professional scrutiny on their specific areas of focus. Committee Chairs provide effective and pertinent reporting to the Board. The review confirmed that the Chair is supported by all Directors, and is respected for his knowledge and experience and his collaborative and open style. The strong, complementary partnership between the Chief Executive and the Finance and Transformation Director is also recognised by the Board. Non-Executive Directors were noted to have an independent and professional mindset, and a sense of collective responsibility towards providing constructive challenge. Organisational culture is considered to be an important asset for long-term success. It is perceived to be results-oriented and talent-driven, yet evolving as the pace of transformation remains rapid. Forward-looking considerations The review acknowledged that acceleration of the Group's strategic transformation in a challenging external environment would influence the composition, dynamics and work of the Board in the future. Considerations and recommendations arising from the review aim to help the Board optimise its effectiveness and contribution looking ahead. Key Actions for 2023 Following the review, the Board plans to implement forward- focused actions across the following four key themes: Strategy – Recognising the importance of continued oversight of the transformation strategy, board agenda to maintain focus on strategic discussion and development, with additional emphasis on scenario planning for external challenges, assessment of the competitive environment, and understanding evolving consumer preferences. Board Leadership and Contribution – In view of evolving Board composition, continue to develop the depth of relationships between Board members through blended use of the Directors’ professional time (formal meetings, site visits and informal engagements). – Further improve efficiency of information flows between the Board and management in advance of Board and Committee meetings, with consistent application of a strategic emphasis for board papers. – While the current skill sets of the Board are found to be aligned to corporate strategy, Director succession planning for the longer term to focus on strategic assessment of future requirements to help maintain an effective balance of skills, knowledge and experience. In view of the findings of the review and changes to Board composition implemented during the year, it is not anticipated that the review will have an immediate impact on Board composition. Risk management – Continue to develop and test appetite for business risk in the context of accelerated organisational transformation, supported by additional time on the Board agenda for in depth strategic discussion of business risk appetite. – Support continuous improvement in the Board's understanding and oversight of digital technology and cyber security risks through regular briefings on digital risk topics. – Maintain the Board’s emphasis on robust development of the Group’s ESG agenda, including through the Audit Committee’s ongoing oversight of the Group’s ESG metrics and reporting. People and Culture – Enhance focus on long-term executive management succession planning and develop further Management Board and senior management diversity, with emphasis on improving gender diversity. – In the context of the Group's transformation, continue Board activities to monitor corporate culture and the impact of significant change programmes. BAT Annual Report and Form 20-F 2022 Strategic Report Governance Report Financial Statements Other Information Composition, Succession, Evaluation Board Effectiveness Continued 144
Nominations Committee current members Luc Jobin (Chair) Kandy Anand Sue Farr Karen Guerra Holly Keller Koeppel Savio Kwan Véronique Laury Dimitri Panayotopoulos Darrell Thomas Luc Jobin Chair of the Nominations Committee Role As set out in the Terms of Reference, the Nominations Committee is responsible for: – reviewing the structure, size and composition of the Board and Management Board on a regular basis to ensure both have an appropriate balance of skills, expertise, knowledge and, in relation to the Board, independence; – reviewing the succession plans for appointments to the Board, the Management Board and Company Secretary to maintain an appropriate balance of skills and experience and to ensure progressive refreshing of both the Board and the Management Board; – making recommendations to the Board on suitable candidates for appointments to the Board, the Management Board and Company Secretary, ensuring that the procedure for those appointments is rigorous, transparent, objective and merit- based and has regard for diversity; – assessing the time needed to fulfil the roles of Chair, Senior Independent Director and Non-Executive Director, and ensuring Non-Executive Directors have sufficient time to fulfil their duties; – overseeing the development of a pipeline of diverse, high-performing potential Executive Directors, Management Board members and other senior managers; and – implementing the Board Diversity Policy and monitoring progress towards the achievement of its objectives, summarised on page 148. Key Activities in 2022 – Making recommendations to the Board in respect of Non-Executive Director and Board Committee appointments, including appointment of Kandy Anand as a Non-Executive Director and member of the Remuneration and Nominations Committees and Véronique Laury as a Non-Executive Director and a member of the Audit and Nominations Committees, discussed on page 146. – Recommending to the Board the appointment of Sue Farr as Senior Independent Director with effect from 1 August 2022. – Recommending to the Board the appointment of a new Director, Digital & Information, to the Management Board, with effect from 1 April 2022. – Recommending to the Board the appointment of a new Director, Combustibles, to the Management Board and reviewing plans to restructure the Management Board to align with Quantum Phase 4 strategic objectives. – Continuing analysis of the profile, skills and experience required of future Non- Executive Directors in the context of the Group’s strategy, to support Board succession planning activities. – Making recommendations to the Board in relation to Directors’ annual appointment and re-election at the AGM, discussed further on page 146. – Reviewing the Executive Directors’ and Management Board members’ annual performance assessments and assessing development of candidates for Management Board roles. – Overseeing the Group’s diversity and inclusion agenda, its role in promoting an inclusive and high-performing culture as part of the Group’s talent strategy, and progress in building diverse talent pipelines and creating enablers across the organisation. Balance and Diversity The Board appreciates the benefits of diversity in all of its forms, within its own membership and at all levels across our organisation. Our Non-Executive Directors come from a broad range of industry and professional backgrounds, with varied experience and expertise aligned to the Group’s strategy. Biographies of the Directors, including a summary of their skills, experience and contribution to the Board, are set out on pages 124 to 127 with details of the representation of key diversity attributes on our Board. Nominations Committee terms of reference The Committee’s terms of reference align with the requirements of the Code. No changes were made to the Committee’s terms of reference in 2022. For the Committee’s terms of reference see www.bat.com/governance BAT Annual Report and Form 20-F 2022 Strategic Report Governance Report Financial Statements Other Information Nominations Committee 145
Currently three Directors on our Board are from an ethnic minority background (as defined by the UK Office of National Statistics), the representation of women on the Board is 36% and the senior board position of Senior Independent Director is held by Sue Farr. At the close of the 2023 AGM, it is anticipated that there will be two Directors from an ethnic minority background on the Board and that the representation of women on the Board will increase to 40% The Board remains committed to enhancing its diversity and the Nominations Committee continues to actively progress Non-Executive Director succession supported by our Board Diversity Policy. Our Board Diversity Policy and its revision in 2022 is discussed on below and on page 148. Board Diversity Policy Update A revised Board Diversity Policy was approved by the Board and took effect from 1 November 2022. Details of our revised Board Diversity Policy are on page 148. Our ethos is at the core of our revised policy and its terms align with the new UK Listing Rules diversity targets for the Board (and associated disclosure requirements for the Board and executive management) applicable to the Company from January 2023. We voluntarily report Board and executive management diversity data in accordance with the new UK Listing Rules requirements on page 149. Board Succession Planning The Board considers the length of service of the Board members as a whole and the need for it to refresh its membership progressively over time. The Committee is responsible for regularly reviewing the composition of the Board and Management Board to ensure both have an appropriate balance of skills, expertise and knowledge. Attendance at meetings in 20222(a), 3(a) Meeting attendance4 Name Member since Attended/Eligible to attend Luc Jobin 2017 4/4 Kandy Anand3(b) 2022 3/3 Sue Farr2(b) 2015 3/4 Karen Guerra 2020 4/4 Holly Keller Koeppel 2017 4/4 Savio Kwan 2014 4/4 Véronique Laury3(c) 2022 1/1 Dimitri Panayotopoulos 2015 4/4 Darrell Thomas 2020 4/4 Dr Marion Helmes3(d) 2016 - 2022 2/2 The Committee is also responsible for identifying candidates for Board positions and ensuring that all appointments are made on merit, against objective criteria, and with due regard for our Board Diversity Policy. This process includes a full evaluation of candidates’ attributes and how these would augment the Board’s mix of skills, expertise and knowledge and involves interviews with a range of candidates. In 2022, the Committee identified and recommended to the Board the appointment of Kandy Anand and Véronique Laury as Non-Executive Directors. Heidrick & Struggles International1 supported the selection process leading to Kandy's appointment and Egon Zehnder1 supported the selection process leading to Véronique's appointment. The executive search firm supporting each appointment process reviewed the Board's requirements, including for consumer and digital expertise, and developed specific criteria for candidate selection. Short lists of candidates were presented to the Committee and preferred candidates were interviewed by members of the Board, who reported their feedback on candidates to the Committee. Thorough consideration was given to candidates' skills, experience, diversity of attributes and their fit with the role criteria. The Committee then recommended the preferred candidates to the Board. Kandy brings marketing and consumer goods expertise, and Véronique brings international consumer products, transformation and digital experience to the Board. Their biographies are set out on pages 125 and 127. The Committee's approach to succession planning for Executive Directors is set out on page 147. Annual General Meeting 2023 With the exception of Savio Kwan, the Company will submit all eligible Directors for re-election and, in the case of Véronique, election for the first time. Prior to making recommendations to the Board in respect of Directors’ submissions for re-election, the Committee carried out an assessment of each Director, including their performance, contribution to the long-term sustainable success of the Company and, in respect of each of the Non-Executive Directors, their continued independence (discussed on page 141). In relation to the proposed reappointment of Sue Farr and Dimitri Panayotopoulos, both of whom will have served as Non- Executive Directors for just over eight years at the time of the 2023 AGM, the Committee conducted a rigorous review, taking into account relevant considerations including their performance and attendance record. The Committee concluded that Sue and Dimitri each continued to challenge management constructively, make effective use of their experience and maintain independence of thought and approach, and accordingly considered it appropriate to recommend to the Board that both Sue and Dimitri be submitted for re-election at the 2023 AGM. The Chair’s letter accompanying the 2023 AGM Notice confirms that all Non- Executive Directors being proposed for re-election are effective and that they continue to demonstrate commitment to their roles. Board Retirements Dr Marion Helmes stepped down from the Board with effect from the conclusion of the Company’s AGM on 28 April 2022. Savio Kwan will step down from the Board with effect from the conclusion of the Company’s AGM on 19 April 2023. Notes: 1. Heidrick & Struggles International, Inc. and Egon Zehnder Limited are independent executive search firms, which apply the Standard and Enhanced Codes of Conduct for Executive Search Firms. Neither firm has any connection with the Company or its Directors other than in respect of the provision of executive search services. 2. Number of meetings in 2022: (a) the Committee held four meetings, two of which were ad hoc; and (b) Sue Farr did not attend the ad hoc meeting in February, which was convened at short notice, due to prior commitments. 3. Membership: (a) all members of the Committee are independent Non-Executive Directors in accordance with UK Corporate Governance Code 2018 Provisions 10 and 17, applicable US federal securities laws and NYSE listing standards; (b) Kandy Anand joined the Committee on appointment to the Board on 14 February 2022; (c) Véronique Laury joined the Committee on appointment to the Board on 19 September 2022; and (d) Marion Helmes ceased to be a member of the Committee on stepping down from the Board at the conclusion of the AGM on 28 April 2022. 4. Other attendees: the Chief Executive, the Director, Talent, Culture & Inclusion, and Group Head of Talent & Organisation Effectiveness regularly attend meetings by invitation but are not members. BAT Annual Report and Form 20-F 2022 Strategic Report Governance Report Financial Statements Other Information Composition, Succession, Evaluation Nominations Committee Continued 146
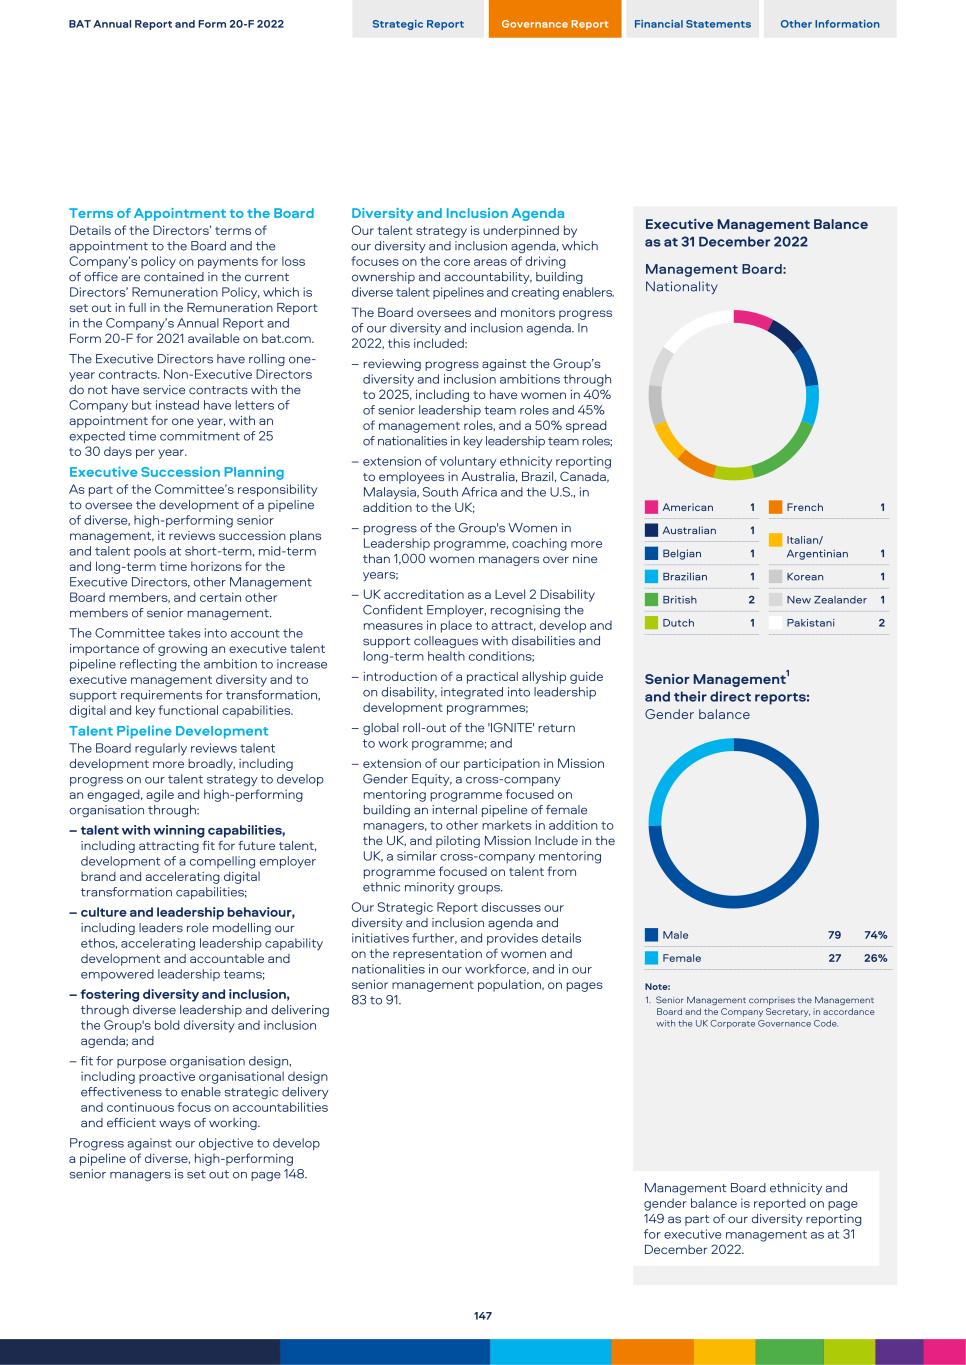
Terms of Appointment to the Board Details of the Directors’ terms of appointment to the Board and the Company’s policy on payments for loss of office are contained in the current Directors’ Remuneration Policy, which is set out in full in the Remuneration Report in the Company’s Annual Report and Form 20-F for 2021 available on bat.com. The Executive Directors have rolling one- year contracts. Non-Executive Directors do not have service contracts with the Company but instead have letters of appointment for one year, with an expected time commitment of 25 to 30 days per year. Executive Succession Planning As part of the Committee’s responsibility to oversee the development of a pipeline of diverse, high-performing senior management, it reviews succession plans and talent pools at short-term, mid-term and long-term time horizons for the Executive Directors, other Management Board members, and certain other members of senior management. The Committee takes into account the importance of growing an executive talent pipeline reflecting the ambition to increase executive management diversity and to support requirements for transformation, digital and key functional capabilities. Talent Pipeline Development The Board regularly reviews talent development more broadly, including progress on our talent strategy to develop an engaged, agile and high-performing organisation through: – talent with winning capabilities, including attracting fit for future talent, development of a compelling employer brand and accelerating digital transformation capabilities; – culture and leadership behaviour, including leaders role modelling our ethos, accelerating leadership capability development and accountable and empowered leadership teams; – fostering diversity and inclusion, through diverse leadership and delivering the Group's bold diversity and inclusion agenda; and – fit for purpose organisation design, including proactive organisational design effectiveness to enable strategic delivery and continuous focus on accountabilities and efficient ways of working. Progress against our objective to develop a pipeline of diverse, high-performing senior managers is set out on page 148. Diversity and Inclusion Agenda Our talent strategy is underpinned by our diversity and inclusion agenda, which focuses on the core areas of driving ownership and accountability, building diverse talent pipelines and creating enablers. The Board oversees and monitors progress of our diversity and inclusion agenda. In 2022, this included: – reviewing progress against the Group’s diversity and inclusion ambitions through to 2025, including to have women in 40% of senior leadership team roles and 45% of management roles, and a 50% spread of nationalities in key leadership team roles; – extension of voluntary ethnicity reporting to employees in Australia, Brazil, Canada, Malaysia, South Africa and the U.S., in addition to the UK; – progress of the Group's Women in Leadership programme, coaching more than 1,000 women managers over nine years; – UK accreditation as a Level 2 Disability Confident Employer, recognising the measures in place to attract, develop and support colleagues with disabilities and long-term health conditions; – introduction of a practical allyship guide on disability, integrated into leadership development programmes; – global roll-out of the 'IGNITE' return to work programme; and – extension of our participation in Mission Gender Equity, a cross-company mentoring programme focused on building an internal pipeline of female managers, to other markets in addition to the UK, and piloting Mission Include in the UK, a similar cross-company mentoring programme focused on talent from ethnic minority groups. Our Strategic Report discusses our diversity and inclusion agenda and initiatives further, and provides details on the representation of women and nationalities in our workforce, and in our senior management population, on pages 83 to 91. Executive Management Balance as at 31 December 2022 Management Board: Nationality American 1 Australian 1 Belgian 1 Brazilian 1 British 2 Dutch 1 French 1 Italian/ Argentinian 1 Korean 1 New Zealander 1 Pakistani 2 Senior Management1 and their direct reports: Gender balance Male 79 74% Female 27 26% Note: 1. Senior Management comprises the Management Board and the Company Secretary, in accordance with the UK Corporate Governance Code. Management Board ethnicity and gender balance is reported on page 149 as part of our diversity reporting for executive management as at 31 December 2022. BAT Annual Report and Form 20-F 2022 Strategic Report Governance Report Financial Statements Other Information 147
Our revised Board Diversity Policy We are proud to be a diverse global organisation that encourages our people to value their differences. Our ongoing commitment to fostering a diverse and inclusive culture is underpinned by our ethos: to be Bold, Fast, Empowered, Responsible and Diverse. Our commitment to diversity across BAT is also embedded through our Group Standards of Business Conduct, applicable to all employees of the Group. Our Board Diversity Policy sets out our approach to diversity applicable to the Board, its Committees1 and the Management Board2. This policy is intended to support the Board, through the activities of its Nominations Committee, in maintaining the effectiveness and balance of the Board, its Committees and the Management Board. Diversity is a key principle of our ethos and a critical enabler for our strategic objectives, providing better understanding, connectivity and insight to our consumers and our employees. We think of diversity in its widest sense, as those attributes that make each of us unique. These include our race, ethnicity, cultural and social backgrounds, geographical origin, nationality, gender, age, any disability, sexual orientation, religion, skills, experience, education, socio-economic and professional background, perspectives and thinking styles. We recognise that diversity is a critical component of board effectiveness and we are committed to promoting diversity in the composition of the Board, its Committees and the Management Board. The Nominations Committee is responsible for regularly reviewing the composition of the Board, its Committees and the Management Board to ensure these have an appropriate balance of skills, expertise, and knowledge, and for ensuring that all appointments are made on merit against objective criteria and with due regard for the benefits of diversity. This includes our Board Diversity Policy objectives set out below. The Nominations Committee is responsible for implementing this policy and monitoring progress against its objectives. This policy and progress against its objectives is reviewed annually by the Nominations Committee, in addition to other BAT initiatives that promote diversity in all its forms across BAT. As part of the annual evaluation of the effectiveness of the Board, consideration is given to the balance of experience, skills, knowledge, independence and all attributes of diversity of the Board. Board Diversity Objectives and Progress Updates The objectives of our revised Board Diversity Policy and progress against these objectives in the year are set out below. Considering all aspects of diversity when reviewing the composition of, and succession planning for, the Board, its Committees1 and the Management Board2 The Nominations Committee has regard to diversity in its widest sense, including attributes such as gender, race, ethnicity, cultural and social backgrounds, and other personal attributes referred to in our Board Diversity Policy above, when undertaking these activities. Considering a wide and gender-balanced pool of candidates for appointment to the Board Executive search firms are engaged to support Board and Management Board succession planning where applicable and are required to provide gender-balanced shortlists of candidates. Succession planning for Executive Directors and Management Board members takes into account potential internal candidates from across the Group and potential external candidates. Maintain at least 40% representation of women on the Board3 The representation of women on the Board was 36% as at 31 December 2022 (2021: 40%). At the close of the 2023 AGM, it is anticipated that women will represent 40% of the Board. The Board is committed to furthering the proportion of women on our Board. At least one of the following senior positions on the Board to be held by a woman: Chair; Senior Independent Director; Chief Executive; Finance Director4 The role of Senior Independent Director is held by Sue Farr. Sue was appointed as Senior Independent Director with effect from 1 August 2022. Other senior positions on the Board are held by Luc Jobin (Chair); Jack Bowles (Chief Executive); and Tadeu Marroco (Finance & Transformation Director). At least one Director of a minority ethnic background on the Board5 As at 31 December 2022, there were three Directors on our Board from an ethnic minority background (2021: two). At the close of the 2023 AGM, it is anticipated that there will be two Directors from an ethnic minority background on the Board, The Board complies with the recommendations on ethnic diversity made by the UK Parker Review. Giving preference, where appropriate, to engagement of executive search firms accredited under the Standard and Enhanced Code of Conduct for Executive Search Firms Where executive search firms are engaged to provide executive search services to support Board succession planning, preference is given to those that are accredited under the Standard and Enhanced Code of Conduct for Executive Search Firms. Oversight of the development of a pipeline of diverse, high-performing potential Executive Directors, Management Board Members and other senior managers. The representation of women on the Management Board was 7.7% as at 31 December 2022 (2021: 15.4%). Management Board succession planning takes into account the ambition to progress towards improved gender diversity. Emphasis is placed on building diverse talent pools at all levels of the organisation through recruiting, developing and retaining diverse and high-performing talent. In 2022, 47% of the Group’s external management recruits were women (2021: 47%) and women comprised 57% of our new graduate intake in 2022 (2021: 51%). Further information about the Group’s diversity and inclusion agenda is set out on pages 83 to 91. Notes to Board Diversity Policy Objectives: 1. The principal committees of the Board comprise the Audit, Remuneration and Nominations Committees. 2. The Management Board is the executive level committee of the Group. 3. Enhanced objective introduced under revised Board Diversity Policy from 1 November 2022 (previous objective to maintain at least 30% female Board representation, with the ambition of progressing towards further gender diversity). 4. New objective introduced under revised Board Diversity Policy from 1 November 2022. 5. New objective introduced under revised Board Diversity Policy from 1 November 2022, applying UK Office for National Statistics ethnicity categories of: Asian; Black; Mixed/Multiple Ethnic Groups; Other Non-White Ethnic Group, in alignment with the UK Listing Rules. BAT Annual Report and Form 20-F 2022 Strategic Report Governance Report Financial Statements Other Information Composition, Succession, Evaluation Nominations Committee Continued 148
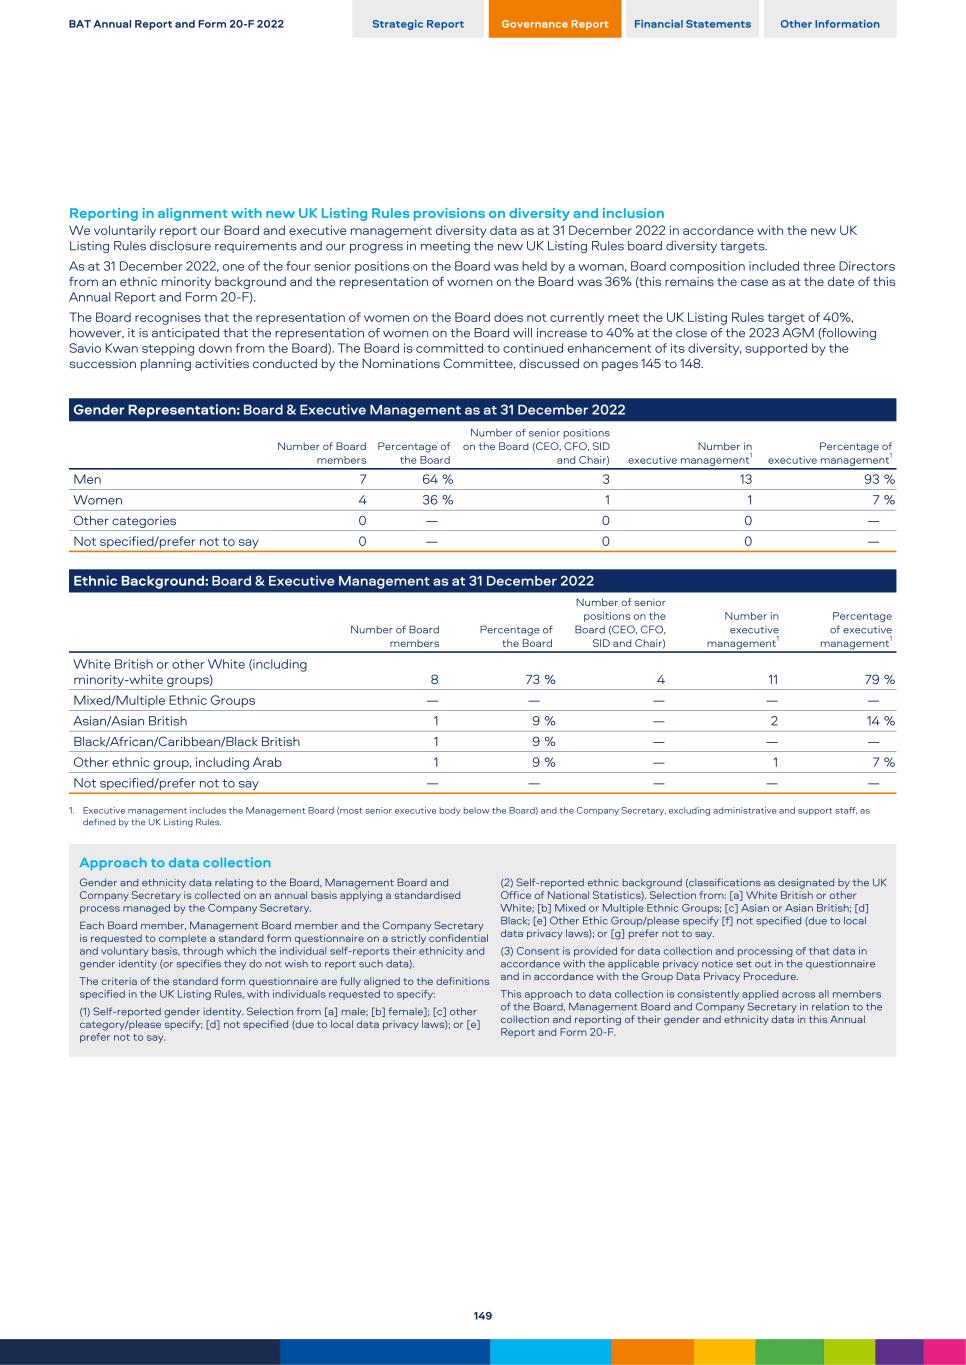
Reporting in alignment with new UK Listing Rules provisions on diversity and inclusion We voluntarily report our Board and executive management diversity data as at 31 December 2022 in accordance with the new UK Listing Rules disclosure requirements and our progress in meeting the new UK Listing Rules board diversity targets. As at 31 December 2022, one of the four senior positions on the Board was held by a woman, Board composition included three Directors from an ethnic minority background and the representation of women on the Board was 36% (this remains the case as at the date of this Annual Report and Form 20-F). The Board recognises that the representation of women on the Board does not currently meet the UK Listing Rules target of 40%, however, it is anticipated that the representation of women on the Board will increase to 40% at the close of the 2023 AGM (following Savio Kwan stepping down from the Board). The Board is committed to continued enhancement of its diversity, supported by the succession planning activities conducted by the Nominations Committee, discussed on pages 145 to 148. Gender Representation: Board & Executive Management as at 31 December 2022 Number of Board members Percentage of the Board Number of senior positions on the Board (CEO, CFO, SID and Chair) Number in executive management1 Percentage of executive management1 Men 7 64 % 3 13 93 % Women 4 36 % 1 1 7 % Other categories 0 — 0 0 — Not specified/prefer not to say 0 — 0 0 — Ethnic Background: Board & Executive Management as at 31 December 2022 Number of Board members Percentage of the Board Number of senior positions on the Board (CEO, CFO, SID and Chair) Number in executive management1 Percentage of executive management1 White British or other White (including minority-white groups) 8 73 % 4 11 79 % Mixed/Multiple Ethnic Groups — — — — — Asian/Asian British 1 9 % — 2 14 % Black/African/Caribbean/Black British 1 9 % — — — Other ethnic group, including Arab 1 9 % — 1 7 % Not specified/prefer not to say — — — — — 1. Executive management includes the Management Board (most senior executive body below the Board) and the Company Secretary, excluding administrative and support staff, as defined by the UK Listing Rules. Approach to data collection Gender and ethnicity data relating to the Board, Management Board and Company Secretary is collected on an annual basis applying a standardised process managed by the Company Secretary. Each Board member, Management Board member and the Company Secretary is requested to complete a standard form questionnaire on a strictly confidential and voluntary basis, through which the individual self-reports their ethnicity and gender identity (or specifies they do not wish to report such data). The criteria of the standard form questionnaire are fully aligned to the definitions specified in the UK Listing Rules, with individuals requested to specify: (1) Self-reported gender identity. Selection from [a] male; [b] female]; [c] other category/please specify; [d] not specified (due to local data privacy laws); or [e] prefer not to say. (2) Self-reported ethnic background (classifications as designated by the UK Office of National Statistics). Selection from: [a] White British or other White; [b] Mixed or Multiple Ethnic Groups; [c] Asian or Asian British; [d] Black; [e] Other Ethic Group/please specify [f] not specified (due to local data privacy laws); or [g] prefer not to say. (3) Consent is provided for data collection and processing of that data in accordance with the applicable privacy notice set out in the questionnaire and in accordance with the Group Data Privacy Procedure. This approach to data collection is consistently applied across all members of the Board, Management Board and Company Secretary in relation to the collection and reporting of their gender and ethnicity data in this Annual Report and Form 20-F. BAT Annual Report and Form 20-F 2022 Strategic Report Governance Report Financial Statements Other Information 149
Our oversight of ESG reporting takes account of developing regulation and both shareholder and wider stakeholder expectations. Holly Keller Koeppel Audit Committee Chair Audit Committee Current Members Holly Keller Koeppel (Chair) Karen Guerra Véronique Laury Darrell Thomas Introduction On behalf of the Audit Committee, I am pleased to introduce our report for 2022 setting out the Committee’s role and reviewing our activities during the year. We welcomed Véronique Laury to the Committee in September. Her experience in digital and business transformation aligns well with the Committee’s evolving oversight in these areas. We met six times in the year, including a meeting in May convened for an initial assessment of a series of complex accounting matters following the decision to transfer the Group’s business in Russia. In view of the unstable local environment and international sanctions introduced, the Committee has maintained a high degree of engagement with management and our external auditors to evaluate and respond to the rapid pace of developments in the year. Our ESG reporting framework has been another focus area for the Committee. Our oversight of ESG reporting takes account of developing regulation and both shareholder and wider stakeholder expectations. Following a Double Materiality Assessment conducted in 2022, the Committee reviewed its outcomes and analysis of our reporting environment. This led us to sharpen the definition of the Group’s ESG metrics and the Committee oversees external assurance activities for reporting against them. All principal components of our ESG reporting are now drawn together in this Annual Report and Form 20-F. The Committee closely examined a range of key risk areas through the year, maintaining our commitment to safeguarding a sound risk and control environment. Our 2022 agenda emphasised digital infrastructure and cyber security, critical business change initiatives such as Quantum and the Group's response to climate change, to ensure robust processes are in place to identify, assess and manage risks. We monitored progress on the internal audit plan during the year and approved the 2023 plan, which has been mapped against the Group’s risk register and designed to respond to emerging risks. Looking ahead, we have commenced planning activities for an external audit tender in respect of the 2025 financial year. The Committee will lead a rigorous and objective tender process that we expect to conclude in 2023, giving adequate time for an orderly handover of our complex and geographically diverse audit footprint should that be the outcome of the process. Role As set out in its terms of reference, the Audit Committee monitors and reviews: – integrity of the Group’s financial statements and any formal announcements relating to the Company’s performance, considering any significant financial reporting issues, significant judgements and estimates reflected in them, before their submission to the Board; – consistency of the Group’s accounting policies; – effectiveness of, and makes recommendations to the Board on, the Group’s accounting, financial controls, auditing matters and business risk management systems; – effectiveness of the Group’s internal audit function; – independence, performance, effectiveness and objectivity of the Company’s external auditors, makes recommendations to the Board as to their reappointment (or for a tender of audit services where appropriate), and approves their terms of engagement and the level of audit, audit-related and non-audit fees; and – Scope of assurance activities, makes recommendations for their appointment, and approves their terms of engagement and fees. Audit Committee terms of reference The Committee’s terms of reference align with the requirements of the Code. No changes were made to the Committee’s terms of reference in 2022. For the Committee’s terms of reference see www.bat.com/governance BAT Annual Report and Form 20-F 2022 Strategic Report Governance Report Financial Statements Other Information Audit, Risk, Internal Control Audit Committee 150
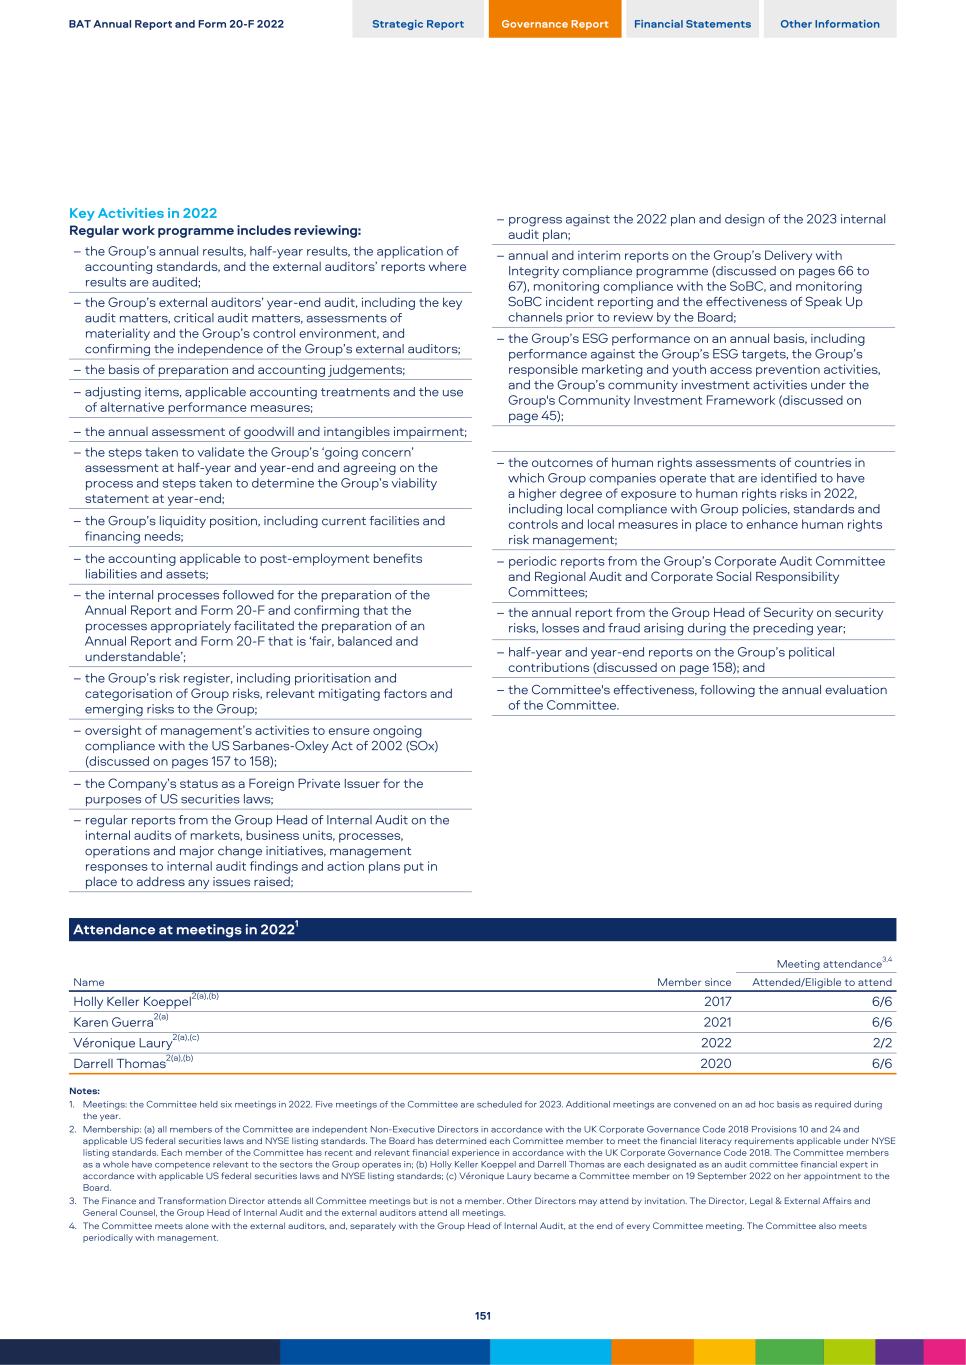
Key Activities in 2022 Regular work programme includes reviewing: – the Group’s annual results, half-year results, the application of accounting standards, and the external auditors’ reports where results are audited; – the Group’s external auditors’ year-end audit, including the key audit matters, critical audit matters, assessments of materiality and the Group’s control environment, and confirming the independence of the Group’s external auditors; – the basis of preparation and accounting judgements; – adjusting items, applicable accounting treatments and the use of alternative performance measures; – the annual assessment of goodwill and intangibles impairment; – the steps taken to validate the Group’s ‘going concern’ assessment at half-year and year-end and agreeing on the process and steps taken to determine the Group’s viability statement at year-end; – the Group’s liquidity position, including current facilities and financing needs; – the accounting applicable to post-employment benefits liabilities and assets; – the internal processes followed for the preparation of the Annual Report and Form 20-F and confirming that the processes appropriately facilitated the preparation of an Annual Report and Form 20-F that is ‘fair, balanced and understandable’; – the Group’s risk register, including prioritisation and categorisation of Group risks, relevant mitigating factors and emerging risks to the Group; – oversight of management’s activities to ensure ongoing compliance with the US Sarbanes-Oxley Act of 2002 (SOx) (discussed on pages 157 to 158); – the Company’s status as a Foreign Private Issuer for the purposes of US securities laws; – regular reports from the Group Head of Internal Audit on the internal audits of markets, business units, processes, operations and major change initiatives, management responses to internal audit findings and action plans put in place to address any issues raised; – progress against the 2022 plan and design of the 2023 internal audit plan; – annual and interim reports on the Group’s Delivery with Integrity compliance programme (discussed on pages 66 to 67), monitoring compliance with the SoBC, and monitoring SoBC incident reporting and the effectiveness of Speak Up channels prior to review by the Board; – the Group’s ESG performance on an annual basis, including performance against the Group’s ESG targets, the Group’s responsible marketing and youth access prevention activities, and the Group’s community investment activities under the Group's Community Investment Framework (discussed on page 45); – the outcomes of human rights assessments of countries in which Group companies operate that are identified to have a higher degree of exposure to human rights risks in 2022, including local compliance with Group policies, standards and controls and local measures in place to enhance human rights risk management; – periodic reports from the Group’s Corporate Audit Committee and Regional Audit and Corporate Social Responsibility Committees; – the annual report from the Group Head of Security on security risks, losses and fraud arising during the preceding year; – half-year and year-end reports on the Group’s political contributions (discussed on page 158); and – the Committee's effectiveness, following the annual evaluation of the Committee. Attendance at meetings in 20221 Meeting attendance3,4 Name Member since Attended/Eligible to attend Holly Keller Koeppel2(a),(b) 2017 6/6 Karen Guerra2(a) 2021 6/6 Véronique Laury2(a),(c) 2022 2/2 Darrell Thomas2(a),(b) 2020 6/6 Notes: 1. Meetings: the Committee held six meetings in 2022. Five meetings of the Committee are scheduled for 2023. Additional meetings are convened on an ad hoc basis as required during the year. 2. Membership: (a) all members of the Committee are independent Non-Executive Directors in accordance with the UK Corporate Governance Code 2018 Provisions 10 and 24 and applicable US federal securities laws and NYSE listing standards. The Board has determined each Committee member to meet the financial literacy requirements applicable under NYSE listing standards. Each member of the Committee has recent and relevant financial experience in accordance with the UK Corporate Governance Code 2018. The Committee members as a whole have competence relevant to the sectors the Group operates in; (b) Holly Keller Koeppel and Darrell Thomas are each designated as an audit committee financial expert in accordance with applicable US federal securities laws and NYSE listing standards; (c) Véronique Laury became a Committee member on 19 September 2022 on her appointment to the Board. 3. The Finance and Transformation Director attends all Committee meetings but is not a member. Other Directors may attend by invitation. The Director, Legal & External Affairs and General Counsel, the Group Head of Internal Audit and the external auditors attend all meetings. 4. The Committee meets alone with the external auditors, and, separately with the Group Head of Internal Audit, at the end of every Committee meeting. The Committee also meets periodically with management. BAT Annual Report and Form 20-F 2022 Strategic Report Governance Report Financial Statements Other Information 151
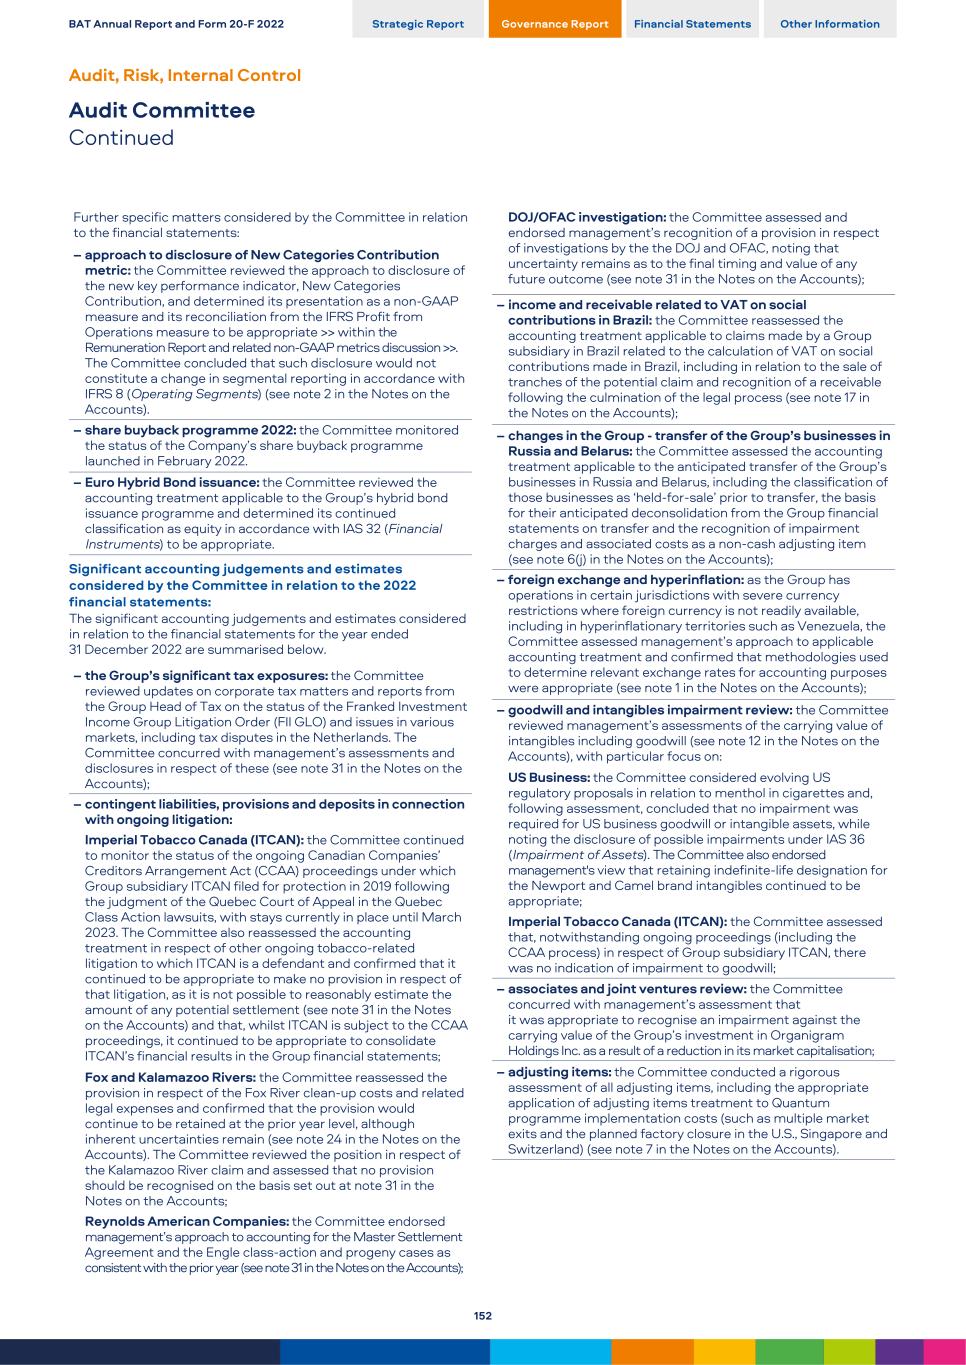
Further specific matters considered by the Committee in relation to the financial statements: – approach to disclosure of New Categories Contribution metric: the Committee reviewed the approach to disclosure of the new key performance indicator, New Categories Contribution, and determined its presentation as a non-GAAP measure and its reconciliation from the IFRS Profit from Operations measure to be appropriate >> within the Remuneration Report and related non-GAAP metrics discussion >>. The Committee concluded that such disclosure would not constitute a change in segmental reporting in accordance with IFRS 8 (Operating Segments) (see note 2 in the Notes on the Accounts). – share buyback programme 2022: the Committee monitored the status of the Company’s share buyback programme launched in February 2022. – Euro Hybrid Bond issuance: the Committee reviewed the accounting treatment applicable to the Group’s hybrid bond issuance programme and determined its continued classification as equity in accordance with IAS 32 (Financial Instruments) to be appropriate. Significant accounting judgements and estimates considered by the Committee in relation to the 2022 financial statements: The significant accounting judgements and estimates considered in relation to the financial statements for the year ended 31 December 2022 are summarised below. – the Group’s significant tax exposures: the Committee reviewed updates on corporate tax matters and reports from the Group Head of Tax on the status of the Franked Investment Income Group Litigation Order (FII GLO) and issues in various markets, including tax disputes in the Netherlands. The Committee concurred with management’s assessments and disclosures in respect of these (see note 31 in the Notes on the Accounts); – contingent liabilities, provisions and deposits in connection with ongoing litigation: Imperial Tobacco Canada (ITCAN): the Committee continued to monitor the status of the ongoing Canadian Companies’ Creditors Arrangement Act (CCAA) proceedings under which Group subsidiary ITCAN filed for protection in 2019 following the judgment of the Quebec Court of Appeal in the Quebec Class Action lawsuits, with stays currently in place until March 2023. The Committee also reassessed the accounting treatment in respect of other ongoing tobacco-related litigation to which ITCAN is a defendant and confirmed that it continued to be appropriate to make no provision in respect of that litigation, as it is not possible to reasonably estimate the amount of any potential settlement (see note 31 in the Notes on the Accounts) and that, whilst ITCAN is subject to the CCAA proceedings, it continued to be appropriate to consolidate ITCAN’s financial results in the Group financial statements; Fox and Kalamazoo Rivers: the Committee reassessed the provision in respect of the Fox River clean-up costs and related legal expenses and confirmed that the provision would continue to be retained at the prior year level, although inherent uncertainties remain (see note 24 in the Notes on the Accounts). The Committee reviewed the position in respect of the Kalamazoo River claim and assessed that no provision should be recognised on the basis set out at note 31 in the Notes on the Accounts; Reynolds American Companies: the Committee endorsed management’s approach to accounting for the Master Settlement Agreement and the Engle class-action and progeny cases as consistent with the prior year (see note 31 in the Notes on the Accounts); DOJ/OFAC investigation: the Committee assessed and endorsed management’s recognition of a provision in respect of investigations by the the DOJ and OFAC, noting that uncertainty remains as to the final timing and value of any future outcome (see note 31 in the Notes on the Accounts); – income and receivable related to VAT on social contributions in Brazil: the Committee reassessed the accounting treatment applicable to claims made by a Group subsidiary in Brazil related to the calculation of VAT on social contributions made in Brazil, including in relation to the sale of tranches of the potential claim and recognition of a receivable following the culmination of the legal process (see note 17 in the Notes on the Accounts); – changes in the Group - transfer of the Group’s businesses in Russia and Belarus: the Committee assessed the accounting treatment applicable to the anticipated transfer of the Group’s businesses in Russia and Belarus, including the classification of those businesses as ‘held-for-sale’ prior to transfer, the basis for their anticipated deconsolidation from the Group financial statements on transfer and the recognition of impairment charges and associated costs as a non-cash adjusting item (see note 6(j) in the Notes on the Accounts); – foreign exchange and hyperinflation: as the Group has operations in certain jurisdictions with severe currency restrictions where foreign currency is not readily available, including in hyperinflationary territories such as Venezuela, the Committee assessed management’s approach to applicable accounting treatment and confirmed that methodologies used to determine relevant exchange rates for accounting purposes were appropriate (see note 1 in the Notes on the Accounts); – goodwill and intangibles impairment review: the Committee reviewed management’s assessments of the carrying value of intangibles including goodwill (see note 12 in the Notes on the Accounts), with particular focus on: US Business: the Committee considered evolving US regulatory proposals in relation to menthol in cigarettes and, following assessment, concluded that no impairment was required for US business goodwill or intangible assets, while noting the disclosure of possible impairments under IAS 36 (Impairment of Assets). The Committee also endorsed management's view that retaining indefinite-life designation for the Newport and Camel brand intangibles continued to be appropriate; Imperial Tobacco Canada (ITCAN): the Committee assessed that, notwithstanding ongoing proceedings (including the CCAA process) in respect of Group subsidiary ITCAN, there was no indication of impairment to goodwill; – associates and joint ventures review: the Committee concurred with management’s assessment that it was appropriate to recognise an impairment against the carrying value of the Group’s investment in Organigram Holdings Inc. as a result of a reduction in its market capitalisation; – adjusting items: the Committee conducted a rigorous assessment of all adjusting items, including the appropriate application of adjusting items treatment to Quantum programme implementation costs (such as multiple market exits and the planned factory closure in the U.S., Singapore and Switzerland) (see note 7 in the Notes on the Accounts). BAT Annual Report and Form 20-F 2022 Strategic Report Governance Report Financial Statements Other Information Audit, Risk, Internal Control Audit Committee Continued 152
Risk topics considered by the Committee included: – climate change risks and their impact on the Group, to ensure robust processes are in place to manage both physical and transitional climate change risks, and annual reporting on the identification, assessment and management of those risks, in alignment with the TCFD framework; – risks related to ESG and the approach to incorporating ESG risks into existing risks managed under the Group’s risk register, to ensure appropriate internal standards, strategic plans, governance, monitoring and reporting mechanisms are in place to align with recognised international standards, meet external expectations and identify emerging issues; – current and emerging risks in relation to the Group’s digital strategy and technology architecture and data management, with particular focus on digital transformation, cyber security, protection of the Group’s information systems and data, and the approach to managing those risks; – revisions to the Group’s risk appetite framework as it relates to the Group’s strategic objectives, and review of emerging risks to the Group twice per year prior to Board assessment; – the report on the effectiveness of the Company’s risk management system; – risks associated with continued exposure to interest rate changes on net finance costs arising from existing, new and refinanced debt and restricted cash in the Group; and – Group anti-bribery and anti-corruption, sanctions and supply chain controls and compliance programme. For further information please refer to the Group Principal Risks on pages 116 to 121 and the Group risk factors on pages 341 to 361 External Auditors The Committee, on behalf of the Board, is responsible for the relationship with the external auditors. KPMG LLP (KPMG) were appointed as the Company’s auditors with effect from 23 March 2015, following a competitive tender process carried out in 2015. KPMG reports to the Committee in depth on the scope and outcomes of the annual audit, including their procedures in relation to internal controls over financial reporting. The Committee reviews and discusses the external audit plan and the external auditors’ assessments of management's proposed treatment of significant transactions and accounting judgements. During the year, the Committee also met independently with the external audit partner after every Committee meeting. Outside of Committee meetings, the Committee Chair, the Finance and Transformation Director, the Director, Legal & External Affairs and General Counsel, the Group Head of Internal Audit and the Company Secretary all meet with the external auditors regularly throughout the year to discuss relevant issues as well as the progress of the external audit. Any significant issues are included on the Committee’s agenda. External auditor effectiveness The Committee carries out an annual assessment of the external auditors, covering qualification, expertise and resources, objectivity and independence, and the quality and effectiveness of the audit process. This assessment takes into account the Committee’s interactions with, and observations of, the external auditors and considers a range of factors, including: – experience and expertise of the external auditors in their direct communication with the Committee; – their mindset, professional scepticism and approach to challenging management’s assumptions where necessary; – their effectiveness and efficiency in completing the agreed external audit plan; – their approach to handling significant audit and accounting judgements; – content, quality and robustness of the external auditors’ reports; – their provision of non-audit services, as referenced below, and other matters that may impact independence; and – relevant reviews and reports issued by external regulatory bodies including the UK Financial Reporting Counsel and the US Public Company Accounting Oversight Board. The Committee’s assessment is also informed by an external audit satisfaction survey completed by members of the Group’s senior management to obtain their perspectives on the effectiveness and quality of the external auditors’ work. No material issues were identified during the external auditor effectiveness review in 2022. Certain opportunities for improvement were identified, which have been discussed between the external auditors and management and taken into account for planning for the following annual audit. The Committee is satisfied with the qualification, expertise and resources of its external auditors, that they have demonstrated an appropriate degree of professional scepticism and that the objectivity and independence of its external auditors are not in any way impaired by the non-audit services which they provide. The Committee has recommended to the Board the proposed reappointment of KPMG at the 2023 AGM. External auditor tender The Committee continually reviews its relationship with the external auditors, including consideration as to when it next intends to complete a competitive tender process for the external audit, taking into account its assessment of external auditor effectiveness. As the Committee considers the relationship with the external auditors to continue to work well and the Committee remains satisfied with the external auditors’ effectiveness, and having considered the continued independence and objectivity of the auditors, the Committee considers it to be in the best interests of the Company’s shareholders for KPMG to remain as auditors for the following financial year. The Committee will continue to monitor this, taking into account the effectiveness and independence of the auditors and the best interests of shareholders. BAT Annual Report and Form 20-F 2022 Strategic Report Governance Report Financial Statements Other Information 153
As set out in the Company’s FY 2022 Preliminary Announcement, the Committee has commenced planning for an audit tender process to be conducted in 2023 in respect of the audit for the 2025 financial year, in compliance with applicable regulations. The timetable for the external audit tender process is designed to permit time to plan for the transition of any non-audit services if there is a change of auditor and to enable any new auditor to fully prepare to assume responsibility for a complex and international audit across the Group. The audit tender process will be overseen by the Committee and is expected to conclude later in 2023. It is intended that a resolution proposing the appointment of the selected auditor would be put to shareholders at the 2025 Annual General Meeting. UK Competition and Markets Authority Audit Order The Company has complied with the Statutory Audit Services Order issued by the UK Competition and Markets Authority for the financial year ended 31 December 2022. Audit Partner Rotation The tenure of the current external audit partner, Mr Philip Smart, commenced from the start of the 2021 year-end audit. Audit Partner rotation is implemented in accordance with the requirements of the UK Financial Reporting Council (FRC) Ethical Standard and the SEC independence rules on partner rotation. Group Auditor Independence Policy (AIP) The Group has an established AIP, reflecting the requirements of applicable laws, to safeguard the independence and objectivity of the Group’s external auditors and to specify the approval processes for the engagement of the Group’s external auditors to provide audit, audit-related and other non-audit services. The key principle of the AIP is that the Group’s external auditors may only be engaged to provide services in cases where the provision of those services does not impair auditor independence and objectivity. The Committee recognises that using the external auditors to provide services can be beneficial given their detailed knowledge of our business. However, the AIP does not permit the Committee to delegate its responsibilities to the external auditors and the external auditors are only permitted to provide audit, audit-related and non-audit services in accordance with the AIP. The AIP does not permit the external auditors to maintain a financial, employment or business relationship with any Group company, or provide services to any Group company, which: – creates a mutual or conflicting interest with any Group company; – places the external auditors in the position of auditing their own work; – results in the external auditors acting as a manager or employee of any Group company; or – places the external auditor in the position of advocate for any Group company. Audit services are approved in advance by the Committee on the basis of an annual engagement letter and the scope of audit services is agreed by the Committee with the external auditors. Subject to the restrictions specified in the AIP, the external auditors may also provide certain non-audit services with the prior approval of the Committee. The requirement for the Committee’s pre-approval of non-audit services may be waived only if the aggregate amount of all non-audit services provided is less than 5% of the total amount paid to the external auditors during the reporting year, where those services were not recognised to be non-audit services at the time of engagement, and provided those services are promptly brought to the attention of the Committee and their provision is approved prior to completion of the audit in the relevant reporting year. The provision of permitted non-audit services must be put to tender if expected spend exceeds limits specified in the AIP, unless a waiver of this requirement, in accordance with the terms of the AIP, is agreed by the Finance and Transformation Director and notified to the Committee. The AIP: – requires Committee pre-approval for all audit, audit-related and other non-audit services, except in respect of non-audit services falling within the exceptions described above; – prohibits the provision of certain types of services by the external auditors, including those with contingent fee arrangements, expert services unrelated to audit and other services prohibited by US securities laws and the Public Company Accounting Oversight Board; – prohibits the Chief Executive, Finance and Transformation Director, Group Financial Controller and Group Chief Accountant (or any person serving in an equivalent position) from having been employed by the external auditors in any capacity in connection with the Group audit for two years before initiation of an audit; – specifies requirements in respect of audit partner rotation, including for both the lead and the concurring external audit partners to rotate off the Group audit engagement at least every five years, and not to recommence provision of audit or audit- related services to the Group for a further five years; and – provides authority for the Committee to oversee any allegations of improper influence, coercion, manipulation or purposeful misleading in connection with any external audit, and to review any issues arising in the course of engagement with the external auditors. BAT Annual Report and Form 20-F 2022 Strategic Report Governance Report Financial Statements Other Information Audit, Risk, Internal Control Audit Committee Continued 154
External audit fees The Committee reviews a schedule identifying the total fees for all audit and audit-related services, tax services and other non-audit services expected to be undertaken by the external auditors in the following year. Tax services and other non-audit services in excess of the tender thresholds referred to above must be itemised. Updated schedules are also submitted to the Committee at mid- year and year-end, so that it has full visibility of the Group spend on services provided by the Group’s external auditors. A breakdown of audit, audit-related, tax and other non-audit fees paid to KPMG firms and associates in 2022 is provided in note 6(k) in the Notes on the Accounts and is summarised as follows: Services provided by KPMG and associates 2022 2022 £m 2021 £m Audit services 20.4 18.2 Audit of defined benefit schemes 0.2 0.4 Audit-related assurance services 7.1 8.0 Total audit and audit-related services 27.7 26.6 Other assurance services 0.9 0.3 Tax advisory services — — Tax compliance — — Other non-audit services — — Total non-audit services 0.9 0.3 Note: In 2022, non-audit fees paid to KPMG amounted to 3.2% of the audit and audit‑related assurance fees paid to them (2021: 1.1%). All audit and non-audit services provided by the external auditors in 2022 were pre-approved by the Committee. The Committee noted that KPMG identified that three member firms have provided preparation of local GAAP financial statement services and that one member firm has additionally provided language translation services for residual out of scope components. The Committee concurred with KPMG’s assessment that their integrity and objectivity as auditor has not been compromised and that an objective, reasonable and informed third party would conclude that the provision of these services would not impair KPMG’s integrity or objectivity. Risk Management and Internal Control Overview The Company maintains its system of risk management and internal control with a view to safeguarding shareholders’ investment and the Company’s assets. It is designed to identify, evaluate and manage risks that may impede the Company’s objectives. It cannot, and is not designed to, eliminate them entirely. The system therefore provides a reasonable, not absolute, assurance against material misstatement or loss. A description of the principal risks that may affect the Group’s business is provided in our Strategic Report on pages 116 to 121. The main features of the risk management processes and system of internal control operated within the Group are described below. These have been in place throughout the year under review and remain in place to date. These do not cover associates of the Group. Risk management Risk registers, based on a standardised methodology, are used at Group, functional, directly-reporting business unit (DRBU) and individual market levels to identify, assess and monitor the risks (both financial and non-financial) faced by the business at each level. Risks are assessed and prioritised at three levels by reference to their residual impact (high/medium /low) and likelihood (probable/ possible/unlikely). Mitigation plans are required to be in place to manage the risks identified, and progress against those plans is monitored. The risk registers are reviewed on a regular basis. The SAP Enterprise Risk Management module is used across the Group to record and track risk management activity. This system is subject to ongoing management review to identify opportunities for increased efficiency and effectiveness. Functional and regional risk registers are reviewed biannually by the relevant Regional Audit and CSR Committee or the Corporate Audit Committee, as appropriate. DRBU risk registers are reviewed as part of DRBU Risk and Controls meetings. At the Group level, specific responsibility for managing each identified risk is allocated to a member of the Management Board. The Group risk register is reviewed twice yearly by the Group Risk Management Committee, a committee of senior managers chaired by the Finance and Transformation Director. In addition, it is reviewed annually by the Board and twice yearly by the Committee. The Board and the Committee review changes in the status of identified risks and assess the changes in impact and likelihood. Any delayed mitigations are also presented to the Committee. In addition, the Committee conducts detailed reviews on selected risks, meeting senior managers responsible for managing and mitigating them, so that it can consider those risks at a more granular level. Board oversight During the year, the Board considered the nature and extent of Group risks (irrespective of their impact or likelihood) which are material to the Group and the delivery of its strategic objectives (its ‘risk appetite’), and the Group's framework for maintaining sound risk management and internal control systems. As part of the Board's assessment of risks faced by the Group, the Board considered the material climate-related risks and opportunities discussed in the context of our TCFD reporting on pages 70 to 80 and other climate-related risks to the Group. As at 31 December 2022, the Group has identified Climate and Circularity as a principal risk to the Group, recognising the Group's existing commitments in relation to climate change and circular economy matters and mitigation of associated risks. Risk appetite is reviewed annually by the Board to ensure that it is appropriate. Alongside a robust assessment of the principal risks and uncertainties facing the Group (including those that would threaten its business model, future performance, solvency, liquidity and viability), the Board also considers emerging risks which may challenge the Group’s ability to achieve its strategic objectives in the future. Each emerging risk is assessed by the Board on its potential impact and likelihood and, where applicable, incorporated into the Group’s risk register with appropriate mitigating activities. Emerging risks are kept under regular review by the Committee, prior to Board assessment. The ongoing conflict in Ukraine continues to represent a very complex, fast-moving and volatile situation. The primary focus of the Group remains the safety and wellbeing of Group company employees. The Board maintains close oversight of the Group’s response to critical external uncertainties that have arisen during the year, including the impact of the ongoing conflict in Ukraine. Risks are actively assessed and mitigated at Group, functional, DRBU and market levels, in compliance with international sanctions. These uncertainties, taken together with inflationary pressures and rising interest rates, present a challenging external environment for the Group. Liquidity (access to cash and sources of finance) is essential to maintaining the Group as a going concern in the short-term (liquidity) and medium-term (solvency). With the support of the Committee, the Board conducts an annual review of the effectiveness of the Group’s risk management and internal control systems. This review covers all material controls including financial, operational and compliance controls and risk management systems, with the Committee continuing to have a strong focus on cyber security, sanctions compliance, IT systems and controls. In conducting the oversight responsibilities of the Board and the Committee, both forums meet regularly with senior management during the year to assess key judgements applied. Refer to the Group Principal Risks on pages 116 to 121 and Group risk factors on pages 341 to 361 BAT Annual Report and Form 20-F 2022 Strategic Report Governance Report Financial Statements Other Information 155
Regional Audit and Corporate Social Responsibility (CSR) Committee framework The Group’s Regional Audit and CSR Committee framework underpins the Audit Committee. It provides a flexible channel for the structured flow of information through the Group, with committees for each of the three Group regions, for the US business, and for locally-listed Group entities and specific markets where considered appropriate. The Regional Audit and CSR Committees are supported by Risk and Control Committees established at business unit level, and within certain Group functions where applicable. This framework ensures that significant financial, social, environmental, governance and reputational risks faced by the Group are appropriately managed and that any failings or weaknesses are identified so that remedial action may be taken. The Group’s Regional Audit and CSR Committees are all chaired by an Executive Director, comprise members of the Management Board and regularly attended by one or more Non-Executive Directors. In addition, the Corporate Audit Committee focuses on the Group’s risks and control environment that fall outside the regional committees’ remit, such as central functions, and global programmes, processes and projects. It comprises members of the Management Board and is chaired by a Regional Director. One or more of the Non‑Executive Directors also regularly attend meetings of the Corporate Audit Committee. External and internal auditors attend meetings of these committees and regularly have private audiences with members of the committees after meetings. Additionally, central, regional and individual market management, along with Internal Audit, support the Board in its role of ensuring a sound control environment. Internal control Group operating companies and other business units are annually required to complete a controls self-assessment, called Control Navigator, of the key controls that they are expected to have in place. Its purpose is to enable them to self-assess their internal control environment, assist them in identifying any controls that may need strengthening and support them in implementing and monitoring action plans to address control weaknesses. The Control Navigator assessment is reviewed annually to ensure that it remains relevant to the business and covers all applicable key controls. In addition, at each year-end, Group operating companies and other business units are required to: – review their system of internal control, confirm whether it remains effective, and report on any specific control deficiencies and the action being taken to address them; and – review and confirm that policies and procedures to promote compliance with the SoBC are fully embedded and identify any material instances of non-compliance. The results of these reviews are reported to the relevant Regional Audit and CSR Committees or to the Corporate Audit Committee, and to the Audit Committee, to ensure that appropriate remedial action has been, or will be, taken where necessary. They are also considered by the SOx Steering Committee and the Disclosure Committee in determining management’s opinion on the internal controls over financial reporting (ICFR). Annual review The Financial Reporting Council’s ‘Guidance on Risk Management, Internal Control and Related Financial and Business Reporting’ provides guidance in relation to issues of risk and internal control management and related reporting. The processes described above, and the reports that they give rise to, enable the Board and the Committee to monitor risk and internal control management on a continuing basis throughout the year and to review its effectiveness at the year-end. The Board, with advice from the Committee, has completed its annual review of the effectiveness of that system for 2022. The Board is satisfied that the system of risk and internal control management accords with the UK Corporate Governance Code and satisfies the requirements for internal controls over financial reporting. Internal Audit function The Group’s Internal Audit function is responsible for carrying out risk-based audits of Group companies, business units, factories, global processes and major change initiatives. A separate Business Controls Team provides advice and guidance on controls to the Group’s business units. The purpose, authority and responsibilities of the Group’s Internal Audit function are defined by the Committee through the Group’s Internal Audit Charter, which is kept under review by the Committee and refreshed at least every three years. The Group’s Internal Audit function works to a rolling 18-month audit plan, prioritising principal risk areas aligned to the Group’s risk register. During 2022, the Internal Audit plan was kept under regular review with the Committee, enabling the Committee to monitor the ongoing effectiveness of audit work and allowing flexibility to augment coverage of audit assignments in response to emerging risks where appropriate. In 2022, internal audits covered various markets and business units, manufacturing facilities in a range of locations and a balanced cross-section of other business activities mapped to Group risks, including digital infrastructure; cyber security programme assurance; business continuity management; supply chain logistics; global leaf pool; critical business transformation programmes; environment; health and safety management processes; responsible product marketing procedures; implementation of SAP in the US business; and the transfer of various activities to shared services hubs. Audits were conducted using a combination of on-site and remote auditing, with continued focus on the use of data analytics and virtual communications to optimise audit efficiency, effectiveness and coverage. The Committee reviews regular summary reports provided by the Group Head of Internal Audit in respect of internal audits conducted during the year and findings from those audits, together with management feedback and agreed action plans established where areas for improvement are identified. The scope of each internal audit is assessed for SOx impact and audit of applicable SOx controls is included where relevant. Reviews of SOx controls and their effectiveness are primarily conducted by the Group’s Business Controls Team. Assurance is also undertaken by the Group’s external auditors, as referred to on page 158. BAT Annual Report and Form 20-F 2022 Strategic Report Governance Report Financial Statements Other Information Audit, Risk, Internal Control Audit Committee Continued 156
The Committee has approved the 2023 Internal Audit plan and assessed its alignment with the Group’s risk register to ensure robust coverage of Group risks and material coverage of Group activities (measured by value and volume). The design of the 2023 Internal Audit plan builds on digital capabilities developed in 2022, using enhanced data analytics, and balanced application of remote fieldwork and focused site visits. The scope of the 2023 plan remains risk-focused, reflecting the Group’s evolving risk profile. Emphasis is placed on the growth of New Categories, ESG priorities, digital infrastructure and cyber security, critical change initiatives including QUEST, and geopolitical and other emerging risks, whilst maintaining thorough coverage of core business activities, lines of defence and IT controls. The Committee reviews the effectiveness of the Group’s internal audit function annually, supported by an effectiveness review conducted periodically by an independent third party. The last external effectiveness review was conducted in 2019. The Committee considers the Internal Audit function to be effective and to have the necessary resources to enable it to fulfil its mandate. Financial reporting controls The Group maintains a series of policies, practices and controls in relation to the financial reporting and consolidation process, designed to address key financial reporting risks, including risks arising from changes in the business or accounting standards and to provide assurance of the completeness and accuracy of the Annual Report and Form 20-F. A key area of focus is to assess whether the Annual Report and Form 20-F and financial statements are ‘fair, balanced and understandable’ in accordance with the UK Corporate Governance Code, with particular regard to: – Fair: Consistency of reporting between the financial statements and narrative reporting of Group performance and coverage of an overall picture of the Group’s performance; – Balanced: Consistency of narrative reporting of significant accounting judgements and key matters considered by the Committee with disclosures of material judgements and uncertainties noted in the financial statements; appropriate use, prominence and explanation of primary and adjusted performance measures; and – Understandable: Clarity and structure of the Annual Report and Form 20-F and financial statements, appropriate emphasis of key messages, and use of succinct and focused narrative with strong linkage throughout the report, to provide shareholders with the information needed to assess the Group’s business, performance, strategy and financial position. The Group Manual of Accounting Policies and Procedures sets out the Group accounting policies, its treatment of transactions and its internal reporting requirements. The internal reporting of financial information to prepare the Group’s annual and half-year financial statements is signed off by the heads of finance responsible for the Group’s markets and business units. The heads of finance responsible for the Group’s markets and all senior managers must also confirm annually that all information relevant to the Group audit has been provided to the Directors and that reasonable steps have been taken to ensure full disclosure in response to requests for information from the external auditors. The Committee Chair participated in the 2022 Annual Report and Form 20-F drafting and review processes, and engaged with the Finance and Transformation Director and the Group Head of Internal Audit during the drafting process. FRC review of the Company's Annual Report and Accounts to 31 December 2021 The UK Financial Reporting Council (FRC) carried out a limited scope review of TCFD and climate disclosures in the Company's Annual Report and Accounts to 31 December 2021. The FRC's correspondence with the Company regarding that review confirmed there were no questions or queries that the FRC wished to raise with the Company. The outcomes of the FRC's limited scope review were reviewed by the Committee and have been taken into account in the preparation of this Annual Report and Form 20-F for 2022. The limited scope review conducted by the FRC was based solely on the Company's Annual Report and Accounts to 31 December 2021. The FRC's review does not provide any assurance that the Company's Annual Report and Accounts to 31 December 2021 are correct in all material respects; the FRC's role is to consider compliance with reporting requirements, not to verify the information provided. SOx compliance oversight The Company is subject to certain rules and regulations of US securities laws, including the US Securities Exchange Act 1934 and SOx. SOx places specific responsibility on the Chief Executive and Finance and Transformation Director to certify or disclose information applicable to the financial statements, disclosure controls and procedures (DCP) and internal controls over financial reporting (ICFR). This includes our Chief Executive and Finance and Transformation Director giving attestations in respect of ICFR effectiveness under §404 of SOx. The Committee has oversight of processes established to ensure full and ongoing compliance with applicable US securities laws, including SOx. Two committees provided assurance during 2022 with regard to applicable SOx certifications. The Disclosure Committee reviews the Company’s financial statements for appropriate disclosure, designs and maintains DCPs, and reports to, and is subject to the oversight of, the Chief Executive and the Finance and Transformation Director. A sub-committee of the Disclosure Committee, the SOx Steering Committee, provides assurance that ICFR have been designed, and are being operated, implemented, evaluated and disclosed appropriately, in accordance with applicable requirements and subject to the oversight of the Chief Executive and Finance and Transformation Director. The activities of this sub-committee are directly reported to the Disclosure Committee. The outputs from the Disclosure Committee and SOx Steering Committee were presented to and reviewed by the Committee. BAT Annual Report and Form 20-F 2022 Strategic Report Governance Report Financial Statements Other Information 157
No material weaknesses were identified and the Committee is satisfied that, where areas for improvement were identified, processes are in place to ensure that remedial action is taken and progress is monitored. In 2022, the Committee also reviewed the scope of the external auditors’ SOx procedures, and received reports on their progress with their independent assessment of ICFR across the Group. Code of Ethics for the Chief Executive and Senior Financial Officers The Company has adopted a Code of Ethics applicable to the Chief Executive, the Finance and Transformation Director, and other senior financial officers, as required by US securities laws and NYSE listing standards. No waivers or exceptions to the Code of Ethics were granted in 2022. Group Standards of Business Conduct (SoBC) The Committee is responsible for monitoring compliance with the SoBC, and reports on this to the Board. The SoBC requires all staff to act with a high degree of business integrity, comply with applicable laws and regulations, and ensure that standards are never compromised for the sake of results. Every Group company and all staff worldwide, including senior management and the Board, are expected to adhere to the SoBC. The SoBC and the Group’s Delivery with Integrity compliance programme are discussed on pages 66 to 67. All Group companies have adopted the SoBC or local equivalent. Information on compliance with the SoBC is gathered at a regional and global level and reports of SoBC allegations, including details of the channels through which allegations are reported, are provided on a regular basis to the Regional Audit and CSR Committees, Corporate Audit Committee, and to the Committee. A breakdown of SoBC contacts and SoBC allegations reported across the Group in 2022 is set out on page 66. The SoBC and information on the total number of SoBC contacts and SoBC allegations reported in 2022 (including established breaches) is available at bat.com/sobc Speak Up The Group maintains Speak Up channels which enable concerns regarding SoBC compliance matters, including concerns about possible improprieties in financial reporting, to be raised in confidence (and anonymously should an individual wish) without fear of reprisal. The SoBC includes the Group’s Speak Up policy, which is supplemented by local procedures throughout the Group that provide staff with further guidance on reporting matters and raising concerns, and the channels through which they can do so. The Board periodically reviews the Group’s Speak Up policy and reports arising from Speak Up channels. The Speak Up policy was revised with effect from 1 January 2022 (as part of the revised SoBC). The Board is satisfied that the Group’s Speak Up policy and procedures enable proportionate and independent investigation of matters raised, and ensure that appropriate follow-up action is taken. Read more about Speak Up channels and Speak Up reports on page 66 Political contributions The Group does not make contributions to UK or European Union (EU) political organisations or incur UK or EU political expenditure. The total amount of political contributions made to non-UK political parties in 2022 was £4,576,059 (2021: £4,339,371) as follows: Reynolds American Companies reported political contributions totalling £4,576,059 (US$5,656,010) for the full year 2022 to US political organisations and to non-federal-level political party and candidate committees in accordance with their contributions programme. No corporate contributions were made to federal candidates or party committees and all contributions were made in accordance with applicable laws. All political contributions made by Reynolds American Companies are assessed and approved in accordance with Reynolds American’s policies and procedures to ensure appropriate oversight and compliance with applicable laws. In accordance with the US Federal Election Campaign Act, Reynolds American Companies continue to support an employee- operated Political Action Committee (PAC), a non-partisan committee registered with the US Federal Election Commission that facilitates voluntary political donations by eligible employees of Reynolds American Companies. According to US federal finance laws, the PAC is a separate segregated fund and is controlled by a governing board of individual employee-members of the PAC. In 2022, Reynolds American Companies incurred expenses, as authorised by US law, in providing administrative support to the PAC. No other political contributions were reported. BAT Annual Report and Form 20-F 2022 Strategic Report Governance Report Financial Statements Other Information Audit, Risk, Internal Control Audit Committee Continued 158
The 2022 Remuneration Policy strengthens the link between remuneration and BAT 's strategy – A Better Tomorrow™ and provides further alignment with shareholders and our ambitious ESG agenda. Dimitri Panayotopoulos Chair of the Remuneration Committee Remuneration Committee current members Dimitri Panayotopoulos (Chair) Kandy Anand Sue Farr Savio Kwan Dear Shareholders, On behalf of the Board, I am pleased to introduce our 2022 Directors’ Remuneration Report. In 2022, we continued to accelerate our transformation and deliver results in line with our guidance, while navigating a more challenging macro-economic environment exacerbated by the conflict in Ukraine. This was driven by the hard work and commitment of Group employees across the world, and their focus on the delivery of our three strategic priorities, demonstrating once again the strength and resilience of our business. With the COVID-19 crisis having been a persistent theme at the start of the year, we maintained our position of no furloughing of employees, no compulsory redundancies, and no pay reductions related to the COVID-19 pandemic. Shareholder Engagement Earlier in 2022, we concluded our engagement process by writing to our major shareholders, representing 60% of our issued share capital together with the Investment Association, Institutional Shareholder Services and Glass Lewis, to share the outcomes of the extensive engagement process we undertook in the latter part of 2021. In that communication we outlined the final 2022 Remuneration Policy proposals following refinements made by the Committee to incorporate the feedback we received from our shareholders. There was a wide range of views on the detail of the proposals with most shareholders recognising that the changes proposed were appropriate for the Group and support the delivery of our corporate purpose, ESG and transformation agendas. At the 2022 Annual General Meeting, we presented our new Directors’ Remuneration Policy, which was very well received and supported by shareholders (94.85% votes in favour). On behalf of the Remuneration Committee, I would like to thank shareholders and their advisory bodies for taking the time to engage with us and for their feedback, which provided valuable input and assisted the Committee in developing the new Remuneration Policy. Remuneration Policy and ESG The new Remuneration Policy strengthens the link between remuneration and BAT's strategy - A Better Tomorrow™ - and provides further alignment with shareholders and our ambitious ESG agenda. We are putting ESG at the heart of our strategy and corporate purpose by delivering sustainable growth, encouraging more consumers to transition to reduced risk products*† and reducing the health impact of our business. As more fully described in the new Remuneration Policy, this has been firmly embedded into our Executive Directors’ remuneration through new quantifiable performance measures in the Short-Term and Long-Term Incentive Plans with greater focus on revenue growth and improving profitability in New Categories (further details are on pages 50 and 51). Wider Workforce Context In 2022, the Remuneration Committee has considered pay decisions against the backdrop of the inflationary pressures faced by all our employees to ensure that pay decisions reflect the principles of fairness and equitable treatment. The Remuneration Committee noted the work undertaken by the Group to support employees during this difficult period, such as off-cycle salary increases targeting lower paid employee groups, additional budgets allocated by the Group for wider workforce salary increases in the UK and globally, and changes to enhance benefits and wellbeing programmes. Notes: * Based on the weight of evidence and assuming a complete switch from cigarette smoking. These products are not risk free and are addictive. † Our Vapour product Vuse (including Alto, Solo, Ciro and Vibe), and certain products including Velo, Grizzly, Kodiak, and Camel Snus, which are sold in the U.S., are subject to FDA regulation and no reduced-risk claims will be made as to these products without agency clearance. The 2022 Annual Report on Remuneration has been prepared in accordance with the relevant provisions of the Companies Act 2006 and as prescribed in The Large and Medium-sized Companies and Group (Accounts and Reports) (Amendment) Regulations 2013 (the UK Directors’ Remuneration Report Regulations). Remuneration Committee terms of reference The Committee’s terms of reference align with the requirements of the Code. No changes were made to the Committee’s terms of reference in 2022. For the Committee’s terms of reference see www.bat.com/governance BAT Annual Report and Form 20-F 2022 Strategic Report Governance Report Financial Statements Other Information Remuneration Report Annual Statement on Remuneration 159
Our Performance and Remuneration Outcomes for 2022 The new “At a Glance” section provides an overview of our financial performance and how it translates into outcomes under the Short-Term and Long-Term Incentive plans, with further details provided on pages 165 and 166. After reflecting on a range of considerations as described further in this report, the Committee was satisfied that the Remuneration Policy had operated as intended. 2022 Target Setting The performance targets set by the Committee early in the year have remained unchanged throughout the 2022 performance period. Target setting was focused on ensuring continued delivery towards the Group’s £5 billion of New Category revenue and profitability targets by 2025, continuing to drive value through our combustibles business, and generating cash to support our Capital Allocation Agenda. In setting the 2022 targets, the Committee also considered the expectations around our further growth in Non-Combustible product consumer base, strong New Category revenue and volume growth and improvement in New Category contribution (refer to page 329). In order to meet profit objectives, ambitious cost savings were also embedded in the targets, aiming to mitigate some of the pressures arising from the inflation in our cost base. The inclusion of New Categories revenue growth in both the Short-Term and Long- Term Incentives is an important step given that New Categories growth is a critical part of our long-term strategy and ESG agenda. The STI measure will continue to provide focus on in year delivery, while the LTIP measure will focus on cumulative and sustained performance over a three-year period. 2022 Short-Term Incentive Our 2022 performance demonstrated our continued focus on delivery against our three priorities – Step Change in New Categories, Combustibles Value Growth and Simplify the Company, with New Categories becoming a greater driver of Group performance and, from 2022, a key component of the Short-Term Incentive and the Long-Term Incentive. In 2022, strong revenue growth continued, led by pricing and New Category revenue growth which increased by 37.0% to £2,813 million (at constant rates of exchange). New Categories contribution, a new performance measure included in 2022 to incentivise delivery of the New Category profitability targets by 2025, improved by £578 million through volume growth, strong pricing and cost of sales productivity savings. We have outperformed the 2022 targets, which were set in relation to the original 2025 ambition, enabling the Group to accelerate progress early in this critical area of our business. Adjusted profit from operations (at constant rates of exchange) improved by 4.3%, driven by accelerated growth in New Categories, strong pricing, optimised resource allocation, productivity savings, and further costs saving initiatives including the actualisation of Quantum benefits. Cash delivery continued to be strong realising over £7.4 billion of adjusted cash generated from operations. Group volume share (of cigarette and THP) in key markets reduced by 10 bps. The above performance translates into a result of 77.7% of maximum opportunity. 2020 Long-Term Incentive The performance results of the last 3 years (2020, 2021 and 2022) are reflected in the outcomes for the 2020 LTIP award: – Total shareholder return (TSR) relative to peers (20%): Over the performance period, we returned more than £6.9 billion to shareholders in the form of dividends and share buy-backs. This, together with our share price performance, reflecting our focus on delivering our strategy, as well as robust financial results and the resilience of our business model, resulted in BAT TSR ranking 4th amongst our TSR peer group of 24 companies (page 166). – Adjusted diluted earnings per share (EPS) (40%): We measure adjusted diluted EPS at current and constant rates of exchange (equally weighted). The 3-year adjusted diluted EPS compound annual growth rate (CAGR) was 4.7% and 5.9%, respectively. – Group revenue (20%): The 3-year Group revenue CAGR was 4.1% at constant rates of exchange. – Operating cash flow conversion (20%): We have continued to demonstrate the ongoing strength of the Group in turning operating performance into cash, resulting in a 102.2% operating cash flow conversion ratio at current rates over the last 3 years. As previously announced, we are working towards transferring our Russian business in full compliance with international and local laws and have suspended all planned capital investment into Russia in 2022. In addition, the Group’s subsidiary in Belarus will form part of the transaction. As Russia and Belarus have been part of the Group throughout 2022, it was decided not to make any adjustments to the 2022 STI and LTI targets set at the beginning of the year - both targets and the results are inclusive of contribution from our Russian and Belarusian businesses. The full treatment of our Russian and Belarusian businesses under IFRS rules, including impairment charges and associated costs, are detailed on pages 215, 266 and 267. The above performance translates into a result of 58.9% of maximum for the 2020 LTIP. Following evaluation of the formulaic outcomes for both the STI plan and LTIP, the Committee considered the results against the underlying performance of the Group and the experience of our shareholders. The Committee concluded that the outcomes were a fair reflection of performance delivered in what continues to be challenging and volatile market conditions and no adjustments were required. In addition, share price fluctuation is reflected throughout the Executive Directors’ remuneration in the vesting and holding periods as well as their individual shareholdings. The Committee also considered whether there were any potential windfall gains for the LTIP award granted in March 2020 in the immediate aftermath of the COVID-19 outbreak. Consideration was given to several factors including the share price at the point of grant which was within the range of share price performance during FY2019; the share price following grant, which remained around the grant price for the 2020/2021 period, and the share price growth since grant, which was delivered almost entirely over 2022, reflecting the Group's performance over that period. The Remuneration Committee also noted that the value of the 2020 awards is indicative at this stage, as awards are subject to the additional two-year holding period and will not vest to the Executive Directors until March 2025. Based on consideration of the above factors, amongst others, it was concluded that an adjustment to the size of the awards was not warranted. More details are provided on page 166. BAT Annual Report and Form 20-F 2022 Strategic Report Governance Report Financial Statements Other Information Remuneration Report Annual Statement on Remuneration Continued 160
Executive Directors Remuneration In determining the 2023 salary increases for the Chief Executive and Finance and Transformation Director, the Remuneration Committee noted that in the UK, salary increases for the majority of employees are expected to be around 5.5% on average. In addition, the Remuneration Committee also considered the underlying company performance for the financial year and individual contribution of the Executive Directors, including continued strong growth in New Categories revenue and New Categories contribution, continued growth in consumer acquisition, as well as further improvements in the Group’s cost structure through Quantum delivery while ensuring the Group navigated through a complex and deteriorating macro- economic environment during the year. The Committee also reviewed the market data provided by external consultants to reference the competitive positioning of the Executive Directors' total remuneration in relation to our pay comparator group and wider market, noting that there were no salary increases granted to either Executive Director in 2022 and that the Finance and Transformation Director’s last salary adjustment was in 2020.The Remuneration Committee also reviewed the impact of salary adjustments on total compensation of the Executive Directors to ensure the overall potential quantum remains reasonable. Taking the above points into account, the Remuneration Committee decided to approve a salary increase of 4.5% for the Chief Executive and 5.0% for the Finance and Transformation Director, which are below the level of the wider UK workforce. Wider Workforce Activities The Remuneration Committee continued to engage in matters related to all employees, ensuring a robust understanding of the issues affecting the wider workforce, drawing from a range of well-established engagement channels worldwide covering the Group’s global workforce. The Committee remains mindful of executive pay in the broader context, ensuring the Remuneration Policy is implemented with the desired attributes of fairness, transparency, proportionality, and alignment to broader organisational culture and societal expectations. Building a diverse and inclusive culture We want to be confident that our pay practices are delivering equal pay globally and that any differences in pay between employees performing similar work are for objective reasons. More information is available in our 2022 People, Diversity and Culture Report starting on page 84. Equal Pay for Equal Work In 2022, we extended the scope of our Pay Equity Review to include approximately 40,000 employees across 44 markets, covering approximately 80% of our people from a gender pay equity perspective. For the first time, we also included data for approximately 14,000 employees across 7 countries covering approximately 30% of our workforce for our Ethnicity Pay Equity Review. The Group results show that pay difference between men and women, and between ethnically diverse and non-ethnically diverse groups is within 1% (on consolidated basis), for doing work of equal value. This demonstrates that our pay practices are founded on fair and legitimate drivers of pay. For the second year in succession, we gained independent accreditation for our Pay Equity Review from Fair Pay Workplace, demonstrating our commitment to pay equity in order to create a more equitable and inclusive workplace. Looking Ahead to 2023 We continued to accelerate our transformation journey towards A Better TomorrowTM in 2022 and creating value for all stakeholders. Our new Remuneration Policy drives pay for performance and provides strong alignment with the Group strategy and our ambitious ESG agenda. We have determined that the measures and weightings used in our incentive plans remain relevant, therefore, we will not make any changes to the STI and LTI performance measures for the 2023 performance year. We hope you find this report informative. We continue to maintain an open dialogue on remuneration matters and welcome your further comments and feedback and respectfully ask for your support at the forthcoming Annual General Meeting. Dimitri Panayotopoulos Chair, Remuneration Committee 8 February 2023 BAT Annual Report and Form 20-F 2022 Strategic Report Governance Report Financial Statements Other Information 161
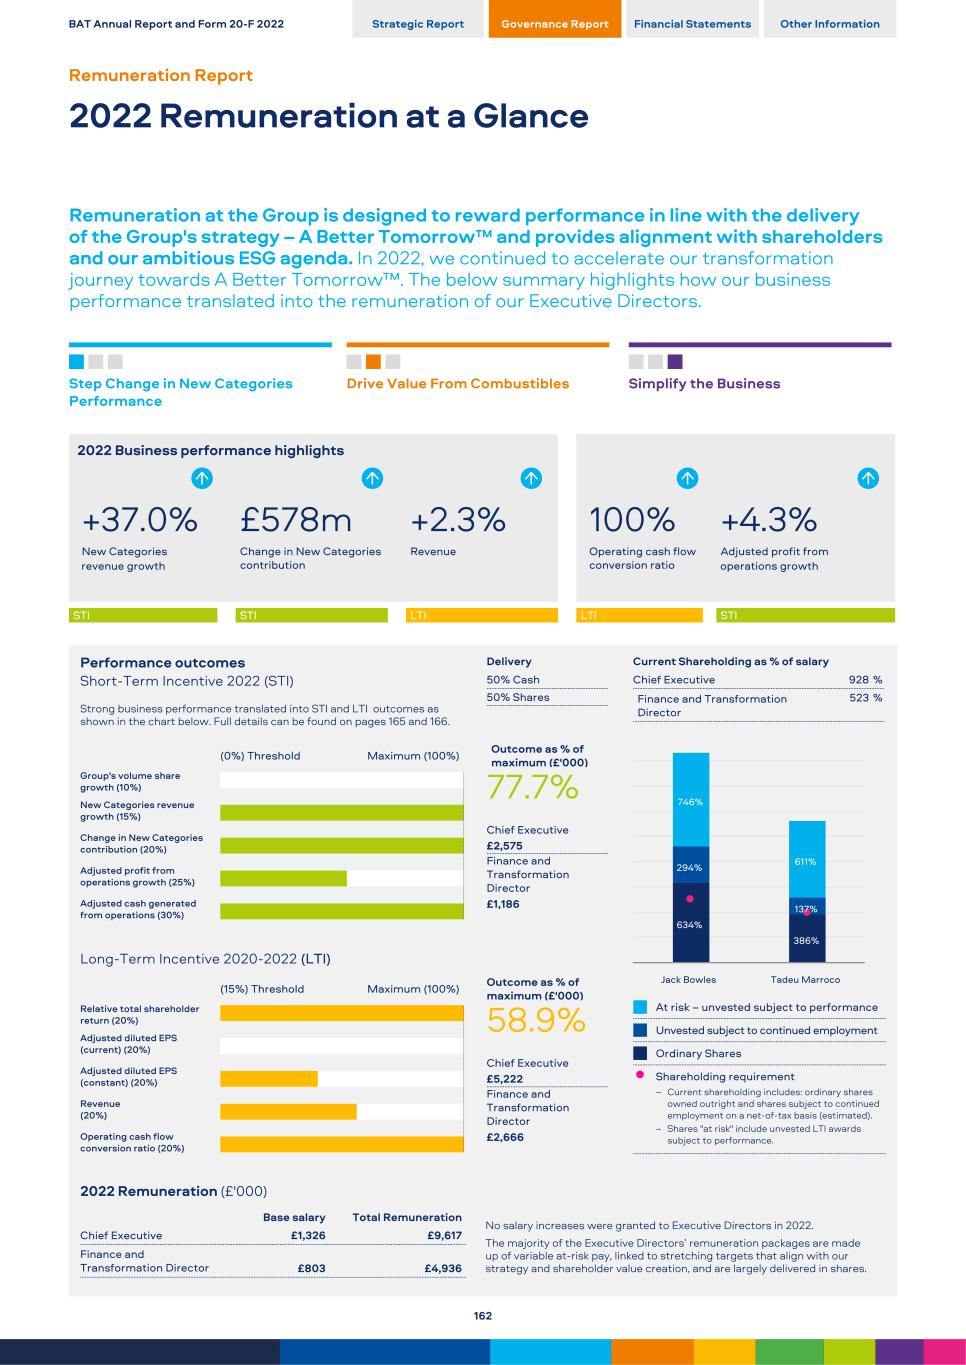
Step Change in New Categories Performance Drive Value From Combustibles Simplify the Business 2022 Business performance highlights +37.0% £578m +2.3% 100% +4.3% New Categories revenue growth Change in New Categories contribution Revenue Operating cash flow conversion ratio Adjusted profit from operations growth STI STI LTI LTI STI Performance outcomes Delivery Short-Term Incentive 2022 (STI) 50% Cash 50% Shares Strong business performance translated into STI and LTI outcomes as shown in the chart below. Full details can be found on pages 165 and 166. (0%) Threshold Maximum (100%) Outcome as % of maximum (£'000) Group's volume share growth (10%) 77.7% New Categories revenue growth (15%) Chief Executive Change in New Categories contribution (20%) £2,575 Finance and Transformation Director Adjusted profit from operations growth (25%) Adjusted cash generated from operations (30%) £1,186 Long-Term Incentive 2020-2022 (LTI) (15%) Threshold Maximum (100%) Outcome as % of maximum (£'000) Relative total shareholder return (20%) 58.9% Adjusted diluted EPS (current) (20%) Chief Executive Adjusted diluted EPS (constant) (20%) £5,222 Finance and Transformation Director Revenue (20%) Operating cash flow conversion ratio (20%) £2,666 Current Shareholding as % of salary Chief Executive 928 % Finance and Transformation Director 523 % 634% 386% 294% 137% 746% 611% Jack Bowles Tadeu Marroco At risk – unvested subject to performance Unvested subject to continued employment Ordinary Shares l Shareholding requirement – Current shareholding includes: ordinary shares owned outright and shares subject to continued employment on a net-of-tax basis (estimated). – Shares "at risk" include unvested LTI awards subject to performance. 2022 Remuneration (£'000) No salary increases were granted to Executive Directors in 2022. The majority of the Executive Directors’ remuneration packages are made up of variable at-risk pay, linked to stretching targets that align with our strategy and shareholder value creation, and are largely delivered in shares. Base salary Total Remuneration Chief Executive £1,326 £9,617 Finance and Transformation Director £803 £4,936 BAT Annual Report and Form 20-F 2022 Strategic Report Governance Report Financial Statements Other Information Remuneration Report 2022 Remuneration at a Glance Remuneration at the Group is designed to reward performance in line with the delivery of the Group's strategy – A Better Tomorrow™ and provides alignment with shareholders and our ambitious ESG agenda. In 2022, we continued to accelerate our transformation journey towards A Better Tomorrow™. The below summary highlights how our business performance translated into the remuneration of our Executive Directors. 162
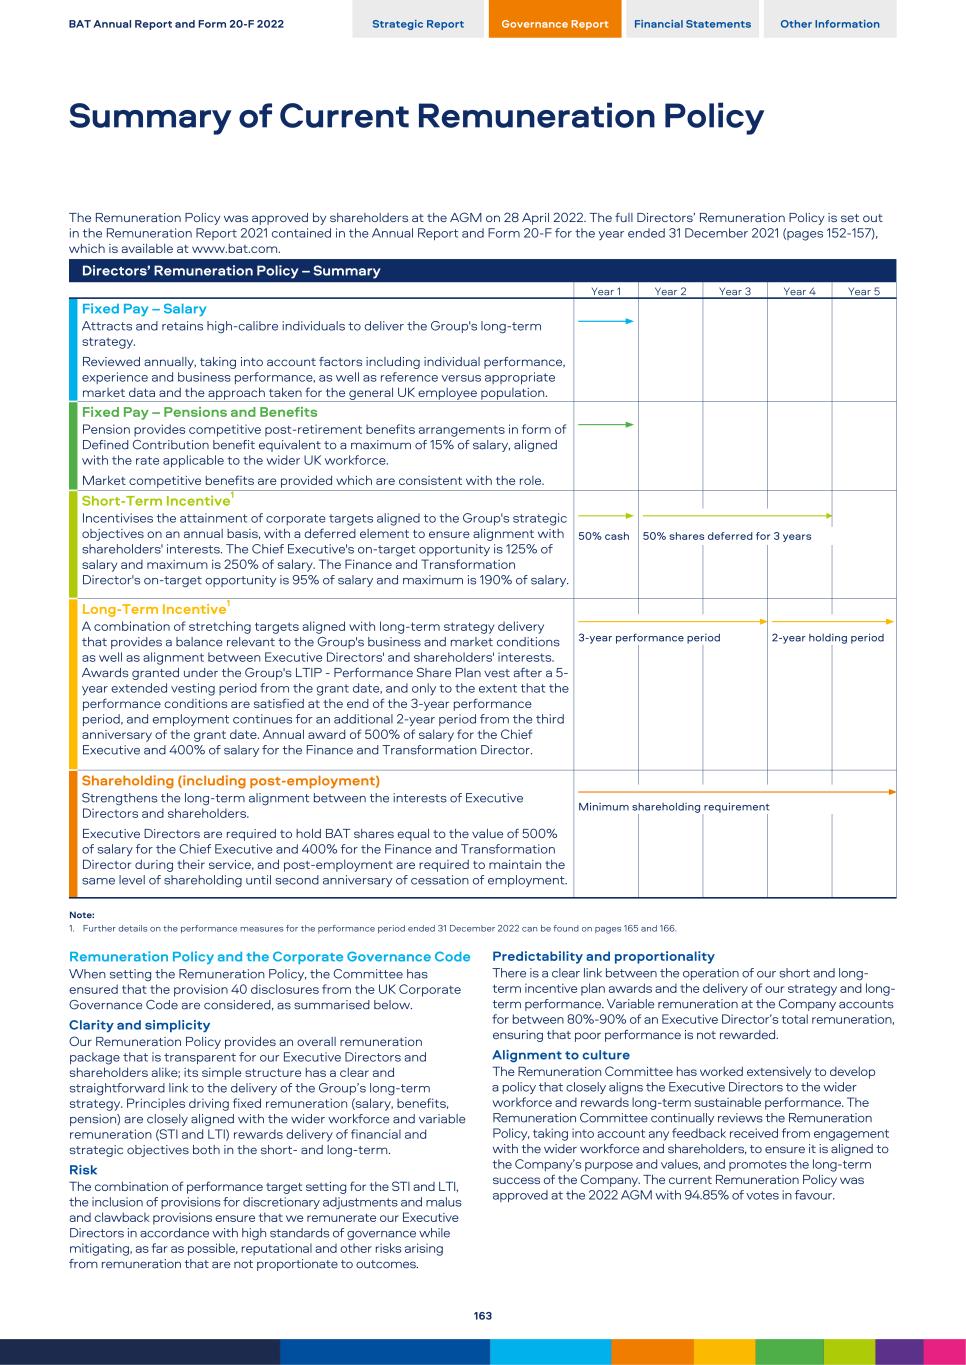
The Remuneration Policy was approved by shareholders at the AGM on 28 April 2022. The full Directors’ Remuneration Policy is set out in the Remuneration Report 2021 contained in the Annual Report and Form 20-F for the year ended 31 December 2021 (pages 152-157), which is available at www.bat.com. Directors’ Remuneration Policy – Summary Year 1 Year 2 Year 3 Year 4 Year 5 Fixed Pay – Salary Attracts and retains high-calibre individuals to deliver the Group's long-term strategy. Reviewed annually, taking into account factors including individual performance, experience and business performance, as well as reference versus appropriate market data and the approach taken for the general UK employee population. Fixed Pay – Pensions and Benefits Pension provides competitive post-retirement benefits arrangements in form of Defined Contribution benefit equivalent to a maximum of 15% of salary, aligned with the rate applicable to the wider UK workforce. Market competitive benefits are provided which are consistent with the role. Short-Term Incentive1 Incentivises the attainment of corporate targets aligned to the Group's strategic objectives on an annual basis, with a deferred element to ensure alignment with shareholders' interests. The Chief Executive's on-target opportunity is 125% of salary and maximum is 250% of salary. The Finance and Transformation Director's on-target opportunity is 95% of salary and maximum is 190% of salary. 50% cash 50% shares deferred for 3 years Long-Term Incentive1 A combination of stretching targets aligned with long-term strategy delivery that provides a balance relevant to the Group's business and market conditions as well as alignment between Executive Directors' and shareholders' interests. Awards granted under the Group's LTIP - Performance Share Plan vest after a 5- year extended vesting period from the grant date, and only to the extent that the performance conditions are satisfied at the end of the 3-year performance period, and employment continues for an additional 2-year period from the third anniversary of the grant date. Annual award of 500% of salary for the Chief Executive and 400% of salary for the Finance and Transformation Director. 3-year performance period 2-year holding period Shareholding (including post-employment) Strengthens the long-term alignment between the interests of Executive Directors and shareholders. Executive Directors are required to hold BAT shares equal to the value of 500% of salary for the Chief Executive and 400% for the Finance and Transformation Director during their service, and post-employment are required to maintain the same level of shareholding until second anniversary of cessation of employment. Minimum shareholding requirement Note: 1. Further details on the performance measures for the performance period ended 31 December 2022 can be found on pages 165 and 166. Remuneration Policy and the Corporate Governance Code When setting the Remuneration Policy, the Committee has ensured that the provision 40 disclosures from the UK Corporate Governance Code are considered, as summarised below. Clarity and simplicity Our Remuneration Policy provides an overall remuneration package that is transparent for our Executive Directors and shareholders alike; its simple structure has a clear and straightforward link to the delivery of the Group’s long-term strategy. Principles driving fixed remuneration (salary, benefits, pension) are closely aligned with the wider workforce and variable remuneration (STI and LTI) rewards delivery of financial and strategic objectives both in the short- and long-term. Risk The combination of performance target setting for the STI and LTI, the inclusion of provisions for discretionary adjustments and malus and clawback provisions ensure that we remunerate our Executive Directors in accordance with high standards of governance while mitigating, as far as possible, reputational and other risks arising from remuneration that are not proportionate to outcomes. Predictability and proportionality There is a clear link between the operation of our short and long- term incentive plan awards and the delivery of our strategy and long- term performance. Variable remuneration at the Company accounts for between 80%-90% of an Executive Director’s total remuneration, ensuring that poor performance is not rewarded. Alignment to culture The Remuneration Committee has worked extensively to develop a policy that closely aligns the Executive Directors to the wider workforce and rewards long-term sustainable performance. The Remuneration Committee continually reviews the Remuneration Policy, taking into account any feedback received from engagement with the wider workforce and shareholders, to ensure it is aligned to the Company’s purpose and values, and promotes the long-term success of the Company. The current Remuneration Policy was approved at the 2022 AGM with 94.85% of votes in favour. BAT Annual Report and Form 20-F 2022 Strategic Report Governance Report Financial Statements Other Information Summary of Current Remuneration Policy 163
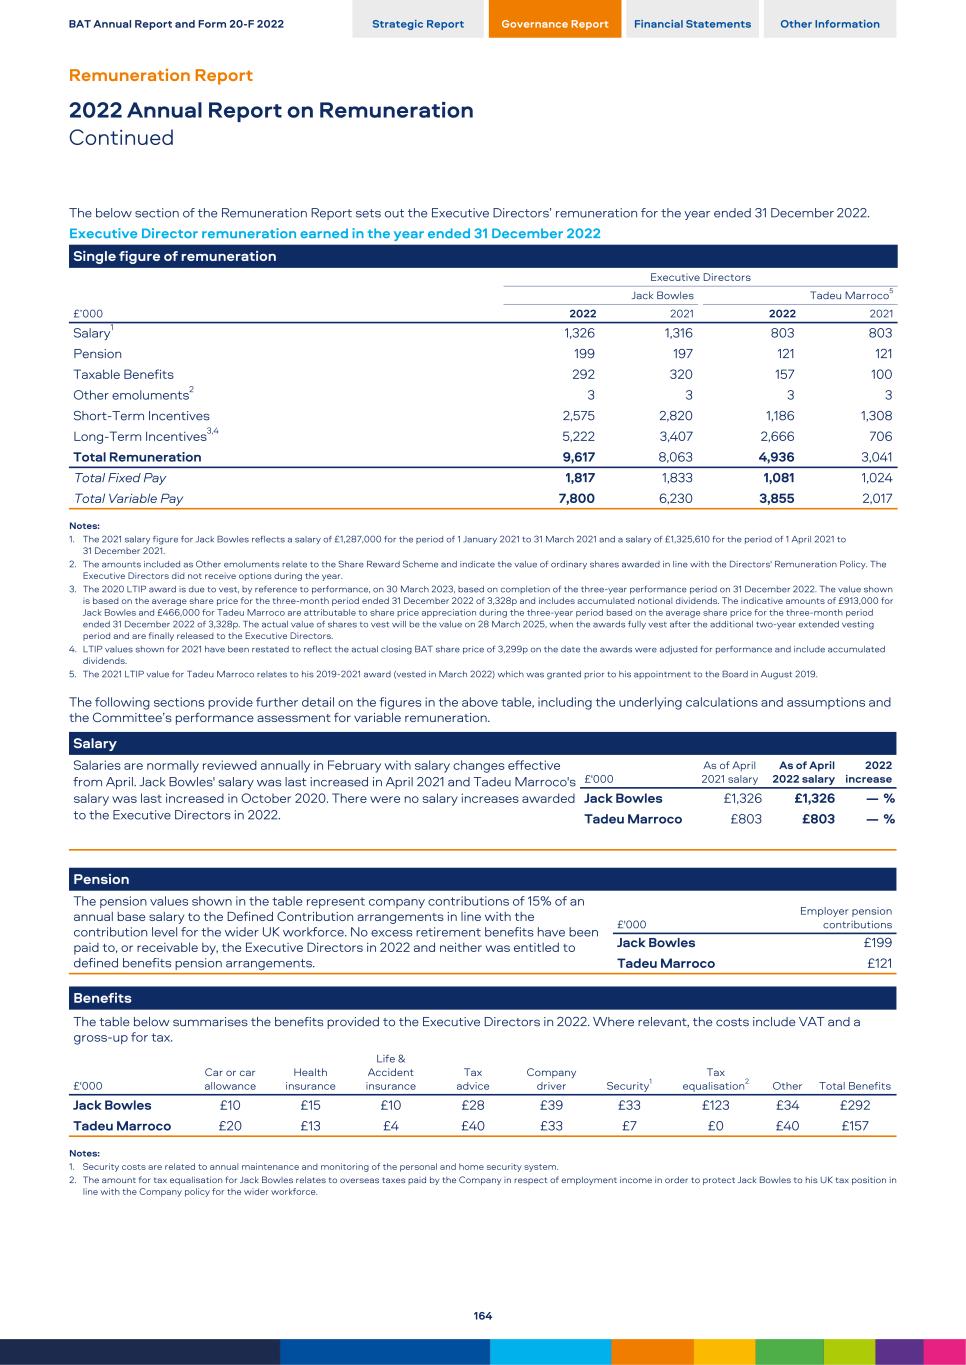
The below section of the Remuneration Report sets out the Executive Directors’ remuneration for the year ended 31 December 2022. Executive Director remuneration earned in the year ended 31 December 2022 Single figure of remuneration Executive Directors Jack Bowles Tadeu Marroco5 £’000 2022 2021 2022 2021 Salary1 1,326 1,316 803 803 Pension 199 197 121 121 Taxable Benefits 292 320 157 100 Other emoluments2 3 3 3 3 Short-Term Incentives 2,575 2,820 1,186 1,308 Long-Term Incentives3,4 5,222 3,407 2,666 706 Total Remuneration 9,617 8,063 4,936 3,041 Total Fixed Pay 1,817 1,833 1,081 1,024 Total Variable Pay 7,800 6,230 3,855 2,017 Notes: 1. The 2021 salary figure for Jack Bowles reflects a salary of £1,287,000 for the period of 1 January 2021 to 31 March 2021 and a salary of £1,325,610 for the period of 1 April 2021 to 31 December 2021. 2. The amounts included as Other emoluments relate to the Share Reward Scheme and indicate the value of ordinary shares awarded in line with the Directors' Remuneration Policy. The Executive Directors did not receive options during the year. 3. The 2020 LTIP award is due to vest, by reference to performance, on 30 March 2023, based on completion of the three-year performance period on 31 December 2022. The value shown is based on the average share price for the three-month period ended 31 December 2022 of 3,328p and includes accumulated notional dividends. The indicative amounts of £913,000 for Jack Bowles and £466,000 for Tadeu Marroco are attributable to share price appreciation during the three-year period based on the average share price for the three-month period ended 31 December 2022 of 3,328p. The actual value of shares to vest will be the value on 28 March 2025, when the awards fully vest after the additional two-year extended vesting period and are finally released to the Executive Directors. 4. LTIP values shown for 2021 have been restated to reflect the actual closing BAT share price of 3,299p on the date the awards were adjusted for performance and include accumulated dividends. 5. The 2021 LTIP value for Tadeu Marroco relates to his 2019-2021 award (vested in March 2022) which was granted prior to his appointment to the Board in August 2019. The following sections provide further detail on the figures in the above table, including the underlying calculations and assumptions and the Committee’s performance assessment for variable remuneration. Salary Salaries are normally reviewed annually in February with salary changes effective from April. Jack Bowles' salary was last increased in April 2021 and Tadeu Marroco's salary was last increased in October 2020. There were no salary increases awarded to the Executive Directors in 2022. £'000 As of April 2021 salary As of April 2022 salary 2022 increase Jack Bowles £1,326 £1,326 — % Tadeu Marroco £803 £803 — % Pension The pension values shown in the table represent company contributions of 15% of an annual base salary to the Defined Contribution arrangements in line with the contribution level for the wider UK workforce. No excess retirement benefits have been paid to, or receivable by, the Executive Directors in 2022 and neither was entitled to defined benefits pension arrangements. £'000 Employer pension contributions Jack Bowles £199 Tadeu Marroco £121 Benefits The table below summarises the benefits provided to the Executive Directors in 2022. Where relevant, the costs include VAT and a gross-up for tax. £'000 Car or car allowance Health insurance Life & Accident insurance Tax advice Company driver Security1 Tax equalisation2 Other Total Benefits Jack Bowles £10 £15 £10 £28 £39 £33 £123 £34 £292 Tadeu Marroco £20 £13 £4 £40 £33 £7 £0 £40 £157 Notes: 1. Security costs are related to annual maintenance and monitoring of the personal and home security system. 2. The amount for tax equalisation for Jack Bowles relates to overseas taxes paid by the Company in respect of employment income in order to protect Jack Bowles to his UK tax position in line with the Company policy for the wider workforce. BAT Annual Report and Form 20-F 2022 Strategic Report Governance Report Financial Statements Other Information Remuneration Report 2022 Annual Report on Remuneration Continued 164
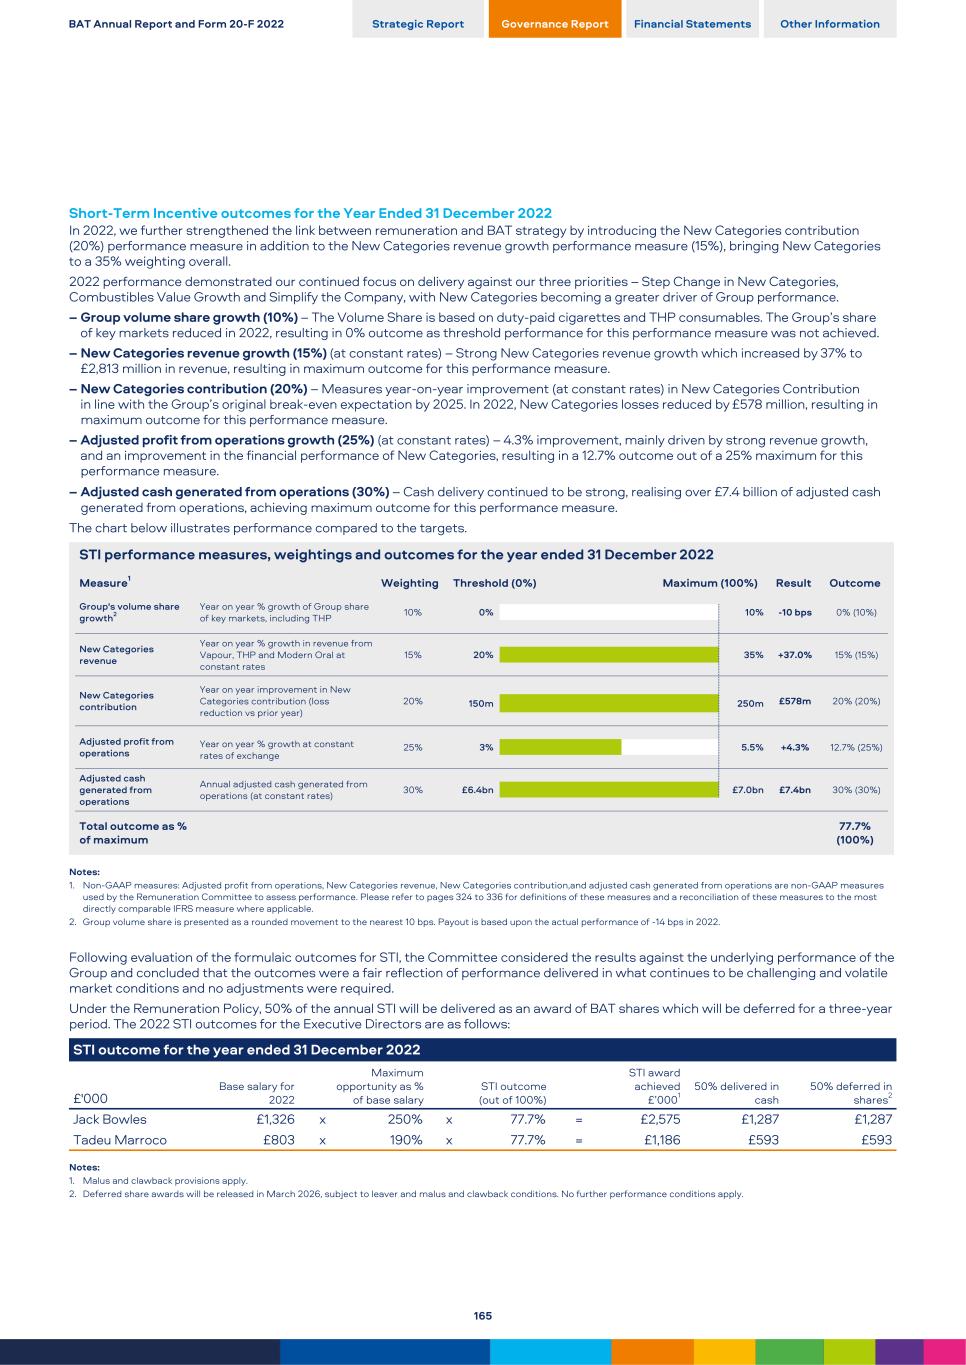
Short-Term Incentive outcomes for the Year Ended 31 December 2022 In 2022, we further strengthened the link between remuneration and BAT strategy by introducing the New Categories contribution (20%) performance measure in addition to the New Categories revenue growth performance measure (15%), bringing New Categories to a 35% weighting overall. 2022 performance demonstrated our continued focus on delivery against our three priorities – Step Change in New Categories, Combustibles Value Growth and Simplify the Company, with New Categories becoming a greater driver of Group performance. – Group volume share growth (10%) – The Volume Share is based on duty-paid cigarettes and THP consumables. The Group’s share of key markets reduced in 2022, resulting in 0% outcome as threshold performance for this performance measure was not achieved. – New Categories revenue growth (15%) (at constant rates) – Strong New Categories revenue growth which increased by 37% to £2,813 million in revenue, resulting in maximum outcome for this performance measure. – New Categories contribution (20%) – Measures year-on-year improvement (at constant rates) in New Categories Contribution in line with the Group’s original break-even expectation by 2025. In 2022, New Categories losses reduced by £578 million, resulting in maximum outcome for this performance measure. – Adjusted profit from operations growth (25%) (at constant rates) – 4.3% improvement, mainly driven by strong revenue growth, and an improvement in the financial performance of New Categories, resulting in a 12.7% outcome out of a 25% maximum for this performance measure. – Adjusted cash generated from operations (30%) – Cash delivery continued to be strong, realising over £7.4 billion of adjusted cash generated from operations, achieving maximum outcome for this performance measure. The chart below illustrates performance compared to the targets. STI performance measures, weightings and outcomes for the year ended 31 December 2022 Measure1 Weighting Threshold (0%) Maximum (100%) Result Outcome Group's volume share growth2 Year on year % growth of Group share of key markets, including THP 10% -10 bps 0% (10%)0% 10% New Categories revenue Year on year % growth in revenue from Vapour, THP and Modern Oral at constant rates 15% +37.0% 15% (15%)20% 35% New Categories contribution Year on year improvement in New Categories contribution (loss reduction vs prior year) 20% £578m 20% (20%)150m 250m Adjusted profit from operations Year on year % growth at constant rates of exchange 25% +4.3% 12.7% (25%)3% 5.5% Adjusted cash generated from operations Annual adjusted cash generated from operations (at constant rates) 30% £7.4bn 30% (30%)£6.4bn £7.0bn Total outcome as % of maximum 77.7% (100%) Notes: 1. Non-GAAP measures: Adjusted profit from operations, New Categories revenue, New Categories contribution,and adjusted cash generated from operations are non-GAAP measures used by the Remuneration Committee to assess performance. Please refer to pages 324 to 336 for definitions of these measures and a reconciliation of these measures to the most directly comparable IFRS measure where applicable. 2. Group volume share is presented as a rounded movement to the nearest 10 bps. Payout is based upon the actual performance of -14 bps in 2022. Following evaluation of the formulaic outcomes for STI, the Committee considered the results against the underlying performance of the Group and concluded that the outcomes were a fair reflection of performance delivered in what continues to be challenging and volatile market conditions and no adjustments were required. Under the Remuneration Policy, 50% of the annual STI will be delivered as an award of BAT shares which will be deferred for a three-year period. The 2022 STI outcomes for the Executive Directors are as follows: STI outcome for the year ended 31 December 2022 £'000 Base salary for 2022 Maximum opportunity as % of base salary STI outcome (out of 100%) STI award achieved £’0001 50% delivered in cash 50% deferred in shares2 Jack Bowles £1,326 x 250% x 77.7% = £2,575 £1,287 £1,287 Tadeu Marroco £803 x 190% x 77.7% = £1,186 £593 £593 Notes: 1. Malus and clawback provisions apply. 2. Deferred share awards will be released in March 2026, subject to leaver and malus and clawback conditions. No further performance conditions apply. BAT Annual Report and Form 20-F 2022 Strategic Report Governance Report Financial Statements Other Information 165
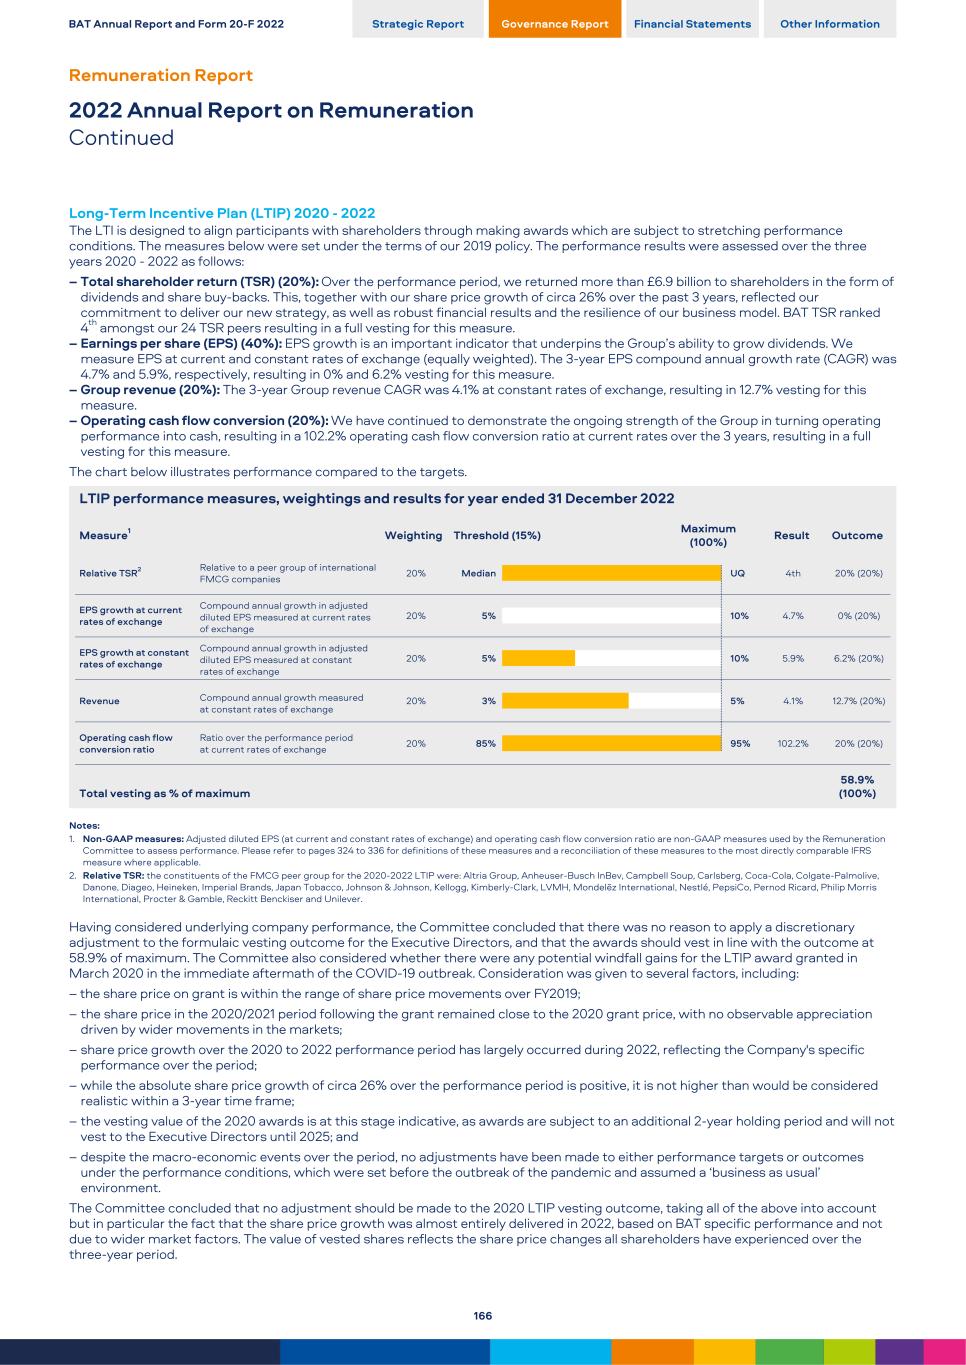
Long-Term Incentive Plan (LTIP) 2020 - 2022 The LTI is designed to align participants with shareholders through making awards which are subject to stretching performance conditions. The measures below were set under the terms of our 2019 policy. The performance results were assessed over the three years 2020 - 2022 as follows: – Total shareholder return (TSR) (20%): Over the performance period, we returned more than £6.9 billion to shareholders in the form of dividends and share buy-backs. This, together with our share price growth of circa 26% over the past 3 years, reflected our commitment to deliver our new strategy, as well as robust financial results and the resilience of our business model. BAT TSR ranked 4th amongst our 24 TSR peers resulting in a full vesting for this measure. – Earnings per share (EPS) (40%): EPS growth is an important indicator that underpins the Group’s ability to grow dividends. We measure EPS at current and constant rates of exchange (equally weighted). The 3-year EPS compound annual growth rate (CAGR) was 4.7% and 5.9%, respectively, resulting in 0% and 6.2% vesting for this measure. – Group revenue (20%): The 3-year Group revenue CAGR was 4.1% at constant rates of exchange, resulting in 12.7% vesting for this measure. – Operating cash flow conversion (20%): We have continued to demonstrate the ongoing strength of the Group in turning operating performance into cash, resulting in a 102.2% operating cash flow conversion ratio at current rates over the 3 years, resulting in a full vesting for this measure. The chart below illustrates performance compared to the targets. LTIP performance measures, weightings and results for year ended 31 December 2022 Measure1 Weighting Threshold (15%) Maximum (100%) Result Outcome Relative TSR2 Relative to a peer group of international FMCG companies 20% 4th 20% (20%)Median UQ EPS growth at current rates of exchange Compound annual growth in adjusted diluted EPS measured at current rates of exchange 20% 4.7% 0% (20%)5% 10% EPS growth at constant rates of exchange Compound annual growth in adjusted diluted EPS measured at constant rates of exchange 20% 5.9% 6.2% (20%)5% 10% Revenue Compound annual growth measured at constant rates of exchange 20% 4.1% 12.7% (20%)3% 5% Operating cash flow conversion ratio Ratio over the performance period at current rates of exchange 20% 102.2% 20% (20%)85% 95% Total vesting as % of maximum 58.9% (100%) Notes: 1. Non-GAAP measures: Adjusted diluted EPS (at current and constant rates of exchange) and operating cash flow conversion ratio are non-GAAP measures used by the Remuneration Committee to assess performance. Please refer to pages 324 to 336 for definitions of these measures and a reconciliation of these measures to the most directly comparable IFRS measure where applicable. 2. Relative TSR: the constituents of the FMCG peer group for the 2020-2022 LTIP were: Altria Group, Anheuser-Busch InBev, Campbell Soup, Carlsberg, Coca-Cola, Colgate-Palmolive, Danone, Diageo, Heineken, Imperial Brands, Japan Tobacco, Johnson & Johnson, Kellogg, Kimberly-Clark, LVMH, Mondelēz International, Nestlé, PepsiCo, Pernod Ricard, Philip Morris International, Procter & Gamble, Reckitt Benckiser and Unilever. Having considered underlying company performance, the Committee concluded that there was no reason to apply a discretionary adjustment to the formulaic vesting outcome for the Executive Directors, and that the awards should vest in line with the outcome at 58.9% of maximum. The Committee also considered whether there were any potential windfall gains for the LTIP award granted in March 2020 in the immediate aftermath of the COVID-19 outbreak. Consideration was given to several factors, including: – the share price on grant is within the range of share price movements over FY2019; – the share price in the 2020/2021 period following the grant remained close to the 2020 grant price, with no observable appreciation driven by wider movements in the markets; – share price growth over the 2020 to 2022 performance period has largely occurred during 2022, reflecting the Company's specific performance over the period; – while the absolute share price growth of circa 26% over the performance period is positive, it is not higher than would be considered realistic within a 3-year time frame; – the vesting value of the 2020 awards is at this stage indicative, as awards are subject to an additional 2-year holding period and will not vest to the Executive Directors until 2025; and – despite the macro-economic events over the period, no adjustments have been made to either performance targets or outcomes under the performance conditions, which were set before the outbreak of the pandemic and assumed a ‘business as usual’ environment. The Committee concluded that no adjustment should be made to the 2020 LTIP vesting outcome, taking all of the above into account but in particular the fact that the share price growth was almost entirely delivered in 2022, based on BAT specific performance and not due to wider market factors. The value of vested shares reflects the share price changes all shareholders have experienced over the three-year period. BAT Annual Report and Form 20-F 2022 Strategic Report Governance Report Financial Statements Other Information Remuneration Report 2022 Annual Report on Remuneration Continued 166
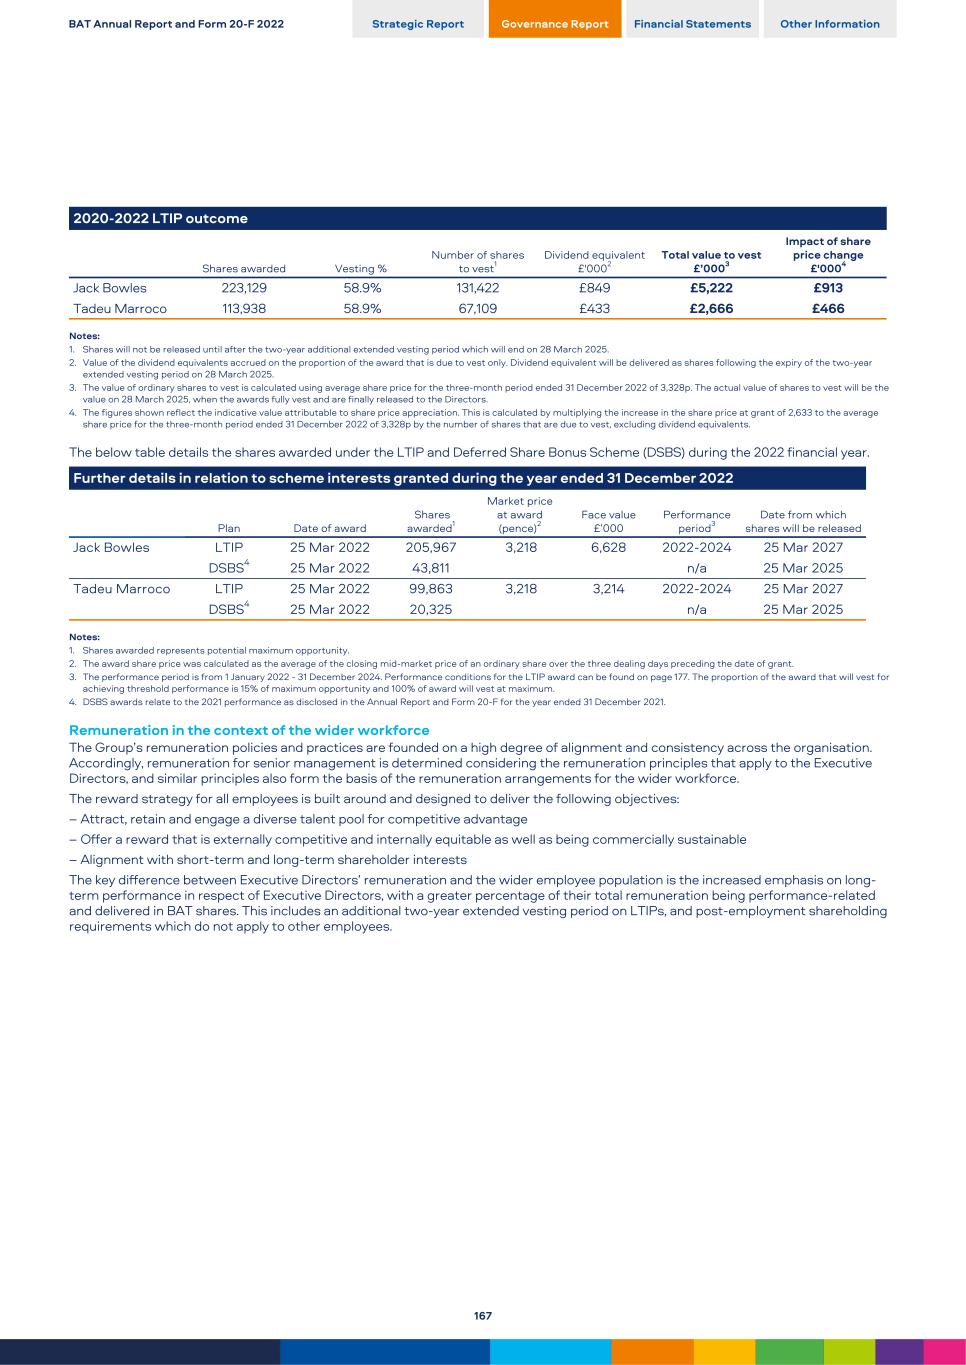
2020-2022 LTIP outcome Shares awarded Vesting % Number of shares to vest1 Dividend equivalent £'0002 Total value to vest £’0003 Impact of share price change £'0004 Jack Bowles 223,129 58.9% 131,422 £849 £5,222 £913 Tadeu Marroco 113,938 58.9% 67,109 £433 £2,666 £466 Notes: 1. Shares will not be released until after the two-year additional extended vesting period which will end on 28 March 2025. 2. Value of the dividend equivalents accrued on the proportion of the award that is due to vest only. Dividend equivalent will be delivered as shares following the expiry of the two-year extended vesting period on 28 March 2025. 3. The value of ordinary shares to vest is calculated using average share price for the three-month period ended 31 December 2022 of 3,328p. The actual value of shares to vest will be the value on 28 March 2025, when the awards fully vest and are finally released to the Directors. 4. The figures shown reflect the indicative value attributable to share price appreciation. This is calculated by multiplying the increase in the share price at grant of 2,633 to the average share price for the three-month period ended 31 December 2022 of 3,328p by the number of shares that are due to vest, excluding dividend equivalents. The below table details the shares awarded under the LTIP and Deferred Share Bonus Scheme (DSBS) during the 2022 financial year. Further details in relation to scheme interests granted during the year ended 31 December 2022 Plan Date of award Shares awarded1 Market price at award (pence)2 Face value £’000 Performance period3 Date from which shares will be released Jack Bowles LTIP 25 Mar 2022 205,967 3,218 6,628 2022-2024 25 Mar 2027 DSBS4 25 Mar 2022 43,811 n/a 25 Mar 2025 Tadeu Marroco LTIP 25 Mar 2022 99,863 3,218 3,214 2022-2024 25 Mar 2027 DSBS4 25 Mar 2022 20,325 n/a 25 Mar 2025 Notes: 1. Shares awarded represents potential maximum opportunity. 2. The award share price was calculated as the average of the closing mid-market price of an ordinary share over the three dealing days preceding the date of grant. 3. The performance period is from 1 January 2022 - 31 December 2024. Performance conditions for the LTIP award can be found on page 177. The proportion of the award that will vest for achieving threshold performance is 15% of maximum opportunity and 100% of award will vest at maximum. 4. DSBS awards relate to the 2021 performance as disclosed in the Annual Report and Form 20-F for the year ended 31 December 2021. Remuneration in the context of the wider workforce The Group’s remuneration policies and practices are founded on a high degree of alignment and consistency across the organisation. Accordingly, remuneration for senior management is determined considering the remuneration principles that apply to the Executive Directors, and similar principles also form the basis of the remuneration arrangements for the wider workforce. The reward strategy for all employees is built around and designed to deliver the following objectives: – Attract, retain and engage a diverse talent pool for competitive advantage – Offer a reward that is externally competitive and internally equitable as well as being commercially sustainable – Alignment with short-term and long-term shareholder interests The key difference between Executive Directors’ remuneration and the wider employee population is the increased emphasis on long- term performance in respect of Executive Directors, with a greater percentage of their total remuneration being performance-related and delivered in BAT shares. This includes an additional two-year extended vesting period on LTIPs, and post-employment shareholding requirements which do not apply to other employees. BAT Annual Report and Form 20-F 2022 Strategic Report Governance Report Financial Statements Other Information 167
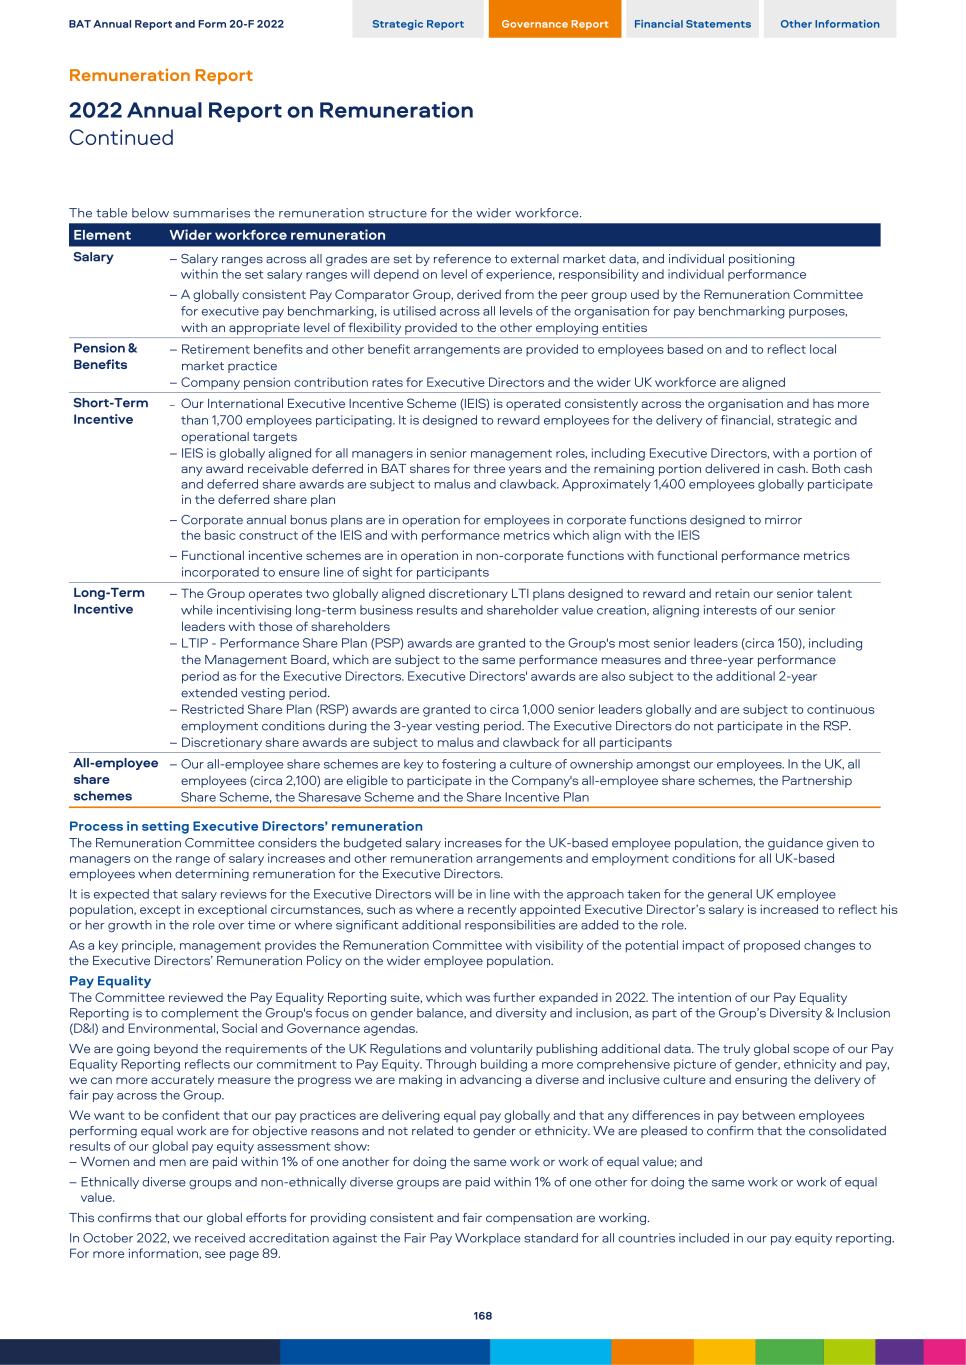
The table below summarises the remuneration structure for the wider workforce. Element Wider workforce remuneration Salary – Salary ranges across all grades are set by reference to external market data, and individual positioning within the set salary ranges will depend on level of experience, responsibility and individual performance – A globally consistent Pay Comparator Group, derived from the peer group used by the Remuneration Committee for executive pay benchmarking, is utilised across all levels of the organisation for pay benchmarking purposes, with an appropriate level of flexibility provided to the other employing entities Pension & Benefits – Retirement benefits and other benefit arrangements are provided to employees based on and to reflect local market practice – Company pension contribution rates for Executive Directors and the wider UK workforce are aligned Short-Term Incentive – Our International Executive Incentive Scheme (IEIS) is operated consistently across the organisation and has more than 1,700 employees participating. It is designed to reward employees for the delivery of financial, strategic and operational targets – IEIS is globally aligned for all managers in senior management roles, including Executive Directors, with a portion of any award receivable deferred in BAT shares for three years and the remaining portion delivered in cash. Both cash and deferred share awards are subject to malus and clawback. Approximately 1,400 employees globally participate in the deferred share plan – Corporate annual bonus plans are in operation for employees in corporate functions designed to mirror the basic construct of the IEIS and with performance metrics which align with the IEIS – Functional incentive schemes are in operation in non-corporate functions with functional performance metrics incorporated to ensure line of sight for participants Long-Term Incentive – The Group operates two globally aligned discretionary LTI plans designed to reward and retain our senior talent while incentivising long-term business results and shareholder value creation, aligning interests of our senior leaders with those of shareholders – LTIP - Performance Share Plan (PSP) awards are granted to the Group's most senior leaders (circa 150), including the Management Board, which are subject to the same performance measures and three-year performance period as for the Executive Directors. Executive Directors' awards are also subject to the additional 2-year extended vesting period. – Restricted Share Plan (RSP) awards are granted to circa 1,000 senior leaders globally and are subject to continuous employment conditions during the 3-year vesting period. The Executive Directors do not participate in the RSP. – Discretionary share awards are subject to malus and clawback for all participants All-employee share schemes – Our all-employee share schemes are key to fostering a culture of ownership amongst our employees. In the UK, all employees (circa 2,100) are eligible to participate in the Company's all-employee share schemes, the Partnership Share Scheme, the Sharesave Scheme and the Share Incentive Plan Process in setting Executive Directors’ remuneration The Remuneration Committee considers the budgeted salary increases for the UK-based employee population, the guidance given to managers on the range of salary increases and other remuneration arrangements and employment conditions for all UK-based employees when determining remuneration for the Executive Directors. It is expected that salary reviews for the Executive Directors will be in line with the approach taken for the general UK employee population, except in exceptional circumstances, such as where a recently appointed Executive Director’s salary is increased to reflect his or her growth in the role over time or where significant additional responsibilities are added to the role. As a key principle, management provides the Remuneration Committee with visibility of the potential impact of proposed changes to the Executive Directors’ Remuneration Policy on the wider employee population. Pay Equality The Committee reviewed the Pay Equality Reporting suite, which was further expanded in 2022. The intention of our Pay Equality Reporting is to complement the Group's focus on gender balance, and diversity and inclusion, as part of the Group’s Diversity & Inclusion (D&I) and Environmental, Social and Governance agendas. We are going beyond the requirements of the UK Regulations and voluntarily publishing additional data. The truly global scope of our Pay Equality Reporting reflects our commitment to Pay Equity. Through building a more comprehensive picture of gender, ethnicity and pay, we can more accurately measure the progress we are making in advancing a diverse and inclusive culture and ensuring the delivery of fair pay across the Group. We want to be confident that our pay practices are delivering equal pay globally and that any differences in pay between employees performing equal work are for objective reasons and not related to gender or ethnicity. We are pleased to confirm that the consolidated results of our global pay equity assessment show: – Women and men are paid within 1% of one another for doing the same work or work of equal value; and – Ethnically diverse groups and non-ethnically diverse groups are paid within 1% of one other for doing the same work or work of equal value. This confirms that our global efforts for providing consistent and fair compensation are working. In October 2022, we received accreditation against the Fair Pay Workplace standard for all countries included in our pay equity reporting. For more information, see page 89. BAT Annual Report and Form 20-F 2022 Strategic Report Governance Report Financial Statements Other Information Remuneration Report 2022 Annual Report on Remuneration Continued 168
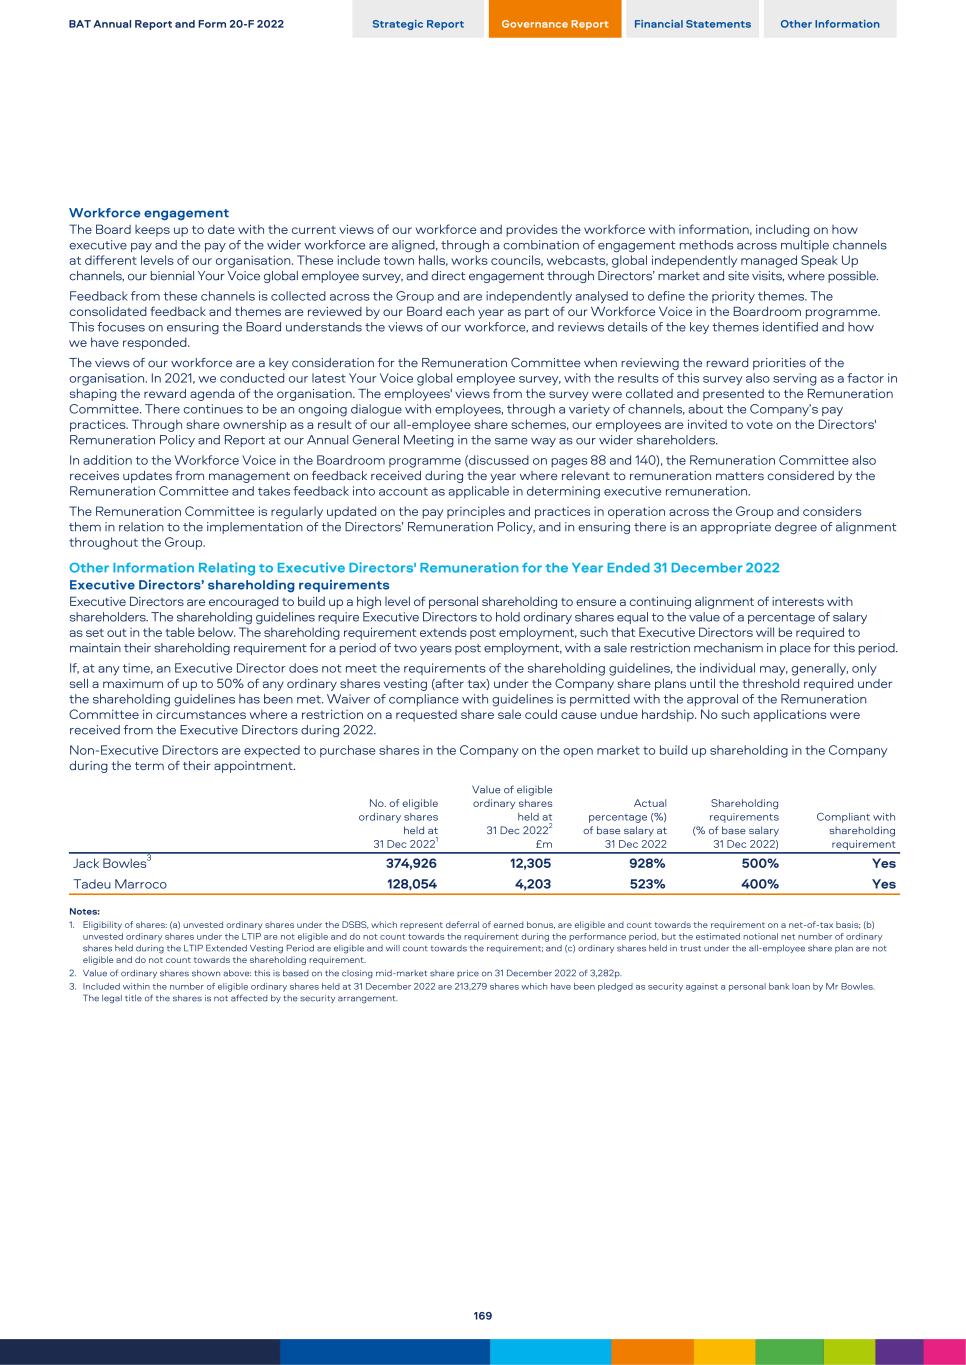
Workforce engagement The Board keeps up to date with the current views of our workforce and provides the workforce with information, including on how executive pay and the pay of the wider workforce are aligned, through a combination of engagement methods across multiple channels at different levels of our organisation. These include town halls, works councils, webcasts, global independently managed Speak Up channels, our biennial Your Voice global employee survey, and direct engagement through Directors’ market and site visits, where possible. Feedback from these channels is collected across the Group and are independently analysed to define the priority themes. The consolidated feedback and themes are reviewed by our Board each year as part of our Workforce Voice in the Boardroom programme. This focuses on ensuring the Board understands the views of our workforce, and reviews details of the key themes identified and how we have responded. The views of our workforce are a key consideration for the Remuneration Committee when reviewing the reward priorities of the organisation. In 2021, we conducted our latest Your Voice global employee survey, with the results of this survey also serving as a factor in shaping the reward agenda of the organisation. The employees' views from the survey were collated and presented to the Remuneration Committee. There continues to be an ongoing dialogue with employees, through a variety of channels, about the Company’s pay practices. Through share ownership as a result of our all-employee share schemes, our employees are invited to vote on the Directors' Remuneration Policy and Report at our Annual General Meeting in the same way as our wider shareholders. In addition to the Workforce Voice in the Boardroom programme (discussed on pages 88 and 140), the Remuneration Committee also receives updates from management on feedback received during the year where relevant to remuneration matters considered by the Remuneration Committee and takes feedback into account as applicable in determining executive remuneration. The Remuneration Committee is regularly updated on the pay principles and practices in operation across the Group and considers them in relation to the implementation of the Directors’ Remuneration Policy, and in ensuring there is an appropriate degree of alignment throughout the Group. Other Information Relating to Executive Directors' Remuneration for the Year Ended 31 December 2022 Executive Directors’ shareholding requirements Executive Directors are encouraged to build up a high level of personal shareholding to ensure a continuing alignment of interests with shareholders. The shareholding guidelines require Executive Directors to hold ordinary shares equal to the value of a percentage of salary as set out in the table below. The shareholding requirement extends post employment, such that Executive Directors will be required to maintain their shareholding requirement for a period of two years post employment, with a sale restriction mechanism in place for this period. If, at any time, an Executive Director does not meet the requirements of the shareholding guidelines, the individual may, generally, only sell a maximum of up to 50% of any ordinary shares vesting (after tax) under the Company share plans until the threshold required under the shareholding guidelines has been met. Waiver of compliance with guidelines is permitted with the approval of the Remuneration Committee in circumstances where a restriction on a requested share sale could cause undue hardship. No such applications were received from the Executive Directors during 2022. Non-Executive Directors are expected to purchase shares in the Company on the open market to build up shareholding in the Company during the term of their appointment. No. of eligible ordinary shares held at 31 Dec 20221 Value of eligible ordinary shares held at 31 Dec 20222 £m Actual percentage (%) of base salary at 31 Dec 2022 Shareholding requirements (% of base salary 31 Dec 2022) Compliant with shareholding requirement Jack Bowles3 374,926 12,305 928% 500% Yes Tadeu Marroco 128,054 4,203 523% 400% Yes Notes: 1. Eligibility of shares: (a) unvested ordinary shares under the DSBS, which represent deferral of earned bonus, are eligible and count towards the requirement on a net-of-tax basis; (b) unvested ordinary shares under the LTIP are not eligible and do not count towards the requirement during the performance period, but the estimated notional net number of ordinary shares held during the LTIP Extended Vesting Period are eligible and will count towards the requirement; and (c) ordinary shares held in trust under the all-employee share plan are not eligible and do not count towards the shareholding requirement. 2. Value of ordinary shares shown above: this is based on the closing mid-market share price on 31 December 2022 of 3,282p. 3. Included within the number of eligible ordinary shares held at 31 December 2022 are 213,279 shares which have been pledged as security against a personal bank loan by Mr Bowles. The legal title of the shares is not affected by the security arrangement. BAT Annual Report and Form 20-F 2022 Strategic Report Governance Report Financial Statements Other Information 169
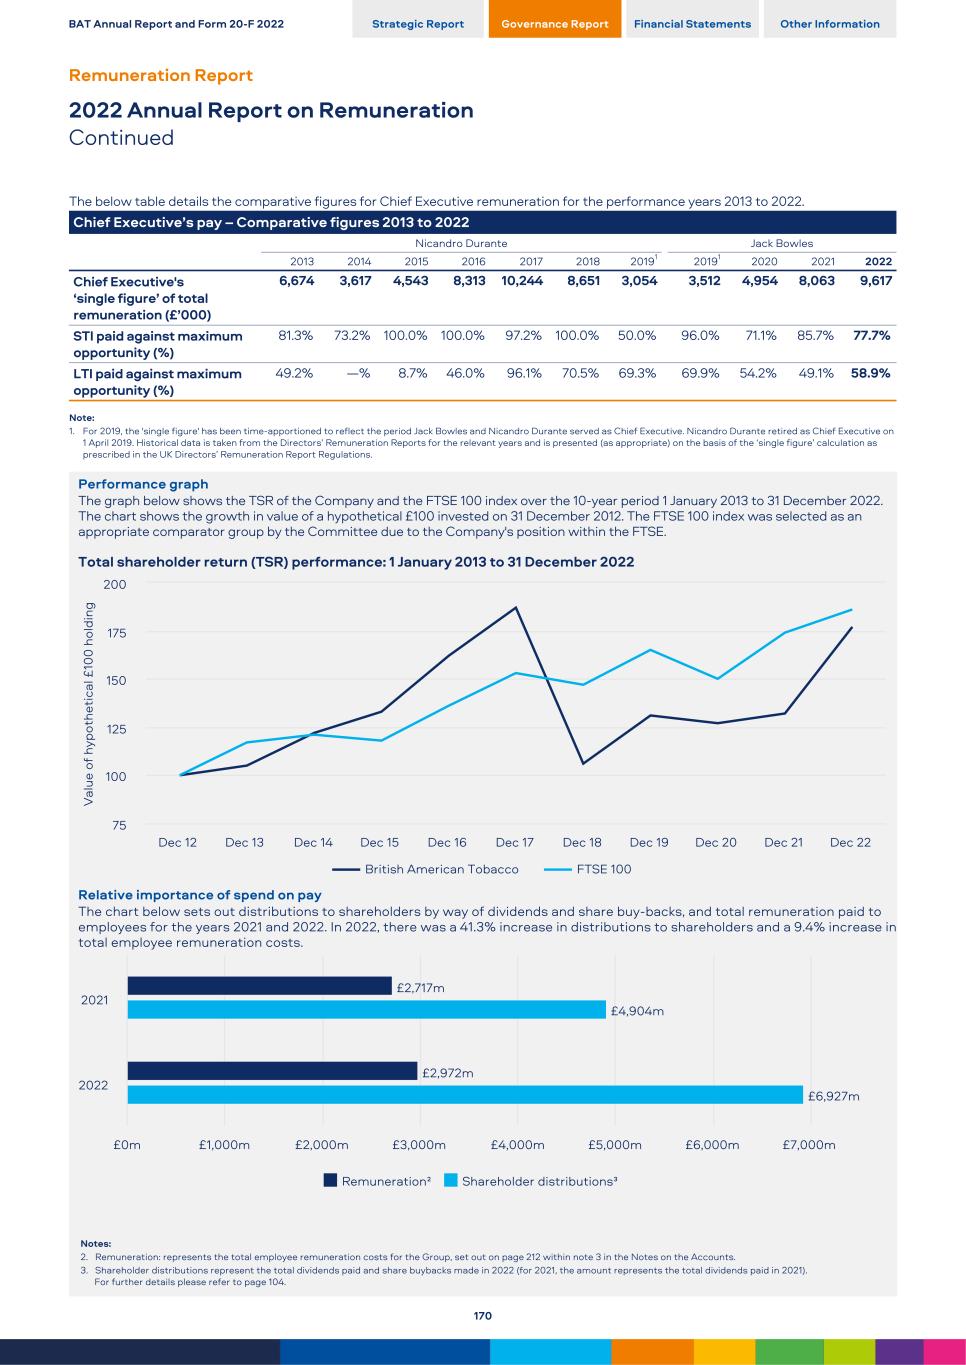
The below table details the comparative figures for Chief Executive remuneration for the performance years 2013 to 2022. Chief Executive’s pay – Comparative figures 2013 to 2022 Nicandro Durante Jack Bowles 2013 2014 2015 2016 2017 2018 20191 20191 2020 2021 2022 Chief Executive's ‘single figure’ of total remuneration (£’000) 6,674 3,617 4,543 8,313 10,244 8,651 3,054 3,512 4,954 8,063 9,617 STI paid against maximum opportunity (%) 81.3% 73.2% 100.0% 100.0% 97.2% 100.0% 50.0% 96.0% 71.1% 85.7% 77.7% LTI paid against maximum opportunity (%) 49.2% —% 8.7% 46.0% 96.1% 70.5% 69.3% 69.9% 54.2% 49.1% 58.9% Note: 1. For 2019, the 'single figure' has been time-apportioned to reflect the period Jack Bowles and Nicandro Durante served as Chief Executive. Nicandro Durante retired as Chief Executive on 1 April 2019. Historical data is taken from the Directors’ Remuneration Reports for the relevant years and is presented (as appropriate) on the basis of the ‘single figure’ calculation as prescribed in the UK Directors’ Remuneration Report Regulations. Performance graph The graph below shows the TSR of the Company and the FTSE 100 index over the 10-year period 1 January 2013 to 31 December 2022. The chart shows the growth in value of a hypothetical £100 invested on 31 December 2012. The FTSE 100 index was selected as an appropriate comparator group by the Committee due to the Company's position within the FTSE. Total shareholder return (TSR) performance: 1 January 2013 to 31 December 2022 V al ue o f h yp ot he ti ca l £ 10 0 h ol di ng British American Tobacco FTSE 100 Dec 12 Dec 13 Dec 14 Dec 15 Dec 16 Dec 17 Dec 18 Dec 19 Dec 20 Dec 21 Dec 22 75 100 125 150 175 200 Relative importance of spend on pay The chart below sets out distributions to shareholders by way of dividends and share buy-backs, and total remuneration paid to employees for the years 2021 and 2022. In 2022, there was a 41.3% increase in distributions to shareholders and a 9.4% increase in total employee remuneration costs. £2,717m £2,972m £4,904m £6,927m Remuneration² Shareholder distributions³ 2021 2022 £0m £1,000m £2,000m £3,000m £4,000m £5,000m £6,000m £7,000m Notes: 2. Remuneration: represents the total employee remuneration costs for the Group, set out on page 212 within note 3 in the Notes on the Accounts. 3. Shareholder distributions represent the total dividends paid and share buybacks made in 2022 (for 2021, the amount represents the total dividends paid in 2021). For further details please refer to page 104. BAT Annual Report and Form 20-F 2022 Strategic Report Governance Report Financial Statements Other Information Remuneration Report 2022 Annual Report on Remuneration Continued 170
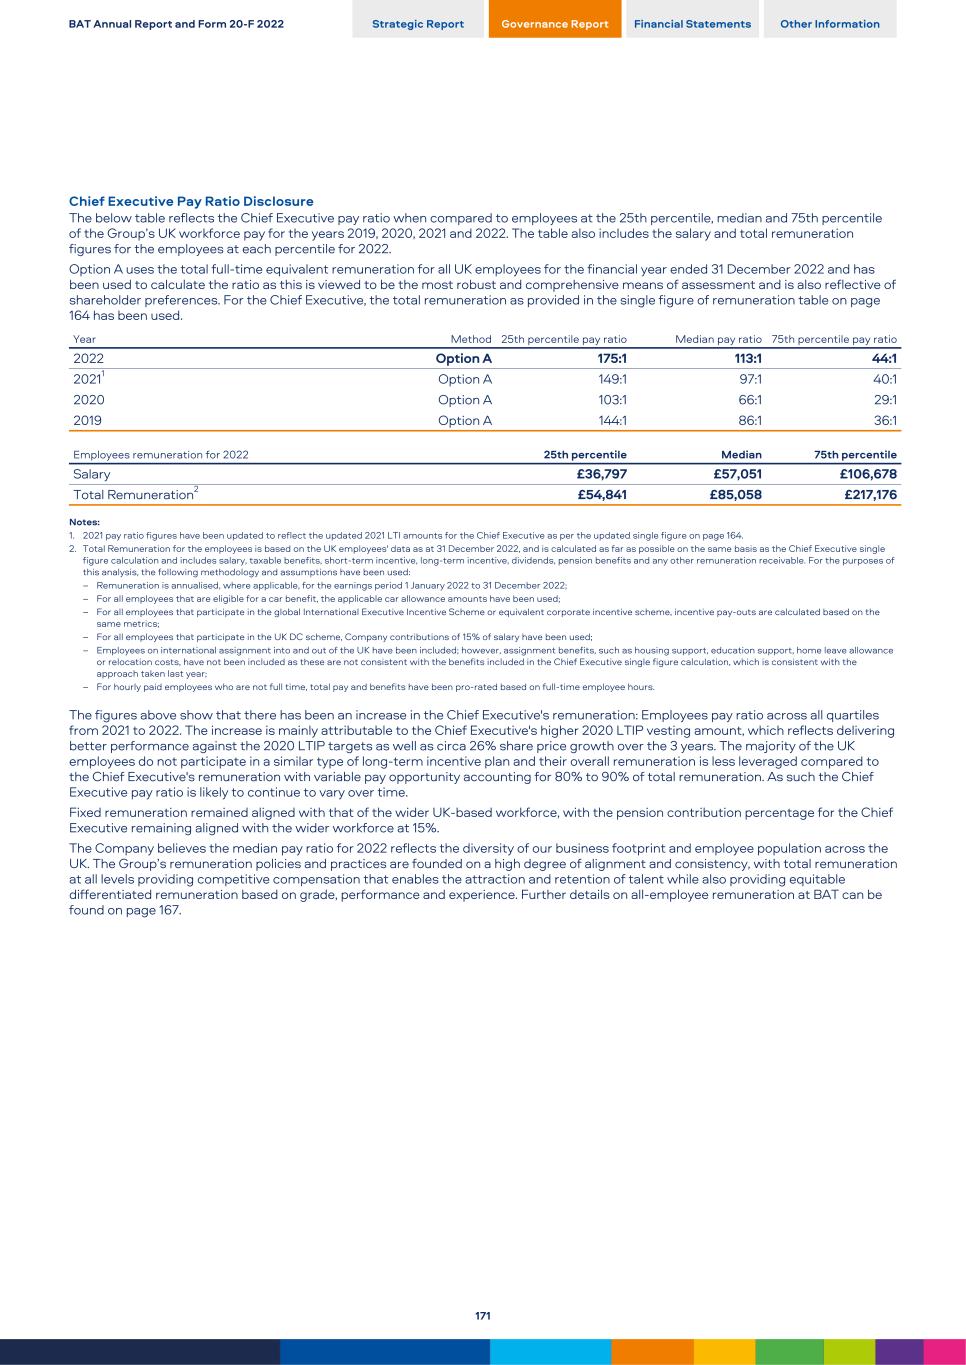
Chief Executive Pay Ratio Disclosure The below table reflects the Chief Executive pay ratio when compared to employees at the 25th percentile, median and 75th percentile of the Group’s UK workforce pay for the years 2019, 2020, 2021 and 2022. The table also includes the salary and total remuneration figures for the employees at each percentile for 2022. Option A uses the total full-time equivalent remuneration for all UK employees for the financial year ended 31 December 2022 and has been used to calculate the ratio as this is viewed to be the most robust and comprehensive means of assessment and is also reflective of shareholder preferences. For the Chief Executive, the total remuneration as provided in the single figure of remuneration table on page 164 has been used. Year Method 25th percentile pay ratio Median pay ratio 75th percentile pay ratio 2022 Option A 175:1 113:1 44:1 20211 Option A 149:1 97:1 40:1 2020 Option A 103:1 66:1 29:1 2019 Option A 144:1 86:1 36:1 Employees remuneration for 2022 25th percentile Median 75th percentile Salary £36,797 £57,051 £106,678 Total Remuneration2 £54,841 £85,058 £217,176 Notes: 1. 2021 pay ratio figures have been updated to reflect the updated 2021 LTI amounts for the Chief Executive as per the updated single figure on page 164. 2. Total Remuneration for the employees is based on the UK employees' data as at 31 December 2022, and is calculated as far as possible on the same basis as the Chief Executive single figure calculation and includes salary, taxable benefits, short-term incentive, long-term incentive, dividends, pension benefits and any other remuneration receivable. For the purposes of this analysis, the following methodology and assumptions have been used: – Remuneration is annualised, where applicable, for the earnings period 1 January 2022 to 31 December 2022; – For all employees that are eligible for a car benefit, the applicable car allowance amounts have been used; – For all employees that participate in the global International Executive Incentive Scheme or equivalent corporate incentive scheme, incentive pay-outs are calculated based on the same metrics; – For all employees that participate in the UK DC scheme, Company contributions of 15% of salary have been used; – Employees on international assignment into and out of the UK have been included; however, assignment benefits, such as housing support, education support, home leave allowance or relocation costs, have not been included as these are not consistent with the benefits included in the Chief Executive single figure calculation, which is consistent with the approach taken last year; – For hourly paid employees who are not full time, total pay and benefits have been pro-rated based on full-time employee hours. The figures above show that there has been an increase in the Chief Executive's remuneration: Employees pay ratio across all quartiles from 2021 to 2022. The increase is mainly attributable to the Chief Executive's higher 2020 LTIP vesting amount, which reflects delivering better performance against the 2020 LTIP targets as well as circa 26% share price growth over the 3 years. The majority of the UK employees do not participate in a similar type of long-term incentive plan and their overall remuneration is less leveraged compared to the Chief Executive's remuneration with variable pay opportunity accounting for 80% to 90% of total remuneration. As such the Chief Executive pay ratio is likely to continue to vary over time. Fixed remuneration remained aligned with that of the wider UK-based workforce, with the pension contribution percentage for the Chief Executive remaining aligned with the wider workforce at 15%. The Company believes the median pay ratio for 2022 reflects the diversity of our business footprint and employee population across the UK. The Group’s remuneration policies and practices are founded on a high degree of alignment and consistency, with total remuneration at all levels providing competitive compensation that enables the attraction and retention of talent while also providing equitable differentiated remuneration based on grade, performance and experience. Further details on all-employee remuneration at BAT can be found on page 167. BAT Annual Report and Form 20-F 2022 Strategic Report Governance Report Financial Statements Other Information 171
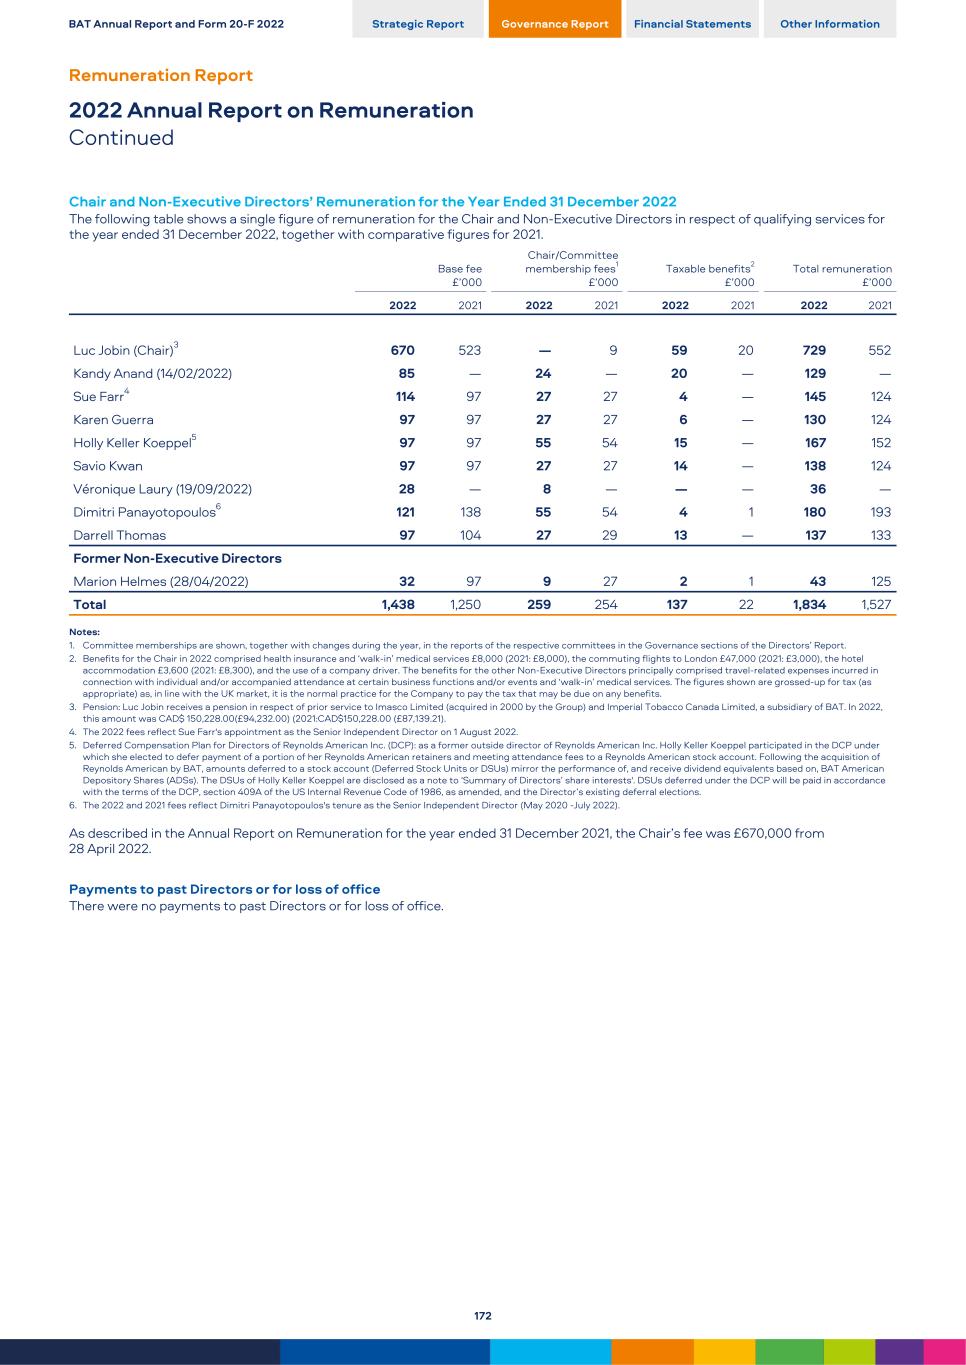
Chair and Non-Executive Directors’ Remuneration for the Year Ended 31 December 2022 The following table shows a single figure of remuneration for the Chair and Non-Executive Directors in respect of qualifying services for the year ended 31 December 2022, together with comparative figures for 2021. Base fee £’000 Chair/Committee membership fees1 £’000 Taxable benefits2 £’000 Total remuneration £’000 2022 2021 2022 2021 2022 2021 2022 2021 Luc Jobin (Chair)3 670 523 — 9 59 20 729 552 Kandy Anand (14/02/2022) 85 — 24 — 20 — 129 — Sue Farr4 114 97 27 27 4 — 145 124 Karen Guerra 97 97 27 27 6 — 130 124 Holly Keller Koeppel5 97 97 55 54 15 — 167 152 Savio Kwan 97 97 27 27 14 — 138 124 Véronique Laury (19/09/2022) 28 — 8 — — — 36 — Dimitri Panayotopoulos6 121 138 55 54 4 1 180 193 Darrell Thomas 97 104 27 29 13 — 137 133 Former Non-Executive Directors Marion Helmes (28/04/2022) 32 97 9 27 2 1 43 125 Total 1,438 1,250 259 254 137 22 1,834 1,527 Notes: 1. Committee memberships are shown, together with changes during the year, in the reports of the respective committees in the Governance sections of the Directors’ Report. 2. Benefits for the Chair in 2022 comprised health insurance and ‘walk-in’ medical services £8,000 (2021: £8,000), the commuting flights to London £47,000 (2021: £3,000), the hotel accommodation £3,600 (2021: £8,300), and the use of a company driver. The benefits for the other Non-Executive Directors principally comprised travel-related expenses incurred in connection with individual and/or accompanied attendance at certain business functions and/or events and ‘walk-in’ medical services. The figures shown are grossed-up for tax (as appropriate) as, in line with the UK market, it is the normal practice for the Company to pay the tax that may be due on any benefits. 3. Pension: Luc Jobin receives a pension in respect of prior service to Imasco Limited (acquired in 2000 by the Group) and Imperial Tobacco Canada Limited, a subsidiary of BAT. In 2022, this amount was CAD$ 150,228.00(£94,232.00) (2021:CAD$150,228.00 (£87,139.21). 4. The 2022 fees reflect Sue Farr's appointment as the Senior Independent Director on 1 August 2022. 5. Deferred Compensation Plan for Directors of Reynolds American Inc. (DCP): as a former outside director of Reynolds American Inc. Holly Keller Koeppel participated in the DCP under which she elected to defer payment of a portion of her Reynolds American retainers and meeting attendance fees to a Reynolds American stock account. Following the acquisition of Reynolds American by BAT, amounts deferred to a stock account (Deferred Stock Units or DSUs) mirror the performance of, and receive dividend equivalents based on, BAT American Depository Shares (ADSs). The DSUs of Holly Keller Koeppel are disclosed as a note to ‘Summary of Directors’ share interests'. DSUs deferred under the DCP will be paid in accordance with the terms of the DCP, section 409A of the US Internal Revenue Code of 1986, as amended, and the Director’s existing deferral elections. 6. The 2022 and 2021 fees reflect Dimitri Panayotopoulos's tenure as the Senior Independent Director (May 2020 -July 2022). As described in the Annual Report on Remuneration for the year ended 31 December 2021, the Chair’s fee was £670,000 from 28 April 2022. Payments to past Directors or for loss of office There were no payments to past Directors or for loss of office. BAT Annual Report and Form 20-F 2022 Strategic Report Governance Report Financial Statements Other Information Remuneration Report 2022 Annual Report on Remuneration Continued 172
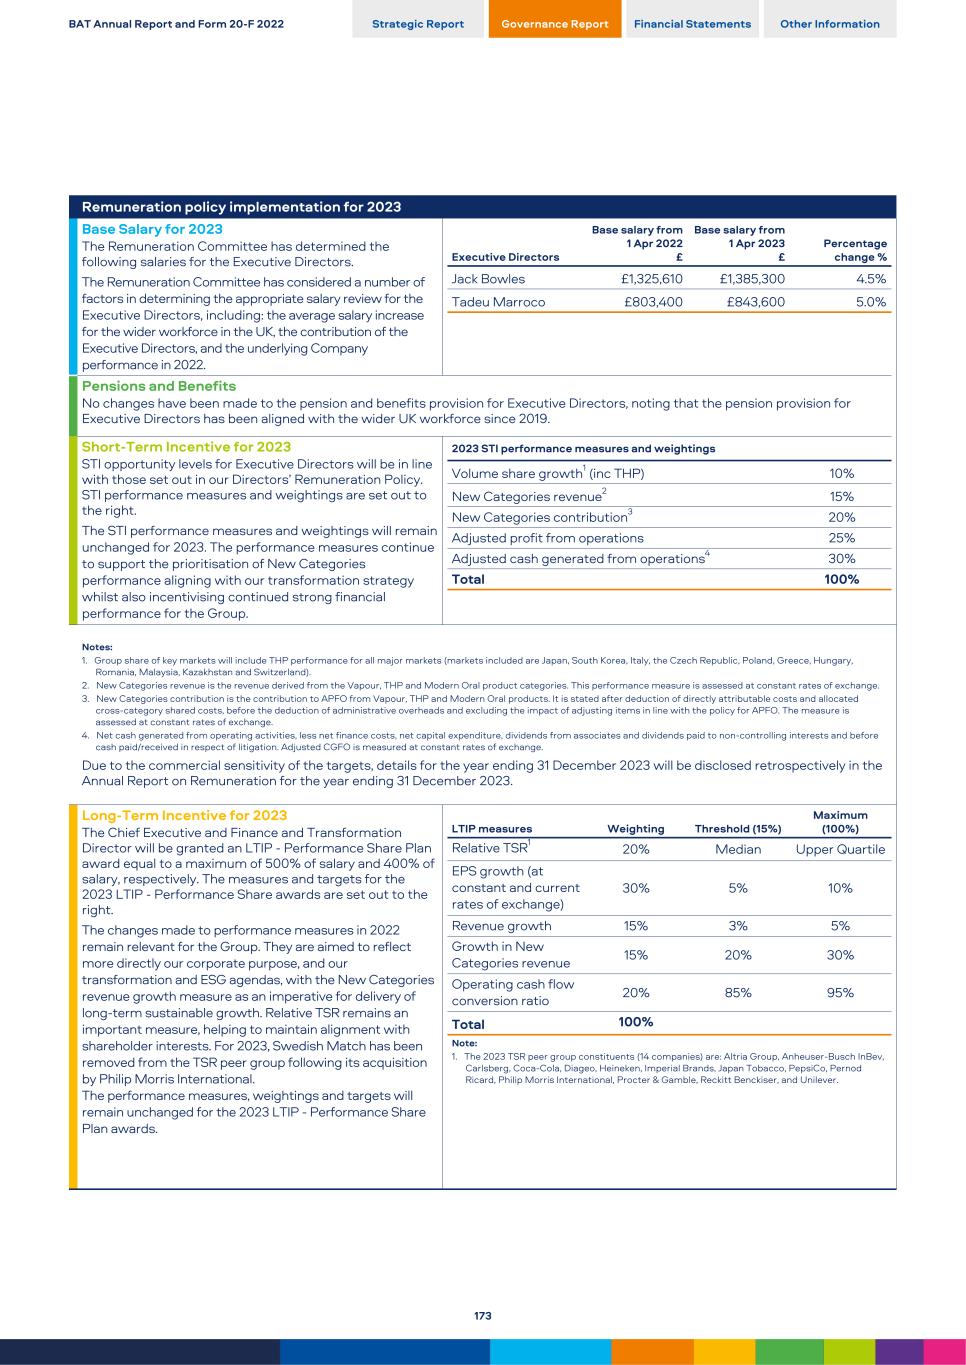
Remuneration policy implementation for 2023 Base Salary for 2023 The Remuneration Committee has determined the following salaries for the Executive Directors. The Remuneration Committee has considered a number of factors in determining the appropriate salary review for the Executive Directors, including: the average salary increase for the wider workforce in the UK, the contribution of the Executive Directors, and the underlying Company performance in 2022. Executive Directors Base salary from 1 Apr 2022 £ Base salary from 1 Apr 2023 £ Percentage change % Jack Bowles £1,325,610 £1,385,300 4.5% Tadeu Marroco £803,400 £843,600 5.0% Pensions and Benefits No changes have been made to the pension and benefits provision for Executive Directors, noting that the pension provision for Executive Directors has been aligned with the wider UK workforce since 2019. Short-Term Incentive for 2023 STI opportunity levels for Executive Directors will be in line with those set out in our Directors’ Remuneration Policy. STI performance measures and weightings are set out to the right. The STI performance measures and weightings will remain unchanged for 2023. The performance measures continue to support the prioritisation of New Categories performance aligning with our transformation strategy whilst also incentivising continued strong financial performance for the Group. 2023 STI performance measures and weightings Volume share growth1 (inc THP) 10% New Categories revenue2 15% New Categories contribution3 20% Adjusted profit from operations 25% Adjusted cash generated from operations4 30% Total 100% Notes: 1. Group share of key markets will include THP performance for all major markets (markets included are Japan, South Korea, Italy, the Czech Republic, Poland, Greece, Hungary, Romania, Malaysia, Kazakhstan and Switzerland). 2. New Categories revenue is the revenue derived from the Vapour, THP and Modern Oral product categories. This performance measure is assessed at constant rates of exchange. 3. New Categories contribution is the contribution to APFO from Vapour, THP and Modern Oral products. It is stated after deduction of directly attributable costs and allocated cross-category shared costs, before the deduction of administrative overheads and excluding the impact of adjusting items in line with the policy for APFO. The measure is assessed at constant rates of exchange. 4. Net cash generated from operating activities, less net finance costs, net capital expenditure, dividends from associates and dividends paid to non-controlling interests and before cash paid/received in respect of litigation. Adjusted CGFO is measured at constant rates of exchange. Due to the commercial sensitivity of the targets, details for the year ending 31 December 2023 will be disclosed retrospectively in the Annual Report on Remuneration for the year ending 31 December 2023. Long-Term Incentive for 2023 The Chief Executive and Finance and Transformation Director will be granted an LTIP - Performance Share Plan award equal to a maximum of 500% of salary and 400% of salary, respectively. The measures and targets for the 2023 LTIP - Performance Share awards are set out to the right. The changes made to performance measures in 2022 remain relevant for the Group. They are aimed to reflect more directly our corporate purpose, and our transformation and ESG agendas, with the New Categories revenue growth measure as an imperative for delivery of long-term sustainable growth. Relative TSR remains an important measure, helping to maintain alignment with shareholder interests. For 2023, Swedish Match has been removed from the TSR peer group following its acquisition by Philip Morris International. The performance measures, weightings and targets will remain unchanged for the 2023 LTIP - Performance Share Plan awards. LTIP measures Weighting Threshold (15%) Maximum (100%) Relative TSR1 20% Median Upper Quartile EPS growth (at constant and current rates of exchange) 30% 5% 10% Revenue growth 15% 3% 5% Growth in New Categories revenue 15% 20% 30% Operating cash flow conversion ratio 20% 85% 95% Total 100% Note: 1. The 2023 TSR peer group constituents (14 companies) are: Altria Group, Anheuser-Busch InBev, Carlsberg, Coca-Cola, Diageo, Heineken, Imperial Brands, Japan Tobacco, PepsiCo, Pernod Ricard, Philip Morris International, Procter & Gamble, Reckitt Benckiser, and Unilever. BAT Annual Report and Form 20-F 2022 Strategic Report Governance Report Financial Statements Other Information 173
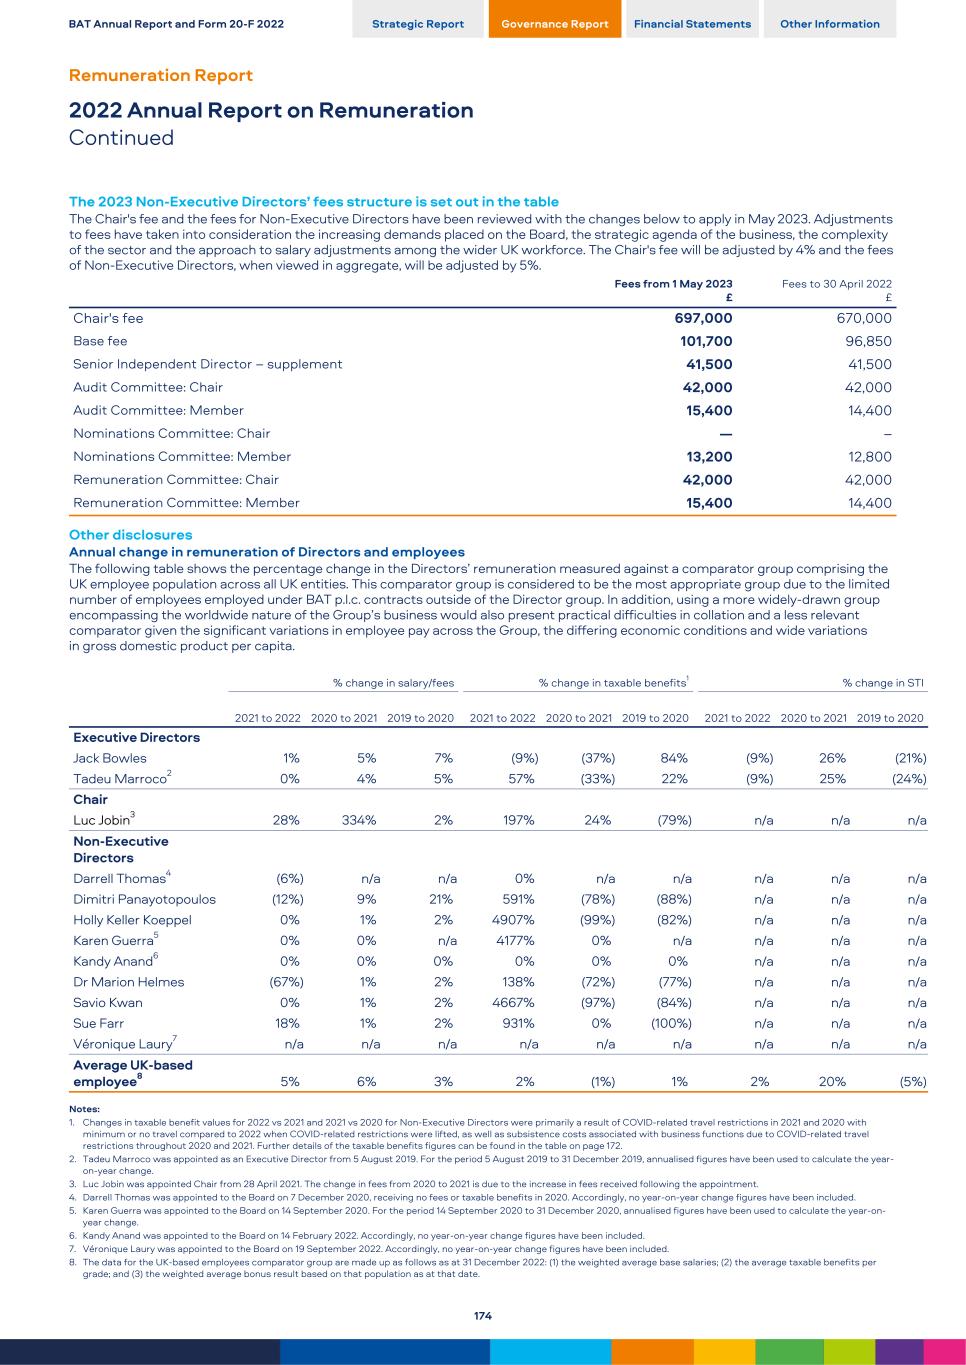
The 2023 Non-Executive Directors’ fees structure is set out in the table The Chair's fee and the fees for Non-Executive Directors have been reviewed with the changes below to apply in May 2023. Adjustments to fees have taken into consideration the increasing demands placed on the Board, the strategic agenda of the business, the complexity of the sector and the approach to salary adjustments among the wider UK workforce. The Chair's fee will be adjusted by 4% and the fees of Non-Executive Directors, when viewed in aggregate, will be adjusted by 5%. Fees from 1 May 2023 £ Fees to 30 April 2022 £ Chair's fee 697,000 670,000 Base fee 101,700 96,850 Senior Independent Director – supplement 41,500 41,500 Audit Committee: Chair 42,000 42,000 Audit Committee: Member 15,400 14,400 Nominations Committee: Chair — – Nominations Committee: Member 13,200 12,800 Remuneration Committee: Chair 42,000 42,000 Remuneration Committee: Member 15,400 14,400 Other disclosures Annual change in remuneration of Directors and employees The following table shows the percentage change in the Directors’ remuneration measured against a comparator group comprising the UK employee population across all UK entities. This comparator group is considered to be the most appropriate group due to the limited number of employees employed under BAT p.l.c. contracts outside of the Director group. In addition, using a more widely-drawn group encompassing the worldwide nature of the Group’s business would also present practical difficulties in collation and a less relevant comparator given the significant variations in employee pay across the Group, the differing economic conditions and wide variations in gross domestic product per capita. % change in salary/fees % change in taxable benefits1 % change in STI 2021 to 2022 2020 to 2021 2019 to 2020 2021 to 2022 2020 to 2021 2019 to 2020 2021 to 2022 2020 to 2021 2019 to 2020 Executive Directors Jack Bowles 1% 5% 7% (9%) (37%) 84% (9%) 26% (21%) Tadeu Marroco2 0% 4% 5% 57% (33%) 22% (9%) 25% (24%) Chair Luc Jobin3 28% 334% 2% 197% 24% (79%) n/a n/a n/a Non-Executive Directors Darrell Thomas4 (6%) n/a n/a 0% n/a n/a n/a n/a n/a Dimitri Panayotopoulos (12%) 9% 21% 591% (78%) (88%) n/a n/a n/a Holly Keller Koeppel 0% 1% 2% 4907% (99%) (82%) n/a n/a n/a Karen Guerra5 0% 0% n/a 4177% 0% n/a n/a n/a n/a Kandy Anand6 0% 0% 0% 0% 0% 0% n/a n/a n/a Dr Marion Helmes (67%) 1% 2% 138% (72%) (77%) n/a n/a n/a Savio Kwan 0% 1% 2% 4667% (97%) (84%) n/a n/a n/a Sue Farr 18% 1% 2% 931% 0% (100%) n/a n/a n/a Véronique Laury7 n/a n/a n/a n/a n/a n/a n/a n/a n/a Average UK-based employee8 5% 6% 3% 2% (1%) 1% 2% 20% (5%) Notes: 1. Changes in taxable benefit values for 2022 vs 2021 and 2021 vs 2020 for Non-Executive Directors were primarily a result of COVID-related travel restrictions in 2021 and 2020 with minimum or no travel compared to 2022 when COVID-related restrictions were lifted, as well as subsistence costs associated with business functions due to COVID-related travel restrictions throughout 2020 and 2021. Further details of the taxable benefits figures can be found in the table on page 172. 2. Tadeu Marroco was appointed as an Executive Director from 5 August 2019. For the period 5 August 2019 to 31 December 2019, annualised figures have been used to calculate the year- on-year change. 3. Luc Jobin was appointed Chair from 28 April 2021. The change in fees from 2020 to 2021 is due to the increase in fees received following the appointment. 4. Darrell Thomas was appointed to the Board on 7 December 2020, receiving no fees or taxable benefits in 2020. Accordingly, no year-on-year change figures have been included. 5. Karen Guerra was appointed to the Board on 14 September 2020. For the period 14 September 2020 to 31 December 2020, annualised figures have been used to calculate the year-on- year change. 6. Kandy Anand was appointed to the Board on 14 February 2022. Accordingly, no year-on-year change figures have been included. 7. Véronique Laury was appointed to the Board on 19 September 2022. Accordingly, no year-on-year change figures have been included. 8. The data for the UK-based employees comparator group are made up as follows as at 31 December 2022: (1) the weighted average base salaries; (2) the average taxable benefits per grade; and (3) the weighted average bonus result based on that population as at that date. BAT Annual Report and Form 20-F 2022 Strategic Report Governance Report Financial Statements Other Information Remuneration Report 2022 Annual Report on Remuneration Continued 174
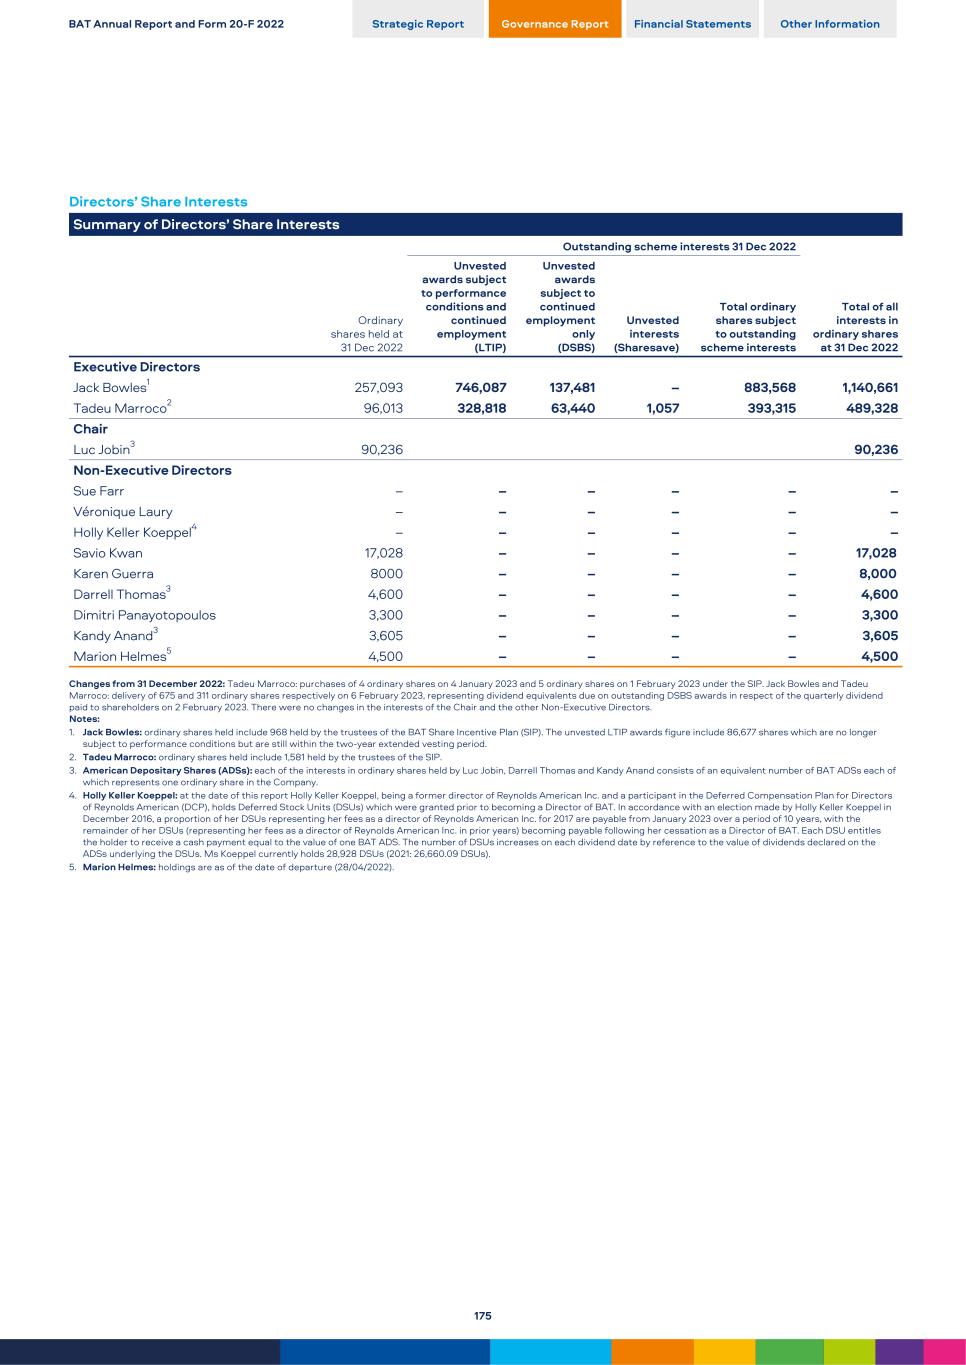
Directors’ Share Interests Summary of Directors’ Share Interests Ordinary shares held at 31 Dec 2022 Outstanding scheme interests 31 Dec 2022 Total of all interests in ordinary shares at 31 Dec 2022 Unvested awards subject to performance conditions and continued employment (LTIP) Unvested awards subject to continued employment only (DSBS) Unvested interests (Sharesave) Total ordinary shares subject to outstanding scheme interests Executive Directors Jack Bowles1 257,093 746,087 137,481 – 883,568 1,140,661 Tadeu Marroco2 96,013 328,818 63,440 1,057 393,315 489,328 Chair Luc Jobin3 90,236 90,236 Non-Executive Directors Sue Farr – – – – – – Véronique Laury – – – – – – Holly Keller Koeppel4 – – – – – – Savio Kwan 17,028 – – – – 17,028 Karen Guerra 8000 – – – – 8,000 Darrell Thomas3 4,600 – – – – 4,600 Dimitri Panayotopoulos 3,300 – – – – 3,300 Kandy Anand3 3,605 – – – – 3,605 Marion Helmes5 4,500 – – – – 4,500 Changes from 31 December 2022: Tadeu Marroco: purchases of 4 ordinary shares on 4 January 2023 and 5 ordinary shares on 1 February 2023 under the SIP. Jack Bowles and Tadeu Marroco: delivery of 675 and 311 ordinary shares respectively on 6 February 2023, representing dividend equivalents due on outstanding DSBS awards in respect of the quarterly dividend paid to shareholders on 2 February 2023. There were no changes in the interests of the Chair and the other Non-Executive Directors. Notes: 1. Jack Bowles: ordinary shares held include 968 held by the trustees of the BAT Share Incentive Plan (SIP). The unvested LTIP awards figure include 86,677 shares which are no longer subject to performance conditions but are still within the two-year extended vesting period. 2. Tadeu Marroco: ordinary shares held include 1,581 held by the trustees of the SIP. 3. American Depositary Shares (ADSs): each of the interests in ordinary shares held by Luc Jobin, Darrell Thomas and Kandy Anand consists of an equivalent number of BAT ADSs each of which represents one ordinary share in the Company. 4. Holly Keller Koeppel: at the date of this report Holly Keller Koeppel, being a former director of Reynolds American Inc. and a participant in the Deferred Compensation Plan for Directors of Reynolds American (DCP), holds Deferred Stock Units (DSUs) which were granted prior to becoming a Director of BAT. In accordance with an election made by Holly Keller Koeppel in December 2016, a proportion of her DSUs representing her fees as a director of Reynolds American Inc. for 2017 are payable from January 2023 over a period of 10 years, with the remainder of her DSUs (representing her fees as a director of Reynolds American Inc. in prior years) becoming payable following her cessation as a Director of BAT. Each DSU entitles the holder to receive a cash payment equal to the value of one BAT ADS. The number of DSUs increases on each dividend date by reference to the value of dividends declared on the ADSs underlying the DSUs. Ms Koeppel currently holds 28,928 DSUs (2021: 26,660.09 DSUs). 5. Marion Helmes: holdings are as of the date of departure (28/04/2022). BAT Annual Report and Form 20-F 2022 Strategic Report Governance Report Financial Statements Other Information 175
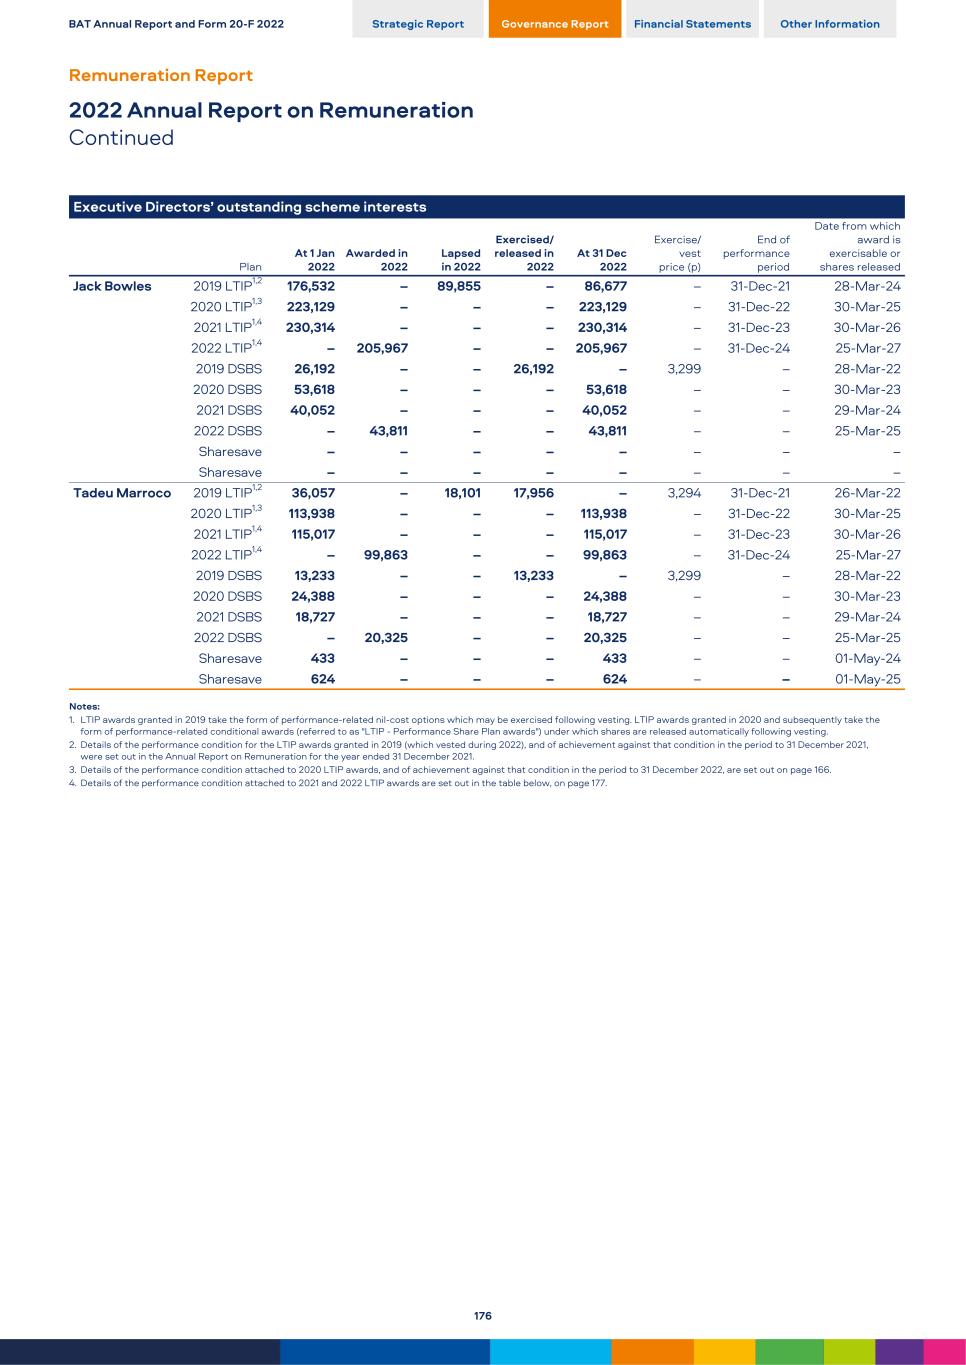
Executive Directors’ outstanding scheme interests Plan At 1 Jan 2022 Awarded in 2022 Lapsed in 2022 Exercised/ released in 2022 At 31 Dec 2022 Exercise/ vest price (p) End of performance period Date from which award is exercisable or shares released Jack Bowles 2019 LTIP1,2 176,532 – 89,855 – 86,677 – 31-Dec-21 28-Mar-24 2020 LTIP1,3 223,129 – – – 223,129 – 31-Dec-22 30-Mar-25 2021 LTIP1,4 230,314 – – – 230,314 – 31-Dec-23 30-Mar-26 2022 LTIP1,4 – 205,967 – – 205,967 – 31-Dec-24 25-Mar-27 2019 DSBS 26,192 – – 26,192 – 3,299 – 28-Mar-22 2020 DSBS 53,618 – – – 53,618 – – 30-Mar-23 2021 DSBS 40,052 – – – 40,052 – – 29-Mar-24 2022 DSBS – 43,811 – – 43,811 – – 25-Mar-25 Sharesave – – – – – – – – Sharesave – – – – – – – – Tadeu Marroco 2019 LTIP1,2 36,057 – 18,101 17,956 – 3,294 31-Dec-21 26-Mar-22 2020 LTIP1,3 113,938 – – – 113,938 – 31-Dec-22 30-Mar-25 2021 LTIP1,4 115,017 – – – 115,017 – 31-Dec-23 30-Mar-26 2022 LTIP1,4 – 99,863 – – 99,863 – 31-Dec-24 25-Mar-27 2019 DSBS 13,233 – – 13,233 – 3,299 – 28-Mar-22 2020 DSBS 24,388 – – – 24,388 – – 30-Mar-23 2021 DSBS 18,727 – – – 18,727 – – 29-Mar-24 2022 DSBS – 20,325 – – 20,325 – – 25-Mar-25 Sharesave 433 – – – 433 – – 01-May-24 Sharesave 624 – – – 624 – – 01-May-25 Notes: 1. LTIP awards granted in 2019 take the form of performance-related nil-cost options which may be exercised following vesting. LTIP awards granted in 2020 and subsequently take the form of performance-related conditional awards (referred to as "LTIP - Performance Share Plan awards") under which shares are released automatically following vesting. 2. Details of the performance condition for the LTIP awards granted in 2019 (which vested during 2022), and of achievement against that condition in the period to 31 December 2021, were set out in the Annual Report on Remuneration for the year ended 31 December 2021. 3. Details of the performance condition attached to 2020 LTIP awards, and of achievement against that condition in the period to 31 December 2022, are set out on page 166. 4. Details of the performance condition attached to 2021 and 2022 LTIP awards are set out in the table below, on page 177. BAT Annual Report and Form 20-F 2022 Strategic Report Governance Report Financial Statements Other Information Remuneration Report 2022 Annual Report on Remuneration Continued 176
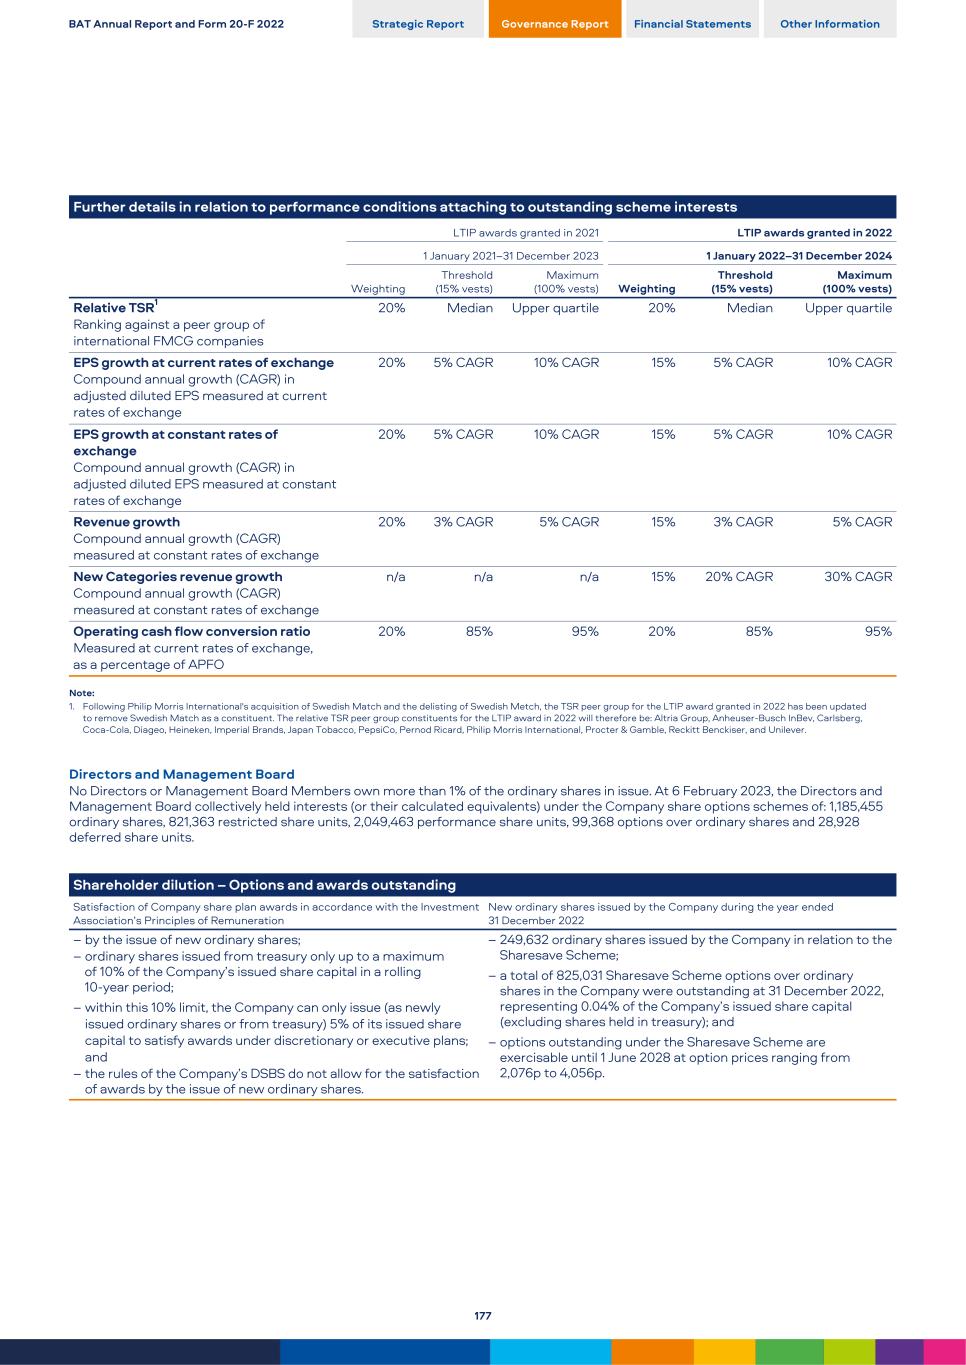
Further details in relation to performance conditions attaching to outstanding scheme interests LTIP awards granted in 2021 LTIP awards granted in 2022 1 January 2021–31 December 2023 1 January 2022–31 December 2024 Weighting Threshold (15% vests) Maximum (100% vests) Weighting Threshold (15% vests) Maximum (100% vests) Relative TSR1 Ranking against a peer group of international FMCG companies 20% Median Upper quartile 20% Median Upper quartile EPS growth at current rates of exchange Compound annual growth (CAGR) in adjusted diluted EPS measured at current rates of exchange 20% 5% CAGR 10% CAGR 15% 5% CAGR 10% CAGR EPS growth at constant rates of exchange Compound annual growth (CAGR) in adjusted diluted EPS measured at constant rates of exchange 20% 5% CAGR 10% CAGR 15% 5% CAGR 10% CAGR Revenue growth Compound annual growth (CAGR) measured at constant rates of exchange 20% 3% CAGR 5% CAGR 15% 3% CAGR 5% CAGR New Categories revenue growth Compound annual growth (CAGR) measured at constant rates of exchange n/a n/a n/a 15% 20% CAGR 30% CAGR Operating cash flow conversion ratio Measured at current rates of exchange, as a percentage of APFO 20% 85% 95% 20% 85% 95% Note: 1. Following Philip Morris International's acquisition of Swedish Match and the delisting of Swedish Metch, the TSR peer group for the LTIP award granted in 2022 has been updated to remove Swedish Match as a constituent. The relative TSR peer group constituents for the LTIP award in 2022 will therefore be: Altria Group, Anheuser-Busch InBev, Carlsberg, Coca-Cola, Diageo, Heineken, Imperial Brands, Japan Tobacco, PepsiCo, Pernod Ricard, Philip Morris International, Procter & Gamble, Reckitt Benckiser, and Unilever. Directors and Management Board No Directors or Management Board Members own more than 1% of the ordinary shares in issue. At 6 February 2023, the Directors and Management Board collectively held interests (or their calculated equivalents) under the Company share options schemes of: 1,185,455 ordinary shares, 821,363 restricted share units, 2,049,463 performance share units, 99,368 options over ordinary shares and 28,928 deferred share units. Shareholder dilution – Options and awards outstanding Satisfaction of Company share plan awards in accordance with the Investment Association’s Principles of Remuneration New ordinary shares issued by the Company during the year ended 31 December 2022 – by the issue of new ordinary shares; – ordinary shares issued from treasury only up to a maximum of 10% of the Company’s issued share capital in a rolling 10-year period; – within this 10% limit, the Company can only issue (as newly issued ordinary shares or from treasury) 5% of its issued share capital to satisfy awards under discretionary or executive plans; and – the rules of the Company’s DSBS do not allow for the satisfaction of awards by the issue of new ordinary shares. – 249,632 ordinary shares issued by the Company in relation to the Sharesave Scheme; – a total of 825,031 Sharesave Scheme options over ordinary shares in the Company were outstanding at 31 December 2022, representing 0.04% of the Company’s issued share capital (excluding shares held in treasury); and – options outstanding under the Sharesave Scheme are exercisable until 1 June 2028 at option prices ranging from 2,076p to 4,056p. BAT Annual Report and Form 20-F 2022 Strategic Report Governance Report Financial Statements Other Information 177
The Remuneration Committee Governance Remuneration Committee current members Dimitri Panayotopoulos (Chair) Kandy Anand Sue Farr Savio Kwan Role As set out in the Terms of Reference, the Remuneration Committee is responsible for: – determining and proposing the Directors’ Remuneration Policy (covering salary, benefits, performance-based variable rewards and retirement benefits) for shareholder approval; – determining, within the terms of the approved Directors’ Remuneration Policy, the specific remuneration packages for the Chair and the Executive Directors, on appointment, on review and, if appropriate, any compensation payment due on termination of appointment; – the setting of targets applicable for the Company’s performance-based variable reward schemes and determining achievement against those targets, exercising discretion where appropriate and as provided by the applicable scheme rules and the Directors’ Remuneration Policy; – reviewing Group workforce remuneration and related policies, and the alignment of incentives and rewards with Group culture, taking these into account when setting the policy for Executive Director remuneration. Providing feedback to the Board on workforce reward, incentives and conditions applicable across the Group and supporting the Board’s monitoring of the Group’s culture and its alignment with the Group’s purpose, values and strategy; – setting remuneration for members of the Management Board and the Company Secretary; and – monitoring and advising the Board on any major changes to the policy on employee benefit structures for the Group. Attendance at meetings in 20221 Name Member since Meeting attendance Attended/Eligible to attend Dimitri Panayotopoulos 2015 6/6 Kandy Anand2(b) 2022 5/5 Sue Farr1(b) 2016 5/6 Savio Kwan2(c) 2016 6/6 Marion Helmes2(d) 2019 - 2022 2/2 Notes: 1. Number of meetings in 2022: (a) the Committee held six meetings in 2022, two of which were ad hoc: (b) Sue Farr did not attend the ad hoc meeting in February 2022 convened at short notice due to prior commitments. 2. Membership: (a) all members of the Committee are independent Non-Executive Directors in accordance with the UK Corporate Governance Code 2018 Provisions 10 and 32 and applicable NYSE listing standards; (b) Kandy Anand became a Committee member on 14 February 2022 upon his appointment to the Board; (c) Savio Kwan will step down from the Committee with effect from the conclusion of the AGM on 19 April 2023; and (d) Marion Helmes stepped down from the Committee with effect from the conclusion of the AGM on 28 April 2022. Other attendees: the Chair, the Chief Executive, the Director, Talent, Culture and Inclusion, the Group Head of Reward and other senior management, including the Company Secretary, may be consulted and provide advice, guidance and assistance to the Remuneration Committee. They may also attend Committee meetings (or parts thereof) by invitation. None of the Chair, any Executive Director or member of senior management plays any part in determining their own respective remuneration. Independence and advice PricewaterhouseCoopers LLP (PwC): Appointed in January 2020 as one of the Remuneration Committee’s remuneration consultants. PwC continued to provide independent advice to the Committee in 2022 and a representative of PwC attended Remuneration Committee meetings in 2022. PwC advice included, for example, support with market trends and comparator group analysis, updates on market practice, shareholder engagement perspectives and independent measurement of the relative TSR performance conditions. PwC is a member of the Remuneration Consulting Group and, as such, operates under the code of conduct in relation to executive remuneration consulting in the UK. The Committee is satisfied that the advice received is objective and independent. The Committee is comfortable that the PwC advisory team is not involved in any other services PwC group provides to the Company, such as tax, corporate finance and consulting services to Group companies worldwide excluding the US. Total fees for the provision of remuneration advice to the Committee in 2022 were £112,746. Meridian Compensation Partners (Meridian): Appointed in January 2020 as one of the Remuneration Committee’s remuneration consultants. Meridian is a U.S. based advisory firm, continued to provide advice to the Committee in 2022 and a representative of Meridian attended Remuneration Committee's meeting in 2022. Meridian advice included general advice on remuneration matters including market trends, shareholder engagement perspectives and comparator group analysis from the U.S. perspective. The Committee is satisfied that the advice received is objective and independent. Meridian did not provide any other services to the Company. Total fees for the provision of remuneration advice to the Committee in 2022 were $35,520. BAT Annual Report and Form 20-F 2022 Strategic Report Governance Report Financial Statements Other Information Remuneration Report 2022 Annual Report on Remuneration Continued 178
Regular work programme 2022 The Remuneration Committee: – reviewed the Chair's fee from 1 April 2022, with specific consideration of market positioning, external market environment and the level of salary increases awarded to UK employees; – reviewed salaries for the Executive Directors to take effect from 1 April 2022, taking into account market positioning, external market environment and the level of salary increases awarded to UK employees. A programme of shareholder engagement on executive remuneration was conducted, led by the Committee Chair, and the Committee considered feedback from shareholders (discussed on page 159); – reviewed salaries for members of the Management Board and the Company Secretary from 1 April 2022, taking into account market positioning, the external market environment and the level of salary increases awarded to UK employees; – assessed the achievement against the targets for the 2021 STI award and set the STI targets for 2022; – reviewed updates on performance against the 2022 STI target measures and for outstanding LTIP awards; – assessed the achievement against the performance conditions for the vesting of the 2019 LTIP award, determined the contingent level of LTIP awards for March 2022 and reviewed the associated performance conditions; – assessed the achievement against the targets for the 2021 Share Reward Scheme and set the targets for the 2022 award; – reviewed and assessed the target ranges across STI and LTI plans to ensure there is an appropriate level of stretch within the target range to drive performance in alignment with the Group's strategic objectives and shareholder interests; – reviewed the Annual Statement and the Annual Report on Remuneration for the year ended 31 December 2021 prior to its approval by the Board and subsequent proposal to shareholders at the Company’s AGM on 28 April 2022; – reviewed the 2022 AGM voting results relating to remuneration resolutions, market trends in the context of that annual general meeting season and corporate governance developments in the UK and the U.S.; – monitored the continued application of the Company’s shareholding guidelines for the Executive Directors and members of the Management Board; and – reviewed the Committee’s effectiveness following the Board and Committee evaluation process. Other activities in 2022 The Remuneration Committee: – determined the revised Directors' Remuneration Policy to be proposed to shareholders at the Company's 2022 AGM, discussed in detail in the Company’s Annual Report and Form 20-F for 2021 available on bat.com; – reviewed the terms of appointment and associated remuneration, and terms of termination of employment, in connection with Management Board changes during the year; – reviewed elements of the Group’s workforce remuneration strategy and their alignment with Executive Directors’ remuneration and with the Group’s culture, with specific focus on the incentive scheme architecture for management grade employees across the Group; – considered the broader range of benefits available to UK-based employees, initiatives implemented in the year to enhance those benefits including to support employee health and wellbeing, and feedback from employees on the initiatives implemented; – approved changes to the methodology for calculating the share of market read for the STI volume share metric in a limited number of markets, based on the local market environment and reporting capabilities; – reviewed the Pay Equality reporting suite, including UK gender pay reporting for 2021 for applicable UK Group companies, prior to publication in March 2022, as well as voluntary reporting on international gender pay and UK ethnicity pay reporting, and noted the Group's progress on fair pay certification; and – reviewed the Group's response to the economic environment in 2022, including additional interventions made by the Group to support employees in high inflationary environments. BAT Annual Report and Form 20-F 2022 Strategic Report Governance Report Financial Statements Other Information 179
Voting on Remuneration and Engagement with Shareholders At the AGM on 28 April 2022, shareholders considered and voted on the 2021 Directors’ Remuneration Report and the new Directors' Remuneration Policy as set out in the table below. Both resolutions were approved by shareholders at the AGM on 28 April 2022. A summary of this policy is provided on page 163. No other resolutions in respect of Directors’ remuneration or incentives were considered at the 2022 AGM. Further information regarding shareholder engagement in relation to remuneration matters is set out in the Annual Statement on Remuneration on page 159 and in the discussion of Board engagement with shareholders on pages 136 and 137. Approval of Directors' Remuneration Report1 and Policy2 Directors Remuneration Report 2022 AGM Directors Remuneration Policy 2022 AGM Percentage for 95.61 94.85 Votes for (including discretionary) 1,659,386,864 1,663,434,518 Percentage against 4.39 5.15 Votes against 76,194,044 90,313,970 Total votes cast excluding votes withheld 1,735,580,908 1,753,748,488 Votes withheld³ 20,978,332 2,811,496 Total votes cast including votes withheld 1,756,559,240 1,756,559,984 Notes: 1. Directors’ Remuneration Report: does not include the part of the Remuneration Report containing the Directors' Remuneration Policy (see note 2 below). 2. Directors’ Remuneration Policy: was approved by shareholders at the 2022 AGM held on 28 April 2022 and is set out in full in the 2021 Annual Report on Remuneration. 3. Votes withheld: these are not included in the final proxy figures as they are not recognised as a vote in law. The Directors’ Remuneration Report has been approved by the Board on 08 February 2023 and signed on its behalf by: Dimitri Panayotopoulos Chair, Remuneration Committee 08 February 2023 BAT Annual Report and Form 20-F 2022 Strategic Report Governance Report Financial Statements Other Information Remuneration Report 2022 Annual Report on Remuneration Continued 180

This page is intentionally left blank BAT Annual Report and Form 20-F 2022 Strategic Report Governance Report Financial Statements Other Information Governance Responsibility of Directors 181
This page is intentionally left blank BAT Annual Report and Form 20-F 2022 Strategic Report Governance Report Financial Statements Other Information Financial Statements 182
This page is intentionally left blank BAT Annual Report and Form 20-F 2022 Strategic Report Governance Report Financial Statements Other Information 183
This page is intentionally left blank BAT Annual Report and Form 20-F 2022 Strategic Report Governance Report Financial Statements Other Information Financial Statements 184
This page is intentionally left blank BAT Annual Report and Form 20-F 2022 Strategic Report Governance Report Financial Statements Other Information 185
This page is intentionally left blank BAT Annual Report and Form 20-F 2022 Strategic Report Governance Report Financial Statements Other Information Financial Statements 186
This page is intentionally left blank BAT Annual Report and Form 20-F 2022 Strategic Report Governance Report Financial Statements Other Information 187
This page is intentionally left blank BAT Annual Report and Form 20-F 2022 Strategic Report Governance Report Financial Statements Other Information Financial Statements 188
This page is intentionally left blank BAT Annual Report and Form 20-F 2022 Strategic Report Governance Report Financial Statements Other Information 189
This page is intentionally left blank BAT Annual Report and Form 20-F 2022 Strategic Report Governance Report Financial Statements Other Information Financial Statements 190
This page is intentionally left blank BAT Annual Report and Form 20-F 2022 Strategic Report Governance Report Financial Statements Other Information 191
This page is intentionally left blank BAT Annual Report and Form 20-F 2022 Strategic Report Governance Report Financial Statements Other Information Financial Statements 192
This page is intentionally left blank BAT Annual Report and Form 20-F 2022 Strategic Report Governance Report Financial Statements Other Information 193
| | | | | | | | | | | | | | | | | | | | | | | |
| BAT Annual Report and Form 20-F 2022 | Strategic Report | | Governance Report | | Financial Statements | | Other Information |
| | | | | | | |
| | | | | | | |
| | | | | | | |
| Financial Statements | | | | | | | |
Report of Independent Registered Public
Accounting Firm>> |
To the Shareholders and Board of Directors of British American Tobacco p.l.c.
Opinions on the Consolidated Financial Statements and Internal Control Over Financial Reporting
We have audited the accompanying Group Balance Sheet of British American Tobacco p.l.c. and subsidiaries (the “Group”) as of December 31, 2022 and 2021, the related Group Income Statement, Group Statement of Comprehensive Income, Group Statement of Changes in Equity, and Group Cash Flow Statement for each of the years in the three-year period ended December 31, 2022, and the related notes (collectively, the consolidated financial statements). We also have audited the Group’s internal control over financial reporting as of December 31, 2022, based on criteria established in Internal Control – Integrated Framework (2013) issued by the Committee of Sponsoring Organizations of the Treadway Commission.
In our opinion, the consolidated financial statements referred to above present fairly, in all material respects, the financial position of the Group as of December 31, 2022 and 2021, and the results of its operations and its cash flows for each of the years in the three-year period ended December 31, 2022, in conformity with International Financial Reporting Standards (IFRS) as issued by the International Accounting Standards Board. Also in our opinion, the Group maintained, in all material respects, effective internal control over financial reporting as of December 31, 2022 based on criteria established in Internal Control – Integrated Framework (2013) issued by the Committee of Sponsoring Organizations of the Treadway Commission.
Basis for Opinions
The Group’s management is responsible for these consolidated financial statements, for maintaining effective internal control over financial reporting, and for its assessment of the effectiveness of internal control over financial reporting, included in the accompanying management’s report on internal control over financial reporting. Our responsibility is to express an opinion on the Group’s consolidated financial statements and an opinion on the Group’s internal control over financial reporting based on our audits. We are a public accounting firm registered with the Public Company Accounting Oversight Board (United States) (PCAOB) and are required to be independent with respect to the Group in accordance with the U.S. federal securities laws and the applicable rules and regulations of the Securities and Exchange Commission and the PCAOB.
We conducted our audits in accordance with the standards of the PCAOB. Those standards require that we plan and perform the audits to obtain reasonable assurance about whether the consolidated financial statements are free of material misstatement, whether due to error or fraud, and whether effective internal control over financial reporting was maintained in all material respects.
Our audits of the consolidated financial statements included performing procedures to assess the risks of material misstatement of the consolidated financial statements, whether due to error or fraud, and performing procedures that respond to those risks. Such procedures included examining, on a test basis, evidence regarding the amounts and disclosures in the consolidated financial statements. Our audits also included evaluating the accounting principles used and significant estimates made by management, as well as evaluating the overall presentation of the consolidated financial statements. Our audit of internal control over financial reporting included obtaining an understanding of internal control over financial reporting, assessing the risk that a material weakness exists, and testing and evaluating the design and operating effectiveness of internal control based on the assessed risk. Our audits also included performing such other procedures as we considered necessary in the circumstances. We believe that our audits provide a reasonable basis for our opinions.
Definition and Limitations of Internal Control Over Financial Reporting
A company’s internal control over financial reporting is a process designed to provide reasonable assurance regarding the reliability of financial reporting and the preparation of financial statements for external purposes in accordance with generally accepted accounting principles. A company’s internal control over financial reporting includes those policies and procedures that (1) pertain to the maintenance of records that, in reasonable detail, accurately and fairly reflect the transactions and dispositions of the assets of the company; (2) provide reasonable assurance that transactions are recorded as necessary to permit preparation of financial statements in accordance with generally accepted accounting principles, and that receipts and expenditures of the company are being made only in accordance with authorizations of management and directors of the company; and (3) provide reasonable assurance regarding prevention or timely detection of unauthorized acquisition, use, or disposition of the company’s assets that could have a material effect on the financial statements.
Because of its inherent limitations, internal control over financial reporting may not prevent or detect misstatements. Also, projections of any evaluation of effectiveness to future periods are subject to the risk that controls may become inadequate because of changes in conditions, or that the degree of compliance with the policies or procedures may deteriorate.
Critical Audit Matters
The critical audit matters communicated below are matters arising from the current period audit of the consolidated financial statements that were communicated or required to be communicated to the audit committee and that: (1) relate to accounts or disclosures that are material to the consolidated financial statements and (2) involved our especially challenging, subjective, or complex judgments. The communication of critical audit matters does not alter in any way our opinion on the consolidated financial statements, taken as a whole, and we are not, by communicating the critical audit matters below, providing separate opinions on the critical audit matters or on the accounts or disclosures to which they relate.
Impairment analysis of goodwill and trademarks with indefinite lives arising from the 2017 acquisition of Reynolds American
Inc. (Reynolds American)
As discussed in Note 12 to the consolidated financial statements, the Group, as at December 31, 2022, has goodwill and trademarks with indefinite lives of £47,956 million and £78,228 million, respectively, arising from the 2017 acquisition of Reynolds American.
We identified the evaluation of the impairment analysis of goodwill and trademarks with indefinite lives arising from the 2017 acquisition of Reynolds American as a critical audit matter. There is a high degree of auditor judgment involved in evaluating: (i) the projected net revenue, long-term growth rates and post-tax discount rates used in the analysis of the recoverable amount of trademarks with indefinite lives and goodwill allocated to the Reynolds American cash-generating unit; and (ii) the impact of the proposed menthol ban on the assumptions listed above for the Newport and Camel indefinite lived trademarks and the goodwill allocated to the Reynolds American cash-generating unit.
| | | | | | | | | | | | | | | | | | | | | | | |
| BAT Annual Report and Form 20-F 2022 | Strategic Report | | Governance Report | | Financial Statements | | Other Information |
| | | | | | | |
| | | | | | | |
| | | | | | | |
| | | | | | | |
|
The following are the primary procedures we performed to address this critical audit matter. We evaluated the design and tested the operating effectiveness of certain internal controls related to the goodwill and trademarks with indefinite lives impairment testing process including controls related to the development of the projected net revenue and management’s determination of the applicable long-term growth rates and post-tax discount rates. In addition, we assessed the impairment analysis by:
–assessing and challenging Reynolds American’s projected net revenue and long-term growth rates by examining externally derived publicly available data, including, broker and analyst reports, industry reports, media reports, macro-economic assumptions, academic and scientific studies, and regulatory changes;
–challenging the projected net revenue by comparing the historical projections to actual results to assess the Group’s ability to accurately forecast;
–performing sensitivity analysis on the projected net revenue, long-term growth rates and post-tax discount rates to assess their impact on the Group’s determination that the value-in-use of the Reynolds American goodwill and trademarks with indefinite lives exceed their carrying value;
–assessing and challenging the impact of the proposed menthol ban on the projected net revenue, long-term growth rates and post-tax discount rates used in the value-in-use based assessment of the recoverable amount of the goodwill allocated to the Reynolds American cash-generating unit and the Newport and Camel indefinite lived brands based on the FDA rulemaking process and recent litigations and by comparing management’s projected brand retention rates against actual brand retention rates in other markets where a menthol ban has been implemented; and
–involving a valuation professional with specialized skills and knowledge, who assisted in independently developing a range of the post-tax discount rates using publicly available market data for comparable companies and comparing these rates to those utilized by Reynolds American to assess their reasonableness.
Canadian legal proceedings
As discussed in Note 31 to the consolidated financial statements, the Group’s operating company in Canada, Imperial Tobacco Canada (“Imperial”), has received an unfavorable judgment on the smoking and health class actions certified by the Quebec Superior Court. As a result of this judgment, Imperial has filed for creditor protection under the Companies’ Creditors Arrangement Act (the “CCAA”) and has asked the Ontario Superior Court to stay all pending or contemplated litigation against Imperial in order to resolve all of the outstanding litigation across the country.
We identified the evaluation of the Canadian legal proceedings as a critical audit matter because complex and subjective auditor judgment was required in evaluating the Group’s assessment of the relevant law, historical and pending court rulings, and the Group’s ability to estimate the likelihood and extent of any future economic outflow arising from the ultimate resolution of the Canadian litigation.
The following are the primary procedures we performed to address this critical audit matter. We evaluated the design and tested the operating effectiveness of certain internal controls related to the legal exposure process including controls related to the interpretation of relevant law and related court rulings and estimation of the likelihood and extent of any future economic outflow arising from the ultimate resolution of the Canadian litigation. In addition, we assessed the Canadian legal proceedings by:
–reading letters received directly from the Group's external and internal legal counsel that evaluated the current status of the Canadian legal proceedings. We further inquired of internal legal counsel to evaluate their basis for conclusions in their letter; and
–assessing relevant historical and recent judgments passed by the judicial court authorities in relation to the Canadian litigation and read the related Canadian court rulings in order to challenge Imperial’s interpretation of the Canadian legal proceedings.
/s/ KPMG LLP
We have served as the Group’s auditor since 2015.
London, United Kingdom
February 8, 2023
| | | | | | | | | | | | | | | | | | | | | | | |
| BAT Annual Report and Form 20-F 2022 | Strategic Report | | Governance Report | | Financial Statements | | Other Information |
| | | | | | | |
| | | | | | | |
| | | | | | | |
| Financial Statements | | | | | | | |
| Group Income Statement |
| | | | | | | | | | | | | | |
| | For the years ended 31 December |
| Notes | 2022 £m | 2021 £m | 2020 £m |
Revenue1 | 2 | 27,655 | | 25,684 | | 25,776 | |
| Raw materials and consumables used | | (4,781) | | (4,542) | | (4,583) | |
| Changes in inventories of finished goods and work in progress | | 227 | | 160 | | 445 | |
| Employee benefit costs | 3 | (2,972) | | (2,717) | | (2,744) | |
| Depreciation, amortisation and impairment costs | 4 | (1,305) | | (1,076) | | (1,450) | |
| Other operating income | 5 | 722 | | 196 | | 188 | |
| Loss on reclassification from amortised cost to fair value | | (5) | | (3) | | (3) | |
| Other operating expenses | 6 | (9,018) | | (7,468) | | (7,667) | |
| Profit from operations | 2 | 10,523 | | 10,234 | | 9,962 | |
| Net finance costs | 8 | (1,641) | | (1,486) | | (1,745) | |
| Share of post-tax results of associates and joint ventures | 2,9 | 442 | | 415 | | 455 | |
| Profit before taxation | | 9,324 | | 9,163 | | 8,672 | |
| Taxation on ordinary activities | 10 | (2,478) | | (2,189) | | (2,108) | |
| Profit for the year | | 6,846 | | 6,974 | | 6,564 | |
| Attributable to: | | | | |
| Owners of the parent | | 6,666 | | 6,801 | | 6,400 | |
| Non-controlling interests | | 180 | | 173 | | 164 | |
| | 6,846 | | 6,974 | | 6,564 | |
| Earnings per share | | | | |
| Basic | 11 | 293.3 | | 296.9 | | 280.0 | |
| Diluted | 11 | 291.9 | | 295.6 | | 278.9 | |
Note:
1. Revenue is net of duty, excise and other taxes of £38,527 million, £38,595 million and £39,172 million for the years ended 31 December 2022, 2021 and 2020, respectively.
The accompanying notes are an integral part of these consolidated financial statements.
| | | | | | | | | | | | | | | | | | | | | | | |
| BAT Annual Report and Form 20-F 2022 | Strategic Report | | Governance Report | | Financial Statements | | Other Information |
| | | | | | | |
| | | | | | | |
| | | | | | | |
| | | | | | | |
| Group Statement of Comprehensive Income |
| | | | | | | | | | | | | | |
| | For the years ended 31 December |
| Notes | 2022 £m | 2021 £m | 2020 £m |
| Profit for the year | | 6,846 | | 6,974 | | 6,564 | |
| Other comprehensive income/(expense) | | | | |
| Items that may be reclassified subsequently to profit or loss: | | 8,506 | | 509 | | (2,997) | |
| Foreign currency translation and hedges of net investments in foreign operations | | | | |
| – differences on exchange from translation of foreign operations | | 8,923 | | 32 | | (2,597) | |
| – reclassified and reported in profit for the year | 22(c) | 5 | | 291 | | — | |
| – net investment hedges - net fair value (losses)/gains on derivatives | | (578) | | 75 | | (16) | |
| – net investment hedges - differences on exchange on borrowings | | (21) | | 24 | | (163) | |
| Cash flow hedges | | | | |
| – net fair value gains/(losses) | | 81 | | 95 | | (257) | |
| – reclassified and reported in profit for the year | | 101 | | 32 | | 90 | |
| – tax on net fair value (gains)/losses in respect of cash flow hedges | 10(f) | (17) | | (32) | | 44 | |
| Investments held at fair value | | | | |
| – net fair value gains | 18 | 6 | | 9 | | — | |
| Associates – share of OCI, net of tax | 9 | 6 | | (17) | | (98) | |
| Items that will not be reclassified subsequently to profit or loss: | | 201 | | 313 | | 55 | |
| Retirement benefit schemes | | | | |
| – net actuarial gains | 15 | 316 | | 382 | | 105 | |
| – surplus recognition | 15 | (39) | | (1) | | 10 | |
| – tax on actuarial gains in respect of subsidiaries | 10(f) | (95) | | (82) | | (26) | |
| Associates – share of OCI, net of tax | 9 | 19 | | 14 | | (34) | |
| | | | |
| Total other comprehensive income/(expense) for the year, net of tax | | 8,707 | | 822 | | (2,942) | |
| Total comprehensive income for the year, net of tax | | 15,553 | | 7,796 | | 3,622 | |
| Attributable to: | | | | |
| Owners of the parent | | 15,370 | | 7,622 | | 3,474 | |
| Non-controlling interests | | 183 | | 174 | | 148 | |
| | 15,553 | | 7,796 | | 3,622 | |
The accompanying notes are an integral part of these consolidated financial statements.
| | | | | | | | | | | | | | | | | | | | | | | |
| BAT Annual Report and Form 20-F 2022 | Strategic Report | | Governance Report | | Financial Statements | | Other Information |
| | | | | | | |
| | | | | | | |
| | | | | | | |
| Financial Statements | | | | | | | |
Group Statement of Changes in Equity
|
| | | | | | | | | | | | | | | | | | | | | | | | | | | | | | | | |
| | Attributable to owners of the parent | | | |
| Notes | Share capital
£m | Share premium, capital redemption and merger reserves
£m | Other reserves
£m | Retained earnings
£m | In respect of assets held-for-sale
£m | Total attributable to owners of parent
£m | Perpetual hybrid bonds
£m | Non- controlling interests
£m | Total equity
£m |
Balance at 1 January 2022 | | 614 | | 26,622 | | (6,032) | | 44,212 | | — | | 65,416 | | 1,685 | | 300 | | 67,401 | |
| Total comprehensive income for the year comprising: | | — | | — | | 8,521 | | 6,849 | | — | | 15,370 | | — | | 183 | | 15,553 | |
| Profit for the year | | — | | — | | — | | 6,666 | | — | | 6,666 | | — | | 180 | | 6,846 | |
| Other comprehensive income for the year | | — | | — | | 8,521 | | 183 | | — | | 8,704 | | — | | 3 | | 8,707 | |
| Other changes in equity | | | | | | | | | | |
| Cash flow hedges reclassified and reported in total assets | | — | | — | | (129) | | — | | — | | (129) | | — | | — | | (129) | |
| Employee share options | | | | | | | | | | |
–value of employee services | 28 | — | | — | | — | | 81 | | — | | 81 | | — | | — | | 81 | |
–proceeds from new
shares issued | | — | | 5 | | — | | — | | — | | 5 | | — | | — | | 5 | |
–treasury shares used for share option schemes | | — | | 1 | | — | | (1) | | — | | — | | — | | — | | — | |
| Dividends and other appropriations | | | | | | | | | | |
–ordinary shares | 22(c),(f) | — | | — | | — | | (4,915) | | — | | (4,915) | | — | | — | | (4,915) | |
–to non-controlling interests | | — | | — | | — | | — | | — | | — | | — | | (141) | | (141) | |
| Purchase of own shares | | | | | | | | | | |
–held in employee share ownership trusts | | — | | — | | — | | (80) | | — | | (80) | | — | | — | | (80) | |
–share buy-back programme | 22(c)(vi) | — | | — | | — | | (2,012) | | — | | (2,012) | | — | | — | | (2,012) | |
| Perpetual hybrid bonds | | | | | | | | | | |
| | | | | | | | | | |
| | | | | | | | | | |
–coupons paid | | — | | — | | — | | (59) | | — | | (59) | | — | | — | | (59) | |
–tax on coupons paid | | — | | — | | — | | 11 | | — | | 11 | | — | | — | | 11 | |
| Non-controlling interests – acquisitions | 27(b) | — | | — | | — | | (1) | | — | | (1) | | — | | — | | (1) | |
| | | | | | | | | | |
Reclassification of
equity in respect of assets classified as held-for-sale | 27(d) | — | | — | | 295 | | — | | (295) | | — | | — | | — | | — | |
| Other movements | | — | | — | | — | | (4) | | — | | (4) | | — | | — | | (4) | |
Balance at
31 December 2022 | | 614 | | 26,628 | | 2,655 | | 44,081 | | (295) | | 73,683 | | 1,685 | | 342 | | 75,710 | |
The accompanying notes are an integral part of these consolidated financial statements.
| | | | | | | | | | | | | | | | | | | | | | | |
| BAT Annual Report and Form 20-F 2022 | Strategic Report | | Governance Report | | Financial Statements | | Other Information |
| | | | | | | |
| | | | | | | |
| | | | | | | |
| | | | | | | |
|
| | | | | | | | | | | | | | | | | | | | | | | | | | | | | |
| | Attributable to owners of the parent | | | |
| Notes | Share capital
£m | Share premium, capital redemption and merger reserves
£m | Other reserves
£m | Retained earnings
£m | Total attributable to owners of parent
£m | Perpetual hybrid bonds
£m | Non- controlling interests
£m | Total equity
£m |
Balance at 1 January 2021 | | 614 | | 26,618 | | (6,600) | | 42,041 | | 62,673 | | — | | 282 | | 62,955 | |
| Total comprehensive income for the year comprising: | | — | | — | | 523 | | 7,099 | | 7,622 | | — | | 174 | | 7,796 | |
| Profit for the year | | — | | — | | — | | 6,801 | | 6,801 | | — | | 173 | | 6,974 | |
| Other comprehensive income for the year | | — | | — | | 523 | | 298 | | 821 | | — | | 1 | | 822 | |
| Other changes in equity | | | | | | | | | |
| Cash flow hedges reclassified and reported in total assets | | — | | — | | 45 | | — | | 45 | | — | | — | | 45 | |
| Employee share options | | | | | | | | | |
–value of employee services | 28 | — | | — | | — | | 76 | | 76 | | — | | — | | 76 | |
–treasury shares used for
share option schemes | | — | | 4 | | — | | (4) | | — | | — | | — | | — | |
| Dividends and other appropriations | | | | | | | | | |
–ordinary shares | 22(c),(f) | — | | — | | — | | (4,904) | | (4,904) | | — | | — | | (4,904) | |
–to non-controlling interests | | — | | — | | — | | — | | — | | — | | (162) | | (162) | |
| Purchase of own shares | | | | | | | | | |
–held in employee share
ownership trusts | | — | | — | | — | | (82) | | (82) | | — | | — | | (82) | |
| Perpetual hybrid bonds | | | | | | | | | |
–proceeds, net of issuance fees | 22(d) | — | | — | | — | | — | | — | | 1,681 | | — | | 1,681 | |
–tax on issuance fees | | — | | — | | — | | — | | — | | 4 | | — | | 4 | |
–coupons paid | | — | | — | | — | | (6) | | (6) | | — | | — | | (6) | |
–tax on coupons paid | | — | | — | | — | | 1 | | 1 | | — | | — | | 1 | |
Non-controlling interests –
acquisitions | 27(b) | — | | — | | — | | (5) | | (5) | | — | | — | | (5) | |
| Other movements - non-controlling interests | 27(b) | — | | — | | — | | — | | — | | — | | 6 | | 6 | |
| Other movements | | — | | — | | — | | (4) | | (4) | | — | | — | | (4) | |
Balance at 31 December 2021 | | 614 | | 26,622 | | (6,032) | | 44,212 | | 65,416 | | 1,685 | | 300 | | 67,401 | |
The accompanying notes are an integral part of these consolidated financial statements.
| | | | | | | | | | | | | | | | | | | | | | | |
| BAT Annual Report and Form 20-F 2022 | Strategic Report | | Governance Report | | Financial Statements | | Other Information |
| | | | | | | |
| | | | | | | |
| | | | | | | |
| Financial Statements | | | | | | | |
Group Statement of Changes in Equity Continued |
| | | | | | | | | | | | | | | | | | | | | | | | | | | |
| | Attributable to owners of the parent | | | |
| Notes | Share capital
£m | Share premium, capital redemption and merger reserves
£m | Other reserves
£m | Retained earnings
£m | Total attributable to owners of parent
£m | | Non- controlling interests
£m | Total equity
£m |
Balance at 1 January 2020 | | 614 | | 26,609 | | (3,555) | | 40,234 | | 63,902 | | | 258 | | 64,160 | |
| Total comprehensive (expense)/income for the year comprising: | | — | | — | | (3,012) | | 6,486 | | 3,474 | | | 148 | | 3,622 | |
| Profit for the year | | — | | — | | — | | 6,400 | | 6,400 | | | 164 | | 6,564 | |
| Other comprehensive (expense)/income for the year | | — | | — | | (3,012) | | 86 | | (2,926) | | | (16) | | (2,942) | |
| Other changes in equity | | | | | | | | | |
| Cash flow hedges reclassified and reported in total assets | | — | | — | | (33) | | — | | (33) | | | — | | (33) | |
| Employee share options | | | | | | | | | |
–value of employee services | 28 | — | | — | | — | | 88 | | 88 | | | — | | 88 | |
–proceeds from new shares issued | | — | | 2 | | — | | — | | 2 | | | — | | 2 | |
–treasury shares used for share option schemes | | — | | 7 | | — | | (7) | | — | | | — | | — | |
| Dividends and other appropriations | | | | | | | | | |
–ordinary shares | 22(c),(f) | — | | — | | — | | (4,747) | | (4,747) | | | — | | (4,747) | |
–to non-controlling interests | | — | | — | | — | | — | | — | | | (141) | | (141) | |
| Purchase of own shares | | | | | | | | | |
–held in employee share ownership trusts | | — | | — | | — | | (17) | | (17) | | | — | | (17) | |
| Other movements non-controlling interests | 27(b) | — | | — | | — | | — | | — | | | 17 | | 17 | |
| Other movements | | — | | — | | — | | 4 | | 4 | | | — | | 4 | |
Balance at 31 December 2020 | | 614 | | 26,618 | | (6,600) | | 42,041 | | 62,673 | | | 282 | | 62,955 | |
The accompanying notes are an integral part of these consolidated financial statements.
| | | | | | | | | | | | | | | | | | | | | | | |
| BAT Annual Report and Form 20-F 2022 | Strategic Report | | Governance Report | | Financial Statements | | Other Information |
| | | | | | | |
| | | | | | | |
| | | | | | | |
| | | | | | | |
| Group Balance Sheet |
| | | | | | | | | | | |
| | 31 December |
| Notes | 2022 £m | 2021 £m |
| Assets | | | |
| Intangible assets | 12 | 129,075 | | 115,625 | |
| Property, plant and equipment | 13 | 4,867 | | 4,953 | |
| Investments in associates and joint ventures | 14 | 2,020 | | 1,948 | |
| Retirement benefit assets | 15 | 1,000 | | 918 | |
| Deferred tax assets | 16 | 682 | | 611 | |
| Trade and other receivables | 17 | 241 | | 210 | |
| Investments held at fair value | 18 | 121 | | 50 | |
| Derivative financial instruments | 19 | 131 | | 243 | |
| Total non-current assets | | 138,137 | | 124,558 | |
| Inventories | 20 | 5,671 | | 5,279 | |
| Income tax receivable | | 149 | | 117 | |
| Trade and other receivables | 17 | 4,367 | | 3,951 | |
| Investments held at fair value | 18 | 579 | | 456 | |
| Derivative financial instruments | 19 | 430 | | 182 | |
| Cash and cash equivalents | 21 | 3,446 | | 2,809 | |
| | 14,642 | | 12,794 | |
| Assets classified as held-for-sale | 27(d) | 767 | | 13 | |
| Total current assets | | 15,409 | | 12,807 | |
| Total assets | | 153,546 | | 137,365 | |
| Equity – capital and reserves | | | |
| Share capital | 22(a) | 614 | | 614 | |
| Share premium, capital redemption and merger reserves | 22(b) | 26,628 | | 26,622 | |
| Other reserves | 22(c) | 2,655 | | (6,032) | |
| Retained earnings | 22(c) | 44,081 | | 44,212 | |
| In respect of assets held-for-sale | 22(c) | (295) | | — | |
| Owners of the parent | | 73,683 | | 65,416 | |
| Perpetual hybrid bonds | 22(d) | 1,685 | | 1,685 | |
| Non-controlling interests | 22(e) | 342 | | 300 | |
| Total equity | | 75,710 | | 67,401 | |
| Liabilities | | | |
| Borrowings | 23 | 38,726 | | 35,666 | |
| Retirement benefit liabilities | 15 | 949 | | 1,239 | |
| Deferred tax liabilities | 16 | 18,428 | | 16,462 | |
| Other provisions for liabilities | 24 | 434 | | 392 | |
| Trade and other payables | 25 | 944 | | 982 | |
| Derivative financial instruments | 19 | 502 | | 79 | |
| Total non-current liabilities | | 59,983 | | 54,820 | |
| Borrowings | 23 | 4,413 | | 3,992 | |
| Income tax payable | | 1,049 | | 879 | |
| Other provisions for liabilities | 24 | 1,087 | | 461 | |
| Trade and other payables | 25 | 10,449 | | 9,577 | |
| Derivative financial instruments | 19 | 427 | | 235 | |
| | 17,425 | | 15,144 | |
| Liabilities associated with assets classified as held-for-sale | 27(d) | 428 | | — | |
| Total current liabilities | | 17,853 | | 15,144 | |
| Total equity and liabilities | | 153,546 | | 137,365 | |
The accompanying notes are an integral part of these consolidated financial statements.
On behalf of the Board
Luc Jobin
Chair
08 February 2023
| | | | | | | | | | | | | | | | | | | | | | | |
| BAT Annual Report and Form 20-F 2022 | Strategic Report | | Governance Report | | Financial Statements | | Other Information |
| | | | | | | |
| | | | | | | |
| | | | | | | |
| Financial Statements | | | | | | | |
| Group Cash Flow Statement |
| | | | | | | | | | | | | | |
| | For the years ended 31 December |
| Notes | 2022 £m | 2021 £m | 2020 £m |
| Profit for the year | | 6,846 | | 6,974 | | 6,564 | |
| Taxation on ordinary activities | | 2,478 | | 2,189 | | 2,108 | |
| Share of post-tax results of associates and joint ventures | | (442) | | (415) | | (455) | |
| Net finance costs | | 1,641 | | 1,486 | | 1,745 | |
| Profit from operations | | 10,523 | | 10,234 | | 9,962 | |
| Adjustments for | | | | |
| – depreciation, amortisation and impairment costs | 4 | 1,305 | | 1,076 | | 1,450 | |
– (increase)/decrease in inventories | | (246) | | 433 | | (144) | |
– (increase)/decrease in trade and other receivables | | (42) | | (393) | | 300 | |
– (decrease)/increase in Master Settlement Agreement payable | 6 | (145) | | (36) | | 369 | |
– increase/(decrease) in trade and other payables | | 3 | | 183 | | (320) | |
– decrease in net retirement benefit liabilities | | (110) | | (104) | | (96) | |
– increase/(decrease) in other provisions for liabilities | | 643 | | (145) | | — | |
| – other non-cash items | 27(d) | 606 | | 430 | | 46 | |
| Cash generated from operating activities | | 12,537 | | 11,678 | | 11,567 | |
| Dividends received from associates | | 394 | | 353 | | 351 | |
| Tax paid | | (2,537) | | (2,314) | | (2,132) | |
Net cash generated from operating activities | | 10,394 | | 9,717 | | 9,786 | |
| Cash flows from investing activities | | | | |
| Interest received | | 85 | | 33 | | 48 | |
| Purchases of property, plant and equipment | | (523) | | (527) | | (511) | |
| Proceeds on disposal of property, plant and equipment | | 31 | | 31 | | 44 | |
| Purchases of intangibles | | (133) | | (218) | | (244) | |
| Proceeds on disposals of intangibles | | 3 | | — | | — | |
| Purchases of investments | | (257) | | (369) | | (343) | |
| Proceeds on disposals of investments | | 128 | | 141 | | 184 | |
| Investment in associates and acquisitions of other subsidiaries net of cash acquired | | (39) | | (133) | | 39 | |
| Disposal of subsidiary, net of cash disposed of | 27(d) | — | | (98) | | — | |
Net cash used in investing activities | | (705) | | (1,140) | | (783) | |
| Cash flows from financing activities | | | | |
| Interest paid on borrowings and financing related activities | | (1,578) | | (1,479) | | (1,737) | |
| Interest element of lease liabilities | | (25) | | (23) | | (26) | |
| Capital element of lease liabilities | | (161) | | (154) | | (164) | |
| Proceeds from increases in and new borrowings | | 3,267 | | 978 | | 9,826 | |
| Reductions in and repayments of borrowings | | (3,044) | | (4,843) | | (10,633) | |
(Outflows)/inflows relating to derivative financial instruments | | (117) | | 229 | | (283) | |
| Purchases of own shares - share buy-back programme | 22(c) | (2,012) | | — | | — | |
| Purchases of own shares held in employee share ownership trusts | | (80) | | (82) | | (18) | |
| Proceeds from the issue of perpetual hybrid bonds, net of issuance costs | 22(d) | — | | 1,681 | | — | |
| Coupon paid on perpetual hybrid bonds | | (60) | | (6) | | — | |
| Dividends paid to owners of the parent | | (4,915) | | (4,904) | | (4,745) | |
| Capital injection from and purchases of non-controlling interests | 30 | (1) | | 1 | | 17 | |
| Dividends paid to non-controlling interests | | (158) | | (150) | | (136) | |
| Other | | 6 | | 3 | | 2 | |
Net cash used in financing activities | | (8,878) | | (8,749) | | (7,897) | |
Net cash flows generated from/(used in) operating, investing and financing activities | | 811 | | (172) | | 1,106 | |
| Transferred to held-for-sale | | (368) | | — | | — | |
| Differences on exchange | | 431 | | (253) | | (253) | |
Increase/(decrease) in net cash and cash equivalents in the year | | 874 | | (425) | | 853 | |
| Net cash and cash equivalents at 1 January | | 2,463 | | 2,888 | | 2,035 | |
| Net cash and cash equivalents at 31 December | 21 | 3,337 | | 2,463 | | 2,888 | |
The accompanying notes are an integral part of these consolidated financial statements.
| | | | | | | | | | | | | | | | | | | | | | | |
| BAT Annual Report and Form 20-F 2022 | Strategic Report | | Governance Report | | Financial Statements | | Other Information |
| | | | | | | |
| | | | | | | |
| | | | | | | |
| | | | | | | |
| Notes on Accounts |
1 Accounting policies
Basis of preparation
The consolidated financial statements have been prepared in accordance with International Financial Reporting Standards (IFRS) as issued by the International Accounting Standards Board (IASB) and UK-adopted international accounting standards. UK-adopted international accounting standards differ in certain respects from IFRS as issued by the IASB. The differences have no impact on the Group’s consolidated financial statements for the periods presented.
The consolidated financial statements have been prepared on a going concern basis under the historical cost convention except as described in the accounting policy below on financial instruments. In performing its going concern assessment, management considered forecasts and liquidity requirements covering a period of at least twelve months from the date of approval of the financial statements and including the Group’s ability to fund its operations and generate cash to pay for debt as it falls due and takes into account the payments arising from the Master Settlement Agreement due in the U.S. in 2023 and other known liabilities or future payments (including interim dividends), as they fall due. This assessment includes consideration of geopolitical events in Europe and the general outlook in the global economy, as well as plausible downside scenarios after taking into account the Group’s Principal Risks and how they could impact the Group’s operations. Any mitigating actions, should they be required, are all within management’s control and could include reductions in discretionary spending such as acquisitions and capital expenditure, or drawdowns on committed facilities. After reviewing the Group’s annual budget, plans and financing arrangements, the Directors consider that the Group has adequate resources to continue operating and that it is therefore appropriate to continue to adopt the going concern basis in preparing the Annual Report and Form 20‑F.
Management have, in preparing the financial statements, considered the impact of climate change and determined that the impact is not expected to be material:
–On the going concern of the Group, over the next three years;
–On the Group’s assessment of future cash flows (including as related to the capital expenditure plans as related to the Group’s emission commitments) as used in impairment assessments for the value in use of non-current assets including goodwill (note 12(e)); and
–In respect of factors including useful lives and residual values that determine the carrying value of non-financial current assets.
There has been no material impact identified on the financial reporting judgements and estimates. Management is aware that the risks related to climate change are developing and ever changing. Accordingly, these judgements and estimates will be kept under review as the future impacts of climate change on the Group’s financial statements depend on environmental, regulatory and other factors outside of the Group’s control which are not all currently known.
The preparation of the consolidated financial statements requires management to make estimates and assumptions that affect the reported amounts of revenues, expenses, assets and liabilities, and the disclosure of contingent liabilities at the date of the financial statements. The key estimates and assumptions are set out in
the accounting policies below, together with the related notes
to the accounts.
The critical accounting judgements include:
–the identification and quantification of adjusting items, which are separately disclosed as memorandum information, is explained below and the impact of these on the calculation of adjusted earnings per share is described in note 11;
–the presentation of disposal groups, including assets classified as held-for-sale and liabilities associated with assets classified as held-for-sale, including the assessment as to whether control would be lost based on the proposed terms of the sale and the impact of regulatory procedures, where applicable, to approve the
sale, including amounts in respect of the proposed disposal of the Group’s businesses in Russia and Belarus (note 27(d));
–the determination as to whether to recognise provisions and the exposures to contingent liabilities related to pending litigation or other outstanding claims, as well as other contingent liabilities. The accounting policy on contingent liabilities, which are not provided for, is set out below and the contingent liabilities of the Group are explained in note 31. Judgement is necessary to assess the likelihood that a pending claim is probable (more likely than not to succeed), possible or remote;
–the determination as to whether control (subsidiaries), joint control (joint arrangements), or significant influence (associates) exists in relation to the investments held by the Group. This is assessed after taking into account the Group’s ability to appoint Directors to the entity’s Board, its relative shareholding compared with other shareholders, any significant contracts or arrangements with the entity or its other shareholders and other relevant facts and circumstances. The application of these policies to Group subsidiaries in territories including Canada is explained in note 32;
–the review of applicable exchange rates for transactions with and translation of entities in territories where there are restrictions on free access to foreign currency, or multiple exchange rates; and
–the determination as to whether perpetual hybrid bonds should be classified as equity instead of borrowings (note 22(d)).
The critical accounting estimates include:
–the review of asset values, including indefinite life assets, such as goodwill and certain trademarks and similar intangibles. The key assumptions used in respect of the impairment testing are the determination of cash-generating units, the budgeted and forecast cash flows of these units, the long-term growth rate for cash flow projections and the rate used to discount the cash flow projections. These are described in note 12;
–the estimation of value ascribed to held-for-sale assets and disposal groups, which are measured at the lower of carrying amount and fair value of expected consideration less costs to sell, reflecting management’s best estimates after taking into account the amount and anticipated timing of sales proceeds less any costs to sell;
–the estimation of and accounting for retirement benefit costs. The determination of the carrying value of assets and liabilities, as well as the charge for the year, and amounts recognised in other comprehensive income, involves judgements made in conjunction with independent actuaries. These involve estimates about uncertain future events based on the environment in different countries, including life expectancy of scheme members, salary and pension increases, inflation, as well as discount rates and asset values at the year-end. The assumptions used by the Group and sensitivity analysis are described in note 15; and
–the estimation of amounts to be recognised in respect of taxation and legal matters, and the estimation of other provisions for liabilities and charges are subject to uncertain future events, may extend over several years and so the amount and/or timing may differ from current assumptions. The accounting policy for taxation is explained below. The recognised deferred tax assets and liabilities, together with a note of unrecognised amounts, are shown in note 16, and a contingent tax asset is explained in note 10(b). Other provisions for liabilities and charges are as set out in note 24. Litigation related deposits are shown in note 17. The application of these accounting policies to the payments made and credits recognised under the Master Settlement Agreement by Reynolds American Inc. (Reynolds American) is described in note 6(b).
| | | | | | | | | | | | | | | | | | | | | | | |
| BAT Annual Report and Form 20-F 2022 | Strategic Report | | Governance Report | | Financial Statements | | Other Information |
| | | | | | | |
| | | | | | | |
| | | | | | | |
| Financial Statements | | | | | | | |
Notes on Accounts Continued |
Such estimates and assumptions are based on historical experience and various other factors that are believed to be reasonable in the circumstances and constitute management’s best judgement at the date of the financial statements. In the future, actual experience may deviate from these estimates and assumptions, which could affect the financial statements as the original estimates and assumptions are modified, as appropriate, in the year in which the circumstances change.
These consolidated financial statements were authorised for
issue by the Board of Directors on 8 February 2023.
Basis of consolidation
The consolidated financial information includes the financial statements of British American Tobacco p.l.c. and its subsidiary undertakings, collectively ‘the Group’, together with the Group’s share of the results of its associates and joint arrangements.
A subsidiary is an entity controlled by the Group. The Group controls an entity when the Group is exposed to, or has rights to, variable returns from its involvement with the entity and has the ability to affect those returns through its power over the entity. Non-controlling interests represent the share of earnings or equity in subsidiaries that is not attributable, directly or indirectly, to shareholders of the Group. Business combinations are accounted for using the acquisition method with identifiable assets, liabilities and contingent liabilities acquired measured at fair value at the date of acquiring control. Disposals of subsidiaries and businesses due to sale or market withdrawal are accounted for as disposals from the date of losing control and may be classified as held-for-sale disposal groups at the balance sheet date if specific tests under IFRS 5 Non-current Assets Held For Sale and Discontinued Operations are met.
A disposal group is a group of assets to be disposed of, by sale or otherwise, together in a single transaction. Discontinued operations, where applicable, comprise material disposal groups representing a significant geographical area of operations or business activities.
Associates comprise investments in undertakings, which are not subsidiary undertakings or joint arrangements, where the Group’s interest in the equity capital is long-term and over whose operating and financial policies the Group exercises significant influence. They are accounted for using the equity method.
Joint arrangements comprise contractual arrangements where
two or more parties have joint control and where decisions regarding the relevant activities of the entity require unanimous consent.
Joint operations are jointly-controlled arrangements where the parties to the arrangement have rights to the underlying assets and obligations for the underlying liabilities relating to the arrangement. The Group accounts for its share of the assets, liabilities, income and expenses of any such arrangement.
Joint ventures comprise arrangements where the parties to the arrangement have rights to the net assets of the arrangement. They are accounted for using the equity method.
Foreign currencies and hyperinflationary territories
The functional currency of the Parent Company is sterling and this is also the presentation currency of the Group. The income and cash flow statements of Group undertakings expressed in currencies other than sterling are translated to sterling using exchange rates applicable to the dates of the underlying transactions. Average rates of exchange in each year are used where the average rate approximates the relevant exchange rate at the date of the underlying transactions. Assets and liabilities of Group undertakings are translated at the applicable rates of exchange at the end of each year. In territories where there are restrictions on free access to foreign currency or multiple exchange rates, the applicable rates of exchange are regularly reviewed.
The differences between retained profits translated at average and closing rates of exchange are taken to reserves, as are differences arising on the retranslation to sterling (using closing rates of exchange) of overseas net assets at the beginning of the year, and are presented as a separate component of equity in the Translation reserve within Other reserves, as shown in note 22. They are recognised in the income statement when the gain or loss on disposal of a Group undertaking is recognised.
Foreign currency transactions are initially recognised in the functional currency of each entity in the Group using the exchange rate ruling at the date of the transaction. Foreign exchange gains and losses resulting from the settlement of such transactions and from the translation of foreign currency assets and liabilities at year-end rates of exchange are recognised in the income statement, except when deferred in equity as qualifying cash flow hedges, on intercompany net investment loans and qualifying net investment hedges. Foreign exchange gains or losses recognised in the income statement are included in profit from operations or net finance costs depending on the underlying transactions that gave rise to these exchange differences.
In addition, for hyperinflationary countries where the effect on the Group results would be significant, the financial statements in local currency are adjusted to reflect the impact of local inflation prior to translation into sterling, in accordance with IAS 29 Financial Reporting in Hyperinflationary Economies. Where applicable, IAS 29 requires all transactions to be indexed by an inflationary factor to the balance sheet date, potentially leading
to a monetary gain or loss on indexation. In addition, the Group assesses the carrying value of fixed assets after indexation and applies IAS 36 Impairment of Assets, where appropriate, to ensure that the carrying value correctly reflects the economic value of such assets.
The results and balance sheets of operations in hyperinflationary territories are translated at the period end rate.
Revenue
Revenue principally comprises sales of cigarettes, other tobacco products, and nicotine products, to external customers. Revenue excludes duty, excise and other taxes related to sales in the period and is stated after deducting rebates, returns and other similar discounts and payments to direct and indirect customers. For the vast majority of the Group’s sales, revenue is recognised when control of the goods is transferred to a customer at a point in time; this is usually evidenced by a transfer of the significant risks and rewards of ownership upon delivery to the customer, which in terms of timing is not materially different to the date of shipping.
For certain e-commerce subscription sales, revenue is allocated to each component of the subscription, with revenue recognised as each component is delivered to the customer. These sales are not material to the Group’s results.
Retirement benefit costs
The Group operates both defined benefit and defined contribution schemes including post-retirement healthcare schemes. For defined benefit schemes, the actuarial cost charged to profit from operations consists of current service cost, net interest on the net defined benefit liability or asset, past service cost and the impact of any settlements. The net deficit or surplus for each defined benefit pension scheme is calculated in accordance with IAS 19 Employee Benefits based on the present value of the defined benefit obligation at the balance sheet date less the fair value of the scheme assets adjusted, where appropriate, for any surplus restrictions or the effect of minimum funding requirements. Some benefits are provided through defined contribution schemes and payments to these are charged as an expense as they fall due.
.
| | | | | | | | | | | | | | | | | | | | | | | |
| BAT Annual Report and Form 20-F 2022 | Strategic Report | | Governance Report | | Financial Statements | | Other Information |
| | | | | | | |
| | | | | | | |
| | | | | | | |
| | | | | | | |
|
Share-based payments
The Group has equity-settled and cash-settled share-based compensation plans.
Equity-settled share-based payments are measured at fair value at the date of grant. The fair value determined at the grant date of the equity-settled share-based payments is expensed over the vesting period, based on the Group’s estimate of awards that will eventually vest. For plans where vesting conditions are based on total shareholder returns, the fair value at date of grant reflects these conditions, whereas earnings per share vesting conditions are reflected in the calculation of awards that will eventually vest over the vesting period.
For cash-settled share-based payments, a liability equal to the portion of the services received is recognised at its current fair value determined at each balance sheet date.
Fair value is measured by the use of the Black-Scholes option pricing model, except where vesting is dependent on market conditions when the Monte-Carlo option pricing model is used. The expected life used in the models has been adjusted, based on management’s best estimate, for the effects of non-transferability, exercise restrictions and behavioural considerations.
Research and development
Research expenditure is charged to profit or loss in the year in which it is incurred. Development expenditure is charged to profit or loss in the year it is incurred, unless it meets the recognition criteria of IAS 38 Intangible Assets to be capitalised as an intangible asset.
Taxation
Tax is chargeable on the profits for the period, together with deferred tax. The current income tax charge is calculated
on the basis of tax laws enacted or substantively enacted
at the balance sheet date in the countries where the Group’s subsidiaries, associates and joint arrangements operate and generate taxable income.
Deferred tax is provided in full using the liability method for temporary differences between the carrying amount of assets and liabilities for financial reporting purposes and the amount used for taxation purposes. A deferred tax asset is recognised only to the extent that it is probable that future taxable profits will be available against which the asset can be utilised.
Deferred tax is determined using the tax rates that have been enacted or substantively enacted by the balance sheet date and are expected to apply when the related deferred tax asset is realised or deferred tax liability is settled.
Tax is recognised in the income statement except to the extent that it relates to items recognised in other comprehensive income or directly in equity, in which case it is recognised in the statement of other comprehensive income or the statement of changes in equity.
The Group has exposures in respect of the payment or recovery of taxes and applies IFRIC 23 Uncertainty over Income Tax Treatments which requires that, where there is uncertainty as to whether a particular tax treatment will be accepted by the relevant taxation authority, the financial statements reflect the probable outcome with estimated amounts determined based on the most likely amount or expected value, depending on which method is expected to better predict the resolution of the uncertainty.
Goodwill
Goodwill arising on acquisitions is capitalised and any impairment of goodwill is recognised immediately in the income statement and is not subsequently reversed.
Goodwill in respect of subsidiaries is included in intangible assets. In respect of associates and joint ventures, goodwill is included in the carrying value of the investment in the associated company or joint venture. On disposal of a subsidiary, associate or joint
venture, the attributable amount of goodwill is included in the determination of the profit or loss on disposal.
Intangible assets other than goodwill
The intangible assets shown on the Group balance sheet consist mainly of trademarks and similar intangibles, including certain intellectual property, acquired by the Group’s subsidiary undertakings and computer software.
Acquired trademarks and similar assets are carried at cost less accumulated amortisation and impairment. Trademarks with indefinite lives are not amortised but are reviewed annually for impairment. Other trademarks and similar assets are amortised on a straight-line basis over their remaining useful lives, consistent with the pattern of economic benefits expected to be received, which do not exceed 20 years. Any impairments of trademarks are recognised in the income statement, but increases in trademark values are not recognised.
Computer software is carried at cost less accumulated amortisation and impairment, and, with the exception of global software solutions, is amortised on a straight-line basis over periods ranging from three years to five years.
Global software solutions are software assets designed to be implemented on a global basis and used as a standard solution by all of the operating companies in the Group. Prior to 2021, these assets were amortised on a straight-line basis over periods not exceeding 10 years and are currently amortised on a straight-line basis over periods not exceeding 13 years due to ongoing use of the assets and the extension of third-party supplier support. In 2021 and 2022, the impact of this change in accounting estimate was a reduction in annual amortisation expense of £26 million and, in 2023, is estimated to be a reduction in annual amortisation expense of £12 million.
Property, plant and equipment
Purchased property, plant and equipment are stated at cost less accumulated depreciation and impairment. Depreciation is calculated on a straight-line basis to write off the assets over their useful economic life. No depreciation is provided on freehold land or assets classified as held-for-sale. Non-current assets are classified as held-for sale if their carrying value will be recovered principally through a sale transaction rather than through continuing use and if all of the conditions of IFRS 5 are met.
Purchased freehold and leasehold property are depreciated at rates between 2.5% and 4% per annum, and plant and equipment at rates between 3% and 25% per annum.
Capitalised interest
Borrowing costs which are directly attributable to the acquisition, construction or production of intangible assets or property, plant and equipment that takes a substantial period of time to get ready for its intended use or sale, are capitalised as part of the cost of
the asset.
Leased assets
The Group applies IFRS 16 Leases to contractual arrangements which are, or contain, leases of assets. Lease liabilities are initially recognised at an amount equal to the present value of estimated contractual lease payments at the inception of the lease, after taking into account any options to extend the term of the lease. Lease commitments are discounted to present value using the interest rate implicit in the lease if this can be readily determined, or the applicable incremental rate of borrowing, as appropriate. Right-of-use lease assets are initially recognised at an amount equal to the lease liability, adjusted for initial direct costs in relation to the assets, then depreciated over the shorter of the lease term and their estimated useful lives. Right-of-use assets are included as part of property, plant and equipment in note 13, with the lease liabilities included as part of borrowings in note 23.
| | | | | | | | | | | | | | | | | | | | | | | |
| BAT Annual Report and Form 20-F 2022 | Strategic Report | | Governance Report | | Financial Statements | | Other Information |
| | | | | | | |
| | | | | | | |
| | | | | | | |
| Financial Statements | | | | | | | |
Notes on Accounts Continued |
The Group has adopted several practical expedients available under the Standard including not applying the requirements of IFRS 16 to leases of intangible assets, applying the portfolio approach where appropriate to do so, and to not apply the recognition and measurement requirements of IFRS 16 to short-term leases (leases of less than 12 months maximum duration) or leases of low-value assets. Except for property-related leases, non-lease components have not been separated from lease components.
Impairment of non-financial assets
Assets are reviewed for impairment whenever events indicate that the carrying amount of a cash-generating unit may not be recoverable. In addition, assets that have indefinite useful lives are tested annually for impairment. An impairment loss is recognised to the extent that the carrying value exceeds the higher of the asset’s fair value less costs to sell and its value-in-use.
A cash-generating unit is the smallest identifiable group of assets that generates cash flows which are largely independent of
the cash flows from other assets or groups of assets. At the acquisition date, any goodwill acquired is allocated to the relevant cash-generating unit or group of cash-generating units expected to benefit from the acquisition for the purpose of impairment testing of goodwill.
Impairment of financial assets held at amortised cost
Loss allowances for expected credit losses on financial assets which are held at amortised cost are recognised on initial recognition of the underlying asset. As permitted by IFRS 9 Financial Instruments, loss allowances on trade receivables arising from the recognition of revenue under IFRS 15 Revenue from Contracts with Customers are initially measured at an amount equal to lifetime expected losses. Allowances in respect of loans and other receivables are initially recognised at an amount equal
to 12-month expected credit losses. Allowances are measured at an amount equal to the lifetime expected credit losses where
the credit risk on the receivables increases significantly after
initial recognition.
Inventories
Inventories are stated at the lower of cost and net realisable value. Cost is based on the weighted average cost incurred in acquiring inventories and bringing them to their existing location and condition, which will include raw materials, direct labour and overheads, where appropriate. Net realisable value is the estimated selling price less costs to completion and sale. Tobacco inventories which have an operating cycle that exceeds 12 months are classified as current assets, consistent with recognised industry practice.
Biological Assets
The investments in associates and joint ventures shown in the Group balance sheet include biological assets held by Organigram Holdings Inc. In accordance with IAS 41 Agriculture, the Group measures biological assets at fair value less costs to sell up to the point of harvest, at which point this becomes the basis for the cost of finished goods inventories after harvest with subsequent expenditures incurred on these being capitalised, where applicable, in accordance with IAS 2 Inventories. Unrealised fair value gains and losses arising during the growth of biological assets are recognised immediately in the income statement.
Equity instruments
Instruments are classified as either financial liabilities or as equity in accordance with the substance of the contractual arrangements. Instruments that cannot be settled in the Group’s own equity instruments and that include no contractual obligation to deliver cash or another financial asset are classified as equity. Equity instruments issued by the Group are recognised at the proceeds received, net of issuance costs.
On 27 September 2021, the Group issued two €1 billion perpetual hybrid bonds. As the Group has the unconditional right to avoid transferring cash or another financial asset in relation to these bonds, they are classified as equity instruments in the consolidated financial statements.
Financial instruments
The Group’s business model for managing financial assets is set out in the Group Treasury Manual which notes that the primary objective with regard to the management of cash and investments is to protect against the loss of principal. Additionally, the Group aims: to maximise Group liquidity by concentrating cash at the Centre, to align the maturity profile of external investments with that of the forecast liquidity profile, to wherever practicable, match the interest rate profile of external investments to that of debt maturities or fixings, and to optimise the investment yield within the Group’s investment parameters. The majority of financial assets are held in order to collect contractual cash flows (typically cash and cash equivalents and loans and other receivables), but some assets (typically investments) are held for investment potential.
Financial assets and financial liabilities are recognised when the Group becomes a party to the contractual provisions of the relevant instrument and derecognised when it ceases to be a party to such provisions. Such assets and liabilities are classified as current if they are expected to be realised or settled within 12 months after the balance sheet date. If not, they are classified as non-current. In addition, current liabilities include amounts where the entity does not have an unconditional right to defer settlement of the liability for at least 12 months after the balance sheet date.
The Group early adopted the phase one and phase two Amendments to IFRS 9 Financial Instruments and IFRS 7 Financial Instruments: Disclosures regarding Interest Rate Benchmark Reform in 2019 and 2020, respectively. The Amendments provide an exemption for certain hedging relationships directly affected by changes in interest rate benchmarks where the reform gives rise to uncertainties regarding the interest rate designated as a hedged risk, or the timing or amount of interest rate cash flows of either the hedged item or of the hedging instrument, such that without the exemption the relationship might not qualify for hedge accounting. In addition, the Amendments provide a practical expedient for financial assets and financial liabilities that are modified or have existing contractual terms activated that change the basis for determining the contractual cash flows as a result of Interest Rate Benchmark Reform, such that the change to the contractual cash flows is applied prospectively by revising the effective interest rate.
| | | | | | | | | | | | | | | | | | | | | | | |
| BAT Annual Report and Form 20-F 2022 | Strategic Report | | Governance Report | | Financial Statements | | Other Information |
| | | | | | | |
| | | | | | | |
| | | | | | | |
| | | | | | | |
|
Non-derivative financial assets are classified on initial recognition in accordance with the Group’s business model as investments, loans and receivables, or cash and cash equivalents and accounted for as follows:
–Investments: these are non-derivative financial assets that cannot be classified as loans and other receivables or cash
and cash equivalents. Dividend and interest income on these investments are included within finance income when the Group’s right to receive payments is established. This category includes financial assets at fair value through profit and loss
and financial assets at fair value through other comprehensive income.
–Loans and other receivables: these are non-derivative financial assets with fixed or determinable payments that are solely payments of principal and interest on the principal amount outstanding, that are primarily held in order to collect contractual cash flows. These balances include trade and other receivables, which are measured at amortised cost, using the effective interest rate method, and stated net of allowances for credit losses, and deposits with banks and other financial institutions which cannot be classified as cash and cash equivalents. In addition, as explained in note 17, certain litigation related deposits are recognised as assets within loans and other receivables where management has determined that these payments represent a resource controlled by the entity as a result of past events. These deposits are held at the fair value of consideration transferred less impairment, if applicable, and have not been discounted.
–Cash and cash equivalents: cash and cash equivalents include cash in hand and deposits held on call, together with other short-term highly liquid investments including investments in certain money market funds. Cash equivalents normally comprise instruments with maturities of three months or less at their
date of acquisition. In the cash flow statement, cash and cash equivalents are shown net of bank overdrafts, which are included as current borrowings in the liabilities section on the balance sheet.
Fair values for quoted investments are based on observable market prices. If there is no active market for a financial asset, the fair value is established by using valuation techniques principally involving discounted cash flow analysis.
Non-derivative financial liabilities, including borrowings and trade payables, are stated at amortised cost using the effective interest method. For borrowings, their carrying value includes accrued interest payable, as well as unamortised issue costs. Drawdowns and repayments of short-term borrowings which have a maturity period of three months or less are stated net in the cash flow statement; drawdowns and repayments on all other borrowings are stated gross in the cash flow statement. As shown in note 23, certain borrowings are subject to fair value hedges, as defined below.
Derivative financial assets and liabilities are initially recognised, and subsequently measured, at fair value, which includes accrued interest receivable and payable where relevant. Changes in their fair values are recognised as follows:
–for derivatives that are designated as cash flow hedges, the changes in their fair values are recognised directly in other comprehensive income, to the extent that they are effective, with the ineffective portion being recognised in the income statement. Where the hedged item results in a non-financial asset, the accumulated gains and losses, previously recognised in other comprehensive income, are included in the initial carrying value of the asset (basis adjustment) and recognised in the income statement in the same periods as the hedged item. Where the underlying transaction does not result in such an asset, the accumulated gains and losses are reclassified to the income statement in the same periods as the hedged item;
–for derivatives that are designated as fair value hedges, the carrying value of the hedged item is adjusted for the fair value changes attributable to the risk being hedged, with the corresponding entry being made in the income statement. The changes in fair value of these derivatives are also recognised in the income statement;
–for derivatives that are designated as hedges of net investments in foreign operations, the changes in their fair values are recognised directly in other comprehensive income, to the extent that they are effective, with the ineffective portion being recognised in the income statement. Where non-derivatives such as foreign currency borrowings are designated as net investment hedges, the relevant exchange differences are similarly recognised. The accumulated gains and losses are reclassified to the income statement when the foreign operation is disposed of; and
–for derivatives that do not qualify for hedge accounting or are not designated as hedges, the changes in their fair values are recognised in the income statement in the period in which they arise. These are referred to as ‘held-for-trading’.
In order to qualify for hedge accounting, the Group is required to document prospectively the economic relationship between the item being hedged and the hedging instrument. The Group is also required to demonstrate an assessment of the economic relationship between the hedged item and the hedging instrument, which shows that the hedge will be highly effective on an ongoing basis. This effectiveness testing is re-performed periodically to ensure that the hedge has remained, and is expected to remain, highly effective.
Hedge accounting is discontinued when a hedging instrument is derecognised (e.g. through expiry or disposal), or no longer qualifies for hedge accounting. Where the hedged item is a highly probable forecast transaction, the related gains and losses remain in equity until the transaction takes place, when they are reclassified to the income statement in the same manner as for cash flow hedges as described above. When a hedged future transaction is no longer expected to occur, any related gains and losses, previously recognised in other comprehensive income, are immediately reclassified to the income statement.
Derivative fair value changes recognised in the income statement are either reflected in arriving at profit from operations (if the hedged item is similarly reflected) or in finance costs.
| | | | | | | | | | | | | | | | | | | | | | | |
| BAT Annual Report and Form 20-F 2022 | Strategic Report | | Governance Report | | Financial Statements | | Other Information |
| | | | | | | |
| | | | | | | |
| | | | | | | |
| Financial Statements | | | | | | | |
Notes on Accounts Continued |
Dividends
The Company pays interim quarterly dividends, and the Group recognises the interim dividend in the period in which it is paid.
Segmental analysis
The Group is organised and managed on the basis of its geographic regions. These are the reportable segments for the Group as they form the focus of the Group’s internal reporting systems and are the basis used by the chief operating decision maker, identified as the Management Board, for assessing performance and allocating resources. While the Group has clearly differentiated brands, global segmentation between a wide portfolio of brands is not part of the regular internally reported financial information. The results of New Category products are reported as part of the results of each geographic region.
The prices agreed between Group companies for intra-group
sales of materials, manufactured goods, charges for royalties, commissions, services and fees, are based on normal commercial practices which would apply between independent businesses. Royalty income, less related expenditure, is included in the region in which the licensor is based.
Adjusting items
Adjusting items are significant items of income or expense in revenue, profit from operations, net finance costs, taxation and
the Group’s share of the post-tax results of associates and joint ventures which individually or, if of a similar type, in aggregate, are relevant to an understanding of the Group’s underlying financial performance because of their size, nature or incidence. In identifying and quantifying adjusting items, the Group consistently applies a policy that defines criteria that are required to be met for an item to be classified as adjusting. These items are separately disclosed in the segmental analyses or in the notes to the accounts as appropriate.
The Group believes that these items are useful to users of the Group financial statements in helping them to understand the underlying business performance and are used to derive the Group’s principal non-GAAP measures of adjusted profit from operations and adjusted diluted earnings per share, all of which are before the impact of adjusting items and which are reconciled from profit from operations and diluted earnings per share.
Provisions
Provisions are recognised when either a legal or constructive obligation as a result of a past event exists at the balance sheet date, it is probable that an outflow of economic resources will be required to settle the obligation and a reasonable estimate can be made of the amount of the obligation.
Contingent liabilities and contingent assets
Subsidiaries and associate companies are defendants in tobacco-related and other litigation. These exposures are regularly reviewed on an on-going basis and provision for this litigation (including legal costs) is made at such time as an unfavourable outcome becomes probable and the amount can be reasonably estimated.
Contingent assets are possible assets whose existence will only
be confirmed by future events not wholly within the control of the entity and are not recognised as assets until the realisation of income is virtually certain.
Where a provision has not been recognised, the Group records its external legal fees and other external defence costs for tobacco-related and other litigation as these costs are incurred.
As explained in note 17, certain litigation-related deposits are recognised as assets within loans and other receivables where management has determined that these payments represent a resource controlled by the entity. These deposits are held at the fair value of consideration transferred less impairment, if applicable, and have not been discounted.
Repurchase of share capital
When share capital is repurchased, the amount of consideration paid, including directly attributable costs, is recognised as a deduction from equity. Repurchased shares which are not cancelled, or shares purchased for the employee share ownership trusts, are classified as treasury shares and presented as a deduction from total equity.
Future changes to accounting policies
Certain changes to IFRS will be applicable to the Group financial statements in future years, but are not expected to have a material effect on reported profit or equity or on the disclosures in the financial statements.
| | | | | | | | | | | | | | | | | | | | | | | |
| BAT Annual Report and Form 20-F 2022 | Strategic Report | | Governance Report | | Financial Statements | | Other Information |
| | | | | | | |
| | | | | | | |
| | | | | | | |
| | | | | | | |
|
2 Segmental analyses
The chief operating decision maker, the Management Board, reviews adjusted profit from operations at constant currencies to
evaluate segment performance and allocate resources to the overall business on a geographic region basis, including the results of
New Categories (comprising Vapour products, Tobacco Heating products and Modern Oral products), which are reported to the Management Board as part of the results of each geographic region. The Management Board also reviews, at constant currencies, revenues on a geographic region basis, which are included within adjusted profit from operations.
The four geographic regions are the reportable segments for the Group as they form the focus of the Group’s internal reporting systems and are the basis used by the Management Board for assessing performance and allocating resources. Transactions between Group subsidiaries are conducted on arm’s length terms in accordance with appropriate transfer pricing rules and Organisation for Economic Cooperation & Development (OECD) principles. Net finance costs (comprising interest income and interest expense), share of post-tax results of associates and joint ventures and taxation are centrally managed, and accordingly, such items are not presented by segment as they are excluded from the measure of segment profitability.
Regional Directors are responsible for delivering the operating and financial results of their Region inclusive of all product categories. Therefore, the results of New Categories (comprising Vapour products, Tobacco Heating products and Modern Oral products) are reported to the Management Board as part of the results of each geographic region.
However, additional information has been provided to disaggregate revenue based on product category to enable investors to better compare the Group’s business performance across periods and by reference to the Group’s investment activity.
In respect of the U.S. region, all financial statements and financial information provided by or with respect to the U.S. business or Reynolds American Inc. (RAI) (and/or RAI and its subsidiaries (collectively, the ‘Reynolds Group’)) are prepared on the basis of US GAAP and constitute the primary financial statements or financial information of the U.S. business or RAI (and/or the Reynolds Group). Solely for the purpose of consolidation within the results of BAT p.l.c. and the BAT Group, this financial information is then converted to IFRS. To the extent any such financial information provided in these financial statements relates to the U.S. business or RAI (and/or the Reynolds Group), it is provided as an explanation of the U.S. business’s or RAI’s (and/or the Reynolds Group’s) primary US GAAP based financial statements and information.
Effective 1 January 2022, the North African markets of Algeria, Egypt, Libya, Morocco, Sudan and Tunisia, which formed part of the Europe and North Africa (ENA) region were moved to the Africa and Middle East (APME) region. From 2022, the ENA region has been renamed Europe. The impact of this is not considered material to the understanding of the regional results of the Europe and APME regions and therefore the prior year comparative information has not been restated.
As part of plans to reduce complexity and drive efficiency in management structures and achieve a better balance in the scale of our regions, it was decided to reduce the management structure from four regions to three regions, with the new organisational structures expected to be in place by early April 2023. The markets which comprise the Americas and Sub-Saharan Africa (AmSSA) region will be distributed to the Asia-Pacific and Middle East (APME) and Europe regions. The new regional structure will be:
–Americas and Europe (AME), comprising the old Europe region with the inclusion of markets in Latin America and Canada;
–Asia-Pacific, Middle East and Africa (APMEA) comprising the old APME region with the inclusion of markets in Sub-Saharan Africa; and
–the U.S.
The change to our segment reporting is a subsequent event and therefore does not affect the historical results, discussion or presentation of our consolidated results as set forth in this Report.
The results of 2023 will be presented in the above structure, with comparator data restated accordingly.
The following table shows 2022 revenue at current rates, and 2022 revenue translated using 2021 rates of exchange. The 2021 figures are stated at the 2021 rates of exchange.
| | | | | | | | | | | | | | | | | | | | | | | |
| | | | | 2022 | | 2021 |
| | | Revenue Constant rates
£m | Translation exchange
£m | Revenue Current Rates
£m | | Revenue
£m |
| U.S. | | | 11,358 | | 1,281 | | 12,639 | | | 11,691 | |
| AmSSA | | | 3,979 | | 224 | | 4,203 | | | 3,801 | |
| Europe | | | 6,423 | | (77) | | 6,346 | | | 6,001 | |
| APME | | | 4,513 | | (46) | | 4,467 | | | 4,191 | |
| Revenue | | | 26,273 | | 1,382 | | 27,655 | | | 25,684 | |
| | | | | | | | | | | | | | | | | | | | | | | |
| BAT Annual Report and Form 20-F 2022 | Strategic Report | | Governance Report | | Financial Statements | | Other Information |
| | | | | | | |
| | | | | | | |
| | | | | | | |
| Financial Statements | | | | | | | |
Notes on Accounts Continued |
The following table shows 2021 revenue at current rates, and 2021 revenue translated using 2020 rates of exchange. The 2020 figures are stated at the 2020 rates of exchange.
| | | | | | | | | | | | | | | | | | | | | | | |
| | | | | 2021 | | 2020 |
| | | Revenue Constant rates
£m | Translation exchange
£m | Revenue Current Rates
£m | | Revenue
£m |
| U.S. | | | 12,530 | | (839) | | 11,691 | | | 11,473 | |
| AmSSA | | | 4,067 | | (266) | | 3,801 | | | 3,772 | |
| Europe | | | 6,429 | | (428) | | 6,001 | | | 5,994 | |
| APME | | | 4,535 | | (344) | | 4,191 | | | 4,537 | |
| Revenue | | | 27,561 | | (1,877) | | 25,684 | | | 25,776 | |
The following table shows 2022 profit from operations and adjusted profit from operations at current rates, and 2022 adjusted profit from operations translated using 2021 rates of exchange. The 2021 figures are stated at the 2021 rates of exchange.
| | | | | | | | | | | | | | | | | | | | | | | | | | | | | |
| | | | | 2022 | | | | 2021 |
| Adjusted* segment result Constant rates
£m | Translation exchange
£m | Adjusted* segment result Current rates
£m | Adjusting* items
£m | Segment result Current rates
£m | | Adjusted* segment result
£m | Adjusting* items
£m | Segment result
£m |
| U.S. | 6,095 | | 740 | | 6,835 | | (630) | | 6,205 | | | 5,887 | | (321) | | 5,566 | |
| AmSSA | 1,659 | | 83 | | 1,742 | | 280 | | 2,022 | | | 1,590 | | (94) | | 1,496 | |
| Europe | 2,103 | | (21) | | 2,082 | | (812) | | 1,270 | | | 1,956 | | (71) | | 1,885 | |
| APME | 1,769 | | (20) | | 1,749 | | (723) | | 1,026 | | | 1,717 | | (430) | | 1,287 | |
| Profit from operations | 11,626 | | 782 | | 12,408 | | (1,885) | | 10,523 | | | 11,150 | | (916) | | 10,234 | |
| Net finance costs | | | | | (1,641) | | | | | (1,486) | |
| Share of post-tax results of associates and joint ventures | | | | | 442 | | | | | 415 | |
| Profit before taxation | | | | | 9,324 | | | | | 9,163 | |
| Taxation on ordinary activities | | | | | (2,478) | | | | | (2,189) | |
| Profit for the year | | | | | 6,846 | | | | | 6,974 | |
Note:
* The adjustments to profit from operations are explained in notes 3, 4, 6(d), 6(f), 6(g), 6(h), 6(i), 6(j), and 7.
The following table shows 2021 profit from operations and adjusted profit from operations at current rates, and 2021 adjusted profit from operations translated using 2020 rates of exchange. The 2020 figures are stated at the 2020 rates of exchange.
| | | | | | | | | | | | | | | | | | | | | | | | | | | | | |
| | | | | 2021 | | | | 2020 |
| Adjusted* segment result Constant rates
£m | Translation exchange
£m | Adjusted* segment result Current rates
£m | Adjusting* items
£m | Segment result Current rates
£m | | Adjusted* segment result
£m | Adjusting* items
£m | Segment result
£m |
| U.S. | 6,343 | | (456) | | 5,887 | | (321) | | 5,566 | | | 5,784 | | (809) | | 4,975 | |
| AmSSA | 1,688 | | (98) | | 1,590 | | (94) | | 1,496 | | | 1,618 | | (65) | | 1,553 | |
| Europe | 2,088 | | (132) | | 1,956 | | (71) | | 1,885 | | | 2,110 | | (148) | | 1,962 | |
| APME | 1,833 | | (116) | | 1,717 | | (430) | | 1,287 | | | 1,853 | | (381) | | 1,472 | |
| Profit from operations | 11,952 | | (802) | | 11,150 | | (916) | | 10,234 | | | 11,365 | | (1,403) | | 9,962 | |
| Net finance costs | | | | | (1,486) | | | | | (1,745) | |
| Share of post-tax results of associates and joint ventures | | | | | 415 | | | | | 455 | |
| Profit before taxation | | | | | 9,163 | | | | | 8,672 | |
| Taxation on ordinary activities | | | | | (2,189) | | | | | (2,108) | |
| Profit for the year | | | | | 6,974 | | | | | 6,564 | |
Note:
* The adjustments to profit from operations are explained in notes 3, 4, 6(d), 6(f), 6(g), 6(h), 6(i), 6(j), and 7.
| | | | | | | | | | | | | | | | | | | | | | | |
| BAT Annual Report and Form 20-F 2022 | Strategic Report | | Governance Report | | Financial Statements | | Other Information |
| | | | | | | |
| | | | | | | |
| | | | | | | |
| | | | | | | |
|
Adjusted profit from operations at constant rates of £11,626 million (2021: £11,952 million; 2020: £11,661 million) excludes adjusting depreciation, amortisation and impairment charges as explained in notes 4 and 7. These are excluded from segmental adjusted profit from operations at constant rates as follows:
| | | | | | | | | | | | | | | | | | | | | | | | | | | | | |
| | | | | 2022 | | | | 2021 |
| Adjusted depreciation, amortisation and impairment Constant rates
£m | Translation exchange
£m | Adjusted depreciation, amortisation and impairment Current rates
£m | Adjusting items
£m | Depreciation, amortisation and impairment Current rates
£m | | Adjusted depreciation, amortisation and impairment
£m | Adjusting items
£m | Depreciation, amortisation and impairment
£m |
| U.S. | 221 | | 16 | | 237 | | 322 | | 559 | | | 203 | | 276 | | 479 | |
| AmSSA | 151 | | 11 | | 162 | | 24 | | 186 | | | 123 | | 56 | | 179 | |
| Europe | 251 | | — | | 251 | | 98 | | 349 | | | 252 | | — | | 252 | |
| APME | 147 | | 3 | | 150 | | 61 | | 211 | | | 146 | | 20 | | 166 | |
| 770 | | 30 | | 800 | | 505 | | 1,305 | | | 724 | | 352 | | 1,076 | |
| | | | | | | | | | | | | | | | | | | | | | | | | | | | | |
| | | | | 2021 | | | | 2020 |
| Adjusted depreciation, amortisation and impairment Constant rates
£m | Translation exchange
£m | Adjusted depreciation, amortisation and impairment Current rates
£m | Adjusting items
£m | Depreciation, amortisation and impairment Current rates
£m | | Adjusted depreciation, amortisation and impairment
£m | Adjusting items
£m | Depreciation, amortisation and impairment
£m |
| U.S. | 210 | | (7) | | 203 | | 276 | | 479 | | | 204 | | 272 | | 476 | |
| AmSSA | 131 | | (8) | | 123 | | 56 | | 179 | | | 121 | | 34 | | 155 | |
| Europe | 266 | | (14) | | 252 | | — | | 252 | | | 259 | | 119 | | 378 | |
| APME | 154 | | (8) | | 146 | | 20 | | 166 | | | 167 | | 274 | | 441 | |
| 761 | | (37) | | 724 | | 352 | | 1,076 | | | 751 | | 699 | | 1,450 | |
Additional information by product category
Although the Group’s operations are managed on a Regional basis, additional information for revenue is provided based on product category as follows:
| | | | | | | | | | | | | | | | | |
| Revenue | | 2022 £m | | 2021 £m | 2020 £m |
| New Categories | | 2,894 | | | 2,054 | | 1,443 | |
| Vapour | | 1,436 | | | 927 | | 611 | |
| THP | | 1,060 | | | 853 | | 634 | |
| Modern Oral | | 398 | | | 274 | | 198 | |
| Traditional Oral | | 1,209 | | | 1,118 | | 1,160 | |
| Combustibles | | 23,030 | | | 22,029 | | 22,752 | |
| Other | | 522 | | | 483 | | 421 | |
| Revenue | | 27,655 | | | 25,684 | | 25,776 | |
| | | | | | | | | | | | | | | | | | | | | | | |
| BAT Annual Report and Form 20-F 2022 | Strategic Report | | Governance Report | | Financial Statements | | Other Information |
| | | | | | | |
| | | | | | | |
| | | | | | | |
| Financial Statements | | | | | | | |
Notes on Accounts Continued |
External revenue and non-current assets other than financial instruments, deferred tax assets and retirement benefit assets are analysed between the UK and all foreign countries at current rates of exchange as follows:
| | | | | | | | | | | | | | | | | | | | | | | | | | | | | | | | | | | |
| United Kingdom | | All foreign countries | | Group |
| Revenue is based on location of sale | 2022 £m | 2021 £m | 2020 £m | | 2022 £m | 2021 £m | 2020 £m | | 2022 £m | 2021 £m | 2020 £m |
| External revenue | 228 | | 209 | | 188 | | | 27,427 | | 25,475 | | 25,588 | | | 27,655 | | 25,684 | | 25,776 | |
| | | | | | | | | | | | | | | | | | | | | | | | | | |
| United Kingdom | | All foreign countries | | Group |
| 2022 £m | 2021 £m | | 2022 £m | 2021 £m | | 2022 £m | 2021 £m |
| Intangible assets | 529 | | 481 | | | 128,546 | | 115,144 | | | 129,075 | | 115,625 | |
| Property, plant and equipment | 215 | | 339 | | | 4,652 | | 4,614 | | | 4,867 | | 4,953 | |
| Investments in associates and joint ventures | — | | 8 | | | 2,020 | | 1,940 | | | 2,020 | | 1,948 | |
The consolidated results of the Reynolds Group operating in the U.S. met the criteria for separate disclosure under the requirements of IFRS 8 Operating Segments. Revenue arising from the operations of the Reynolds Group, inclusive of the sales made to fellow Group companies, in 2022, 2021 and 2020 was £12,635 million, £11,707 million and £11,481 million, respectively. The majority of sales are to customers based in the U.S.. Non-current assets attributable to the operations of the Reynolds Group were £119,597 million (2021: £106,495 million).
The main acquisitions comprising the goodwill balance of £47,956 million (2021: £43,194 million), included in intangible assets, are provided in note 12. Included in investments in associates and joint ventures are amounts of £ 1,865 million (2021: £1,759 million) attributable to the investment in ITC Ltd. Further information is provided in notes 9 and 14.
3 Employee benefit costs
| | | | | | | | | | | | | | | | | | | | | | | | | | | | | |
| | | | Note | | 2022 £m | | 2021 £m | 2020 £m |
| Wages and salaries | | | 2,553 | | | 2,315 | | 2,277 | |
| Social security costs | | | 201 | | | 185 | | 194 | |
| Other pension and retirement benefit costs | 15 | | 133 | | | 139 | | 182 | |
| Share-based payments - equity and cash-settled | 28 | | 85 | | | 78 | | 91 | |
| | | | | | 2,972 | | | 2,717 | | 2,744 | |
Included within employee benefits costs are expenses in relation to the Group’s restructuring and integration initiatives of £315 million (2021: £160 million; 2020: £91 million), as explained in note 7.
Following a partial buy-out in 2021, in 2022, a second partial buy-out was concluded in the U.S. with approximately US$1.6 billion (£1.3 billion) (2021: US$1.9 billion (£1.4 billion)) of plan liabilities being removed from the balance sheet, resulting in a settlement gain of £16 million (2021: £35 million), which was reported in the income statement, and recognised as an adjusting item.
4 Depreciation, amortisation and impairment costs
| | | | | | | | | | | |
| 2022 £m | 2021 £m | 2020 £m |
| Intangibles – amortisation and impairment of trademarks and similar intangibles | 317 | | 333 | | 360 | |
| – amortisation and impairment of computer software | 142 | | 129 | | 129 | |
| – impairment of goodwill | — | | 57 | | 209 | |
| Property, plant and equipment - depreciation and impairment | 846 | | 557 | | 752 | |
| 1,305 | | 1,076 | | 1,450 | |
Enumerated below are movements in costs that have impacted depreciation, amortisation and impairment in 2022, 2021 and 2020. These include changes in our underlying business performance, as well as impact of adjusting items, as defined in note 1.
Intangibles – amortisation and impairment of trademarks and similar intangibles
Acquisitions in previous years have resulted in the capitalisation of trademarks and similar intangibles, including those which are amortised over their expected useful lives, which do not exceed 20 years. The amortisation and impairment of these acquired trademarks and similar intangibles are charged to the income statement of which the adjusting element is £288 million (2021:
£306 million; 2020: £339 million). Also included under amortisation and impairment of trademarks and similar intangibles is a £3 million gain (2021: £nil, 2020:£nil) related to a trademark disposal, which has been treated as adjusting.
Impairment of goodwill
The impairment of goodwill is charged to the income statement as adjusting.
During 2022, the Group made no impairments of goodwill.
During 2021, the Group impaired £3 million of goodwill held in Myanmar as a result of the decision to cease activities in the market.
The Group also recognised a goodwill impairment charge of £54 million in 2021 due to continued difficult trading conditions in Peru as
a consequence of the COVID-19 pandemic.
During 2020, the Group impaired the goodwill arising from Malaysia amounting to £197 million, goodwill arising from the acquisition of Twisp of £11 million and goodwill arising from the acquisition of Blue Nile of £1 million.
| | | | | | | | | | | | | | | | | | | | | | | |
| BAT Annual Report and Form 20-F 2022 | Strategic Report | | Governance Report | | Financial Statements | | Other Information |
| | | | | | | |
| | | | | | | |
| | | | | | | |
| | | | | | | |
|
Property, plant and equipment – depreciation and impairment
The following items are included within depreciation and impairment of property, plant and equipment:
–Restructuring and integration related depreciation and impairment costs and reversals were a net cost of £220 million (2021: £11 million net credit; 2020: £151 million net cost) resulting from obsolete machines in relation to downsizing and factory rationalisation as mentioned in note 7; and
–Gains and losses recognised on disposal of property, plant and equipment.
5 Other operating income
Other operating income of £722 million (2021: £196 million; 2020: £188 million) comprises income that is associated with the Group’s normal activities, but which falls outside the definition of turnover and includes one-off capital profits on property sales and one-off disposals of fixed assets.
In 2022, other operating income mainly related to the calculation of historical VAT on social contributions in Brazil, where the Group recognised £472 million. This has been treated as an adjusting item.
In addition, £78 million of the contingent asset in respect of historical VAT on social contributions claims was sold to financial institutions for £38 million.
In 2021 and 2020, the Group recognised £5 million and £58 million, respectively, in respect of a tax case in Brazil. In addition, during 2021, £130 million of the unrecognised contingent asset in respect of historical VAT on social contributions claims was sold to financial institutions for £45 million.
In 2022, as disclosed in note 7, certain items of operating income have been recognised as part of the Group’s restructuring and integration activities.
Also, in 2021, R.J. Reynolds Tobacco Company (RJRT) reached an agreement with several Master Settlement Agreement (MSA) states to waive RJRT’s claims under the MSA in connection with a settlement between those MSA states and a non-participating manufacturer, S&M Brands, Inc. (S&M Brands), under which the states released certain claims against S&M Brands in exchange for receiving a portion of the funds S&M Brands had deposited into escrow accounts in those states pursuant to the states’ escrow statutes. In consideration for waiving claims, RJRT, together with Santa Fe Natural Tobacco Company, received approximately £40 million from the escrow funds paid to those MSA states under their settlement with S&M Brands.
6 Other operating expenses
(a) Items included within other operating expenses
The following items are included within other operating expenses:
| | | | | | | | | | | | | | |
| Notes | 2022 £m | 2021 £m | 2020 £m |
| Other operating expenses | | 9,018 | | 7,468 | | 7,667 | |
| The following items are included within other operating expenses: | | | | |
| Master settlement agreement | 6(b),(d) | 2,387 | | 2,486 | | 2,783 | |
| Marketing costs in operating expenses | 6(c) | 1,160 | | 1,242 | | 1,096 | |
| Inventory write-offs | 20 | 250 | | 215 | | 309 | |
| Research and development expenses (excluding employee benefit costs and depreciation) | 6(e) | 138 | | 141 | | 121 | |
| Loss on disposal of businesses | 6(f) | (6) | | 358 | | — | |
| Excise, VAT and penalties in respect of disputes in Turkey, South Korea and Russia | 6(g) | — | | 26 | | (40) | |
| Charges in respect of DOJ investigation | 6(h) | 450 | | — | | — | |
| Charges in respect of assets held-for-sale | 6(j) | 612 | | — | | — | |
| Charges in respect of Nigerian FCCPC case | 6(i) | 79 | | — | | — | |
| Social contribution expense related to Brazil VAT case | | 12 | | — | | — | |
| Exchange differences | | 92 | | 19 | | (29) | |
| Hedge ineffectiveness within operating profit | | 36 | | (5) | | (3) | |
| Expenses relating to short-term leases | | 11 | | 8 | | 10 | |
| Expenses relating to leases of low-value assets | | 1 | | 1 | | 1 | |
| Gains arising from sale and leaseback transactions | | — | | — | | (1) | |
| Auditor’s remuneration | 6(k) | 29 | | 27 | | 28 | |
(b) Master Settlement Agreement
In 1998, the major U.S. cigarette manufacturers (including the R.J. Reynolds Tobacco Company, Lorillard and Brown & Williamson, businesses which are now part of the Reynolds Group) entered into the Master Settlement Agreement (MSA) with attorneys general representing most U.S. states and territories. The MSA imposes a perpetual stream of future payment obligations on the major U.S. cigarette manufacturers. The amounts of money that the participating manufacturers are required to annually contribute are based upon, amongst other things, the volume of cigarettes sold and market share (based on cigarette shipments in that year).
During 2012, R.J. Reynolds Tobacco Company, Santa Fe Natural Tobacco Company (SFNTC), various other tobacco manufacturers, 17 states, the District of Columbia and Puerto Rico reached an agreement related to the Non-Participating Manufacturer (NPM) adjustment under the MSA, and three more states joined the agreement in 2013. Under this agreement, R.J. Reynolds Tobacco Company has received credits of more than
| | | | | | | | | | | | | | | | | | | | | | | |
| BAT Annual Report and Form 20-F 2022 | Strategic Report | | Governance Report | | Financial Statements | | Other Information |
| | | | | | | |
| | | | | | | |
| | | | | | | |
| Financial Statements | | | | | | | |
Notes on Accounts Continued |
US$1 billion, in respect of its Non-Participating Manufacturer (NPM) Adjustment claims related to the period from 2003 to 2012. These credits have been applied against the companies’ MSA payments over a period of five years from 2013, subject to, and dependent upon, meeting the various ongoing performance obligations. During 2014, two additional states agreed to settle NPM disputes related to claims for the period 2003 to 2012. R.J. Reynolds Tobacco Company has received US$170 million in credits, which has been applied over a five-year period from 2014. During 2015, another state agreed to settle NPM disputes related to claims for the period 2004 to 2014 and included a method to determine future adjustments from 2015 forward. R.J. Reynolds Tobacco Company has received US$285 million in credits, which was applied over a four-year period from 2016. During 2016, no additional states agreed to settle NPM disputes. During 2017, two more states agreed to settle NPM disputes related to claims for the period 2004 to 2014. It is estimated that R.J. Reynolds Tobacco Company will receive US$61 million in credits, which will be applied over a five-year period from 2017. During 2018, nine more states agreed to settle NPM disputes related to claims for the period 2004 to 2019, with an option through 2022, subject to certain conditions. It is estimated that R.J. Reynolds Tobacco Company will receive US$182 million in credits for settled periods through 2017, which will be applied over a five-year period from 2018. Also, in 2018, one additional state agreed to settle NPM disputes related to claims for the period 2004 to 2024, subject to certain conditions. It is estimated that R.J. Reynolds Tobacco Company will receive US$205 million in credits for settled periods through 2017, which will be applied over a five-year period from 2019. In the first quarter of 2020, certain conditions set forth in the 2017 and 2018 agreements were met for those 10 states. In 2022, an additional state settled NPM disputes related to claims for the period 2005 to 2018. It is estimated that R.J. Reynolds Tobacco Company will receive a credit of US$130 million for settled periods through 2018, which will be applied over a five-year period from 2022. Credits in respect of future years’ payments and the NPM Adjustment claims would be accounted for in the applicable year and will not be treated as adjusting items. Only credits in respect of prior year payments are included as adjusting items.
In 2020, R.J. Reynolds Tobacco Company recognised additional expenses under the state settlement agreements in the States of Mississippi, Florida, Texas and Minnesota. R.J. Reynolds Tobacco Company recognised US$241 million of expense for payment obligations to the State of Florida for the ITG Brands, LLC acquired brands from the date of divestiture, June 12, 2015, as a result of an unfavourable judgment. In addition,
R.J. Reynolds Tobacco Company recognised US$264 million related to the resolution of claims against it in the States of Texas, Minnesota and Mississippi for payment obligations to those states for the ITG Brands, LLC acquired brands from the date of divestiture. Finally, R.J. Reynolds Tobacco Company settled certain related claims with Phillip Morris USA under the state settlement agreements in the states of Mississippi, Texas and Minnesota for US$8 million. Additional information related to the resolution of these claims is included in notes 6(d) and 31. During 2021, an additional US$17 million expense was recognised in relation to the final resolution of the Texas and Minnesota claims. In 2022, R.J. Reynolds Tobacco Company recognised US$37 million in additional expenses related to a settlement with Philip Morris USA resolving prior operating profit disputes under the MSA related to the ITG Brands, LLC acquired brands.
The BAT Group is subject to substantial payment obligations under the MSA and the state settlement agreements with the States of Mississippi, Florida, Texas and Minnesota (such settlement agreements, collectively State Settlement Agreements). Reynolds Group’s operating subsidiaries’ expenses and payments under the MSA and the State Settlement Agreements for 2022 amounted to US$2,951 million (2021: US$3,420 million; 2020: US$3,572 million) in respect of settlement expenses and US$3,129 million (2021: US$3,744 million; 2020: US$2,848 million) in respect of settlement cash payments.
(c) Marketing costs recognised as operating expenses
Certain marketing activities, such as discounts or allowances provided to customers, are required to be deducted from revenue as explained in note 1. Other marketing expenses, such as point of sale and promotional materials, media advertising and sponsorship, and consumer research, are reported as operating expenses and have been shown in the table above.
(d) Litigation costs
Litigation costs included within other operating expenses, and reported as an adjusting item, were £170 million (2021: £54 million; 2020: £87 million) predominantly related to litigation costs including Engle progeny with the remainder relating to immaterial other health related claims.
In 2022, the Group received £26 million of NPM credits related to a favourable resolution in respect of MSA litigation in the state of Illinois.
In 2020, also included as an adjusting item was a charge of £400 million incurred largely in respect of charges following the development in cases regarding payment obligations under the state settlement agreements with Florida, Texas, Minnesota and Mississippi for brands previously sold to a third party. The Group recognised a charge of £188 million in the period for a final judgment of a case in the Florida court. The Group continues to pursue indemnification remedies in a Delaware court for payments made to Florida as a result of this judgment, as explained in note 31. During 2020, the Group also recognised a provision of £212 million related to the settlement discussions with other manufacturers and the States of Texas, Minnesota and Mississippi for payment obligations related to these brands in prior years. During 2021, an additional £12 million expense was recognised in relation to the final resolution of the Texas and Minnesota claims.
(e) Research and development
Total research and development costs, including employee benefit costs and depreciation, are £323 million (2021: £304 million; 2020: £307 million).
(f) Loss on disposal of businesses
On 6 August 2021, the Group disposed of its Iranian subsidiary, B.A.T. Pars Company PJSC (BAT Pars). Included within other operating expenses, and recognised as an adjusting item in 2021, was a charge of £358 million comprising £272 million of foreign exchange reclassified from other comprehensive income (note 22(c)(i)) and an impairment charge and associated costs of £88 million. In 2022, as a result of the unwind of discounting on the deferred proceeds and a true-up on the completion of accounts, a credit of £6 million (2021: £2 million) was recognised.
(g) Tax disputes in Turkey, South Korea and Russia
The settlement of tax disputes in Turkey, South Korea and Russia were recognised as adjusting items.
Turkey
British American Tobacco Tutun Mamulleri Sanayi ve Ticaret Anonim Sirketi (BAT Tutun) was subject to a series of tax audits mainly on inventory movements for the years 2015, 2016 and 2019. In August 2021, BAT Tutun applied under the relevant tax amnesty law to settle its retrospective tax assessments. Based on the settlement through the tax amnesty procedure, in 2021, BAT Tutun agreed to pay £47 million in 18 instalments from 1 November 2021 until 31 July 2024. Of the £47 million, £30 million of excise and penalties were recognised and charged to operating profit, £11 million as interest in net finance costs (note 8(b)) and £6 million in taxation.
| | | | | | | | | | | | | | | | | | | | | | | |
| BAT Annual Report and Form 20-F 2022 | Strategic Report | | Governance Report | | Financial Statements | | Other Information |
| | | | | | | |
| | | | | | | |
| | | | | | | |
| | | | | | | |
|
South Korea
As explained in note 31, on 16 September 2021, Rothmans Far East B.V. Korea Branch Office received £4 million in relation to a VAT case. In line with the treatment of the associated expense incurred in 2016, the cash received was recognised as an adjusting item in 2021.
Russia
In August 2019, the Russian tax authority issued a final audit report to JSC British American Tobacco-SPb (BAT SpB) related to the application of legislation introduced in 2017 that prospectively limited the amount of production that could take place prior to excise tax increases, without being subject to higher excise tax rates. The final audit report sought to retrospectively apply the legislation to the years 2015 to 2017. BAT SpB submitted an appeal to the Federal Tax Services (FTS) objecting to the findings. The FTS accepted some of BAT SpB’s arguments and, on 27 January 2020, a final claim was issued by the FTS. As a consequence, the Group recognised a charge of £202 million.
In 2020, a credit of £40 million was recognised in relation to the 2019 charge discussed above, of which £14 million was offset in the adjusting items included in taxation (note 10(d)).
(h) Charges in respect of DOJ and OFAC investigations
From time to time, the Group investigates, and becomes aware of governmental authorities’ investigations into, allegations of misconduct, including alleged breaches of sanctions and allegations of corruption, against Group companies. The Group cooperates with the authorities’ investigations, where appropriate.
For example, the Group has been cooperating with investigations by the DOJ and OFAC into suspicions of breaches of sanctions. The Group is currently engaged in discussions with both agencies to find a resolution through settlement. A provision of £450 million has been recognised in 2022, however it cannot be excluded that the amount of any potential settlement with the DOJ and OFAC may vary from this amount.
(i) Charges in respect of Nigerian FCCPC case
In 2022, a charge of £79 million was recognised, related to the conclusion of the investigation into alleged violations of the Nigerian Competition and Consumer Protection Act and National Tobacco Control Act.
(j) Charges in respect of assets held-for-sale
On 11 March 2022, the Group announced the intention to transfer its Russian business in full compliance with international and local laws. The Group has two subsidiaries in Russia (BAT Russia), being JSC British American Tobacco-SPb and JSC International Tobacco Marketing Services (ITMS). In addition, the Group's subsidiary in Belarus, International Tobacco Marketing Services BY, will form part of the transaction. Upon completion, it is intended that the Group will no longer have a presence in Russia (or Belarus).
In accordance with IFRS 5, the assets and liabilities of these subsidiaries have been classified as held-for-sale at 31 December 2022 and presented as such on the balance sheet at an estimated fair value less costs to sell. An impairment charge of £554 million and associated costs of £58 million have been recognised in Other operating expenses as adjusting items. Refer to note 27(d)(i) for further details.
(k) Auditor’s remuneration
| | | | | | | | | | | |
| 2022 £m | 2021 £m | 2020 £m |
| Auditor’s remuneration | | | |
| Total expense for audit services pursuant to legislation: | | | |
–fees to KPMG LLP for Parent Company and Group audit | 9.4 | 8.7 | 8.7 |
–fees to KPMG LLP firms and associates for local statutory and Group
reporting audits | 11.0 | 9.5 | 9.9 |
| Total audit fees expense - KPMG LLP firms and associates | 20.4 | 18.2 | 18.6 |
| Audit fees expense to other firms | 0.2 | 0.2 | 0.2 |
| Total audit fees expense | 20.6 | 18.4 | 18.8 |
| Fees to KPMG LLP firms and associates for other services: | | | |
–audit-related assurance services | 7.1 | 8.0 | 8.5 |
–other assurance services | 0.9 | 0.3 | 0.5 |
–tax advisory services | — | — | — |
–tax compliance | — | — | — |
–audit of defined benefit schemes of the Company | 0.2 | 0.4 | 0.5 |
–other non-audit services | — | — | — |
| 8.2 | 8.7 | 9.5 |
The total auditor’s remuneration to KPMG firms and associates included above are £28.6 million (2021: £26.9 million; 2020: £28.1 million).
Under SEC regulations, the remuneration to KPMG firms and associates of £28.6 million in 2022 (2021: £26.9 million; 2020: £28.1 million) is required to be presented as follows: audit fees £27.5 million (2021: £26.2 million; 2020: £27.5 million), audit-related fees £0.2 million (2021: £0.4 million; 2020: £0.5 million), tax fees £nil (2021: £nil; 2020: £nil) and all other fees £0.9 million (2021: £0.3 million; 2020: £0.1 million). Audit-related fees are in respect of services provided to associated pension schemes. All other fees are in respect of other assurance services, including those provided over information derived from the financial information systems subject to audit or over the controls over those systems.
| | | | | | | | | | | | | | | | | | | | | | | |
| BAT Annual Report and Form 20-F 2022 | Strategic Report | | Governance Report | | Financial Statements | | Other Information |
| | | | | | | |
| | | | | | | |
| | | | | | | |
| Financial Statements | | | | | | | |
Notes on Accounts Continued |
7 Restructuring and integration costs
Restructuring costs reflect the costs incurred as a result of initiatives to improve the effectiveness and the efficiency of the Group as a globally integrated enterprise. These costs represent additional expenses incurred that are not related to the normal business and day-to-day activities. These initiatives include the costs associated with Quantum, being a review of the Group’s organisational structure announced in 2019 to simplify the business and create a more efficient, agile and focused company. In 2020 and 2022, these also included a review of the Group’s manufacturing operations. Restructuring initiatives (including as related to Quantum) have largely been announced to those that will be impacted, although the delivery of such programmes is expected to be substantially completed by the end of 2023.
The costs of the Group’s initiatives are included in profit from operations under the following headings:
| | | | | | | | | | | | | | |
| Notes | 2022 £m | 2021 £m | 2020 £m |
| Employee benefit costs | 3 | | 315 | | 160 | | 91 | |
| Depreciation, amortisation and impairment costs | 4 | | 220 | | (11) | | 151 | |
| Other operating income | 5 | (1) | | — | | — | |
| Other operating expenses | | 237 | | 1 | | 166 | |
| | 771 | | 150 | | 408 | |
The adjusting charge in 2022, 2021 and 2020 relates to the cost of employee packages in respect of Quantum and the ongoing costs associated with initiatives to improve the effectiveness and efficiency of the Group as a globally integrated organisation. In addition, Quantum initiatives in certain countries have resulted in the move to above market business models utilising local distributors as importers. As a consequence, with the cessation of a physical presence in these markets, foreign exchange previously recognised in Other Comprehensive Income for these countries has been reclassified to the income statement and reported within other operating expenses (note 22(c)(i)).
The restructuring costs in 2022 include costs related to factory closures or rationalisation in APME, Europe and the U.S. and costs recognised as part of the Group's announced exit from Egypt.
In 2021, included under the Quantum initiatives above is a charge of £27 million, including £4 million for foreign exchange reclassified from equity (note 22(c)(i)), related to the Group's withdrawal from Myanmar. In addition, as set out in note 4, goodwill in relation to Myanmar was impaired and charged to the income statement.
The depreciation, amortisation and impairment costs in 2021 included a credit of £25 million due to a partial reversal of previously estimated impairment following the revision of factory rationalisation initiatives.
Also, in 2021, included within other operating expenses is a credit of £59 million representing the release of an accrual on the successful conclusion of the dispute with former shareholders of Reynolds American, as explained in note 31.
The adjusting charges in 2020 are mainly in relation to Quantum and the downsizing and factory rationalisation activities in the Netherlands, Hungary, Russia and APME.
Also, in 2020, as a consequence of a reduction in volumes due to the significant increase in excise in Indonesia, the Group announced a restructuring programme which included the partial closure of the factory operations in Indonesia. As a result of this decision, a £69 million impairment was recognised in respect of machinery. This impairment charge related to some of the machinery in use as well as machinery held for future use which, following the significant changes in consumer preferences, is not expected to be brought in to manufacturing in the future.
| | | | | | | | | | | | | | | | | | | | | | | |
| BAT Annual Report and Form 20-F 2022 | Strategic Report | | Governance Report | | Financial Statements | | Other Information |
| | | | | | | |
| | | | | | | |
| | | | | | | |
| | | | | | | |
|
8 Net finance costs
(a) Net finance costs/(income)
| | | | | | | | | | | | | | | | | | | | |
| 2022 £m | 2021 £m | 2020 £m |
| Interest expense | 1,602 | | 1,436 | | 1,605 | |
| Interest expense on lease liabilities | 25 | | 24 | | 26 | |
| Facility fees | 21 | | 33 | | 23 | |
Interest and fair value related to early repurchase of bonds (note 8(b)) | — | | — | | 142 | |
Interest related to adjusting tax payables (note 8(b)) | 36 | | 31 | | 11 | |
| Fair value changes on derivative financial instruments and hedged items | (473) | | 252 | | (217) | |
Fair value change on other financial items (note 8(b)) | (2) | | 24 | | — | |
| Exchange differences | 524 | | (279) | | 205 | |
| Finance costs | 1,733 | | 1,521 | | 1,795 | |
| Interest under the effective interest method | (92) | | (35) | | (50) | |
| Finance income | (92) | | (35) | | (50) | |
| Net finance costs | 1,641 | | 1,486 | | 1,745 | |
The Group manages foreign exchange gains and losses and fair value changes on a net basis excluding adjusting items, which are explained in note 8(b). The derivatives that generate the fair value changes are explained in note 19.
Facility fees principally relate to the Group’s central banking facilities.
In October 2020, the Group completed a tender offer to repurchase sterling-equivalent £2,653 million of bonds, including £24 million
of accrued interest. Following this, in November 2020, the Group also completed a ‘make-whole’ bond redemption exercise of sterling-equivalent £462 million of bonds, including £6 million of accrued interest. Other costs directly associated with the early repurchase of bonds, including the premium paid, were treated as adjusting items, as detailed in note 8(b).
(b) Adjusting items included in net finance costs
Adjusting items are significant items in net finance costs which individually or, if of a similar type, in aggregate, are relevant to an understanding of the Group’s underlying financial performance.
The Group recognised interest on adjusting tax payables of £36 million (2021: £31 million; 2020: £11 million), which included interest of
£33 million (2021: £20 million; 2020: £21 million) in relation to the Franked Investment Income Group Litigation Order (FII GLO) (note 10(b)), £3 million in respect of a potential tax claw back due to the factory closure in Switzerland in 2022, an amnesty tax payment of £11 million in Turkey in 2021 and a net credit of £10 million in 2020 in respect of the excise dispute (note 6(g)) and withholding tax in Russia.
Included within £2 million of fair value changes on other financial items are:
(i) £15 million of foreign exchange arising on the revaluation of foreign currency balances held in Russia that no longer qualify for hedge accounting, due to the proposed transfer of the Group's Russian business as detailed in note 27(d)(i); and
(ii) In 2021, as part of the disposal of the Group’s operations in Iran (note 27(d)), a provision of £24 million was charged to net finance costs against non-current investments held at fair value due to the uncertainty around recovery of these funds. In 2022, part of these funds were recovered and therefore a reversal of the provision of £17 million is recognised in net finance costs.
In 2020, the Group incurred additional interest costs of £157 million and fair value gains of £15 million in relation to the early repurchase of bonds.
| | | | | | | | | | | | | | | | | | | | | | | |
| BAT Annual Report and Form 20-F 2022 | Strategic Report | | Governance Report | | Financial Statements | | Other Information |
| | | | | | | |
| | | | | | | |
| | | | | | | |
| Financial Statements | | | | | | | |
Notes on Accounts Continued |
9 Associates and joint ventures
| | | | | | | | | | | | | | | | | | | | | | | | | | |
| | 2022 | | | 2021 | | | 2020 |
| Total
£m | Group’s
share
£m | | Total
£m | Group's share
£m | | Total
£m | Group's share
£m |
| Revenue | 9,486 | | 2,675 | | | 7,668 | | 2,164 | | | 7,001 | | 1,983 | |
| Profit from operations | 1,971 | | 622 | | | 1,911 | | 567 | | | 2,006 | | 591 | |
| Net finance costs | 21 | | 4 | | | 13 | | 2 | | | (6) | | (2) | |
Profit on ordinary activities
before taxation | 1,992 | | 626 | | | 1,924 | | 569 | | | 2,000 | | 589 | |
| Taxation on ordinary activities | (595) | | (176) | | | (499) | | (147) | | | (421) | | (125) | |
| Profit on ordinary activities after taxation | 1,397 | | 450 | | | 1,425 | | 422 | | | 1,579 | | 464 | |
| Non-controlling interests | (27) | | (8) | | | (22) | | (7) | | | (30) | | (9) | |
| Post-tax results of associates and joint ventures | 1,370 | | 442 | | | 1,403 | | 415 | | | 1,549 | | 455 | |
Enumerated below are movements that have impacted the post-tax results of associates and joint ventures in 2022, 2021 and 2020.
The amounts below were reported as adjusting items under the share of profit from associates in the income statement.
(a) Adjusting items
In 2022, the Group’s interest in ITC Ltd. (ITC) decreased from 29.38% to 29.19% (2021: 29.42% to 29.38%; 2020: 29.46% to 29.42%) as a result of ITC issuing ordinary shares under the ITC Employee Share Option Scheme. The issue of these shares and change in the Group’s share of ITC resulted in a loss of £3 million (2021: £6 million gain; 2020: £17 million gain), which is treated as a deemed partial disposal and included in the income statement.
Also, in the first half of 2022, the Group impaired the investment in Organigram by £59 million (net of tax), driven by the decrease in the company’s share price.
In addition to this, the Group incurred a £2 million charge (2021: £2 million; 2020: £nil) in relation to the amortisation of acquired intangibles associated with the acquisition of Organigram in March 2021, as described in note 14.
During 2022, the Group decided to cease business activities altogether in Yemen, due to the challenging operating environment in the country. This led to the full impairment of the investment in the Group's remaining associate in Yemen, United Industries Company Limited, with a charge of £18 million to the income statement.
In 2021, the Group had already impaired the investment in Kamaran Industry & Investment Company, the Group’s other associate in Yemen. This resulted in a charge of £18 million to the income statement.
As detailed in note 14, also in 2021, as a result of the liquidation of Tisak d.d., the Group reclassified the foreign exchange previously recognised in other comprehensive income to the income statement. This resulted in a credit of £2 million to the income statement.
In 2020, ITC recognised a charge in respect of the cost of leaf tobacco stocks destroyed in a third-party warehouse fire, the Group’s share of which was £4 million.
(b) Other financial information
The Group’s share of the results of associates and joint ventures is shown in the table below.
| | | | | | | | | | | |
| 2022 | 2021 | 2020 |
| Group’s
share
£m | Group’s
share
£m | Group’s
share
£m |
| Profit on ordinary activities after taxation | | | |
| – attributable to owners of the parent | 442 | | 415 | | 455 | |
| Other comprehensive income: | | | |
| Items that may be reclassified to profit and loss | 6 | | (17) | | (98) | |
| Items that will not be reclassified to profit and loss | 19 | | 14 | | (34) | |
| Total comprehensive income | 467 | | 412 | | 323 | |
| | | | | | | | | | | | | | | | | | | | | | | |
| BAT Annual Report and Form 20-F 2022 | Strategic Report | | Governance Report | | Financial Statements | | Other Information |
| | | | | | | |
| | | | | | | |
| | | | | | | |
| | | | | | | |
|
Summarised financial information of the Group’s associates and joint ventures is shown below.
| | | | | | | | | | | |
| | | 2022 |
| ITC
£m | Others
£m | Total
£m |
| Revenue | 7,126 | | 2,360 | | 9,486 | |
| Profit on ordinary activities before taxation | 2,395 | | (403) | | 1,992 | |
| Post-tax results of associates and joint ventures | 1,761 | | (391) | | 1,370 | |
| Other comprehensive income | 56 | | 32 | | 88 | |
| Total comprehensive income | 1,817 | | (359) | | 1,458 | |
| | | | | | | | | | | |
| | | 2021 |
| ITC
£m | Others
£m | Total
£m |
| Revenue | 5,312 | | 2,356 | | 7,668 | |
| Profit on ordinary activities before taxation | 1,931 | | (7) | | 1,924 | |
| Post-tax results of associates and joint ventures | 1,427 | | (24) | | 1,403 | |
| Other comprehensive income | (11) | | — | | (11) | |
| Total comprehensive income | 1,416 | | (24) | | 1,392 | |
| | | | | | | | | | | |
| | | 2020 |
| ITC
£m | Others
£m | Total
£m |
| Revenue | 4,892 | | 2,109 | | 7,001 | |
| Profit on ordinary activities before taxation | 1,930 | | 70 | | 2,000 | |
| Post-tax results of associates and joint ventures | 1,495 | | 54 | | 1,549 | |
| Other comprehensive income | (450) | | — | | (450) | |
| Total comprehensive income | 1,045 | | 54 | | 1,099 | |
| | | | | | | | | | | | | | | | | | | | | | | |
| BAT Annual Report and Form 20-F 2022 | Strategic Report | | Governance Report | | Financial Statements | | Other Information |
| | | | | | | |
| | | | | | | |
| | | | | | | |
| Financial Statements | | | | | | | |
Notes on Accounts Continued |
10 Taxation on ordinary activities
(a) Summary of taxation on ordinary activities
| | | | | | | | | | | |
| 2022 £m | 2021 £m | 2020 £m |
| UK corporation tax | (3) | | (25) | | 38 | |
| Comprising: | | | |
| – current year tax expense | 2 | | 1 | | 38 | |
| – adjustments in respect of prior periods | (5) | | (26) | | — | |
| Overseas tax | 2,721 | | 2,401 | | 2,387 | |
| Comprising: | | | |
| – current year tax expense | 2,675 | | 2,418 | | 2,369 | |
| – adjustments in respect of prior periods | 46 | | (17) | | 18 | |
| Total current tax | 2,718 | | 2,376 | | 2,425 | |
| Deferred tax | (240) | | (187) | | (317) | |
| Comprising: | | | |
| – deferred tax relating to origination and reversal of temporary differences | (174) | | (29) | | (184) | |
| – deferred tax relating to changes in tax rates | (66) | | (158) | | (133) | |
| 2,478 | | 2,189 | | 2,108 | |
(b) Franked Investment Income Group Litigation Order
The Group is the principal test claimant in an action in the United Kingdom against HM Revenue and Customs (HMRC) in the Franked Investment Income Group Litigation Order (FII GLO). There were 17 corporate groups in the FII GLO as at 31 December 2022. The case concerns the treatment for UK corporate tax purposes of profits earned overseas and distributed to the UK.
The original claim was filed in 2003. The trial of the claim was split broadly into issues of liability and quantification. The main liability issues were heard by the High Court, Court of Appeal and Supreme Court in the UK and the European Court of Justice in the period to November 2012. The detailed technical issues of the quantification mechanics of the claim were heard by the High Court during May and June 2014 and the judgment handed down on 18 December 2014. The High Court determined that in respect of issues concerning the calculation of unlawfully charged corporation tax and advance corporation tax, the law of restitution including the defence on change of position and questions concerning the calculation of overpaid interest, the approach of the Group was broadly preferred. The conclusion reached by the High Court would, if upheld, produce an estimated receivable of £1.2 billion for the Group. Appeals on a majority of the issues were made to the Court of Appeal, which heard the arguments in June 2016. The Court of Appeal determined in November 2016 on the majority of issues that the conclusion reached by the High Court should be upheld. The Supreme Court gave permission for a number of issues to be appealed in two separate hearings. The first, in February 2020, concerned the time limit for bringing claims. HMRC sought to challenge existing case law. In November 2020, the Supreme Court handed down its judgment. The Supreme Court agreed to overturn existing case law partially but introduced a new test for determining whether claims of this type are in time. The case has been remitted to the High Court to apply that new test to the facts. The second hearing was heard in December 2020 and concerned issues relating to the type of claims BAT is entitled to bring. The judgment from the second hearing was handed down in July 2021. Applying that judgment reduces the value of the FII claim to approximately £0.3 billion, mainly as the result of the application of simple interest and the limitation to claims for advance corporation tax offset against lawful corporation tax charges, which is subject to the determination of the timing issue by the High Court and any subsequent appeal.
During 2015, HMRC paid to the Group a gross amount of £1,224 million in two separate payments. The payments made by HMRC have been made without any admission of liability and are subject to refund were HMRC to succeed on appeal. The second payment in November 2015 followed the introduction of a new 45% tax on the interest component of restitution claims against HMRC. HMRC held back £261 million from the second payment contending that it represents the new 45% tax on that payment, leading to total cash received by the Group of £963 million. Actions challenging the legality of the withholding of the 45% tax have been lodged by the Group. The First Tier Tribunal found in favour of HMRC in July 2017 and the Group’s appeal to the Upper Tribunal was heard in July 2018 and judgment has not yet been handed down.
The net £0.9 billion held by the Group is higher than the current value of the claim referred to above. Due to the uncertainty of the amounts and eventual outcome, the Group has not recognised any impact in the Income Statement in the current or prior period. The receipt, net of the deduction by HMRC, is held within trade and other payables as disclosed in note 25. Any future recognition as income will be treated as an adjusting item, due to the size of the amount, with interest of £33 million for the 12 months to 31 December 2022 (2021: £20 million; 2020: £21 million) accruing on the balance, which was also treated as an adjusting item.
The final resolution of all issues in the litigation is likely to take a number of years. The Group made an interim repayment to HMRC of £50 million in 2022 and intends to make further interim repayments in future periods.
| | | | | | | | | | | | | | | | | | | | | | | |
| BAT Annual Report and Form 20-F 2022 | Strategic Report | | Governance Report | | Financial Statements | | Other Information |
| | | | | | | |
| | | | | | | |
| | | | | | | |
| | | | | | | |
|
(c) Factors affecting the taxation charge
The taxation charge differs from the standard rate of corporation tax in the UK of 19% for 2022, 2021 and 2020. The major causes of this difference are listed below;
| | | | | | | | | | | | | | | | | | | | | | | | | | |
| 2022 | | 2021 | | 2020 |
| £m | % | | £m | % | | £m | % |
| Profit before tax | 9,324 | | | | 9,163 | | | | 8,672 | | |
Less: share of post-tax results of associates and joint ventures (see note 9) | (442) | | | | (415) | | | | (455) | | |
| 8,882 | | | | 8,748 | | | | 8,217 | | |
Tax at 19% (2021: 19% and 2020: 19%) on the above | 1,688 | | 19.0 | | | 1,662 | | 19.0 | | | 1,561 | | 19.0 | |
| Factors affecting the tax rate: | | | | | | | | |
| Tax at standard rates other than UK corporation tax rate | 397 | | 4.5 | | | 319 | | 3.6 | | | 368 | | 4.5 | |
| Other national tax charges | 244 | | 2.7 | | | 184 | | 2.1 | | | 142 | | 1.7 | |
| Permanent differences | 83 | | 0.9 | | | 87 | | 1.0 | | | 20 | | 0.3 | |
| Overseas withholding taxes | 156 | | 1.8 | | | 189 | | 2.2 | | | 155 | | 1.9 | |
| Double taxation relief on UK profits | (26) | | (0.3) | | | (23) | | (0.3) | | | (22) | | (0.3) | |
| Unutilised/(utilised) tax losses | 12 | | 0.1 | | | (10) | | (0.1) | | | 5 | | 0.1 | |
| Adjustments in respect of prior periods | 41 | | 0.5 | | | (43) | | (0.5) | | | 18 | | 0.2 | |
| Deferred tax relating to changes in tax rates | (66) | | (0.7) | | | (158) | | (1.8) | | | (133) | | (1.6) | |
| Additional net deferred tax (credits)/charges | (51) | | (0.6) | | | (18) | | (0.2) | | | (6) | | (0.1) | |
| 2,478 | | 27.9 | | | 2,189 | | 25.0 | | | 2,108 | | 25.7 | |
(d) Adjusting items included in taxation
In 2022, adjusting items in taxation included a net credit of £27 million mainly relating to the revaluation of deferred tax liabilities arising on trademarks recognised in the Reynolds American acquisition in 2017 due to changes in U.S. state tax rates and a potential clawback of tax reliefs arising on the closure of the Group's factory in Switzerland.
In 2021, adjusting items in taxation included a net credit of £91 million mainly relating to the revaluation of deferred tax liabilities arising on trademarks recognised in the Reynolds American acquisition in 2017 due to changes in U.S. state tax rates.
In 2020, adjusting items in taxation included a net credit of £35 million mainly relating to the release of a provision regarding the application of overseas withholding tax, the revaluation of deferred tax liabilities arising on trademarks recognised in the Reynolds American acquisition in 2017 due to changes in U.S. state tax rates and the excise dispute in Russia (note 6(g)).
(e) Tax on adjusting items
In addition, the tax on adjusting items, separated between the different categories, as per note 11, amounted to £176 million (2021: £119 million; 2020: £287 million). The adjustment to the adjusted earnings per share (note 11) also includes £5 million (2021: £6 million; 2020: £8 million) in respect of the non-controlling interests’ share of the adjusting items net of tax.
(f) Tax on items recognised directly in other comprehensive income
| | | | | | | | | | | |
| 2022 £m | 2021 £m | 2020 £m |
| Current tax | (6) | | (4) | | (5) | |
| Deferred tax | (106) | | (110) | | 23 | |
| (Charged)/credited to other comprehensive income | (112) | | (114) | | 18 | |
(g) Tax on items recognised directly in equity
In relation to the perpetual hybrid bonds issued on 27 September 2021 (note 22(d)), tax relief of £11 million (2021: £5 million) has been recognised, principally in relation to the coupon incurred.
| | | | | | | | | | | | | | | | | | | | | | | |
| BAT Annual Report and Form 20-F 2022 | Strategic Report | | Governance Report | | Financial Statements | | Other Information |
| | | | | | | |
| | | | | | | |
| | | | | | | |
| Financial Statements | | | | | | | |
Notes on Accounts Continued |
11 Earnings per share
Earnings used in the basic, diluted and headline earnings per share calculation represent the profit attributable to the ordinary equity shareholders after deducting amounts representing the coupon on perpetual hybrid bonds on a pro-rata basis regardless of whether coupons have been deferred or paid in the period. Below is a reconciliation of the earnings used to calculate earnings per share:
| | | | | | | | | | | |
| 2022 £m | 2021 £m | 2020 £m |
| Earnings attributable to owners of the parent | 6,666 | | 6,801 | | 6,400 | |
| Coupon on perpetual hybrid bonds | (60) | | (15) | | — | |
| Tax on coupon on perpetual hybrid bonds | 11 | | 3 | | — | |
| Earnings | 6,617 | | 6,789 | | 6,400 | |
Below is a reconciliation from basic to diluted earnings per share:
| | | | | | | | | | | | | | | | | | | | | | | | | | | | | | | | | | | |
| | | 2022 | | | | 2021 | | | | 2020 |
| Earnings
£m | Weighted
average
number of
shares
m | Earnings
per share
pence | | Earnings
£m | Weighted
average
number of
shares
m | Earnings
per share
pence | | Earnings
£m | Weighted
average
number of
shares
m | Earnings
per share
pence |
Basic earnings per share (ordinary shares of 25p each) | 6,617 | | 2,256 | | 293.3 | | | 6,789 | | 2,287 | | 296.9 | | | 6,400 | | 2,286 | | 280.0 | |
| Share options | — | | 11 | | (1.4) | | | — | | 10 | | (1.3) | | | — | | 9 | | (1.1) | |
| Diluted earnings per share | 6,617 | | 2,267 | | 291.9 | | | 6,789 | | 2,297 | | 295.6 | | | 6,400 | | 2,295 | | 278.9 | |
| | | | | | | | | | | | | | | | | | | | | | | |
| BAT Annual Report and Form 20-F 2022 | Strategic Report | | Governance Report | | Financial Statements | | Other Information |
| | | | | | | |
| | | | | | | |
| | | | | | | |
| | | | | | | |
|
Adjusted earnings per share calculation
Earnings have been affected by a number of adjusting items, which are described in notes 3 to 10. Adjusting items are significant items in the profit from operations, net finance costs, taxation and the Group’s share of the post-tax results of associates and joint ventures which individually or, if of a similar type, in aggregate, are relevant to an understanding of the Group’s underlying financial performance. The Group believes that these items are useful to users of the Group financial statements in helping them to understand the underlying business performance. To illustrate the impact of these items, an adjusted earnings per share calculation is shown below.
| | | | | | | | | | | | | | | | | | | | | | | | | | | | | |
| | | | | | | | | Basic |
| | 2022 | | 2021 | | 2020 |
| Notes | Earnings
£m | Earnings
per share
pence | | Earnings
£m | Earnings
per share
pence | | Earnings
£m | Earnings
per share
pence |
| Basic earnings per share | | 6,617 | | 293.3 | | | 6,789 | | 296.9 | | | 6,400 | | 280.0 | |
| Effect of amortisation and impairment of goodwill, trademarks and similar intangibles | 4 | 285 | | 12.6 | | | 363 | | 15.9 | | | 548 | | 24.0 | |
| Tax and non-controlling interests on amortisation and impairment of goodwill, trademarks and similar intangibles | 10(e) | (67) | | (3.0) | | | (71) | | (3.1) | | | (77) | | (3.4) | |
| Effect of Brazil VAT case | 5,6(a) | (460) | | (20.4) | | | — | | — | | | — | | — | |
| Tax on Brazil VAT case | 10(e) | 72 | | 3.2 | | | — | | — | | | — | | — | |
| Effect of disposal of subsidiaries | 6(f) | (6) | | (0.3) | | | 358 | | 15.7 | | | — | | — | |
| Effect of excise and VAT disputes | 6(g) | — | | — | | | 26 | | 1.1 | | | (40) | | (1.7) | |
| Tax on excise and VAT disputes | 10(d) | — | | — | | | (3) | | (0.1) | | | 14 | | 0.6 | |
| Effect of charges in respect of DOJ and OFAC investigations | 6(h) | 450 | | 19.9 | | | — | | — | | | — | | — | |
| Effect of charges in respect of Nigerian FCCPC case | 6(i) | 79 | | 3.5 | | | — | | — | | | — | | — | |
| Effect of impairment on held-for-sale assets and associated costs | 6(j) | 612 | | 27.2 | | | — | | — | | | — | | — | |
| Tax effect of impairment of assets held-for-sale and associated costs | 10(e) | (10) | | (0.4) | | | — | | — | | | — | | — | |
| Effect of restructuring and integration costs | 7 | 771 | | 34.2 | | | 150 | | 6.5 | | | 408 | | 17.8 | |
| Tax and non-controlling interests on restructuring and integration costs | 10(d)(e) | (116) | | (5.1) | | | (39) | | (1.7) | | | (64) | | (2.8) | |
| Other adjusting items | 3,6(d) | 154 | | 6.8 | | | 19 | | 0.8 | | | 487 | | 21.2 | |
| Tax effect on other adjusting items | 10(e) | (37) | | (1.6) | | | (5) | | (0.2) | | | (104) | | (4.5) | |
| Effect of early repurchase of bonds | 8(b) | — | | — | | | — | | — | | | 142 | | 6.2 | |
| Tax effect of early repurchase of bonds | 10(e) | — | | — | | | — | | — | | | (32) | | (1.4) | |
| Effect of interest on FII GLO settlement and other | 8(b) | 34 | | 1.5 | | | 55 | | 2.4 | | | 11 | | 0.5 | |
| Tax effect of interest on FII GLO settlement and other | 10(e) | (6) | | (0.3) | | | — | | — | | | (4) | | (0.2) | |
| Effect of associates' adjusting items net of tax | 9(a) | 92 | | 4.1 | | | 12 | | 0.5 | | | (13) | | (0.6) | |
| Deferred tax relating to changes in tax rates | 10(d) | (44) | | (2.0) | | | (98) | | (4.3) | | | (21) | | (0.9) | |
| Effect of retrospective guidance on WHT | 10(d) | — | | — | | | — | | — | | | (42) | | (1.8) | |
| Adjusted earnings per share (basic) | | 8,420 | | 373.2 | | | 7,556 | | 330.4 | | | 7,613 | | 333.0 | |
| | | | | | | | | | | | | | | | | | | | | | | |
| BAT Annual Report and Form 20-F 2022 | Strategic Report | | Governance Report | | Financial Statements | | Other Information |
| | | | | | | |
| | | | | | | |
| | | | | | | |
| Financial Statements | | | | | | | |
Notes on Accounts Continued |
| | | | | | | | | | | | | | | | | | | | | | | | | | | | | |
| | | | | | | | | Diluted |
| | 2022 | | 2021 | | 2020 |
| Notes | Earnings
£m | Earnings
per share
pence | | Earnings
£m | Earnings
per share
pence | | Earnings
£m | Earnings
per share
pence |
| Diluted earnings per share | | 6,617 | | 291.9 | | | 6,789 | | 295.6 | | | 6,400 | | 278.9 | |
| Effect of amortisation and impairment of goodwill, trademarks and similar intangibles | 4 | 285 | | 12.6 | | | 363 | | 15.8 | | | 548 | | 23.9 | |
| Tax and non-controlling interests on amortisation and impairment of goodwill, trademarks and similar intangibles | 10(e) | (67) | | (3.0) | | | (71) | | (3.1) | | | (77) | | (3.4) | |
| Effect of Brazil VAT case | 5,6(a) | (460) | | (20.3) | | | — | | — | | | — | | — | |
| Tax on Brazil VAT case | 10(e) | 72 | | 3.2 | | | — | | — | | | — | | — | |
| Effect of disposal of subsidiaries | 6(f) | (6) | | (0.3) | | | 358 | | 15.6 | | | — | | — | |
| Effect of excise and VAT disputes | 6(g) | — | | — | | | 26 | | 1.1 | | | (40) | | (1.7) | |
| Tax on excise and VAT disputes | 10(d) | — | | — | | | (3) | | (0.1) | | | 14 | | 0.6 | |
| Effect of charges in respect of DOJ and OFAC investigations | 6(h) | 450 | | 19.9 | | | — | | — | | | — | | — | |
| Effect of charges in respect of Nigerian FCCPC case | 6(i) | 79 | | 3.5 | | | — | | — | | | — | | — | |
| Effect of impairment on held-for-sale assets and associated costs | 6(j) | 612 | | 26.8 | | | — | | — | | | — | | — | |
| Tax effect of impairment of assets held-for-sale and associated costs | 10(e) | (10) | | (0.4) | | | — | | — | | | — | | — | |
| Effect of restructuring and integration costs | 7 | 771 | | 34.0 | | | 150 | | 6.6 | | | 408 | | 17.7 | |
| Tax and non-controlling interests on restructuring and integration costs | 10(d)(e) | (116) | | (5.1) | | | (39) | | (1.7) | | | (64) | | (2.8) | |
| Other adjusting items | 3,6(d) | 154 | | 6.8 | | | 19 | | 0.8 | | | 487 | | 21.2 | |
| Tax effect on other adjusting items | 10(e) | (37) | | (1.6) | | | (5) | | (0.2) | | | (104) | | (4.5) | |
| Effect of early repurchase of bonds | 8(b) | — | | — | | | — | | — | | | 142 | | 6.2 | |
| Tax effect of early repurchase of bonds | 10(e) | — | | — | | | — | | — | | | (32) | | (1.4) | |
| Effect of interest on FII GLO settlement and other | 8(b) | 34 | | 1.5 | | | 55 | | 2.4 | | | 11 | | 0.5 | |
| Tax effect of interest on FII GLO settlement and other | 10(e) | (6) | | (0.3) | | | — | | — | | | (4) | | (0.2) | |
| Effect of associates' adjusting items net of tax | 9(a) | 92 | | 4.1 | | | 12 | | 0.5 | | | (13) | | (0.6) | |
| Deferred tax relating to changes in tax rates | 10(d) | (44) | | (1.9) | | | (98) | | (4.3) | | | (21) | | (0.9) | |
| Effect of retrospective guidance on WHT | 10(d) | — | | — | | | — | | — | | | (42) | | (1.8) | |
| Adjusted earnings per share (diluted) | | 8,420 | | 371.4 | | 7,556 | | 329.0 | | | 7,613 | | 331.7 |
| | | | | | | | | | | | | | | | | | | | | | | |
| BAT Annual Report and Form 20-F 2022 | Strategic Report | | Governance Report | | Financial Statements | | Other Information |
| | | | | | | |
| | | | | | | |
| | | | | | | |
| | | | | | | |
|
Headline earnings per share as required by the JSE Limited
The presentation of headline earnings per share, as an alternative measure of earnings per share, is mandated under the JSE Listing Requirements. It is calculated in accordance with Circular 1/2021 ‘Headline Earnings’, as issued by the South African Institute of
Chartered Accountants.
| | | | | | | | | | | | | | | | | | | | | | | | | | |
| | | | | | | | Basic |
| 2022 | | 2021 | | 2020 |
| Earnings
£m | Earnings
per share
pence | | Earnings
£m | Earnings
per share
pence | | Earnings
£m | Earnings
per share
pence |
| Basic earnings per share | 6,617 | | 293.3 | | 6,789 | | 296.9 | | 6,400 | | 280.0 |
| Effect of impairment of intangibles, property, plant and equipment, associates and assets held-for-sale | 429 | | 19.0 | | 138 | | 6.0 | | 465 | | 20.3 |
| Tax and non-controlling interests on intangibles, property, plant and equipment, associates and assets held-for-sale | (77) | | (3.4) | | (42) | | (1.8) | | (74) | | (3.3) |
| Effect of gains on disposal of property, plant and equipment, trademarks, held-for-sale assets, partial/full termination of IFRS 16 leases, and sale and leaseback | (21) | | (0.9) | | (10) | | (0.4) | | (26) | | (1.1) |
| Tax and non-controlling interests on disposal of property, plant and equipment, held-for-sale assets, partial/full termination of IFRS 16 leases, and sale and leaseback | 5 | | 0.2 | | 2 | | 0.1 | | 8 | | 0.3 |
| Effect of impairment of subsidiaries | 548 | | 24.2 | | 83 | | 3.6 | | — | | — |
| Tax on impairment of subsidiaries | (10) | | (0.4) | | — | | — | | — | | — |
| Effect of foreign exchange reclassification from reserves to the income statement | | | | | | | | |
| – Subsidiaries | 6 | | 0.3 | | 291 | | 12.7 | | — | | — |
| – Associates | (1) | | — | | (2) | | (0.1) | | — | | — |
| Issue of shares and change in shareholding in associate | 3 | | 0.1 | | (6) | | (0.3) | | (17) | | (0.7) |
| Headline earnings per share (basic) | 7,499 | | 332.4 | | 7,243 | | 316.7 | | 6,756 | | 295.5 |
| | | | | | | | | | | | | | | | | | | | | | | | | | |
| | | | | | | | Diluted |
| 2022 | | 2021 | | 2020 |
| Earnings
£m | Earnings
per share
pence | | Earnings
£m | Earnings
per share
pence | | Earnings
£m | Earnings
per share
pence |
| Diluted earnings per share | 6,617 | | 291.9 | | 6,789 | | 295.6 | | 6,400 | | 278.9 |
| Effect of impairment of intangibles, property, plant and equipment, associates and assets held-for-sale | 429 | | 18.9 | | 138 | | 6.0 | | 465 | | 20.3 |
| Tax and non-controlling interests on intangibles, property, plant and equipment, associates and assets held-for-sale | (77) | | (3.4) | | (42) | | (1.8) | | (74) | | (3.3) |
| Effect of gains on disposal of property, plant and equipment, trademarks, held-for-sale assets, partial/full termination of IFRS 16 leases, and sale and leaseback | (21) | | (0.9) | | (10) | | (0.4) | | (26) | | (1.1) |
| Tax and non-controlling interests on disposal of property, plant and equipment, held-for-sale assets, partial/full termination of IFRS 16 leases, and sale and leaseback | 5 | | 0.2 | | 2 | | 0.1 | | 8 | | 0.3 |
| Effect of impairment of subsidiaries | 548 | | 24.1 | | 83 | | 3.6 | | — | | — |
| Tax on impairment of subsidiaries | (10) | | (0.4) | | — | | — | | — | | — |
| Effect of foreign exchange reclassification from reserves to the income statement | | | | | | | | |
| – Subsidiaries | 6 | | 0.3 | | 291 | | 12.6 | | — | | — |
| – Associates | (1) | | — | | (2) | | (0.1) | | — | | — |
| Issue of shares and change in shareholding in associate | 3 | | 0.1 | | (6) | | (0.3) | | (17) | | (0.7) |
| Headline earnings per share (diluted) | 7,499 | | 330.8 | | 7,243 | | 315.3 | | 6,756 | | 294.4 |
| | | | | | | | | | | | | | | | | | | | | | | |
| BAT Annual Report and Form 20-F 2022 | Strategic Report | | Governance Report | | Financial Statements | | Other Information |
| | | | | | | |
| | | | | | | |
| | | | | | | |
| Financial Statements | | | | | | | |
Notes on Accounts Continued |
12 Intangible assets
(a) Overview of intangible assets
| | | | | | | | | | | | | | | | | |
| | | | | 2022 |
| Goodwill
£m | Computer
software
£m | Trademarks
and similar intangibles
£m | Assets in
the course of
development
£m | Total
£m |
| 1 January | | | | | |
| Cost | 43,194 | 1,266 | 74,227 | 156 | 118,843 |
| Accumulated amortisation and impairment | | (858) | (2,360) | | (3,218) |
| Net book value at 1 January | 43,194 | 408 | 71,867 | 156 | 115,625 |
| Differences on exchange | 4,762 | 5 | 9,033 | 2 | 13,802 |
| Additions | | | | | |
| – internal development | — | — | — | 37 | 37 |
| | | | | |
| – separately acquired | — | — | — | 85 | 85 |
| Reallocations | — | 96 | 29 | (125) | — |
| Amortisation charge | — | (128) | (309) | — | (437) |
| Impairment | — | (3) | (10) | (11) | (24) |
| Disposals | — | — | (7) | — | (7) |
| Held for sale | — | (4) | — | (2) | (6) |
| 31 December | | | | | |
| Cost | 47,956 | 1,379 | 83,454 | 153 | 132,942 |
| Accumulated amortisation and impairment | | (1,005) | (2,851) | (11) | (3,867) |
| Net book value at 31 December | 47,956 | 374 | 80,603 | 142 | 129,075 |
| | | | | | | | | | | | | | | | | |
| | | | | 2021 |
| Goodwill
£m | Computer
software
£m | Trademarks
and similar intangibles
£m | Assets in
the course of
development
£m | Total
£m |
| 1 January | | | | | |
| Cost | 43,319 | | 1,307 | | 73,598 | | 120 | | 118,344 | |
| Accumulated amortisation and impairment | | (885) | | (2,116) | | | (3,001) | |
| Net book value at 1 January | 43,319 | | 422 | | 71,482 | | 120 | | 115,343 | |
| Differences on exchange | (68) | | (3) | | 640 | | — | | 569 | |
| Additions | | | | | |
| – internal development | — | | — | | — | | 139 | | 139 | |
| | | | | |
| – separately acquired | — | | — | | 60 | | 33 | | 93 | |
| Reallocations | — | | 118 | | 18 | | (136) | | — | |
| Amortisation charge | — | | (116) | | (319) | | — | | (435) | |
| Impairment | (57) | | (13) | | (14) | | — | | (84) | |
| 31 December | | | | | |
| Cost | 43,194 | | 1,266 | | 74,227 | | 156 | | 118,843 | |
| Accumulated amortisation and impairment | | (858) | | (2,360) | | | (3,218) | |
| Net book value at 31 December | 43,194 | | 408 | | 71,867 | | 156 | | 115,625 | |
(b) Goodwill
Goodwill of £47,956 million (2021: £43,194 million) is included in intangible assets in the balance sheet of which the following are the significant acquisitions: Reynolds American £37,181 million (2021: £33,021 million); Rothmans Group £4,704 million (2021: £4,408 million); Imperial Tobacco Canada £2,460 million (2021: £2,345 million); ETI (Italy) £1,461 million (2021: £1,384 million) and ST (principally Scandinavia) £1,102 million (2021: £1,043 million). The principal allocations of goodwill in the Rothmans’ acquisition are to the cash-generating units of Europe and South Africa, with the remainder mainly relating to operations in APME.
During 2022, there was no goodwill impairment (2021: £57 million) as explained in note 12(e)(iv) below.
| | | | | | | | | | | | | | | | | | | | | | | |
| BAT Annual Report and Form 20-F 2022 | Strategic Report | | Governance Report | | Financial Statements | | Other Information |
| | | | | | | |
| | | | | | | |
| | | | | | | |
| | | | | | | |
|
(c) Trademarks and similar intangibles
Trademarks and similar intangibles with indefinite lives
The net book value of trademarks and similar intangibles with indefinite lives is £78,228 million (2021: £69,475 million) and relates to the acquisition of Reynolds American. The trademarks acquired, including Newport, Camel, Natural American Spirit, Grizzly and Pall Mall, all of which are part of the Group’s Strategic Portfolio of key brands, form the core focus of the U.S. business and receive significant support in the form of dedicated internal resources, forecasting and, where appropriate, marketing investment. These trademarks have significant market share and positive cashflow growth expectations. There are no regulatory or contractual restrictions on the use of the trademarks, and there are no plans by management to significantly redirect resources elsewhere. Consequently, in the view of management, these trademarks do not have a foreseeable and definite end to their ability to generate future cash flows and hence are not amortised.
Trademarks and similar intangibles with definite lives
The majority of trademarks and similar intangibles with definite lives relate to trademarks acquired in previous years. These trademarks are amortised over their expected useful lives, which do not exceed 20 years. Included in the net book value of trademarks and similar intangibles are trademarks relating to the acquisition of Reynolds American £2,071 million (2021: £2,038 million).
(d) Computer software and assets in the course of development
Included in computer software and assets in the course of development are internally developed assets with a carrying value of £423 million (2021: £517 million). The costs of internally developed assets include capitalised expenses of employees working full time on software development projects, third-party consultants and software licence fees from third-party suppliers.
The Group has £1 million of future contractual commitments (2021: £2 million) related to intangible assets.
(e) Impairment testing
(i) Overview
a. Estimation uncertainty
As described in note 1, the critical accounting estimates used in the preparation of the consolidated financial statements include the review of asset values, especially indefinite life assets such as goodwill and certain trademarks and similar intangibles.
There is significant judgement with regard to assumptions and estimates involved in the forecasting of future cash flows, which form the basis of the assessment of the recoverability of these assets, with the effect that the value-in-use of calculations incorporate estimation uncertainty, particularly for certain assets held in relation to the Canadian and U.S. markets.
b. Impact of climate change
The impact of climate change on the future cash flows has been considered for scenarios analysed in terms of future access to tobacco and nicotine. The climate change scenario analyses – conducted in line with TCFD recommendations – undertaken this year did not identify any material financial impact.
(ii) Impairment testing – Trademarks and similar intangibles with indefinite lives (brands)
The trademarks and similar intangibles with indefinite lives (brands) have been tested for impairment on a value-in-use basis. The value-in-use calculations use cash flows based on detailed brand budgets prepared by management using projected sales volumes and pricing (net revenue) and projected brand profitability covering a five-year horizon and, thereafter, grown into perpetuity. Corporate costs are allocated to the brand budgets based on either specific allocations, where appropriate, or based on revenue. The discount rates and long-term growth rates applied to the brand value-in-use calculations have been determined by local management based on experience, specific market and brand trends and pricing and cost expectations. As the trademarks and similar intangibles with indefinite lives relate to the acquisition of Reynolds American, the brand budgets used in the value-in-use calculations have also been incorporated into the budget information used in the impairment testing of Reynolds American goodwill.
| | | | | | | | | | | | | | | | | |
| | 2022 | | | 2021 |
| Carrying
amount
£m | Pre-tax
discount rate
%* | | Carrying
amount
£m | Pre-tax
discount rate
% |
| Indefinite-lived intangibles | | | | | |
| Newport | 33,236 | | 9.2 | | | 29,517 | | 9.9 | |
| Camel | 14,058 | | 8.9 | | | 12,485 | | 9.4 | |
| Pall Mall | 6,252 | | 8.6 | | | 5,552 | | 8.8 | |
| Natural American Spirit | 13,019 | | 8.6 | | | 11,562 | | 8.7 | |
| Camel Snus | 1,355 | | 8.6 | | | 1,203 | | 8.7 | |
| Grizzly | 10,308 | | 8.6 | | | 9,155 | | 8.7 | |
| Total | 78,228 | | | | 69,474 | | |
Note:
* The pre-tax discount rates for all indefinite-lived intangibles have declined in comparison to 2021 primarily as the result of a change in U.S. federal tax rate assumption in 2022. On a post-tax basis the discount rates for all the indefinite-lived intangibles have increased when compared with 2021, except for Newport which, as the most exposed brand to mentholated products, saw a greater shift in risk for the discount rate into the cash flows, in 2022, in relation to the proposed product standard to prohibit menthol as a characterising flavour in cigarettes (outlined further in note 12(e)(v).
Refer to note 12(e)(v) for further information on brand impairment testing.
(iii) Cash-generating units and information on goodwill impairment testing
In 2022, goodwill was allocated for impairment testing purposes to 17 (2021: 17) individual cash-generating units (CGUs) – one in the U.S.
(2021: one), six in AmSSA (2021: six), four in Europe (2021: four) and six in APME (2021: six).
| | | | | | | | | | | | | | | | | | | | | | | |
| BAT Annual Report and Form 20-F 2022 | Strategic Report | | Governance Report | | Financial Statements | | Other Information |
| | | | | | | |
| | | | | | | |
| | | | | | | |
| Financial Statements | | | | | | | |
Notes on Accounts Continued |
| | | | | | | | | | | | | | | | | |
| | 2022 | | | 2021 |
| Carrying
amount
£m | Pre-tax
discount rate
% | | Carrying
amount
£m | Pre-tax
discount rate
% |
| Cash-generating unit | | | | | |
| Reynolds American | 37,181 | | 8.8 | | | 33,021 | | 8.4 | |
| Europe | 5,670 | | 7.5 | | | 5,362 | | 6.1 | |
| Canada | 2,460 | | 19.4 | | | 2,345 | | 19.3 | |
| Australia | 755 | | 8.2 | | | 719 | | 6.8 | |
| South Africa* | 541 | | 10.4 | | | 512 | | 14.6 | |
| Singapore | 398 | | 7.9 | | | 352 | | 8.2 | |
| GTR | 264 | | 7.6 | | | 233 | | 7.7 | |
| Malaysia | 240 | | 11.4 | | | 226 | | 11.2 | |
| Peru* | 103 | | 7.5 | | | 91 | | 10.7 | |
| Other | 344 | | 8.0 | | | 333 | | 6.8 | |
| Total | 47,956 | | | | 43,194 | | |
Note:
* Due to difficult trading conditions and uncertainties resulting from the COVID-19 pandemic in the prior year, a more granular market-led approach was adopted in formulating the CGUs financial forecast and value-in-use assumptions. However, given these risk factors have now dissipated, the CGUs have been assessed through the established Group approach in the current year.
Included within ‘Other’ above is goodwill arising on various acquisitions that have been allocated to eight cash-generating units which are, individually, insignificant. The pre-tax discount rate represents the weighted average pre-tax discount rate.
The recoverable amounts of all cash-generating units have been determined on a value-in-use basis. The key assumptions for the recoverable amounts of all units are the projected sales volumes and pricing (net revenues), operating margins and long-term growth rates, which directly impact the cash flows, and the discount rates used in the calculation. The long-term growth rate is used purely for the impairment testing of goodwill under IAS 36 Impairment of Assets and does not reflect long-term planning assumptions used by the Group for investment proposals or for any other assessments.
Post-tax discount rates were used in the impairment testing, based on the Group’s weighted average cost of capital, taking into account the cost of capital and borrowings, to which specific market-related premium adjustments are made. These adjustments are derived from external sources and are based on the spread between bonds (or credit default swaps, or similar indicators) issued by the relevant local (or comparable) government, adjusted for the Group’s own credit market risk. For ease of use and consistency in application, these results are periodically calibrated into bands based on internationally recognised credit ratings. This applies to all CGUs with the exception of Reynolds which had its discount rate independently determined based on its own weighted average cost of capital and U.S. market-related premiums. In general, an overall increase in post-tax discount rates in 2022 has been observed, primarily driven by higher interest rates and bond yields. In relation to Reynolds, this has been partially offset by a reduction in the risk-adjustment incorporated into the 2021 discount rates which has now been incorporated directly into the cash flows.
The long-term growth rates and discount rates have been applied to the budgeted cash flows of each cash-generating unit. These cash flows have been determined by local management based on experience, specific market and brand trends, as well as pricing and cost expectations. These have been endorsed by Group management as part of the consolidated Group’s budget.
(iv) Impairment testing – Goodwill (excluding Reynolds American and Canada)
The value-in-use calculations use cash flows based on detailed financial budgets prepared by management covering a one-year period extrapolated over a 10-year horizon with growth of 3% (2021: 3%) in years 2 to 10, after which a growth rate of 1% (2021: 1%) having been assumed as the long-term volume decline is more than offset by pricing to drive revenue growth. A 10-year horizon is considered appropriate based on the Group’s history of profit and cash growth, its well-balanced portfolio of brands and the industry in which it operates.
For the Malaysian cash-generating unit, as a result of regulatory and macro-economic conditions, the above assumptions were amended to reflect the short- to medium-term plans of the country or area management spanning up to a period of five years after which a long-term growth rate of 0% has been assumed. For the Malaysian cash-generating units headroom to reduce to £nil, the forecasted cash flows would need to reduce by 11.5% year on year or the pre-tax discount rate would have to increase by 1.5%, both of which management does not consider to be reasonably possible. The Group will continue to monitor Malaysia's performance going forward to identify if any impairment triggers materialise.
South Africa is positively recovering from the COVID-19 pandemic and the five-month sales ban in 2020, with the forecasted cashflows prepared to reflect the continued expected recovery with no further indication of impairment.
The Group had recognised an impairment charge of £54 million in 2021 for its Peruvian cash generating unit due to continued difficult trading conditions as a consequence of the COVID-19 pandemic and its impact on the forecasted operating cashflows which partially reduced the carrying value of goodwill to £91 million. As a result of the assessment, in 2022, no further deterioration in performance was identified requiring further impairment consideration.
In 2021, the Group also impaired in full the goodwill of Myanmar resulting in an impairment charge of £3 million.
Following the application of a reasonable range of sensitivities to all cash-generating units, there was no reasonably possible scenario identified that would lead to a potential impairment charge.
| | | | | | | | | | | | | | | | | | | | | | | |
| BAT Annual Report and Form 20-F 2022 | Strategic Report | | Governance Report | | Financial Statements | | Other Information |
| | | | | | | |
| | | | | | | |
| | | | | | | |
| | | | | | | |
|
(v) Impairment testing – Reynolds American
Goodwill relating to Reynolds American and the indefinite-lived brand intangibles
On 28 April 2022, the FDA announced a proposed product standard to prohibit menthol as a characterising flavour in cigarettes, consistent with their previously stated timeline. Management notes that the proposal of a product standard does not itself constitute a ban on menthol in cigarettes given the proposed standard is still required to go through the established U.S. comprehensive rule-making process, the timetable and outcome for which was, and remains, uncertain. Further to this, on 21 June 2022, the FDA announced plans to develop a proposed product standard that would establish a maximum nicotine level in cigarettes and certain other combustible tobacco products to reduce addictiveness. Management notes that the FDA announcement does not itself constitute restrictions on nicotine levels in cigarettes, and any proposed regulation of nicotine in cigarettes would need to be introduced through the established U.S. comprehensive rule-making process, the timetable and outcome for which was, and remains, uncertain. Management do not deem this to be a new development but rather a continuation of the rulemaking process that the FDA initiated in 2017 that was later put on hold.
In December 2022, the sale of most tobacco products with characterising flavours (including menthol) other than tobacco were banned in the state of California. The impact of such ban does not present an indicator of a potential impairment for Reynolds American goodwill or any of the indefinite-lived intangibles. The Group has a long-standing track record of managing regulatory shifts and, in the event of regulatory change, the Group remains confident in its ability to navigate that environment successfully. Since 2018, having considered the combination of the risk of implementation and impact of any change in regulations, the Group has not recognised any impairment on either the Newport or Camel brands or the Reynolds American cash-generating unit.
In 2022, the value-in-use calculations have been determined based on probability weighted scenarios to derive a risk-adjusted cash flow forecast applied within the valuations. Management incorporated the following scenarios into the valuation:
–Management’s internal forecast (risk of the proposed product standard to prohibit menthol as a characterising flavour in cigarettes incorporated into the long-term growth rate).
–Assuming a final product standard to prohibit menthol as a characterising flavour in cigarettes becomes effective in the final year of the discrete forecast period (Management’s best estimate of the ban’s effective date, if a final rule is published).
–No product standard to prohibit menthol as a characterising flavour in cigarettes ultimately ends up being introduced.
This is a change in valuation methodology from 2021 where management prepared one cash flow forecast with the potential impact/risk of a proposed product standard to prohibit menthol as a characterising flavour in cigarettes incorporated into the long-term growth rate and discount rate. This change was a result of the timing of a proposed product standard narrowing given we have moved one year further forward.
The value-in-use calculations for brands, as described in note 12(e)(ii) above, have been incorporated in the probability weighted scenarios used in the Reynolds American goodwill model. The value-in-use calculations have been prepared based on a five-year risk-adjusted cash flow forecast which assumes a long-term volume decline of cigarettes generally offset by pricing. After this forecast, a probability weighted growth rate of 1.05% has been assumed for the Reynolds American cash-generating unit, 0.89% for Newport, 0.93% for Camel, and 1.0%for all remaining indefinite life intangibles.
The excess of value-in-use earnings over the carrying values (headroom) of the Reynolds American cash-generating unit and the Newport, Camel, Pall Mall, Grizzly and Camel Snus brand intangibles would be reduced to nil if the following individual changes were made to the key assumptions used in the impairment model.
| | | | | | | | | | | | | | | | | | | | |
| Reynolds American goodwill
% | Newport
% | Camel
% | Pall Mall
% | Grizzly
% | Camel Snus
% |
| Assumptions | | | | | | |
| Decrease in revenue by* | 6.1 | | 21.0 | | 28.6 | | 14.1 | | 8.9 | | 5.1 | |
| Increase in pre-tax discount rate by | 0.8 | | 3.4 | | 5.5 | | 2.2 | | 0.8 | | 0.4 | |
| Decrease in long-term growth rate by | 0.8 | | 4.0 | | 7.0 | | 2.4 | | 1.0 | | 0.5 | |
Note:
* Revenue sensitivities are performed in isolation and do not include the removal of the corresponding variable cost of sales.
| | | | | | | | | | | | | | | | | | | | | | | |
| BAT Annual Report and Form 20-F 2022 | Strategic Report | | Governance Report | | Financial Statements | | Other Information |
| | | | | | | |
| | | | | | | |
| | | | | | | |
| Financial Statements | | | | | | | |
Notes on Accounts Continued |
The change in revenue assumption is based on revenue in the five-year forecast reducing by the stated percentage in each year without any future recovery and assumes that other assumptions are not changed. Management concluded that such reduction would not be reasonably possible for either Reynolds American goodwill or the indefinite-lived intangibles.
As a result of a reduction in the excess of value-in-use earnings over the carrying values (headroom) on Reynolds American goodwill in 2022, reasonably possible changes to key assumptions, within the value-in-use model, could result in an impairment charge. The following movements in key assumptions are deemed to be reasonably possible and would result in the following:
| | | | | | | | | | | | | | |
| Current headroom (£m) | Assumptions | Reasonable possible change | Impact
(£m) | Possible impairment
(£m) |
| 11,826 | Pre-tax discount rate | Increase of 0.93% | (13,355) | (1,529) |
| Long-term growth rates | Decrease of 0.85% | (13,036) | (1,210) |
Reasonably possible changes to key assumptions, within the value-in-use model, which could result in an impairment charge were also identified for Camel Snus. The following movements in key assumptions are deemed to be reasonably possible and would result in the following:
| | | | | | | | | | | | | | |
| Current headroom (£m) | Assumptions | Reasonable possible change | Impact
(£m) | Possible impairment
(£m) |
| 95 | Pre-tax discount rate | Increase of 0.94% | (165) | (70) |
| Long-term growth rates | Decrease of 1.00% | (175) | (80) |
The sensitivities relating to the pre-tax discount rates above are based upon a change in the risk-free rate only, as a directional potential impact. It is recognised that such changes may arise in a combination of assumptions within the discount rate calculation.
Apart from Camel Snus, management concluded that no reasonably possible scenarios were identified that resulted in any of the indefinite-lived intangibles requiring an impairment charge. However, it is noted that if adverse movement occurred in a combination of the above key assumptions for the Pall Mall brand intangible this may result in an impairment charge.
(vi) Impairment testing – Canada
Goodwill relating to Imperial Tobacco Canada Ltd (ITCAN)
In March 2019, ITCAN obtained an Initial Order from the Ontario Superior Court of Justice granting it protection under the Companies’ Creditors Arrangement Act (CCAA). If the CCAA creditor protection were to end, significant liabilities might crystallise. As a consequence, to reflect the risk to future operating cash flows, the value-in-use calculations have been prepared based on a five-year cash flow forecast, after which a growth rate of -2.5% and a pre-tax discount rate of 19.4% (2021: 19.3%) have been assumed. Further information on the Quebec Class Actions and CCAA can be found in note 31.
In addition to the increase in discount rate, a reasonable range of sensitivities was applied to the value-in-use calculation, and there was no risk of an impairment charge identified.
The excess of value-in-use earnings over the carrying values (headroom) of the ITCAN goodwill would be reduced to nil if the following individual changes, none of which are considered reasonably possible by management, were made to the key assumptions used in the impairment model. The change in revenue assumption is based on combustibles revenue in the five-year forecast reducing by 20.6% in each year and assumes that other assumptions are not changed.
| | | | | |
| Canada
goodwill
% |
| Assumptions | |
| Decrease in revenue by | 20.6 | |
| Increase in pre-tax discount rate by | 10.2 | |
Note:
* Revenue sensitivities are performed in isolation and do not include the removal of the corresponding variable cost of sales.
The £2,460 million of goodwill relating to ITCAN on the Group’s balance sheet at 31 December 2022 will continue to be reviewed on a regular basis. Any future impairment charge would result in a non-cash charge to the income statement that will be treated as an adjusting item.
| | | | | | | | | | | | | | | | | | | | | | | |
| BAT Annual Report and Form 20-F 2022 | Strategic Report | | Governance Report | | Financial Statements | | Other Information |
| | | | | | | |
| | | | | | | |
| | | | | | | |
| | | | | | | |
|
13 Property, plant and equipment
(a) Overview of property, plant and equipment, including right-of-use assets
| | | | | | | | | | | | | | | | | | | | |
| | | | | | 2022 |
| Freehold
property
£m | Leasehold
property
£m | Plant,
equipment and other owned
£m | Plant,
equipment and other leased
£m | Assets in the
course of
construction
£m | Total
£m |
1 January | | | | | | |
| Cost | 1,421 | | 847 | | 5,750 | | 247 | | 706 | | 8,971 | |
| Accumulated depreciation and impairment | (388) | | (370) | | (3,130) | | (130) | | | (4,018) | |
| Net book value at 1 January | 1,033 | | 477 | | 2,620 | | 117 | | 706 | | 4,953 | |
| Differences on exchange | 68 | | 30 | | 164 | | 9 | | 48 | | 319 | |
| Additions | | | | | | |
| – right-of-use assets | — | | 117 | | — | | 117 | | — | | 234 | |
| – separately acquired | — | | — | | 32 | | — | | 471 | | 503 | |
| | | | | | |
| Reallocations | 44 | | 21 | | 374 | | 2 | | (441) | | — | |
| Depreciation | (36) | | (112) | | (323) | | (68) | | — | | (539) | |
| Impairment | (62) | | (39) | | (210) | | (4) | | (4) | | (319) | |
| Right-of-use assets - reassessments, modifications and terminations | — | | (16) | | — | | 4 | | — | | (12) | |
| Disposals | (4) | | (2) | | (15) | | — | | 3 | | (18) | |
| Net reclassifications as held-for-sale | (41) | | (10) | | (187) | | — | | (16) | | (254) | |
31 December | | | | | | |
| Cost | 1,475 | | 940 | | 5,962 | | 362 | | 767 | | 9,506 | |
Accumulated depreciation
and impairment | (473) | | (474) | | (3,507) | | (185) | | | (4,639) | |
Net book value at 31 December | 1,002 | | 466 | | 2,455 | | 177 | | 767 | | 4,867 | |
| | | | | | | | | | | | | | | | | | | | |
| | | | | | 2021 |
| Freehold
property
£m | Leasehold
property
£m | Plant,
equipment and other owned
£m | Plant,
equipment and other leased
£m | Assets in the
course of
construction
£m | Total
£m |
1 January | | | | | | |
| Cost | 1,518 | | 798 | | 5,807 | | 217 | | 764 | | 9,104 | |
Accumulated depreciation
and impairment | (444) | | (315) | | (3,175) | | (110) | | | (4,044) | |
| Net book value at 1 January | 1,074 | | 483 | | 2,632 | | 107 | | 764 | | 5,060 | |
| Differences on exchange | (23) | | (22) | | (135) | | (5) | | (18) | | (203) | |
| Additions | | | | | | |
| – right-of-use assets | — | | 88 | | — | | 76 | | — | | 164 | |
| – separately acquired | — | | 1 | | 45 | | — | | 508 | | 554 | |
| | | | | | |
| Reallocations | 44 | | 51 | | 441 | | 1 | | (537) | | — | |
| Depreciation | (35) | | (110) | | (303) | | (57) | | — | | (505) | |
| Impairment | (4) | | (2) | | (37) | | — | | (11) | | (54) | |
| Right-of-use assets - reassessments, modifications and terminations | — | | (11) | | — | | (5) | | — | | (16) | |
| Disposals | (7) | | (1) | | (12) | | — | | — | | (20) | |
| Net reclassifications as held-for-sale | (16) | | — | | (11) | | — | | — | | (27) | |
31 December | | | | | | |
| Cost | 1,421 | | 847 | | 5,750 | | 247 | | 706 | | 8,971 | |
Accumulated depreciation
and impairment | (388) | | (370) | | (3,130) | | (130) | | | (4,018) | |
Net book value at 31 December | 1,033 | | 477 | | 2,620 | | 117 | | 706 | | 4,953 | |
Refer to notes 4 and 7 for more information on property, plant and equipment impairments. The £254 million (2021: £27 million) of assets reclassified as held-for-sale in 2022 primarily relates to the Group's operations in Russia and Belarus and in 2021, the Group's Iranian subsidiary, BAT Pars, as disclosed in note 27(d).
| | | | | | | | | | | | | | | | | | | | | | | |
| BAT Annual Report and Form 20-F 2022 | Strategic Report | | Governance Report | | Financial Statements | | Other Information |
| | | | | | | |
| | | | | | | |
| | | | | | | |
| Financial Statements | | | | | | | |
Notes on Accounts Continued |
ESG Investments: Included in additions in 2022 is an amount of £27.1 million related to investments directed towards equipment to drive energy efficiency and renewable energy generation, water recycling and efficiency projects, waste reduction, and product innovation-led specification improvements to drive recyclability and reduce waste.
The Group has £80 million of future contractual commitments (2021: £90 million) related to property, plant and equipment.
(b) Right-of-use assets
In accordance with IFRS 16 Leases, the right-of-use assets related to leased properties have been included in the asset class ‘Leasehold Property’ (note 13(c)) and other right-of-use assets have been reported under ‘Plant, equipment and other leased’.
The Group leases various offices, warehouses, retail spaces, equipment and vehicles through its subsidiaries across the globe. Arrangements are entered into in the course of ordinary business, and lease terms are negotiated on an individual basis and contain a wide range of different terms and conditions reflecting local commercial practice. The lease agreements do not impose any covenants other than the security interests in the leased assets that are held by the lessor. Leased assets may not be used as security for borrowing purposes.
Assets representing ‘plant, equipment and other’ relate to leases of various assets including tobacco vending machines, industrial equipment and distribution vehicles in Brazil, Japan, Pakistan, Poland, Romania, Switzerland, the U.S. and other countries.
(c) Leasehold property
As of 31 December 2022, the Group holds £152 million (2021: £165 million) of leasehold properties acquired and another £314 million (2021: £312 million) of right-of-use leased properties.
Assets representing ‘leasehold property’ relate to leases in respect of offices, retail space, warehouses and manufacturing facilities occupied by Group subsidiaries and include property leases with lease terms of more than five years in Bangladesh, Brazil, China, Germany, Italy, Mexico, Romania, Singapore, the UK and the U.S., amongst other countries. In addition, capitalised expenditure representing leasehold improvements is included in this asset class.
| | | | | | | | |
| 2022 £m | 2021 £m |
| Leasehold land and property comprises | | |
| - net book value of long leasehold | 15 | | 14 | |
| - net book value of short leasehold | 451 | | 463 | |
| 466 | | 477 | |
| | | | | | | | | | | | | | | | | |
2022 |
Leasehold property net book value movements for the year ended 31 December 2022 | Net book value at 1 January
£m | Differences on exchange
£m | Depreciation and impairment
£m | Other net movements* £m | Net book value at 31 December
£m |
| - Property acquired (IAS 16) | 165 | | 11 | | (41) | | 17 | | 152 | |
| - Right-of-use properties (IFRS 16) | 312 | | 19 | | (110) | | 93 | | 314 | |
| 477 | | 30 | | (151) | | 110 | | 466 | |
| | | | | | | | | | | | | | | | | |
| | | | | 2021 |
Leasehold property net book value movements for the year ended 31 December 2021 | Net book value at 1 January
£m | Differences on exchange
£m | Depreciation and impairment
£m | Other net movements*
£m | Net book value at 31 December
£m |
| - Property acquired (IAS 16) | 132 | | (8) | | (13) | | 54 | | 165 | |
| - Right-of-use properties (IFRS 16) | 351 | | (14) | | (99) | | 74 | | 312 | |
| 483 | | (22) | | (112) | | 128 | | 477 | |
Note:
* Property acquired (IAS 16 Property, plant and equipment) other net movements for leasehold improvements represent additions (directly acquired and/or transferred from assets in the course of construction) net of disposals, whereas other net movements for right-of-use properties (IFRS 16) relate to new leases net of reassessments, modifications and terminations as reported in the Property, plant and equipment movement table in note 13(a).
(d) Freehold property
As of 31 December 2022, the Group owns freehold property amounting to £1,002 million (2021: £1,033 million), representing factories, warehouses and office buildings together with adjoining land, mainly in the U.S., the UK, Bangladesh, Indonesia and South Korea.
| | | | | | | | |
| 2022 £m | 2021 £m |
| Cost of freehold land within freehold property on which no depreciation is provided | 246 | | 242 | |
| | | | | | | | | | | | | | | | | | | | | | | |
| BAT Annual Report and Form 20-F 2022 | Strategic Report | | Governance Report | | Financial Statements | | Other Information |
| | | | | | | |
| | | | | | | |
| | | | | | | |
| | | | | | | |
|
14 Investments in associates and joint ventures
| | | | | | | | |
| 2022 £m | 2021 £m |
| 1 January | 1,948 | | 1,796 | |
Total comprehensive income (note 9) | 467 | | 412 | |
| Dividends | (438) | | (392) | |
Additions (note 27(c)) | 39 | | 130 | |
| Other equity movements | 4 | | 2 | |
| 31 December | 2,020 | | 1,948 | |
| Non-current assets | 1,400 | | 1,286 | |
| Current assets | 1,138 | | 1,144 | |
| Non-current liabilities | (75) | | (83) | |
| Current liabilities | (443) | | (399) | |
| 2,020 | | 1,948 | |
ITC Ltd. (Group’s share of the market value is £12,059 million (2021 £7,839 million)) | 1,865 | | 1,759 | |
Other listed associates (Group’s share of the market value is £206 million (2021: £232 million)) | 106 | | 154 | |
| Unlisted associates | 49 | | 35 | |
| 2,020 | | 1,948 | |
The principal associate undertaking of the Group is ITC Ltd. (ITC). Included within the dividends amount of £438 million
(2021: £392 million) are £427 million (2021: £383 million) attributable to dividends declared by ITC.
As explained in note 27(c), acquisitions during the year included mostly investments in Sanity Group GmbH and Steady State LLC.
In 2021, acquisitions largely related to investments in Organigram Holdings Inc.
Organigram
On 11 March 2021, the Group announced a strategic collaboration agreement with Organigram Inc., a wholly owned subsidiary of publicly traded Organigram Holdings Inc. (collectively, Organigram). Under the terms of the transaction, a Group subsidiary acquired a 19.9% (2022: 19.4%) equity stake in Organigram Holdings Inc. (listed on both the Nasdaq and Toronto Stock Exchange under the symbol ‘OGI’) to become its largest shareholder.
The Group’s share of the fair value of net assets acquired included £49 million of intangibles and £30 million of goodwill, representing a strategic premium to enter the legal cannabis market in North America.
During 2022, management reassessed the carrying value of the Group’s investment in Organigram Holdings Inc. due to a reduction in the entity's share price being identified as a trigger for a detailed impairment assessment to be undertaken. As part of this exercise, management took into consideration Organigram’s share price, internal value-in-use calculations, external trading multiples and broker forecasts. As a result of this analysis, it was concluded that an impairment charge of £65 million (or £59 million net of tax) was required against the carrying value of the investment in associate, with the recoverable amount as at 31 December 2022 being £73 million (2021: £125 million). Management will continue to monitor the carrying value, in line with IAS 36, over the course of future periods.
Tisak d.d.
The Group’s investment in Tisak d.d. (Tisak) was acquired as part of the TDR Group in 2015. During 2016, the Group entered into an agreement with Tisak’s parent Agrokor d.d. (Agrokor) to convert certain outstanding trading balances into long-term loans and an additional shareholding in Tisak. As part of the agreement, Agrokor had the right to reacquire the additional shareholding in Tisak. As a consequence of this, while the Group had legal ownership of the additional shareholding, it did not consider that the shares provided any additional equity interest and continued to account for 26% of the equity of Tisak. In 2017, due to the financial difficulties of Agrokor and Tisak, the Group fully impaired this investment resulting in a charge of £27 million to the income statement in that year that was reported as an adjusting item. In July 2018, Agrokor’s creditors approved a settlement plan proposed by Agrokor’s administrators. The settlement plan has not returned any value to the Group, and Tisak was liquidated on 21 September 2021.
Charlotte’s Web Holdings Inc.
In November 2022, the Group announced a £48 million investment in Charlotte’s Web Holdings, Inc. (Charlotte's Web). Based in Colorado, USA, and listed on the Toronto Stock Exchange, Charlotte’s Web holds a prominent position in innovative hemp extract wellness products. The Group’s investment has been made via a 7-year convertible debenture which is convertible at the Group’s discretion into a non-controlling equity stake in Charlotte’s Web of around 19.9%. As part of the investment agreement, the Group has the right to appoint directors to the Board of Charlotte’s Web. However, given the investment does not give the Group any current right to a share of the earnings or net assets of the investee, the investment has been classified as an investment at fair value through profit and loss (see note 18). On conversion of the loan note, the Group would equity account for its investment.
| | | | | | | | | | | | | | | | | | | | | | | |
| BAT Annual Report and Form 20-F 2022 | Strategic Report | | Governance Report | | Financial Statements | | Other Information |
| | | | | | | |
| | | | | | | |
| | | | | | | |
| Financial Statements | | | | | | | |
Notes on Accounts Continued |
ITC Ltd.
ITC is an Indian conglomerate based in Kolkata and maintains a presence in cigarettes, hotels, paper and packaging, agri-business
and other fast-moving goods (e.g. confectionery, branded apparel, personal care, stationery and safety matches). BAT’s interest in ITC
is 29.19%.
ITC prepares accounts on a quarterly basis with a 31 March year-end. As permitted by IAS 28 Investments in associates and joint ventures, results up to 30 September 2022 have been used in applying the equity method. This is driven by the availability of information at the half-year, to be consistent with the treatment in the Group’s interim accounts. Any further information available after the date used for reporting purposes is reviewed and any material items adjusted for in the final results. The latest published information available is at 31 December 2022. | | | | | | | | |
| 2022 £m | 2021 £m |
| Non-current assets | 4,402 | | 3,889 | |
| Current assets | 3,465 | | 3,391 | |
| Non-current liabilities | (233) | | (231) | |
| Current liabilities | (1,244) | | (1,061) | |
| 6,390 | | 5,988 | |
Group’s share of ITC Ltd. (2022: 29.19%; 2021: 29.38%) | 1,865 | | 1,759 | |
15 Retirement benefit schemes
The Group operates various funded and unfunded defined benefit schemes, including pension and post-retirement healthcare schemes, and defined contribution pension schemes through its subsidiary undertakings in multiple jurisdictions, with its most significant arrangements being in the U.S., the UK, Canada, Germany, Switzerland and the Netherlands. Together, schemes in these territories account for over 90% of the total underlying obligations of the Group’s defined benefit arrangements and over 70% of the current service cost.
Pension obligations consist mainly of final salary pension schemes which provide benefits to members in the form of a guaranteed level of pension payable for life. The level of benefits provided depends on members’ length of service and their salary in the final years leading up to retirement. In addition, the Group operates several healthcare benefit schemes, of which the most significant are in the U.S. and Canada. The majority of defined benefit schemes allow for the future accrual of benefits. With the exception of arrangements required under local regulations, most of the Group’s arrangements are closed to new entrants.
Benefits provided through defined contribution schemes are charged as an expense as payments fall due. The liabilities arising in respect of defined benefit schemes are determined in accordance with the advice of independent, professionally qualified actuaries, using the projected unit credit method. It is Group policy that all schemes are formally valued at least every three years.
Through its defined benefit pension schemes and healthcare benefit schemes, the Group is exposed to a number of risks, including:
–Asset volatility: The scheme liabilities are calculated using discount rates set by reference to bond yields. If scheme assets underperform this yield, e.g. due to stock market volatility, this may create a deficit. However, most funded schemes hold a proportion of assets which are expected to outperform bonds in the long term, and the majority of schemes by value are subject to local regulation regarding funding deficits. In addition, schemes in the UK and Canada have purchased insurance contracts which exactly match valuation volatility of all or part of the scheme liabilities.
–Changes in bond yields: A decrease in corporate bond yields will increase scheme liabilities, although this will be partially offset by an increase in the value of the schemes’ bond holdings, ‘buy-in’ insurance assets or other hedging instruments.
–Inflation risk: Some of the Group’s pension obligations are linked to inflation, and higher inflation will lead to higher liabilities, although in most cases, caps on the level of inflationary increases are in place in the scheme rules, while some assets and derivatives provide specific inflation protection.
–Life expectancy: The majority of the schemes’ obligations are to provide benefits for the life of the member, so increases in life expectancy will result in an increase in the plans’ liabilities. Assumptions regarding mortality and mortality improvements are regularly reviewed in line with actuarial tables and scheme specific experience.
The Group has an internal body, the Pensions Executive Committee (PEC), that is chaired by the Finance and Transformation Director. The PEC sets and oversees a set of philosophies, policies and practices in respect of post-employment benefits including, but not limited to, design, funding, investment strategy, risk management and governance. It also reviews significant changes to defined benefit schemes in the countries with the most significant liabilities, and defined contribution schemes in the countries with the most significant costs. Significant changes to defined benefit arrangements include scheme closures to future accrual and risk management exercises such as the ‘buy-in’ and ‘buy-out’ transactions referred to below.
A ‘buy-out’ transaction is where a pension scheme derecognises all (or part) of its liabilities, removing it from the balance sheet, by permanently transferring those obligations from the sponsoring employer to a third-party provider and eliminating all further legal or constructive obligation to the pension scheme or to the sponsoring employer. By contrast, with a ‘buy-in’ transaction the scheme liabilities remain on the balance sheet and the sponsoring employer remains responsible for the fulfilment of the pension obligations. However, these obligations are de-risked through the purchase of an insurance product designed to match the underlying cash flows of the pension liability reducing the risks associated with improved longevity and interest and discount rate movements. The Group consequently benefits from the ‘buy-in’ as it reduces the individual scheme’s reliance on the Group for future cash funding requirements.
All of the Group’s arrangements, including funded schemes where formal trusts or equivalents are required, have been developed and are operated in accordance with local practices and regulations where applicable in the countries concerned. Responsibility for the governance of these schemes, including specific investment decisions and funding contribution schedules, generally lies with the trustees, or equivalent bodies, of each arrangement. The trustees will usually consist of representatives appointed by both the sponsoring company and the beneficiaries.
| | | | | | | | | | | | | | | | | | | | | | | |
| BAT Annual Report and Form 20-F 2022 | Strategic Report | | Governance Report | | Financial Statements | | Other Information |
| | | | | | | |
| | | | | | | |
| | | | | | | |
| | | | | | | |
|
The funded arrangements in the Group have policies on investment management, including strategies over a preferred long-term investment profile, and schemes in certain territories including Canada and the Netherlands manage their bond portfolios to match the weighted average duration of scheme liabilities. In addition, as noted below, certain arrangements in the UK and Canada have been de-risked through the purchase of insurance policies. The majority of funded schemes are subject to local regulations regarding funding requirements. Contributions to defined benefit schemes are determined after consultation with the respective trustees and actuaries of the individual externally funded schemes, and after taking into account regulatory requirements in each territory. The Group’s contributions to funded defined benefit schemes in 2023 in total are expected to be £110 million compared to £74 million in 2022.
U.S.
In the U.S., the main funded pension plan is the Reynolds and Affiliates Pension Plan which was formed at the end of 2022 through a merger of the Reynolds American Retirement Plan (PEP) and the Retirement Income Plan for Certain RAI Affiliates (Affiliates). The only funded healthcare scheme is the Brown & Williamson Tobacco Corporation Welfare & Fringe Benefit Plan. Each of the above were established with corporate trustees that are required to run the plan in accordance with the plan’s rules and to comply with all relevant legislation, including the Employee Retirement Income Security Act of 1974.
The corporate trustees act as custodians with a committee of local management acting in a fiduciary capacity with regard to investment decisions, risk mitigation and administration of the arrangements. Contributions to the various funded plans are agreed with the named fiduciary, scheme actuaries and the committee of local management after taking account of statutory requirements including the Pension Protection Act of 2006, as amended. Through its U.S. subsidiaries, the Group may make significant contributions, either as required by statutory requirements or at the discretion of the Group, with the aim of maintaining a funding status of at least 90% and remaining fully funded in the long term. During 2022, the Group did not contribute to its funded pension and post-retirement plans in the U.S. and does not expect to do so in 2023.
For funded plans in the U.S., the trustees employ a risk mitigation strategy which seeks to balance pension plan returns with a reasonable level of funded status volatility. Based on this framework, the asset allocation has two primary components. The first component is the hedging portfolio, which uses extended duration fixed income holdings (typically U.S. Government and investment grade corporate bonds) and, to a lesser extent, derivatives to match a significant portion of the interest rate risk associated with the benefit obligations, thereby reducing expected funded status volatility. The second component is the return-seeking portfolio, which is designed to enhance portfolio returns. The return-seeking portfolio is broadly diversified across asset classes.
On 7 October 2021, the Group concluded a transaction affecting portions of the membership of the former PEP and former Affiliates plans referred to above, allowing the Group to fully settle portions of its liability by transferring the obligations to the Metropolitan Tower Life Insurance Company in a buy-out. Approximately US$1.9 billion (£1.4 billion) of plan liabilities were removed from the balance sheet, resulting in a settlement gain of £35 million. A further partial buy-out affecting portions of the membership of the former PEP and former Affiliates plans was concluded on 7 June 2022, with approximately US$1.6 billion (£1.3 billion) of plan liabilities removed from the balance sheet, resulting in a settlement gain of £16 million.
At 31 December 2022, the Reynolds and Affiliates Pension Plan was reporting a surplus under IAS 19 in total of £567 million (2021: £463 million). Under the rules of this plan, after assuming the gradual settlement of the plan liabilities over the lives of the arrangements, any surplus would be returnable to the Group in the event of a termination or could otherwise be repurposed for other existing or replacement benefit plans, and accordingly, no surplus restriction has been recognised.
United Kingdom
In the UK, the main pension arrangement is the British American Tobacco UK Pension Fund (UKPF), which is established under trust law and has a corporate trustee that is required to run the scheme in accordance with the UKPF’s Trust Deed and Rules and to comply with the Pension Scheme Act 1993, Pensions Act 1995, Pensions Act 2004 and all other relevant legislation. With effect from 1 July 2020, UKPF was closed to further accrual of benefits with all active members becoming deferred members. A past service credit was recognised on the difference between the salary increase assumption for active members and the inflation assumption for deferred members at the date of the plan amendment and curtailment of benefits.
The formal triennial actuarial valuation of the UKPF was last carried out with an effective date of 31 March 2020. This showed that UKPF had a surplus of £139 million on a Technical Provisions basis, in accordance with the statutory funding objective. The Trustee also has a Long-Term Funding Target to be fully funded on a Solvency Liabilities basis by 2026, and on this basis UKPF had a surplus of £7 million at the valuation date. Under IAS 19, this was reported as a net retirement benefit asset of £143 million (2021: £293 million).
Under the UKPF scheme rules, the Trustee does not have a unilateral power to commence a wind up of UKPF, and the Group has recognised a surplus as an unconditional right to a refund assuming the gradual settlement of the UKPF liabilities over the life of the scheme with any future surplus returnable to the Group at the end of the life of the scheme. The funding commitment is not considered onerous, and no additional liabilities or surplus restrictions have been recognised.
Following the completion of the valuation noted above, the Trustee and the Group agreed a new Schedule of Contributions with an effective date of 5 October 2020. This schedule was subsequently replaced with a new Schedule with an effective date of 30 March 2021, such that the Group made no contributions in 2021 but was committed to pay £18 million in July 2022 and £18 million in July 2023 as contributions towards further de-risking of UKPF’s assets and securing members’ benefits. The Schedule of Contributions was further amended on 8 August 2022 such that the Group would make no contributions in 2022 but would commit to pay £36 million in July 2023. However, the Trustee retained the right to require an interim payment of up to £18 million at any time before 19 August 2023 should it consider this, in all the circumstances, to be necessary and appropriate. Consequently, no contributions were made to UKPF in 2022 or 2021.
On 26 October 2022, the Group entered into an agreement with the Trustee to provide a temporary liquidity facility capped at £40 million for up to two years. The facility will be used for the purposes of providing short-term liquidity for UKPF, should this be necessary, in meeting capital calls in respect of the certain residual investments held by UKPF. Once borrowed and repaid, amounts cannot be redrawn. Interest will accrue on the amounts borrowed under the facility at SONIA plus 2.25% p.a. A commitment charge of 0.56% will be paid by the Trustee. As at 31 December 2022 this facility was undrawn.
As part of its risk management strategy, on 31 May 2019, the UK Trustee entered into a buy-in agreement with Pension Insurance Corporation plc (‘PIC’) to acquire an insurance policy with the intent of matching a specific part of UKPF’s future cash flows arising from the accrued pension liabilities of retired and deferred members and improving the security to the UKPF and its members. On an IAS 19 basis, the subsequent fair value of the insurance policy matches the present value of the liabilities being insured. On 19 May 2021, the
| | | | | | | | | | | | | | | | | | | | | | | |
| BAT Annual Report and Form 20-F 2022 | Strategic Report | | Governance Report | | Financial Statements | | Other Information |
| | | | | | | |
| | | | | | | |
| | | | | | | |
| Financial Statements | | | | | | | |
Notes on Accounts Continued |
Trustee entered into an agreement with PIC to acquire a second buy-in policy which involved the transfer of £383 million of assets held by UKPF to PIC, and on 26 October 2022, a third and final buy-in policy was acquired with PIC. £198 million of assets were transferred immediately with £35 million of the premium deferred until 2023 and 2024.
As a result of these transactions, approximately 94% of the assets held by UKPF (2021: 84%) are represented by the buy-in contracts, covering 100% of UKPF’s retirement liabilities (2021: 91%). On an IAS 19 basis, the subsequent fair value of the insurance policies matches the present value of the liabilities being insured.
For the residual assets held by UKPF, the current allocation is broadly split as 75% in risk reducing assets and 25% in return seeking assets. The return seeking portfolio is invested in illiquid assets which, in the normal course of events, will wind down naturally over time, with their value being realised as the investments mature. This is consistent with the Trustee’s ultimate target which is to be 100% invested in risk reducing assets or matching assets. Given the strong funding position of UKPF as shown in the 31 March 2020 actuarial valuation, the Trustee will continue to review the investment strategy and may look to increase the proportion of risk-reducing or matching assets, commensurate with their ultimate target to further reduce UKPF’s exposure to asset volatility.
Other territories
Payments made to pensioners by the operating companies in Germany, net of income on scheme assets, are deemed to be company contributions to the Contractual Trust Arrangements and are anticipated to be around £40 million in 2023 and £39 million per annum for the four years after that. Contributions to pension schemes in Canada, Netherlands and Switzerland in total are anticipated to be around £17 million in 2023 and then also around £9 million per annum for the four years after that.
For schemes in the Netherlands reporting surpluses of £46 million (2021: £77 million), these surpluses have been recognised as an unconditional right to a refund assuming the gradual settlement of the pension liabilities over the life of the scheme, with any future surplus returnable to the Group at the end of the life of the scheme, and similarly for the surplus relating to schemes in Germany of £150 million (2021: £nil). For schemes in surplus in Canada of £35 million (2021: £27 million), the economic benefit has been calculated as a combination of the expected level of administration expenses which may be charged to the plan assets in accordance with the plan rules, which economically represents a potential surplus refund, and the value of the employer reserve account as defined in legislation, which represents a potential reduction in contributions on an ongoing basis or a surplus refund at the end of the life of the scheme.
On 2 September 2021, the Group through its Canadian subsidiaries entered into a buy-in agreement with five insurers to acquire insurance policies that operate as assets of its largest Canadian scheme, the Imasco Pension Fund Society Plan (Society Plan), by transferring plan assets of CAD $766 million (£451 million). The transaction was met entirely from the pension plan assets with no further funding required from the Group. The buy-in covered all the Society Plan’s liabilities in relation to pensioners and deferred members as well as the pensions accrued up to 31 December 2021 for active members. The Group consequently benefits from the buy-in as it reduces the Society Plan’s reliance on the Group for future cash funding requirements. For the residual assets, the Society Plan is 100% invested in risk reducing assets, consistent with the Canadian subsidiary’s ultimate de-risking target.
Unfunded arrangements
The majority of benefit payments are from trustee administered funds, however, there are also a number of unfunded schemes where the sponsoring company meets the benefit payment obligation as it falls due, including UK-based Defined Benefit and Defined Contribution Unapproved Unfunded Retirement Benefit Schemes (DB UURBS and DC UURBS respectively). The DC UURBS credits accrued in the year are increased in line with the Company’s Weighted Average Cost of Debt and the scheme is therefore treated as a defined benefit scheme under IAS 19. For unfunded pension schemes in the U.S. and UK, 50% of the liabilities reported at year-end are expected to be settled by the Group within 10 years, 29% between 10 and 20 years, 14% between 20 and 30 years, and 7% thereafter. For unfunded healthcare schemes in the U.S. and Canada, 71% of the liabilities reported at year-end are expected to be settled by the Group within 10 years, 23% between 10 and 20 years, 5% between 20 and 30 years, and 1% thereafter.
The amounts recognised in the balance sheet are determined as follows:
| | | | | | | | | | | | | | | | | | | | | | | | | | |
| Pension schemes | | Healthcare schemes | | Total |
| 2022 £m | 2021 £m | | 2022 £m | 2021 £m | | 2022 £m | 2021 £m |
| Present value of funded scheme liabilities | (6,310) | | (9,859) | | | (205) | | (225) | | | (6,515) | | (10,084) | |
| Fair value of funded scheme assets | 7,271 | | 10,644 | | | 153 | | 172 | | | 7,424 | | 10,816 | |
| 961 | | 785 | | | (52) | | (53) | | | 909 | | 732 | |
| Unrecognised funded scheme surpluses | (61) | | (16) | | | — | | — | | | (61) | | (16) | |
| 900 | | 769 | | | (52) | | (53) | | | 848 | | 716 | |
| Present value of unfunded scheme liabilities | (387) | | (555) | | | (410) | | (482) | | | (797) | | (1,037) | |
| 513 | | 214 | | | (462) | | (535) | | | 51 | | (321) | |
| | | | | | | | |
| The above net asset/(liability) is recognised in the balance sheet as follows: | | | | |
| – retirement benefit scheme liabilities | (483) | | (702) | | | (466) | | (537) | | | (949) | | (1,239) | |
| – retirement benefit scheme assets | 996 | | 916 | | | 4 | | 2 | | | 1,000 | | 918 | |
| 513 | | 214 | | | (462) | | (535) | | | 51 | | (321) | |
| | | | | | | | | | | | | | | | | | | | | | | |
| BAT Annual Report and Form 20-F 2022 | Strategic Report | | Governance Report | | Financial Statements | | Other Information |
| | | | | | | |
| | | | | | | |
| | | | | | | |
| | | | | | | |
|
The net assets/(liabilities) of funded pension schemes by territory are as follows:
| | | | | | | | | | | | | | | | | | | | | | | | | | |
| Liabilities | | Assets | | Total |
| 2022 £m | 2021 £m | | 2022 £m | 2021 £m | | 2022 £m | 2021 £m |
| – U.S. | (1,552) | | (3,378) | | | 2,046 | | 3,748 | | | 494 | | 370 | |
| – UK | (2,114) | | (3,357) | | | 2,256 | | 3,645 | | | 142 | | 288 | |
| – Germany | (711) | | (913) | | | 861 | | 896 | | | 150 | | (17) | |
| – Canada | (574) | | (706) | | | 613 | | 724 | | | 39 | | 18 | |
| – Netherlands | (693) | | (769) | | | 739 | | 846 | | | 46 | | 77 | |
| – Switzerland | (279) | | (317) | | | 308 | | 311 | | | 29 | | (6) | |
| – Rest of Group | (387) | | (419) | | | 448 | | 474 | | | 61 | | 55 | |
| Funded schemes | (6,310) | | (9,859) | | | 7,271 | | 10,644 | | | 961 | | 785 | |
Of the Group’s unfunded pension schemes, 47% (2021: 57%) relate to arrangements in the UK and 39% (2021: 32%) relate to arrangements in the U.S., while 86% (2021: 85%) of the Group’s unfunded healthcare arrangements relate to arrangements in the U.S.
The amounts recognised in the income statement are as follows:
| | | | | | | | | | | | | | | | | | | | | | | | | | |
| Pension schemes | | Healthcare schemes | | Total |
| 2022 £m | 2021 £m | | 2022 £m | 2021 £m | | 2022 £m | 2021 £m |
| Defined benefit schemes | | | | | | | | |
| Service cost | | | | | | | | |
| – current service cost | 50 | | 60 | | | 1 | | 2 | | | 51 | | 62 | |
| – past service credit, curtailments and settlements | (14) | | (29) | | | 1 | | — | | | (13) | | (29) | |
| Net interest on the net defined benefit liability | | | | | | | | |
| – interest on scheme liabilities | 224 | | 226 | | | 23 | | 19 | | | 247 | | 245 | |
| – interest on scheme assets | (240) | | (226) | | | (6) | | (5) | | | (246) | | (231) | |
| – interest on unrecognised funded scheme surpluses | 1 | | 1 | | | — | | — | | | 1 | | 1 | |
| 21 | | 32 | | | 19 | | 16 | | | 40 | | 48 | |
| Defined contribution schemes | 93 | | 91 | | | — | | — | | | 93 | | 91 | |
Total amount recognised in the income statement (note 3) | 114 | | 123 | | | 19 | | 16 | | | 133 | | 139 | |
The above charges are recognised within employee benefit costs in note 3 and include a credit of £9 million in 2022 (2021: £23 million) in respect of settlements, past service costs and defined contribution costs reported as part of the restructuring costs and other adjusting items charged in arriving at profit from operations (note 7). Included in current service cost in 2022 is £13 million (2021: £15 million) of administration costs. Current service cost is stated after netting employee contributions, where applicable.
| | | | | | | | | | | | | | | | | | | | | | | |
| BAT Annual Report and Form 20-F 2022 | Strategic Report | | Governance Report | | Financial Statements | | Other Information |
| | | | | | | |
| | | | | | | |
| | | | | | | |
| Financial Statements | | | | | | | |
Notes on Accounts Continued |
The movements in scheme liabilities are as follows:
| | | | | | | | | | | | | | | | | | | | | | | | | | |
| Pension schemes | | Healthcare schemes | | Total |
| 2022 £m | 2021 £m | | 2022 £m | 2021 £m | | 2022 £m | 2021 £m |
| Present value at 1 January | 10,414 | | 12,572 | | | 707 | | 798 | | | 11,121 | | 13,370 | |
| Differences on exchange | 567 | | (122) | | | 78 | | 5 | | | 645 | | (117) | |
| Current service cost | 50 | | 60 | | | 1 | | 2 | | | 51 | | 62 | |
| Past service (credit)/cost and settlements | (1,308) | | (1,426) | | | 1 | | — | | | (1,307) | | (1,426) | |
| Interest on scheme liabilities | 224 | | 226 | | | 23 | | 19 | | | 247 | | 245 | |
| Contributions by scheme members | 3 | | 3 | | | — | | — | | | 3 | | 3 | |
| Benefits paid | (586) | | (705) | | | (59) | | (55) | | | (645) | | (760) | |
| Actuarial (gains)/losses | | | | | | | | |
| – arising from changes in demographic assumptions | (18) | | 147 | | | — | | 3 | | | (18) | | 150 | |
| – arising from changes in financial assumptions | (2,775) | | (394) | | | (145) | | (18) | | | (2,920) | | (412) | |
| Experience losses/(gains) | 126 | | 53 | | | 9 | | (47) | | | 135 | | 6 | |
| Present value at 31 December | 6,697 | | 10,414 | | | 615 | | 707 | | | 7,312 | | 11,121 | |
Changes in financial assumptions principally relate to discount rate movements in both years, offset by changes in inflation. Experience losses/(gains) relates to variations from previous assumptions for inflationary increases for pensions-in-payment and deferred pensions as well as adjustments for membership data. Past service (credit)/cost and settlements in the table above includes amounts relating to the U.S. buy-out transaction in both years.
Scheme liabilities by scheme membership:
| | | | | | | | | | | | | | | | | | | | | | | | | | |
| Pension schemes | | Healthcare schemes | | Total |
| 2022 £m | 2021 £m | | 2022 £m | 2021 £m | | 2022 £m | 2021 £m |
| Active members | 756 | | 1,090 | | | 31 | | 41 | | | 787 | | 1,131 | |
| Deferred members | 1,055 | | 1,750 | | | 1 | | 1 | | | 1,056 | | 1,751 | |
| Retired members | 4,886 | | 7,574 | | | 583 | | 665 | | | 5,469 | | 8,239 | |
| Present value at 31 December | 6,697 | | 10,414 | | | 615 | | 707 | | | 7,312 | | 11,121 | |
Approximately 95% of scheme liabilities in both years relate to guaranteed benefits.
| | | | | | | | | | | | | | | | | | | | | | | |
| BAT Annual Report and Form 20-F 2022 | Strategic Report | | Governance Report | | Financial Statements | | Other Information |
| | | | | | | |
| | | | | | | |
| | | | | | | |
| | | | | | | |
|
The movements in funded scheme assets are as follows:
| | | | | | | | | | | | | | | | | | | | | | | | | | |
| Pension schemes | | Healthcare schemes | | Total |
| 2022 £m | 2021 £m | | 2022 £m | 2021 £m | | 2022 £m | 2021 £m |
Fair value of scheme assets
at 1 January | 10,644 | | 12,403 | | | 172 | | 173 | | | 10,816 | | 12,576 | |
| Differences on exchange | 606 | | (116) | | | 21 | | — | | | 627 | | (116) | |
| Settlements | (1,294) | | (1,397) | | | — | | — | | | (1,294) | | (1,397) | |
| Interest on scheme assets | 240 | | 226 | | | 6 | | 5 | | | 246 | | 231 | |
| Company contributions | 74 | | 74 | | | — | | — | | | 74 | | 74 | |
| Contributions by scheme members | 3 | | 3 | | | — | | — | | | 3 | | 3 | |
| Benefits paid | (546) | | (668) | | | (15) | | (13) | | | (561) | | (681) | |
| Actuarial (losses)/gains | (2,456) | | 119 | | | (31) | | 7 | | | (2,487) | | 126 | |
Fair value of scheme assets
at 31 December | 7,271 | | 10,644 | | | 153 | | 172 | | | 7,424 | | 10,816 | |
The actuarial losses and gains in both years principally relate to movements in the fair values of scheme assets including revaluations on initial recognition and subsequent remeasurement of insurance assets acquired in the buy-in transactions referred to above. Actual returns are stated net of applicable taxes and fund management fees. Past service and settlements in the table above includes amounts relating to the U.S. buy-out transactions in both years.
Scheme assets have been diversified into equities, bonds and other assets and are typically invested via fund investment managers into both pooled and segregated mandates of listed and unlisted equities and bonds.
| | | | | | | | | | | | | | | | | | | | | | | | | | |
| Pension schemes | | Healthcare schemes | | Total |
| 2022 £m | 2021 £m | | 2022 £m | 2021 £m | | 2022 £m | 2021 £m |
| Equities ‒ listed | 623 | | 741 | | | 5 | | 6 | | | 628 | | 747 | |
| Equities ‒ unlisted | 756 | | 892 | | | 50 | | 65 | | | 806 | | 957 | |
| Bonds ‒ listed | 1,167 | | 1,929 | | | 18 | | 5 | | | 1,185 | | 1,934 | |
| Bonds ‒ unlisted | 768 | | 1,924 | | | 64 | | 72 | | | 832 | | 1,996 | |
| Other assets ‒ listed | 473 | | 543 | | | 7 | | 15 | | | 480 | | 558 | |
| Other assets ‒ unlisted | 3,484 | | 4,615 | | | 9 | | 9 | | | 3,493 | | 4,624 | |
Fair value of scheme assets
at 31 December | 7,271 | | 10,644 | | | 153 | | 172 | | | 7,424 | | 10,816 | |
In the above analysis, investments via equity-based investment funds are shown under listed equities, and investments via bond-based investment funds are shown under listed bonds. Other assets include insurance contracts, cash and other deposits, derivatives and other hedges, recoverable taxes, infrastructure investments and investment property. The fair values of listed scheme assets were derived from observable data including quoted market prices and other market data, including market values of individual segregated investments and of pooled investment funds where quoted.
Insurance policies of £2,453 million (2021: £3,473 million), acquired in buy-in transactions in the UK and Canada are included within ‘other assets-unlisted’ in the table above. The fair value of these assets was estimated as the present value of the underlying obligations covered by the insurance policy and consequently the valuation of these assets at each balance sheet date is subject to the same measurement uncertainty as for the related scheme liabilities. The fair values of other unlisted assets, excluding buy-in insurance policies, were determined using an income approach that utilised cash flow models utilising observable inputs and comparing these valuations to benchmark valuations of similar assets. In addition, the fair value of a proportion of the unlisted bonds is estimated by reference to daily broker auctions.
In the U.S, pension plan assets are invested using active investment strategies and multiple investment management firms. Managers within each asset class cover a range of investment styles and approaches. Allowable investment types include public equity, fixed income, real assets, private equity and hedge funds. The range of allowable investment types utilised for pension assets provides enhanced returns and more widely diversifies the plan.
As noted above, during 2022, 2021 and 2019, the UKPF Trustee acquired insurance policies that operate as a UK Fund investment asset in a buy-in transaction. The residual assets of this fund of £143 million (2021: £586 million) now predominantly consist of cash and a proportion of illiquid investments, such as private equity and infrastructure investments, as well as certain liability-driven investments and absolute return funds.
The recognition of retirement benefit surpluses on the balance sheet is restricted where the economic benefit, in the form of a potential refund or reduction in future contributions, has a present value which is less than the net assets of the scheme. The movements in the unrecognised scheme surpluses, recognised in other comprehensive income, are as follows:
| | | | | | | | | | | | | | | | | | | | | | | |
| BAT Annual Report and Form 20-F 2022 | Strategic Report | | Governance Report | | Financial Statements | | Other Information |
| | | | | | | |
| | | | | | | |
| | | | | | | |
| Financial Statements | | | | | | | |
Notes on Accounts Continued |
| | | | | | | | | | | | | | | | | | | | | | | | | | | | | | | | | | | |
| Pension schemes | | Healthcare schemes | | Total |
| 2022 £m | 2021 £m | 2020 £m | | 2022 £m | 2021 £m | 2020 £m | | 2022 £m | 2021 £m | 2020 £m |
Unrecognised funded scheme surpluses at
1 January | (16) | | (16) | | (28) | | | — | | — | | — | | | (16) | | (16) | | (28) | |
Differences
on exchange | (4) | | 2 | | 3 | | | — | | — | | — | | | (4) | | 2 | | 3 | |
| Interest on unrecognised funded scheme surpluses | (1) | | (1) | | (1) | | | — | | — | | — | | | (1) | | (1) | | (1) | |
Movement in year (note 22) | (39) | | (1) | | 10 | | | — | | — | | — | | | (39) | | (1) | | 10 | |
Unrecognised funded scheme surpluses at
31 December | (60) | | (16) | | (16) | | | — | | — | | — | | | (60) | | (16) | | (16) | |
The principal actuarial assumptions (weighted to reflect individual scheme differences) used in the following territories are shown below. In both years, discount rates are determined by reference to normal yields on high quality corporate bonds at the balance sheet date.
| | | | | | | | | | | | | | | | | | | | | | | | | | | | | | | | | | | | | | | | | |
| | | | | | 2022 | | | | | | | 2021 |
| U.S. | UK | Germany | Canada | Netherlands | Switzerland | | U.S. | UK | Germany | Canada | Netherlands | Switzerland |
| Rate of increase in salaries (%) | 3.3 | | Nil | 2.5 | | 2.5 | | 1.4 | | 1.5 | | | 3.4 | | — | | 2.5 | | 2.5 | | 1.4 | | 1.2 | |
| Rate of increase in pensions in payment (%) | 2.4 | | 3.2 | | 2.3 | | Nil | 2.2 | | Nil | | 2.5 | | 3.4 | | 1.8 | | Nil | 1.1 | | Nil |
| Rate of increase in deferred pensions (%) | 0.1 | | 2.8 | | 2.3 | | Nil | 2.2 | | — | | | 0.1 | | 3.0 | | 1.8 | | Nil | 1.1 | | — | |
| Discount rate (%) | 5.5 | | 5.0 | | 4.2 | | 5.0 | | 3.7 | | 2.1 | | | 3.0 | | 1.8 | | 1.3 | | 2.8 | | 1.0 | | 0.2 | |
| General inflation (%) | 2.5 | | 3.2 | | 2.3 | | 2.0 | | 2.0 | | 1.2 | | | 2.5 | | 3.4 | | 1.8 | | 2.0 | | 2.0 | | 1.0 | |
| | | | | | | | | | | | | | | | | | | | | | | | | | | | | | | | | | | | | | | | | |
| | | | | | 2022 | | | | | | | 2021 |
| U.S. | UK | Germany | Canada | Netherlands | Switzerland | | U.S. | UK | Germany | Canada | Netherlands | Switzerland |
| Weighted average duration of liabilities (years) | 10.7 | 12.4 | 10.9 | 9.0 | 14.4 | 10.2 | | 12.3 | 16.7 | 13.6 | 11.0 | 17.1 | 13.3 |
| | | | | | | | | | | | | | | | | | | | | | | |
| BAT Annual Report and Form 20-F 2022 | Strategic Report | | Governance Report | | Financial Statements | | Other Information |
| | | | | | | |
| | | | | | | |
| | | | | | | |
| | | | | | | |
|
For healthcare inflation in the U.S., the assumption is 7.5% for 2022 (2021: 7.0%) and in Canada, the assumption is 5.0% for both years.
Mortality assumptions are subject to regular review. The principal schemes used the following tables:
| | | | | | | | |
| U.S. | PRI-2012 mortality tables without collar or amount, projected with MP-2021 generational projection except for a specific group of retired members for which the mortality assumption is 99.5% of the RP-2006 table with white collar adjustment, projected with MP-2021 generational projection (both years) |
| UK | S3PA (YOB) with the CMI (2021) improvement model with a 1.25% long-term improvement rate (2021: S3PA (YOB) with the CMI (2020) improvement model with a 1.25% long-term improvement rate) |
| Germany | RT Heubeck 2018 G (both years) |
| Canada | CPM-2014 Private Table (both years) |
| Netherlands | AG Prognosetafel 2022 (2021: AG Prognosetafel 2020) |
| Switzerland | LPP/BVG 2020 base table with CMI projection factors for mortality improvements with a 1.5% long-term improvement rate (2021: LPP/BVG 2020 base table with CMI projection factors for mortality improvements with a 1.5% long-term improvement rate) |
| | |
Based on the above, the weighted average life expectancy, in years, for mortality tables used to determine benefit obligations is as follows:
| | | | | | | | | | | | | | | | | | | | | | | | | | | | | | | | | | | | | | | | | | | | | | | | | | | | | |
| U.S. | | UK | | Germany | | Canada | | Netherlands | | Switzerland |
| Male | Female | | Male | Female | | Male | Female | | Male | Female | | Male | Female | | Male | Female |
31 December 2022 | | | | | | | | | | | | | | | | | |
| Member age 65 (current life expectancy) | 22.1 | 23.6 | | 22.9 | 24.2 | | 20.6 | 24.0 | | 22.0 | 24.4 | | 21.0 | 24.4 | | 22.0 | 23.7 |
| Member age 45 (life expectancy at age 65) | 22.2 | 24.1 | | 24.5 | 26.0 | | 23.4 | 26.3 | | 23.0 | 25.3 | | 23.2 | 26.3 | | 23.9 | 25.6 |
31 December 2021 | | | | | | | | | | | | | | | | | |
| Member age 65 (current life expectancy) | 21.6 | 23.5 | | 22.9 | 24.2 | | 20.5 | 23.9 | | 22.0 | 24.3 | | 20.7 | 24.1 | | 21.9 | 23.6 |
| Member age 45 (life expectancy at age 65) | 22.1 | 24.0 | | 24.5 | 25.9 | | 23.2 | 26.2 | | 23.0 | 25.3 | | 22.8 | 25.8 | | 23.8 | 25.5 |
For the remaining territories, typical assumptions are that real salary increases will be from 0% to 8.0% (2021: 0% to 8.0%) per annum and discount rates will be from 0% to 7.5% (2021: 0% to 11.0%) above inflation. Pension increases, where allowed for, are generally assumed to be in line with inflation. Assumptions of life expectancy are in line with best practice in each territory. For countries where there is not a deep market in such corporate bonds, the yield on government bonds is used.
The valuation of retirement benefit schemes involves judgements about uncertain future events. Sensitivities in respect of the key assumptions used to measure the principal pension schemes as at 31 December 2022 are set out below. These sensitivities show the hypothetical impact of a change in each of the listed assumptions in isolation, with the exception of the sensitivity to inflation which incorporates the impact of certain correlating assumptions such as salary increases and pension increases. While each of these sensitivities holds all other assumptions constant, in practice such assumptions rarely change in isolation, while asset values also change, and the impacts may offset to some extent.
| | | | | | | | | | | | | | |
| 1 year
increase
£m | 1 year
decrease
£m | percentage increase
£m | percentage decrease
£m |
| Average life expectancy – increase/(decrease) of scheme liabilities | 170 | | (171) | | | |
| Rate of inflation (+/- 25bps) – increase/(decrease) of scheme liabilities | | | 95 | | (91) | |
| Discount rate (+/- 50bps) – (decrease)/increase of scheme liabilities | | | (309) | | 328 | |
A one percent increase in healthcare inflation would increase healthcare scheme liabilities by £25 million, and a one percent decrease would decrease liabilities by £19 million. The income statement effect of this change in assumption is not material.
| | | | | | | | | | | | | | | | | | | | | | | |
| BAT Annual Report and Form 20-F 2022 | Strategic Report | | Governance Report | | Financial Statements | | Other Information |
| | | | | | | |
| | | | | | | |
| | | | | | | |
| Financial Statements | | | | | | | |
Notes on Accounts Continued |
16 Deferred tax
Net deferred tax (liabilities)/assets comprise:
| | | | | | | | | | | | | | | | | | | | | | | | | | |
| Stock
relief
£m | Excess of
capital allowances over depreciation
£m | Tax
losses
£m | Undistributed earnings of associates and subsidiaries
£m | Retirement
benefits
£m | Trademarks
£m | Other
temporary
differences
£m | Total
£m |
| 1 January 2022 | (4) | | (151) | | 94 | | (221) | | 139 | | (16,779) | | 1,071 | | (15,851) | |
| Differences on exchange | (8) | | (20) | | 5 | | (8) | | 7 | | (2,109) | | 126 | | (2,007) | |
Credited/(charged) to the
income statement | 46 | | 50 | | 77 | | — | | (18) | | 70 | | (51) | | 174 | |
Credited/(charged) relating
to changes in tax rates | — | | (3) | | 34 | | — | | (1) | | 45 | | (9) | | 66 | |
Charged to other
comprehensive income | — | | — | | — | | — | | (89) | | — | | (17) | | (106) | |
| Net reclassifications as held-for-sale | (4) | | 9 | | — | | — | | — | | — | | (27) | | (22) | |
| 31 December 2022 | 30 | | (115) | | 210 | | (229) | | 38 | | (18,773) | | 1,093 | | (17,746) | |
| 1 January 2021 | (13) | | (189) | | 58 | | (231) | | 246 | | (16,784) | | 1,133 | | (15,780) | |
| Differences on exchange | (3) | | 5 | | (3) | | 2 | | (4) | | (149) | | 4 | | (148) | |
Credited/(charged) to the
income statement | 12 | | (16) | | 34 | | 8 | | (22) | | 63 | | (50) | | 29 | |
Credited/(charged) relating
to changes in tax rates | — | | 49 | | 5 | | — | | (3) | | 91 | | 16 | | 158 | |
Charged to other
comprehensive income | — | | — | | — | | — | | (78) | | — | | (32) | | (110) | |
| 31 December 2021 | (4) | | (151) | | 94 | | (221) | | 139 | | (16,779) | | 1,071 | | (15,851) | |
The net deferred tax liabilities are reflected in the Group balance sheet as follows: deferred tax asset of £682 million and deferred tax liability of £18,428 million (2021: deferred tax asset of £611 million and deferred tax liability of £16,462 million), after offsetting assets and liabilities where there is a legally enforceable right to offset current tax assets and liabilities and where the deferred income taxes relate to the same fiscal authority.
At the balance sheet date, the Group has not recognised a deferred tax asset in respect of unused tax losses of £364 million (2021: £342 million) which have no expiry date and unused tax losses of £429 million (2021: £452 million) which will expire within the next 20 years.
In 2022 and 2021 the Group has not recognised any deferred tax asset in respect of deductible temporary differences which have no expiry date and has not recognised £41 million (2021: £148 million) in respect of deductible temporary differences which will expire within the next 10 years.
At the balance sheet date, the Group has unused tax credits of £80 million (2021: £80 million) which have no expiry date. No amount of deferred tax has been recognised in respect of these unused tax credits.
At the balance sheet date, the aggregate amount of undistributed earnings of subsidiaries which would be subject to dividend withholding tax and for which no withholding tax liability has been recognised was £1.6 billion (2021: £0.9 billion).
| | | | | | | | | | | | | | | | | | | | | | | |
| BAT Annual Report and Form 20-F 2022 | Strategic Report | | Governance Report | | Financial Statements | | Other Information |
| | | | | | | |
| | | | | | | |
| | | | | | | |
| | | | | | | |
|
17 Trade and other receivables
| | | | | | | | |
| 2022 £m | 2021 £m |
| Trade receivables | 2,609 | | 2,998 | |
| Loans and other receivables | 1,568 | | 755 | |
| Prepayments and accrued income | 431 | | 408 | |
| 4,608 | | 4,161 | |
| Current | 4,367 | | 3,951 | |
| Non-current | 241 | | 210 | |
| 4,608 | | 4,161 | |
The majority of receivables are held in order to collect contractual cash flows, in accordance with the Group’s business model for managing financial assets, and hence are measured at amortised cost. In certain countries, however, the Group has entered into factoring arrangements and periodically sells certain trade receivables to banks and other financial institutions, without recourse, for cash. These trade receivables have been derecognised from the statement of financial position to reflect the transfer by the Group of substantially all of the risks and rewards of the receivables, including credit risk. Consequently, the cash inflows have been recognised within operating cash flows. Typically in these arrangements, the Group also acts as a collection agent for the bank. At 31 December 2022, the value of trade receivables derecognised through the factoring arrangements where the Group acts as a collection agent was £533 million (2021: £562 million) and where the Group does not act as a collection agent was £22 million (2021: £8 million). Included in trade receivables above is £164 million (2021: £110 million) of trade debtor balances which were available for factoring under these arrangements. In addition, the Group participates in certain supply chain finance programmes utilised by our customers allowing us to receive payment for invoices earlier than the agreed due date at a discounted value. At 31 December 2022, the value of trade receivables derecognised through these arrangements was £81 million (2021: £171 million).
Included in loans and other receivables are £114 million of litigation related deposits (2021: £84 million). Management has determined that these payments represent a resource controlled by the entity, as a result of past events and from which future economic benefits are expected to flow to the entity either by being recoverable on conclusion of ongoing appeal processes or by reducing amounts potentially payable should the appeal process fail. These deposits are held at the fair value of consideration transferred less impairment, if applicable. The effect of discounting would be immaterial.
In March 2017, the Brazilian Supreme Court ruled that for all taxpayers VAT should not be included in the calculation of social contribution taxes (PIS/Cofins) which are levied based on revenue. In August 2022, Souza Cruz achieved the favourable final and unappealable decision in its individual lawsuit in respect of overpaid taxes to the government. Accordingly, an asset has been recognised in the amount of £624 million (principal amount plus interest) . Furthermore, the Group has a right related to an earn-out linked to the timing of the credit compensation of £97 million.
Also included in loans and other receivables are deposits that do not meet the definition of cash and cash equivalents as well as loans provided to farmers. The cash flows arising from these transactions are included in investing activities and have been reconciled, in note 18, to the cash flow statement.
Prepayments and accrued income include £21 million (2021: £24 million) of accrued income primarily in relation to rebates.
Amounts receivable from related parties including associated undertakings are shown in note 30.
| | | | | | | | | | | | | | | | | | | | | | | |
| BAT Annual Report and Form 20-F 2022 | Strategic Report | | Governance Report | | Financial Statements | | Other Information |
| | | | | | | |
| | | | | | | |
| | | | | | | |
| Financial Statements | | | | | | | |
Notes on Accounts Continued |
Trade and other receivables have been reported in the balance sheet net of allowances as follows:
| | | | | | | | |
| 2022 £m | 2021 £m |
| Trade receivables – gross | 2,660 | | 3,035 | |
| Trade receivables – allowance | (51) | | (37) | |
| Loans and other receivables – gross | 1,568 | | 755 | |
| Loans and other receivables – allowance | — | | — | |
| Prepayments and accrued income | 431 | | 408 | |
| Net trade and other receivables per balance sheet | 4,608 | | 4,161 | |
The movements in the allowance account are as follows:
| | | | | | | | | | | | | | | | | | | | | | | |
| | | 2022 | | | | 2021 |
| Trade receivables
£m | Loans
and other receivables
£m | Total
£m | | Trade receivables
£m | Loans
and other receivables
£m | Total
£m |
| 1 January | 37 | | — | | 37 | | | 41 | | — | | 41 | |
| Differences on exchange | 2 | | — | | 2 | | | (2) | | — | | (2) | |
| Provided in the year | 28 | | — | | 28 | | | 7 | | — | | 7 | |
| Released | (16) | | — | | (16) | | | (9) | | — | | (9) | |
| 31 December | 51 | | — | | 51 | | | 37 | | — | | 37 | |
As permitted by IFRS 9, the loss allowance on trade receivables arising from the recognition of revenue under IFRS 15 is initially measured at an amount equal to lifetime expected losses. Allowances in respect of loans and other receivables are initially recognised at an amount equal to 12-month expected credit losses. Allowances are measured at an amount equal to the lifetime expected credit losses where the credit risk on the receivables increases significantly after initial recognition.
The Group holds bank guarantees, other guarantees and credit insurance in respect of some of the past due debtor balances.
Trade and other receivables are predominantly denominated in the functional currencies of subsidiary undertakings apart from the following: U.S. dollar: 1.9% (2021: 2.2%), UK sterling: 0.0% (2021: 0.1%), Euro: 5.7% (2021: 3.6%) and other currencies: 2.4% (2021: 0.9%).
There is no material difference between the above amounts for trade and other receivables and their fair value due to the short-term duration of the majority of trade and other receivables as determined using discounted cash flow analysis. There is no concentration of credit risk with respect to trade receivables as the Group has a large number of internationally dispersed customers.
| | | | | | | | | | | | | | | | | | | | | | | |
| BAT Annual Report and Form 20-F 2022 | Strategic Report | | Governance Report | | Financial Statements | | Other Information |
| | | | | | | |
| | | | | | | |
| | | | | | | |
| | | | | | | |
|
18 Investments held at fair value
| | | | | | | | | | | | | | | | | | | | | | | |
| | | 2022 | | | | 2021 |
| Fair value through P&L
£m | Fair value through OCI
£m | Total
£m | | Fair value through P&L
£m | Fair value through OCI
£m | Total
£m |
| 1 January | 469 | | 37 | | 506 | | | 255 | | 9 | | 264 | |
| Difference on exchange | 18 | | 1 | | 19 | | | 3 | | 1 | | 4 | |
| Additions | 209 | | 19 | | 228 | | | 327 | | 18 | | 345 | |
| Disposals | (93) | | (3) | | (96) | | | (98) | | — | | (98) | |
| Provisions | 17 | | — | | 17 | | | (24) | | — | | (24) | |
| Other fair value movements | 20 | | 6 | | 26 | | | 6 | | 9 | | 15 | |
| | | | | | | |
| | | | | | | |
| 31 December | 640 | | 60 | | 700 | | | 469 | | 37 | | 506 | |
| Current | 579 | | — | | 579 | | | 456 | | — | | 456 | |
| Non-current | 61 | | 60 | | 121 | | | 13 | | 37 | | 50 | |
| 640 | | 60 | | 700 | | | 469 | | 37 | | 506 | |
The Group’s investments principally consist of non-derivative financial assets that cannot be classified as loans and other receivables
or cash and cash equivalents, as well as investments made by the Group’s corporate venture capital unit, Btomorrow Ventures, and other Group companies.
Investments held at fair value through profit and loss principally consist of government securities, indexed deposits, treasury bills or other treasury products with maturities of more than three months which, if held for less than 12 months, form part of the Group’s definition
of net debt. Investments held at fair value through profit and loss also includes the Group’s investment in Charlotte’s Web (see note 14). Investments held at fair value through other comprehensive income (OCI) include equity investments in various start-up businesses which are held for their strategic value.
Investments held at fair value through profit and loss above include restricted amounts of £396 million (2021: £351 million) due to investments held by subsidiaries in CCAA protection (note 32), as well as £78 million (2021: £61 million) subject to potential exchange control restrictions.
In 2021, as part of the disposal of the Group’s operations in Iran (note 27(d)), a provision of £24 million against non-current investments held at fair value was charged to net finance costs as recoverability of these funds was not certain. During 2022, £17 million was recovered with some progress on resolving issues over the release of the remaining funds.
Investments held at fair value are predominantly denominated in the functional currencies of subsidiary undertakings with less than
5% in other currencies (2021: less than 4% in other currencies). There is no material difference between the investments held at fair value and their gross contractual values.
The classification of these investments under the IFRS 13 Fair Value Measurement fair value hierarchy is given in note 26. Fair values for quoted investments are based on observable market prices. If there is no active market for a financial asset, the fair value is established by using valuation techniques, including discounted cash flow analyses and share of net assets. The fair value of the 7-year convertible debenture in Charlotte’s Web has been determined using a binomial option pricing model.
Included in the values in the table above are £186 million (2021: £101 million) of level 3 assets. Movements in these assets in 2022 included £133 million (2021: £73 million) of additions, £82 million (2021: £56 million) of disposals and £26 million (£9 million) of net fair value gains.
Below is a reconciliation of the fair value investments cash flows to the cash flow statement – investing activities:
| | | | | | | | |
| 2022 £m | 2021 £m |
| Cash outflow from investments held at fair value | 228 | | 345 | |
| Cash outflow from loans and other receivables | 29 | | 24 | |
| Cash outflows from investments per cash flow statement | 257 | | 369 | |
| Cash inflow from investments held at fair value | (96) | | (98) | |
| Cash inflow from loans and other receivables | (32) | | (43) | |
| Cash inflows from investments per cash flow statement | (128) | | (141) | |
| | | | | | | | | | | | | | | | | | | | | | | |
| BAT Annual Report and Form 20-F 2022 | Strategic Report | | Governance Report | | Financial Statements | | Other Information |
| | | | | | | |
| | | | | | | |
| | | | | | | |
| Financial Statements | | | | | | | |
Notes on Accounts Continued |
19 Derivative financial instruments
The fair values of derivatives are determined based on market data (primarily yield curves, implied volatilities and exchange rates) to calculate the present value of all estimated flows associated with each derivative at the balance sheet date. In the absence of sufficient market data, fair values would be based on the quoted market price of similar derivatives. The classification of these derivative assets and liabilities under the IFRS 13 fair value hierarchy is given in note 26.
| | | | | | | | | | | | | | | | | |
| | 2022 | | | 2021 |
| Assets
£m | Liabilities
£m | | Assets
£m | Liabilities
£m |
| Fair value hedges | | | | | |
–interest rate swaps | 27 | | 435 | | | 5 | | 2 | |
| – cross-currency swaps | 126 | | — | | | 114 | | — | |
| Cash flow hedges | | | | | |
–interest rate swaps | 5 | | — | | | — | | — | |
| – cross-currency swaps | 127 | | 121 | | | 107 | | 35 | |
| – forward foreign currency contracts | 70 | | 71 | | | 81 | | 35 | |
| Net investment hedges | | | | | |
| – forward foreign currency contracts | 45 | | 247 | | | 62 | | 81 | |
| Held-for-trading* | | | | | |
| – interest rate swaps | 12 | | 14 | | | 28 | | 34 | |
| – forward foreign currency contracts | 149 | | 41 | | | 28 | | 127 | |
| Total | 561 | | 929 | | | 425 | | 314 | |
| Current | 430 | | 427 | | | 182 | | 235 | |
| Non-current | 131 | | 502 | | | 243 | | 79 | |
| 561 | | 929 | | | 425 | | 314 | |
| Derivatives | | | | | |
| – in respect of net debt** | 438 | | 605 | | | 273 | | 182 | |
| – other | 123 | | 324 | | | 152 | | 132 | |
| 561 | | 929 | | | 425 | | 314 | |
Notes:
* Derivatives which do not meet the tests for hedge accounting under IFRS 9 or which are not designated as hedging instruments are referred to as ‘held-for-trading’. These derivatives principally consist of interest rate swaps and forward foreign currency contracts which have not been designated as hedges due to their value changes offsetting with other components of net finance costs relating to financial assets and financial liabilities. The Group does not use derivatives for speculative purposes. All derivatives are undertaken for risk management purposes.
** Derivatives in respect of net debt are in a net liability position of £167 million as at 31 December 2022 (2021: net asset position of £91 million). The Group’s net debt is presented in note 23.
For cash flow hedges, the timing of expected cash flows is as follows: assets of £202 million (2021: £188 million) of which £72 million (2021: £78 million) is expected within one year and £nil million (2021: £107 million) beyond five years and liabilities of £192 million (2021: £70 million) of which £134 million (2021: £33 million) is expected within one year and £nil (2021: £nil) beyond five years.
The Group’s cash flow hedges are principally in respect of sales or purchases of inventory and certain debt instruments. A certain number of forward foreign currency contracts were used to manage the currency profile of external borrowings and are reflected in the currency table in note 23. Interest rate swaps have been used to manage the interest rate profile of external borrowings and are reflected in the re-pricing table in note 23.
| | | | | | | | | | | | | | | | | | | | | | | |
| BAT Annual Report and Form 20-F 2022 | Strategic Report | | Governance Report | | Financial Statements | | Other Information |
| | | | | | | |
| | | | | | | |
| | | | | | | |
| | | | | | | |
|
The tables below set out the maturities of the Group’s derivative financial instruments on an undiscounted contractual basis, based on spot rates.
The maturity dates of all gross-settled derivative financial instruments are as follows:
| | | | | | | | | | | | | | | | | | | | | | | | | | | | | | | | | | | |
| | | | | 2022 | | | | | | 2021 |
| Assets | | Liabilities | | Assets | | Liabilities |
| Inflow
£m | Outflow
£m | | Inflow
£m | Outflow
£m | | Inflow
£m | Outflow
£m | | Inflow
£m | Outflow
£m |
| Within one year | | | | | | | | | | | |
–forward foreign currency contracts | 12,506 | | (12,249) | | | 8,691 | | (9,049) | | | 5,743 | | (4,727) | | | 12,407 | | (12,096) | |
| – cross-currency swaps | 731 | | (608) | | | 689 | | (767) | | | 14 | | (22) | | | 17 | | (36) | |
| Between one and two years | | | | | | | | | | | |
–forward foreign currency contracts | 199 | | (193) | | | 243 | | (247) | | | 807 | | (779) | | | 143 | | (113) | |
| – cross-currency swaps | 9 | | (15) | | | 10 | | (17) | | | 705 | | (592) | | | 665 | | (689) | |
| Between two and three years | | | | | | | | | | | |
| – cross-currency swaps | 9 | | (15) | | | 460 | | (502) | | | 9 | | (15) | | | 10 | | (15) | |
| Between three and four years | | | | | | | | | | | |
| – cross-currency swaps | 9 | | (15) | | | — | | — | | | 9 | | (15) | | | 460 | | (445) | |
| Between four and five years | | | | | | | | | | | |
| – cross-currency swaps | 756 | | (579) | | | — | | — | | | 9 | | (15) | | | — | | — | |
| Beyond five years | | | | | | | | | | | |
| – cross-currency swaps | — | | — | | | — | | — | | | 726 | | (579) | | | — | | — | |
| 14,219 | | (13,674) | | | 10,093 | | (10,582) | | | 8,022 | | (6,744) | | | 13,702 | | (13,394) | |
The maturity dates of net-settled derivative financial instruments, which primarily relate to interest rate swaps, are as follows:
| | | | | | | | | | | | | | | | | |
| | 2022 | | | 2021 |
| Assets
Inflow/
(outflow)
£m | Liabilities
Outflow/
(inflow)
£m | | Assets
Inflow/
(outflow)
£m | Liabilities
Outflow/
(inflow)
£m |
| Within one year | 263 | | 531 | | | 127 | | 225 | |
| Between one and two years | 30 | | 134 | | | 25 | | 19 | |
| Between two and three years | — | | 84 | | | 23 | | 11 | |
| Between three and four years | — | | 66 | | | (2) | | 11 | |
| Between four and five years | — | | 7 | | | — | | 12 | |
| Beyond five years | 23 | | 460 | | | — | | (17) | |
| 316 | | 1,282 | | | 173 | | 261 | |
| | | | | | | | | | | | | | | | | | | | | | | |
| BAT Annual Report and Form 20-F 2022 | Strategic Report | | Governance Report | | Financial Statements | | Other Information |
| | | | | | | |
| | | | | | | |
| | | | | | | |
| Financial Statements | | | | | | | |
Notes on Accounts Continued |
The items designated as hedging instruments are as follows:
| | | | | | | | | | | | | | | | | |
| | 2022 | | | 2021 |
| Nominal
amount of hedging instrument
£m | Changes in
fair value used for calculating hedge ineffectiveness
£m | | Nominal
amount of hedging instrument
£m | Changes in
fair value used for calculating hedge ineffectiveness
£m |
| Interest rate risk exposure: | | | | | |
| Fair value hedges | | | | | |
| – interest rate swaps | 4,657 | | (417) | | | 4,413 | | (35) | |
| – cross-currency swaps | 710 | | 11 | | | 672 | | (52) | |
| Cash flow hedges | | | | | |
| – interest rate swaps | 1,247 | | (5) | | | — | | — | |
| – cross-currency swaps | 1,825 | | 60 | | | 1,751 | | 69 | |
| Foreign currency risk exposure: | | | | | |
| Cash flow hedges | | | | | |
| – forward foreign currency contracts | 3,695 | | (2) | | | 3,573 | | 49 | |
| Net investment hedges (derivative related) | | | | | |
| – forward foreign currency contracts | 6,407 | | (208) | | | 6,120 | | (27) | |
| Net investment hedges (non-derivative related) | | | | | |
| – debt (carrying value) in borrowings designated as net investment hedges of net assets | 389 | | 21 | | | 368 | | (24) | |
20 Inventories
| | | | | | | | |
| 2022 £m | 2021 £m |
| Raw materials and consumables | 2,370 | | 2,100 | |
| Finished goods and work in progress | 3,159 | | 3,046 | |
| Goods purchased for resale | 142 | | 133 | |
| 5,671 | | 5,279 | |
Write-offs taken to other operating expenses in the Group income statement were £250 million (2021: £215 million; 2020: £309 million). Goods purchased for resale include Group brands produced under third-party contract manufacturing arrangements.
| | | | | | | | | | | | | | | | | | | | | | | |
| BAT Annual Report and Form 20-F 2022 | Strategic Report | | Governance Report | | Financial Statements | | Other Information |
| | | | | | | |
| | | | | | | |
| | | | | | | |
| | | | | | | |
|
21 Cash and cash equivalents
| | | | | | | | |
| 2022 £m | 2021 £m |
| Cash and bank balances | 3,116 | | 2,529 | |
| Cash equivalents | 330 | | 280 | |
| 3,446 | | 2,809 | |
The carrying value of cash and cash equivalents approximates their fair value.
Cash and cash equivalents are denominated in the functional currency of the subsidiary undertaking or other currencies as shown below:
| | | | | | | | |
| 2022 £m | 2021 £m |
| Functional currency | 2,979 | | 2,422 | |
| U.S. dollar | 207 | | 170 | |
| Euro | 129 | | 92 | |
| Other currencies | 131 | | 125 | |
| 3,446 | | 2,809 | |
In the Group cash flow statement, net cash and cash equivalents are shown after deducting bank overdrafts and accrued interest where applicable, as follows: | | | | | | | | |
| 2022 £m | 2021 £m |
| Cash and cash equivalents as above | 3,446 | | 2,809 | |
| Less overdrafts and accrued interest | (109) | | (346) | |
| Net cash and cash equivalents | 3,337 | | 2,463 | |
Cash and cash equivalents also include £34 million (2021: £42 million) of cash that is held as a hedging instrument.
Restricted cash
Cash and cash equivalents include restricted amounts of £1,411 million (2021: £1,024 million) due to subsidiaries in CCAA protection (note 32), as well as £324 million (2021: £305 million) principally due to exchange control restrictions.
| | | | | | | | | | | | | | | | | | | | | | | |
| BAT Annual Report and Form 20-F 2022 | Strategic Report | | Governance Report | | Financial Statements | | Other Information |
| | | | | | | |
| | | | | | | |
| | | | | | | |
| Financial Statements | | | | | | | |
Notes on Accounts Continued |
22 Capital and reserves
(a) Share capital
| | | | | | | | | | | |
| | Ordinary shares of 25p each Number of shares | | £m |
| Allotted and fully paid | | | |
1 January 2022 | 2,456,617,788 | | 614.15 | |
| Changes during the year | | | |
| – share option schemes | 249,632 | | 0.06 | |
31 December 2022 | 2,456,867,420 | | 614.21 | |
| Allotted and fully paid | | | |
1 January 2021 | 2,456,591,597 | | 614.14 | |
| Changes during the year | | | |
| – share option schemes | 26,191 | | 0.01 | |
31 December 2021 | 2,456,617,788 | | 614.15 | |
| Allotted and fully paid | | | |
1 January 2020 | 2,456,520,738 | | 614.12 | |
| Changes during the year | | | |
| – share option schemes | 70,859 | | 0.02 | |
31 December 2020 | 2,456,591,597 | | 614.14 | |
Share capital
The Company’s ordinary shares are fully paid and no further contribution of capital may be required by the Company from the shareholders. All ordinary shares rank equally with regard to participation in dividends and to share in the proceeds of the Company’s residual assets upon a winding up of the Company. Shareholders may, by ordinary resolution, declare final dividends, but not in excess of the amount recommended by the Directors. Holders of ordinary shares have no pre-emptive rights.
On a show of hands every shareholder who is present in person at a general meeting is entitled to one vote regardless of the number of shares held by the shareholder, unless a poll is demanded. On a poll, every shareholder who is present in person or by proxy has one vote for every share held by the shareholder. The Company’s Annual General Meeting voting is undertaken by way of a poll.
All rights attached to the Company’s shares held by the Group as treasury shares are suspended until those shares are reissued.
(b) Share premium account, capital redemption reserves and merger reserves comprise:
| | | | | | | | | | | | | | |
| Share
premium
account
£m | Capital
redemption
reserves
£m | Merger
reserves
£m | Total
£m |
31 December 2022 | 113 | | 101 | | 26,414 | | 26,628 | |
31 December 2021 | 107 | | 101 | | 26,414 | | 26,622 | |
31 December 2020 | 103 | | 101 | | 26,414 | | 26,618 | |
Share premium account
The share premium account includes the difference between the value of shares issued and their nominal value. The share premium increase includes £5 million (2021: £nil; 2020: £2 million) in respect of ordinary shares issued under the Company’s share option schemes. A further £1 million (2021: £4 million; 2020: £7 million) increase in share premium is related to shares repurchased and not cancelled that have been transferred from the Company to other Group undertakings, to be granted to certain employees on vesting of awards, and represents the excess of transfer price of the share over the original weighted average cost of shares.
Capital redemption account
On the purchase of own shares as part of the share buy-back programme for shares which are cancelled, a transfer is made from retained earnings to the capital redemption reserve equivalent to the nominal value of shares purchased. Purchased shares which are not cancelled are classified as treasury shares and presented as a deduction from total equity.
Merger reserve account
The merger reserve comprises:
a.In 1999, shares were issued for the acquisition of the Rothmans International B.V. Group and the difference between the fair value of shares issued and their nominal value of £3,748 million was credited to merger reserves; and
b.On 25 July 2017, the Group announced the completion of the acquisition of the remaining 57.8% of RAI not already owned by the Group. Shares were issued for the acquisition and the difference between the fair value of shares issued and their nominal value of £22,666 million was credited to merger reserves.
| | | | | | | | | | | | | | | | | | | | | | | |
| BAT Annual Report and Form 20-F 2022 | Strategic Report | | Governance Report | | Financial Statements | | Other Information |
| | | | | | | |
| | | | | | | |
| | | | | | | |
| | | | | | | |
|
(c) Equity attributed to owners of the parent - movements in other reserves and retained earnings (which are after deducting treasury shares) comprise:
| | | | | | | | | | | | | | | | | | | | | | | | | | |
| | | | | | | Retained earnings |
| Translation
reserve
(i)
£m | Hedging
reserve
(ii)
£m | Fair value reserve
(iii)
£m | Revaluation
reserve
(iv)
£m | Other
(v)
£m | Total other
reserves
£m | Treasury
shares
(vi)
£m | Other
£m |
1 January 2022 | (6,427) | | (363) | | 6 | | 179 | | 573 | | (6,032) | | (5,122) | | 49,334 | |
| Comprehensive income and expense | | | | | | | | |
| Profit for the year | — | | — | | — | | — | | — | | — | | — | | 6,666 | |
| Foreign currency translation and hedges of net investments in foreign operations | | | | | | | | |
–differences on exchange from translation of foreign operations | 8,920 | | — | | — | | — | | — | | 8,920 | | — | | — | |
| – reclassified and reported in profit for the year | 5 | | — | | — | | — | | — | | 5 | | — | | — | |
– net investment hedges - net fair value
gains on derivatives | (578) | | — | | — | | — | | — | | (578) | | — | | — | |
–net investment hedges - differences on exchange on borrowings | (21) | | — | | — | | — | | — | | (21) | | — | | — | |
| Cash flow hedges | | | | | | | | |
| – net fair value gains | — | | 81 | | — | | — | | — | | 81 | | — | | — | |
| – reclassified and reported in profit for the year | — | | 101 | | — | | — | | — | | 101 | | — | | — | |
–tax on net fair value gains in respect of cash flow hedges (note 10(f)) | — | | (17) | | — | | — | | — | | (17) | | — | | — | |
| Investments held at fair value | | | | | | | | |
| – net fair value gains | — | | — | | 6 | | — | | — | | 6 | | — | | — | |
Associates - share of OCI, net of tax (note 9) | 6 | | — | | — | | — | | — | | 6 | | — | | — | |
| Retirement benefit schemes | | | | | | | | |
– net actuarial gains (note 15) | — | | — | | — | | — | | — | | — | | — | | 316 | |
– surplus recognition (note 15) | — | | — | | — | | — | | — | | — | | — | | (39) | |
–tax on actuarial gains in respect of subsidiaries (note 10(f)) | — | | — | | — | | — | | — | | — | | — | | (95) | |
Associates - share of OCI, net of tax (note 9) | — | | — | | 18 | | — | | — | | 18 | | — | | 1 | |
| Other changes in equity | | | | | | | | |
Cash flow hedges reclassified and
reported in total assets | — | | (129) | | — | | — | | — | | (129) | | — | | — | |
| Employee share options | | | | | | | | |
| – value of employee services | — | | — | | — | | — | | — | | — | | — | | 81 | |
| – treasury shares used for share option schemes | — | | — | | — | | — | | — | | — | | 14 | | (15) | |
| Dividends and other appropriations | | | | | | | | |
| – ordinary shares | — | | — | | — | | — | | — | | — | | — | | (4,915) | |
| Purchase of own shares | | | | | | | | |
| – held in employee share ownership trusts | — | | — | | — | | — | | — | | — | | (80) | | — | |
| – share buy-back programme | — | | — | | — | | — | | — | | — | | (2,012) | | — | |
| Perpetual hybrid bonds | | | | | | | | |
| – coupons paid | — | | — | | — | | — | | — | | — | | — | | (59) | |
| – tax on coupons paid | — | | — | | — | | — | | — | | — | | — | | 11 | |
Non-controlling interests - acquisitions (note 27(b)) | — | | — | | — | | — | | — | | — | | — | | (1) | |
| Reclassification of equity related to assets held-for-sale | 295 | | — | | — | | — | | — | | 295 | | — | | — | |
| Other movements | — | | — | | — | | — | | — | | — | | 84 | | (88) | |
31 December 2022 | 2,200 | | (327) | | 30 | | 179 | | 573 | | 2,655 | | (7,116) | | 51,197 | |
| | | | | | | | | | | | | | | | | | | | | | | |
| BAT Annual Report and Form 20-F 2022 | Strategic Report | | Governance Report | | Financial Statements | | Other Information |
| | | | | | | |
| | | | | | | |
| | | | | | | |
| Financial Statements | | | | | | | |
Notes on Accounts Continued |
| | | | | | | | | | | | | | | | | | | | | | | | | | |
| | | | | | | Retained earnings |
| Translation
reserve
(i)
£m | Hedging
reserve
(ii)
£m | Fair value reserve
(iii)
£m | Revaluation
reserve
(iv)
£m | Other
(v)
£m | Total other
reserves
£m | Treasury
shares
(vi)
£m | Other
£m |
1 January 2021 | (6,830) | | (504) | | (18) | | 179 | | 573 | | (6,600) | | (5,150) | | 47,191 | |
| Comprehensive income and expense | | | | | | | | |
| Profit for the year | — | | — | | — | | — | | — | | — | | — | | 6,801 | |
| Foreign currency translation and hedges of net investments in foreign operations | | | | | | | | |
–differences on exchange from translation of foreign operations | 31 | | — | | — | | — | | — | | 31 | | — | | — | |
| – reclassified and reported in profit for the year | 291 | | — | | — | | — | | — | | 291 | | — | | — | |
–net investment hedges – net fair value gains on derivatives | 75 | | — | | — | | — | | — | | 75 | | — | | — | |
–net investment hedges – differences on exchange on borrowings | 24 | | — | | — | | — | | — | | 24 | | — | | — | |
| Cash flow hedges | | | | | | | | |
| – net fair value gains | — | | 95 | | — | | — | | — | | 95 | | — | | — | |
| – reclassified and reported in profit for the year | — | | 32 | | — | | — | | — | | 32 | | — | | — | |
–tax on net fair value gains in respect of cash flow hedges (note 10(f)) | — | | (32) | | — | | — | | — | | (32) | | — | | — | |
| Investments held at fair value | | | | | | | | |
| – net fair value gains | — | | — | | 9 | | — | | — | | 9 | | — | | — | |
Associates – share of OCI, net of tax (note 9) | (18) | | 1 | | — | | — | | — | | (17) | | — | | — | |
| Retirement benefit schemes | | | | | | | | |
– net actuarial gains (note 15) | — | | — | | — | | — | | — | | — | | — | | 382 | |
– surplus recognition (note 15) | — | | — | | — | | — | | — | | — | | — | | (1) | |
–tax on actuarial gains in respect of subsidiaries (note 10(f)) | — | | — | | — | | — | | — | | — | | — | | (82) | |
Associates - share of OCI, net of tax (note 9) | — | | — | | 15 | | — | | — | | 15 | | — | | (1) | |
| Other changes in equity | | | | | | | | |
| Cash flow hedges reclassified and reported in total assets | — | | 45 | | — | | — | | — | | 45 | | — | | — | |
| Employee share options | | | | | | | | |
| – value of employee services | — | | — | | — | | — | | — | | — | | — | | 76 | |
| – treasury shares used for share option schemes | — | | — | | — | | — | | — | | — | | 13 | | (17) | |
| Dividends and other appropriations | | | | | | | | |
| – ordinary shares | — | | — | | — | | — | | — | | — | | — | | (4,904) | |
| Purchase of own shares | | | | | | | | |
| – held in employee share ownership trusts | — | | — | | — | | — | | — | | — | | (82) | | — | |
| Perpetual hybrid bonds | | | | | | | | |
| – coupons paid | — | | — | | — | | — | | — | | — | | — | | (6) | |
| – tax on coupons paid | — | | — | | — | | — | | — | | — | | — | | 1 | |
Non-controlling interests – acquisitions
(note 27(b)) | — | | — | | — | | — | | — | | — | | — | | (5) | |
| Other movements | — | | — | | — | | — | | — | | — | | 97 | | (101) | |
31 December 2021 | (6,427) | | (363) | | 6 | | 179 | | 573 | | (6,032) | | (5,122) | | 49,334 | |
| | | | | | | | | | | | | | | | | | | | | | | |
| BAT Annual Report and Form 20-F 2022 | Strategic Report | | Governance Report | | Financial Statements | | Other Information |
| | | | | | | |
| | | | | | | |
| | | | | | | |
| | | | | | | |
|
| | | | | | | | | | | | | | | | | | | | | | | | | | |
| | | | | | | Retained earnings |
| Translation
reserve
(i)
£m | Hedging
reserve
(ii)
£m | Fair value reserve
(iii)
£m | Revaluation
reserve
(iv)
£m | Other
(v)
£m | Total other
reserves
£m | Treasury
shares
(vi)
£m | Other
£m |
1 January 2020 | (3,974) | | (346) | | 13 | | 179 | | 573 | | (3,555) | | (5,261) | | 45,495 | |
| Comprehensive income and expense | | | | | | | | |
| Profit for the year | — | | — | | — | | — | | — | | — | | — | | 6,400 | |
| Foreign currency translation and hedges of net investments in foreign operations | | | | | | | | |
–differences on exchange from translation of foreign operations | (2,582) | | — | | — | | — | | — | | (2,582) | | — | | — | |
–net investment hedges – net fair value
losses on derivatives | (16) | | — | | — | | — | | — | | (16) | | — | | — | |
–net investment hedges – differences on exchange on borrowings | (163) | | — | | — | | — | | — | | (163) | | — | | — | |
| Cash flow hedges | | | | | | | | |
| – net fair value losses | — | | (256) | | — | | — | | — | | (256) | | — | | — | |
| – reclassified and reported in profit for the year | — | | 90 | | — | | — | | — | | 90 | | — | | — | |
–tax on net fair value losses in respect of cash flow hedges (note 10(f)) | — | | 44 | | — | | — | | — | | 44 | | — | | — | |
Associates – share of OCI, net of tax (note 9) | (95) | | (3) | | — | | — | | — | | (98) | | — | | — | |
| Retirement benefit schemes | | | | | | | | |
– net actuarial gains (note 15) | — | | — | | — | | — | | — | | — | | — | | 105 | |
– surplus recognition (note 15) | — | | — | | — | | — | | — | | — | | — | | 10 | |
–tax on actuarial gains in respect of subsidiaries (note 10(f)) | — | | — | | — | | — | | — | | — | | — | | (26) | |
Associates - share of OCI, net of tax (note 9) | — | | — | | (31) | | — | | — | | (31) | | — | | (3) | |
| Other changes in equity | | | | | | | | |
| Cash flow hedges reclassified and reported in total assets | — | | (33) | | — | | — | | — | | (33) | | — | | — | |
| Employee share options | | | | | | | | |
–value of employee services | — | | — | | — | | — | | — | | — | | — | | 88 | |
–treasury shares used for share option schemes | — | | — | | — | | — | | — | | — | | 9 | | (16) | |
| Dividends and other appropriations | | | | | | | | |
–ordinary shares | — | | — | | — | | — | | — | | — | | — | | (4,747) | |
| Purchase of own shares | | | | | | | | |
–held in employee share ownership trusts | — | | — | | — | | — | | — | | — | | (17) | | — | |
| Other movements | — | | — | | — | | — | | — | | — | | 119 | | (115) | |
31 December 2020 | (6,830) | | (504) | | (18) | | 179 | | 573 | | (6,600) | | (5,150) | | 47,191 | |
(i) Translation reserve:
The translation reserve is explained in the accounting policy on foreign currencies in note 1.
In 2022, included within the differences on exchange from translation of foreign operations is £5 million (2021: £291 million; 2020: £nil) which has been reclassified from reserves to the income statement and recognised in other operating expenses as an adjusting item. This amount includes £4 million in respect of the exit from Egypt and £2 million (2021: £19 million; 2020: £nil) from other Quantum-related initiatives. In addition, in certain markets, the Group has moved to above market business models utilising local distributors as importers. As a consequence, with the cessation of a physical presence in these markets, foreign exchange previously recognised in other comprehensive income for these entities has been reclassified to the income statement.
In 2022, as detailed in note 14, as a result of the liquidation of Yemen, the Group reclassified to the income statement the foreign exchange previously recognised in associates other comprehensive income. This resulted in a credit of £1 million to the income statement.
| | | | | | | | | | | | | | | | | | | | | | | |
| BAT Annual Report and Form 20-F 2022 | Strategic Report | | Governance Report | | Financial Statements | | Other Information |
| | | | | | | |
| | | | | | | |
| | | | | | | |
| Financial Statements | | | | | | | |
Notes on Accounts Continued |
(ii) Hedging reserve:
The hedging reserve is explained in the accounting policy on financial instruments in note 1.
Of the amounts reclassified from the hedging reserve and reported in profit for the year, a loss of £16 million (2021: £29 million loss; 2020: £16 million gain) and a loss of £2 million (2021: £6 million gain; 2020: £19 million gain) were reported within revenue and raw materials and consumables, respectively, together with a gain of £46 million (2021: £4 million loss; 2020: £2 million loss) reported in other operating expenses, and a gain of £73 million (2021: £59 million gain; 2020: £57 million gain) reported within net finance costs.
The Group hedges certain foreign currency denominated borrowings with cross-currency interest rate swaps. As permitted by IFRS 9 Financial Instruments, the foreign currency basis spreads have been separated from the hedging instrument and are recognised in reserves as a ‘cost of hedging’ and are reclassified to the income statement in the same period in which profit and loss is affected by the hedged expected cashflows as a component of the associated interest expense. The basis spreads are included within hedging reserves as they are not material. Included within the balance of hedging reserves at 31 December 2022 is an accumulated gain of £5 million (2021: £4 million; 2020: £9 million) in respect of the cost of hedging.
(iii) Fair value reserve:
The fair value reserve is explained in the accounting policy on financial instruments in note 1. Fair value gains and losses arising from investments held at fair value through other comprehensive income are recognised in this reserve.
(iv) Revaluation reserve:
The revaluation reserve relates to the acquisition of the cigarette and snus business of ST in 2008.
(v) Other reserves:
Other reserves comprise:
(a) £483 million which arose in 1998 from merger accounting in a Scheme of Arrangement and Reconstruction whereby British American Tobacco p.l.c. acquired the entire share capital of B.A.T Industries p.l.c. and the share capital of that company’s principal financial services subsidiaries was distributed, so effectively demerging them; and
(b) In the 1999 Rothmans transaction, convertible redeemable preference shares were issued as part of the consideration. The discount on these shares was amortised by crediting other reserves and charging retained earnings. The £90 million balance in other reserves comprises the accumulated balance in respect of the preference shares converted during 2004.
(vi) Treasury shares:
Total equity attributable to owners of the parent is stated after deducting the cost of treasury shares which include £6,821 million (2021: £4,823 million; 2020: £4,836 million) for shares repurchased and not cancelled and £295 million (2021: £299 million; 2020: £314 million) in respect of the cost of own shares held in employee share ownership trusts. The increase in the shares repurchased and not cancelled is primarily due to the Group’s share buy-back programme net of shares reissued to satisfy the vesting of U.S. share options.
On 10 February 2022, the Board approved a proposed £2 billion share buy-back programme for 2022. The previous share buy-back programme was suspended from 30 July 2014. As at 31 December 2022, treasury shares include 5,920,638 (2021: 6,269,959; 2020: 6,053,158) shares held in trust and 221,000,192 (2021: 161,930,217; 2020: 162,347,246) shares repurchased and not cancelled as part of the Company’s share buy-back programme. From March 2020, the Company has utilised shares acquired in the share buy-back programme to satisfy shared-based payment awards made to certain employees.
| | | | | | | | | | | | | | | | | | | | | | | |
| BAT Annual Report and Form 20-F 2022 | Strategic Report | | Governance Report | | Financial Statements | | Other Information |
| | | | | | | |
| | | | | | | |
| | | | | | | |
| | | | | | | |
|
(d) Perpetual hybrid bonds
On 27 September 2021, the Group issued two €1 billion perpetual hybrid bonds amounting to £1,703 million, which have been classified
as equity. Issuance costs of these bonds, amounting to €26 million (£22 million), have been recognised within equity.
These bonds include redemption options exercisable at the Group’s discretion from September 2026 to December 2026 (the
3% perpetual hybrid bond) and June 2029 to September 2029 (the 3.75% perpetual hybrid bond), on specified dates thereafter, or in
the event of specific circumstances (such as a change in IFRS or tax regime) as set out in the individual terms of each issue.
The coupons associated with these perpetual hybrid bonds are fixed at 3% until 2026 and 3.75% until 2029, respectively, and would reset to rates determined by the contractual terms of each instrument on certain dates thereafter. The bonds are perpetual in nature and do not have maturity dates for the repayment of principal. The contractual terms of the perpetual hybrid bonds allow the Group to defer coupon payments, however certain contingent events could trigger mandatory payments of such deferred coupons, including the payment of dividends on, and the repurchase of, ordinary shares, subject to certain exceptions in each case. The full terms and conditions of such events can be found in the prospectus dated 27 September 2021 which is available under the debt facilities section of the Group’s debt microsite (bat.com/debt).
As the Group has the unconditional right to avoid transferring cash or another financial asset in relation to these bonds, they are classified as equity instruments in the consolidated financial statements.
During the year, the Group did not defer any eligible coupon payments and paid a coupon of £33 million in September 2022 on the
3.75% September 2029 bond and £27 million in December 2022 (December 2021: £6 million) on the 3% December 2026 bond which has been recognised within equity.
The fair value of these bonds at 31 December 2022 is £1,331 million (2021: £1,651 million).
(e) Non-controlling interests
Movements in non-controlling interests primarily relate to profit for the year and dividends (reported as a movement in retained earnings) and differences on exchange arising from the translation into sterling (reported as a movement in other reserves). Information on subsidiaries with material non-controlling interests is provided in note 32.
(f) Dividends and other appropriations
The interim quarterly dividend payment for the year ended 31 December 2021 of 217.8p per ordinary share (31 December 2020: 215.6p per ordinary share) was payable in four equal instalments: amounts payable in May 2022 of £1,239 million (May 2021: £1,241 million), August 2022 of £1,223 million (August 2021: £1,228 million), November 2022 of £1,219 million (November 2021: £1,232 million) and £1,211 million in February 2023 (February 2022: £1,236 million) respectively. The total dividends recognised as an appropriation from reserves in 2022 was £4,915 million (2021: £4,904 million; 2020: £4,747 million).
The Board has declared an interim dividend of 230.9p per ordinary share of 25p, for the year ended 31 December 2022, payable in four equal quarterly instalments of 57.72p per ordinary share in May 2023, August 2023, November 2023 and February 2024. These payments will be recognised as appropriations from reserves in 2023 and 2024. The total amount payable is estimated to be £5,163 million based on the number of shares outstanding at the date of these accounts.
| | | | | | | | | | | | | | | | | | | | | | | |
| BAT Annual Report and Form 20-F 2022 | Strategic Report | | Governance Report | | Financial Statements | | Other Information |
| | | | | | | |
| | | | | | | |
| | | | | | | |
| Financial Statements | | | | | | | |
Notes on Accounts Continued |
23 Borrowings
| | | | | | | | | | | | | | | | | |
| Currency | Maturity dates | Interest rates | 2022 £m | 2021 £m |
| Eurobonds | Euro | 2023 to 2045 | 0.9% to 3.1% | 7,149 | 7,316 | |
| | | | | |
| UK sterling | 2024 to 2055 | 2.1% to 7.3% | 3,884 | 4,086 | |
| Swiss franc | 2026 | 1.4% | 226 | 203 | |
| Bonds issued pursuant to Rules under the U.S. Securities Act (as amended) | U.S. dollar | 2023 to 2052 | 1.7% to 8.1% | 30,152 | 25,625 |
| U.S. dollar* | 2022 | USD3m LIBOR + 0.88 bps | — | 554 |
| Bonds and notes | | | | 41,411 | 37,784 |
| Commercial paper | | | | 27 | 269 |
| Other loans | | | | 875 | 500 |
| Bank loans | | | | 203 | 313 |
| Bank overdrafts | | | | 106 | 346 |
| Lease liabilities | | | | 517 | 446 |
| | | | 43,139 | 39,658 |
Note:
* As at 31 December 2022, there were no outstanding floating rate U.S. dollar bonds (2021: £554 million, 3M LIBOR +88bps)
Perpetual hybrid bonds issued by the Group have been classified as equity (note 22(d)) and are therefore excluded from borrowings.
Other loans comprise £875 million (2021: £500 million) relating to a bilateral facility. Commercial paper is issued at competitive rates to meet short-term borrowing requirements as and when needed.
Current borrowings per the balance sheet include interest payable of £524 million at 31 December 2022 (2021: £460 million). Included within borrowings are £9,223 million (2021: £9,197 million) of borrowings subject to fair value hedges where their amortised cost has
been decreased by £355 million (2021: £101 million increase).
The fair value of borrowings is estimated to be £37,170 million (2021: £40,557 million) of which £35,440 million (2021: £38,683 million)
has been calculated using quoted market prices and is within level 1 of the fair value hierarchy and £1,730 million (2021: £1,874 million)
has been calculated based on discounted cash flow analysis and is within level 3 of the fair value hierarchy.
Amounts secured on Group assets including property, plant and equipment, inventory and receivables as at 31 December 2022 are
£9 million (2021: £10 million). The majority of lease liabilities are also secured against the associated assets.
Borrowings are repayable as follows:
| | | | | | | | | | | | | | | | | |
| Per balance sheet | | Contractual gross maturities |
| 2022 £m | 2021 £m | | 2022 £m | 2021 £m |
| Within one year | 4,413 | | 3,992 | | | 5,426 | | 4,860 | |
| Between one and two years | 4,253 | | 2,484 | | | 5,763 | | 3,740 | |
| Between two and three years | 4,406 | | 3,853 | | | 5,673 | | 5,092 | |
| Between three and four years | 3,013 | | 4,090 | | | 4,141 | | 5,034 | |
| Between four and five years | 4,077 | | 2,739 | | | 5,494 | | 3,675 | |
| Beyond five years | 22,977 | | 22,500 | | | 33,806 | | 32,203 | |
| 43,139 | | 39,658 | | | 60,303 | | 54,604 | |
| | | | | | | | | | | | | | | | | | | | | | | |
| BAT Annual Report and Form 20-F 2022 | Strategic Report | | Governance Report | | Financial Statements | | Other Information |
| | | | | | | |
| | | | | | | |
| | | | | | | |
| | | | | | | |
|
The contractual gross maturities in each year include the borrowings maturing in that year together with forecast interest payments on all borrowings which are outstanding for all or part of that year.
Borrowings are denominated in the functional currency of the subsidiary undertaking or other currencies as shown below:
| | | | | | | | | | | | | | | | | | | | |
| Functional
currency
£m | U.S.
dollar
£m | UK
sterling
£m | Euro
£m | Other
currencies
£m | Total
£m |
31 December 2022 | | | | | | |
| Total borrowings | 33,438 | | 3,383 | | 452 | | 5,579 | | 287 | | 43,139 | |
| Effect of derivative financial instruments | | | | | | |
| – cross-currency swaps | 2,356 | | — | | (450) | | (2,085) | | — | | (179) | |
| – forward foreign currency contracts | (40) | | (998) | | — | | 590 | | 454 | | 6 | |
| 35,754 | | 2,385 | | 2 | | 4,084 | | 741 | | 42,966 | |
31 December 2021 | | | | | | |
| Total borrowings | 30,363 | | 2,837 | | 453 | | 5,775 | | 230 | | 39,658 | |
| Effect of derivative financial instruments | | | | | | |
| – cross-currency swaps | 2,219 | | — | | (450) | | (1,973) | | — | | (204) | |
| – forward foreign currency contracts | (24) | | (464) | | — | | 58 | | 432 | | 2 | |
| 32,558 | | 2,373 | | 3 | | 3,860 | | 662 | | 39,456 | |
The exposure to interest rate changes when borrowings are re-priced is as follows:
| | | | | | | | | | | | | | | | | | | | | | | |
| Within
1 year
£m | Between
1-2 years
£m | Between
2-3 years
£m | Between
3-4 years
£m | Between
4-5 years
£m | Beyond
5 years
£m | Total
£m |
31 December 2022 | | | | | | | |
| Total borrowings | 4,398 | | 4,246 | | 4,407 | | 3,013 | | 4,077 | | 22,998 | | 43,139 | |
| Effect of derivative financial instruments | | | | | | | |
| – interest rate swaps | 4,657 | | (500) | | (1,247) | | — | | (2,910) | | — | | — | |
| – cross-currency swaps | (77) | | — | | 36 | | — | | (138) | | — | | (179) | |
| 8,978 | | 3,746 | | 3,196 | | 3,013 | | 1,029 | | 22,998 | | 42,960 | |
31 December 2021 | | | | | | | |
| Total borrowings | 3,999 | | 2,477 | | 3,853 | | 4,090 | | 2,739 | | 22,500 | | 39,658 | |
| Effect of derivative financial instruments | | | | | | | |
| – interest rate swaps | 4,192 | | — | | (500) | | (1,107) | | — | | (2,585) | | — | |
| – cross-currency swaps | 566 | | (652) | | — | | (19) | | — | | (99) | | (204) | |
| 8,757 | | 1,825 | | 3,353 | | 2,964 | | 2,739 | | 19,816 | | 39,454 | |
Lease liabilities are repayable as follows:
| | | | | | | | | | | | | | | | | |
| Per balance sheet | | Contractual gross maturities |
| 2022 £m | 2021 £m | | 2022 £m | 2021 £m |
| Within one year | 142 | | 126 | | | 161 | | 142 | |
| Between one and two years | 109 | | 93 | | | 122 | | 106 | |
| Between two and three years | 76 | | 66 | | | 85 | | 76 | |
| Between three and four years | 58 | | 49 | | | 65 | | 56 | |
| Between four and five years | 50 | | 38 | | | 54 | | 43 | |
| Beyond five years | 82 | | 74 | | | 112 | | 103 | |
| 517 | | 446 | | | 599 | | 526 | |
For more information on leasing arrangements, refer to note 13(b).
As at 31 December 2022, the Group’s undrawn committed borrowing facilities (note 26) amount to £7,828 million (2021: £7,850 million) with £4,828 million maturing within one year (2021: £4,850 million maturing within one year), £150 million maturing between two and three years (2021: £nil maturing between two and three years), £350 million maturing between three and four years (2021: £150 million maturing between three and four years) and £2,500 million maturing between four and five years (2021: £2,850 million maturing between four and five years).
The Group’s composition and movements in net debt are presented below along with a reconciliation to the financing activities in the Group Cash Flow Statement:
| | | | | | | | | | | | | | | | | | | | | | | |
| BAT Annual Report and Form 20-F 2022 | Strategic Report | | Governance Report | | Financial Statements | | Other Information |
| | | | | | | |
| | | | | | | |
| | | | | | | |
| Financial Statements | | | | | | | |
Notes on Accounts Continued |
| | | | | | | | | | | | | | | | | | | | | | | |
| | | | | | | 2022 £m |
| Notes | Opening balance | Cash flow | Foreign exchange | Fair value, accrued interest and other | Held for Sale | Closing balance |
| Borrowings (excluding lease liabilities)* | | 39,212 | | (17) | | 3,881 | | (454) | | — | | 42,622 | |
| Lease liabilities | | 446 | | (161) | | 30 | | 218 | | (16) | | 517 | |
| Derivatives in respect of net debt | 19 | (91) | | 348 | | (435) | | 345 | | — | | 167 | |
| Cash and cash equivalents | 21 | (2,809) | | (571) | | (431) | | (3) | | 368 | | (3,446) | |
| Current investments held at fair value | 18 | (456) | | (86) | | (15) | | (22) | | — | | (579) | |
| | 36,302 | | (487) | | 3,030 | | 84 | | 352 | | 39,281 | |
| | | | | | | |
| | | | | | | 2021 £m |
| Notes | Opening
balance | Cash flow | Foreign
exchange | Fair value,
accrued interest and other | Held for Sale | Closing balance |
| Borrowings (excluding lease liabilities)* | | 43,493 | | (3,768) | | (387) | | (126) | | — | | 39,212 | |
| Lease liabilities | | 475 | | (154) | | (22) | | 147 | | — | | 446 | |
| Derivatives in respect of net debt | 19 | (346) | | (22) | | 277 | | — | | — | | (91) | |
| Cash and cash equivalents | 21 | (3,139) | | 75 | | 258 | | (3) | | — | | (2,809) | |
| Current investments held at fair value | 18 | (242) | | (205) | | (2) | | (7) | | — | | (456) | |
| | 40,241 | | (4,074) | | 124 | | 11 | | — | | 36,302 | |
Note:
* Borrowings as at 31 December 2022 include £798 million (2021: £754 million) in respect of the purchase price adjustments relating to the acquisition of Reynolds American.
In the table above, movements in accrued interest relate to the net movement year on year and cash flows related to interest payments are not included.
'Fair value, accrued interest and other’ movements in lease liabilities in 2022 mainly comprise additions of £218 million (2021: £147 million) (net of reassessments, modifications and terminations), see note 13(a). The movement of £22 million (2021: £7 million) in current investments held at fair value represents the fair value gains for these investments.
| | | | | | | | |
| 2022 £m | 2021 £m |
| Cash flows per net debt statement | (487) | | (4,074) | |
| Non-financing cash flows included in net debt | 897 | | 33 | |
| Interest paid | (1,578) | | (1,479) | |
| Interest element of lease liabilities | (25) | | (23) | |
| Remaining cash flows relating to derivative financial instruments | (465) | | 251 | |
| Purchases of own shares held in employee share ownership trusts | (80) | | (82) | |
| Purchase of own shares | (2,012) | | — | |
| Proceeds from issue of perpetual hybrid bonds | — | | 1,681 | |
| Coupon paid on perpetual hybrid bonds | (60) | | (6) | |
| Dividends paid to owners of the parent | (4,915) | | (4,904) | |
| Capital injection from and purchase of non-controlling interests | (1) | | 1 | |
| Dividends paid to non-controlling interests | (158) | | (150) | |
| Other | 6 | | 3 | |
| Net cash used in financing activities per cash flow statement | (8,878) | | (8,749) | |
| | | | | | | | | | | | | | | | | | | | | | | |
| BAT Annual Report and Form 20-F 2022 | Strategic Report | | Governance Report | | Financial Statements | | Other Information |
| | | | | | | |
| | | | | | | |
| | | | | | | |
| | | | | | | |
|
24 Provisions for liabilities
| | | | | | | | | | | | | | | | | | | | |
| Restructuring
of existing businesses
£m | Employee-related
benefits
£m | Fox River
£m | DOJ and OFAC investigations £m | Other
provisions
£m | Total
£m |
1 January 2022 | 179 | | 41 | | 62 | | — | | 571 | | 853 | |
| Differences on exchange | 9 | | 2 | | — | | — | | 15 | | 26 | |
| | | | | | |
| Provided in respect of the year (*) | 198 | | 10 | | — | | 450 | 187 | | 845 | |
| | | | | | |
| | | | | | |
| Transferred to liabilities associated with assets held for sale | (20) | | — | | — | | — | | (6) | | (26) | |
| Utilised during the year | (69) | | (9) | | (8) | | — | | (91) | | (177) | |
| | | | | | |
| | | | | | |
31 December 2022 | 297 | | 44 | | 54 | | 450 | | 676 | | 1,521 | |
| Analysed on the balance sheet as | | | | | | |
| – current | 240 | | 14 | | 10 | | 450 | 373 | | 1,087 | |
| – non-current | 57 | | 30 | | 44 | | — | | 303 | | 434 | |
| 297 | | 44 | | 54 | | 450 | 676 | | 1,521 | |
| | | | | | | | | | | | | | | | | |
| Restructuring
of existing businesses
£m | Employee-related
benefits
£m | Fox River
£m | Other
provisions
£m | Total
£m |
1 January 2021 | 241 | | 38 | | 70 | | 636 | | 985 | |
| Differences on exchange | (13) | | (3) | | — | | (23) | | (39) | |
| Provided in respect of the year (*) | 32 | | 27 | | — | | 199 | | 258 | |
| Utilised during the year | (81) | | (21) | | (8) | | (241) | | (351) | |
| - in respect of MSA litigation (Texas, Minnesota, Mississippi) | — | | — | | — | | (199) | | (199) | |
| - in respect of other | (81) | | (21) | | (8) | | (42) | | (152) | |
31 December 2021 | 179 | | 41 | | 62 | | 571 | | 853 | |
| Analysed on the balance sheet as | | | | | |
| – current | 123 | | 14 | | 8 | | 316 | | 461 | |
| – non-current | 56 | | 27 | | 54 | | 255 | | 392 | |
| 179 | | 41 | | 62 | | 571 | | 853 | |
Note:
* Amounts provided above are shown net of reversals of unused provisions which include reversals of £35 million (2021: £20 million) for restructuring of existing businesses,
£10 million (2021: £1 million) for employee benefits and £225 million (2021: £147 million) for other provisions, of which £74 million (2021: £34 million) was reclassified to trade and other payables.
The restructuring provisions relate to the restructuring and integration costs incurred and are reported as adjusting items. The principal restructuring activities in 2022 and 2021 are as described in note 7 and primarily include the cost of employee packages and long-term social plans associated with redundancy programmes from previous years. Provisions associated with redundancy packages are determined based on termination packages offered in each country. The long-term social plans primarily relate to social plans in Germany, which span over several years and are based on actuarial calculations. These are discounted to present value using Central Bank rates. We do not consider the effect of discounting to be material. The provisions for long-term social plans include future payments related to contracts that are already fixed. Given that there is little or no variability expected in the timing and amount of the payments, no additional risk has been incorporated in the discounting. While some elements of the non-current provisions of £57 million will unwind over several years, as termination payments are made over extended periods in some countries, it is estimated that approximately 97% of these non-current provisions will unwind within five years.
Employee-related benefits mainly relate to employee benefits other than post-employment benefits. The principal components of these provisions are gratuity and termination awards, ‘jubilee’ payments due after a certain service period and expected payments associated with long-term disability. The majority of these provisions are calculated by actuaries. It is estimated that approximately 81% of the non-current provisions of £30 million will unwind within five years.
A provision of £274 million was made in 2011 for a potential claim under a 1998 settlement agreement entered into by a Group subsidiary in respect of the clean-up of sediment in the Fox River. On 30 September 2014, the Group, NCR, Appvion and Windward Prospects entered into a funding agreement; the details of this agreement are explained in note 31. This agreement led to payments of £1 million in 2022 (2021: £2 million). In addition, the Group incurred legal costs of £7 million (2021: £6 million), which were also charged against the provision. It is expected that the non-current provision will unwind within five years.
As discussed earlier (in note 6(h) Other Operating Expenses), the Group has been cooperating with investigations by the DOJ and OFAC into suspicions of breaches of sanctions. The Group is engaged in discussions with both agencies to find a resolution through settlement. A provision of £450 million has been recognised in 2022, however it cannot be excluded that the amount of any potential settlement with the DOJ and OFAC may vary from this amount.
| | | | | | | | | | | | | | | | | | | | | | | |
| BAT Annual Report and Form 20-F 2022 | Strategic Report | | Governance Report | | Financial Statements | | Other Information |
| | | | | | | |
| | | | | | | |
| | | | | | | |
| Financial Statements | | | | | | | |
Notes on Accounts Continued |
Other provisions comprise balances set up in the ordinary course of general business that cannot be classified within the other categories, such as sales returns and onerous contracts, together with amounts in respect of supplier, excise and other disputes. The nature of the amounts provided in respect of disputes is such that the extent and timing of cash flows are difficult to estimate and the ultimate liability may vary from the amounts provided. Other provisions also include a provision for interest of £183 million in relation to the Franked Investment Income Group Litigation Order (FII GLO), as mentioned in notes 8(b) and 10(b). The provision is calculated based on the UK central bank base rate plus 2% and has been charged to net finance costs. As there is uncertainty over the potential timing
of the utilisation, as explained in note 10(b), the provision has been reported as a non-current provision.
In 2020, the Group recognised a provision of US$272 million (£212 million) in relation to the ITG Brands, LLC MSA litigation agreements with the States of Texas, Minnesota and Mississippi which was utilised in 2021. Further details are provided in note 31.
On 1 March 2019, the Quebec Court of Appeal in Montreal upheld the Superior Court’s decision of May 2015 (reducing ITCAN’s share of the judgment due to a change in interest computation to a maximum of CAD$9.2 billion). The Court of Appeal also upheld the previously stated requirements for the defendants to deposit CAD$1.1 billion into an escrow account. The Board of Directors of ITCAN reassessed the recoverability of the litigation related deposit and, accordingly, the Group recognised a charge against the income statement of CAD$758 million (£436 million) in 2019, reflecting the amount of the judgment that is considered to be probable and estimable in line with IAS 37 Provisions, Contingent Liabilities and Contingent Assets. Consequently, the Group utilised the litigation related deposit which was shown as a receivable at 31 December 2018 (within trade and other receivables) against the current estimate of the liability and both the provision and litigation related deposit were reduced accordingly. Further details are provided in note 31.
25 Trade and other payables
| | | | | | | | |
| 2022 £m | 2021 £m |
| Trade payables | 4,055 | | 3,923 | |
| Duty, excise and other taxes | 3,104 | | 3,148 | |
| Accrued charges and deferred income | 2,713 | | 2,095 | |
FII GLO (note 10(b)) | 913 | | 963 | |
| Social security and other taxation | 61 | | 55 | |
| Sundry payables | 547 | | 375 | |
| 11,393 | | 10,559 | |
| Current | 10,449 | | 9,577 | |
| Non-current | 944 | | 982 | |
| 11,393 | | 10,559 | |
As explained in note 17, the Group acts as a collection agent for banks and other financial institutions in certain debt factoring arrangements. The cash collected in respect of these arrangements that has not yet been remitted amounts to £119 million (2021: £137 million) and is included in sundry payables.
In addition, the Group has certain Supply Chain Financing (SCF) or ‘reverse factoring’ arrangements in place. The principal purpose of these arrangements is to provide the supplier with the option to access liquidity earlier through the sale of its receivables due from the Group to a bank or other financial institution prior to their due date. Management has determined that the Group’s payables to these suppliers have neither been extinguished nor have the liabilities been significantly modified by these arrangements. The value of amounts payable, invoice due dates and other terms and conditions applicable, from the Group’s perspective, remain unaltered, with only the ultimate payee being changed. At 31 December 2022, the value of amounts payable under the SCF programmes was £257 million (2021: £251 million). The cash outflows in respect of these arrangements have been recognised within operating cash flows. Included in this amount is £161 million (2021: £156 million) of leaf payables where the standard payment terms with the vendor is 150 days, consistent with credit terms normally available in certain markets.
During 2022, following an investigation by the Nigerian Federal Competition and Consumer Protection Commission (FCCPC) into alleged violations of the Nigerian Competition and Consumer Protection Act and National Tobacco Control Act, a consent order was entered into between the FCCPC and British American Tobacco (Holdings) Limited, British American Tobacco (Nigeria) Limited and British American Tobacco Marketing (Nigeria) Limited in December 2022 terminating the investigation and associated proceedings. A penalty equivalent to US$110 million has been accrued for and will be paid in Naira in instalments, among other measures.
Accrued charges and deferred income include £20 million of deferred income (2021: £1 million) relating to certain customer deposits in advance of shipments and £66 million (2021: £58 million) in respect of interest payable mainly related to tax matters. FII GLO of £913 million (2021: £963 million) relates to receipts in 2015, in respect of the Franked Investment Income Government Litigation Order (note 10(b)). Amounts payable to related parties including associated undertakings are shown in note 30.
There is no material difference between the above amounts for trade and other payables and their fair value due to the short-term duration of the majority of trade and other payables, as determined using discounted cash flow analysis.
Trade and other payables are predominantly denominated in the functional currencies of subsidiary undertakings with less than 7% in other currencies (2021: less than 6% in other currencies).
| | | | | | | | | | | | | | | | | | | | | | | |
| BAT Annual Report and Form 20-F 2022 | Strategic Report | | Governance Report | | Financial Statements | | Other Information |
| | | | | | | |
| | | | | | | |
| | | | | | | |
| | | | | | | |
|
26 Financial instruments and risk management
Management of financial risks
One of the principal responsibilities of Treasury is to manage the financial risks arising from the Group’s underlying operations. Specifically, Treasury manages, within an overall policy framework set by the Group’s Main Board and Corporate Finance Committee (CFC), the Group’s exposure to funding and liquidity, interest rate, foreign exchange and counterparty risks. The Group’s treasury position is monitored by the CFC which meets regularly throughout the year and is chaired by the Group Finance Director. The approach is one of risk reduction within an overall framework of delivering total shareholder return.
The Group defines capital as net debt (note 23) and equity (note 22). There are no externally imposed capital requirements for the Group. Group policies include a set of financing principles that provide a framework within which the Group’s capital base is managed and, in particular, the policies on dividends (as a percentage of long-term sustainable earnings) and share buy-back are decided. The key objective of the financing principles is to appropriately balance the interests of equity and debt holders in driving an efficient financing mix for the Group. The Group’s average cost of debt in 2022 is 4.0% (2021: 3.5%).
The Group manages its financial risks in line with the classification of its financial assets and liabilities in the Group’s balance sheet and related notes. The Group’s management of specific risks is dealt with as follows:
Liquidity risk
It is the policy of the Group to maximise financial flexibility
and minimise refinancing risk by issuing debt with a range of maturities, generally matching the projected cash flows of the Group and obtaining this financing from a wide range of sources. The Group has a target average centrally managed debt maturity of at least five years with no more than 20% of centrally managed debt maturing in a single rolling year. As at 31 December 2022, the average centrally managed debt maturity was 9.9 years (2021: 10.1 years) and the highest proportion of centrally managed debt maturing in a single rolling year was 18.6% (2021: 18.6%). Perpetual hybrid bonds are treated as equity (note 22(d)) and therefore not included within the debt maturity analysis.
The Group utilises cash pooling and zero balancing bank account structures in addition to intercompany loans and borrowings to mobilise cash efficiently within the Group. The key objectives of Treasury in respect of cash and cash equivalents are to protect their principal value, to concentrate cash at the centre, to minimise the required debt issuance and to optimise the yield earned. The amount of debt issued by the Group is determined by forecasting the net debt requirement after the mobilisation of cash.
The Group continues to target a solid investment-grade credit rating. Moody’s and S&P's current ratings for the Group are Baa2 (stable outlook) and BBB+ (negative outlook), respectively. The Group’s strategy is to continue deleveraging. The Group is confident of its continued ability to successfully access the debt capital markets for future refinancing requirements.
As part of its short-term cash management, the Group invests in a range of cash and cash equivalents, including money market funds, which are regarded as highly liquid and are not exposed to significant changes in fair value. These are kept under continuous review as described in the credit risk section below. At 31 December 2022,
the Group does not have any investments in money market funds (2021: £nil).
As part of its working capital management, in certain countries, the Group has entered into factoring arrangements and supply chain financing arrangements. These are explained in further detail in note 17 and note 25.
Subsidiary companies are funded by share capital and retained earnings, loans from the central finance companies on commercial terms, or through local borrowings by the subsidiaries in appropriate currencies to predominantly fund short- to medium-term working capital requirements.
Available facilities in current year:
It is Group policy that short-term sources of funds (including drawings under both the Group US$4 billion U.S. commercial paper (U.S. CP) programme and the Group £3 billion euro commercial paper (ECP) programme) are backed by undrawn committed lines of credit and cash. Commercial paper is issued
by B.A.T. International Finance p.l.c, B.A.T. Netherlands Finance B.V. and B.A.T Capital Corporation and guaranteed by British American Tobacco p.l.c. At 31 December 2022, commercial paper of £27 million was outstanding (2021: £269 million). Cash flows relating to commercial paper that have maturity periods of three months or less are presented on a net basis in Group’s cash flow statement.
At 31 December 2022, the Group had access to a £5.69 billion revolving credit facility. In February 2022, the Group exercised the second of the one-year extension options.Therefore, the £2.85 billion 364-day tranche was extended to March 2023 at the reduced amount of £2.7 billion and £2.5 billion of the five-year tranche was extended from March 2026 to March 2027 (with £3.0 billion of this tranche remaining available until March 2025 and £2.85 billion remaining available from March 2025 to March 2026). The Group anticipates to refinance the £2.7 billion 364-day tranche in the first half of the 2023 financial year.
During 2022, the Group extended short-term bilateral facilities totalling £3.0 billion. As at 31 December 2022, £875 million was drawn on a short-term basis with £2.1 billion undrawn and still available under such bilateral facilities. Cash flows relating to bilateral facilities that have maturity periods of three months or less are presented on a net basis in the Group’s cash flow statement.
Issuance, drawdowns and repayments in current year:
–In March 2022, the Group accessed the US dollar market under its SEC Shelf Programme, raising a total of US$2.5 billion across two tranches;
–In May 2022, the Group repaid a €600 million bond at maturity;
–In June 2022, the Group repaid US$419 million and £180 million bonds at maturity;
–In August 2022, the Group repaid US$750 million and US$601 million bonds at maturity; and
–In October 2022, the Group raised US$600 million in the US dollar market under its SEC Shelf Programme.
In January 2023, the Group repaid a €750 million bond at maturity.
Available facilities in prior year:
At 31 December 2021, the Group had access to a £5.85 billion revolving credit facility. This facility was undrawn at
31 December 2021.
During 2021, the Group extended short-term bilateral facilities totalling £2.5 billion until March or April 2022, some with extension options to extend for further periods. As at 31 December 2021, £500 million was drawn on a short-term basis.
Issuance, drawdowns and repayments in prior year:
–In February 2021, the Group repaid a €650 million bond at maturity;
–In June 2021, the Group repaid £500 million of the £1,929 million term loan that has a maturity date in January 2022; the remaining £1,429 million was repaid in September 2021;
–In July, August, September and November 2021, the Group repaid £500 million, €1,100 million, CHF 400 million and €500 million of bonds at maturity, respectively; and
The Group issued perpetual hybrid bonds totalling €2 billion in September 2021. Please refer to note 22(d) for further details.
| | | | | | | | | | | | | | | | | | | | | | | |
| BAT Annual Report and Form 20-F 2022 | Strategic Report | | Governance Report | | Financial Statements | | Other Information |
| | | | | | | |
| | | | | | | |
| | | | | | | |
| Financial Statements | | | | | | | |
Notes on Accounts Continued |
Currency risk
The Group is subject to exposure on the translation of the net assets of foreign currency subsidiaries and associates into its reporting currency, sterling. The Group’s primary balance sheet translation exposures are to the US dollar, Euro, Canadian dollar, Australian dollar, Indian rupee, South African rand, Indonesian rupiah, Danish krone, Brazilian real, Russian rouble, Singaporean dollar and Swiss franc. These exposures are kept under continuous review. The Group’s policy on borrowings is to broadly match the currency of these borrowings with the currency of cash flows arising from the Group’s underlying operations. Within this overall policy, the Group aims to minimise all balance sheet translation exposure where it is practicable and cost-effective to do so through matching currency assets with currency borrowings. The main objective of these policies is to protect shareholder value by increasing certainty and minimising volatility in earnings per share. At 31 December 2022, the currency profile of the Group’s gross debt, after taking into account derivative contracts, was 71% U.S. dollar (2021: 68%), 13% euro (2021: 13%), 12% sterling (2021: 13%) and 4% other currencies (2021: 6%).
The Group faces currency exposures arising from the translation of profits earned in foreign currency subsidiaries and associates and joint arrangements; these exposures are not normally hedged. Exposures also arise from:
(i) foreign currency denominated trading transactions undertaken by subsidiaries. These exposures comprise committed and highly probable forecast sales and purchases, which are offset wherever possible. The remaining exposures are hedged within the Treasury policies and procedures with forward foreign exchange contracts and options, which are designated as hedges of the foreign exchange risk of the identified future transactions; and
(ii) forecast dividend flows from subsidiaries to the centre. To ensure cash flow certainty, the Group enters into forward foreign exchange contracts which are designated as net investment hedges of the foreign exchange risk arising from the investments in these subsidiaries.
IFRS 7 requires a sensitivity analysis that shows the impact on the income statement and on items recognised directly in other comprehensive income of hypothetical changes of exchange rates in respect of non-functional currency financial assets and liabilities held across the Group. All other variables are held constant although, in practice, market rates rarely change in isolation. Financial assets and liabilities held in the functional currency of the Group’s subsidiaries, as well as non-financial assets and liabilities and translation risk, are not included in the analysis. The Group considers a 10% strengthening or weakening of the functional currency against the non-functional currency of its subsidiaries as a reasonably possible change. The impact is calculated with reference to the financial asset or liability held as at the year-end, unless this is unrepresentative of the position during the year.
A 10% strengthening of functional currencies against non-functional currencies would result in pre-tax profit being £49 million lower (2021: £53 million lower; 2020: £61 million lower) and items recognised directly in other comprehensive income being £445 million higher (2021: £144 million higher; 2020: £57 million higher). A 10% weakening of functional currencies against non-functional currencies would result in pre-tax profit being £60 million higher (2021: £65 million higher; 2020: £74 million higher) and items recognised directly in other comprehensive income being £543 million lower (2021: £177 million lower; 2020: £70 million lower).
The exchange sensitivities on items recognised directly in other comprehensive income relate to hedging of certain net asset currency positions in the Group, as well as on cash flow hedges in respect of future transactions, but do not include sensitivities in respect of exchange on non-financial assets or liabilities.
Interest rate risk
The objectives of the Group’s interest rate risk management policy are to lessen the impact of adverse interest rate movements on the earnings, cash flow and economic value of the Group. Additional objectives are to minimise the cost of hedging and the associated counterparty risk.
In order to manage its interest rate risk, the Group maintains both floating rate and fixed rate debt. The Group sets targets (within overall guidelines) for the desired ratio of floating to fixed rate debt on a net basis (at least 50% fixed on a net basis in the short to medium term) as a result of regular reviews of market conditions and strategy by the Corporate Finance Committee and the board of the main central finance company. Underlying borrowings are arranged on both a fixed rate and a floating rate basis and, where appropriate, the Group uses derivatives, primarily interest rate swaps to vary the fixed and floating mix, or forward starting swaps to manage the refinancing risk. The interest rate profile of liquid assets included in net debt are considered to offset floating rate debt and are taken into account in determining the net interest rate exposure. At 31 December 2022, the relevant ratio of floating to fixed rate borrowings after the impact of derivatives was 12:88 (2021: 18:82). On a net debt basis, after offsetting liquid assets, the relevant ratio of floating to fixed rate borrowings was 3:97 (2021: 10:90). Excluding cash and other liquid assets in Canada, which are subject to certain restrictions under CCAA protection, the ratio of floating to fixed rate borrowings was 7:93 (2021: 13:87).
IFRS 7 requires a sensitivity analysis that shows the impact on the income statement and on items recognised directly in other comprehensive income of hypothetical changes of interest rates in respect of financial assets and liabilities of the Group. All other variables are held constant although, in practice, market rates rarely change in isolation. For the purposes of this sensitivity analysis, financial assets and liabilities with fixed interest rates are not included. The Group considers a 100 basis point change in interest rates a reasonably possible change except where rates are less than 100 basis points. In these instances, it is assumed that the interest rates increase by 100 basis points and decrease to zero for the purpose of performing the sensitivity analysis. The impact is calculated with reference to the financial asset or liability held as at the year-end, unless this is unrepresentative of the position during the year.
A 100 basis point increase in interest rates would result in pre-tax profit being £50 million lower (2021: £44 million lower; 2020: £31 million lower). A 100 basis point decrease in interest rates, or less where applicable, would result in pre-tax profit being £50 million higher (2021: £47 million higher; 2020: £29 million higher). The effect of these interest rate changes on items recognised directly in other comprehensive income is not material in either year.
In accordance with the UK Financial Conduct Authority’s announcement on 27 July 2017, and following the decision taken by global regulators in 2018 to replace Interbank Offered Rates with alternative nearly risk-free rates, such benchmark rates were expected to be largely discontinued after 2021. The IASB addressed the effects of interest rate benchmark reform on financial reporting, with two phases of Amendments to IFRS 9 Financial Instruments (and other Standards) which the Group adopted in its 2019 and 2020 accounts, respectively, as explained in the accounting policies (note 1). The impact on the Group’s profit or equity from the application of these amendments was not material.
| | | | | | | | | | | | | | | | | | | | | | | |
| BAT Annual Report and Form 20-F 2022 | Strategic Report | | Governance Report | | Financial Statements | | Other Information |
| | | | | | | |
| | | | | | | |
| | | | | | | |
| | | | | | | |
|
In January 2021, the Group confirmed adherence to the ISDA 2020 IBOR Fallbacks Protocol as published by the International Swaps and Derivatives Association, Inc. (ISDA) on 23 October 2020 (the Protocol), ensuring that appropriate fallback rates can apply to derivatives in the event of LIBOR discontinuation.
As at 31 December 2022, the Group had no outstanding floating rate bonds using historical benchmark rates (2021: US$750 million (£554 million)). The Group’s syndicated revolving credit facility (undrawn at 31 December 2022 and 2021) has historically had references to USD London Interbank Offered Rate (''LIBOR''), EURIBOR and GBP LIBOR. This facility includes market standard LIBOR replacement language, and with effect from June 2021 the agreement has adopted SOFR and SONIA as the alternative benchmark rates in respect of USD LIBOR and GBP LIBOR, respectively.
Following announcements by the respective regulators, EURIBOR is expected to continue for the foreseeable future, with USD LIBOR rates potentially discontinued only after June 2023.
The Group is party to the ISDA fallback protocol and in January 2022, it automatically replaced the GBP LIBOR with economically equivalent interest rate derivatives referencing SONIA on their reset date. The four impacted derivatives (cross currency interest rate swaps) with nominal values totalling €800 million (£672 million) maturing in October 2023 are in fair value hedge relationships which were indexed to GBP LIBOR interest rates. The Group has updated the respective hedge documentation accordingly since the uncertainty regarding the transition for these four derivatives has ceased. The hedge relationships on these derivatives continue with resulting ineffectiveness expected to be immaterial.
Credit risk
The Group has no significant concentrations of customer credit risk. Subsidiaries have policies in place requiring appropriate credit checks on potential customers before sales commence. The process for monitoring and managing credit risk once sales to customers have been made varies depending on local practice in the countries concerned.
Certain territories have bank guarantees, other guarantees or credit insurance provided in the Group’s favour in respect of Group trade receivables, the issuance and terms of which are dependent on local practices in the countries concerned. All derivatives are subject to ISDA agreements or equivalent documentation.
Cash deposits and other financial instruments give rise to credit risk on the amounts due from the related counterparties. Generally, the Group aims to transact with counterparties with strong investment grade credit ratings. However, the Group recognises that due to the need to operate over a large geographic footprint, this will not always be possible. Counterparty credit risk is managed on a global basis by limiting the aggregate amount and duration of exposure to any one counterparty, taking into account its credit rating. The credit ratings of all counterparties are reviewed regularly.
The Group ensures that it has sufficient counterparty credit capacity of requisite quality to undertake all anticipated transactions throughout its geographic footprint, while at the same time ensuring that there is no geographic concentration in the location of counterparties.
With the following exceptions, the maximum exposure to the credit risk of financial assets at the balance sheet date is reflected by the carrying values included in the Group’s balance sheet. The Group has entered into short-term risk participation agreements in relation to certain leaf supply arrangements and the maximum exposure under these would be £90 million (2021: £89 million). In addition, the Group has entered into a guarantee arrangement to support a short-term bank credit facility with a supply chain partner. The maximum exposure under the arrangement would be £1 million (2021: £1 million).
Price risk
The Group is exposed to price risk on investments held by the Group, which are included in investments held at fair value on the consolidated balance sheet, but the quantum of such is not material.
Hedge accounting
In order to qualify for hedge accounting, the Group is required to document prospectively the economic relationship between the item being hedged and the hedging instrument. The Group is also required to demonstrate an assessment of the economic relationship between the hedged item and the hedging instrument, which shows that the hedge will be highly effective on an ongoing basis. This effectiveness testing is repeated periodically to ensure that the hedge has remained, and is expected to remain, highly effective. The prospective effectiveness testing determines that an economic relationship between the hedged item and the hedging instrument exists.
In accordance with the Group Treasury Policy, the exact hedge ratios and profile of a hedge relationship will depend on several factors, including the desired degree of certainty and reduced volatility of net interest costs and market conditions, trends and expectations in the relevant markets. The sources of ineffectiveness include spot and forward differences, impact of time value and timing differences between periods in the hedged item and hedging instrument.
The Group’s risk management strategy has been explained in further detail under the interest rate risk and currency risk sections of this note.
Fair value estimation
The fair values of financial assets and liabilities with maturities of less than one year, other than derivatives, are assumed to approximate their book values. For other financial instruments which are measured at fair value in the balance sheet, the basis for fair values is described below.
| | | | | | | | | | | | | | | | | | | | | | | |
| BAT Annual Report and Form 20-F 2022 | Strategic Report | | Governance Report | | Financial Statements | | Other Information |
| | | | | | | |
| | | | | | | |
| | | | | | | |
| Financial Statements | | | | | | | |
Notes on Accounts Continued |
Fair value hierarchy
In accordance with IFRS 13 classification hierarchy, the following table presents the Group’s financial assets and liabilities that are measured at fair value:
| | | | | | | | | | | | | | | | | | | | | | | | | | | | | | | | |
| | | | | 2022 | | | | | 2021 |
| Notes | Level 1
£m | Level 2
£m | Level 3
£m | Total
£m | | Level 1
£m | Level 2
£m | Level 3
£m | Total
£m |
| Assets at fair value | | | | | | | | | | |
| Investment held at fair value | 18 | 514 | | — | | 186 | | 700 | | | 405 | | — | | 101 | | 506 | |
| Derivatives relating to | | | | | | | | | | |
| – interest rate swaps | 19 | — | | 43 | | — | | 43 | | | — | | 33 | | — | | 33 | |
| – cross-currency swaps | 19 | — | | 254 | | — | | 254 | | | — | | 221 | | — | | 221 | |
| – forward foreign currency contracts | 19 | — | | 264 | | — | | 264 | | | — | | 171 | | — | | 171 | |
| Assets at fair value | | 514 | | 561 | | 186 | | 1,261 | | | 405 | | 425 | | 101 | | 931 | |
| Liabilities at fair value | | | | | | | | | | |
| Derivatives relating to | | | | | | | | | | |
| – interest rate swaps | 19 | — | | 450 | | — | | 450 | | | — | | 36 | | — | | 36 | |
| – cross-currency swaps | 19 | — | | 121 | | — | | 121 | | | — | | 35 | | — | | 35 | |
| – forward foreign currency contracts | 19 | — | | 358 | | — | | 358 | | | — | | 243 | | — | | 243 | |
| Liabilities at fair value | | — | | 929 | | — | | 929 | | | — | | 314 | | — | | 314 | |
Level 2 financial instruments are not traded in an active market, but the fair values are based on quoted market prices, broker/dealer quotations, or alternative pricing sources with reasonable levels of price transparency. The Group’s level 2 financial instruments include OTC derivatives.
Netting arrangements of derivative financial instruments
The gross fair value of derivative financial instruments as presented in the Group balance sheet, together with the Group’s rights of offset associated with recognised financial assets and recognised financial liabilities subject to enforceable master netting arrangements and similar agreements, is summarised as follows:
| | | | | | | | | | | | | | | | | | | | | | | |
| | | 2022 | | | | 2021 |
| Amount presented in the Group balance sheet*
£m | Related amounts not offset in the Group balance
sheet
£m | Net amount
£m | | Amount presented in
the Group balance
sheet*
£m | Related amounts not offset in the Group
balance
sheet
£m | Net amount
£m |
| Financial assets | | | | | | | |
– Derivative financial instruments (note 19) | 561 | | (405) | | 156 | | | 425 | | (184) | | 241 | |
| Financial liabilities | | | | | | | |
– Derivative financial instruments (note 19) | (929) | | 405 | | (524) | | | (314) | | 184 | | (130) | |
| (368) | | — | | (368) | | | 111 | | — | | 111 | |
Note:
* No financial instruments have been offset in the Group balance sheet.
The Group is subject to master netting arrangements in force with financial counterparties with whom the Group trades derivatives.
The master netting arrangements determine the proceedings should either party default on their obligations. In case of any event of default, the non-defaulting party will calculate the sum of the replacement cost of outstanding transactions and amounts owed to it by the defaulting party. If that sum exceeds the amounts owed to the defaulting party, the defaulting party will pay the balance to the non-defaulting party. If the sum is less than the amounts owed to the defaulting party, the non-defaulting party will pay the balance to the defaulting party.
| | | | | | | | | | | | | | | | | | | | | | | |
| BAT Annual Report and Form 20-F 2022 | Strategic Report | | Governance Report | | Financial Statements | | Other Information |
| | | | | | | |
| | | | | | | |
| | | | | | | |
| | | | | | | |
|
The hedged items by risk category are presented below:
| | | | | | | | | | | | | | | | | | | | | | | | | | | | | |
| | | | | | | | | 2022 |
| Carrying amount of the hedged item
£m | | Accumulated amount of fair value hedge adjustments on the hedged item included in the carrying amount of the hedged item
£m | | Line item in the statement of financial position where the hedged item is included | | Changes in fair value used for calculating hedge ineffectiveness
£m | | Cash flow hedge reserve (gross of tax)
£m |
| Fair value hedges | | | | | | | | | |
| Interest rate risk | | | | | | | | | |
| – borrowings (liabilities) | 9,223 | | | (355) | | | Borrowings | | 399 | | | |
| Cash flow hedges | | | | | | | | | |
| Interest rate risk | | | | | | | | | |
| – borrowings (liabilities) | 1,824 | | | | | Borrowings | | (55) | | | (464) | |
| | | | | | | | | | | | | | | | | | | | | | | | | | | | | |
| | | | | | | | | 2021 |
| Carrying amount of the hedged item
£m | | Accumulated amount of fair value hedge adjustments on the hedged item included in the carrying amount of the hedged item
£m | | Line item in the statement of financial position where the hedged item is included | | Changes in fair value used for calculating hedge ineffectiveness
£m | | Cash flow hedge
reserve (gross of tax)
£m |
| Fair value hedges | | | | | | | | | |
| Interest rate risk | | | | | | | | | |
| – borrowings (liabilities) | 9,197 | | | 101 | | | Borrowings | | 87 | | | — | |
| Cash flow hedges | | | | | | | | | |
| Interest rate risk | | | | | | | | | |
| – borrowings (liabilities) | 2,132 | | | — | | | Borrowings | | (69) | | | (538) | |
£389 million (2021: £368 million) of the Group’s borrowings are designated as net investment hedge instruments of the Group’s net investments in foreign operations. In line with the Group’s risk management policies, the net investment hedge relationships are reviewed periodically. The change in the value used for calculating hedge ineffectiveness for hedged items designated under net investment hedge relationships is £21 million (2021: £24 million).
As at 31 December 2022, the accumulated balance of the cash flow hedge reserve was a loss of £327 million (2021: loss of £363 million) including an accumulated loss of £464 million (2021: loss of £538 million) in relation to interest rate exposure and foreign currency exposure arising from borrowings held by the Group, and an accumulated gain of £99 million (2021: gain of £116 million) in relation to deferred tax arising from cash flow hedges. The remainder related to the Group’s foreign currency exposure on forecasted transactions and cost of hedging (note 22(c)(ii)).
| | | | | | | | | | | | | | | | | | | | | | | |
| BAT Annual Report and Form 20-F 2022 | Strategic Report | | Governance Report | | Financial Statements | | Other Information |
| | | | | | | |
| | | | | | | |
| | | | | | | |
| Financial Statements | | | | | | | |
Notes on Accounts Continued |
27 Changes in the Group
(a) Acquisitions
The Group acquired certain businesses and other tobacco assets as noted below. The financial impact of these transactions to the Group were immaterial individually and in aggregate. Except as noted, there were no material differences between the fair value and book values of net assets acquired in business combinations.
On 12 November 2020, the Group acquired 100% of the share capital in Eastern Tobacco Company for Trading, subsequently renamed as BAT Arabia for Trading, for £50 million. Goodwill of £36 million, representing anticipated synergies, and trademarks and similar intangibles of £39 million, as well as £96 million of cash and cash equivalents, were recognised on acquisition.
On 30 September 2019, the Group acquired control of Twisp Proprietary Limited, a South African e-cigarette/nicotine Vapour company for a purchase price of £25 million of which £6 million was deferred and contingent upon future performance in the market. Goodwill of £12 million, representing a strategic premium to enter this segment of the South African Vapour market, and trademarks and similar intangibles of £15 million were recognised on acquisition. Due to difficult trading conditions, the goodwill and intangibles were fully impaired in 2020. The final payment of deferred consideration of £3 million was paid in 2021.
(b) Non-controlling interests
In 2022, the Group acquired a further 3.3% in Hrvatski Duhani d.d. Tobacco Leaf Processing at a cost of £1 million, following the acquisition of an additional 2.7% in Hrvatski Duhani d.d. Tobacco Leaf Processing in 2021 at a cost of £1 million.
In 2021, the Group made a capital contribution to Brascuba Cigarrillos S.A. at a cost of £6 million (2020: £17 million). This contribution was in proportion to a capital contribution made by the non-controlling interest to the company and as such, the Group’s shareholding remains unchanged.
Also in 2021, as part of a Voluntary Tender Offer for the non-controlling interests of the Group’s Indonesian subsidiary, the Group acquired 0.2% additional shares at a cost of £4 million as explained in note 30.
(c) Other transactions
(i) Organigram
On 11 March 2021, the Group announced a strategic collaboration agreement with Organigram Inc., a wholly owned subsidiary of publicly traded Organigram Holdings Inc. (collectively, Organigram). Under the terms of the transaction, a Group subsidiary acquired a 19.9% equity stake in Organigram Holdings Inc. to become its largest shareholder, with the ability to appoint two directors to Organigram Holdings Inc.’s board of directors and representation on its investment committee. The Group accounts for the investment as an associate.
The Group’s initial investment of £129 million was allocated against the Group’s share of Organigram’s net assets, including the recognition of £49 million of intangibles, and goodwill of £30 million, which represents a strategic premium to enter the legal cannabis market in North America.
During 2021, Organigram acquired all of the issued and outstanding shares of The Edibles & Infusions Corporation (EIC) for an initial consideration of CAD$22 million, payable in shares. Organigram also acquired all of the issued and outstanding shares of Laurentian Organic Inc. for consideration of CAD$36 million, payable in cash and shares. The impact of these transactions on the Group was not material. As a result of these transactions, the Group’s shareholding was reduced to 18.8%. In 2022, the Group exercised its top-up rights and invested a further £4 million to maintain its ownership stake.
(ii) Other acquisitions
On 26 September 2022, the Group announced a £32 million investment in exchange for 16% of Sanity Group GmbH (Sanity Group), a German based cannabis company which has a well-established product portfolio of CBD consumer brands and medical cannabis brands and is actively engaged in the research, development, and marketing of cannabis products. The Group’s investment was part of a series-B investment round. As part of the investment agreement, the Group has the right to appoint directors to the Sanity Group's board and will account for the investment as an associate. The Group’s investment was allocated against the Group’s share of Sanity Group’s net assets, including the recognition of £4 million of intangibles, and goodwill of £28 million, which represents a strategic premium in expectation of the legalisation of cannabis in Germany and elsewhere in Europe.
In November 2022, the Group announced that it had invested in Charlotte’s Web Holdings, Inc. (Charlotte’s Web), via a convertible debenture of £48 million. Charlotte's Web is based in Colorado, USA, listed on the Toronto Stock Exchange, and holds a prominent position in innovative hemp extract wellness products across major retail channels, including food/drug/mass retail, and natural grocery and vitamin retailers. Their product formats include tinctures, capsules, chews and topicals. The debenture is currently convertible into a non-controlling equity stake in Charlotte’s Web of approximately 19.9% and is convertible at BAT’s discretion. Given that the nature of the investment as a convertible loan note does not give the Group any current right to a share of the earnings or net assets of the investee, despite the ability to appoint directors, the investment will be recognised at fair value through profit and loss with fair value changes in the investment recognised in net finance costs. On conversion of the loan note, the Group will equity account for its investment.
During 2022, the Group increased its ownership of a wholesale producer and distributor operating in the agriculture sector based in Uzbekistan, FE “Samfruit” JSC by 2.8% to 45.4%, for £1 million. During 2021, the ownership was increased by 4%, for £1 million and in 2020, by 28.4%, for £5 million. The Group accounts for the investment as an associate.
In addition, during 2022, the Group made a non-controlling investment in Steady State LLC, a U.S. based cGMP certified manufacturer and distributor of cannabinoid ingredients, food products and nutraceuticals, for £4 million. The Group accounts for the investment as an associate.
(d) Assets held for sale and business disposals
(i) BAT Russia
On 11 March 2022, the Group announced the intention to transfer its Russian business in full compliance with international and local laws. The Group has two subsidiaries in Russia (BAT Russia), being JSC British American Tobacco-SPb and JSC International Tobacco Marketing Services (ITMS). In addition, the Group’s subsidiary in Belarus, International Tobacco Marketing Services BY, will form part of the transaction. Upon completion, it is intended that the Group will no longer have a presence in Russia (or Belarus).
| | | | | | | | | | | | | | | | | | | | | | | |
| BAT Annual Report and Form 20-F 2022 | Strategic Report | | Governance Report | | Financial Statements | | Other Information |
| | | | | | | |
| | | | | | | |
| | | | | | | |
| | | | | | | |
|
It is intended that, as a result of a potential sale of its shares to an acquirer, the Group will have neither voting rights nor the ability or means to direct day-to-day activities, appoint management, or make business decisions. Since the Group will not own any shares in the transferred businesses, and is not providing any financing to the proposed buyer, the Group will not have any exposure to returns from the business, having no rights to dividends, royalties or amendments to the agreed-upon consideration to take account of post-disposal trading. Consequently, management have classified the assets and liabilities of these entities as a disposal group in accordance with IFRS 5.
At 30 June 2022, £387 million of property, plant and equipment and other non-current assets, £696 million of trade and other receivables, £240 million of cash and cash equivalents and £144 million of other current assets principally relating to inventories, were classified as held-for-sale in respect of this anticipated disposal and presented as such on the balance sheet at an estimated fair value less costs to sell. In addition, £11 million of borrowings and £528 million of trade creditors and other current liabilities were also classified as held-for-sale. Impairment charges and associated costs of £957 million were recognised in the Income Statement and were treated as a non-cash, adjusting item. The assets and liabilities recognised as held-for-sale, as at 30 June 2022, and the subsequent impairment charge, did not include Belarus.
At 31 December 2022, £281 million of property, plant and equipment and other non-current assets, £474 million of trade and other receivables, £368 million of cash and cash equivalents and £181 million of other current assets principally relating to inventories, have been similarly classified as held-for-sale and presented as such on the balance sheet at an estimated fair value less costs to sell. In addition, £16 million of borrowings and £412 million of trade creditors and other current liabilities have been classified as held-for-sale at 31 December 2022. Impairment charges of £554 million and associated costs of £58 million have been recognised in the Income Statement as adjusting items.
An estimated charge of £295 million in respect of foreign exchange previously recognised in other comprehensive income will be reclassified to the income statement on completion of the transaction as has been shown as a separate amount within Group reserves.
At the date of approval of these accounts, no definitive agreement to transfer the shares in these subsidiaries had been entered into, with no final consideration agreed. The assessment of the recoverable value (fair value less costs to sell) at 30 June and 31 December 2022 has taken into account a range of internal assumptions, including those regarding the likely consideration for the sale, the impact, extent and duration of sanctions, the likelihood of consideration being significantly deferred and ongoing macro-economic developments, including the impact of inflation and interest rates. All assumptions are based on current expectations and are subject to a very high degree of volatility and uncertainty and therefore may change up until the final value can be determined, based on an actual transaction.
The following is a reconciliation between the total assets available for sale and their estimated recoverable value (fair value less costs to sell):
| | | | | |
| 31 December 2022 £m |
Total assets held-for-sale1 | 1,321 | |
| Impairment of non-current assets held-for-sale - Russia and Belarus | (281) | |
| 1,040 | |
Excess impairment beyond non-current assets held-for-sale - Russia and Belarus | (273) | |
| 767 | |
Note:
1. In December 2022, £15 million of assets held-for-sale being held in territories other than Russia and Belarus.
(ii) B.A.T. Pars Company PJSC (BAT Pars)
On 25 June 2021, the Group agreed to dispose of its Iranian subsidiary, BAT Pars to DTM ME FZE LLC. Accordingly, BAT Pars was classified as held-for-sale at that date and £152 million of assets, primarily comprised £98 million of cash and cash equivalents, £38 million of inventory and £14 million of property, plant and equipment, were transferred to held-for-sale assets. Also, £24 million of liabilities, primarily comprised £10 million of trade creditors and £8 million of corporation tax payable, were transferred to held-for-sale liabilities. Subsequently an impairment charge and associated costs of £88 million was recognised in the income statement and treated as an adjusting item.
Completion took place on 6 August 2021. £272 million in respect of foreign exchange previously recognised in other comprehensive income has been reclassified to the income statement. The financial impact of this has also been treated as an adjusting item.
In compliance with IAS 7 Statement of cash flows, the £98 million of cash and cash equivalents held at the date of disposal was reported as a cash outflow under investing activities.
In 2022, as a result of the unwind of discounting on the deferred proceeds and a true-up on the completion of accounts, a credit of £6 million (2021: £2 million) was recognised. The value of the consideration remains outstanding at 31 December 2022, and £56 million is recognised as a current receivable.
In addition, in 2021, £24 million of related investments held at fair value were provided against as a charge to net finance costs given uncertainties regarding recovery of these funds. During 2022, £17 million was recovered with some progress on resolving issues over the release of the remaining funds.
| | | | | | | | | | | | | | | | | | | | | | | |
| BAT Annual Report and Form 20-F 2022 | Strategic Report | | Governance Report | | Financial Statements | | Other Information |
| | | | | | | |
| | | | | | | |
| | | | | | | |
| Financial Statements | | | | | | | |
Notes on Accounts Continued |
28 Share-based payments
The Group operates a number of share-based payment arrangements of which the three principal ones are:
LTIP - Performance Share Plan (PSP):
Since 2020, performance-related conditional awards under which shares are released automatically following a 3-year vesting period (5-year period for the Executive Directors). LTIP awards granted up to 2019 are nil-cost options exercisable after three years from date of grant (five years for Executive Directors) with a contractual life of 10 years.
For awards granted in 2021, 2020 and 2019, vesting is subject to performance conditions measured over a 3-year period (for all awards), based on earnings per share (40% of grant), operating cash flow (20% of grant), total shareholder return (20% of grant) and net turnover (20% of grant). Total shareholder return combines the share price and dividend performance of the Company by reference to one comparator group.
For 2022 awards, the performance conditions are based on earnings per share (30% of grant), operating cash flow (20% of grant), total shareholder return (20% of grant), net turnover (15% of the grant) and New Categories revenue growth (15% of the grant).
Participants are not entitled to dividends prior to the vesting or exercise of the awards. A cash equivalent dividend accrues through the vesting period (other than for the Executive Directors where additional shares are delivered in lieu of cash) and is paid on vesting. Both equity and cash-settled PSP awards are granted in March each year.
In the U.S., PSP awards are made over BAT American Depository Shares (ADSs).
Restricted Share Plan (RSP):
Introduced in 2020, conditional awards under which shares are released three years from date of grant, subject to a continuous employment condition during the three-year vesting period. Participants are not entitled to dividends prior to shares vesting. A cash equivalent dividend accrues through the vesting period and is paid on vesting. Both equity and cash settled RSP awards are granted in March or September.
In the U.S., RSP awards are made over BAT American Depository Shares (ADSs).
Deferred Share Bonus Scheme (DSBS):
Granted in connection with annual bonuses, conditional awards under which shares are released three years from date of grant subject to a continuous employment condition during the three-year vesting period. A cash equivalent dividend accrues through the vesting period and is paid quarterly (other than for the Executive Directors where additional shares are delivered in lieu of cash). Both equity and cash-settled DSBS awards are granted in March each year.
The Group also has a number of other arrangements which are not material for the Group and these are as follows:
Sharesave Scheme (SAYE)
Options are granted in March each year by invitation at a 20% discount to the market price. Options under this equity-settled scheme are exercisable at the end of a three-year or five-year savings contract. Participants are not entitled to dividends prior to the exercise of the options. The maximum amount that can be saved by a participant in this way is £6,000 in any tax year.
Share Reward Scheme (SRS)
Free shares are granted in April each year (up to an equivalent of £3,600 in any year) under the equity-settled schemes are subject to a three-year holding period. Participants receive dividends during the holding period which are reinvested to buy further shares. The shares are held in a UK-based trust and are normally capable of transfer to participants tax-free after a five-year holding period.
International Share Reward Scheme (ISRS)
Conditional shares are granted in April each year (up to an equivalent of £3,600 in any year) subject to a three-year vesting period. Dividend equivalents accrue through the vesting period and additional shares are delivered at vesting. Awards may be equity or cash-settled.
Partnership Share Scheme
Employees can allocate part of their pre-tax salary to purchase shares in British American Tobacco p.l.c. (maximum £1,800 in any year). The shares purchased are held in a UK-based trust and are normally capable of transfer to participants tax-free after a five-year holding period.
The amounts recognised in the income statement in respect of share-based payments were as follows:
| | | | | | | | | | | | | | | | | | | | | | | | | | | | | |
| | | 2022 | | | 2021 | | | 2020 |
| Notes | Equity-
settled
£m | Cash-
settled
£m | | Equity-
settled
£m | Cash-
settled
£m | | Equity-
settled
£m | Cash-
settled
£m |
| LTIP - PSP & RSP | 28(a) | 38 | | 1 | | | 30 | | — | | | 36 | | — | |
| DSBS | 28(b) | 36 | | 3 | | | 39 | | 2 | | | 44 | | 3 | |
| Other schemes | | 7 | | — | | | 7 | | — | | | 8 | | — | |
| Total recognised in the income statement | 3 | 81 | | 4 | | | 76 | | 2 | | | 88 | | 3 | |
| | | | | | | | | | | | | | | | | | | | | | | |
| BAT Annual Report and Form 20-F 2022 | Strategic Report | | Governance Report | | Financial Statements | | Other Information |
| | | | | | | |
| | | | | | | |
| | | | | | | |
| | | | | | | |
|
Share-based payment liability
The Group issues to certain employees cash-settled share-based payments that require the Group to pay the intrinsic value of these share-based payments to the employee at the date of exercise. The Group has recorded liabilities in respect of vested and unvested grants at the end of 2022 and 2021:
| | | | | | | | | | | | | | | | | |
| | 2022 | | | 2021 |
| Vested
£m* | Unvested
£m | | Vested
£m | Unvested
£m |
| LTIP - PSP & RSP | (0.3) | | 1.9 | | | 0.1 | | 1.1 | |
| DSBS | 0.5 | | 6.6 | | | 0.1 | | 6.4 | |
| Total liability | 0.2 | | 8.5 | | | 0.2 | | 7.5 | |
Note:
* The reduction in the liabilities for vested LTIPs was due to shares being exercised at prices lower than the share price at date of grant.
(a) Long-Term Incentive Plan - PSP & RSP
Details of the movements for the equity- and cash-settled LTIP scheme during the years ended 31 December 2022 and 31 December 2021, were as follows:
| | | | | | | | | | | | | | | | | |
| | 2022 | | | 2021 |
| Equity-settled
Number
of options
in thousands | Cash-settled
Number
of options
in thousands | | Equity-settled
Number
of options
in thousands | Cash-settled
Number
of options
in thousands |
| Outstanding at start of year | 9,891 | 243 | | 10,000 | 274 |
| Granted during the period | 2,927 | 58 | | 3,440 | 81 |
| Exercised during the period | (1,606) | (58) | | (1,639) | (48) |
| Forfeited during the period | (2,252) | (47) | | (1,910) | (64) |
| Outstanding at end of year | 8,960 | 196 | | 9,891 | 243 |
| Exercisable at end of year | 661 | 40 | | 611 | 29 |
As at 31 December 2022, the Group has 8,960,000 shares (2021: 9,891,000 shares) outstanding which includes 1,749,762 shares (2021: 2,650,364 shares) which are related to Reynolds American LTIP awards from which nil shares (2021: nil shares) are exercisable at the end of the year.
The weighted average British American Tobacco p.l.c. share price at the date of exercise for share options exercised during the period was £32.84 (2021: £27.67; 2020: £29.37) for equity-settled and £33.01 (2021: £27.59; 2020: £28.68) for cash-settled options.
The weighted average British American Tobacco p.l.c. share price for ADS on the New York Stock Exchange at the date of exercise for share options exercised during the period relating to equity-settled Reynolds American LTIP awards was US$38.37 (2021: US$35.93; 2020: US$40.04).
The outstanding shares for the year ended 31 December 2022 had a weighted average remaining contractual life of 1.8 years (2021: 3.7 years; 2020: 8.1 years) for the equity-settled scheme, 1.8 years for Reynolds American equity-settled scheme (2021: 1.70 years; 2020: 1.72 years) and 1.7 years (2021: 4.1 years; 2020: 8.1 years) for the cash-settled share-based payment arrangements.
| | | | | | | | | | | | | | | | | | | | | | | |
| BAT Annual Report and Form 20-F 2022 | Strategic Report | | Governance Report | | Financial Statements | | Other Information |
| | | | | | | |
| | | | | | | |
| | | | | | | |
| Financial Statements | | | | | | | |
Notes on Accounts Continued |
(b) Deferred Share Bonus Scheme
Details of the movements for the equity- and cash-settled DSBS scheme during the years ended 31 December 2022 and 31 December 2021, were as follows:
| | | | | | | | | | | | | | | | | |
| | 2022 | | | 2021 |
| Equity-settled
Number
of options
in thousands | Cash-settled
Number
of options
in thousands | | Equity-settled
Number
of options
in thousands | Cash-settled
Number
of options
in thousands |
| Outstanding at start of year | 4,141 | 223 | | 4,141 | 200 |
| Granted during the period | 1,616 | 85 | | 1,562 | 179 |
| Exercised during the period | (1,609) | (159) | | (1,497) | (142) |
| Forfeited during the period | (133) | (8) | | (65) | (14) |
| Outstanding at end of year | 4,015 | 141 | | 4,141 | 223 |
| Exercisable at end of year | 1 | 14 | | — | 1 |
The weighted average British American Tobacco p.l.c. share price at the date of exercise for share options exercised during the financial year was £32.20 (2021: £27.58; 2020: £28.08) for equity-settled and £32.50 (2021: £27.70; 2020: £28.06) for cash-settled options.
The outstanding shares for the year ended 31 December 2022 had a weighted average remaining contractual life of 1.3 years (2021: 1.3 years; 2020: 1.4 years) for the equity-settled scheme and 1.1 years (2021: 1.3 years; 2020: 1.4 years) for the cash-settled scheme.
Valuation assumptions
Assumptions used in the Black-Scholes models to determine the fair value of share options at grant date were as follows:
| | | | | | | | | | | | | | | | | |
| | 2022 | | | 2021 |
| LTIP –
PSP & RSP | DSBS | | LTIP –
PSP & RSP | DSBS |
| Expected volatility (%) | 27.0 | | 27.0 | | | 27.0 | | 27.0 | |
| Average expected term to exercise (years) | 3.0 | 3.0 | | 3.0 | 3.0 |
| Risk-free rate (%) | 1.4 | | 1.4 | | | 0.2 | | 0.2 | |
| Expected dividend yield (%) | 6.8 | | 6.8 | | | 7.7 | | 7.7 | |
| Share price at date of grant (£) | 32.18 | 32.18 | | 27.94 | 27.94 |
| Fair value at grant date (£)* | 27.46 / 26.28 | 26.28 | | 19.87/22.20 | 22.20 |
| Fair value at grant date (£)* - Management Board | 24.80 / 26.28 | 26.28 | | 17.35/22.20 | 22.20 |
Note:
* Where two figures have been quoted for the Long-Term Incentive Plan, the numbers relate to PSP and RSP awards, respectively.
Market condition features were incorporated into the Monte-Carlo models for the total shareholder return elements of the LTIP - PSP, in determining fair value at grant date. Assumptions used in these models were as follows:
| | | | | | | | |
| 2022 LTIP - PSP | 2021 LTIP - PSP |
| Average share price volatility FMCG comparator group (%) | 23 | | 23 | |
| Average correlation FMCG comparator group (%) | 31 | | 29 | |
Fair values determined from the Black-Scholes and Monte-Carlo models use assumptions revised at the end of each reporting period for cash-settled share-based payment arrangements.
The expected British American Tobacco p.l.c. share price volatility was determined taking account of the return index (the share price index plus the dividend reinvested) over a five-year period. The FMCG share price volatility and correlation was also determined over the same periods. The average expected term to exercise used in the models has been adjusted, based on management’s best estimate, for the effects of non-transferability, exercise restrictions and behavioural conditions, forfeiture and historical experience.
The risk-free rate has been determined from market yield curves for government gilts with outstanding terms equal to the average expected term to exercise for each relevant grant. The expected dividend yield was determined by calculating the yield from the last two declared dividends divided by the grant share price.
In addition to these valuation assumptions, LTIP awards, excluding RSP, contain earnings per share performance conditions. As these are non-market performance conditions they are not included in the determination of fair value of share options at the grant date, however, they are used to estimate the number of awards expected to vest. This pay-out calculation is based on expectations published in analysts’ forecasts.
| | | | | | | | | | | | | | | | | | | | | | | |
| BAT Annual Report and Form 20-F 2022 | Strategic Report | | Governance Report | | Financial Statements | | Other Information |
| | | | | | | |
| | | | | | | |
| | | | | | | |
| | | | | | | |
|
29 Group employees
The average number of persons employed by the Group and its associates during the year, including Directors, was 77,951 (2021: 82,868).
| | | | | | | | |
| 2022 Number | 2021 Number |
| U.S. | 4,274 | 4,789 |
| AmSSA | 16,084 | 16,799 |
| Europe | 21,885 | 22,289 |
| APME | 9,834 | 10,488 |
| Subsidiary undertakings | 52,077 | 54,365 |
| Associates | 25,874 | 28,503 |
| 77,951 | 82,868 |
Included within the employee numbers for Europe are certain employees in the UK in respect of central functions. Some of the costs of these employees are allocated or charged to the various regions and markets in the Group.
30 Related party disclosures
The Group has a number of transactions and relationships with related parties, as defined in IAS 24 Related Party Disclosures, all of which are undertaken in the normal course of business. Transactions with CTBAT International Limited (a joint operation) are not included in these disclosures as the results are immaterial to the Group.
Intercompany transactions and balances are eliminated on consolidation and therefore are not disclosed.
Transactions and balances with associates relate mainly to the sale and purchase of cigarettes and tobacco leaf. The Group’s share of dividends from associates, included in other net income in the table below, was £438 million (2021: £392 million; 2020: £394 million).
| | | | | | | | | | | |
| 2022 £m | 2021 £m | 2020 £m |
| Transactions | | | |
| – revenue | 494 | | 524 | | 495 | |
| – purchases | (190) | | (123) | | (80) | |
| – other net income | 440 | | 387 | | 388 | |
| Amounts receivable at 31 December | 51 | | 48 | | 33 | |
| Amounts payable at 31 December | (4) | | (3) | | (5) | |
In 2022, as mentioned in note 27, the Group made a £32 million investment in exchange for 16% of Sanity Group GmbH and made a non-controlling investment in Steady State LLC for £4 million.
Also in 2022, the Group acquired a further 3.3% in Hrvatski Duhani d.d. Tobacco Leaf Processing at a cost of £1 million, following the acquisition of an additional 2.7% in 2021 at a cost of £1 million.
During 2022, the Group increased its ownership of a wholesale producer and distributor operating in the agriculture sector based in Uzbekistan, FE “Samfruit” JSC to 45.40% for £1 million. In 2021, the Group increased its ownership to 42.61%, for £1 million (2020: increase to 38.63% for £5 million).
In 2021, the Group made a capital contribution in Brascuba Cigarrillos S.A. at a cost of £6 million (2020: £17 million). There was a capital reduction in CTBAT International Limited of approximately US$171 million with funds remitted prorata to investors in 2021.
On 5 October 2021, PT Bentoel Internasional Investama Tbk (Bentoel) announced its intention to delist from the Indonesia Stock Exchange and go private by conducting a Voluntary Tender Offer (VTO). As part of this, in two phases in November and December 2021, the Group acquired an additional 0.2% of shares in Bentoel from independent shareholders at a cost of £4 million and terminated the total return swap (as explained in note 32).
As explained in note 15, in 2022 the Group provided a temporary liquidity facility to the main UK pension fund. As at 31 December 2022 this facility was undrawn.
As set out in note 27, in March 2021, the Group acquired a 19.9% equity stake in Organigram. The Group and Organigram also entered into a Product Development Collaboration Agreement following which a Centre of Excellence has been established to focus on developing the next generation of cannabis products with an initial focus on cannabidiol (CBD).
The key management personnel of British American Tobacco consist of the members of the Board of Directors of British American Tobacco p.l.c. and the members of the Management Board. No such person had any material interest during the year in a contract of significance (other than a service contract) with the Company or any subsidiary company. The term key management personnel in this context includes their close family members.
| | | | | | | | | | | |
| 2022 £m | 2021 £m | 2020 £m |
| The total compensation for key management personnel, including Directors, was: | | | |
| – salaries and other short-term employee benefits | 19 | | 18 | | 17 | |
– post-employment benefits | 1 | | 1 | | 2 | |
| – share-based payments | 17 | | 16 | | 13 | |
| 37 | | 35 | | 32 | |
| | | | | | | | | | | | | | | | | | | | | | | |
| BAT Annual Report and Form 20-F 2022 | Strategic Report | | Governance Report | | Financial Statements | | Other Information |
| | | | | | | |
| | | | | | | |
| | | | | | | |
| Financial Statements | | | | | | | |
Notes on Accounts Continued |
The following table, which is not part of IAS 24 disclosures, shows the aggregate emoluments of the Directors of the Company.
| | | | | | | | | | | | | | | | | | | | | | | | | | | | | | | | | | | | | | | | | | | | | | | |
| Executive Directors | | Chair | | Non-Executive Directors | | Total |
| 2022 £'000 | 2021 £'000 | 2020 £'000 | | 2022 £'000 | 2021 £'000 | 2020 £'000 | | 2022 £'000 | 2021 £'000 | 2020 £'000 | | 2022 £'000 | 2021 £'000 | 2020 £'000 |
| Salary; fees; benefits; incentives | | | | | | | | | | | | | | | |
| – salary | 2,129 | | 2,119 | | 2,026 | | | | | | | | | | | 2,129 | 2,119 | | 2,026 | |
| – fees | | | | | 670 | | 727 | | 714 | | | 1,027 | | 1,045 | | 1,028 | | | 1,697 | | 1,772 | | 1,742 | |
| – taxable benefits | 449 | | 420 | | 744 | | | 59 | | 55 | | 77 | | | 78 | | 2 | | 72 | | | 586 | | 477 | | 893 | |
| – short-term incentives | 3,761 | | 4,128 | | 3,274 | | | | | | | | | | | 3,761 | 4,128 | | 3,274 | |
| – long-term incentives | 7,888 | | 3,399 | | 1,294 | | | | | | | | | | | 7,888 | | 3,399 | | 1,294 | |
| Sub-total | 14,227 | | 10,066 | | 7,338 | | | 729 | | 782 | | 791 | | | 1,105 | | 1,047 | | 1,100 | | | 16,061 | 11,895 | | 9,229 | |
| Pension; other emoluments | | | | | | | | | | | | | | | |
| – pension | 320 | | 318 | | 304 | | | | | | | | | | | 320 | 318 | | 304 | |
| – other emoluments | 6 | | 6 | | 20 | | | | | | | | | | | 6 | 6 | | 20 | |
| Sub-total | 326 | | 324 | | 324 | | | | | | | | | | | 326 | 324 | | 324 | |
| Total emoluments | 14,553 | | 10,390 | | 7,662 | | | 729 | | 782 | | 791 | | | 1,105 | | 1,047 | | 1,100 | | | 16,387 | | 12,219 | | 9,553 | |
| | | | | | | | | | | | | | | | | | | | | | | |
| BAT Annual Report and Form 20-F 2022 | Strategic Report | | Governance Report | | Financial Statements | | Other Information |
| | | | | | | |
| | | | | | | |
| | | | | | | |
| | | | | | | |
|
31 Contingent liabilities and financial commitments
1.The Group is subject to contingencies pursuant to requirements that it complies with relevant laws, regulations and standards.
2.Failure to comply could result in restrictions in operations, damages, fines, increased tax, increased cost of compliance, interest charges, reputational damage or other sanctions. These matters are inherently difficult to quantify. In cases where the Group has an obligation as a result of a past event existing at the balance sheet date, if it is probable that an outflow of economic resources will be required to settle the obligation and if the amount of the obligation can be reliably estimated, a provision will be recognised based on best estimates and management judgement.
3.There are, however, contingent liabilities in respect of litigation, taxes in some countries and guarantees for which no provisions have been made.
General Litigation Overview
4.There are a number of legal and regulatory actions, proceedings and claims against Group companies related to tobacco and New Category products that are pending in a number of jurisdictions. These proceedings include, among other things, claims for personal injury (both individual claims and class actions) and claims for economic loss arising from the treatment of smoking- and health-related diseases (such as medical recoupment claims brought by local governments).
5.The plaintiffs in these cases seek recovery on a variety of legal theories, including negligence, strict liability in tort, design defect, failure to warn, fraud, misrepresentation, violations of unfair and deceptive trade practices statutes, conspiracy, public nuisance, medical monitoring and violations of competition and antitrust laws. The plaintiffs seek various forms of relief, including compensatory and, where available, punitive damages, treble or multiple damages and statutory damages and penalties, creation of medical monitoring and smoking cessation funds, disgorgement of profits, attorneys’ fees, and injunctive and other equitable relief.
6.Although alleged damages often are not determinable from a complaint, and the law governing the pleading and calculation of damages varies from jurisdiction to jurisdiction, compensatory and punitive damages have been specifically pleaded in a number of cases, sometimes in amounts ranging into the hundreds of millions and even hundreds of billions of sterling.
7.The Group has successfully managed tobacco-related litigation, and a very high percentage of the tobacco-related litigation claims brought against them, including Engle progeny cases, continue to be dismissed at or before trial. Based on their experience in tobacco-related litigation and the strength of the defences available to them in such litigation, the Group’s companies believe that their successful defence of tobacco-related litigation in the past will continue in the future.
8.It is the policy of the Group to defend tobacco-related litigation claims vigorously; generally, Group companies do not settle such claims. However, Group companies may enter into settlement discussions in certain cases, if they believe it is in their best interests to do so. Exceptions to this approach
include, but are not limited to, actions taken pursuant to ‘offer of judgment’ statutes and Filter Cases, as defined below. An ‘offer of judgment,’ if rejected by the plaintiff, preserves the Group’s right to recover attorneys’ fees under certain statutes in the event of a verdict favourable to the Group. Such offers are sometimes made through court-ordered mediations. Other settlements by Group companies include the State Settlement Agreements (as defined in paragraph 40 below), the funding by various tobacco companies of a US$5.2 billion (approximately £4.3 billion) trust fund contemplated by the Master Settlement Agreement (as described in paragraph 40 below) to benefit tobacco growers, the original Broin flight attendant case, and most of the Engle progeny cases pending in U.S. federal court, after the initial docket of over 4,000 such cases was reduced to approximately 400 cases. The Group believes that the circumstances surrounding these claims are readily distinguishable from the current categories of tobacco-related litigation claims involving Group companies.
9.Although the Group intends to defend all pending cases vigorously, and believes that the Group’s companies have valid bases for appeals of adverse verdicts and valid defences to all actions, and that an outflow of resources related to any individual case is not considered probable, litigation is subject to many uncertainties, and, generally, it is not possible to predict the outcome of any particular litigation pending against Group companies, or to reasonably estimate the amount or range of any possible loss. Furthermore, a number of political, legislative, regulatory and other developments relating to the tobacco industry and cigarette smoking have received wide media attention. These developments may negatively affect the outcomes of tobacco-related legal actions and encourage the commencement of additional similar litigation. Therefore, the Group does not provide estimates of the financial effect of the contingent liabilities represented by such litigation, as such estimates are not practicable.
10.The following table lists the categories of the tobacco-related actions pending against Group companies as at 31 December 2022 and the increase or decrease from the number of cases pending against Group companies as at 31 December 2021. Details of the quantum of past judgments awarded against Group companies, the majority of which are under appeal, are also identified along with any settlements reached during the relevant period. Given the volume and more active nature of the Engle progeny cases and the Filter Cases in the U.S. described below, and the fluctuation in the number of such cases and amounts awarded from year to year, the Group presents judgment or settlement figures for these cases on a three-year basis. Where no quantum is identified, either no judgment has been awarded against a Group company, or where a verdict has been reached no quantification of damages has been given, or no settlement has been entered into. Further details on the judgments, damages quantification and settlements are included within the case narratives below. For a discussion of the non-tobacco related litigation pending against the Group, see note 31, paragraph 82, et seq.
| | | | | | | | | | | | | | | | | | | | | | | |
| BAT Annual Report and Form 20-F 2022 | Strategic Report | | Governance Report | | Financial Statements | | Other Information |
| | | | | | | |
| | | | | | | |
| | | | | | | |
| Financial Statements | | | | | | | |
Notes on Accounts Continued |
| | | | | | | | | | | | | | |
| Case Type | Notes | Case Numbers as at 31 December 2022 (note 31(a)) | Case Numbers as at 31 December 2021 (note 31(a)) | Change in Number Increase/(decrease) |
| U.S. tobacco-related actions | | | | |
| Medical reimbursement cases | 31(b) | 2 | 2 | No change |
| Class actions | 31(c) | 20 | 20 | No change |
| Individual smoking and health cases | 31(d) | 206 | 222 | (16) |
Engle Progeny Cases | 31(e) | 665 | 1,071 | (406) |
Broin II Cases | 31(f) | 1,183 | 1,200 | (17) |
| Filter Cases | 31(g) | 46 | 46 | No change |
| State Settlement Agreements – Enforcement and Validity | 31(h) | 1 | 2 | (1) |
| Non-U.S. tobacco-related actions | | | | |
| Medical reimbursement cases | | 18 | 19 | (1) |
| Class actions | 31(i) | 12 | 12 | No change |
| Individual smoking and health cases | 31(j) | 51 | 68 | (17) |
(Note 31(a)) This includes cases to which the Reynolds American Inc. (Reynolds American) group companies were a party at such date.
(Note 31(b)) This category of cases includes the Department of Justice action. See note 31, paragraphs 20-23.
(Note 31(c)) See note 31, paragraphs 24-37.
(Note 31(d)) See note 31, paragraphs 38-39.
(Note 31(e)) See note 31, paragraphs 28-37.
(Note 31(f)) See note 31, paragraph 39.
(Note 31(g)) See note 31, paragraph 39.
(Note 31(h)) See note 31, paragraphs 40-54.
(Note 31(i)) Outside the United States, there are 12 class actions being brought against Group companies as at 31 December 2022. These include class actions in the following jurisdictions: Canada (11) and Venezuela (1). For a description of the Group companies’ class actions, see note 31, paragraphs 69-80. For a description of the Quebec Class Actions, see note 31, paragraph 75. All of the class actions in Canada are currently stayed pursuant to a court order. See note 31, paragraph 57.
(Note 31(j)) As at 31 December 2022, the jurisdictions with the most active individual cases against Group companies were, in descending order: Brazil (17), Chile (11), Italy (9), Canada (5), Argentina (5) and Ireland (2). There were a further two jurisdictions with one active case only. Out of these 51 active individual cases, as at 31 December 2022 there were two cases in Argentina that have resulted in pending unfavourable judgments. In one case, damages were awarded totalling ARS 685,976 (approximately £3,200) in compensatory damages and ARS 2,500,000 (approximately £11,700) in punitive damages, with post-judgment interest totalling approximately ARS 5,288,000 (approximately £25,000), while in the other case, compensatory damages were awarded totalling ARS 2,850,000 (approximately £13,400), with post-judgment interest totalling approximately ARS 92,638,000 (approximately £435,000). Both judgments are currently on appeal.
| | | | | | | | | | | | | | | | | | | | | | | |
| BAT Annual Report and Form 20-F 2022 | Strategic Report | | Governance Report | | Financial Statements | | Other Information |
| | | | | | | |
| | | | | | | |
| | | | | | | |
| | | | | | | |
|
11.Certain terms and phrases used in this note 31 may require some explanation.
a) ‘Judgment’ or ‘final judgment’ refers to the final decision of the court resolving the dispute and determining the rights and obligations of the parties. At the trial court level, for example, a final judgment generally is entered by the court after a jury verdict and after post-verdict motions have been decided. In most cases, the losing party can appeal a verdict only after a final judgment has been entered by the trial court.
b) ‘Damages’ refers to the amount of money sought by a plaintiff in a complaint, or awarded to a party by a jury or, in some cases, by a judge. ‘Compensatory damages’ are awarded to compensate the prevailing party for actual losses suffered, if liability is proved. In cases in which there is a finding that a defendant has acted wilfully, maliciously or fraudulently, generally based on a higher burden of proof than is required for a finding of liability for compensatory damages, a plaintiff also may be awarded ‘punitive damages’. Although damages may be awarded at the trial court stage, a losing party may be protected from paying any damages until all appellate avenues have been exhausted by posting a supersedeas bond. The amount of such a bond is governed by the law of the relevant jurisdiction and generally is set at the amount of damages plus some measure of statutory interest, modified at the discretion of the appropriate court or subject to limits set by a court or statute.
c) ‘Settlement’ refers to certain types of cases in which cigarette manufacturers, including R. J. Reynolds Tobacco Co. (RJRT), Brown & Williamson Tobacco Corporation (now known as Brown & Williamson Holdings, Inc.) (B&W), and Lorillard Tobacco Company (Lorillard Tobacco), have agreed to resolve disputes with certain plaintiffs without resolving the cases through trial.
d) All sums set out in note 31 have been converted to GBP and US$ using the following end closing rates: GBP 1 to US$ 1.2029, GBP 1 to CAD$ 1.6299, GBP 1 to EUR 1.1271, GBP 1 to BRL 6.3510, GBP 1 to AOA 613.3401, GBP 1 to NGN 703.8799, GBP 1 to KRW 1,521.0700, GBP 1 to HRK 8.4921, GBP 1 to JPY 158.7166, GBP 1 to QAR 4.3807, GBP 1 to SAR 4.5205, GBP 1 to ARS 213.0510, GBP 1 to MZN 77.0999 and GBP 1 to EGP 29.7778.
U.S. Tobacco Litigation
12.Group companies, notably RJRT (individually and as successor by merger to Lorillard Tobacco) and B&W as well as other leading cigarette manufacturers, are defendants in a number of product liability cases. In a number of these cases, the amounts of compensatory and punitive damages sought are significant.
13.The total number of U.S. tobacco product liability cases pending as at 31 December 2022 involving RJRT, B&W and/or Lorillard Tobacco was approximately 2,140.
14.Since many of these pending cases seek unspecified damages, it is not possible to quantify the total amounts being claimed, but the aggregate amounts involved in such litigation are significant, possibly totalling billions of U.S. dollars. The cases fall into four broad categories: medical reimbursement cases; class actions; individual cases; and other claims.
15.RJRT (individually and as successor by merger to Lorillard Tobacco), American Snuff Co., Santa Fe Natural Tobacco Company, Inc. (SFNTC), R.J. Reynolds Vapor Company (RJR Vapor), Reynolds American, Lorillard Inc., other Reynolds American affiliates and indemnitees, including but not limited to B&W (collectively, the Reynolds Defendants), believe that they have valid defences to the tobacco-related litigation claims against them, as well as valid bases for appeal of adverse verdicts against them. The Reynolds Defendants have, through their counsel, filed pleadings and memoranda in pending tobacco-related litigation that set forth and discuss a number of grounds and defences that they and their counsel believe have a valid basis in law and fact.
16.Scheduled trials. Trial schedules are subject to change, and many cases are dismissed before trial. In the U.S., there are 48 cases, exclusive of Engle progeny cases, scheduled for trial as at 31 December 2022 through 31 December 2023, for the Reynolds Defendants: 35 individual smoking and health cases, 11 Filter Cases, and two other cases. There are also approximately 77 Engle progeny cases against RJRT (individually and as successor to Lorillard Tobacco) and B&W scheduled for trial through 31 December 2023. It is not known how many of these cases will actually be tried.
17.Trial results. From 1 January 2020 through 31 December 2022, 44 trials occurred in individual smoking and health, Engle progeny, and patent cases in which the Reynolds Defendants were defendants, including nine where mistrials were declared. Verdicts in favour of the Reynolds Defendants and, in some cases, other defendants, were returned in eight cases, tried in Florida (5), Oregon (1), and Massachusetts (2). Verdicts in favour of the plaintiffs were returned in 23 cases, tried in Florida (18), Massachusetts (1), New Mexico (1), Oregon (2) and North Carolina (1). Three of the cases (in Florida) were dismissed during trial. One of the cases (in Florida) was a punitive damages re-trial.
(a) Medical Reimbursement Cases
18.These civil actions seek to recover amounts spent by government entities and other third-party providers on healthcare and welfare costs claimed to result from illnesses associated with smoking.
19.As at 31 December 2022, one U.S. medical reimbursement suit (Crow Creek Sioux Tribe v. American Tobacco Co., filed in 1997) was pending against RJRT, B&W and Lorillard Tobacco in a Native American tribal court in South Dakota. The plaintiffs seek to recover actual and punitive damages, restitution, funding of a clinical cessation programme, funding of a corrective public education programme, and disgorgement of unjust profits from sales to minors. There has been no recent activity in this case, and no other medical reimbursement suits are pending against these companies by county or other political subdivisions of the states.
| | | | | | | | | | | | | | | | | | | | | | | |
| BAT Annual Report and Form 20-F 2022 | Strategic Report | | Governance Report | | Financial Statements | | Other Information |
| | | | | | | |
| | | | | | | |
| | | | | | | |
| Financial Statements | | | | | | | |
Notes on Accounts Continued |
U.S. Department of Justice Action
20.On 22 September 1999, the U.S. Department of Justice (DOJ) brought an action in the U.S. District Court for the District of Columbia against various industry members, including RJRT, B&W, Lorillard Tobacco, B.A.T Industries p.l.c. (Industries) and Investments (United States v. Philip Morris USA Inc.). The DOJ initially sought (i) recovery of certain federal funds expended in providing health care to smokers who developed alleged smoking-related diseases and (ii) equitable relief under the civil provisions of the Racketeer Influenced and Corrupt Organizations Act (RICO), including (a) disgorgement of roughly US$280 billion (approximately £232.8 billion) in profits allegedly earned from a purported racketeering ‘enterprise’ - a remedy the U.S. Court of Appeals for the DC Circuit ruled in February 2005 was not available - and (b) certain ‘corrective communications’. In September 2000, the district court dismissed Industries for lack of personal jurisdiction and dismissed the health care cost recovery claims.
21.After a roughly nine-month non-jury trial of the remaining RICO claims, the district court issued its Final Judgment and Remedial Order (the Remedial Order) on 17 August 2006. That order found certain defendants, including RJRT, B&W, Lorillard Tobacco and Investments, had violated RICO, imposed financial penalties and enjoined the defendants from committing future racketeering acts, participating in certain trade organisations, making misrepresentations concerning smoking and health and youth marketing, and using certain brand descriptors such as ‘low tar’, ‘light’, ‘ultra-light’, ‘mild’ and ‘natural’. The Remedial Order also required the defendants to issue ‘corrective communications’ on five subjects, including smoking and health and addiction, and to comply with further undertakings, including maintaining websites of historical corporate documents and disseminating certain marketing information on a confidential basis to the government. In addition, the district court placed restrictions on the defendants’ ability to dispose of certain assets for use in the United States, unless the transferee agrees to abide by the terms of the district court’s order.
22.The parties appealed and cross-appealed and, on 22 May 2009, the DC Circuit affirmed the district court’s RICO liability judgment but vacated the Remedial Order in part and remanded for further factual findings and clarification as to whether liability should be imposed against B&W, based on changes in the nature of B&W’s business operations (including the extent of B&W’s control over tobacco operations). The DC Circuit also remanded three other discrete issues relating to the injunctive remedies, including for the district court ‘to reformulate’ the injunction on the use of low-tar descriptors ‘to exempt foreign activities that have no substantial, direct, and foreseeable domestic effects,’ and for the district court to evaluate whether corrective communications could be required at point-of-sale displays (which requirement the DC Circuit vacated). On 28 June 2010, the U.S. Supreme Court denied the parties' petitions for further review.
23.On 22 December 2010, the district court dismissed B&W from the litigation. Due to intervening changes in controlling law, on 28 March 2011, the district court ruled that the Remedial Order no longer applied to Investments prospectively, and for this reason, Investments would not have to comply with any of the remaining injunctive remedies. In November 2012, the district court entered an order setting forth the text of the corrective statements and directed the parties to engage in discussions with the Special Master to implement them. After various proceedings and appeals, the district court in October 2017 ordered RJRT and the other U.S. tobacco company defendants to fund the publication of compelled public statements in various U.S. media outlets, including in newspapers, on television, on the companies’ websites, and in onserts on cigarette packaging. The compelled public statements in newspapers and on television were completed in 2018 and in package onserts in mid-2020. The compelled public statements now also appear on RJRT websites. The final issue regarding corrective statements was their display at retail point of sale. On 6 December 2022, the district court entered a consent order requiring the tobacco company defendants to have the compelled public statements posted at retail point of sale from October 2023 through June 2025.
(b) Class Actions
24.As at 31 December 2022, RJRT, B&W and Lorillard Tobacco were named as defendants in two actions asserting claims on behalf of putative classes of persons allegedly injured or financially impacted by their smoking, and SFNTC was named in 17 putative class actions relating to the use of the words ‘natural’, ‘100% additive-free’ or ‘organic’ in Natural American Spirit advertising and promotional materials. If the classes are or remain certified, separate trials may be needed to assess individual plaintiffs’ damages. Among the pending class actions, 16 specified the amount of the claim in the complaint and alleged that the plaintiffs were seeking in excess of US$5 million (approximately £4.16 million) and one that alleged that the plaintiffs were seeking less than US$75,000 (approximately £62,349) per class member plus unspecified punitive damages.
| | | | | | | | | | | | | | | | | | | | | | | |
| BAT Annual Report and Form 20-F 2022 | Strategic Report | | Governance Report | | Financial Statements | | Other Information |
| | | | | | | |
| | | | | | | |
| | | | | | | |
| | | | | | | |
|
No Additive/Natural/Organic Claim Cases
25.A total of 17 pending putative class actions were filed in nine U.S. federal district courts against SFNTC, a subsidiary of Reynolds American, which cases generally allege, in various combinations, violations of state deceptive and unfair trade practice statutes, and claim state common law fraud, negligent misrepresentation, and unjust enrichment based on the use of descriptors such as ‘natural’, ‘organic’ and ‘100% additive-free’ in the marketing, labelling, advertising, and promotion of SFNTC’s Natural American Spirit brand cigarettes. In these actions, the plaintiffs allege that the use of these terms suggests that Natural American Spirit brand cigarettes are less harmful than other cigarettes and, for that reason, violated state consumer protection statutes or amounted to fraud or a negligent or intentional misrepresentation. The actions seek various categories of recovery, including economic damages, injunctive relief (including medical monitoring and cessation programmes), interest, restitution, disgorgement, treble and punitive damages, and attorneys’ fees and costs. In April 2016, the U.S. Judicial Panel on Multidistrict Litigation (JPML) consolidated the 16 cases pending at that time for pre-trial purposes before a federal district court in New Mexico, and a later-filed case was transferred there for pre-trial purposes in 2018. On 21 December 2017, that court granted the defendants’ motion to dismiss in part, dismissing a number of claims with prejudice, and denied it in part. The district court conducted a five-day hearing on the motion for class certification and on the motion challenging the admissibility of expert opinion testimony in December 2020. The parties filed post-hearing briefs in January 2021 and filed proposed findings of fact and conclusions of law in February 2021. A decision is pending.
Other Putative Class Actions
26.Jones v. American Tobacco Co. is a putative class action filed in December 1998 in the Circuit Court, Jackson County, Missouri, against various U.S. cigarette manufacturers, including RJRT, B&W, Lorillard Tobacco and certain parent companies. The action was brought by a plaintiff on behalf of a putative class of Missouri tobacco product users and purchasers alleging that the plaintiffs’ use of the defendants’ tobacco products has caused them to become addicted to nicotine, and seeking an unspecified amount of compensatory and punitive damages. There is currently no activity in this case.
27.Young v. American Tobacco Co. is a putative class action filed in November 1997 in the Circuit Court, Orleans Parish, Louisiana against various U.S. cigarette manufacturers, including RJRT, B&W, Lorillard Tobacco and certain parent companies. This action was brought on behalf of a putative class of Louisiana residents who, though not themselves cigarette smokers, have been exposed to second-hand smoke from cigarettes manufactured by the defendants, and who allegedly suffered injury as a result of that exposure. The action seeks an unspecified amount of compensatory and punitive damages. In March 2016, the court entered an order staying the case, including all discovery, pending the completion of an ongoing smoking cessation programme ordered by the court in a now-concluded Louisiana state court certified class action, Scott v. American Tobacco Co.
Engle Class Action and Engle Progeny Cases (Florida)
28.In July 1998, trial began in Engle v. R. J. Reynolds Tobacco Co., a then-certified class action filed in Circuit Court, Miami-Dade County, Florida, against U.S. cigarette manufacturers, including RJRT, B&W, Lorillard Tobacco and Lorillard Inc. The then-certified class consisted of Florida citizens and residents, and their survivors, who suffered from smoking-related diseases that first manifested between 5 May 1990, and 21 November 1996, and were caused by an addiction to cigarettes. In July 1999, the jury in this Phase I found against RJRT, B&W, Lorillard Tobacco, Lorillard Inc. and the other defendants on common issues relating to the defendants’ conduct, general causation, the addictiveness of cigarettes, and entitlement to punitive damages.
29.In July 2000, the jury in Phase II awarded the class a total of approximately US$145 billion (approximately £120.5 billion) in punitive damages, apportioned US$36.3 billion (approximately £30.2 billion) to RJRT, US$17.6 billion (approximately £14.6 billion) to B&W, and US$16.3 billion (approximately £13.6 billion) to Lorillard Tobacco and Lorillard Inc. The three class representatives in the Engle class action were awarded US$13 million (approximately £10.8 million) in compensatory damages.
30.This decision was appealed and ultimately resulted in the Florida Supreme Court in December 2006 decertifying the class and allowing judgments entered for only two of the three Engle class representatives to stand and setting aside the punitive damages award. The court preserved certain of the jury’s Phase I findings, including that cigarettes can cause certain diseases, nicotine is addictive, and defendants placed defective cigarettes on the market, breached duties of care, concealed health-related information and conspired. Putative Engle class members were permitted to file individual lawsuits, deemed ‘Engle progeny cases’, against the Engle defendants, within one year of the Supreme Court’s decision (subsequently extended to 11 January 2008).
31.During 2015, RJRT and Lorillard Tobacco, together with Philip Morris USA Inc. (PM USA), settled virtually all of the Engle progeny cases then pending against them in federal district court. The total amount of the settlement was US$100 million (approximately £83.1 million) divided as follows: RJRT US$42.5 million (approximately £35.3 million); PM USA US$42.5 million (approximately £35.3 million); and Lorillard Tobacco US$15 million (approximately £12.5 million). The settlement covered more than 400 federal Engle progeny cases but did not cover 12 federal progeny cases previously tried to verdict and then pending on post-trial motions or appeal, and two federal progeny cases filed by different lawyers from the ones who negotiated the settlement for the plaintiffs.
32.As at 31 December 2022, there were approximately 665 Engle progeny cases pending in which RJRT, B&W and/or Lorillard Tobacco have all been named as defendants and served. These cases include claims by or on behalf of 838 plaintiffs. In addition, as at 31 December 2022, RJRT was aware of five additional Engle progeny cases that have been filed but not served. The number of pending cases fluctuates for a variety of reasons, including voluntary and involuntary dismissals. Voluntary dismissals include cases in which a plaintiff accepts an ‘offer of judgment’ from RJRT and/or RJRT’s affiliates and indemnitees. An offer of judgment, if rejected by the plaintiff, preserves the offering party's right to seek attorneys’ fees under Florida law in the event of a favourable verdict. Such offers are sometimes made through court-ordered mediations.
| | | | | | | | | | | | | | | | | | | | | | | |
| BAT Annual Report and Form 20-F 2022 | Strategic Report | | Governance Report | | Financial Statements | | Other Information |
| | | | | | | |
| | | | | | | |
| | | | | | | |
| Financial Statements | | | | | | | |
Notes on Accounts Continued |
33.31 trials occurred in Engle progeny cases in Florida state and federal courts against RJRT, B&W and/or Lorillard Tobacco from 1 January 2020 through 31 December 2022, and additional state court trials are scheduled for 2023.
34.The following chart identifies the number of trials in Engle progeny cases as at 31 December 2022 and additional information about the adverse judgments entered:
Trials/verdicts/judgments of individual Engle progeny cases from 1 January 2020 through 31 December 2022:
| | | | | |
| Total number of trials | 31 |
| Number of trials resulting in plaintiffs’ verdicts | 16 ** |
| Total damages awarded in final judgments against RJRT | US$92,934,000 (approximately £77 million) |
| Amount of overall damages comprising ‘compensatory damages’ (approximately) | US$57,869,000 (of overall US$92,934,000 ) (approximately £48 million of £77 million) |
| Amount of overall damages comprising ‘punitive damages’ (approximately) | US$35,065,000 (of overall US$92,934,000) (approximately £29 million of £77 million) |
Note:
** Of the 16 trials resulting in plaintiffs’ verdicts 1 January 2020 to 31 December 2022 (note 31(k)):
| | | | | |
Number of adverse judgments appealed by RJRT (note 31(l)) | 12 |
| Number of adverse judgments, in which RJRT still has time to file an appeal | 2 |
| Number of adverse judgments in which an appeal was not, and can no longer be, sought | 2 |
Appeals of individual Engle progeny cases 1 January 2020 to 31 December 2022: |
| |
Number of adverse judgments appealed by RJRT (note 31(m)) | 13 |
(Note 31(k)) The 31 trials include two cases that were tried twice (Yount v. R.J. Reynolds Tobacco Co. and Rutkowski v. R. J. Reynolds Tobacco Co.). In each case, the first trial resulted in mistrial, while the second resulted in a verdict for plaintiff. The 31 cases also include one trial that resulted in a plaintiff verdict, but a new trial was ordered (Leidinger v. R. J. Reynolds Tobacco Co.).
(Note 31(l)) Of the 12 adverse verdicts appealed by RJRT as a result of judgments arising in the period 1 January 2020 to 31 December 2022:
a.eight appeals remain undecided in the District Courts of Appeal;
b.two appeals were decided and/or closed in the District Court of Appeals;
c.one judgment was affirmed and paid; and
d.there was one appeal in which the case was resolved and appeal dismissed.
(Note 31(m)) In addition to the 12 cases discussed in note 31(l), RJRT appealed one additional case during the 1 January 2020 to 31 December 2022 period, the original plaintiff verdict of which was returned in November 2019.
35.By statute, Florida applies a US$200 million (approximately £166.3 million) bond cap to all Engle progeny cases in the aggregate. Individual bond caps for any given Engle progeny case vary depending on the number of judgments in effect at a given time. Judicial attempts by several plaintiffs in the Engle progeny cases to challenge the bond cap as violating the Florida Constitution have failed. In addition, bills have been introduced in sessions of the Florida legislature that would eliminate the Engle progeny bond cap, but those bills have not been enacted as at 31 December 2022.
36.In 2022, RJRT paid judgments in 11 Engle progeny cases. Those payments totalled US$13.2 million (approximately £11.0 million) in compensatory or punitive damages. Additional costs were paid in respect of attorneys’ fees and statutory interest.
37.In addition, accruals for damages and attorneys’ fees and statutory interest for 14 cases and three resolution bundles (Konzelman v. R. J. Reynolds Tobacco Co., Ledo v. R. J. Reynolds Tobacco Co., Blackwood v. R. J. Reynolds Tobacco Co., Lane v. R. J. Reynolds Tobacco Co., McKeehan v. R. J. Reynolds Tobacco Co., Woodley v. R. J. Reynolds Tobacco Co., Rodriguez v. R. J. Reynolds Tobacco Co., French v. R. J. Reynolds Tobacco Co., Rembe v. R. J. Reynolds Tobacco Co., Canady v. R. J. Reynolds Tobacco Co., Redburn v. R. J. Reynolds Tobacco Co., Phelps v. R. J. Reynolds Tobacco Co., Wlasiuk v. R. J. Reynolds Tobacco Co., Leidinger v. R. J. Reynolds Tobacco Co., the Gary Williams Engle progeny bundle, the Ogle/Wiggins Child Engle progeny bundle, and the Ogle Engle progeny bundle) were recorded in Reynolds American’s consolidated balance sheet as at 31 December 2022 to the value of approximately US$53 million (approximately £44.1 million).
| | | | | | | | | | | | | | | | | | | | | | | |
| BAT Annual Report and Form 20-F 2022 | Strategic Report | | Governance Report | | Financial Statements | | Other Information |
| | | | | | | |
| | | | | | | |
| | | | | | | |
| | | | | | | |
|
(c) Individual Cases
38.As at 31 December 2022, 206 individual cases were pending in the United States against RJRT, B&W and/or Lorillard Tobacco. This category of cases includes smoking and health cases alleging personal injuries caused by tobacco use or exposure brought by or on behalf of individual plaintiffs based on theories of negligence, strict liability, breach of express or implied warranty, and violations of state deceptive trade practices or consumer protection statutes. The plaintiffs seek to recover compensatory damages, attorneys’ fees and costs, and punitive damages. The category does not include the Engle progeny cases, Broin II cases, and Filter Cases discussed above and below. One of the individual cases is brought by or on behalf of an individual or his/her survivors alleging personal injury as a result of exposure to Environmental Tobacco Smoke (ETS).
39.The following chart identifies the number of individual cases pending as at 31 December 2022 as against the number pending as at 31 December 2021, along with the number of Engle progeny cases, Broin II cases, and Filter Cases, which are discussed further below.
| | | | | | | | | | | |
| Case Type | U.S. Case Numbers 31 December 2022 | U.S. Case Numbers 31 December 2021 | Change in
Number
Increase / (Decrease) |
Individual Smoking and Health Cases (note 31(n)) | 206 | 222 | (16) |
Engle Progeny Cases (Number of Plaintiffs) (note 31(o)) | 665 (838) | 1,071 (1,304) | (406) (466) |
Broin II Cases (note 31(p)) | 1,183 | 1,200 | (17) |
| Filter Cases (note 31(q)) | 46 | 46 | No change |
(Note 31(n)) Out of the 206 pending individual smoking and health cases, nine have received adverse verdicts or judgments in the court of first instance or on appeal, and the total amount of those verdicts or judgments is approximately US$60.0 million (approximately £49.9 million).
(Note 31(o)) The number of Engle progeny cases will fluctuate as cases are dismissed or if any of the dismissed cases are appealed. Please see earlier table in paragraph 34.
(Note 31(p)) Broin v. Philip Morris, Inc. was a class action filed in Circuit Court in Miami-Dade County, Florida in 1991 and brought on behalf of flight attendants alleged to have suffered from diseases or ailments caused by exposure to ETS in airplane cabins. In October 1997, RJRT, B&W, Lorillard Tobacco and other cigarette manufacturer defendants settled Broin, agreeing to pay a total of US$300 million (approximately £249 million) in three annual US$100 million (approximately £83.1 million) instalments, allocated among the companies by market share, to fund research on the early detection and cure of diseases associated with tobacco smoke. It also required those companies to pay a total of US$49 million (approximately £40.7 million) for the plaintiffs’ counsel’s fees and expenses. RJRT’s portion of these payments was approximately US$86 million (approximately £71.5 million); B&W’s was approximately US$57 million (approximately £47.4 million); and Lorillard Tobacco’s was approximately US$31 million (approximately £25.8 million). The settlement agreement, among other things, limits the types of claims class members may bring and eliminates claims for punitive damages. The settlement agreement also provides that, in individual cases by class members that are referred to as Broin II lawsuits, the defendants will bear the burden of proof with respect to whether ETS can cause certain specifically enumerated diseases, referred to as ‘general causation’. With respect to all other liability issues, including whether an individual plaintiff’s disease was caused by his or her exposure to ETS in airplane cabins, referred to as ‘specific causation’, individual plaintiffs will bear the burden of proof. On 7 September 1999, the Florida Supreme Court approved the settlement. There have been no Broin II trials since 2007. There have been periodic efforts to activate cases and the Group expects this to continue over time.
(Note 31(q)) Includes claims brought against Lorillard Tobacco and Lorillard Inc. by individuals who seek damages resulting from their alleged exposure to asbestos fibres that were incorporated into filter material used in one brand of cigarettes manufactured by a predecessor to Lorillard Tobacco for a limited period of time ending more than 60 years ago. Pursuant to a 1952 agreement between P. Lorillard Company and H&V Specialties Co., Inc. (the manufacturer of the filter material), Lorillard Tobacco is required to indemnify Hollingsworth & Vose for legal fees, expenses, judgments and resolutions in cases and claims alleging injury from finished products sold by P. Lorillard Company that contained the filter material. As at 31 December 2022, Lorillard Tobacco and/or Lorillard Inc. was a defendant in 46 Filter Cases. Since 1 January 2020, Lorillard Tobacco and RJRT have paid, or have reached agreement to pay, a total of approximately US$22.3 million (approximately £18.5 million) in settlements to resolve 84 Filter Cases.
(d) State Settlement Agreements
40.In November 1998, the major U.S. cigarette manufacturers, including RJRT, B&W and Lorillard Tobacco, entered into the Master Settlement Agreement (MSA) with attorneys general representing 46 U.S. states, the District of Columbia and certain U.S. territories and possessions. These cigarette manufacturers previously settled four other cases, brought on behalf of Mississippi, Florida, Texas and Minnesota, by separate agreements with each state (collectively and with the MSA, the ‘State Settlement Agreements’).
41.These State Settlement Agreements settled all health care cost recovery actions brought by, or on behalf of, the settling jurisdictions; released the defending major U.S. cigarette manufacturers from various additional present and potential future claims; imposed future payment obligations in perpetuity on RJRT, B&W, Lorillard Tobacco and other major U.S. cigarette manufacturers; and placed significant restrictions on their ability to market and sell cigarettes and smokeless tobacco products. In accordance with the MSA, various tobacco companies agreed to fund a US$5.2 billion (approximately £4.3 billion) trust fund to be used to address the possible adverse economic impact of the MSA on tobacco growers.
| | | | | | | | | | | | | | | | | | | | | | | |
| BAT Annual Report and Form 20-F 2022 | Strategic Report | | Governance Report | | Financial Statements | | Other Information |
| | | | | | | |
| | | | | | | |
| | | | | | | |
| Financial Statements | | | | | | | |
Notes on Accounts Continued |
42.RJRT and SFNTC are subject to the substantial payment obligations under the State Settlement Agreements. Payments under the State Settlement Agreements are subject to various adjustments for, among other things, the volume of cigarettes sold, relative market share, operating profit and inflation. Reynolds American’s operating subsidiaries’ expenses and payments under the State Settlement Agreements for 2019, 2020, 2021 and 2022 and the projected expenses and payments for 2023 and onwards are set forth below (in millions of U.S. dollars)*:
| | | | | | | | | | | | | | | | | | | | |
| 2019 | 2020 | 2021 | 2022 | 2023 | 2024 and thereafter |
| Settlement expenses | $2,762 | $3,572 | $3,420 | $2,951 | | |
| Settlement cash payments | $2,918 | $2,848 | $3,744 | $3,129 | | |
| Projected settlement expenses | | | | | >$2,800 | >$2,800 |
| Projected settlement cash payments | | | | | >$3,000 | >$2,800 |
Note:
* Subject to adjustments for changes in sales volume, inflation, operating profit and other factors. Payments are allocated among the companies on the basis of relative market share or other methods.
43.The State Settlement Agreements have materially adversely affected RJRT’s shipment volumes. Reynolds American believes that these settlement obligations may materially adversely affect the results of operations, cash flows or financial position of Reynolds American and RJRT in future periods. The degree of the adverse impact will depend, among other things, on the rate of decline in U.S. cigarette sales in the premium and value categories, RJRT’s share of the domestic premium and value cigarette categories, and the effect of any resulting cost advantage of manufacturers not subject to the State Settlement Agreements.
44.In addition, the MSA includes an adjustment that potentially reduces the annual payment obligations of RJRT, Lorillard Tobacco and the other signatories to the MSA, known as ‘Participating Manufacturers’ (PMs). Certain requirements, collectively referred to as the ‘Adjustment Requirements’, must be satisfied before the Non-Participating Manufacturers (NPM) Adjustment for a given year is available: (i) an Independent Auditor must determine that the PMs have experienced a market share loss, beyond a triggering threshold, to those manufacturers that do not participate in the MSA (such non-participating manufacturers being referred to as NPMs); and (ii) in a binding arbitration proceeding, a firm of independent economic consultants must find that the disadvantages of the MSA were a significant factor contributing to the loss of market share. This finding is known as a significant factor determination.
45.When the Adjustment Requirements are satisfied, the MSA provides that the NPM Adjustment applies to reduce the annual payment obligation of the PMs. However, an individual settling state may avoid its share of the NPM Adjustment if it had in place and diligently enforced during the entirety of the relevant year a ‘Qualifying Statute’ that imposes escrow obligations on NPMs that are comparable to what the NPMs would have owed if they had joined the MSA. In such event, the state’s share of the NPM Adjustment is reallocated to other settling states, if any, that did not have in place and diligently enforce a Qualifying Statute.
46.RJRT, Lorillard Tobacco and SFNTC are or were involved in the NPM Adjustment proceedings concerning the years 2003 to 2019. In 2012, RJRT, Lorillard Tobacco, and SFNTC entered into an agreement (the Term Sheet) with certain settling states that resolved accrued and future NPM adjustments. After an arbitration panel ruled in September 2013 that six states had not diligently enforced their qualifying statutes in the year 2003, additional states joined the Term Sheet. RJRT executed the NPM Adjustment Settlement Agreement on 25 September 2017 (which incorporated the Term Sheet). Since the NPM Adjustment Settlement Agreement was executed, an additional 11 states have joined. The arbitration panels ruled in September 2021 that two states had not diligently enforced their qualifying statutes in the year 2004. In September 2022, a panel also ruled that an additional state had not diligently enforced its qualifying statute in the year 2004. NPM proceedings are ongoing and could result in further reductions of the companies’ MSA-related payments.
47.On 18 January 2017, the State of Florida filed a motion to join Imperial Tobacco Group, PLC (ITG) as a defendant and to enforce the Florida State Settlement Agreement, which motion sought payment under the Florida State Settlement Agreement of approximately US$45 million (approximately £37.4 million) with respect to the four brands (Winston, Salem, Kool and Maverick) that were sold to ITG in the divestiture of certain assets, on 12 June 2015, by subsidiaries or affiliates of Reynolds American and Lorillard, to a wholly owned subsidiary of Imperial Brands plc (the Divestiture), referred to as the ‘Acquired Brands’. The motion also claimed future annual losses of approximately US$30 million per year (approximately £24.9 million) absent the court’s enforcement of the Florida State Settlement Agreement. The State’s motion sought, among other things, an order declaring that RJRT and ITG are in breach of the Florida Settlement Agreement and are required, jointly and severally, to make annual payments to the State under the Florida State Settlement Agreement with respect to the Acquired Brands. By order dated 30 March 2017, ITG was joined into the enforcement action. In addition, on 18 January 2017, PM USA filed a motion to enforce the Florida State Settlement Agreement asserting, among other things, that RJRT and ITG breached that agreement by failing to make settlement payments as to the Acquired Brands, which PM USA asserts improperly shifted settlement payment obligations to PM USA.
| | | | | | | | | | | | | | | | | | | | | | | |
| BAT Annual Report and Form 20-F 2022 | Strategic Report | | Governance Report | | Financial Statements | | Other Information |
| | | | | | | |
| | | | | | | |
| | | | | | | |
| | | | | | | |
|
48.After a bench trial, on 27 December 2017 the court entered
an order holding RJRT (not ITG) liable for annual settlement payments for the Acquired Brands, finding that ITG did not assume liability for annual settlement payments related to the Acquired Brands under the terms of the asset purchase agreement relating to the Divestiture. The court declined to enter final judgment until after resolution of the dispute between RJRT and PM USA regarding PM USA's assertion that the settlement payment obligations have been improperly shifted to PM USA. On 15 August 2018, the court entered a final judgment in the action (the Final Judgment). As a result of the Final Judgment, PM USA's challenge to RJRT's accounting assumptions related to the Acquired Brands was rendered moot, subject to reinstatement if ITG joins the Florida State Settlement Agreement or if the Final Judgment is reversed. On 29 August 2018, RJRT filed a notice of appeal on the Final Judgment. On 7 September 2018, PM USA filed a notice of appeal with respect to the court's ruling as to ITG. These appeals were consolidated pursuant to RJRT's motion on 1 October 2018. On 29 July 2020, Florida's Fourth District Court of Appeal affirmed the Final Judgment. On 12 August 2020, RJRT filed a motion for rehearing or for certification to the Florida Supreme Court of the 29 July 2020 decision. RJRT posted a total bond in the amount of US$187,797,139.83 (approximately £156.1 million) for its appeal. RJRT’s motion for rehearing or certification to the Florida Supreme Court was denied on 18 September 2020 and its motion for review was denied by the Florida Supreme Court on 18 December 2020. On 5 October 2020, RJRT satisfied the Final Judgment (approximately US$192,869,589.86 (approximately £160.3 million)) and paid approximately US$3.2 million (approximately £2.7 million) of Florida’s attorneys’ fees. RJRT's appellate bonds were released to RJRT by order dated 5 November 2020. As explained below, RJRT has secured an order in the Delaware action requiring ITG to indemnify it for amounts paid under the Final Judgment.
49.On 17 February 2017, ITG filed an action in the Delaware Court of Chancery seeking declaratory relief against Reynolds American and RJRT on various matters related to its rights and obligations under the asset purchase agreement (and related documents) relating to the Divestiture with respect to the subject of the Florida enforcement litigation described above. Reynolds American and RJRT filed counterclaims on the same issues. As a result of multiple rounds of cross-motions for judgment on the pleadings, the Delaware court ruled (i) that ITG’s obligation to use its reasonable best efforts to join the Florida Settlement Agreement did not terminate due to the closing of the asset purchase agreement relating to the Divestiture; (ii) that the asset purchase agreement does not entitle ITG to a unique protection from an equity-fee law that does not yet exist in a Previously Settled State; and (iii) that it would defer until after it received evidence related to the parties' intent in the asset purchase agreement, its determination of whether, to the extent RJRT is held liable for any settlement payments based on ITG's post-closing sales of the Acquired Brands, ITG assumed this liability. After discovery was completed in March 2022, the parties briefed cross-motions for summary judgment on that third issue. On 30 September 2022, the court granted summary judgment for Reynolds American and RJRT, holding that ITG assumed the liability that the Final Judgment imposed on RJRT for settlement payments to the State of Florida based on ITG's post-closing sales of the Acquired Brands. A second round of summary judgment briefing on the amount of indemnifiable damages is complete. A hearing on that issue is scheduled for 23 February 2023.
50.In June 2015, ITG joined the Mississippi State Settlement Agreement. On 26 December 2018, PM USA filed a motion to enforce the settlement agreement against RJRT and ITG alleging RJRT and ITG failed to act in good faith in calculating the base year net operating profits for the Acquired Brands, claiming damages of approximately US$6 million (approximately £5.0 million) through 2017. On 21 February 2019, the Chancery Court of Jackson County, Mississippi held a scheduling conference and issued a discovery schedule order. A hearing on PM USA’s motion to enforce, originally scheduled for 3-6 May 2021, was adjourned on consent of the parties to 11-12 August 2021. On 8 June 2021, PM USA and RJRT entered into a settlement agreement resolving the outstanding payment calculation issues. On 11 June 2021, the Mississippi Chancery Court entered an order withdrawing PM USA’s motion to enforce. On 14 June 2021, RJRT made a payment of US$5.1 million (approximately £4.2 million) to PM USA. On 3 December 2019, the State of Mississippi filed a notice of violation and motion to enforce the settlement agreement in the Chancery Court of Jackson County, Mississippi against RJRT, PM USA and ITG, seeking a declaration that the base year 1997 net operating profit to be used in calculating the Net Operating Profit Adjustment was not affected by the change in the federal corporate tax rate in 2018 from 35% to 21%, and an order requiring RJRT to pay the approximately US$5 million (approximately £4.2 million) difference in its 2018 payment because of this issue. Determination of this issue may affect RJRT’s annual payment thereafter. A hearing on Mississippi’s motion to enforce occurred on 6-7 October 2021. On 10 June 2022, the Mississippi Chancery Court granted the State's motion to enforce, finding that the base year 1997 net operating profit to be used in calculating the Net Operating Profit Adjustment was not affected by the change in the federal corporate tax rate in 2018. RJRT will appeal the motion to enforce. On 29 July 2022, the parties each submitted a supplemental briefing on damages, including interest and attorneys' fees. A hearing on damages was scheduled for 7 December 2022, however, the Court advised the parties that the hearing will be rescheduled for a date in 2023; the parties will confer to select a new date.
51.In January 2021, RJRT reached an agreement with several MSA states to waive RJRT’s claims under the MSA in connection with a settlement between those MSA states and a non-participating manufacturer, S&M Brands, Inc. (S&M Brands), under which the states released certain claims against S&M Brands in exchange for receiving a portion of the funds S&M Brands had deposited into escrow accounts in those states pursuant to the states’ escrow statutes. In consideration for waiving claims, RJRT, together with SFNTC, received approximately US$55.4 million (approximately £46.1 million) from the escrow funds paid to those MSA states under their settlement with S&M Brands.
52.On 27 May 2022, PM USA filed a motion to compel arbitration under the MSA against RJRT and ITG in North Carolina Superior Court claiming RJRT and ITG inaccurately calculated the base year net operating profits for the Acquired Brands and this improperly shifted approximately US$80 million (approximately £66.5 million) in MSA payment obligations from RJRT to PM USA, to date. On 7 June 2022, RJRT and PM USA negotiated a resolution of the MSA claims, in which RJRT agreed to, among other things, pay PM USA the sum of approximately US$37 million (approximately £30.8 million).
| | | | | | | | | | | | | | | | | | | | | | | |
| BAT Annual Report and Form 20-F 2022 | Strategic Report | | Governance Report | | Financial Statements | | Other Information |
| | | | | | | |
| | | | | | | |
| | | | | | | |
| Financial Statements | | | | | | | |
Notes on Accounts Continued |
53.On 28 July 2022, the State of Iowa filed a motion to enforce the Consent Decree and MSA against the PMs asserting, among other things, claims for breach of contract and violations of the Iowa False Claims Act. Iowa seeks over US$130 million (approximately £108 million) in damages, as well as treble damages. The PMs filed their resistance to Iowa’s motion and a motion to compel arbitration on 26 September 2022. Iowa filed its resistance to the PMs’ motion to compel arbitration on 6 October 2022, and the PMs filed their reply on 31 October 2022. A hearing on the motion was held on 21 December 2022; a decision is pending.
54.On 29 November 2022, the State of New Mexico filed a complaint, or in the alternative, a motion to enforce the Consent Decree and MSA against the PMs asserting, among other things, claims for breach of contract and violations of New Mexico’s Unfair Practices Act. New Mexico seeks compensatory damages in an amount to be determined at trial, as well as treble damages, punitive damages, and declaratory and injunctive relief. The PMs’ deadline to answer or respond was 29 December 2022. On 15 December 2022, the PMs filed an opposed motion for an extension of deadlines and pages to file their response on 10 February 2023. New Mexico filed its response to the motion on 20 December 2022 and the PMs filed their reply on 30 December 2022. On 13 January 2023, the court granted the PMs’ motion to extend their deadline to file their response to 10 February 2023.
Tobacco-Related Litigation Outside the U.S.
55.As at 31 December 2022:
a) medical reimbursement actions are being brought in Angola, Brazil, Canada, Nigeria and South Korea;
b) class actions are being brought in Canada and Venezuela; and
c) active tobacco product liability claims against the Group’s companies existed in 12 markets outside the U.S. The only markets with five or more claims were Argentina, Brazil, Canada, Chile, Nigeria and Italy.
(a) Medical reimbursement cases
Angola
56.In November 2016, BAT Angola affiliate Sociedade Unificada de Tabacos de Angola (SUT) was served with a collective action filed in the Provincial Court of Luanda, 2nd Civil Section, by the consumer association Associação Angolana dos Direitos do Consumidor (AADIC). The lawsuit seeks damages of AOA 800,000,000 (approximately £1.3 million) allegedly incurred by the Angolan Instituto Nacional do Controlo do Cancro (INCC) for the cost of treating tobacco-related disease, non-material damages allegedly suffered by certain individual smokers on the rolls of INCC, and the mandating of certain cigarette package warnings. SUT filed its answer to the claim on 5 December 2016. The case remains pending.
Canada
57.On 1 March 2019, the Quebec Court of Appeal handed down a judgment which largely upheld and endorsed the lower court’s previous decision in two Quebec class actions (the Quebec Class Actions), as further described below. The share of the judgment for Imperial, the Group’s operating company in Canada, is approximately CAD$9.2 billion (approximately £5.6 billion). As a result of this judgment, there were attempts by the Quebec plaintiffs to obtain payment out of the CAD $758 million (approximately £465 million) on deposit with the court. JTI-MacDonald Corp (a co-defendant in the cases) filed for creditor protection under the Companies’ Creditors Arrangement Act (the CCAA) on 8 March 2019. A court order to stay all tobacco litigation in Canada against all defendants (including RJRT and its affiliate R.J. Reynolds Tobacco International Inc. (collectively, the RJR Companies)) until 4 April 2019 was obtained, and the need for a mediation process to resolve all the outstanding litigation across the country was recognised. On 12 March 2019 Imperial filed for creditor protection under the CCAA. In its application Imperial asked the Ontario Superior Court to stay all pending or contemplated litigation against Imperial, certain of its subsidiaries and all other Group companies that were defendants in the Canadian tobacco litigation, including British American Tobacco p.l.c. (the Company), Investments, Industries and Carreras Rothmans Limited (collectively, the UK Companies). On 22 March 2019, Rothmans, Benson & Hedges Inc. also filed for CCAA protection and obtained a stay of proceedings (together with the other two stays, the Stays). The Stays are currently in place until 31 March 2023. While the Stays are in place, no steps are to be taken in connection with the Canadian tobacco litigation with respect to any of the defendants.
58.The below represents the state of the referenced litigation
as at the advent of the Stays.
59.Following the implementation of legislation enabling provincial governments to recover health-care costs directly from tobacco manufacturers, 10 actions for recovery of health-care costs arising from the treatment of smoking- and health-related diseases have been brought. These proceedings name various Group companies as defendants, including the UK Companies and Imperial as well as the RJR Companies. Pursuant to the terms of the 1999 sale of RJRT’s international tobacco business to Japan Tobacco Incorporated (JTI), JTI has agreed to indemnify RJRT for all liabilities and obligations (including litigation costs) arising in respect of the Canadian recoupment actions. Subject to a reservation of rights, JTI has assumed the defence of the RJR Companies in these actions.
| | | | | | | | | | | | | | | | | | | | | | | |
| BAT Annual Report and Form 20-F 2022 | Strategic Report | | Governance Report | | Financial Statements | | Other Information |
| | | | | | | |
| | | | | | | |
| | | | | | | |
| | | | | | | |
|
60.The 10 cases were proceeding in British Columbia, New Brunswick, Newfoundland and Labrador, Ontario, Quebec, Manitoba, Alberta, Saskatchewan, Nova Scotia and Prince Edward Island. The enabling legislation is in force in all 10 provinces. In addition, legislation has received Royal Assent
in two of the three territories in Canada, but has yet to be proclaimed into force.
Canadian province: British Columbia
Act pursuant to which Claim was brought: Tobacco Damages and Health Care Costs Recovery Act 2000
Companies named as Defendants: Imperial, Investments, Industries, Carreras Rothmans Limited, the RJR Companies and other former Rothmans Group companies have been named as defendants and served.
Current stage: The defences of Imperial, Investments, Industries, Carreras Rothmans Limited and the RJR Companies have been filed, and document production and discoveries were ongoing. On 13 February 2017, the Province delivered an expert report dated October 2016, quantifying its damages in the amount of CAD$118 billion (approximately £72.4 billion). No trial date has been set. The federal government is seeking CAD$5 million (approximately £3.1 million) jointly from all the defendants in respect of costs pertaining to the third-party claim, now dismissed.
Canadian province: New Brunswick
Act pursuant to which Claim was brought: Tobacco Damages and Health Care Costs Recovery Act 2006
Companies named as Defendants: Imperial, the UK Companies and the RJR Companies have been named as defendants and served.
Current stage: The defences of Imperial, the UK Companies and the RJR Companies have been filed and document production and discoveries are substantially complete. The most recent expert report filed by the Province estimated a range of damages between CAD$11.1 billion (approximately £6.8 billion) and CAD$23.2 billion (approximately £14.2 billion), including expected future costs. Following a motion to set a trial date, the New Brunswick Court of Queen’s Bench ordered that the trial commence on 4 November 2019. On 7 March 2019, the New Brunswick Court of Queen’s Bench released a decision which requires the Province to produce a substantial amount of additional documentation and data to the defendants. As a result, the original trial date of 4 November 2019 would have been delayed. No new trial date has been set.
Canadian province: Ontario
Act pursuant to which Claim was brought: Tobacco Damages and Health Care Costs Recovery Act 2009
Companies named as Defendants: Imperial, the UK Companies and the RJR Companies have been named as defendants and served.
Current stage: The defences of Imperial, the UK Companies and the RJR Companies have been filed. The parties completed significant document production in the summer of 2017 and discoveries commenced in the autumn of 2018. On 15 June 2018, the Province delivered an expert report quantifying its damages in the range of CAD$280 billion (approximately £172 billion) – CAD$630 billion (approximately £387 billion) in 2016/2017 dollars for the period 1954 – 2060, and the Province amended the damages sought in its Statement of Claim to CAD$330 billion (approximately £202.5 billion). On 31 January 2019, the Province delivered a further expert report claiming an additional amount between CAD$9.4 billion (approximately £5.8 billion) and CAD$10.9 billion in damages (approximately £6.7 billion) in respect of ETS. No trial date has been set.
Canadian province: Newfoundland and Labrador
Act pursuant to which Claim was brought: Tobacco Health Care Costs Recovery Act 2001
Companies named as Defendants: Imperial, the UK Companies and the RJR Companies have been named as defendants and served.
Current stage: This case is at an early case management stage. The defences of Imperial, the UK Companies and the RJR Companies have been filed and the Province began its document production in March 2018. Damages have not been quantified by the Province. No trial date has been set.
Canadian province: Saskatchewan
Act pursuant to which Claim was brought: Tobacco Damages and Health Care Costs Recovery Act 2007
Companies named as Defendants: Imperial, the UK Companies and the RJR Companies have been named as defendants and served.
Current stage: This case is at an early case management stage. The defences of Imperial, the UK Companies and the RJR Companies have been filed and the Province has delivered a test shipment of documents. Damages have not been quantified by the Province. No trial date has been set.
Canadian province: Manitoba
Act pursuant to which Claim was brought: Tobacco Damages Health Care Costs Recovery Act 2006
Companies named as Defendants: Imperial, the UK Companies and the RJR Companies have been named as defendants and served.
Current stage: This case is at an early case management stage. The defences of Imperial, the UK Companies and the RJR Companies have been filed and document production commenced. Damages have not been quantified by the Province. No trial date has been set.
Canadian province: Alberta
Act pursuant to which Claim was brought: Crown’s Right of Recovery Act 2009
Companies named as Defendants: Imperial, the UK Companies and the RJR Companies have been named as defendants and served.
Current stage: This case is at an early case management stage. The defences of Imperial, the UK Companies and the RJR Companies have been filed and the Province commenced its document production. The Province has stated its claim to be worth CAD$10 billion (approximately £6.1 billion). No trial date has been set.
Canadian province: Quebec
Act pursuant to which Claim was brought: Tobacco Related Damages and Health Care Costs Recovery Act 2009
Companies named as Defendants: Imperial, Investments, Industries, the RJR Companies and Carreras Rothmans Limited have been named as defendants and served.
Current stage: This case is at an early case management stage. The defences of Imperial, Investments, Industries, Carreras Rothmans Limited and the RJR Companies have been filed. Motions over admissibility of documents and damages discovery have been filed but not heard. The Province is seeking CAD$60 billion (approximately £36.8 billion). No trial date has been set.
| | | | | | | | | | | | | | | | | | | | | | | |
| BAT Annual Report and Form 20-F 2022 | Strategic Report | | Governance Report | | Financial Statements | | Other Information |
| | | | | | | |
| | | | | | | |
| | | | | | | |
| Financial Statements | | | | | | | |
Notes on Accounts Continued |
Canadian province: Prince Edward Island
Act pursuant to which Claim was brought: Tobacco Damages and Health Care Costs Recovery Act 2009
Companies named as Defendants: Imperial, the UK Companies and the RJR Companies have been named as defendants and served.
Current stage: This case is at an early case management stage. The defences of Imperial, the UK Companies and the RJR Companies have been filed and the next step was expected to be document production, which the parties deferred for the time being. Damages have not been quantified by the Province. No trial date has been set.
Canadian province: Nova Scotia
Act pursuant to which Claim was brought: Tobacco Health Care Costs Recovery Act 2005
Companies named as Defendants: Imperial, the UK Companies and the RJR Companies have been named as defendants and served.
Current stage: This case is at an early case management stage. The defences of Imperial, the UK Companies and the RJR Companies have been filed. The Province provided a test document production in March 2018. Damages have not been quantified by the Province. No trial date has been set.
Nigeria
61.British American Tobacco (Nigeria) Limited (BAT Nigeria), the Company and Investments have been named as defendants in a medical reimbursement action by the federal government of Nigeria, filed on 6 November 2007 in the Federal High Court, and in similar actions filed by the Nigerian states of Kano (9 May 2007), Oyo (30 May 2007), Lagos (13 March 2008), Ogun (26 February 2008), and Gombe (17 October 2008) commenced in their respective High Courts. In the five cases that remain active, the plaintiffs seek a total of approximately 10.6 trillion Nigerian naira (approximately £15 billion) in damages, including special, anticipatory and punitive damages, restitution and disgorgement of profits, as well as declaratory and injunctive relief.
62.The suits claim that the state and federal government plaintiffs incurred costs related to the treatment of smoking-related illnesses resulting from allegedly tortious conduct by the defendants in the manufacture, marketing, and sale of tobacco products in Nigeria, and assert that the plaintiffs are entitled to reimbursement for such costs. The plaintiffs assert causes of action for negligence, negligent design, fraud and deceit, fraudulent concealment, breach of express and implied warranty, public nuisance, conspiracy, strict liability, indemnity, restitution, unjust enrichment, voluntary assumption of a special undertaking, and performance of another’s duty to the public.
63.The Company and Investments have made a number of challenges to the jurisdiction of the Nigerian courts. Such challenges are still pending (on appeal) against the federal government and the states of Lagos, Kano, Gombe and Ogun. The underlying cases are stayed or adjourned pending the final outcome of these jurisdictional challenges. In the state of Oyo, on 13 November 2015, and 24 February 2017, respectively, the Company’s and Investments’ jurisdictional challenges were successful in the Court of Appeal and the issuance of the writ of summons was set aside.
South Korea
64.In April 2014, Korea’s National Health Insurance Service (NHIS) filed a healthcare recoupment action against KT&G (a Korean tobacco company), PM Korea and BAT Korea (including BAT Korea Manufacturing). The NHIS is seeking damages of roughly 54 billion Korean Won (approximately £35.5 million) in respect of health care costs allegedly incurred by the NHIS treating patients with lung (small cell and squamous cell) and laryngeal (squamous cell) cancer between 2003 and 2012. Court hearings in the case, which constitute the trial, commenced in September 2014. On 20 November 2020, the court issued a judgment in favour of the defendants and dismissing all of the plaintiff’s claims. The NHIS filed an appeal of the judgment on 11 December 2020. Appellate proceedings commenced in June 2021 and remain ongoing.
Brazil
65.On 21 May 2019, the Federal Attorney’s Office (AGU) in Brazil filed an action in the Federal Court of Rio Grande do Sul against the Company, the BAT Group’s Brazilian subsidiary Souza Cruz LTDA (Souza Cruz), Philip Morris International, Philip Morris Brazil Indústria e Comércio LTDA and Philip Morris Brasil S/A (collectively, PMB), asserting claims for medical reimbursement for funds allegedly expended by the federal government as public health care expenses to treat 26 tobacco-related diseases over the last five years from the filing date and that will be expended in perpetuity during future years, including diseases allegedly caused both by cigarette smoking and exposure to ETS. The action includes a claim for moral damages allegedly suffered by Brazilian society to be paid into a public welfare fund. The action is for an unspecified amount of monetary compensation, as the AGU seeks a bifurcated action in which liability would be determined in the first phase followed by an evidentiary phase to ascertain damages.
66.On 19 July 2019, the trial court ordered that service of the action on the Company be effected via service on Souza Cruz. On 6 August 2019, Souza Cruz refused to receive service on behalf of the Company due to Souza Cruz’s lack of power to do so. On 7 August 2019, Souza Cruz was served with the complaint. On 19 August 2019, Souza Cruz filed an interlocutory appeal challenging the 19 July 2019 trial court order and requesting a stay of proceedings until the appeal is decided. On 20 August 2019, the trial court issued a new decision that vacated its 19 July 2019 order to reassess whether service of a foreign defendant via its Brazilian subsidiary constituted improper service. The appellate court, in response to the trial court's 20 August 2019 decision, ruled on 21 August 2019 that the interlocutory appeal previously filed by Souza Cruz was rendered moot. The AGU filed its submission in the trial court on 19 September 2019, and Souza Cruz filed a reply submission on 25 September 2019.
67.On 4 February 2020, following further submissions by the AGU and Souza Cruz, the trial court ruled that service of the Company via its Brazilian subsidiary constituted proper service, and ordered that defences be filed within 30 business days. On 18 February 2020, Souza Cruz filed an interlocutory appeal challenging this decision and requesting a stay of the deadline to file defences. The Company intervened in Souza Cruz's appeal effective 8 July 2020. On 15 July 2020, the appellate court denied the interlocutory appeal. Souza Cruz and the Company filed their respective defences on 12 May 2020. The appellate decision in the interlocutory appeal became final on 7 June 2021.
68.On 19 February 2021, the Associação de Controle do Tabagismo, Promoção da Saúde (ACT) filed a petition seeking to intervene in the case as amicus curiae. Souza Cruz, PMB and the Company filed responses (on 25 March 2021, 26 March 2021 and 20 August 2021, respectively) asserting that ACT's request should be rejected and/or in the alternative that
| | | | | | | | | | | | | | | | | | | | | | | |
| BAT Annual Report and Form 20-F 2022 | Strategic Report | | Governance Report | | Financial Statements | | Other Information |
| | | | | | | |
| | | | | | | |
| | | | | | | |
| | | | | | | |
|
the scope of ACT's intervention rights should be limited. On 13 May 2022, the trial court ordered the AGU to reply to the defences within 30 business days, and also permitted the ACT to intervene, limiting ACT's rights as amicus curiae to presenting technical and scientific opinions and participating in court hearings. The AGU submitted its reply on 5 July 2022. Souza Cruz, PMB and the Company submitted responses to the AGU's reply on 26 August 2022. On 19 May 2020, notice was sent to the Public Prosecutor’s Office (MPF) regarding the AGU’s request that the MPF join the action as a plaintiff. The MPF, via its response filed on 10 July 2020, declined to join the action as party, but will act as an ‘inspector of the law’, which enables MPF to express its opinion on case matters. On 10 October 2022, the MPF submitted an opinion on preliminary issues and evidence, which called for rejection of the defendants’ preliminary defences and the majority of the evidence requested by AGU and defendants. The court has not set a deadline for responses to the MPF’s submission.
(b) Class Actions
Canada
69.As described in paragraph 57, the Canadian tobacco litigation is currently stayed subject to court-ordered stays of proceeding (the Stays). The Stays are currently in place until 31 March 2023. While the Stays are in place, no steps are to be taken in connection with the Canadian tobacco litigation with respect to any of the defendants.
70.The below represents the state of the referenced litigation as at the advent of the Stays.
71.There are 11 class actions being brought in Canada against Group companies.
72.Knight Class Action: the Supreme Court of British Columbia certified a class of all consumers who purchased Imperial cigarettes in British Columbia bearing ‘light’ or ‘mild’ descriptors since 1974. The plaintiff is seeking compensation for amounts spent on ‘light and mild’ products and a disgorgement of profits from Imperial on the basis that the marketing of light and mild cigarettes was deceptive because it conveyed a false and misleading message that those cigarettes are less harmful than regular cigarettes.
73.On appeal, the appellate court confirmed the certification of the class, but limited any financial liability, if proven, to 1997 onward. Imperial’s third-party claim against the federal government was dismissed by the Supreme Court of Canada. The federal government is seeking a cost order of CAD$5 million (approximately £3.1 million) from Imperial relating to its now dismissed third-party claim. After being dormant for several years, the plaintiff delivered a Notice of Intention to Proceed, and Imperial delivered an application to dismiss the action for delay. The application was heard on 23 June 2017 and was dismissed on 23 August 2017. Notice to class members of certification was provided on 14 February 2018. As at the date of the Stays, the next steps were expected to include discovery-related ones.
74.Growers’ Class Action: in December 2009, Imperial was served with a proposed class action filed by Ontario tobacco farmers and the Ontario Flue-Cured Tobacco Growers’ Marketing Board. The plaintiffs allege that Imperial and the Canadian subsidiaries of Philip Morris International and JTI failed to pay the agreed domestic contract price to the growers used in products manufactured for the export market and which were ultimately smuggled back into Canada. JTI has sought indemnification pursuant to the JTI Indemnities (discussed below at paragraphs 131-132). The plaintiffs seek damages in the amount of CAD$50 million (approximately £30.7 million). Various preliminary challenges have been heard, the last being a motion for summary judgment on a limitation period. The motion was dismissed and ultimately, leave to appeal to the Ontario Court of Appeal was dismissed in November 2016. In December 2017, the plaintiffs proposed that the action proceed by way of individual actions as opposed to a class action. The defendants did not consent. As at the date of the Stays, the claim was in abeyance pending further action from the plaintiffs.
75.Quebec Class Actions: there are currently two smoking and health class actions in Quebec, certified by the Quebec Superior Court on 21 February 2005 against Imperial and two other domestic manufacturers. Judgment was rendered against the defendants on 27 May 2015. Pursuant to the judgment, the plaintiffs were awarded damages and interest against Imperial and the Canadian subsidiaries of Philip Morris International and JTI in the amount of CAD$15.6 billion (approximately £9.6 billion), most of which was on a joint and several basis, of which Imperial’s share was CAD$10.4 billion (approximately £6.4 billion). An appeal of the judgment was filed on 26 June 2015. The court also awarded provisional execution pending appeal of CAD$1,131 million (approximately £694 million), of which Imperial’s share was approximately CAD$742 million (approximately £455 million). This order was subsequently overturned by the Court of Appeal. Following the cancellation of the order for provisional execution, the plaintiffs filed a motion against Imperial and one other manufacturer seeking security in the amount of CAD$5 billion (approximately £3.1 billion) to guarantee, in whole or in part, the payment of costs of the appeal and the judgment. On 27 October 2015, the Court of Appeal ordered the parties to post security for the judgment in the amount of CAD$984 million (approximately £604 million), of which Imperial’s share was CAD$758 million (approximately £465 million) which amounts have been paid into court. Imperial's share was later recalculated by the Court of Appeal as CAD$759 million (approximately £465.7 million). On 1 March 2019, the trial judgment was upheld by a unanimous decision of the five-member panel of the Court of Appeal, with one exception being an amendment to the original interest calculation applied to certain portions of the judgment. The interest adjustment has resulted in the reduction of the total maximum award in the two cases to CAD$13.7 billion (approximately £8.4 billion) as at 1 March 2019, with Imperial’s share being reduced to approximately CAD$9.2 billion (approximately £5.6 billion).
| | | | | | | | | | | | | | | | | | | | | | | |
| BAT Annual Report and Form 20-F 2022 | Strategic Report | | Governance Report | | Financial Statements | | Other Information |
| | | | | | | |
| | | | | | | |
| | | | | | | |
| Financial Statements | | | | | | | |
Notes on Accounts Continued |
76.Other Canadian Smoking and Health Class Actions: seven putative class actions, described below, have been filed against various Canadian and non-Canadian tobacco-related entities, including the UK Companies, Imperial and the RJR Companies, in various Canadian provinces. In these cases, none of which have quantified their asserted damages, the plaintiffs allege claims based on fraud, fraudulent concealment, breach of warranty of merchantability, and of fitness for a particular purpose, failure to warn, design defects, negligence, breach of a ‘special duty’ to children and adolescents, conspiracy, concert of action, unjust enrichment, market share liability and violations of various trade practices and competition statutes. Pursuant to the terms of the 1999 sale of RJRT’s international tobacco business, and subject to a reservation of rights, JTI has assumed the defence of the RJR Companies in these seven actions (Semple, Kunka, Adams, Dorion, Bourassa, McDermid and Jacklin, discussed below).
77.In June 2009, four smoking and health class actions were filed in Nova Scotia (Semple), Manitoba (Kunka), Saskatchewan (Adams) and Alberta (Dorion) against various Canadian and non-Canadian tobacco-related entities, including the UK Companies, Imperial and the RJR Companies. In Saskatchewan, the Company, Carreras Rothmans Limited and Ryesekks p.l.c. have been released from Adams, and the RJR Companies have brought a motion challenging the jurisdiction of the court. There are service issues in relation to Imperial and the UK Companies in Alberta and in relation to the UK Companies in Manitoba. The plaintiffs did not serve their certification motion materials and no dates for certification motions were set.
78.In June 2010, two further smoking and health class actions were filed in British Columbia (Bourassa and McDermid) against various Canadian and non-Canadian tobacco-related entities, including Imperial, the UK Companies and the RJR Companies. The UK Companies, Imperial, the RJR Companies and other defendants objected to jurisdiction. Subsequently, the Company, Carreras Rothmans Limited and Ryesekks p.l.c. were released from the actions. Imperial, Industries, Investments and the RJR Companies remain as defendants in both actions. The plaintiffs did not serve their certification motion materials and no dates for certification motions were set.
79.In June 2012, a smoking and health class action was filed in Ontario (Jacklin) against various Canadian and non-Canadian tobacco-related entities, including the UK Companies, Imperial and the RJR Companies. The claim has been in abeyance.
Venezuela
80.In April 2008, the Venezuelan Federation of Associations of Users and Consumers (FEVACU) and Wolfang Cardozo Espinel and Giorgio Di Muro Di Nunno, acting as individuals, filed a class action against the Venezuelan government. The class action seeks regulatory controls on tobacco and recovery of medical expenses for future expenses of treating smoking-related illnesses in Venezuela. Both C.A Cigarrera Bigott Sucs. (Cigarrera Bigott), a Group subsidiary, and ASUELECTRIC, represented by its president Giorgio Di Muro Di Nunno (who had previously filed as an individual), have been admitted as third parties by the Constitutional Chamber of the Supreme Court of Justice. A hearing date for the action is yet to be scheduled. On 25 April 2017 and on 23 January 2018, Cigarrera Bigott requested the court to declare the lapsing of the class action due to no proceedings taking place in the case in over a year. A ruling on the matter is yet to be issued.
(c) Individual Tobacco-Related Personal Injury Claims
81.As at 31 December 2022, the jurisdictions with the most active individual cases against Group companies were, in descending order: Brazil (17), Chile (11), Italy (9), Canada (5), Argentina (5) and Ireland (2). There were a further two jurisdictions with one active case only. Out of these 51 active individual cases, as at 31 December 2022 there were two cases in Argentina that have resulted in pending unfavourable judgments. In one case, damages were awarded totalling ARS 685,976 (approximately £3,200) in compensatory damages and ARS 2,500,000 (approximately £11,700) in punitive damages, with post-judgment interest totalling approximately ARS 5,288,000 (approximately £25,000), while in the other case, compensatory damages were awarded totalling ARS 2,850,000 (approximately £13,400 ), with post-judgment interest totalling approximately ARS 92,638,000 (approximately £435,000). Both judgments are currently on appeal.
Non-Tobacco-Related Litigation
Vuse Litigation
82.On 22 July 2020, Nicholas Bernston filed a personal injury action in the Northern District of Oklahoma against JUUL Labs Inc. (JUUL), Altria Client Services, LLC, RJR Vapor, Reynolds American, and others. The complaint seeks damages for personal injuries (including pneumonia and acute respiratory failure) allegedly resulting from vaping on several theories, including strict liability, negligence, and breach of implied warranty of merchantability. On 5 August 2020, the Judicial Panel on Multidistrict Litigation entered a conditional transfer order transferring the case to the Northern District of California where this case now is a member case in the JUUL multidistrict litigation (MDL). On 13 October 2020, RJR Vapor and Reynolds American moved to dismiss the complaint or, in the alternative, for a stay or a suggestion of remand to the Northern District of Oklahoma. On 16 October 2020, the MDL court issued an order staying those motions to dismiss. The case will remain pending against Reynolds American and RJR Vapor, but they will not be subject to discovery or other pretrial obligations absent further order from the court.
83.On 11 January 2023, Camellia Chastain filed a putative class action complaint in the Middle District of Florida against RJRV. The complaint seeks damages arising from alleged discoloration and/or a burnt taste in Vuse Alto Golden Tobacco pods based on several theories, including state consumer protection statutes, false and misleading advertising, breach of warranty, negligent misrepresentation, fraud, and unjust enrichment. The complaint seeks to certify two classes, including a Florida class and a multi-state class from the states of North Carolina, South Carolina, Georgia, Alabama, and Mississippi. RJRV has not yet responded to the complaint.
| | | | | | | | | | | | | | | | | | | | | | | |
| BAT Annual Report and Form 20-F 2022 | Strategic Report | | Governance Report | | Financial Statements | | Other Information |
| | | | | | | |
| | | | | | | |
| | | | | | | |
| | | | | | | |
|
Croatian Distributor Dispute
84.BAT Hrvatska d.o.o u likvidaciji and British American Tobacco Investments (Central and Eastern Europe) Limited are named as defendants in a claim by Mr Perica received on 22 August 2017 and brought before the commercial court of Zagreb, Croatia. Mr Perica seeks damages of HRK 408,000,000 (approximately £48 million) relating to a BAT Standard Distribution Agreement dating from 2005. BAT Hrvatska d.o.o and British American Tobacco Investments (Central and Eastern Europe) Ltd filed a reply to the statement of claim on 6 October 2017. A hearing had been scheduled to take place on 10 May 2018, but it was postponed due to a change of the judge hearing the case. The Commercial Court in Zagreb declared they do not have jurisdiction and that the competent court to hear this case is the Municipal Court in Zagreb. TDR d.o.o. is also named as the defendant in a claim by Mr Perica received on 30 April 2018 and brought before the commercial court of Zagreb, Croatia. Mr. Perica seeks payment in the amount of HRK 408,000,000 (approximately £48 million) claiming that BAT Hrvatska d.o.o. transferred a business unit to TDR d.o.o, thus giving rise to a liability of TDR d.o.o. for the debts incurred by BAT Hrvatska d.o.o, on the basis of the provisions of Croatian civil obligations law. A response to the statement of claim was filed on 30 May 2018. The Commercial Court in Zagreb declared they do not have jurisdiction and that the competent court to hear this case is the Municipal Court in Pula. Mr Perica filed an appeal against this decision which was rejected by the High Commercial Court of The Republic of Croatia confirming therewith that the competent court to hear this case is the Municipal Court in Pula. The Municipal Court in Zagreb has decided that the claims by Mr Perica initiated on 22 August 2017 and 30 April 2018 shall be heard as one case in front of the Municipal Court of Zagreb. After the two hearings have been held, the Municipal Court of Zagreb has appointed the court financial and auditing appraisal to determine the value of Mr Perica’s claim.
Patents and Trademark Litigation
85.Certain Group companies are party to a number of patent litigation cases and procedural challenges concerning the validity of patents owned by or licensed to them and/or the alleged infringement of third-parties’ patents.
86.On 22 June 2018, an affiliate of Philip Morris International (PMI) commenced proceedings against British American Tobacco Japan, Ltd. (BAT Japan) in the Japanese courts challenging the import, export, sale and offer of sale of the glo device and of the NeoStiks consumable in Japan at the time the claim was brought (and earlier models of the glo device), alleging that the glo devices directly infringe certain claims of two Japanese patents that have been issued to the PMI affiliate and that the NeoStiks indirectly infringe certain claims of those patents. On 17 January 2019, the PMI affiliate introduced new grounds of infringement, alleging that the glo device also infringes some other claims in the two PMI affiliate’s Japanese patents. Damages for the glo device and NeoStik are claimed in the court filing, to the amount of 100 million Yen (approximately £630,054). The PMI affiliate has also filed a request for injunction with respect to the glo device. BAT Japan denies infringement and is challenging the validity of the two PMI affiliate’s Japanese patents. On 30 November 2022, the Tokyo District Court dismissed both of the above claims of the PMI affiliate on the grounds that both of the above two PMI affiliate's Japanese patents lack inventive step and would be invalidated by a patent invalidation trial. The PMI affiliate has appealed against this judgment.
87.On 9 April 2020, Nicoventures Trading Limited (Nicoventures) commenced an action in the England and Wales High Court (Patents Court) against Philip Morris Products S.A. (PMP) for revocation against three divisional patents in the same family, of which PMP is the proprietor (a further divisional patent in the same family was added into the revocation action on 9 July 2020). On 12 May 2020 PMP filed its defence together with a counterclaim for patent infringement against Nicoventures and Investments concerning prototype examples or production samples of certain ‘glo’ tobacco heating devices. PMP are seeking an injunction and damages on commercial sales (and interest thereon). On 14 July 2021 the England and Wales High Court (Patents Court) handed down its judgment finding that the four divisional patents belonging to PMP were invalid and consequently, that PMP’s counterclaim for patent infringement against Nicoventures and Investments failed. PMP's appeal was heard in November 2022 and dismissed in December 2022.
88.On 11 February 2022, Nicoventures commenced an action in the England and Wales High Court (Patents Court) against PMP for revocation against one of PMP’s patents (a further divisional patent in the same family was added into the revocation action on 27 May 2022). On 22 August 2022, PMP counterclaimed for patent infringement against Nicoventures and Investments concerning certain ‘glo’ tobacco heating devices that comprise two inductive heating coils and their corresponding consumables. PMP are seeking an injunction and damages (plus interest thereon). The trial will be heard in March 2023.
89.On 28 May 2020, Altria Client Services LLC and U.S. Smokeless Tobacco Company LLC commenced proceedings against RJR Vapor before the U.S. District Court for the Middle District of North Carolina against the vapour products Vuse Vibe and Vuse Alto, and the tin used in the modern oral product Velo. Nine patents in total were asserted: two against Vibe, four against Alto and three against Velo. On 5 January 2021, Altria filed an Amended Complaint adding Modoral Brands Inc. as a defendant with respect to the Velo product claims. The plaintiffs have sought damages but have not to date sought preliminary or permanent injunctions. A claim construction hearing was held on 28 April 2021, and the court issued its claim construction ruling on 12 May 2021. All asserted patent claims against Vibe and Velo as well as one of the four patents asserted against Alto were dropped prior to trial, leaving three patents asserted against Alto for trial. Trial was held from 29 August 2022 to 7 September 2022. The jury found infringement by all accused products and awarded approximately US$95 million (approximately £79 million) in damages. On 12 January 2023, the court denied all parties' post-trial motions. The court issued an order on Altria's motion for ongoing royalty on 27 January 2023, denying Altria's request to double the jury's awarded royalty rate for post-trial sales and setting the royalty rate applicable to post-trial sales to the jury's awarded rate of 5.25%. Altria did not request entry of an injunction and has stipulated it will not enforce the monetary judgment until appeals are exhausted.
| | | | | | | | | | | | | | | | | | | | | | | |
| BAT Annual Report and Form 20-F 2022 | Strategic Report | | Governance Report | | Financial Statements | | Other Information |
| | | | | | | |
| | | | | | | |
| | | | | | | |
| Financial Statements | | | | | | | |
Notes on Accounts Continued |
90.On 9 April 2020, RAI Strategic Holdings, Inc. and RJR Vapor commenced an action in the U.S. District Court for the Eastern District of Virginia against Altria Client Services LLC, Philip Morris USA, Inc., Altria Group, Inc., Philip Morris International, Inc., and Philip Morris Products S.A. (collectively, Philip Morris) for infringement of six patents based on the importation and commercialization within the United States of IQOS. On 8 May 2020 and 12 June 2020, Philip Morris filed Inter Partes Review (IPR) petitions in the U.S. Patent Office challenging the validity of each of the six patents asserted. On 29 June 2020, Philip Morris asserted counterclaims alleging that RJR Vapor infringes five patents. On 24 November 2020, the court issued a claim construction order that determined that each disputed term would have its plain and ordinary meaning. On 4 December 2020, the magistrate judge issued an order staying RJR Vapor and Philip Morris’s patent claims pending a decision by the U.S. Patent Office regarding whether to proceed with the IPRs. Trial on the Altria and Philip Morris patents began on 8 June 2022. Shortly before trial, Philip Morris dropped its claims to one patent and the Altria entities dismissed their claims relating to two patents, which left two Philip Morris patents at issue in the trial. On 15 June 2022, the jury found that RJR Vapor's Alto product infringed two claims in one patent and that its Solo product infringed three claims of the other patent. The jury awarded damages of US$10,759,755 (approximately £8,944,846), which was supplemented by the Court to a total of US$14,062,742 (approximately £11,690,699) to account for additional sales of Solo and Alto through the date of judgment and interest. Philip Morris has requested entry of a permanent injunction barring sale of the Alto and Solo products and a hearing was held on 4 November 2022. A decision on Philip Morris's request for permanent injunction is expected imminently. RJR Vapor intends to appeal the jury verdict after the Court has issued its decision on Philip Morris's request for an injunction. The RJR Vapor offensive patent case remains stayed pending (i) an appeal by Philip Morris to the Federal Circuit in relation an exclusion order granted against Philip Morris by the International Trade Commission based on the relevant patents, and (ii) the decisions in IPRs commenced by Philip Morris against the relevant patents at the U.S. Patent Office.
91.On 27 November 2020 Philip Morris filed a complaint before the Regional Court Mannheim in Germany against British American Tobacco (Germany) GmbH (BAT Germany) alleging that the sale, offer for sale and importation of Vype ePod products infringes a patent. Philip Morris is seeking an injunction, a recall of product from commercial customers and a declaratory judgment for damages. The trials of this action took place on 15 June 2021 and 9 November 2021. A decision on the matter was promulgated on 30 November 2021. The decision dismissed the complaint in its entirety. On 28 December 2021, Philip Morris lodged an appeal against this decision before the Higher Regional Court Karlsruhe. A date has not yet been set for the appeal hearing.
92.On 11 December 2020 Philip Morris filed a complaint before the Regional Court Dusseldorf in Germany against BAT Germany alleging that the sale, offer for sale and importation of the glo TABAK HEATER and neo STICK products infringe a patent. Philip Morris is seeking an injunction, a recall of product from commercial customers and a declaratory judgment for damages. The trial of this action took place on 30 November 2021. The court promulgated its decision on 21 December 2021 and decided that the above-mentioned products infringe the patent. The decision was appealed by BAT Germany on 21 December 2021 to the Higher Regional Court Dusseldorf. The oral hearing of these appeal proceedings took place on 24 November 2022. On 15 December 2022, the Higher Regional Court Dusseldorf reversed the trial court decision and dismissed Philip Morris’s complaint in its entirety. In addition, the Higher Regional Court Dusseldorf did not grant a further appeal to the German Supreme Court (Bundesgerichtshof (BGH)). PMI filed a motion for leave of appeal with the BGH, which is why the decision of the Higher Regional Court Dusseldorf is not yet final.
93.On 14 December 2020, Modoral Brands Inc. (Modoral) filed a complaint in the U.S. District Court for the District of Delaware against Pinkerton Tobacco Co., LP, Swedish Match North America LLC, and NYZ AB (collectively Swedish Match) seeking a declaratory judgment that the importation, manufacture, use, and/or sale of certain Modoral Velo products that Modoral acquired from Dryft Sciences does not infringe a Swedish Match patent or its trade secrets. On 3 June 2021, the case was transferred to the U.S. District Court for the Central District of California. On 13 July 2021, Swedish Match and Helix Innovations GmbH filed counterclaims against Modoral for infringement of the patent and misappropriation of trade secrets arising out of the manufacture, use, and sale of Modoral’s Velo product. On 15 December 2021, the court entered a Markman Order finding that the patent distinguishes a nicotine complex from the claimed ‘nicotine salt,’ and more specifically, affirmatively excluding the nicotine polacrilex complex used in the accused Velo product from the claimed invention because it is 'not a nicotine salt'. Swedish Match agreed to a joint stipulation and request for entry of judgment of non-infringement for all of the asserted claims of the '908 patent, which the Court granted on 19 January 2022. Trial on Swedish Match’s trade secret misappropriation claims is scheduled to begin on 13 February 2023.
| | | | | | | | | | | | | | | | | | | | | | | |
| BAT Annual Report and Form 20-F 2022 | Strategic Report | | Governance Report | | Financial Statements | | Other Information |
| | | | | | | |
| | | | | | | |
| | | | | | | |
| | | | | | | |
|
Mozambican IP Litigation
94.On 19 April 2017, Sociedade Agrícola de Tabacos, Limitada (SAT) (a BAT Group company in Mozambique) filed a complaint to the National Inspectorate for Economic Activities (INAE), the government body under the Ministry of Industry and Trade, regarding alleged infringements of its registered trademark (GT) by GS Tobacco SA (GST). INAE subsequently seized the allegedly infringing products (GS cigarettes) and fined and ordered GST to discontinue manufacturing products that could infringe SAT’s intellectual property rights. Following INAE’s decision, in July 2017 and March 2018, SAT sought damages via the Judicial Court of Nampula, from GST in the amount of MZN 46,811,700 (approximately £607,156) as well as a permanent restraint order in connection with the manufacturing and selling of the allegedly infringing products. The Judicial Court of Nampula (Tribunal Judicial de Nampula) granted the order on an interim basis on 7 August 2017. After hearing the parties, on 5 September 2017, the court found that no alleged infringement by GST had occurred and removed the interim restraint order, this decision was appealed by SAT and is currently pending a decision. GST filed an application for review against INAE’s initial decision directly to the Minister of Trade and Industry, which reversed the decision of INAE. On 31 December 2018, SAT was notified of GST’s counterclaim against SAT at the Judicial Court of Nampula for damages allegedly sustained as a result of SAT’s complaint to INAE (and INAE’s decision). GST is seeking damages in the amount of approximately MZN 14.5 billion (approximately £188.2 million). On 31 January 2019 SAT filed a formal response to the counterclaim. GST was notified on 28 February 2019 to file a response to SAT's formal response to the counterclaim and the judge scheduled the preliminary hearing for 14 March 2019. This hearing was adjourned and was held on 2 April 2019, when the court heard arguments on the validity of GST’s counterclaim. On 2 September 2019, SAT received notification of an order which provided that (i) SAT’s claim had been dismissed by the court; and (ii) the GST counterclaim would proceed to trial. On 9 September 2019 SAT responded to the order by appealing the dismissal of the SAT claim. Additionally, SAT made an interlocutory application in the counterclaim proceedings to challenge certain questions posed by the judge, on the basis that the responses may be used as evidence at trial. SAT was notified in December 2021 that the trial of the counterclaim was to take place on 24 February 2022. SAT subsequently submitted a complaint related to that trial to the court, on the basis that prior to any further step being taken in relation to the trial the process should be submitted to the superior court for analysis, as per the appeals previously submitted in the proceedings. SAT’s complaint has been appreciated favorably and the process will be remitted to the superior court. Trial has not taken place.
Malawi Group Action
95.In December 2020, the Company and British American Tobacco (GLP) Limited (GLP) were named as defendants in a claim made in the English High Court by around 7,500 Malawian tobacco farmers and their family members. The claim also names Imperial Brands plc and five affiliates as defendants. The claimants allege they were subjected to unlawful and exploitative working conditions on tobacco farms from which it is alleged that the defendants indirectly acquire tobacco. They seek unquantified damages (including aggravated and exemplary damages) for the torts of negligence and conversion and unquantified personal and proprietary remedies for restitution of unjust enrichment. They also seek an injunction to restrain the commission of further torts of conversion or negligence by the defendants. The defendants had an application to strike out the claims dismissed in a judgment dated 25 June 2021. In January 2022, the Company and GLP were served with a similar claim by around a further 3,500 claimants. The Company and GLP intend vigorously to defend the claims.
Qatar Customs Authority Claims
96.On 12 November 2020, British American Tobacco Middle East W.L.L (formerly British American Tobacco Middle East SPC) (BAT ME), along with its distributor in Qatar, Ali Bin Ali Establishment (ABA), filed a case before the Qatar Court of First Instance which challenged a decision of Qatar's General Authority of Customs dated 16 August 2020 ordering ABA to pay two amounts arising from unrelated circumstances, one of which totalled QAR 160,531,588 (approximately £36.6 million) in customs duties and penalties in relation to 27 consignments of cigarettes imported into Qatar by ABA. On January 7, 2021, BAT arranged for a bank guarantee covering the QAR 160,531,588 claimed by the General Authority of Customs to be issued to the General Authority of Customs. That bank guarantee was subsequently liquidated by the General Authority of Customs. On 14 February 2021, the General Authority of Customs issued a new order that repeated (and addressed only) its demand that ABA pay QAR 160,531,588 in customs duties and penalties in relation to the same 27 consignments of cigarettes imported into Qatar by ABA. On 19 May 2021, BAT ME and ABA filed a second case before the Qatar Court of First Instance which challenges the decision of Qatar’s General Authority of Customs dated 14 February 2021. On 28 October 2021, the Court of First Instance dismissed both cases filed by BAT ME and ABA on the grounds the cases were not timely filed. In December 2021, BAT ME and ABA appealed to the Court of Appeal the decisions of the Court of First Instance in both cases. ABA can only have liability under one case not both, so its maximum liability is QAR 160,531,588, not twice that amount. BAT ME and ABA strongly asserted that the additional customs duty and penalties imposed by the Qatar Customs Authority are inconsistent with applicable law. Nonetheless, BAT ME and ABA decided not to continue contesting the orders of the General Authority of Customs for ABA to pay QAR 160,531,588. Accordingly, BAT ME and ABA submitted requests to the Court of Appeal in both cases to withdraw their appeals. On 6 April 2022, the Court of Appeal ordered the withdrawal of the appeals irrevocably ending the two cases. As a result, the General Authority of Customs will keep the QAR 160,531,588 proceeds of the liquidated bank guarantee. BAT ME has no further potential liability in respect of the two cases.
Saudi Arabia Customs Claim
97.On 25 January 2021, Walid Ahmed Mohammed Al Naghi for Trading Establishment (Al Naghi), a former distributor for the Group’s operating companies in the Middle East, filed a claim in the Commercial Court in Jeddah, Saudi Arabia, seeking SAR 2,105,356,121 (approximately £466 million) for reimbursement of funds allegedly due under contract. Al Naghi did not formally name any Group entity as a defendant in the claim. The claim was dismissed orally by the Court on 9 February 2021. On 20 April 2021, Al Naghi filed a new claim in the Jeddah Commercial Court against BAT UKE demanding that BAT UKE reimburse Al Naghi in the amount of SAR 2,105,356,121 allegedly paid by Al Naghi to the customs authorities in customs dues. On 16 June 2021, the Court of First Instance issued a judgment dismissing the claim against BAT UKE on the ground that BAT UKE lacks legal standing to be sued. On 22 August 2021, Al Naghi filed an appeal against the Court of First Instance judgment. On 15 November 2021, the Appellate Court remanded the case to the lower Court in order for the lower Court to join BAT entities in Bahrain and UAE, which Al Naghi had wrongly claimed on appeal to be branches of BAT UKE. The lower Court tried to summon the Bahrain and UAE BAT entities to obtain clarifications about their status; however, said entities were not properly notified and did not appear. On 2 August 2022, the Court reversed its decision to seek clarifications from the BAT entities in Bahrain and UAE and dismissed the claim against BAT UKE for lack of legal capacity. On 29 August 2022, Al Naghi filed an appeal against
| | | | | | | | | | | | | | | | | | | | | | | |
| BAT Annual Report and Form 20-F 2022 | Strategic Report | | Governance Report | | Financial Statements | | Other Information |
| | | | | | | |
| | | | | | | |
| | | | | | | |
| Financial Statements | | | | | | | |
Notes on Accounts Continued |
the Court of First Instance judgment. On 5 December 2022, the Court of Appeal issued a judgment affirming the preliminary court's ruling dismissing Al Naghi's claim against BAT UKE. On 27 December 2022, Al Naghi filed an appeal before the Supreme Court and the appeal is still pending.
Asbestos Litigation
98.On 17 October 2022, plaintiffs in an asbestos personal injury action (Barbara Lowis and Trevor Lowis) filed a complaint in the Supreme Court of the State of New York (New York County), which names as a defendant BATUS Holdings Inc., along with various other defendants. The complaint was served on BATUS Holdings Inc. on 24 October 2022. The complaint alleges that plaintiff Barbara Lowis was exposed to the defendants’ asbestos and asbestos-containing talcum powder and cosmetics products, which allegedly caused her to develop mesothelioma, and asserts claims under state law, including for negligence, breach of warranty, strict liability, conspiracy, and fraud. Plaintiffs seek unspecified compensatory and punitive damages. BATUS Holdings Inc. filed a motion to dismiss BATUS Holdings Inc. for lack of personal jurisdiction on 18 November 2022. On 28 November 2022, plaintiffs filed an opposition to the motion and requested jurisdictional discovery. On 2 December 2022, BATUS Holdings Inc. filed a reply submission in further support of the motion, which remains pending.
99.On 13 December 2022, plaintiffs in an asbestos personal injury action (Michele Stuck and Jack Bannister, individually and as executors of the estate of Penelope Rigby) filed an amended complaint in the Supreme Court of the State of New York (New York County), which names as a defendant BATUS Holdings Inc., along with various other defendants. The complaint was served on BATUS Holdings Inc. on 28 December 2022. The complaint alleges that the decedent was exposed to the defendants’ asbestos and asbestos-containing talcum powder and cosmetics products, which allegedly caused her to develop mesothelioma, and asserts claims by the executors of her estate under state law, including for negligence, breach of warranty, strict liability, conspiracy, fraud, and wrongful death. Plaintiffs seek unspecified compensatory and punitive damages. BATUS Holdings Inc. filed a motion to dismiss BATUS Holdings Inc. for lack of personal jurisdiction on 27 January 2023.
100.On 22 December 2022, plaintiffs in an asbestos personal injury action (Marion Mannooch and Harvey Mannooch) filed a complaint in the Supreme Court of the State of New York (New York County), which names as a defendant BATUS Holdings Inc., along with various other defendants. The complaint was served on BATUS Holdings Inc. on 28 December 2022. The complaint alleges that plaintiff Marion Mannooch was exposed to the defendants’ asbestos and asbestos-containing talcum powder and cosmetics products, which allegedly caused her to develop mesothelioma, and asserts claims under state law, including for negligence, breach of warranty, strict liability, conspiracy, and fraud. Plaintiffs seek unspecified compensatory and punitive damages. BATUS Holdings Inc. filed a motion to dismiss BATUS Holdings Inc. for lack of personal jurisdiction on 27 January 2023.
101.A further three asbestos personal injury actions (Carlson, Alloway and Wolfe) naming as a defendant BATUS Holdings Inc., along with various other defendants, and alleging the respective plaintiffs sustained personal injury from exposure to the defendants’ asbestos and asbestos-containing talcum powder and cosmetics products, were filed in Washington state court (Carlson) and California state court (Alloway and Wolfe) on 4 March 2022, 25 April 2022, and 10 November 2022, respectively. Plaintiffs in these cases sought unspecified compensatory and punitive damages. BATUS Holdings Inc. filed motions to dismiss the respective complaints for lack of personal jurisdiction. The cases were subsequently voluntarily dismissed without prejudice as to BATUS Holdings Inc. by orders entered on 1 July 2022 (Carlson), 29 September 2022 (Alloway), and 17 January 2023 (Wolfe).
Cigarette Filter Litter Litigation
102.On 21 November 2022, the Mayor and City Council of Baltimore, Maryland, filed a lawsuit in the Circuit Court for Baltimore City naming the Company and RJRT, as well as Philip Morris USA, Inc., Altria Group, Liggett Group LLC and a Maryland-based distributor, as defendants. RJRT was served on 13 December 2022, and the Company received the complaint on 18 January 2023. Plaintiff, a municipality, alleges that the defendants manufactured, distributed and sold non-biodegradable cigarette filters with knowledge that consumers would discard used filters on public property owned by the plaintiff, and further alleges that the defendants failed to warn consumers of the alleged environmental impacts of littered filters. Plaintiff asserts causes of action for alleged violation of state and municipal civil and criminal anti-littering and dumping laws, trespass, strict liability and negligent design defect, public nuisance, and strict liability and negligent failure to warn. Plaintiff seeks, among other relief, unspecified damages (including punitive damages) for costs allegedly incurred removing discarded cigarette filters from public property, and for alleged damage to land and natural resources and property value diminution, along with fines under state and municipal laws.
Fox River
Background to environmental liabilities arising out of contamination of the Fox River:
103.U.S. authorities identified potentially responsible parties (PRPs), including NCR Corporation (NCR), to fund the clean-up of polluted sediments in the Lower Fox River, Wisconsin. Discharges of Polychlorinated Biphenyls (PCBs) from paper mills and other facilities operating close to the river caused that pollution. Industries’ involvement with the environmental liabilities arises out of (i) indemnity arrangements which it became party to due to various transactions that took place from the late-1970s onwards and (ii) subsequent litigation brought by NCR against Industries and Appvion Inc. (Appvion) (a former Group subsidiary) in relation to those arrangements.
104.Following substantial litigation in the United States regarding the responsibility for the costs of the clean-up operations, and enforcement proceedings brought by the U.S. Government against NCR and Appvion to ensure compliance with regulatory orders made relating to the Fox River clean-up, the District Court of Wisconsin approved (on 23 August 2017) a form of settlement with the U.S. Government known as a Consent Decree.
| | | | | | | | | | | | | | | | | | | | | | | |
| BAT Annual Report and Form 20-F 2022 | Strategic Report | | Governance Report | | Financial Statements | | Other Information |
| | | | | | | |
| | | | | | | |
| | | | | | | |
| | | | | | | |
|
105.The principal terms of that Consent Decree, in summary, are:
a) NCR is obliged to perform and fund all of the remaining Fox River remediation work by itself.
b) The U.S. Government enforcement proceedings were settled, with NCR having no liability to meet the U.S. Government’s claim for costs it had incurred in relation to the clean-up to date, a secondary responsibility to meet certain future costs, and no liability to the U.S. Government for natural resource damages (NRDs).
c) NCR ceased to pursue its contribution claims against the other PRPs and in return received contribution protection preventing other PRPs from pursuing their contribution claims against NCR and existing claims for contribution being dismissed by order of the Court. NCR does, however, have the right to reinstate its contribution claims if the other PRPs decide to continue to pursue certain contractual claims against NCR.
d) Appvion also agreed to cease pursuance of claims against the other PRPs, subject to retention of the right to reinstate its claims if the other PRPs decide to continue to pursue certain claims against Appvion.
106.A cost breakdown filed in support of the motion to approve the Consent Decree estimates the total Fox River clean-up costs (including NRDs) to be US$1,346 million (approximately £1,119 million).
107.A further Consent Decree between the U.S. Government, P.H. Glatfelter Company and Georgia-Pacific Consumer Products LP (Georgia-Pacific), approved by the Wisconsin District Court on 14 March 2019, concluded all remaining litigation relating to the Fox River. In November 2019, an arbitral tribunal awarded approximately US$10 million (approximately £8.3 million) to the remediation contractor engaged by a limited liability company formed by NCR and Appvion to perform the Fox River clean-up operation. NCR has stated (in its 2021 Annual Report on Form 10-K) that its indemnitors and co-obligors were responsible for the majority of the award, with its own share being approximately 25%.
108.On 3 October 2022, the United States Environmental Protection Agency issued a Certificate of Completion in respect of remedial action for the Lower Fox River.
Industries’ involvement with environmental liabilities arising out of the contamination of the Fox River:
109.NCR's position is that, under the terms of a 1998 Settlement Agreement between it, Appvion and Industries, and a 2005 arbitration award, Industries and Appvion had a joint and several obligation to bear 60% of the Fox River environmental remediation costs imposed on NCR and of any amounts NCR has to pay in respect of other PRPs’ contribution claims. BAT has not acknowledged any such liability to NCR and has defences to such claims.
110.Until May 2012, Appvion and Windward Prospects Limited (Windward) (another former Group subsidiary) paid a 60% share of the clean-up costs incurred by NCR. Industries was never required to contribute. Around that time, Appvion refused to continue to pay clean-up costs, NCR therefore demanded that Industries pay a 60% share of those costs. Industries commenced proceedings against Windward and Appvion seeking confirmation of indemnities provided to Industries in respect of any liability it might have to NCR (the English Indemnity Proceedings) pursuant to a 1990 de-merger agreement between those parties.
Funding Agreement of 30 September 2014
111.On 30 September 2014, Industries entered into a Funding Agreement with Windward, Appvion, NCR and BTI 2014 LLC (BTI) (a wholly owned subsidiary of Industries). Pursuant to the Funding Agreement, the English Indemnity Proceedings (and a related counterclaim) and NCR-Appvion arbitration were discontinued as part of an overall agreement providing a framework through which the parties would together fund the ongoing costs of the Fox River clean-up.
112.Under the Funding Agreement, NCR has agreed to accept funding by Industries at the lower level of 50% of the ongoing clean-up related costs of the Fox River (rather than the 60% referenced above). This remains subject to an ability to litigate at a later stage the extent of Industries’ liability (if any) in relation to Fox River clean-up related costs (including in respect of the 50% of costs that Industries has paid under the Funding Agreement to date). Additionally, Windward has contributed US$10 million (approximately £8.3 million) of funding. Appvion has contributed US$25 million (approximately £20.8 million) for Fox River and agreed to contribute US$25 million (approximately £20.8 million) for the Kalamazoo River (see further below). Appvion entered Chapter 11 bankruptcy protection on 1 October 2017.
113.The parties also agreed to cooperate in order to maximise recoveries from certain claims made against third parties, including (i) a claim commenced by Windward in the High Court of England & Wales (the High Court) against Sequana S.A. (Sequana) and the former Windward directors (the Windward Dividend Claim), assigned to BTI under the Funding Agreement, and which relates to dividend payments made by Windward to Sequana of around €443 million (approximately £393 million) in 2008 and €135 million (approximately £119.8 million) in 2009 (the Dividend Payments) and (ii) a claim commenced by Industries directly against Sequana to recover the value of the Dividend Payments alleging that the dividends were paid for the purpose of putting assets beyond the reach of Windward’s creditors (including Industries) (the BAT section 423 Claim) (together, the Sequana Proceedings).
114.The High Court heard the Windward Dividend and BAT section 423 Claims and handed down its judgment on 11 July 2016. The court upheld the BAT section 423 Claim and, by way of a consequentials judgment dated 10 February 2017, ordered that Sequana pay to BTI an amount up to the full value of the 2009 Dividend plus interest, equating to around US$185 million (approximately £153.8 million). The Court dismissed the Windward Dividend Claim.
115.The parties pursued cross appeals on the judgment, during which time Sequana was granted a stay in respect of the above payments. That stay was lifted in May 2017, three months after Sequana had entered into an insolvency process in France seeking court protection. On 15 May 2019, the Nanterre Commercial Court made an order placing Sequana into formal liquidation proceedings. To date, Sequana has made no payments to Industries. On 6 February 2019 the Court of Appeal gave judgment upholding the High Court’s findings, with one immaterial change to the method of calculating the damages awarded. Sequana therefore remains liable to pay approximately US$185 million (approximately £153.8 million). Because of Sequana’s ongoing insolvency process, execution of that judgment is stayed. Sequana is also liable to pay around £10 million in costs to Industries.
| | | | | | | | | | | | | | | | | | | | | | | |
| BAT Annual Report and Form 20-F 2022 | Strategic Report | | Governance Report | | Financial Statements | | Other Information |
| | | | | | | |
| | | | | | | |
| | | | | | | |
| Financial Statements | | | | | | | |
Notes on Accounts Continued |
116.BTI was subsequently granted permission to appeal to the Supreme Court in respect of the Windward Dividend Claims. The hearing of its appeal took place on 4 and 5 May 2021. On 5 October 2022, the Supreme Court handed down its judgment, dismissing BTI's appeal.
117.BTI has brought claims against certain of Windward’s former advisers, including Windward’s auditors at the time of the dividend payments, PricewaterhouseCoopers LLP (PwC) (which claims were also assigned to BTI under the Funding Agreement). The claim had been stayed pending the outcome of the Sequana Proceedings. Once that stay was lifted, PwC unsuccessfully applied to strike-out BTI’s claim. A hearing of this application took place in October 2019. On 15 November 2019, the court dismissed PwC’s application. BTI's claim against PwC is progressing in the High Court and the trial is expected to take place in the summer of 2024. An agreed stay is in place in respect of BTI’s separate assigned claim against Freshfields Bruckhaus Deringer.
118.The sums Industries has paid under the Funding Agreement are subject to the reservation as set out in paragraph 112 above and ongoing adjustment. Clean-up costs can only be estimated in advance of the work being carried out and certain sums payable are the subject of ongoing U.S. litigation. In 2019, Industries paid £32 million in respect of clean-up costs. In 2020, Industries paid £2 million in respect of clean-up costs. In 2021, Industries paid a further £2 million in respect of clean-up costs. In 2022, Industries has paid an additional £1 million in respect of clean-up costs. Industries is potentially liable for further costs associated with the clean-up. Industries has a provision of £54 million which represents the current best estimate of its exposure – see note 24.
Kalamazoo
119.Georgia-Pacific, a designated PRP in respect of the Kalamazoo River in Michigan, also pursued NCR in relation to remediation costs caused by PCBs released into that river. On 26 September 2013, the Michigan Court held that NCR was liable as a PRP on the basis that it had arranged for the disposal of hazardous material for the purposes of the Comprehensive Environmental Response, Compensation and Liability Act (CERCLA).
120.Following further litigation, on 11 December 2019, NCR announced that it had entered into a Consent Decree with the U.S. Government and the State of Michigan (subsequently approved by the Michigan Court on 2 December 2020), pursuant to which it assumed liability for certain remediation work at the Kalamazoo River. The payments to be made on the face of the Consent Decree in respect of such work total approximately US$245 million (approximately £204 million). The Consent Decree also provides for the payment by NCR of an outstanding judgment against it of approximately US$20 million (approximately £16.6 million) to Georgia-Pacific.
121.The quantum of the clean-up costs for the Kalamazoo River is presently unclear. It may well exceed the amounts payable on the face of the Consent Decree.
122.NCR has informed Industries that it will look to Industries to pay 60% of any sums NCR becomes liable to pay under the Consent Decree on the asserted basis that the river constitutes a ‘Future Site’ for the purposes of the Settlement Agreement. The Funding Agreement described above does not resolve any such claims. Industries has defences to any claims made by NCR in relation to the Kalamazoo River. No such claims have yet been pursued against Industries.
123.Industries also anticipates that NCR may seek to recover from Appvion (subject to a cap of US$25 million (approximately £20.8 million)) for ‘Future Sites’ under the Funding Agreement. The basis of the recovery would be the same as any demand NCR may make on Industries. The effect of Appvion's Chapter 11 bankruptcy proceedings on its liability for Future Sites payments under the Funding Agreement is currently uncertain. If NCR is unable to obtain recovery from Appvion then NCR will seek to recover such from Industries.
124.In summary, Industries is taking active steps to protect its interests. These include preparation of all its defences, seeking to procure the repayment of the Windward dividends, pursuing the other valuable claims that are now within its control, and working with the other parties to the Funding Agreement to maximise recoveries from third parties with a view to ensuring that amounts funded towards clean-up related costs are later recouped under the agreed repayment mechanisms under the Funding Agreement.
Other environmental matters
125.Reynolds American and its subsidiaries are subject to federal, state and local environmental laws and regulations concerning the discharge, storage, handling and disposal of hazardous or toxic substances. Such laws and regulations provide for significant fines, penalties and liabilities, sometimes without regard to whether the owner or operator of the property or facility knew of, or was responsible for, the release or presence of hazardous or toxic substances. In addition, third parties may make claims against owners or operators of properties for personal injuries and property damage associated with releases of hazardous or toxic substances. In the past, RJRT has been named a PRP with third parties under CERCLA with respect to several superfund sites. Reynolds American and its subsidiaries are not aware of any current environmental matters that are expected to have a material adverse effect on the business, results of operations or financial position of Reynolds American or its subsidiaries.
| | | | | | | | | | | | | | | | | | | | | | | |
| BAT Annual Report and Form 20-F 2022 | Strategic Report | | Governance Report | | Financial Statements | | Other Information |
| | | | | | | |
| | | | | | | |
| | | | | | | |
| | | | | | | |
|
126.From time to time, the Group investigates, and becomes aware of governmental authorities’ investigations into, allegations of misconduct, including alleged breaches of sanctions and allegations of corruption against Group companies. The Group cooperates with the authorities’ investigations, where appropriate. For instance, the Group is currently engaged in discussions with the DOJ and the United States Department of the Treasury’s Office of Foreign Assets Control (OFAC) regarding their investigations into suspicions of sanctions breaches to find a resolution through settlement. Based on those discussions, the Group expects any such settlements will include civil and/or criminal fines and penalties, and may also include non-monetary remedies, such as compliance requirements. Although the Group is discussing resolution of these government investigations through settlement, there can be no assurance that these discussions will be successful or, if they are, what the timing or terms of any such settlements would be. The Company has recognised a provision of £450 million (approximately US$541 million) in the first half of 2022. However, it cannot be excluded that the amount of any potential settlement with the DOJ and OFAC may vary from this amount. Separately, British American Tobacco Italia SpA has been charged with administrative offences in Florence, Italy in a case against a large number of individual and corporate defendants. This relates to potential allegations of failure to supervise or take appropriate steps to prevent alleged corruption by two (now former) employees. Any financial penalty is not thought likely to be material.
Closed litigation matters
127.The following matters on which the Company reported in the contingent liabilities and financial commitments note 31 to the Company’s 2021 financial statements have been dismissed, concluded or resolved as noted below:
| | | | | | | | | | | | | | |
| Matter | Jurisdiction | Companies named as Defendants | Description | Disposition |
| Minnesota State Settlement Agreement | U.S. | RJRT | State Settlement Agreements - Enforcement and Validity | Settled |
| Texas State Settlement Agreement | U.S. | RJRT | State Settlement Agreements - Enforcement and Validity | Settled |
| Fuma International LLC patent litigation | U.S. | RJR Vapor | Vuse patent infringement claims | Resolved |
| Reynolds American dissenters' litigation | U.S. | Reynolds American Inc. | Shareholder Litigation | Final judgment of North Carolina Supreme Court (upholding Reynolds American's proposed valuation) |
| Rentko / Smoltino asbestos litigation | U.S. | Reynolds American, RJRT, the Company, BATUS Holdings, Inc., and British American Tobacco (Brands) Inc. | Personal Injury | Voluntary dismissal by plaintiffs |
| Gilbride asbestos litigation | U.S. | RJRT | Personal Injury | Voluntary dismissal by plaintiffs |
| Argentina Tort Law Association medical reimbursement matter | Argentina | Nobleza | Medical reimbursement | Court judgment of dismissal |
| | | | |
General Litigation Conclusion
128.While it is impossible to be certain of the outcome of any particular case or of the amount of any possible adverse verdict, the Group believes that the defences of the Group’s companies to all these various claims are meritorious on both the law and the facts, and a vigorous defence is being made everywhere.
129.As indicated above, on 1 March 2019 the Quebec Court of Appeal released its appeal judgment. The trial judgment was largely upheld by a unanimous decision of the five-member panel including the requirement that the defendants deposit the initial deposits in their solicitors’ trust accounts within 60 days. This is the only executory aspect of the judgment. In these circumstances we are of the view that it is more likely than not that there will be an outlay and it is reasonably estimable at CAD$758 million (approximately £465 million), the amount of the initial deposit paid into court. If further adverse judgments are entered against any of the Group’s companies in any case, avenues of appeal will be pursued. Such appeals could require the appellants to post appeal bonds or substitute security (as has been necessary in Quebec) in amounts which could in some cases equal or exceed the amount of the judgment. At least in the aggregate, and despite the quality of defences available to the Group, it is not impossible that the Group’s results of operations or cash flows in any particular period could be materially adversely affected by the impact of a significant increase in litigation, difficulties in obtaining the bonding required to stay execution of judgments on appeal, or any final outcome of any particular litigation.
| | | | | | | | | | | | | | | | | | | | | | | |
| BAT Annual Report and Form 20-F 2022 | Strategic Report | | Governance Report | | Financial Statements | | Other Information |
| | | | | | | |
| | | | | | | |
| | | | | | | |
| Financial Statements | | | | | | | |
Notes on Accounts Continued |
130.Having regard to all these matters, with the exception of the Quebec Class Actions, Fox River, and the DOJ and OFAC investigations, the Group does not consider it appropriate to make any provision in respect of any pending litigation because the likelihood of any resulting material loss, on an individual case basis, is not considered probable and/or the amount of any such loss cannot be reasonably estimated. Notwithstanding the negative decision in the Quebec Class Actions, the Group does not believe that the ultimate outcome of this litigation will significantly impair the Group’s financial condition. If the facts and circumstances change and result in further unfavourable outcomes in the pending litigation, then there could be a material impact on the financial statements of the Group. In addition, the Group accrues for damages, attorneys' fees and/or statutory interest, including in respect of certain Engle Progeny cases, certain U.S. individual smoking and health cases, the DOJ medical reimbursement/corrective statement case and the Nigeria competition investigation.
Other contingencies
131.JTI Indemnities. By a purchase agreement dated 9 March 1999, amended and restated as at 11 May 1999, referred to as the 1999 Purchase Agreement, R.J. Reynolds Tobacco Holdings, Inc. (RJR) and RJRT sold their international tobacco business to JTI. Under the 1999 Purchase Agreement, RJR and RJRT retained certain liabilities relating to the international tobacco business sold to JTI, and agreed to indemnify JTI against: (i) any liabilities, costs and expenses arising out of the imposition or assessment of any tax with respect to the international tobacco business arising prior to the sale, other than as reflected on the closing balance sheet; (ii) any liabilities, costs and expenses that JTI or any of its affiliates, including the acquired entities, may incur after the sale with respect to any of RJR’s or RJRT’s employee benefit and welfare plans; and (iii) any liabilities, costs and expenses incurred by JTI or any of its affiliates arising out of certain activities of Northern Brands.
132.RJRT has received claims for indemnification from JTI, and several of these have been resolved. Although RJR and RJRT recognise that, under certain circumstances, they may have other unresolved indemnification obligations to JTI under the 1999 Purchase Agreement, RJR and RJRT disagree what circumstances described in such claims give rise to any indemnification obligations by RJR and RJRT and the nature and extent of any such obligation. RJR and RJRT have conveyed their position to JTI, and the parties have agreed to resolve their differences at a later date.
133.ITG Indemnity. In the Divestiture, Reynolds American agreed to defend and indemnify, subject to certain conditions and limitations, ITG in connection with claims relating to the purchase or use of one or more of the Winston, Kool, Salem or Maverick cigarette brands on or before 12 June 2015, as well as in actions filed before 13 June 2023, relating to the purchase or use of one or more of the Winston, Kool, Salem or Maverick cigarette brands. In the purchase agreement relating to the Divestiture, ITG agreed to defend and indemnify, subject to certain conditions and limitations, Reynolds American and its affiliates in connection with claims relating to the purchase or use of ‘blu’ brand e-cigarettes. ITG also agreed to defend and indemnify, subject to certain conditions and limitations, Reynolds American and its affiliates in actions filed after 12 June 2023, relating to the purchase or use of one or more of the Winston, Kool, Salem or Maverick cigarette brands after 12 June 2015. ITG has tendered a number of actions to Reynolds American under the terms of this indemnity, and Reynolds American has, subject to a reservation of rights, agreed to defend and indemnify ITG pursuant to the terms of the indemnity. Reynolds American has tendered an action to ITG under the terms of this indemnity, and ITG has, subject to a reservation of rights, agreed to defend and indemnify
Reynolds American and its affiliates pursuant to the terms of the indemnity. These claims are substantially similar in nature and extent to claims asserted directly against RJRT in similar actions.
134.Loews Indemnity. In 2008, Loews Corporation (Loews), entered into an agreement with Lorillard Inc., Lorillard Tobacco, and certain of their affiliates, which agreement is referred to as the ‘Separation Agreement’. In the Separation Agreement, Lorillard agreed to indemnify Loews and its officers, directors, employees and agents against all costs and expenses arising out of third-party claims (including, without limitation, attorneys’ fees, interest, penalties and costs of investigation or preparation of defence), judgments, fines, losses, claims, damages, liabilities, taxes, demands, assessments, and amounts paid in settlement based on, arising out of or resulting from, among other things, Loews’ ownership of or the operation of Lorillard and its assets and properties, and its operation or conduct of its businesses at any time prior to or following the separation of Lorillard and Loews (including with respect to any product liability claims). Loews is a defendant in three pending product liability actions, each of which is a putative class action. Pursuant to the Separation Agreement, Lorillard is required to indemnify Loews for the amount of any losses and any legal or other fees with respect to such cases. Following the closing of the Lorillard merger, RJRT assumed Lorillard’s obligations under the Separation Agreement as was required under the Separation Agreement.
135.SFRTI Indemnity. In connection with the 13 January 2016 sale by Reynolds American of the international rights to the Natural American Spirit brand name and associated trademarks, along with SFR Tobacco International GmbH (SFRTI) and other international companies that distributed and marketed the brand outside the United States, to JT International Holding BV (JTI Holding), each of SFNTC, R. J. Reynolds Global Products, Inc., and R. J. Reynolds Tobacco B.V. agreed to indemnify JTI Holding against, among other things, any liabilities, costs, and expenses relating to actions (i) commenced on or before (a) 13 January 2019, to the extent relating to alleged personal injuries, and (b) in all other cases, 13 January 2021; (ii) brought by (a) a governmental authority to enforce legislation implementing European Union Directive 2001/37/EC or European Directive 2014/40/EU or (b) consumers or a consumer association; and (iii) arising out of any statement or claim (a) made on or before 13 January 2016, (b) by any company sold to JTI Holding in the transaction, (c) concerning Natural American Spirit brand products consumed or intended to be consumed outside of the United States and (d) that the Natural American Spirit brand product is natural, organic, or additive-free. These claims settled for a total of US$4,653,009 (approximately £3,868,159) in taxes and interest.
136.Indemnification of Distributors and Retailers. RJRT, Lorillard Tobacco, SFNTC, American Snuff Co. and RJR Vapor have entered into agreements to indemnify certain distributors and retailers from liability and related defence costs arising out of the sale or distribution of their products. Additionally, SFNTC has entered into an agreement to indemnify a supplier from liability and related defence costs arising out of the sale or use of SFNTC’s products. The cost has been, and is expected to be, insignificant. RJRT, SFNTC, American Snuff Co. and RJR Vapor believe that the indemnified claims are substantially similar in nature and extent to the claims that they are already exposed to by virtue of their having manufactured those products.
137.Except as otherwise noted above, Reynolds American is not able to estimate the maximum potential of future payments, if any, related to these indemnification obligations.
| | | | | | | | | | | | | | | | | | | | | | | |
| BAT Annual Report and Form 20-F 2022 | Strategic Report | | Governance Report | | Financial Statements | | Other Information |
| | | | | | | |
| | | | | | | |
| | | | | | | |
| | | | | | | |
|
138.Competition Investigations. There are instances where Group companies are cooperating with relevant national competition authorities in relation to ongoing competition law investigations and/or engaged in legal proceedings at the appellate level, including (amongst others) in the Netherlands and Nigeria. In the previously disclosed investigation by the Nigerian Federal Competition and Consumer Protection Commission into alleged violations of the Nigerian Competition and Consumer Protection Act and National Tobacco Control Act, a consent order was entered into between the FCCPC and British American Tobacco (Holdings) Limited, British American Tobacco (Nigeria) Limited and British American Tobacco Marketing (Nigeria) Limited in December 2022 terminating the investigation and associated proceedings, replacing the previous Final Order. A penalty equivalent to US$110 million will be paid in Naira in instalments, among other measures.
Tax disputes
The Group has exposures in respect of the payment or recovery of a number of taxes. The Group is and has been subject to a number of tax audits covering, amongst others, excise tax, value added taxes, sales taxes, corporate taxes, withholding taxes and payroll taxes.
The estimated costs of known tax obligations have been provided in these accounts in accordance with the Group’s accounting policies. In some countries, tax law requires that full or part payment of disputed tax assessments be made pending resolution of the dispute. To the extent that such payments exceed the estimated obligation, they would not be recognised as an expense. While the amounts that may be payable or receivable in relation to tax disputes could be material to the results or cash flows of the Group in the period in which they are recognised, the Board does not expect these amounts to have a material effect on the Group’s financial condition.
The following matters are in or may proceed to litigation:
Corporate taxes
Brazil
Profits of overseas subsidiaries. The Brazilian Federal Tax Authority has filed claims against Souza Cruz seeking to reassess the profits of overseas subsidiaries to corporate income tax and social contribution tax. The reassessments are for the years 2004 until and including 2012 for a total amount of BRL1,919 million (£302 million) to cover tax, interest and penalties.
Souza Cruz appealed all reassessments. Regarding the first assessments (2004-2006), Souza Cruz’s appeals were rejected by the ultimate Administrative Court after which Souza Cruz filed two lawsuits with the Judicial Court to appeal the reassessments. The judgment in respect of the reassessment of corporate income tax has been decided in favour of Souza Cruz by the first level of the Judicial Court and Souza Cruz is waiting to see whether the Brazilian Tax Authorities will appeal the judgment. The lawsuit appealing the social contribution tax is pending judgment in the first level of the Judicial Court. The appeal against the second assessments (2007 and 2008) was upheld at the second tier tribunal and was closed. In 2015, a further reassessment for the same period (2007 and 2008) was raised after the five-year statute of limitation which has been appealed against. Souza Cruz received further reassessments in 2014 for the 2009 calendar year and in 2015 an assessment for the 2010 calendar year. Souza Cruz appealed both the reassessments in full. In December 2016, assessments were received for the calendar years 2011 and 2012 which have also been appealed.
Rio de Janeiro VAT Incentives. The Brazilian Federal Tax authority has challenged the treatment of Rio de Janeiro VAT incentives. In October 2021, in respect of the 2016-2021 calendar years, the authorities position was upheld at the lower Judicial Court. Souza Cruz has appealed in full against the Judgment. The maximum exposure from 2016 is BRL 833 million (£131 million) including potential interest and penalties.
Netherlands
The Dutch tax authority has issued a number of assessments on various issues across the years 2003-2016 in relation to various intra-group transactions. The assessments amount to an aggregate net potential liability across these periods of £1,221 million covering tax, interest and penalties. The Group has appealed against the assessments in full. The case is being dealt with in two separate trials. The first trial deals with assessments for periods from 2008-2013 (with an aggregate potential net liability of £285 million). A separate trial will cover the periods from 2014-2016 (with an aggregate potential net liability of £936 million). In relation to the periods from 2008-2013 at an initial trial, the District Court of North Holland issued judgments on 17 October 2022, resulting in findings against the Group on a number of issues. All these judgments have been appealed to the High Court.
The Group believes that its companies have meritorious defences in law and fact in each of the above matters and intends to pursue each dispute through the judicial system as necessary. The Group does not consider it appropriate to make provision for these amounts nor for any potential further amounts which may be assessed in relation to these matters in subsequent years.
Indirect and other taxes
Bangladesh
In 2017, the National Board of Revenue (NBR) passed a discriminatory special order fixing BDT 27 for local brands and BDT 35 for foreign brand cigarettes. After NBR passed the special order, it was highlighted to the Government that it was against the principles of foreign direct investment and against WTO practice. Subsequently, the Finance Minister directed that no action should be taken in this regard until the different issues raised were finalised. Later in 2018, the special order itself was repealed. AKTC (a local Bangladeshi tobacco manufacturer) filed a case against NBR to get a direction from the Court to implement the special order and reserve low segment for local industries. The judgment in the AKTC case was passed by the High Court Division verbally on 21 September 2020. The judgment revived the discriminatory regime of VAT and Supplementary Duty (SD) between local and international/imported brands for the fiscal year 2017 - 2018. In light of the judgment, the Large Taxpayers’ Unit (LTU) of National Board of Revenue by a notice asked BATB to show cause as to why BATB believed it should not be liable to pay £210 million as unpaid VAT and SD. Challenging the judgment, BATB filed and moved an appeal (known as the Civil Miscellaneous Petition for Leave to Appeal) before the Appellate Division of the Supreme Court of Bangladesh and the judgment was subsequently stayed.
On 20 December 2020, BATB filed a Civil Petition for Leave to Appeal as directed by the Appellate Division Judge in Chamber. The judgment passed by the High Court Division will continue to remain stayed while the appeal remains pending at the Appellate Division of the Supreme Court of Bangladesh. It is anticipated that the appeals admission hearing date may be fixed for February or March 2023.
| | | | | | | | | | | | | | | | | | | | | | | |
| BAT Annual Report and Form 20-F 2022 | Strategic Report | | Governance Report | | Financial Statements | | Other Information |
| | | | | | | |
| | | | | | | |
| | | | | | | |
| Financial Statements | | | | | | | |
Notes on Accounts Continued |
Egypt
Until 28 September 2022 and 4 December 2022, respectively, British American Tobacco Egypt LLC (BAT Egypt) was subject to two civil cases concerning the imposition of sales tax on low-price category brands brought by the Egyptian tax authority for £88 million, one case pertaining to the period May 2008 to February 2009, and the second case pertaining to the period March 2009 to June 2010. Court-appointed experts filed reports in both cases. Management believes the tax claims are unfounded and challenged both claims. In May 2021, a judgment was issued in the second of the two cases which acquitted BAT Egypt from all amounts related only to the period from March 2009 to October 2009. An appeal was submitted to the Supreme Administrative Court to extend the acquittal to the rest of the disputed period. A judgment in the first claim was not issued.
In June 2022, following the business decision to exit the Egyptian market, BAT Egypt entered into an arrangement with the Tax Authority to fully and finally settle the outstanding claims and take advantage of a tax amnesty scheme introduced into the market which provided for a 65% reduction on the penalties claimed in the event payment of the principal was made in full, which amounts to EGP 1.183 billion (£50 million). Following this agreement with the Tax Authority, applications were made to the court to abandon the pending court cases, and the proceedings are now formally closed since 28 September 2022 and 4 December 2022, respectively.
South Korea
In 2016, the Board of Audit and Inspection of Korea (BAI) concluded its tax assessment in relation to the 2014 year-end tobacco inventory, and imposed additional national excise, local excise, VAT taxes and penalties. This resulted in the recognition of a KRW80.7 billion (approximately £50 million) charge by Group subsidiaries, Rothmans Far East B.V. Korea Branch Office and BAT Korea Manufacturing Ltd. Management deems the tax and penalties to be unfounded and has appealed to the tax tribunal against the assessment. On grounds of materiality and the likelihood of the tax and penalties being reversed in future, the Group classified the tax and penalties charge as an adjusting item in 2016.
On 23 August 2019, the trial court ruled in favour of Rothmans Far East B.V. Korea Branch Office on KRW6.7 billion (approximately £4 million), the VAT portion of the assessment. The Korean government appealed the ruling on 16 September 2019. On 16 April 2021 the Court of Appeals affirmed the ruling of the Trial Court. The government immediately appealed to the Supreme Court and the Supreme Court also affirmed the ruling of the Appeals Court on 26 August 2021. On 16 September 2021, Rothmans Far East B.V. Korea Branch Office duly received the amount litigated (VAT portion) including statutory interests (note 6). Appeals on the other elements of the assessment are still pending at Appeals Court.
Commitments in relation to service contracts, non-capitalised leases
The total future minimum payments under non-cancellable service contracts based on when payments fall due:
| | | | | | | | |
| 2022 £m | 2021 £m |
| Service contracts | | |
| Within one year | 45 | | 41 | |
| Between one and five years | 66 | | 81 | |
| Beyond five years | — | | 5 | |
| 111 | | 127 | |
Financial commitments arising from short-term leases and leases of low-value assets that are not capitalised under IFRS 16 Leases are £30 million (2021: £7 million) for property and £50 million (2021: £19 million) for plant, equipment and other assets.
| | | | | | | | | | | | | | | | | | | | | | | |
| BAT Annual Report and Form 20-F 2022 | Strategic Report | | Governance Report | | Financial Statements | | Other Information |
| | | | | | | |
| | | | | | | |
| | | | | | | |
| | | | | | | |
|
32 Interests in subsidiaries
Subsidiaries with material non-controlling interests
Non-controlling interests principally arise from the Group’s listed investment in Bangladesh (British American Tobacco Bangladesh Company Limited) where the Group held 72.91% in 2022, 2021 and 2020. Summarised financial information for Bangladesh is shown below as required by IFRS 12 Disclosure of interest in other entities. No adjustments have been made to the information below for the elimination of intercompany transactions and balances with the rest of the Group.
| | | | | | | | | | | |
| Summarised financial information | 2022 £m | 2021 £m | 2020 £m |
| Revenue | 732 | | 640 | | 553 | |
| Profit for the year | 153 | | 127 | | 101 | |
| – Attributable to non-controlling interests | 41 | | 34 | | 27 | |
| Total comprehensive income | 132 | | 127 | | 91 | |
| – Attributable to non-controlling interests | 36 | | 34 | | 25 | |
| Dividends paid and other appropriations made to non-controlling interests | (32) | | (28) | | (31) | |
| Summary net assets: | | | |
| Non-current assets | 322 | | 303 | | 271 | |
| Current assets | 253 | | 345 | | 271 | |
| Non-current liabilities | 78 | | 70 | | 58 | |
| Current liabilities | 166 | | 262 | | 190 | |
| Total equity at the end of the year | 331 | | 316 | | 294 | |
| – Attributable to non-controlling interests | 90 | | 86 | | 80 | |
| Net cash generated from operating activities | 164 | | 52 | | 137 | |
| Net cash used in investing activities | (46) | | (26) | | (11) | |
| Net cash used in financing activities | (147) | | (55) | | (111) | |
| Differences on exchange | 4 | | — | | (1) | |
| (Decrease)/increase in net cash and cash equivalents | (25) | | (29) | | 14 | |
| Net cash and cash equivalents at 1 January | 1 | | 30 | | 16 | |
| Net cash and cash equivalents at 31 December | (24) | | 1 | | 30 | |
Subsidiaries subject to restrictions:
As a result of the Group’s Canadian subsidiary, Imperial Tobacco Canada (ITCAN), entering CCAA protection, the assets of ITCAN
are subject to restrictions. The table below summarises the assets and liabilities of ITCAN:
| | | | | | | | |
| Summarised financial information | 2022 £m | 2021 £m |
| Non-current assets | 2,554 | | 2,403 | |
| Current assets | 2,193 | | 1,630 | |
| Non-current liabilities | (114) | | (109) | |
| Current liabilities | (526) | | (479) | |
| 4,107 | | 3,445 | |
Under the terms of CCAA, the court has appointed FTI Consulting Canada Inc. to act as a monitor. This monitor has no operational input and is not involved in the management of the business. The Group considers that ITCAN continues to meet the requirements of IFRS 10 Consolidated Financial Statements, and, until such requirements are not met, the Group will continue to consolidate the results of ITCAN.
Whilst the Group continues to control the operations of its Canadian subsidiary, there are restrictions over the ability to access or use certain assets including the ability to remit dividends. Included in non-current assets for 2022 and 2021 is goodwill of £2.5 billion subject to impairment reviews (note 12). Included in current liabilities are trade and other payables of £391 million (2021: £341 million), the majority of which are amounts payable in respect of duties and excise. A breakdown of current assets has been provided below.
| | | | | | | | |
| 2022 £m | 2021 £m |
| Cash and cash equivalents* | 1,569 | | 1,114 | |
| Inventory | 182 | | 126 | |
| Investments held at fair value | 396 | | 351 | |
| Other | 46 | | 39 | |
| 2,193 | | 1,630 | |
Note:
* Cash and cash equivalents above include £1,411 million (2021: £1,024 million) of restricted cash and cash equivalents. The Group defines restricted cash and cash equivalents as where there are significant restrictions on its ability to access or use the assets and settle the liabilities of the Group, but excludes cash and cash equivalents where there are also outstanding local currency borrowings or where there is an outstanding excise liability. In addition, dividends payable would also be excluded from restricted cash and cash equivalents if the dividend has been approved by the necessary regulatory channels.
| | | | | | | | | | | | | | | | | | | | | | | |
| BAT Annual Report and Form 20-F 2022 | Strategic Report | | Governance Report | | Financial Statements | | Other Information |
| | | | | | | |
| | | | | | | |
| | | | | | | |
| Financial Statements | | | | | | | |
Notes on Accounts Continued |
Refer to note 31 for information on the Quebec Class Actions.
Other shareholdings
At 31 December 2022, the Group holds almost 100% (2021: 99%; 2020: 92%) of the equity shares of PT Bentoel Internasional Investama Tbk (Bentoel). Between 2011 and 2021, the Group was party to a total return swap on approximately 7% of Bentoel’s issued capital. While the Group did not have legal ownership of these shares in this period, it retained the risks and rewards associated with them which resulted in the Group continuing to recognise an effective interest in 99% of Bentoel’s net assets and results. In 2021, the Group terminated the total return swap as part of its intention to delist from the Indonesia Stock Exchange and go private by conducting a Voluntary Tender Offer (VTO), as a result of which the Group acquired 0.2% additional shares at a cost of £4 million. Shares from over one thousand individual shareholders who could not be contacted are in the process of being transferred to a courts-approved Public Trustee. When this is complete, approvals will be sought from the relevant authorities to delist the company.
33 Summarised financial information
The following summarised financial information is required by the rules of the Securities and Exchange Commission and has been prepared as a requirement of the Regulation S-X 3-10 in respect of the guarantees of:
–US$11.00 billion of outstanding bonds issued by B.A.T Capital Corporation (BATCAP) in connection with the acquisition of Reynolds American Inc. (Reynolds American), including registered bonds issued in exchange for the initially issued bonds (the 2017 Bonds);
–US$12.15 billion of outstanding bonds issued by BATCAP pursuant to the Shelf Registration Statement on Form F-3 filed on July 17, 2019, and US$0.6 billion of outstanding bonds issued by BATCAP pursuant to the Shelf Registration Statement on Form F-3 filed on July 1, 2022 pursuant to which BATCAP or BATIF may issue an indefinite amount of debt securities; and
–US$2.50 billion of outstanding bonds issued by BATIF pursuant to the Shelf Registration Statement on Form F-3 filed on July 17, 2019, pursuant to which BATCAP or BATIF may issue an indefinite amount of debt securities.
As of July 28, 2020, all relevant Group entities suspended their reporting obligations with respect to the US$7.7 billion (2022: US$7.7 billion) of Reynolds American unsecured notes and US$40.9 million (2022: US$40.9 million) of Lorillard unsecured notes. As such, no summarised financial information is provided with respect to these securities.
As described below, Reynolds American is a subsidiary guarantor of all outstanding series of BATCAP and BATIF bonds. Under the terms of the indentures governing such notes, any subsidiary guarantor (including Reynolds American) other than BATCAP or BATIF, as applicable, BATNF and BATHTN, will automatically and unconditionally be released from all obligations under its guarantee, and such guarantee shall thereupon terminate and be discharged and of no further force or effect, in the event that (1) its guarantee of all then outstanding notes issued under the Group’s EMTN Programme is released or (2) at substantially the same time its guarantee of the debt securities is terminated, such subsidiary guarantor is released from all obligations in respect of indebtedness for borrowed money for which such subsidiary guarantor is an obligor (as a guarantor or borrower). Under the EMTN Programme, Reynolds American’s guarantee is released if at any time the aggregate amount of indebtedness for borrowed money, subject to certain exceptions, for which Reynolds American is an obligor does not exceed 10% of the outstanding long-term debt of BAT as reflected in the balance sheet included in BAT’s most recent publicly released interim or annual consolidated financial statements.
Reynolds American’s guarantee may be released notwithstanding Reynolds American guaranteeing other indebtedness, provided Reynolds American’s guarantee of outstanding notes issued under the EMTN Programme is released. If Reynolds American’s guarantee is released, BAT is not required to replace such guarantee, and the debt securities will have the benefit of fewer subsidiary guarantees for the remaining maturity of the debt securities.
Note: The following summarised financial information report the unconsolidated contribution of each applicable company to the Group’s consolidated results and not the separate financial statements for each applicable company as local financial statements are prepared in accordance with local legislative requirements and may differ from the financial information provided below. In particular, in respect of the U.S. region, all financial statements and financial information provided by or with respect to the U.S. business or RAI (and/or RAI and its subsidiaries (collectively, the Reynolds Group)) are prepared on the basis of US GAAP and constitute the primary financial statements or financial information of the U.S. business or RAI (and/or the Reynolds Group). Solely for the purpose of consolidation within the results of BAT p.l.c. and the BAT Group, this financial information is then converted to IFRS. To the extent any such financial information provided in these financial statements relates to the U.S. business or RAI (and/or the Reynolds Group), it is provided as an explanation of the U.S. business’s or RAI’s (and/or the Reynolds Group’s) primary US GAAP based financial statements and information.
| | | | | | | | | | | | | | | | | | | | | | | |
| BAT Annual Report and Form 20-F 2022 | Strategic Report | | Governance Report | | Financial Statements | | Other Information |
| | | | | | | |
| | | | | | | |
| | | | | | | |
| | | | | | | |
|
The subsidiaries disclosed below are wholly-owned and the guarantees provided are full and unconditional, and joint and several:
a.British American Tobacco p.l.c. (as the parent guarantor), referred to as ‘BAT p.l.c.’ in the financials below;
b.B.A.T Capital Corporation (as an issuer or a subsidiary guarantor, as the case may be), referred to as ‘BATCAP’ in the financials below;
c.B.A.T. International Finance p.l.c. (as an issuer or a subsidiary guarantor, as the case may be), referred to as ‘BATIF’ in the financials below;
d.B.A.T. Netherlands Finance B.V. (as a subsidiary guarantor), referred to as ‘BATNF’ in the financials below;
e.Reynolds American Inc. (as a subsidiary guarantor), referred to as ‘RAI’ in the financials below; and
f.British American Tobacco Holdings (The Netherlands) B.V. (as a subsidiary guarantor of the 2017 Bonds only), referred to as ‘BATHTN’ in the financials below.
In accordance with Regulation S-X 13-01, information in respect of investments in subsidiaries that are not issuers or guarantors has been excluded from non-current assets as shown in the balance sheet table below. The ‘BATHTN’ column in the summarised financial information is only applicable in the context of the 2017 Bonds. British American Tobacco Holdings (The Netherlands) B.V. (BATHTN) is not an issuer nor guarantor of any of the other securities referenced in this note. None of the issuers or other guarantors has material balances with or an investment in BATHTN. Investments in subsidiaries represents share capital acquired in relation to or issued by subsidiary undertakings.
| | | | | | | | | | | | | | | | | | | | |
| Summarised Financial Information |
Year ended 31 December 2022 | BAT p.l.c.
£m | BATCAP
£m | BATIF
£m | BATNF
£m | RAI
£m | BATHTN
£m |
| Income Statement | | | | | | |
| Revenue | — | | — | | — | | — | | — | | — | |
| (Loss)/profit from operations | (115) | | (1) | | (2) | | — | | 5 | | 1 | |
| Dividend income | 7,515 | | — | | — | | — | | 4,835 | | 148 | |
| Net finance income/(costs) | 264 | | (52) | | 187 | | — | | (500) | | — | |
| Profit/(loss) before taxation | 7,664 | | (53) | | 185 | | — | | 4,340 | | 149 | |
| Taxation on ordinary activities | (10) | | (9) | | (21) | | — | | 110 | | — | |
| Profit/(loss) for the year | 7,654 | | (62) | | 164 | | — | | 4,450 | | 149 | |
| Intercompany Transactions – Income Statement | | | | | | |
| Transactions with non-issuer/non-guarantor subsidiaries (expense)/income | (116) | | (1) | | (2) | | — | | 47 | | — | |
| Transactions with non-issuer/non-guarantor subsidiaries net finance (cost)/income | 52 | | 815 | | 732 | | — | | 25 | | — | |
| Dividend income from non-issuer/non-guarantor subsidiaries | 7,515 | | — | | — | | — | | 4,835 | | 148 | |
| | | | | | | | | | | | | | | | | | | | |
| Summarised Financial Information |
Year ended 31 December 2021 | BAT p.l.c.
£m | BATCAP
£m | BATIF
£m | BATNF
£m | RAI
£m | BATHTN
£m |
| Income Statement | | | | | | |
| Revenue | — | | — | | — | | — | | — | | — | |
| (Loss)/profit from operations | (111) | | (1) | | (2) | | — | | 3 | | — | |
| Dividend income | 6,200 | | — | | — | | — | | 4,827 | | 164 | |
| Net finance income/(costs) | 170 | | (43) | | 63 | | 1 | | (421) | | — | |
| Profit/(loss) before taxation | 6,259 | | (44) | | 61 | | 1 | | 4,409 | | 164 | |
| Taxation on ordinary activities | 5 | | 19 | | 1 | | — | | 97 | | — | |
| Profit/(loss) for the year | 6,264 | | (25) | | 62 | | 1 | | 4,506 | | 164 | |
| Intercompany Transactions – Income Statement | | | | | | |
| Transactions with non-issuer/non-guarantor subsidiaries (expense)/income | (111) | | (1) | | (2) | | — | | 36 | | — | |
| Transactions with non-issuer/non-guarantor subsidiaries net finance (cost)/income | (2) | | 709 | | 370 | | — | | 28 | | — | |
| Dividend income from non-issuer/non-guarantor subsidiaries | 6,200 | | — | | — | | — | | 4,827 | | 164 | |
| | | | | | | | | | | | | | | | | | | | | | | |
| BAT Annual Report and Form 20-F 2022 | Strategic Report | | Governance Report | | Financial Statements | | Other Information |
| | | | | | | |
| | | | | | | |
| | | | | | | |
| Financial Statements | | | | | | | |
Notes on Accounts Continued |
| | | | | | | | | | | | | | | | | | | | |
| Summarised Financial Information |
As at 31 December 2022 | BAT p.l.c.
£m | BATCAP
£m | BATIF
£m | BATNF
£m | RAI
£m | BATHTN
£m |
| Balance Sheet | | | | | | |
| Non-current assets | 1,917 | | 20,962 | | 2,480 | | 1,500 | | 405 | | 45 | |
| Current assets | 9,166 | | 7,947 | | 42,748 | | 22 | | 1,135 | | 8 | |
| Non-current liabilities | 1,580 | | 20,018 | | 14,058 | | 1,500 | | 10,094 | | 12 | |
| Non-current borrowings | 1,572 | | 19,762 | | 13,510 | | 1,500 | | 10,033 | | — | |
| Other non-current liabilities | 8 | | 256 | | 548 | | — | | 61 | | 12 | |
| Current liabilities | 55 | | 8,749 | | 29,379 | | 21 | | 1,011 | | 1 | |
| Current borrowings | 23 | | 8,657 | | 28,525 | | 21 | | 568 | | 1 | |
| Other current liabilities | 32 | | 92 | | 854 | | — | | 443 | | — | |
| Intercompany Transactions – Balance Sheet | | | | | | |
| Amounts due from non-issuer/non-guarantor subsidiaries | 9,117 | | 17,003 | | 42,752 | | — | | 700 | | 8 | |
| Amounts due to non-issuer/non-guarantor subsidiaries | 5 | | 3,890 | | 22,702 | | — | | 34 | | 1 | |
Investment in subsidiaries (that are not issuers
or guarantors) | 27,234 | | — | | 718 | | — | | 26,690 | | 1,573 | |
| | | | | | | | | | | | | | | | | | | | |
| Summarised Financial Information |
As at 31 December 2021 | BAT p.l.c.
£m | BATCAP
£m | BATIF
£m | BATNF
£m | RAI
£m | BATHTN
£m |
| Balance Sheet | | | | | | |
| Non-current assets | 1,916 | | 18,192 | | 4,986 | | 1,417 | | 357 | | 75 | |
| Current assets | 8,443 | | 3,583 | | 35,772 | | 21 | | 1,033 | | 19 | |
| Non-current liabilities | 9 | | 17,024 | | 13,667 | | 1,417 | | 8,778 | | 19 | |
| Non-current borrowings | — | | 16,965 | | 13,560 | | 1,417 | | 8,719 | | — | |
| Other non-current liabilities | 9 | | 59 | | 107 | | — | | 59 | | 19 | |
| Current liabilities | 1,607 | | 4,633 | | 25,451 | | 20 | | 882 | | 10 | |
| Current borrowings | 1,580 | | 4,602 | | 25,081 | | 20 | | 263 | | 10 | |
| Other current liabilities | 27 | | 31 | | 370 | | — | | 619 | | — | |
| Intercompany Transactions - Balance Sheet | | | | | | |
| Amounts due from non-issuer/non-guarantor subsidiaries | 8,405 | | 14,999 | | 38,539 | | — | | 1,360 | | 19 | |
| Amounts due to non-issuer/non-guarantor subsidiaries | — | | 3,006 | | 20,422 | | — | | 48 | | 9 | |
Investment in subsidiaries (that are not issuers
or guarantors) | 27,234 | | — | | 718 | | — | | 23,643 | | 1,488 | |
Perpetual hybrid bonds
BAT p.l.c. has issued two €1 billion of perpetual hybrid bonds which have been classified as equity as there is no contractual obligation
to either repay the principal or make payments of interest (note 22(d)).
BAT p.l.c.’s unconsolidated contribution to the Group’s consolidated equity results is shown below:
BAT p.l.c.
| | | | | | | | |
| As at 31 December | 2022 £m | 2021 £m |
| Total equity | 36,682 | | 35,977 | |
| Share capital | 614 | 614 | |
| Share premium | 113 | 107 | |
| Perpetual hybrid bonds | 1,685 | 1,685 | |
| Other equity | 34,270 | 33,571 | |
| | | | | | | | | | | | | | | | | | | | | | | |
| BAT Annual Report and Form 20-F 2022 | Strategic Report | | Governance Report | | Financial Statements | | Other Information |
| | | | | | | |
| | | | | | | |
| | | | | | | |
| | | | | | | |
| Group Companies and Undertakings |
This disclosure is made in accordance with Section 409 of the Companies Act 2006 and The Large and Medium-sized Companies and Groups (Accounts and Reports) Regulations 2008, as amended by The Companies, Partnerships and Groups (Accounts and Reports) Regulations 2015. A full list of subsidiary undertakings, associates and joint ventures and joint operations as defined by IFRS (showing the country of incorporation, effective percentage of equity shares held and full registered office addresses) as at 31 December 2022 is disclosed below.
The subsidiary undertakings that are held directly by British American Tobacco p.l.c. (the ultimate Parent Company) are indicated thus*; all others are held by sub-holding companies.
Unless otherwise stated, the equity shares held are in the form of ordinary shares or common stock, except for those indicated thus#, which include preference shares. The effective percentage of equity shares held in subsidiary undertakings is 100% unless otherwise stated. Further, where the effective percentage of equity shares held by the sub-holding company is different from that held by British American Tobacco p.l.c., the percentage of equity shares held by British American Tobacco p.l.c. is indicated thus^ and is shown after the percentage interest held by the sub-holding company.
The results of a number of these subsidiary undertakings principally affect the financial statements of the Group. These principal subsidiary undertakings are highlighted in grey and are considered to be the main corporate entities in those countries which, in aggregate, contributed 90% of the Group revenue in 2022.
| | |
| Subsidiary Undertaking |
| Albania |
| Rruga e Kavajes, Ish Kombinati Ushqimor, Tirana, Albania |
| British American Tobacco - Albania SH.P.K. |
| Algeria |
| Zone d’activité El Omran, Route de Ouled Fayet, Ilot 789- Lot 04, Cheraga, Alger, Algeria |
British American Tobacco (Algérie) S.P.A. (51%)4 |
| Angola |
| Viana Park, Polo Industrial, Viana, Luanda, Angola |
| British American Tobacco - B.A.T. Angola, Limitada |
| Sociedade Geral de Distribuição e Comércio, Limitada |
| Sociedade Industrial Tabacos Angola LDA (71.6%) |
| Sociedade Unificada Tabacos Angola LDA (62.67%) |
| Argentina |
| San Martín 140, Floor 14, City of Buenos Aires, Argentina |
| BAT Operaciones S.A.U. |
| British American Tobacco Argentina S.A.I.C.y F. (99.98%) |
| Australia |
| 166 William Street, Woolloomooloo, NSW 2011, Australia |
| British American Tobacc South East Asia Pty Ltd |
| British American Tobacco Australasia Limited |
| British American Tobacco Australia Limited |
| British American Tobacco Australia Overseas Pty Limited |
| British American Tobacco Australia Services Limited |
Rothmans Asia Pacific Limited # |
| The Benson & Hedges Company Pty. Limited |
| W.D. & H.O. Wills Holdings Limited |
| Austria |
| Dr. Karl Lueger Platz 5, 1010, Wien, Austria |
| British American Tobacco (Austria) GmbH |
| Bahrain |
| Flat 2115, Building 2504, Road 2832, Block 428 Al Seef Area, Kingdom of Bahrain |
| British American Tobacco Middle East W.L.L |
| Bangladesh |
| New DOHS Road, Mohakhali, Dhaka 1206, Bangladesh |
| British American Tobacco Bangladesh Company Limited (72.91%) |
|
| | |
| Barbados |
| Chancery Chambers, Chancery House, High Street, Bridgetown, Barbados |
| Southward Insurance Ltd. |
| Belarus |
| 7th Floor, 3 Kuprevicha Str., Minsk, 220141, Belarus |
| Limited liability company "International Tobacco Marketing Services BY" |
| Belgium |
| Globe House, 4 Temple Place, London, WC2R 2PG, United Kingdom |
| British American Tobacco Holdings Belgium N.V. |
| Nieuwe Gentsesteenweg 21, 1702 Groot-Bijgaarden, Belgium |
| British American Tobacco Belgium N.V. |
| Benin |
| Cotonou, Lot Numbero H19, Quartiers Les Cocotiers, 01 BP 2520, Benin |
| British American Tobacco Benin SA |
| Bolivia |
| Av. Ballivián entre calles 11 y 12 No. 555, Edificio El Dorial, Piso 19, Oficina E, zona de Calacoto, La Paz, Bolivia |
| BAT Bolivia S.R.L. |
| Bosnia and Herzegovina |
| Fra Dominka Mandića 24A, 88220 Široki Brijeg, Bosnia and Herzegovina |
| IPRESS d.o.o. |
| ul. Azize Šaćirbegović 1, 71000 Sarajevo-Novo Sarajevo, Bosnia and Herzegovina |
| TDR d.o.o. Sarajevo |
| ul. Kolodvorska 12, 71000 Sarajevo-Novo Sarajevo, Bosnia and Herzegovina |
| iNovine BH d.o.o. |
| Botswana |
| Plot 20774 Broadhurst Industrial Estate, Gaborone, Botswana |
| British American Tobacco Botswana (Pty) Limited |
| Business Venture Investments Botswana 6773 (Pty) Ltd. (In Liquidation) |
|
| | | | | | | | | | | | | | | | | | | | | | | |
| BAT Annual Report and Form 20-F 2022 | Strategic Report | | Governance Report | | Financial Statements | | Other Information |
| | | | | | | |
| | | | | | | |
| | | | | | | |
| Financial Statements | | | | | | | |
Group Companies and Undertakings Continued |
| | |
Subsidiary Undertaking continued |
| Brazil |
| Avenida República do Chile, nº 330, Bloco 1, Torre Leste, 30º andar, Centro, Rio de Janeiro/RJ - CEP 20.031-170, Brazil |
| Instituto Souza Cruz |
| Souza Cruz LTDA |
| Yolanda Participacoes S.A. |
| Bulgaria |
| 115 M, Tsarigradsko Shose Blvd., Building D, Floor 5, Sofia, Mladost Municipality, 1784, Bulgaria |
| British American Tobacco Trading EOOD |
| Burkina Faso |
| Ouagadougou, Avenue Yennega BP: 882, Ouagadougou, Burkina Faso |
| Tobacco Marketing Consultant Burkina Faso SARL |
| Cambodia |
| 1121 National Road 2, Prek Tanou Village, Sangkat Chak Ang Re Leu, Khan Mean Chey, Phnom Penh, Kingdom of Cambodia |
| British American Tobacco (Cambodge) International Limited |
| 516, National Road No. 2, Phum Prek Ta Nu, Sangkat Chak Ang Re Leu, Khan Mean Chey, Phnom Penh, Kingdom of Cambodia |
| British American Tobacco (Cambodia) Limited (71%) |
| Cameroon |
| Rue Njo Njo, Bonapriso - B.P. 259, Douala, Cameroon |
| British American Tobacco Cameroun S.A. (99.76%) |
| Canada |
| 30 Pedigree Court, Brampton, Ontario, L6T 5T8, Canada |
| Imperial Tobacco Canada Limited |
| Imperial Tobacco Company Limited |
| 3711 St-Antoine West, Montreal, Quebec, H4C 3P6, Canada |
| Allan Ramsay and Company Limited |
| Cameo Inc. |
Genstar Corporation #2 |
| Imperial Brands Limited |
| Imperial Tobacco Products Limited |
| Imperial Tobacco Services Inc. |
| John Player & Sons Ltd |
Liggett & Myers Tobacco Company of Canada Limited (70%) (50%)^3 |
| Marlboro Canada Limited |
| Medaillon Inc. |
| 45 O'Connor Street, Suite 1500, Ottawa, Ontario, K1P 1A4, Canada |
| 2004969 Ontario Inc. |
| Cayman Islands |
| Trident Trust Company (Cayman) Ltd., One Capital Place, PO Box 847, Grand Cayman KY1-1103, Cayman Islands |
| R.J. Reynolds Tobacco (CI), Co. |
| Chile |
| Isidora Goyenechea 3000, Piso 15, of 1501, Las Condes, Santiago, Chile |
| BAT Chile S.A. |
| British American Tobacco Chile Operaciones S.A. (99.51%) |
| Inversiones Casablanca S.A. |
|
| | |
| China (People's Republic of) |
| Room 3101, Tower A, Gemdale Viseen Tower, No. 16, Gaoxin South 10th Road, High-tech Park, Nanshan District, Shenzhen, People's Republic of China |
| Nicoventures Technical (Shenzhen) Co., Ltd. |
| Room 436, No. 1000, Zhenchen Road, Baoshan District, Shanghai, People's Republic of China |
| British American (Shanghai) Enterprise Development Co., Ltd |
| British American Nico Business Consulting (Shanghai) Co., Ltd |
| Unit 1001 in 901, 9/F, Building 3, No.8 Guanghuadongli, Chaoyang District Beijing, People’s Republic of China |
British American Consulting (Beijing) Co., Ltd8 |
| Colombia |
| Av. Cra. 72 # 80-94 Piso 10. Bogotá, Colombia |
| British American Tobacco Colombia S.A.S. |
| Vype Colombia S.A.S. |
| Congo (Democratic Republic of) |
| 1er étage, Immeuble du Centenaire, Gombe, Kinshasa, Democratic Republic of Congo |
| BAT Distributon SARL (In Liquidation) |
| British American Tobacco Congo SARL (In Liquidation) |
| 1st floor Immeuble L’horizon sis avenue Colonel Lukusa n°50, Gombe, Kinshasa, Democratic Republic of Congo |
| British American Tobacco Import SARL |
| British American Tobacco Services Congo SARL |
| Costa Rica |
| 325 Metros este del Puente de la Firestone, Llorente, Flores, Heredia, Costa Rica |
| BASS Americas S.A. |
| BATCCA Park Inversiones Immobiliarias, S.A. |
| BATCCA Servicios S.A. |
| Croatia |
| Avenija Dubrovnik 16, 10000 Zagreb, Croatia |
| BAT HRVATSKA d.o.o. u likvidaciji (In Liquidation) |
| Draškovićeva 27, 10000 Zagreb, Croatia |
| iNovine d.d. (93.42%) |
| Obala V. Nazora 1, 52210 Rovinj, Croatia |
| TDR d.o.o. |
| Osječka 2, 33000 Virovitica, Croatia |
| Hrvatski Duhani d.d. Tobacco Leaf Processing (95.54%) (98.65%)^ |
| Cuba |
| Parcela nº 2 a noroeste do terminal de contêineres de Mariel, a 2,2 km do vértice nº 4, Município de Mariel, Província de Artemisa, Republic of Cuba |
| Brascuba Cigarrillos S.A. (50%) |
| Cyprus |
| Photiades Business Centre, 5th Floor, 8 Stasinou Avenue, Nicosia, CY-1060, Cyprus |
| B.A.T (Cyprus) Limited |
| Rothmans (Middle East) Limited |
| Czech Republic |
| Karolinská 654/2, Prague 8 – Karlín, 186 00, Czech Republic |
| British American Tobacco (Czech Republic), s.r.o. |
|
| | | | | | | | | | | | | | | | | | | | | | | |
| BAT Annual Report and Form 20-F 2022 | Strategic Report | | Governance Report | | Financial Statements | | Other Information |
| | | | | | | |
| | | | | | | |
| | | | | | | |
| | | | | | | |
|
| | |
| Denmark |
| Bernstorffsgade 50, 1577 Copenhagen, Denmark |
| British American Tobacco Denmark A/S (House of Prince A/S) |
| Precis (1789) Denmark A/S |
| Djibouti |
| Rue de Magadiscio, Lot No. 133, Djibouti City, Djibouti |
| British American Tobacco Djibouti SARL (In Liquidation) |
| Egypt |
| Administrative unit no.1 , 5th Floor, Building S2B, Sector A, Downtown Mall Katameya, 5th settlement, New Cairo, Egypt |
| BETCO for General Services and Marketing LLC |
| BETCO for Trade and Distribution LLC |
| British American Tobacco Egypt LLC |
| British American Tobacco North Africa LLC |
| English American Company for Importation and Trade L.L.C (In Liquidation) |
| Eritrea |
| P.O. Box 749, 62 Fel Ket Street, Asmara, Eritrea |
British American Tobacco (Eritrea) Share Company # |
| Estonia |
| Tornimäe 7-10, 10145 Tallinn, Estonia |
| British American Tobacco Estonia AS |
| Fiji |
| Lady Maria Road, Nabua, Suva, Fiji |
| British American Tobacco (Fiji) Marketing Pte Limited |
| Central Manufacturing Company Pte Limited |
| Rothmans of Pall Mall (Fiji) Pte Limited |
| Finland |
| c/o Retail24, Olarinluoma 7, 02200 Espoo, Finland |
| British American Tobacco Finland Oy |
| France |
| 111 Avenue Victor Hugo, 75016 Paris, France |
| Carreras France SAS |
| Tour Légende, 20 place de la Défense, CS 80289, 92050 Paris La Défense Cedex, France |
| British American Tobacco France SAS |
| Germany |
| Alsterufer 4, 20354 Hamburg, Germany |
| BATIG Gesellschaft fur Beteiligungen m.b.H. |
| British American Tobacco (Germany) GmbH |
| British American Tobacco (Industrie) GmbH |
| Schutterwälder Straße. 23, 01458 Ottendorf-Okrilla, Germany |
| Quantus Beteiligungs-und Beratungsgesellschaft mbH i.L (In Liquidation) |
| Ghana |
| 4th Floor, Volta Place, Airport Residential Area, Patrice Lumumba Street, Accra, Ghana |
| British American Tobacco Ghana Limited (97.09%) |
|
| | |
| Greece |
| 27, Ag. Thoma Street, Maroussi, 151 24, Greece |
| British American Tobacco Hellas S.A. |
| Guernsey |
| St Martin’s House, Le Bordage, St. Peter’s Port, GY1 4AU, Guernsey |
| Belaire Insurance Company Limited |
| Guyana |
| Lot 122 Parade Street, Kingston, Georgetown, Guyana |
| Demerara Tobacco Company Limited (70.25%) |
| Honduras |
| Boulevard del Sur, Zona El Cacao, San Pedro Sula, Depart. de Cortés, Honduras |
| Tabacalera Hondureña S.A. (83.64%) |
| Hong Kong |
| 11/F, One Pacific Place, 88 Queensway, Hong Kong, China |
| British American Tobacco China Investments Limited |
| Lehman, Lee & XU Corporate Services, Suite 3313, Tower One, Times Square 1 Matheson Street, Causeway Bay, Hong Kong, China |
| Reynolds Asia-Pacific Limited |
| Level 24, Suites 2407-09, 3 Pacific Place, 1 Queen's Road East, Wanchai, Hong Kong, China |
| BAT Global Travel Retail Limited |
| Level 30, 3 Pacific Place, 1 Queen's Road East, Wanchai, Hong Kong, China |
| British American Tobacco Asia-Pacific Region Limited |
| British-American Tobacco Company (Hong Kong) Limited |
| Nicoventures Business Consulting (Hong Kong) Co., Ltd. |
| Hungary |
| H-1124, Budapest, Csörsz utca 49-51. 3. em., Hungary |
| BAT Pécsi Dohánygyár Korlátolt Felelosségu Társaság |
| Indonesia |
| Capital Place Office Tower, 6th Floor, Jl. Gatot Subroto Kav. 18, Jakarta 12710, Indonesia |
| PT Bentoel Internasional Investama, Tbk (99.96%) |
| Jl. Raya Karanglo, 1 Desa Banjararum, Kecamatan Singosari, Jawa Timur 65153, Indonesia |
PT Bentoel Prima (99.99%)(99.96%)^4 |
| Jl. Susanto No. 2B, Ciptomulyo, Sukun, Malang, Jawa Timur 65148, Indonesia |
| PT Bentoel Distribusi Utama (100%) (99.96%)^ |
| Iraq |
| Empire Business Tower, Building C5, 2nd floor, Erbil, Kurdistan Region of Iraq |
| B.A.T. Iraqia Company for Tobacco Trading Limited |
| Ireland |
| Suite D, 2nd Floor, The Apex Building, Blackthorn Road, Sandyford Industrial Estate, Dublin 18, Republic of Ireland |
| Carroll Group Distributors Limited |
| P.J. Carroll & Company Limited |
Rothmans of Pall Mall (Ireland) Limited5 |
|
| | | | | | | | | | | | | | | | | | | | | | | |
| BAT Annual Report and Form 20-F 2022 | Strategic Report | | Governance Report | | Financial Statements | | Other Information |
| | | | | | | |
| | | | | | | |
| | | | | | | |
| Financial Statements | | | | | | | |
Group Companies and Undertakings Continued |
| | |
Subsidiary Undertaking continued |
| Isle of Man |
| 2nd Floor, St Mary’s Court, 20 Hill Street, Douglas, IM1 1EU, Isle of Man |
| Abbey Investment Company Limited |
| The Raleigh Investment Company Limited |
| Tobacco Manufacturers (India) Limited |
| Italy |
| Località Bagnoli della Rosandra, snc, 34018 San Dorligo della Valle (TS), Italy |
| BAT Trieste S.p.A. |
| Via Amsterdam 147, 00144 Rome, Italy |
| British American Tobacco Italia S.p.A. |
| Ivory Coast |
| Rue des Jardins -Immeuble Sayegh-Mezzanine, Abidjan, Cocody 2 plateaux, Côte d'Ivoire |
| British American Tobacco RCI SARL |
| Jamaica |
| 13A Ripon Road, Kingston 5, Jamaica |
Carreras Limited (50.40%)13 |
Sans Souci Development Limited (100%) (50.40%)^13 (In Liquidation) |
Sans Souci Limited (100%) (50.40%)^13 (In Liquidation) |
| Japan |
| Midtown Tower 20F, 9-7-1 Akasaka, Minato-ku, Tokyo, Japan |
British American Tobacco Japan, Ltd.10 |
| Jersey |
| 22 Grenville Street, St Helier, JE4 8PX, Jersey |
| Pathway 5 (Jersey) Limited |
| Jordan |
| Airport Road, Al Qastal Industrial Area, Air Cargo Road, Amman, Jordan |
| British American Tobacco – Jordan Private Shareholding Company Limited |
| Kazakhstan |
| 240G, Nursultan Nazarbayev Avenue, A26F8D4 Almaty, Republic of Kazakhstan |
British American Tobacco Kazakhstan Trading LLP1 |
| Kenya |
| 8 Likoni Road, Industrial Area, P.O. Box 30000-00100, Nairobi, Kenya |
| BAT Kenya Tobacco Company Limited (100%) (60%)^ |
| British American Tobacco Area Limited |
| British American Tobacco Kenya plc (60%) |
| East African Tobacco Company (Kenya) Limited (60%) (In Liquidation) |
| Korea, Republic of |
| 141, Gongdan1-ro, Sanam-Myun, Sacheon City, Kyungsangnamdo, Korea (the Republic of) |
| British American Tobacco Korea Manufacturing Limited |
| 22nd FL. West Tower, MiraeAssetCENTER1, 26, Eulji-ro 5-gil, Jung-gu, Seoul, Korea (the Republic of) |
| British American Tobacco Korea Limited |
|
| | |
| Kosovo, Republic of |
| Llapllaselle p.n., 10500 Gracanicë, Republic of Kosovo |
| British American Tobacco Kosovo SH.P.K. |
| Kuwait |
| Unit 21, 35th Floor, Al Hamra Tower, Al Shohada St. Kuwait City, Kuwait |
| BAT Kuwait for Wholesale and Retail Trading Company (S.P.C) |
| Latvia |
| Mukusalas iela 101, Riga LV-1004, Latvia |
| British American Tobacco Latvia SIA |
| Lesotho |
| Mohokare Industrial Estate, Florida Area Extention, Ha Hoohle, Maseru, 100, Lesotho |
| British Amercan Tobacco Lesotho (Pty) Ltd |
| Lithuania |
| J. Galvydžio g. 11-7, LT-08236 Vilnius, Lithuania |
| UAB British American Tobacco Lietuva |
| Luxembourg |
| 1, Rue Jean Piret, 2350 Luxembourg, Grand Duchy of Luxembourg |
| British American Tobacco Brands (Switzerland) Limited |
| Malawi |
| Northgate Arcade Complex, Masauko Chipembere Highway, Blantyre, Malawi. |
| British American Tobacco (Malawi) Limited |
| Malaysia |
| 12th Floor, Menara Symphony, No. 5, Jalan Prof Khoo Kay Kim, Seksyen 13, 46200, Petaling Jaya, Selangor Darul Ehsan, Malaysia |
| British American Tobacco GSD (Kuala Lumpur) Sdn Bhd |
| Level 11, Sunway Geo Tower, Jalan Lagoon Selatan, Sunway South Quay, Bandar Sunway, 47500 Subang Jaya, Selangor Darul Ehsan, Malaysia |
| BAT Aspac Service Centre Sdn Bhd |
| Level 19, Guoco Tower, Damansara City, No. 6 Jalan Damanlela, Bukit Damansara, 50490 Kuala Lumpur, Malaysia |
| British American Tobacco (Malaysia) Berhad (50%) |
British American Tobacco Malaysia Foundation11 |
| Commercial Marketers and Distributors Sdn. Bhd. (100%) (50%)^ |
| Rothmans Brands Sdn. Bhd. (100%) (50%)^ (In Liquidation) |
| Tobacco Importers and Manufacturers Sdn. Bhd. (100%) (50%)^ |
| Mali |
| Djelibougoud-Immeuble Bassaro - BP 2065, Bamako, Mali |
| British American Tobacco (Mali) Sarl |
| Malta |
| PM Building, Level 2, Bone Street, Zone 1, Central Business District, Birkirkara, CBD 1060, Malta |
| British American Tobacco (Malta) Limited |
| Central Cigarette Company Limited |
| Rothmans of Pall Mall (Malta) Limited |
|
| | | | | | | | | | | | | | | | | | | | | | | |
| BAT Annual Report and Form 20-F 2022 | Strategic Report | | Governance Report | | Financial Statements | | Other Information |
| | | | | | | |
| | | | | | | |
| | | | | | | |
| | | | | | | |
|
| | |
| Mexico |
| Francisco I Madero 2750 Norte, ZipCode 64000, Monterrey, Nuevo Leon, Mexico |
BAT DBS Mexico S.A De C.V4 |
| Francisco I Madero 2750 Poniente, Colonia Centro, Monterrey, Nuevo León, C.P. 64000, Mexico |
| British American Tobacco Mexico Comercial, S.A. de C.V. |
| British American Tobacco Mexico, S.A. de C.V. |
| British American Tobacco Servicios S.A. de C.V. |
| Cigarrera La Moderna, S.A. de C.V. |
| Predio Los Sauces Sin número, Colonia Los Sauces, C.P. 63197, Tepic, Nayarit, Mexico |
| Procesadora de Tabacos de Mexico, S.A. de C.V. (93%) |
| Mozambique |
| 2289 Avenida de Angola, Maputo, Mozambique |
| British American Tobacco Mozambique Limitada (95%) |
| Myanmar |
| Min Aye Yar Street, Plot No. (55, 56), Survey Ward No. (14) Shwe Than Lwin Industrial Zone, Hlaing Tharyar Township Yangon Region, Myanmar |
British American Tobacco Myanmar Limited (95%)13 (In Liquidation) |
British American Tobacco Myanmar Services Limited13 (In Liquidation) |
| Namibia |
| 24 Orban Street, Klein Windhoek, Namibia |
| Twisp (Pty) Limited |
| Shop 48, Second Floor Old Power Station Complex, Armstrong Street, Windhoek, Namibia |
| British American Tobacco Namibia (Pty) Limited |
| Netherlands |
| Handelsweg 53 A, 1181 ZA, Amstelveen, Netherlands |
| Aruba Properties B.V. |
| B.A.T. Netherlands Finance B.V. |
| British American Tobacco European Operations Centre B.V. |
| British American Tobacco Exports B.V. |
| British American Tobacco Holdings (Australia) B.V. |
| British American Tobacco Holdings (Malaysia) B.V. |
| British American Tobacco Holdings (South Africa) B.V. |
| British American Tobacco Holdings (The Netherlands) B.V. |
| British American Tobacco Holdings (Venezuela) B.V. |
| British American Tobacco Holdings (Vietnam) B.V. |
| British American Tobacco International (Holdings) B.V. |
| Molensteegh Invest B.V. |
| Precis (1790) B.V. |
| Rothmans Far East B.V. |
| Rothmans International Holdings B.V. |
| Rothmans Tobacco Investments B.V. |
| Rothmans UK Holdings B.V. |
|
| | |
| New Zealand |
| 2 Watt Street, Parnell, Auckland, 1052, New Zealand |
| BAT (New Zealand) Limited |
| BAT Holdings (New Zealand) Limited |
| Mint Advisory Limited, Suite 6, 8 Turua Street, St Heliers, Auckland, 1071, New Zealand |
New Zealand (UK Finance) Limited # |
| Nigeria |
| 1, Tobacco Road, Oluyole Local Government Area, Ibadan, Oyo State, Nigeria |
| British American Tobacco (Nigeria) Limited |
| 2 Olumegbon Road, Ikoyi, Lagos, Nigeria |
| British American Tobacco Marketing Nigeria Limited (80%) |
| North Macedonia, Republic of |
| Blvd. 8-mi SEPTEMVRI No. 18, 1000 Skopje, Republic of North Macedonia |
| TDR SKOPJE DOOEL Skopje |
| Norway |
| Dronning Eufemias gate 42. 0191 Oslo, Norway |
| British American Tobacco Norway AS |
| Pakistan |
| Bun Khurma Chichian Road, Mirpur Azad Jammu & Kashmir, Pakistan |
| Phoenix (Private) Limited (100%) (94.65%)^ |
First Floor, 26-FCC, Syed Maratab Ali Road,
Gulberg IV, Lahore, Pakistan |
| British American Tobacco SAA Services (Private) Ltd |
| Serena Business Complex. Khayaban-e-Suhrwardy, Islamabad, Pakistan |
| Pakistan Tobacco Company Limited (94.65%) |
| Panama |
| Calle 54, Obarrio, PH Twist Tower, Piso 22, Oficina E-22, Corregimiento Bella Vista, Ciudad de Panamá, Panama |
| British American Tobacco Central America S.A. (87.65%) |
| British American Tobacco Panama S.A. |
| Tabacalera Istmeña S.A. |
| Vía Fernández de Córdoba, Corregimiento of Pueblo Nuevo, Panama City, Panama |
| BAT Caribbean, S.A. |
| Papua New Guinea |
| Ashurst Png, Level 11 Mrdc Haus, Cnr Of Musgrave Street And Champion Parade, Port Moresby, National Capital District, Papua New Guinea |
| British American Tobacco (PNG) Limited |
| Rothmans of Pall Mall (P.N.G.) Limited |
| Paraguay |
| Roque Centurion Miranda 1635, AYMAC II, Piso 2, Asunción, Paraguay |
| British American Tobacco Productora de Cigarrillos S.A. |
|
| | | | | | | | | | | | | | | | | | | | | | | |
| BAT Annual Report and Form 20-F 2022 | Strategic Report | | Governance Report | | Financial Statements | | Other Information |
| | | | | | | |
| | | | | | | |
| | | | | | | |
| Financial Statements | | | | | | | |
Group Companies and Undertakings Continued |
| | |
Subsidiary Undertaking continued |
| Peru |
| Av. El Derby N° 055, Torre 3, Oficinas 405-406-407-408, Urb. Lima Polo and Hunt Club, Santiago de Surco, Lima, Peru |
British American Tobacco del Peru Holdings S.A. (98.55%)6 |
| British American Tobacco del Peru, S.A.C. |
| Philippines |
| 31 Tayuman Street, Tonda, Manila, Philippines |
Alhambra Industries Inc. # |
| Poland |
| Aleja Wojska Polskiego 23c, 63-500, Ostrzeszow, Poland |
| CHIC sp. z o.o |
| ESMOKING LIQUIDS SP. Z O.O |
| Krakowiakow 46, 02-255, Warszawa, Poland |
| BAT DBS Poland sp. Z.o.o. |
| Krakowiakow 48, 02-255, Warszawa, Poland |
| British American Tobacco Polska Trading sp. zo.o. |
| Rubiez 46, 61-612, Poznan, Poland |
| eSMOKING INSTITUTE sp.zo |
| ul. IŁŻECKA 26E, 02-135WARSZAWA, Poland |
| Nicoventures Poland sp. Z.o.o. (In Liquidation) |
| Ul. Tytoniowa 16, 16-300, Augustow, Poland |
| British-American Tobacco Polska S.A. |
| Portugal |
| Edificio Amoreiras Square, Rua Carlos Alberto da Mota Pinto 17, 3e A, 1070-313, Amoreiras, Lisboa, Portugal |
| COTAPO Empreendimentos Commerciais e Industriais S.A. |
| Sociedade Unificada de Tabacos Limitada (76.4%) |
| Qatar |
| 61 Al Funduq St., Al Dafna, 8th floor – AL Fardan Office Tower, P.O Box 31316, Doha, Qatar |
| BAT Gulf for Trading LLC |
| P.O. Box 6689, 41 Floor, Tornado Tower, West Bay, Doha, Qatar |
| British American Tobacco Q LLC |
| Réunion |
| 5, Immeuble Cap, Avenue Théodore Drouhet, ZAC Horizon 2000, Le Port, 97420, IIe de la Réunion |
| B.A.T. La Réunion SAS |
| Romania |
| 319 Splaiul Independentei, Sema Parc “City Building”, 1st Floor, 6th Sector, Bucharest, Romania |
| British American Shared Services (Europe) S.R.L. |
| 319 Splaiul Independentei, Sema Parc “City Building”, 6th Floor, 6th Sector, Bucharest, Romania |
| BRITISH American GBS Recruitment S.R.L. |
| Bucharest Business Park, Building A (3rd floor) and Building B2 ( floors 3-4), 1A Bucuresti - Ploiesti (DN1) Road, Sector 1, Bucharest 013681, Romania |
| British American Tobacco (Romania) Trading SRL |
| Ploiesti, 17-19 Laboratorului Street, Prahova County, Romania |
| British-American Tobacco (Romania) Investment S.R.L. |
|
| | |
| Russia |
| 121614 Russia, Moscow, Krylatskaya st., 17, bld. 2, Russia |
| JSC ‘International Tobacco Marketing Services’ |
| 38, 3rd Konnaya Iakhta, Saint Petersburg, 197229, Russia |
JSC ‘British American Tobacco-SPb’ # |
| Rwanda |
| SORAS Building, Boulevard de la Revolution P.O Box 650 Kigali, Rwanda |
| British American Tobacco Rwanda Limited |
| Saint Lucia |
| c/o ADCO Incorporated, 10 Manoel Street, Castries, Saint Lucia |
| Carisma Marketing Services Ltd |
| Pointe Seraphine, Castries, Saint Lucia |
| Rothmans Holdings (Caricom) Ltd. |
| Samoa |
| Vaitele Estate, Vaitele, Samoa |
| British American Tobacco Company (Samoa) Limited |
| Saudi Arabia, Kingdom of |
| 7051 Al Amir Sultan-Al Salamah District, Unit 1302. Jeddah 23525 - 2661, Saudi Arabia |
| BAT Arabia for Trading |
| BAT Saudia for Trading |
| Office Pending |
| Regional HQ of British American Tobacco Middle East - Single Person Company |
| Senegal |
| Almadies, Route Hôtel Méridien en Face Club Med, Dakar, BP 3174, Senegal |
| Tobacco Marketing Consultant TMC S.A.R.L (In Liquidation) |
| Serbia |
| Bulevar Milutina Milankovića 1ž, Belgrade, 11070, Serbia |
| British American Tobacco South – East Europe d.o.o. Beograd |
| Kralja Stefana Provenčanog 209, Vranje, 17500, Serbia |
| British American Tobacco Vranje a.d. Vranje |
| Singapore |
| 15 Senoko Loop, 758168, Singapore |
| British American Tobacco Sales & Marketing Singapore Pte. Ltd. |
| British-American Tobacco (Singapore) Private Limited |
| British-American Tobacco Marketing (Singapore) Private Limited |
| Shenton Way, #33-00 OUE Downtown, 068809, Singapore |
RHL Investments Pte Limited # (In Liquidation) |
| Solomon Islands |
| Kukum Highway, Ranadi, Honiara, Honiara, Solomon Islands |
| Solomon Islands Tobacco Company Limited |
|
| | | | | | | | | | | | | | | | | | | | | | | |
| BAT Annual Report and Form 20-F 2022 | Strategic Report | | Governance Report | | Financial Statements | | Other Information |
| | | | | | | |
| | | | | | | |
| | | | | | | |
| | | | | | | |
|
| | |
| South Africa |
| Waterway House South, 3 Dock Road, V&A Waterfront, Cape Town, Western Cape 8002, South Africa |
| Agrega EEMEA (Pty) Ltd |
| Amalgamated Tobacco Corporation (South Africa) (Pty) Ltd (In Liquidation) |
| American Cigarette Company (Overseas) (Pty) Ltd |
| Benson and Hedges (Pty) Ltd (In Liquidation) |
| British American Shared Services Africa Middle East (Pty) Ltd |
| British American Tobacco East and Southern Africa (Pty) Ltd |
| British American Tobacco GSD (South Africa) (Pty) Ltd |
British American Tobacco Holdings South Africa (Pty) Ltd # |
| British American Tobacco Properties South Africa (Pty) Ltd. |
| British American Tobacco Services South Africa (Pty) Ltd |
| British American Tobacco South Africa (Pty) Ltd |
| Brown & Williamson Tobacco Corporation (Pty) Ltd |
| Business Venture Investments No 216 (Pty) Ltd |
| Carlton Cigarette Company (Pty) Ltd (In Liquidation) |
| John Chapman (Pty) Ltd (In Liquidation) |
| John Player and Sons (Pty) Ltd (In Liquidation) |
| Kentucky Tobacco Corporation (Pty) Ltd (In Liquidation) |
| Martins of London (Pty) Ltd (In Liquidation) |
| Rembrandt Tobacco Corporation (Overseas) (Pty) Ltd (In Liquidation) |
| Riggio Tobacco Corporation of New York (Pty) Ltd (In Liquidation) |
| Rothmans of Pall Mall London (Pty) Ltd (In Liquidation) |
| St Regis Tobacco Corporation (Pty) Ltd |
| Thomas Bear’s Son and Company (Pty) Ltd (In Liquidation) |
| Tobacco Research and Development Institute (Pty) Ltd |
| Twisp (Pty) Ltd |
| WD and HO. Wills (Pty) Ltd (In Liquidation) |
| Westminster Tobacco Company (Cape Town and London) (Pty) Ltd (In Liquidation) |
| Winfield Tobacco Corporation (Pty) Ltd (In Liquidation) |
| Winston Tobacco Company (Pty) Ltd (In Liquidation) |
| Spain |
| Torreo Espacio, Paseo de la Castellana, 259D, 28046 Madrid, Spain |
| British American Tobacco España, S.A. |
| Sri Lanka |
| 178 Srimath Ramanathan Mawatha, Colombo, 15, Sri Lanka |
| Ceylon Tobacco Company Plc (84.13%) |
| Sudan |
| Byblos Tower, Al-Muk Nemer Street, Postal Code 11111, P.O Box 1381, Khartoum, Sudan |
| Blue Nile Cigarette Company Limited |
| Swaziland |
| 213 King Mswati III Avenue West, Matsapha Industrial Site, Matsapha, Swaziland |
| British American Tobacco Swaziland (Pty) Limited |
|
| | |
| Sweden |
| Hyllie Boulevard 32, 215 32 Malmö, Sweden |
| Niconovum AB |
| Stenåldersgatan 23, 213 76 Malmö, Sweden |
| Fiedler & Lundgren AB |
| Västra Trädgårdsgatan 15, 11153 Stockholm, Sweden |
| British American Tobacco Sweden AB |
| Switzerland |
| c/o Bright Law AG, Bundesplatz 9, 6302 Zug, Switzerland |
| British American Tobacco International Limited (In Liquidation) |
| c/o British American Tobacco Switzerland S.A., Route de France 17, 2926 Boncourt, Switzerland |
| American-Cigarette Company (Overseas) Limited |
| BAT Switzerland Vending SA |
| Rothmans of Pall Mall Limited |
| c/o NBA Fiduciaire S.A., Route de la Glâne 107, 1752 Villars-sur-Glâne, Switzerland |
| Intertab S.A. (50%) |
| Route de France 17, 2926 Boncourt, Switzerland |
| British American Tobacco Switzerland S.A. |
| Nicoventures Communications (Switzerland) SA |
| Tanzania |
| Acacia Estate Building, Kinondoni Road, P.O Box 288, Dar es Salaam, Tanzania |
| BAT Distribution Tanzania Limited |
| British American Tobacco (Tanzania) Limited (In Liquidation) |
| International Cigarette Distributors Limited (99%) (In Liquidation) |
| Zanzibar Distribution Company Limited (99%) (In Liquidation) |
| Trinidad and Tobago |
| Corner Eastern Main Road and Mt. D’or Road, Champs Fleurs, Trinidad and Tobago |
| The West Indian Tobacco Company Limited (50.13%) |
| Turkey |
| Orjin Maslak İş Merkezi, Eski Büyükdere Caddesi, Kat 9-10, Maslak, Sarıyer, İstanbul |
| British American Tobacco Tütün Mamulleri Sanayi ve Ticaret Anonim Sirketi |
| Uganda |
| 10th Floor, Lotis Towers, Plot 16 Mackinnon Road, Nakasero, Kampala, Uganda |
| British American Tobacco Uganda Limited (90%) |
| Ukraine |
| 13-15 Bolsunovska Str, Kyiv, 01014, Ukraine |
LLC “British American Tobacco Sales and Marketing Ukraine”1 |
| 21 Nezalezhnosti Str, Chernihiv Oblast, Prylucky, 17502, Ukraine |
| PJSC “A/T B.A.T. – Prilucky Tobacco Company” |
|
| | | | | | | | | | | | | | | | | | | | | | | |
| BAT Annual Report and Form 20-F 2022 | Strategic Report | | Governance Report | | Financial Statements | | Other Information |
| | | | | | | |
| | | | | | | |
| | | | | | | |
| Financial Statements | | | | | | | |
Group Companies and Undertakings Continued |
| | |
Subsidiary Undertaking continued |
| United Arab Emirates |
| 2302-08, Smart Heights, Al Thanyah First, Dubai, United Arab Emirates |
| BAT Middle East For Trading LLC |
| Jumeirah Business Centre 3, 37th Floor, Jumeirah Lake Towers, Dubai, P.O. Box 337222, United Arab Emirates |
| British American Tobacco GCC DMCC |
| Jumeirah Business Centre 3, 38th Floor, Jumeirah Lake Towers, Dubai, P.O. Box 337222, United Arab Emirates |
| British American Tobacco ME DMCC |
| Unit # 2680, DMCC Business Center- Level # 1, Jewellery & Gemplex 3, Dubai, United Arab Emirates |
| British American Tobacco International DMCC |
| United Kingdom |
| 212-218 Upper Newtownards Road, Belfast, BT4 3ET, Northern Ireland |
| Murray, Sons & Company, Limited |
| 7 More London, Riverside, London, SE1 2RT, United Kingdom |
| Ryesekks P.L.C. (50%) (In Liquidation) |
| Building 7, Chiswick Business Park, 566 Chiswick High Road, London, W4 5YG, United Kingdom |
| 10 Motives Limited |
| British American Tobacco UK Limited |
| Nicoventures Retail (UK) Limited |
| Ten Motives Limited |
| Globe House, 1 Water Street, London, WC2R 3LA, United Kingdom |
| Advanced Technologies (Cambridge) Limited |
| Allen & Ginter (UK) Limited |
| B.A.T (U.K. and Export) Limited |
| B.A.T Cambodia (Investments) Limited |
| B.A.T Far East Holding Limited |
| B.A.T Far East Leaf Limited |
| B.A.T Services Limited |
| B.A.T Uzbekistan (Investments) Limited |
| B.A.T Vietnam Limited |
| B.A.T. (Westminster House) Limited |
| B.A.T. China Limited |
| BAT Finance COP Limited |
| BATIF Dollar Limited |
| BATUS Limited |
| Big Ben Tobacco Company Limited |
| British American Shared Services (GSD) Limited |
| British American Shared Services Limited |
| British American Tobacco (AIT) Limited |
| British American Tobacco (GLP) Limited |
| British American Tobacco (Investments) Limited |
| British American Tobacco (Philippines) Limited |
| British American Tobacco (Serbia) Limited |
| British American Tobacco (South America) Limited |
| British American Tobacco China Holdings Limited |
| British American Tobacco Exports Limited |
| | |
| British American Tobacco Georgia Limited |
| British American Tobacco Global Travel Retail Limited |
| British American Tobacco International Holdings (UK) Limited |
| British American Tobacco Investments (Central & Eastern Europe) Limited |
| British American Tobacco Italy Investments Limited |
| British American Tobacco Italy Limited (In Liquidation) |
| British American Tobacco Korea (Investments) Limited |
| British American Tobacco Malaysia (Investments) Limited (In Liquidation) |
| British American Tobacco Peru Holdings Limited |
British American Tobacco UK Pension Fund Trustee Limited13 |
| British-American Tobacco (Mauritius) p.l.c. |
Carreras Rothmans Limited # |
| Chelwood Trading & Investment Company Limited |
| East African Tobacco Company (U.K.) Limited (In Liquidation) |
| KBio Holdings Limited |
| Lord Extra Limited |
| Myddleton Investment Company Limited |
| Nicovations Limited |
| Nicoventures Holdings Limited |
| Nicoventures Trading Limited |
| Powhattan Limited |
| Precis (2396) Limited |
| Ridirectors Limited |
| Rothmans Exports Limited |
| Rothmans International Limited |
| Rothmans International Services Limited (In Liquidation) |
| Rothmans International Tobacco (UK) Limited |
| Rothmans of Pall Mall (Overseas) Limited (In Liquidation) |
| Rothmans Trading Limited (In Liquidation) |
| Ryservs (1995) Limited |
| Ryservs (No.3) Limited |
| Tobacco Exporters International Limited |
| Tobacco Marketing Consultants Limited |
| Venezuela Property Company Limited |
| Westanley Trading & Investment Company Limited |
| Westminster Tobacco Company Limited |
| Globe House, 2 Milford Lane, London, WC2R 3LN, United Kingdom |
| World Investment Company Limited (In Liquidation) |
| Globe House, 4 Temple Place, London, WC2R 2PG, United Kingdom |
| Amalgamated Tobacco Company Limited |
| American Cigarette Company (Overseas) Limited |
| Ardath Tobacco Company Limited |
| B.A.T Additional Retirement Benefit Scheme Trustee Limited |
| B.A.T Industries p.l.c. |
| B.A.T. International Finance p.l.c. * |
| B.A.T. Operating Finance Limited |
| BATLaw Limited |
| BATMark Limited * |
| Benson & Hedges (Overseas) Limited |
| British American Global Shared Services Limited |
|
| | | | | | | | | | | | | | | | | | | | | | | |
| BAT Annual Report and Form 20-F 2022 | Strategic Report | | Governance Report | | Financial Statements | | Other Information |
| | | | | | | |
| | | | | | | |
| | | | | | | |
| | | | | | | |
|
| | |
| British American Tobacco (1998) Limited * |
| British American Tobacco (2009 PCA) Limited |
British American Tobacco (2009) Limited # |
| British American Tobacco (2012) Limited |
| British American Tobacco (Brands) Limited |
| British American Tobacco (Corby) Limited |
| British American Tobacco (NGP) Limited |
| British American Tobacco Healthcare Trustee Limited |
| British American Tobacco Taiwan Logistics Limited |
| British-American Tobacco (Holdings) Limited |
| Brown & Williamson Tobacco Corporation (Export) Limited |
| Btomorrow Ventures Limited |
| Carreras Limited |
| Courtleigh of London Limited |
| Dunhill Tobacco of London Limited |
| John Sinclair Limited |
| Louisville Securities Limited |
| Moorgate Tobacco Co. Limited |
| Peter Jackson (Overseas) Limited |
| Precis (1789) Limited |
Precis (1814) Limited # |
| Rothmans International Enterprises Limited |
| Rothmans of Pall Mall Limited (In Liquidation) |
| Senior Service (Overseas) Limited |
| South Western Nominees Limited (In Liquidation) |
| The London Tobacco Company Limited |
| The Water Street Collective Limited |
| Tobacco Insurance Company Limited (In Liquidation) |
| Weston (2009) Limited |
| Weston Investment Company Limited |
| United States |
| 251 Little Falls Drive, Wilmington, DE 19808, United States |
| B.A.T Capital Corporation |
| BATUS Holdings Inc. |
| BATUS Japan, Inc. |
| BATUS Retail Services, Inc. |
| British American Tobacco (Brands), Inc. |
| Brown & Williamson Holdings, Inc. |
| BT DE Investments Inc. |
BTI 2014 LLC1 |
| BTomorrow Innovation Hub Inc. |
| Imasco Holdings Group, Inc. |
| Imasco Holdings, Inc. |
| ITL (USA) Limited |
| Louisville Corporate Services, Inc. |
| Nicoventures U.S. Limited |
|
| | |
| 3700 Airpark Dr., Owensboro, KY 42301, United States |
| KBio Inc. |
| 401 N. Main Street, Winston-Salem, NC 27101, United States |
| Conwood Holdings, Inc. |
EXP Homes, LLC1 |
Lorillard Licensing Company LLC1 |
Lorillard, LLC1 |
| Modoral Brands Inc. |
| Northern Brands International, Inc. |
| R. J. Reynolds Global Products, Inc. |
| R. J. Reynolds Tobacco Company |
| R. J. Reynolds Tobacco International, Inc. |
| R. J. Reynolds Vapor Company |
| R.J. Reynolds Tobacco Co. |
| R.J. Reynolds Tobacco Holdings, Inc. |
| RAI Innovations Company |
| RAI International, Inc. |
| RAI Services Company |
| RAI Strategic Holdings, Inc. |
| Reynolds American Inc. |
| Reynolds Brands Inc. |
| Reynolds Marketing Services Company |
| Reynolds Technologies, Inc. |
| RJR Realty Relocation Services, Inc. |
RJR Vapor Co., LLC1 |
Rosswil LLC1 |
| S.F. Imports, Inc. |
| Santa Fe Natural Tobacco Company, Inc. |
| Spot You More, Inc. |
The Water Street Collective LLC1 |
Vuse Stores LLC1 |
| 5106 Tradeport Dr., Memphis, TN 38141, United States |
American Snuff Company, LLC1 |
| CSC-Lawyers Incorporating Service, 2710 Gateway Oaks Drive, Suite 150N, Sacramento CA 95833-3505, United States |
| Genstar Pacific Corporation |
| Farmers Bank Building, Suite 1402, 301 N. Market Street, Wilmington, DE 19801, United States |
| Reynolds Finance Company |
| Uruguay |
| Juncal 1392, Montevideo, Uruguay |
| Kellian S.A. |
| Uzbekistan |
| 77 Minor Passage, Tashkent, 100084, Uzbekistan |
| JSC JV “UZBAT A.O.” (97.38%) |
|
| | | | | | | | | | | | | | | | | | | | | | | |
| BAT Annual Report and Form 20-F 2022 | Strategic Report | | Governance Report | | Financial Statements | | Other Information |
| | | | | | | |
| | | | | | | |
| | | | | | | |
| Financial Statements | | | | | | | |
Group Companies and Undertakings Continued |
| | |
Subsidiary Undertaking continued |
| Venezuela |
| Avenida Francisco de Miranda, Edificio Bigott, Los Ruices, Caracas – Estado Miranda, 1010, Venezuela |
| Agrobigott, C.A. |
| Compania Anonima Cigarrera Bigott Sucesores |
| Distribuidora Bigott, C.A. |
| Avenida Francisco de Miranda, Torre Regelfall, Municipio Chacao, Estado, Miranda, Caracas, Venezuela |
| Proyectos de Inversion BAT 1902 C.A. |
| Registro Mecantil Primero de la Circunscripción, Judical des Distrito, Capital y Estado, Miranda, Venezuela |
| Agrega de Venezuela, Agreven, C.A. (50%) (In Liquidation) |
| Vietnam |
| 20/F MPlaza Saigon, 39 Le Duan Street, Ben Nghe ward, District 1, Ho Chi Minh City, Vietnam |
East Asia Area Services Company Limited8 |
| Area 8, Long Binh Ward, Bien Hoa City, Dong Nai Province, Vietnam |
| British American Tobacco – Vinataba (JV) (70%) |
| Lot 45C/I, Road #7, Vinh Loc Industrial Park, Binh Chanh District, Ho Chi Minh City, Vietnam |
| VINA-BAT Joint Venture Company Limited (49%) |
| Zambia |
| Plot No. PH1 IND & 53 & 54, LS-MFEZ, Chifwema Road, Lusaka, Zambia |
| British American Tobacco (Zambia) plc (75%) |
| Zimbabwe |
| Manchester Road 1, Southerton, Harare, Zimbabwe |
| American-Cigarette Company (Overseas) (Private) Ltd |
| British American Tobacco Zimbabwe (Holdings) Limited (42.98%) |
| Rothmans Limited |
|
|
|
| | |
Associated Undertakings and Joint Ventures |
| Canada |
| 2800 Park Place, 666 Burrard Street, Vancouver, BC, V6C 2Z7, Canada |
Charlotte's Web Holdings, Inc. 16 |
| 35 English Drive, Moncton, New Brunswick, E1E 3X3, Canada |
| Organigram Holdings Inc. (19.43%) |
| France |
| 88 Avenue des Ternes, 75017, Paris, France |
Alcome SAS (24%)15 |
| Germany |
| Jägerstraße 28-31, 10117 Berlin, Germany |
Sanity Group GmbH (16.3%)12 |
| Greece |
| Filonos 107-109, 185 35, Piraeus, Greece |
Alternative Management of Tobacco Products Filters Societe Anonyme (17.5%)15 |
| Hungary |
| H-6800 Hódmezóvásárhely, Erzsébeti út 5/b, Hungary |
| Országos Dohányboltellátó Korlátolt Felelosségu Társaság (49%) |
|
| | |
| India |
| Azamabad, Andhra Pradesh, Hyderabad, 500 020, India |
VST Industries Limited (32.16%)13 |
| Virginia House, 37, J.L. Nehru Road, Kolkata, 700071, India |
ITC Limited (29.16%)13 |
| Italy |
| Via Messina, 38 – 20154 Milano, Italy |
Erion Care (25%) 9 |
| Nepal |
| Shree Bal Sadan, Gha 2-513, Kantipath, Kathmandu, Nepal |
| Surya Nepal Pvt. Limited (61%) (19.79%) ^ |
| United Kingdom |
| 4a Station Parade, Uxbridge Road, London, W5 3LD, United Kingdom |
AYR Limited (13.14%)14 |
| United States |
| 12 Timber Creek Land, Newark, Delaware, 19711, United States |
Steady State LLC (5.76%) 5 |
| 6160, Lusk Blvd, Suite C105, San Diego, CA, CA 92121, United States |
ZabBio, Inc (49%)7 |
| Uzbekistan |
| Gulobod Village, Samarkand Region, 140100, Uzbekistan |
| FE "Samfruit" JSC (45.4%) |
| Yemen |
| P.O. Box 14, Sanna, Yemen |
| Kamaran Industry and Investment Company (31%) |
| P.O. Box 5302, Hoban, Taiz, Yemen |
| United Industries Company Limited (32%) |
|
|
|
|
|
| | |
Joint Operations |
| Hong Kong |
| 29/F, Oxford House, 979 King’s Road, Taikoo Place, Quarry Bay, Hong Kong |
| CTBAT International Co. Limited (50%) |
Notes:
1. Ownership held in Membership Interest.
2. Ownership held in the class of Series F and 2nd Preferred shares.
3. Ownership held in the class of A shares (50%) and class of B shares (100%).
4. Ownership held in class of A shares and B shares.
5. Ownership held solely in class of Preference shares.
6. Ownership held in class of Ordinary and Investment Shares.
7. Ownership held in 49% share capital and 39% voting rights.
8. Ownership held in Registered Capital.
9. Ownership held in Voting shares.
10 .Ownership held in Equity Units.
11. Company limited by guarantee.
12 .Ownership held in Series B Preferred shares.
13. 31 March year-end.
14. 31 May year-end.
15. Accounted for as an investment at fair value through profit and loss.
16. Refer to Note 14, Investments in associates and joint ventures.
This page is intentionally left blank BAT Annual Report and Form 20-F 2022 Strategic Report Governance Report Financial Statements Other Information 311
This page is intentionally left blank BAT Annual Report and Form 20-F 2022 Strategic Report Governance Report Financial Statements Other Information Financial Statements 312
This page is intentionally left blank BAT Annual Report and Form 20-F 2022 Strategic Report Governance Report Financial Statements Other Information 313
This page is intentionally left blank BAT Annual Report and Form 20-F 2022 Strategic Report Governance Report Financial Statements Other Information Financial Statements 314
This page is intentionally left blank BAT Annual Report and Form 20-F 2022 Strategic Report Governance Report Financial Statements Other Information 315
This page is intentionally left blank BAT Annual Report and Form 20-F 2022 Strategic Report Governance Report Financial Statements Other Information Financial Statements 316
This page is intentionally left blank BAT Annual Report and Form 20-F 2022 Strategic Report Governance Report Financial Statements Other Information 317
This page is intentionally left blank BAT Annual Report and Form 20-F 2022 Strategic Report Governance Report Financial Statements Other Information Financial Statements 318
Additional Disclosures Information on the Group .......................................................................................................................................................................................................................…. 320 Selected Financial Information ............................................................................................................................................................................................................…. 321 Non-Financial Measures ...............................................................................................................................................................................................................….......…. 322 Non-GAAP Measures ...............................................................................................................................................................................................................….............…. 324 Employees ...............................................................................................................................................................................................................….............…......................... 337 Additional Disclosures on Liquidity and Capital Resources ..................................................................................................................................................... 338 Summary of Group Risk Factors .............................................................................................................................................................................................................. 340 Group Risk Factors ...............................................................................................................................................................................................................….............…....... 341 Regulation of the Group’s Business ...................................................................................................................................................................................................… 362 Material Contracts ...............................................................................................................................................................................................................….............…....... 367 Property, Plant and Equipment ............................................................................................................................................................................................................... 369 Raw Materials ...............................................................................................................................................................................................................….............…................. 369 U.S. Corporate Governance Practices .................................................................................................................................................................................................. 370 Controls and Procedures ...............................................................................................................................................................................................................…......…. 371 Statements Regarding Competitive Position ................................................................................................................................................................................. 371 Directors’ Report Information ...............................................................................................................................................................................................................… 372 Cautionary Statement ...............................................................................................................................................................................................................….............… 373 Shareholder Information Share Prices and Listings ...............................................................................................................................................................................................................….......... 374 Dividends ...............................................................................................................................................................................................................….............…............................ 375 Shareholder Taxation Information ......................................................................................................................................................................................................... 377 Share Capital and Security Ownership ............................................................................................................................................................................................... 381 Articles of Association ...............................................................................................................................................................................................................….............… 383 Purchase of Shares ...............................................................................................................................................................................................................….............…....... 386 Group Employee Trust ...............................................................................................................................................................................................................…................ 388 American Depositary Shares ...............................................................................................................................................................................................................….. 389 Shareholding Administration and Services ....................................................................................................................................................................................... 390 Exhibits ...............................................................................................................................................................................................................….............…................................ 391 Other Information Glossary ...............................................................................................................................................................................................................….............…............................... 394 Cross-Reference to Form-20F ............................................................................................................................................................................................................…. 395 BAT Annual Report and Form 20-F 2022 Strategic Report Governance Report Financial Statements Other Information Other Information Additional Disclosures 319
Overview British American Tobacco p.l.c. is the parent holding company of the Group, a leading consumer-centric, multi-category consumer goods company that provides tobacco and nicotine products to millions of consumers around the world. According to the Group’s internal estimates, the BAT Group is a market leader by volume in more than 50 markets. The Group, excluding the Group’s associated undertakings, is organised into four regions: – the United States of America (Reynolds American Inc.); – Asia-Pacific and the Middle East (APME); – Americas and Sub-Saharan Africa (AmSSA); and – Europe. From 2023, the Group will reduce to three regions, being the United States, Americas & Europe (AME) and Asia-Pacific, Middle East & Africa (APMEA), as discussed on page 209. The Group’s range of combustible products covers all segments, from value-for-money to premium with a portfolio of international, regional and local tobacco brands to meet a broad array of adult tobacco consumer preferences wherever the Group operates. The Group has also built a portfolio of reduced risk*† tobacco and nicotine products – including Vapour products, Tobacco Heating Products (THPs) and Modern Oral products, which are collectively termed the New Categories, as well as Traditional Oral products. The Group manages a globally-integrated supply chain and its products are distributed to retail outlets worldwide. History and development of BAT The Group has had a significant global presence in the tobacco industry for over 100 years. BAT Ltd. was incorporated in 1902, when the Imperial Tobacco Company and the American Tobacco Company agreed to form a joint venture company. BAT Ltd. inherited companies and quickly expanded into major markets, including India and Ceylon, Egypt, Malaya, Northern Europe and East Africa. In 1927, BAT Ltd. expanded into the U.S. market through its acquisition of B&W. During the 1960s, 1970s and 1980s, the Group diversified its business under the umbrella of B.A.T Industries p.l.c., with acquisitions in the paper, cosmetics, retail and financial services industries, among others. Various business reorganisations followed as the business was eventually refocused on the Group’s core cigarette, cigars and tobacco products businesses with BAT becoming a separately listed entity on the LSE in 1998. The following is a summary of the significant mergers, acquisitions and disposals undertaken since 1998: – 1999 – global merger with Rothmans International; – 2000 – acquisition of Imperial Tobacco Canada; – 2003 – acquisition of Ente Tabacchi Italiani S.p.A., Italy’s state- owned tobacco company, Tabacalera Nacional in Peru and Duvanska Industrija Vranje in Serbia; – 2004 - the U.S. assets, liabilities and operations, other than certain specified assets and liabilities, of BAT’s wholly-owned subsidiary, B&W, were combined with RJR Tobacco Company to form Reynolds American Inc. As a result of the B&W business combination, B&W acquired beneficial ownership of approximately 42% of the Reynolds American Inc. shares; – 2008 – acquisition of Tekel, the Turkish state-owned tobacco company and the cigarette and snus business of Skandinavisk Tobakskompagni A/S; – 2009 - acquisition of an effective 99% interest in Bentoel in Indonesia; – 2011 – acquisition of Protabaco in Colombia; – 2012 – acquisition of CN Creative Limited in the UK; – 2013 – entered into joint operations in China; – 2015 – acquisition of the shares not already owned by the Group in Souza Cruz in Brazil, the acquisition of the CHIC Group in Poland, the acquisition of TDR d.o.o., a cigarette manufacturer in Central Europe. Also in 2015, the Group increased its investment in Reynolds American Inc. by US$4.7 billion to maintain the Group’s approximate 42% equity position following Reynolds American Inc.’s purchase of Lorillard Inc.; – 2016 – acquisition of Ten Motives in the UK; – 2017 – acquisition of the remaining 57.8% of Reynolds American Inc. the Group did not already own. Following completion of the acquisition, Reynolds American Inc. became an indirect, wholly- owned subsidiary of BAT and is no longer a publicly-held corporation. In 2017, the Group also acquired certain tobacco assets from Bulgartabac Holding AD in Bulgaria and Fabrika Duhana Sarajevo (FDS) in Bosnia, acquired Winnington Holdings AB in Sweden and acquired certain assets from Must Have Limited in the UK, including the electronic cigarette brand ViP; – 2018 – acquisition of Quantus Beteiligungs-und Beratungsgesellschaft mbH in Germany; – 2019 – acquisition of Twisp Proprietary Limited in South Africa and 60% of VapeWild Holdings LLC in the U.S.; – 2020 – acquisition of the nicotine pouch product assets of Dryft Sciences, LLC (Dryft) in the U.S. and the acquisition of Eastern Tobacco Company for Trading in Saudi Arabia; – 2021 – entry into a strategic research and product development collaboration agreement with Organigram Inc., a licensed producer of cannabis and cannabis-derived products in Canada and a wholly-owned subsidiary of publicly-traded Organigram Holdings Inc., and acquisition of a 19.9% equity stake in Organigram Holdings Inc.. Also in 2021, the Group disposed of its Iranian subsidiary, BAT Pars Company PJSC; and – 2022 – acquisition of a 16% equity stake in Sanity Group GmbH, a German cannabis company. In 2022, the Group also made an investment, via a convertible debenture in the amount of c.£48 million, into Charlotte’s Web Holdings, Inc., a U.S.-based hemp extract wellness products business. British American Tobacco p.l.c. was incorporated in July 1997 under the laws of England and Wales as a public limited company and is domiciled in the United Kingdom. Seasonality The Group’s business segments are not significantly affected by seasonality although in certain markets cigarette consumption trends rise during summer months due to longer daylight time and tourism. Patents and trademarks Our trademarks, which include the brand names under which our products are sold, are key assets which we consider, in the aggregate, to be important to the business as a whole. As well as protecting our brand names by way of trademark registration, we also protect our innovations by means of patents and designs in key global jurisdictions. Board oversight of M&A transactions The Company’s Board has strategic oversight of significant M&A transactions (determined by value or strategic nature of transaction), which are referred to it for noting under the Group Statement of Delegated Authorities (SoDA). Other M&A transactions are referred for strategic oversight to the Management Board or other applicable senior forum or persons, under the Group SoDA. Those referral requirements under the Group SoDA apply alongside any requirement for corporate approval of M&A transactions by or within a Group company. Notes: * Based on the weight of evidence and assuming a complete switch from cigarette smoking. These products are not risk free and are addictive. † Our Vapour product Vuse (including Alto, Solo, Ciro and Vibe), and certain products, including Velo, Grizzly, Kodiak, and Camel Snus, which are sold in the U.S., are subject to FDA regulation and no reduced-risk claims will be made as to these products without agency clearance. BAT Annual Report and Form 20-F 2022 Strategic Report Governance Report Financial Statements Other Information Other Information Information on the Group 320
This information set out below has been derived from, in part, the audited consolidated financial statements of the Group commencing on page 196. This selected financial information should be read in conjunction with the consolidated financial statements and the Strategic Report. As of and for the Year Ended 31 December All items shown in £m except per share information 2022 2021 2020 2019 2018 Income statement data Revenue2 27,655 25,684 25,776 25,877 24,492 Raw materials and consumables used (4,781) (4,542) (4,583) (4,599) (4,664) Changes in inventories of finished goods and work in progress 227 160 445 162 114 Employee benefit costs (2,972) (2,717) (2,744) (3,221) (3,005) Depreciation, amortisation and impairment costs (1,305) (1,076) (1,450) (1,512) (1,038) Other operating income 722 196 188 163 85 Loss on reclassification from amortised cost to fair value (5) (3) (3) (3) (3) Other operating expenses (9,018) (7,468) (7,667) (7,851) (6,668) Profit from operations 10,523 10,234 9,962 9,016 9,313 Net finance costs (1,641) (1,486) (1,745) (1,602) (1,381) Share of post-tax results of associates and joint ventures 442 415 455 498 419 Profit before taxation 9,324 9,163 8,672 7,912 8,351 Taxation on ordinary activities (2,478) (2,189) (2,108) (2,063) (2,141) Profit for the year 6,846 6,974 6,564 5,849 6,210 Per share data Basic weighted average number of ordinary shares, in millions 2,256 2,287 2,286 2,284 2,285 Diluted weighted average number of ordinary shares, in millions 2,267 2,297 2,295 2,291 2,292 Earnings per share-basic (pence) 293.3p 296.9p 280.0p 249.7p 264.0p Earnings per share-diluted (pence) 291.9p 295.6p 278.9p 249.0p 263.2p Dividends per share (pence)3 230.9p 217.8p 215.6p 210.4p 203.0p Balance sheet data Assets Non-current assets 138,137 124,558 124,078 127,731 133,687 Current assets 15,409 12,807 13,612 13,274 12,655 Total assets 153,546 137,365 137,690 141,005 146,342 Liabilities Non-current liabilities 59,983 54,820 59,257 58,022 64,325 Current liabilities 17,853 15,144 15,478 18,823 16,329 Total borrowings 43,139 39,658 43,968 45,366 47,509 Equity Share capital 614 614 614 614 614 Total equity 75,710 67,401 62,955 64,160 65,688 Cash flow data Net cash generated from operating activities 10,394 9,717 9,786 8,996 10,295 Net cash used in investing activities (705) (1,140) (783) (639) (1,021) Net cash used in financing activities (8,878) (8,749) (7,897) (8,593) (9,630) Notes: 1. All of the information above is in respect of continuing operations, revised for the fully retrospective adoption of IFRS 15. 2. Revenue is net of duty, excise and other taxes of £38,527 million, £38,595 million, £39,172 million, £39,826 million and £38,553 million for the years ended 31 December 2022, 2021, 2020, 2019, and 2018, respectively. 3. In February 2023, the BAT Directors declared an interim dividend of 230.9 pence per share for the year ended 31 December 2022, payable in four equal instalments of 57.72 pence per ordinary share. The interim dividend will be paid to BAT shareholders in May 2023, August 2023, November 2023 and February 2024. The equivalent quarterly dividends receivable by holders of ADSs in US dollars will be calculated based on the exchange rate on the applicable payment date. BAT Annual Report and Form 20-F 2022 Strategic Report Governance Report Financial Statements Other Information Selected Financial Information 321
Volume Volume is defined as the number of units sold. Units may vary between categories. This can be summarised for the principal metrics as follows: – Factory made cigarettes (FMC) – sticks, regardless of weight or dimensions; – Roll-Your-Own/Make-Your-Own – kilos, converted to a stick equivalent based upon 0.8 grams (per stick equivalent) for Roll-Your-Own and between 0.5 and 0.7 grams (per stick equivalent) for Make-Your-Own; – Traditional oral – pouches (being 1:1 conversion to stick equivalent) and kilos, converted to a stick equivalent based upon 2.8 grams (per stick equivalent) for Moist Snuff, 2.0 grams (per stick equivalent) for Dry Snuff and 7.1 grams (per stick equivalent) for other oral; – Modern Oral – pouches, being 1:1 conversion to stick equivalent; – Tobacco Heat sticks – sticks, being 1:1 conversion to stick equivalent; and – Vapour – pods and 10 millilitre bottles. There is no conversion to a stick equivalent. Volume is recognised in line with IFRS 15 Revenue from Contracts with Customers, based upon transfer of control. It is assumed that there is no material difference, in line with the Group’s recognition of revenue, between the transfer of control and shipment date. Volume is used by management and investors to assess the relative performance of the Group and its brands within categories, given volume is a principal determinant of revenue. Volume Share Volume share is the number of units bought by consumers of a specific brand or combination of brands, as a proportion of the total units bought by consumers in the industry, category or other sub-categorisation. Sub-categories include, but are not limited to, the total nicotine category, Modern Oral, Vapour, Traditional Oral, total oral or cigarette. Except when referencing particular markets, volume share is based on our key markets (representing around 70% of the Group’s cigarette and THP volume). Where possible, the Group utilises data provided by third-party organisations, including AC Nielsen, based upon retail audit of sales to consumers. In certain markets, where such data is not available, other measures are employed which assess volume share based upon other movements within the supply chain, such as sales to retailers. This may depend on the provision of data to the industry by the customers including distributors/wholesalers. Volume share is used by management to assess the relative performance to the Group and its brands against the performance of its competitors in the categories and geographies in which the Group operates. This measure is also useful to understand the Group’s performance when seeking to grow scale within a market or category from which future financial returns can be realised. The Group’s management believes that this measure is useful to investors to understand the relative performance of the Group and its brands against the performance of its competitors in the categories and geographies in which the Group operates. Volume share in each year compares the average volume share in the year with the average volume share in the prior year. This is a more robust measure of performance, removing short-term volatility that may arise at a point in time. However, in certain circumstances, related to periods of introduction to a market, in order to illustrate the latest performance, data may be provided as at the end of the period rather than the average in that period. In these instances the Group states these are at a specific date (for instance, December 2022). Value Share Value share is the retail value of units bought by consumers of a particular brand or combination of brands, as a proportion of the total retail value of units bought by consumers in the industry, category or other sub-categorisation in discussion. Except when referencing particular markets, value share is based on our key markets (representing around 80% of the Group’s cigarette and THP value). Where possible, the Group utilises data provided by third-party organisations, including AC Nielsen, based upon retail audit of sales to consumers. In certain markets, where such data is not available, other measures are employed which assess value share based upon other movements within the supply chain, such as sales to retailers. This may depend on the provision of data to the industry by the customers (including distributors and wholesalers). Value share is used by management to assess the relative performance of the Group and its brands against the performance of its competitors in the categories and geographies in which the Group operates, specifically indicating the Group’s ability to realise value relative to the market. The measure is particularly useful when the Group’s products and/or the relevant category in the market in which they are sold has developed or achieved scale from which value can be realised. The Group’s management believes that this measure is useful to investors to apprehend the relative performance of the Group and its brands against the performance of its competitors in the categories and geographies in which the Group operates, specifically indicating the Group’s ability to realise value relative to the market. Value share in each year compares the average value share in the year with the average value share in the prior period. This is a more robust measure of performance, removing short-term volatility that may arise at a point of time. However, in certain circumstances, related to periods of introduction to a market, in order to illustrate the latest performance, data may be provided that is as at the end of the period rather than the average in that period. In these instances the Group states these are at a specific date (for instance, December 2022). BAT Annual Report and Form 20-F 2022 Strategic Report Governance Report Financial Statements Other Information Other Information Non-Financial Measures 322
Price Mix Price mix is a term used by management and investors to explain the movement in revenue between periods. Revenue is affected by the volume (how many units are sold) and the value (how much is each unit sold for). Price mix is used to explain the value component of the sales as the Group sells each unit for a value (price) but may also achieve a movement in revenue due to the relative proportions of higher value volume sold compared to lower value volume sold (mix). This term is used to explain the Group’s relative performance between periods only. It is calculated as the difference between the movement in revenue (between periods) and volume (between periods). For instance, the decline in combustibles revenue (excluding translational foreign exchange movements) of 0.6% in 2022, with a decline in combustibles volume of 5.2% in 2022, leads to a price mix of 4.6% in 2022. No assumptions underlie this metric as it utilises the Group’s own data. Non-Combustible Consumers The number of consumers of Non-Combustible products is defined as the estimated number of Legal Age (minimum 18 years) consumers of the Group’s Non-Combustible products. In markets where regular consumer tracking is in place, this estimate is obtained from adult consumer tracking studies conducted by third parties (including Kantar). In markets where regular consumer tracking is not in place, the number of consumers of Non-Combustible products is derived from volume sales of consumables and devices in such markets, using consumption patterns obtained from other similar markets with consumer tracking (utilising studies conducted by third parties including Kantar). The number of Non-Combustible products consumers is used by management to assess the number of consumers regularly using the Group’s New Categories products as the increase in Non-Combustible products is a key pillar of the Group’s ESG Ambition and is integral to the sustainability of our business. The Group’s management believes that this measure is useful to investors given the Group’s ESG ambition and alignment to the sustainability of the business with respect to the Non-Combustibles portfolio. % of farms monitored for child labour; % of farms with incidents of child labour identified; Number of child labour incidents identified; % reported as resolved by end of the growing season Data in relation to our contracted farmers is collected by BAT field technicians (FTs) who visit our contracted farmers approximately once a month during the growing season. Details of each visit are recorded in our Farmer Sustainability Management (FSM) digital app by the FTs and are formally acknowledged by the farmer. If any child labour case is identified, it is reported in the system and treated as a critical prompt action. For this to be closed, it is followed by an unannounced visit within 14 days to observe whether this is repeated and an agreed remediation plan agreed with the farmer. The remediation plan varies from case to case, considering the individual circumstances. Our strategic third-party suppliers collect data for Thrive via their own FTs, in their own farm monitoring systems. Once the data is collected in the field, the country team analyses the data and approve it or reopen the questions for discussion with the farmers. After that, the data is reported in Thrive and made available to the Global Leaf ESG team. The data is also reviewed by an independent third-party. The definition of child labour used to identify child labour incidents is hazardous child labour as defined by the ILO Convention No. 138 on Minimum Age and ILO Convention No. 182 on the Worst Forms of Child Labour. Ethnically Diverse Group For the purposes of D&I Reporting, the following definitions are used. Ethnically diverse groups includes global ethnic groups Hispanic/ Latin American, Black, Asian, Indigenous, Mixed, Other (Arabs/Middle Eastern and Turkish). In 2022, we expanded the scope of our confidential voluntary ethnicity identity collection and reporting beyond the UK to six additional markets (Australia, Brazil, Canada, Malaysia, South Africa and the U.S.). Senior Leadership Teams Members of senior leadership teams are defined as any employee who is either a direct report of a Management Board member or a direct report of a Management Board’s direct report. Some MB-1 and MB-2 employees are double-counted in this calculation to account for those who feature on one or more senior leadership teams, given their dual accountability. % Women in Management Roles The number of female management-grade employees, as a percentage of the total number of management-grade employees. Management-grade employees include all employees at job grade 34 or above, as well as any global graduates. The gender of each employee is typically recorded at the point of hire. BAT Annual Report and Form 20-F 2022 Strategic Report Governance Report Financial Statements Other Information 323
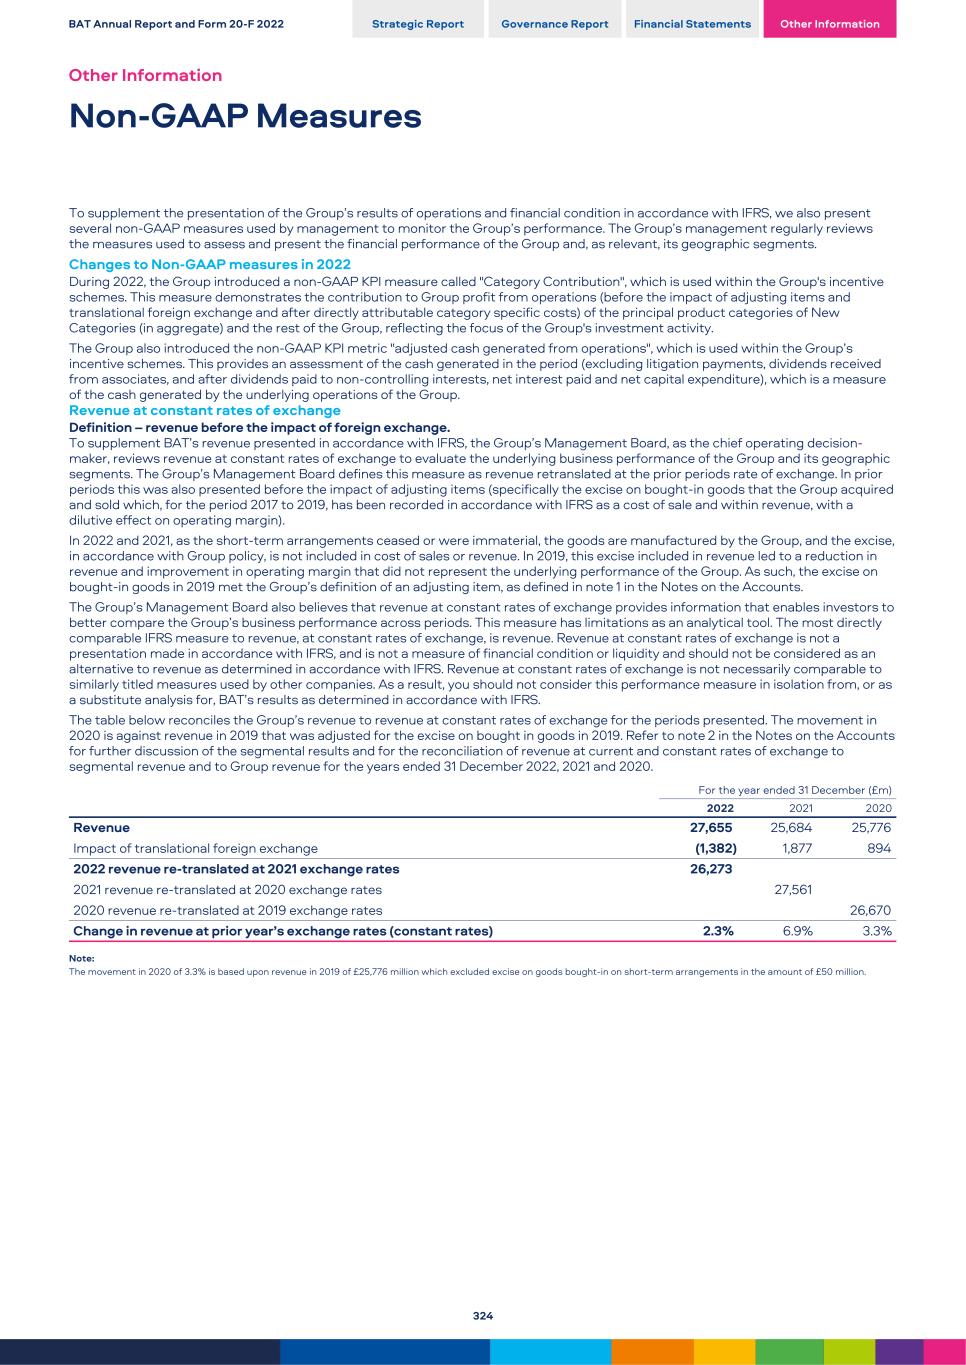
To supplement the presentation of the Group’s results of operations and financial condition in accordance with IFRS, we also present several non-GAAP measures used by management to monitor the Group’s performance. The Group’s management regularly reviews the measures used to assess and present the financial performance of the Group and, as relevant, its geographic segments. Changes to Non-GAAP measures in 2022 During 2022, the Group introduced a non-GAAP KPI measure called "Category Contribution", which is used within the Group's incentive schemes. This measure demonstrates the contribution to Group profit from operations (before the impact of adjusting items and translational foreign exchange and after directly attributable category specific costs) of the principal product categories of New Categories (in aggregate) and the rest of the Group, reflecting the focus of the Group's investment activity. The Group also introduced the non-GAAP KPI metric "adjusted cash generated from operations", which is used within the Group’s incentive schemes. This provides an assessment of the cash generated in the period (excluding litigation payments, dividends received from associates, and after dividends paid to non-controlling interests, net interest paid and net capital expenditure), which is a measure of the cash generated by the underlying operations of the Group. Revenue at constant rates of exchange Definition – revenue before the impact of foreign exchange. To supplement BAT’s revenue presented in accordance with IFRS, the Group’s Management Board, as the chief operating decision- maker, reviews revenue at constant rates of exchange to evaluate the underlying business performance of the Group and its geographic segments. The Group’s Management Board defines this measure as revenue retranslated at the prior periods rate of exchange. In prior periods this was also presented before the impact of adjusting items (specifically the excise on bought-in goods that the Group acquired and sold which, for the period 2017 to 2019, has been recorded in accordance with IFRS as a cost of sale and within revenue, with a dilutive effect on operating margin). In 2022 and 2021, as the short-term arrangements ceased or were immaterial, the goods are manufactured by the Group, and the excise, in accordance with Group policy, is not included in cost of sales or revenue. In 2019, this excise included in revenue led to a reduction in revenue and improvement in operating margin that did not represent the underlying performance of the Group. As such, the excise on bought-in goods in 2019 met the Group’s definition of an adjusting item, as defined in note 1 in the Notes on the Accounts. The Group’s Management Board also believes that revenue at constant rates of exchange provides information that enables investors to better compare the Group’s business performance across periods. This measure has limitations as an analytical tool. The most directly comparable IFRS measure to revenue, at constant rates of exchange, is revenue. Revenue at constant rates of exchange is not a presentation made in accordance with IFRS, and is not a measure of financial condition or liquidity and should not be considered as an alternative to revenue as determined in accordance with IFRS. Revenue at constant rates of exchange is not necessarily comparable to similarly titled measures used by other companies. As a result, you should not consider this performance measure in isolation from, or as a substitute analysis for, BAT’s results as determined in accordance with IFRS. The table below reconciles the Group’s revenue to revenue at constant rates of exchange for the periods presented. The movement in 2020 is against revenue in 2019 that was adjusted for the excise on bought in goods in 2019. Refer to note 2 in the Notes on the Accounts for further discussion of the segmental results and for the reconciliation of revenue at current and constant rates of exchange to segmental revenue and to Group revenue for the years ended 31 December 2022, 2021 and 2020. For the year ended 31 December (£m) 2022 2021 2020 Revenue 27,655 25,684 25,776 Impact of translational foreign exchange (1,382) 1,877 894 2022 revenue re-translated at 2021 exchange rates 26,273 2021 revenue re-translated at 2020 exchange rates 27,561 2020 revenue re-translated at 2019 exchange rates 26,670 Change in revenue at prior year’s exchange rates (constant rates) 2.3% 6.9% 3.3% Note: The movement in 2020 of 3.3% is based upon revenue in 2019 of £25,776 million which excluded excise on goods bought-in on short-term arrangements in the amount of £50 million. BAT Annual Report and Form 20-F 2022 Strategic Report Governance Report Financial Statements Other Information Other Information Non-GAAP Measures 324
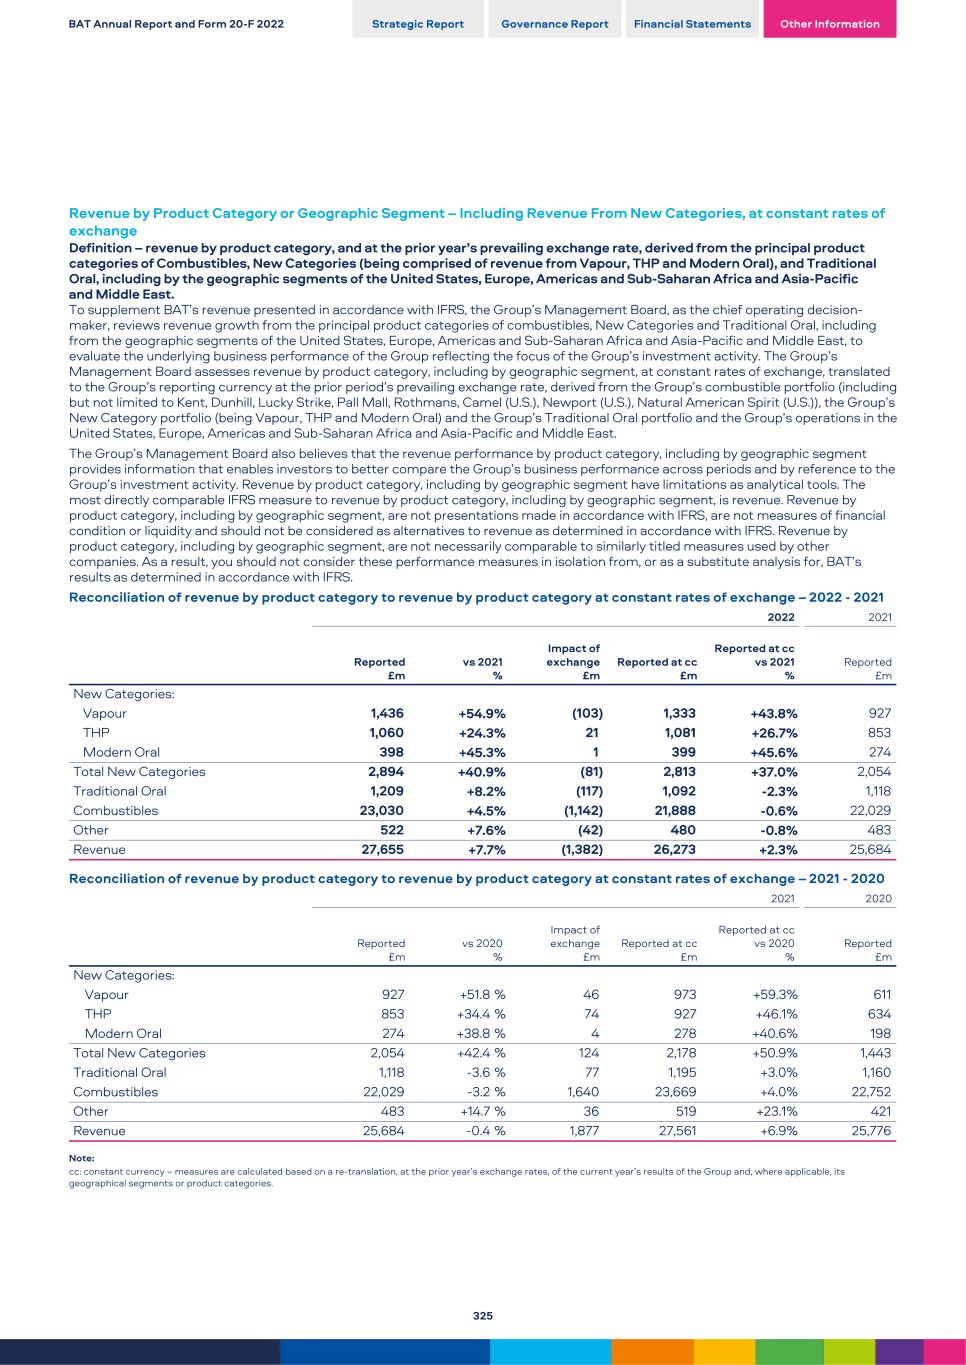
Revenue by Product Category or Geographic Segment – Including Revenue From New Categories, at constant rates of exchange Definition – revenue by product category, and at the prior year’s prevailing exchange rate, derived from the principal product categories of Combustibles, New Categories (being comprised of revenue from Vapour, THP and Modern Oral), and Traditional Oral, including by the geographic segments of the United States, Europe, Americas and Sub-Saharan Africa and Asia-Pacific and Middle East. To supplement BAT’s revenue presented in accordance with IFRS, the Group’s Management Board, as the chief operating decision- maker, reviews revenue growth from the principal product categories of combustibles, New Categories and Traditional Oral, including from the geographic segments of the United States, Europe, Americas and Sub-Saharan Africa and Asia-Pacific and Middle East, to evaluate the underlying business performance of the Group reflecting the focus of the Group’s investment activity. The Group’s Management Board assesses revenue by product category, including by geographic segment, at constant rates of exchange, translated to the Group’s reporting currency at the prior period’s prevailing exchange rate, derived from the Group’s combustible portfolio (including but not limited to Kent, Dunhill, Lucky Strike, Pall Mall, Rothmans, Camel (U.S.), Newport (U.S.), Natural American Spirit (U.S.)), the Group’s New Category portfolio (being Vapour, THP and Modern Oral) and the Group’s Traditional Oral portfolio and the Group’s operations in the United States, Europe, Americas and Sub-Saharan Africa and Asia-Pacific and Middle East. The Group’s Management Board also believes that the revenue performance by product category, including by geographic segment provides information that enables investors to better compare the Group’s business performance across periods and by reference to the Group’s investment activity. Revenue by product category, including by geographic segment have limitations as analytical tools. The most directly comparable IFRS measure to revenue by product category, including by geographic segment, is revenue. Revenue by product category, including by geographic segment, are not presentations made in accordance with IFRS, are not measures of financial condition or liquidity and should not be considered as alternatives to revenue as determined in accordance with IFRS. Revenue by product category, including by geographic segment, are not necessarily comparable to similarly titled measures used by other companies. As a result, you should not consider these performance measures in isolation from, or as a substitute analysis for, BAT’s results as determined in accordance with IFRS. Reconciliation of revenue by product category to revenue by product category at constant rates of exchange – 2022 - 2021 2022 2021 Reported £m vs 2021 % Impact of exchange £m Reported at cc £m Reported at cc vs 2021 % Reported £m New Categories: Vapour 1,436 +54.9 % (103) 1,333 +43.8 % 927 THP 1,060 +24.3 % 21 1,081 +26.7 % 853 Modern Oral 398 +45.3 % 1 399 +45.6 % 274 Total New Categories 2,894 +40.9 % (81) 2,813 +37.0 % 2,054 Traditional Oral 1,209 +8.2 % (117) 1,092 -2.3 % 1,118 Combustibles 23,030 +4.5 % (1,142) 21,888 -0.6 % 22,029 Other 522 +7.6 % (42) 480 -0.8 % 483 Revenue 27,655 +7.7 % (1,382) 26,273 +2.3 % 25,684 Reconciliation of revenue by product category to revenue by product category at constant rates of exchange – 2021 - 2020 2021 2020 Reported £m vs 2020 % Impact of exchange £m Reported at cc £m Reported at cc vs 2020 % Reported £m New Categories: Vapour 927 +51.8 % 46 973 +59.3 % 611 THP 853 +34.4 % 74 927 +46.1 % 634 Modern Oral 274 +38.8 % 4 278 +40.6 % 198 Total New Categories 2,054 +42.4 % 124 2,178 +50.9 % 1,443 Traditional Oral 1,118 -3.6 % 77 1,195 +3.0 % 1,160 Combustibles 22,029 -3.2 % 1,640 23,669 +4.0 % 22,752 Other 483 +14.7 % 36 519 +23.1 % 421 Revenue 25,684 -0.4 % 1,877 27,561 +6.9 % 25,776 Note: cc: constant currency – measures are calculated based on a re-translation, at the prior year’s exchange rates, of the current year’s results of the Group and, where applicable, its geographical segments or product categories. BAT Annual Report and Form 20-F 2022 Strategic Report Governance Report Financial Statements Other Information 325
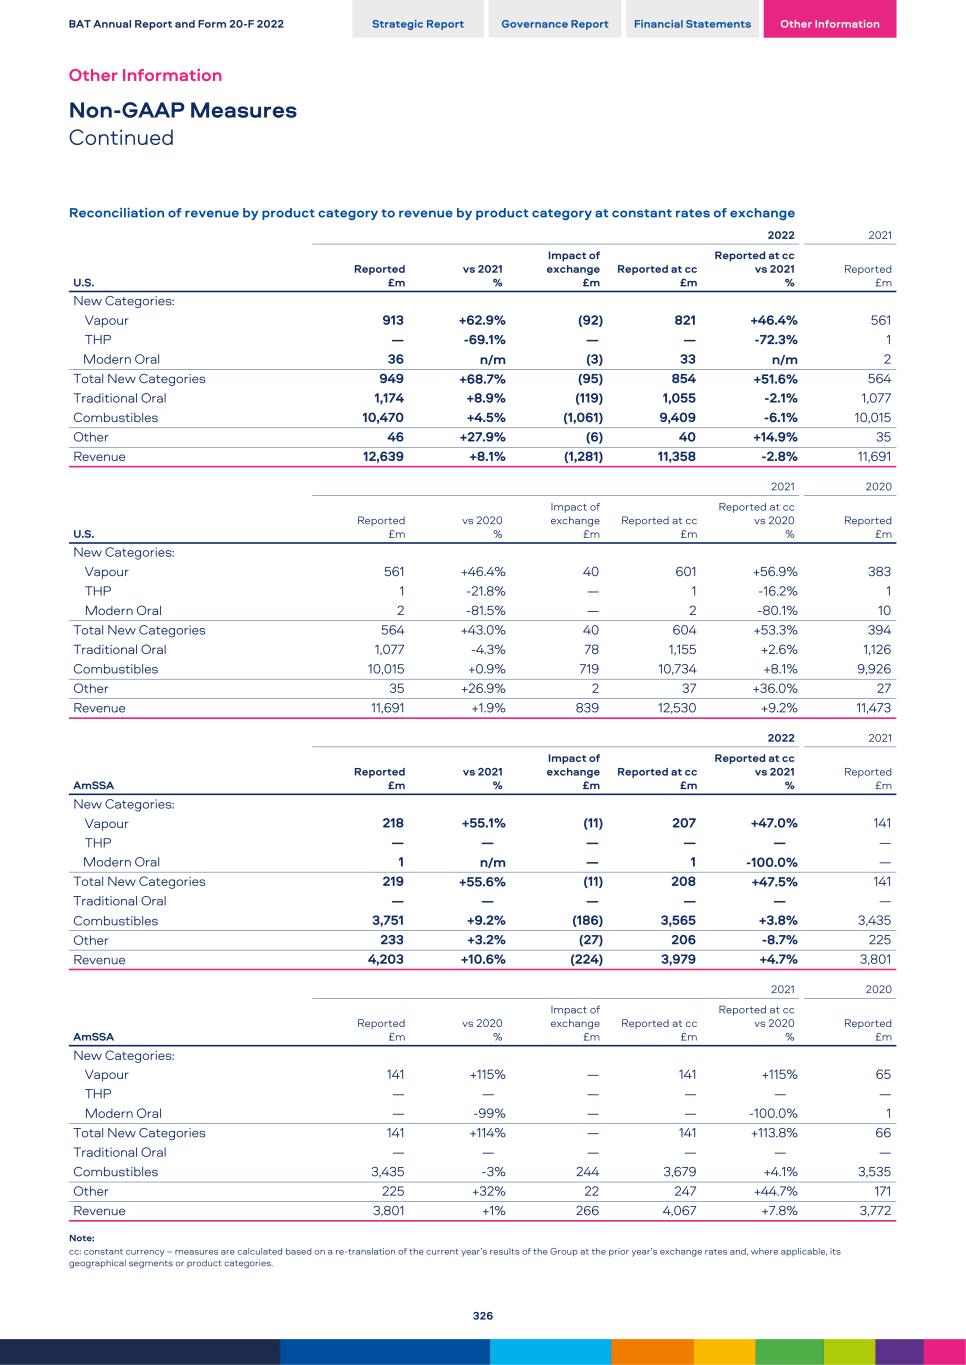
Reconciliation of revenue by product category to revenue by product category at constant rates of exchange 2022 2021 U.S. Reported £m vs 2021 % Impact of exchange £m Reported at cc £m Reported at cc vs 2021 % Reported £m New Categories: Vapour 913 +62.9 % (92) 821 +46.4 % 561 THP — -69.1 % — — -72.3 % 1 Modern Oral 36 n/m (3) 33 n/m 2 Total New Categories 949 +68.7 % (95) 854 +51.6 % 564 Traditional Oral 1,174 +8.9 % (119) 1,055 -2.1 % 1,077 Combustibles 10,470 +4.5 % (1,061) 9,409 -6.1 % 10,015 Other 46 +27.9 % (6) 40 +14.9 % 35 Revenue 12,639 +8.1 % (1,281) 11,358 -2.8 % 11,691 2021 2020 U.S. Reported £m vs 2020 % Impact of exchange £m Reported at cc £m Reported at cc vs 2020 % Reported £m New Categories: Vapour 561 +46.4% 40 601 +56.9 % 383 THP 1 -21.8% — 1 -16.2 % 1 Modern Oral 2 -81.5% — 2 -80.1 % 10 Total New Categories 564 +43.0% 40 604 +53.3 % 394 Traditional Oral 1,077 -4.3% 78 1,155 +2.6 % 1,126 Combustibles 10,015 +0.9% 719 10,734 +8.1 % 9,926 Other 35 +26.9% 2 37 +36.0 % 27 Revenue 11,691 +1.9% 839 12,530 +9.2 % 11,473 2022 2021 AmSSA Reported £m vs 2021 % Impact of exchange £m Reported at cc £m Reported at cc vs 2021 % Reported £m New Categories: Vapour 218 +55.1 % (11) 207 +47.0 % 141 THP — — — — — — Modern Oral 1 n/m — 1 -100.0 % — Total New Categories 219 +55.6 % (11) 208 +47.5 % 141 Traditional Oral — — — — — — Combustibles 3,751 +9.2 % (186) 3,565 +3.8 % 3,435 Other 233 +3.2 % (27) 206 -8.7 % 225 Revenue 4,203 +10.6 % (224) 3,979 +4.7 % 3,801 2021 2020 AmSSA Reported £m vs 2020 % Impact of exchange £m Reported at cc £m Reported at cc vs 2020 % Reported £m New Categories: Vapour 141 +115% — 141 +115 % 65 THP — — — — — — Modern Oral — -99% — — -100.0 % 1 Total New Categories 141 +114% — 141 +113.8 % 66 Traditional Oral — — — — — — Combustibles 3,435 -3% 244 3,679 +4.1 % 3,535 Other 225 +32% 22 247 +44.7 % 171 Revenue 3,801 +1% 266 4,067 +7.8 % 3,772 Note: cc: constant currency – measures are calculated based on a re-translation of the current year’s results of the Group at the prior year’s exchange rates and, where applicable, its geographical segments or product categories. BAT Annual Report and Form 20-F 2022 Strategic Report Governance Report Financial Statements Other Information Other Information Non-GAAP Measures Continued 326
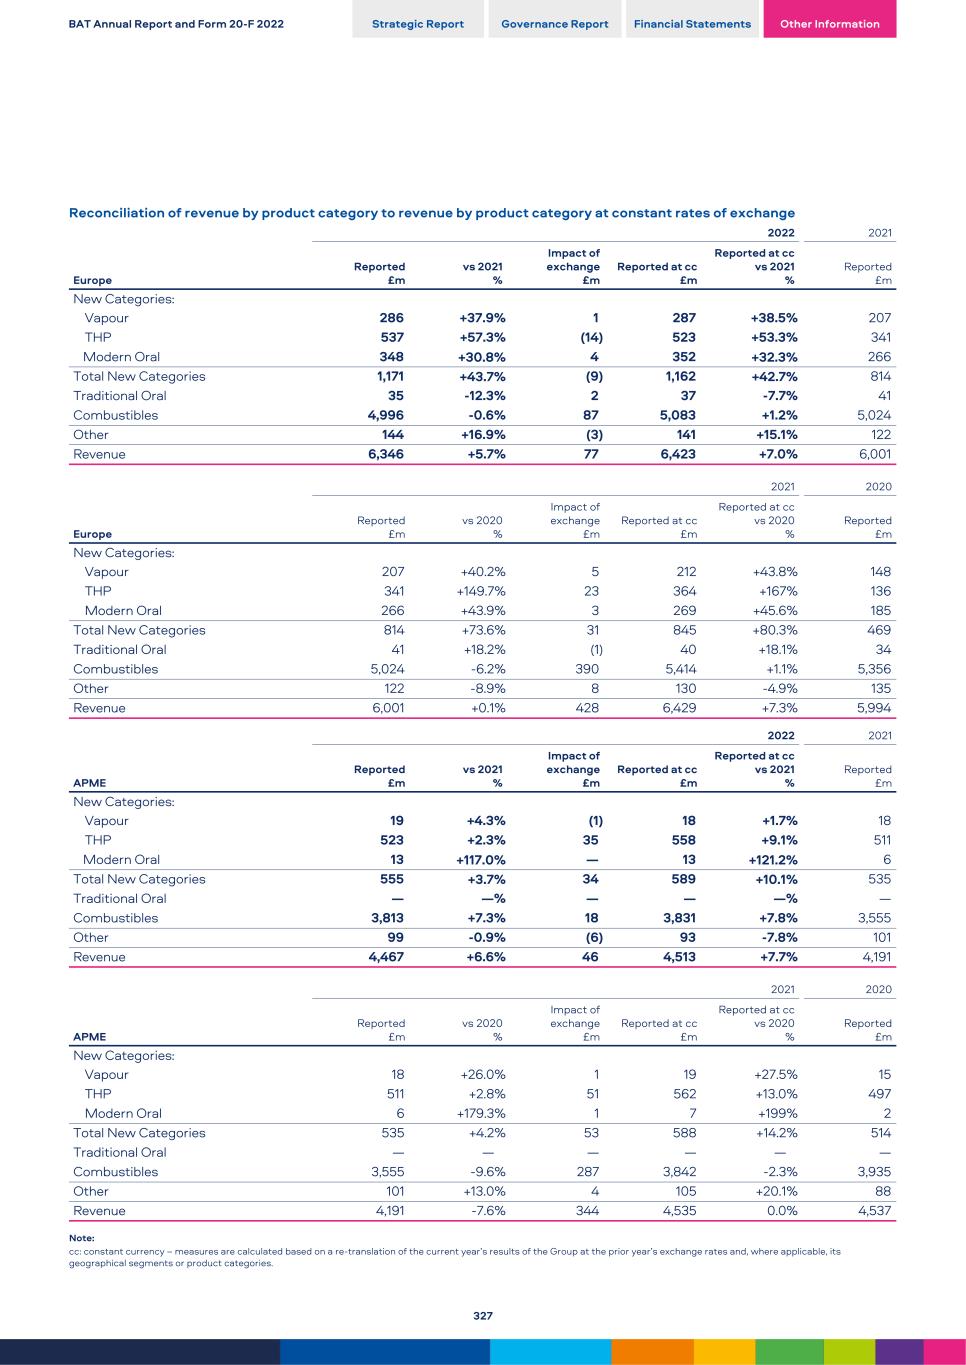
Reconciliation of revenue by product category to revenue by product category at constant rates of exchange 2022 2021 Europe Reported £m vs 2021 % Impact of exchange £m Reported at cc £m Reported at cc vs 2021 % Reported £m New Categories: Vapour 286 +37.9 % 1 287 +38.5 % 207 THP 537 +57.3 % (14) 523 +53.3 % 341 Modern Oral 348 +30.8 % 4 352 +32.3 % 266 Total New Categories 1,171 +43.7 % (9) 1,162 +42.7 % 814 Traditional Oral 35 -12.3 % 2 37 -7.7 % 41 Combustibles 4,996 -0.6 % 87 5,083 +1.2 % 5,024 Other 144 +16.9 % (3) 141 +15.1 % 122 Revenue 6,346 +5.7 % 77 6,423 +7.0 % 6,001 2021 2020 Europe Reported £m vs 2020 % Impact of exchange £m Reported at cc £m Reported at cc vs 2020 % Reported £m New Categories: Vapour 207 +40.2% 5 212 +43.8 % 148 THP 341 +149.7% 23 364 +167 % 136 Modern Oral 266 +43.9% 3 269 +45.6 % 185 Total New Categories 814 +73.6% 31 845 +80.3 % 469 Traditional Oral 41 +18.2% (1) 40 +18.1 % 34 Combustibles 5,024 -6.2% 390 5,414 +1.1 % 5,356 Other 122 -8.9% 8 130 -4.9 % 135 Revenue 6,001 +0.1% 428 6,429 +7.3 % 5,994 2022 2021 APME Reported £m vs 2021 % Impact of exchange £m Reported at cc £m Reported at cc vs 2021 % Reported £m New Categories: Vapour 19 +4.3 % (1) 18 +1.7 % 18 THP 523 +2.3 % 35 558 +9.1 % 511 Modern Oral 13 +117.0 % — 13 +121.2 % 6 Total New Categories 555 +3.7 % 34 589 +10.1 % 535 Traditional Oral — — % — — — % — Combustibles 3,813 +7.3 % 18 3,831 +7.8 % 3,555 Other 99 -0.9 % (6) 93 -7.8 % 101 Revenue 4,467 +6.6 % 46 4,513 +7.7 % 4,191 2021 2020 APME Reported £m vs 2020 % Impact of exchange £m Reported at cc £m Reported at cc vs 2020 % Reported £m New Categories: Vapour 18 +26.0% 1 19 +27.5 % 15 THP 511 +2.8% 51 562 +13.0 % 497 Modern Oral 6 +179.3% 1 7 +199 % 2 Total New Categories 535 +4.2% 53 588 +14.2 % 514 Traditional Oral — — — — — — Combustibles 3,555 -9.6% 287 3,842 -2.3 % 3,935 Other 101 +13.0% 4 105 +20.1 % 88 Revenue 4,191 -7.6% 344 4,535 0.0 % 4,537 Note: cc: constant currency – measures are calculated based on a re-translation of the current year’s results of the Group at the prior year’s exchange rates and, where applicable, its geographical segments or product categories. BAT Annual Report and Form 20-F 2022 Strategic Report Governance Report Financial Statements Other Information 327
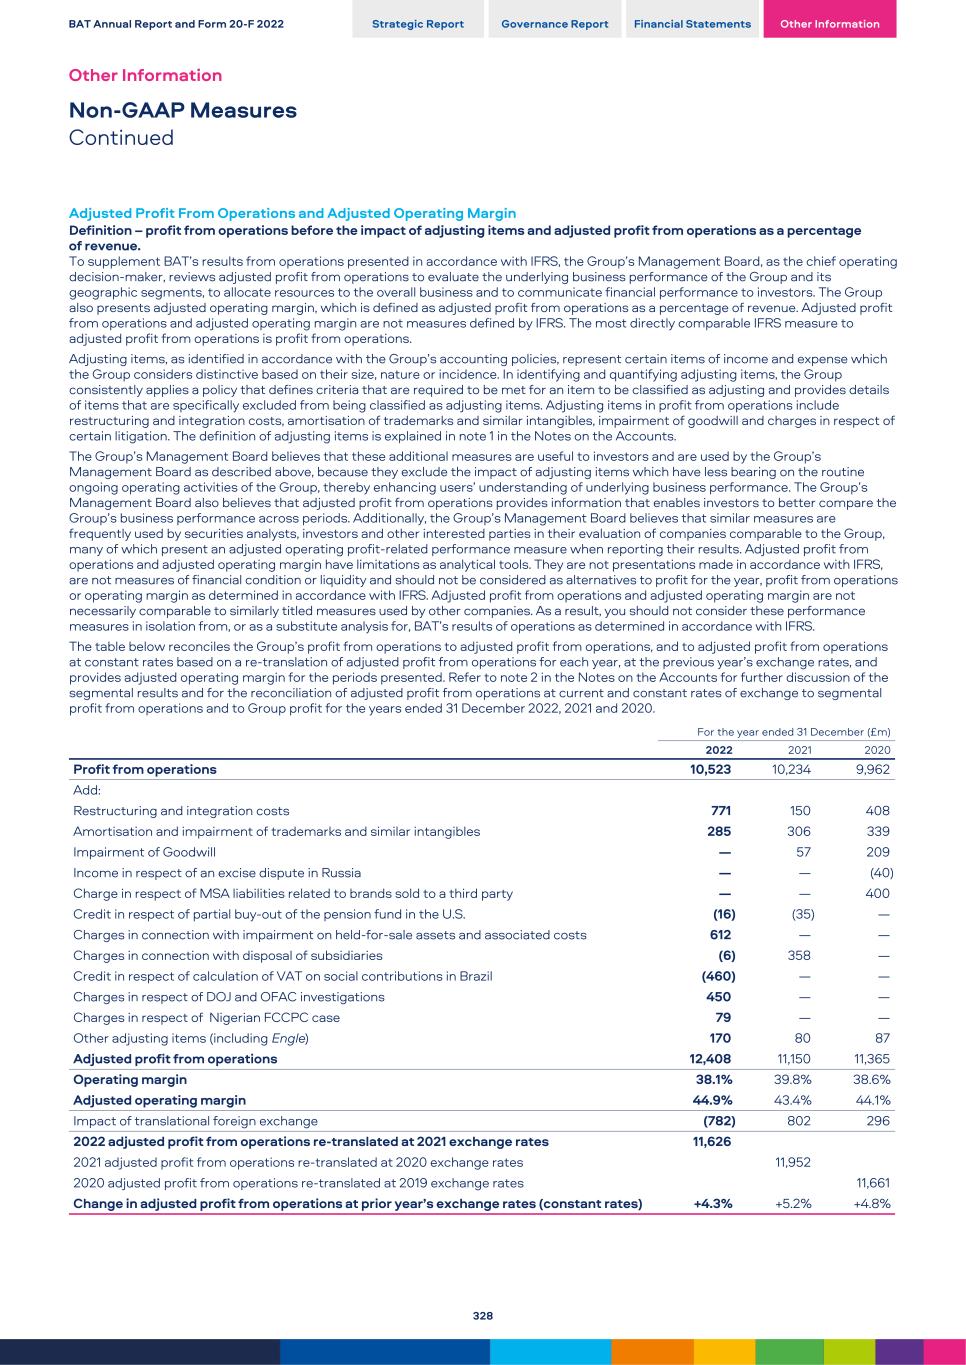
Adjusted Profit From Operations and Adjusted Operating Margin Definition – profit from operations before the impact of adjusting items and adjusted profit from operations as a percentage of revenue. To supplement BAT’s results from operations presented in accordance with IFRS, the Group’s Management Board, as the chief operating decision‑maker, reviews adjusted profit from operations to evaluate the underlying business performance of the Group and its geographic segments, to allocate resources to the overall business and to communicate financial performance to investors. The Group also presents adjusted operating margin, which is defined as adjusted profit from operations as a percentage of revenue. Adjusted profit from operations and adjusted operating margin are not measures defined by IFRS. The most directly comparable IFRS measure to adjusted profit from operations is profit from operations. Adjusting items, as identified in accordance with the Group’s accounting policies, represent certain items of income and expense which the Group considers distinctive based on their size, nature or incidence. In identifying and quantifying adjusting items, the Group consistently applies a policy that defines criteria that are required to be met for an item to be classified as adjusting and provides details of items that are specifically excluded from being classified as adjusting items. Adjusting items in profit from operations include restructuring and integration costs, amortisation of trademarks and similar intangibles, impairment of goodwill and charges in respect of certain litigation. The definition of adjusting items is explained in note 1 in the Notes on the Accounts. The Group’s Management Board believes that these additional measures are useful to investors and are used by the Group’s Management Board as described above, because they exclude the impact of adjusting items which have less bearing on the routine ongoing operating activities of the Group, thereby enhancing users’ understanding of underlying business performance. The Group’s Management Board also believes that adjusted profit from operations provides information that enables investors to better compare the Group’s business performance across periods. Additionally, the Group’s Management Board believes that similar measures are frequently used by securities analysts, investors and other interested parties in their evaluation of companies comparable to the Group, many of which present an adjusted operating profit-related performance measure when reporting their results. Adjusted profit from operations and adjusted operating margin have limitations as analytical tools. They are not presentations made in accordance with IFRS, are not measures of financial condition or liquidity and should not be considered as alternatives to profit for the year, profit from operations or operating margin as determined in accordance with IFRS. Adjusted profit from operations and adjusted operating margin are not necessarily comparable to similarly titled measures used by other companies. As a result, you should not consider these performance measures in isolation from, or as a substitute analysis for, BAT’s results of operations as determined in accordance with IFRS. The table below reconciles the Group’s profit from operations to adjusted profit from operations, and to adjusted profit from operations at constant rates based on a re-translation of adjusted profit from operations for each year, at the previous year’s exchange rates, and provides adjusted operating margin for the periods presented. Refer to note 2 in the Notes on the Accounts for further discussion of the segmental results and for the reconciliation of adjusted profit from operations at current and constant rates of exchange to segmental profit from operations and to Group profit for the years ended 31 December 2022, 2021 and 2020. For the year ended 31 December (£m) 2022 2021 2020 Profit from operations 10,523 10,234 9,962 Add: Restructuring and integration costs 771 150 408 Amortisation and impairment of trademarks and similar intangibles 285 306 339 Impairment of Goodwill — 57 209 Income in respect of an excise dispute in Russia — — (40) Charge in respect of MSA liabilities related to brands sold to a third party — — 400 Credit in respect of partial buy-out of the pension fund in the U.S. (16) (35) — Charges in connection with impairment on held-for-sale assets and associated costs 612 — — Charges in connection with disposal of subsidiaries (6) 358 — Credit in respect of calculation of VAT on social contributions in Brazil (460) — — Charges in respect of DOJ and OFAC investigations 450 — — Charges in respect of Nigerian FCCPC case 79 — — Other adjusting items (including Engle) 170 80 87 Adjusted profit from operations 12,408 11,150 11,365 Operating margin 38.1% 39.8% 38.6% Adjusted operating margin 44.9% 43.4% 44.1% Impact of translational foreign exchange (782) 802 296 2022 adjusted profit from operations re-translated at 2021 exchange rates 11,626 2021 adjusted profit from operations re-translated at 2020 exchange rates 11,952 2020 adjusted profit from operations re-translated at 2019 exchange rates 11,661 Change in adjusted profit from operations at prior year’s exchange rates (constant rates) +4.3% +5.2% +4.8% BAT Annual Report and Form 20-F 2022 Strategic Report Governance Report Financial Statements Other Information Other Information Non-GAAP Measures Continued 328
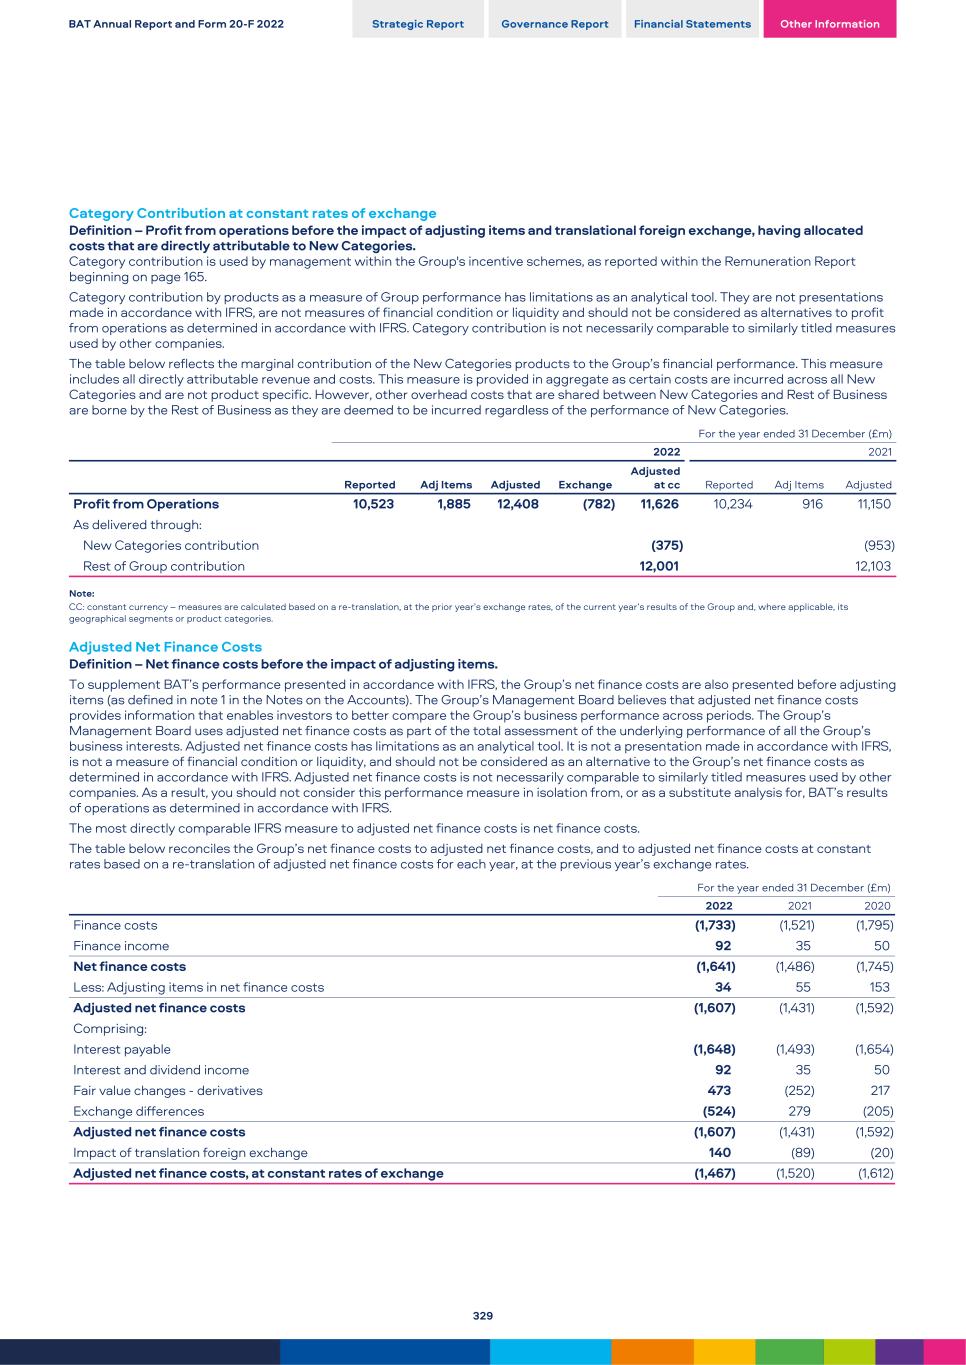
Category Contribution at constant rates of exchange Definition – Profit from operations before the impact of adjusting items and translational foreign exchange, having allocated costs that are directly attributable to New Categories. Category contribution is used by management within the Group's incentive schemes, as reported within the Remuneration Report beginning on page 165. Category contribution by products as a measure of Group performance has limitations as an analytical tool. They are not presentations made in accordance with IFRS, are not measures of financial condition or liquidity and should not be considered as alternatives to profit from operations as determined in accordance with IFRS. Category contribution is not necessarily comparable to similarly titled measures used by other companies. The table below reflects the marginal contribution of the New Categories products to the Group’s financial performance. This measure includes all directly attributable revenue and costs. This measure is provided in aggregate as certain costs are incurred across all New Categories and are not product specific. However, other overhead costs that are shared between New Categories and Rest of Business are borne by the Rest of Business as they are deemed to be incurred regardless of the performance of New Categories. For the year ended 31 December (£m) 2022 2021 Reported Adj Items Adjusted Exchange Adjusted at cc Reported Adj Items Adjusted Profit from Operations 10,523 1,885 12,408 (782) 11,626 10,234 916 11,150 As delivered through: New Categories contribution (375) (953) Rest of Group contribution 12,001 12,103 Note: CC: constant currency – measures are calculated based on a re-translation, at the prior year’s exchange rates, of the current year’s results of the Group and, where applicable, its geographical segments or product categories. Adjusted Net Finance Costs Definition – Net finance costs before the impact of adjusting items. To supplement BAT’s performance presented in accordance with IFRS, the Group’s net finance costs are also presented before adjusting items (as defined in note 1 in the Notes on the Accounts). The Group’s Management Board believes that adjusted net finance costs provides information that enables investors to better compare the Group’s business performance across periods. The Group’s Management Board uses adjusted net finance costs as part of the total assessment of the underlying performance of all the Group’s business interests. Adjusted net finance costs has limitations as an analytical tool. It is not a presentation made in accordance with IFRS, is not a measure of financial condition or liquidity, and should not be considered as an alternative to the Group’s net finance costs as determined in accordance with IFRS. Adjusted net finance costs is not necessarily comparable to similarly titled measures used by other companies. As a result, you should not consider this performance measure in isolation from, or as a substitute analysis for, BAT’s results of operations as determined in accordance with IFRS. The most directly comparable IFRS measure to adjusted net finance costs is net finance costs. The table below reconciles the Group’s net finance costs to adjusted net finance costs, and to adjusted net finance costs at constant rates based on a re-translation of adjusted net finance costs for each year, at the previous year’s exchange rates. For the year ended 31 December (£m) 2022 2021 2020 Finance costs (1,733) (1,521) (1,795) Finance income 92 35 50 Net finance costs (1,641) (1,486) (1,745) Less: Adjusting items in net finance costs 34 55 153 Adjusted net finance costs (1,607) (1,431) (1,592) Comprising: Interest payable (1,648) (1,493) (1,654) Interest and dividend income 92 35 50 Fair value changes - derivatives 473 (252) 217 Exchange differences (524) 279 (205) Adjusted net finance costs (1,607) (1,431) (1,592) Impact of translation foreign exchange 140 (89) (20) Adjusted net finance costs, at constant rates of exchange (1,467) (1,520) (1,612) BAT Annual Report and Form 20-F 2022 Strategic Report Governance Report Financial Statements Other Information 329
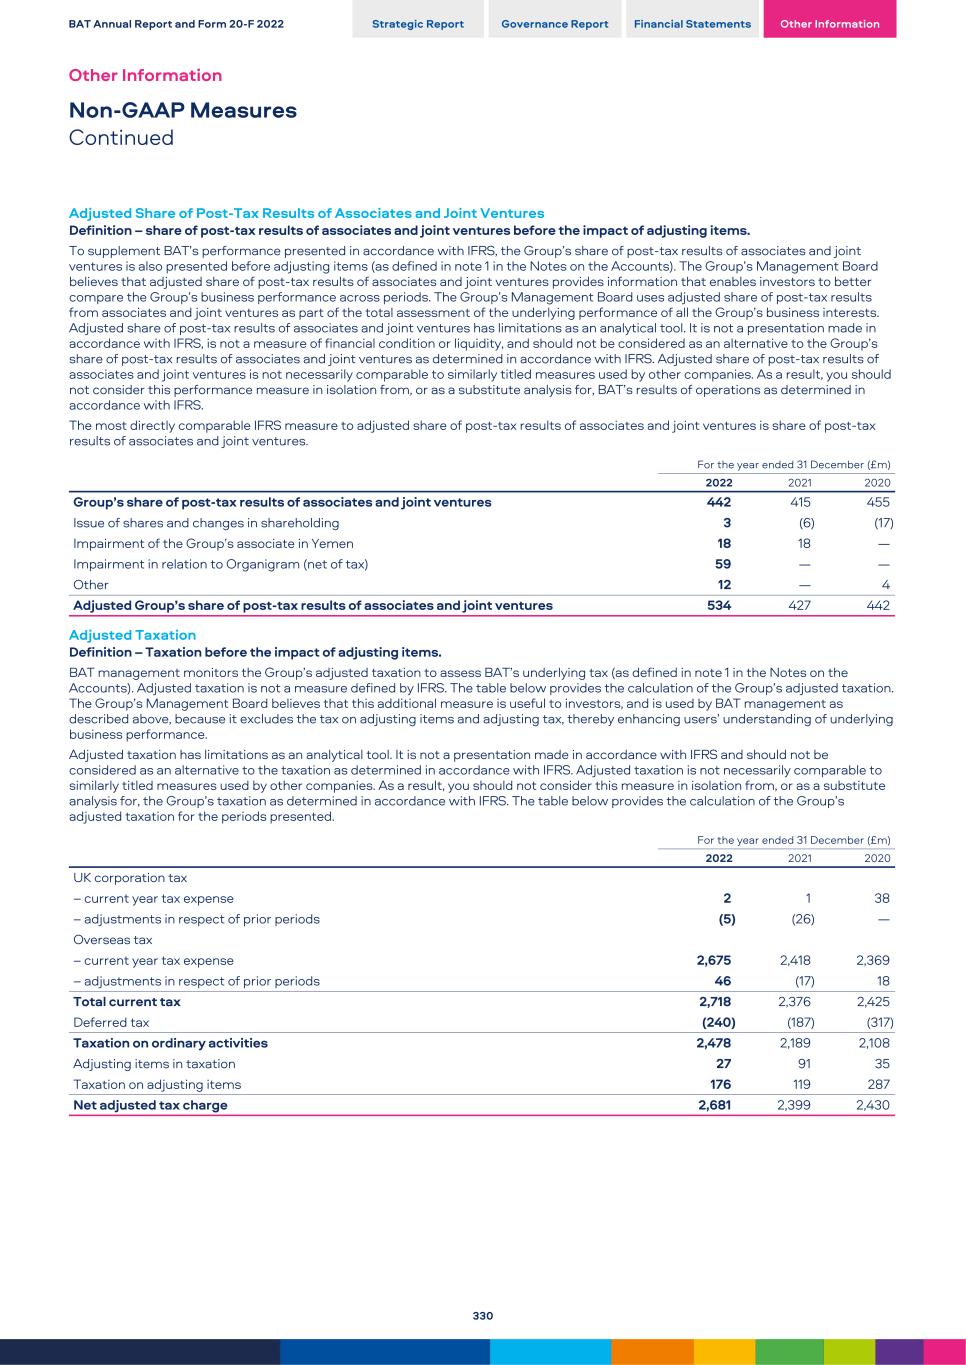
Adjusted Share of Post-Tax Results of Associates and Joint Ventures Definition – share of post-tax results of associates and joint ventures before the impact of adjusting items. To supplement BAT’s performance presented in accordance with IFRS, the Group’s share of post-tax results of associates and joint ventures is also presented before adjusting items (as defined in note 1 in the Notes on the Accounts). The Group’s Management Board believes that adjusted share of post-tax results of associates and joint ventures provides information that enables investors to better compare the Group’s business performance across periods. The Group’s Management Board uses adjusted share of post-tax results from associates and joint ventures as part of the total assessment of the underlying performance of all the Group’s business interests. Adjusted share of post-tax results of associates and joint ventures has limitations as an analytical tool. It is not a presentation made in accordance with IFRS, is not a measure of financial condition or liquidity, and should not be considered as an alternative to the Group’s share of post-tax results of associates and joint ventures as determined in accordance with IFRS. Adjusted share of post-tax results of associates and joint ventures is not necessarily comparable to similarly titled measures used by other companies. As a result, you should not consider this performance measure in isolation from, or as a substitute analysis for, BAT’s results of operations as determined in accordance with IFRS. The most directly comparable IFRS measure to adjusted share of post-tax results of associates and joint ventures is share of post-tax results of associates and joint ventures. For the year ended 31 December (£m) 2022 2021 2020 Group’s share of post-tax results of associates and joint ventures 442 415 455 Issue of shares and changes in shareholding 3 (6) (17) Impairment of the Group’s associate in Yemen 18 18 — Impairment in relation to Organigram (net of tax) 59 — — Other 12 — 4 Adjusted Group’s share of post-tax results of associates and joint ventures 534 427 442 Adjusted Taxation Definition – Taxation before the impact of adjusting items. BAT management monitors the Group’s adjusted taxation to assess BAT’s underlying tax (as defined in note 1 in the Notes on the Accounts). Adjusted taxation is not a measure defined by IFRS. The table below provides the calculation of the Group’s adjusted taxation. The Group’s Management Board believes that this additional measure is useful to investors, and is used by BAT management as described above, because it excludes the tax on adjusting items and adjusting tax, thereby enhancing users’ understanding of underlying business performance. Adjusted taxation has limitations as an analytical tool. It is not a presentation made in accordance with IFRS and should not be considered as an alternative to the taxation as determined in accordance with IFRS. Adjusted taxation is not necessarily comparable to similarly titled measures used by other companies. As a result, you should not consider this measure in isolation from, or as a substitute analysis for, the Group’s taxation as determined in accordance with IFRS. The table below provides the calculation of the Group’s adjusted taxation for the periods presented. For the year ended 31 December (£m) 2022 2021 2020 UK corporation tax – current year tax expense 2 1 38 – adjustments in respect of prior periods (5) (26) — Overseas tax – current year tax expense 2,675 2,418 2,369 – adjustments in respect of prior periods 46 (17) 18 Total current tax 2,718 2,376 2,425 Deferred tax (240) (187) (317) Taxation on ordinary activities 2,478 2,189 2,108 Adjusting items in taxation 27 91 35 Taxation on adjusting items 176 119 287 Net adjusted tax charge 2,681 2,399 2,430 BAT Annual Report and Form 20-F 2022 Strategic Report Governance Report Financial Statements Other Information Other Information Non-GAAP Measures Continued 330
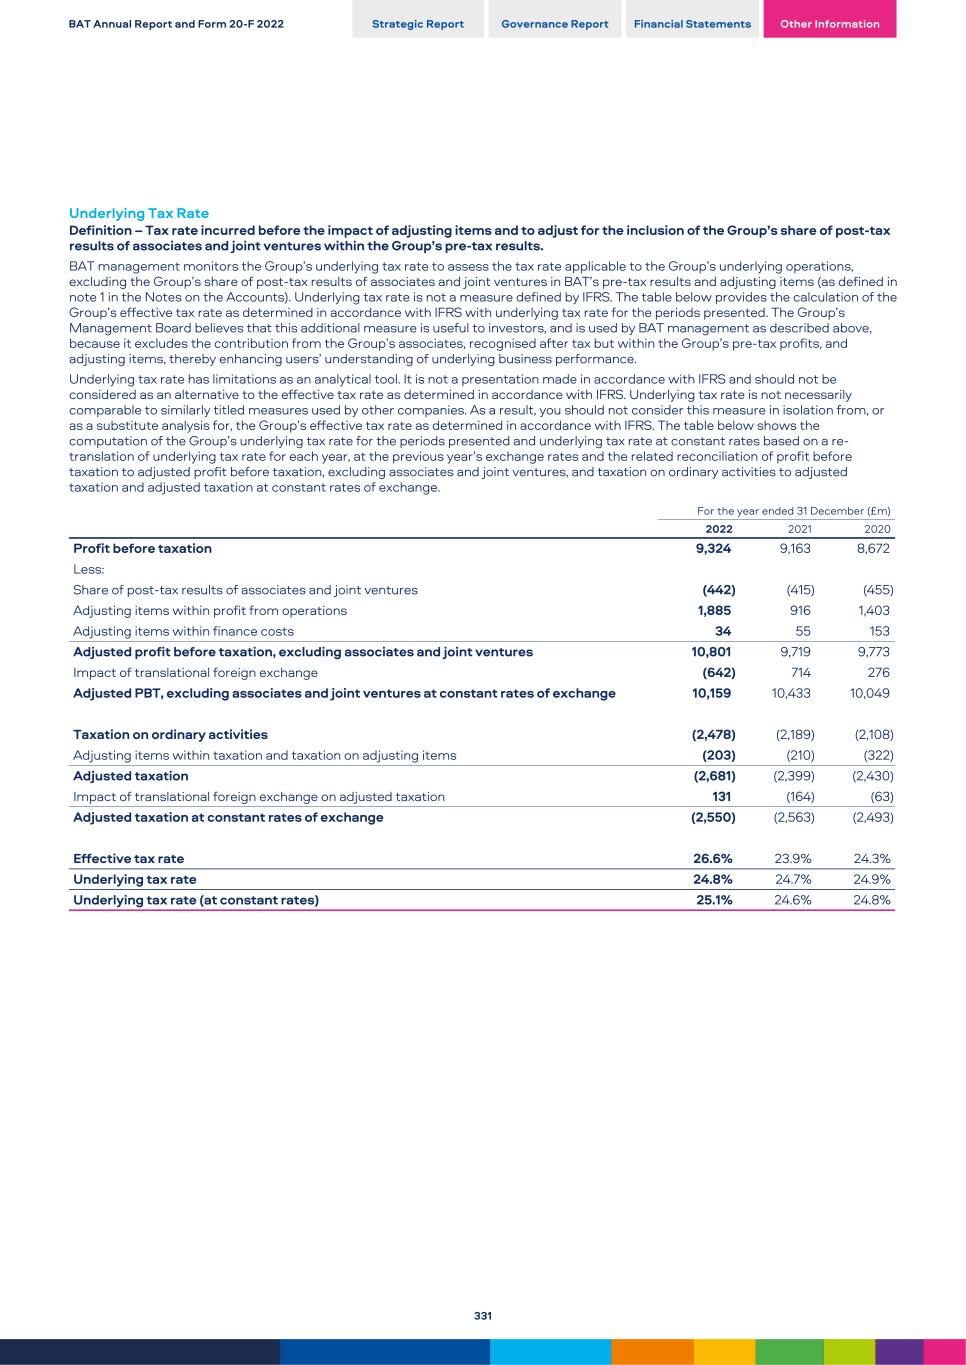
Underlying Tax Rate Definition – Tax rate incurred before the impact of adjusting items and to adjust for the inclusion of the Group’s share of post-tax results of associates and joint ventures within the Group’s pre-tax results. BAT management monitors the Group’s underlying tax rate to assess the tax rate applicable to the Group’s underlying operations, excluding the Group’s share of post-tax results of associates and joint ventures in BAT’s pre-tax results and adjusting items (as defined in note 1 in the Notes on the Accounts). Underlying tax rate is not a measure defined by IFRS. The table below provides the calculation of the Group’s effective tax rate as determined in accordance with IFRS with underlying tax rate for the periods presented. The Group’s Management Board believes that this additional measure is useful to investors, and is used by BAT management as described above, because it excludes the contribution from the Group’s associates, recognised after tax but within the Group’s pre-tax profits, and adjusting items, thereby enhancing users’ understanding of underlying business performance. Underlying tax rate has limitations as an analytical tool. It is not a presentation made in accordance with IFRS and should not be considered as an alternative to the effective tax rate as determined in accordance with IFRS. Underlying tax rate is not necessarily comparable to similarly titled measures used by other companies. As a result, you should not consider this measure in isolation from, or as a substitute analysis for, the Group’s effective tax rate as determined in accordance with IFRS. The table below shows the computation of the Group’s underlying tax rate for the periods presented and underlying tax rate at constant rates based on a re- translation of underlying tax rate for each year, at the previous year’s exchange rates and the related reconciliation of profit before taxation to adjusted profit before taxation, excluding associates and joint ventures, and taxation on ordinary activities to adjusted taxation and adjusted taxation at constant rates of exchange. For the year ended 31 December (£m) 2022 2021 2020 Profit before taxation 9,324 9,163 8,672 Less: Share of post-tax results of associates and joint ventures (442) (415) (455) Adjusting items within profit from operations 1,885 916 1,403 Adjusting items within finance costs 34 55 153 Adjusted profit before taxation, excluding associates and joint ventures 10,801 9,719 9,773 Impact of translational foreign exchange (642) 714 276 Adjusted PBT, excluding associates and joint ventures at constant rates of exchange 10,159 10,433 10,049 Taxation on ordinary activities (2,478) (2,189) (2,108) Adjusting items within taxation and taxation on adjusting items (203) (210) (322) Adjusted taxation (2,681) (2,399) (2,430) Impact of translational foreign exchange on adjusted taxation 131 (164) (63) Adjusted taxation at constant rates of exchange (2,550) (2,563) (2,493) Effective tax rate 26.6% 23.9% 24.3% Underlying tax rate 24.8% 24.7% 24.9% Underlying tax rate (at constant rates) 25.1% 24.6% 24.8% BAT Annual Report and Form 20-F 2022 Strategic Report Governance Report Financial Statements Other Information 331
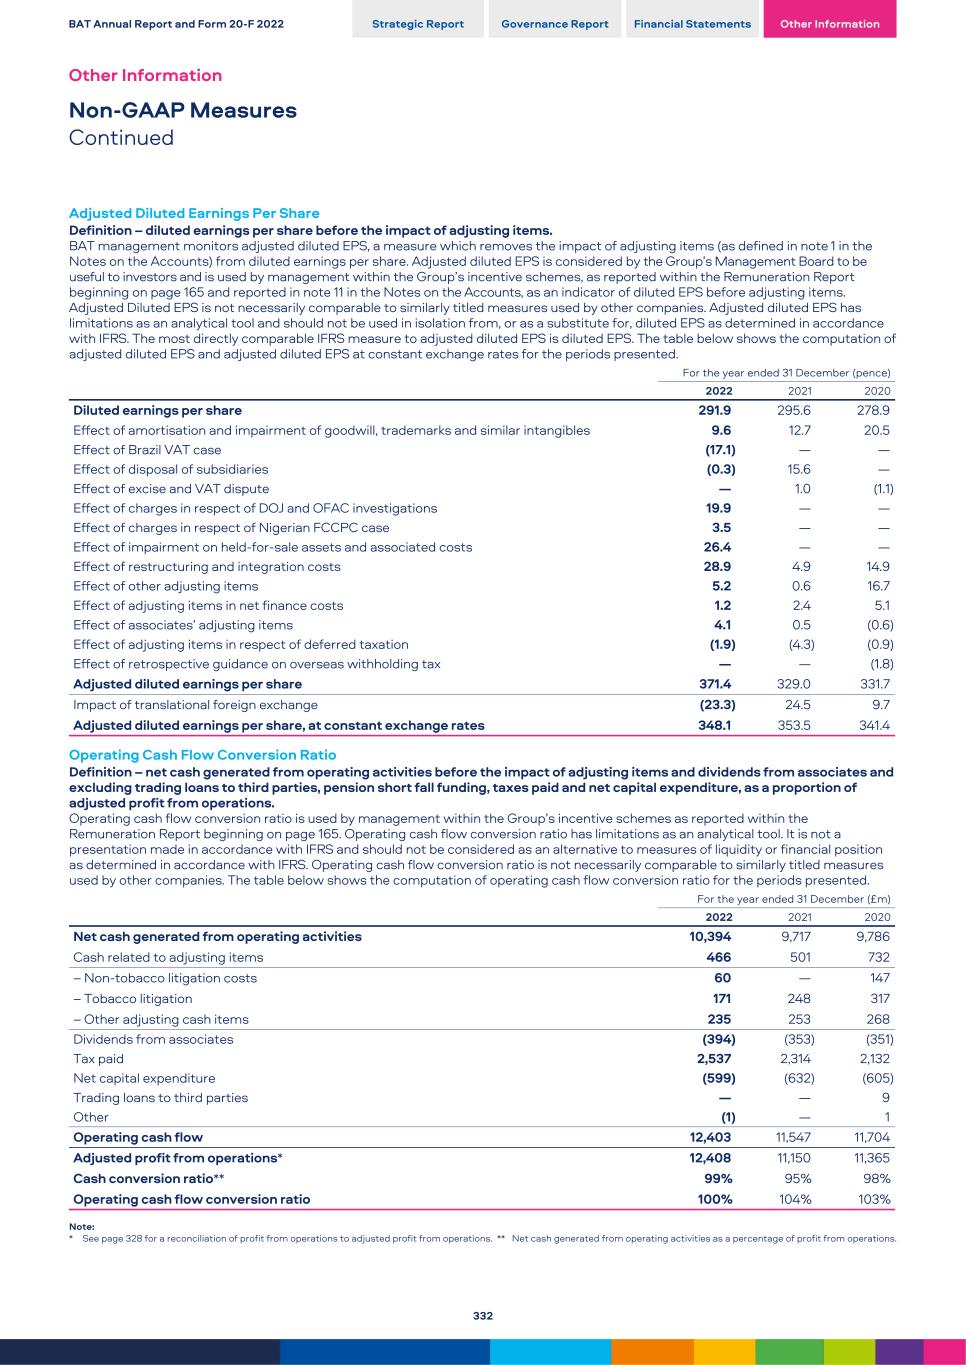
Adjusted Diluted Earnings Per Share Definition – diluted earnings per share before the impact of adjusting items. BAT management monitors adjusted diluted EPS, a measure which removes the impact of adjusting items (as defined in note 1 in the Notes on the Accounts) from diluted earnings per share. Adjusted diluted EPS is considered by the Group’s Management Board to be useful to investors and is used by management within the Group’s incentive schemes, as reported within the Remuneration Report beginning on page 165 and reported in note 11 in the Notes on the Accounts, as an indicator of diluted EPS before adjusting items. Adjusted Diluted EPS is not necessarily comparable to similarly titled measures used by other companies. Adjusted diluted EPS has limitations as an analytical tool and should not be used in isolation from, or as a substitute for, diluted EPS as determined in accordance with IFRS. The most directly comparable IFRS measure to adjusted diluted EPS is diluted EPS. The table below shows the computation of adjusted diluted EPS and adjusted diluted EPS at constant exchange rates for the periods presented. For the year ended 31 December (pence) 2022 2021 2020 Diluted earnings per share 291.9 295.6 278.9 Effect of amortisation and impairment of goodwill, trademarks and similar intangibles 9.6 12.7 20.5 Effect of Brazil VAT case (17.1) — — Effect of disposal of subsidiaries (0.3) 15.6 — Effect of excise and VAT dispute — 1.0 (1.1) Effect of charges in respect of DOJ and OFAC investigations 19.9 — — Effect of charges in respect of Nigerian FCCPC case 3.5 — — Effect of impairment on held-for-sale assets and associated costs 26.4 — — Effect of restructuring and integration costs 28.9 4.9 14.9 Effect of other adjusting items 5.2 0.6 16.7 Effect of adjusting items in net finance costs 1.2 2.4 5.1 Effect of associates’ adjusting items 4.1 0.5 (0.6) Effect of adjusting items in respect of deferred taxation (1.9) (4.3) (0.9) Effect of retrospective guidance on overseas withholding tax — — (1.8) Adjusted diluted earnings per share 371.4 329.0 331.7 Impact of translational foreign exchange (23.3) 24.5 9.7 Adjusted diluted earnings per share, at constant exchange rates 348.1 353.5 341.4 Operating Cash Flow Conversion Ratio Definition – net cash generated from operating activities before the impact of adjusting items and dividends from associates and excluding trading loans to third parties, pension short fall funding, taxes paid and net capital expenditure, as a proportion of adjusted profit from operations. Operating cash flow conversion ratio is used by management within the Group’s incentive schemes as reported within the Remuneration Report beginning on page 165. Operating cash flow conversion ratio has limitations as an analytical tool. It is not a presentation made in accordance with IFRS and should not be considered as an alternative to measures of liquidity or financial position as determined in accordance with IFRS. Operating cash flow conversion ratio is not necessarily comparable to similarly titled measures used by other companies. The table below shows the computation of operating cash flow conversion ratio for the periods presented. For the year ended 31 December (£m) 2022 2021 2020 Net cash generated from operating activities 10,394 9,717 9,786 Cash related to adjusting items 466 501 732 – Non-tobacco litigation costs 60 — 147 – Tobacco litigation 171 248 317 – Other adjusting cash items 235 253 268 Dividends from associates (394) (353) (351) Tax paid 2,537 2,314 2,132 Net capital expenditure (599) (632) (605) Trading loans to third parties — — 9 Other (1) — 1 Operating cash flow 12,403 11,547 11,704 Adjusted profit from operations* 12,408 11,150 11,365 Cash conversion ratio** 99% 95% 98% Operating cash flow conversion ratio 100% 104% 103% Note: * See page 328 for a reconciliation of profit from operations to adjusted profit from operations. ** Net cash generated from operating activities as a percentage of profit from operations. BAT Annual Report and Form 20-F 2022 Strategic Report Governance Report Financial Statements Other Information Other Information Non-GAAP Measures Continued 332
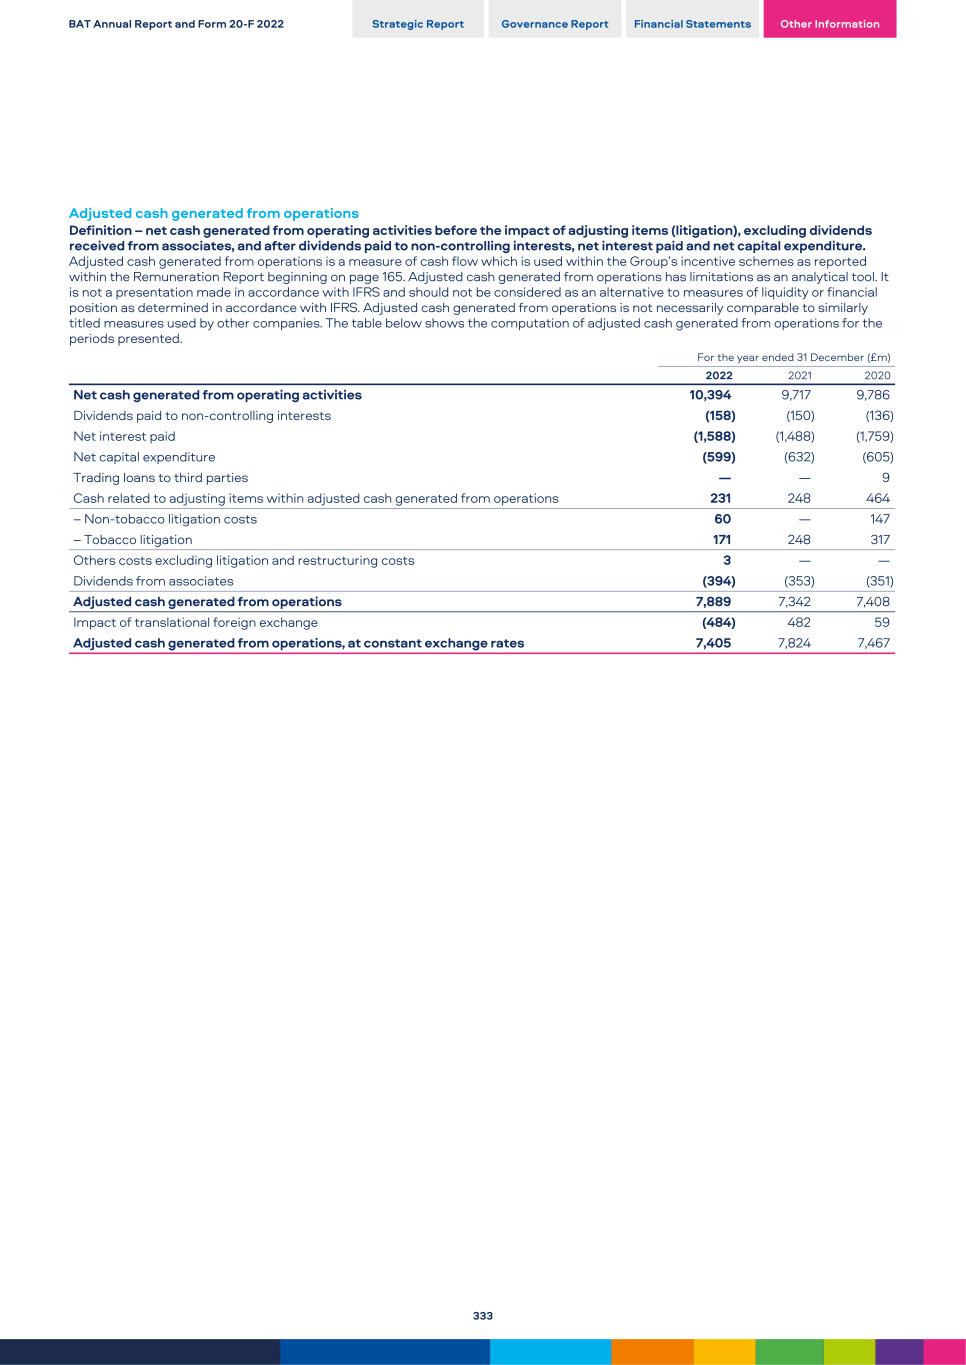
Adjusted cash generated from operations Definition – net cash generated from operating activities before the impact of adjusting items (litigation), excluding dividends received from associates, and after dividends paid to non-controlling interests, net interest paid and net capital expenditure. Adjusted cash generated from operations is a measure of cash flow which is used within the Group’s incentive schemes as reported within the Remuneration Report beginning on page 165. Adjusted cash generated from operations has limitations as an analytical tool. It is not a presentation made in accordance with IFRS and should not be considered as an alternative to measures of liquidity or financial position as determined in accordance with IFRS. Adjusted cash generated from operations is not necessarily comparable to similarly titled measures used by other companies. The table below shows the computation of adjusted cash generated from operations for the periods presented. For the year ended 31 December (£m) 2022 2021 2020 Net cash generated from operating activities 10,394 9,717 9,786 Dividends paid to non-controlling interests (158) (150) (136) Net interest paid (1,588) (1,488) (1,759) Net capital expenditure (599) (632) (605) Trading loans to third parties — — 9 Cash related to adjusting items within adjusted cash generated from operations 231 248 464 – Non-tobacco litigation costs 60 — 147 – Tobacco litigation 171 248 317 Others costs excluding litigation and restructuring costs 3 — — Dividends from associates (394) (353) (351) Adjusted cash generated from operations 7,889 7,342 7,408 Impact of translational foreign exchange (484) 482 59 Adjusted cash generated from operations, at constant exchange rates 7,405 7,824 7,467 BAT Annual Report and Form 20-F 2022 Strategic Report Governance Report Financial Statements Other Information 333
Net Debt Definition – total borrowings, including related derivatives, less cash and cash equivalents and current investments held at fair value. The Group uses net debt to assess its financial capacity. Net debt is not a measure defined by IFRS. The most directly comparable IFRS measure to net debt is total borrowings. The Group’s Management Board believes that this additional measure, which is used internally to assess the Group’s financial capacity, is useful to the users of the financial statements in helping them to see how business financing has changed over the year. Net debt has limitations as an analytical tool. It is not a presentation made in accordance with IFRS and should not be considered as an alternative to total borrowings or total liabilities determined in accordance with IFRS. Net debt is not necessarily comparable to similarly titled measures used by other companies. In addition, it does not exclude restricted cash (as set out in note 21 in the Notes on the Accounts) in the calculation. As a result, you should not consider this measure in isolation from, or as a substitute analysis for, the Group’s measures of financial position or liquidity as determined in accordance with IFRS. A reconciliation of borrowings to net debt is provided in note 23 in the Notes on the Accounts. BAT Annual Report and Form 20-F 2022 Strategic Report Governance Report Financial Statements Other Information Other Information Non-GAAP Measures Continued 334

This page is intentionally left blank BAT Annual Report and Form 20-F 2022 Strategic Report Governance Report Financial Statements Other Information 335
Results on a Constant Translational Currency Basis Movements in foreign exchange rates have impacted the Group’s financial results. The Group’s Management Board reviews certain of its results, including revenue, revenue growth from New Categories, adjusted profit from operations and adjusted diluted earnings per share, at constant rates of exchange. The Group calculates these financial measures at constant rates of exchange based on a re- translation, at prior year exchange rates, of the current year’s results of the Group and, where applicable, its geographic segments. The Group does not adjust for the normal transactional gains and losses in profit from operations that are generated by exchange movements. Although the Group does not believe that these measures are a substitute for IFRS measures, the Group’s Management Board does believe that such results excluding the impact of currency fluctuations year-on-year provide additional useful information to investors regarding the Group’s operating performance on a local currency basis. Accordingly, the constant rates of exchange financial measures appearing in the discussion of the Group results of operations (beginning on page 101) should be read in conjunction with the information provided in note 2 in the Notes on the Accounts. In 2022, 2021 and 2020, results were affected by translational exchange rate movements. In 2022, at the prevailing exchange rates, reported revenue increased by 7.7%, revenue from New Categories increased by 40.9% and adjusted profit from operations increased by 11.3% versus 2021. At constant rates of exchange, reported revenue would have increased by 2.3%, revenue from New Categories would have increased by 37.0% and adjusted profit from operations would have increased by 4.3%. This higher growth rate at prevailing exchange rates reflects the positive translational impact as a result of the relative weakening of the pound sterling. In 2021, at the prevailing exchange rates, revenue declined by 0.4%, revenue from New Categories increased by 42.4% and adjusted profit from operations decreased by 1.9% versus 2020. At constant rates of exchange, revenue would have increased by 6.9%, revenue from New Categories would have increased by 50.9% and adjusted profit from operations would have increased by 5.2%. This lower growth rate at prevailing exchange rates reflects the negative translational impact as a result of the relative strengthening of the pound sterling. In 2022, 2021 and 2020, adjusted diluted earnings per share was affected by translational exchange rate movements. In 2022, the adjusted diluted earnings per share of 371.4p, an increase of 12.9%, would, when translated at 2021 exchange rates, have been 348.1p, an increase of 5.8%. This higher growth rate, in 2022, at prevailing exchange rates, reflects the positive translational impact as a result of the relative weakness of the pound sterling. In 2021, the adjusted diluted earnings per share of 329.0p, a decrease of 0.8%, would, when translated at 2020 exchange rates, have been 353.5p, an increase of 6.6%. This lower growth rate, in 2021, at prevailing exchange rates, reflects the negative translational impact as a result of the relative strength of the pound sterling. BAT Annual Report and Form 20-F 2022 Strategic Report Governance Report Financial Statements Other Information Other Information Non-GAAP Measures Continued 336
As at 31 December 2022, the number of persons employed by the Group was 50,397 worldwide. The Group believes that its labour relations are good. Certain temporary employees are included in the below figures. The number of such temporary employees is approximately 224 in 2022 and largely relates to seasonal workers within operations. The following table sets forth the number of Group employees by region in 2022, 2021 and 2020. Region (number of employees worldwide) As of 31 December 2022 2021 2020 U.S. 4,152 4,405 4,921 AmSSA 15,090 15,565 15,873 Europe1 21,773 22,333 23,785 APME1 9,382 9,747 10,750 Total employees 50,397 52,050 55,329 Note: 1. Included within the employee numbers for Europe are certain employees in different locations in respect of central functions. Some of the costs of these employees are allocated or charged to the various regions and markets in the Group. From 1 January 2022, Algeria, Sudan, Libya, Morocco, Tunisia and Egypt moved to APME and Europe and North Africa (ENA) has been renamed Europe. No restatement of prior year figures has been made as the impact was not material to either Europe or APME. BAT Annual Report and Form 20-F 2022 Strategic Report Governance Report Financial Statements Other Information Employees 337
Additional Disclosures on Liquidity and Capital Resources The Group’s cash inflows derive principally from its operating activities. They are supplemented when required by cash flows from financing activities, typically to support general corporate requirements but also, from time to time, to support acquisitions. The principal sources of liquidity for the Group are cash flows generated from the operating business and proceeds from issuances of debt securities described below under ‘capital resources’. The Board reviews and agrees the overall treasury policies and procedures, delegating appropriate oversight to the Finance and Transformation Director and the treasury function. The treasury policies include a set of financing principles and key performance indicators. The Group’s treasury position is monitored by a Corporate Finance Committee chaired by the Finance and Transformation Director. Treasury operations are subject to periodic independent reviews and audits, both internal and external. In 2022, 2021 and 2020, all contractual borrowing covenants were met and none are expected to inhibit the Group’s operations or funding plans. In 2020, the Group’s financial covenant (interest cover) was removed from the terms of the revolving credit facility and syndicated term loan. Capital Expenditure Gross capital expenditures include purchases of property, plant and equipment and purchases of certain intangibles. The Group’s gross capital expenditures for 2022, 2021 and 2020 were £630 million, £664 million and £648 million, respectively, representing investment in the Group’s global operational infrastructure (including, but not limited to, the manufacturing network, trade marketing and IT systems). The Group expects gross capital expenditures in 2023 of approximately £600 million, representing the ongoing investment in the Group’s operational infrastructure, including the continued investment in New Categories. This is expected to be funded by the Group’s cash flows and existing facilities. Hedging Instruments As discussed in note 19 in the Notes on the Accounts, the Group hedges its exposure to interest rate movements and currency movements. BAT’s cash flow hedges are principally in respect of sales or purchases of inventory and certain debt instruments. A certain number of forward foreign currency contracts were used to manage the currency profile of external borrowings. Interest rate swaps have been used to manage the interest rate profile of external borrowings, while cross-currency swaps have been used to manage the currency profile of external borrowings. Capital Resources Policy The Group utilises cash pooling and zero balancing bank account structures in addition to intercompany loans and borrowings to ensure that there is the maximum mobilisation of cash within the Group. The key objectives of treasury in respect of cash and cash equivalents are to protect the principal value of the Group’s cash and cash equivalents, to concentrate cash at the centre to minimise the required long-term debt issuance, including perpetual hybrid debt treated as an equity instrument, and to optimise the yield earned. The amount of debt the Group issues is determined by forecasting the net debt requirement after the mobilisation of cash. Subsidiary companies are funded by share capital and retained earnings, loans from the central finance companies on commercial terms or through local borrowings by the subsidiaries in appropriate currencies. All contractual borrowing covenants have been met and none are expected to inhibit the Group’s operations or funding plans. Borrowings The following table sets out the Group’s long- and short-term borrowings as of the dates indicated: As of 31 December (£m)1 Currency Maturity dates Interest rates at 31 December 2022 2022 2021 2020 Eurobonds2 Euro 2023 to 2045 0.9% to 3.1% 7,149 7,316 8,875 Euro* — — 984 UK sterling 2024 to 2055 2.1% to 7.3% 3,884 4,086 4,590 Swiss franc 2026 1.4% 226 203 540 Bonds issued pursuant to rules under the U.S. Securities Act (as amended)2 U.S. dollar 2023 to 2052 1.7% to 8.1% 30,152 25,625 25,461 U.S. dollar 2022 USD3m LIBOR + 0.88 bps — 554 548 Commercial paper2 27 269 — Other loans 875 500 1,929 Bank loans 203 313 317 Bank overdrafts 106 346 249 Finance leases 517 446 475 Total 43,139 39,658 43,968 Notes: 1. The financial data above has been extracted from the Group’s consolidated financial statements. 2. The issuers of these debt securities are B.A.T. International Finance p.l.c., B.A.T Capital Corporation, Reynolds American Inc., or R.J. Reynolds Tobacco Company, as applicable. British American Tobacco p.l.c. is the ultimate guarantor in each case. Perpetual hybrid bonds issued by the Company have been classified as equity and therefore excluded from borrowings. * Eurobond with a maturity date in 2021 that was repaid in 2021. BAT Annual Report and Form 20-F 2022 Strategic Report Governance Report Financial Statements Other Information Other Information Additional Disclosures on Liquidity and Capital Resources 338
Off-Balance Sheet Arrangements and Contractual Obligations The Group has no significant off-balance sheet arrangements. The Group has contractual obligations to make future payments on debt agreements. In the normal course of business, the Group enters into contractual arrangements where the Group commits to future purchases of services from unaffiliated parties and related parties. The Group’s undiscounted contractual obligations as of 31 December 2022 were as follows: Payments due by period (£m) Total Less than 1 Year 1–3 Years 3–5 Years Thereafter Long-term notes and other borrowings, exclusive of interest1 42,615 3,889 8,660 7,089 22,977 Interest payments related to long-term notes1 524 524 — — — Lease liabilities 517 142 185 108 82 Purchase obligations2 1,332 1,150 182 — — Total cash obligations 44,988 5,705 9,027 7,197 23,059 Notes: 1. For more information about the Group’s long-term debt, see note 23 in the Notes on the Accounts. 2. Purchase obligations primarily include commitments to acquire tobacco leaf. Purchase orders for the purchase of other raw materials and other goods and services are not included in the table, as the Group’s operating subsidiaries are not able to determine the aggregate amount of such purchase orders that represent contractual obligations, as purchase orders typically represent authorisations to purchase rather than binding agreements. The table above does not include any amounts that the Group may pay to fund its retirement benefit plans as the timing and amount of any such future funding are unknown and dependent on, among other things, the future performance of defined benefit pension plan assets, interest rate assumptions and other factors. The net retirement benefit scheme assets totalled £51 million as of 31 December 2022, which is net of pension assets of £7,424 million. The Group expects to be required to contribute £110 million to its defined benefit plans during 2023. See note 15 in the Notes on the Accounts for further information. The above table also excludes any amounts in relation to service contracts which are disclosed in note 31 in the Notes on the Accounts. The Group has £80 million of future contractual commitments (2021: £90 million) related to property, plant and equipment. BAT Annual Report and Form 20-F 2022 Strategic Report Governance Report Financial Statements Other Information 339
The following is a summary of some of the risks and uncertainties, the occurrence of any one of which, alone or in combination with other events or circumstances, may materially adversely affect the Group’s results of operations and financial condition. You should read this summary together with the ‘Group Principal Risks’ section from pages 116 to 121 and the more detailed description of each risk factor contained below. Business execution and supply chain risks – Competition from illicit trade. – Geopolitical tensions that have the potential to disrupt the Group’s business in multiple markets. – Disruption to the Group’s data and information technology systems, including by cyber attack or the malicious manipulation or disclosure of confidential or sensitive information. – Failure to meet current or future New Categories demand. – Failure of a financial counterparty. – Exposure to unavailability of, and price volatility, in raw materials and increased costs of employment. – Failure to retain key personnel or to attract and retain skilled talent. – Disruption to the supply chain and distribution channels. – Failure to uphold the high standard of ESG management. – Failure to deliver digital innovation and drive digital transformation. – Inability to obtain adequate supplies of tobacco leaf. – Exposure to product contamination. – Failure to successfully design, implement and sustain an integrated operating model. – Failure to manage the Group’s climate change and circular economy risk. – Impact of a pandemic on the performance of the Group. Legal, regulatory and compliance risks – Exposure to, the enactment of, proposals for, or rumours of regulation that significantly impairs the Group’s ability to communicate, differentiate, market or launch its products and/or the lack of appropriate regulation for New Categories. – Adverse implications of EU legislation on single-use plastics that will result in on-pack environmental warnings and financial implications relating to the Extended Producer Responsibility (EPR). – Exposure to litigation, regulatory action or criminal investigations on tobacco, nicotine, New Categories and other issues. – Significant and/or unexpected increases or structural changes in tobacco and nicotine-related taxes. – Failure to comply with health and safety and environmental laws. – Exposure to unfavourable tax rulings. – Unexpected legislative changes to corporate income tax laws. – Exposure to potential liability under competition or antitrust laws. – Failure to establish and maintain adequate controls and procedures to comply with applicable securities, corporate governance and compliance regulations. – Loss of confidential information, including through manipulation of data by employees and system failure. – Failure to comply with product regulations due to uncertainty surrounding the proper interpretation and application of those regulations. – Failure to uphold high standards of corporate behaviour, including through unintended or malicious breach of anti-bribery and anti- corruption and other anti-financial crime laws. – Imposition of sanctions under sanctions regimes or similar international, regional or national measures. – Failure to uphold New Categories marketing practices. – Loss or misuse of personal data through a failure to comply with the European General Data Protection Regulation, the UK Data Protection Act 2018, e-Privacy laws and other privacy legislation governing the processing of personal data. Economic and financial risks – Foreign exchange rate exposures. – Inability to obtain price increases and exposure to risks from excessive price increases and value chain erosion. – Effects of declining consumption of legitimate tobacco products and a tough competitive environment. – Funding, liquidity and interest rate risks. – Failure to achieve growth through mergers, acquisitions, joint ventures, investments and other transactions. – Unforeseen underperformance in key global markets. – Increases in net liabilities under the Group’s retirement benefit schemes. Product pipeline, commercialisation and Intellectual Property risks – Inability to predict consumers’ changing behaviours and launch innovative products that offer adult tobacco and nicotine consumers meaningful value-added differentiation. – Exposure to risks associated with intellectual property rights, including the failure to identify, protect and prevent infringement of the Group’s intellectual property rights and potential infringement of, or the failure to retain licences to use, third-party intellectual property rights. BAT Annual Report and Form 20-F 2022 Strategic Report Governance Report Financial Statements Other Information Other Information Summary of Group Risk Factors 340
Business Execution and Supply Chain Risks Risk: Competition from illicit trade Description Illicit trade, illegal products and tobacco trafficking in the form of counterfeit products, smuggled genuine products (product diversion), and locally manufactured products, which do not comply with applicable regulations and/or in which applicable taxes are evaded, represent a significant and growing threat to the legitimate tobacco industry, including New Categories products. Factors such as increasing levels of taxation, price increases, economic downturn, lack of law enforcement, appropriate penalties and weak border control are encouraging more adult tobacco and New Categories consumers to switch to illegal cheaper tobacco and New Categories products and are providing greater rewards for counterfeiters and smugglers. Regulatory restrictions such as plain packaging or graphic health warnings, display bans, flavour or ingredient restrictions and increased compliance costs further disadvantage legitimate industry participants by providing competitive advantages to illicit manufacturers and distributors of illicit tobacco and New Categories products. In addition, third parties may seek to divert products when there is an arbitrage opportunity for them between lower and higher excise countries. Impact Illicit trade has an adverse effect on the Group’s overall sales volume and may restrict the ability to increase selling prices. Illicit trade can also damage brand equity and reputation, which could undermine the Group’s investment in Trade Marketing and Distribution. Operational costs (e.g. track and trace costs) can increase and the product may become commoditised. These factors in turn could reduce profits and have an adverse effect on the Group’s results of operations and financial conditions and cause the Group to fail to deliver on its strategic growth plans. Further, counterfeit products (especially New Categories) and other illicit products could harm consumers, damaging goodwill and/or the category (with lower volumes and reduced profits), and potentially leading to misplaced claims against BAT, further regulation and a failure to deliver our corporate harm reduction objective. In addition, as the Group has contractual and legislative obligations to prevent the diversion of our products into illicit channels, actual and perceived breaches of the obligations to prevent product diversion into illicit channels can lead to substantial fines in the forms of seizure payments and legislative penalties (including financial penalties), as well as the risk of reputational damage (including negative perceptions of our governance and our ESG credentials) from Group products being found in illicit channels. Risk: Geopolitical tensions that have the potential to disrupt the Group’s business in multiple markets Description The Group’s operations and financial condition are influenced by the economic and political situations in the markets and regions in which it has operations, which are often unpredictable and outside of its control. Some markets in which the Group operates face the threat of civil unrest and can be subject to frequent changes in regime. In others, there is a risk of terrorism, conflict, global health crisis, war, organised crime or other criminal activity. The Group is also exposed to economic policy changes in jurisdictions in which it operates. In addition, some markets maintain trade barriers or adopt policies that favour domestic producers, preventing or restricting the Group’s sales. Impact Deterioration of socio-economic or political conditions could lead to injury or loss of life, restricted mobility, loss of assets and/or denial of access to BAT sites that reduce the Group’s access to particular markets or may disrupt the Group’s operations, such as supply chain, or manufacturing or distribution capabilities. Such disruption may result in increased taxes and/or other costs due to the need for more complex supply chain and security arrangements, to build new facilities or to maintain inefficient facilities, or in a reduction of the Group’s sales volume. Further, there may be reputational damage, including negative perceptions of our governance and protection of our people and our ESG credentials. Risk: Disruption to the Group’s data and information technology systems, including by cyber attack or the malicious manipulation or disclosure of confidential or sensitive information Description The Group increasingly relies on data and information technology systems for its daily business operations, internal communications, controls, reporting and relations with customers and suppliers. Some of these systems are managed by third-party service providers. A significant disruption of the Group’s systems, including those managed by third-party service providers, due to computer viruses, cyber threats, malicious intrusions or unintended or malicious behaviour by employees, contractors or services providers could affect the Group’s communications and operations. Computer viruses and cyber attacks are becoming more sophisticated and coordinated. In addition, such disruption may compromise the integrity of information and result in the inappropriate disclosure of confidential information, or may lead to false or misleading statements being made about the Group. Impact Any disruption to technology systems related to the Group’s operations could adversely affect its business and result in financial and reputational losses. Any delays or failure to rapidly detect or respond to attempts to gain unauthorised access to the Group’s information technology systems through a cyber attack can lead to a loss of access to systems or information being corrupted or lost, resulting in significantly increased costs for remediation and reputational consequences. Any delay in response will also impact the outcome. Security breaches and the loss of data or operational capacity may disrupt relationships throughout the supply chain, expose the Group or our consumers to a risk of loss or misuse of information, which could further expose the Group to liability, impact the Group’s reputation and lead to increased costs. The disclosure of trade secrets or other commercially sensitive information may provide competitors with a competitive advantage resulting in competitive or operational damage to the Group. The disclosure of confidential and sensitive information about the Group’s employees, customers, consumers, suppliers or other third parties could compromise data privacy and expose the Group to liability. Failure to effectively prevent or respond to a major breach or cyber attack may also subject the Group to significant reputational damage. BAT Annual Report and Form 20-F 2022 Strategic Report Governance Report Financial Statements Other Information Group Risk Factors 341
Business Execution and Supply Chain Risks continued Risk: Failure to meet current or future New Categories demand Description The New Categories supply chain is a multi-tiered and complex environment with reliance on multiple factors, such as third-party suppliers’ ability to upscale production in order to meet demand while maintaining product quality, dependency on single suppliers at various points in the chain and the Group’s ability to build adequate consumables production capacity in line with product demand. The geographical spread of suppliers and customers exposes the Group to political and economic issues such as Brexit and trade wars which may compromise the New Categories supply chain. Given the developing nature of the New Categories portfolio, there is also an enhanced risk that some products may not meet product quality and safety standards or may be subject to regulatory changes, leading to product recalls, which we have experienced in the past, or bans of certain ingredients or products. In addition, the New Categories supply chain may be vulnerable to changes in local legislation related to liquid nicotine that could increase import duties. Furthermore, the New Categories supply chain includes the development of sensitive trade secrets jointly with external design partners, which carries the risk of exposure of innovations to competitors. Impact Vulnerabilities in the New Categories supply chain may impact the Group’s ability to maintain supply and meet the current and future demand requirements across the New Categories portfolio, potentially resulting in significant reputational harm and financial impact that may negatively affect the Group’s results of operations and financial condition and cause the Group to fail to deliver on its strategic growth plans. Over-forecasting may also lead to write-offs and negatively impact working capital. The design of New Categories devices may also prevent the scaling of commercial manufacturing, which will either restrict supply or increase the costs of production. Further, there may be loss of investors’ confidence in ESG performance, including failure to deliver our corporate purpose of harm reduction. In addition, changes in local legislation related to liquid nicotine import duties may increase New Categories production costs, which may increase end market pricing and reduce demand. Furthermore, the exposure of sensitive trade secrets can lead to competitive disadvantages and further negatively impact the Group’s results of operations and financial condition and cause the Group to fail to deliver on its strategic growth plans. Risk: Failure of a financial counterparty Description The Group relies on transactions with a variety of financial counterparties to manage the Group’s business and financial risks. In the event that any of these counterparties fails, payments due from such counterparties, such as under hedging or insurance contracts, may not be recovered. In addition, failure of a transactional banking party may lead to the loss of cash balances and disruption to payment systems involving such counterparty. Impact The inability to recover payments due from one or more failed financial counterparties or the loss of cash balances may cause significant financial loss and have an adverse impact on the Group’s results of operations, financial condition and financial risk profile. In addition, the loss of cash balances or a disruption to payment systems may cause disruption to the Group’s ongoing operations and ability to pay its creditors and suppliers. Risk: Exposure to unavailability of, and price volatility, in raw materials and increased costs of employment Description The availability and price of various commodities required in the manufacture of the Group’s products fluctuate. Raw materials and other inputs used in the Group’s business, such as wood pulp and energy, are commodities that are subject to price volatility caused by numerous factors, including inflation, political influence, market fluctuations and natural disasters. Similarly, the Group is exposed to the risk of an increase above inflation in employment costs, including due to governmental action to introduce or increase minimum wages. Employment and health care law changes and the increase in inflation may also increase the cost of provided health care and other employment benefits expenses. Impact Restricted availability and price volatility of commodities may result in supply shortages and unexpected increases in costs for raw materials and packaging for the Group’s products, which may affect the Group’s results of operations and financial condition. Similarly, the Group’s profitability may be affected by increases in overall employment costs. The Group may not be able to increase prices to offset increased costs without suffering reduced sales volume and revenue. In the absence of compensating for increased costs through pricing, significant increases in raw material, packaging and employment costs above inflation will impact product margins, leading to lower profits and negatively affecting the Group’s results of operations and financial condition and cause the Group to fail to deliver on its strategic growth plans. BAT Annual Report and Form 20-F 2022 Strategic Report Governance Report Financial Statements Other Information Other Information Group Risk Factors Continued 342
Risk: Failure to retain key personnel or to attract and retain skilled talent Description The Group relies on a number of highly experienced employees with detailed knowledge of the tobacco industry, other areas of focus for the Group (including New Categories and Beyond Nicotine) and the Group’s business. Similarly, the Group is dependent on its ability to identify, attract, develop and retain such qualified personnel in the future. The Group is also dependent on external hires to ensure that there are the right new business critical capabilities and knowledge to accelerate transformation. BAT anticipates that this trend will continue and therefore the ability to continue to build awareness, increase reach and ultimately attract the new target audience remains a primary focus. The shift in career development expectations from new hires are leading to shorter tenures. Although the Group is increasing its effort on retaining critical capabilities and knowledge, following any departure of new external hires, there can be no assurance that this effort will be successful. Furthermore, broader economic and ESG trends may impact the Group’s ability to retain key employees and may increase competition for highly talented employees, potentially resulting in the loss of experienced employees. Impact If the Group is unable to retain its existing key employees or to attract and retain skilled talent in the future, critical positions may be left vacant, which could adversely impact the delivery of strategic objectives, which could ultimately impact the Group’s results of operations, financial condition and achieving its ESG related ambitions and cause the Group to fail to deliver on its strategic growth plans. High voluntary employee turnover may also reduce organisational performance and productivity, which may have a further adverse impact on the Group’s results of operations and financial condition and cause the Group to fail to deliver on its strategic growth plans. Risk: Disruption to the supply chain and distribution channels Description The Group has an increasingly global approach to managing its supply chain and distribution channels and is exposed to the risk of disruption to any aspect of the Group’s supply chain, to suppliers’ operations or to distribution channels, and the deterioration in the financial condition of a trading partner. This is especially so in our New Categories Supply Chain which is a multi-tiered and complex environment. Such disruption may be caused by a cyber event, global health crisis, political tensions, strikes, riots, civil commotion, major fire, violent weather conditions or other natural disasters that affect manufacturing or other facilities of the Group’s operating subsidiaries or those of their suppliers and distributors. In certain geographic areas where the Group operates, insurance coverage may not be obtainable on commercially reasonable terms, if at all. Coverage may be subject to limitations or the Group may be unable to recover damages from its insurers. Disruption may also be caused by spread of infectious disease (such as the COVID-19 pandemic) or by a deterioration/shortage in labour or union relations, disputes or work stoppages or other labour-related developments within the Group or its suppliers and distributors. In addition, the Group’s operating subsidiaries may not be able to establish or maintain relationships on favourable commercial terms with their suppliers and distributors. In some markets, distribution of the Group’s products is through third-party monopoly channels, often licensed by governments. The Group may be unable to renew these third-party supplier and distribution agreements on satisfactory terms for numerous reasons, including government regulations or ESG considerations. Furthermore, there are some product categories for which the Group does not have spare production capacity or where substitution between different production plants is very difficult. Consolidation of global suppliers and certain distributors that control large geographies may reduce the Group’s availability of alternatives and negatively impact the Group’s negotiating power with key suppliers and distributors. These risks are particularly relevant in jurisdictions where the Group’s manufacturing facilities are more concentrated or for certain product categories where production is more centralised. Impact Any disruption to the Group’s supply chain and distribution channels could have an adverse effect on the results of operations and financial conditions of the Group through failures to meet shipment demand, contract disputes, increased costs, loss of market share and inability to reinvest into New Category and support harm reduction agenda and cause the Group to fail to deliver on its strategic growth plans. BAT Annual Report and Form 20-F 2022 Strategic Report Governance Report Financial Statements Other Information 343
Business Execution and Supply Chain Risks continued Risk: Failure to uphold the high standard of ESG management Description Stakeholder expectations of the Group’s ESG performance are continually evolving. The Group may fail to have the appropriate internal standards, strategic plans and governance, monitoring and reporting mechanisms in place to ensure it can identify emerging issues, meet external expectations and align with recognised international standards. In addition, the Group relies on third-parties for certain ESG monitoring and measurement services, the provision of carbon-offsets and other ESG-related services. Such service providers may fail to perform these services to the specified standards. Impact Failure to uphold high standards of ESG management or provide transparent and consistent reporting could significantly impact Group reputation and reduce investor confidence. In addition, poor performance across any aspect of ESG, such as a failure to address climate change or human rights impacts across the Group’s business and supply chain, could result in increased regulation, difficulty in attracting and retaining talent, criminal or civil prosecution, or decreases in consumer demand for our products. Poor performance can also result in our failure to deliver our ESG targets. Failure to responsibly and transparently market our products and communicate our achievements and position, such that we are accused of greenwashing, can potentially cause reputational damage and litigation impacts. In addition, the Group's association with any provider of ESG-related services that fails to perform its services for the Group or third-parties to the specified standard or is alleged to have done so could also result in reputational damage and litigation impacts. Risk: Failure to deliver digital innovation and drive digital transformation. Description The Group’s strategy in areas of further growth and increasing profitability depends to a large extent on digital transformation and innovation. Digital transformation and innovation are key drivers of the Group’s ethos and QUEST, which includes new and modern categories of products, increased interaction with customers, data-driven decision making and cost optimisation efforts driven by automated and modernised processes. Examples of the Group’s ambitions that depend on digital transformation include: – the ability to leverage our data assets to generate insights and foresights as a key driver of revenue growth; – the expansion and flexibility of technology solutions to streamline the market realisation of new products and marketing campaigns; and – the ability to build new solutions and the flexibility to react to market disruptions. The Group must effectively implement new ways of working and supporting technologies to fully develop the digital agenda defined by the Board (e.g. digital channels, data and analytics, automation, etc.). The Group may see stalled progress in the pace of digital transformation and hampered strategy goals realisation if the necessary information and digital technology is not ready to support the business implementation of global functional transformations (e.g. direct relationship with consumers, integrated planning, demand forecasting and revenue growth management). The unavailability of the necessary digital technology may be due to missing technology capabilities, lack of scalability or poor data quality. Shortage of skills and ineffective ways of working may slow down the pace of the Group’s digital transformation and hamper its value realisation processes. Regulation may also limit the use of the data necessary for the Group's digital transformation. In addition, sub-optimal design of the global digital platforms implemented by the Group may lead to the fragmentation and under-utilisation of such platforms and slow down the Group’s digital transformation. Impact The Group’s multi-category strategy requires dealing with different consumer needs and behaviours as well as complying with various regulations, which increasingly require the expansion and flexibility of technology solutions. This may lead to the fragmentation and under-utilisation of existing and future technology solutions. Similarly, increased control and centralisation of the technology solutions and delivery mechanisms may slow down the effective delivery of the Group’s digital transformation and innovation. The Group’s inability to adapt to the ever-changing digital space and fully exploit the value expected from digital transformation may have an adverse impact on its competitive edge, market share and profitability, and may prevent the Group from reaching its medium and long-term financial targets. BAT Annual Report and Form 20-F 2022 Strategic Report Governance Report Financial Statements Other Information Other Information Group Risk Factors Continued 344
Risk: Inability to obtain adequate supplies of tobacco leaf Description The Group purchases significant volumes of packed leaf each year. Tobacco leaf, as any other agricultural commodity, can be impacted by a variety of external factors. Like any other agricultural supply chain, it can be particularly vulnerable to a range of challenges, including climate change, weather-related events, such as drought, flood and other natural disasters, increasing demand for land and natural resources, rural poverty, social inequality, child labour and ageing farmer populations.Tobacco production in certain countries is also subject to a variety of controls, including regulation affecting farming and production control programmes, and competition for land use from other agriculture commodities. Such controls and competition can further constrain the production of tobacco leaf, raising prices and reducing supply. The Group recognises the above and any combination of those, including topics like child labour, as a risk to our tobacco leaf supply chain. Impact Restricted availability of tobacco leaf may prevent the Group accessing sufficient tobacco leaf that meets volume, quality and the Group’s ESG compliance requirements. This could lead to an impact in the quality of the Group's products to a level that may be perceptible by consumers and may impact the Group's ability to deliver on consumer needs.The Group’s commitment to ESG may restrict the sources we can buy from, which would result in an imbalance in supply and demand potentially causing incremental tobacco prices. Higher tobacco leaf prices would result in increased raw material costs and have an adverse effect on the Group's financial condition. The Group may also experience reputational damage from not adequately managing its sustainability priorities like climate change, protection of natural resources, including forests, and human rights in our leaf supply chain, which may restrict suppliers willing to do business with us. Risk: Exposure to product contamination Description The Group may experience product contamination, whether by accident or deliberate malicious intent, during supply chain or manufacturing processes, or may otherwise fail to comply with the Group’s quality standards. The Group may also receive threats of malicious tampering. Impact Product contamination or threats of contamination may expose the Group to significant costs associated with recalling products from the market or temporarily ceasing production. In addition, adult tobacco consumers may lose confidence in the specific brand affected by the contamination, resulting in reputational damage and a loss of sales volume and market share. The Group could be subject to liability and costs associated with civil and criminal actions as well as regulatory sanctions brought in connection with a contamination of the Group’s products. Each of these results may in turn have an adverse effect on the Group’s results of operations, financial condition and reputation and cause the Group to fail to deliver on its strategic growth plans. Risk: Failure to successfully design, implement and sustain an integrated operating model Description The Group aims to improve profitability and productivity through supply chain improvements and the implementation of an integrated operating model and organisational structure, including standardisation of processes, centralised back-office services and a common IT platform. The Group undertakes transformation initiatives periodically which aim to simplify the organisation and facilitate growth. The Group’s efforts to achieve these goals are driven and enabled through use of our TaO (central SAP ERP system) global template – a standardised process used by the Group with the use of a central SAP instance common for the Group's subsidiaries. These processes include, among others, core back-office global processes, procurement, warehouse management, accounting and controlling. Impact Failure by the Group to successfully design, implement and sustain the integrated operating model, organisational structure and transformation initiatives could lead to the failure to realise anticipated benefits, increased costs, disruption to operations, decreased trading performance, disgruntled employees, loss of institutional knowledge and reduced market share. These results could in turn reduce profitability and funds available for investment by the Group in long-term growth opportunities. Lack of adherence to the TaO template, as well as template degradation over time, may result in the failure to maintain achieved productivity gains and capture additional productivity gains which may in turn have an adverse effect on the Group’s results of operations and financial condition and cause the Group to fail to deliver on its strategic growth plans. BAT Annual Report and Form 20-F 2022 Strategic Report Governance Report Financial Statements Other Information 345
Business Execution and Supply Chain Risks continued Risk: Failure to manage the Group’s climate change and circular economy risk Description The Group is exposed to physical risks associated with climate change from severe weather events such as flooding, drought and storms across its global operations and supply chain. Climate change may cause acute physical risks such as more frequent and severe weather events, or chronic risks such as those related to longer-term shifts in climate patterns and temperatures. These, alongside their direct impact on Group operations, could lead to reductions in the supply and quality of tobacco leaf and other physical goods and cause transport and logistics disruptions in our supply chains. The Group may also experience transition risks associated with the move to a low carbon economy. The Group is exposed to risks associated with the move towards a circular economy, including product-related regulatory risks, such as product design/disassembly requirements and Extended Producer Responsibility (EPR) requirements. As climate change and circular economy-related legislation and reporting requirements further evolve, companies need to effectively identify, assess, monitor and mitigate associated transition risks; failure to do so adequately or less well than others could lead to BAT scoring lower in ESG ratings and indices used by financial actors in making investment decisions. As consumer and customers behaviours and expectations evolve, the Group may fail to sufficiently adapt its product portfolio and marketing strategy in response to stakeholders' increasing environmental (and social) sustainability expectations. Climate change and circular economy-related considerations, including relevant aspects of products and value chains, may result in a potential reduced demand for or rejection of the Group’s products as well as reputational risk in relation to sustainability matters. Impact Disruption to the Group's agricultural or non-agricultural supply chain or distribution channels could have an adverse effect on its operations and financial condition through failures to meet product demand, contract disputes, increased costs and loss of market share. Consumer and customer behaviours and expectations may influence their purchasing decisions and may lead them to seek alternative product offerings. An inability to develop and commercialise products, packaging or value chain sustainability innovations in-line with demand or less well than competitors, including failures to adequately predict changes in consumer and societal behaviour and expectations and reflect them in the product portfolio, could lead to missed commercial opportunities, under- or over-supply, loss of competitive advantage, loss of market share, unrecoverable costs and the erosion of the Group's consumer base or brand equity.This includes potential impacts from a failure to adequately manage product-related matter and EPR requirements. In addition, consumers failing to engage in product recycling and/or Take-Back schemes could also have an impact on the Group’s product-related and EPR risks and requirements. Material non-compliance with climate change or circular economy-related legislation or reporting requirements could reduce BAT's ability to attract investors, result in reputational damage and potentially regulatory sanctions. Poor results in ESG ratings and indices used by financial actors may negatively impact their investment decision, and thereby increase the cost of capital or negatively impact share price. Failure to meet current and future employees’ expectations concerning the Group’s actions to mitigate and adapt to climate change or address circular economy matters may negatively impact the retention and/or attraction of high-quality employees. BAT Annual Report and Form 20-F 2022 Strategic Report Governance Report Financial Statements Other Information Other Information Group Risk Factors Continued 346
Risk: Impact of a pandemic on the performance of the Group Description The Group continues to closely monitor the potential for disruption arising from pandemics, the most recent having been coronavirus ( COVID-19). Consequences may include significant logistical challenges for employees and their ability to perform their duties, potential loss of lives or significant level of illness in the workforce, inability to deliver revenue stream and market share targets impacting profits and cash flows, and disruption to the supply chain and third parties being unable to deliver contractual goods and services. In addition, some countries in which the Group operates have adopted regulations restricting the ability to manufacture, distribute, market and sell products. Impact The influence of COVID-19, future variants and other pandemics on the Group's operations and financial condition is difficult to predict given the wide range of determining factors, not least the nature of the pandemic/virus, its speed of infection, geographical scope and duration. The impact of a pandemic on global economic activity and the nature and severity of measures adopted by governments are numerous. The impact on the Group is not limited to: – Reductions or volatility in consumer demand for one or more of our products due to illness, retail closures, quarantine or other travel restrictions, health consciousness (quitting use of tobacco and nicotine products), government restrictions, the deterioration of socio-economic conditions, economic hardship and customer-downtrading (switching to a cheaper brand), which may impact the Group’s market share. – Disruptions to the Group’s operations, such as its supply chain, or manufacturing or distribution capabilities, which may result in increased costs due to the need for more complex supply chain arrangements, to expand existing facilities or to maintain inefficient facilities, a reduction of the Group’s sales volumes or an increase in bad debts from customers. – Disruption to the Group’s operations resulting from a significant number of the Group’s employees, including employees performing key functions, working remotely for extended periods of time or becoming ill, which may reduce the employees’ efficiency and productivity and cause product development delays, hamper new product innovation and have other adverse effects on the Group’s business. – Significant volatility in financial markets (including exchange rate volatility) and measures adopted by governments and central banks that further restrict liquidity, which may limit the Group’s access to funds, lead to shortages of cash and cash equivalents needed to operate the Group’s business, and impact the Group’s ability to refinance its existing debt. – Regulations restricting the ability to manufacture, distribute, market and sell products, and potentially increasing illicit trade. – Governments seeking to increase revenues through increased corporate taxes and excise in combustible and/or New Category products, increasing the cost and prices of our products – which could reduce volumes and margins, and/or increase illicit trade. All of these factors may have material adverse effects on the Group’s results of operations and financial condition and cause the Group to fail to deliver on its strategic growth plans. BAT Annual Report and Form 20-F 2022 Strategic Report Governance Report Financial Statements Other Information 347
Legal, Regulatory and Compliance Risks Risk: Exposure to, the enactment of, proposals for, or rumours of regulation that significantly impairs the Group’s ability to communicate, differentiate, market or launch its products and/or the lack of appropriate regulation for New Categories Description Tobacco control measures are in place in nearly all markets in which we operate and specific regulations for non-tobacco nicotine products and Beyond Nicotine products (including CBD) are gaining momentum. Such restrictions are introduced by legislation, regulations and/or voluntary agreements. Most tobacco and nicotine control measures can be categorised as follows: – Category Bans: including regulations that ban the sale, import, possession, or use of certain product categories, entirely (e.g. New Categories); – Place: including regulations restricting consumption in private and public spaces (e.g. public place smoking or vaping bans, including restaurants and bars); – Product: including regulations on the use of or testing for ingredients, product design and attributes (e.g. tar/ nicotine / carbon monoxide ceilings) flavours bans (including menthol); product safety (e.g. reduced cigarette ignition propensity standards); product disclosure (e.g. ingredients and emissions) and environmental impact (e.g. Extended Producer Responsibility (EPR) requirements for cigarette filters); – Packaging and labelling: including regulations on health warnings and other government-mandated messages; restrictions on the use of certain descriptors and brand names; requirements on pack shape, size, weight and colour; and mandatory plain packaging; – Advertising, promotion and sponsorship: including partial or total bans on advertising , promotions and sponsorship, and online and direct engagement communication; – Purchase: including regulations on where the products are sold, such as type of outlet (e.g. supermarkets and vending machines), radius or distance restrictions (e.g. 300 meters from a school), online sales bans, regulation regarding how they are sold and displayed (e.g. above the counter or under the counter) and minimum purchase age and increases thereto; and – Price: including regulations that have implications on prices and margins (e.g. excise taxes, minimum prices and import/export duties). The Group believes that further tobacco control and nicotine regulation is expected over the medium term in many of the Group’s markets. Irresponsible behaviour or marketing practices of competitors (for example where there is a lack of appropriate regulation) or actions contrary to the regulations in certain markets, may cause reputational harm to the industry as a whole and may result in additional regulation or bans. Further, there is pressure on governments from international organisations and agencies, tobacco control NGOs, vanguard regulators and the private sector (including philanthropists, pharmaceutical and security technology companies and social justice groups) to pursue regulatory policies and implement tobacco or nicotine product-related regulation which is not science or evidence based and is aimed at increasing the complexity and cost burden on the tobacco or nicotine industry, limiting the commercial viability of tobacco and nicotine products or prohibiting the products completely. Regulators may be lacking in understanding of New Categories products and their role in tobacco harm reduction due to their novelty. These factors can lead to a lack of adequate or existing regulatory regimes or clear and appropriate product classifications. In addition, the Group may fail to implement the right level of control measures or to maintain adequate standards of compliance with regulatory measures. For example, the Group’s marketing activities may fail to comply with the relevant law and regulations or with the Group’s International Marketing Principles. Insufficient information, instruction and training in the relevant areas and a lack of knowledge of the existence and/or requirements of relevant regulations including tobacco and nicotine as well as other relevant regulations, such as battery regulation, or a failure to monitor, assess and implement the requirements of new or modified regulation, may increase these risks. There may also be negative and disproportionate societal responses to consumer abuse or misuse of tobacco and/or nicotine products (e.g. in New Categories) or to certain categories of products. With respect to Modern Oral and other New Categories, regulatory frameworks currently follow divergent approaches. In certain markets, where there is an absence of adequate regulation, actions of irresponsible competitors may cause reputational harm to the category and result in outright bans or adverse regulation. In markets where there is a likelihood of tobacco, pharmaceutical or food regulatory classification, the category can be at risk of severe regulation or total ban. The Group believes that Tobacco Heated Products are likely to be regulated as traditional tobacco products, driven by the decision of WHO’s 7th Conference of Parties to the Framework Convention on Tobacco Control, and Reports from the WHO submitted to the COP9 for noting, to apply tobacco control regulations to these products including recommendations for plain packaging and flavour bans. BAT Annual Report and Form 20-F 2022 Strategic Report Governance Report Financial Statements Other Information Other Information Group Risk Factors Continued 348
Traditional Tobacco Products With respect to tobacco and combustible products, many of the measures outlined in the FCTC have been or are in the process of being implemented through national legislation in many markets in which the Group operates, including recommendations for plain packaging and flavour bans (e.g. menthol bans – in effect in the European Union since 20 May 2020). In April 2022, the U.S. Food and Drug Administration (FDA) published proposed product standards that would ban menthol as a characterising flavour in cigarettes in the U.S. if finalised. In December 2022, the sale of all tobacco products with characterising flavours (including menthol) other than tobacco were banned in the state of California, which is the most populated state in the U.S. Further, various national or international regulatory regimes may seek to require the reduction of nicotine levels in tobacco products. In March 2018, the FDA published its Advanced Notice of Proposed Rulemaking titled “Tobacco Product Standard for Nicotine Level of Combusted Cigarettes” and invited interested parties to submit comments on, among other issues, maximum nicotine limits and whether any maximum nicotine level should apply to combustible tobacco products. In October 2019, the FDA withdrew the Advanced Notice of Proposed Rulemaking without explanation. Then, in June 2022, the FDA announced a plan to move forward with a proposed rule reducing nicotine levels in cigarettes to “minimally or non-addictive” levels, but the agency has said that there is no precise date on which it plans to issue this proposed rule. In the U.S., manufacturers of all tobacco products deemed to be under the authority of the FDA as of 2016 (which includes Vapour and Modern Oral products that contain or can be used with tobacco-derived nicotine) must submit information to the FDA seeking formal marketing authorisation of such products. The New Zealand Smokefree Aotearoa 2025 Bill came into force on 1 January 2023. It implements a ban on anyone born after 1 January 2009 from buying tobacco products, will implement a retail limit of 600 retailers across New Zealand from 1 July 2024, and will implement a nicotine limit in smoked tobacco to 0.8 mg/g (~5% of current levels) from 1 April 2025. A consultation on how to apply the retail limit and nicotine restrictions will close on 15 March 2023. Finally, the preparations of a revised EU Tobacco Products Directive are progressing, with estimated adoption in 2025. The current Directive might be replaced with a directly applicable regulation, following which transposition in Member States would no longer be required. It is anticipated that this new regulation could include plain packaging for combustibles and/or greater regulation of tobacco and nicotine product ingredients. New Categories With respect to New Categories, regulation is still evolving and frameworks for regulation and taxation vary from country to country. Some regulators have applied or are considering applying combustible tobacco products’ restrictive regulatory framework to New Categories. Some jurisdictions have banned or are considering banning certain New Category products altogether. Following reports of individuals experiencing acute respiratory injury in suspected association with vaping certain e-liquids (EVALI) and reports regarding vaping youth usage in the U.S., stricter regulatory views gained momentum and were publicly supported by the World Health Organization (WHO) which continues to call on countries to ban or regulate novel nicotine products as tobacco. The U.S., the EU and Canada are playing a leading role across all identified regulatory risks, including: bans on flavours, sales channel bans, advertising restrictions and nicotine limits, among others. The FDA granted marketing authorisation for the Vuse Solo device and its tobacco (“original”) flavour in October 2021, but denied authorisation for Vuse Solo flavours other than menthol (which were not on the market). That denial is being appealed with the FDA. In May 2022, the FDA issued marketing authorisation orders for tobacco flavoured Vuse Vibe and Ciro but denied authorisation for flavours other than menthol (which were not on the market). This denial in relation to Vuse Vibe and Ciro has been appealed through a request for further Agency review. We have received and are challenging the FDA's Market Denial Order dated January 2023 related to Vibe and Ciro (menthol variants) and are seeking a permanent stay.There can be no assurance that the Vuse menthol or other flavours appeals will succeed. Additionally, the continued marketing authorisations of Vuse products is contingent on continued compliance with regulatory requirements. The marketing authorisation may be suspended or withdrawn if the FDA determines that the continued marketing of the products are no longer appropriate for the protection of the public health. The FDA has not issued marketing authorisations for Vuse Alto and its associated flavours, including menthol, with FDA decisions still pending. Although the Vuse Alto menthol and tobacco flavoured products remain on the market pending FDA decisions there can be no assurance that these authorisations (or the other Vuse Alto flavours) will be granted. Similarly, the Group’s Velo products remain on the market in the U.S., again pending FDA decisions on their marketing authorisations, and there can be no assurance these will be granted. If the FDA denies a marketing authorisation then the relevant product(s) would need to be withdrawn from the market (unless a court or the FDA intervenes). Beyond Nicotine As the Group also looks to Beyond Nicotine products including CBD and cannabis (in connection with its investments in Organigram, Sanity Group and Charlotte's Web), it may be subject to additional regulation and these products might not be scalable on a global basis given varying degrees of regulation. Please refer to the discussion of tobacco and nicotine regulatory regimes under which the Group’s businesses operate set out from page 362. BAT Annual Report and Form 20-F 2022 Strategic Report Governance Report Financial Statements Other Information 349
Legal, Regulatory and Compliance Risks continued Risk: Exposure to, the enactment of, proposals for, or rumours of regulation that significantly impairs the Group’s ability to communicate, differentiate, market or launch its products and/or the lack of appropriate regulation for New Categories continued Impact Existing and future regulatory measures impacting one or more New Categories and/or Beyond Nicotine and/or traditional tobacco products could adversely affect volume, revenue and profits, as a result of: restrictions on the Group’s ability to sell and differentiate its products or brands, leverage price, innovate, make scientific claims, compete in future product categories and make new market entries; regulations (e.g. pharma or food) or total bans of tobacco and/or New Categories products in certain markets; reduced margins due to increased operating costs; impediments to building or maintaining brand equity; and restrictions on the Group’s ability to deliver, market and sell existing or new products responding to consumers’ preferences. In addition, new (and changes to existing) regulation could lead to greater complexity, as well as higher production and compliance costs. As an example, through the acquisition of Reynolds American Inc., the Group acquired the Newport brand, the leading menthol cigarette brand in the U.S., the Group’s largest single market. The sales of Newport, together with the other menthol brands of the Group’s operating subsidiaries, represent a significant portion of the Group’s total net sales. Any action by the FDA or any other governmental authority banning or materially restricting the use of menthol in tobacco products (such as the ban, from December 2022, in California) could have a significant negative impact on sales volumes which would, in turn, have an adverse effect on the results of operations and financial position of the Group. Regulations can also have an adverse impact on the Group’s ability to compete within the legitimate tobacco, nicotine or New Categories industry and with illicit traders or legal operators exploiting legal and regulatory loop holes. Regulations could also lead to reduced consumer acceptability of new product specifications, leading to consumers seeking alternatives in illicit markets. Unclear or inadequate regulations can lead to legal uncertainty, impacting the Group’s position in the marketplace. In the specific case of New Categories, our corporate harm reduction ambition, including of New Categories revenue of £5 billion by 2025 and 50 million consumers of Non-Combustible products by 2030 could be at risk if stricter regulatory views are imposed at a global scale, or if appropriate regulation is lacking or there is a lack of acceptance of tobacco harm reduction as a tobacco control policy (preventing a balanced regulatory framework for New Categories). Any action by the FDA or any government authority restricting the use of New Category products could also have an adverse effect on the operation and financial position of the Group and the possible failure of the Group’s harm reduction objective and loss of confidence in the Group’s ESG performance. As a reflection of the real or perceived impact of stricter regulation in our business, the Group’s share price has also experienced, and could in the future experience, shocks upon the announcement, rumour of or enactment of restrictive regulation. All these effects may have an adverse effect on the Group’s results of operations and financial conditions and cause the Group to fail to deliver on its strategic growth plans. In addition, considering the significant number of regulations that may apply to the Group’s businesses across the world, the Group is and may in the future be subject to claims for breach of such regulations. Government authorities (such as the FDA), organisations or even individuals may allege that our marketing activities do not comply with the relevant law s and regulations, or with our International Marketing Principles. As such, the Group could be subject to liability and costs associated with civil and criminal actions as well as regulatory sanctions, fines and penalties brought in connection with these allegations. Even when proven untrue, there are often financial costs and reputational impacts in defending against such claims and allegations (including potential adverse impact on the treatment by the FDA of the Group ‘s PMTAs in the U.S.). Each of these results may in turn have an adverse effect on the Group’s results of operations and financial condition and cause the Group to fail to deliver on its strategic growth plans. BAT Annual Report and Form 20-F 2022 Strategic Report Governance Report Financial Statements Other Information Other Information Group Risk Factors Continued 350
Risk: Adverse implications of EU legislation on single-use plastics that will result in on-pack environmental warnings and financial implications relating to the Extended Producer Responsibility (EPR) Description The EU adopted a Directive on single-use plastics in July 2019 (the "SUP Directive") which, among other products, targets tobacco products with filters containing plastic. The Cellulose Acetate in our filters is defined as a single-use plastic under the Directive and, as such, the Directive will have an impact on the Group’s cigarettes, filters for other tobacco products and consumables for THPs. Under the SUP Directive, the Group will be subject to (and in some cases already is subject to) Extended Producer Responsibility (“EPR”) schemes, requiring the Group to cover the costs of collecting, transporting, treating and cleaning-up of filters containing plastic. The SUP Directive also imposes on tobacco manufacturers the obligation to finance consumer awareness campaigns and to place environmental markings on packs of products with filters containing plastic. Member States had to transpose the SUP Directive into national law by 3 July 2021, with an implementation deadline of 5 January 2023 for EPR schemes. In practice, most Member States are late on transposition and implementation, with the practical consequence that EPR schemes will go live with several months delays on average. The European Commission is also late in its issuance of guidelines on the criteria for the costs of cleaning up litter, which should have been issued prior to the anticipated implementation deadline for EPR schemes. This introduces further difficulties and uncertainty in the design and setting-up of EPR schemes. When transposing the SUP Directive into national law, EU member states could decide to expand the scope of EPR systems under their respective national laws, which may expose the Group to additional regulations and financial obligations. This is the case in France, where EPR implementation has already occurred with an expansion of the scope to include non-plastic filters for RYO products. Although Sweden’s government has abandoned plans to extend its national EPR system to Snus and Modern Oral pouches, other markets are still at risk of extension, such as in Spain (tobacco manufacturers would be mandated to financially contribute to the cost of cleaning of parts of the general sewage system), the Czech Republic (tobacco manufacturers would be mandated to contribute to the cost of managing household waste costs), and Poland and Romania (manufacturers’ financial contribution would also cover paper filters, although they are not plastic items). Proposed regulations are still being discussed in these countries. It is noted that there is a growing level of scrutiny on the use of single-use plastic across the world and a number of other markets in which the Group operates are considering ways to restrict (or ban) the use of filters made of plastic and/or introduce EPR schemes covering other plastic elements in our products beyond filters for traditional products and/or New Categories products. Impact The financial implications of existing and future EPR schemes will increase administrative burdens and operating costs and may have an adverse effect on the Group’s results of operations and financial condition and cause the Group to fail to deliver on its strategic growth plans. If significant space is appropriated on the packaging of some of the Group’s products, this may also be an impediment to maintaining or building brand equity of the Group’s products which may, in turn, have a negative impact on the Group’s sales volume. Failure to deliver appropriate EPR schemes may lead to imposition of the schemes by the local authorities at a higher cost to the Group, adversely impacting the Group’s results of operations, financial condition and reputation. Risk: Exposure to litigation, regulatory action or criminal investigations on tobacco, nicotine, New Categories and other issues Description The Group is involved in litigation related to its tobacco and nicotine products, including legal, regulatory and patent actions, proceedings and claims, brought against it in a number of jurisdictions. Claims brought against the Group may be based on personal injury (both individual claims and class actions), economic loss arising from the treatment of smoking and health-related diseases (such as medical recoupment claims brought by local governments), patent infringement (please refer to the risk factor under “Product pipeline, commercialisation and Intellectual Property risks, Exposure to risks associated with intellectual property rights, including the failure to identify, protect and prevent infringement of the Group’s intellectual property rights and potential infringement of, or the failure to retain licences to use, third-party intellectual property rights” below), negligence, strict tort liability, design defect, failure to warn, fraud, misrepresentation, deceptive/unfair trade practices, conspiracy, medical monitoring and violations of antitrust/racketeering laws. ESG and sustainability-related litigation and regulatory action may also be brought against the Group. Certain actions, such as those in the U.S. and Canada, involve claims in the tens or hundreds of billions of pounds sterling. The Group is also involved in proceedings that are not directly related to its tobacco and nicotine products, including proceedings based on environmental pollution claims. Additional legal and regulatory actions and investigations, proceedings and claims may be brought against the Group in the future. Impact The Group’s consolidated results of operations and financial position could be materially affected by any unfavourable outcome of certain pending or future litigation. The Group could be exposed to substantial liability, which may take the form of ongoing payments, such as is the case with the State Settlement Agreements in the U.S. that require substantial ongoing payments by Group subsidiary, RJRT. Whether successful or not, the costs of the Group’s involvement in litigation could materially increase due to costs associated with bringing proceedings and defending claims, which may also cause operational and strategic disruption by diverting management time away from business matters. Liabilities and costs in connection with litigation could result in bankruptcy of one or more Group entities, for example, following a judgement in Canada, certain of the Group's Canadian subsidiaries filed for protection under the CCAA. Any negative publicity resulting from these claims may also adversely affect the Group’s reputation. The occurrence of any of the above effects could in turn have an adverse effect on the Group’s results of operations and financial condition and cause the Group to fail to deliver on its strategic growth plans. Please refer to note 31 in the Notes on the Accounts for details of contingent liabilities applicable to the Group. BAT Annual Report and Form 20-F 2022 Strategic Report Governance Report Financial Statements Other Information 351
Legal, Regulatory and Compliance Risks continued Risk: Significant and/or unexpected increases or structural changes in tobacco and nicotine-related taxes Description Tobacco and nicotine products are subject to high levels of taxation, including excise taxes, sales taxes, import duties and levies in most markets in which the Group operates. In many of these markets, taxes are generally increasing, but the rate of increase varies between markets and between different types of tobacco and nicotine products. Increases in, or the introduction of new, tobacco and nicotine- related taxes may be caused by a number of factors, including fiscal pressures, health policy objectives and increased lobbying pressure from anti-tobacco advocates. With respect to New Categories, although a common framework for regulation and taxation has yet to emerge, the manufacture, sale, packaging and advertising of such products are increasingly being regulated and taxed. Impact Significant or unexpected increases in, or the introduction of new, tobacco-related taxes or minimum retail selling prices, changes in relative tax rates for different tobacco and nicotine products or adjustments to excise have in the past resulted, and may in the future result, in the need for the Group to absorb such tax increases due to limits in its ability to increase prices, an alteration in the sales mix in favour of value-for-money brands or products, or growth in illicit trade, each of which could impact pricing, sales volume and profit for the Group’s products. Significant or unexpected increases of tobacco-related taxes could also impact the Group's ability to deliver the corporate purpose of harm reduction. Risk: Failure to comply with health and safety and environmental laws Description The Group is subject to a variety of laws, regulations and operational standards relating to health and safety and the environment. The Group may fail to assess certain risks and implement the right level of control measures or to maintain adequate standards of health and safety or environmental compliance, which could cause injury, ill health , disability or loss of life to employees, contractors or members of the public, or harm to the natural environment and local communities in which the Group operates. As a result of the outcomes of the COP26, further future regulation is anticipated as governments look to meet their climate change ambitions. Insufficient information, instruction and training in the relevant areas and a lack of knowledge of the existence and/or requirements of relevant regulations, or a failure to monitor, assess and implement the requirements of new or modified legislation, may increase these risks. Impact Any failure by the Group to comply with applicable health and safety or environmental laws, or the exposure to the consequences of a perceived failure, could result in business disruption, reputational damage, difficulties in recruiting and retaining staff, increased insurance costs, consequential losses, the obligation to install or upgrade costly pollution control equipment, loss of value of the Group’s assets, remedial costs and damages, fines and penalties as well as civil or criminal liability. Each of these results could in turn adversely impact the Group’s results of operations and financial condition and cause the Group to fail to deliver on its strategic growth plans. Risk: Exposure to unfavourable tax rulings Description The Group is subject to tax laws in a variety of jurisdictions. The Group‘s interpretation and application of the tax laws could differ from those of the relevant tax authority, which may subject the Group to claims for breach of such laws, including for late or incorrect filings or for misinterpretation of rules. Tax authorities in a variety of jurisdictions, such as the Netherlands and Russia, have assessed, and may in the future assess, the Group for historical tax claims, including interest and penalties, arising from disputed areas of tax law. The Group is currently party to tax disputes in a number of jurisdictions, some of which involve claims for amounts in the hundreds of millions of pounds sterling. Please refer to note 31 in the Notes on the Accounts for details of contingent liabilities applicable to the Group. Impact The Group’s failure to comply with the relevant tax authority’s interpretation and application of the tax laws could result in significant financial and legal penalties, including the payment of additional taxes, fines and interest in the event of an unfavourable ruling by a tax authority in a disputed area, as well as the payment of dispute costs. Disruption to the business could occur as a result of management’s time being diverted away from business matters. Each of these results could negatively affect the Group’s results of operations and financial condition and cause the Group to fail to deliver on its strategic growth plans. Risk: Unexpected legislative changes to corporate income tax laws Description The Group is subject to corporate income tax laws in the jurisdictions in which it operates. These laws frequently change on a prospective or retroactive basis. Impact Legislative changes to corporate income tax laws and regulations may have an adverse impact on the Group’s corporate income tax liabilities and may lead to a material increase of the Group’s overall tax rate. This could, in turn, negatively affect the Group’s results of operations and financial condition and cause the Group to fail to deliver on its strategic growth plans. BAT Annual Report and Form 20-F 2022 Strategic Report Governance Report Financial Statements Other Information Other Information Group Risk Factors Continued 352
Risk: Exposure to potential liability under competition or antitrust laws Description According to the Group’s internal estimates, the Group is a market leader by volume and/or value in certain categories in a number of countries in which it operates and/or is one of a small number of tobacco and/or New Categories companies in certain other markets in which it operates. The Group has had antitrust infringement decisions imposed against it in the past and is subject to ongoing investigations (please refer to note 31 in the Notes on the Accounts for details of contingent liabilities applicable to the Group). The Group may fail to comply with competition or antitrust laws and may be subject to investigation and/or litigation for alleged abuse of its position in markets in which it has significant market share or for alleged collusion/anti-competitive arrangements with other market participants. Competition/antitrust laws continue to evolve globally with increasingly aggressive enforcement. Impact Failure by the Group to comply with competition or antitrust laws and investigations (and/or litigation) for violation of such laws may result in significant legal liability, fines, penalties and/or damages actions; criminal sanctions against the Group, its officers and employees; increased costs, prohibitions on conduct of the Group’s business; forced changes in business practices, forced divestment of brands and businesses (or parts of businesses) to competitors or other buyers; director disqualifications; commercial agreements being held void; and operational and strategic disruption (including by diverting management time away from business matters). The Group may face increased public scrutiny and the investigation or imposition of sanctions by antitrust regulation agencies and/or courts for violations of competition regimes which may subject the Group to reputational damage and loss of goodwill, including negative perceptions of the Group’s governance and our ESG credentials. The occurrence of any of the above effects could in turn have an adverse effect on the Group’s results of operations and financial condition and cause the Group to fail to deliver on its strategic growth plans. Risk: Failure to establish and maintain adequate controls and procedures to comply with applicable securities, corporate governance and compliance regulations Description The Group’s operations are subject to a range of rules and regulations around the world. These include U.S. securities, corporate governance and compliance laws and regulations, such as the Sarbanes-Oxley Act of 2002 and the U.S. Foreign Corrupt Practices Act of 1977, which applies to the Group’s worldwide activities. While the Group continuously seeks to improve its systems of internal controls and to remedy any weaknesses identified, there can be no assurance that the policies and procedures will be followed at all times or effectively detect and prevent violations of applicable laws. In addition, the Group is subject to increasingly stringent reporting obligations under UK corporate reporting regulations. Impact The increased scope and complexity of applicable regulations to which the Group is subject may lead to higher costs for compliance. Failure to comply with laws and regulations may result in significant legal liability, fines, penalties, and/or damages actions, criminal sanctions against the Group, its officers and employees, and damage to the Group’s reputation. Non-compliance with such regulations could also lead to a loss of the Group’s listing on one or more stock exchanges or a loss of investor confidence with a subsequent reduction in share price. Risk: Loss of confidential information, including through manipulation of data by employees and system failure Description Unintended or inappropriate behaviour by employees, contractors, service providers or others using or managing the Group’s confidential information especially given the increased use of third parties (including sensitive or confidential information of third parties) or personal data (including sensitive consumer personal data) may affect the Group’s communications and operations which may result in the unauthorised disclosure of such information. Increased remote working has and may increase this risk. In addition, flaws in our IT systems and/or those of our suppliers, a lack of infrastructure or application resilience, slow or insufficient disaster recovery service levels or the installation of new systems may increase the possibility that data, including confidential, personal or other sensitive information, stored or communicated by IT systems may be corrupted, lost or disclosed. There may be malicious ‘bad actor’ activity (e.g. cyber attack) or ‘insider threat’ (e.g. activists or disgruntled employees). Impact The loss of confidential information may result in civil or criminal legal liability and prosecution by enforcement bodies and/or claims from third parties, which may subject the Group to the imposition of material fines, damages and/or penalties and the costs associated with defending these claims. It could also lead to a competitive disadvantage through the loss of trade secrets. There could also be potential exposure from extortion attempts and costs from business continuity situations. Inappropriate disclosure of confidential information or violation of the European General Data Protection Regulation (GDPR) or other privacy laws (please refer to the risk factor under “Loss or misuse of personal data through a failure to comply with the European General Data Protection Regulation, the UK Data Protection Act 2018, e-Privacy Laws and other privacy legislation governing the processing of personal data” below) may also result in significant reputational harm and public scrutiny which could create negative perceptions of the Group’s governance and our ESG credentials, a loss of investor confidence (including a possible share price impact) and reduced third-party reliance on the Group’s information technology systems or other data handling practices. In addition, restoration and remediation of disclosed confidential information or personal data may be costly, difficult or even impossible. The occurrence of any of the above effects could in turn have an adverse effect on the Group’s results of operations and financial condition and cause the Group to fail to deliver on its strategic growth plans. BAT Annual Report and Form 20-F 2022 Strategic Report Governance Report Financial Statements Other Information 353
Legal, Regulatory and Compliance Risks continued Risk: Failure to comply with product regulations due to uncertainty surrounding the proper interpretation and application of those regulations Description The interpretation and application of regulations concerning the Group’s products, such as the Tobacco and Related Products Directive (TPD2), may be subject to debate and uncertainty. This includes uncertainty over product classifications and restrictions on advertising. In particular with respect to the developing category of New Categories, which has grown in size and complexity in a relatively short period of time, a consensus framework for the interpretation and application of existing regulation, such as the rules concerning nicotine-containing liquids used in Vapour products, has yet to emerge. The continuously changing and evolving landscape of regulation concerning the Group’s products contributes to the uncertainty surrounding interpretation and application and creates a risk that the Group may misinterpret or fail to comply with developing regulations in the various jurisdictions in which it operates, or becomes subject to enforcement actions from regulators. With the continuous changing of product cycle plans and expansion to new markets and innovations, there is a risk that such changes and launches fail to comply with the relevant regulations, including pre-approval and/or pre-registration requirements. For example, some governments have intentionally banned or are seeking to ban novel tobacco products and products containing nicotine, while others would need to amend their existing legislation to permit their sale. Even in countries where the sale of such products is currently permitted, some governments have adopted, or are seeking to adopt, bans on New Categories or restrictions on certain flavours. Impact The significant number of emerging regulations and the uncertainty surrounding their interpretation and application may subject the Group to claims for breach of such regulations. Financial costs of such enforcement actions include financial penalties, product recalls and litigation costs, and entail a significant risk of adverse publicity and damage to the Group’s reputation and goodwill. Risk: Failure to uphold high standards of corporate behaviour, including through unintended or malicious breach of anti- bribery and anti-corruption and other anti-financial crime laws Description The Group is subject to various anti-corruption laws and regulations and other anti-financial crime laws including but not limited to those relating to tax evasion, money laundering, terrorist financing and bribery (Anti-Corruption Laws, including the UK Proceeds of Crime Acts (POCA)). All employees of BAT, its subsidiaries and joint ventures which it controls are expected to uphold a high standard of corporate behaviour and comply with the Group Standards of Business Conduct (SoBC) which includes a requirement to comply with Anti-Corruption Laws. Employees, associates, suppliers, distributors and agents are prohibited from engaging in improper conduct to obtain or retain business or to improperly influence (directly or indirectly) a person working in an official capacity to decide in the Group’s favour. The Group’s employees, contractors and service providers may fail to comply with our SoBC and/or may violate applicable Anti-Corruption Laws. From time to time, the Group investigates, and becomes aware of governmental authorities’ investigations into, allegations of misconduct, including alleged breach of sanctions and allegations of corruption, against Group companies. The Group cooperates with the authorities’ investigations, where appropriate, including with the DOJ and OFAC in the United States, which are conducting investigations into suspicions of breach of sanctions. As the investigations are ongoing, it is not possible to identify the timescale in which these matters might be resolved. Please refer to note 24 in the Notes on the Accounts. Please refer to note 31 in the Notes on the Accounts for details of contingent liabilities applicable to the Group. Impact Failure of the Group to comply with Anti-Corruption Laws or to deploy and maintain robust internal policies, procedures and controls could result in significant fines and penalties (reducing the Group’s ability to reinvest in the future), a share price impact, criminal and/or civil sanctions against the Group and its officers and employees, increased costs, prohibitions or other limitations or requirements (e.g. compliance requirements) on the conduct of the Group’s business and reputational harm (including negative perceptions of the Group’s governance and our ESG credentials), it may subject the Group to claims for breach of such regulations and it could in turn have an adverse effect on the Group’s results of operations and financial condition and cause the Group to fail to deliver on its strategic growth plans. Even when proven untrue, there are often financial costs, time demands and reputational impacts associated with investigating and defending against such claims. BAT Annual Report and Form 20-F 2022 Strategic Report Governance Report Financial Statements Other Information Other Information Group Risk Factors Continued 354
Risk: Imposition of sanctions under sanctions regimes or similar international, regional or national measures Description National, international and supra-national sanctions regimes or similar international, regional or national measures are complex and dynamic and may affect territories in which the Group operates or third parties with which it may have commercial relationships. There may be unintended or malicious breaches of sanctions due to inappropriate or negligent behaviour by BAT employees, contractors, customers, suppliers or service providers. In particular, the Group has operations in a number of territories that are subject to various sanctions, including Cuba, Russia and Belarus. Operations in these territories expose the Group to the risk of significant financial costs and disruption in operations that may be difficult or impossible to predict or avoid or the activities could become commercially and/or operationally unviable. Sanctions can be imposed quickly (as happened recently in Russia) with the possibility of further territories the Group operates in becoming subject to sanctions at short notice. National, international and supra-national sanctions regimes may also affect third parties (or their banks) with which the Group has commercial relationships, e.g. through their banks (including possible risk aversion to being associated with a sanctioned territory) and could lead to supply and payment chain disruptions. From time to time, the Group investigates, and becomes aware of governmental authorities’ investigations into, allegations of misconduct, including alleged breach of sanctions and allegations of corruption, against Group companies. The Group cooperates with the authorities’ investigations, where appropriate, including with the DOJ and OFAC in the United States, which are conducting investigations into suspicions of breach of sanctions. Please refer to note 31 in the Notes on the Accounts for details of contingent liabilities applicable to the Group. Impact As a result of the limitations imposed by sanctions, it may become commercially and/or operationally unviable for the Group and/or its critical business partners to operate in certain territories or execute transactions related to them and the Group may be required to exit existing operations in such territories. The Group may also experience difficulty in sourcing materials or importing products, repatriating currency from a sanctioned country and finding financial institutions willing to transact with it, any of which may expose the Group to increased costs. In addition, the costs of complying with sanctions may increase as a result of new, or changes to existing, sanctions regimes. Any failure to comply with sanctions regimes or similar international, regional, or national or supra-national measures may result in significant legal liability, fines (reducing the Group’s ability to reinvest in the future) and/or penalties, criminal and/or civil sanctions against the Group, its officers and employees, damage to commercial or banking relationships and reputational harm. Reputational harm (including negative perceptions of the Group’s governance and our ESG credentials) may result regardless of whether the Group complies with imposed sanctions. The occurrence of any of the above effects could in turn have an adverse effect on the Group’s results of operations and financial condition and cause the Group to fail to deliver on its strategic growth plans. Risk: Failure to uphold New Categories marketing practices Description The regulatory landscape is constantly evolving with marketing practices being different in key New Categories markets. The Group’s marketing activities may be found to be, or alleged (including in the media) to be, non-compliant with laws and regulations, or with the International Marketing Principles (IMPs) on the marketing and sale of tobacco and nicotine products to consumers such as age verification measures. On-line activities can also be found to be, or alleged to be, aimed at consumers in a country where such activities are not permitted. Impact The Group is and may in the future be subject to claims for breach of marketing practices. In particular, national authorities (such as the FDA), organisations or even individuals may allege that our marketing activities do not comply with the relevant laws and regulations, or with our IMPs. As such, the Group could be subject to liability and costs as well as regulatory sanctions, fines and penalties brought in connection with these allegations. Even when proven untrue, there are often financial costs and reputational impacts in defending against such claims and allegations. Future breaches may lead to a loss of investor confidence in ESG performance and inability to meet our responsible marketing focus area if our IMPs are not followed, impacting our corporate purpose of delivering harm reduction. BAT Annual Report and Form 20-F 2022 Strategic Report Governance Report Financial Statements Other Information 355
Legal, Regulatory and Compliance Risks continued Risk: Loss or misuse of personal data through a failure to comply with the European General Data Protection Regulation, the UK Data Protection Act 2018, e-Privacy Laws and other privacy legislation governing the processing of personal data. Description Personal data is a subset of data (which is likely to be confidential) which attracts different risks and treatment under applicable law. Breaches of data privacy laws include misuse of information which may not be confidential in nature. These include, for example, unsolicited marketing calls to a publicly available number, or using an individual’s personal data in a way which was not authorised or in a way that the individual did not reasonably expect through technologies such as online tracking or monitoring. Various privacy laws, including the European General Data Protection Regulation (GDPR), UK Data Protection Act 2018 (UKDPA) and e- Privacy Directive, including EU and UK Regulatory guidances (e-Privacy Laws), govern the way in which organisations (such as employees, contractors, service provider colleagues and other authorised persons) handle individuals’ personal data including how such organisations, including the Group, track or monitor their online behaviour. Unintended or malicious breaches of data privacy laws may occur through inappropriate or negligent behaviour by BAT employees, contractors, service providers or others. In particular, in the event of: – an unauthorised disclosure of personal data as a result of a bad actor (e.g. cyber attack); or – a weakness in our IT systems, or application resilience, slow or insufficient disaster recovery service levels or the installation failure of a new system (which result in personal data stored or communicated by IT systems being corrupted, lost or disclosed). Depending on the risk to the individuals concerned, such personal data breaches (including mass personal data unavailability) could trigger a formal notification to a local data protection supervisory authority. This, in turn, could subject Group companies to not only regulatory scrutiny but also individual claims or even class action suits; and ePrivacy Laws state that any misuse of consumer personal data or lack of transparency provided to consumers on how we use their data or track their online behaviours are subject to regulatory scrutiny. Legal requirements relating to the collection, storage, handling, and transfer of personal data continue to evolve. Following the entry into force of the GDPR in May 2018, other jurisdictions in which the Group operates have enacted similar local legislation such as the California Consumer Privacy Act U.S. and the “LGPD” in Brazil which further increases the risks surrounding the processing of personal data especially in the consumer space. As part of the Group’s digital transformation initiative, it has an enhanced focus on consumer data, especially regarding New Categories, which increases these risks. Impact Failure to comply with existing or future e-Privacy Laws and privacy legislation governing the processing of personal data may adversely impact the Group’s results of operations and financial condition. Loss or misuse of personal data may result in civil or criminal legal liability and prosecution by enforcement bodies, which may subject the Group to the imposition of material fines (currently up to 4% of Group worldwide turnover in the context of GDPR and/or the UK Data Protection Act) and/or penalties and/or claims and costs associated with defending these claims (which could include class action suits brought by consumers). The Group’s officers and employees may also be subject to personal criminal sanctions. Reputational damage could also potentially cause significant harm to the Group, including negative perceptions of the Group’s governance and our ESG credentials. Relevant data protection supervisory authority could also order certain Group legal entities to cease processing activities, which could result in a significant operational disruption. Regulatory interest may also prompt interest from other compliance authorities/ governments, leading to further regulation or proceedings. The occurrence of any of the above effects could in turn have an adverse effect on the Group’s results of operations and financial condition and cause the Group to fail to deliver on its strategic growth plans. BAT Annual Report and Form 20-F 2022 Strategic Report Governance Report Financial Statements Other Information Other Information Group Risk Factors Continued 356
Economic and Financial Risks Risk: Foreign exchange rate exposures Description The Group’s reporting currency is the pound sterling. The Group is exposed to the risk of fluctuations in exchange rates affecting the translation of net assets and earned profits of overseas subsidiaries into the Group’s reporting currency. These translational exposures are not normally hedged. Exposures also arise from the foreign currency denominated trading transactions undertaken by subsidiaries and dividend flows. Where not offset by opposing flows, these exposures are generally hedged according to internal policies, but hedging of exposure to certain currencies might not be possible due to exchange controls, limited currency availability or prohibitive costs, and errors in hedging may occur. Fiscal policy divergence in relation to interest rates between key markets may also increase these risks. Impact During periods of exchange rate volatility, the impact of exchange rates on the Group’s results of operations and financial condition can be significant. Fluctuations in exchange rates of key currencies against the pound sterling (as was the case in 2022 when the pound sterling depreciated significantly against the US dollar, among other currencies) may result in volatility in the Group’s reported earnings per share, cash flow and balance sheet. Furthermore, the dividend paid by the Group may be impacted if the payout ratio is not adjusted. Differences in translation between earnings and net debt may also affect key ratios used by credit rating agencies, which may have an adverse effect on the Group’s credit ratings. In addition, volatility and/or increased costs in the Group’s business due to transactional foreign exchange rate exposures may adversely affect operating margins and profitability and attempts to increase prices to offset such increases could adversely impact sales volumes. Risk: Inability to obtain price increases and exposure to risks from excessive price increases and value chain erosion Description Annual price increases by the Group are among the key drivers in increasing market profitability. However, the Group has in the past been, and may in the future be, unable to obtain such price increases as a result of increased regulation; increased competition from illicit trade; stretched consumer affordability arising from deteriorating political and economic conditions and rising prices; sharp increases or changes in excise structures; and competitors’ pricing. As the New Categories market continues to develop, the Group may face erosion in the value chain for New Categories through lower market prices, excise taxes, high retail trade margins or high production costs that make New Categories less competitive versus combustible tobacco products. As an example, excise on Tobacco Heated Products in Japan increased and aligned closer to FMC following a five-year (2018-2022) phased excise plan. In addition, the Group faces the risk that price increases it has conducted in the past, and may conduct in the future, may be excessive and not find adequate adult tobacco consumer acceptance. Impact If the Group is unable to obtain price increases or is adversely affected by impacts of excessive price increases, it may be unable to achieve its strategic growth metrics, have fewer funds to invest in growth opportunities, and, in the case of excessive price increases, be faced with quicker reductions in sales volumes than anticipated due to accelerated market decline, down-trading (switching to a cheaper brand) and increased illicit trade. These in turn impact the Group’s market share, results of operations and financial condition and cause the Group to fail to deliver on its strategic growth plans. In addition, erosion in the value chain for New Categories could have a negative impact on the Group’s sales volume or pricing for these products. High excise could dampen demand for New Categories or result in lower profit margins. Lower market prices, high retail trade margins or increases in production costs could also negatively impact profit margins or lead to uncompetitive pricing. BAT Annual Report and Form 20-F 2022 Strategic Report Governance Report Financial Statements Other Information 357
Economic and Financial Risks continued Risk: Effects of declining consumption of legitimate tobacco products and a tough competitive environment Description Evidence of market contraction and the growth of illicit trade of tobacco products is apparent in several key global markets in which the Group operates. This decline is due to multiple factors, including increases in excise taxes leading to continuous above-inflation price rises, changes in the regulatory environment, the continuing difficult economic environment in many countries impacting consumers’ disposable incomes, the increase in the trade of illicit tobacco products, rising health concerns, a decline in the social acceptability of smoking and an increase in New Category uptake. The Group competes based on the strength of its strategic brand portfolio, product quality and taste, brand recognition, brand loyalty, taste, innovation, packaging, service, marketing, advertising and price. The Group is subject to highly competitive environments in all aspects of its business, and its competitive position can be significantly influenced by the prevailing economic climate, consumers’ disposable income, regulation, competitors’ introduction of lower-price or innovative products, higher tobacco product taxes, higher absolute prices, governmental action to increase minimum wages, employment costs, interest rates and increase in raw material costs. Furthermore, the Group is subject to substantial payment obligations under the State Settlement Agreements, which adversely affect the ability of the Group to compete in the U.S. with manufacturers of deep-discount cigarettes that are not subject to such substantial obligations. Impact Any future decline in the demand for legitimate tobacco products could have an adverse effect on the Group’s results of operations and financial conditions and cause the Group to fail to deliver on its strategic growth plans. In a tough competitive environment, factors such as market size reduction, customer down-trading, illicit trade and competitors aggressively taking market share through price re-positioning or price wars generally reduce the overall profit pool of the market and may impact delivery of the Group’s profits. This may also lead to a decline in sales volume, loss of market share, impact delivery of the Group’s ESG agenda, erosion of its portfolio mix and reduction of funds available for investment in growth opportunities. Risk: Funding, liquidity and interest rate risks Description The Group cannot be certain that it will have access to bank financing or to the debt and equity capital markets at all times and is therefore subject to funding and liquidity risks. In addition, the Group’s access to funding may be affected by restrictive covenants to which it is subject under some of its credit facilities. Furthermore, broader ESG trends may impact the Group’s access to funding. The Group is also exposed to increases in interest rates in connection with both existing floating rate debt and future debt refinancings. Recently, after an extended period with historically low interest rates, interest rates have increased substantially and may further increase in the future. Furthermore, the Group operates in several markets closely regulated by governmental bodies that intervene in foreign exchange markets by imposing limitations on the ability to transfer local currency into foreign currency and introducing other currency controls that expose cash balances to devaluation risks or that increase costs to obtain hard currency. As a result, the Group’s operational entities in these markets may be restricted from using end-market cash resources to pay for imported goods, dividend remittances, interest payments and royalties. The inability to access end-market cash resources in certain markets contributes to the Group’s funding and liquidity risks. Impact Adverse developments in the Group’s funding, liquidity and interest rate environment may lead to shortages of cash and cash equivalents needed to operate the Group’s business and to refinance its existing debt. Inability to fund the business under the Group’s current capital structure, failure to access funding and foreign exchange or increases in interest rates may also have an adverse effect on the Group’s credit rating, which would in turn result in further increased funding costs and may require the Group to issue equity or seek new sources of capital. Although the Group currently benefits from investment grade ratings from both Moody's and S&P, in 2022, S&P revised its outlook from stable to negative. Any downgrade of the Group's credit ratings or loss of investment grade status could materially increase the Group's financing costs. Non-compliance with the Group’s covenants under certain credit facilities could lead to an acceleration of its debt. All these factors may have material adverse effects on the Group’s results of operations and financial conditions and cause the Group to fail to deliver on its strategic growth plans. These conditions could also lead to underperforming bond prices and increased yields. In the case of funding or liquidity constraints, the Group may also suffer reputational damage due to its perceived failure to manage the financial risk profile of its business, which may result in an erosion of shareholder value reflected in an underperforming share price, and/ or underperforming bond prices and higher yields. In addition, the Group’s ability to finance strategic opportunities or respond to threats may be impacted by limited access to funds. BAT Annual Report and Form 20-F 2022 Strategic Report Governance Report Financial Statements Other Information Other Information Group Risk Factors Continued 358
Risk: Failure to achieve growth through mergers, acquisitions, joint ventures, investments and other transactions Description The Group’s growth strategy includes a combination of organic growth as well as mergers, acquisitions, joint ventures and investments. The Group may be unable to acquire or invest in attractive businesses on favourable terms and may inappropriately value or otherwise fail to identify or capitalise on growth opportunities. The Group may not be able to deliver strategic objectives and revenue improvements from business combinations, successfully integrate businesses it acquires or establishes, or obtain appropriate regulatory approvals for business combinations. Risks from integration of businesses also include the risk that the integration may divert the Group’s focus and resources from its other strategic goals. Additionally, the Group could be exposed to financial, legal or reputational risks if it fails to appropriately consider and address any compliance, antitrust or ESG aspects of a transaction or planned transaction. Further, the Group has certain uncapped indemnification obligations in connection with divestitures and could incur similar obligations in the future. Impact Any of the foregoing risks could result in increased costs, decreased revenues or a loss of opportunities and have an adverse effect on the Group’s results of operations and financial condition, and in the case of a breach of compliance or antitrust regulation, could lead to reputational damage, fines and potentially criminal sanctions and an adverse impact on the Group's ESG agenda. The Group may become liable for claims arising in respect of conduct prior to any merger or acquisition of businesses if deemed to be a successor to the liabilities of the acquired company or indemnification claims relating to divestitures, and any resulting adverse judgment against the Group may adversely affect its results of operations and financial condition and cause the Group to fail to deliver on its strategic growth plans. Please refer to note 31 in the Notes on the Accounts for details of contingent liabilities applicable to the Group. Risk: Unforeseen underperformance in key global markets Description A substantial majority of the Group’s profit from operations is based on its operations in certain key markets, including the U.S. A number of these markets are declining for a variety of factors, including price increases, restrictions on advertising and promotions, smoking prevention campaigns, increased pressure from anti-tobacco groups, migration to smokeless products and private businesses adopting policies that prohibit or restrict, or are intended to discourage, smoking and tobacco use. Economic and political factors affecting the Group’s key markets include the prevailing economic climate, governmental austerity measures, levels of employment, inflation, governmental action to increase minimum wages, employment costs, interest rates, raw material costs, consumer confidence and consumer pricing. Impact Any change to the economic and political factors in any of the key markets in which the Group operates could affect consumer behaviour and have an impact on the Group’s results of operations and financial condition and cause the Group to fail to deliver on its strategic growth plans. Risk: Increases in net liabilities under the Group’s retirement benefit schemes Description The Group currently maintains and contributes to defined benefit pension plans and other post-retirement benefit plans that cover various categories of employees and retirees worldwide. The Group’s obligations to make contributions under these arrangements may increase in the case of increases in pension liabilities, decreases in asset returns, salary increases, inflation, decreases in long-term interest rates, increases in life expectancies, changes in population trends and other actuarial assumptions. Please refer to the information under the caption ‘Retirement benefit schemes’ on page 235 and to note 15 in the Notes on the Accounts for details of the Group’s retirement benefit schemes. Impact Higher contributions to the Group’s retirement benefit schemes could have an adverse impact on the Group’s results of operations, financial condition and ability to raise funds and cause the Group to fail to deliver on its strategic growth plans. BAT Annual Report and Form 20-F 2022 Strategic Report Governance Report Financial Statements Other Information 359
Product pipeline, commercialisation and Intellectual Property risks Risk: Inability to predict consumers’ changing behaviours and launch innovative products that offer adult tobacco and nicotine consumers meaningful value-added differentiation Description The Group focuses its research and development activities on both creating new products, including New Categories and Beyond Nicotine products, whilst maintaining and improving the quality of its existing products. In a competitive market, the Group believes that innovation is key to growth. The Group considers that one of its key challenges in the medium and long term is to provide adult tobacco and nicotine consumers with high-quality products that take into account their changing preferences and expectations, including those in relation to ESG, while complying with evolving regulation. The Group continues to develop and roll-out its New Categories portfolio which requires significant investment. The Group may be unsuccessful in developing and launching innovative products or maintaining and improving the quality of existing products across Combustibles, New Categories and Beyond Nicotine that offer consumers meaningful value-added differentiation. The Group may fail to keep pace with innovation in its sector or changes in consumer expectations and is also exposed to the risk of an inability to build a strong enough brand equity through social media and other technological tools to compete with its competitors. There are potential bans and restrictions in key markets when using social media to advertise and communicate. Competitors may be more successful in predicting changing consumer behaviour, developing and rolling out consumer-relevant products and may be able to do so more quickly and at a lower cost. In addition, the Group devotes considerable resources to the research and development of innovative products that may have the potential to reduce the risks of smoking-related diseases. The complex nature of research and development programmes necessary to satisfy emerging regulatory and scientific requirements creates a substantial risk that these programmes will fail to demonstrate health-related claims regarding New Categories and Beyond Nicotine or to achieve adult tobacco consumer, regulatory and scientific acceptance. Furthermore, the regulatory environment impacting Non-Combustible tobacco products, Vapour products and other non-tobacco nicotine products and Beyond Nicotine, including classification of products for regulatory and excise purposes, is still developing and it cannot be predicted whether regulations will permit the marketing of such products in any given market in the future. Categorisation as medicines, for example, and restrictions on advertising could stifle innovation, increase complexity and costs and significantly undermine the commercial viability of these products. Alternatively, categorisation of any New Categories, as tobacco products for instance, could result in the application of onerous regulation, which could further stifle uptake. Impact The inability to timely develop and roll out innovations or products in line with consumer demand, including any failure to predict changes in adult tobacco consumer and societal behaviour and expectations and to fill gaps in the product portfolio, as well as the risk of poor product quality, could lead to missed opportunities, under- or over-supply, loss of competitive advantage, unrecoverable costs and/or the erosion of the Group’s consumer base or brand equity. Restrictions on packaging and labelling or on promotion and advertising could impact the Group’s ability to communicate its innovations and product differences to adult tobacco consumers, leading to unsuccessful product launches. An inability to provide robust scientific results sufficient to substantiate health-related product claims poses a significant threat to the ability to launch innovative products and comply with emerging regulatory and legal regimes. The occurrence of any of the above effects could in turn have an adverse effect on the Group’s results of operations and financial condition and cause the Group to fail to deliver on its strategic growth plans. In addition, there may be loss of investors’ confidence in ESG performance, including failure to deliver our corporate purpose of harm reduction. BAT Annual Report and Form 20-F 2022 Strategic Report Governance Report Financial Statements Other Information Other Information Group Risk Factors Continued 360
Product pipeline, commercialisation and Intellectual Property risks continued Risk: Exposure to risks associated with intellectual property rights, including the failure to identify, protect and prevent infringement of the Group’s intellectual property rights and potential infringement of, or the failure to retain licences to use, third-party intellectual property rights Description The Group relies on trademarks, patents, registered designs, copyrights, domain names and trade secrets. The brand names under which the Group’s products are sold are key assets of its business. The protection and maintenance of these brand names and of the reputation of these brands is important to the Group’s success. Protection of intellectual property rights is also important in connection with the Group’s innovative products, including New Categories. The Group is exposed to the risk of infringements of its intellectual property rights by third parties due to limitations in judicial protection, failure to identify, protect and register its innovations and/or inadequate enforceability of these rights in some markets in which the Group operates. The Group currently is involved in various patent infringement litigation proceedings in several countries related to the Group’s New Categories inventions and products. This litigation involves both claims by the Group that competitors are infringing the Group’s patents and claims by competitors that the Group is infringing competitors’ patents. Please refer to note 31 in the Notes on the Accounts for details of contingent liabilities relating to patent litigation applicable to the Group. Some brands and trademarks under which the Group’s products are sold are licensed for a fixed period of time in certain markets. If any of these licences are terminated or not renewed after the end of the applicable term, the Group would no longer have the right to use, and to sell products under, those brand(s) and trademark(s). In addition, as third party rights are not always identifiable, the Group may be subject to claims for infringement of third party intellectual property rights. Impact Any erosion in the value of the Group’s brands or innovations, or failure to obtain or maintain adequate protection of intellectual property rights for any reason, or the loss of brands, trademarks or other intellectual property rights under licence to Group companies, may have a material adverse effect on the Group‘s market share, results of operations and financial condition. Any inability to appropriately protect the Group’s products and key innovations will also limit its growth and affect competitiveness and return on innovation investment. Any infringement of third-party intellectual property rights could result in interim or final injunctions, product recalls, legal liability and the payment of damages, any of which may disrupt operations, negatively impact the Group’s reputation and have an adverse effect on its results of operations and financial condition and cause the Group to fail to deliver on its strategic growth plan. In addition, litigation (even where successful) results in an intensive use of resources and management time leading to potential disruption. BAT Annual Report and Form 20-F 2022 Strategic Report Governance Report Financial Statements Other Information 361
Overview The Group’s businesses operate under increasingly stringent regulatory regimes worldwide. The tobacco and nicotine industry is one of the most highly regulated in the world, with manufacturers required to comply with a variety of different regulatory regimes across the globe. The Group continues to respond to these regimes and engages with governments and other regulatory bodies to find solutions to changing regulatory landscapes. Restrictions on the manufacture, sale, marketing and packaging of tobacco and non-tobacco nicotine products are in place in nearly all countries and markets. Regulation can typically be categorised as follows: Place: including regulations restricting smoking and vaping in private, public and work places (e.g. public place smoking and vaping bans); Product: including regulations on the use of ingredients, product design and attributes (e.g. ceilings regarding tar, nicotine and carbon monoxide yields for cigarettes and restrictions on nicotine strength for non-tobacco nicotine products, as well as restrictions on flavours); product safety regulations (e.g. the EU’s General Product Safety Directive (2001/95/EC), electrical safety regulations and reduced ignition propensity standards for cigarettes); regulatory product disclosure requirements (e.g. in relation to ingredients and emissions); and bans of entire product categories (e.g. bans on the manufacture, import, and sale, of Non- Combustible tobacco products or non-tobacco nicotine products); Packaging and labelling: including regulations on health warnings and other government-mandated messages (e.g. in respect of content, positioning, size and rotation); restrictions on the use of certain descriptors and brand names; requirements on pack shape, size, weight and colour and plain packaging of products; and marking requirements relating to single-use plastics; Sponsorship, promotion and advertising: including partial or total bans on tobacco and/or non-tobacco nicotine product advertising, marketing, promotions and sponsorship and restrictions on brand sharing and stretching (the latter refers to the creation of an association between a tobacco product and a non-tobacco product by the use of tobacco branding on the non- tobacco product); Purchase: including regulations on the manner in which tobacco products and non-tobacco nicotine products are sold, such as type of outlet (e.g. supermarkets and vending machines); how they are sold (e.g. above-the-counter versus beneath-the-counter); and restrictions on adult purchase (e.g. generational bans which preclude the sale and supply of tobacco products to individuals born after a certain year); Price: including regulations which have implications for the prices that manufacturers can charge for their tobacco products and non-tobacco nicotine products (e.g. excise taxes and minimum prices); and Responsibility: including regulations introducing Extended Producer Responsibility schemes on cigarette manufacturers to cover the cost to clean up cigarette waste (see Single Use Plastics Directive (EU) 2019/904); and equipment-related cost sharing obligations to fight illicit trade (see Article 15.7 of EU Tobacco Products Directive 2014). In addition, the Group operates a number of global policies, and in some cases its businesses have also entered into voluntary agreements, which may impose more onerous obligations or standards than those imposed by local legislation. World Health Organization Framework Convention on Tobacco Control Much of the recent development in regulation at a global level has been driven by the World Health Organization Framework Convention on Tobacco Control (FCTC). The FCTC came into force in 2005 and contains provisions aimed at, among other things, reducing tobacco consumption and exposure to tobacco smoke. The original treaty is supplemented by one protocol (on illicit trade) and guidelines on the implementation of several of the treaty obligations. While the guidelines are not legally binding, they provide recommendations for Parties on the implementation of specific provisions of the FCTC. To date, the FCTC has been ratified by 182 countries, not including the U.S. The FCTC has led to increased efforts by tobacco control advocates and public health organisations to encourage governments to further regulate the tobacco industry. As national regulations increasingly reflect global influences, the scope of areas regulated will likely further expand. The guidelines on advertising, promotion, and sponsorship, for example, seek to broaden the definition of tobacco advertising to include product display, the use of vending machines as well as the design of the pack itself. Where adopted by the Parties, a number of the measures referred to in the guidelines may result in either additional costs for the tobacco industry or restrictions on a manufacturer’s ability to differentiate its products and communicate those differences to adult smokers. The World Health Organization and other public health organisations have recently focused their efforts on attempting to widen the scope of the FCTC beyond the text of the Convention to include Reduced Risk Products (RRPs)1, including adopting a decision that tobacco heated products (THPs) should be subject to the FCTC; recommending that governments adopt stricter regulations of RRPs; and applying existing cigarette regulations to RRPs. All engagement efforts of the tobacco industry are being closely monitored by these organisations and are often (incorrectly) labelled as unlawful industry interference. In turn, this has an impact on the willingness of Parties to engage with the industry, which limits the opportunity for the industry to provide input into the development of regulation. The biannual session of the Conference of the Parties to the FCTC took place in November 2021 (COP9). Due to the virtual nature of the meetings most substantive discussions have however been postponed to COP10, which will take place in 2023 in Panama. EU Tobacco and Related Products Directive (2014/40/EU) A revised EU Tobacco and Related Products Directive (2014/40/ EU) (TPD2) was adopted in April 2014 for transposition into EU Member States’ law by May 2016. Provisions of TPD2 include: large combined pictorial and textual health warnings covering 65% of the two main pack surfaces (front and back) for cigarettes; restrictions on pack shape and size, including minimum pack sizes of 20 sticks for cigarettes and 30g for roll-your-own and make- your-own tobacco; ingredients reporting; “tracking and tracing” requirements; and for e-cigarettes: nicotine limits, pre-market notification, ingredients reporting and advertising restrictions. Among other things, TPD2 bans the sale of cigarettes and roll- your-own tobacco with a characterising flavour. Enforcement of the ban in relation to menthol-flavoured cigarettes was delayed until May 2020, but those products are now also banned (see “Regulation of Ingredients, Including Flavoured Tobacco Products and RRPs”). TPD2 seeks to ensure that the same rules apply in the same way across all EU Member States, but it leaves open to individual Member States the possibility of further standardising the packaging of tobacco products and applying other requirements not regulated by TPD2, provided these are compatible with EU law. BAT Annual Report and Form 20-F 2022 Strategic Report Governance Report Financial Statements Other Information Other Information Regulation of the Group’s Business 362
The European Commission published its Article 28 report on the application of TPD2 on 20 May 2021. The report concluded that TPD2 helped decrease smoking rates and tobacco use but that more efforts are needed, particularly in relation to enforcement at national level and new market developments, such as novel tobacco products. Currently, the preparations of a revised EU Tobacco Products Directive are progressing, with estimated adoption in 2025. TPD2 might be replaced with a directly applicable regulation instead of a directive, following which transposition in Member States would no longer be required. It is anticipated that this new regulation will include the following provisions: plain packaging for combustibles; more regulation of ingredients, including a ban on the use of any menthol for combustibles at the EU level; regulation of flavours and nicotine- free liquids for e-cigarettes at the EU level; more stringent advertising restrictions for e-cigarettes; stricter regulations for THPs; and regulation of oral nicotine pouches at the EU level. Single-Use Plastics The Single Use Plastics Directive (EU) 2019/904 (the SUP Directive) entered into force on 2 July 2019. The SUP Directive requires that EU Member States introduce Extended Producer Responsibility (EPR) schemes covering the cost to clean up litter and the application of on-pack marking requirements for tobacco product filters. Member States had to transpose the SUP Directive into national law by 3 July 2021, with an implementation deadline of 3 July 2021 for pack marking requirements and of 5 January 2023 for EPR schemes. Member States are late on transposition and implementation, with the practical consequence that EPR schemes will go live with several months delays on average. The European Commission is also late in its issuance of guidelines on the criteria for the costs of cleaning up litter, which should have been issued prior to the anticipated implementation deadline for EPR schemes. France was the only Member State to not await the 5 January 2023 deadline and, in December 2020 and February 2021, it implemented EPR schemes for, among others, cigarette manufacturers. These regulations are currently being challenged before the French Council of State. Other governments have passed or are considering similar legislation including Canada, Russia, South Korea, and various levels of government in the U.S. Restrictions on Smoking in Private, Public and Workplaces The Group operates in a number of markets which have in place restrictions on smoking and vaping in certain private, public and workplaces, including restaurants, bars and nightclubs. While these restrictions vary in scope, extensive public and workplace smoking and vaping bans have been enacted in markets including the U.S., Canada, the UK, Spain, New Zealand and Australia. Restrictions on smoking and vaping in private have also been adopted or proposed, and typically take the form of prohibitions on smoking and vaping in cars or residential homes when children are present, and/or smoking and vaping within a certain distance from specified public places (such as primary schools). Regulation of Ingredients, Including Flavoured Tobacco Products A number of countries have restricted or banned, and others are seeking to restrict or ban, the use of certain flavours or ingredients in cigarettes and other tobacco products, on the basis that such flavoured products are alleged to appeal disproportionally to minors, act as a catalyst for young people taking up smoking and/ or increase the addictiveness or toxicity of the relevant product. To the extent flavours are permitted, this is often restricted to tobacco and/or menthol flavours only. Such restrictions have been enacted in markets including the U.S., Canada, Australia and Turkey. An ingredients ban in Brazil, which would ban the use of certain ingredients with flavouring or aromatic properties, including menthol, is not currently in force due to ongoing legal challenges. TPD2 similarly bans in the EU the manufacture and sale of cigarettes and roll-your-own tobacco with a characterising flavour other than tobacco. A number of the above regulations are subject to ongoing legal challenges (see “The U.S.” for information pertaining to the regulation of menthol in that market). Regulators in Europe are increasingly seeking to ban the use of flavours in Vapour products and other RRPs, except for non- tobacco and menthol (see “Reduced Risk Products”1). For example, Hungary, Finland, the Netherlands, Denmark and Norway have adopted, or are considering adopting, bills banning flavours in Vapour products. BAT is exploring its legal options in relation to these new regulations. The European Commission has also produced a Commission Delegated Directive amending TPD2 to withdraw certain exemptions in respect of THPs. If it proceeds, this proposal would extend the prohibition of tobacco products with a characterising flavour (which currently applies to cigarettes and hand rolling tobacco) to THPs. BAT is exploring its legal options in relation to this proposal. Further legislation on ingredients, both for factory made cigarettes and RRPs1, is expected. The Conference of Parties to the FCTC has tasked a working group to further elaborate the partial guidelines on the regulation of the contents of tobacco products and tobacco product disclosures (see Articles 9 and 10 of the FCTC). The work of this group was suspended in 2018 and an expert group was created to examine the reasons for low implementation of Articles 9 and 10, and related partial guidelines. This expert group presented its report in 2021, but the substantive discussions by the Conference of Parties of this report have been postponed to COP10 (see “World Health Organization Framework Convention on Tobacco Control”). Furthermore, several regulators in EU Member States have also taken action, or are considering taking action, to ban low menthol products, or products using other coolants, from the market. For example, in Belgium, the regulator banned all cigarettes and other tobacco products that include components with cooling and/or purported analgesic effects. Plain and Standardised Packaging Plain (or “standardised”) packaging generally refers to a ban on the use of trademarks, logos and colours on packaging other than the use of a single colour and the presentation of brand name and variant in a specified font, size and location(s). The presentation of individual cigarettes may be similarly restricted. Plain packaging is high on the agenda of tobacco control groups, and the non-binding FCTC guidelines recommend that the Parties consider introducing plain packaging. As of 17 January 2023, 24 countries have implemented plain packaging (including Australia, Belgium, Canada, Denmark, France, Ireland, New Zealand, the Netherlands, Saudi Arabia, Singapore, Turkey, and the UK), with a further nine countries examining legislation to introduce the measure. Countries, territories and states that are currently considering adopting plain packaging legislation include, but are not limited to, Argentina, India, Ecuador, Panama, Brazil, Chile, Spain and South Africa. Others, such as South Korea, Ukraine and Colombia, are considering implementing increased graphic health warnings. Also, RRPs are increasingly facing plain packaging regulations (see “Reduced Risk Products”1), such as in Denmark where a bill was adopted on 15 December 2020, which introduced plain packaging for Vapour products and THPs. Product Display Bans at Point of Sale and Licensing Regimes Product display bans at point of sale and licensing regimes have become relatively commonplace and have been implemented for several years in a number of countries both at national and state levels, including in Norway, Iceland, Finland, New Zealand, Thailand, Canada, Australia, and the UK. The Danish bill (referenced above) also introduced a product display ban for RRPs1. A large number of countries, such as Hungary, Finland and Spain, have also sought to restrict the supply of tobacco products, including through the adoption of licensing regimes limiting the number of retail outlets from which it is possible to purchase tobacco products and/or by BAT Annual Report and Form 20-F 2022 Strategic Report Governance Report Financial Statements Other Information 363
prohibiting the sale of tobacco products within a certain distance of specified public places. Illicit Trade The illegal market for tobacco products is an increasingly important issue for governments and the industry across the world. Euromonitor International estimates that, in 2021, approximately 350 billion cigarettes (excl. China) were smuggled, manufactured illegally or counterfeited. A number of governments, regulators and organisations have or are considering adopting regulation to support anti-illicit trade activities. Among other forms, such regulation may comprise mandatory “tracking and tracing” requirements, enabling regulators to identify the point at which any seized product left the legal supply chain, security features to combat counterfeiting and inspection and authentication obligations in respect of seized product. The TPD2, for example, requires that all unit packets of tobacco are marked with a unique and irremovable identifier, which when scanned provides various information about that product’s route-to-market. In November 2012, the FCTC Parties adopted the Protocol to Eliminate Illicit Trade in Tobacco Products which includes a raft of supply chain control measures, including the implementation of “tracking and tracing” technologies. The Protocol entered into force on 25 September 2018 and was considered at the first session of the Meeting of the Parties to the Protocol in October 2018. The second session of the Meeting of the Parties to the Protocol took place in November 2021. As of 10 October 2022, 66 parties have ratified the Protocol. Reduced-Risk Products1 (“RRPs”) As the Vapour category has grown in size and complexity in a relatively short period of time, a consensus framework for regulation and taxation has yet to emerge. The TPD2, for example, establishes frameworks for the regulation of novel tobacco products and e-cigarettes, introducing nicotine limits, health warnings requirements, advertising bans and pre-market notification and post-market disclosure obligations. As noted above, the World Health Organization and other public health organisations have recently focused their efforts on attempting to widen the scope of the FCTC beyond the text of the Convention to include RRPs (see “World Health Organization Framework Convention on Tobacco Control”). In countries where the sale of Vapour products is permitted, governments are increasingly seeking to more strictly regulate these products, including by adopting or seeking to adopt bans on vaping in public places, bans or restrictions on flavours or other restrictions such as plain packaging and retail display and advertising bans. Conversely, some governments have expressly banned or are seeking to ban RRPs (such as Hong Kong), while others restrict their sale as medicinal products (such as Australia). Also, other RRPs, such as nicotine pouches and THPs, are facing increasing scrutiny by regulators. In countries such as Belgium, Germany, and the Netherlands, regulators have sought to classify oral nicotine pouch products as food stuff or medicinal products and ban these products from the market. However, the Belgian authorities have subsequently clarified that oral nicotine pouches should not be classified as medicinal products, but may explore a ban for other reasons. We expect tobacco-free nicotine pouches to be regulated at a European level as part of the next revision of the Tobacco Products Directive. In Germany and Hungary, THPs have faced being classified in the same way as traditional tobacco products, with the potential consequence of facing the same restrictions and excise categories. However, in 2021, the Administrative Court of Braunschweig (Germany) concluded that THPs are smokeless because they do not involve a combustion process (Judgment of 23 September 20212). The federal German regulator did not appeal this judgment. Generational Bans A recent regulatory measure that some countries are considering, including Denmark, New Zealand and Malaysia, involves the prohibition on sales and supply of tobacco and/or nicotine products to persons of a certain age that will follow them throughout their lifetime. This regulatory measure is referred to as a “generational ban” and entails that persons born on or after a certain date would never be able to lawfully be sold tobacco products. Over time, as more and more persons become subject to the ban, the pool of consumers for tobacco products would grow ever smaller. On 1 January 2023, the Smokefree Environments and Regulated Products (Smoked Tobacco) Amendment Act came into force in New Zealand, specifying that New Zealand’s generational ban will commence on 1 January 2027. BAT is continuing to monitor this situation and whether other governments will follow suit with similar measures. The U.S. Through the Reynolds American Inc. (RAI) subsidiaries, the Group is subject to U.S. federal, state, and local laws and regulations. The Family Smoking Prevention and Tobacco Control Act (FSPTCA), which was enacted in 2009, grants the U.S. Food & Drug Administration (FDA) broad authority over the manufacture, sale, marketing and packaging of tobacco products but limited the Agency’s authority to cigarettes, smokeless tobacco products, cigarette tobacco and roll-your-own tobacco products. Key elements of the FSPTCA include: filing of facility registrations, product listing, constituent testing and ingredient information; obtaining FDA clearance for all new products and product modifications; banning all characterising flavours other than tobacco or menthol in cigarettes; establishing “user fees” to fund the FDA’s regulation of tobacco products; increasing the health warning size on cigarette packs with the option to introduce pictorial health warnings; implementing good manufacturing practices; revising the labelling and advertising requirements for smokeless tobacco products; and requiring the study of menthol. The U.S. Congress did limit the FDA’s authority in two areas, prohibiting it from: – banning categories of tobacco products; and – requiring the reduction of nicotine yields of a tobacco product to zero. On 10 May 2016, the FDA issued a final regulation, referred to as the Deeming Rule, deeming all remaining products that are “made or derived from tobacco” to be subject to the FDA’s regulatory authority under the FSPTCA. The Final Rule became effective as of 8 August 2016, though each requirement of the Final Rule had its own compliance date. Such “deemed” tobacco products subject to the FSPTCA include, among others, electronic nicotine delivery systems (including e-cigarettes, e-hookah, e-cigars, vape pens, advanced refillable personal vapourisers, electronic pipes and e- liquids mixed in vape shops), certain dissolvable tobacco products, cigars and pipe tobacco. The “grandfathered” (now called "pre-existing products") date under the Final Rule for newly deemed products remained the same as the “grandfathered” date for those tobacco products already subject to the FSPTCA – 15 February 2007 (known as “Pre- Existing Tobacco Products”). Any tobacco product that was not legally marketed as of 15 February 2007 is considered a new tobacco product subject to premarket review by the FDA. The FDA established a compliance policy allowing all newly deemed tobacco products that were on the market as of 8 August 2016 to remain on the market so long as the manufacturer filed a Premarket Tobacco Product Application (PMTA) by a specific deadline (9 September 2020). BAT Annual Report and Form 20-F 2022 Strategic Report Governance Report Financial Statements Other Information Other Information Regulation of the Group’s Business Continued 364
In October 2019, R. J. Reynolds Vapour Company filed PMTAs for Vuse Solo. Based upon requirements of the FSPTCA that must be addressed in PMTAs, and the FDA’s Guidance regarding the type of evidence required for such applications, the costs of preparing a PMTA are significant. R. J. Reynolds Vapor Company thereafter filed PMTAs for the remaining Vuse products (Vibe, Ciro, and Alto) and the Velo products (pouch and lozenge) by the September 2020 deadline. Certain additional data from ongoing research relevant to the Alto and Velo applications were submitted as amendments to the PMTAs during the FDA review process. The FDA granted marketing authorisation for the Vuse Solo device and its tobacco (‘original’) flavour in October 2021, but denied authorisation for Vuse Solo flavours other than menthol (which were not on the market). That denial is being appealed with the FDA. In May 2022, the FDA issued marketing authorisation orders for tobacco flavoured Vuse Vibe and Ciro, but denied authorization for flavours other than menthol (which were not on the market). R. J. Reynolds Vapor Company has appealed the denials issued for the relevant Vuse Vibe and Ciro products by requesting further Agency review. We have received and are challenging the FDA's Market Denial Order dated January 2023 related to Vibe and Ciro (menthol variants) and are seeking a permanent stay.There can be no assurance that the Vuse menthol or other flavours appeals will succeed. Additionally, the continued marketing authorisation of the applicable Vuse products is contingent on continued compliance with regulatory requirements; the marketing authorisations may be suspended or withdrawn if the FDA determines that the continued marketing of the products is no longer appropriate for the protection of the public health. The FDA has not issued marketing authorisations for Vuse Alto and its associated flavours, including menthol, with FDA decisions still pending. Although the Vuse Alto menthol and tobacco flavoured products remain on the market pending FDA decisions there can be no assurance that these authorisations (or the other Vuse Alto flavours) will be granted. Similarly, the Group’s Velo products remain on the market in the U.S., again pending FDA decisions on their marketing authorisations and there can be no assurance these will be granted. If the FDA denies a marketing authorisation, then the relevant product(s) would need to be withdrawn from the market (unless a court intervenes). Legislation granting the FDA authority over synthetic nicotine products (products containing nicotine not “made or derived from tobacco”) went into effect in April 2022, which required manufacturers of such products to file PMTAs by a May 2022 deadline. Synthetic nicotine products without marketing authorisation cannot remain on the U.S. market after 13 July 2022, even if subject to a pending PMTA. The Group's current portfolio contains no synthetic nicotine products. Comprehensive plan for tobacco and nicotine regulation On 28 July 2017, the FDA announced its intent to develop a comprehensive plan for tobacco and nicotine regulation that recognises the continuum of risk for nicotine delivery. As part of that plan, the FDA planned to publish an Advance Notice of Proposed Rulemaking (ANPRM) to seek public input regarding the potential health benefits and possible adverse effects of lowering the level of nicotine in combustible cigarettes. The FDA also announced its intent to issue ANPRMs requesting public stakeholder input on the impact of flavours (including menthol) in increased initiation among youth and young adults as well as assisting adult smokers to switch to potentially less harmful forms of nicotine delivery, and the patterns of use and public health impact of premium cigars. This follows on from the FDA’s decision to issue its own preliminary scientific evaluation regarding menthol cigarettes in 2013, which concluded that menthol cigarettes adversely affect initiation, addiction and cessation compared to non-menthol cigarettes. In January 2018, the FDA held a public hearing to obtain input from a broad group of stakeholders on ways to streamline the regulatory process for the issuance of therapeutic claims for nicotine products. In March 2018, the Agency issued three ANPRMs, seeking information on (1) the lowering of nicotine levels to non-addictive or minimally addictive levels, (2) the impact of flavours (including menthol) in increased initiation among youth and young adults as well as assisting adult smokers to switch to potentially less harmful forms of nicotine delivery, and (3) the patterns of use and public health impact of premium cigars. In April 2022, the FDA published a proposed product standard that would ban menthol as a characterising flavour in cigarettes. The FDA accepted public comment on this proposed rule through to August 2022. RAI Services Company submitted a detailed comment to the FDA (available on the U.S. Government's Regulations website) opposing the proposed rule as unsupported by existing scientific evidence and with the potential for negative unintended consequences. In December 2022, the sale of all tobacco products with characterising flavours other than tobacco (including menthol) were banned in the state of California. Additional regulation In addition to the ANPRMs on reduced nicotine products and flavours, the FDA, in April 2019, issued a proposed rule on the format and content of reports to demonstrate substantial equivalence. This follows on from the FDA’s previous statements regarding the development of foundational rules so as to provide clarity and predictability to the tobacco product submission process, including not only substantial equivalence applications but new product applications as well as MRTP applications. In September 2019, the FDA published a proposed rule on the format and content of PMTAs. The final foundational rules for substantial equivalence and PMTAs were published on 5 October 2021 and became effective on 4 November 2021. The FDA has not yet promulgated its proposed rule for MRTP applications. Under the FSPTCA, for a manufacturer to launch a new tobacco product or modify an existing tobacco product after 22 March 2011, the manufacturer must obtain an order from the FDA authorising the new or modified product to be marketed. Similarly, a manufacturer that introduced a cigarette or smokeless tobacco product between 15 February 2007 and 22 March 2011 was required to file a substantial equivalence report with the FDA demonstrating either (1) that the new or modified product had the same characteristics as a product commercially available as at 15 February 2007, referred to as a predicate product, or (2) if the new or modified product had different characteristics than the predicate product, that it did not raise different questions of public health. A product subject to such report is referred to as a provisional product. A manufacturer may continue to market a provisional product unless and until the FDA issues an order that the provisional product is not substantially equivalent, in which case the FDA could then require the manufacturer to remove the provisional product from the market. Many of the RAI subsidiaries’ cigarette and smokeless tobacco products currently on the market are provisional products. In January 2017, the FDA issued its first proposed product standard whereby the Agency would require the reduction, over a three-year period, of the levels of N-nitrosonornicotine (NNN) contained in smokeless tobacco products. Since issuing this proposal, the Agency has simply stated that it is evaluating submitted comments. The FDA’s semi-annual regulatory agenda has not listed the NNN proposal since its publication. Thus, it is not known whether or when this proposed rule will be finalised, and, if adopted, whether the final rule will be the same as or similar to the proposed rule. On 18 December 2017, the FDA accepted for review MRTP applications for six Camel BAT Annual Report and Form 20-F 2022 Strategic Report Governance Report Financial Statements Other Information 365
Snus smokeless tobacco products. In 2018, the FDA began its review of these applications, which included facility inspections and a public meeting held 13-14 September 2018 before the Tobacco Product Scientific Advisory Committee to obtain its review and recommendation. These applications were withdrawn in Q4 2022. On 18 March 2020, the FDA issued a rule mandating the incorporation on cigarettes packages of graphic health warnings. The rule required eleven new textual warnings, each accompanied by a specific graphic image, on the top 50% of the front and back of all cigarette packages, on the left 50% of the front and back of cigarette cartons, and the top 20% of all cigarette advertising, beginning 18 June 2021. On 3 April 2020, RAI subsidiaries R. J. Reynolds Tobacco Company and Santa Fe Natural Tobacco Company, in conjunction with several cigarette manufacturers and retailers, filed a lawsuit seeking to permanently enjoin implementation of the rule. The court, following multiple orders to delay the implementation of the rule, invalidated it as unconstitutional in December 2022. The FDA may appeal this decision to the federal court of appeals. On 21 June 2022, the Biden Administration released the Fall 2022 Unified Agenda. This is an outline of the Administration’s upcoming regulatory priorities. As a part of this agenda, the FDA announced a plan to move forward with, among other proposals, a proposed rule reducing nicotine levels in cigarettes to “minimally- or non-addictive” levels. The regulatory agenda anticipates a proposed nicotine rule in October 2023; however, the FDA has clarified that there is no precise date on which it plans to issue the proposed rule. Cigarettes and other tobacco products are subject to substantial taxes in the U.S. All states and the District of Columbia currently impose cigarette excise taxes. Certain city and county governments, such as those of New York, Philadelphia and Chicago, also impose substantial excise taxes on cigarettes sold in those jurisdictions. Also, all states and the District of Columbia currently subject smokeless tobacco products to excise taxes. Various states and the District of Columbia impose a tax on Vapour products, such as e-cigarettes, and many other states have proposed taxes on Vapour products. Currently, there is no federal tax on Vapour products. State and local governments also consider and implement other legislation and regulation regarding the sale of tobacco products. Measures include, among others, limiting or prohibiting the sale of flavours in tobacco products, restricting where tobacco products may be sold and increasing the minimum age to purchase tobacco products. The Group believes that, as a responsible business, it can contribute through information, ideas and practical steps, to help regulators address the key issues regarding its products, including underage access, illicit trade, product information, product design, involuntary exposure to smoke and the development of potentially less harmful products, while maintaining a competitive market that accommodates the significant percentage of adults who choose to be tobacco consumers. The Group is committed to working with national governments and multilateral organisations and welcomes opportunities to participate in good faith to achieve sensible and balanced regulation of traditional tobacco and potentially RRPs1. Notes: 1. Based on the weight of evidence and assuming a complete switch from cigarette smoking. These products are not risk free and are addictive. Our Vapour product Vuse (including Alto, Solo, Ciro and Vibe), and certain products, including Velo, Grizzly, Kodiak, and Camel Snus, which are sold in the U.S., are subject to FDA regulation and no reduced-risk claims will be made as to these products without agency clearance. 2. Administrative Court Braunschweig - 4th Chamber, case No. 4 A 23/19, British American Tobacco (Germany) GmbH v. Federal Republic of Germany, represented by the Federal Office of Consumer Protection and Food Safety, 23 September 2021. BAT Annual Report and Form 20-F 2022 Strategic Report Governance Report Financial Statements Other Information Other Information Regulation of the Group’s Business Continued 366
The Master Settlement Agreement & State Settlement Agreements In 1998, the major U.S. cigarette manufacturers (including R.J. Reynolds Tobacco Company, Lorillard and Brown & Williamson, businesses which are now part of Reynolds American) entered into the Master Settlement Agreement (“MSA”) with attorneys general representing most U.S. states and territories. The MSA imposes a perpetual stream of future payment obligations on the major US cigarette manufacturers. The amounts of money that the participating manufacturers are required to annually contribute are based upon, among other things, the volume of cigarettes sold and market share (based on cigarette shipments in that year). During 2012, R.J. Reynolds Tobacco Company, various other tobacco manufacturers, 17 states, the District of Columbia and Puerto Rico reached a final agreement related to Reynolds American’s 2003 MSA activities, and three more states joined the agreement in 2013. Under this agreement, R.J. Reynolds Tobacco Company has received credits of more than US$1 billion in respect of its Non-Participating Manufacturer (“NPM”) Adjustment claims related to the period from 2003 to 2012. These credits have been applied against the company’s MSA payments over a period of five years from 2013, subject to, and dependent upon, meeting the various ongoing performance obligations. During 2014, two additional states agreed to settle NPM disputes related to claims for the period 2003 to 2012. R.J. Reynolds Tobacco Company received US$170 million in credits, which have been applied over a five-year period from 2014. During 2015, another state agreed to settle NPM disputes related to claims for the period 2004 to 2014. R.J. Reynolds Tobacco Company received US$285 million in credits, which have been applied over a four-year period from 2016. During 2016, no additional states agreed to settle NPM disputes. During 2017, two more states agreed to settle NPM disputes related to claims for the period 2004 to 2014. It is estimated that R.J. Reynolds Tobacco Company will receive US$61 million in credits, which will be applied over a five-year period from 2017. During 2018, nine more states agreed to settle NPM disputes related to claims for the period 2004 to 2019, with an option through 2022, subject to certain conditions. It is estimated that R.J. Reynolds Tobacco Company will receive US$182 million in credits for settled periods through 2017, which will be applied over a five- year period from 2018. Also in 2018, a 10th additional state agreed to settle NPM disputes related to claims for the period 2004 to 2024, subject to certain conditions. It is estimated that R.J. Reynolds Tobacco Company will receive US$205 million in credits for settled periods through 2017, which will be applied over a five- year period from 2019. In the first quarter of 2020, certain conditions set forth in the 2018 agreements were met for those 10 states. In addition, in August 2020, 24 states, the District of Columbia and Puerto Rico agreed to settle NPM disputes related to claims for the period 2018-2022. In 2022, an additional state settled NPM disputes related to claims for the period 2005 to 2028. It is estimated that R.J. Reynolds Tobacco Company will receive US$130 million in credits for settled periods through 2018, which will be applied over a five-year period from 2022. Credits in respect of future years’ payments and the NPM Adjustment claims would be accounted for in the applicable year and will not be treated as adjusting items. Only credits in respect of prior year payments are included as adjusting items. The BAT Group is subject to substantial payment obligations under the MSA and the state settlement agreements with the states of Mississippi, Florida, Texas and Minnesota (such settlement agreements, collectively “State Settlement Agreements”). Reynolds American Inc.’s operating subsidiaries’ expenses and payments under the MSA and the State Settlement Agreements for 2022 amounted to US$2,951 million in respect of settlement expenses and US$3,129 million in respect of settlement cash payments. Reynolds American Inc.’s operating subsidiaries’ expenses and payments under the MSA and the State Settlement Agreements for 2021 amounted to US$3,420 million in respect of settlement expenses and US$3,744 million in respect of settlement cash payments; for 2020 amounted to US$3,572 million in respect of settlement expenses and US$2,848 million in respect of settlement cash payments; and for 2019 amounted to US$2,762 million in respect of settlement expenses and US$2,918 million in respect of settlement cash payments. R.J. Reynolds Tobacco Company divested certain brands to Imperial Tobacco Group (ITG) in 2015. In 2020, R.J. Reynolds Tobacco Company recognised additional expenses, included above, under the state settlement agreements in the states of Mississippi, Florida, Texas and Minnesota related to these divested brands. R.J. Reynolds Tobacco Company recognised US$241 million of expense for payment obligations to the state of Florida for the ITG acquired brands from the date of divestiture, 12 June 2015, as a result of an unfavourable judgment. In addition, R.J. Reynolds Tobacco Company recognised US$264 million related to the resolution of claims against it in the states of Texas, Minnesota and Mississippi for payment obligations to those states for the ITG acquired brands from the date of divestiture. R.J. Reynolds Tobacco Company settled certain related claims with Phillip Morris USA under the state settlement agreements in the states of Mississippi, Texas and Minnesota for US$8 million. Finally, in June 2022, R.J. Reynolds Tobacco Company settled PM USA's claims relating to the calculation of the base-year net operating profits for the ITG acquired brands for US$37 million. Reynolds American Inc.: Transfer of Pension Obligations On 7 October 2021, Reynolds American Inc. entered into a transaction with Metropolitan Tower Life Insurance Company to transfer approximately US$1.9 billion of pension obligations through the purchase of annuities for retirees receiving benefit payments of less than a threshold amount per month. The transaction was funded with plan assets and resulted in an increase in the funded status of the retirement plan. On 7 June 2022, Reynolds American Inc. entered into a transaction with Metropolitan Tower Life Insurance Company to transfer approximately $1.6 billion of pension obligations through the purchase of annuities for retirees receiving benefit payments from one pension plan and less than a threshold amount per month from another pension plan. The transaction was funded with plan assets and resulted in an increase in the funded status of the retirement plan. BAT Annual Report and Form 20-F 2022 Strategic Report Governance Report Financial Statements Other Information Material Contracts 367
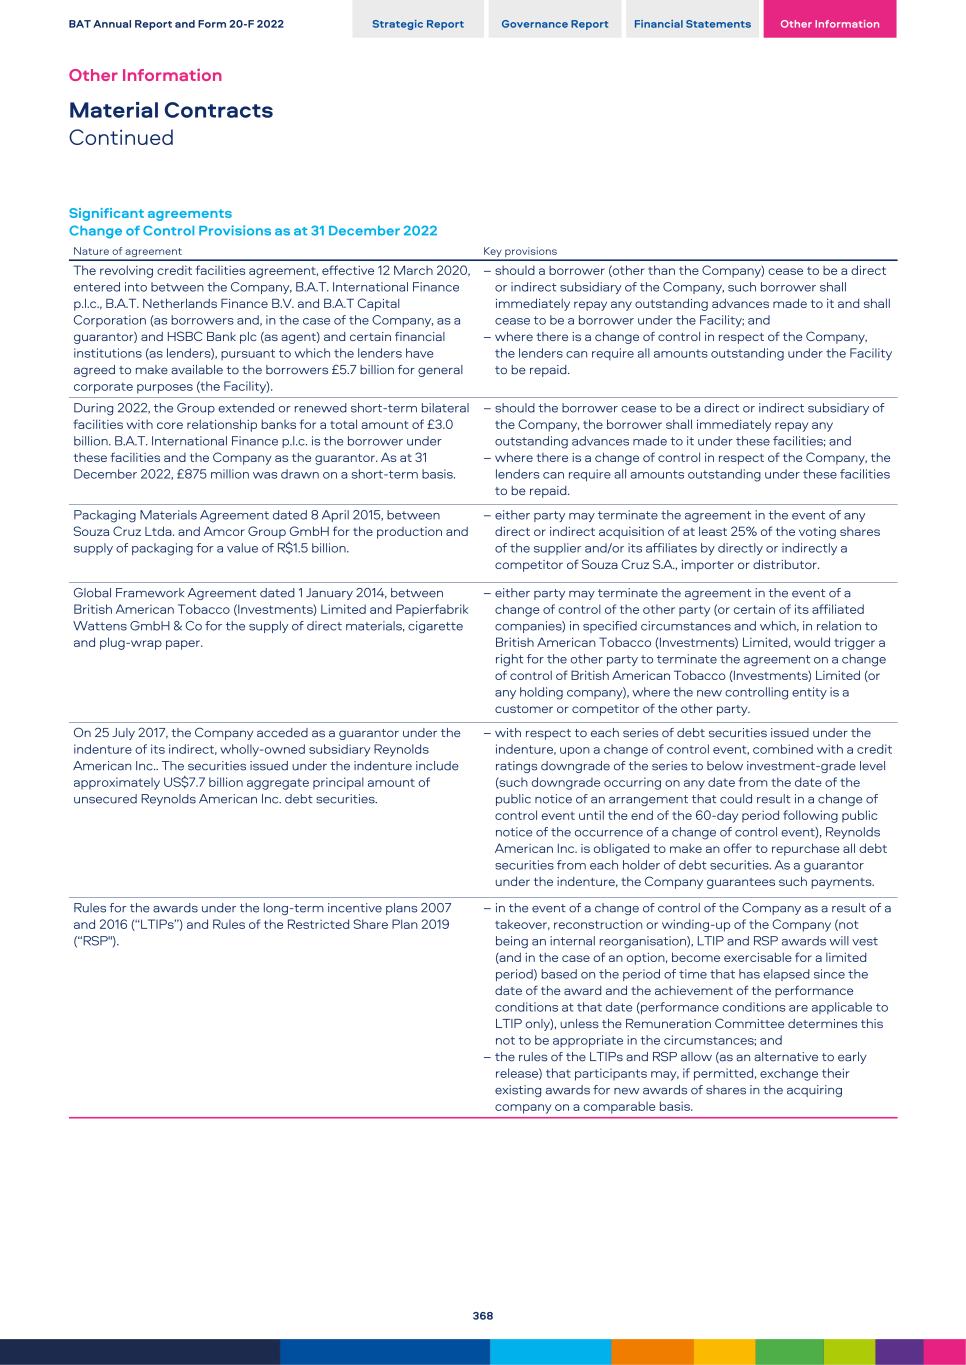
Significant agreements Change of Control Provisions as at 31 December 2022 Nature of agreement Key provisions The revolving credit facilities agreement, effective 12 March 2020, entered into between the Company, B.A.T. International Finance p.l.c., B.A.T. Netherlands Finance B.V. and B.A.T Capital Corporation (as borrowers and, in the case of the Company, as a guarantor) and HSBC Bank plc (as agent) and certain financial institutions (as lenders), pursuant to which the lenders have agreed to make available to the borrowers £5.7 billion for general corporate purposes (the Facility). – should a borrower (other than the Company) cease to be a direct or indirect subsidiary of the Company, such borrower shall immediately repay any outstanding advances made to it and shall cease to be a borrower under the Facility; and – where there is a change of control in respect of the Company, the lenders can require all amounts outstanding under the Facility to be repaid. During 2022, the Group extended or renewed short-term bilateral facilities with core relationship banks for a total amount of £3.0 billion. B.A.T. International Finance p.l.c. is the borrower under these facilities and the Company as the guarantor. As at 31 December 2022, £875 million was drawn on a short-term basis. – should the borrower cease to be a direct or indirect subsidiary of the Company, the borrower shall immediately repay any outstanding advances made to it under these facilities; and – where there is a change of control in respect of the Company, the lenders can require all amounts outstanding under these facilities to be repaid. Packaging Materials Agreement dated 8 April 2015, between Souza Cruz Ltda. and Amcor Group GmbH for the production and supply of packaging for a value of R$1.5 billion. – either party may terminate the agreement in the event of any direct or indirect acquisition of at least 25% of the voting shares of the supplier and/or its affiliates by directly or indirectly a competitor of Souza Cruz S.A., importer or distributor. Global Framework Agreement dated 1 January 2014, between British American Tobacco (Investments) Limited and Papierfabrik Wattens GmbH & Co for the supply of direct materials, cigarette and plug-wrap paper. – either party may terminate the agreement in the event of a change of control of the other party (or certain of its affiliated companies) in specified circumstances and which, in relation to British American Tobacco (Investments) Limited, would trigger a right for the other party to terminate the agreement on a change of control of British American Tobacco (Investments) Limited (or any holding company), where the new controlling entity is a customer or competitor of the other party. On 25 July 2017, the Company acceded as a guarantor under the indenture of its indirect, wholly-owned subsidiary Reynolds American Inc.. The securities issued under the indenture include approximately US$7.7 billion aggregate principal amount of unsecured Reynolds American Inc. debt securities. – with respect to each series of debt securities issued under the indenture, upon a change of control event, combined with a credit ratings downgrade of the series to below investment-grade level (such downgrade occurring on any date from the date of the public notice of an arrangement that could result in a change of control event until the end of the 60-day period following public notice of the occurrence of a change of control event), Reynolds American Inc. is obligated to make an offer to repurchase all debt securities from each holder of debt securities. As a guarantor under the indenture, the Company guarantees such payments. Rules for the awards under the long-term incentive plans 2007 and 2016 (“LTIPs”) and Rules of the Restricted Share Plan 2019 (“RSP"). – in the event of a change of control of the Company as a result of a takeover, reconstruction or winding-up of the Company (not being an internal reorganisation), LTIP and RSP awards will vest (and in the case of an option, become exercisable for a limited period) based on the period of time that has elapsed since the date of the award and the achievement of the performance conditions at that date (performance conditions are applicable to LTIP only), unless the Remuneration Committee determines this not to be appropriate in the circumstances; and – the rules of the LTIPs and RSP allow (as an alternative to early release) that participants may, if permitted, exchange their existing awards for new awards of shares in the acquiring company on a comparable basis. BAT Annual Report and Form 20-F 2022 Strategic Report Governance Report Financial Statements Other Information Other Information Material Contracts Continued 368
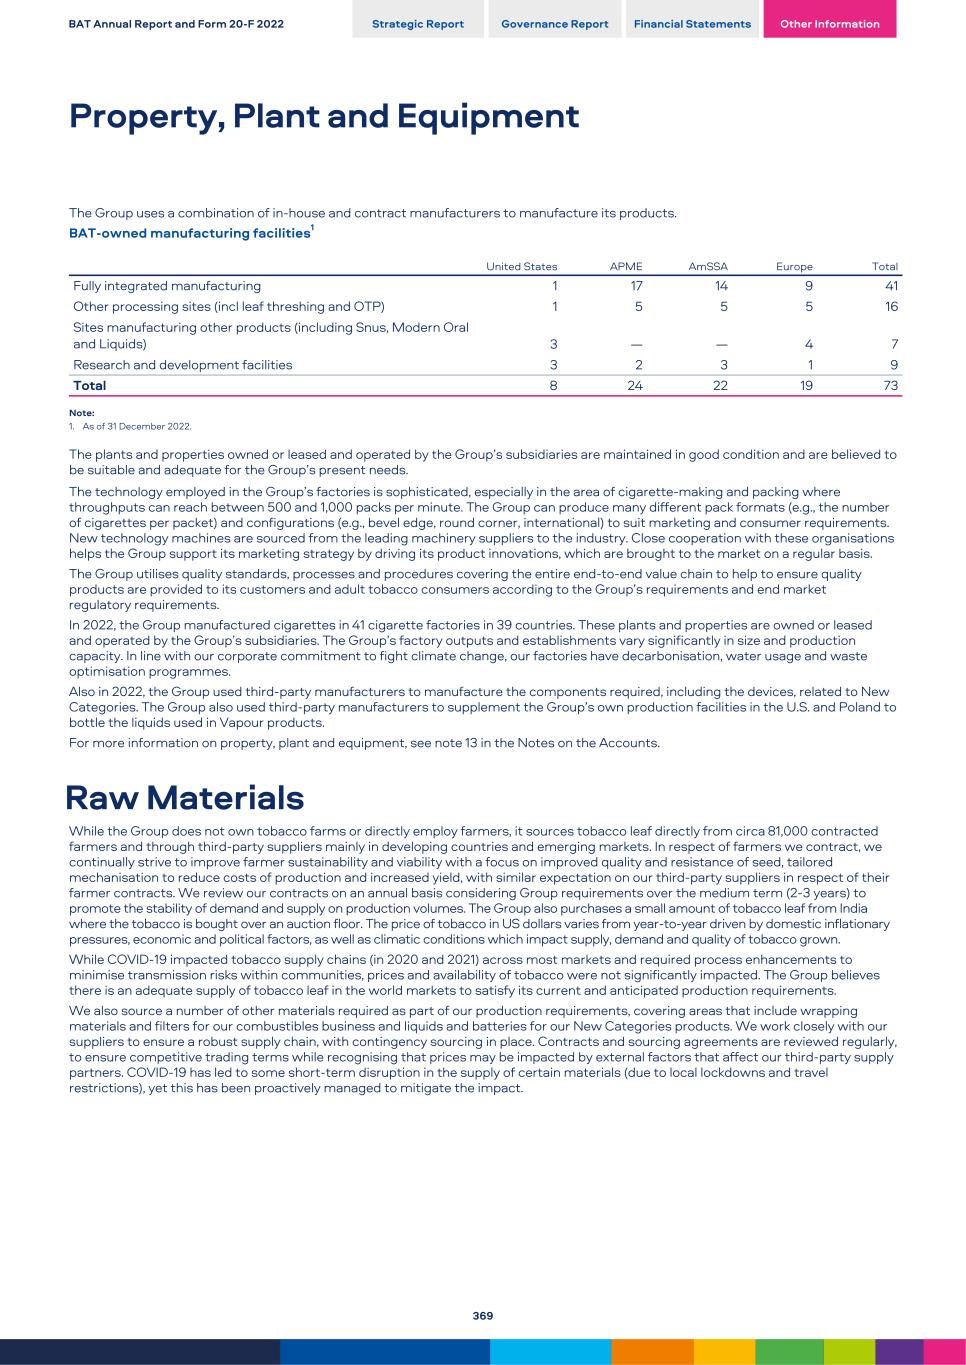
The Group uses a combination of in-house and contract manufacturers to manufacture its products. BAT-owned manufacturing facilities1 United States APME AmSSA Europe Total Fully integrated manufacturing 1 17 14 9 41 Other processing sites (incl leaf threshing and OTP) 1 5 5 5 16 Sites manufacturing other products (including Snus, Modern Oral and Liquids) 3 — — 4 7 Research and development facilities 3 2 3 1 9 Total 8 24 22 19 73 Note: 1. As of 31 December 2022. The plants and properties owned or leased and operated by the Group’s subsidiaries are maintained in good condition and are believed to be suitable and adequate for the Group’s present needs. The technology employed in the Group’s factories is sophisticated, especially in the area of cigarette-making and packing where throughputs can reach between 500 and 1,000 packs per minute. The Group can produce many different pack formats (e.g., the number of cigarettes per packet) and configurations (e.g., bevel edge, round corner, international) to suit marketing and consumer requirements. New technology machines are sourced from the leading machinery suppliers to the industry. Close cooperation with these organisations helps the Group support its marketing strategy by driving its product innovations, which are brought to the market on a regular basis. The Group utilises quality standards, processes and procedures covering the entire end-to-end value chain to help to ensure quality products are provided to its customers and adult tobacco consumers according to the Group’s requirements and end market regulatory requirements. In 2022, the Group manufactured cigarettes in 41 cigarette factories in 39 countries. These plants and properties are owned or leased and operated by the Group’s subsidiaries. The Group’s factory outputs and establishments vary significantly in size and production capacity. In line with our corporate commitment to fight climate change, our factories have decarbonisation, water usage and waste optimisation programmes. Also in 2022, the Group used third-party manufacturers to manufacture the components required, including the devices, related to New Categories. The Group also used third-party manufacturers to supplement the Group’s own production facilities in the U.S. and Poland to bottle the liquids used in Vapour products. For more information on property, plant and equipment, see note 13 in the Notes on the Accounts. Raw Materials While the Group does not own tobacco farms or directly employ farmers, it sources tobacco leaf directly from circa 81,000 contracted farmers and through third-party suppliers mainly in developing countries and emerging markets. In respect of farmers we contract, we continually strive to improve farmer sustainability and viability with a focus on improved quality and resistance of seed, tailored mechanisation to reduce costs of production and increased yield, with similar expectation on our third-party suppliers in respect of their farmer contracts. We review our contracts on an annual basis considering Group requirements over the medium term (2-3 years) to promote the stability of demand and supply on production volumes. The Group also purchases a small amount of tobacco leaf from India where the tobacco is bought over an auction floor. The price of tobacco in US dollars varies from year-to-year driven by domestic inflationary pressures, economic and political factors, as well as climatic conditions which impact supply, demand and quality of tobacco grown. While COVID-19 impacted tobacco supply chains (in 2020 and 2021) across most markets and required process enhancements to minimise transmission risks within communities, prices and availability of tobacco were not significantly impacted. The Group believes there is an adequate supply of tobacco leaf in the world markets to satisfy its current and anticipated production requirements. We also source a number of other materials required as part of our production requirements, covering areas that include wrapping materials and filters for our combustibles business and liquids and batteries for our New Categories products. We work closely with our suppliers to ensure a robust supply chain, with contingency sourcing in place. Contracts and sourcing agreements are reviewed regularly, to ensure competitive trading terms while recognising that prices may be impacted by external factors that affect our third-party supply partners. COVID-19 has led to some short-term disruption in the supply of certain materials (due to local lockdowns and travel restrictions), yet this has been proactively managed to mitigate the impact. BAT Annual Report and Form 20-F 2022 Strategic Report Governance Report Financial Statements Other Information Property, Plant and Equipment 369
Principles In the U.S., ADSs of the Company are listed on the New York Stock Exchange (NYSE). The significant differences between the Company’s corporate governance practices as a UK company and those required by NYSE listing standards for U.S. companies are discussed below. The Company has applied a robust set of board governance principles, which reflect the UK Corporate Governance Code 2018 and its principles-based approach to corporate governance. NYSE rules require U.S. companies to adopt and disclose on their websites corporate governance guidelines. The Company complies with UK requirements, including a statement in this report of how the Company has applied the principles of the UK Corporate Governance Code 2018 and that the Company has complied with the provisions of the UK Corporate Governance Code 2018. Independence The Company’s Board governance principles require that all Non- Executive Directors be determined by the Board to be independent in character and judgement and free from any business or other relationships that could interfere materially with, or appear to affect, their judgement. The Board also has formal procedures for managing conflicts of interest. The Board has determined that, in its judgement, all of the Non-Executive Directors are independent. In doing so, the Board has taken into consideration the independence requirements outlined in the NYSE’s listing standards and considers these to be met by the Chair and all of its Non-Executive Directors. Committees The Company has a number of Board Committees that are broadly comparable in purpose and composition to those required by NYSE rules for domestic U.S. companies. For instance, the Company has a Nominations (rather than nominating/corporate governance) Committee and a Remuneration (rather than compensation) Committee. The Company also has an Audit Committee, which NYSE rules require for both US companies and foreign private issuers. These Committees are composed solely of Non-Executive Directors and, in the case of the Nominations Committee, the Chair of the Board whom the Board has determined to be independent in the manner described above. Each Board Committee has its own terms of reference, which prescribe the composition, main tasks and requirements of each of the Committees (see the Board Committee reports on pages 145, 150 and 159). Under U.S. securities laws and the listing standards of the NYSE, the Company is required to have an audit committee that satisfies the requirements of Rule 10A-3 under the Exchange Act and Section 303A.06 of the NYSE Listed Company Manual. The Company’s Audit Committee complies with these requirements. The Company’s Audit Committee does not have direct responsibility for the appointment, reappointment or removal of the independent auditors. Instead, it follows the UK Companies Act 2006 by making recommendations to the Board on these matters for it to put forward for shareholder approval at the AGM. One of the NYSE’s additional requirements for the audit committee states that at least one member of the audit committee is to have ‘accounting or related financial management expertise’. The Board has determined that Holly Keller Koeppel, Véronique Laury and Darrell Thomas possess such expertise and also possess the financial and audit committee experiences set forth in both the UK Corporate Governance Code 2018 and SEC rules (see the Audit Committee report on page 150). Holly Keller Koeppel and Darrell Thomas have also each been designated as an Audit Committee financial expert as defined in Item 16.A. of Form 20-F. The Board has also determined that each Audit Committee member meets the financial literacy requirements applicable under NYSE listing standards. Shareholder Approval of Equity Compensation Plans The NYSE rules for U.S. companies require that shareholders must be given the opportunity to vote on all equity-compensation plans and material revisions to those plans. The Company complies with UK requirements that are similar to the NYSE rules. The Board, however, does not explicitly take into consideration the NYSE’s detailed definition of what are considered ‘material revisions’. Codes of Business Conduct and Ethics The NYSE rules require US companies to adopt and disclose a code of business conduct and ethics for all directors, officers and employees and promptly disclose any waivers of the code for directors or executive officers. The Group Standards of Business Conduct (the “SoBC”) described on pages 66 and 67 apply to all staff in the Group, including senior management and the Board, and satisfy the NYSE requirements. All Group companies have adopted the SoBC (or localised versions). The SoBC also set out the Group’s whistleblowing policy, enabling staff, in confidence and anonymously, to raise concerns without fear of reprisal, including concerns regarding questionable accounting or auditing matters. The SoBC is available at bat.com/sobc. The Company has also adopted a code of ethics for its Chief Executive, Finance and Transformation Director, Group Financial Controller and Group Chief Accountant as required by the provisions of Section 406 of the Sarbanes-Oxley Act of 2002 and the rules issued by the SEC. No waivers or exceptions to the Code of Ethics were granted in 2022. The Code of Ethics includes requirements in relation to confidentiality, conflicts of interest and corporate opportunities, and obligations for those senior financial officers to act with honesty and integrity in the performance of their duties and to promote full, fair, accurate, timely and understandable disclosures in all reports and other documents submitted to the SEC, the UK Financial Conduct Authority, and any other regulatory agency. The Company considers that these codes and policies address the matters specified in the NYSE rules for U.S. companies. Independent Director Contact Interested parties may communicate directly with the independent directors, individually or as a group, by sending written correspondence addressed to the independent Director(s) to the attention of the Company Secretary at the following address: c/o Paul McCrory, Company Secretary, British American Tobacco p.l.c., Globe House, 4 Temple Place, London WC2R 2PG. BAT Annual Report and Form 20-F 2022 Strategic Report Governance Report Financial Statements Other Information Other Information US Corporate Governance Practices 370
Evaluation of Disclosure Controls and Procedures Disclosure controls and procedures The Group maintains ‘disclosure controls and procedures’ (as such term is defined in Exchange Act Rule 13a-15(e)), that are designed to ensure that information required to be disclosed in reports the Group files or submits under the Exchange Act is recorded, processed, summarised and reported within the time periods specified in the SEC rules and forms, and that such information is accumulated and communicated to management, including the Chief Executive and Finance and Transformation Director, as appropriate, to allow timely decisions regarding required disclosure. In designing and evaluating our disclosure controls and procedures, our management, including the Chief Executive and Finance and Transformation Director, recognise that any controls and procedures, no matter how well designed and operated, can provide only reasonable, not absolute, assurance that the objectives of the disclosure controls and procedures are met. Due to the inherent limitations in all control systems, no evaluation of controls can provide absolute assurance that all control issues and instances of fraud, if any, within the Group have been detected. The Group’s disclosure controls and procedures have been designed to meet, and management believes that they meet, reasonable assurance standards. Management, with the participation of the Chief Executive and Finance and Transformation Director, has evaluated the effectiveness of the Group disclosure controls and procedures pursuant to Exchange Act Rule 13a-15(b) as of the end of the period covered by this annual report. Based on that evaluation, the Chief Executive and Finance and Transformation Director have concluded that the Group disclosure controls and procedures were effective at a reasonable assurance level. Management’s report on internal control over financial reporting Management, under the oversight of the Chief Executive and the Finance and Transformation Director, is responsible for establishing and maintaining adequate internal control over financial reporting for the Group. The Group’s internal control over financial reporting consists of processes which are designed to: provide reasonable assurance regarding the reliability of financial reporting and the preparation of the Group’s financial statements for external reporting purposes in accordance with IFRS as issued by the IASB and UK-adopted international accounting standards; provide reasonable assurance that receipts and expenditure are made only in accordance with the authorisation of management; and provide reasonable assurance regarding the prevention or timely detection of any unauthorised acquisition, use or disposal of assets that could have a material effect on the consolidated financial statements. As required by Section 404 of the Sarbanes-Oxley Act of 2002, management has assessed the effectiveness of the internal control over financial reporting (as defined in Rules 13(a)-13(f) and 15(d)-15(f) under the US Securities Exchange Act of 1934) based on the updated Internal Control‑Integrated Framework issued by the Committee of Sponsoring Organisations of the Treadway Commission (COSO) (2013). Based on that assessment, management has determined that the Group’s internal control over financial reporting was effective as at 31 December 2022. Any internal control framework, no matter how well designed, has inherent limitations, including the possibility of human error and the circumvention or overriding of controls and procedures and may not prevent or detect misstatements. Also, projections of any evaluation of effectiveness to future periods are subject to the risk that controls may become inadequate because of changes in conditions or because the degree of compliance with the policies or procedures may deteriorate. »KPMG LLP, an independent registered public accounting firm, who also audit the Group’s consolidated financial statements, has audited the effectiveness of the Group’s internal control over financial reporting as at 31 December 2022. KPMG LLP has issued an attestation report on management’s assessment of the issuer’s internal control over financial reporting, which report is included in this document.>> Changes in internal control over financial reporting During the period covered by this report, there were no changes in the Group’s internal control over financial reporting that have materially affected or are reasonably likely to materially affect the effectiveness of internal control over financial reporting. Statements Regarding Competitive Position Statements referring to the competitive position of BAT and its subsidiaries are based on the Group’s belief and best estimates. In certain cases, such statements and figures rely on a range of sources, including investment analyst reports, independent market surveys, and the Group’s own internal assessments of market share. BAT Annual Report and Form 20-F 2022 Strategic Report Governance Report Financial Statements Other Information Controls and Procedures 371
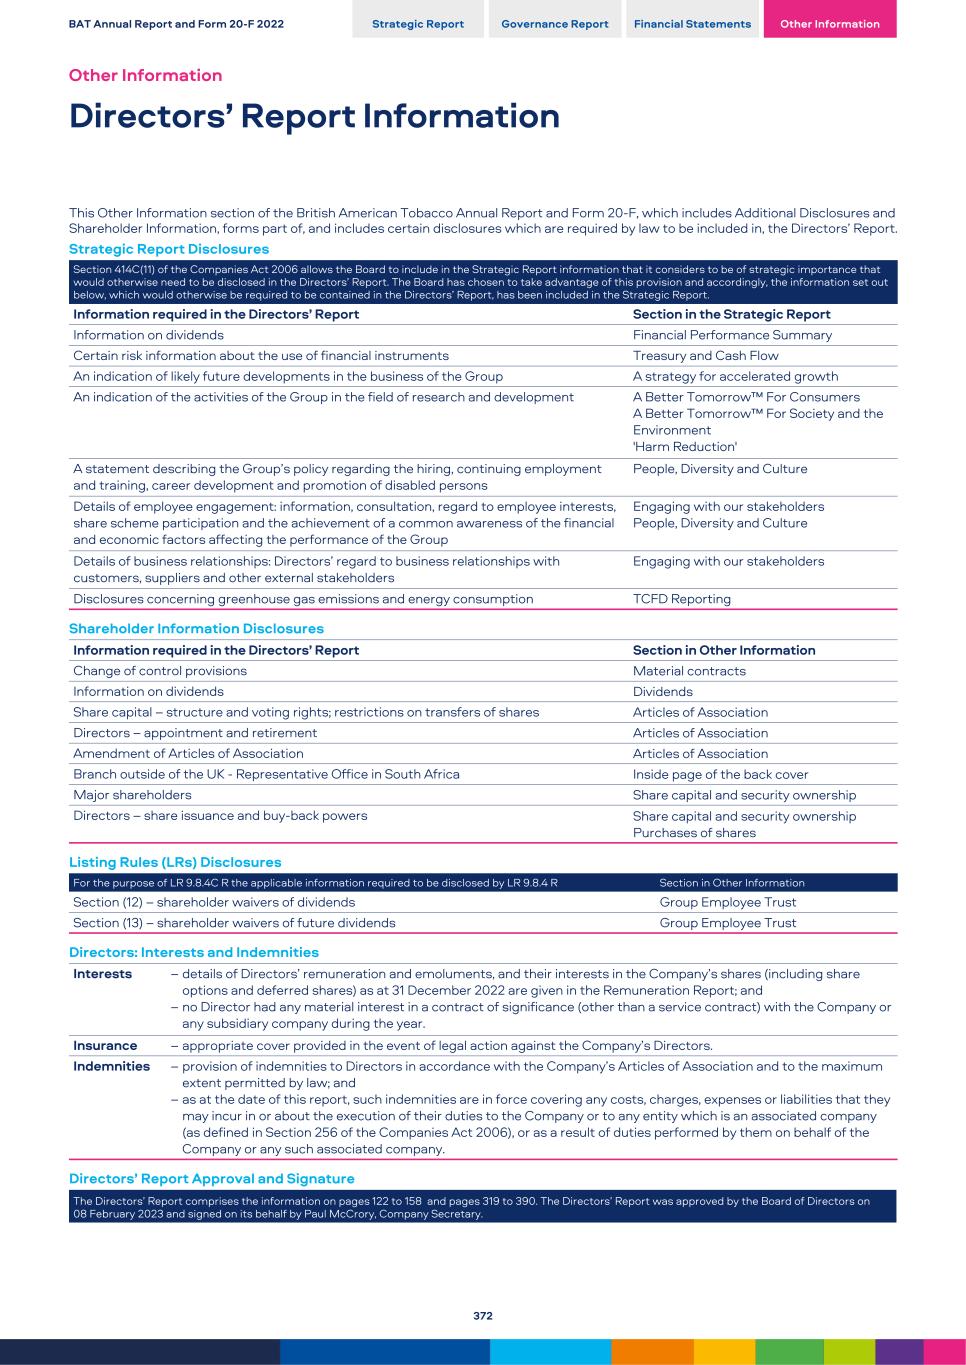
This Other Information section of the British American Tobacco Annual Report and Form 20-F, which includes Additional Disclosures and Shareholder Information, forms part of, and includes certain disclosures which are required by law to be included in, the Directors’ Report. Strategic Report Disclosures Section 414C(11) of the Companies Act 2006 allows the Board to include in the Strategic Report information that it considers to be of strategic importance that would otherwise need to be disclosed in the Directors’ Report. The Board has chosen to take advantage of this provision and accordingly, the information set out below, which would otherwise be required to be contained in the Directors’ Report, has been included in the Strategic Report. Information required in the Directors’ Report Section in the Strategic Report Information on dividends Financial Performance Summary Certain risk information about the use of financial instruments Treasury and Cash Flow An indication of likely future developments in the business of the Group A strategy for accelerated growth An indication of the activities of the Group in the field of research and development A Better Tomorrow™ For Consumers A Better Tomorrow™ For Society and the Environment 'Harm Reduction' A statement describing the Group’s policy regarding the hiring, continuing employment and training, career development and promotion of disabled persons People, Diversity and Culture Details of employee engagement: information, consultation, regard to employee interests, share scheme participation and the achievement of a common awareness of the financial and economic factors affecting the performance of the Group Engaging with our stakeholders People, Diversity and Culture Details of business relationships: Directors’ regard to business relationships with customers, suppliers and other external stakeholders Engaging with our stakeholders Disclosures concerning greenhouse gas emissions and energy consumption TCFD Reporting Shareholder Information Disclosures Information required in the Directors’ Report Section in Other Information Change of control provisions Material contracts Information on dividends Dividends Share capital – structure and voting rights; restrictions on transfers of shares Articles of Association Directors – appointment and retirement Articles of Association Amendment of Articles of Association Articles of Association Branch outside of the UK - Representative Office in South Africa Inside page of the back cover Major shareholders Share capital and security ownership Directors – share issuance and buy-back powers Share capital and security ownership Purchases of shares Listing Rules (LRs) Disclosures For the purpose of LR 9.8.4C R the applicable information required to be disclosed by LR 9.8.4 R Section in Other Information Section (12) – shareholder waivers of dividends Group Employee Trust Section (13) – shareholder waivers of future dividends Group Employee Trust Directors: Interests and Indemnities Interests – details of Directors’ remuneration and emoluments, and their interests in the Company’s shares (including share options and deferred shares) as at 31 December 2022 are given in the Remuneration Report; and – no Director had any material interest in a contract of significance (other than a service contract) with the Company or any subsidiary company during the year. Insurance – appropriate cover provided in the event of legal action against the Company’s Directors. Indemnities – provision of indemnities to Directors in accordance with the Company’s Articles of Association and to the maximum extent permitted by law; and – as at the date of this report, such indemnities are in force covering any costs, charges, expenses or liabilities that they may incur in or about the execution of their duties to the Company or to any entity which is an associated company (as defined in Section 256 of the Companies Act 2006), or as a result of duties performed by them on behalf of the Company or any such associated company. Directors’ Report Approval and Signature The Directors’ Report comprises the information on pages 122 to 158 and pages 319 to 390. The Directors’ Report was approved by the Board of Directors on 08 February 2023 and signed on its behalf by Paul McCrory, Company Secretary. BAT Annual Report and Form 20-F 2022 Strategic Report Governance Report Financial Statements Other Information Other Information Directors’ Report Information 372
This document contains certain forward-looking statements, including “forward-looking” statements made within the meaning of the U.S. Private Securities Litigation Reform Act of 1995. These statements are often, but not always, made through the use of words or phrases such as “believe,” “anticipate,” “could,” “may,” “would,” “should,” “intend,” “plan,” “potential,” “predict,” “will,” “expect,” “estimate,” “project,” “positioned,” “strategy,” “outlook”, “target” and similar expressions. These include statements regarding our intentions, beliefs or current expectations concerning, amongst other things, our results of operations, financial condition, liquidity, prospects, growth, strategies and the economic and business circumstances occurring from time to time in the countries and markets in which the Group operates, including the projected future financial and operating impacts of the COVID-19 pandemic. In particular, these forward-looking statements include, among other statements, statements regarding the Group’s future financial performance, planned product launches and future regulatory developments, as well as: (i) certain statements in the Overview section (pages 2 to 11, including the Chair’s Introduction, Chief Executive’s Review and Finance and Transformation Director’s Overview; (ii) certain statements in the Strategic Management section (pages 12 to 29), including Our Global Business section; (iii) certain statements in the Delivering a Better Tomorrow for Society and the Environment section (pages 42 to 81), including Our Material Topics and TCFD Reporting; (iv) certain statements in the Board Engagement with Stakeholders section (pages 136 to 140), including the Society section; (v) certain statements in the Financial Review section (pages 98 to 107), including the Treasury and Cash Flow section and going concern discussions; and (vi) certain statements in the Other Information section (pages 318 to 394), including the Additional Disclosures and Shareholder Information sections. All such forward-looking statements involve estimates and assumptions that are subject to risks, uncertainties and other factors. It is believed that the expectations reflected in this document are reasonable but they may be affected by a wide range of variables that could cause actual results to differ materially from those currently anticipated. Among the key factors that could cause actual results to differ materially from those projected in the forward-looking statements are uncertainties related to the following: the impact of competition from illicit trade; the impact of adverse domestic or international legislation and regulation; the inability to develop, commercialise and deliver the Group’s New Categories strategy; adverse litigation and dispute outcomes and the effect of such outcomes on the Group’s financial condition; the impact of significant increases or structural changes in tobacco, nicotine and New Categories related taxes; translational and transactional foreign exchange rate exposure; changes or differences in domestic or international economic or political conditions; the ability to maintain credit ratings and to fund the business under the current capital structure; the impact of serious injury, illness or death in the workplace; adverse decisions by domestic or international regulatory bodies; changes in the market position, businesses, financial condition, results of operations or prospects of the Group and direct and indirect adverse impacts associated with Climate Change and the move towards a Circular Economy. Further details on the principal risks that may affect the Group can be found in the ‘Group Principal Risks’ section of the Strategic Report on pages 116 to 121 of this document. A summary of all the risk factors (including the principal risks) which are monitored by the Board through the Group’s risk register is set out in the Additional Disclosures section under the heading ‘Group Risk Factors’ on pages 340 to 361. Past performance is no guide to future performance and persons needing advice should consult an independent financial adviser. The forward-looking statements reflect knowledge and information available at the date of preparation of this document and the Group undertakes no obligation to update or revise these forward-looking statements, whether as a result of new information, future events or otherwise. Readers are cautioned not to place undue reliance on such forward-looking statements. No statement in this document is intended to be a profit forecast and no statement in this document should be interpreted to mean that earnings per share of BAT for the current or future financial years would necessarily match or exceed the historical published earnings per share of BAT. BAT Annual Report and Form 20-F 2022 Strategic Report Governance Report Financial Statements Other Information Cautionary Statement 373
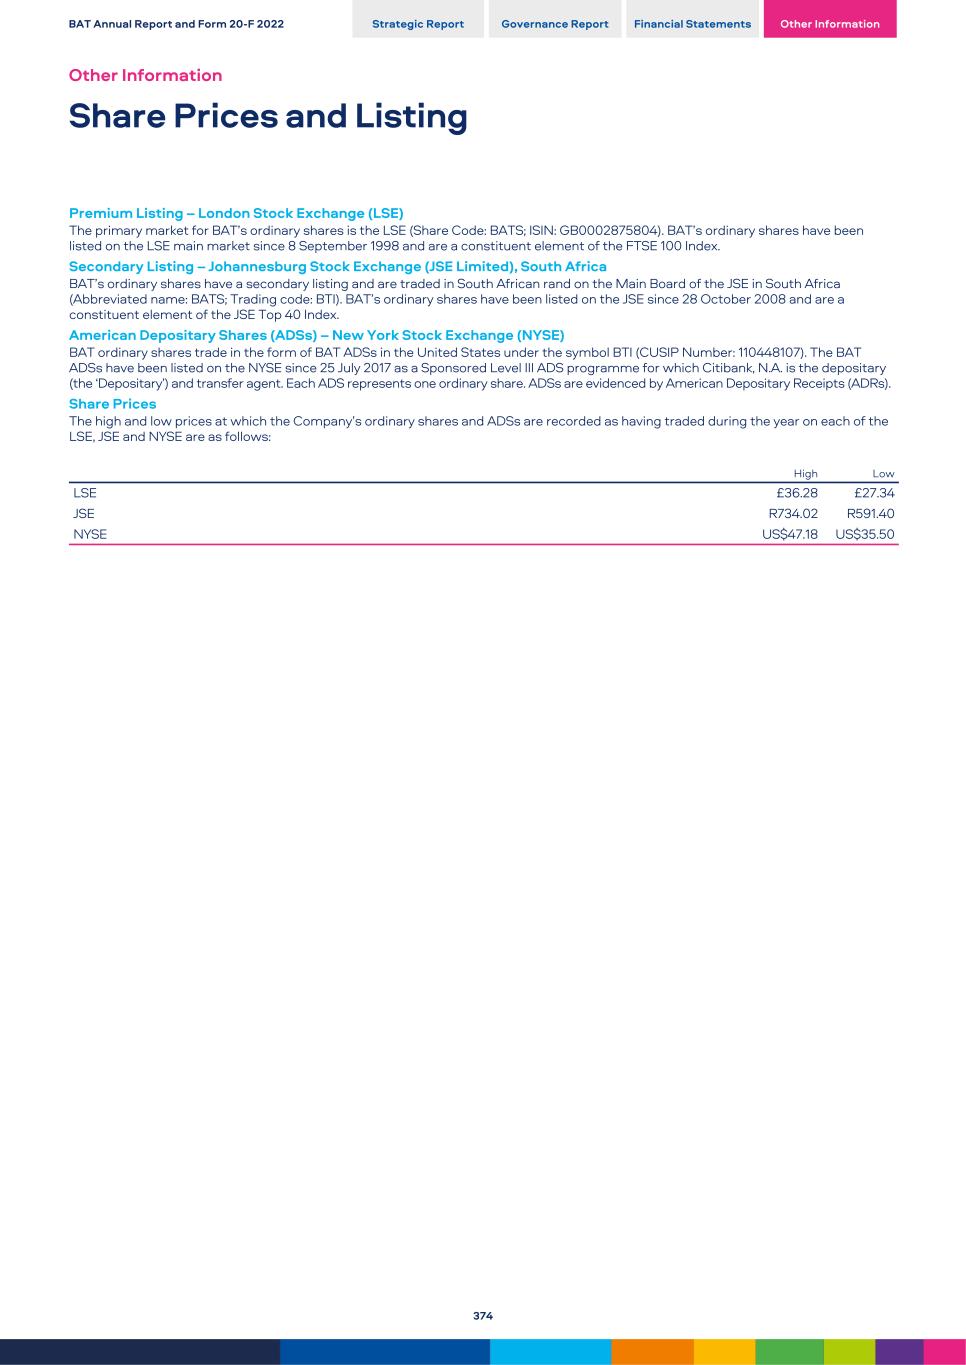
Premium Listing – London Stock Exchange (LSE) The primary market for BAT’s ordinary shares is the LSE (Share Code: BATS; ISIN: GB0002875804). BAT’s ordinary shares have been listed on the LSE main market since 8 September 1998 and are a constituent element of the FTSE 100 Index. Secondary Listing – Johannesburg Stock Exchange (JSE Limited), South Africa BAT’s ordinary shares have a secondary listing and are traded in South African rand on the Main Board of the JSE in South Africa (Abbreviated name: BATS; Trading code: BTI). BAT’s ordinary shares have been listed on the JSE since 28 October 2008 and are a constituent element of the JSE Top 40 Index. American Depositary Shares (ADSs) – New York Stock Exchange (NYSE) BAT ordinary shares trade in the form of BAT ADSs in the United States under the symbol BTI (CUSIP Number: 110448107). The BAT ADSs have been listed on the NYSE since 25 July 2017 as a Sponsored Level III ADS programme for which Citibank, N.A. is the depositary (the ‘Depositary’) and transfer agent. Each ADS represents one ordinary share. ADSs are evidenced by American Depositary Receipts (ADRs). Share Prices The high and low prices at which the Company’s ordinary shares and ADSs are recorded as having traded during the year on each of the LSE, JSE and NYSE are as follows: High Low LSE £36.28 £27.34 JSE R734.02 R591.40 NYSE US$47.18 US$35.50 BAT Annual Report and Form 20-F 2022 Strategic Report Governance Report Financial Statements Other Information Other Information Share Prices and Listing 374
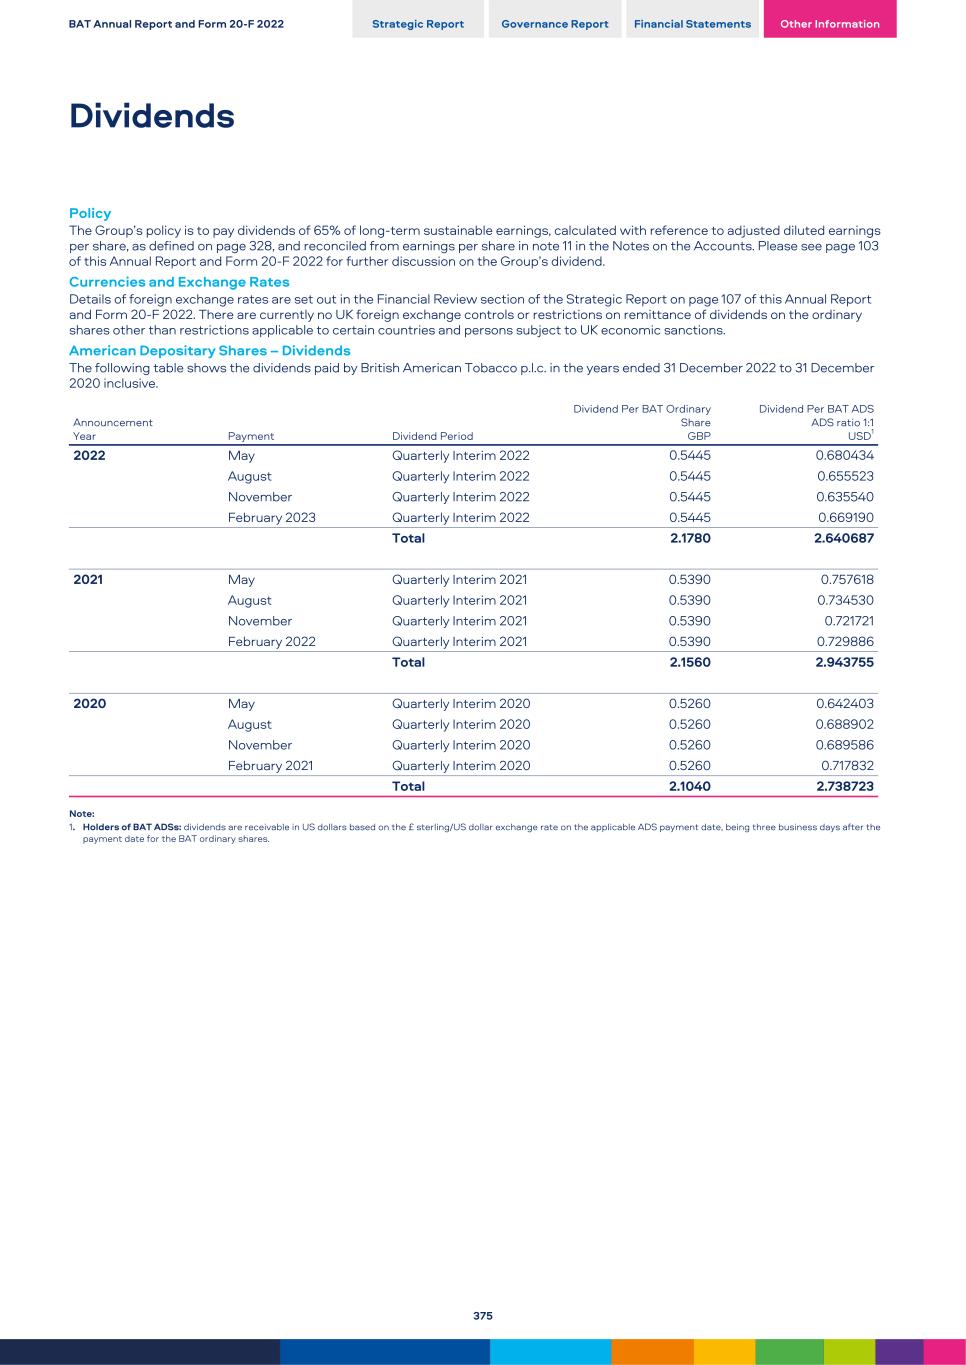
Policy The Group’s policy is to pay dividends of 65% of long-term sustainable earnings, calculated with reference to adjusted diluted earnings per share, as defined on page 328, and reconciled from earnings per share in note 11 in the Notes on the Accounts. Please see page 103 of this Annual Report and Form 20-F 2022 for further discussion on the Group’s dividend. Currencies and Exchange Rates Details of foreign exchange rates are set out in the Financial Review section of the Strategic Report on page 107 of this Annual Report and Form 20-F 2022. There are currently no UK foreign exchange controls or restrictions on remittance of dividends on the ordinary shares other than restrictions applicable to certain countries and persons subject to UK economic sanctions. American Depositary Shares – Dividends The following table shows the dividends paid by British American Tobacco p.l.c. in the years ended 31 December 2022 to 31 December 2020 inclusive. Announcement Year Payment Dividend Period Dividend Per BAT Ordinary Share GBP Dividend Per BAT ADS ADS ratio 1:1 USD1 2022 May Quarterly Interim 2022 0.5445 0.680434 August Quarterly Interim 2022 0.5445 0.655523 November Quarterly Interim 2022 0.5445 0.635540 February 2023 Quarterly Interim 2022 0.5445 0.669190 Total 2.1780 2.640687 2021 May Quarterly Interim 2021 0.5390 0.757618 August Quarterly Interim 2021 0.5390 0.734530 November Quarterly Interim 2021 0.5390 0.721721 February 2022 Quarterly Interim 2021 0.5390 0.729886 Total 2.1560 2.943755 2020 May Quarterly Interim 2020 0.5260 0.642403 August Quarterly Interim 2020 0.5260 0.688902 November Quarterly Interim 2020 0.5260 0.689586 February 2021 Quarterly Interim 2020 0.5260 0.717832 Total 2.1040 2.738723 Note: 1. Holders of BAT ADSs: dividends are receivable in US dollars based on the £ sterling/US dollar exchange rate on the applicable ADS payment date, being three business days after the payment date for the BAT ordinary shares. BAT Annual Report and Form 20-F 2022 Strategic Report Governance Report Financial Statements Other Information Dividends 375
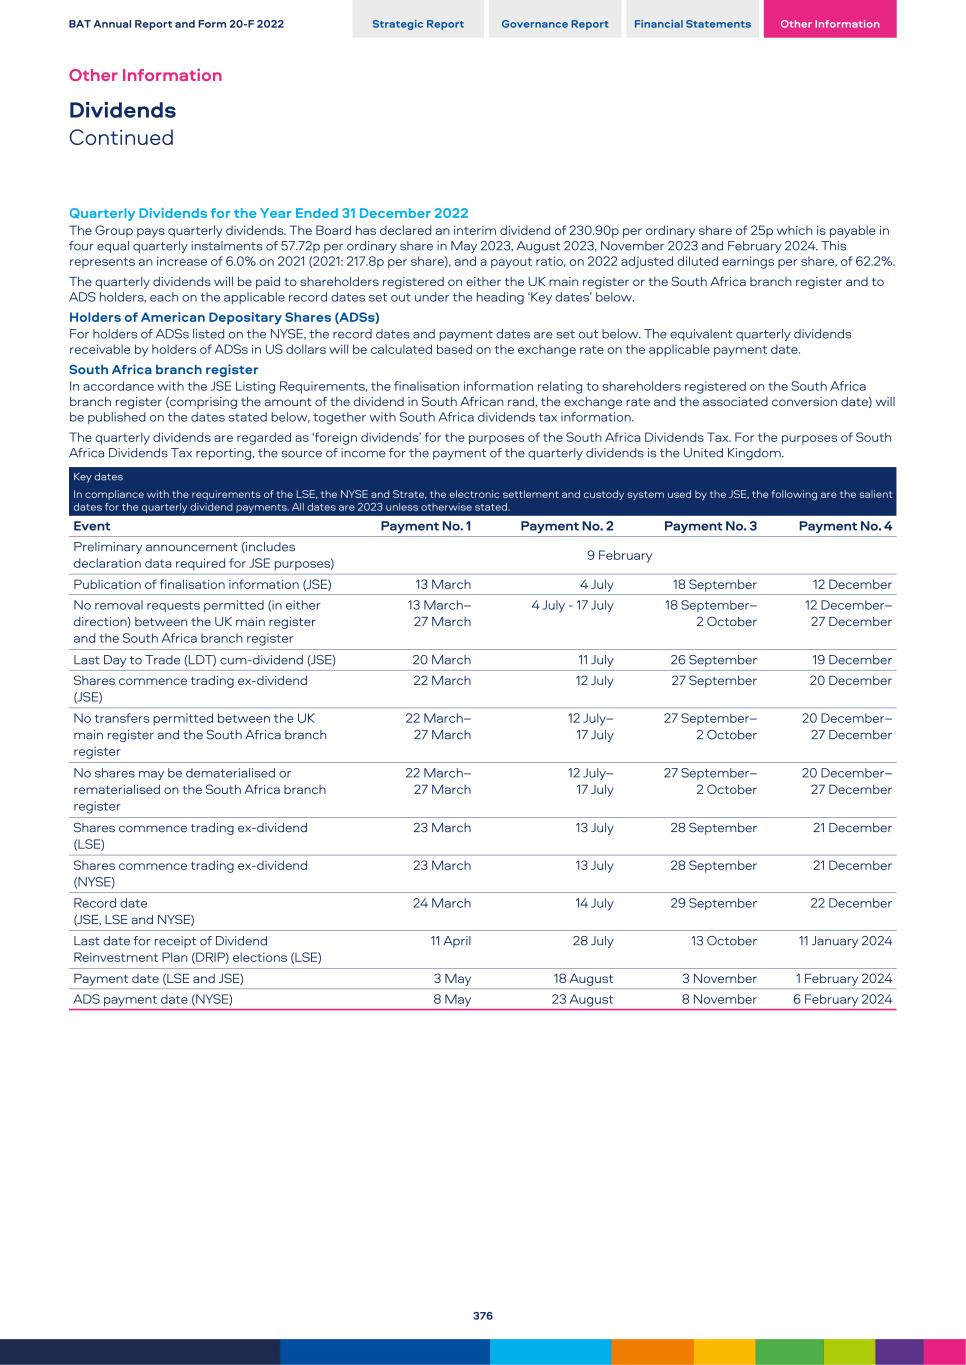
Quarterly Dividends for the Year Ended 31 December 2022 The Group pays quarterly dividends. The Board has declared an interim dividend of 230.90p per ordinary share of 25p which is payable in four equal quarterly instalments of 57.72p per ordinary share in May 2023, August 2023, November 2023 and February 2024. This represents an increase of 6.0% on 2021 (2021: 217.8p per share), and a payout ratio, on 2022 adjusted diluted earnings per share, of 62.2%. The quarterly dividends will be paid to shareholders registered on either the UK main register or the South Africa branch register and to ADS holders, each on the applicable record dates set out under the heading ‘Key dates’ below. Holders of American Depositary Shares (ADSs) For holders of ADSs listed on the NYSE, the record dates and payment dates are set out below. The equivalent quarterly dividends receivable by holders of ADSs in US dollars will be calculated based on the exchange rate on the applicable payment date. South Africa branch register In accordance with the JSE Listing Requirements, the finalisation information relating to shareholders registered on the South Africa branch register (comprising the amount of the dividend in South African rand, the exchange rate and the associated conversion date) will be published on the dates stated below, together with South Africa dividends tax information. The quarterly dividends are regarded as ‘foreign dividends’ for the purposes of the South Africa Dividends Tax. For the purposes of South Africa Dividends Tax reporting, the source of income for the payment of the quarterly dividends is the United Kingdom. Key dates In compliance with the requirements of the LSE, the NYSE and Strate, the electronic settlement and custody system used by the JSE, the following are the salient dates for the quarterly dividend payments. All dates are 2023 unless otherwise stated. Event Payment No. 1 Payment No. 2 Payment No. 3 Payment No. 4 Preliminary announcement (includes declaration data required for JSE purposes) 9 February Publication of finalisation information (JSE) 13 March 4 July 18 September 12 December No removal requests permitted (in either direction) between the UK main register and the South Africa branch register 13 March– 27 March 4 July - 17 July 18 September– 2 October 12 December– 27 December Last Day to Trade (LDT) cum-dividend (JSE) 20 March 11 July 26 September 19 December Shares commence trading ex-dividend (JSE) 22 March 12 July 27 September 20 December No transfers permitted between the UK main register and the South Africa branch register 22 March– 27 March 12 July– 17 July 27 September– 2 October 20 December– 27 December No shares may be dematerialised or rematerialised on the South Africa branch register 22 March– 27 March 12 July– 17 July 27 September– 2 October 20 December– 27 December Shares commence trading ex-dividend (LSE) 23 March 13 July 28 September 21 December Shares commence trading ex-dividend (NYSE) 23 March 13 July 28 September 21 December Record date (JSE, LSE and NYSE) 24 March 14 July 29 September 22 December Last date for receipt of Dividend Reinvestment Plan (DRIP) elections (LSE) 11 April 28 July 13 October 11 January 2024 Payment date (LSE and JSE) 3 May 18 August 3 November 1 February 2024 ADS payment date (NYSE) 8 May 23 August 8 November 6 February 2024 BAT Annual Report and Form 20-F 2022 Strategic Report Governance Report Financial Statements Other Information Other Information Dividends Continued 376
The following discussion summarises material U.S. federal income tax consequences and UK taxation consequences to U.S. holders of owning and disposing of ordinary shares or ADSs, this information is accurate as at >>2 March 2023>>. This discussion does not address any tax consequences arising under the laws of any state, local or foreign jurisdiction or under any U.S. federal laws other than those pertaining to income tax. This discussion is based upon the U.S. Internal Revenue Code of 1986 (the ‘U.S. Tax Code’), the Treasury regulations promulgated under the U.S. Tax Code and court and administrative rulings and decisions, all as in effect on the date hereof. These laws may change, possibly retroactively, and any change could affect the accuracy of the statements and conclusions set forth in this discussion. This discussion addresses only those U.S. holders of ordinary shares or ADSs who hold such equity interests as capital assets within the meaning of Section 1221 of the U.S. Tax Code. Further, this discussion does not address all aspects of U.S. federal income taxation that may be relevant to U.S. holders in light of their particular circumstances or that may be applicable to them if they are subject to special treatment under the U.S. federal income tax laws, including, without limitation: – a bank or other financial institution; – a tax-exempt organisation; – an S corporation or other pass-through entity and an investor therein; – an insurance company; – a mutual fund; – a regulated investment company or real estate investment trust; – a dealer or broker in stocks and securities, or currencies; – a trader in securities that elects mark-to-market treatment; – a U.S. holder subject to the alternative minimum tax provisions of the U.S. Tax Code; – a U.S. holder that received ordinary shares or ADSs through the exercise of an employee stock option, pursuant to a tax qualified retirement plan or otherwise as compensation; – a U.S. holder that is a tax-qualified retirement plan or a participant or a beneficiary under such a plan; – a person that is not a U.S. holder (as defined below); – a person that has a functional currency other than the U.S. dollar; – a person required to recognise any item of gross income as a result of such income being recognised on an applicable financial statement; – a U.S. holder of ordinary shares or ADSs that holds such equity interest as part of a hedge, straddle, constructive sale, conversion or other integrated transaction; – a U.S. holder that owns (directly, indirectly or constructively) 10% or more of ordinary shares or ADSs by vote or by value; or – a U.S. expatriate. The determination of the actual tax consequences to a U.S. holder will depend on the U.S. holder’s specific situation. U.S. holders of ordinary shares or ADSs should consult their own tax advisers as to the tax consequences of owning and disposing of ordinary shares or ADSs, in each case, including the applicability and effect of the alternative minimum tax and any state, local, foreign or other tax laws and of changes in those laws. For purposes of this discussion, the term U.S. holder means a beneficial owner of ordinary shares or ADSs (as the case may be) that: – is for U.S. federal income tax purposes: (i) an individual citizen or resident of the United States; (ii) a corporation, including any entity treated as a corporation for U.S. federal income tax purposes, created or organised in or under the laws of the United States, any state thereof or the District of Columbia; (iii) a trust if a U.S. court is able to exercise primary supervision over the trust’s administration and one or more U.S. persons are authorised to control all substantial decisions of the trust or it has a valid election in effect under applicable Treasury regulations to be treated as a U.S. person; or (iv) an estate that is subject to U.S. federal income tax on its income regardless of its source; and – is not resident in the UK for UK tax purposes. The U.S. federal income tax consequences to a partner in an entity or arrangement treated as a partnership for U.S. federal income tax purposes that holds ordinary shares or ADSs generally will depend on the status of the partner and the activities of the partnership. Partners in a partnership holding any such equity interest should consult their own tax advisers. Material U.S. Federal Income Tax Consequences Relating to the Ownership and Disposition of Ordinary Shares or ADSs The following is a discussion of the material U.S. federal income tax consequences of the ownership and disposition by U.S. holders of ordinary shares or ADSs. This discussion assumes that BAT is not, and will not become, a passive foreign investment company for U.S. federal income tax purposes, as described below. ADSs A US holder of ADSs, for U.S. federal income tax purposes, generally will be treated as the owner of the underlying ordinary shares that are represented by such ADSs. Accordingly, deposits or withdrawals of ordinary shares for or from ADSs will not be subject to U.S. federal income tax. Taxation of Dividends The gross amount of distributions on the ordinary shares or ADSs will be taxable as dividends to the extent paid out of BAT’s current or accumulated earnings and profits, as determined under U.S. federal income tax principles. Such income will be includable in a U.S. holder’s gross income as ordinary income on the day actually or constructively received by the U.S. holder. Such dividends will be treated as foreign source income and will not be eligible for the dividends received deduction allowed to corporations under the U.S. Tax Code. BAT Annual Report and Form 20-F 2022 Strategic Report Governance Report Financial Statements Other Information Shareholder Taxation Information 377
With respect to non-corporate U.S. investors, certain dividends received from a qualified foreign corporation may be subject to reduced rates of taxation. A qualified foreign corporation includes a foreign corporation that is eligible for the benefits of a comprehensive income tax treaty with the United States that the Treasury determines to be satisfactory for these purposes and that includes an exchange of information provision. The Treasury has determined that the treaty between the United States and the United Kingdom meets these requirements, and BAT believes that it is eligible for the benefits of the treaty. However, non-corporate holders that do not meet a minimum holding period requirement during which they are not protected from the risk of loss or that elect to treat the dividend income as ‘investment income’ pursuant to Section 163(d)(4) of the U.S. Tax Code will not be eligible for the reduced rates of taxation. In addition, the rate reduction will not apply to dividends if the recipient of a dividend is obligated to make related payments with respect to positions in substantially similar or related property. This disallowance applies even if the minimum holding period has been met. U.S. holders should consult their own tax advisers regarding the application of these rules to their particular circumstances. The amount of any dividend paid by BAT in £ sterling (including any such amount in respect of ADSs that is converted into U.S. dollars by the depositary bank) will equal the U.S. dollar value of the £ sterling actually or constructively received, calculated by reference to the exchange rate in effect on the date the dividend is so received by the U.S. holder, regardless of whether the £ sterling are converted into U.S. dollars. If the £ sterling received as a dividend are converted into U.S. dollars on the date received, the U.S. holder generally will not be required to recognise foreign currency exchange gain or loss in respect of the dividend income. If the £ sterling received as a dividend are not converted into U.S. dollars on the date of receipt, the U.S. holder will have a basis in £ sterling equal to their U.S. dollar value on the date of receipt. Any gain or loss realised on a subsequent conversion or other disposition of £ sterling will be treated as U.S. source ordinary income or loss. U.S. holders of ADSs should consult their own tax advisers regarding the application of these rules to the amount of any dividend paid by BAT in £ sterling that is converted into U.S. dollars by the depositary bank. To the extent that the amount of any distribution exceeds BAT’s current and accumulated earnings and profits for a taxable year, as determined under U.S. federal income tax principles, the distribution will first be treated as a tax-free return of capital, causing a reduction in the U.S. holder’s adjusted basis of the ordinary shares or ADSs, and to the extent the amount of the distribution exceeds the U.S.holder’s tax basis, the excess will be taxed as capital gain recognised on a sale or exchange, as described below. BAT does not expect to determine earnings and profits in accordance with U.S. federal income tax principles. Therefore, notwithstanding the foregoing, U.S. holders should expect that distributions generally will be reported as dividend income for U.S. information reporting purposes. Distributions by BAT of additional ordinary shares (which may be distributed by the depositary bank to a holder of ADSs in the form of ADSs) to a U.S. holder that is made as part of a pro rata distribution to all holders of ordinary shares and ADSs in respect of their ordinary shares or ADSs, and for which there is no option to receive other property (not including ADSs), generally will not be subject to U.S. federal income tax. The basis of any new ordinary shares (or ADSs representing new ordinary shares) so received will be determined by allocating the U.S. holder’s basis in the previously held ordinary shares or ADSs between the previously held ordinary shares or ADSs and the new ordinary shares or ADSs, based on their relative fair market values on the date of distribution. Passive foreign investment company A passive foreign investment company (“PFIC”), is any foreign corporation if, after the application of certain ‘look-through’ rules: (1) at least 75% of its gross income is ‘passive income’ as that term is defined in the relevant provisions of the U.S. Tax Code; or (2) at least 50% of the average value of its assets produce ‘passive income’ or are held for the production of ‘passive income.’ The determination as to PFIC status is made annually. BAT does not believe that it is, for U.S. federal income tax purposes, a PFIC, and BAT expects to operate in such a manner so as not to become a PFIC. If, however, BAT is or becomes a PFIC, U.S. holders could be subject to additional U.S. federal income taxes on gain recognised with respect to the ordinary shares or ADSs and on certain distributions, plus an interest charge on certain taxes treated as having been deferred under the PFIC rules. Non-corporate U.S. holders will not be eligible for reduced rates of taxation on any dividends received from BAT if it is a PFIC in the taxable year in which such dividends are paid or in the preceding taxable year. BAT’s U.S. counsel expresses no opinion with respect to BAT’s PFIC status. Taxation of capital gains Upon a sale, exchange or other taxable disposition of ordinary shares or ADSs, a U.S. holder will generally recognise capital gain or loss for U.S. federal income tax purposes in an amount equal to the difference between the US dollar value of the amount realised on the disposition and the U.S. holder’s adjusted tax basis in the ordinary shares or ADSs as determined in U.S. dollars. Such gain or loss generally will be U.S. source gain or loss, and will be long-term capital gain or loss if the U.S. holder has held the ordinary shares or ADSs for more than one year. Certain non-corporate U.S. holders may be eligible for preferential rates of U.S. federal income tax in respect of net long-term capital gains. The deductibility of capital losses is subject to limitations. The amount realised on a sale, exchange or other taxable disposition of ordinary shares for an amount in foreign currency will be the U.S. dollar value of that amount on the date of sale or disposition. On the settlement date, the U.S. holder will recognise U.S. source foreign currency exchange gain or loss (taxable as ordinary income or loss) equal to the difference (if any) between the U.S. dollar value of the amount received based on the exchange rates in effect on the date of sale, exchange or other disposition and the settlement date. However, in the case of ordinary shares traded on an established securities market that are sold by a cash- basis U.S. holder (or an accrual-basis U.S. holder that so elects), the amount realised will be based on the exchange rate in effect on the settlement date for the sale, and no foreign currency exchange gain or loss will be recognised at that time. A U.S. holder’s tax basis in ordinary shares or ADSs will generally equal the U.S. dollar cost of the ordinary shares or ADSs. The U.S. dollar cost of ordinary shares purchased with foreign currency will generally be the U.S. dollar value of the purchase price on the date of purchase, or the settlement date for the purchase in the case of ordinary shares traded on an established securities market that are purchased by a cash-basis U.S. holder (or an accrual-basis U.S. holder that so elects). BAT Annual Report and Form 20-F 2022 Strategic Report Governance Report Financial Statements Other Information Other Information Shareholder Taxation Information Continued 378
Information with respect to foreign financial assets Individuals and certain entities that own ‘specified foreign financial assets’ with an aggregate value in excess of US$50,000 are generally required to file information reports with respect to such assets with their U.S. federal income tax returns. Depending on the individual’s circumstances, higher threshold amounts may apply. Specified foreign financial assets include any financial accounts maintained by foreign financial institutions, as well as any of the following, but only if they are not held in accounts maintained by financial institutions: (1) stocks and securities issued by non-U.S. persons; (2) financial instruments and contracts held for investment that have non-U.S. issuers or counterparties; and (3) interests in non‑U.S. entities. If a U.S. holder is subject to this information reporting regime, the failure to file information reports may subject the U.S. holder to penalties. U.S. holders are urged to consult their own tax advisers regarding their obligations to file information reports with respect to ordinary shares or ADSs. Medicare net investment tax Certain persons who are individuals (other than non-resident aliens), estates or trusts are required to pay an additional 3.8% tax on the lesser of (1) their ‘net investment income’ (in the case of individuals) or ‘undistributed net investment income’ (in the case of estates and trusts) (which includes dividend income in respect of, and gain recognised on the disposition of, ordinary shares or ADSs) for the relevant taxable year; and (2) the excess of their modified adjusted gross income (in the case of individuals) or adjusted gross income (in the case of estates and trusts) for the taxable year over specified dollar amounts. U.S. holders are urged to consult their tax advisers regarding the applicability of this provision to their ownership of ordinary shares or ADSs. Credits or deductions for UK taxes As indicated under ‘Material UK tax consequences’ below, dividends in respect of, and gains on the disposition of, ordinary shares or ADSs may be subject to UK taxation in certain circumstances. A U.S. holder may be eligible to claim a credit or deduction in respect of UK taxes attributable to such income or gain for purposes of computing the U.S. holder’s U.S. federal income tax liability, subject to certain limitations. The U.S. foreign tax credit rules are complex, and U.S. holders should consult their own tax advisers regarding the availability of U.S. foreign tax credits and the application of the U.S. foreign tax credit rules to their particular situation. Information reporting and backup withholding Information reporting and backup withholding may apply to dividend payments and proceeds from the sale, exchange or other taxable disposition of ordinary shares or ADSs. Backup withholding will not apply, however, to a U.S. holder that: (1) furnishes a correct taxpayer identification number (TIN), certifies that such holder is not subject to backup withholding on Internal Revenue Service Form W-9 (or appropriate successor form) and otherwise complies with all applicable requirements of the backup withholding rules; or (2) provides proof that such holder is otherwise exempt from backup withholding. Backup withholding is not an additional tax, and any amounts withheld under the backup withholding rules may be refunded or credited against a holder’s U.S. federal income tax liability, if any, provided that such holder furnishes the required information to the Internal Revenue Service in a timely manner. The Internal Revenue Service may impose a penalty upon any taxpayer that fails to provide the correct TIN. This summary of material U.S. federal income tax consequences is not tax advice. The determination of the actual tax consequences for a U.S. holder will depend on the U.S. holder’s specific situation. U.S. holders of ordinary shares or ADSs, in each case, should consult their own tax advisers as to the tax consequences of owning and disposing of ordinary shares or ADSs, including the applicability and effect of the alternative minimum tax and any state, local, foreign or other tax laws and of changes in those laws. BAT Annual Report and Form 20-F 2022 Strategic Report Governance Report Financial Statements Other Information 379
Material UK Tax Consequences The following paragraphs summarise material aspects of the UK tax treatment of U.S. holders of ordinary shares or ADSs and do not purport to be either a complete analysis of all tax considerations relating to holding ordinary shares or ADSs or an analysis of the tax position of BAT. They are based on current UK legislation and what is understood to be current HMRC practice, both of which are subject to change, possibly with retrospective effect. The comments are intended as a general guide and (otherwise than where expressly stated to the contrary) apply only to U.S. holders of ordinary shares or ADSs (other than under a personal equity plan or individual savings account) and who are the absolute beneficial owners of such shares. These comments do not deal with certain types of shareholders such as charities, dealers in securities, persons holding or acquiring shares in the course of a trade, persons who have or could be treated for tax purposes as having acquired their ordinary shares or ADSs by reason of their employment, collective investment schemes, persons subject to UK tax on the remittance basis and insurance companies. You are encouraged to consult an appropriate independent professional tax adviser with respect to your tax position. Tax on chargeable gains as a result of disposals of ordinary shares or ADSs Subject to the below, U.S. holders will not generally be subject to UK tax on chargeable gains on a disposal of ordinary shares or ADSs provided that they do not carry on a trade, profession or vocation in the United Kingdom through a branch, agency or permanent establishment in connection with which the ordinary shares or ADSs are held. A U.S. holder who is an individual, who has ceased to be resident for tax purposes in the United Kingdom for a period of less than five years and who disposes of ordinary shares or ADSs during that period may be liable for UK tax on capital gains (in the absence of any available exemptions or reliefs). If applicable, the tax charge will arise in the tax year that the individual returns to the United Kingdom. Tax on dividends BAT is not required to withhold UK tax at source from dividends paid on ordinary shares or ADSs. U.S. holders will not generally be subject to UK tax on dividends received from BAT provided that they do not carry on a trade, profession or vocation in the United Kingdom through a branch, agency or permanent establishment in connection with which the ordinary shares or ADSs are held. Stamp duty and stamp duty reserve tax (SDRT) Based on current published HMRC practice and recent case law, transfers of ADSs should not be subject to SDRT or stamp duty. The transfer of an underlying ordinary share to the ADS holder in exchange for the cancellation of an ADS should also not give rise to a stamp duty or SDRT charge. Transfers of ordinary shares outside of the depositary bank, including the repurchase of ordinary shares by BAT, will generally be subject to stamp duty or SDRT at the rate of 0.5% of the amount or value of the consideration given, except as described above in connection with the cancellation of an ADS. If ordinary shares are redeposited into a clearance service or depositary system, the redeposit will attract stamp duty or SDRT at the higher rate of 1.5%. The purchaser or the transferee of the ordinary shares or ADSs will generally be responsible for paying any stamp duty or SDRT payable. Where stamp duty or SDRT is payable, it is payable regardless of the residence position of the purchaser. Inheritance tax A gift or settlement of ordinary shares or ADSs by, or on the death of, an individual shareholder may give rise to a liability to UK inheritance tax even if the shareholder is not a resident of, or domiciled in, the United Kingdom. A charge to inheritance tax may arise in certain circumstances where ordinary shares or ADSs are held by close companies and trustees of settlements. However, pursuant to the Estate and Gift Tax Treaty 1980 (the “Treaty”) entered into between the United Kingdom and the United States, a gift or settlement of ordinary shares or ADSs by shareholders who are domiciled in the United States for the purposes of the Treaty may be exempt from any liability to UK inheritance tax. BAT Annual Report and Form 20-F 2022 Strategic Report Governance Report Financial Statements Other Information Other Information Shareholder Taxation Information Continued 380
Share Capital Share Capital Ordinary shares of 25p each 31 December 2022 Issued ordinary shares (excluding treasury shares) 2,235,867,228 Treasury shares 221,000,192 Total alloted and fully paid ordinary shares 2,456,867,420 Aggregated nominal value £m 614.2 Note: 1. Includes treasury shares and shares owned by employee share trusts. Authority to allot shares This authority (granted at the 2022 AGM) will expire at the 2023 AGM and provides the Company authority to allot relevant securities up to the amount representing one-third of the Company’s then issued ordinary share capital (excluding treasury shares). Although the Directors have no present intention of exercising this authority, it provides them with an appropriate level of authority for on-going purposes and the Directors consider it appropriate to maintain the flexibility that this authority provides. Analyses of Shareholders Ordinary Shares At 31 December 2022, there was a total of 2,456,867,420 ordinary shares in issue held by 102,304 shareholders. These shareholdings are analysed as follows: (a) by listing as at 31 December 2022: Register Total number of shares Number of holders % of issued share capital UK 2,201,061,504 32,955 89.59 South Africa 255,805,916 69,349 10.41 Total 2,456,867,420 102,304 100.00 (b) by size of shareholding as at 31 December 2022: UK Register Number of holders % of UK ordinary share capital 1-1,999 28,250 0.54 2,000-9,999 3,375 0.59 10,000-199,999 957 2.20 200,000-499,999 130 1.85 500,000 and over 242 84.78 Treasury shares (UK) 1 10.04 Total 32,955 100.00 South Africa Register Number of holders % of SA ordinary share capital 1-1,999 64,092 6.23 2,000-9,999 3,520 5.67 10,000-199,999 1,597 24.54 200,000-499,999 83 9.95 500,000 and over 57 53.61 Total 69,349 100.00 Combined registers Number of holders % of issued ordinary share capital 1-1,999 92,342 1.13 2,000-9,999 6,895 1.12 10,000-199,999 2,554 4.52 200,000-499,999 213 2.70 500,000 and over 299 81.53 Treasury shares (UK) 1 9.00 Total 102,304 100.00 American Depositary Shares (ADSs) At 31 December 2022, there was a total of 277,478,111 ADSs outstanding held by 8,595 registered holders. The ADS register is analysed by size of shareholding as at 31 December 2022 as follows: Number of holders % of total ADSs 1-1,999 8,418 0.58 2,000-9,999 157 0.19 10,000-199,999 18 0.13 200,000-499,999 1 0.08 500,000 and over 1 99.02 Total 8,595 100.00 Note: 1. One registered holder of ADSs represents 570,503 underlying shareholders. Security Ownership of Ordinary Shares As at 3 February 2023, there were 32,819 record holders of ordinary shares listed on the LSE (including Citibank as the depositary bank for the ADSs) and 2,203,451,905 of such ordinary shares outstanding. As at that date, to BAT’s knowledge, 302 record holders, representing 0% of the ordinary shares listed on the LSE, had a registered address in the US. As at 3 February 2023, there were 1,156 record holders of ordinary shares listed on the JSE (including PLC Nominees (Proprietary) Limited as the nominee for the dematerialised ordinary shares listed on the JSE) and 253,418,167 of such ordinary shares outstanding. As at such date, to BAT’s knowledge, 7 record holders, representing 0% of the ordinary shares listed on the JSE had a registered address in the US. As at 3 February 2023, based on information received from Citibank, there were 8,574 record holders of ADSs and 295,838,263 ADSs outstanding. As at that date, based on information received from Citibank, 8,493 record holders, representing 99.95% of ADSs representing ordinary shares, had a registered address in the US. Security Ownership – Major Shareholders All shares held by the significant shareholders represent the Company's ordinary shares. These significant shareholders have no special voting rights compared with other holders of the Company's ordinary shares. At 31 December 2022, the following substantial interests (3% or more) in the Company’s ordinary share capital (voting securities) had been notified to the Company in accordance with Section 5.1.2 of the Disclosure Guidance and Transparency Rules (DTRs). The Company has not received any notifications in accordance with DTR 5.1.2 from 1 January 2023 to the date of this report. Name Number of ordinary shares % of issued share capital1 The Capital Group Companies, Inc.2 292,841,616 13.10 Spring Mountain Investments Ltd.3 187,023,731 8.36 BlackRock, Inc 132,891,526 5.94 Notes: 1. The percentage of issued share capital as at 31 December 2022, excluding treasury shares. 2. Includes 17,722,608 ordinary shares represented by ADRs. 3. Includes 5,807,274 ordinary shares represented by ADRs. BAT Annual Report and Form 20-F 2022 Strategic Report Governance Report Financial Statements Other Information Share Capital and Security Ownership 381
Additional Significant Shareholding Disclosure The Company is aware of the following interests from filings by shareholders made under the US Securities Exchange Act of 1934 as at the date of this report: Holder Schedule 13G Filing Date1 Date of holding Ordinary shares held Percentage of ordinary share capital held2 Portfolio Services Ltd3 10 February 2023 31 December 2022 198,285,158 8.9 % 10 February 2022 31 December 2021 187,023,731 8.2 % 22 January 2021 31 December 2020 114,819,555 5.0 % BlackRock, Inc. 31 January 2023 31 December 2022 172,502,866 7.7 % 3 February 2022 31 December 2021 184,921,039 8.1 % 29 January 2021 31 December 2020 178,392,857 7.8 % Capital International Investors, a division of Capital Research and Management Company4 13 February 2023 30 December 2022 115,107,720 5.1 % 11 February 2022 31 December 2021 110,680,543 4.8 % 16 February 2021 31 December 2020 122,341,746 5.3 % Capital Research Global Investors, a division of Capital Research and Management Company4 13 February 2023 30 December 2022 126,794,516 5.7 % 16 February 2021 31 December 2020 42,749,672 1.9 % Notes: 1. In addition to the Schedule 13G filings made with the SEC, in accordance with the DTRs, shareholders must notify the Company if their shareholding reaches, exceeds or falls below 3% of total voting rights and each 1% threshold thereafter. The notifications received by the Company during the past three years to the best of the Company’s knowledge are set out in the notes below. 2. The percentage of issued share capital excludes treasury shares. 3. Kenneth B. Dart is beneficial owner of all outstanding shares of Portfolio Services Ltd. and Spring Mountain Investments Ltd 187,023,731.. Spring Mountain Investments Ltd notified the Company on: 22 October 2020 that its interest had increased above the notifiable threshold of 3% to 69,295,724 ordinary shares on 20 October 2020; 11 December 2020 that its interest had increased above 4% to 92,462,558 ordinary shares on 9 December 2020; 14 January 2021 that its interest had increased above 5% to 115,596,737 ordinary shares on 12 January 2021; 19 February 2021 that its interest had increased above 6% to 138,342,092 ordinary shares on 23 February 2021; 22 April 2021 that its interest had increased above 7% to 161,977,731 ordinary shares on 20 April 2021; 17 August 2021 that its interest had increased above 8% to 184,360,731 ordinary shares on 16 August 2021; and 12 November 2021 that its interest had increased above 9% to 187,023,731 ordinary shares on 11 November 2021. 4. The notifications regarding the holdings by The Capital Group Companies, Inc., listed below, indicate that Capital Research and Management Company is part of a chain of controlled undertakings with The Capital Group Companies, Inc.: The Capital Group Companies, Inc. notified the Company on: 6 January 2020 that its interest had increased above 12% to 275,376,579 ordinary shares on 3 January 2020; 26 March 2020 that its interest had decreased below 12% to 274,639,101 ordinary shares on 25 March 2020; 8 April 2020 that its interest had increased above 12% to 276,394,237 ordinary shares on 7 April 2020; 22 July 2020 that its interest had decreased below 12% to 243,800,405 ordinary shares on 20 July 2020; 6 August 2020 that its interest had decreased below 11% to 245,769,790 ordinary shares on 4 August 2020; 1 October 2020 that its interest had increased above 11% to256,801,504 ordinary shares on 29 September 2020; 29 March 2021 that its interest had decreased below 11% to 251,963,680 ordinary shares on 26 March 2021; 20 April 2021 that its interest had increased above 11% to 253,881,408 ordinary shares on 19 April 2021; 15 October 2021 that its interest had decreased below 11% to 251,653,679 ordinary shares on 14 October 2021; 25 January 2022 that its interests had increased above 11% to 249,908,259 ordinary shares on 24 January 2022; 26 January 2022 that its interests had increased above 11% to 253,762,060 ordinary shares on 25 January 2022; 24 February 2022 that its interests had increased above 12% to 275,311,725 ordinary shares on 23 February 2022; 9 June 2022 that its interests had increased above 13% to 295,342,819 ordinary shares on 8 June 2022; 17 June 2022 that its interests had decreased below 13% to 293,149,711 ordinary shares on 16 June 2022; 14 July 2022 that its interests had increased above 13% to 293,899,574 ordinary shares on 13 July 2022; 28 July 2022 that its interests had decreased below 13% to 292,880,152 ordinary shares on 27 July 2022; 11 August 2022 that its interests had increased above 13% to 292,841,616 ordinary shares on 9 August 2022. To the extent known by BAT, BAT is not directly or indirectly owned or controlled by another corporation, any foreign government or by any other natural or legal person, severally or jointly. BAT is not aware of any arrangements, the operation of which may at a subsequent date result in a change of control of the Group. BAT Annual Report and Form 20-F 2022 Strategic Report Governance Report Financial Statements Other Information Other Information Share Capital and Security Ownership Continued 382
The Company is incorporated under the name of British American Tobacco p.l.c. and is registered in England and Wales under registered number 3407696. Under the Companies Act 2006 (the “Companies Act”), the Company’s objects are unrestricted. The following descriptions summarise certain provisions of the Company’s current Articles of Association (the “Articles”) (as adopted by special resolution at the AGM on 28 April 2010), applicable English and Welsh law and the Companies Act. This summary is qualified in its entirety by reference to the Companies Act and the Articles, available on bat.com. The Articles may be altered or added to, or completely new articles may be adopted, by a special resolution of the shareholders of the Company, subject to the provisions of the Companies Act. Share capital – structure Ordinary shares – all of the Company’s ordinary shares are fully paid – no further contribution of capital may be required by the Company from the holders of such shares Alteration of share capital – the Company by ordinary resolution may: – consolidate and divide all or any of its shares into shares of a larger amount than its existing shares – divide or sub-divide any of its shares into shares of smaller amount than its existing shares – determine that, as between the shares resulting from such a sub-division, any of them may have any preference or advantage as compared with the others Alteration of share capital – the Company, subject to the provisions of the Companies Act, may: – reduce its share capital, its capital redemption reserve and any share premium account in any way – purchase its own shares, including redeemable shares, and may hold such shares as treasury shares or cancel them Dividend rights – shareholders may, by ordinary resolution, declare dividends but not in excess of the amount recommended by the Directors – the Directors may pay interim dividends out of distributable profits – no dividend shall be paid otherwise than out of the profits available for distribution as specified under the provisions of the Companies Act – the Directors may, with the authority of an ordinary resolution of the shareholders, pay scrip dividends or satisfy the payment of a dividend by the distribution of specific assets – unclaimed dividends for a period of 12 years may be forfeited and cease to be owed by the Company – specific provisions enable the Directors to elect to pay dividends by bank or electronic transfer only Share capital – voting rights Voting at general meetings – by a show of hands, unless a poll is demanded, and on a show of hands, every shareholder who is present in person at a general meeting has one vote regardless of the number of shares held by that shareholder – every proxy appointed by a shareholder and present at a general meeting has one vote except that if the proxy has been duly appointed by more than one shareholder entitled to vote on the resolution and is instructed by one or more of those shareholders to vote for the resolution and by one or more others to vote against it, or is instructed by one or more of those shareholders to vote in one way and is given discretion as to how to vote by one or more others (and wishes to use that discretion to vote in the other way), he has one vote for and one vote against the resolution – on a poll, every shareholder who is present in person or by proxy has one vote for every share held by the shareholder – a shareholder (or his duly appointed proxy) entitled to more than one vote need not use all his votes or cast all the votes he uses in the same way – a poll may be demanded by any of the following: a.the Chairman of the meeting; b.the Directors; c.not less than five shareholders having the right to vote at the meeting; d.a shareholder or shareholders representing not less than one-tenth of the total voting rights of all shareholders having the right to vote at the meeting (excluding any voting rights attached to treasury shares); or e.a shareholder or shareholders holding shares which confer a right to vote on the resolution at the meeting being shares on which an aggregate sum has been paid up equal to not less than one-tenth of the total sum paid up on all shares conferring that right (excluding any voting rights attached to treasury shares) Matters transacted at general meetings – ordinary resolutions can include resolutions for the appointment, reappointment and removal of Directors, the receiving of the Annual Report, the declaration of final dividends, the appointment and reappointment of the external auditor, the authority for the Company to purchase its own shares and the grant of authority to allot shares – an ordinary resolution is passed when a simple majority of the votes cast at a meeting at which there is a quorum vote in favour of the resolution – special resolutions can include resolutions amending the Company’s Articles and resolutions relating to certain matters concerning a winding‑up of the Company – a special resolution is passed when not less than three-quarters of the votes cast at a meeting at which there is a quorum vote in favour of the resolution – quorum for a meeting of the Company is a minimum of two shareholders present in person or by proxy or by a duly authorised representative(s) of a corporation which is a shareholder and entitled to vote – convening a meeting: the Company may specify a time not more than 48 hours before the time of the meeting (excluding any part of a day that is not a working day) by which a person must be entered on the register of members in order to have the right to attend or vote at the meeting BAT Annual Report and Form 20-F 2022 Strategic Report Governance Report Financial Statements Other Information Articles of Association 383
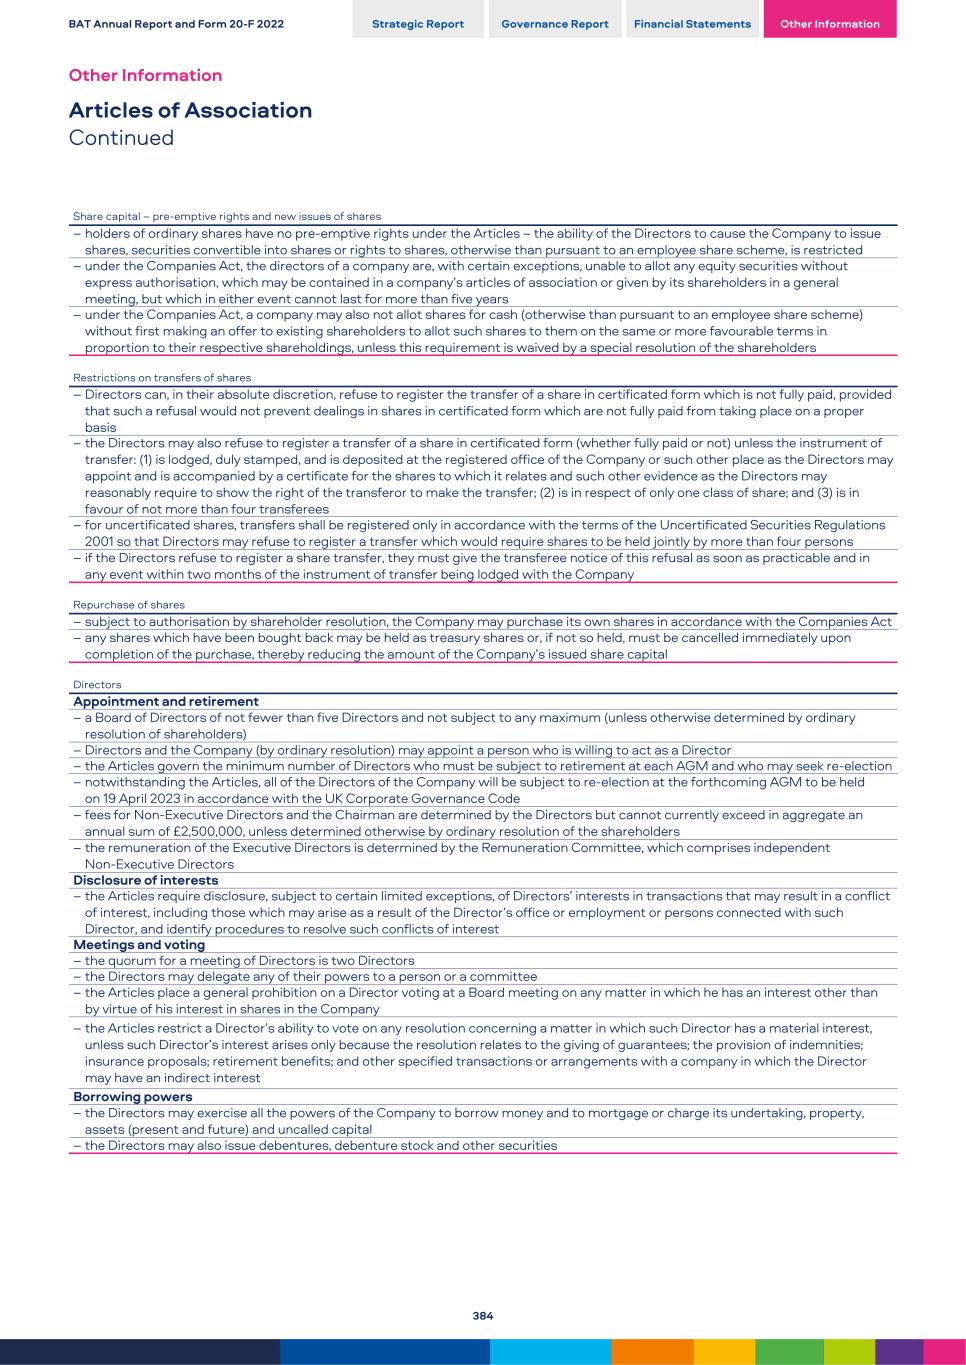
Share capital – pre-emptive rights and new issues of shares – holders of ordinary shares have no pre-emptive rights under the Articles – the ability of the Directors to cause the Company to issue shares, securities convertible into shares or rights to shares, otherwise than pursuant to an employee share scheme, is restricted – under the Companies Act, the directors of a company are, with certain exceptions, unable to allot any equity securities without express authorisation, which may be contained in a company’s articles of association or given by its shareholders in a general meeting, but which in either event cannot last for more than five years – under the Companies Act, a company may also not allot shares for cash (otherwise than pursuant to an employee share scheme) without first making an offer to existing shareholders to allot such shares to them on the same or more favourable terms in proportion to their respective shareholdings, unless this requirement is waived by a special resolution of the shareholders Restrictions on transfers of shares – Directors can, in their absolute discretion, refuse to register the transfer of a share in certificated form which is not fully paid, provided that such a refusal would not prevent dealings in shares in certificated form which are not fully paid from taking place on a proper basis – the Directors may also refuse to register a transfer of a share in certificated form (whether fully paid or not) unless the instrument of transfer: (1) is lodged, duly stamped, and is deposited at the registered office of the Company or such other place as the Directors may appoint and is accompanied by a certificate for the shares to which it relates and such other evidence as the Directors may reasonably require to show the right of the transferor to make the transfer; (2) is in respect of only one class of share; and (3) is in favour of not more than four transferees – for uncertificated shares, transfers shall be registered only in accordance with the terms of the Uncertificated Securities Regulations 2001 so that Directors may refuse to register a transfer which would require shares to be held jointly by more than four persons – if the Directors refuse to register a share transfer, they must give the transferee notice of this refusal as soon as practicable and in any event within two months of the instrument of transfer being lodged with the Company Repurchase of shares – subject to authorisation by shareholder resolution, the Company may purchase its own shares in accordance with the Companies Act – any shares which have been bought back may be held as treasury shares or, if not so held, must be cancelled immediately upon completion of the purchase, thereby reducing the amount of the Company’s issued share capital Directors Appointment and retirement – a Board of Directors of not fewer than five Directors and not subject to any maximum (unless otherwise determined by ordinary resolution of shareholders) – Directors and the Company (by ordinary resolution) may appoint a person who is willing to act as a Director – the Articles govern the minimum number of Directors who must be subject to retirement at each AGM and who may seek re-election – notwithstanding the Articles, all of the Directors of the Company will be subject to re-election at the forthcoming AGM to be held on 19 April 2023 in accordance with the UK Corporate Governance Code – fees for Non-Executive Directors and the Chairman are determined by the Directors but cannot currently exceed in aggregate an annual sum of £2,500,000, unless determined otherwise by ordinary resolution of the shareholders – the remuneration of the Executive Directors is determined by the Remuneration Committee, which comprises independent Non‑Executive Directors Disclosure of interests – the Articles require disclosure, subject to certain limited exceptions, of Directors’ interests in transactions that may result in a conflict of interest, including those which may arise as a result of the Director’s office or employment or persons connected with such Director, and identify procedures to resolve such conflicts of interest Meetings and voting – the quorum for a meeting of Directors is two Directors – the Directors may delegate any of their powers to a person or a committee – the Articles place a general prohibition on a Director voting at a Board meeting on any matter in which he has an interest other than by virtue of his interest in shares in the Company – the Articles restrict a Director’s ability to vote on any resolution concerning a matter in which such Director has a material interest, unless such Director’s interest arises only because the resolution relates to the giving of guarantees; the provision of indemnities; insurance proposals; retirement benefits; and other specified transactions or arrangements with a company in which the Director may have an indirect interest Borrowing powers – the Directors may exercise all the powers of the Company to borrow money and to mortgage or charge its undertaking, property, assets (present and future) and uncalled capital – the Directors may also issue debentures, debenture stock and other securities BAT Annual Report and Form 20-F 2022 Strategic Report Governance Report Financial Statements Other Information Other Information Articles of Association Continued 384
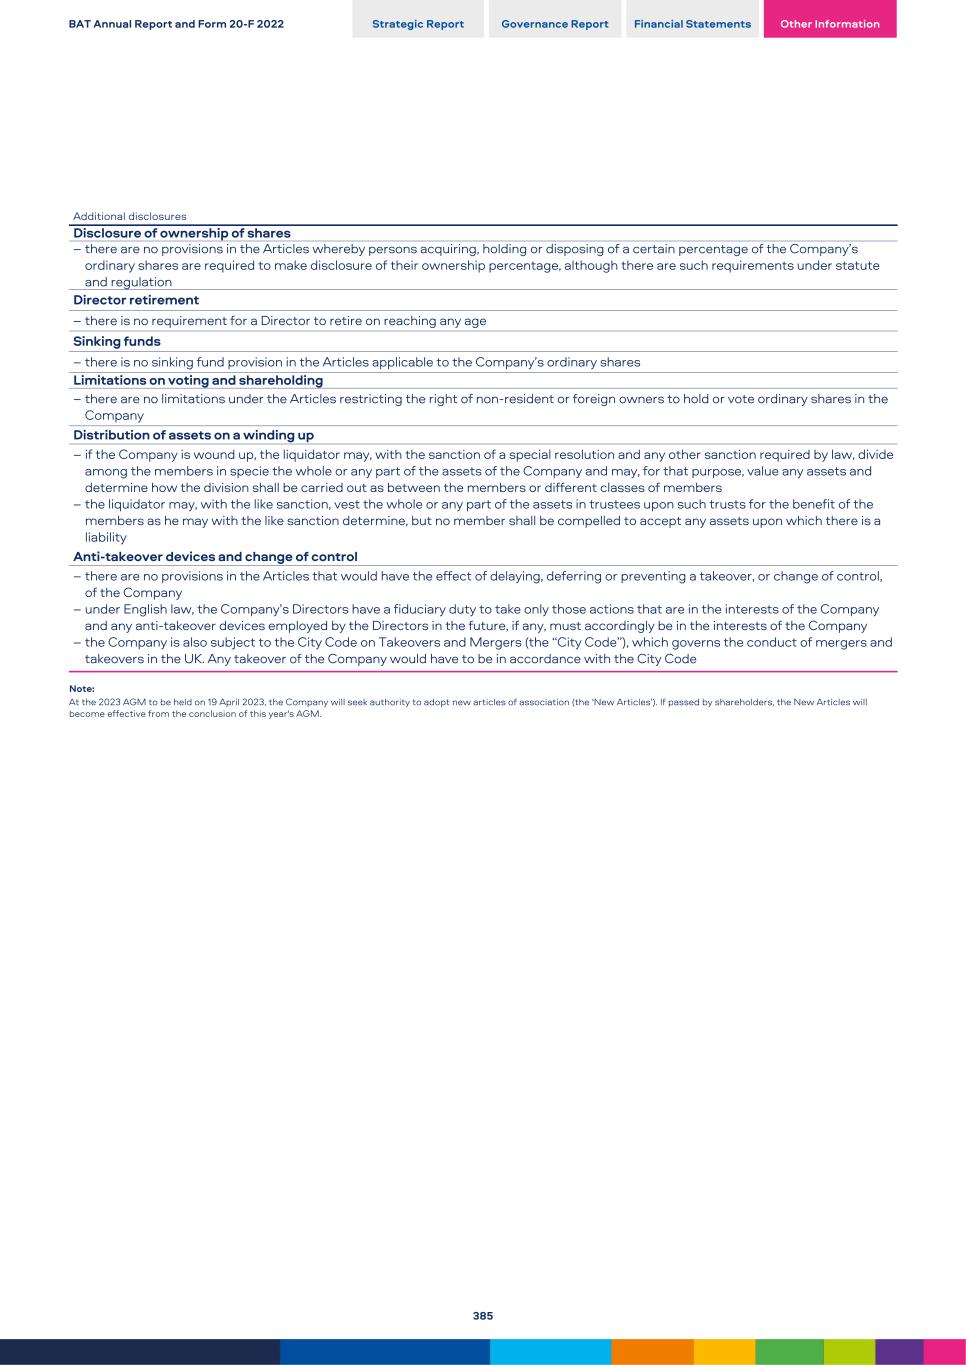
Additional disclosures Disclosure of ownership of shares – there are no provisions in the Articles whereby persons acquiring, holding or disposing of a certain percentage of the Company’s ordinary shares are required to make disclosure of their ownership percentage, although there are such requirements under statute and regulation Director retirement – there is no requirement for a Director to retire on reaching any age Sinking funds – there is no sinking fund provision in the Articles applicable to the Company’s ordinary shares Limitations on voting and shareholding – there are no limitations under the Articles restricting the right of non-resident or foreign owners to hold or vote ordinary shares in the Company Distribution of assets on a winding up – if the Company is wound up, the liquidator may, with the sanction of a special resolution and any other sanction required by law, divide among the members in specie the whole or any part of the assets of the Company and may, for that purpose, value any assets and determine how the division shall be carried out as between the members or different classes of members – the liquidator may, with the like sanction, vest the whole or any part of the assets in trustees upon such trusts for the benefit of the members as he may with the like sanction determine, but no member shall be compelled to accept any assets upon which there is a liability Anti-takeover devices and change of control – there are no provisions in the Articles that would have the effect of delaying, deferring or preventing a takeover, or change of control, of the Company – under English law, the Company’s Directors have a fiduciary duty to take only those actions that are in the interests of the Company and any anti-takeover devices employed by the Directors in the future, if any, must accordingly be in the interests of the Company – the Company is also subject to the City Code on Takeovers and Mergers (the “City Code”), which governs the conduct of mergers and takeovers in the UK. Any takeover of the Company would have to be in accordance with the City Code Note: At the 2023 AGM to be held on 19 April 2023, the Company will seek authority to adopt new articles of association (the ‘New Articles’). If passed by shareholders, the New Articles will become effective from the conclusion of this year's AGM. BAT Annual Report and Form 20-F 2022 Strategic Report Governance Report Financial Statements Other Information 385
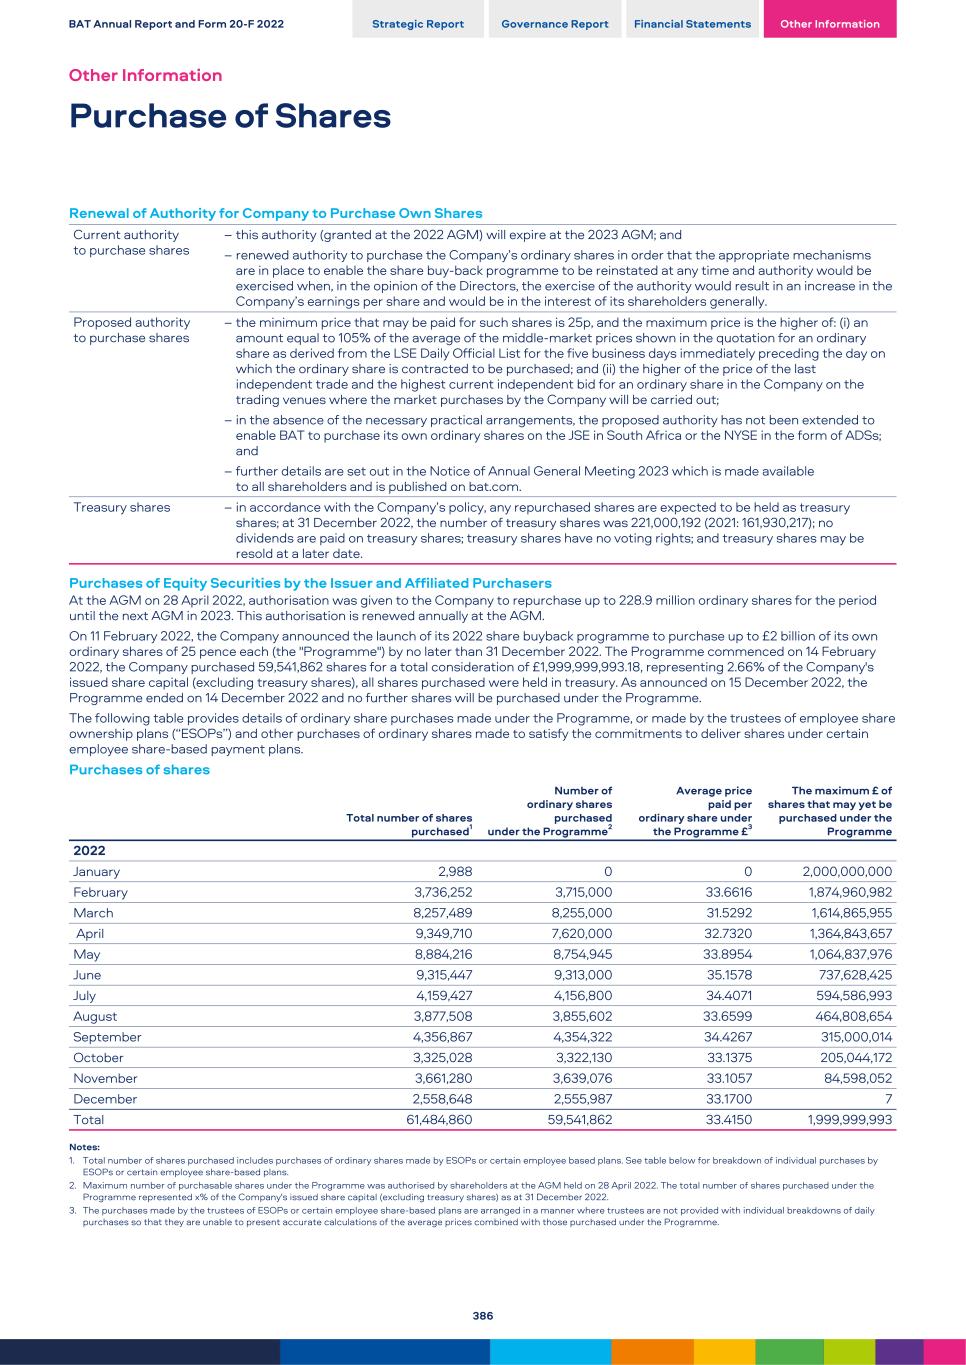
Renewal of Authority for Company to Purchase Own Shares Current authority to purchase shares – this authority (granted at the 2022 AGM) will expire at the 2023 AGM; and – renewed authority to purchase the Company’s ordinary shares in order that the appropriate mechanisms are in place to enable the share buy-back programme to be reinstated at any time and authority would be exercised when, in the opinion of the Directors, the exercise of the authority would result in an increase in the Company’s earnings per share and would be in the interest of its shareholders generally. Proposed authority to purchase shares – the minimum price that may be paid for such shares is 25p, and the maximum price is the higher of: (i) an amount equal to 105% of the average of the middle-market prices shown in the quotation for an ordinary share as derived from the LSE Daily Official List for the five business days immediately preceding the day on which the ordinary share is contracted to be purchased; and (ii) the higher of the price of the last independent trade and the highest current independent bid for an ordinary share in the Company on the trading venues where the market purchases by the Company will be carried out; – in the absence of the necessary practical arrangements, the proposed authority has not been extended to enable BAT to purchase its own ordinary shares on the JSE in South Africa or the NYSE in the form of ADSs; and – further details are set out in the Notice of Annual General Meeting 2023 which is made available to all shareholders and is published on bat.com. Treasury shares – in accordance with the Company’s policy, any repurchased shares are expected to be held as treasury shares; at 31 December 2022, the number of treasury shares was 221,000,192 (2021: 161,930,217); no dividends are paid on treasury shares; treasury shares have no voting rights; and treasury shares may be resold at a later date. Purchases of Equity Securities by the Issuer and Affiliated Purchasers At the AGM on 28 April 2022, authorisation was given to the Company to repurchase up to 228.9 million ordinary shares for the period until the next AGM in 2023. This authorisation is renewed annually at the AGM. On 11 February 2022, the Company announced the launch of its 2022 share buyback programme to purchase up to £2 billion of its own ordinary shares of 25 pence each (the "Programme") by no later than 31 December 2022. The Programme commenced on 14 February 2022, the Company purchased 59,541,862 shares for a total consideration of £1,999,999,993.18, representing 2.66% of the Company's issued share capital (excluding treasury shares), all shares purchased were held in treasury. As announced on 15 December 2022, the Programme ended on 14 December 2022 and no further shares will be purchased under the Programme. The following table provides details of ordinary share purchases made under the Programme, or made by the trustees of employee share ownership plans (“ESOPs”) and other purchases of ordinary shares made to satisfy the commitments to deliver shares under certain employee share-based payment plans. Purchases of shares Total number of shares purchased1 Number of ordinary shares purchased under the Programme2 Average price paid per ordinary share under the Programme £3 The maximum £ of shares that may yet be purchased under the Programme 2022 January 2,988 0 0 2,000,000,000 February 3,736,252 3,715,000 33.6616 1,874,960,982 March 8,257,489 8,255,000 31.5292 1,614,865,955 April 9,349,710 7,620,000 32.7320 1,364,843,657 May 8,884,216 8,754,945 33.8954 1,064,837,976 June 9,315,447 9,313,000 35.1578 737,628,425 July 4,159,427 4,156,800 34.4071 594,586,993 August 3,877,508 3,855,602 33.6599 464,808,654 September 4,356,867 4,354,322 34.4267 315,000,014 October 3,325,028 3,322,130 33.1375 205,044,172 November 3,661,280 3,639,076 33.1057 84,598,052 December 2,558,648 2,555,987 33.1700 7 Total 61,484,860 59,541,862 33.4150 1,999,999,993 Notes: 1. Total number of shares purchased includes purchases of ordinary shares made by ESOPs or certain employee based plans. See table below for breakdown of individual purchases by ESOPs or certain employee share-based plans. 2. Maximum number of purchasable shares under the Programme was authorised by shareholders at the AGM held on 28 April 2022. The total number of shares purchased under the Programme represented x% of the Company's issued share capital (excluding treasury shares) as at 31 December 2022. 3. The purchases made by the trustees of ESOPs or certain employee share-based plans are arranged in a manner where trustees are not provided with individual breakdowns of daily purchases so that they are unable to present accurate calculations of the average prices combined with those purchased under the Programme. BAT Annual Report and Form 20-F 2022 Strategic Report Governance Report Financial Statements Other Information Other Information Purchase of Shares 386
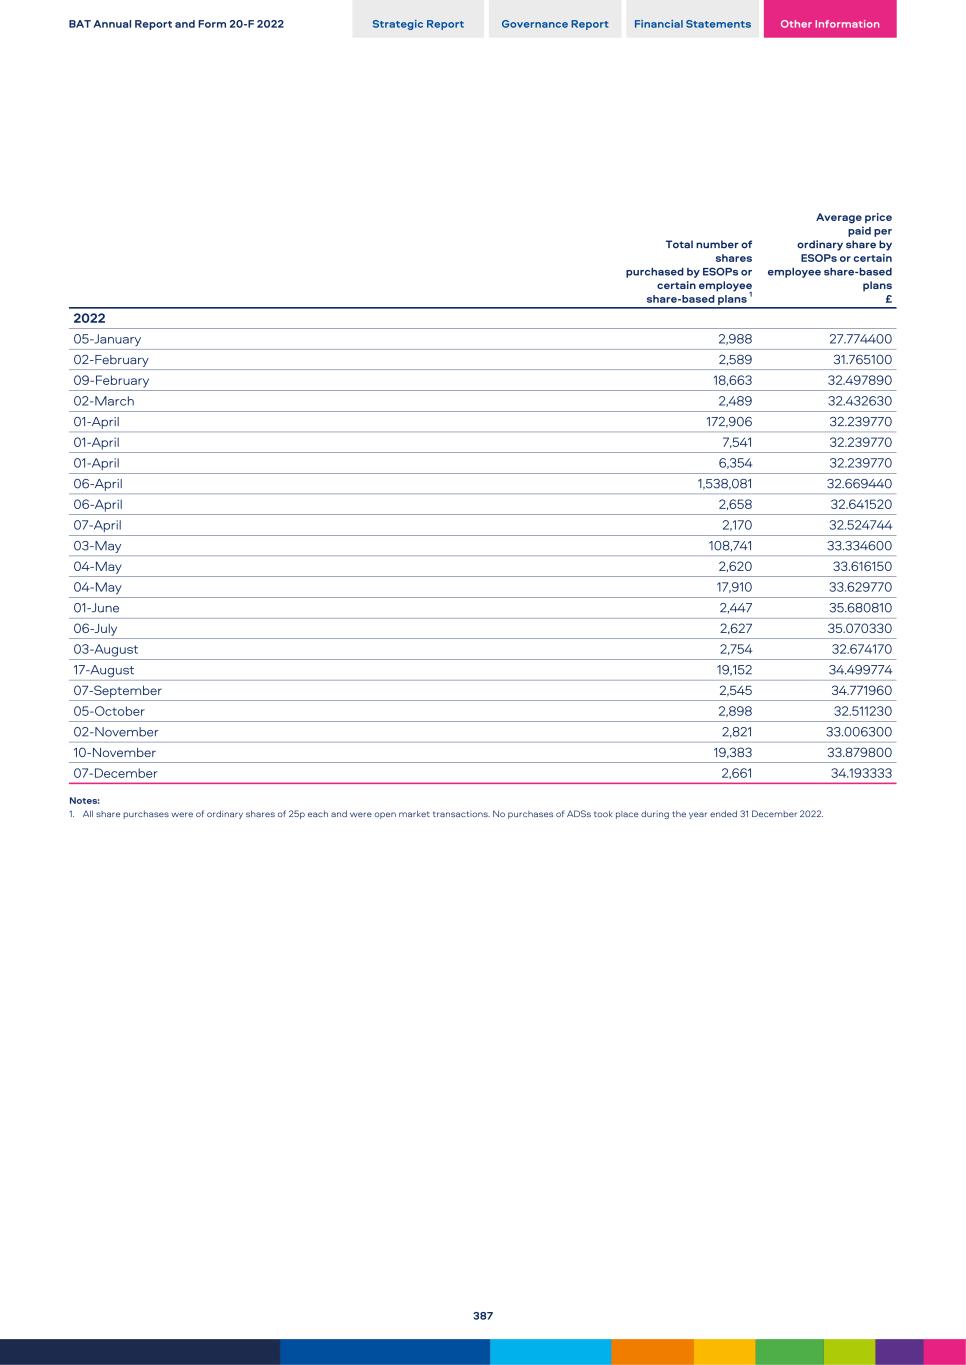
Total number of shares purchased by ESOPs or certain employee share-based plans 1 Average price paid per ordinary share by ESOPs or certain employee share-based plans £ 2022 05-January 2,988 27.774400 02-February 2,589 31.765100 09-February 18,663 32.497890 02-March 2,489 32.432630 01-April 172,906 32.239770 01-April 7,541 32.239770 01-April 6,354 32.239770 06-April 1,538,081 32.669440 06-April 2,658 32.641520 07-April 2,170 32.524744 03-May 108,741 33.334600 04-May 2,620 33.616150 04-May 17,910 33.629770 01-June 2,447 35.680810 06-July 2,627 35.070330 03-August 2,754 32.674170 17-August 19,152 34.499774 07-September 2,545 34.771960 05-October 2,898 32.511230 02-November 2,821 33.006300 10-November 19,383 33.879800 07-December 2,661 34.193333 Notes: 1. All share purchases were of ordinary shares of 25p each and were open market transactions. No purchases of ADSs took place during the year ended 31 December 2022. BAT Annual Report and Form 20-F 2022 Strategic Report Governance Report Financial Statements Other Information 387
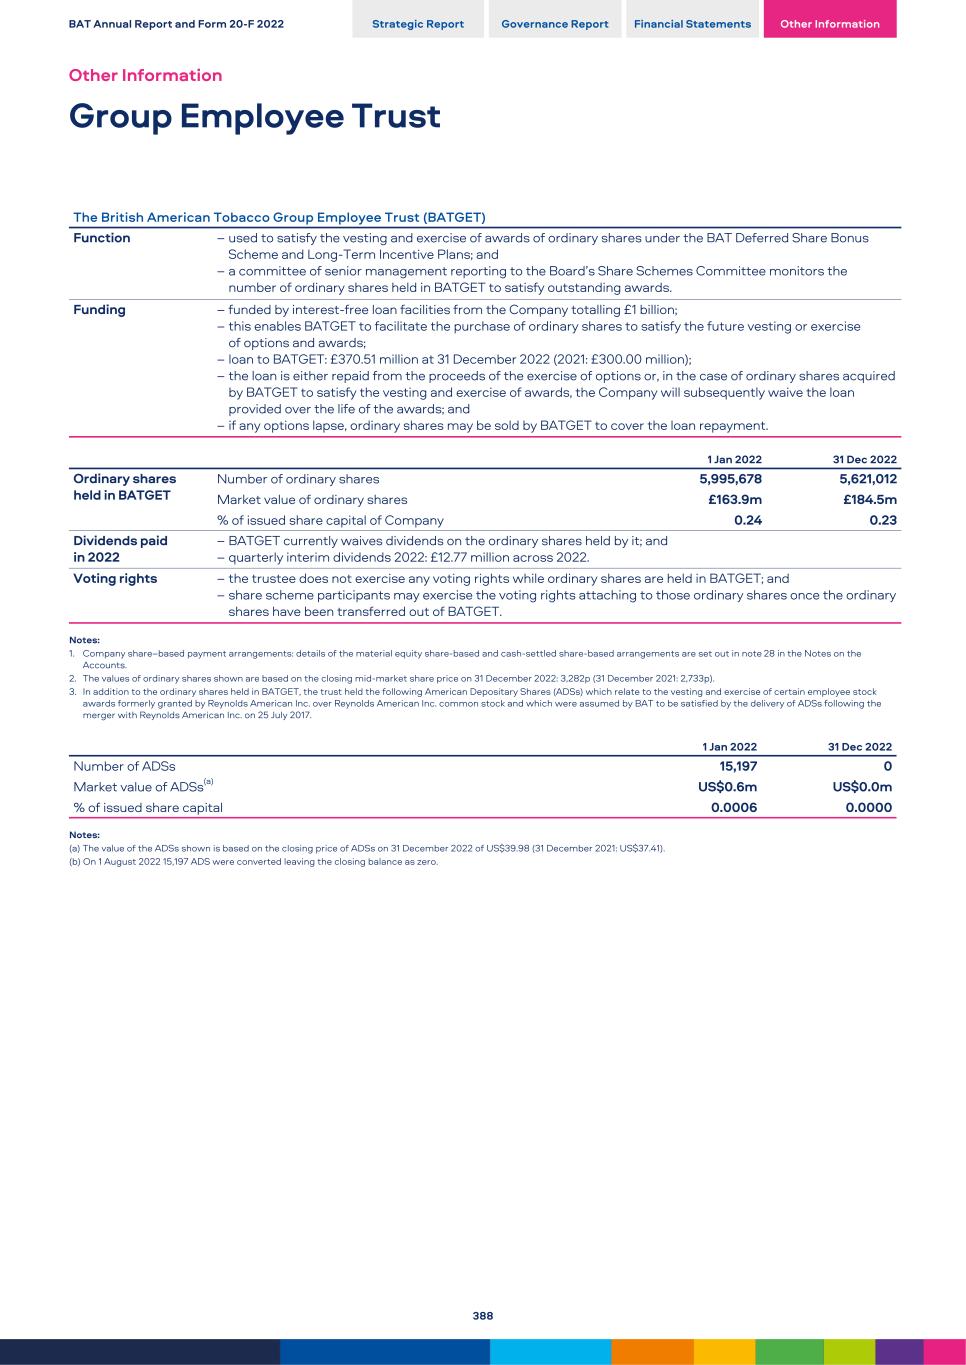
The British American Tobacco Group Employee Trust (BATGET) Function – used to satisfy the vesting and exercise of awards of ordinary shares under the BAT Deferred Share Bonus Scheme and Long-Term Incentive Plans; and – a committee of senior management reporting to the Board’s Share Schemes Committee monitors the number of ordinary shares held in BATGET to satisfy outstanding awards. Funding – funded by interest-free loan facilities from the Company totalling £1 billion; – this enables BATGET to facilitate the purchase of ordinary shares to satisfy the future vesting or exercise of options and awards; – loan to BATGET: £370.51 million at 31 December 2022 (2021: £300.00 million); – the loan is either repaid from the proceeds of the exercise of options or, in the case of ordinary shares acquired by BATGET to satisfy the vesting and exercise of awards, the Company will subsequently waive the loan provided over the life of the awards; and – if any options lapse, ordinary shares may be sold by BATGET to cover the loan repayment. 1 Jan 2022 31 Dec 2022 Ordinary shares held in BATGET Number of ordinary shares 5,995,678 5,621,012 Market value of ordinary shares £163.9m £184.5m % of issued share capital of Company 0.24 0.23 Dividends paid in 2022 – BATGET currently waives dividends on the ordinary shares held by it; and – quarterly interim dividends 2022: £12.77 million across 2022. Voting rights – the trustee does not exercise any voting rights while ordinary shares are held in BATGET; and – share scheme participants may exercise the voting rights attaching to those ordinary shares once the ordinary shares have been transferred out of BATGET. Notes: 1. Company share–based payment arrangements: details of the material equity share-based and cash-settled share-based arrangements are set out in note 28 in the Notes on the Accounts. 2. The values of ordinary shares shown are based on the closing mid-market share price on 31 December 2022: 3,282p (31 December 2021: 2,733p). 3. In addition to the ordinary shares held in BATGET, the trust held the following American Depositary Shares (ADSs) which relate to the vesting and exercise of certain employee stock awards formerly granted by Reynolds American Inc. over Reynolds American Inc. common stock and which were assumed by BAT to be satisfied by the delivery of ADSs following the merger with Reynolds American Inc. on 25 July 2017. 1 Jan 2022 31 Dec 2022 Number of ADSs 15,197 0 Market value of ADSs(a) US$0.6m US$0.0m % of issued share capital 0.0006 0.0000 Notes: (a) The value of the ADSs shown is based on the closing price of ADSs on 31 December 2022 of US$39.98 (31 December 2021: US$37.41). (b) On 1 August 2022 15,197 ADS were converted leaving the closing balance as zero. BAT Annual Report and Form 20-F 2022 Strategic Report Governance Report Financial Statements Other Information Other Information Group Employee Trust 388
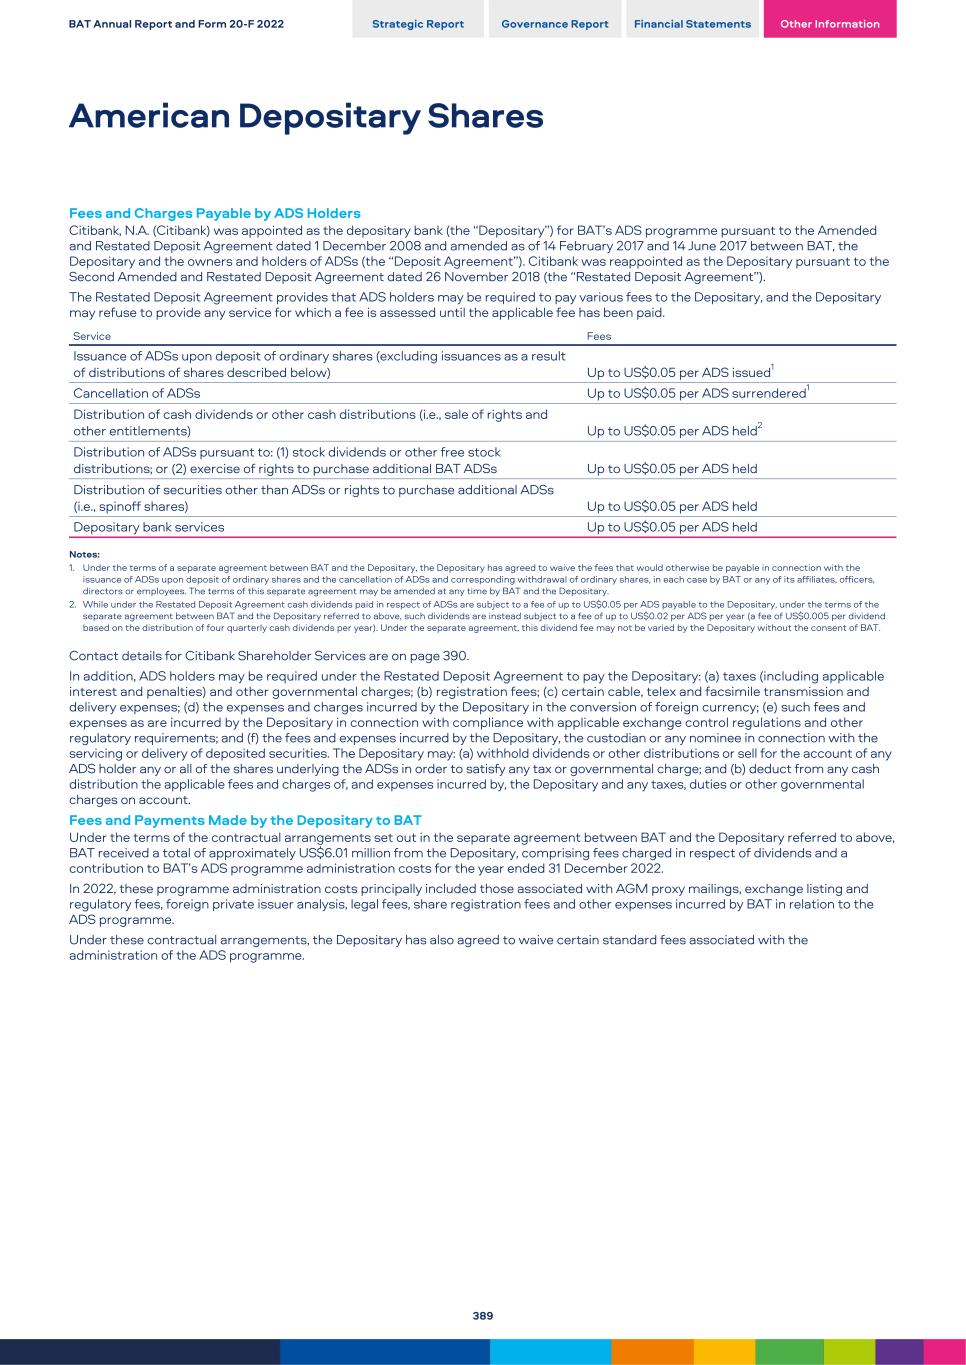
Fees and Charges Payable by ADS Holders Citibank, N.A. (Citibank) was appointed as the depositary bank (the “Depositary”) for BAT’s ADS programme pursuant to the Amended and Restated Deposit Agreement dated 1 December 2008 and amended as of 14 February 2017 and 14 June 2017 between BAT, the Depositary and the owners and holders of ADSs (the “Deposit Agreement”). Citibank was reappointed as the Depositary pursuant to the Second Amended and Restated Deposit Agreement dated 26 November 2018 (the “Restated Deposit Agreement”). The Restated Deposit Agreement provides that ADS holders may be required to pay various fees to the Depositary, and the Depositary may refuse to provide any service for which a fee is assessed until the applicable fee has been paid. Service Fees Issuance of ADSs upon deposit of ordinary shares (excluding issuances as a result of distributions of shares described below) Up to US$0.05 per ADS issued1 Cancellation of ADSs Up to US$0.05 per ADS surrendered1 Distribution of cash dividends or other cash distributions (i.e., sale of rights and other entitlements) Up to US$0.05 per ADS held2 Distribution of ADSs pursuant to: (1) stock dividends or other free stock distributions; or (2) exercise of rights to purchase additional BAT ADSs Up to US$0.05 per ADS held Distribution of securities other than ADSs or rights to purchase additional ADSs (i.e., spinoff shares) Up to US$0.05 per ADS held Depositary bank services Up to US$0.05 per ADS held Notes: 1. Under the terms of a separate agreement between BAT and the Depositary, the Depositary has agreed to waive the fees that would otherwise be payable in connection with the issuance of ADSs upon deposit of ordinary shares and the cancellation of ADSs and corresponding withdrawal of ordinary shares, in each case by BAT or any of its affiliates, officers, directors or employees. The terms of this separate agreement may be amended at any time by BAT and the Depositary. 2. While under the Restated Deposit Agreement cash dividends paid in respect of ADSs are subject to a fee of up to US$0.05 per ADS payable to the Depositary, under the terms of the separate agreement between BAT and the Depositary referred to above, such dividends are instead subject to a fee of up to US$0.02 per ADS per year (a fee of US$0.005 per dividend based on the distribution of four quarterly cash dividends per year). Under the separate agreement, this dividend fee may not be varied by the Depositary without the consent of BAT. Contact details for Citibank Shareholder Services are on page 390. In addition, ADS holders may be required under the Restated Deposit Agreement to pay the Depositary: (a) taxes (including applicable interest and penalties) and other governmental charges; (b) registration fees; (c) certain cable, telex and facsimile transmission and delivery expenses; (d) the expenses and charges incurred by the Depositary in the conversion of foreign currency; (e) such fees and expenses as are incurred by the Depositary in connection with compliance with applicable exchange control regulations and other regulatory requirements; and (f) the fees and expenses incurred by the Depositary, the custodian or any nominee in connection with the servicing or delivery of deposited securities. The Depositary may: (a) withhold dividends or other distributions or sell for the account of any ADS holder any or all of the shares underlying the ADSs in order to satisfy any tax or governmental charge; and (b) deduct from any cash distribution the applicable fees and charges of, and expenses incurred by, the Depositary and any taxes, duties or other governmental charges on account. Fees and Payments Made by the Depositary to BAT Under the terms of the contractual arrangements set out in the separate agreement between BAT and the Depositary referred to above, BAT received a total of approximately US$6.01 million from the Depositary, comprising fees charged in respect of dividends and a contribution to BAT’s ADS programme administration costs for the year ended 31 December 2022. In 2022, these programme administration costs principally included those associated with AGM proxy mailings, exchange listing and regulatory fees, foreign private issuer analysis, legal fees, share registration fees and other expenses incurred by BAT in relation to the ADS programme. Under these contractual arrangements, the Depositary has also agreed to waive certain standard fees associated with the administration of the ADS programme. BAT Annual Report and Form 20-F 2022 Strategic Report Governance Report Financial Statements Other Information American Depositary Shares 389
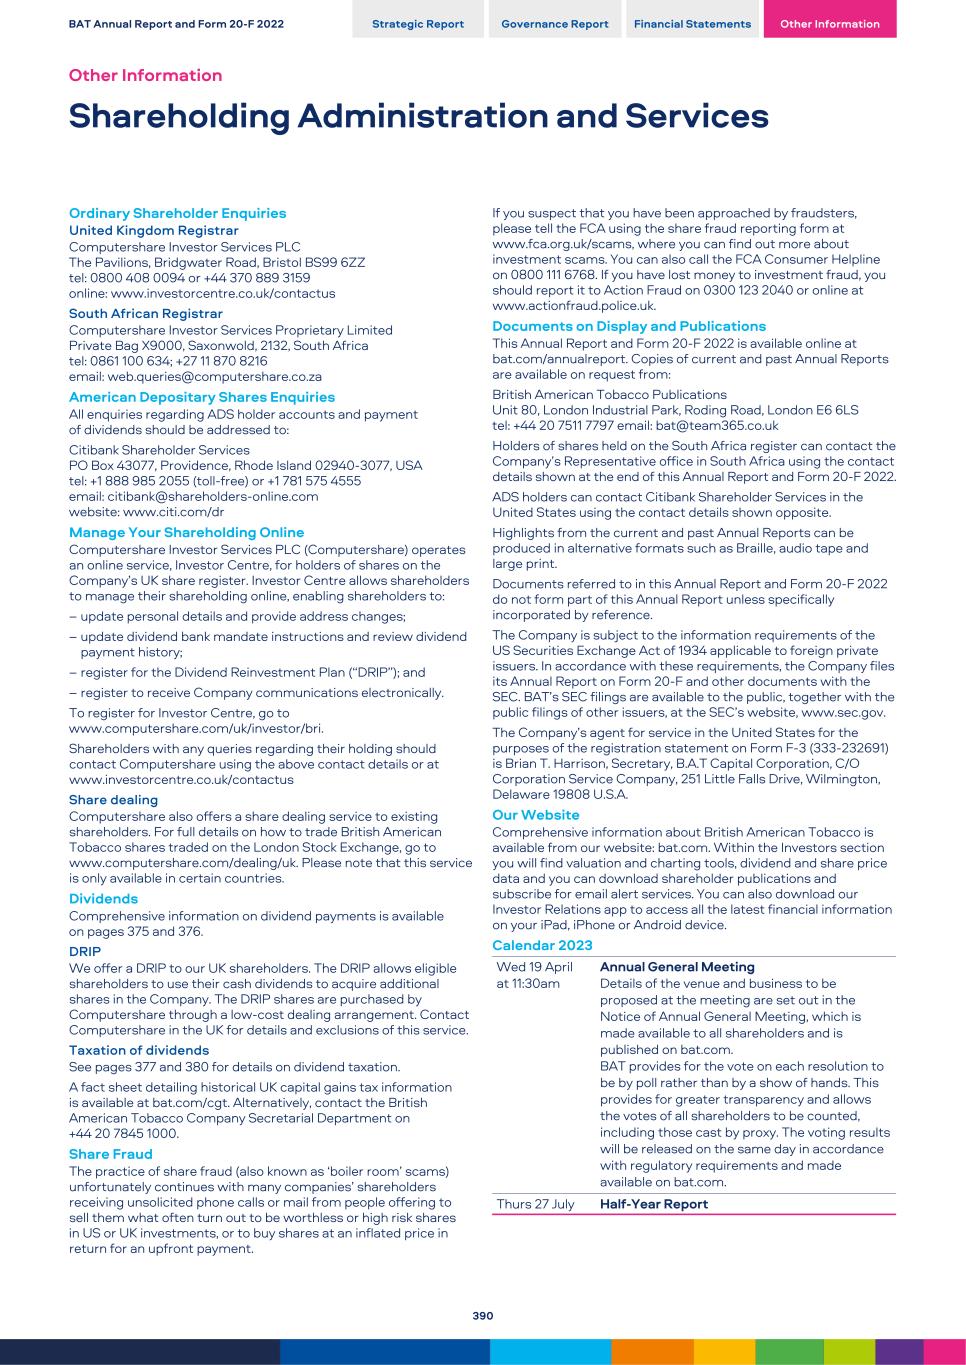
Ordinary Shareholder Enquiries United Kingdom Registrar Computershare Investor Services PLC The Pavilions, Bridgwater Road, Bristol BS99 6ZZ tel: 0800 408 0094 or +44 370 889 3159 online: www.investorcentre.co.uk/contactus South African Registrar Computershare Investor Services Proprietary Limited Private Bag X9000, Saxonwold, 2132, South Africa tel: 0861 100 634; +27 11 870 8216 email: web.queries@computershare.co.za American Depositary Shares Enquiries All enquiries regarding ADS holder accounts and payment of dividends should be addressed to: Citibank Shareholder Services PO Box 43077, Providence, Rhode Island 02940-3077, USA tel: +1 888 985 2055 (toll-free) or +1 781 575 4555 email: citibank@shareholders-online.com website: www.citi.com/dr Manage Your Shareholding Online Computershare Investor Services PLC (Computershare) operates an online service, Investor Centre, for holders of shares on the Company’s UK share register. Investor Centre allows shareholders to manage their shareholding online, enabling shareholders to: – update personal details and provide address changes; – update dividend bank mandate instructions and review dividend payment history; – register for the Dividend Reinvestment Plan (“DRIP”); and – register to receive Company communications electronically. To register for Investor Centre, go to www.computershare.com/uk/investor/bri. Shareholders with any queries regarding their holding should contact Computershare using the above contact details or at www.investorcentre.co.uk/contactus Share dealing Computershare also offers a share dealing service to existing shareholders. For full details on how to trade British American Tobacco shares traded on the London Stock Exchange, go to www.computershare.com/dealing/uk. Please note that this service is only available in certain countries. Dividends Comprehensive information on dividend payments is available on pages 375 and 376. DRIP We offer a DRIP to our UK shareholders. The DRIP allows eligible shareholders to use their cash dividends to acquire additional shares in the Company. The DRIP shares are purchased by Computershare through a low-cost dealing arrangement. Contact Computershare in the UK for details and exclusions of this service. Taxation of dividends See pages 377 and 380 for details on dividend taxation. A fact sheet detailing historical UK capital gains tax information is available at bat.com/cgt. Alternatively, contact the British American Tobacco Company Secretarial Department on +44 20 7845 1000. Share Fraud The practice of share fraud (also known as ‘boiler room’ scams) unfortunately continues with many companies’ shareholders receiving unsolicited phone calls or mail from people offering to sell them what often turn out to be worthless or high risk shares in US or UK investments, or to buy shares at an inflated price in return for an upfront payment. If you suspect that you have been approached by fraudsters, please tell the FCA using the share fraud reporting form at www.fca.org.uk/scams, where you can find out more about investment scams. You can also call the FCA Consumer Helpline on 0800 111 6768. If you have lost money to investment fraud, you should report it to Action Fraud on 0300 123 2040 or online at www.actionfraud.police.uk. Documents on Display and Publications This Annual Report and Form 20-F 2022 is available online at bat.com/annualreport. Copies of current and past Annual Reports are available on request from: British American Tobacco Publications Unit 80, London Industrial Park, Roding Road, London E6 6LS tel: +44 20 7511 7797 email: bat@team365.co.uk Holders of shares held on the South Africa register can contact the Company’s Representative office in South Africa using the contact details shown at the end of this Annual Report and Form 20-F 2022. ADS holders can contact Citibank Shareholder Services in the United States using the contact details shown opposite. Highlights from the current and past Annual Reports can be produced in alternative formats such as Braille, audio tape and large print. Documents referred to in this Annual Report and Form 20-F 2022 do not form part of this Annual Report unless specifically incorporated by reference. The Company is subject to the information requirements of the US Securities Exchange Act of 1934 applicable to foreign private issuers. In accordance with these requirements, the Company files its Annual Report on Form 20-F and other documents with the SEC. BAT’s SEC filings are available to the public, together with the public filings of other issuers, at the SEC’s website, www.sec.gov. The Company’s agent for service in the United States for the purposes of the registration statement on Form F-3 (333-232691) is Brian T. Harrison, Secretary, B.A.T Capital Corporation, C/O Corporation Service Company, 251 Little Falls Drive, Wilmington, Delaware 19808 U.S.A. Our Website Comprehensive information about British American Tobacco is available from our website: bat.com. Within the Investors section you will find valuation and charting tools, dividend and share price data and you can download shareholder publications and subscribe for email alert services. You can also download our Investor Relations app to access all the latest financial information on your iPad, iPhone or Android device. Calendar 2023 Wed 19 April at 11:30am Annual General Meeting Details of the venue and business to be proposed at the meeting are set out in the Notice of Annual General Meeting, which is made available to all shareholders and is published on bat.com. BAT provides for the vote on each resolution to be by poll rather than by a show of hands. This provides for greater transparency and allows the votes of all shareholders to be counted, including those cast by proxy. The voting results will be released on the same day in accordance with regulatory requirements and made available on bat.com. Thurs 27 July Half-Year Report BAT Annual Report and Form 20-F 2022 Strategic Report Governance Report Financial Statements Other Information Other Information Shareholding Administration and Services 390
| | | | | | | | | | | | | | | | | | | | | | | |
| BAT Annual Report and Form 20-F 2022 | Strategic Report | | Governance Report | | Financial Statements | | Other Information |
| | | | | | | |
| | | | | | | |
| | | | | | | |
| | | | | | | |
Exhibits |
The following documents are filed in the SEC EDGAR system, as part of this Annual Report on Form 20-F, and can be viewed on the SEC’s website, www.sec.gov:
| | | | | |
Exhibit
Number | Description |
| 1 | |
| 2.1 | |
| 2.2 | |
| 2.3 | |
| 2.4 | |
| 2.5 | |
| 2.6 | |
| 2.7 | |
| 2.8 | |
| 2.9 | |
| 2.10 | |
| 2.11 | |
| 2.12 | |
| 2.13 | |
| 2.14 | |
| 2.15 | |
| 2.16 | |
| 2.17 | |
| 2.18 | |
| 2.19 | |
| 2.20 | |
| 2.21 | |
| 2.22 | |
| 2.23 | Thirty-fourth Supplemental Trust Deed, dated 17 March 2022, by and among B.A.T. International Finance p.l.c., B.A.T Capital Corporation, B.A.T. Netherlands Finance B.V., British American Tobacco p.l.c. and the Law Debenture Trust Corporation p.l.c., further modifying the Trust Deed, dated as of 6 July 1998 (as previously modified and restated) relating to the US$3,000,000,000 (now £25,000,000,000) Euro Medium Term Note Programme.24 |
| 2.24 | |
| 4.1 | |
| 4.2 | |
| 4.3 | |
| 4.4 | |
| 4.5 | |
| 4.6 | |
| | | | | | | | | | | | | | | | | | | | | | | |
| BAT Annual Report and Form 20-F 2022 | Strategic Report | | Governance Report | | Financial Statements | | Other Information |
| | | | | | | |
| | | | | | | |
| | | | | | | |
| Other Information | | | | | | | |
Exhibits Continued |
| | | | | |
| 4.7 | |
| 4.8 | |
| 4.9 | |
| 4.10 | |
| 4.11 | |
| 4.12 | |
| 4.13 | |
| 4.14 | |
| 4.15 | |
| 4.16 | |
| 4.17 | |
| 4.18 | |
| 4.19 | |
| 4.20 | Revolving credit facilities agreement, dated as of 12 March 2020, among British American Tobacco p.l.c., B.A.T. International Finance p.l.c., B.A.T. Netherlands Finance B.V. and B.A.T Capital Corporation, as borrowers, British American Tobacco p.l.c., as guarantor, HSBC Bank plc, as agent and euro swingline agent, HSBC Bank USA, National Association, as US agent and US$ swingline agent, and the banks and financial institutions party thereto.44 |
| 8 | |
| 11 | |
| 12 | |
| 13 | |
| 15.1 | |
| 17 | |
| 101 | Interactive Data Files (formatted in XBRL (Extensible Business Reporting Language) and furnished electronically). |
Notes:
1. Incorporated by reference to Exhibit 3.1 to BAT’s Registration Statement on Form F-4 (Reg. No. 333-217939) filed on 12 May 2017.
2. Incorporated by reference to Exhibit 4.1 to BAT’s Registration Statement on Form S-8 (Reg. No. 333-237186) filed on 16 March 2020.
3. Incorporated by reference to Exhibit 2.4 to BAT’s Annual Report on Form 20-F for the year ended 31 December 2017 filed on 15 March 2018.
4. Incorporated by reference to Exhibit 4.2 to BAT’s Registration Statement on Form F-4 (Reg. No. 333-227658) filed on 2 October 2018.
5. Incorporated by reference to Exhibit 4.1 to British American Tobacco p.l.c.’s Form 6-K filed on 6 September 2019.
6. Incorporated by reference to Exhibit 4.2 to British American Tobacco p.l.c.’s Form 6-K filed on 6 September 2019.
7. Incorporated by reference to Exhibit 4.3 to British American Tobacco p.l.c.’s Form 6-K filed on 6 September 2019.
8. Incorporated by reference to Exhibit 4.4 to British American Tobacco p.l.c.’s Form 6-K filed on 6 September 2019.
9. Incorporated by reference to Exhibit 4.5 to British American Tobacco p.l.c.’s Form 6-K filed on 6 September 2019.
10. Incorporated by reference to Exhibit 4.1 to British American Tobacco p.l.c.’s Form 6-K filed on 2 April 2020.
11. Incorporated by reference to Exhibit 4.2 to British American Tobacco p.l.c.’s Form 6-K filed on 2 April 2020.
12. Incorporated by reference to Exhibit 4.3 to British American Tobacco p.l.c.’s Form 6-K filed on 2 April 2020.
13. Incorporated by reference to Exhibit 4.2 to British American Tobacco p.l.c.’s Form 6-K filed on 25 September 2020.
14. Incorporated by reference to Exhibit 4.3 to British American Tobacco p.l.c.’s Form 6-K filed on 25 September 2020.
15. Incorporated by reference to Exhibit 4.4 to British American Tobacco p.l.c.’s Form 6-K filed on 25 September 2020.
16. Incorporated by reference to Exhibit 4.5 to British American Tobacco p.l.c.’s Form 6-K filed on 25 September 2020.
17. Incorporated by reference to Exhibit 4.1 to British American Tobacco p.l.c.’s Form 6-K filed on 16 March 2022.
18. Incorporated by reference to Exhibit 4.2 to British American Tobacco p.l.c.’s Form 6-K filed on 16 March 2022.
19. Incorporated by reference to Exhibit 4.1 to British American Tobacco p.l.c.’s Form 6-K filed on 24 March 2022.
20. Incorporated by reference to Exhibit 4.1 to British American Tobacco p.l.c.’s Form 6-K filed on 19 October 2022.
21. Incorporated by reference to Exhibit 4.1 to British American Tobacco p.l.c.’s Form 6-K filed on 25 September 2020.
22. Incorporated by reference to Exhibit 4.6 to British American Tobacco p.l.c.’s Form 6-K filed on 25 September 2020.
23. Incorporated by reference to Exhibit 4.3 to British American Tobacco p.l.c.’s Form 6-K filed on 16 March 2022.
24. Incorporated by reference to Exhibit 4.1 to British American Tobacco p.l.c.’s Registration Statement on Form F-3 (Reg. No. 333-265958) filed on 1 July 2022.
25. Incorporated by reference to Exhibit 10.6 to BAT’s Registration Statement on Form F-4 (Reg. No. 333-217939) filed on 12 May 2017.
26. Incorporated by reference to Exhibit 4.2 to BAT’s Annual Report on Form 20-F for the year ended 31 December 2021 filed on 8 March 2022.
27. Incorporated by reference to Exhibit 10.8 to BAT’s Registration Statement on Form F-4 (Reg. No. 333-217939) filed on 12 May 2017.
28. Incorporated by reference to Exhibit 4.6 to BAT’s Annual Report on Form 20-F for the year ended 31 December 2018 filed on 15 March 2019.
29. Incorporated by reference to Exhibit 4.5 to BAT’s Annual Report on Form 20-F for the year ended 31 December 2021 filed on 8 March 2022.
30. Incorporated by reference to Exhibit 4.6 to BAT’s Annual Report on Form 20-F for the year ended 31 December 2021 filed on 8 March 2022.
31. Incorporated by reference to Exhibit 10.43 to Reynolds American Inc.’s Annual Report on Form 10-K for the fiscal year ended 31 December 2007 filed on 27 February 2008.
32. Incorporated by reference to Exhibit 4.11 to BAT’s Annual Report on Form 20-F for the year ended 31 December 2018 filed on 15 March 2019.
33. Incorporated by reference to Exhibit 4.14 to BAT’s Annual Report on Form 20-F for the year ended 31 December 2019 filed on 26 March 2020.
| | | | | | | | | | | | | | | | | | | | | | | |
| BAT Annual Report and Form 20-F 2022 | Strategic Report | | Governance Report | | Financial Statements | | Other Information |
| | | | | | | |
| | | | | | | |
| | | | | | | |
| | | | | | | |
|
34. Incorporated by reference to Exhibit 4 to R.J. Reynolds Tobacco Holdings, Inc.’s Form 8-K dated 24 November 1998.
35. Incorporated by reference to Exhibit 2 to R.J. Reynolds Tobacco Holdings, Inc.’s Form 8-K dated 5 September 1997.
36. Incorporated by reference to Exhibit 2 to R.J. Reynolds Tobacco Holdings, Inc.’s Form 8-K dated 27 January 1998.
37. Incorporated by reference to Exhibit 99.1 to R.J. Reynolds Tobacco Holdings, Inc.’s Quarterly Report on Form 10-Q for the quarter ended 30 March 1998 filed on 15 May 1998.
38. Incorporated by reference to Exhibit 99.2 to R.J. Reynolds Tobacco Holdings, Inc.’s Quarterly Report on Form 10-Q for the quarter ended 30 March 1998 filed on 15 May 1998.
39. Incorporated by reference to Exhibit 99.3 to R.J. Reynolds Tobacco Holdings, Inc.’s Quarterly Report on Form 10-Q for the quarter ended 30 March 1998 filed on 15 May 1998.
40. Incorporated by reference to Exhibit 99.2 to R.J. Reynolds Tobacco Holdings, Inc.’s Quarterly Report on Form 10-Q for the quarter ended 30 June 1998 filed on 14 August 1998.
41. Incorporated by reference to Exhibit 99.4 to R.J. Reynolds Tobacco Holdings, Inc.’s Quarterly Report on Form 10-Q for the quarter ended 30 June 1998 filed on 14 August 1998.
42. Incorporated by reference to Exhibit 99.1 to R.J. Reynolds Tobacco Holdings, Inc.’s Quarterly Report on Form 10-Q for the quarter ended 30 September 1998 filed on 12 November 1998.
43. Incorporated by reference to Exhibit 10.1 to Reynolds American Inc.’s Form 8-K dated 12 March 2013.
44. Incorporated by reference to Exhibit 4.25 to BAT’s Annual Report on Form 20-F for the year ended 31 December 2019 filed on 26 March 2020.
45. Incorporated by reference to Exhibit 11 to BAT’s Annual Report on Form 20-F for the year ended 31 December 2021 filed on 8 March 2022.
46. These certifications are furnished only and are not filed as part of BAT’s Annual Report on Form 20-F for the year ended 31 December 2022.
Certain instruments which define the rights of holders of long-term debt issued by BAT and its subsidiaries are not being filed because the total amount of securities authorised under each such instrument does not exceed 10% of the total consolidated assets of BAT and its subsidiaries. BAT agrees to furnish copies of any or all such instruments to the SEC on request.
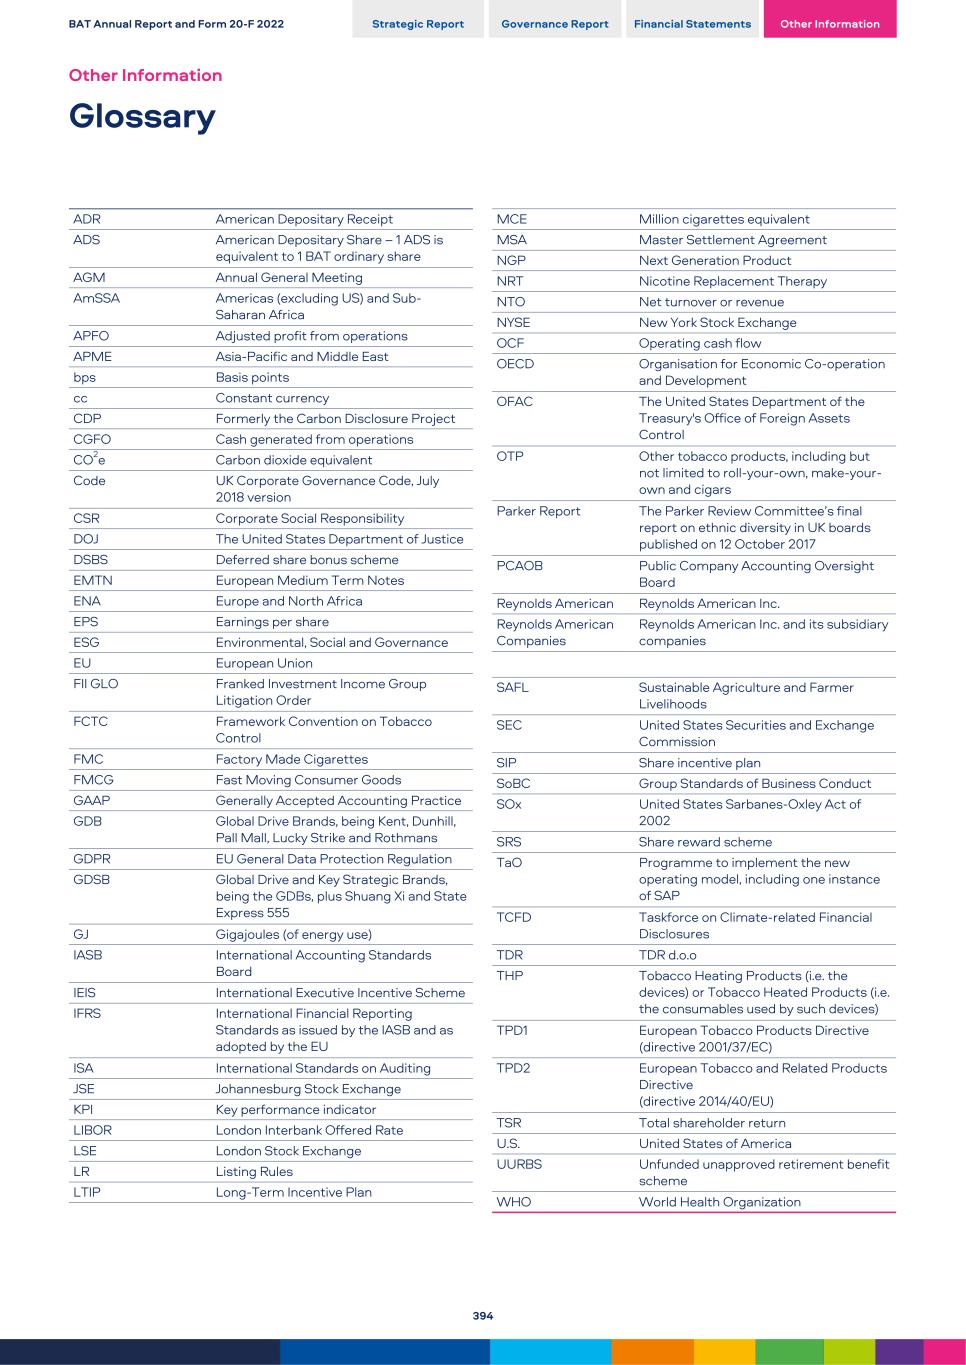
ADR American Depositary Receipt ADS American Depositary Share – 1 ADS is equivalent to 1 BAT ordinary share AGM Annual General Meeting AmSSA Americas (excluding US) and Sub- Saharan Africa APFO Adjusted profit from operations APME Asia-Pacific and Middle East bps Basis points cc Constant currency CDP Formerly the Carbon Disclosure Project CGFO Cash generated from operations CO2e Carbon dioxide equivalent Code UK Corporate Governance Code, July 2018 version CSR Corporate Social Responsibility DOJ The United States Department of Justice DSBS Deferred share bonus scheme EMTN European Medium Term Notes ENA Europe and North Africa EPS Earnings per share ESG Environmental, Social and Governance EU European Union FII GLO Franked Investment Income Group Litigation Order FCTC Framework Convention on Tobacco Control FMC Factory Made Cigarettes FMCG Fast Moving Consumer Goods GAAP Generally Accepted Accounting Practice GDB Global Drive Brands, being Kent, Dunhill, Pall Mall, Lucky Strike and Rothmans GDPR EU General Data Protection Regulation GDSB Global Drive and Key Strategic Brands, being the GDBs, plus Shuang Xi and State Express 555 GJ Gigajoules (of energy use) IASB International Accounting Standards Board IEIS International Executive Incentive Scheme IFRS International Financial Reporting Standards as issued by the IASB and as adopted by the EU ISA International Standards on Auditing JSE Johannesburg Stock Exchange KPI Key performance indicator LIBOR London Interbank Offered Rate LSE London Stock Exchange LR Listing Rules LTIP Long-Term Incentive Plan MCE Million cigarettes equivalent MSA Master Settlement Agreement NGP Next Generation Product NRT Nicotine Replacement Therapy NTO Net turnover or revenue NYSE New York Stock Exchange OCF Operating cash flow OECD Organisation for Economic Co-operation and Development OFAC The United States Department of the Treasury's Office of Foreign Assets Control OTP Other tobacco products, including but not limited to roll-your-own, make-your- own and cigars Parker Report The Parker Review Committee’s final report on ethnic diversity in UK boards published on 12 October 2017 PCAOB Public Company Accounting Oversight Board Reynolds American Reynolds American Inc. Reynolds American Companies Reynolds American Inc. and its subsidiary companies SAFL Sustainable Agriculture and Farmer Livelihoods SEC United States Securities and Exchange Commission SIP Share incentive plan SoBC Group Standards of Business Conduct SOx United States Sarbanes-Oxley Act of 2002 SRS Share reward scheme TaO Programme to implement the new operating model, including one instance of SAP TCFD Taskforce on Climate-related Financial Disclosures TDR TDR d.o.o THP Tobacco Heating Products (i.e. the devices) or Tobacco Heated Products (i.e. the consumables used by such devices) TPD1 European Tobacco Products Directive (directive 2001/37/EC) TPD2 European Tobacco and Related Products Directive (directive 2014/40/EU) TSR Total shareholder return U.S. United States of America UURBS Unfunded unapproved retirement benefit scheme WHO World Health Organization BAT Annual Report and Form 20-F 2022 Strategic Report Governance Report Financial Statements Other Information Other Information Glossary 394
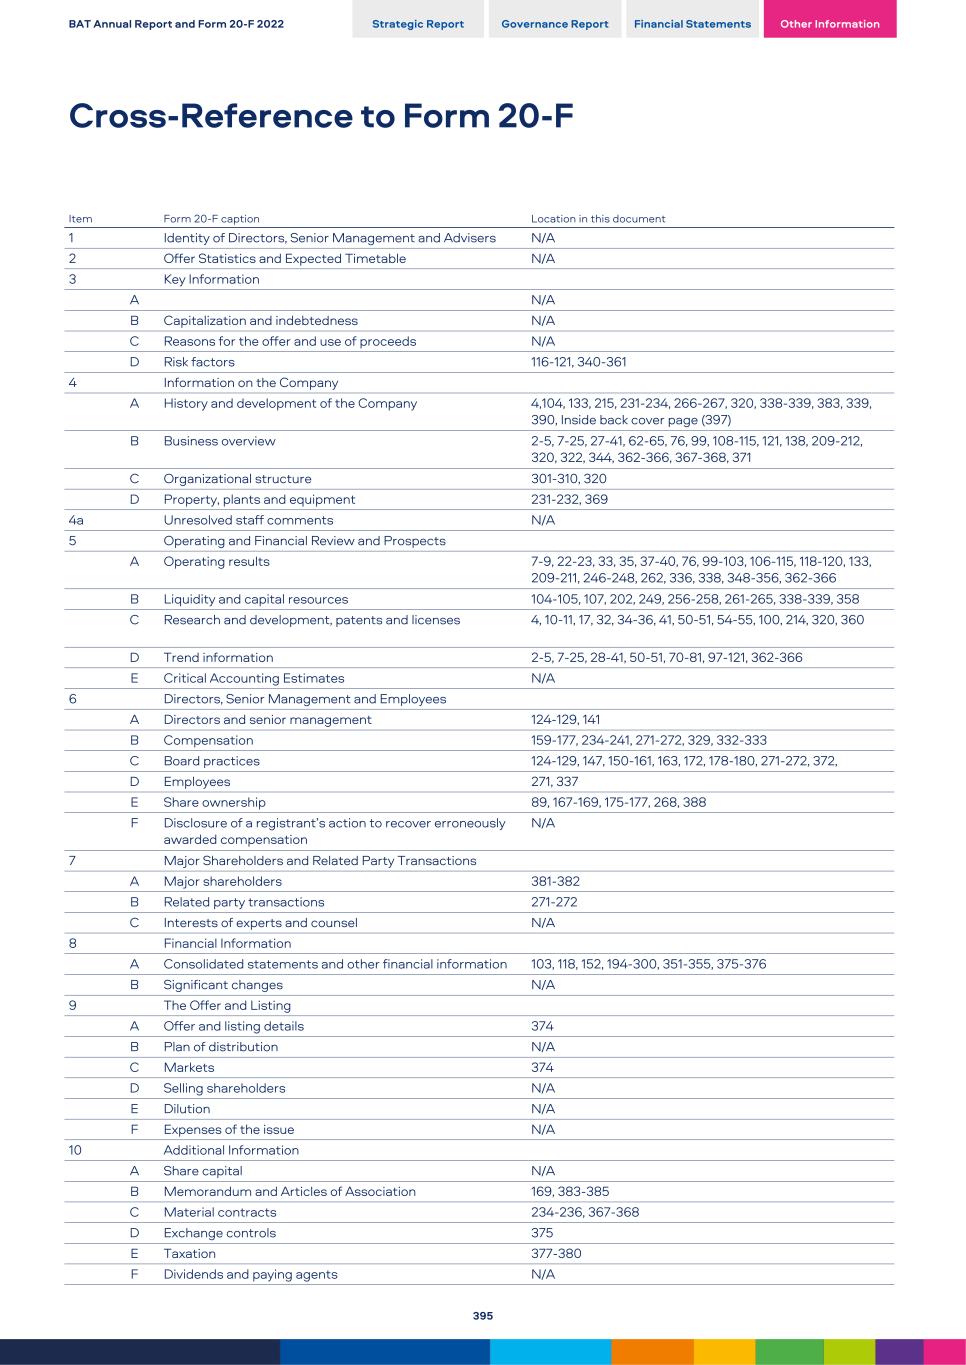
1 Identity of Directors, Senior Management and Advisers N/A 2 Offer Statistics and Expected Timetable N/A 3 Key Information A N/A B Capitalization and indebtedness N/A C Reasons for the offer and use of proceeds N/A D Risk factors 116-121, 340-361 4 Information on the Company A History and development of the Company 4,104, 133, 215, 231-234, 266-267, 320, 338-339, 383, 339, 390, Inside back cover page (397) B Business overview 2-5, 7-25, 27-41, 62-65, 76, 99, 108-115, 121, 138, 209-212, 320, 322, 344, 362-366, 367-368, 371 C Organizational structure 301-310, 320 D Property, plants and equipment 231-232, 369 4a Unresolved staff comments N/A 5 Operating and Financial Review and Prospects A Operating results 7-9, 22-23, 33, 35, 37-40, 76, 99-103, 106-115, 118-120, 133, 209-211, 246-248, 262, 336, 338, 348-356, 362-366 B Liquidity and capital resources 104-105, 107, 202, 249, 256-258, 261-265, 338-339, 358 C Research and development, patents and licenses 4, 10-11, 17, 32, 34-36, 41, 50-51, 54-55, 100, 214, 320, 360 D Trend information 2-5, 7-25, 28-41, 50-51, 70-81, 97-121, 362-366 E Critical Accounting Estimates N/A 6 Directors, Senior Management and Employees A Directors and senior management 124-129, 141 B Compensation 159-177, 234-241, 271-272, 329, 332-333 C Board practices 124-129, 147, 150-161, 163, 172, 178-180, 271-272, 372, D Employees 271, 337 E Share ownership 89, 167-169, 175-177, 268, 388 F Disclosure of a registrant’s action to recover erroneously awarded compensation N/A 7 Major Shareholders and Related Party Transactions A Major shareholders 381-382 B Related party transactions 271-272 C Interests of experts and counsel N/A 8 Financial Information A Consolidated statements and other financial information 103, 118, 152, 194-300, 351-355, 375-376 B Significant changes N/A 9 The Offer and Listing A Offer and listing details 374 B Plan of distribution N/A C Markets 374 D Selling shareholders N/A E Dilution N/A F Expenses of the issue N/A 10 Additional Information A Share capital N/A B Memorandum and Articles of Association 169, 383-385 C Material contracts 234-236, 367-368 D Exchange controls 375 E Taxation 377-380 F Dividends and paying agents N/A Item Form 20-F caption Location in this document BAT Annual Report and Form 20-F 2022 Strategic Report Governance Report Financial Statements Other Information Cross-Reference to Form 20-F 395
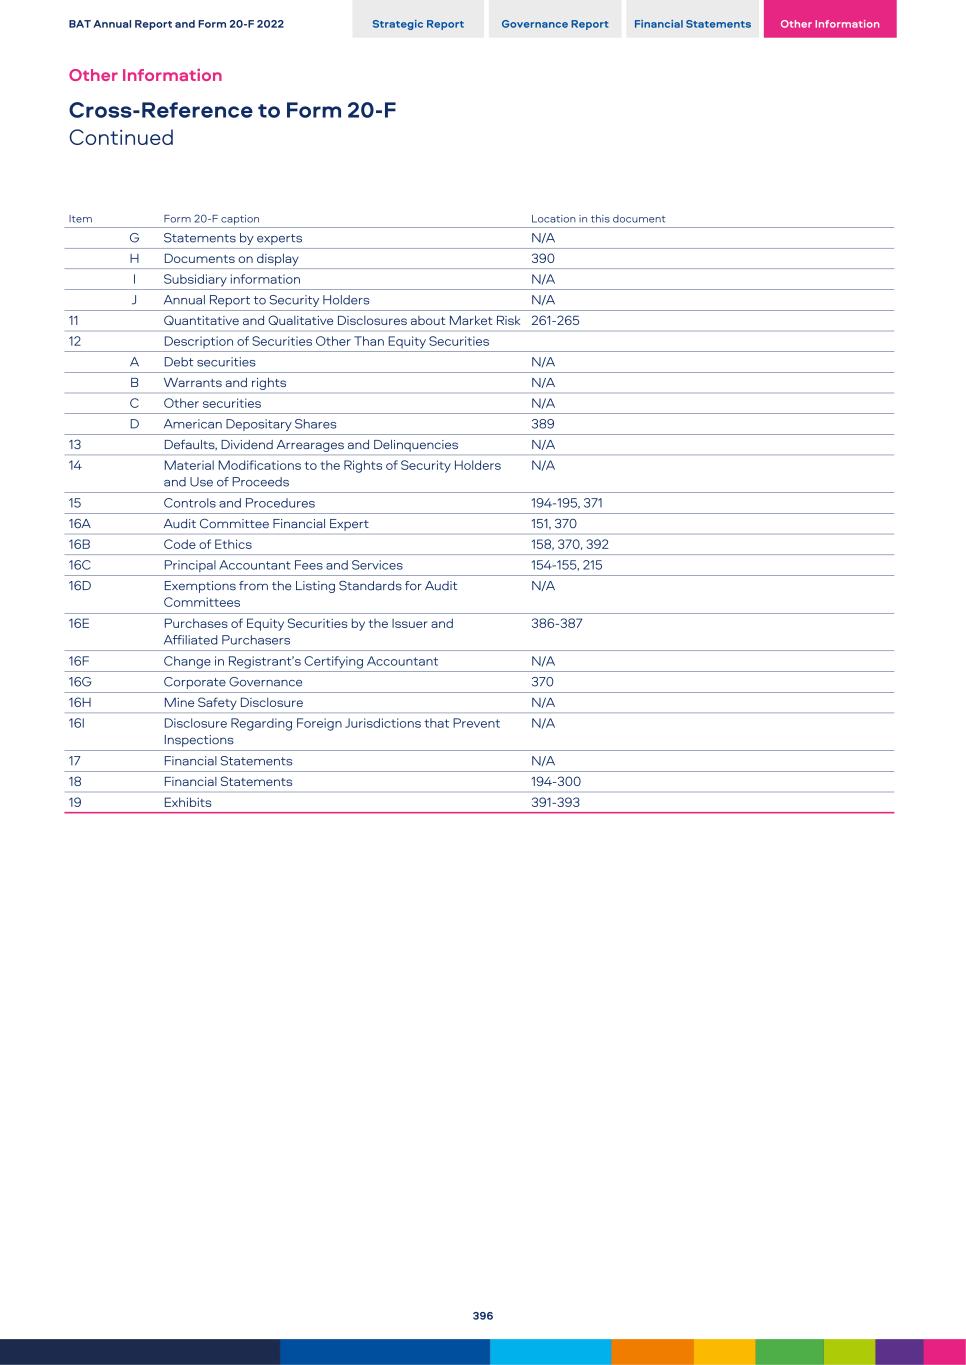
G Statements by experts N/A H Documents on display 390 I Subsidiary information N/A J Annual Report to Security Holders N/A 11 Quantitative and Qualitative Disclosures about Market Risk 261-265 12 Description of Securities Other Than Equity Securities A Debt securities N/A B Warrants and rights N/A C Other securities N/A D American Depositary Shares 389 13 Defaults, Dividend Arrearages and Delinquencies N/A 14 Material Modifications to the Rights of Security Holders and Use of Proceeds N/A 15 Controls and Procedures 194-195, 371 16A Audit Committee Financial Expert 151, 370 16B Code of Ethics 158, 370, 392 16C Principal Accountant Fees and Services 154-155, 215 16D Exemptions from the Listing Standards for Audit Committees N/A 16E Purchases of Equity Securities by the Issuer and Affiliated Purchasers 386-387 16F Change in Registrant’s Certifying Accountant N/A 16G Corporate Governance 370 16H Mine Safety Disclosure N/A 16I Disclosure Regarding Foreign Jurisdictions that Prevent Inspections N/A 17 Financial Statements N/A 18 Financial Statements 194-300 19 Exhibits 391-393 Item Form 20-F caption Location in this document BAT Annual Report and Form 20-F 2022 Strategic Report Governance Report Financial Statements Other Information Other Information Cross-Reference to Form 20-F Continued 396
397
398
Developments subsequent to the approval of the Annual Report 2022 >>
Subsequent to the approval of the Annual Report 2022 by the Board of the Company on 8 February 2023 and the date of British American Tobacco p.l.c.’s consolidated financial statements for the years ended 31 December 2022, 2021 and 2020, on 10 February 2023, NCR Corporation (NCR) filed a complaint against B.A.T Industries p.l.c. seeking a declaration that it must compensate NCR for 60% of any costs NCR incurs relating to the Kalamazoo River site. Management continues to believe that there are defences to such claims and are considering the next steps in terms of defending the claims.
Please refer to page 292 (Note 31, paragraphs 119. through 124.) for more information on the Kalamazoo River site dispute. Please also refer to page 351 for the identified risk in relation to the exposure to litigation.
SIGNATURE
The registrant hereby certifies that it meets all of the requirements for filing on Form 20-F and that it has duly caused and authorized the undersigned to sign this annual report on its behalf.
Date: 2 March 2023
British American Tobacco p.l.c.
(Registrant)
| | | | | |
| By: | /s/ Paul McCrory |
| Paul McCrory Company Secretary |