UNITED STATES
SECURITIES AND EXCHANGE COMMISSION
Washington, D.C. 20549
FORM 10-Q
(Mark One)
QUARTERLY REPORT PURSUANT TO SECTION 13 OR 15(d) OF THE SECURITIES EXCHANGE ACT OF 1934 | |
For the quarterly period ended June 30, 2020 or
TRANSITION REPORT PURSUANT TO SECTION 13 OR 15(d) OF THE SECURITIES EXCHANGE ACT OF 1934 | |
For the transition period from to
Commission File Number: 0-16533
(Exact name of registrant as specified in its charter)
(State or other jurisdiction of incorporation or organization) | (I.R.S. Employer Identification No.) | ||||||||
(Address of principal executive offices) | (Zip Code) | ||||||||
(Registrant’s telephone number, including area code) | (Former name, former address and former fiscal year, if changed since last report) | ||||||||
Securities registered pursuant to Section 12(b) of the Act:
Title of each class | Trading Symbol(s) | Name of each exchange on which registered |
Indicate by check mark whether the registrant (1) has filed all reports required to be filed by Section 13 or 15(d) of the Securities Exchange Act of 1934 during the preceding 12 months (or for such shorter period that the registrant was required to file such reports), and (2) has been subject to such filing requirements for the past 90 days. Yes ☒ No ☐
Indicate by check mark whether the registrant has submitted electronically every Interactive Data File required to be submitted pursuant to Rule 405 of Regulation S-T (§232.405 of this chapter) during the preceding 12 months (or for such shorter period that the registrant was required to submit such files). Yes ☒ No ☐
Indicate by check mark whether the registrant is a large accelerated filer, an accelerated filer, a non-accelerated filer, smaller reporting company, or an emerging growth company. See the definitions of "large accelerated filer," "accelerated filer," "smaller reporting company," and "emerging growth company" in Rule 12b-2 of the Exchange Act.
☒ | Accelerated filer | ☐ | |||||
Non-accelerated filer | ☐ | Smaller reporting company | |||||
Emerging growth company | |||||||
If an emerging growth company, indicate by check mark if the registrant has elected not to use the extended transition period for complying with any new or revised financial accounting standards provided pursuant to Section 13(a) of the Exchange Act. ¨
Indicate by check mark whether the registrant is a shell company (as defined in Rule 12b-2 of the Exchange Act). Yes ☐ No ☒
As of July 31, 2020, there were 53,889,233 shares of the registrant’s common stock outstanding.
Glossary of Terms and Acronyms
When the following terms and acronyms appear in the text of this report, they have the meanings indicated below.
Term | Meaning |
AAD | Annual aggregate deductible |
AOCI | Accumulated other comprehensive income (loss) |
ASU | Accounting Standards Update |
BEAT | Base erosion anti-abuse tax |
Board | Board of Directors of ProAssurance Corporation |
BOLI | Business owned life insurance |
CARES Act | Coronavirus Aid, Relief and Economic Security Act |
Council of Lloyd's | The governing body for Lloyd's of London |
CODM | Chief Operating Decision Maker |
Commutation | An agreement between a ceding insurer and the reinsurer that provides for the valuation, payment, and complete discharge of all obligations between the parties under a particular reinsurance contract |
COVID-19 | Coronavirus Disease 2019 |
DPAC | Deferred policy acquisition costs |
Eastern Re | Eastern Re, LTD, S.P.C. |
EBUB | Earned but unbilled premium |
ECO/XPL | Extra-contractual obligations /excess of policy limit claims |
E&O | Errors and Omissions |
FAL | Funds at Lloyd's |
FASB | Financial Accounting Standards Board |
FHLB | Federal Home Loan Bank |
FHLMC | Federal Home Loan Mortgage Corporation |
FNMA | Federal National Mortgage Association |
GAAP | Generally accepted accounting principles in the United States of America |
GILTI | Global intangible low-taxed income |
GNMA | Government National Mortgage Association |
HCPL | Healthcare professional liability |
IBNR | Incurred but not reported |
Inova Re | Inova Re, LTD, S.P.C. |
IRS | Internal Revenue Service |
LIBOR | London Interbank Offered Rate |
LLC | Limited liability company |
Lloyd's | Lloyd's of London market |
LP | Limited partnership |
Medical Technology Liability | Medical technology and life sciences products liability |
Mortgage Loans | Two ten-year mortgage loans collectively with an original borrowing amount of approximately $40 million, each entered into by a subsidiary of ProAssurance |
NAV | Net asset value |
NOL | Net operating loss |
NORCAL | NORCAL Group |
NORCAL Mutual | NORCAL Mutual Insurance Company |
NRSRO | Nationally recognized statistical rating organization |
NYSE | New York Stock Exchange |
OCI | Other comprehensive income (loss) |
2
Term | Meaning |
PCAOB | Public Company Accounting Oversight Board |
PDR | Premium deficiency reserve |
PREP Act | The Public Readiness and Emergency Preparedness Act |
Revolving Credit Agreement | ProAssurance's $250 million revolving credit agreement |
ROE | Return on equity |
ROU | Right-of-use |
SEC | Securities and Exchange Commission |
SPA | Special Purpose Arrangement |
SPC | Segregated portfolio cell |
Specialty P&C | Specialty Property and Casualty |
Syndicate 1729 | Lloyd's of London Syndicate 1729 |
Syndicate 6131 | Lloyd's of London Syndicate 6131, a Special Purpose Arrangement with Lloyd's of London Syndicate 1729 |
Syndicate Credit Agreement | Unconditional revolving credit agreement with the Premium Trust Fund of Syndicate 1729 |
TCJA | Tax Cuts and Jobs Act H.R.1 of 2017 |
U.K. | United Kingdom of Great Britain and Northern Ireland |
ULAE | Unallocated loss adjustment expense |
VIE | Variable interest entity |
3
Caution Regarding Forward-Looking Statements
Any statements in this Form 10-Q that are not historical facts are specifically identified as forward-looking statements. These statements are based upon our estimates and anticipation of future events and are subject to significant risks, assumptions and uncertainties that could cause actual results to vary materially from the expected results described in the forward-looking statements. Forward-looking statements are identified by words such as, but not limited to, "anticipate," "believe," "estimate," "expect," "hope," "hopeful," "intend," "likely," "may," "optimistic," "possible," "potential," "preliminary," "project," "should," "will" and other analogous expressions. There are numerous factors that could cause our actual results to differ materially from those in the forward-looking statements. Thus, sentences and phrases that we use to convey our view of future events and trends are expressly designated as forward-looking statements as are sections of this Form 10-Q that are identified as giving our outlook on future business.
Forward-looking statements relating to our business include among other things: statements concerning future liquidity and capital requirements, investment valuation and performance, return on equity, financial ratios, net income, premiums, losses and loss reserve, premium rates and retention of current business, competition and market conditions, the expansion of product lines, the development or acquisition of business in new geographical areas, the pricing or availability of acceptable reinsurance, actions by regulators and rating agencies, court actions, legislative actions, payment or performance of obligations under indebtedness, payment of dividends and other matters.
These forward-looking statements are subject to significant risks, assumptions and uncertainties, including, among other things, the following factors that could affect the actual outcome of future events:
Ÿ | changes in general economic conditions, including the impact of inflation or deflation and unemployment; |
Ÿ | our ability to maintain our dividend payments; |
Ÿ | regulatory, legislative and judicial actions or decisions that could affect our business plans or operations, including the impact of Brexit and the impact of changes in interpretations of certain coverages as a result of COVID-19; |
Ÿ | the enactment or repeal of tort reforms; |
Ÿ | formation or dissolution of state-sponsored insurance entities providing coverages now offered by ProAssurance which could remove or add sizable numbers of insureds from or to the private insurance market; |
Ÿ | changes in the interest and tax rate environment; |
Ÿ | resolution of uncertain tax matters and changes in tax laws, including the impact of the TCJA; |
Ÿ | changes in laws or government regulations regarding financial markets or market activity that may affect our business; |
Ÿ | changes in the ability of the U.S. government to meet its obligations that may affect the U.S. economy and our business; |
Ÿ | performance of financial markets affecting the fair value of our investments or making it difficult to determine the value of our investments; |
Ÿ | changes in requirements or accounting policies and practices that may be adopted by our regulatory agencies, the FASB, the SEC, the PCAOB or the NYSE that may affect our business; |
Ÿ | changes in laws or government regulations affecting the financial services industry, the property and casualty insurance industry or particular insurance lines underwritten by our subsidiaries; |
Ÿ | the effect on our insureds, particularly the insurance needs of our insureds, and our loss costs, of changes in the healthcare delivery system and/or changes in the U.S. political climate that may affect healthcare policy or our business; |
Ÿ | consolidation of our insureds into or under larger entities which may be insured by competitors, or may not have a risk profile that meets our underwriting criteria or which may not use external providers for insuring or otherwise managing substantial portions of their liability risk; |
Ÿ | the effect of cyclical insurance industry trends on our underwriting, including demand and pricing in the insurance and reinsurance markets in which we operate; |
Ÿ | uncertainties inherent in the estimate of our loss and loss adjustment expense reserve and reinsurance recoverable; |
Ÿ | changes in the availability, cost, quality or collectability of insurance/reinsurance; |
Ÿ | the results of litigation, including pre- or post-trial motions, trials and/or appeals we undertake; |
Ÿ | effects on our claims costs from mass tort litigation that are different from that anticipated by us; |
Ÿ | allegations of bad faith which may arise from our handling of any particular claim, including failure to settle; |
Ÿ | loss or consolidation of independent agents, agencies, brokers or brokerage firms; |
4
Ÿ | changes in our organization, compensation and benefit plans; |
Ÿ | changes in the business or competitive environment may limit the effectiveness of our business strategy and impact our revenues; |
Ÿ | our ability to retain and recruit senior management and other qualified personnel; |
Ÿ | the availability, integrity and security of our technology infrastructure or that of our third-party providers of technology infrastructure, including any susceptibility to cyber-attacks which might result in a loss of information or operating capability; |
Ÿ | the impact of a catastrophic event, including the recent COVID-19 pandemic, as it relates to our business and insurance operations, investment results, Lloyd's Syndicates and our insured risks; |
Ÿ | the impact of the COVID-19 pandemic and related economic conditions on our premium volume, loss reserves, investment portfolio, business operations and workforce; |
Ÿ | the impact of acts of terrorism and acts of war; |
Ÿ | the effects of terrorism-related insurance legislation and laws; |
Ÿ | guaranty funds and other state assessments; |
Ÿ | our ability to achieve continued growth through expansion into new markets or through acquisitions or business combinations; |
Ÿ | our ability to complete our planned acquisition of NORCAL due to regulatory approval or inability to fund the transaction, or inability to successfully integrate NORCAL and achieve expected synergies; |
Ÿ | changes to the ratings assigned by rating agencies to our insurance subsidiaries, individually or as a group; |
Ÿ | provisions in our charter documents, Delaware law and state insurance laws may impede attempts to replace or remove management or may impede a takeover; |
Ÿ | state insurance restrictions may prohibit assets held by our insurance subsidiaries, including cash and investment securities, from being used for general corporate purposes; |
Ÿ | taxing authorities can take exception to our tax positions and cause us to incur significant amounts of legal and accounting costs and, if our defense is not successful, additional tax costs, including interest and penalties; and |
Ÿ | expected benefits from completed and proposed acquisitions may not be achieved or may be delayed longer than expected due to business disruption; loss of customers, employees or key agents; increased operating costs or inability to achieve cost savings and synergies; and assumption of greater than expected liabilities, among other reasons. |
Additional risks, assumptions and uncertainties that could arise from our membership in the Lloyd's market and our participation in Lloyd's Syndicates include, but are not limited to, the following: | |
Ÿ | members of Lloyd's are subject to levies by the Council of Lloyd's based on a percentage of the member's underwriting capacity, currently a maximum of 3%, but can be increased by Lloyd's; |
Ÿ | Syndicate operating results can be affected by decisions made by the Council of Lloyd's which the management of Syndicate 1729 and Syndicate 6131 have little ability to control, such as a decision to not approve the business plan of Syndicate 1729 or Syndicate 6131, or a decision to increase the capital required to continue operations, and by our obligation to pay levies to Lloyd's; |
Ÿ | Lloyd's insurance and reinsurance relationships and distribution channels could be disrupted or Lloyd's trading licenses could be revoked, making it more difficult for a Lloyd's Syndicate to distribute and market its products; |
Ÿ | rating agencies could downgrade their ratings of Lloyd's as a whole; and |
Ÿ | Syndicate 1729 and Syndicate 6131 operations are dependent on a small, specialized management team, and the loss of their services could adversely affect the Syndicate’s business. The inability to identify, hire and retain other highly qualified personnel in the future could adversely affect the quality and profitability of Syndicate 1729’s or Syndicate 6131's business. |
Our results may differ materially from those we expect and discuss in any forward-looking statements. The principal risk factors that may cause these differences are described in "Item 1A, Risk Factors" in our December 31, 2019 report on Form 10-K, in "Item 1A, Risk Factors" included in this report and other documents we file with the SEC, such as our current reports on Form 8-K and our regular reports on Form 10-Q.
We caution readers not to place undue reliance on any such forward-looking statements, which are based upon conditions existing only as of the date made, and advise readers that these factors could affect our financial performance and could cause actual results for future periods to differ materially from any opinions or statements expressed with respect to future periods in
5
any current statements. Except as required by law or regulations, we do not undertake and specifically decline any obligation to publicly release the result of any revisions that may be made to any forward-looking statements to reflect events or circumstances after the date of such statements or to reflect the occurrence of anticipated or unanticipated events.
6
TABLE OF CONTENTS | ||
7
ProAssurance Corporation and Subsidiaries
Condensed Consolidated Balance Sheets (Unaudited)
(In thousands, except share data)
June 30, 2020 | December 31, 2019 | ||||||
Assets | |||||||
Investments | |||||||
Fixed maturities, available-for-sale, at fair value (amortized cost, $2,182,473 and $2,241,304, respectively; allowance for expected credit losses, $1,408 as of current period end) | $ | $ | |||||
Fixed maturities, trading, at fair value (cost, $45,754 and $46,772, respectively) | |||||||
Equity investments, at fair value (cost, $99,822 and $227,873, respectively) | |||||||
Short-term investments | |||||||
Business owned life insurance | |||||||
Investment in unconsolidated subsidiaries | |||||||
Other investments (at fair value, $37,978 and $36,018, respectively, otherwise at cost or amortized cost) | |||||||
Total Investments | |||||||
Cash and cash equivalents | |||||||
Premiums receivable, net | |||||||
Receivable from reinsurers on paid losses and loss adjustment expenses | |||||||
Receivable from reinsurers on unpaid losses and loss adjustment expenses | |||||||
Prepaid reinsurance premiums | |||||||
Deferred policy acquisition costs | |||||||
Deferred tax asset, net | |||||||
Real estate, net | |||||||
Operating lease ROU assets | |||||||
Intangible assets, net | |||||||
Goodwill | |||||||
Other assets | |||||||
Total Assets | $ | $ | |||||
Liabilities and Shareholders' Equity | |||||||
Liabilities | |||||||
Policy liabilities and accruals | |||||||
Reserve for losses and loss adjustment expenses | $ | $ | |||||
Unearned premiums | |||||||
Reinsurance premiums payable | |||||||
Total Policy Liabilities | |||||||
Operating lease liabilities | |||||||
Other liabilities | |||||||
Debt less unamortized debt issuance costs | |||||||
Total Liabilities | |||||||
Shareholders' Equity | |||||||
Common shares (par value $0.01 per share, 100,000,000 shares authorized, 63,213,146 and 63,117,235 shares issued, respectively) | |||||||
Additional paid-in capital | |||||||
Accumulated other comprehensive income (loss) (net of deferred tax expense (benefit) of $15,587 and $9,795, respectively) | |||||||
Retained earnings | |||||||
Treasury shares, at cost (9,325,180 shares as of each respective period end) | ( | ) | ( | ) | |||
Total Shareholders' Equity | |||||||
Total Liabilities and Shareholders' Equity | $ | $ | |||||
See accompanying notes.
8
ProAssurance Corporation and Subsidiaries
Condensed Consolidated Statements of Changes in Capital (Unaudited)
(In thousands)
ProAssurance Shareholders' Equity | ||||||||||||||||||||||||
Common Stock | Additional Paid-in Capital | Accumulated Other Comprehensive Income (Loss) | Retained Earnings | Treasury Stock | Total | |||||||||||||||||||
Balance at April 1, 2020 | $ | $ | $ | ( | ) | $ | $ | ( | ) | $ | ||||||||||||||
Common shares issued for compensation and effect of shares reissued to stock purchase plan | — | — | — | |||||||||||||||||||||
Share-based compensation | — | — | — | — | ||||||||||||||||||||
Net effect of restricted and performance shares issued | — | ( | ) | — | — | — | ( | ) | ||||||||||||||||
Dividends to shareholders | — | — | — | ( | ) | — | ( | ) | ||||||||||||||||
Other comprehensive income (loss) | — | — | — | — | ||||||||||||||||||||
Net income (loss) | — | — | — | ( | ) | — | ( | ) | ||||||||||||||||
Balance at June 30, 2020 | $ | $ | $ | $ | $ | ( | ) | $ | ||||||||||||||||
Common Stock | Additional Paid-in Capital | Accumulated Other Comprehensive Income (Loss) | Retained Earnings | Treasury Stock | Total | |||||||||||||||||||
Balance at December 31, 2019 | $ | $ | $ | $ | $ | ( | ) | $ | ||||||||||||||||
Cumulative-effect adjustment- ASU 2016-13 adoption* | — | — | — | ( | ) | — | ( | ) | ||||||||||||||||
Common shares issued for compensation and effect of shares reissued to stock purchase plan | — | — | — | — | ||||||||||||||||||||
Share-based compensation | — | — | — | — | ||||||||||||||||||||
Net effect of restricted and performance shares issued | ( | ) | — | — | — | ( | ) | |||||||||||||||||
Dividends to shareholders | — | — | — | ( | ) | — | ( | ) | ||||||||||||||||
Other comprehensive income (loss) | — | — | — | — | ||||||||||||||||||||
Net income (loss) | — | — | — | ( | ) | — | ( | ) | ||||||||||||||||
Balance at June 30, 2020 | $ | $ | $ | $ | $ | ( | ) | $ | ||||||||||||||||
* See Note 1 for discussion of accounting guidance adopted during the period. | ||||||||||||||||||||||||
Continued on the following page. | ||||||||||||||||||||||||
9
Continued from the previous page. | ||||||||||||||||||||||||
Common Stock | Additional Paid-in Capital | Accumulated Other Comprehensive Income (Loss) | Retained Earnings | Treasury Stock | Total | |||||||||||||||||||
Balance at April 1, 2019 | $ | $ | $ | $ | $ | ( | ) | $ | ||||||||||||||||
Common shares issued for compensation and effect of shares reissued to stock purchase plan | — | — | — | — | ||||||||||||||||||||
Share-based compensation | — | — | — | — | ||||||||||||||||||||
Net effect of restricted and performance shares issued | — | ( | ) | — | — | — | ( | ) | ||||||||||||||||
Dividends to shareholders | — | — | — | ( | ) | — | ( | ) | ||||||||||||||||
Other comprehensive income (loss) | — | — | — | — | ||||||||||||||||||||
Net income | — | — | — | — | ||||||||||||||||||||
Balance at June 30, 2019 | $ | $ | $ | $ | $ | ( | ) | $ | ||||||||||||||||
Common Stock | Additional Paid-in Capital | Accumulated Other Comprehensive Income (Loss) | Retained Earnings | Treasury Stock | Total | |||||||||||||||||||
Balance at December 31, 2018 | $ | $ | $ | ( | ) | $ | $ | ( | ) | $ | ||||||||||||||
Cumulative-effect adjustment- ASU 2018-07 adoption | — | — | — | ( | ) | — | ( | ) | ||||||||||||||||
Common shares issued for compensation and effect of shares reissued to stock purchase plan | — | — | — | — | ||||||||||||||||||||
Share-based compensation | — | — | — | — | ||||||||||||||||||||
Net effect of restricted and performance shares issued | ( | ) | — | — | — | ( | ) | |||||||||||||||||
Dividends to shareholders | — | — | — | ( | ) | — | ( | ) | ||||||||||||||||
Other comprehensive income (loss) | — | — | — | — | ||||||||||||||||||||
Net income | — | — | — | — | ||||||||||||||||||||
Balance at June 30, 2019 | $ | $ | $ | $ | $ | ( | ) | $ | ||||||||||||||||
See accompanying notes.
10
ProAssurance Corporation and Subsidiaries
Condensed Consolidated Statements of Income and Comprehensive Income (Unaudited)
(In thousands, except per share data)
Three Months Ended June 30 | Six Months Ended June 30 | ||||||||||||||
2020 | 2019 | 2020 | 2019 | ||||||||||||
Revenues | |||||||||||||||
Net premiums earned | $ | $ | $ | $ | |||||||||||
Net investment income | |||||||||||||||
Equity in earnings (loss) of unconsolidated subsidiaries | ( | ) | ( | ) | ( | ) | ( | ) | |||||||
Net realized investment gains (losses): | |||||||||||||||
Impairment losses | ( | ) | ( | ) | ( | ) | |||||||||
Portion of impairment losses recognized in other comprehensive income (loss) before taxes | |||||||||||||||
Net impairment losses recognized in earnings | ( | ) | ( | ) | ( | ) | |||||||||
Other net realized investment gains (losses) | ( | ) | |||||||||||||
Total net realized investment gains (losses) | ( | ) | |||||||||||||
Other income | |||||||||||||||
Total revenues | |||||||||||||||
Expenses | |||||||||||||||
Net losses and loss adjustment expenses | |||||||||||||||
Underwriting, policy acquisition and operating expenses: | |||||||||||||||
Operating expense | |||||||||||||||
DPAC amortization | |||||||||||||||
SPC U.S. federal income tax expense | |||||||||||||||
SPC dividend expense (income) | ( | ) | ( | ) | |||||||||||
Interest expense | |||||||||||||||
Total expenses | |||||||||||||||
Income (loss) before income taxes | ( | ) | ( | ) | |||||||||||
Provision for income taxes: | |||||||||||||||
Current expense (benefit) | ( | ) | ( | ) | |||||||||||
Deferred expense (benefit) | ( | ) | ( | ) | ( | ) | |||||||||
Total income tax expense (benefit) | ( | ) | ( | ) | ( | ) | |||||||||
Net income (loss) | ( | ) | ( | ) | |||||||||||
Other comprehensive income (loss), after tax, net of reclassification adjustments | |||||||||||||||
Comprehensive income (loss) | $ | $ | $ | ( | ) | $ | |||||||||
Earnings (loss) per share | |||||||||||||||
Basic | $ | ( | ) | $ | $ | ( | ) | $ | |||||||
Diluted | $ | ( | ) | $ | $ | ( | ) | $ | |||||||
Weighted average number of common shares outstanding: | |||||||||||||||
Basic | |||||||||||||||
Diluted | |||||||||||||||
Cash dividends declared per common share | $ | $ | $ | $ | |||||||||||
See accompanying notes.
11
ProAssurance Corporation and Subsidiaries
Condensed Consolidated Statements of Cash Flows (Unaudited)
(In thousands)
Six Months Ended June 30 | |||||||
2020 | 2019 | ||||||
Operating Activities | |||||||
Net income (loss) | $ | ( | ) | $ | |||
Adjustments to reconcile net income to net cash provided by operating activities: | |||||||
Depreciation and amortization, net of accretion | |||||||
(Increase) decrease in cash surrender value of BOLI | ( | ) | ( | ) | |||
Net realized investment (gains) losses | ( | ) | |||||
Share-based compensation | |||||||
Deferred income tax expense (benefit) | ( | ) | |||||
Policy acquisition costs, net of amortization (net deferral) | ( | ) | |||||
Equity in (earnings) loss of unconsolidated subsidiaries | |||||||
Distributed earnings from unconsolidated subsidiaries | |||||||
Other | |||||||
Other changes in assets and liabilities: | |||||||
Premiums receivable | ( | ) | |||||
Reinsurance related assets and liabilities | ( | ) | ( | ) | |||
Other assets | ( | ) | ( | ) | |||
Reserve for losses and loss adjustment expenses | |||||||
Unearned premiums | ( | ) | |||||
Other liabilities | ( | ) | ( | ) | |||
Net cash provided (used) by operating activities | |||||||
Investing Activities | |||||||
Purchases of: | |||||||
Fixed maturities, available-for-sale | ( | ) | ( | ) | |||
Equity investments | ( | ) | ( | ) | |||
Other investments | ( | ) | ( | ) | |||
Funding of qualified affordable housing project tax credit partnerships | ( | ) | ( | ) | |||
Investment in unconsolidated subsidiaries | ( | ) | ( | ) | |||
Proceeds from sales or maturities of: | |||||||
Fixed maturities, available-for-sale | |||||||
Equity investments | |||||||
Other investments | |||||||
Net sales or (purchases) of fixed maturities, trading | ( | ) | |||||
Return of invested capital from unconsolidated subsidiaries | |||||||
Net sales or maturities (purchases) of short-term investments | ( | ) | |||||
Unsettled security transactions, net change | ( | ) | |||||
Purchases of capital assets | ( | ) | ( | ) | |||
Purchases of intangible assets | ( | ) | |||||
Repayments under Syndicate Credit Agreement | |||||||
Other | ( | ) | ( | ) | |||
Net cash provided (used) by investing activities | ( | ) | |||||
Continued on the following page. | |||||||
12
Six Months Ended June 30 | |||||||
2020 | 2019 | ||||||
Continued from the previous page. | |||||||
Financing Activities | |||||||
Repayments of Mortgage Loans | ( | ) | ( | ) | |||
Dividends to shareholders | ( | ) | ( | ) | |||
Capital contribution received from (return of capital to) external segregated portfolio cell participants | ( | ) | ( | ) | |||
Other | ( | ) | ( | ) | |||
Net cash provided (used) by financing activities | ( | ) | ( | ) | |||
Increase (decrease) in cash and cash equivalents | |||||||
Cash and cash equivalents at beginning of period | |||||||
Cash and cash equivalents at end of period | $ | $ | |||||
Significant Non-Cash Transactions | |||||||
Dividends declared and not yet paid | $ | $ | |||||
Operating ROU assets obtained in exchange for operating lease liabilities | $ | $ | |||||
See accompanying notes.
13
ProAssurance Corporation and Subsidiaries
Notes to Condensed Consolidated Financial Statements (Unaudited)
June 30, 2020
1. Basis of Presentation
The accompanying unaudited Condensed Consolidated Financial Statements include the accounts of ProAssurance Corporation and its consolidated subsidiaries (ProAssurance, PRA or the Company). The financial statements have been prepared in accordance with GAAP for interim financial information and with the instructions to Form 10-Q and Article 10 of Regulation S-X. Accordingly, they do not include all of the information and notes required by GAAP for complete financial statements. In the opinion of management, all adjustments considered necessary for a fair presentation, consisting of normal recurring adjustments, have been included. ProAssurance’s results for the six months ended June 30, 2020 are not necessarily indicative of the results that may be expected for the year ending December 31, 2020. The accompanying Condensed Consolidated Financial Statements should be read in conjunction with the Consolidated Financial Statements and Notes contained in ProAssurance’s December 31, 2019 report on Form 10-K.
ProAssurance operates in five reportable segments as follows: Specialty P&C, Workers' Compensation Insurance, Segregated Portfolio Cell Reinsurance, Lloyd's Syndicates and Corporate. For more information on the Company's segment reporting, including the nature of products and services provided and financial information by segment, refer to Note 12.
Other Liabilities
Other liabilities consisted of the following:
(In thousands) | June 30, 2020 | December 31, 2019 | ||||||
SPC dividends payable | $ | $ | ||||||
Unpaid shareholder dividends | ||||||||
All other | ||||||||
Total other liabilities | $ | $ | ||||||
SPC dividends payable represents the undistributed equity contractually payable to the external cell participants of SPCs operated by ProAssurance's Cayman Islands subsidiaries, Inova Re and Eastern Re.
Unpaid shareholder dividends represent common stock dividends declared by ProAssurance's Board that had not yet been paid as of June 30, 2020.
Accounting Policies
The preparation of financial statements in conformity with GAAP requires the Company to make estimates and assumptions that affect the reported amounts of assets and liabilities, revenues and expenses, and disclosures related to these amounts at the date of the financial statements. The Company evaluates these estimates and assumptions on an ongoing basis based on current and historical developments, market conditions, industry trends and other information that the Company believes to be reasonable under the circumstances. The Company can make no assurance that actual results will conform to its estimates and assumptions; reported results of operations may be materially affected by changes in these estimates and assumptions.
As a result of the COVID-19 pandemic, the Company will reevaluate certain of these estimates and assumptions which could result in material changes to its results of operations including, but not limited to, higher losses and loss adjustment expenses, lower premium volume, asset impairment charges, declines in investment valuations, reductions in audit premium estimates, deferred tax valuation allowances and increases in the allowance for expected credit losses related to available-for-sale securities, premiums receivable and reinsurance receivables. The extent to which the COVID-19 pandemic impacts the Company's business, results of operations and financial condition will depend on future developments, which are highly uncertain and cannot be predicted. These factors include, but are not limited to, the duration, spread, severity, reemergence or mutation of the COVID-19 pandemic, the effects of the COVID-19 pandemic on the Company's insureds, the loss environment, the healthcare industry, the labor market and Lloyd's, the actions and stimulus measures taken by governments and governmental agencies, and to what extent normal economic and operating conditions can resume. Even after the COVID-19 pandemic has subsided, the Company may experience an impact to its business as a result of any economic recession that has occurred or may occur in the future.
14
ProAssurance Corporation and Subsidiaries
Notes to Condensed Consolidated Financial Statements (Unaudited)
June 30, 2020
Due to the adoption of ASU 2016-13 at the beginning of 2020, ProAssurance began following the accounting policies described below:
Credit Losses
ProAssurance's premiums receivable and reinsurance receivables are exposed to credit losses but to-date have not experienced any significant amount of credit losses. ProAssurance measures expected credit losses on its premiums receivables and reinsurance receivables on a collective (pool) basis when similar risk characteristics exist, and the Company will reassess its pools each reporting period to ensure all receivables within the pool continue to share similar risk characteristics. If the Company determines that a receivable does not share risk characteristics with its other receivables within a pool, it will evaluate that receivable for expected credit losses on an individual basis. ProAssurance measures expected credit losses associated with its premium receivables at the segment level as each segment’s premium receivables share similar risk characteristics including term, type of financial asset and similar historical and expected credit loss patterns. ProAssurance measures expected credit losses associated with its reinsurance receivables (related to both paid and unpaid losses) at the consolidated level as its reinsurance receivables share similar risk characteristics including type of financial asset, type of industry and similar historical and expected credit loss patterns.
ProAssurance measures expected credit losses over the contractual term of each pool utilizing a loss rate method. Historical internal credit loss experience for each pool is the basis for the Company’s assessment of expected credit losses; however, the Company may also consider historical credit loss information from external sources. In addition to historical credit loss data, the Company also considers reasonable and supportable forecasts of future economic conditions in its estimate of expected credit losses by utilizing industry and macroeconomic factors that it believes most relevant to the collectability of each pool.
ProAssurance’s premiums receivable on its Condensed Consolidated Balance Sheet as of June 30, 2020 is reported net of the related allowance for expected credit losses of $6.6 million. The following table presents a roll forward of the allowance for expected credit losses related to the Company's premiums receivable for the six months ended June 30, 2020.
(In thousands) | Premiums Receivable, Net | Allowance for Expected Credit Losses | |||||
Balance, April 1, 2020 | $ | $ | |||||
Provision for expected credit losses | |||||||
Write offs charged against the allowance | ( | ) | |||||
Recoveries of amounts previously written off | |||||||
Balance, June 30, 2020 | $ | $ | |||||
(In thousands) | Premiums Receivable, Net | Allowance for Expected Credit Losses | |||||
Balance, December 31, 2019 | $ | $ | |||||
Cumulative-effect adjustment on January 1, 2020, before tax - ASU 2016-13 adoption | |||||||
Provision for expected credit losses | |||||||
Write offs charged against the allowance | ( | ) | |||||
Recoveries of amounts previously written off | |||||||
Balance, June 30, 2020 | $ | $ | |||||
ProAssurance’s expected credit losses associated with its reinsurance receivables (related to both paid and unpaid losses) were nominal in amount as of June 30, 2020. ProAssurance has other financial assets and off-balance-sheet commitments that are exposed to credit losses; however, expected credit losses associated with these assets and commitments were nominal in amount as of June 30, 2020.
15
ProAssurance Corporation and Subsidiaries
Notes to Condensed Consolidated Financial Statements (Unaudited)
June 30, 2020
Investments
Impairments
ProAssurance evaluates its available-for-sale investment securities, which at June 30, 2020 and December 31, 2019 consisted entirely of fixed maturity securities, on at least a quarterly basis for the purpose of determining whether declines in fair value below recorded cost basis represent a credit loss. The Company considers a credit loss to have occurred:
• | if there is intent to sell the security; |
• | if it is more likely than not that the security will be required to be sold before full recovery of its amortized cost basis; or |
• | if the entire amortized basis of the security is not expected to be recovered. |
The assessment of whether the amortized cost basis of a security is expected to be recovered requires the Company to make assumptions regarding various matters affecting future cash flows. The choice of assumptions is subjective and requires the use of judgment. Actual credit losses experienced in future periods may differ from the Company’s estimates of those credit losses. Methodologies used to estimate the present value of expected cash flows are:
The estimate of expected cash flows is determined by projecting a recovery value and a recovery time frame and assessing whether further principal and interest will be received. ProAssurance considers various factors in projecting recovery values and recovery time frames, including the following:
• | third-party research and credit rating reports; |
• | the current credit standing of the issuer, including credit rating downgrades, whether before or after the balance sheet date; |
• | the extent to which the decline in fair value is attributable to credit risk specifically associated with the security or its issuer; |
• | internal assessments and the assessments of external portfolio managers regarding specific circumstances surrounding an investment, which indicate the investment is more or less likely to recover its amortized cost than other investments with a similar structure; |
• | for asset-backed securities, the origination date of the underlying loans, the remaining average life, the probability that credit performance of the underlying loans will deteriorate in the future and ProAssurance's assessment of the quality of the collateral underlying the loan; |
• | failure of the issuer of the security to make scheduled interest or principal payments; |
• | any changes to the rating of the security by a rating agency; |
• | recoveries or additional declines in fair value subsequent to the balance sheet date; |
• | adverse legal or regulatory events; |
• | significant deterioration in the market environment that may affect the value of collateral (e.g. decline in real estate prices); |
• | significant deterioration in economic conditions; and |
• | disruption in the business model resulting from changes in technology or new entrants to the industry. |
If deemed appropriate and necessary, a discounted cash flow analysis is performed to confirm whether a credit loss exists and, if so, the amount of the credit loss. ProAssurance uses the single best estimate approach for available-for-sale debt securities and considers all reasonably available data points, including industry analyses, credit ratings, expected defaults and the remaining payment terms of the debt security. For fixed rate available-for-sale debt securities, cash flows are discounted at the security's effective interest rate implicit in the security at the date of acquisition. If the available-for-sale debt security’s contractual interest rate varies based on subsequent changes in an independent factor, such as an index or rate, for example, the prime rate, the LIBOR, or the U.S. Treasury bill weekly average, that security’s effective interest rate is calculated based on the factor as it changes over the life of the security.
If ProAssurance intends to sell a debt security or believes it will more likely than not be required to sell a debt security before the amortized cost basis is recovered, any existing allowance will be written off against the security's amortized cost basis, with any remaining difference between the debt security's amortized cost basis and fair value recognized as an impairment loss in earnings.
Exclusive of securities where there is an intent to sell or where it is not more likely than not that the security will be required to be sold before recovery of its amortized cost basis, impairment for debt securities is separated into a credit component and a non-credit component. The credit component of an impairment is the difference between the security’s amortized cost basis and the present value of its expected future cash flows, while the non-credit component is the remaining difference between the security’s fair value and the present value of expected future cash flows. An allowance for expected credit losses will be recorded for the expected credit losses through income and the non-credit component is recognized in OCI.
16
ProAssurance Corporation and Subsidiaries
Notes to Condensed Consolidated Financial Statements (Unaudited)
June 30, 2020
The amount of impairment recognized is limited to the excess of the amortized cost over the fair value of the available-for-sale debt security.
Goodwill / Intangibles
Goodwill is recognized in conjunction with business acquisitions as the excess of the purchase consideration for the business acquisition over the fair value of identifiable assets acquired and liabilities assumed. The fair value of identifiable assets and liabilities, and thus goodwill, is subject to redetermination within a measurement period of up to one year following completion of a business acquisition.
Goodwill is tested for impairment annually or more frequently if circumstances indicate an impairment may have occurred. The date of the Company's annual goodwill impairment testing is October 1. Impairment of goodwill is tested at the reporting unit level, which is consistent with the Company's reportable segments identified in Note 12. Of the five reporting units, three have goodwill - Specialty P&C, Workers' Compensation Insurance and Segregated Portfolio Cell Reinsurance. In 2019, the Company performed qualitative assessments that supported a conclusion that the fair value of all of the reporting units with goodwill exceeded their carrying value.
COVID–19 has caused significant market volatility impacting the Company's actual and projected results along with a decline in the Company's stock price. During the second quarter of 2020, management performed a quantitative assessment on the Specialty P&C and Workers' Compensation Insurance reporting units. The previous quantitative and qualitative assessments on the Segregated Portfolio Cell Reinsurance reporting unit indicated that the fair value of the reporting unit significantly exceeded the carrying; as such no quantitative assessment of this reporting unit was performed during the second quarter of 2020.
For the interim impairment assessment, management estimated the fair value of the reporting units using both an income approach and a market approach. The estimate of fair value derived from the income approach is based on the present value of expected future cash flows, including terminal value, utilizing a market-based weighted average cost of capital determined separately for each reporting unit. The estimate of fair value derived from the market approach is based on earnings multiple data. The determination of fair value involves the use of significant estimates and assumptions, including revenue growth rates, operating margins, capital expenditures, working capital requirements, tax rates, terminal growth rates, discount rates, comparable public companies and synergistic benefits available to market participants. In addition, management makes certain judgments and assumptions in allocating shared assets and liabilities to individual reporting units to determine the carrying amount of each reporting unit. Given the evolving, uncertain nature of the COVID-19 pandemic, these estimates and assumptions have inherent uncertainties, and different assumptions could lead to materially different results including impairment charges in the future. To corroborate the reporting units’ valuation, management performed a reconciliation of the estimate of the aggregate fair value of the reporting units to ProAssurance's market capitalization, including consideration of a control premium. As a result of the interim goodwill impairment assessment, management concluded that the fair value of each of the Specialty P&C and Workers' Compensation Insurance reporting units were greater than their carrying value as of the testing date; therefore, goodwill was not impaired and no further impairment testing was required. As this is an evolving crisis, management expects to continue to monitor developments and perform updated analyses as necessary.
Accounting Changes Adopted
Improvements to Financial Instruments - Credit Losses (ASU 2016-13)
Effective for fiscal years beginning after December 15, 2019 and interim periods within those fiscal years, the FASB issued guidance that replaces the incurred loss impairment methodology, which delays recognition of credit losses until a probable loss has been incurred, with a methodology that reflects expected credit losses and requires consideration of a broader range of reasonable and supportable information to inform credit loss estimates. Included in the scope of this guidance are the Company's available-for-sale fixed maturity securities and its financial assets held at amortized cost. Under the new guidance, credit losses are required to be recorded through an allowance for expected credit losses account and the income statement will reflect the initial recognition of lifetime expected credit losses for any newly recognized financial assets as well as increases or decreases of expected credit losses that have taken place during the period. Credit losses on available-for-sale fixed maturity securities are required to be presented as an allowance, rather than as a write-down of the asset, limited to the amount by which the fair value is below amortized cost. ProAssurance adopted this guidance beginning January 1, 2020 using a modified retrospective application for the portion of the new guidance that relates to its premiums and reinsurance receivables and a prospective application for the portion of the new guidance that relates to its available-for-sale fixed maturity securities. ProAssurance recorded a cumulative-effect adjustment of $4.1 million, net of related tax impacts, to beginning retained earnings as of January 1, 2020 to increase its consolidated allowance for expected credit losses related to its premiums receivable. ProAssurance determined that estimated expected credit losses associated with the Company's other financial assets
17
ProAssurance Corporation and Subsidiaries
Notes to Condensed Consolidated Financial Statements (Unaudited)
June 30, 2020
held at amortized cost included in the scope of this new guidance was nominal as of January 1, 2020. Adoption of this guidance had no material effect on ProAssurance's results of operations, financial position or cash flows.
Simplifying the Test for Goodwill Impairment (ASU 2017-04)
Effective for the fiscal years beginning after December 15, 2019 and interim periods within those fiscal years, the FASB issued guidance that simplifies the requirements to test goodwill for impairment for business entities that have goodwill reported in their financial statements. The guidance eliminates the second step of the impairment test which measures a goodwill impairment loss by comparing the implied fair value of a reporting unit's goodwill with the carrying amount which is expected to reduce the complexity and cost of future tests of goodwill for impairment. In addition, the guidance also eliminates the requirements for any reporting unit with a zero or negative carrying amount to perform a qualitative assessment. ProAssurance adopted the guidance beginning January 1, 2020, and adoption had no material effect on ProAssurance’s results of operations, financial position or cash flows.
Changes to the Disclosure Requirements for Fair Value Measurement (ASU 2018-13)
Effective for fiscal years beginning after December 15, 2019 and interim periods within those fiscal years, the FASB issued guidance that eliminates, modifies and adds certain disclosure requirements related to fair value measurements. The new guidance eliminates the requirements to disclose the transfers between Level 1 and Level 2 of the fair value hierarchy, the policy for the timing of transfers between levels of the fair value hierarchy and the valuation process for Level 3 fair value measurements while it modifies existing disclosure requirements related to measurement uncertainty and the requirement to disclose the timing of liquidation of an investee's assets for investments in certain entities that calculate NAV. The new guidance also adds requirements to disclose changes in unrealized gains and losses included in OCI for recurring Level 3 fair value measurements as well as the range and weighted average used to develop significant unobservable inputs for Level 3 fair value measurements. An entity is permitted to early adopt any eliminated or modified disclosure requirements and delay adoption of the additional disclosure requirements until the guidance is effective. During the third quarter of 2018, ProAssurance elected to early adopt the provisions that eliminate and modify certain disclosure requirements within Note 2 on a retrospective basis, and adopted the additional disclosure requirements beginning January 1, 2020. Adoption of this guidance had no material effect on ProAssurance’s results of operations, financial position or cash flows as it affected disclosures only.
Intangibles - Goodwill and Other-Internal-Use Software (ASU 2018-15)
Effective for fiscal years beginning after December 15, 2019 and interim periods within those fiscal years, the FASB amended the new standard regarding accounting for implementation costs in cloud computing arrangements. The amended guidance substantially aligns the requirements for capitalizing implementation costs incurred in a hosting arrangement that is a service contract with the requirements for capitalizing implementation costs incurred to develop or obtain internal-use software. ProAssurance adopted the guidance beginning January 1, 2020, and adoption had no material effect on ProAssurance’s results of operations, financial position or cash flows.
Targeted Improvements to Related Party Guidance for VIEs (ASU 2018-17)
Effective for fiscal years beginning after December 15, 2019 and interim periods within those fiscal years, the FASB amended guidance which improves the consistency of the application of the VIE guidance for common control arrangements. The amended guidance requires an entity to consider indirect interests held through related parties under common control on a proportional basis rather than as the equivalent of a direct interest in its entirety when determining whether a decision-making fee is a variable interest. ProAssurance adopted the guidance beginning January 1, 2020. ProAssurance does not have any material indirect interests held through related parties under common control; therefore, adoption had no material effect on ProAssurance’s results of operations, financial position or cash flows.
Collaborative Arrangements (ASU 2018-18)
Effective for fiscal years beginning after December 15, 2019 and interim periods within those fiscal years, the FASB issued new guidance which clarifies how to assess whether certain transactions between participants in a collaborative arrangement should be accounted for under the revenue from contracts with customers accounting standard when the counterpart is a customer. In addition, the guidance precludes an entity from presenting consideration from a transaction in a collaborative arrangement as revenue from contracts with customers if the counterparty is not a customer for that transaction. ProAssurance adopted the guidance beginning January 1, 2020, and adoption had no material effect on ProAssurance’s results of operations, financial position or cash flows.
Reference Rate Reform (ASU 2020-04)
The FASB issued guidance intended to assist stakeholders during the market-wide reference rate transition period and is effective for a limited period between March 12, 2020 and December 31, 2022. The guidance provides optional expedients and
18
ProAssurance Corporation and Subsidiaries
Notes to Condensed Consolidated Financial Statements (Unaudited)
June 30, 2020
exceptions for applying GAAP to contracts, hedging relationships and other transactions that reference LIBOR or another reference rate that is expected to be discontinued because of reference rate reform. ProAssurance has exposure to LIBOR-based financial instruments through its variable rate Mortgage Loans and Revolving Credit Agreement; however, these agreements include provisions for an alternative benchmark rate if LIBOR ceases to exist, which do not materially change the liability exposure. Additionally, ProAssurance has exposure to LIBOR in its available-for-sale fixed maturities portfolio which represented approximately 6 % of total investments, or $188 million, as of June 30, 2020; 28 % of these investments with exposure to LIBOR were issued during 2020 or 2019 and include provisions for an alternative benchmark rate. Optional expedients for contract modifications include a prospective adjustment that does not require contract remeasurement or reassessment of a previous accounting determination; therefore, the modified contract is accounted for as a continuation of the existing contract. ProAssurance adopted the guidance beginning March 12, 2020, and adoption had no material effect on ProAssurance's results of operations, financial position or cash flows.
Simplifying the Accounting for Income Taxes (ASU 2019-12)
Effective for fiscal years beginning after December 15, 2020 and interim periods within those fiscal years, the FASB issued new guidance which is intended to simplify various aspects related to accounting for income taxes. In addition, it removes certain exceptions to the general principles in the income tax guidance in the codification and also clarifies and amends existing guidance to improve consistent application. ProAssurance elected to early adopt this guidance using a prospective application during the second quarter of 2020. The most impactful provision of the new guidance on the Company is the removal of the limitation on the tax benefit recognized on pre-tax losses during interim periods in which the year-to-date loss exceeds the expected loss for the fiscal year.
Accounting Changes Not Yet Adopted
Clarifying the Interactions between Investments - Equity Securities, Investments - Equity Method and Joint Ventures, and Derivatives and Hedging (ASU 2020-01)
Effective for fiscal years beginning after December 15, 2020 and interim periods within those fiscal years, the FASB amended guidance that clarifies the accounting for the transition into and out of the equity method and measuring certain purchased options and forward contracts to acquire investments. ProAssurance plans to adopt the guidance beginning January 1, 2021, and adoption is not expected to have a material effect on ProAssurance's results of operations, financial position or cash flows.
19
ProAssurance Corporation and Subsidiaries
Notes to Condensed Consolidated Financial Statements (Unaudited)
June 30, 2020
2. Fair Value Measurement
Fair value is defined as the price that would be received to sell an asset or paid to transfer a liability in an orderly transaction between market participants at the measurement date. A three level hierarchy has been established for valuing assets and liabilities based on how transparent (observable) the inputs are that are used to determine fair value, with the inputs considered most observable categorized as Level 1 and those that are the least observable categorized as Level 3. Hierarchy levels are defined as follows:
Level 1: | quoted (unadjusted) market prices in active markets for identical assets and liabilities. For ProAssurance, Level 1 inputs are generally quotes for debt or equity securities actively traded in exchange or over-the-counter markets. | |
Level 2: | market data obtained from sources independent of the reporting entity (observable inputs). For ProAssurance, Level 2 inputs generally include quoted prices in markets that are not active, quoted prices for similar assets or liabilities, and results from pricing models that use observable inputs such as interest rates and yield curves that are generally available at commonly quoted intervals. | |
Level 3: | the reporting entity’s own assumptions about market participant assumptions based on the best information available in the circumstances (non-observable inputs). For ProAssurance, Level 3 inputs are used in situations where little or no Level 1 or 2 inputs are available or are inappropriate given the particular circumstances. Level 3 inputs include results from pricing models for which some or all of the inputs are not observable, discounted cash flow methodologies, single non-binding broker quotes and adjustments to externally quoted prices that are based on management judgment or estimation. | |
Fair values of assets measured at fair value on a recurring basis as of June 30, 2020 and December 31, 2019 are shown in the following tables. Where applicable, the tables also indicate the fair value hierarchy of the valuation techniques utilized to determine those fair values. For some assets, the inputs used to measure fair value may fall into different levels of the fair value hierarchy. When this is the case, the asset is categorized based on the level of the most significant input to the fair value measurement. Assessments of the significance of a particular input to the fair value measurement require judgment and consideration of factors specific to the assets being valued.
20
ProAssurance Corporation and Subsidiaries
Notes to Condensed Consolidated Financial Statements (Unaudited)
June 30, 2020
June 30, 2020 | |||||||||||||||
Fair Value Measurements Using | Total | ||||||||||||||
(In thousands) | Level 1 | Level 2 | Level 3 | Fair Value | |||||||||||
Assets: | |||||||||||||||
Fixed maturities, available-for-sale | |||||||||||||||
U.S. Treasury obligations | $ | $ | $ | $ | |||||||||||
U.S. Government-sponsored enterprise obligations | |||||||||||||||
State and municipal bonds | |||||||||||||||
Corporate debt, multiple observable inputs | |||||||||||||||
Corporate debt, limited observable inputs | |||||||||||||||
Residential mortgage-backed securities | |||||||||||||||
Agency commercial mortgage-backed securities | |||||||||||||||
Other commercial mortgage-backed securities | |||||||||||||||
Other asset-backed securities | |||||||||||||||
Fixed maturities, trading | |||||||||||||||
Equity investments | |||||||||||||||
Financial | |||||||||||||||
Utilities/Energy | |||||||||||||||
Consumer oriented | |||||||||||||||
Industrial | |||||||||||||||
Bond funds | |||||||||||||||
All other | |||||||||||||||
Short-term investments | |||||||||||||||
Other investments | |||||||||||||||
Other assets | |||||||||||||||
Total assets categorized within the fair value hierarchy | $ | $ | $ | ||||||||||||
Assets carried at NAV, which approximates fair value and which are not categorized within the fair value hierarchy, reported as a part of: | |||||||||||||||
Equity investments | |||||||||||||||
Investment in unconsolidated subsidiaries | |||||||||||||||
Total assets at fair value | $ | ||||||||||||||
21
ProAssurance Corporation and Subsidiaries
Notes to Condensed Consolidated Financial Statements (Unaudited)
June 30, 2020
December 31, 2019 | |||||||||||||||
Fair Value Measurements Using | Total | ||||||||||||||
(In thousands) | Level 1 | Level 2 | Level 3 | Fair Value | |||||||||||
Assets: | |||||||||||||||
Fixed maturities, available-for-sale | |||||||||||||||
U.S. Treasury obligations | $ | $ | $ | $ | |||||||||||
U.S. Government-sponsored enterprise obligations | |||||||||||||||
State and municipal bonds | |||||||||||||||
Corporate debt, multiple observable inputs | |||||||||||||||
Corporate debt, limited observable inputs | |||||||||||||||
Residential mortgage-backed securities | |||||||||||||||
Agency commercial mortgage-backed securities | |||||||||||||||
Other commercial mortgage-backed securities | |||||||||||||||
Other asset-backed securities | |||||||||||||||
Fixed maturities, trading | |||||||||||||||
Equity investments | |||||||||||||||
Financial | |||||||||||||||
Utilities/Energy | |||||||||||||||
Consumer oriented | |||||||||||||||
Industrial | |||||||||||||||
Bond funds | |||||||||||||||
All other | |||||||||||||||
Short-term investments | |||||||||||||||
Other investments | |||||||||||||||
Other assets | |||||||||||||||
Total assets categorized within the fair value hierarchy | $ | $ | $ | ||||||||||||
Assets carried at NAV, which approximates fair value and which are not categorized within the fair value hierarchy, reported as a part of: | |||||||||||||||
Equity investments | |||||||||||||||
Investment in unconsolidated subsidiaries | |||||||||||||||
Total assets at fair value | $ | ||||||||||||||
The fair values for securities included in the Level 2 category, with the few exceptions described below, were developed by one of several third party, nationally recognized pricing services, including services that price only certain types of securities. Each service uses complex methodologies to determine values for securities and subject the values they develop to quality control reviews. Management selected a primary source for each type of security in the portfolio and reviewed the values provided for reasonableness by comparing data to alternate pricing services and to available market and trade data. Values that appeared inconsistent were further reviewed for appropriateness. Any value that did not appear reasonable was discussed with the service that provided the value and adjusted, if necessary. There were no material changes to the values supplied by the pricing services as of June 30, 2020 and December 31, 2019.
22
ProAssurance Corporation and Subsidiaries
Notes to Condensed Consolidated Financial Statements (Unaudited)
June 30, 2020
Level 2 Valuations
Below is a summary description of the valuation methodologies primarily used by the pricing services for securities in the Level 2 category, by security type:
U.S. Treasury obligations were valued based on quoted prices for identical assets, or, in markets that are not active, quotes for similar assets, taking into consideration adjustments for variations in contractual cash flows and yields to maturity.
U.S. Government-sponsored enterprise obligations were valued using pricing models that consider current and historical market data, normal trading conventions, credit ratings, and the particular structure and characteristics of the security being valued, such as yield to maturity, redemption options, and contractual cash flows. Adjustments to model inputs or model results were included in the valuation process when necessary to reflect recent regulatory, government or corporate actions or significant economic, industry or geographic events affecting the security’s fair value.
State and municipal bonds were valued using a series of matrices that considered credit ratings, the structure of the security, the sector in which the security falls, yields, and contractual cash flows. Valuations were further adjusted, when necessary, to reflect the expected effect on fair value of recent significant economic or geographic events or ratings changes.
Corporate debt, multiple observable inputs consisted primarily of corporate bonds, but also included a small number of bank loans. The methodology used to value Level 2 corporate bonds was the same as the methodology previously described for U.S. Government-sponsored enterprise obligations. Bank loans were valued based on an average of broker quotes for the loans in question, if available. If quotes were not available, the loans were valued based on quoted prices for comparable loans or, if the loan was newly issued, by comparison to similar seasoned issues. Broker quotes were compared to actual trade prices to permit assessment of the reliability of the quotes; unreliable quotes were not considered in quoted averages.
Residential and commercial mortgage-backed securities were valued using a pricing matrix which considers the issuer type, coupon rate and longest cash flows outstanding. The matrix used was based on the most recently available market information. Agency and non-agency collateralized mortgage obligations were both valued using models that consider the structure of the security, current and historical information regarding prepayment speeds, ratings and ratings updates, and current and historical interest rate and interest rate spread data.
Other asset-backed securities were valued using models that consider the structure of the security, monthly payment information, current and historical information regarding prepayment speeds, ratings and ratings updates, and current and historical interest rate and interest rate spread data. Spreads and prepayment speeds consider collateral type.
Fixed maturities, trading, are held by the Lloyd's Syndicates segment and include U.S. Treasury obligations, corporate debt with multiple observable inputs and residential mortgage-backed securities. These securities were valued using the respective valuation methodologies discussed above for each security type.
Short-term investments were securities maturing within one year, carried at fair value which approximated the cost of the securities due to their short-term nature.
Other investments consisted primarily of convertible bonds valued using a pricing model that incorporated selected dealer quotes as well as current market data regarding equity prices and risk free rates. If dealer quotes were unavailable for the security being valued, quotes for securities with similar terms and credit status were used in the pricing model. Dealer quotes selected for use were those considered most accurate based on parameters such as underwriter status and historical reliability.
Other assets consisted of an interest rate cap derivative instrument, valued using a model which considers the volatilities from other instruments with similar maturities, strike prices, durations and forward yield curves. Under the terms of the interest rate cap agreement, ProAssurance paid a premium of $2 million for the right to receive cash payments based upon a notional amount of $35 million if and when the three-month LIBOR rises above 2.35 %. The Company's variable-rate Mortgage Loans bear an interest rate of three-month LIBOR plus 1.325 %. For additional information regarding the interest rate cap agreement, see Note 12 of the Notes to Consolidated Financial Statements in ProAssurance's December 31, 2019 report on Form 10-K.
23
ProAssurance Corporation and Subsidiaries
Notes to Condensed Consolidated Financial Statements (Unaudited)
June 30, 2020
Level 3 Valuations
Below is a summary description of the valuation methodologies used as well as quantitative information regarding securities in the Level 3 category, by security type:
Level 3 Valuation Methodologies
Corporate debt, limited observable inputs consisted of corporate bonds valued using dealer quotes for similar securities or discounted cash flow models using yields currently available for similar securities. Similar securities are defined as securities of comparable credit quality that have like terms and payment features. Assessments of credit quality were based on NRSRO ratings, if available, or were determined by management if not available. At June 30, 2020, 100 % of the securities were rated and the average rating was BBB-. At December 31, 2019, 66 % of the securities were rated and the average rating was BBB-.
Residential mortgage-backed, other commercial mortgage-backed and other asset-backed securities consisted of securitizations of receivables valued using dealer quotes for similar securities or discounted cash flow models using yields currently available for similar securities. Similar securities are defined as securities of comparable credit quality that have like terms and payment features. Assessments of credit quality were based on NRSRO ratings, if available, or were subjectively determined by management if not available. At June 30, 2020, 70 % of the securities were rated and the average rating was AA. At December 31, 2019, 100 % of the securities were rated and the average rating was AA.
Other investments consisted of convertible securities for which limited observable inputs were available at June 30, 2020 and December 31, 2019. The securities were valued internally based on expected cash flows, including the expected final recovery, discounted at a yield that considered the lack of liquidity and the financial status of the issuer.
Quantitative Information Regarding Level 3 Valuations
Fair Value at | ||||||||||
($ in thousands) | June 30, 2020 | December 31, 2019 | Valuation Technique | Unobservable Input | Range (Weighted Average) | |||||
Assets: | ||||||||||
Corporate debt, limited observable inputs | $ | $ | Market Comparable Securities | Comparability Adjustment | 0% - 5% (2.5%) | |||||
Discounted Cash Flows | Comparability Adjustment | 0% - 5% (2.5%) | ||||||||
Residential mortgage-backed and other commercial mortgage-backed securities | $ | Market Comparable Securities | Comparability Adjustment | 0% - 5% (2.5%) | ||||||
Discounted Cash Flows | Comparability Adjustment | 0% - 5% (2.5%) | ||||||||
Other asset-backed securities | $ | $ | Market Comparable Securities | Comparability Adjustment | 0% - 5% (2.5%) | |||||
Discounted Cash Flows | Comparability Adjustment | 0% - 5% (2.5%) | ||||||||
Other investments | $ | Discounted Cash Flows | Comparability Adjustment | 0% - 10% (5%) | ||||||
The significant unobservable inputs used in the fair value measurement of the above listed securities were the valuations of comparable securities with similar issuers, credit quality and maturity. Changes in the availability of comparable securities could result in changes in the fair value measurements.
24
ProAssurance Corporation and Subsidiaries
Notes to Condensed Consolidated Financial Statements (Unaudited)
June 30, 2020
Fair Value Measurements - Level 3 Assets
The following tables (the Level 3 Tables) present summary information regarding changes in the fair value of assets measured at fair value using Level 3 inputs.
June 30, 2020 | |||||||||||||||
Level 3 Fair Value Measurements – Assets | |||||||||||||||
(In thousands) | Corporate Debt | Asset-backed Securities | Other investments | Total | |||||||||||
Balance March 31, 2020 | $ | $ | $ | $ | |||||||||||
Total gains (losses) realized and unrealized: | |||||||||||||||
Included in earnings, as a part of: | |||||||||||||||
Net investment income | ( | ) | ( | ) | |||||||||||
Net realized investment gains (losses) | |||||||||||||||
Included in other comprehensive income | |||||||||||||||
Purchases | |||||||||||||||
Sales | ( | ) | ( | ) | ( | ) | |||||||||
Transfers in | |||||||||||||||
Transfers out | ( | ) | ( | ) | |||||||||||
Balance June 30, 2020 | $ | $ | $ | $ | |||||||||||
Change in unrealized gains (losses) included in earnings for the above period for Level 3 assets held at period-end | $ | $ | $ | $ | |||||||||||
June 30, 2020 | |||||||||||||||
Level 3 Fair Value Measurements – Assets | |||||||||||||||
(In thousands) | Corporate Debt | Asset-backed Securities | Other investments | Total | |||||||||||
Balance December 31, 2019 | $ | $ | $ | $ | |||||||||||
Total gains (losses) realized and unrealized: | |||||||||||||||
Included in earnings, as a part of: | |||||||||||||||
Net investment income | ( | ) | ( | ) | |||||||||||
Net realized investment gains (losses) | |||||||||||||||
Included in other comprehensive income | |||||||||||||||
Purchases | |||||||||||||||
Sales | ( | ) | ( | ) | ( | ) | |||||||||
Transfers in | |||||||||||||||
Transfers out | ( | ) | ( | ) | ( | ) | ( | ) | |||||||
Balance June 30, 2020 | $ | $ | $ | $ | |||||||||||
Change in unrealized gains (losses) included in earnings for the above period for Level 3 assets held at period-end | $ | $ | $ | $ | |||||||||||
25
ProAssurance Corporation and Subsidiaries
Notes to Condensed Consolidated Financial Statements (Unaudited)
June 30, 2020
June 30, 2019 | |||||||||||||||
Level 3 Fair Value Measurements – Assets | |||||||||||||||
(In thousands) | Corporate Debt | Asset-backed Securities | Other investments | Total | |||||||||||
Balance March 31, 2019 | $ | $ | $ | $ | |||||||||||
Total gains (losses) realized and unrealized: | |||||||||||||||
Included in earnings, as a part of: | |||||||||||||||
Net investment income | ( | ) | ( | ) | |||||||||||
Net realized investment gains (losses) | |||||||||||||||
Included in other comprehensive income | |||||||||||||||
Purchases | |||||||||||||||
Sales | ( | ) | ( | ) | |||||||||||
Transfers in | |||||||||||||||
Transfers out | |||||||||||||||
Balance June 30, 2019 | $ | $ | $ | $ | |||||||||||
Change in unrealized gains (losses) included in earnings for the above period for Level 3 assets held at period-end | $ | $ | $ | $ | |||||||||||
June 30, 2019 | |||||||||||||||
Level 3 Fair Value Measurements – Assets | |||||||||||||||
(In thousands) | Corporate Debt | Asset-backed Securities | Other investments | Total | |||||||||||
Balance December 31, 2018 | $ | $ | $ | $ | |||||||||||
Total gains (losses) realized and unrealized: | |||||||||||||||
Included in earnings, as a part of: | |||||||||||||||
Net investment income | ( | ) | ( | ) | |||||||||||
Net realized investment gains (losses) | |||||||||||||||
Included in other comprehensive income | |||||||||||||||
Purchases | |||||||||||||||
Sales | ( | ) | ( | ) | ( | ) | |||||||||
Transfers in | |||||||||||||||
Transfers out | ( | ) | ( | ) | ( | ) | |||||||||
Balance June 30, 2019 | $ | $ | $ | ||||||||||||
Change in unrealized gains (losses) included in earnings for the above period for Level 3 assets held at period-end | $ | $ | $ | $ | |||||||||||
26
ProAssurance Corporation and Subsidiaries
Notes to Condensed Consolidated Financial Statements (Unaudited)
June 30, 2020
Transfers
Transfers shown in the preceding Level 3 tables were as of the end of the quarter in which the transfer occurred. All transfers were to or from Level 2.
All transfers in and out of Level 3 during the three and six months ended June 30, 2020 and 2019 related to securities held for which the level of market activity for identical or nearly identical securities varies from period to period. The securities were valued using multiple observable inputs when those inputs were available; otherwise the securities were valued using limited observable inputs.
Fair Values Not Categorized
At June 30, 2020 and December 31, 2019, certain LPs/LLCs and investment funds measure fund assets at fair value on a recurring basis and provide a NAV for ProAssurance's interest. The carrying value of these interests is based on the NAV provided and was considered to approximate the fair value of the interests. For investment in unconsolidated subsidiaries, ProAssurance recognizes any changes in the NAV of its interests in equity in earnings (loss) of unconsolidated subsidiaries during the period of change. In accordance with GAAP, the fair value of these investments was not classified within the fair value hierarchy. The amount of ProAssurance's unfunded commitments related to these investments as of June 30, 2020 and fair values of these investments as of June 30, 2020 and December 31, 2019 were as follows:
Unfunded Commitments | Fair Value | ||||||||||
(In thousands) | June 30, 2020 | June 30, 2020 | December 31, 2019 | ||||||||
Equity investments: | |||||||||||
Mortgage fund (1) | $ | $ | |||||||||
Investment in unconsolidated subsidiaries: | |||||||||||
Private debt funds (2) | $ | ||||||||||
Long equity fund (3) | |||||||||||
Long/short equity funds (4) | |||||||||||
Non-public equity funds (5) | $ | ||||||||||
Multi-strategy fund of funds (6) | |||||||||||
Credit funds (7) | $ | ||||||||||
Long/short commodities fund (8) | |||||||||||
Strategy focused funds (9) | $ | ||||||||||
Total investments carried at NAV | $ | $ | |||||||||
Below is additional information regarding each of the investments listed in the table above as of June 30, 2020.
(1) | This investment fund is focused on the structured mortgage market. The fund will primarily invest in U.S. Agency mortgage-backed securities. Redemptions are allowed at the end of any calendar quarter with a prior notice requirement of |
(2) | This investment is comprised of interests in |
(3) | This fund is a LP that holds long equities of public international companies and was fully redeemed during the second quarter of 2020. |
(4) | This investment holds primarily long and short North American equities and target absolute returns using strategies designed to take advantage of market opportunities. Redemptions are permitted; however, redemptions above specified thresholds (lowest threshold is |
27
ProAssurance Corporation and Subsidiaries
Notes to Condensed Consolidated Financial Statements (Unaudited)
June 30, 2020
(5) | This investment is comprised of interests in multiple unrelated LP funds, each structured to provide capital appreciation through diversified investments in private equity, which can include investments in buyout, venture capital, debt including senior, second lien and mezzanine, distressed debt, collateralized loan obligations and other private equity-oriented LPs. Two of the LPs allow redemption by terms set forth in the LP agreements; the others do not permit redemption. Income and capital are to be periodically distributed at the discretion of the LP over time frames that are anticipated to span up to |
(6) | This fund is a LLC structured to build and manage low volatility, multi-manager portfolios that have little or no correlation to the broader fixed income and equity security markets. Redemptions are not permitted but offers to repurchase units of the LLC may be extended periodically. |
(7) | This investment is comprised of four unrelated LP funds. Two funds seek to obtain superior risk-adjusted absolute returns through a diversified portfolio of debt securities, including bonds, loans and other asset-backed instruments. A third fund focuses on private middle market company mezzanine loans, while the remaining fund seeks event driven opportunities across the corporate credit spectrum. Two funds are allowed redemptions at any quarter-end with a prior notice requirement of |
(8) | This fund is a LLC invested across a broad range of commodities and focuses primarily on market neutral, relative value strategies, seeking to generate absolute returns with low correlation to broad commodity, equity and fixed income markets. This fund was fully redeemed during the second quarter of 2020. |
(9) This investment is comprised of multiple unrelated LPs/LLCs funds. One fund is a LLC focused on investing in North American consumer products companies, comprised of equity and equity-related securities, as well as debt instruments. A second fund is focused on aircraft investments, along with components and assets related to aircrafts. For both funds, redemptions are not permitted. Another fund is a LP focused on North American energy infrastructure assets that allows redemption with consent of the General Partner. The remaining funds are real estate focused LPs, one of which allows for redemption with prior notice.
ProAssurance may not sell, transfer or assign its interest in any of the above LPs/LLCs without special consent from the LPs/LLCs.
Nonrecurring Fair Value Measurement
At June 30, 2020 and December 31, 2019, ProAssurance did no t have any assets or liabilities that were measured at fair value on a nonrecurring basis.
Financial Instruments - Methodologies Other Than Fair Value
The following table provides the estimated fair value of the Company's financial instruments that, in accordance with GAAP for the type of investment, are measured using a methodology other than fair value. Fair values provided primarily fall within the Level 3 fair value category.
June 30, 2020 | December 31, 2019 | ||||||||||||||
(In thousands) | Carrying Value | Fair Value | Carrying Value | Fair Value | |||||||||||
Financial assets: | |||||||||||||||
BOLI | $ | $ | $ | $ | |||||||||||
Other investments | $ | $ | $ | $ | |||||||||||
Other assets | $ | $ | $ | $ | |||||||||||
Financial liabilities: | |||||||||||||||
Senior notes due 2023* | $ | $ | $ | $ | |||||||||||
Mortgage Loans* | $ | $ | $ | $ | |||||||||||
Other liabilities | $ | $ | $ | $ | |||||||||||
* Carrying value excludes unamortized debt issuance costs. | |||||||||||||||
The fair value of the BOLI was equal to the cash surrender value associated with the policies on the valuation date.
28
ProAssurance Corporation and Subsidiaries
Notes to Condensed Consolidated Financial Statements (Unaudited)
June 30, 2020
Other investments listed in the table above include FHLB common stock carried at cost and an annuity investment carried at amortized cost. Two of ProAssurance's insurance subsidiaries are members of an FHLB. The estimated fair value of the FHLB common stock was based on the amount the subsidiaries would receive if their memberships were canceled, as the memberships cannot be sold. The fair value of the annuity represents the present value of the expected future cash flows discounted using a rate available in active markets for similarly structured instruments.
Other assets and other liabilities primarily consisted of related investment assets and liabilities associated with funded deferred compensation agreements. The fair value of the funded deferred compensation assets was based upon quoted market prices, which is categorized as a Level 1 valuation, and had a fair value of $26.0 million and $26.9 million at June 30, 2020 and December 31, 2019, respectively. The deferred compensation liabilities are adjusted to match the fair value of the deferred compensation assets. Other assets also included an unsecured note receivable under a separate line of credit agreement. Fair value of the note receivable was based on the present value of expected cash flows from the note receivable, discounted at market rates on the valuation date for receivables with similar credit standings and similar payment structures.
The fair value of the debt was estimated based on the present value of expected future cash outflows, discounted at rates available on the valuation date for similar debt issued by entities with a similar credit standing to ProAssurance.
29
ProAssurance Corporation and Subsidiaries
Notes to Condensed Consolidated Financial Statements (Unaudited)
June 30, 2020
3. Investments
Available-for-sale fixed maturities at June 30, 2020 and December 31, 2019 included the following:
June 30, 2020 | |||||||||||||||||||
(In thousands) | Amortized Cost | Allowance for Expected Credit Losses | Gross Unrealized Gains | Gross Unrealized Losses | Estimated Fair Value | ||||||||||||||
Fixed maturities, available-for-sale | |||||||||||||||||||
U.S. Treasury obligations | $ | $ | $ | $ | $ | ||||||||||||||
U.S. Government-sponsored enterprise obligations | |||||||||||||||||||
State and municipal bonds | |||||||||||||||||||
Corporate debt | |||||||||||||||||||
Residential mortgage-backed securities | |||||||||||||||||||
Agency commercial mortgage-backed securities | |||||||||||||||||||
Other commercial mortgage-backed securities | |||||||||||||||||||
Other asset-backed securities | |||||||||||||||||||
$ | $ | $ | $ | $ | |||||||||||||||
December 31, 2019 | |||||||||||||||
(In thousands) | Amortized Cost | Gross Unrealized Gains | Gross Unrealized Losses | Estimated Fair Value | |||||||||||
Fixed maturities, available-for-sale | |||||||||||||||
U.S. Treasury obligations | $ | $ | $ | $ | |||||||||||
U.S. Government-sponsored enterprise obligations | |||||||||||||||
State and municipal bonds | |||||||||||||||
Corporate debt | |||||||||||||||
Residential mortgage-backed securities | |||||||||||||||
Agency commercial mortgage-backed securities | |||||||||||||||
Other commercial mortgage-backed securities | |||||||||||||||
Other asset-backed securities | |||||||||||||||
$ | $ | $ | $ | ||||||||||||
30
ProAssurance Corporation and Subsidiaries
Notes to Condensed Consolidated Financial Statements (Unaudited)
June 30, 2020
The recorded cost basis and estimated fair value of available-for-sale fixed maturities at June 30, 2020, by contractual maturity, are shown below. Actual maturities may differ from contractual maturities because borrowers may have the right to call or prepay obligations with or without call or prepayment penalties.
(In thousands) | Amortized Cost | Due in one year or less | Due after one year through five years | Due after five years through ten years | Due after ten years | Total Fair Value | |||||||||||||||||
Fixed maturities, available-for-sale | |||||||||||||||||||||||
U.S. Treasury obligations | $ | $ | $ | $ | $ | $ | |||||||||||||||||
U.S. Government-sponsored enterprise obligations | |||||||||||||||||||||||
State and municipal bonds | |||||||||||||||||||||||
Corporate debt | |||||||||||||||||||||||
Residential mortgage-backed securities | |||||||||||||||||||||||
Agency commercial mortgage-backed securities | |||||||||||||||||||||||
Other commercial mortgage-backed securities | |||||||||||||||||||||||
Other asset-backed securities | |||||||||||||||||||||||
$ | $ | ||||||||||||||||||||||
Excluding obligations of the U.S. Government, U.S. Government-sponsored enterprises and a U.S. Government obligations money market fund, no investment in any entity or its affiliates exceeded 10% of shareholders’ equity at June 30, 2020.
Cash and securities with a carrying value of $44.0 million at June 30, 2020 were on deposit with various state insurance departments to meet regulatory requirements.
As a member of Lloyd's, ProAssurance is required to maintain capital at Lloyd's, referred to as FAL, to support underwriting by Syndicate 1729 and Syndicate 6131. At June 30, 2020, ProAssurance's FAL investments were comprised of available-for-sale fixed maturities with a fair value of $104.3 million and cash and cash equivalents of $33.2 million on deposit with Lloyd's in order to satisfy these FAL requirements.
31
ProAssurance Corporation and Subsidiaries
Notes to Condensed Consolidated Financial Statements (Unaudited)
June 30, 2020
Investments Held in a Loss Position
The following tables provide summarized information with respect to investments held in an unrealized loss position at June 30, 2020 and December 31, 2019, including the length of time the investment had been held in a continuous unrealized loss position.
June 30, 2020 | |||||||||||||||||||||||
Total | Less than 12 months | 12 months or longer | |||||||||||||||||||||
Fair | Unrealized | Fair | Unrealized | Fair | Unrealized | ||||||||||||||||||
(In thousands) | Value | Loss | Value | Loss | Value | Loss | |||||||||||||||||
Fixed maturities, available-for-sale | |||||||||||||||||||||||
U.S. Treasury obligations | $ | $ | $ | $ | $ | $ | |||||||||||||||||
State and municipal bonds | |||||||||||||||||||||||
Corporate debt | |||||||||||||||||||||||
Residential mortgage-backed securities | |||||||||||||||||||||||
Other commercial mortgage-backed securities | |||||||||||||||||||||||
Other asset-backed securities | |||||||||||||||||||||||
$ | $ | $ | $ | $ | $ | ||||||||||||||||||
December 31, 2019 | |||||||||||||||||||||||
Total | Less than 12 months | 12 months or longer | |||||||||||||||||||||
Fair | Unrealized | Fair | Unrealized | Fair | Unrealized | ||||||||||||||||||
(In thousands) | Value | Loss | Value | Loss | Value | Loss | |||||||||||||||||
Fixed maturities, available-for-sale | |||||||||||||||||||||||
U.S. Treasury obligations | $ | $ | $ | $ | $ | $ | |||||||||||||||||
State and municipal bonds | |||||||||||||||||||||||
Corporate debt | |||||||||||||||||||||||
Residential mortgage-backed securities | |||||||||||||||||||||||
Agency commercial mortgage-backed securities | |||||||||||||||||||||||
Other commercial mortgage-backed securities | |||||||||||||||||||||||
Other asset-backed securities | |||||||||||||||||||||||
$ | $ | $ | $ | $ | $ | ||||||||||||||||||
As of June 30, 2020, excluding U.S. Government or U.S. Government-sponsored enterprise obligations, there were 384 debt securities (16.2 % of all available-for-sale fixed maturity securities held) in an unrealized loss position representing 309 issuers. The greatest and second greatest unrealized loss positions among those securities were approximately $0.7 million and $0.6 million, respectively. The securities were evaluated for impairment as of June 30, 2020.
As of December 31, 2019, excluding U.S. Government or U.S. Government-sponsored enterprise obligations, there were 263 debt securities (12.1 % of all available-for-sale fixed maturity securities held) in an unrealized loss position representing 204 issuers. The greatest and second greatest unrealized loss positions among those securities were approximately $0.2 million and $0.1 million, respectively. The securities were evaluated for impairment as of December 31, 2019.
Each quarter, ProAssurance performs a detailed analysis for the purpose of assessing whether any of the securities it holds in an unrealized loss position has suffered an impairment due to credit or non-credit factors. A detailed discussion of the factors considered in the assessment is included in Note 1.
Fixed maturity securities held in an unrealized loss position at June 30, 2020, excluding asset-backed securities, have paid all scheduled contractual payments and are expected to continue doing so. Expected future cash flows of asset-backed securities, excluding those issued by GNMA, FNMA and FHLMC, held in an unrealized loss position were estimated as part of
32
ProAssurance Corporation and Subsidiaries
Notes to Condensed Consolidated Financial Statements (Unaudited)
June 30, 2020
the June 30, 2020 impairment evaluation using the most recently available six-month historical performance data for the collateral (loans) underlying the security or, if historical data was not available, sector based assumptions, and equaled or exceeded the current amortized cost basis of the security.
The following tables present a roll forward of the allowance for expected credit losses on available-for-sale fixed maturities for the three and six months ended June 30, 2020.
Three Months Ended June 30, 2020 | ||||||
(In thousands) | Corporate Debt | Total | ||||
Balance April 1, 2020 | $ | $ | ||||
Additional credit losses related to securities for which: | ||||||
No allowance for credit losses has been previously recognized | ||||||
An allowance for credit losses was recorded in a previous period | ||||||
Reductions related to: | ||||||
Securities sold during the period | ( | ) | ( | ) | ||
Balance June 30, 2020 | $ | $ | ||||
Six Months Ended June 30, 2020 | ||||||
(In thousands) | Corporate Debt | Total | ||||
Balance December 31, 2019 | $ | $ | ||||
Additional credit losses related to securities for which: | ||||||
No allowance for credit losses has been previously recognized | ||||||
Reductions related to: | ||||||
Securities sold during the period | ( | ) | ( | ) | ||
Balance June 30, 2020 | $ | $ | ||||
Other information regarding sales and purchases of fixed maturity available-for-sale securities is as follows:
Three Months Ended June 30 | Six Months Ended June 30 | ||||||||||||||
(In millions) | 2020 | 2019 | 2020 | 2019 | |||||||||||
Proceeds from sales (exclusive of maturities and paydowns) | $ | $ | $ | $ | |||||||||||
Purchases | $ | $ | $ | $ | |||||||||||
Equity Investments
ProAssurance's equity investments are carried at fair value with changes in fair value recognized in income as a component of net realized investment gains (losses) during the period of change. Equity investments on the Condensed Consolidated Balance Sheets as of June 30, 2020 and December 31, 2019 primarily included stocks, bond funds and investment funds.
Short-term Investments
ProAssurance's short-term investments, which have a maturity at purchase of one year or less, are primarily comprised of investments in U.S. treasury obligations, commercial paper and money market funds. Short-term investments are carried at fair value which approximates the cost of the securities due to their short-term nature.
BOLI
ProAssurance holds BOLI policies that are carried at the current cash surrender value of the policies (original cost $33 million). All insured individuals were members of ProAssurance management at the time the policies were acquired. The primary purpose of the program is to offset future employee benefit expenses through earnings on the cash value of the policies. ProAssurance is the owner and beneficiary of these policies.
33
ProAssurance Corporation and Subsidiaries
Notes to Condensed Consolidated Financial Statements (Unaudited)
June 30, 2020
Net Investment Income
Net investment income by investment category was as follows:
Three Months Ended June 30 | Six Months Ended June 30 | ||||||||||||||
(In thousands) | 2020 | 2019 | 2020 | 2019 | |||||||||||
Fixed maturities | $ | $ | $ | $ | |||||||||||
Equities | |||||||||||||||
Short-term investments, including Other | |||||||||||||||
BOLI | |||||||||||||||
Investment fees and expenses | ( | ) | ( | ) | ( | ) | ( | ) | |||||||
Net investment income | $ | $ | $ | $ | |||||||||||
Investment in Unconsolidated Subsidiaries
ProAssurance's investment in unconsolidated subsidiaries were as follows:
June 30, 2020 | Carrying Value | |||||||||
(In thousands) | Percentage Ownership | June 30, 2020 | December 31, 2019 | |||||||
Qualified affordable housing project tax credit partnerships | See below | $ | $ | |||||||
Other tax credit partnerships | See below | |||||||||
All other investments, primarily investment fund LPs/LLCs | See below | |||||||||
$ | $ | |||||||||
Qualified affordable housing project tax credit partnership interests held by ProAssurance generate investment returns by providing tax benefits to fund investors in the form of tax credits and project operating losses. The carrying value of these investments reflects ProAssurance's total commitments (both funded and unfunded) to the partnerships, less any amortization. ProAssurance's ownership percentage relative to two of the tax credit partnership interests is almost 100 %; these interests had a carrying value of $13.3 million at June 30, 2020 and $17.2 million at December 31, 2019. ProAssurance's ownership percentage relative to the remaining tax credit partnership interests is less than 20 %; these interests had a carrying value of $23.8 million at June 30, 2020 and $29.2 million at December 31, 2019. Since ProAssurance has the ability to exert influence over the partnerships but does not control them, all are accounted for using the equity method. See further discussion of the entities in which ProAssurance holds passive interests in Note 10.
ProAssurance's other tax credit partnership is an investment in a historic tax credit partnership that generates investment returns by providing benefits to fund investors in the form of tax credits, tax deductible project operating losses and positive cash flows. The carrying value of this investment reflects ProAssurance's total funded commitment less any amortization. As of June 30, 2020, this investment was fully amortized up to the total current funded commitment. ProAssurance's ownership percentage relative to the historic tax credit partnership is almost 100 %. Since ProAssurance has the ability to exert influence over the partnership but does not control it, it is accounted for using the equity method. See further discussion of the entities in which ProAssurance holds passive interests in Note 10.
ProAssurance holds interests in investment fund LPs/LLCs and other equity method investments and LPs/LLCs which are not considered to be investment funds. ProAssurance's ownership percentage relative to three of the LPs/LLCs is greater than 25%, which is expected to be reduced as the funds mature and other investors participate in the funds; these investments had a carrying value of $39.7 million at June 30, 2020 and $41.0 million at December 31, 2019. ProAssurance's ownership percentage relative to the remaining investments and LPs/LLCs is less than 25%; these interests had a carrying value of $230.1 million at June 30, 2020 and $269.3 million at December 31, 2019. ProAssurance does not have the ability to exert control over any of these funds.
34
ProAssurance Corporation and Subsidiaries
Notes to Condensed Consolidated Financial Statements (Unaudited)
June 30, 2020
Equity in Earnings (Loss) of Unconsolidated Subsidiaries
Equity in earnings (loss) of unconsolidated subsidiaries included losses from qualified affordable housing project tax credit partnerships and a historic tax credit partnership. Losses recorded reflect ProAssurance's allocable portion of partnership operating losses. Tax credits reduce income tax expense in the period they are recognized. Losses recorded and tax credits recognized related to ProAssurance's tax credit partnership investments were as follows:
Three Months Ended June 30 | Six Months Ended June 30 | ||||||||||||||
(In thousands) | 2020 | 2019 | 2020 | 2019 | |||||||||||
Qualified affordable housing project tax credit partnerships | |||||||||||||||
Losses recorded | $ | $ | $ | $ | |||||||||||
Tax credits recognized | $ | $ | $ | $ | |||||||||||
Historic tax credit partnership | |||||||||||||||
Losses recorded | $ | $ | $ | $ | |||||||||||
Tax credits recognized | $ | $ | $ | $ | |||||||||||
Due to the consolidated loss before income taxes recognized during the three and six months ended June 30, 2020, the tax credits generated in 2020 from tax credit partnership investments of $4.5 million and $8.9 million, respectively, were deferred and are expected to be utilized in future periods.
Net Realized Investment Gains (Losses)
Realized investment gains and losses are recognized on the first-in, first-out basis. The following table provides detailed information regarding net realized investment gains (losses):
Three Months Ended June 30 | Six Months Ended June 30 | ||||||||||||||
(In thousands) | 2020 | 2019 | 2020 | 2019 | |||||||||||
Total impairment losses: | |||||||||||||||
Corporate debt | $ | ( | ) | $ | $ | ( | ) | $ | ( | ) | |||||
Portion of impairment losses recognized in other comprehensive income before taxes: | |||||||||||||||
Corporate debt | — | ||||||||||||||
Net impairment losses recognized in earnings | ( | ) | ( | ) | ( | ) | |||||||||
Gross realized gains, available-for-sale fixed maturities | |||||||||||||||
Gross realized (losses), available-for-sale fixed maturities | ( | ) | ( | ) | ( | ) | ( | ) | |||||||
Net realized gains (losses), trading fixed maturities | ( | ) | |||||||||||||
Net realized gains (losses), equity investments | ( | ) | |||||||||||||
Net realized gains (losses), other investments | |||||||||||||||
Change in unrealized holding gains (losses), trading fixed maturities | |||||||||||||||
Change in unrealized holding gains (losses), equity investments | ( | ) | ( | ) | |||||||||||
Change in unrealized holding gains (losses), convertible securities, carried at fair value | ( | ) | |||||||||||||
Other | ( | ) | |||||||||||||
Net realized investment gains (losses) | $ | $ | $ | ( | ) | $ | |||||||||
For the three and six months ended June 30, 2020, ProAssurance recognized credit-related impairment losses in earnings of approximately $0.3 million and $1.5 million, respectively, and non-credit impairment losses in OCI of approximately $0.2 million and $0.9 million, respectively. The credit-related impairment losses recognized during the 2020 three- and six- month periods related to corporate bonds in the energy, consumer and financial sectors. Additionally, the 2020 six-month period included credit-related impairment losses related to a corporate bond in the entertainment sector, which was sold during the second quarter of 2020. The non-credit impairment losses recognized during the 2020 three- and six- month periods related to three corporate bonds in the energy and consumer sectors. ProAssurance did not recognize any impairment losses for the three
35
ProAssurance Corporation and Subsidiaries
Notes to Condensed Consolidated Financial Statements (Unaudited)
June 30, 2020
months ended June 30, 2019. For the 2019 six-month period, ProAssurance recognized a nominal amount of both credit-related impairment losses in earnings and non-credit impairment losses in OCI, both of which related to a corporate bond.
ProAssurance recognized $20.0 million of net realized investment gains during the three months ended June 30, 2020 and $8.7 million of net realized investment losses during the six months ended June 30, 2020 driven by changes in fair value on the Company's equity portfolio and convertible securities due to the volatility in the global financial markets related to COVID-19 during the first half of 2020. ProAssurance recognized $9.3 million and $45.9 million of net realized investment gains during the three and six months ended June 30, 2019, respectively. Net realized investment gains for the three months ended June 30, 2019 were driven by realized gains from the sale of equity investments during the period. For the six months ended June 30, 2019, net realized investment gains were driven by unrealized holding gains on the Company's equity portfolio and realized gains from the sale of equity investments during the period.
The following table presents a roll forward of cumulative credit losses recorded in earnings related to impaired debt securities for which a portion of the impairment was recorded in OCI.
Three Months Ended June 30 | Six Months Ended June 30 | ||||||||||||||
(In thousands) | 2020 | 2019 | 2020 | 2019 | |||||||||||
Balance beginning of period | $ | $ | $ | $ | |||||||||||
Additional credit losses recognized during the period, related to securities for which: | |||||||||||||||
No impairment has been previously recognized | |||||||||||||||
Impairment has been previously recognized | |||||||||||||||
Reductions due to: | |||||||||||||||
Securities sold during the period (realized) | ( | ) | ( | ) | |||||||||||
Balance June 30 | $ | $ | $ | $ | |||||||||||
36
ProAssurance Corporation and Subsidiaries
Notes to Condensed Consolidated Financial Statements (Unaudited)
June 30, 2020
4. Income Taxes
For interim periods, ProAssurance generally utilizes the estimated annual effective tax rate method under which the Company determines its provision (benefit) for income taxes based on the current estimate of its annual effective tax rate. For the three months ended March 31, 2020, ProAssurance adopted the discrete effective tax rate method for recording income taxes in the period. The discrete method was applied in the first quarter of 2020 because the application of the estimated annual effective tax rate method was impractical and did not provide a reliable estimate of the annual effective tax rate at that time. Furthermore, ProAssurance believed the use of the discrete effective tax rate method in the first quarter of 2020 was more appropriate than the annual effective tax rate method as minor changes in the Company's estimated ordinary income would have a significant effect on the estimated annual effective tax rate and would result in sizable variations in the customary relationship between income tax expense (benefit) and pretax accounting income (loss). For the six months ended June 30, 2020, ProAssurance reevaluated the use of the discrete effective tax rate method and concluded that a return to the estimated annual effective tax rate method is appropriate given the Company's revised financial projections and ability to provide a reliable estimate of the annual effective tax rate in the current period.
Under the estimated annual effective tax rate method, items which are unusual, infrequent, or that cannot be reliably estimated are considered in the effective tax rate in the period in which the item is included in income, and are referred to as discrete items. In calculating the Company's year-to-date income tax expense (benefit), the Company includes the estimated benefit of tax credits for the year-to-date period based on the most recently available information provided by the tax credit partnerships; the actual amounts of credits provided by the tax credit partnerships may prove to be different than the Company's estimates. The effect of such a difference is recognized in the period identified.
ProAssurance had a receivable for federal and U.K. income taxes carried as a part of other assets of $37.3 million at June 30, 2020 and $8.0 million at December 31, 2019. The liability for unrecognized tax benefits, which is included in the total receivable for federal and U.K. income taxes, was $11.1 million and $5.7 million at June 30, 2020 and December 31, 2019, respectively, which included an accrued liability for interest of approximately $0.7 million and $0.6 million, respectively.
Tax Cuts and Jobs Act
ProAssurance recognized a nominal amount of tax expense related to the GILTI provision of the TCJA during each of the three and six months ended June 30, 2020 and 2019. During the three and six months ended June 30, 2020 and 2019, ProAssurance did not recognize any incremental tax expense related to the BEAT provision of the TCJA. For additional information regarding ProAssurance's accounting for certain provisions of the TCJA, see Note 6 of the Notes to Consolidated Financial Statements in ProAssurance's December 31, 2019 report on Form 10-K.
Coronavirus Aid, Relief and Economic Security Act
In response to COVID-19, the CARES Act was signed into law on March 27, 2020 and contains several provisions for corporations and eases certain deduction limitations originally imposed by the TCJA. The CARES Act, among other things, includes temporary changes regarding the prior and future utilization of NOLs, temporary changes to the prior and future limitations on interest deductions, temporary suspension of certain payment requirements for the employer portion of Social Security taxes and the creation of certain refundable employee retention credits. ProAssurance has an NOL of approximately $34.4 million from the 2019 tax year that will be carried back to the 2014 tax year and is expected to generate a tax refund of approximately $12.0 million. ProAssurance is currently evaluating the other provisions of the CARES Act and how certain elections may impact its financial position and results of operations, if elected.
37
ProAssurance Corporation and Subsidiaries
Notes to Condensed Consolidated Financial Statements (Unaudited)
June 30, 2020
5. Reserve for Losses and Loss Adjustment Expenses
The reserve for losses is established based on estimates of individual claims and actuarially determined estimates of future losses based on ProAssurance’s past loss experience, available industry data and projections as to future claims frequency, severity, inflationary trends and settlement patterns. Estimating the reserve, particularly the reserve appropriate for liability exposures, is a complex process. For a high proportion of the risks insured or reinsured by ProAssurance, claims may be resolved over an extended period of time, often five years or more, and may be subject to litigation. Estimating losses requires ProAssurance to make and revise judgments and assessments regarding multiple uncertainties over an extended period of time. As a result, the reserve estimate may vary considerably from the eventual outcome. The assumptions used in establishing ProAssurance’s reserve are regularly reviewed and updated by management as new data becomes available. Changes to estimates of previously established reserves are included in earnings in the period in which the estimate is changed.
ProAssurance believes that the methods it uses to establish reserves are reasonable and appropriate. Each year, ProAssurance uses internal actuaries to review the reserve for losses of each insurance subsidiary. ProAssurance also engages consulting actuaries to review ProAssurance claims data and provide observations regarding cost trends, rate adequacy and ultimate loss costs. The statutory filings of each insurance company with the insurance regulators must be accompanied by a consulting actuary's certification as to their respective reserves. ProAssurance considers the views of the actuaries as well as other factors, such as premium rates, claims frequency and severity, historical paid and incurred loss development trends, the expected effect of inflation, general economic and social trends and the legal and political environment in establishing the amount of its reserve for losses. As of June 30, 2020, the Company expects there will be impacts to these factors as well as to the timing of loss emergence and ultimate loss ratios for certain coverages it underwrites as a result of COVID-19 and the related economic shutdown; however, the extent to which COVID-19 impacts these factors is highly uncertain and cannot be predicted. The industry is experiencing new conditions, including the postponement of court cases, changes in settlement trends and a significant reduction in economic activity and insured exposure in some classes. ProAssurance's booked reserves as of June 30, 2020 include consideration of these factors, but the duration and degree to which these issues persist, along with potential legislative, regulatory or judicial actions, could result in significant changes to the Company's reserve estimates in future periods.
ProAssurance partitions its reserve by accident year, which is the year in which the claim becomes its liability. For claims-made policies, the insured event generally becomes a liability when the event is first reported to the Company. For occurrence policies, the insured event becomes a liability when the event takes place. For retroactive coverages, the insured event becomes a liability at inception of the underlying contract. As claims are incurred (reported) and claim payments are made, they are aggregated by accident year for analysis purposes. ProAssurance also partitions its reserve by reserve type: case reserves and IBNR reserves. Case reserves are established by the claims department based upon the particular circumstances of each reported claim and represent ProAssurance’s estimate of the future loss costs (often referred to as expected losses) that will be paid on reported claims. Case reserves are decremented as claim payments are made and are periodically adjusted upward or downward as estimates regarding the amount of future losses are revised; a reported loss for an individual claim equates to the case reserve at any point in time plus the claim payments that have been made to date. IBNR reserves represent an estimate, in the aggregate, of future development on losses that have been reported to ProAssurance plus an estimate of losses that have been incurred but not reported.
Development of Prior Accident Years
In addition to setting the initial reserve for the current accident year, each period ProAssurance reassesses the amount of reserve required for prior accident years. The foundation of ProAssurance’s reserve re-estimation process is an actuarial analysis that is performed by both the internal and consulting actuaries. This detailed analysis projects ultimate losses based on partitions which include line of business, geography, coverage layer and accident year. The procedure uses the most representative data for each partition, capturing its unique patterns of development and trends. In all, there are over 200 different partitions of ProAssurance's business for purposes of this analysis. ProAssurance believes that the use of consulting actuaries provides an independent view of the loss data as well as a broader perspective on industry loss trends.
38
ProAssurance Corporation and Subsidiaries
Notes to Condensed Consolidated Financial Statements (Unaudited)
June 30, 2020
Activity in the reserve for losses and loss adjustment expenses is summarized as follows:
(In thousands) | Six Months Ended June 30, 2020 | Six Months Ended June 30, 2019 | Year Ended December 31, 2019 | ||||||||
Balance, beginning of year | $ | $ | $ | ||||||||
Less reinsurance recoverables on unpaid losses and loss adjustment expenses | |||||||||||
Net balance, beginning of year | |||||||||||
Net losses: | |||||||||||
Current year(1)(2) | |||||||||||
Favorable development of reserves established in prior years, net | ( | ) | ( | ) | ( | ) | |||||
Total | |||||||||||
Paid related to: | |||||||||||
Current year | ( | ) | ( | ) | ( | ) | |||||
Prior years | ( | ) | ( | ) | ( | ) | |||||
Total paid | ( | ) | ( | ) | ( | ) | |||||
Net balance, end of period | |||||||||||
Plus reinsurance recoverables on unpaid losses and loss adjustment expenses | |||||||||||
Balance, end of period | $ | $ | $ | ||||||||
(1) Current year net losses for the year ended December 31, 2019 included a PDR of $9.2 million associated with the unearned premium of a large national healthcare account's claims-made policy in the Specialty P&C segment. Current year net losses for the six months ended June 30, 2020 included the amortization of the aforementioned $9.2 million PDR which offsets the impact of the losses incurred associated with the premium earned related to the large national healthcare account's claims-made policy. For additional information regarding the PDR, see Note 7 of the Notes to Consolidated Financial Statements included in ProAssurance's December 31, 2019 Form 10-K.
(2) During the second quarter of 2020, the aforementioned large national healthcare account did not renew on terms offered by the Company and exercised its contractual option to purchase extended reporting endorsement or "tail" coverage. As a result, ProAssurance recognized total current year losses of $60.0 million (assumes a full limit loss) within the Specialty P&C segment for the the six months ended June 30, 2020.
The net favorable loss development recognized in the six months ended June 30, 2020 primarily reflected a lower than anticipated claims severity trend (i.e., the average size of a claim) in the Specialty P&C segment, primarily related to the 2014 through 2018 accident years. The net favorable development also reflected overall favorable trends in claim closing patterns in the Segregated Portfolio Cell Reinsurance and Workers' Compensation Insurance segments, primarily related to the 2016 through 2018 and 2014 through 2016 accident years, respectively.
The net favorable loss development recognized in the six months ended June 30, 2019 primarily reflected a lower than anticipated claims severity trend in the Specialty P&C segment for accident years 2012 through 2015.
The net favorable loss development recognized in the twelve months ended December 31, 2019 primarily reflected overall favorable trends in claim closing patterns in the Workers' Compensation Insurance and Segregated Portfolio Cell Reinsurance segments, largely offset by net unfavorable loss development recognized in the Specialty P&C segment. The net favorable loss development recognized in the Workers' Compensation Insurance segment primarily related to the 2015 and 2016 accident years and the net favorable loss development recognized in the Segregated Portfolio Cell Reinsurance segment primarily related to the 2015 through 2018 accident years. The net unfavorable loss development recognized in the Specialty P&C segment primarily related to accident years 2016 through 2018.
For additional information regarding ProAssurance's reserve for losses, see Note 1 and Note 8 of the Notes to Consolidated Financial Statements included in ProAssurance's December 31, 2019 report on Form 10-K.
39
ProAssurance Corporation and Subsidiaries
Notes to Condensed Consolidated Financial Statements (Unaudited)
June 30, 2020
6. Commitments and Contingencies
ProAssurance is involved in various legal actions related to insurance policies and claims handling including, but not limited to, claims asserted by policyholders. These types of legal actions arise in the Company's ordinary course of business and, in accordance with GAAP for insurance entities, are considered as a part of the Company's loss reserving process, which is described in detail under the heading "Losses and Loss Adjustment Expenses" in the Accounting Policies section in Note 1 of the Notes to Consolidated Financial Statements in ProAssurance's December 31, 2019 Form 10-K. ProAssurance also has other direct actions against the Company unrelated to its claims activity which are evaluated and accounted for as a part of other liabilities. For these corporate legal actions, the Company evaluates each case separately and establishes what it believes is an appropriate reserve based on GAAP guidance related to contingent liabilities. As of June 30, 2020 there were no material reserves established for corporate legal actions.
As a member of Lloyd's, ProAssurance has obligations to Syndicate 1729 and Syndicate 6131 including a Syndicate Credit Agreement and FAL requirements. The Syndicate Credit Agreement is an unconditional revolving credit agreement to the Premium Trust Fund of Syndicate 1729 for the purpose of providing working capital with maximum permitted borrowings of £30.0 million (approximately $37.2 million as of June 30, 2020). The Syndicate Credit Agreement has a maturity date of December 31, 2021 and contains an annual auto-renewal feature which allows for ProAssurance to elect to non-renew if notice is given at least 30 days prior to the next auto-renewal date, which is one year prior to the maturity date. Under the Syndicate Credit Agreement, advances bear interest at 3.8 % annually and may be repaid at any time but are repayable upon demand after December 31, 2021, subject to extension through the auto-renewal feature. As of June 30, 2020, there were no outstanding borrowings under the Syndicate Credit Agreement. ProAssurance provides FAL to support underwriting by Syndicate 1729 and Syndicate 6131 and is comprised of investment securities and cash and cash equivalents deposited with Lloyd's with a total fair value of approximately $137.5 million at June 30, 2020 (see Note 3).
ProAssurance has entered into financial instrument transactions that may present off-balance sheet credit risk or market risk. These transactions include a short-term loan commitment and commitments to provide funding to non-public investment entities. Under the short-term loan commitment, ProAssurance has agreed to advance funds on a 30 day basis to a counterparty provided there is no violation of any condition established in the contract. As of June 30, 2020, ProAssurance had total funding commitments related to non-public investment entities as well as the short-term loan commitment of approximately $213.3 million which included the amount at risk if the full short-term loan is extended and the counterparties default. However, the credit risk associated with the short-term loan commitment is minimal as the counterparties to the contract are highly rated commercial institutions and to-date have been performing in accordance with their contractual obligations. ProAssurance’s expected credit losses associated with this short-term loan commitment were nominal in amount as of June 30, 2020.
ProAssurance entered into an agreement with a company to provide data analytics services for certain product lines within the Company's HCPL book of business. The agreement contains a minimum two year commitment with optional extension features for an annual fee of approximately $4.8 million per year with additional variable quarterly incentive fees based on service utilization metrics prescribed in the contract. ProAssurance incurred operating expenses associated with this agreement of $1.2 million and $2.4 million for the three and six months ended June 30, 2020, respectively, and $1.3 million and $2.3 million for the same respective periods of 2019. As of June 30, 2020, the remaining commitment under this agreement was between $1.2 million and $1.6 million.
ProAssurance has entered into a definitive agreement to acquire NORCAL, an underwriter of medical professional liability insurance, subject to the demutualization of NORCAL Mutual, NORCAL's ultimate controlling party. Both companies are targeting to close the transaction either by the end of 2020 or early 2021. Subject to NORCAL’s conversion from a mutual company to a stock company, ProAssurance has agreed to acquire 100% of the converted company in exchange for base consideration of $450 million and contingent consideration of up to an additional $150 million depending on the development of NORCAL’s ultimate losses over a three-year period following December 31, 2020. The actual final cost of the transaction could vary due to the ability of NORCAL’s policyholders to elect forms of consideration other than stock in the demutualization transaction as provided by California law. Those alternative consideration options are tied to an appraised value of NORCAL as determined by the California insurance regulator rather than the price per share ProAssurance has agreed to pay for 100% of NORCAL assuming that all policyholders elect to receive stock. Further, the transaction is subject to a number of closing conditions, including a maximum threshold for one of the alternative forms of consideration in the demutualization, a minimum threshold for the number of NORCAL shares tendered to ProAssurance, and various required regulatory approvals. The Agreement and Plan of Acquisition was previously filed as Exhibit 10.1 to ProAssurance's March 31, 2020 report on Form 10-Q.
40
ProAssurance Corporation and Subsidiaries
Notes to Condensed Consolidated Financial Statements (Unaudited)
June 30, 2020
7. Leases
ProAssurance is involved in a number of operating leases primarily for office facilities. Office facility leases have remaining lease terms ranging from one year to twelve years ; some of which include options to extend the leases for up to ten years , and some of which include an option to terminate the lease within one year. ProAssurance subleases certain office facilities to third parties and classifies these leases as operating leases.
The following table provides a summary of the components of net lease expense as well as the reporting location in the Condensed Consolidated Statements of Income and Comprehensive Income for the three and six months ended June 30, 2020 and 2019.
(In thousands) | Location in the Condensed Consolidated Statements of Income and Comprehensive Income | Three Months Ended June 30 | Six Months Ended June 30 | |||||||||||
2020 | 2019 | 2020 | 2019 | |||||||||||
Operating lease expense (1) | Operating expense | $ | $ | $ | $ | |||||||||
Sublease income (2) | Other income | ( | ) | ( | ) | ( | ) | ( | ) | |||||
Net lease expense | $ | $ | $ | $ | ||||||||||
(1) Includes short-term lease costs and variable lease costs, if applicable. For the three and six months ended June 30, 2020 and 2019, no short-term lease costs were recognized and variable lease costs were nominal in amount.
(2) Sublease income excludes rental income from owned properties of $0.6 million and $1.2 million during each of the three and six months ended June 30, 2020 and 2019, respectively, which is included in other income. See “Item 2. Properties” in ProAssurance's December 31, 2019 report on Form 10-K for a listing of currently owned properties.
The following table provides supplemental lease information for operating leases on the Condensed Consolidated Balance Sheet as of June 30, 2020 and December 31, 2019.
($ in thousands) | June 30, 2020 | December 31, 2019 | ||||
Operating lease ROU assets | $ | $ | ||||
Operating lease liabilities | $ | $ | ||||
Weighted-average remaining lease term | ||||||
Weighted-average discount rate | % | % | ||||
The following table provides supplemental lease information for the Condensed Consolidated Statements of Cash Flows for the six months ended June 30, 2020 and 2019.
Six Months Ended June 30 | ||||||
(In thousands) | 2020 | 2019 | ||||
Cash paid for amounts included in the measurement of lease liabilities: | ||||||
Operating cash flows from operating leases | $ | $ | ||||
41
ProAssurance Corporation and Subsidiaries
Notes to Condensed Consolidated Financial Statements (Unaudited)
June 30, 2020
The following table is a schedule of remaining future minimum lease payments for operating leases that had an initial or remaining non-cancellable lease term in excess of one year as of June 30, 2020. Operating lease payments exclude $0.5 million of future minimum lease payments for one lease signed but not yet commenced as of June 30, 2020. This lease will commence in the first quarter of 2021 with a lease term of approximately seven years .
(In thousands) | |||
2020 | $ | ||
2021 | |||
2022 | |||
2023 | |||
2024 | |||
Thereafter | |||
Total future minimum lease payments | |||
Less: Imputed interest | |||
Total operating lease liabilities | $ | ||
8. Debt
ProAssurance’s outstanding debt consisted of the following:
(In thousands) | June 30, 2020 | December 31, 2019 | |||||
Senior Notes due 2023, unsecured, interest at 5.3% annually | $ | $ | |||||
Mortgage Loans, outstanding borrowings are secured by first priority liens on two office buildings, and bear an interest rate of three-month LIBOR plus 1.325% (1.70% and 3.21%, respectively) determined on a quarterly basis. | |||||||
Total principal | |||||||
Less unamortized debt issuance costs | |||||||
Debt less unamortized debt issuance costs | $ | $ | |||||
Revolving Credit Agreement
ProAssurance has a Revolving Credit Agreement, which expires November 2024, that may be used for general corporate purposes, including, but not limited to, short-term working capital, share repurchases as authorized by the Board and support for other activities. ProAssurance's Revolving Credit Agreement permits borrowings up to $250 million, and has available a $50 million accordion feature which, if successfully subscribed, would expand the permitted borrowings to a maximum of $300 million. As of June 30, 2020 and December 31, 2019, there were no outstanding borrowings on the Revolving Credit Agreement.
Covenant Compliance
There are no financial covenants associated with the Senior Notes due 2023.
The Revolving Credit Agreement contains customary representations, covenants and events constituting default, and remedies for default. The Revolving Credit Agreement also defines financial covenants regarding permitted leverage ratios. ProAssurance is currently in compliance with all covenants of the Revolving Credit Agreement.
The Mortgage Loans contain customary representations, covenants and events constituting default, and remedies for default. The Mortgage Loans also define a financial covenant regarding a permitted leverage ratio for each of the two ProAssurance subsidiaries that entered into the Mortgage Loans. ProAssurance's subsidiaries are currently in compliance with the financial covenant of the Mortgage Loans.
Additional Information
For additional information regarding ProAssurance's debt, see Note 11 of the Notes to Consolidated Financial Statements included in ProAssurance's December 31, 2019 report on Form 10-K.
42
ProAssurance Corporation and Subsidiaries
Notes to Condensed Consolidated Financial Statements (Unaudited)
June 30, 2020
9. Shareholders’ Equity
At June 30, 2020 and December 31, 2019, ProAssurance had 100 million shares of authorized common stock and 50 million shares of authorized preferred stock. The Board has the authority to determine provisions for the issuance of preferred shares, including the number of shares to be issued, the designations, powers, preferences and rights, and the qualifications, limitations or restrictions of such shares. To date, the Board has not approved the issuance of preferred stock.
ProAssurance declared cash dividends of $0.31 and $0.05 per share during the first and second quarters of 2020, respectively, and $0.31 per share during each of the first two quarters of 2019. Dividends declared during the 2020 and 2019 six-month periods totaled $19.4 million and $33.3 million, respectively. Given the Company’s current earnings profile, the effects that underlying conditions in the broader insurance marketplace continue to have on the Company’s results and the uncertainties introduced by the COVID-19 pandemic, the Board made the decision to reduce the quarterly cash dividend from $0.31 per share to $0.05 per share, beginning with the dividend declared for the second quarter of 2020. Any decision to pay future cash dividends is subject to the Board’s final determination after a comprehensive review of financial performance, future expectations and other factors deemed relevant by the Board.
At June 30, 2020, Board authorizations for the repurchase of common shares or the retirement of outstanding debt of $110 million remained available for use. ProAssurance did no t repurchase any common shares during the six months ended June 30, 2020 and 2019.
Share-based compensation expense and related tax benefits were as follows:
Three Months Ended June 30 | Six Months Ended June 30 | ||||||||||||||
(In thousands) | 2020 | 2019 | 2020 | 2019 | |||||||||||
Share-based compensation expense | $ | $ | $ | $ | |||||||||||
Related tax benefits | $ | $ | $ | $ | |||||||||||
ProAssurance awarded approximately 112,000 restricted share units and 39,000 base performance share units to employees in February 2020. The fair value of each unit awarded was estimated at $29.18 , equal to the market value of a ProAssurance common share on the date of grant less the estimated present value of expected dividends during the vesting period. The majority of awards are charged to expense as an increase to additional paid-in capital over the service period (generally the vesting period) associated with the award. However, a nominal amount of awards are recorded as a liability as they are structured to be settled in cash. Restricted share units and performance share units vest in their entirety at the end of a three-year period following the grant date based on a continuous service requirement and, for performance share units, achievement of a performance objective. Partial vesting is permitted for retirees. For equity classified awards, a ProAssurance common share is issued for each unit once vesting requirements are met, except that units sufficient to satisfy required tax withholdings are paid in cash. The number of common shares issued for performance share units varies from 50 % to 200 % of base awards depending upon the degree to which stated performance objectives are achieved. ProAssurance issued approximately 47,000 common shares to employees in February 2020 related to restricted share units granted in 2017. Liability classified awards, which are nominal in amount, are settled in cash at the end of the vesting period.
Other Comprehensive Income (Loss) and Accumulated Other Comprehensive Income (Loss)
The following tables provide a detailed breakout of the components of AOCI and the amounts reclassified from AOCI to net income (loss). The tax effects of all amounts in the tables below, except for an immaterial amount of unrealized gains and losses on available-for-sale securities held at the Company's U.K. subsidiary, were computed using the enacted U.S. federal corporate tax rate of 21%. For the three and six months ended June 30, 2020, OCI included a deferred tax expense of $16.8 million and $5.8 million, respectively, as compared to $6.2 million and $13.0 million for the same respective periods of 2019.
43
ProAssurance Corporation and Subsidiaries
Notes to Condensed Consolidated Financial Statements (Unaudited)
June 30, 2020
The changes in the balance of each component of AOCI for the three and six months ended June 30, 2020 and 2019 were as follows:
(In thousands) | Unrealized Investment Gains (Losses) | Non-credit Impairments | Unrecognized Change in Defined Benefit Plan Liabilities* | Accumulated Other Comprehensive Income (Loss) | |||||||||||
Balance April 1, 2020 | $ | ( | ) | $ | ( | ) | $ | ( | ) | $ | ( | ) | |||
OCI, before reclassifications, net of tax | ( | ) | |||||||||||||
Amounts reclassified from AOCI, net of tax | ( | ) | ( | ) | |||||||||||
Net OCI, current period | |||||||||||||||
Balance at June 30, 2020 | $ | $ | ( | ) | $ | ( | ) | $ | |||||||
(In thousands) | Unrealized Investment Gains (Losses) | Non-credit Impairments | Unrecognized Change in Defined Benefit Plan Liabilities* | Accumulated Other Comprehensive Income (Loss) | |||||||||||
Balance December 31, 2019 | $ | $ | ( | ) | $ | ( | ) | $ | |||||||
OCI, before reclassifications, net of tax | ( | ) | |||||||||||||
Amounts reclassified from AOCI, net of tax | ( | ) | ( | ) | |||||||||||
Net OCI, current period | ( | ) | |||||||||||||
Balance at June 30, 2020 | $ | $ | ( | ) | $ | ( | ) | $ | |||||||
(In thousands) | Unrealized Investment Gains (Losses) | Non-credit Impairments | Unrecognized Change in Defined Benefit Plan Liabilities* | Accumulated Other Comprehensive Income (Loss) | |||||||||||
Balance April 1, 2019 | $ | $ | ( | ) | $ | ( | ) | $ | |||||||
OCI, before reclassifications, net of tax | ( | ) | |||||||||||||
Amounts reclassified from AOCI, net of tax | ( | ) | ( | ) | |||||||||||
Net OCI, current period | ( | ) | |||||||||||||
Balance June 30, 2019 | $ | $ | ( | ) | $ | ( | ) | $ | |||||||
(In thousands) | Unrealized Investment Gains (Losses) | Non-credit Impairments | Unrecognized Change in Defined Benefit Plan Liabilities* | Accumulated Other Comprehensive Income (Loss) | |||||||||||
Balance December 31, 2018 | $ | ( | ) | $ | ( | ) | $ | ( | ) | $ | ( | ) | |||
OCI, before reclassifications, net of tax | ( | ) | ( | ) | |||||||||||
Amounts reclassified from AOCI, net of tax | ( | ) | ( | ) | |||||||||||
Net OCI, current period | ( | ) | ( | ) | |||||||||||
Balance June 30, 2019 | $ | $ | ( | ) | $ | ( | ) | $ | |||||||
* Represents the reestimation of the defined benefit plan liability assumed in the Eastern acquisition. The defined benefit plan is frozen as to the earnings of additional benefits and the benefit plan liability is reestimated annually. | |||||||||||||||
44
ProAssurance Corporation and Subsidiaries
Notes to Condensed Consolidated Financial Statements (Unaudited)
June 30, 2020
10. Variable Interest Entities
ProAssurance holds passive interests in a number of entities that are considered to be VIEs under GAAP guidance. ProAssurance's VIE interests principally consist of interests in LPs/LLCs formed for the purpose of achieving diversified equity and debt returns. ProAssurance's VIE interests, carried as a part of investment in unconsolidated subsidiaries, totaled $277.8 million at June 30, 2020 and $309.0 million at December 31, 2019.
ProAssurance does not have power over the activities that most significantly impact the economic performance of these VIEs and thus is not the primary beneficiary. Investments in entities where ProAssurance holds a greater than minor interest but does not hold a controlling interest are accounted for using the equity method. Therefore, ProAssurance has not consolidated these VIEs. ProAssurance’s involvement with each VIE is limited to its direct ownership interest in the VIE. Except for the funding commitments disclosed in Note 6, ProAssurance has no arrangements with any of the VIEs to provide other financial support to or on behalf of the VIE. At June 30, 2020, ProAssurance’s maximum loss exposure relative to these investments was limited to the carrying value of ProAssurance’s investment in the VIE.
11. Earnings (Loss) Per Share
Diluted weighted average shares is calculated as basic weighted average shares plus the effect, calculated using the treasury stock method, of assuming that restricted share units, performance share units and purchase match units have vested. The following table provides a reconciliation between the Company's basic weighted average number of common shares outstanding to its diluted weighted average number of common shares outstanding:
(In thousands, except per share data) | Three Months Ended June 30 | Six Months Ended June 30 | |||||||||||||
2020 | 2019 | 2020 | 2019 | ||||||||||||
Weighted average number of common shares outstanding, basic | |||||||||||||||
Dilutive effect of securities: | |||||||||||||||
Restricted Share Units | |||||||||||||||
Performance Share Units | |||||||||||||||
Purchase Match Units | |||||||||||||||
Weighted average number of common shares outstanding, diluted | |||||||||||||||
Effect of dilutive shares on earnings (loss) per share | $ | $ | $ | $ | |||||||||||
The diluted weighted average number of common shares outstanding for the three and six months ended June 30, 2020 excludes approximately 180,000 and 90,000 , respectively, common share equivalents issuable under the Company's stock compensation plans, as their effect would be antidilutive. There were no antidilutive common share equivalents for the three and six months ended June 30, 2019.
Dilutive common share equivalents are reflected in the earnings (loss) per share calculation while antidilutive common share equivalents are not reflected in the earnings (loss) per share calculation. For the three and six months ended June 30, 2020, all incremental common share equivalents were not included in the computation of diluted earnings (loss) per share because to do so would have been antidilutive.
45
ProAssurance Corporation and Subsidiaries
Notes to Condensed Consolidated Financial Statements (Unaudited)
June 30, 2020
12. Segment Information
ProAssurance's segments are based on the Company's internal management reporting structure for which financial results are regularly evaluated by the Company's CODM to determine resource allocation and assess operating performance. The Company continually assesses its internal management reporting structure and information evaluated by its CODM to determine whether any changes have occurred that would impact its segment reporting structure. The Company operates in five segments that are organized around the nature of the products and services provided: Specialty P&C, Workers' Compensation Insurance, Segregated Portfolio Cell Reinsurance, Lloyd's Syndicates and Corporate. A description of each of ProAssurance's five operating and reportable segments follows.
Specialty P&C includes professional liability insurance and medical technology liability insurance. Professional liability insurance is primarily comprised of medical professional liability products offered to healthcare providers and institutions. The Company also offers, to a lesser extent, professional liability insurance to attorneys and their firms. Medical technology liability insurance is offered to medical technology and life sciences companies that manufacture or distribute products including entities conducting human clinical trials. In addition, the Company also offers custom alternative risk solutions including loss portfolio transfers and captive cell programs for healthcare professional liability insureds. For the alternative market captive cell programs, the Specialty P&C segment cedes either all or a portion of the premium to certain SPCs in the Company's Segregated Portfolio Cell Reinsurance segment.
Workers' Compensation Insurance includes workers' compensation products provided to employers with 1,000 or fewer employees. The segment's products include guaranteed cost policies, policyholder dividend policies, retrospectively-rated policies, deductible polices and alternative market solutions. Alternative market products include program design, fronting, claims administration, risk management, SPC rental, asset management and SPC management services. Alternative market program premiums are 100 % ceded to either SPCs in the Company's Segregated Portfolio Cell Reinsurance segment or, to a limited extent, to a captive insurer unaffiliated with ProAssurance.
Segregated Portfolio Cell Reinsurance reflects the net operating results (underwriting profit or loss, plus investment results, net of U.S. federal income taxes) of SPCs at Inova Re and Eastern Re, the Company's Cayman Islands SPC operations. Each SPC is owned, fully or in part, by an agency, group or association, and the operating results of the SPCs are due to the participants of that cell. ProAssurance participates to a varying degree in the results of selected SPCs. SPC operating results attributable to external cell participants are reflected as SPC dividend expense (income) in the Segregated Portfolio Cell Reinsurance segment and in ProAssurance's Condensed Consolidated Statements of Income and Comprehensive Income. In addition, the Segregated Portfolio Cell Reinsurance segment includes the SPC investment results as the investments are solely for the benefit of the cell participants, and investment results attributable to external cell participants are reflected in the SPC dividend expense (income). The SPCs assume workers' compensation insurance, healthcare professional liability insurance or a combination of the two from the Company's Workers' Compensation Insurance and Specialty P&C segments.
Lloyd's Syndicates includes operating results from ProAssurance's participation in Lloyd's of London Syndicate 1729 and its 100% participation in Syndicate 6131, which is an SPA that underwrites on a quota share basis with Syndicate 1729. The results of this segment are normally reported on a quarter lag, except when information is available that is material to the current period. Furthermore, investment results associated with the majority of investment assets solely allocated to Lloyd's Syndicate operations and certain U.S. paid administrative expenses are reported concurrently as that information is available on an earlier time frame. For the 2020 underwriting year, ProAssurance decreased its participation in the operating results of Syndicate 1729 to 29 % from 61 % ; however, due to the quarter lag these changes were not reflected in the Company's results until the second quarter of 2020. Syndicate 1729 underwrites risks over a wide range of property and casualty insurance and reinsurance lines in both the U.S. and international markets. Syndicate 6131 focuses on contingency and specialty property business, also within the U.S. and international markets.
Corporate includes ProAssurance's investment operations, other than those reported in the Company's Segregated Portfolio Cell Reinsurance and Lloyd's Syndicates segments, interest expense and U.S. income taxes. The segment also includes non-premium revenues generated outside of the Company's insurance entities and corporate expenses.
The accounting policies of the segments are the same as those described in Note 1 of the Notes to Consolidated Financial Statements in ProAssurance’s December 31, 2019 report on Form 10-K and Note 1 herein. ProAssurance evaluates the performance of its Specialty P&C and Workers' Compensation Insurance segments based on before tax underwriting profit or loss, which excludes investment performance. ProAssurance evaluates the performance of its Segregated Portfolio Cell Reinsurance segment based on operating profit or loss, which includes investment results of investment assets solely allocated to SPC operations, net of U.S. federal income taxes. Performance of the Lloyd's Syndicates segment is evaluated based on operating profit or loss, which includes investment results of investment assets solely allocated to Lloyd's Syndicate operations, net of U.K. income tax expense. Performance of the Corporate segment is evaluated based on the contribution made to
46
ProAssurance Corporation and Subsidiaries
Notes to Condensed Consolidated Financial Statements (Unaudited)
June 30, 2020
consolidated after-tax results. ProAssurance accounts for inter-segment transactions as if the transactions were to third parties at current market prices. Assets are not allocated to segments because investments, other than the investments discussed above that are solely allocated to the Segregated Portfolio Cell Reinsurance and Lloyd's Syndicates segments, and other assets are not managed at the segment level.
Financial results by segment were as follows:
Three Months Ended June 30, 2020 | |||||||||||||||||||||||||||
(In thousands) | Specialty P&C | Workers' Compensation Insurance | Segregated Portfolio Cell Reinsurance | Lloyd's Syndicates | Corporate | Inter-segment Eliminations | Consolidated | ||||||||||||||||||||
Net premiums earned | $ | $ | $ | $ | $ | $ | $ | ||||||||||||||||||||
Net investment income | |||||||||||||||||||||||||||
Equity in earnings (loss) of unconsolidated subsidiaries | ( | ) | ( | ) | |||||||||||||||||||||||
Net realized gains (losses) | |||||||||||||||||||||||||||
Other income (expense)(1) | ( | ) | |||||||||||||||||||||||||
Net losses and loss adjustment expenses | ( | ) | ( | ) | ( | ) | ( | ) | ( | ) | |||||||||||||||||
Underwriting, policy acquisition and operating expenses(1) | ( | ) | ( | ) | ( | ) | ( | ) | ( | ) | ( | ) | |||||||||||||||
SPC U.S. federal income tax expense(2) | ( | ) | ( | ) | |||||||||||||||||||||||
SPC dividend (expense) income | ( | ) | ( | ) | |||||||||||||||||||||||
Interest expense | ( | ) | ( | ) | |||||||||||||||||||||||
Income tax benefit (expense) | |||||||||||||||||||||||||||
Segment operating results | $ | ( | ) | $ | $ | $ | $ | $ | $ | ( | ) | ||||||||||||||||
Significant non-cash items: | |||||||||||||||||||||||||||
Depreciation and amortization, net of accretion | $ | $ | $ | $ | $ | $ | $ | ||||||||||||||||||||
Six Months Ended June 30, 2020 | |||||||||||||||||||||||||||
(In thousands) | Specialty P&C | Workers' Compensation Insurance | Segregated Portfolio Cell Reinsurance | Lloyd's Syndicates | Corporate | Inter-segment Eliminations | Consolidated | ||||||||||||||||||||
Net premiums earned | $ | $ | $ | $ | $ | $ | $ | ||||||||||||||||||||
Net investment income | |||||||||||||||||||||||||||
Equity in earnings (loss) of unconsolidated subsidiaries | ( | ) | ( | ) | |||||||||||||||||||||||
Net realized gains (losses) | ( | ) | ( | ) | ( | ) | |||||||||||||||||||||
Other income (expense)(1) | ( | ) | ( | ) | |||||||||||||||||||||||
Net losses and loss adjustment expenses | ( | ) | ( | ) | ( | ) | ( | ) | ( | ) | |||||||||||||||||
Underwriting, policy acquisition and operating expenses(1) | ( | ) | ( | ) | ( | ) | ( | ) | ( | ) | ( | ) | |||||||||||||||
SPC U.S. federal income tax expense(2) | ( | ) | ( | ) | |||||||||||||||||||||||
SPC dividend (expense) income | ( | ) | ( | ) | |||||||||||||||||||||||
Interest expense | ( | ) | ( | ) | |||||||||||||||||||||||
Income tax benefit (expense) | |||||||||||||||||||||||||||
Segment operating results | $ | ( | ) | $ | $ | $ | ( | ) | $ | $ | $ | ( | ) | ||||||||||||||
Significant non-cash items: | |||||||||||||||||||||||||||
Depreciation and amortization, net of accretion | $ | $ | $ | $ | $ | $ | $ | ||||||||||||||||||||
47
ProAssurance Corporation and Subsidiaries
Notes to Condensed Consolidated Financial Statements (Unaudited)
June 30, 2020
Three Months Ended June 30, 2019 | |||||||||||||||||||||||||||
(In thousands) | Specialty P&C | Workers' Compensation Insurance | Segregated Portfolio Cell Reinsurance | Lloyd's Syndicates | Corporate | Inter-segment Eliminations | Consolidated | ||||||||||||||||||||
Net premiums earned | $ | $ | $ | $ | $ | $ | $ | ||||||||||||||||||||
Net investment income | |||||||||||||||||||||||||||
Equity in earnings (loss) of unconsolidated subsidiaries | ( | ) | ( | ) | |||||||||||||||||||||||
Net realized gains (losses) | ( | ) | |||||||||||||||||||||||||
Other income (expense)(1) | ( | ) | |||||||||||||||||||||||||
Net losses and loss adjustment expenses | ( | ) | ( | ) | ( | ) | ( | ) | ( | ) | |||||||||||||||||
Underwriting, policy acquisition and operating expenses(1) | ( | ) | ( | ) | ( | ) | ( | ) | ( | ) | ( | ) | |||||||||||||||
SPC U.S. federal income tax expense(2) | |||||||||||||||||||||||||||
SPC dividend (expense) income | |||||||||||||||||||||||||||
Interest expense | ( | ) | ( | ) | |||||||||||||||||||||||
Income tax benefit (expense) | ( | ) | |||||||||||||||||||||||||
Segment operating results | $ | ( | ) | $ | $ | $ | ( | ) | $ | $ | $ | ||||||||||||||||
Significant non-cash items: | |||||||||||||||||||||||||||
Depreciation and amortization, net of accretion | $ | $ | $ | ( | ) | $ | ( | ) | $ | $ | $ | ||||||||||||||||
Six Months Ended June 30, 2019 | |||||||||||||||||||||||||||
(In thousands) | Specialty P&C | Workers' Compensation Insurance | Segregated Portfolio Cell Reinsurance | Lloyd's Syndicates | Corporate | Inter-segment Eliminations | Consolidated | ||||||||||||||||||||
Net premiums earned | $ | $ | $ | $ | $ | $ | $ | ||||||||||||||||||||
Net investment income | |||||||||||||||||||||||||||
Equity in earnings (loss) of unconsolidated subsidiaries | ( | ) | ( | ) | |||||||||||||||||||||||
Net realized gains (losses) | |||||||||||||||||||||||||||
Other income (expense)(1) | ( | ) | ( | ) | |||||||||||||||||||||||
Net losses and loss adjustment expenses | ( | ) | ( | ) | ( | ) | ( | ) | ( | ) | |||||||||||||||||
Underwriting, policy acquisition and operating expenses(1) | ( | ) | ( | ) | ( | ) | ( | ) | ( | ) | ( | ) | |||||||||||||||
SPC U.S. federal income tax expense(2) | |||||||||||||||||||||||||||
SPC dividend (expense) income | |||||||||||||||||||||||||||
Interest expense | ( | ) | ( | ) | |||||||||||||||||||||||
Income tax benefit (expense) | ( | ) | ( | ) | |||||||||||||||||||||||
Segment operating results | $ | ( | ) | $ | $ | $ | ( | ) | $ | $ | $ | ||||||||||||||||
Significant non-cash items: | |||||||||||||||||||||||||||
Depreciation and amortization, net of accretion | $ | $ | $ | $ | ( | ) | $ | $ | $ | ||||||||||||||||||
(1) Certain fees for services provided to the SPCs at Inova Re and Eastern Re are recorded as expenses within the Segregated Portfolio Cell Reinsurance segment and as other income within the Workers' Compensation Insurance segment. These fees are primarily SPC rental fees and are eliminated between segments in consolidation. | |||||||||||||||||||||||||||
(2) Represents the provision for U.S. federal income taxes for SPCs at Inova Re, which have elected to be taxed as a U.S. corporation under Section 953(d) of the Internal Revenue Code. U.S. federal income taxes are included in the total SPC net operating results and are paid by the individual SPCs. | |||||||||||||||||||||||||||
48
ProAssurance Corporation and Subsidiaries
Notes to Condensed Consolidated Financial Statements (Unaudited)
June 30, 2020
The following table provides detailed information regarding ProAssurance's gross premiums earned by product as well as a reconciliation to net premiums earned. All gross premiums earned are from external customers except as noted. ProAssurance's insured risks are primarily within the U.S.
Three Months Ended June 30 | Six Months Ended June 30 | ||||||||||||||
(In thousands) | 2020 | 2019 | 2020 | 2019 | |||||||||||
Specialty P&C Segment | |||||||||||||||
Gross premiums earned: | |||||||||||||||
HCPL | $ | $ | $ | $ | |||||||||||
Small Business Unit | |||||||||||||||
Medical Technology Liability | |||||||||||||||
Other | |||||||||||||||
Ceded premiums earned | ( | ) | ( | ) | ( | ) | ( | ) | |||||||
Segment net premiums earned | |||||||||||||||
Workers' Compensation Insurance Segment | |||||||||||||||
Gross premiums earned: | |||||||||||||||
Traditional business | |||||||||||||||
Alternative market business | |||||||||||||||
Ceded premiums earned | ( | ) | ( | ) | ( | ) | ( | ) | |||||||
Segment net premiums earned | |||||||||||||||
Segregated Portfolio Cell Reinsurance Segment | |||||||||||||||
Gross premiums earned: | |||||||||||||||
Workers' compensation(1) | |||||||||||||||
HCPL(2) | |||||||||||||||
Other | |||||||||||||||
Ceded premiums earned | ( | ) | ( | ) | ( | ) | ( | ) | |||||||
Segment net premiums earned | |||||||||||||||
Lloyd's Syndicates Segment | |||||||||||||||
Gross premiums earned: | |||||||||||||||
Property and casualty(3) | |||||||||||||||
Ceded premiums earned | ( | ) | ( | ) | ( | ) | ( | ) | |||||||
Segment net premiums earned | |||||||||||||||
Consolidated net premiums earned | $ | $ | $ | $ | |||||||||||
(1) Premium for all periods is assumed from the Workers' Compensation Insurance segment.
(2) Premium for all periods is assumed from the Specialty P&C segment.
(3) Includes a nominal amount of premium assumed from the Specialty P&C segment for the six months ended June 30, 2019.
49
ITEM 2. MANAGEMENT’S DISCUSSION AND ANALYSIS OF FINANCIAL CONDITION AND RESULTS OF OPERATIONS.
The following discussion should be read in conjunction with the Condensed Consolidated Financial Statements and Notes to those statements which accompany this report. Throughout the discussion we use certain terms and abbreviations, which can be found in the Glossary of Terms and Acronyms at the beginning of this report. In addition, a glossary of insurance terms and phrases is available on the investor section of our website. Throughout the discussion, references to "ProAssurance," "PRA," "Company," "we," "us" and "our" refer to ProAssurance Corporation and its consolidated subsidiaries. The discussion contains certain forward-looking information that involves significant risks, assumptions and uncertainties. As discussed under the heading "Caution Regarding Forward-Looking Statements," our actual financial condition and operating results could differ significantly from these forward-looking statements.
ProAssurance Overview
ProAssurance Corporation is a holding company for property and casualty insurance companies. Our wholly owned insurance subsidiaries provide professional liability insurance, liability insurance for medical technology and life sciences risks and workers' compensation insurance. We also provide capital to Syndicate 1729 and are the sole (100%) capital provider for Syndicate 6131 at Lloyd's of London.
We operate in five segments which are based on our internal management reporting structure for which financial results are regularly evaluated by our CODM to determine resource allocation and assess operating performance. Descriptions of ProAssurance's five operating and reportable segments are as follows:
• | Specialty P&C - This segment includes our professional liability business and medical technology liability business. Our professional liability insurance is primarily comprised of medical professional liability products offered to healthcare providers and institutions. We also offer, to a lesser extent, professional liability insurance to attorneys and their firms. Medical technology liability insurance is offered to medical technology and life sciences companies that manufacture or distribute products including entities conducting human clinical trials. We also offer custom alternative risk solutions including loss portfolio transfers, assumed reinsurance and captive cell programs for healthcare professional liability insureds. For our alternative market captive cell programs, we cede either all or a portion of the premium to certain SPCs in our Segregated Portfolio Cell Reinsurance segment. |
• | Workers' Compensation Insurance - This segment includes our workers' compensation insurance business which is provided primarily to employers with 1,000 or fewer employees. Our workers' compensation products include guaranteed cost policies, policyholder dividend policies, retrospectively-rated policies, deductible policies and alternative market solutions. Alternative market program premiums are 100% ceded to either SPCs in our Segregated Portfolio Cell Reinsurance segment or, to a limited extent, an unaffiliated captive insurer. |
• | Segregated Portfolio Cell Reinsurance - This segment includes the operating results (underwriting profit or loss, plus investment results, net of U.S. federal income taxes) of SPCs at Inova Re and Eastern Re, our Cayman Islands SPC operations. Each SPC is owned, fully or in part, by an agency, group or association, and the operating results of the SPCs are attributable to the participants of that cell. We participate to a varying degree in the results of selected SPCs and, for the SPCs in which we participate, our participation interest ranges from a low of 20% to a high of 85%. SPC operating results attributable to external cell participants are reflected as an SPC dividend expense (income) in our Segregated Portfolio Cell Reinsurance segment. The SPCs assume workers' compensation insurance, healthcare professional liability insurance or a combination of the two from our Workers' Compensation Insurance and Specialty P&C segments. |
• | Lloyd's Syndicates - This segment includes the operating results from our participation in Lloyd's of London Syndicate 1729 and our 100% participation in Syndicate 6131, which is an SPA that underwrites on a quota share basis with Syndicate 1729. The results of this segment are normally reported on a quarter lag, except when information is available that is material to the current period. To reduce our exposure and the associated earnings volatility, we decreased our participation in the operating results of Syndicate 1729 for the 2020 underwriting year to 29% from 61%; however, due to the quarter lag, these changes were not reflected in our results until the second quarter of 2020. Syndicate 1729 underwrites risks over a wide range of property and casualty insurance and reinsurance lines in both the U.S. and international markets while Syndicate 6131 focuses on contingency and specialty property business, also within the U.S. and international markets. |
• | Corporate - This segment includes our investment operations, other than those reported in our Segregated Portfolio Cell Reinsurance and Lloyd's Syndicates segments, interest expense and U.S. income taxes. This segment also includes non-premium revenues generated outside of our insurance entities and corporate expenses. |
Additional information regarding our segments is included in Note 12 of the Notes to Condensed Consolidated Financial Statements and in the Segment Operating Results sections that follow.
50
Regulatory Environment
The primary regulations and legislations that impact or could have a potential impact on our Company are described in "Item 1, Insurance Regulatory Matters" in our December 31, 2019 report on Form 10-K. Other than as described below, there have been no material changes to the "Insurance Regulatory Matters" section in Part 1, Item 1 of ProAssurance's December 31, 2019 report on Form 10-K.
COVID-19
In response to COVID-19, the federal government and a number of states have introduced or adopted legislation to address issues related to the pandemic. The PREP Act was amended on March 27, 2020 to extend liability immunity for activities related to medical countermeasures against COVID-19, except for claims involving "willful misconduct" as defined in the PREP Act. Certain states have enacted legislation changes designed to effectively expand workers’ compensation coverage by establishing a presumption of compensability for certain types of workers. Other states are considering similar measures. Depending on the number of states that institute such changes and the terms of the changes, as well as the impact of the amendment to the PREP Act and any related legal challenges, we may experience increases in claims frequency and severity for our healthcare professional liability and workers’ compensation books of business, which could have an effect on our financial condition, results of operations and cash flows.
Furthermore, we are closely monitoring the impact of potential legislation or court decisions that could retroactively require insurers to extend certain insurance to cover COVID-19 claims, even if the original contract excluded the cover of communicable diseases as is typical in certain policies. These actions could result in a significant increase in claim frequency and severity due to an unintended increase in exposure for Syndicate 1729 and 6131 which could have an effect on our financial condition, results of operations and cash flows given our participation in those Syndicates.
Critical Accounting Estimates
Our Condensed Consolidated Financial Statements are prepared in conformity with GAAP. Preparation of these financial statements requires us to make estimates and assumptions that affect the amounts we report on those statements. We evaluate these estimates and assumptions on an ongoing basis based on current and historical developments, market conditions, industry trends and other information that we believe to be reasonable under the circumstances. We can make no assurance that actual results will conform to our estimates and assumptions; reported results of operations may be materially affected by changes in these estimates and assumptions.
As a result of the COVID-19 pandemic, we will reevaluate certain of these estimates and assumptions which could result in material changes to our results of operations including, but not limited to, higher losses and loss adjustment expenses, lower premium volume, asset impairment charges, declines in investment valuations, reductions in audit premium estimates, deferred tax valuation allowances and increases in the allowance for expected credit losses related to available-for-sale securities, premiums receivable and reinsurance receivables. The extent to which the COVID-19 pandemic impacts our business, results of operations and financial condition will depend on future developments, which are highly uncertain and cannot be predicted. These factors include, but are not limited to, the duration, spread, severity, reemergence or mutation of the COVID-19 pandemic, the effects of the COVID-19 pandemic on our insureds, the loss environment, the healthcare industry, the labor market and Lloyd's, the actions and stimulus measures taken by governments and governmental agencies, and to what extent normal economic and operating conditions can resume. Even after the COVID-19 pandemic has subsided, we may experience an impact to our business as a result of any economic recession that has occurred or may occur in the future. Please see "Item 1A, Risk Factors" included in this report for additional information.
Management considers the following accounting estimates to be critical because they involve significant judgment by management and those judgments could result in a material effect on our financial statements.
Reserve for Losses and Loss Adjustment Expenses
The largest component of our liabilities is our reserve for losses and loss adjustment expenses ("reserve for losses" or "reserve"), and the largest component of expense for our operations is incurred losses and loss adjustment expenses (also referred to as “losses and loss adjustment expenses,” “incurred losses,” “losses incurred” and “losses”). Incurred losses reported in any period reflect our estimate of losses incurred related to the premiums earned in that period as well as any changes to our previous estimate of the reserve required for prior periods.
As of June 30, 2020, our reserve is comprised almost entirely of long-tail exposures. The estimation of long-tailed losses is inherently difficult and is subject to significant judgment on the part of management. Due to the nature of our claims, our loss costs, even for claims with similar characteristics, can vary significantly depending upon many factors, including but not limited to the specific characteristics of the claim and the manner in which the claim is resolved. Long-tailed insurance is characterized by the extended period of time typically required both to assess the viability of a claim and potential damages, if
51
any, and to reach a resolution of the claim. The claims resolution process may extend to more than five years. The combination of continually changing conditions and the extended time required for claim resolution results in a loss cost estimation process that requires actuarial skill and the application of significant judgment, and such estimates require periodic modification.
Our reserve is established by management after taking into consideration a variety of factors including premium rates, claims frequency and severity, historical paid and incurred loss development trends, the expected effect of inflation, general economic and social trends, the legal and political environment and the conclusions reached by our internal and consulting actuaries. We update and review the data underlying the estimation of our reserve for losses each reporting period and make adjustments to loss estimation assumptions that we believe best reflect emerging data. Both our internal and consulting actuaries perform an in-depth review of our reserve for losses on at least a semi-annual basis using the loss and exposure data of our insurance subsidiaries.
Our reserving process can be broadly grouped into three areas: the establishment of the reserve for the current accident year (the initial reserve), the re-estimation of the reserve for prior accident years (development of prior accident years) and the establishment of the initial reserve for risks assumed in business combinations, applicable only in periods in which acquisitions occur (the acquired reserve).
Current Accident Year - Initial Reserve
Considerable judgment is required in establishing our initial reserve for any current accident year period, as there is limited data available upon which to base our estimate. Our process for setting an initial reserve considers the unique characteristics of each product, but in general we rely heavily on the loss assumptions that were used to price business, as our pricing reflects our analysis of loss costs that we expect to incur relative to the insurance product being priced.
Specialty P&C Segment. Loss costs within this segment are impacted by many factors including but not limited to the nature of the claim, including whether or not the claim is an individual or a mass tort claim, the personal situation of the claimant or the claimant's family, the outcome of jury trials, the legislative and judicial climate where any potential litigation may occur, general economic and social trends and, for claims involving bodily injury, the trend of healthcare costs. Within our Specialty P&C segment, for our professional liability business (79% of our consolidated gross reserve for losses and loss adjustment expenses as of December 31, 2019; predominately comprised of our HCPL products), we set an initial reserve based upon our evaluation of the current loss environment including frequency, severity, economic inflation, social inflation and legal trends.
The initial loss ratio in the Specialty P&C segment has ranged from 87% to 106% in recent years, excluding the effect of a large national healthcare account. We recorded a higher than average current accident year net loss ratio in 2019 due to increased reserve estimates related to this large national healthcare account that exceeded the assumptions we made when originally underwriting the account. The policy term associated with this account's claims-made coverage expired near the end of the second quarter of 2020. This account did not renew on terms offered by us and the insured exercised its contractual option to purchase the extended reporting endorsement or "tail" coverage which resulted in a net underwriting loss of $45.7 million recognized during the three and six months ended June 30, 2020 associated with this policy, which increased our current accident year net loss ratio in 2020. Excluding the impact of this large national healthcare account, we have trended towards the mid range of the current accident year net loss ratio in the segment in recent years. This reflects loss severity in the broader medical professional liability industry and a higher loss pick in our Specialty line of business. In addition, this range also reflects the impact of a $10 million reserve established during the second quarter of 2020 related to COVID-19 which represents our best estimate of ultimate COVID-19 related losses based on currently available information and reported incidents. While we have established a reserve for COVID-19 related losses in the current period, we have also observed a signification reduction in claims frequency during the second quarter of 2020 as compared to the same period in 2019, likely associated with the COVID-19 pandemic; however, we have remained cautious in recognizing these favorable frequency trends in our current accident year reserve due to the possibility of delays in reporting and uncertainty surrounding the length and severity of the pandemic. See further discussion in our Segment Operating Results - Specialty Property & Casualty section that follows under the heading "Losses."
The risks insured in our medical technology liability business (3% of our consolidated gross reserve for losses and loss adjustment expenses as of December 31, 2019) are more varied, and policies are individually priced based on the risk characteristics of the policy and the account. The insured risks range from startup operations to large multinational entities, and the larger entities often have significant deductibles or self-insured retentions. Reserves are established using our most recently developed actuarial estimates of losses expected to be incurred based on factors which include results from prior analysis of similar business, industry indications, observed trends and judgment. Claims in this line of business primarily involve bodily injury to individuals and are affected by factors similar to those of our HCPL line of business. For the medical technology liability business, we also establish an initial reserve using a loss ratio approach, including a provision in consideration of historical loss volatility that this line of business has exhibited.
52
Workers' Compensation Insurance Segment. Many factors affect the ultimate losses incurred for our workers' compensation coverages (10% of our consolidated gross reserve for losses and loss adjustment expenses as of December 31, 2019) including but not limited to the type and severity of the injury, the age, health and occupation of the injured worker, the estimated length of disability, medical treatment and related costs, and the jurisdiction and workers' compensation laws of the state of the injury occurrence.
We use various actuarial methodologies in developing our workers’ compensation reserve, combined with a review of the payroll exposure base. For the current accident year, given the lack of seasoned information, the different actuarial methodologies produce results with significant variability; therefore, more emphasis is placed on supplementing results from the actuarial methodologies with trends in exposure base, medical expense inflation, general inflation, severity, and claim counts, among other things, to select an expected loss ratio.
Similar to our Specialty P&C segment, we have also observed a reduction in claims frequency in our Workers' Compensation Insurance segment, likely associated with the COVID-19 pandemic; however, we remain cautious in our evaluation of the current accident year reserve due to uncertainty surrounding the length and severity of the pandemic, and legislative and regulatory bodies in certain states changing or attempting to broaden compensability requirements for COVID-19 claims. If these legislative and regulatory bodies are successful, it could result in an increase in claims frequency and severity for the current accident year. See previous discussion under the heading "Regulatory Environment." Furthermore, as it relates to both our Workers' Compensation Insurance and Segregated Portfolio Cell Reinsurance segments, the current economic conditions resulting from the COVID-19 pandemic have introduced significant risk of a prolonged recession, which could have an adverse impact on our return to wellness efforts and the ability of injured workers to return to work, resulting in a potential reduction in favorable claim trends in future periods.
Segregated Portfolio Cell Reinsurance Segment. The factors that affect the ultimate losses incurred for the workers' compensation and HCPL coverages assumed by the SPCs at Inova Re and Eastern Re (4% of our consolidated gross reserve for losses and loss adjustment expenses as of December 31, 2019) are consistent with that of our Workers’ Compensation Insurance and Specialty P&C segments, respectively.
Lloyd's Syndicates Segment. Initial reserves for Syndicate 1729 and Syndicate 6131 are primarily recorded using the loss assumptions by risk category incorporated into each Syndicate's business plan submitted to Lloyd's with consideration given to loss experience incurred to date (4% of our consolidated gross reserve for losses and loss adjustment expenses as of December 31, 2019). The assumptions used in each business plan are consistent with loss results reflected in Lloyd's historical data for similar risks. The loss ratios may also fluctuate due to the timing of earned premium adjustments. Such adjustments may be the result of premiums for certain policies and assumed reinsurance contracts being reported subsequent to the coverage period and may be subject to adjustment based on loss experience. Premium and exposure for some of Syndicate 1729's insurance policies and reinsurance contracts are initially estimated and subsequently recorded over an extended period of time as reports are received under delegated underwriting authority programs. When reports are received, the premium, exposure and corresponding loss estimates are revised accordingly. Changes in loss estimates due to premium or exposure fluctuations are incurred in the accident year in which the premium is earned.
For significant property catastrophe exposures, Syndicate 1729 uses third-party catastrophe models to accumulate a listing of potentially affected policies. Each identified policy is given an estimate of loss severity based upon a combination of factors including the probable maximum loss of each policy, market share analytics, underwriting judgment, client/broker estimates and historical loss trends for similar events. These models are inherently uncertain, reliant upon key assumptions and management judgment and are not always a representation of actual events and ensuing potential loss exposure. Determination of actual losses may take an extended period of time until claims are reported and resolved, including coverage litigation.
Development of Prior Accident Years
In addition to setting the initial reserve for the current accident year, each period we reassess the amount of reserve required for prior accident years.
Our reserve re-estimation process is based upon the most recently completed actuarial analysis supplemented by any new analysis, information or trends that have emerged since the date of that study. We also take into account currently available industry trend information. Changes to previously established reserve estimates are recognized in the current period if management’s best estimate of ultimate losses differs from the estimate previously established. While management considers a variety of variables in determining its best estimate, in general, as claims age, our methodologies give more weight to actual loss costs which, for the majority of our reserves, continue to indicate that ultimate loss costs will be lower than our previous estimates. The discussion in our Critical Accounting Estimates section in Item 7 of our December 31, 2019 report on Form 10-K includes additional information regarding the methodologies used to evaluate our reserve.
Any change in our estimate of net ultimate losses for prior accident years is reflected in net income (loss) in the period in which such changes are made. In recent years such changes have reduced our estimate of consolidated net ultimate losses, resulting in a reduction of reported losses for the period and a corresponding increase in pre-tax income.
53
Due to the size of our consolidated reserve for losses and the large number of claims outstanding at any point in time, even a small percentage adjustment to our total reserve estimate could have a material effect on our results of operations for the period in which the adjustment is made. Please refer to the Executive Summary of Operations and Segment Operating Results sections that follow for a discussion on consolidated and segment prior accident year loss development recognized in the current period.
Use of Judgment
The process of estimating reserves involves a high degree of judgment and is subject to a number of variables. These variables can be affected by both views of internal and external events, such as changes in views of economic inflation, legal trends and legislative changes, as well as differentiating views of individuals involved in the reserve estimation process, among others. We continually refine our estimates in a regular, ongoing process as historical loss experience develops and additional claims are reported and settled. Our objective is to consider all significant facts and circumstances known at the time.
Changes in economic conditions and steps taken by the federal government and the Federal Reserve in response to COVID-19 could lead to inflation trends that are different from those we anticipated when establishing our reserves, which could in turn lead to an increase or decrease in our loss costs and the need to strengthen or reduce reserves. These impacts of inflation on loss costs and reserves could be more pronounced for our HCPL line of business as that business generally requires a longer period of time to settle claims for a given accident year and, accordingly, is relatively more inflation sensitive.
We use various actuarial methods in the process of setting reserves. Each actuarial method generally returns a different value, and for the more recent accident years the variations among the various methodologies can be significant. In order to project ultimate losses, we partition our reserves for analysis such as by line of business, geography, coverage layer or accident year; in all, there are over 200 different partitions of our business used for actuarial evaluation. For each partition of our reserves, we evaluate the results of the various methods, along with the supplementary statistical data regarding such factors as closed with and without indemnity ratios, claim severity trends, the expected duration of such trends, changes in the legal and legislative environment and the current economic environment to develop a point estimate based upon management's judgment and past experience. The series of selected point estimates is then combined to produce an overall point estimate for ultimate losses.
HCPL. Over the past several years, the most influential factor affecting the analysis of our HCPL reserves and the related development recognized has been an observed increase in claim severity for the broader medical professional liability industry as well as higher initial loss expectations on incurred claims. The severity trend is an explicit component of our pricing models, whereas in our reserving process the severity trend's impact is implicit. Our estimate of this trend and our expectations about changes in this trend impact a variety of factors, from the selection of expected loss ratios to the ultimate point estimates established by management.
Because of the implicit and wide-ranging nature of severity trend assumptions on the loss reserving process, it is not practical to specifically isolate the impact of changing severity trends. However, because severity is an explicit component of our HCPL pricing process we can better isolate the impact that changing severity can have on our loss costs and loss ratios in regards to our pricing models for this business component. Our current HCPL pricing models assume severity trends in the range of 2% to 5% depending on state, territory and specialty. In some portions of our HCPL business we have observed and reflected higher severity trends in our estimates of losses and loss adjustment expenses.
If the severity trend were to be higher by 1 percentage point, the impact would be an increase in our initial expected loss ratio for this business of 3.2 percentage points, based on current claim disposition patterns. An increase in the severity trend of 3 percentage points would result in a 10.1 percentage point increase in our initial expected loss ratio. Due to the long-tailed nature of our claims and the previously discussed historical volatility of loss costs, selection of a severity trend assumption is a subjective process that is inherently likely to prove inaccurate over time. Given the long tail and volatility, we are generally cautious in making changes to the severity assumptions within our pricing models. All open claims and accident years are generally impacted by a change in the severity trend, which compounds the effect of such a change.
Although the future degree and impact of the ultimate severity trend remains uncertain due to the long-tailed nature of our business, we have given consideration to observed loss costs in setting our rates. For our HCPL business, this practice had generally resulted in rate reductions as claim frequency declined and remained at historically low levels. However, from early 2017 to the current period, the average pricing on renewed business has steadily increased reflective of the rising loss cost environment, and we anticipate further renewal pricing increases due to increasing loss severity.
Workers' Compensation. The projection of changes in claim severity trend has not historically been an influential factor affecting our analysis of workers' compensation reserves, as claims are typically resolved more quickly than the industry norm. As previously mentioned, the determination and calculation of loss development factors, in particular, the selection of tail factors which are used to extend the projection of losses beyond historical data, requires considerable judgment.
54
Investment Valuations
We record the majority of our investments at fair value as shown in the table below. At June 30, 2020, the distribution of our investments based on GAAP fair value hierarchies (levels) was as follows:
Distribution by GAAP Fair Value Hierarchy | |||||||||
Level 1 | Level 2 | Level 3 | Not Categorized | Total Investments | |||||
Investments recorded at: | |||||||||
Fair value | 16% | 71% | 1% | 7% | 95% | ||||
Other valuations | 5% | ||||||||
Total Investments | 100% | ||||||||
Fair value is defined as the price that would be received to sell an asset or paid to transfer a liability in an orderly transaction between market participants at the measurement date. All of our fixed maturity and equity investments are carried at fair value. The fair value of our short-term securities approximates the cost of the securities due to their short-term nature.
Because of the number of securities we own and the complexity of developing accurate fair values, we utilize multiple independent pricing services to assist us in establishing the fair value of individual securities. The pricing services provide fair values based on exchange-traded prices, if available. If an exchange-traded price is not available, the pricing services, if possible, provide a fair value that is based on multiple broker/dealer quotes or that has been developed using pricing models. Pricing models vary by asset class and utilize currently available market data for securities comparable to ours to estimate a fair value for our securities. The pricing services scrutinize market data for consistency with other relevant market information before including the data in the pricing models. The pricing services disclose the types of pricing models used and the inputs used for each asset class. Determining fair values using these pricing models requires the use of judgment to identify appropriate comparable securities and to choose a valuation methodology that is appropriate for the asset class and available data.
The pricing services provide a single value per instrument quoted. We review the values provided for reasonableness each quarter by comparing market yields generated by the supplied value versus market yields observed in the marketplace. We also compare yields indicated by the provided values to appropriate benchmark yields and review for values that are unchanged or that reflect an unanticipated variation as compared to prior period values. We utilize a primary pricing service for each security type and compare provided information for consistency with alternate pricing services, known market data and information from our own trades, considering both values and valuation trends. We also review weekly trades versus the prices supplied by the services. If a supplied value appears unreasonable, we discuss the valuation in question with the pricing service and make adjustments if deemed necessary. Historically our review has not resulted in any material changes to the values supplied by the pricing services. The pricing services do not provide a fair value unless an exchange-traded price or multiple observable inputs are available. As a result, the pricing services may provide a fair value for a security in some periods but not others, depending upon the level of recent market activity for the security or comparable securities.
Level 1 Investments
Fair values for a majority of our equity securities and portions of our corporate debt, short-term and convertible securities are determined using exchange-traded prices. There is little judgment involved when fair value is determined using an exchange-traded price. In accordance with GAAP, we classify securities valued using an exchange-traded price as Level 1 securities.
Level 2 Investments
Most fixed income securities do not trade daily; thus, exchange-traded prices are generally not available for these securities. However, market information (often referred to as observable inputs or market data, including but not limited to, last reported trade, non-binding broker quotes, bids, benchmark yield curves, issuer spreads, two-sided markets, benchmark securities, offers and recent data regarding assumed prepayment speeds, cash flow and loan performance data) is available for most of our fixed income securities. We determine fair value for a large portion of our fixed income securities using available market information. In accordance with GAAP, we classify securities valued based on multiple market observable inputs as Level 2 securities.
Level 3 Investments
When a pricing service does not provide a value for one of our fixed maturity securities, management estimates fair value using either a single non-binding broker quote or pricing models that utilize market based assumptions which have limited
55
observable inputs. The process involves significant judgment in selecting the appropriate data and modeling techniques to use in the valuation process. In accordance with GAAP, we classify securities valued using limited observable inputs as Level 3 securities.
Fair Values Not Categorized
We hold interests in certain investment funds, primarily LPs/LLCs, which measure fund assets at fair value on a recurring basis and provide us with a NAV for our interest. As a practical expedient, we consider the NAV provided to approximate the fair value of the interest. In accordance with GAAP, we do not categorize these investments within the fair value hierarchy.
Nonrecurring Fair Value Measurements
We measure the fair value of certain assets on a nonrecurring basis when events or changes in circumstances indicate that the carrying amount of the asset may not be recoverable. These assets include investments carried principally at cost, investments in tax credit partnerships, fixed assets, goodwill and other intangible assets. These assets would also include any equity method investments that do not provide a NAV.
Investments - Other Valuation Methodologies
Certain of our investments, in accordance with GAAP for the type of investment, are measured using methodologies other than fair value. At June 30, 2020, these investments represented approximately 5% of total investments, and are detailed in the following table. Additional information about these investments is provided in Notes 2 and 3 of the Notes to Condensed Consolidated Financial Statements.
(In millions) | Carrying Value | GAAP Measurement Method | |||
Other investments: | |||||
Other, principally FHLB capital stock | $ | 2.9 | Principally Cost | ||
Investment in unconsolidated subsidiaries: | |||||
Investments in tax credit partnerships | 37.1 | Equity | |||
Equity method investments, primarily LPs/LLCs | 46.8 | Equity | |||
83.9 | |||||
BOLI | 67.0 | Cash surrender value | |||
Total investments - Other valuation methodologies | $ | 153.8 | |||
Impairments
We evaluate our available-for-sale investment securities, which at June 30, 2020 and December 31, 2019 consisted entirely of fixed maturity securities, on at least a quarterly basis for the purpose of determining whether declines in fair value below recorded cost basis represent an impairment loss. We consider a credit-related impairment loss to have occurred:
• | if there is intent to sell the security; |
• | if it is more likely than not that the security will be required to be sold before full recovery of its amortized cost basis; or |
• | if the entire amortized basis of the security is not expected to be recovered. |
The assessment of whether the amortized cost basis of a security is expected to be recovered requires management to make assumptions regarding various matters affecting future cash flows. The choice of assumptions is subjective and requires the use of judgment. Actual credit losses experienced in future periods may differ from management’s estimates of those credit losses. Methodologies used to estimate the present value of expected cash flows are:
The estimate of expected cash flows is determined by projecting a recovery value and a recovery time frame and assessing whether further principal and interest will be received. We consider various factors in projecting recovery values and recovery time frames, including the following:
• | third-party research and credit rating reports; |
• | the current credit standing of the issuer, including credit rating downgrades, whether before or after the balance sheet date; |
• | the extent to which the decline in fair value is attributable to credit risk specifically associated with the security or its issuer; |
56
• | internal assessments and the assessments of external portfolio managers regarding specific circumstances surrounding an investment, which indicate the investment is more or less likely to recover its amortized cost than other investments with a similar structure; |
• | for asset-backed securities, the origination date of the underlying loans, the remaining average life, the probability that credit performance of the underlying loans will deteriorate in the future and our assessment of the quality of the collateral underlying the loan; |
• | failure of the issuer of the security to make scheduled interest or principal payments; |
• | any changes to the rating of the security by a rating agency; |
• | recoveries or additional declines in fair value subsequent to the balance sheet date; |
• | adverse legal or regulatory events; |
• | significant deterioration in the market environment that may affect the value of collateral (e.g. decline in real estate prices); |
• | significant deterioration in economic conditions; and |
• | disruption in the business model resulting from changes in technology or new entrants to the industry. |
If deemed appropriate and necessary, a discounted cash flow analysis is performed to confirm whether a credit loss exists and, if so, the amount of the credit loss. We use the single best estimate approach for available-for-sale debt securities and consider all reasonably available data points, including industry analyses, credit ratings, expected defaults and the remaining payment terms of the debt security. For fixed rate available-for-sale debt securities, cash flows are discounted at the security's effective interest rate implicit in the security at the date of acquisition. If the available-for-sale debt security’s contractual interest rate varies based on subsequent changes in an independent factor, such as an index or rate, for example, the prime rate, the LIBOR, or the U.S. Treasury bill weekly average, that security’s effective interest rate is calculated based on the factor as it changes over the life of the security. If we intend to sell a debt security or believe we will more likely than not be required to sell a debt security before the amortized cost basis is recovered, any existing allowance will be written off against the security's amortized cost basis, with any remaining difference between the debt security's amortized cost basis and fair value recognized as an impairment loss in earnings.
Exclusive of securities where there is an intent to sell or where it is not more likely than not that the security will be required to be sold before recovery of its amortized cost basis, impairment for debt securities is separated into a credit component and a non-credit component. The credit component of an impairment is the difference between the security’s amortized cost basis and the present value of its expected future cash flows, while the non-credit component is the remaining difference between the security’s fair value and the present value of expected future cash flows. An allowance for expected credit losses will be recorded for the expected credit losses through income and the non-credit component is recognized in OCI. The amount of impairment recognized is limited to the excess of the amortized cost over the fair value of the available-for-sale debt security.
Deferred Policy Acquisition Costs
Policy acquisition costs (primarily commissions, premium taxes and underwriting salaries) which are directly related to the successful acquisition of new and renewal premiums are capitalized as DPAC and charged to expense, net of ceding commissions earned, as the related premium revenue is recognized. We evaluate the recoverability of our DPAC typically at the segment level each reporting period or in a manner that is consistent with the way we manage our business. Any amounts estimated to be unrecoverable are charged to expense in the current period.
As part of our evaluation of the recoverability of DPAC, we also evaluate our unearned premiums for premium deficiencies. A premium deficiency is recognized if the sum of anticipated losses and loss adjustment expenses, unamortized DPAC and maintenance costs, net of anticipated investment income, exceeds the related unearned premium. If a premium deficiency is identified, the associated DPAC is written off, and a PDR is recorded for the excess deficiency as a component of net losses and loss adjustment expenses in our Consolidated Statement of Income and Comprehensive Income and as a component of the reserve for losses on our Consolidated Balance Sheet. During the three and six months ended June 30, 2020 we did not determine any DPAC to be unrecoverable.
Estimation of Taxes / Tax Credits
For interim periods, we generally utilize the estimated annual effective tax rate method under which we determine our provision (benefit) for income taxes based on the current estimate of our annual effective tax rate. For the three months ended March 31, 2020, we adopted the discrete effective tax rate method for recording income taxes in the period. The discrete method was applied in the first quarter of 2020 because the application of the estimated annual effective tax rate method was impractical and did not provide a reliable estimate of the annual effective tax rate at that time. Furthermore, we believed the use of the discrete effective tax rate method in the first quarter of 2020 was more appropriate than the annual effective tax rate method as minor changes in our estimated ordinary income would have a significant effect on the estimated annual effective tax
57
rate and would result in sizable variations in the customary relationship between income tax expense (benefit) and pretax accounting income (loss). For the six months ended June 30, 2020, we reevaluated our use of the discrete effective tax rate method and concluded that a return to the estimated annual effective tax rate method is appropriate given our revised financial projections and ability to provide a reliable estimate of the annual effective tax rate in the current period.
Under the estimated annual effective tax rate method, items which are unusual, infrequent, or that cannot be reliably estimated are considered in the effective tax rate in the period in which the item is included in income, and are referred to as discrete items. In calculating our year-to-date income tax expense (benefit), we include the estimated benefit of tax credits for the year-to-date period based on the most recently available information provided by the tax credit partnerships; the actual amounts of credits provided by the tax credit partnerships may prove to be different than our estimates. The effect of such a difference is recognized in the period identified.
Deferred Taxes
Deferred federal income taxes arise from the recognition of temporary differences between the basis of assets and liabilities determined for financial reporting purposes and the basis determined for income tax purposes. Our temporary differences principally relate to our loss reserves, unearned and advanced premiums, DPAC, compensation related items, unrealized investment gains (losses) and basis differences on fixed assets, intangible assets and operating leases. Deferred tax assets and liabilities are measured using the enacted tax rates expected to be in effect when such benefits are realized. We review our deferred tax assets quarterly for impairment. If we determine that it is more likely than not that some or all of a deferred tax asset will not be realized, a valuation allowance is recorded to reduce the carrying value of the asset. In assessing the need for a valuation allowance, management is required to make certain judgments and assumptions about our future operations based on historical experience and information as of the measurement period regarding reversal of existing temporary differences, carryback capacity, future taxable income (including its capital and operating characteristics) and tax planning strategies.
A valuation allowance was established in a prior year against the deferred tax asset related to the NOL carryforwards for the U.K. operations as management concluded that it was more likely than not that the deferred tax asset will not be realized. We also established a valuation allowance in a prior year against the deferred tax assets of certain SPCs at our wholly owned Cayman Islands reinsurance subsidiary, Inova Re. Due to the limited operations of these SPCs, management concluded that a valuation allowance was required. As of June 30, 2020, management concluded that a valuation allowance was still required against the deferred tax assets related to the NOL carryforwards for the U.K. operations and against the deferred tax assets of certain SPCs at Inova Re. See further discussion in Note 6 of the Notes to Consolidated Financial Statements in our December 31, 2019 Form 10-K.
Tax Cuts and Jobs Act
The TCJA introduced a minimum tax on payments made to related foreign entities referred to as the BEAT. The BEAT is imposed by adding back into the U.S. tax base any base erosion payment made by the U.S. taxpayer to a related foreign entity and applying a minimum tax rate to this newly calculated modified taxable income. Base erosion payments represent any amount paid or accrued by the U.S. taxpayer to a related foreign entity for which a deduction is allowed. Premiums we cede to the SPCs at Inova Re, one of our wholly owned Cayman Islands reinsurance subsidiaries, do not fall within the scope of base erosion payments as the SPCs at Inova Re have elected to be taxed as U.S. taxpayers. However, premiums that we cede to any active SPC at our other wholly owned Cayman Islands reinsurance subsidiary, Eastern Re, fall within the scope of base erosion payments and therefore could be significantly impacted by the BEAT. We have evaluated our exposure to the BEAT and have concluded that our expected outbound deductible payments to related foreign entities are below the threshold for application of the BEAT; therefore, we have not recognized any incremental tax expense for the BEAT provision of the TCJA during the three and six months ended June 30, 2020 or 2019. See further discussion on our Cayman Islands SPC operations in the Segment Operating Results - Segregated Portfolio Cell Reinsurance section that follows. See further discussion in Note 4 of the Notes to Condensed Consolidated Financial Statements.
The TCJA also requires a U.S. shareholder of a controlled foreign corporation to include its GILTI in U.S. taxable income. The GILTI amount is based on the U.S. shareholder’s aggregate share of the gross income of the controlled foreign corporation reduced by certain exceptions and a net deemed tangible income return. The net deemed tangible income return is based on the controlled foreign corporation’s basis in the tangible depreciable business property. Cell rental fee income earned by Inova Re and Eastern Re fall within the scope of the GILTI provisions of the TCJA. We have evaluated the new GILTI provisions of the TCJA and we have made an accounting policy election to treat the taxes due on inclusions of GILTI in U.S. taxable income as a current period expense when incurred. We recognized a nominal amount of tax expense for the GILTI provision of the TCJA during each of the three and six months ended June 30, 2020 and 2019. See further discussion in Note 4 of the Notes to Condensed Consolidated Financial Statements.
58
Coronavirus Aid, Relief and Economic Security Act
In response to COVID-19, the CARES Act was signed into law on March 27, 2020 and contains several provisions for corporations and eases certain deduction limitations originally imposed by the TCJA. The CARES Act, among other things, includes temporary changes regarding the prior and future utilization of NOLs, temporary changes to the prior and future limitations on interest deductions, temporary suspension of certain payment requirements for the employer portion of Social Security taxes and the creation of certain refundable employee retention credits. We anticipate the temporary changes regarding NOL carryback provisions will have a favorable impact on our liquidity (see discussion that follows in the Liquidity and Capital Resources and Financial Condition section under the heading "Taxes"). We are currently evaluating the other provisions of the CARES Act and how certain elections may impact our financial position and results of operations if elected. See discussion in Note 4 of the Notes to Condensed Consolidated Financial Statements.
Unrecognized Tax Benefits
We evaluate tax positions taken on tax returns and recognize positions in our financial statements when it is more likely than not that we will sustain the position upon resolution with a taxing authority. If recognized, the benefit is measured as the largest amount of benefit that has a greater than 50% probability of being realized. We review uncertain tax positions each period, considering changes in facts and circumstances, such as changes in tax law, interactions with taxing authorities and developments in case law, and make adjustments as we consider necessary. Adjustments to our unrecognized tax benefits may affect our income tax expense, and settlement of uncertain tax positions may require the use of cash. Other than differences related to timing, no significant adjustments were considered necessary during the three and six months ended June 30, 2020 or 2019. At June 30, 2020, our liability for unrecognized tax benefits approximated $10.4 million.
Goodwill / Intangibles
Goodwill is tested for impairment annually or more frequently if circumstances indicate an impairment may have occurred. The date of our annual goodwill impairment testing is October 1. Impairment of goodwill is tested at the reporting unit level, which is consistent with our reportable segments identified in Note 12 of the Notes to Condensed Consolidated Financial Statements. Of the five reporting units, three have goodwill - Specialty P&C, Workers' Compensation Insurance and Segregated Portfolio Cell Reinsurance. In 2019, we performed qualitative assessments that supported a conclusion that the fair value of all of the reporting units with goodwill exceeded their carrying value.
COVID–19 has caused significant market volatility impacting our actual and projected results along with a decline in our stock price. During the second quarter of 2020, we performed a quantitative assessment on our Specialty P&C and Workers' Compensation Insurance reporting units. The previous quantitative and qualitative assessments on our Segregated Portfolio Cell Reinsurance reporting unit indicated that the fair value of the reporting unit significantly exceeded the carrying; as such no quantitative assessment of this reporting unit was performed during the second quarter of 2020.
For the interim impairment assessment, we estimated the fair value of the reporting units using both an income approach and a market approach. The estimate of fair value derived from the income approach is based on the present value of expected future cash flows, including terminal value, utilizing a market-based weighted average cost of capital determined separately for each reporting unit. The estimate of fair value derived from the market approach is based on earnings multiple data. The determination of fair value involves the use of significant estimates and assumptions, including revenue growth rates, operating margins, capital expenditures, working capital requirements, tax rates, terminal growth rates, discount rates, comparable public companies and synergistic benefits available to market participants. In addition, we make certain judgments and assumptions in allocating shared assets and liabilities to individual reporting units to determine the carrying amount of each reporting unit. Given the evolving, uncertain nature of the COVID-19 pandemic, these estimates and assumptions have inherent uncertainties, and different assumptions could lead to materially different results including impairment charges in the future. To corroborate the reporting units’ valuation, we performed a reconciliation of the estimate of the aggregate fair value of the reporting units to ProAssurance's market capitalization, including consideration of a control premium. As a result of the interim goodwill impairment assessment, management concluded that the fair value of each of our Specialty P&C and Workers' Compensation Insurance reporting units were greater than their carrying value as of the testing date; therefore, goodwill was not impaired and no further impairment testing was required. As this is an evolving crisis, we expect to continue to monitor developments and perform updated analyses as necessary. Additional information regarding our goodwill and intangible assets is included in Note 1 of the Notes to Consolidated Financial Statements included in ProAssurance's December 31, 2019 report on Form 10-K.
Leases
We are involved in a number of leases, primarily for office facilities. We determine if an arrangement is a lease at the inception date of the contract and classify all leases as either financing or operating. As of June 30, 2020, all of our leases were classified as operating. Operating lease ROU assets and operating lease liabilities are recognized as of the lease commencement
59
date based on the present value of the remaining lease payments, discounted over the term of the lease using a discount rate determined based on information available as of the commencement date. The ROU asset represents the right to use the underlying asset (office space) for the lease term. As the majority of our lessors do not provide an implicit discount rate, we use our collateralized incremental borrowing rate in determining the present value of remaining lease payments. For leases entered into or reassessed after the adoption of ASU 2016-02 on January 1, 2019, we account for lease and non-lease components of a contract as a single lease component.
We evaluate our operating lease ROU assets for impairment at the asset group level whenever events or changes in circumstances indicate that the carrying amount of the asset group may not be recoverable. The carrying amount of an asset group, which includes the operating lease ROU asset and the related operating lease liability, is not recoverable if the carrying amount exceeds the sum of the undiscounted cash flows expected to result from the use of the asset group over the life of the primary asset in the asset group. That assessment is based on the carrying amount of the asset group, including the operating lease ROU asset and the related operating lease liability, at the date it is tested for recoverability, and an impairment loss is measured and recognized as the amount by which the carrying amount of the asset group exceeds its fair value. Any impairment loss is allocated to each asset in the asset group, including the operating ROU asset.
When a lease of an office facility is to be abandoned and will not be subleased, we first evaluate whether or not the operating lease ROU asset’s inclusion in an existing asset group continues to be appropriate and if the commitment to abandon the lease constitutes a change in circumstances requiring the operating lease ROU asset, or the larger asset group, to be tested for impairment. If an impairment test is required, it is performed in the same manner as discussed above. Any remaining carrying value of the operating lease ROU asset is amortized from the date we commit to a plan to abandon the lease to the expected date that we will cease to use the leased property. Leases to be abandoned in which we have the intent or practical ability to sublease continue to be accounted for under a held and use model, with no change to the amortization period of the operating lease ROU asset, and are evaluated for impairment as a separate asset group at the date the sublease is executed.
Additional information regarding our leases is included in Note 7 of the Notes to Condensed Consolidated Financial Statements herein and Note 1 of the Notes to Consolidated Financial Statements included in ProAssurance's December 31, 2019 report on Form 10-K.
Audit Premium
Workers’ compensation premiums are determined based upon the payroll of the insured, respective premium rates and, where applicable, an experience-based modification factor. An audit of the policyholders’ records is conducted after policy expiration to make a final determination of applicable premiums. Audit premium due from or due to a policyholder as a result of an audit is reflected in net premiums written and earned when billed. We track, by policy, the amount of additional premium billed in final audit invoices as a percentage of payroll exposure and use this information to estimate the probable additional amount of EBUB premium as of the balance sheet date. We include changes to the EBUB premium estimate in net premiums written and earned in the period recognized. As a result of the economic impact of COVID-19, we are beginning to see our insured payroll exposure decrease which could result in significant reductions in our EBUB premium estimate in future periods. As of June 30, 2020, we have not experienced a significant increase in mid-term endorsement requests and as such, we did not adjust our EBUB premium estimate in the second quarter of 2020. We will continually review and adjust, if necessary, to changes in our policyholders' payrolls and economic conditions, as experience develops or new information becomes known; however, the length and magnitude of such changes depends on future developments, which are highly uncertain and cannot be predicted.
Lloyd’s Premium Estimates
For certain insurance policies and reinsurance contracts written in our Lloyd’s Syndicates segment, premiums are initially recognized based upon estimates of ultimate premium. Estimated ultimate premium consists primarily of premium written under delegated underwriting authority arrangements, which consist primarily of binding authorities, and certain assumed reinsurance agreements. These estimates of ultimate premium are judgmental and are dependent upon certain assumptions, including historical premium trends for similar agreements. As reports are received from programs, ultimate premium estimates are revised, if necessary, with changes reflected in current operations.
Accounting Changes
During the second quarter of 2020, we early adopted ASU 2019-12 which is intended to simplify various aspects related to accounting for income taxes. The most impactful provision of the new guidance on the Company is the removal of the limitation on the tax benefit recognized on pre-tax losses during interim periods in which the year-to-date loss exceeds the expected loss for the fiscal year.
We did not have any other change in accounting estimate or policy that had a material effect on our results of operations or financial position during the six months ended June 30, 2020. We are not aware of any accounting changes not yet adopted as of June 30, 2020 that would have a material effect on our results of operation, financial position or cash flows. Note 1 of the Notes to Condensed Consolidated Financial Statements provides additional detail regarding accounting changes not yet adopted.
Liquidity and Capital Resources and Financial Condition
Overview
ProAssurance Corporation is a holding company and is a legal entity separate and distinct from its subsidiaries. As a holding company, our principal source of external revenue is our investment revenues. In addition, dividends from our operating subsidiaries represent another source of funds for our obligations, including debt service and shareholder dividends. We also charge our operating subsidiaries within our Specialty P&C and Workers' Compensation Insurance segments a management fee based on the extent to which services are provided to the subsidiary and the amount of gross premium written by the subsidiary. At June 30, 2020, we held cash and liquid investments of approximately $137 million outside our insurance subsidiaries that were available for use without regulatory approval or other restriction. We also have $250 million in permitted borrowings available under our Revolving Credit Agreement as well as the possibility of a $50 million accordion feature, if successfully subscribed. As of July 31, 2020, no borrowings were outstanding under our Revolving Credit Agreement.
To date, during 2020, our operating subsidiaries have paid dividends to us of approximately $19 million, which included $18 million that was paid in July 2020. Additionally, we anticipate that our operating subsidiaries will pay dividends to us of approximately $93 million in August 2020, which will include extraordinary dividends of $64 million. Dividends paid in July 2020 and anticipated to be paid in August 2020 have not been included in our cash and liquid investments held outside of our insurance subsidiaries at June 30, 2020. Excluding the dividends paid in July 2020 and anticipated to be paid in August 2020, our insurance subsidiaries, in the aggregate, are permitted to pay additional dividends of approximately $46 million over the remainder of 2020 without prior approval of state insurance regulators. However, the payment of any dividend requires prior notice to the insurance regulator in the state of domicile, and the regulator may reduce or prevent the dividend if, in its judgment, payment of the dividend would have an adverse effect on the surplus of the insurance subsidiary. We make the decision to pay dividends from an insurance subsidiary based on the capital needs of that subsidiary and may pay less than the permitted dividend or may also request permission to pay an additional amount (an extraordinary dividend).
Cash Flows
Cash flows between periods compare as follows:
Six Months Ended June 30 | |||||||||||
(In thousands) | 2020 | 2019 | Change | ||||||||
Net cash provided (used) by: | |||||||||||
Operating activities | $ | 2,473 | $ | 79,015 | $ | (76,542 | ) | ||||
Investing activities | 81,519 | (2,720 | ) | 84,239 | |||||||
Financing activities | (35,093 | ) | (64,887 | ) | 29,794 | ||||||
Increase (decrease) in cash and cash equivalents | $ | 48,899 | $ | 11,408 | $ | 37,491 | |||||
Six Months Ended June 30 | |||||||||||
(In thousands) | 2019 | 2018 | Change | ||||||||
Net cash provided (used) by: | |||||||||||
Operating activities | $ | 79,015 | $ | 65,566 | $ | 13,449 | |||||
Investing activities | (2,720 | ) | 277,898 | (280,618 | ) | ||||||
Financing activities | (64,887 | ) | (411,244 | ) | 346,357 | ||||||
Increase (decrease) in cash and cash equivalents | $ | 11,408 | $ | (67,780 | ) | $ | 79,188 | ||||
The principal components of our operating cash flows are the excess of premiums collected and net investment income over losses paid and operating costs, including income taxes. Timing delays exist between the collection of premiums and the payment of losses associated with the premiums. Premiums are generally collected within the twelve-month period after the policy is written, while our claim payments are generally paid over a more extended period of time. Likewise, timing delays exist between the payment of claims and the collection of any associated reinsurance recoveries.
60
The decrease in operating cash flows for the six months ended June 30, 2020 as compared to the six months ended June 30, 2019 of $76.5 million was primarily due to an increase in paid losses of $68.0 million driven by our Specialty P&C and Segregated Portfolio Cell Reinsurance segments. The increase in paid losses in our Specialty P&C segment was primarily due to higher average claim payments which we believe is an early indication that the higher severity trends that we are experiencing in our HCPL case reserve estimates are starting to emerge in actual claim payments. The increase in paid losses in our Segregated Portfolio Cell Reinsurance segment reflected the payment of a $10 million claim during the first quarter of 2020 by an SPC at Eastern Re in which we do not participate. The payment related to a reserve established by the SPC in 2019 related to an errors and omissions liability policy. Additionally, the decrease in operating cash flows reflected a decrease in net cash received of $7.4 million associated with the cash settlement of the 2017 calendar year quota share reinsurance arrangement between our Specialty P&C segment and Syndicate 1729 due to the reduction in premiums ceded to Syndicate 1729. The decrease in operating cash flows was somewhat offset by an increase in net premium receipts of $18.4 million, an increase in cash received from investment income of $13.2 million and a decrease in 2020 net tax payments as compared to 2019 of $8.2 million. The increase in net premium receipts was driven by our Specialty P&C segment due to $14.3 million of tail premium received from a large national healthcare account during the second quarter of 2020 (see further discussion in our Segment Operating Results - Specialty Property & Casualty section that follows). The increase in cash received from investment income was primarily due to an increase in distributed earnings and redemptions from our portfolio of investments in LPs/LLCs. The decrease in net tax payments was primarily due to refunds received during the six months ended June 30, 2020. The remaining variance in operating cash flows for the six months ended June 30, 2020 as compared to the six months ended June 30, 2019 was comprised of individually insignificant components.
The increase in operating cash flows for the six months ended June 30, 2019 as compared to the six months ended June 30, 2018 of $13.4 million was primarily due to an increase in net premium receipts of $18.7 million and a decrease in paid losses of $2.9 million, partially offset by an increase in cash paid for operating expenses of $0.9 million and a decrease in cash received from investment income of $0.8 million. Additionally, the increase in operating cash flows was partially offset by a decrease in net cash received of $7.1 million associated with the cash settlement of the 2017 and 2016 calendar year quota share reinsurance arrangements between our Specialty P&C segment and Syndicate 1729 due to the reduction in premiums ceded to Syndicate 1729. The increase in net premium receipts was primarily due to the growth in written premium in our Specialty P&C and Lloyd's Syndicates segments as well as the timing of premium receipts related to the 2018 loss portfolio transfer in our Specialty P&C segment. The decrease in paid losses was driven by our Lloyd's Syndicates segment primarily due to the effect of higher losses paid in 2018 related to the 2017 hurricane season and, to a lesser extent, our Specialty P&C segment primarily due to the timing of loss payments between periods. The increase in cash paid for operating expenses was primarily due to an increase in operating expenses in our Lloyd's Syndicates segment primarily due to the growth in Syndicate 1729 operations and the addition of Syndicate 6131 and, to a lesser extent, an increase in operating expenses in our Specialty P&C segment primarily due to a data analytics services agreement entered into during the fourth quarter of 2018. The decrease in cash received from investment income was primarily due to a decline in distributed earnings from our unconsolidated subsidiaries.
We manage our investing cash flows to ensure that we will have sufficient liquidity to meet our obligations, taking into consideration the timing of cash flows from our investments, including interest payments, dividends and principal payments, as well as the expected cash flows to be generated by our operations as discussed in this section under the heading "Investing Activities and Related Cash Flows."
Our financing cash flows are primarily composed of dividend payments and borrowings and repayments under our Revolving Credit Agreement. See further discussion of our financing activities in this section under "Financing Activities and Related Cash Flows."
61
Operating Activities and Related Cash Flows
Reinsurance
Within our Specialty P&C segment, we use insurance and reinsurance (collectively, “reinsurance”) to provide capacity to write larger limits of liability, to provide reimbursement for losses incurred under the higher limit coverages we offer and to provide protection against losses in excess of policy limits. Within our Workers' Compensation Insurance segment, we use reinsurance to reduce our net liability on individual risks, to mitigate the effect of significant loss occurrences (including catastrophic events), to stabilize underwriting results and to increase underwriting capacity by decreasing leverage. In both our Specialty P&C and Workers' Compensation Insurance segments, we use reinsurance in risk sharing arrangements to align our objectives with those of our strategic business partners and to provide custom insurance solutions for large customer groups. The purchase of reinsurance does not relieve us from the ultimate risk on our policies; however, it does provide reimbursement for certain losses we pay. We pay our reinsurers a premium in exchange for reinsurance of the risk. In certain of our excess of loss arrangements, the premium due to the reinsurer is determined by the loss experience of the business reinsured, subject to certain minimum and maximum amounts. Until all loss amounts are known, we estimate the premium due to the reinsurer. Changes to the estimate of premium owed under reinsurance agreements related to prior periods are recorded in the period in which the change in estimate occurs and can have a significant effect on net premiums earned.
We offer alternative market solutions whereby we cede certain premiums from our Workers' Compensation Insurance and Specialty P&C segments to either the SPCs at Inova Re or Eastern Re, our Cayman Islands reinsurance subsidiaries which are reported in our Segregated Portfolio Cell Reinsurance segment, or, to a limited extent, an unaffiliated captive insurer for one program. During the three and six months ended June 30, 2020, we wrote total alternative market premium of approximately $15.6 million and $45.3 million, respectively, and approximately $17.3 million and $55.6 million during the same respective periods of 2019. The majority of these policies ($15.0 million and $42.1 million of premium for the three and six months ended June 30, 2020, respectively, and $16.9 million and $52.8 million for the same respective periods of 2019) are reinsured to the SPCs at Inova Re or Eastern Re, net of a ceding commission. Each SPC at Inova Re and Eastern Re is owned, fully or in part, by an agency, group or association, and the operating results of the SPCs are due to the participants of that cell. We participate to a varying degree in the results of selected SPCs and, for the SPCs in which we participate, our participation interest ranges from a low of 20% to a high of 85%. SPC operating results attributable to external cell participants are reflected as an SPC dividend expense (income) in our Segregated Portfolio Cell Reinsurance segment. See further discussion on our SPC operations in the Segment Operating Results - Segregated Portfolio Cell Reinsurance section that follows. The alternative market workers' compensation policies are ceded from our Workers' Compensation Insurance segment to the SPCs under 100% quota share reinsurance agreements. The alternative market healthcare professional liability policies are ceded from our Specialty P&C segment to the SPCs under either excess of loss or quota share reinsurance agreements, depending on the structure of the individual program. The nominal portion of the risk that is not ceded to an SPC is retained in our Specialty P&C segment and may also be reinsured under our standard healthcare professional liability reinsurance program depending on the policy limits provided. The remaining premium written in our alternative market business of $0.1 million and $2.7 million three and six months ended June 30, 2020, respectively, and $2.4 million for the six months ended June 30, 2019 related to one program that was 100% ceded to an unaffiliated captive insurer.
For all of our segments, we make a determination of the amount of insurance risk we choose to retain based upon numerous factors, including our risk tolerance and the capital we have to support it, the price and availability of reinsurance, the volume of business, our level of experience with a particular set of exposures and our analysis of the potential underwriting results. We purchase excess of loss reinsurance to limit the amount of risk we retain and we do so from a number of companies to mitigate concentrations of credit risk. We utilize reinsurance brokers to assist us in the placement of these reinsurance programs and in the analysis of the credit quality of our reinsurers. The determination of which reinsurers we choose to do business with is based upon an evaluation of their then current financial strength, rating and stability. However, the financial strength of our reinsurers and their corresponding ability to pay us may change in the future due to circumstances or events we cannot control or anticipate.
62
Excess of Loss Reinsurance Agreements
We generally reinsure risks under treaties (our excess of loss reinsurance agreements) pursuant to which the reinsurers agree to assume all or a portion of all risks that we insure above our individual risk retention levels, up to the maximum individual limits offered. These agreements are negotiated and renewed annually. Renewal dates for our HCPL, Medical Technology Liability and workers' compensation treaties are October 1, January 1 and May 1, respectively. Our HCPL treaty renewed October 1, 2019 at a higher rate than the previous agreement, partially offset by a lower intermediary compensation rate. Our Medical Technology Liability treaty renewed January 1, 2020 at a lower rate than the previous agreement. Our traditional workers' compensation treaty renewed May 1, 2020 at a higher rate than the previous agreement, with an increase in the AAD to 3.16% from approximately 2.1% of subject earned premium, in excess of the $0.5 million retention per loss occurrence; all other material treaty terms were consistent with the expiring agreement. The significant coverages provided by our current excess of loss reinsurance agreements are detailed in the following table.
Excess of Loss Reinsurance Agreements
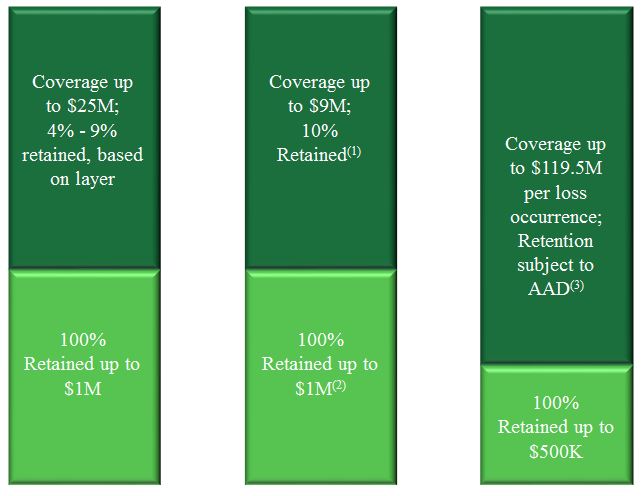
Healthcare Professional Liability | Medical Technology & Life Sciences Products | Workers' Compensation - Traditional | |||
(1) Historically, retention has ranged from 5% to 32.5%.
(2) Historically, retention has been as high as $2M.
(3) Includes an AAD where retention is 3.16% of subject earned premium in annual losses otherwise recoverable in excess of the $500k retention per loss occurrence.
Large HCPL risks that are above the limits of our basic reinsurance treaties are reinsured on a facultative basis, whereby the reinsurer agrees to insure a particular risk up to a designated limit. We also have in place a number of risk sharing arrangements that apply to the first $1 million of losses for certain large healthcare systems and other insurance entities, as well as with certain insurance agencies that produce business for us.
63
Other Reinsurance Arrangements
For the workers' compensation business ceded to Inova Re and Eastern Re, each SPC has in place its own reinsurance arrangements; which are illustrated in the following table.
Segregated Portfolio Cell Reinsurance
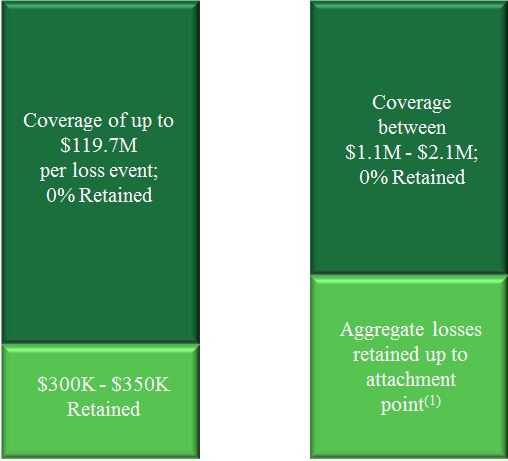
Per Occurrence Coverage | Aggregate Coverage | |
(1) The attachment point is based on a percentage of written premium within individual cells (average is 89%) and varies by cell.
Each SPC has participants and the profit or loss of each cell accrues fully to these cell participants. As previously discussed, we participate in certain SPCs to a varying degree. Each SPC maintains a loss fund initially equal to the difference between premium assumed by the cell and the ceding commission. The external participants of each cell provide collateral to us, typically in the form of a letter of credit, that is initially equal to the difference between the loss fund of the SPC (amount of funds available to pay losses after deduction of ceding commission) and the aggregate attachment point of the reinsurance. Over time, an SPC's retained profits are considered in the determination of the collateral amount required to be provided by the cell's external participants.
Within our Lloyd's Syndicates segment, Syndicate 1729 utilizes reinsurance to provide capacity to write larger limits of liability on individual risks, to provide protection against catastrophic loss and to provide protection against losses in excess of policy limits. The level of reinsurance that Syndicate 1729 purchases is dependent on a number of factors, including its underwriting risk appetite for catastrophic exposure, the specific risks inherent in each line or class of business written and the pricing, coverage and terms and conditions available from the reinsurance market. Reinsurance protection by line of business is as follows:
• | Reinsurance is utilized on a per risk basis for the property insurance and casualty coverages in order to mitigate risk volatility. |
• | Catastrophic protection is utilized on both our property insurance and casualty coverages to protect against losses in excess of policy limits as well as natural catastrophes. |
• | Both quota share reinsurance and excess of loss reinsurance are utilized to manage the net loss exposure on our property reinsurance coverages. |
• | Property umbrella excess of loss reinsurance is utilized for peak catastrophe and frequency of catastrophe exposures. |
64
• | External excess of loss reinsurance is utilized by Syndicate 1729 to manage the net loss exposure on the specialty property and contingency coverages ceded to Syndicate 6131 (see further discussion in Segment Operating Results - Lloyd's Syndicates section that follows). |
Syndicate 1729 may still be exposed to losses that exceed the level of reinsurance purchased as well as to reinstatement premiums triggered by losses exceeding specified levels. Cash demands on Syndicate 1729 can vary significantly depending on the nature and intensity of a loss event. For significant reinsured catastrophe losses, the inability or unwillingness of the reinsurer to make timely payments under the terms of the reinsurance agreement could have an adverse effect on Syndicate 1729's liquidity.
Taxes
We are subject to the tax laws and regulations of the U.S. and U.K. We file a consolidated U.S. federal income tax return that includes the holding company and its U.S. subsidiaries. Our filing obligations include a requirement to make quarterly payments of estimated taxes to the IRS using the corporate tax rate effective for the tax year. We did not make any quarterly estimated tax payments during either of the three and six months ended June 30, 2020 or 2019.
As a result of the CARES Act that was signed into law on March 27, 2020, as previously discussed, we now have the ability to carryback NOLs generated in tax years 2018, 2019, and 2020 for up to five years. We have an NOL of approximately $34.4 million from the 2019 tax year that will be carried back to the 2014 tax year and is expected to generate a tax refund of approximately $12.0 million. Furthermore, our effective tax rate for the three and six months ended June 30, 2020 was affected by the tax rate differential on the carryback of the 2020 and 2019 NOLs to the 2015 and 2014 tax years, respectively, when the federal statutory tax rate was 35% as compared to the current tax rate of 21%. See further discussion on our effective tax rate for the three and six months ended June 30, 2020 in the Segment Operating Results - Corporate section that follows under the heading "Taxes." We are currently evaluating the other provisions of the CARES Act and how certain elections may impact our liquidity, financial position and results of operations if elected. See further discussion in Note 4 of the Notes to Condensed Consolidated Financial Statements.
Litigation
We are involved in various legal actions related to insurance policies and claims handling including, but not limited to, claims asserted against us by policyholders. These types of legal actions arise in the ordinary course of business and, in accordance with GAAP for insurance entities, are generally considered as a part of our loss reserving process, which is described in detail in our Critical Accounting Estimates section under the heading "Reserve for Losses and Loss Adjustment Expenses." We also have other direct actions against the Company unrelated to our claims activity which we evaluate and account for as a part of our other liabilities. For these corporate legal actions, we evaluate each case separately and establish what we believe is an appropriate reserve based on GAAP guidance related to contingent liabilities. As of June 30, 2020 there were no material reserves established for corporate legal actions.
65
Investing Activities and Related Cash Flows
Our investments at June 30, 2020 and December 31, 2019 are comprised as follows:
June 30, 2020 | December 31, 2019 | ||||||||||
($ in thousands) | Carrying Value | % of Total Investment | Carrying Value | % of Total Investment | |||||||
Fixed maturities, available-for-sale | |||||||||||
U.S. Treasury obligations | $ | 115,241 | 4 | % | $ | 110,467 | 3 | % | |||
U.S. Government-sponsored enterprise obligations | 8,693 | 1 | % | 17,340 | 1 | % | |||||
State and municipal bonds | 293,718 | 9 | % | 296,093 | 9 | % | |||||
Corporate debt | 1,274,443 | 39 | % | 1,340,364 | 40 | % | |||||
Residential mortgage-backed securities | 234,693 | 7 | % | 208,408 | 6 | % | |||||
Commercial mortgage-backed securities | 103,949 | 3 | % | 80,089 | 2 | % | |||||
Other asset-backed securities | 229,211 | 7 | % | 236,024 | 7 | % | |||||
Total fixed maturities, available-for-sale | 2,259,948 | 70 | % | 2,288,785 | 68 | % | |||||
Fixed maturities, trading | 46,116 | 1 | % | 47,284 | 1 | % | |||||
Total fixed maturities | 2,306,064 | 71 | % | 2,336,069 | 69 | % | |||||
Equity investments | 98,723 | 3 | % | 250,552 | 7 | % | |||||
Short-term investments | 478,074 | 14 | % | 339,907 | 10 | % | |||||
BOLI | 67,025 | 2 | % | 66,112 | 2 | % | |||||
Investment in unconsolidated subsidiaries | 306,859 | 9 | % | 358,820 | 11 | % | |||||
Other investments | 40,900 | 1 | % | 38,949 | 1 | % | |||||
Total investments | $ | 3,297,645 | 100 | % | $ | 3,390,409 | 100 | % | |||
At June 30, 2020, 99% of our investments in available-for-sale fixed maturity securities were rated and the average rating was A+. The distribution of our investments in available-for-sale fixed maturity securities by rating were as follows:
June 30, 2020 | December 31, 2019 | ||||||||||
($ in thousands) | Carrying Value | % of Total Investment | Carrying Value | % of Total Investment | |||||||
Rating* | |||||||||||
AAA | $ | 649,795 | 29 | % | $ | 677,554 | 30 | % | |||
AA+ | 95,147 | 4 | % | 84,991 | 3 | % | |||||
AA | 150,267 | 7 | % | 152,118 | 7 | % | |||||
AA- | 115,625 | 5 | % | 153,377 | 7 | % | |||||
A+ | 197,178 | 9 | % | 182,966 | 8 | % | |||||
A | 321,263 | 14 | % | 338,697 | 15 | % | |||||
A- | 211,256 | 9 | % | 171,553 | 7 | % | |||||
BBB+ | 178,107 | 8 | % | 182,041 | 8 | % | |||||
BBB | 153,253 | 7 | % | 155,935 | 7 | % | |||||
BBB- | 50,306 | 2 | % | 52,523 | 2 | % | |||||
Below investment grade | 130,671 | 5 | % | 130,929 | 5 | % | |||||
Not rated | 7,080 | 1 | % | 6,101 | 1 | % | |||||
Total | $ | 2,259,948 | 100 | % | $ | 2,288,785 | 100 | % | |||
*Average of three NRSRO sources, presented as an S&P equivalent. Source: S&P, Copyright ©2020, S&P Global Market Intelligence | |||||||||||
66
A detailed listing of our investment holdings as of June 30, 2020 is located under the Financial Information heading on the Investor Relations page of our website which can be reached directly at www.proassurance.com/investmentholdings or through links from the Investor Relations section of our website, investor.proassurance.com.
We manage our investments to ensure that we will have sufficient liquidity to meet our obligations, taking into consideration the timing of cash flows from our investments, including interest payments, dividends and principal payments, as well as the expected cash flows to be generated by our operations. During the second quarter of 2020, we have received and granted requests for premium relief for certain insureds that have been adversely impacted by the recent COVID-19 pandemic in the form of either premium credits or premium deferrals. While premium credits and deferrals granted during the three and six months ended June 30, 2020 did not have a significant impact on our liquidity, additional premium relief efforts could have an impact on our cash flows to be generated from our operations in future quarters and could result in an increase to our allowance for expected credit losses related to our premiums receivable. In addition to the interest and dividends we will receive from our investments, we anticipate that between $40 million and $80 million of our portfolio will mature (or be paid down) each quarter over the next twelve months and become available, if needed, to meet our cash flow requirements. In response to COVID-19, we have reduced the rate of reinvestment of these cash flows in order to allow for additional cash availability. The primary outflow of cash at our insurance subsidiaries is related to paid losses and operating costs, including income taxes. The payment of individual claims cannot be predicted with certainty; therefore, we rely upon the history of paid claims in estimating the timing of future claims payments with consideration to current and anticipated industry trends and macroeconomic conditions, including the impacts of COVID-19. To the extent that we may have an unanticipated shortfall in cash, we may either liquidate securities or borrow funds under existing borrowing arrangements through our Revolving Credit Agreement and the FHLB system. Permitted borrowings under our Revolving Credit Agreement are $250 million with the possibility of an additional $50 million accordion feature, if successfully subscribed. Given the duration of our investments, we do not foresee a shortfall that would require us to meet operating cash needs through additional borrowings. Additional information regarding our Revolving Credit Agreement is detailed in Note 8 of the Notes to Condensed Consolidated Financial Statements.
At June 30, 2020, our FAL was comprised of fixed maturity securities with a fair value of $104.3 million and cash and cash equivalents of $33.2 million deposited with Lloyd's. See further discussion in Note 3 of the Notes to Condensed Consolidated Financial Statements. We expect to receive a return of approximately $33.0 million of FAL given our reduced participation in the operating results of Syndicate 1729 for the 2020 underwriting year to 29% from 61%.
Our investment portfolio continues to be primarily composed of high quality fixed income securities with approximately 94% of our fixed maturities being investment grade securities as determined by national rating agencies. The weighted average effective duration of our fixed maturity securities at June 30, 2020 was 3.11 years; the weighted average effective duration of our fixed maturity securities combined with our short-term securities was 2.56 years.
The carrying value and unfunded commitments for certain of our investments were as follows:
Carrying Value | June 30, 2020 | ||||||||||
($ in thousands, except expected funding period) | June 30, 2020 | December 31, 2019 | Unfunded Commitment | Expected funding period in years | |||||||
Qualified affordable housing project tax credit partnerships (1) | $ | 37,061 | $ | 46,421 | $ | 771 | 6 | ||||
Historic tax credit partnership (2) | — | 2,085 | 276 | 1 | |||||||
All other investments, primarily investment fund LPs/LLCs | 269,798 | 310,314 | 137,206 | 4 | |||||||
Total | $ | 306,859 | $ | 358,820 | $ | 138,253 | |||||
(1) The carrying value reflects our total commitments (both funded and unfunded) to the partnerships, less any amortization, since our initial investment. We fund these investments based on funding schedules maintained by the partnerships. | |||||||||||
(2) The carrying value reflects our funded commitments less any amortization. | |||||||||||
Investment fund LPs/LLCs are by nature less liquid and may involve more risk than other investments. We manage our risk through diversification of asset class and geographic location. At June 30, 2020, we had investments in 33 separate investment funds with a total carrying value of $269.8 million which represented approximately 8% of our total investments. Our investment fund LPs/LLCs generate earnings from trading portfolios, secured debt, debt securities, multi-strategy funds and private equity investments, and the performance of these LPs/LLCs is affected by the volatility of equity and credit markets. For our investments in LPs/LLCs, we record our allocable portion of the partnership operating income or loss as the results of the LPs/LLCs become available, typically following the end of a reporting period.
67
Acquisitions
We have entered into a definitive agreement to acquire NORCAL, an underwriter of medical professional liability insurance, subject to the demutualization of NORCAL Mutual, NORCAL's ultimate controlling party. We are targeting to close the transaction either by the end of 2020 or early 2021. Subject to NORCAL’s conversion from a mutual company to a stock company, we have agreed to acquire 100% of the converted company stock in exchange for base consideration of $450 million and contingent consideration of up to an additional $150 million depending on the development of NORCAL’s ultimate losses over a three-year period following December 31, 2020. The actual final cost of the transaction could vary due to the ability of NORCAL’s policyholders to elect forms of consideration other than stock in the demutualization transaction as provided by California law. Those alternative consideration options are tied to an appraised value of NORCAL as determined by the California insurance regulator rather than the price per share we have agreed to pay for 100% of NORCAL assuming that all policyholders elect to receive stock. Further, the transaction is subject to a number of closing conditions, including a maximum threshold for one of the alternative forms of consideration in the demutualization, a minimum threshold for the number of NORCAL shares tendered to us, and various required regulatory approvals. The Agreement and Plan of Acquisition was previously filed as Exhibit 10.1 to ProAssurance's March 31, 2020 report on Form 10-Q. We plan to utilize our Revolving Credit Agreement to partially finance the acquisition (see further discussion on our Revolving Credit Agreement in this section under the heading "Debt"). The COVID-19 pandemic’s potential disruption to our business operations may require us to access our Revolving Credit Agreement for other purposes including working capital, capital expenditures or other general corporate requirements. If needed, we may be required to obtain additional financing and our ability to arrange such financing or refinancing will depend on, among other factors, our financial position and performance, as well as prevailing market conditions and other factors beyond our control. As a result, we may be compelled to take additional measures to preserve our cash flow, including the reduction of operating expenses or reduction or suspension of dividend payments, at least until the impacts of the COVID-19 pandemic improve. We believe that funds available under the Revolving Credit Agreement, along with cash generated from our operations and investment portfolio, will be sufficient to meet our liquidity needs, including the planned acquisition of NORCAL.
Financing Activities and Related Cash Flows
Treasury Shares
During the six months ended June 30, 2020 and 2019, we did not repurchase any common shares and, as of July 31, 2020, our remaining Board authorization was approximately $110 million.
ProAssurance Shareholder Dividends
Our Board declared quarterly cash dividends of $0.31 and $0.05 per share during the first and second quarters of 2020, respectively, and $0.31 per share during each of the first and second quarters of 2019. Dividends are paid the month following the quarter in which they are declared. Dividends paid in the first six months of 2019 included a special dividend of $0.50 per share declared in the fourth quarter of 2018. Given our current earnings profile, the effects that underlying conditions in the broader insurance marketplace continue to have on our results and the uncertainties introduced by the COVID-19 pandemic, our Board made the decision to reduce our quarterly cash dividend from $0.31 per share to $0.05 per share, beginning with the dividend that was declared for the second quarter of 2020. Any decision to pay future cash dividends is subject to the Board’s final determination after a comprehensive review of financial performance, future expectations and other factors deemed relevant by the Board.
Debt
At June 30, 2020 our debt included $250 million of outstanding unsecured senior notes. The notes bear interest at 5.3% annually and are due in 2023 although they may be redeemed in whole or part prior to maturity. There are no financial covenants associated with these notes.
We have a Revolving Credit Agreement, which expires in November 2024, that may be used for general corporate purposes, including, but not limited to, short-term working capital, share repurchases as authorized by the Board and support for other activities, such as the planned acquisition of NORCAL, as previously discussed under the heading "Acquisitions." Our Revolving Credit Agreement permits borrowings of up to $250 million as well as the possibility of a $50 million accordion feature, if successfully subscribed. At June 30, 2020, there were no outstanding borrowings on our Revolving Credit Agreement; we are in compliance with the financial covenants of the Revolving Credit Agreement.
We have Mortgage Loans with one lender in connection with the recapitalization of two office buildings, which mature in December 2027. The Mortgage Loans accrue interest at three-month LIBOR plus 1.325% with principal and interest payable on a quarterly basis. At June 30, 2020, the outstanding balance of the Mortgage Loans was approximately $37 million; we are in compliance with the financial covenant of the Mortgage Loans.
68
Additional information regarding our debt is provided in Note 8 of the Notes to Condensed Consolidated Financial Statements.
We utilize an interest rate cap agreement with a notional amount of $35 million to manage our exposure to increases in LIBOR on our Mortgage Loans. Per the interest rate cap agreement, we are entitled to receive cash payments if and when the three-month LIBOR exceeds 2.35%. Additional information on our interest rate cap agreement is provided in Note 12 of the Notes to Consolidated Financial Statements in ProAssurance's December 31, 2019 report on Form 10-K.
Two of our insurance subsidiaries are members of an FHLB. Through membership, those subsidiaries have access to secured cash advances which can be used for liquidity purposes or other operational needs. In order for us to use FHLB proceeds, regulatory approvals may be required depending on the nature of the transaction. To date, those subsidiaries have not materially utilized their membership for borrowing purposes.
Off-Balance Sheet Arrangements
We have no significant off-balance sheet arrangements that have or are reasonably likely to have a material current or future effect on our financial condition, changes in financial condition, revenues or expenses, results of operations, liquidity, capital expenditures or capital resources. See more information on our off-balance sheet arrangements in Note 6 of the Notes to Condensed Consolidated Financial Statements.
69
Results of Operations – Three and Six Months Ended June 30, 2020 Compared to Three and Six Months Ended June 30, 2019
Selected consolidated financial data for each period is summarized in the table below.
Three Months Ended June 30 | Six Months Ended June 30 | ||||||||||||||||||
($ in thousands, except per share data) | 2020 | 2019 | Change | 2020 | 2019 | Change | |||||||||||||
Revenues: | |||||||||||||||||||
Net premiums written | $ | 159,745 | $ | 189,984 | $ | (30,239 | ) | $ | 391,961 | $ | 435,725 | $ | (43,764 | ) | |||||
Net premiums earned | $ | 207,293 | $ | 209,149 | $ | (1,856 | ) | $ | 411,149 | $ | 417,298 | $ | (6,149 | ) | |||||
Net investment result | (7,231 | ) | 18,387 | (25,618 | ) | 12,037 | 40,395 | (28,358 | ) | ||||||||||
Net realized investment gains (losses) | 19,985 | 9,308 | 10,677 | (8,688 | ) | 45,931 | (54,619 | ) | |||||||||||
Other income | 1,695 | 2,777 | (1,082 | ) | 3,945 | 4,872 | (927 | ) | |||||||||||
Total revenues | 221,742 | 239,621 | (17,879 | ) | 418,443 | 508,496 | (90,053 | ) | |||||||||||
Expenses: | |||||||||||||||||||
Net losses and loss adjustment expenses | 210,999 | 168,440 | 42,559 | 375,831 | 328,195 | 47,636 | |||||||||||||
Underwriting, policy acquisition and operating expenses | 58,692 | 62,708 | (4,016 | ) | 120,746 | 124,100 | (3,354 | ) | |||||||||||
SPC U.S. federal income tax expense | 480 | — | 480 | 702 | — | 702 | |||||||||||||
Segregated portfolio cell dividend expense (income) | 4,642 | (7,033 | ) | 11,675 | 4,134 | (2,246 | ) | 6,380 | |||||||||||
Interest expense | 3,714 | 4,247 | (533 | ) | 7,844 | 8,576 | (732 | ) | |||||||||||
Total expenses | 278,527 | 228,362 | 50,165 | 509,257 | 458,625 | 50,632 | |||||||||||||
Income (loss) before income taxes | (56,785 | ) | 11,259 | (68,044 | ) | (90,814 | ) | 49,871 | (140,685 | ) | |||||||||
Income tax expense (benefit) | (38,686 | ) | (277 | ) | (38,409 | ) | (50,761 | ) | 6,685 | (57,446 | ) | ||||||||
Net income (loss) | $ | (18,099 | ) | $ | 11,536 | $ | (29,635 | ) | $ | (40,053 | ) | $ | 43,186 | $ | (83,239 | ) | |||
Non-GAAP operating income (loss) | $ | (32,441 | ) | $ | 4,134 | $ | (36,575 | ) | $ | (33,587 | ) | $ | 8,298 | $ | (41,885 | ) | |||
Earnings (loss) per share: | |||||||||||||||||||
Basic | $ | (0.34 | ) | $ | 0.21 | $ | (0.55 | ) | $ | (0.74 | ) | $ | 0.80 | $ | (1.54 | ) | |||
Diluted | $ | (0.34 | ) | $ | 0.21 | $ | (0.55 | ) | $ | (0.74 | ) | $ | 0.80 | $ | (1.54 | ) | |||
Non-GAAP operating earnings (loss) per share: | |||||||||||||||||||
Basic | $ | (0.60 | ) | $ | 0.08 | $ | (0.68 | ) | $ | (0.62 | ) | $ | 0.15 | $ | (0.77 | ) | |||
Diluted | $ | (0.60 | ) | $ | 0.08 | $ | (0.68 | ) | $ | (0.62 | ) | $ | 0.15 | $ | (0.77 | ) | |||
Net loss ratio | 101.8 | % | 80.5 | % | 21.3 | pts | 91.4 | % | 78.6 | % | 12.8 | pts | |||||||
Underwriting expense ratio | 28.3 | % | 30.0 | % | (1.7 | pts) | 29.4 | % | 29.7 | % | (0.3 | pts) | |||||||
Combined ratio | 130.1 | % | 110.5 | % | 19.6 | pts | 120.8 | % | 108.3 | % | 12.5 | pts | |||||||
Operating ratio | 121.4 | % | 99.2 | % | 22.2 | pts | 111.3 | % | 97.2 | % | 14.1 | pts | |||||||
Effective tax rate | 68.1 | % | (2.5 | %) | 70.6 | pts | 55.9 | % | 13.4 | % | 42.5 | pts | |||||||
Return on equity* | (5.0 | %) | 2.9 | % | (7.9 | pts) | (5.4 | %) | 5.6 | % | (11.0 | pts) | |||||||
* Annualized | |||||||||||||||||||
In all tables that follow, the abbreviation "nm" indicates that the information or the percentage change is not meaningful. | |||||||||||||||||||
70
Executive Summary of Operations
The following sections provide an overview of our consolidated and segment results of operations for the three and six months ended June 30, 2020 as compared to the three and six months ended June 30, 2019. See the Segment Operating Results sections that follow for additional information regarding each segment's operating results.
Revenues
The following table shows our consolidated and segment net premiums earned:
Three Months Ended June 30 | Six Months Ended June 30 | ||||||||||||||||||||||||||||
($ in thousands) | 2020 | 2019 | Change | 2020 | 2019 | Change | |||||||||||||||||||||||
Net premiums earned | |||||||||||||||||||||||||||||
Specialty P&C | $ | 127,096 | $ | 126,011 | $ | 1,085 | 0.9 | % | $ | 247,456 | $ | 250,079 | $ | (2,623 | ) | (1.0 | %) | ||||||||||||
Workers' Compensation Insurance | 42,406 | 46,574 | (4,168 | ) | (8.9 | %) | 86,921 | 92,512 | (5,591 | ) | (6.0 | %) | |||||||||||||||||
Segregated Portfolio Cell Reinsurance | 16,748 | 19,284 | (2,536 | ) | (13.2 | %) | 33,728 | 38,787 | (5,059 | ) | (13.0 | %) | |||||||||||||||||
Lloyd's Syndicates | 21,043 | 17,280 | 3,763 | 21.8 | % | 43,044 | 35,920 | 7,124 | 19.8 | % | |||||||||||||||||||
Consolidated total | $ | 207,293 | $ | 209,149 | $ | (1,856 | ) | (0.9 | %) | $ | 411,149 | $ | 417,298 | $ | (6,149 | ) | (1.5 | %) | |||||||||||
Consolidated net premiums earned for the 2020 three- and six- month periods included $14.3 million of tail premium written and fully earned during the second quarter of 2020 in connection with a large national healthcare account in our Specialty P&C segment (see further discussion under the heading "Expenses" in this section and in our Segment Operating Results - Specialty Property & Casualty section that follows). After removing the impact of the tail premium, consolidated net premiums earned decreased $16.2 million and $20.4 million during the 2020 three- and six- month periods, respectively, as compared to the same periods of 2019. The decrease in both the 2020 three- and six- month periods was driven by decreases in net premiums earned in our Specialty P&C, Workers' Compensation Insurance and Segregated Portfolio Cell Reinsurance segments, partially offset by an increase in net premiums earned in our Lloyd's Syndicates segment. The decrease in net premiums earned in our Specialty P&C segment for the 2020 three- and six- month periods was primarily due to our focus on underwriting discipline as we continue to emphasize careful risk selection, rate adequacy and a willingness to walk away from business that does not fit our goal of achieving a long-term underwriting profit. For our Workers' Compensation Insurance segment, the decrease in net premiums earned for the 2020 three- and six- month periods reflected the competitive workers' compensation market conditions, the impact of retrospectively-rated policy adjustments and, for the 2020 six-month period, the reduction in premium funding for a large workers' compensation alternative market program and a reduction in our EBUB premium estimate. The decrease in net premiums earned in our Segregated Portfolio Cell Reinsurance segment for the 2020 three- and six- month periods also reflected the competitive workers' compensation market conditions and, for the 2020 six-month period, a reduction in our EBUB premium estimate. The increase in net premiums earned in our Lloyd's Syndicates segment for the 2020 three- and six- month periods was driven by the pro rata effect of higher premiums written during the preceding twelve months, primarily property insurance coverages.
The following table shows our consolidated net investment result:
Three Months Ended June 30 | Six Months Ended June 30 | ||||||||||||||||||||||||||||
($ in thousands) | 2020 | 2019 | Change | 2020 | 2019 | Change | |||||||||||||||||||||||
Net investment income | $ | 18,124 | $ | 23,539 | $ | (5,415 | ) | (23.0 | %) | $ | 38,954 | $ | 46,357 | $ | (7,403 | ) | (16.0 | %) | |||||||||||
Equity in earnings (loss) of unconsolidated subsidiaries | (25,355 | ) | (5,152 | ) | (20,203 | ) | (392.1 | %) | (26,917 | ) | (5,962 | ) | (20,955 | ) | (351.5 | %) | |||||||||||||
Net investment result | $ | (7,231 | ) | $ | 18,387 | $ | (25,618 | ) | (139.3 | %) | $ | 12,037 | $ | 40,395 | $ | (28,358 | ) | (70.2 | %) | ||||||||||
The decrease in our consolidated net investment result for the three and six months ended June 30, 2020 as compared to the same respective periods of 2019 was driven by higher losses from our unconsolidated subsidiaries. Equity in earnings (loss) of unconsolidated subsidiaries includes our share of the operating results of interests we hold in certain LPs/LLCs as well as operating losses associated with our tax credit partnership investments, which are designed to generate returns in the form of tax credits and tax-deductible project operating losses. Our investment results from our portfolio of investments in LPs/LLCs decreased for the 2020 three- and six- month periods as compared to the 2019 three- and six- month periods primarily due to lower reported earnings from several LPs/LLCs driven by the impact of the disruption in global financial markets during the first quarter of 2020 due to COVID-19. Given the results of our investments in LPs/LLCs are often reported to us on a one-
71
quarter lag, the impact of COVID-19 on the global financial markets during the first quarter of 2020 was not captured in our results until the current period.
The following table shows our total consolidated net realized investment gains (losses):
Three Months Ended June 30 | Six Months Ended June 30 | ||||||||||||||||||||||||||||
($ in thousands) | 2020 | 2019 | Change | 2020 | 2019 | Change | |||||||||||||||||||||||
Net impairment losses recognized in earnings | $ | (345 | ) | $ | — | $ | (345 | ) | nm | $ | (1,508 | ) | $ | (49 | ) | $ | (1,459 | ) | 2,977.6 | % | |||||||||
Other net realized investment gains (losses) | 20,330 | 9,308 | 11,022 | 118.4 | % | (7,180 | ) | 45,980 | (53,160 | ) | (115.6 | %) | |||||||||||||||||
Net realized investment gains (losses) | $ | 19,985 | $ | 9,308 | $ | 10,677 | 114.7 | % | $ | (8,688 | ) | $ | 45,931 | $ | (54,619 | ) | (118.9 | %) | |||||||||||
For the three and six months ended June 30, 2020, we recognized credit-related impairment losses in earnings of $0.3 million and $1.5 million, respectively, and non-credit impairment losses in OCI of $0.2 million and $0.9 million, respectively. The credit-related impairment losses recognized during the three and six months ended June 30, 2020 related to four corporate bonds in the energy, consumer and financial sectors. Additionally, the 2020 six-month period included credit-related impairment losses related to a corporate bond in the entertainment sector, which was sold during the second quarter of 2020. The non-credit impairment losses recognized during the three and six months ended June 30, 2020 related to three corporate bonds in the energy and consumer sectors.
Other net realized investment gains and losses recognized during 2020 were driven by changes in fair value on our equity portfolio and convertible securities due to the volatility in the global financial markets related to COVID-19. Other net realized investment gains recognized during 2019 reflected changes in the value of our equity trading portfolio and realized gains and losses from the sale of equity securities during the periods. See further discussion in our Segment Operating Results - Corporate section that follows.
Expenses
The following table shows our consolidated and segment net loss ratios and net loss development:
Three Months Ended June 30 | Six Months Ended June 30 | ||||||||||||||||||||||
($ in millions) | 2020 | 2019 | Change | 2020 | 2019 | Change | |||||||||||||||||
Current accident year net loss ratio | |||||||||||||||||||||||
Consolidated ratio | 110.0 | % | 88.2 | % | 21.8 | pts | 97.0 | % | 84.9 | % | 12.1 | pts | |||||||||||
Specialty P&C | 137.7 | % | 94.0 | % | 43.7 | pts | 116.5 | % | 93.6 | % | 22.9 | pts | |||||||||||
Workers' Compensation Insurance | 70.6 | % | 68.2 | % | 2.4 | pts | 70.4 | % | 68.2 | % | 2.2 | pts | |||||||||||
Segregated Portfolio Cell Reinsurance | 57.0 | % | 115.2 | % | (58.2 | pts) | 61.4 | % | 90.8 | % | (29.4 | pts) | |||||||||||
Lloyd's Syndicates | 64.7 | % | 69.7 | % | (5.0 | pts) | 66.8 | % | 61.8 | % | 5.0 | pts | |||||||||||
Calendar year net loss ratio | |||||||||||||||||||||||
Consolidated ratio | 101.8 | % | 80.5 | % | 21.3 | pts | 91.4 | % | 78.6 | % | 12.8 | pts | |||||||||||
Specialty P&C | 125.5 | % | 84.1 | % | 41.4 | pts | 109.3 | % | 85.4 | % | 23.9 | pts | |||||||||||
Workers' Compensation Insurance | 67.0 | % | 65.8 | % | 1.2 | pts | 66.9 | % | 66.0 | % | 0.9 | pts | |||||||||||
Segregated Portfolio Cell Reinsurance | 45.9 | % | 103.6 | % | (57.7 | pts) | 50.5 | % | 79.2 | % | (28.7 | pts) | |||||||||||
Lloyd's Syndicates | 72.9 | % | 68.4 | % | 4.5 | pts | 70.0 | % | 63.3 | % | 6.7 | pts | |||||||||||
Favorable (unfavorable) net loss development, prior accident years | |||||||||||||||||||||||
Consolidated | $ | 17.1 | $ | 16.0 | $ | 1.1 | $ | 23.1 | $ | 26.3 | $ | (3.2 | ) | ||||||||||
Specialty P&C | $ | 15.4 | $ | 12.4 | $ | 3.0 | $ | 17.8 | $ | 20.3 | $ | (2.5 | ) | ||||||||||
Workers' Compensation Insurance | $ | 1.5 | $ | 1.1 | $ | 0.4 | $ | 3.0 | $ | 2.0 | $ | 1.0 | |||||||||||
Segregated Portfolio Cell Reinsurance | $ | 1.9 | $ | 2.3 | $ | (0.4 | ) | $ | 3.7 | $ | 4.5 | $ | (0.8 | ) | |||||||||
Lloyd's Syndicates | $ | (1.7 | ) | $ | 0.2 | $ | (1.9 | ) | $ | (1.4 | ) | $ | (0.5 | ) | $ | (0.9 | ) | ||||||
72
The primary drivers of the increase in our consolidated current accident year net loss ratio for the three and six months ended June 30, 2020 as compared to the same periods of 2019 were as follows:
(In percentage points) | Increase (Decrease), 2020 versus 2019 | |||
Comparative three-month period | Comparative six-month period | |||
Estimated ratio increase (decrease) attributable to: | ||||
Large National Healthcare Account Tail Policy | 22.9 pts | 11.6 pts | ||
COVID-19 Reserve | 5.2 pts | 2.5 pts | ||
E&O Liability Policy Reserve | (4.8 pts) | (2.3 pts) | ||
All other, net | (1.5 pts) | 0.3 pts | ||
Increase in the consolidated current accident year net loss ratio | 21.8 pts | 12.1 pts | ||
The policy term associated with a large national healthcare account's claims-made coverage expired near the end of the second quarter of 2020. This account did not renew on terms offered by us and exercised its contractual option to purchase the extended reporting endorsement or "tail" coverage, which resulted in a net underwriting loss of $45.7 million recognized during the second quarter of 2020 related to this policy in our Specialty P&C segment. This tail policy accounted for a 22.9 and 11.6 percentage point increase in our consolidated current accident year net loss ratio during the three and six months ended June 30, 2020, respectively. In addition, we established a $10 million reserve during the second quarter of 2020 for COVID-19 in our Specialty P&C segment. This reserve represents our best estimate of ultimate COVID-19 related losses based on currently available information and reported incidents, and increased our consolidated current accident year net loss ratio by 5.2 and 2.5 percentage points during the three and six months ended June 30, 2020, respectively. Our consolidated current accident year net loss ratio for the three and six months ended June 30, 2019 was affected by a $10 million reserve that an SPC at Eastern Re established during the second quarter of 2019 associated with an assumed E&O liability policy which accounted for a 4.8 and 2.3 percentage point decrease to our consolidated current accident year net loss ratio for the three and six months ended June 30, 2020, respectively, as compared to the same periods of 2019 (see further discussion in our Segment Operating Results - Segregated Portfolio Cell Reinsurance section that follows). Excluding the impacts of the previously discussed items, our consolidated current accident year net loss ratio decreased 1.5 percentage points during the 2020 three-month period and was relatively unchanged during the 2020 six-month period as compared to the same periods of 2019. The decrease in the ratio during the 2020 three-month period was driven by a lower current accident year net loss ratio in our Specialty P&C and Lloyd's Syndicates segments, partially offset by a higher current accident year net loss ratio in our Workers' Compensation Insurance segment. The lower current accident year net loss ratio in our Specialty P&C segment, excluding the items discussed above, was primarily due to decreases in certain loss ratios in our Standard Physician and Small Business Unit lines as a result of our re-underwriting efforts and focus on rate adequacy (see further discussion in our Segment Operating Results - Specialty P&C section that follows). In our Lloyd's Syndicates segment, the lower current accident year net loss ratio was driven by higher estimated reinsurance recoveries related to contingency and catastrophe related losses and, to a lesser extent, the effect of an increase in net premiums earned. For our Workers' Compensation Insurance segment, the higher current accident year net loss ratio was driven by the continuation of intense price competition and the resulting renewal rate decreases, as well as the effect of lower net premiums earned, partially offset by favorable trends in claim closing patterns that reduced loss development factors.
In both the 2020 and 2019 three- and six- month periods, our consolidated calendar year net loss ratio was lower than our consolidated current accident year net loss ratio due to the recognition of net favorable prior year reserve development, as shown in a previous table. Net favorable prior year reserve development recognized in the 2020 six-month period was lower as compared to the same respective period of 2019 driven by our Specialty P&C segment given our concerns around elevated loss severity in the broader medical professional liability industry, including our Specialty lines of business, and uncertainties around the impact that the COVID-19 pandemic will ultimately have on variables such as premium volume, claims frequency and severity, historical paid and incurred loss trends, general economic and social trends, inflation and the legal and political environment. In both our Specialty P&C and Workers' Compensation Insurance segments, we observed a reduction in claims frequency during the second quarter of 2020, likely associated with the COVID-19 pandemic; however, we have remained cautious in recognizing these favorable frequency trends in our current accident year reserve due to the possibility of delays in reporting and uncertainty surrounding the length and severity of the pandemic. As it relates to our Workers' Compensation Insurance segment, legislative and regulatory bodies in certain states are attempting to broaden compensability requirements for COVID-19 claims and, if successful, could result in an increase in claims frequency and severity for the current accident year. Furthermore, as it relates to both our Workers' Compensation Insurance and Segregated Portfolio Cell Reinsurance segments, the current economic conditions resulting from the COVID-19 pandemic have introduced significant risk of a prolonged recession, which could have an adverse impact on our return to wellness efforts and the ability of injured workers to return to work, resulting in a potential reduction in favorable claim trends in future periods.
73
Our consolidated and segment underwriting expense ratios were as follows:
Three Months Ended June 30 | Six Months Ended June 30 | ||||||||||||||||
2020 | 2019 | Change | 2020 | 2019 | Change | ||||||||||||
Underwriting Expense Ratio | |||||||||||||||||
Consolidated | 28.3 | % | 30.0 | % | (1.7 | pts) | 29.4 | % | 29.7 | % | (0.3 | pts) | |||||
Specialty P&C | 19.9 | % | 23.7 | % | (3.8 | pts) | 22.2 | % | 23.8 | % | (1.6 | pts) | |||||
Workers' Compensation Insurance | 31.7 | % | 30.8 | % | 0.9 | pts | 31.8 | % | 30.9 | % | 0.9 | pts | |||||
Segregated Portfolio Cell Reinsurance | 32.0 | % | 30.6 | % | 1.4 | pts | 31.0 | % | 28.7 | % | 2.3 | pts | |||||
Lloyd's Syndicates | 34.7 | % | 43.8 | % | (9.1 | pts) | 38.2 | % | 44.6 | % | (6.4 | pts) | |||||
Corporate* | 3.7 | % | 2.6 | % | 1.1 | pts | 3.1 | % | 2.4 | % | 0.7 | pts | |||||
*There are no net premiums earned associated with the Corporate segment. Ratios shown are the contribution of the Corporate segment to the consolidated ratio (Corporate operating expenses divided by consolidated net premium earned). | |||||||||||||||||
Our consolidated underwriting expense ratio decreased for the 2020 three- and six- month periods as compared to the same respective periods of 2019 driven by the effect of tail premium associated with a large national healthcare account in our Specialty P&C segment (net premiums earned with no associated operating expenses) which decreased our consolidated expense ratio by approximately 2.1 and 1.0 percentage points, respectively. See further discussion in our Segment Operating Results - Specialty P&C section that follows. After removing the impact of this tail premium, the consolidated underwriting expense ratio increased by approximately 0.4 and 0.6 percentage points for the 2020 three- and six- month periods, respectively, primarily due to a decrease in consolidated net premiums earned driven by our Specialty P&C and Workers' Compensation Insurance segments (see previous discussion in this section under the heading "Net Premiums Earned"), largely offset by a decrease in various operational expenses in all of our segments as a result of the COVID-19 pandemic. Additionally, the increase in our consolidated underwriting expense ratio for the 2020 three- and six- month periods reflected an increase in operating expenses in our Corporate segment primarily due to an increase in professional fees driven by corporate legal expenses and transaction-related costs associated with our planned acquisition of NORCAL.
Taxes
Our provision for income taxes and effective tax rates for the six months ended June 30, 2020 and 2019 were as follows:
($ in thousands) | Six Months Ended June 30 | |||||||||||||
2020 | 2019 | Change | ||||||||||||
Income (loss) before income taxes | $ | (90,814 | ) | $ | 49,871 | $ | (140,685 | ) | (282.1 | %) | ||||
Income tax expense (benefit) | (50,761 | ) | 6,685 | (57,446 | ) | (859.3 | %) | |||||||
Net income (loss) | $ | (40,053 | ) | $ | 43,186 | $ | (83,239 | ) | (192.7 | %) | ||||
Effective tax rate | 55.9 | % | 13.4 | % | ||||||||||
Six Months Ended June 30 | |||||
2020 | 2019 | ||||
Projected annual effective tax rate | 53.4 | % | (39.0 | %) | |
Tax effect of discrete items | 2.5 | % | 52.4 | % | |
Total effective tax rate | 55.9 | % | 13.4 | % | |
We recognized an income tax benefit of $50.8 million for the six months ended June 30, 2020 as compared to income tax expense of $6.7 million for the six months ended June 30, 2019; however, the comparability of our effective tax rates is impacted by the consolidated pre-tax loss recognized during the 2020 six-month period as compared to the consolidated pre-tax income recognized in the 2019 six-month period. Our projected annual effective tax rates were 53.4% and (39.0%) as of June 30, 2020 and 2019, respectively, before discrete items were considered. These discrete items increased our effective tax rate by 2.5% and 52.4% for the 2020 and 2019 six-month periods, respectively, as shown in the table above. For the 2020 and 2019 six-month periods the most significant discrete item that affected our effective tax rate was net realized investment gains and losses. Net realized investment losses of $8.7 million for the six months ended June 30, 2020 and net realized investment gains of $43.4 million for the six months ended June 30, 2019 in our Corporate segment accounted for 2.0% and 52.3% of the increase in the effective tax rate in the same respective periods. Additionally, our effective tax rate as of June 30, 2020 differed from the statutory federal income tax rate due to the additional tax rate differential of 14% on the carryback of our 2020 and
74
2019 NOLs to the 2014 and 2015 tax years, respectively, as a result of changes made by the CARES Act to the NOL provisions of the tax law.
Our projected annual effective tax rates as of June 30, 2020 and 2019 were different from the statutory federal income tax rate of 21% primarily due to the benefit recognized from the tax credits transferred to us from our tax credit partnership investments. See further discussion in the Segment Operating Results - Corporate section that follows under the heading "Taxes."
Operating Ratio
Our operating ratio is our combined ratio, less our investment income ratio. This ratio provides the combined effect of underwriting profitability and investment income. Our operating ratio for the three and six months ended June 30, 2020 and 2019 was as follows:
Three Months Ended June 30 | Six Months Ended June 30 | ||||||||||||
2020 | 2019 | Change | 2020 | 2019 | Change | ||||||||
Combined ratio | 130.1 | % | 110.5 | % | 19.6 | pts | 120.8 | % | 108.3 | % | 12.5 | pts | |
Less: investment income ratio | 8.7 | % | 11.3 | % | (2.6 | pts) | 9.5 | % | 11.1 | % | (1.6 | pts) | |
Operating ratio | 121.4 | % | 99.2 | % | 22.2 | pts | 111.3 | % | 97.2 | % | 14.1 | pts | |
Excluding the impact of the large national healthcare account's tail policy, the COVID-19 reserve and the 2019 E&O liability policy reserve (see previous discussion in this section under the heading "Expenses"), our operating ratio was relatively unchanged for the 2020 three-month period and increased 2.7 percentage points for the 2020 six-month period as compared to the same respective periods of 2019. The operating ratio in both the 2020 three- and six- month periods was affected by a lower investment income ratio primarily due to a decrease in our allocation to equities as well as lower yields on our short-term investments given the recent actions taken by the Federal Reserve to aggressively reduce interest rates in response to COVID-19. Furthermore, we have reduced the rate of reinvestment of the proceeds from our investment portfolio maturities in order to allow for additional cash availability. For the 2020 three-month period, the impact of the lower investment income ratio was offset by a lower net loss ratio in our Specialty P&C segment due to a lower current accident year net loss ratio, excluding the aforementioned events, as well as a higher amount of net favorable prior year reserve development recognized as compared to the same period of 2019 (see previous discussion in this section under the heading "Expenses").
ROE
ROE is calculated as annualized net income (loss) for the period divided by the average of beginning and ending shareholders’ equity. This ratio measures our overall after-tax profitability and shows how efficiently capital is being used. ROE for the three and six months ended June 30, 2020 and 2019 was as follows:
Three Months Ended June 30 | Six Months Ended June 30 | ||||||||||||
2020 | 2019 | Change | 2020 | 2019 | Change | ||||||||
ROE | (5.0 | %) | 2.9 | % | (7.9 | pts) | (5.4 | %) | 5.6 | % | (11.0 | pts) | |
The decrease in our ROE for the 2020 three- and six- month periods as compared to the same periods of 2019 was driven by the tail policy for a large national healthcare account, as previously discussed, which resulted in a net underwriting loss of $45.7 million recognized in the second quarter of 2020 related to this coverage. Additionally, our ROE during the 2020 three- and six- month periods was impacted by lower reported earnings from our LP/LLC investments driven by the impact of the disruption in global financial markets during the first quarter of 2020 due to COVID-19. Given the results of our investments in LPs/LLCs are often reported to us on a one-quarter lag, the impact of COVID-19 on the global financial markets during the first quarter of 2020 was not captured in our results until the current period.
75
Book Value per Share
Book value per share is calculated as total shareholders’ equity at the balance sheet date divided by the total number of common shares outstanding. This ratio measures the net worth of the Company to shareholders on a per-share basis. Our book value per share at June 30, 2020 as compared to December 31, 2019 is shown in the following table.
Book Value Per Share | |||
Book Value Per Share at December 31, 2019 | $ | 28.11 | |
Increase (decrease) to book value per share during the six months ended June 30, 2020 attributable to: | |||
Dividends declared | (0.36 | ) | |
Net income (loss) | (0.74 | ) | |
OCI | 0.45 | ||
Other * | (0.10 | ) | |
Book Value Per Share at June 30, 2020 | $ | 27.36 | |
* Includes the impact of cumulative effect adjustments related to ASUs adopted during 2020 and the impact of share-based compensation. | |||
76
Non-GAAP Financial Measures
Non-GAAP operating income (loss) is a financial measure that is widely used to evaluate performance within the insurance sector. In calculating Non-GAAP operating income (loss), we have excluded the effects of the items listed in the following table that do not reflect normal operating results. We believe Non-GAAP operating income (loss) presents a useful view of the performance of our insurance operations, however it should be considered in conjunction with net income (loss) computed in accordance with GAAP.
The following table is a reconciliation of net income (loss) to Non-GAAP operating income (loss):
Three Months Ended June 30 | Six Months Ended June 30 | ||||||||||||||
(In thousands, except per share data) | 2020 | 2019 | 2020 | 2019 | |||||||||||
Net income (loss) | $ | (18,099 | ) | $ | 11,536 | $ | (40,053 | ) | $ | 43,186 | |||||
Items excluded in the calculation of Non-GAAP operating income (loss): | |||||||||||||||
Net realized investment (gains) losses | (19,985 | ) | (9,308 | ) | 8,688 | (45,931 | ) | ||||||||
Net realized gains (losses) attributable to SPCs which no profit/loss is retained (1) | 2,075 | (79 | ) | (423 | ) | 1,663 | |||||||||
Guaranty fund assessments (recoupments) | 29 | 18 | 27 | 106 | |||||||||||
Pre-tax effect of exclusions | (17,881 | ) | (9,369 | ) | 8,292 | (44,162 | ) | ||||||||
Tax effect, at 21% (2) | 3,539 | 1,967 | (1,826 | ) | 9,274 | ||||||||||
After-tax effect of exclusions | (14,342 | ) | (7,402 | ) | 6,466 | (34,888 | ) | ||||||||
Non-GAAP operating income (loss) | $ | (32,441 | ) | $ | 4,134 | $ | (33,587 | ) | $ | 8,298 | |||||
Per diluted common share: | |||||||||||||||
Net income (loss) | $ | (0.34 | ) | $ | 0.21 | $ | (0.74 | ) | $ | 0.80 | |||||
Effect of exclusions | (0.26 | ) | (0.13 | ) | 0.12 | (0.65 | ) | ||||||||
Non-GAAP operating income (loss) per diluted common share | $ | (0.60 | ) | $ | 0.08 | $ | (0.62 | ) | $ | 0.15 | |||||
(1) Net realized investment gains (losses) on investments related to SPCs are recognized in our Segregated Portfolio Cell Reinsurance segment. SPC operating results, including any realized gain or loss, that are attributable to external cell participants are reflected in the SPC dividend expense (income). To be consistent with our exclusion of net realized investment gains (losses) recognized in earnings, we are excluding the portion of net realized investment gains (losses) that is included in the SPC dividend expense (income) which is attributable to the external cell participants. | |||||||||||||||
(2) The 21% rate is the annual expected statutory tax rate associated with the taxable or tax deductible items listed above. Our effective tax rate for the respective periods was applied to these items in calculating net income (loss), excluding net realized investment gains (losses) and related adjustments. Net realized investment gains (losses) in our Corporate segment are discrete items and are tax affected at the annual expected statutory tax rate (21%) in the period they are included in our consolidated tax provision and net income (loss). See previous discussion in this section under the heading "Taxes." The taxes associated with the net realized investment gains (losses) related to SPCs in our Segregated Portfolio Cell Reinsurance segment are paid by the individual SPCs and are not included in our consolidated tax provision or net income (loss); therefore, both the net realized investment gains (losses) from our Segregated Portfolio Cell Reinsurance segment and the adjustment to exclude the portion of net realized investment gains (losses) included in the SPC dividend expense (income) in the table above are not tax effected. | |||||||||||||||
77
Segment Operating Results - Specialty Property & Casualty
Our Specialty P&C segment focuses on professional liability insurance and medical technology liability insurance as discussed in Note 12 of the Notes to Condensed Consolidated Financial Statements. Segment operating results reflected pre-tax underwriting profit or loss from these insurance lines, exclusive of investment results, which are included in our Corporate segment. Segment operating results included the following:
Three Months Ended June 30 | Six Months Ended June 30 | ||||||||||||||||||||||
($ in thousands) | 2020 | 2019 | Change | 2020 | 2019 | Change | |||||||||||||||||
Net premiums written | $ | 92,682 | $ | 111,253 | $ | (18,571 | ) | (16.7 | %) | $ | 223,937 | $ | 251,909 | $ | (27,972 | ) | (11.1 | %) | |||||
Net premiums earned | $ | 127,096 | $ | 126,011 | $ | 1,085 | 0.9 | % | $ | 247,456 | $ | 250,079 | $ | (2,623 | ) | (1.0 | %) | ||||||
Other income | 1,092 | 1,470 | (378 | ) | (25.7 | %) | 2,788 | 2,680 | 108 | 4.0 | % | ||||||||||||
Net losses and loss adjustment expenses | (159,559 | ) | (106,017 | ) | (53,542 | ) | 50.5 | % | (270,491 | ) | (213,675 | ) | (56,816 | ) | 26.6 | % | |||||||
Underwriting, policy acquisition and operating expenses | (25,234 | ) | (29,863 | ) | 4,629 | (15.5 | %) | (54,818 | ) | (59,480 | ) | 4,662 | (7.8 | %) | |||||||||
Segment operating results | $ | (56,605 | ) | $ | (8,399 | ) | $ | (48,206 | ) | (573.9 | %) | $ | (75,065 | ) | $ | (20,396 | ) | $ | (54,669 | ) | (268.0 | %) | |
Net loss ratio | 125.5 | % | 84.1 | % | 41.4 pts | 109.3 | % | 85.4 | % | 23.9 pts | |||||||||||||
Underwriting expense ratio | 19.9 | % | 23.7 | % | (3.8 pts) | 22.2 | % | 23.8 | % | (1.6 pts) | |||||||||||||
During the second quarter of 2020, a large national healthcare account did not renew on terms offered by us and exercised its contractual option to purchase extended reporting endorsement or "tail" coverage. As a result, we recognized a net underwriting loss of $45.7 million related to this policy within our Specialty P&C segment for the three and six months ended June 30, 2020. Furthermore, during the second quarter of 2020, we established a $10 million reserve representing our best estimate of ultimate COVID-19 related losses based on currently available information. See further discussion that follows under the headings "Gross Premiums Written" and "Losses."
Premiums Written
Changes in our premium volume within our Specialty P&C segment are driven by four primary factors: (1) the amount of new business written, (2) our retention of existing business, (3) the premium charged for business that is renewed, which is affected by rates charged and by the amount and type of coverage an insured chooses to purchase and (4) the timing of premium written through multi-period policies. In addition, premium volume may periodically be affected by shifts in the timing of renewals between periods. The professional liability market, which accounts for a majority of the revenues in this segment, remains challenging as physicians continue joining hospitals or larger group practices and are thus no longer purchasing individual or group policies in the standard market. In addition, some competitors have chosen to compete primarily on price; both factors may impact our ability to write new business and retain existing business. Furthermore, the insurance and reinsurance markets have historically been cyclical, characterized by extended periods of intense price competition and other periods of reduced competition. The professional liability area has been particularly affected by these cycles. Underwriting cycles are generally driven by an excess of capacity available and actively pursuing business that is deemed profitable. Changes in the frequency and severity of losses may affect the cycles of the insurance and reinsurance markets significantly. During “soft markets” where price competition is high and underwriting profits are poor, growth and retention of business become challenging which may result in reduced premium volumes. As a result of COVID-19, we are beginning to experience downward pressure on our premium volume resulting from new business disruptions and reductions in exposure due to insureds moving to part-time as a result of a general reduction in non-COVID-19 healthcare consumption and suspension of elective medical procedures; however, the length and magnitude of such changes depends on future developments, which are highly uncertain and cannot be predicted. In an effort to provide premium relief for insureds adversely impacted by the COVID-19 pandemic and to adjust for changes in exposures we granted premium credits totaling $3.7 million during the 2020 three- and six- month periods.
78
Gross, ceded and net premiums written were as follows:
Three Months Ended June 30 | Six Months Ended June 30 | ||||||||||||||||||||||||||||
($ in thousands) | 2020 | 2019 | Change | 2020 | 2019 | Change | |||||||||||||||||||||||
Gross premiums written | $ | 107,065 | $ | 127,901 | $ | (20,836 | ) | (16.3 | %) | $ | 262,445 | $ | 294,333 | $ | (31,888 | ) | (10.8 | %) | |||||||||||
Less: Ceded premiums written | 14,383 | 16,648 | (2,265 | ) | (13.6 | %) | 38,508 | 42,424 | (3,916 | ) | (9.2 | %) | |||||||||||||||||
Net premiums written | $ | 92,682 | $ | 111,253 | $ | (18,571 | ) | (16.7 | %) | $ | 223,937 | $ | 251,909 | $ | (27,972 | ) | (11.1 | %) | |||||||||||
Gross Premiums Written
During the second quarter of 2020, we reorganized our presentation of gross premiums written by component and related metrics below to better align with the current internal management reporting structure within the segment. All prior period information has been recast to conform to the current period presentation.
Gross premiums written by component were as follows:
Three Months Ended June 30 | Six Months Ended June 30 | ||||||||||||||||||||||||||||
($ in thousands) | 2020 | 2019 | Change | 2020 | 2019 | Change | |||||||||||||||||||||||
Professional Liability | |||||||||||||||||||||||||||||
HCPL | |||||||||||||||||||||||||||||
Standard Physician(1)(9) | |||||||||||||||||||||||||||||
Twelve month term | $ | 45,019 | $ | 50,598 | $ | (5,579 | ) | (11.0 | %) | $ | 108,917 | $ | 117,756 | $ | (8,839 | ) | (7.5 | %) | |||||||||||
Twenty-four month term | 947 | 10,081 | (9,134 | ) | (90.6 | %) | 8,314 | 16,867 | (8,553 | ) | (50.7 | %) | |||||||||||||||||
Total Standard physician | 40,339 | 53,452 | (13,113 | ) | (24.5 | %) | $ | 104,623 | $ | 119,771 | (15,148 | ) | (12.6 | %) | |||||||||||||||
Specialty | |||||||||||||||||||||||||||||
Custom Physician(2)(9) | 5,696 | 17,420 | (11,724 | ) | (67.3 | %) | 36,442 | 51,795 | (15,353 | ) | (29.6 | %) | |||||||||||||||||
Hospitals and Facilities(3)(9) | 9,662 | 11,340 | (1,678 | ) | (14.8 | %) | 25,933 | 27,496 | (1,563 | ) | (5.7 | %) | |||||||||||||||||
Senior Care(4)(9) | 480 | 3,625 | (3,145 | ) | (86.8 | %) | 4,104 | 11,784 | (7,680 | ) | (65.2 | %) | |||||||||||||||||
Reinsurance (assumed) | 2,477 | 2,517 | (40 | ) | (1.6 | %) | 7,266 | 7,178 | 88 | 1.2 | % | ||||||||||||||||||
Total Specialty | 18,315 | 34,902 | (16,587 | ) | (47.5 | %) | 73,745 | 98,253 | (24,508 | ) | (24.9 | %) | |||||||||||||||||
Total HCPL | 58,654 | 88,354 | (29,700 | ) | (33.6 | %) | 178,368 | 218,024 | (39,656 | ) | (18.2 | %) | |||||||||||||||||
Small Business Unit(5) | 20,505 | 23,180 | (2,675 | ) | (11.5 | %) | 43,405 | 48,144 | (4,739 | ) | (9.8 | %) | |||||||||||||||||
Tail Coverages(6) | 17,818 | 4,752 | 13,066 | 275.0 | % | 24,007 | 9,181 | 14,826 | 161.5 | % | |||||||||||||||||||
Total Professional Liability | 96,977 | 116,286 | (19,309 | ) | (16.6 | %) | 245,780 | 275,349 | (29,569 | ) | (10.7 | %) | |||||||||||||||||
Medical Technology Liability(7) | 9,885 | 9,937 | (52 | ) | (0.5 | %) | 16,104 | 17,140 | (1,036 | ) | (6.0 | %) | |||||||||||||||||
Other(8) | 203 | 1,678 | (1,475 | ) | (87.9 | %) | 561 | 1,844 | (1,283 | ) | (69.6 | %) | |||||||||||||||||
Total | $ | 107,065 | $ | 127,901 | $ | (20,836 | ) | (16.3 | %) | $ | 262,445 | $ | 294,333 | $ | (31,888 | ) | (10.8 | %) | |||||||||||
(1) | Standard Physician premium was our greatest source of premium revenues in both 2020 and 2019 and is predominately comprised of twelve month term policies. The decrease in twelve month term policies during the 2020 three- and six- month periods was driven by retention losses and, to a lesser extent, premium credits granted as a result of the COVID-19 pandemic, partially offset by an increase in renewal pricing and, to a lesser extent, new business written. The lower retention for the 2020 three- and six- month periods is largely attributable to our focus on underwriting discipline as we continue to emphasize careful risk selection, rate adequacy, improved contract terms and a willingness to walk away from business that does not fit our goal of achieving a long-term underwriting profit. In addition, we have implemented a targeted state strategy to reassess our underwriting appetite in certain unprofitable states which impacted our retention rate in the current period. We will continue to perform a detailed evaluation of venues, specialties and other areas to improve our underwriting results. These strategies resulted in our non-renewal of a few large policies totaling $1.8 million and $3.3 million, respectively. We anticipate a lower than average level of retention to persist as we continue to reevaluate certain states and books of business and set our rates to reflect our observations of higher severity trends. For the 2020 three- and six- month periods, renewal pricing increases reflect the rising loss cost environment and new business written reflects the impact of lower submissions as a result of the COVID-19 pandemic as well as general market conditions. Standard Physician premium includes twenty-four month term premiums that were offered to physician insureds in one selected |
79
jurisdiction. The decrease in twenty-four month term premiums during the 2020 three- and six- month periods primarily reflected the normal cycle of renewals (policies subject to renewal in 2020 were previously written in 2018, rather than in 2019). In addition, the decrease in twenty-four month term premiums was due to the majority of renewed policies converting to twelve-month term policies, as we have ceased offering twenty-four month term policies beginning in the second quarter of 2020.
(2) | Custom Physician premium includes large complex physician groups, multi-state physician groups and non-standard physicians and is written primarily on an excess and surplus lines basis. The decrease in premium during the 2020 three- and six- month periods was driven by a large national healthcare account that did not renew on terms offered by us resulting in a $9.0 million decrease in Custom Physician premium; this account exercised its contractual option to purchase extended reporting endorsement or "tail" coverage (see further discussion in footnote 6 that follows). Excluding the effect of this policy, Custom Physician premium decreased $2.7 million and $6.4 million during the 2020 three- and six- month periods, respectively, as compared to the same periods of 2019. The decrease during the 2020 three- and six- month periods was driven by retention losses and, to a lesser extent, timing differences of $0.6 million and $1.9 million, respectively, primarily related to the prior year renewal of certain policies, partially offset by an increase in renewal pricing and, to a lesser extent, new business written. For the 2020 three- and six- month periods, renewal pricing increases reflect the rising loss cost environment and new business written reflects the impact of lower submissions as a result of the COVID-19 pandemic as well as general market conditions. The lower retention for the 2020 three- and six- month periods is largely attributable to the non-renewal of the aforementioned large national healthcare account, which resulted in a decrease to our Specialty retention rate of 13 and 9 percentage points, respectively. The lower retention in 2020 also reflects our focus on underwriting discipline as we continue to emphasize careful risk selection, rate adequacy, improved contract terms and a willingness to walk away from business that does not fit our goal of achieving a long-term underwriting profit. We anticipate a lower than average level of retention to persist as we continue to reevaluate certain books of business and set our rates to reflect our observations of higher severity trends. |
(3) | Hospitals and Facilities premium (which includes hospitals, surgery centers and miscellaneous medical facilities) decreased for the 2020 three- and six- month periods as compared to the same periods in 2019 primarily due to retention losses, partially offset by an increase in renewal pricing and, to a lesser extent, new business written. For the 2020 three- and six- month periods, renewal pricing increases reflect rate increases and contract modifications that we believe are appropriate given the current loss environment and new business written reflects lower submissions as a result of COVID-19 as well as general market conditions. Retention losses in the 2020 three- and six- month periods were driven by our decision not to renew certain products, and the loss of one large policy totaling $2.7 million during the second quarter of 2020, which resulted in a decrease to our Specialty retention rate of 3 and 2 percentage points, respectively. As we continue to reevaluate certain books of business, we anticipate our retention to remain at a lower than historic level. |
(4) | Senior Care premium includes facilities specializing in long term residential care primarily for the elderly ranging from independent living through skilled nursing. Our Senior Care premium decreased for the 2020 three- and six- month periods as compared to the same respective periods of 2019 primarily due to retention losses, partially offset by an increase in renewal pricing and, to a lesser extent, new business written. Retention losses in the 2020 three- and six- month periods were driven by our decision not to renew certain classes of Senior Care business based on our expectations of poor loss performance and, for the 2020 six-month period, the loss of one large policy totaling $1.4 million due to price competition during the first quarter of 2020. As we continue to reevaluate certain books of business, we anticipate our retention to remain at a lower than historic level. Renewal pricing increases in 2020 reflect rate increases where we believe appropriate given the loss environment in this space. |
(5) | Our Small Business Unit is primarily comprised of premium associated with podiatrists, legal professionals, dentists and chiropractors. Our Small Business Unit premium decreased for the 2020 three- and six- month periods as compared to the same respective periods of 2019 driven by retention losses and, to a lesser extent, reductions in exposure of $2.0 million primarily due to our insureds moving to part-time as a result of a general reduction in non-COVID-19 healthcare consumption during the second quarter of 2020, partially offset by an increase in renewal pricing and, to a lesser extent, new business written. The increase in renewal pricing was primarily the result of an increase in the rate charged for certain renewed policies in select states. |
(6) | We offer extended reporting endorsement or "tail" coverage to insureds who discontinue their claims-made coverage with us, and we also periodically offer tail coverage through stand-alone policies. Tail coverage premiums are generally 100% earned in the period written because the policies insure only incidents that occurred in prior periods and are not cancellable. The amount of tail coverage premium written can vary significantly from period to period. In the second quarter of 2020, a large national healthcare account exercised its contractual option to purchase tail |
80
coverage which resulted in $14.3 million of one-time premium written and fully earned in the 2020 three- and six- month periods.
(7) | Our Medical Technology Liability business is marketed throughout the U.S.; coverage is typically offered on a primary basis, within specified limits, to manufacturers and distributors of medical technology and life sciences products including entities conducting human clinical trials. In addition to the previously listed factors that affect our premium volume, our Medical Technology Liability premium is impacted by the sales volume of insureds. The decrease during the 2020 three- and six- month periods was primarily due to retention losses and, to a lesser extent, renewal pricing decreases, partially offset by new business written, including the addition of a few COVID-19 related policies during the second quarter of 2020. Retention losses in the 2020 three- and six- month periods are primarily attributable to an increase in competition on terms and pricing. Renewal pricing decreases during the 2020 three- and six- month periods are primarily due to changes in the sales volume of certain insureds, including changes in COVID-19 related exposure on several renewing policies. |
(8) | This component of gross premiums written includes all other product lines within our Specialty P&C segment. The decrease during the 2020 three- and six- month periods was due to the effect of our non-renewal of a $1.5 million specialty contractual liability policy. |
(9) | Certain components of our gross premiums written include alternative market premiums. We currently cede either all or a portion of the alternative market premium, net of reinsurance, to three SPCs of our wholly owned Cayman Islands reinsurance subsidiaries, Inova Re and Eastern Re, which are reported in our Segregated Portfolio Cell Reinsurance segment (see further discussion in the Ceded Premiums Written section that follows). The portion not ceded to the SPCs is retained within our Specialty P&C segment. |
Three Months Ended June 30 | Six Months Ended June 30 | ||||||||||||||||||||||||||||
($ in millions) | 2020 | 2019 | Change | 2020 | 2019 | Change | |||||||||||||||||||||||
Standard Physician | $ | 1.6 | $ | 1.4 | $ | 0.2 | 14.3 | % | $ | 1.6 | $ | 1.4 | $ | 0.2 | 14.3 | % | |||||||||||||
Custom Physician | — | — | — | nm | 0.1 | 0.2 | (0.1 | ) | (50.0 | %) | |||||||||||||||||||
Hospitals and Facilities | — | — | — | nm | 0.1 | — | 0.1 | nm | |||||||||||||||||||||
Senior Care | 0.2 | 0.2 | — | — | % | 3.8 | 3.7 | 0.1 | 2.7 | % | |||||||||||||||||||
Total | $ | 1.8 | $ | 1.6 | $ | 0.2 | 12.5 | % | $ | 5.6 | $ | 5.3 | $ | 0.3 | 5.7 | % | |||||||||||||
Alternative market gross premiums written remained relatively unchanged during the 2020 three- and six- month periods as compared to the same periods of 2019.
We are committed to a rate structure that will allow us to fulfill our obligations to our insureds, while generating competitive long-term returns for our shareholders. Our pricing continues to be based on expected losses as indicated by our historical loss data and available industry loss data. In recent years, this practice has resulted in gradual rate increases and we anticipate further rate increases due to indications of increasing loss severity. Additionally, the pricing of our business includes the effects of filed rates, surcharges and discounts. Renewal pricing also reflects changes in our exposure base, deductibles, self-insurance retention limits and other policy terms and conditions.
The change in renewal pricing for our Specialty P&C segment, including by major component, was as follows:
Three Months Ended June 30 | Six Months Ended June 30 | ||||
2020 | 2020 | ||||
Specialty P&C segment | 9 | % | 11 | % | |
HCPL | |||||
Standard Physician(1) | 12 | % | 12 | % | |
Specialty(1) | 20 | % | 18 | % | |
Total HCPL | 13 | % | 14 | % | |
Small Business Unit | 3 | % | 3 | % | |
Medical Technology Liability(1) | (2 | %) | (3 | %) | |
(1) See Gross Premiums Written section for further explanation of changes in renewal pricing. | |||||
81
New business written by major component on a direct basis was as follows:
Three Months Ended June 30 | Six Months Ended June 30 | ||||||||||||||
(In millions) | 2020 | 2019 | 2020 | 2019 | |||||||||||
HCPL | |||||||||||||||
Standard Physician | $ | 0.4 | $ | 1.2 | $ | 1.0 | $ | 6.3 | |||||||
Specialty | 1.1 | 4.4 | 3.0 | 18.2 | |||||||||||
Total HCPL | 1.5 | 5.6 | 4.0 | 24.5 | |||||||||||
Small Business Unit | 1.1 | 1.2 | 2.3 | 2.3 | |||||||||||
Medical Technology Liability | 2.0 | 1.3 | 2.7 | 2.2 | |||||||||||
Total | $ | 4.6 | $ | 8.1 | $ | 9.0 | $ | 29.0 | |||||||
For our Specialty P&C segment, we calculate retention as annualized renewed premium divided by all annualized premium subject to renewal. Retention is affected by a number of factors. We may lose insureds to competitors or to alternative insurance mechanisms such as risk retention groups or self-insurance entities (often when physicians join hospitals or large group practices) or due to pricing or other issues. We may choose not to renew an insured as a result of our underwriting evaluation. Insureds may also terminate coverage because they have left the practice of medicine for various reasons, principally for retirement, death or disability, but also for personal reasons.
Retention for our Specialty P&C segment, including by major component, was as follows:
Three Months Ended June 30 | Six Months Ended June 30 | ||||||||||
2020 | 2019 | 2020 | 2019 | ||||||||
Specialty P&C segment | 71 | % | 87 | % | 77 | % | 88 | % | |||
HCPL | |||||||||||
Standard Physician(1) | 82 | % | 87 | % | 81 | % | 88 | % | |||
Specialty(1) | 29 | % | 87 | % | 60 | % | 87 | % | |||
Total HCPL | 63 | % | 87 | % | 73 | % | 88 | % | |||
Small Business Unit | 91 | % | 91 | % | 88 | % | 91 | % | |||
Medical Technology Liability(1) | 88 | % | 89 | % | 84 | % | 85 | % | |||
(1) See Gross Premiums Written section for further explanation of retention decline in 2020. | |||||||||||
82
Ceded Premiums Written
Ceded premiums represent the amounts owed to our reinsurers for their assumption of a portion of our losses. Through our current excess of loss reinsurance arrangements we generally retain the first $1 million in risk insured by us and cede coverages in excess of this amount. For our HCPL coverages, we also retain from 4% to 9% of the next $25 million of risk for coverages in excess of $1 million. For our Medical Technology Liability coverages, we also retain 10% of the next $9 million of risk for coverages in excess of $1 million. We pay our reinsurers a ceding premium in exchange for their accepting the risk, and in certain of our excess of loss arrangements, the ultimate amount of which is determined by the loss experience of the business ceded, subject to certain minimum and maximum amounts.
Given the length of time that it takes to resolve our claims, many years may elapse before all losses recoverable under a reinsurance arrangement are known. As a part of the process of estimating our loss reserve we also make estimates regarding the amounts recoverable under our reinsurance arrangements. As a result, we may have an adjustment to our estimate of expected losses and associated recoveries for prior year ceded losses under certain loss sensitive reinsurance agreements. Any changes to estimates of premiums ceded related to prior accident years are fully earned in the period the changes in estimates occur.
Ceded premiums written were as follows:
Three Months Ended June 30 | Six Months Ended June 30 | ||||||||||||||||||||||
($ in thousands) | 2020 | 2019 | Change | 2020 | 2019 | Change | |||||||||||||||||
Excess of loss reinsurance arrangements (1) | $ | 8,111 | $ | 8,661 | $ | (550 | ) | (6.4 | %) | $ | 16,728 | $ | 17,982 | $ | (1,254 | ) | (7.0 | %) | |||||
Other shared risk arrangements (2) | 4,314 | 6,135 | (1,821 | ) | (29.7 | %) | 15,178 | 17,853 | (2,675 | ) | (15.0 | %) | |||||||||||
Premium ceded to SPCs (3) | 1,298 | 1,152 | 146 | 12.7 | % | 5,082 | 4,890 | 192 | 3.9 | % | |||||||||||||
Other ceded premiums written | 660 | 700 | (40 | ) | (5.7 | %) | 1,520 | 1,699 | (179 | ) | (10.5 | %) | |||||||||||
Total ceded premiums written | $ | 14,383 | $ | 16,648 | $ | (2,265 | ) | (13.6 | %) | $ | 38,508 | $ | 42,424 | $ | (3,916 | ) | (9.2 | %) | |||||
(1) | We generally reinsure risks under our excess of loss reinsurance arrangements pursuant to which the reinsurers agree to assume all or a portion of all risks that we insure above our individual risk retention levels, up to the maximum individual limits offered. Premium due to reinsurers also fluctuates with the volume of written premium subject to cession under the arrangement. In certain of our excess of loss reinsurance arrangements, the premium due to the reinsurer is determined by the loss experience of that business reinsured, subject to certain minimum and maximum amounts. Premium due to reinsurers also fluctuates with the volume of written premium subject to cession under the arrangement. The decrease in ceded premiums written under our excess of loss reinsurance arrangements during the 2020 three- and six- month periods as compared to the same periods of 2019 primarily reflected a decrease in the overall volume of gross premiums written subject to cession, partially offset by the effect of changes to both minimum and maximum limits for the treaty year effective October 1, 2019. |
(2) | We have entered into various shared risk arrangements, including quota share, fronting, and captive arrangements, with certain large healthcare systems and other insurance entities. These arrangements include our Ascension Health and CAPAssurance programs. While we cede a large portion of the premium written under these arrangements, they provide us an opportunity to grow net premium through strategic partnerships. The decrease in ceded premiums written under our shared risk arrangements during the 2020 three- and six- month periods as compared to the same respective periods of 2019 was primarily due to a decrease in premium ceded to our Ascension Health program and our non-renewal of one large policy in our CAPAssurance program during the second quarter of 2020. Additionally, the decrease during the 2020 six-month period included a timing difference of $0.9 million related to the prior year renewal of a policy in our CAPAssurance program. |
(3) | As previously discussed, as a part of our alternative market solutions, all or a portion of certain healthcare premium written is ceded to SPCs in our Segregated Portfolio Cell Reinsurance segment under either excess of loss or quota share reinsurance agreements, depending on the structure of the individual program. See the Segment Operating Results - Segregated Portfolio Cell Reinsurance section for further discussion on the cession to the SPCs from our Specialty P&C segment. Premiums ceded to SPCs during the 2020 three- and six- month periods remained relatively unchanged as compared to the same periods of 2019. |
83
Ceded Premiums Ratio
The ceded premiums ratios were as follows:
Three Months Ended June 30 | Six Months Ended June 30 | ||||||||||
2020 | 2019 | Change | 2020 | 2019 | Change | ||||||
Ceded premiums ratio | 13.4% | 13.0% | 0.4 pts | 14.7% | 14.4% | 0.3 pts | |||||
The increase in the ceded premiums ratio during the 2020 three- and six- month periods was primarily due to changes in retention limits under our excess of loss reinsurance agreements, and, to a lesser extent, an increase in premium ceded to the SPCs in our Segregated Portfolio Cell Reinsurance segment. The increase in the ratio during the 2020 three- and six- month periods was partially offset by a decrease in premiums ceded under our shared risk arrangements and, to a lesser extent, the effect of the aforementioned large national healthcare account tail policy (increase in gross premiums written with minimal premium ceded). See discussion above under the heading "Ceded Premiums Written."
Net Premiums Earned
Net premiums earned consist of gross premiums earned less the portion of earned premiums that we cede to our reinsurers for their assumption of a portion of our losses. Because premiums are generally earned pro rata over the entire policy period, fluctuations in premiums earned tend to lag those of premiums written. Generally, our policies carry a term of one year; however we write certain Standard Physician policies with a twenty-four month term, and a few of our Medical Technology Liability policies have a multi-year term. Tail coverage premiums are generally 100% earned in the period written because the policies insure only incidents that occurred in prior periods and are not cancellable. Retroactive coverage premiums are 100% earned at the inception of the contract, as all of the underlying loss events occurred in the past. Additionally, any ceded premium changes due to changes to estimates of premiums owed under reinsurance agreements for prior accident years are fully earned in the period of change.
Net premiums earned were as follows:
Three Months Ended June 30 | Six Months Ended June 30 | ||||||||||||||||||||||||||||
($ in thousands) | 2020 | 2019 | Change | 2020 | 2019 | Change | |||||||||||||||||||||||
Gross premiums earned | $ | 145,547 | $ | 145,169 | $ | 378 | 0.3 | % | $ | 284,570 | $ | 288,186 | $ | (3,616 | ) | (1.3 | %) | ||||||||||||
Less: Ceded premiums earned | 18,451 | 19,158 | (707 | ) | (3.7 | %) | 37,114 | 38,107 | (993 | ) | (2.6 | %) | |||||||||||||||||
Net premiums earned | $ | 127,096 | $ | 126,011 | $ | 1,085 | 0.9 | % | $ | 247,456 | $ | 250,079 | $ | (2,623 | ) | (1.0 | %) | ||||||||||||
Gross premiums earned during the 2020 three- and six- month periods included tail coverage associated with a large national healthcare account which resulted in $14.3 million of one-time premium written and fully earned in the current period (see previous discussion in footnote 6 under the heading "Gross Premiums Written"). After removing the impact of this tail policy, gross premiums earned decreased $13.9 million and $17.9 million during the 2020 three- and six- month periods, respectively, driven by the pro rata effect of a decrease in the volume of written premium during the preceding twelve months, predominantly in our Specialty line of business due to our focus on underwriting discipline.
The decrease in ceded premiums earned during both the 2020 three- and six- month periods as compared to the same periods of 2019 was driven by the pro rata effect of a decrease in premium ceded under our shared risk and excess of loss arrangements during the preceding twelve months.
Losses and Loss Adjustment Expenses
The determination of calendar year losses involves the actuarial evaluation of incurred losses for the current accident year and the actuarial re-evaluation of incurred losses for prior accident years, including an evaluation of the reserve amounts required for ECO/XPL losses. As part of the review of our prior accident year reserves, we also make estimates of expected losses and associated recoveries for prior year ceded losses under certain loss sensitive reinsurance agreements. This analysis may result in reductions to estimates of premiums owed under reinsurance agreements for prior accident years which impacts net premiums earned (the denominator of the net loss ratio) in the period the adjustment is made; no such adjustments were made during the three and six months ended June 30, 2020 or 2019. See previous discussion under the heading "Ceded Premiums Written" for additional information.
Accident year refers to the accounting period in which the insured event becomes a liability of the insurer. For claims-made policies, which represent the majority of the premiums written in our Specialty P&C segment, the insured event generally becomes a liability when the event is first reported to us. For occurrence policies, the insured event becomes a liability when the event takes place. For retroactive coverages, the insured event becomes a liability at inception of the underlying contract. We believe that measuring losses on an accident year basis is the best measure of the underlying profitability of the premiums
84
earned in that period, since it associates policy premiums earned with the estimate of the losses incurred related to those policy premiums.
The following table summarizes calendar year net loss ratios by separating losses between the current accident year and all prior accident years. The net loss ratios for our Specialty P&C segment were as follows:
Net Loss Ratios (1) | |||||||||||
Three Months Ended June 30 | Six Months Ended June 30 | ||||||||||
2020 | 2019 | Change | 2020 | 2019 | Change | ||||||
Calendar year net loss ratio | 125.5% | 84.1% | 41.4 pts | 109.3% | 85.4% | 23.9 pts | |||||
Less impact of prior accident years on the net loss ratio | (12.2%) | (9.9%) | (2.3 pts) | (7.2%) | (8.2%) | 1.0 pts | |||||
Current accident year net loss ratio (2) | 137.7% | 94.0% | 43.7 pts | 116.5% | 93.6% | 22.9 pts | |||||
(1) | Net losses, as specified, divided by net premiums earned. |
(2) | For the three and six months ended June 30, 2020, the current accident year net loss ratio (as shown in the table above), increased 43.7 and 22.9 percentage points, respectively, as compared to the same periods of 2019 primarily attributable to the following: |
(In percentage points) | Increase (Decrease), 2020 versus 2019 | |||
Comparative three-month period | Comparative six-month period | |||
Estimated ratio increase (decrease) attributable to: | ||||
Large National Healthcare Account Tail Policy | 35.8 pts | 18.6 pts | ||
COVID-19 Reserve | 8.9 pts | 4.3 pts | ||
All other, net | (1.0 pts) | — | ||
Increase in the current accident year net loss ratio | 43.7 pts | 22.9 pts | ||
As previously discussed, a large national healthcare account exercised its contractual option to purchase the extended reporting endorsement or "tail" coverage in the current quarter, which resulted in a net underwriting loss of $45.7 million recognized during the second quarter of 2020. This tail policy accounted for a 35.8 and 18.6 percentage point increase in our current accident year net loss ratio during the three and six months ended June 30, 2020, respectively. In addition, we established a $10 million reserve during the second quarter of 2020 for COVID-19. This reserve represents our best estimate of ultimate COVID-19 related losses based on currently available information and reported incidents, and increased our current accident year net loss ratio by 8.9 and 4.3 percentage points during the three and six months ended June 30, 2020, respectively. The remaining change in our current accident year net loss ratio for the 2020 three- and six- month periods, as shown in the table above, primarily reflected the impact of decreases to certain loss ratios in the second quarter of 2020 in our Standard Physician and Small Business Unit lines as a result of our re-underwriting efforts and focus on rate adequacy. For the 2020 six-month period, this impact was partially offset by higher severity trends in our HCPL book of business, particularly in our Specialty lines, as compared to what was reflected in our loss ratios during the first half of 2019. We reflected higher severity trends in our estimates of losses at the end of 2019; however, the current accident year net loss ratio for the first six months of 2020, excluding the large national healthcare account tail policy and the COVID-19 reserve, is approximately 5.2 percentage points lower as compared to the current accident year net loss ratio for the full year of 2019, excluding the 2019 impact of the large national healthcare account, due to our re-underwriting efforts.
We re-evaluate our previously established reserve each quarter based upon the most recently completed actuarial analysis supplemented by any new analysis, information or trends that have emerged since the date of that study. We also take into account currently available industry trend information. We continue to see elevated loss severity in the broader medical professional liability industry and are observing early indications of these increased severity trends in our paid loss data. Furthermore, there remain uncertainties around the impact that the COVID-19 pandemic will ultimately have on variables such as premium volume, claims frequency and severity, historical paid and incurred loss trends, general economic and social trends, inflation and the legal and political environment. While we have established a reserve for COVID-19 related losses in the current period, we have also observed a significant reduction in claims frequency during the second quarter of 2020 as compared to the same period in 2019, likely associated with the COVID-19 pandemic and the disruption of the court systems; however, we have remained cautious in recognizing these favorable frequency trends in our current accident year reserve due to the possibility of delays in reporting and uncertainty surrounding the length and severity of the pandemic.
85
We recognized net favorable loss development related to our previously established reserves of $15.4 million and $17.8 million during the three and six months ended June 30, 2020, respectively, as compared to $12.4 million and $20.3 million during the same respective periods of 2019. Development recognized during the three and six months ended June 30, 2020 included a reduction in our reserve for potential ECO/XPL claims of $0.4 million and $2.8 million, respectively, as compared to $0.4 million during each of the three and six months ended June 30, 2019. Development recognized during the three and six months ended June 30, 2020 principally related to accident years 2014 through 2018. Development recognized during the three and six months ended June 30, 2019 principally related to accident years 2012 through 2015.
A detailed discussion of factors influencing our recognition of loss development is included in our Critical Accounting Estimates section under the heading "Reserve for Losses and Loss Adjustment Expenses" and in our December 31, 2019 report on Form 10-K under the same heading. Assumptions used in establishing our reserve are regularly reviewed and updated by management as new data becomes available. Any adjustments necessary are reflected in the then current operations. Due to the size of our reserve, even a small percentage adjustment to the assumptions can have a material effect on our results of operations for the period in which the change is made, as was the case in both 2020 and 2019.
Underwriting, Policy Acquisition and Operating Expenses
Our Specialty P&C segment underwriting, policy acquisition and operating expenses were comprised as follows:
Three Months Ended June 30 | Six Months Ended June 30 | ||||||||||||||||||||||||||||
($ in thousands) | 2020 | 2019 | Change | 2020 | 2019 | Change | |||||||||||||||||||||||
DPAC amortization | $ | 13,635 | $ | 14,444 | $ | (809 | ) | (5.6 | %) | $ | 27,551 | $ | 28,535 | $ | (984 | ) | (3.4 | %) | |||||||||||
Management fees | 1,258 | 1,474 | (216 | ) | (14.7 | %) | 3,090 | 3,440 | (350 | ) | (10.2 | %) | |||||||||||||||||
Other underwriting and operating expenses | 10,341 | 13,945 | (3,604 | ) | (25.8 | %) | 24,177 | 27,505 | (3,328 | ) | (12.1 | %) | |||||||||||||||||
Total | $ | 25,234 | $ | 29,863 | $ | (4,629 | ) | (15.5 | %) | $ | 54,818 | $ | 59,480 | $ | (4,662 | ) | (7.8 | %) | |||||||||||
DPAC amortization decreased for the three and six months ended June 30, 2020 as compared to the same respective periods of 2019 driven by a decrease in earned premium, excluding the effect of the premium earned from the tail coverage associated with a large national healthcare account during the second quarter of 2020 as there were no deferred acquisition costs associated with the tail premium (see discussion under the heading "Gross Premiums Written"). In addition, the decrease in DPAC amortization during the 2020 three- and six- month periods reflected a decrease in brokerage expenses due to our non-renewal of certain products written on an excess and surplus lines basis in our Specialty line of business (see discussion under the heading "Gross Premiums Written") as well as a decrease in agent commissions and premium taxes due to a lower volume of premium written. Partially offsetting the decrease in DPAC amortization for both the 2020 three- and six- month periods was a decrease in ceding commission income, which is an offset to expense, from certain of our shared risk arrangements and one-time employee severance charges of $0.3 million related to the restructuring of our HCPL field office organization. For the 2020 six-month period, the decrease in DPAC amortization was also partially offset by an increase in medical costs associated with employee health plans during the first quarter of 2020.
Management fees are charged pursuant to a management agreement by the Corporate segment to the operating subsidiaries within our Specialty P&C segment for services provided based on the extent to which services are provided to the subsidiary and the amount of premium written by the subsidiary. While the terms of the management agreement were consistent between 2020 and 2019, fluctuations in the amount of premium written by each subsidiary can result in corresponding variations in the management fee charged to each subsidiary during a particular period.
Other underwriting and operating expenses decreased during the 2020 three- and six- month periods as compared to the same respective periods of 2019 driven by a decrease in various operational expenses resulting from incremental improvements over the past year including organizational structure enhancements and improved operating efficiencies, as well as a reduction in travel-related costs of $1.1 million during the second quarter of 2020 as a result of the COVID-19 pandemic. The decrease during the 2020 three- and six- month periods was partially offset by one-time expenses of $0.5 million and $1.9 million, respectively, primarily related to the restructuring of our HCPL field office organization. One-time restructuring expenses during the 2020 three- and six- month periods were comprised of employee severance charges and, for the 2020 six-month period, lease exit costs due to a reduction in physical office locations during the first quarter of 2020.
86
Underwriting Expense Ratio (the Expense Ratio)
Our expense ratio for the Specialty P&C segment for the three and six months ended June 30, 2020 and 2019, respectively, was as follows:
Three Months Ended June 30 | Six Months Ended June 30 | ||||||||||||||||
2020 | 2019 | Change | 2020 | 2019 | Change | ||||||||||||
Underwriting expense ratio | 19.9 | % | 23.7 | % | (3.8 | pts) | 22.2 | % | 23.8 | % | (1.6 | pts) | |||||
The underwriting expense ratio decreased for the three and six months ended June 30, 2020 as compared to the same periods of 2019 driven by the effect of tail premium associated with a large national healthcare account recognized during the second quarter of 2020 (net premiums earned with no associated operating expenses) which accounted for approximately 2.5 and 1.3 percentage points, respectively, of the decrease in the ratio as compared to the same periods of 2019. After removing the impact of the tail premium, the underwriting expense ratio decreased by 1.3 percentage points for the 2020 three-month period and remained relatively unchanged for the 2020 six-month period. The decrease for the 2020 three-month period, excluding the impact of the tail premium, was driven by a decrease in various operational expenses as a result of the COVID-19 pandemic, which accounted for a 1.0 percentage point decrease in the underwriting expense ratio, partially offset by a decrease in net premiums earned and certain one-time restructuring expenses, as previously discussed.
87
Segment Operating Results - Workers' Compensation Insurance
Our Workers' Compensation Insurance segment includes workers' compensation products provided to employers generally with 1,000 or fewer employees, as discussed in Note 12 of the Notes to Condensed Consolidated Financial Statements. Workers' compensation products offered include guaranteed cost policies, policyholder dividend policies, retrospectively-rated policies, deductible policies and alternative market programs. Alternative market programs include program design, fronting, claims administration, risk management, SPC rental, asset management and SPC management services. Alternative market program premiums are 100% ceded to either the SPCs within our Segregated Portfolio Cell Reinsurance segment or, to a limited extent, an unaffiliated captive insurer for one program. Our Workers' Compensation Insurance segment operating results reflected pre-tax underwriting profit or loss from these workers' compensation products, exclusive of investment results, which are included in our Corporate segment. Segment operating results included the following:
Three Months Ended June 30 | Six Months Ended June 30 | ||||||||||||||||||||||
($ in thousands) | 2020 | 2019 | Change | 2020 | 2019 | Change | |||||||||||||||||
Net premiums written | $ | 40,301 | $ | 45,031 | $ | (4,730 | ) | (10.5 | %) | $ | 90,613 | $ | 96,438 | $ | (5,825 | ) | (6.0 | %) | |||||
Net premiums earned | $ | 42,406 | $ | 46,574 | $ | (4,168 | ) | (8.9 | %) | $ | 86,921 | $ | 92,512 | $ | (5,591 | ) | (6.0 | %) | |||||
Other income | 519 | 725 | (206 | ) | (28.4 | %) | 1,276 | 1,454 | (178 | ) | (12.2 | %) | |||||||||||
Net losses and loss adjustment expenses | (28,425 | ) | (30,625 | ) | 2,200 | (7.2 | %) | (58,192 | ) | (61,068 | ) | 2,876 | (4.7 | %) | |||||||||
Underwriting, policy acquisition and operating expenses | (13,456 | ) | (14,368 | ) | 912 | (6.3 | %) | (27,622 | ) | (28,559 | ) | 937 | (3.3 | %) | |||||||||
Segment operating results | $ | 1,044 | $ | 2,306 | $ | (1,262 | ) | (54.7 | %) | $ | 2,383 | $ | 4,339 | $ | (1,956 | ) | (45.1 | %) | |||||
Net loss ratio | 67.0% | 65.8% | 1.2 pts | 66.9 | % | 66.0 | % | 0.9 pts | |||||||||||||||
Underwriting expense ratio | 31.7% | 30.8% | 0.9 pts | 31.8 | % | 30.9 | % | 0.9 pts | |||||||||||||||
Premiums Written
Our workers’ compensation premium volume is driven by five primary factors: (1) the amount of new business written, (2) retention of our existing book of business, (3) premium rates charged on our renewal book of business, (4) changes in payroll exposure and (5) audit premium.
Gross, ceded and net premiums written were as follows:
Three Months Ended June 30 | Six Months Ended June 30 | ||||||||||||||||||||||
($ in thousands) | 2020 | 2019 | Change | 2020 | 2019 | Change | |||||||||||||||||
Gross premiums written | $ | 57,208 | $ | 64,218 | $ | (7,010 | ) | (10.9 | %) | $ | 136,451 | $ | 153,572 | $ | (17,121 | ) | (11.1 | %) | |||||
Less: Ceded premiums written | 16,907 | 19,187 | (2,280 | ) | (11.9 | %) | 45,838 | 57,134 | (11,296 | ) | (19.8 | %) | |||||||||||
Net premiums written | $ | 40,301 | $ | 45,031 | $ | (4,730 | ) | (10.5 | %) | $ | 90,613 | $ | 96,438 | $ | (5,825 | ) | (6.0 | %) | |||||
88
Gross Premiums Written
Gross premiums written by product were as follows:
Three Months Ended June 30 | Six Months Ended June 30 | ||||||||||||||||||||||||||||
($ in thousands) | 2020 | 2019 | Change | 2020 | 2019 | Change | |||||||||||||||||||||||
Traditional business: | |||||||||||||||||||||||||||||
Guaranteed cost | $ | 35,049 | $ | 37,559 | $ | (2,510 | ) | (6.7 | %) | $ | 77,111 | $ | 80,296 | $ | (3,185 | ) | (4.0 | %) | |||||||||||
Policyholder dividend | 5,144 | 5,068 | 76 | 1.5 | % | 13,176 | 12,254 | 922 | 7.5 | % | |||||||||||||||||||
Deductible | 552 | 831 | (279 | ) | (33.6 | %) | 2,478 | 3,077 | (599 | ) | (19.5 | %) | |||||||||||||||||
Retrospective* | 995 | 2,274 | (1,279 | ) | (56.2 | %) | 1,338 | 3,037 | (1,699 | ) | (55.9 | %) | |||||||||||||||||
Other | 1,687 | 2,775 | (1,088 | ) | (39.2 | %) | 3,468 | 4,602 | (1,134 | ) | (24.6 | %) | |||||||||||||||||
Alternative market business | 13,781 | 15,711 | (1,930 | ) | (12.3 | %) | 39,740 | 50,306 | (10,566 | ) | (21.0 | %) | |||||||||||||||||
Change in EBUB estimate | — | — | — | nm | (860 | ) | — | (860 | ) | nm | |||||||||||||||||||
Total | $ | 57,208 | $ | 64,218 | $ | (7,010 | ) | (10.9 | %) | $ | 136,451 | $ | 153,572 | $ | (17,121 | ) | (11.1 | %) | |||||||||||
*The change in retrospectively-related policies included premium adjustments of $1.5 million and $1.7 million for the three and six months ended June 30, 2020, respectively, and $1.1 million and $1.4 million for the same respective periods of 2019.
Gross premiums written decreased during the three and six months ended June 30, 2020 as compared to the same periods of 2019, which primarily reflected renewal rate decreases, retention losses and a decrease in audit premium, partially offset by new business written. Additionally, the 2020 three- and six- month periods were impacted by COVID-19 related payroll exposure reductions and policy cancellations, which reduced premiums written. Gross premiums written during the 2020 six-month period was also impacted by a reduction in our EBUB estimate of $0.9 million. Renewal rate decreases were 4% during each of the three and six months ended June 30, 2020 as compared to 4% and 3% for the same respective periods in 2019. Renewal retention was 87% and 84% for the three and six months ended June 30, 2020, respectively. Retention for the 2020 six-month period was impacted by the reduction in premium funding for a large alternative market program (see further discussion in our Segment Operating Results - Segregated Portfolio Cell Reinsurance section that follows).
In our traditional business, gross premiums written decreased during the 2020 three- and six- month periods as compared to the same periods of 2019, primarily reflecting renewal rate decreases of 4% during each of the 2020 three- and six- month periods, partially offset by new business written. In addition, the 2020 six-month period was impacted by the aforementioned reduction in our EBUB estimate. Retention in our traditional business was 87% and 86% for the three and six months ended June 30, 2020, respectively, and 79% and 81% for the same respective periods in 2019.
Gross premiums written in our alternative market business decreased during the three and six months ended June 30, 2020 as compared to the same periods of 2019. As noted above, the 2020 six-month period reflected the reduction in premium funding for one of our large alternative market programs. Renewal rate decreases were 5% for each of the three and six months ended June 30, 2020 as compared to 7% and 4% for the same periods in 2019. Renewal rate decreases and retention losses were partially offset by new business of $0.7 million and $1.8 million for the three and six months ended June 30, 2020, respectively. Retention in our alternative market business was 87% and 81% for the three and six months ended June 30, 2020, respectively, and 85% and 93% for the same respective periods in 2019. We retained 100% of the 14 workers' compensation alternative market programs up for renewal during the six months ended June 30, 2020. During the second quarter of 2020, we added one new workers' compensation alternative market program at Inova Re with $0.6 million in premiums written during the current period.
As noted above, our traditional and alternative market premiums written for the second quarter of 2020 were impacted by reductions in payroll exposure and policy cancellations related to the economic impact of COVID-19, and we expect continued downward pressure in future quarters on our workers' compensation premium resulting from further reductions in insured payroll exposure; however, the length and magnitude of such changes depends on future developments, which are highly uncertain and cannot be predicted.
89
New business, audit premium, retention and renewal price changes for both the traditional business and the alternative market business are shown in the table below:
Three Months Ended June 30 | |||||||||||||||||||
2020 | 2019 | ||||||||||||||||||
($ in millions) | Traditional Business | Alternative Market Business | Segment Results | Traditional Business | Alternative Market Business | Segment Results | |||||||||||||
New business | $ | 5.8 | $ | 0.7 | $ | 6.5 | $ | 5.4 | $ | 1.2 | $ | 6.6 | |||||||
Audit premium (excluding EBUB) | $ | 0.1 | $ | 0.1 | $ | 0.2 | $ | 0.7 | $ | 0.5 | $ | 1.2 | |||||||
Retention rate (1) | 87 | % | 87 | % | 87 | % | 79 | % | 85 | % | 81 | % | |||||||
Change in renewal pricing (2) | (4 | %) | (5 | %) | (4 | %) | (3 | %) | (7 | %) | (4 | %) | |||||||
Six Months Ended June 30 | |||||||||||||||||||
2020 | 2019 | ||||||||||||||||||
($ in millions) | Traditional Business | Alternative Market Business | Segment Results | Traditional Business | Alternative Market Business | Segment Results | |||||||||||||
New business | $ | 13.8 | $ | 1.8 | $ | 15.6 | $ | 11.8 | $ | 2.3 | $ | 14.1 | |||||||
Audit premium (excluding EBUB) | $ | 1.3 | $ | (0.2 | ) | $ | 1.1 | $ | 0.9 | $ | 1.0 | $ | 1.9 | ||||||
Retention rate (1) | 86 | % | 81 | % | 84 | % | 81 | % | 93 | % | 84 | % | |||||||
Change in renewal pricing (2) | (4 | %) | (5 | %) | (4 | %) | (3 | %) | (4 | %) | (3 | %) | |||||||
(1) We calculate our workers' compensation retention rate as annualized expiring renewed premium divided by all annualized expiring premium subject to renewal. Our retention rate can be impacted by various factors, including price or other competitive issues, insureds being acquired, or a decision not to renew based on our underwriting evaluation. | |||||||||||||||||||
(2) The pricing of our business includes an assessment of the underlying policy exposure and market conditions. We continue to base our pricing on expected losses, as indicated by our historical loss data. | |||||||||||||||||||
Ceded Premiums Written
Ceded premiums written were as follows:
Three Months Ended June 30 | Six Months Ended June 30 | ||||||||||||||||||||||||||||
($ in thousands) | 2020 | 2019 | Change | 2020 | 2019 | Change | |||||||||||||||||||||||
Premiums ceded to SPCs | $ | 13,698 | $ | 15,758 | $ | (2,060 | ) | (13.1 | %) | $ | 37,053 | $ | 47,903 | $ | (10,850 | ) | (22.6 | %) | |||||||||||
Premiums ceded to external reinsurers | 3,110 | 3,373 | (263 | ) | (7.8 | %) | 6,051 | 6,817 | (766 | ) | (11.2 | %) | |||||||||||||||||
Premiums ceded to unaffiliated captive insurers | 83 | (47 | ) | 130 | 276.6 | % | 2,687 | 2,403 | 284 | 11.8 | % | ||||||||||||||||||
Change in return premium estimate under external reinsurance | 16 | 103 | (87 | ) | (84.5 | %) | 47 | 11 | 36 | 327.3 | % | ||||||||||||||||||
Total ceded premiums written | $ | 16,907 | $ | 19,187 | $ | (2,280 | ) | (11.9 | %) | $ | 45,838 | $ | 57,134 | $ | (11,296 | ) | (19.8 | %) | |||||||||||
Our Workers' Compensation Insurance segment cedes alternative market business under a 100% quota share reinsurance agreement, net of a ceding commission, to SPCs in our Segregated Portfolio Cell Reinsurance segment and, to a limited extent, to an unaffiliated captive insurer. The decrease in premiums ceded to SPCs during the three and six months ended June 30, 2020 reflects the reduction in alternative market gross premiums written as discussed above under the heading "Gross Premiums Written".
Under our external reinsurance agreement for traditional business, we retain the first $0.5 million in risk insured by us and cede losses in excess of this amount on each loss occurrence under our primary external reinsurance treaty, subject to an AAD. The AAD for the contract year effective May, 1 2019 was $3.9 million, or approximately 2.1% of subject earned premium. Effective May 1, 2020, our primary reinsurance layer was renewed at a slightly higher rate than the expiring year, with an increase in the AAD to 3.16% of subject earned premium, in excess of the $0.5 million retention per loss occurrence. Per our reinsurance agreements, we cede premiums related to our traditional business on an earned premium basis. The decrease in premiums ceded to external reinsurers during the 2020 three- and six- month periods primarily reflected the decrease in traditional earned premium.
90
Changes in the return premium estimate reflected the loss experience under the reinsurance contract for the three and six months ended June 30, 2020 and 2019. The change in estimated return premium for the three and six months ended June 30, 2020 reflected prior year loss development on previously reported reinsured claims.
Ceded Premiums Ratio
Ceded premiums ratio was as follows:
Three Months Ended June 30 | Six Months Ended June 30 | ||||||||||||||||
2020 | 2019 | Change | 2020 | 2019 | Change | ||||||||||||
Ceded premiums ratio, as reported | 33.1 | % | 34.3 | % | (1.2 | pts) | 32.6 | % | 34.5 | % | (1.9 | pts) | |||||
Less the effect of: | |||||||||||||||||
Premiums ceded to SPCs (100%) | 24.9 | % | 26.2 | % | (1.3 | pts) | 24.8 | % | 26.6 | % | (1.8 | pts) | |||||
Retrospective premium adjustments | 0.2 | % | 0.2 | % | — | 0.1 | % | 0.1 | % | — | |||||||
Premiums ceded to unaffiliated captive insurers (100%) | 1.4 | % | 1.1 | % | 0.3 | pts | 1.3 | % | 1.0 | % | 0.3 | pts | |||||
Change in EBUB | — | % | — | % | — | 0.1 | % | — | % | 0.1 | pts | ||||||
Return premium estimated under external reinsurance | — | % | 0.2 | % | (0.2 | pts) | — | % | — | % | — | ||||||
Assumed premiums earned (not ceded to external reinsurers) | (0.2 | %) | (0.3 | %) | 0.1 | pts | (0.2 | %) | (0.3 | %) | 0.1 | pts | |||||
Ceded premiums ratio (related to external reinsurance), less the effects of above | 6.8 | % | 6.9 | % | (0.1 | pts) | 6.5 | % | 7.1 | % | (0.6 | pts) | |||||
The above table reflects ceded premiums earned as a percent of gross premiums earned. As discussed above, we cede premiums related to our traditional business to external reinsurers on an earned premium basis. The ceded premiums ratio, excluding the effects in the table above, was relatively unchanged for the three months ended June 30, 2020 and decreased for the six months ended June 30, 2020 as compared to the same respective periods of 2019. The decrease in the ceded premiums ratio for six months ended June 30, 2020 primarily reflected the impact of lower reinsurance rates for the treaty year effective May 1, 2019 through April 30, 2020.
Net Premiums Earned
Net premiums earned were as follows:
Three Months Ended June 30 | Six Months Ended June 30 | ||||||||||||||||||||||
($ in thousands) | 2020 | 2019 | Change | 2020 | 2019 | Change | |||||||||||||||||
Gross premiums earned | $ | 63,430 | $ | 70,882 | $ | (7,452 | ) | (10.5 | %) | $ | 129,042 | $ | 141,158 | $ | (12,116 | ) | (8.6 | %) | |||||
Less: Ceded premiums earned | 21,024 | 24,308 | (3,284 | ) | (13.5 | %) | 42,121 | 48,646 | (6,525 | ) | (13.4 | %) | |||||||||||
Net premiums earned | $ | 42,406 | $ | 46,574 | $ | (4,168 | ) | (8.9 | %) | $ | 86,921 | $ | 92,512 | $ | (5,591 | ) | (6.0 | %) | |||||
Net premiums earned consist of gross premiums earned less the portion of earned premiums that we cede to SPCs in our Segregated Portfolio Cell Reinsurance segment, external reinsurers or to any unaffiliated captive insurers. Because premiums are generally earned pro rata over the entire policy period, fluctuations in premiums earned tend to lag those of premiums written. Our workers’ compensation policies are twelve month term policies, and premiums are earned on a pro rata basis over the policy period. Net premiums earned also include premium adjustments related to the audit of our insureds' payrolls, changes in our EBUB premium estimate and premium adjustments related to retrospectively-rated policies. Payroll audits are conducted subsequent to the end of the policy period and any related adjustments are recorded as fully earned in the current period. In addition, we record an estimate for EBUB premium and evaluate the estimate on a quarterly basis. We reduced our EBUB premium estimate by $0.9 million during the six months ended June 30, 2020 which primarily reflected a reduction in earned payroll exposure. As a result of the economic impact of COVID-19, we expect future reductions in payroll exposure related to in-force policies that could result in a significant decrease in audit premium and our EBUB estimate. Mid-term policy endorsements that resulted in a reduction of payroll exposure were reported and processed during the second quarter of 2020, however, we have not experienced the level of endorsements expected to occur as a result of COVID-19 and, as such, we did not adjust our EBUB premium estimate in the second quarter of 2020. We will continue to monitor and adjust the estimate, if necessary, to changes in insured payrolls and economic conditions, as experience develops or new information becomes known; however, the length and magnitude of such changes depends on future developments, which are highly uncertain and cannot be predicted. There was no adjustment to our EBUB premium estimate during the three and six months ended June 30, 2019.
91
Premium adjustments related to retrospectively-rated policies totaled $1.5 million and $1.7 million for the three and six months ended June 30, 2020, respectively, and $1.1 million and $1.4 million for the for the same respective periods of 2019. The decrease in net premiums earned during the three and six months ended June 30, 2020 primarily reflected the pro rata effect of a reduction in net premiums written during the preceding twelve months, the impact of retrospectively-rated policy adjustments and, for the six months ended June 30, 2020, the reduction in our EBUB premium estimate.
Losses and Loss Adjustment Expenses
We estimate our current accident year loss and loss adjustment expenses based on an expected loss ratio. Incurred losses and loss adjustment expenses for the current accident year are determined by applying the expected loss ratio to net premiums earned for the respective period. The following table summarizes calendar year net loss ratios by separating losses between the current accident year and all prior accident years. Calendar year and current accident year net loss ratios by component were as follows:
Three Months Ended June 30 | Six Months Ended June 30 | ||||||||||||||||
2020 | 2019 | Change | 2020 | 2019 | Change | ||||||||||||
Calendar year net loss ratio | 67.0 | % | 65.8 | % | 1.2 | pts | 66.9 | % | 66.0 | % | 0.9 | pts | |||||
Less impact of prior accident years on the net loss ratio | (3.6 | %) | (2.4 | %) | (1.2 | pts) | (3.5 | %) | (2.2 | %) | (1.3 | pts) | |||||
Current accident year net loss ratio | 70.6 | % | 68.2 | % | 2.4 | pts | 70.4 | % | 68.2 | % | 2.2 | pts | |||||
The increase in the current accident year loss ratio for the three and six months ended June 30, 2020 primarily reflected the continuation of intense price competition and the resulting renewal rate decreases, partially offset by favorable trends in claim closing patterns that reduced loss development factors. As a result of the COVID-19 pandemic, we have observed a reduction in claims frequency during the second quarter of 2020; however, we remain cautious in our evaluation of the current accident year reserve due to uncertainty surrounding the length and severity of the pandemic, as well as legislative and regulatory bodies in certain states changing or attempting to change compensability requirements and presumptions for certain types of workers related to COVID-19 claims. If successful, these endeavors could result in an increase in claims frequency and severity which may result in a higher current accident year net loss ratio in future quarters. Furthermore, the current economic conditions resulting from the COVID-19 pandemic have introduced significant risk of a prolonged recession, which could have an adverse impact on our return to wellness efforts and the ability of injured workers to return to work, resulting in a potential reduction in favorable claim trends in future periods.
Calendar year incurred losses (excluding IBNR) ceded to our external reinsurers increased $1.5 million and $0.7 million for the three and six months ended June 30, 2020, respectively, as compared to the same periods of 2019. Current accident year ceded incurred losses decreased $0.1 million during both the three and six months ended June 30, 2020 as compared to the same periods of 2019.
We recognized net favorable prior year development related to our previously established reserve of $1.5 million and $3.0 million for the three and six months ended June 30, 2020, respectively, as compared to $1.1 million and $2.0 million for the same respective periods of 2019. The net favorable prior year development for the three and six months ended June 30, 2020 reflected overall favorable trends in claim closing patterns, primarily in the 2014, 2015 and 2016 accident years. Net favorable development for the three and six months ended June 30, 2019 included $0.4 million and $0.8 million, respectively, related to the amortization of purchase accounting adjustments, which were fully amortized at December 31, 2019.
92
Underwriting, Policy Acquisition and Operating Expenses
Underwriting, policy acquisition and operating expenses includes the amortization of commissions, premium taxes and underwriting salaries, which are capitalized and deferred over the related workers’ compensation policy period, net of ceding commissions earned. The capitalization of underwriting salaries can vary as they are subject to the success rate of our contract acquisition efforts. These expenses also include a management fee charged by our Corporate segment, which represents intercompany charges pursuant to a management agreement, and the amortization of intangible assets, primarily related to the acquisition of Eastern by ProAssurance. The management fee is based on the extent to which services are provided to the subsidiary and the amount of premium written by the subsidiary.
Our Workers' Compensation Insurance segment underwriting, policy acquisition and operating expenses were comprised as follows:
Three Months Ended June 30 | Six Months Ended June 30 | ||||||||||||||||||||||||||||
($ in thousands) | 2020 | 2019 | Change | 2020 | 2019 | Change | |||||||||||||||||||||||
DPAC amortization | $ | 7,287 | $ | 8,601 | $ | (1,314 | ) | (15.3 | %) | $ | 15,137 | $ | 17,051 | $ | (1,914 | ) | (11.2 | %) | |||||||||||
Management fees | 429 | 482 | (53 | ) | (11.0 | %) | 1,030 | 1,152 | (122 | ) | (10.6 | %) | |||||||||||||||||
Other underwriting and operating expenses | 9,302 | 9,798 | (496 | ) | (5.1 | %) | 19,337 | 19,181 | 156 | 0.8 | % | ||||||||||||||||||
SPC ceding commission offset | (3,562 | ) | (4,513 | ) | 951 | (21.1 | %) | (7,882 | ) | (8,825 | ) | 943 | (10.7 | %) | |||||||||||||||
Total | $ | 13,456 | $ | 14,368 | $ | (912 | ) | (6.3 | %) | $ | 27,622 | $ | 28,559 | $ | (937 | ) | (3.3 | %) | |||||||||||
The decrease in DPAC amortization for the three and six months ended June 30, 2020 as compared to the same periods in 2019 primarily reflects the decrease in net premiums earned. The decrease in other underwriting and operating expenses for the three months ended June 30, 2020 primarily reflected a decrease in employee benefit and travel-related costs, partially offset by costs related to the implementation of a new policy administration and claims system and an increase in bad debt expense. The increase in other underwriting and operating expenses for the six months ended June 30, 2020 primarily reflected higher compensation-related expenses due to an increase in headcount as we have secured talent for most of the positions that were open during the first quarter of 2019, costs associated with the aforementioned system implementation and bad debt expense, partially offset by a decrease in travel-related costs. The increase in bad debt expense and the decrease in travel-related costs during the second quarter of 2020 are directly attributable to COVID-19. During the second quarter of 2020, we experienced an increase in our receivable balances over 90 days old, which resulted in an increase to our allowance for doubtful accounts. Travel-related expenses are lower in 2020, as compared to 2019, as company business travel has been substantially reduced due to COVID-19.
As previously discussed, alternative market premiums written through our Workers' Compensation Insurance segment's alternative market business unit are 100% ceded, less a ceding commission, to either the SPCs in our Segregated Portfolio Cell Reinsurance segment or, to a limited extent, an unaffiliated captive insurer. The ceding commission consists of an amount for fronting fees, cell rental fees, commissions, premium taxes and risk management fees. The fronting fees, commissions, premium taxes and risk management fees are recorded as an offset to underwriting, policy acquisition and operating expenses. Cell rental fees are recorded as a component of other income and claims administration fees are recorded as ceded ULAE. SPC ceding commissions earned decreased for the three and six months ended June 30, 2020 as compared to the same respective periods of 2019, primarily reflecting the decrease in alternative market ceded earned premium.
Underwriting Expense Ratio (the Expense Ratio)
The underwriting expense ratio included the impact of the following:
Three Months Ended June 30 | Six Months Ended June 30 | ||||||||||||||||
2020 | 2019 | Change | 2020 | 2019 | Change | ||||||||||||
Underwriting expense ratio, as reported | 31.7 | % | 30.8 | % | 0.9 | pts | 31.8 | % | 30.9 | % | 0.9 | pts | |||||
Less estimated ratio increase (decrease) attributable to: | |||||||||||||||||
Impact of ceding commissions received from SPCs | 3.5 | % | 2.8 | % | 0.7 | pts | 2.9 | % | 3.0 | % | (0.1 | pts) | |||||
Retrospective premium adjustment | 0.7 | % | 0.5 | % | 0.2 | pts | 0.4 | % | 0.3 | % | 0.1 | pts | |||||
Impact of audit premium | (0.1 | %) | (0.3 | %) | 0.2 | pts | (0.1 | %) | (0.2 | %) | 0.1 | pts | |||||
Underwriting expense ratio, less listed effects | 27.6 | % | 27.8 | % | (0.2 | pts) | 28.6 | % | 27.8 | % | 0.8 | pts | |||||
Excluding the items noted in the table above, the expense ratio was relatively unchanged for the three months ended June 30, 2020 and increased for the six months ended June 30, 2020 due to the effect of the decrease in net premiums earned, as previously discussed.
93
Segment Operating Results - Segregated Portfolio Cell Reinsurance
The Segregated Portfolio Cell Reinsurance segment reflects the operating results (underwriting profit or loss, plus investment results, net of U.S. federal income taxes) of SPCs at Inova Re and Eastern Re, our Cayman Islands SPC operations, as discussed in Note 12 of the Notes to Condensed Consolidated Financial Statements. SPCs are segregated pools of assets and liabilities that provide an insurance facility for a defined set of risks. Assets of each SPC are solely for the benefit of that individual cell and each SPC is solely responsible for the liabilities of that individual cell. Assets of one SPC are statutorily protected from the creditors of the others. Each SPC is owned, fully or in part, by an agency, group or association and the operating results of the SPCs are attributable to the participants of that cell. We participate to a varying degree in the results of selected SPCs and, for the SPCs in which we participate, our participation interest ranges from a low of 20% to a high of 85%. SPC operating results attributable to external cell participants are reflected as SPC dividend (expense) income in our Segregated Portfolio Cell Reinsurance segment. In addition, our Segregated Portfolio Cell Reinsurance segment includes the SPC investment results as the investments are solely for the benefit of the cell participants and investment results attributable to external cell participants are reflected in the SPC dividend (expense) income. As of June 30, 2020, there were 27 (24 active) SPCs. The SPCs assume workers' compensation insurance, healthcare professional liability insurance or a combination of the two from our Workers' Compensation Insurance and Specialty P&C segments. As of June 30, 2020, there were two SPCs that assumed both workers' compensation insurance and healthcare professional liability insurance and one SPC that assumed only healthcare professional liability insurance.
Segment operating results reflects our share of the underwriting and investment results of the SPCs in which we participate, and included the following:
Three Months Ended June 30 | Six Months Ended June 30 | ||||||||||||||||||||||
($ in thousands) | 2020 | 2019 | Change | 2020 | 2019 | Change | |||||||||||||||||
Net premiums written | $ | 13,245 | $ | 14,937 | $ | (1,692 | ) | (11.3 | %) | $ | 37,235 | $ | 47,618 | $ | (10,383 | ) | (21.8 | %) | |||||
Net premiums earned | $ | 16,748 | $ | 19,284 | $ | (2,536 | ) | (13.2 | %) | $ | 33,728 | $ | 38,787 | $ | (5,059 | ) | (13.0 | %) | |||||
Net investment income | 305 | 368 | (63 | ) | (17.1 | %) | 559 | 815 | (256 | ) | (31.4 | %) | |||||||||||
Net realized gains (losses) | 2,606 | (94 | ) | 2,700 | (2,872.3 | %) | (601 | ) | 2,047 | (2,648 | ) | (129.4 | %) | ||||||||||
Other income | 55 | 135 | (80 | ) | (59.3 | %) | 191 | 221 | (30 | ) | (13.6 | %) | |||||||||||
Net losses and loss adjustment expenses | (7,680 | ) | (19,973 | ) | 12,293 | (61.5 | %) | (17,032 | ) | (30,719 | ) | 13,687 | (44.6 | %) | |||||||||
Underwriting, policy acquisition and operating expenses | (5,360 | ) | (5,905 | ) | 545 | (9.2 | %) | (10,439 | ) | (11,138 | ) | 699 | (6.3 | %) | |||||||||
SPC U.S. federal income tax expense(1) | (480 | ) | — | (480 | ) | nm | (702 | ) | — | (702 | ) | nm | |||||||||||
SPC net operating results | 6,194 | (6,185 | ) | 12,379 | (200.1 | %) | 5,704 | 13 | 5,691 | 43,776.9 | % | ||||||||||||
SPC dividend (expense) income (2) | (4,642 | ) | 7,033 | (11,675 | ) | (166.0 | %) | (4,134 | ) | 2,246 | (6,380 | ) | (284.1 | %) | |||||||||
Segment operating results (3) | $ | 1,552 | $ | 848 | $ | 704 | 83.0 | % | $ | 1,570 | $ | 2,259 | $ | (689 | ) | (30.5 | %) | ||||||
Net loss ratio | 45.9 | % | 103.6 | % | (57.7 pts) | 50.5 | % | 79.2 | % | (28.7 pts) | |||||||||||||
Underwriting expense ratio | 32.0 | % | 30.6 | % | 1.4 pts | 31.0 | % | 28.7 | % | 2.3 pts | |||||||||||||
(1) Represents the provision for U.S. federal income taxes for SPCs at Inova Re, which have elected to be taxed as a U.S. corporation under Section 953(d) of the Internal Revenue Code. U.S. federal income taxes are included in the total SPC net operating results and are paid by the individual SPCs. | |||||||||||||||||||||||
(2) Represents the net operating (profit) loss due to external cell participants. | |||||||||||||||||||||||
(3) Represents our share of the net operating profit (loss) of the SPCs in which we participate. | |||||||||||||||||||||||
94
Premiums Written
The majority of premiums in our Segregated Portfolio Cell Reinsurance segment are assumed from either our Workers' Compensation Insurance or Specialty P&C segments. Premium volume is driven by five primary factors: (1) the amount of new business written, (2) retention of the existing book of business, (3) premium rates charged on the renewal book of business and, for workers' compensation business, (4) changes in payroll exposure and (5) audit premium.
Gross, ceded and net premiums written were as follows:
Three Months Ended June 30 | Six Months Ended June 30 | ||||||||||||||||||||||||||||
($ in thousands) | 2020 | 2019 | Change | 2020 | 2019 | Change | |||||||||||||||||||||||
Gross premiums written | $ | 14,996 | $ | 16,910 | $ | (1,914 | ) | (11.3 | %) | $ | 42,135 | $ | 53,274 | $ | (11,139 | ) | (20.9 | %) | |||||||||||
Less: Ceded premiums written | 1,751 | 1,973 | (222 | ) | (11.3 | %) | 4,900 | 5,656 | (756 | ) | (13.4 | %) | |||||||||||||||||
Net premiums written | $ | 13,245 | $ | 14,937 | $ | (1,692 | ) | (11.3 | %) | $ | 37,235 | $ | 47,618 | $ | (10,383 | ) | (21.8 | %) | |||||||||||
Gross Premiums Written
Gross premiums written reflected reinsurance premiums assumed by component as follows:
Three Months Ended June 30 | Six Months Ended June 30 | ||||||||||||||||||||||||||||
($ in thousands) | 2020 | 2019 | Change | 2020 | 2019 | Change | |||||||||||||||||||||||
Workers' compensation | $ | 13,698 | $ | 15,758 | $ | (2,060 | ) | (13.1 | %) | $ | 37,053 | $ | 47,903 | $ | (10,850 | ) | (22.6 | %) | |||||||||||
Healthcare professional liability | 1,298 | 1,152 | 146 | 12.7 | % | 5,082 | 4,890 | 192 | 3.9 | % | |||||||||||||||||||
Other | — | — | — | nm | — | 481 | (481 | ) | nm | ||||||||||||||||||||
Gross Premiums Written | $ | 14,996 | $ | 16,910 | $ | (1,914 | ) | (11.3 | %) | $ | 42,135 | $ | 53,274 | $ | (11,139 | ) | (20.9 | %) | |||||||||||
Gross premiums written for the three and six months ended June 30, 2020 and 2019 were primarily comprised of workers' compensation coverages assumed from our Workers' Compensation Insurance segment. The decrease in gross premiums written during the 2020 three-month period as compared to the same period of 2019 primarily reflected the competitive workers’ compensation market conditions and the resulting renewal rate decreases of 5%. The decrease in gross premiums written during the 2020 six-month period as compared to the same period in 2019 primarily reflected a reduction in premium funding for a large workers' compensation alternative market program. We do not participate in this program; therefore, the reduction in premium funding had no effect on our share of the segment operating results for the six months ended June 30, 2020. The reduction in premiums for the 2020 six-month period also reflected the competitive workers' compensation market conditions and the resulting renewal rate decreases of 5%. Healthcare professional liability gross premiums written remained relatively unchanged during the 2020 three- and six- month periods as compared to the same periods of 2019. We retained 100% of the 13 workers' compensation programs and 2 healthcare professional liability programs up for renewal during the six months ended June 30, 2020. During the second quarter of 2020, we added one new alternative market program at Inova Re with $0.6 million in premiums written in the current period.
Our workers’ compensation premiums written for the second quarter of 2020 were impacted by reductions in payroll exposure and policy cancellations related to the economic impact of COVID-19, and we expect continued downward pressure in future quarters on our workers' compensation premium resulting from further reductions in insured payroll exposure; however, the length and magnitude of such changes depends on future developments, which are highly uncertain and cannot be predicted.
95
New business, audit premium, retention and renewal price changes for the assumed workers' compensation premium is shown in the table below:
Three Months Ended June 30 | Six Months Ended June 30 | ||||||||||||||
($ in millions) | 2020 | 2019 | 2020 | 2019 | |||||||||||
New business | $ | 0.7 | $ | 1.2 | $ | 1.8 | $ | 2.3 | |||||||
Audit premium (including EBUB) | $ | 0.1 | $ | 0.5 | $ | (0.2 | ) | $ | 1.0 | ||||||
Retention rate (1) | 87 | % | 85 | % | 81 | % | 93 | % | |||||||
Change in renewal pricing (2) | (5 | %) | (7 | %) | (5 | %) | (4 | %) | |||||||
(1) We calculate our workers' compensation retention rate as annualized expiring renewed premium divided by all annualized expiring premium subject to renewal. Our retention rate can be impacted by various factors, including price or other competitive issues, insureds being acquired, or a decision not to renew based on our underwriting evaluation. | |||||||||||||||
(2) The pricing of our business includes an assessment of the underlying policy exposure and market conditions. We continue to base our pricing on expected losses, as indicated by our historical loss data. | |||||||||||||||
Ceded Premiums Written
Ceded premiums written were as follows:
Three Months Ended June 30 | Six Months Ended June 30 | ||||||||||||||||||||||
($ in thousands) | 2020 | 2019 | Change | 2020 | 2019 | Change | |||||||||||||||||
Ceded premiums written | $ | 1,751 | $ | 1,973 | $ | (222 | ) | (11.3 | %) | $ | 4,900 | $ | 5,656 | $ | (756 | ) | (13.4 | %) | |||||
For the workers' compensation business, each SPC has in place its own external reinsurance arrangements. The healthcare professional liability business is assumed net of reinsurance from our Specialty P&C segment; therefore, there are no ceded premiums related to the healthcare professional liability business reflected in the table above. The risk retention for each loss occurrence for the workers' compensation business ranges from $0.3 million to $0.35 million based on the program, with limits up to $119.7 million. In addition, each program has aggregate reinsurance coverage between $1.1 million and $2.1 million on a program year basis. Per the SPC external reinsurance agreements, premiums are ceded on a written premium basis and changes in ceded premiums written during the 2020 three- and six- month periods primarily reflected changes in workers' compensation gross premiums written as compared to the same respective periods in 2019. External reinsurance rates vary based on the alternative market program.
Ceded Premiums Ratio
Ceded premiums ratio was as follows:
Three Months Ended June 30 | Six Months Ended June 30 | ||||||||||
2020 | 2019 | Change | 2020 | 2019 | Change | ||||||
Ceded premiums ratio | 12.8% | 12.5% | 0.3 pts | 13.2% | 11.8% | 1.4 pts | |||||
The above table reflects ceded premiums as a percent of gross premiums written for the workers' compensation business only; healthcare professional liability business is assumed net of reinsurance, as discussed above. The ceded premiums ratio reflects the weighted average reinsurance rates of all SPC programs. The ceded premiums ratio remained relatively unchanged for the 2020 three-month period and increased for the 2020 six-month period as compared to the same respective periods in 2019. The increase in the ceded premiums ratio for the 2020 six-month period primarily reflected the reduction in premium funding for a large workers' compensation alternative market program (see previous discussion under the heading "Gross Premiums Written"). The reinsurance costs associated with this program are fixed, which resulted in an increase in the ceded ratio.
96
Net Premiums Earned
Gross, ceded and net premiums earned were as follows:
Three Months Ended June 30 | Six Months Ended June 30 | ||||||||||||||||||||||
($ in thousands) | 2020 | 2019 | Change | 2020 | 2019 | Change | |||||||||||||||||
Gross premiums earned | $ | 18,912 | $ | 21,698 | $ | (2,786 | ) | (12.8 | %) | $ | 38,102 | $ | 43,638 | $ | (5,536 | ) | (12.7 | %) | |||||
Less: Ceded premiums earned | 2,164 | 2,414 | (250 | ) | (10.4 | %) | 4,374 | 4,851 | (477 | ) | (9.8 | %) | |||||||||||
Net premiums earned | $ | 16,748 | $ | 19,284 | $ | (2,536 | ) | (13.2 | %) | $ | 33,728 | $ | 38,787 | $ | (5,059 | ) | (13.0 | %) | |||||
Net premiums earned consist of gross premiums earned less the portion of earned premiums that the SPCs cede to external reinsurers. Because premiums are generally earned pro rata over the entire policy period, fluctuations in premiums earned tend to lag those of premiums written. Policies ceded to the SPCs are twelve month term policies and premiums are earned on a pro rata basis over the policy period. Net premiums earned also include premium adjustments related to the audit of workers' compensation insureds' payrolls. Payroll audits are conducted subsequent to the end of the policy period and any related adjustments are recorded as fully earned in the current period. The decrease in net premiums earned during the three and six months ended June 30, 2020 primarily reflected the pro rata effect of a reduction in net premiums written during the preceding twelve months and, for the 2020 six-month period, the reduction in premium funding for a large workers' compensation alternative market program compensation alternative market program (see previous discussion under the heading "Gross Premiums Written").
Net Investment Income and Net Realized Investment Gains (Losses)
Net investment income for the three and six months ended June 30, 2020 and 2019 was primarily attributable to interest earned on available-for-sale fixed maturity investments, which primarily includes investment-grade corporate debt securities. We recognized $2.6 million of net realized investment gains during the three months ended June 30, 2020 and $0.6 million of net realized investment losses during the six months ended June 30, 2020. Net realized investment gains and losses for the 2020 three- and six- month periods were driven by changes in fair value on our equity portfolio due to the volatility in the global financial markets related to COVID-19 during the first half of 2020. We recognized $0.1 million of net realized investment losses during the three months ended June 30, 2019 and $2.0 million of net realized investment gains during the six months ended June 30, 2019 driven by changes in the fair value of our equity securities portfolio.
Losses and Loss Adjustment Expenses
The following table summarizes the calendar year net loss ratios by separating losses between the current accident year and all prior accident years. The current accident year net loss ratio reflected the aggregate loss ratio for all programs. Loss reserves are estimated for each program on a quarterly basis. Due to the size of some of the programs, quarterly loss results can create volatility in the current accident year net loss ratio to fluctuate significantly from period to period.
For the three and six months ended June 30, 2019, our Segregated Portfolio Cell Reinsurance segment net loss ratios were affected by a $10 million reserve that an SPC at Eastern Re established during the second quarter of 2019. This SPC had previously assumed an errors and omissions liability policy that provides coverage for losses up to a lifetime maximum of $10 million from a captive insurer unaffiliated with ProAssurance. During the second quarter of 2019, a claim was filed under this policy that met the lifetime maximum limit and, accordingly, a $10 million reserve was recorded. We do not participate in the SPC that assumed this policy; therefore, these losses were attributable to the external cell participants as reflected in the SPC dividend expense (income) and had no effect on our Segregated Portfolio Cell Reinsurance segment operating results for the three and six months ended June 30, 2019. Given the significance of this event, we have removed the impact of the policy from each of the ratios below (as shown in the columns labeled "Adjusted") in order to assist in the comparability between periods. Calendar year and current accident year net loss ratios were as follows:
Three Months Ended June 30 | ||||||||||||||
2020 | 2019 | Change | ||||||||||||
As reported | As reported | E&O Reserve Impact | Adjusted | As reported | Adjusted | |||||||||
Calendar year net loss ratio | 45.9 | % | 103.6 | % | 51.6 | pts | 52.0 | % | (57.7 | pts) | (6.1 | pts) | ||
Less impact of prior accident years on the net loss ratio | (11.1 | %) | (11.6 | %) | 0.2 | pts | (11.8 | %) | 0.5 | pts | 0.7 | pts | ||
Current accident year net loss ratio | 57.0 | % | 115.2 | % | 51.4 | pts | 63.8 | % | (58.2 | pts) | (6.8 | pts) | ||
Six Months Ended June 30 | ||||||||||||||
2020 | 2019 | Change | ||||||||||||
As reported | As reported | E&O Reserve Impact | Adjusted | As reported | Adjusted | |||||||||
Calendar year net loss ratio | 50.5 | % | 79.2 | % | 25.5 | pts | 53.7 | % | (28.7 | pts) | (3.2 | pts) | ||
Less impact of prior accident years on the net loss ratio | (10.9 | %) | (11.6 | %) | 0.2 | pts | (11.8 | %) | 0.7 | pts | 0.9 | pts | ||
Current accident year net loss ratio | 61.4 | % | 90.8 | % | 25.3 | pts | 65.5 | % | (29.4 | pts) | (4.1 | pts) | ||
Excluding the impact of the errors and omissions liability policy, as previously discussed and as shown in the tables
above, the current accident year net loss ratio for the 2020 three- and six- month periods decreased 6.8 and 4.1 percentage points, respectively, as compared to the same respective periods of 2019. The decrease during the 2020 three- and six- month periods primarily reflected overall favorable trends in workers' compensation claim closing patterns, including lower severity, partially offset by the effect of the continuation of intense price competition and the resulting renewal rate decreases. Due to the recent COVID-19 pandemic, legislative and regulatory bodies in certain states have changed or are attempting to change compensability requirements and presumptions for certain types of workers related to COVID-19 claims. If successful, these endeavors could result in an increase in claims frequency and severity which may result in a higher current accident year net loss ratio in future quarters.
Calendar year ceded incurred losses (excluding IBNR) ceded to our external reinsurers increased $0.9 million and $0.6 million for the 2020 three- and six- month periods, respectively, as compared to the same periods of 2019. Current accident year ceded incurred losses increased $0.6 million and $0.9 million for the 2020 three- and six- month periods, respectively, as compared to the same respective periods of 2019. Current accident year ceded incurred losses for the 2020 three- and six- month periods primarily related to healthcare professional liability business.
We recognized net favorable prior year development of $1.9 million and $3.7 million for the three and six months ended June 30, 2020, respectively, and $2.3 million and $4.5 million for the same periods of 2019. The net favorable prior year reserve development for the three and six months ended June 30, 2020 included $1.9 million and $2.7 million related to the workers’ compensation business, respectively. In addition, net favorable prior year reserve development for the six months ended June 30, 2020 included $1.0 million related to the healthcare professional liability business. Development recognized for the three and six months ended June 30, 2020 primarily reflected the overall favorable trends in claim closing patterns in the 2016 through 2018 accident years. The current economic conditions resulting from the COVID-19 pandemic have introduced significant risk of a prolonged recession, which could have an adverse impact on our return to wellness efforts and the ability of injured workers to return to work, resulting in a potential reduction in favorable claim trends in future periods.
97
Underwriting, Policy Acquisition and Operating Expenses
Our Segregated Portfolio Cell Reinsurance segment underwriting, policy acquisition and operating expenses were comprised as follows:
Three Months Ended June 30 | Six Months Ended June 30 | ||||||||||||||||||||||||||||
($ in thousands) | 2020 | 2019 | Change | 2020 | 2019 | Change | |||||||||||||||||||||||
DPAC amortization | $ | 4,938 | $ | 5,516 | $ | (578 | ) | (10.5 | %) | $ | 10,073 | $ | 10,666 | $ | (593 | ) | (5.6 | %) | |||||||||||
Other underwriting and operating expenses | 422 | 389 | 33 | 8.5 | % | 366 | 472 | (106 | ) | (22.5 | %) | ||||||||||||||||||
Total | $ | 5,360 | $ | 5,905 | $ | (545 | ) | (9.2 | %) | $ | 10,439 | $ | 11,138 | $ | (699 | ) | (6.3 | %) | |||||||||||
DPAC amortization primarily represents ceding commissions, which vary by program and are paid to our Workers' Compensation Insurance and Specialty P&C segments for premiums assumed. Ceding commissions include an amount for fronting fees, commissions, premium taxes and risk management fees, which are reported as an offset to underwriting, policy acquisition and operating expenses within our Workers' Compensation Insurance and Specialty P&C segments. In addition, ceding commissions paid to our Workers' Compensation Insurance segment include cell rental fees which are recorded as other income within our Workers' Compensation Insurance segment.
Other underwriting and operating expenses primarily include bank fees, professional fees and bad debt expense. The increase in other underwriting and operating expenses for the three months ended June 30, 2020 as compared to the same period in 2019 primarily reflected an increase in insurance costs. The decrease in other underwriting and operating expenses for the six months ended June 30, 2020 as compared to the same period in 2019 primarily reflected recoveries of premiums receivables previously written off, which resulted in an adjustment to our allowance for expected credit losses.
Underwriting Expense Ratio (the Expense Ratio)
The underwriting expense ratio included the impact of the following:
Three Months Ended June 30 | Six Months Ended June 30 | ||||||||||
2020 | 2019 | Change | 2020 | 2019 | Change | ||||||
Underwriting expense ratio, as reported | 32.0% | 30.6% | 1.4 pts | 31.0% | 28.7% | 2.3 pts | |||||
Less | |||||||||||
Impact of audit premium on expense ratio | (0.2%) | (0.8%) | 0.6 pts | 0.3% | (0.7%) | 1.0 pts | |||||
Underwriting expense ratio, excluding the effect of audit premium | 32.2% | 31.4% | 0.8 pts | 30.7% | 29.4% | 1.3 pts | |||||
Excluding the effect of audit premium, the underwriting expense ratio primarily reflected the weighted average ceding commission percentage of all SPC programs. The increase in the expense ratio during the 2020 three- and six- month periods was driven by the effect of a reduction in net premiums earned, as previously discussed. Additionally, the increase in the expense ratio during the 2020 six-month period reflected the impact of the reduction in premium funding for a large workers' compensation alternative market program as the ceding commissions associated with this program are fixed and do not vary directly with changes in premium (see previous discussion under the heading "Gross Premiums Written").
SPC U.S. Federal Income Tax Expense
The SPCs at Inova Re have made a 953(d) election under the U.S. Internal Revenue Code and are subject to U.S. federal income tax. U.S. federal income taxes incurred totaled $0.5 million and $0.7 million for the three and six months ended June 30, 2020, respectively. There was no provision for U.S. federal income taxes for the three and six months ended June 30, 2019. U.S. federal income taxes are included in the total SPC net operating results and are paid by the individual SPCs.
98
Segment Operating Results - Lloyd's Syndicates
Our Lloyd's Syndicates segment includes operating results from our participation in certain Syndicates at Lloyd's of London. In addition to our participation in Syndicate operating results, we have investments in and other obligations to our Lloyd's Syndicates consisting of a Syndicate Credit Agreement and FAL requirements. For the 2020 underwriting year, our FAL was comprised of investment securities and cash and cash equivalents deposited with Lloyd's which at June 30, 2020 had a fair value of approximately $137.5 million, as discussed in Note 3 of the Notes to Condensed Consolidated Financial Statements.
We normally report results from our involvement in Lloyd's Syndicates on a quarter lag, except when information is available that is material to the current period. Furthermore, the investment results associated with our FAL investments and certain U.S. paid administrative expenses are reported concurrently as that information is available on an earlier time frame.
Lloyd's Syndicate 1729. We provide capital to Syndicate 1729, which covers a range of property and casualty insurance and reinsurance lines in both the U.S. and international markets. The remaining capital for Syndicate 1729 is provided by unrelated third parties, including private names and other corporate members. To reduce our exposure and the associated earnings volatility, we decreased our participation in the operating results of Syndicate 1729 for the 2020 underwriting year to 29% from 61% which, due to the quarter lag, was not reflected in our results until the second quarter of 2020. Syndicate 1729's maximum underwriting capacity for the 2020 underwriting year is £135 million (approximately $167 million based on June 30, 2020 exchange rates), of which £39 million (approximately $48 million based on June 30, 2020 exchange rates) is our allocated underwriting capacity.
Lloyd's Syndicate 6131. We are the sole (100%) capital provider to an SPA, Syndicate 6131, which focuses on contingency and specialty property business in both the U.S. and international markets. As an SPA, Syndicate 6131 is only allowed to underwrite one quota share reinsurance contract with Syndicate 1729. For the 2020 underwriting year, Syndicate 6131 has a maximum underwriting capacity of £12 million (approximately $15 million based on June 30, 2020 exchange rates).
In addition to the results of our participation in Lloyd's Syndicates, as discussed above, our Lloyd's Syndicates segment also includes 100% of the operating results of our wholly owned subsidiaries that support our operations at Lloyd's. For the three and six months ended June 30, 2020 and 2019, the results of our Lloyd's Syndicates segment were as follows:
Three Months Ended June 30 | Six Months Ended June 30 | ||||||||||||||||||||||
($ in thousands) | 2020 | 2019 | Change | 2020 | 2019 | Change | |||||||||||||||||
Gross premiums written | $ | 20,717 | $ | 29,233 | $ | (8,516 | ) | (29.1 | %) | $ | 48,579 | $ | 52,821 | $ | (4,242 | ) | (8.0 | %) | |||||
Ceded premiums written | (7,200 | ) | (10,470 | ) | 3,270 | (31.2 | %) | (8,403 | ) | (13,061 | ) | 4,658 | (35.7 | %) | |||||||||
Net premiums written | $ | 13,517 | $ | 18,763 | $ | (5,246 | ) | (28.0 | %) | $ | 40,176 | $ | 39,760 | $ | 416 | 1.0 | % | ||||||
Net premiums earned | $ | 21,043 | $ | 17,280 | $ | 3,763 | 21.8 | % | $ | 43,044 | $ | 35,920 | $ | 7,124 | 19.8 | % | |||||||
Net investment income | 1,126 | 1,199 | (73 | ) | (6.1 | %) | 2,285 | 2,205 | 80 | 3.6 | % | ||||||||||||
Net realized gains (losses) | 529 | 262 | 267 | 101.9 | % | 611 | 440 | 171 | 38.9 | % | |||||||||||||
Other income (loss) | 40 | 32 | 8 | 25.0 | % | (192 | ) | (114 | ) | (78 | ) | 68.4 | % | ||||||||||
Net losses and loss adjustment expenses | (15,335 | ) | (11,825 | ) | (3,510 | ) | 29.7 | % | (30,116 | ) | (22,733 | ) | (7,383 | ) | 32.5 | % | |||||||
Underwriting, policy acquisition and operating expenses | (7,293 | ) | (7,564 | ) | 271 | (3.6 | %) | (16,434 | ) | (16,033 | ) | (401 | ) | 2.5 | % | ||||||||
Income tax benefit (expense) | — | 304 | (304 | ) | nm | 29 | — | 29 | nm | ||||||||||||||
Segment operating results | $ | 110 | $ | (312 | ) | $ | 422 | 135.3 | % | $ | (773 | ) | $ | (315 | ) | $ | (458 | ) | (145.4 | %) | |||
Net loss ratio | 72.9 | % | 68.4 | % | 4.5 | pts | 70.0 | % | 63.3 | % | 6.7 | pts | |||||||||||
Underwriting expense ratio | 34.7 | % | 43.8 | % | (9.1 | pts) | 38.2 | % | 44.6 | % | (6.4 | pts) | |||||||||||
99
Gross Premiums Written
Changes in our premium volume within our Lloyd's Syndicates segment are driven by five primary factors: (1) the amount of new business and the channels in which the business is written, (2) our retention of existing business, (3) the premium charged for business that is renewed, which is affected by rates charged and by the amount and type of coverage an insured chooses to purchase, (4) the timing of premium written through multi-period policies and (5) changes in our participation in the Syndicates.
Gross premiums written during the six months ended June 30, 2020 consisted of property insurance coverages (39% of total gross premiums written), casualty coverages (34%), catastrophe reinsurance coverages (10%), specialty property coverages (9%), contingency coverages (6%) and property reinsurance coverages (2%). The decrease in gross premiums written during the 2020 three- and six- month periods as compared to the same respective periods of 2019 was primarily driven by our decreased participation in the operating results of Syndicate 1729, partially offset by volume increases on renewal business and renewal pricing increases, primarily property insurance coverages, as well as new business written, primarily casualty coverages.
Ceded Premiums Written
Syndicate 1729 utilizes reinsurance to provide the capacity to write larger limits of liability on individual risks, to provide protection against catastrophic loss and to provide protection against losses in excess of policy limits. Ceded premiums written decreased for the three and six months ended June 30, 2020 as compared to the same periods of 2019 primarily driven by our decreased participation in the operating results of Syndicate 1729. In addition, the decrease in ceded premiums written during the 2020 six-month period as compared to the same period of 2019 included the effect of a revision to the Syndicates' estimates of premiums due to reinsurers during the first quarter of 2019.
Net Premiums Earned
Net premiums earned consist of gross premiums earned less the portion of earned premiums that the Syndicates cede to reinsurers for their assumption of a portion of losses. Premiums written through open-market channels are generally earned pro rata over the entire policy period, which is predominately twelve months, whereas premiums written through delegated underwriting authority arrangements are earned over twenty-four months. Therefore, net premiums earned is affected by shifts in the mix of policies written between the open-market and delegated underwriting authority arrangements. Additionally, fluctuations in premiums earned tend to lag those of premiums written. Premiums for certain policies and assumed reinsurance contracts are reported subsequent to the coverage period and/or may be subject to adjustment based on loss experience. These premium adjustments are earned when reported, which can result in further fluctuation in earned premium.
Gross, ceded and net premiums earned were as follows:
Three Months Ended June 30 | Six Months Ended June 30 | ||||||||||||||||||||||||||
($ in thousands) | 2020 | 2019 | Change | 2020 | 2019 | Change | |||||||||||||||||||||
Gross premiums earned | $ | 26,336 | $ | 21,997 | $ | 4,339 | 19.7 | % | $ | 54,532 | $ | 45,825 | $ | 8,707 | 19.0 | % | |||||||||||
Less: Ceded premiums earned | 5,293 | 4,717 | 576 | 12.2 | % | 11,488 | 9,905 | 1,583 | 16.0 | % | |||||||||||||||||
Net premiums earned | $ | 21,043 | $ | 17,280 | $ | 3,763 | 21.8 | % | $ | 43,044 | $ | 35,920 | $ | 7,124 | 19.8 | % | |||||||||||
The increase in gross premiums earned during the three and six months ended June 30, 2020 as compared to the same periods of 2019 was driven by the pro rata effect of higher premiums written during the preceding twelve months, primarily property insurance coverages.
The increase in ceded premiums earned during the three and six months ended June 30, 2020 as compared to the same periods of 2019 was driven by the pro rata effect of an increase in premiums ceded under reinsurance arrangements during the preceding twelve months due to the increase in gross premiums earned, as previously discussed.
Net Losses and Loss Adjustment Expenses
Losses for the period were primarily recorded using the loss assumptions by risk category incorporated into the business plans submitted to Lloyd's for Syndicate 1729 and Syndicate 6131 with consideration given to loss experience incurred to date. The assumptions used in each business plan were consistent with loss results reflected in Lloyd's historical data for similar risks. The loss ratios may fluctuate due to the timing of earned premium adjustments (see discussion in this section under the heading "Net Premiums Earned"). Premium and exposure for some of Syndicate 1729's insurance policies and reinsurance contracts are initially estimated and subsequently adjusted over an extended period of time as underlying premium reports are received from cedants and insureds. When reports are received, the premium, exposure and corresponding loss estimates are
100
revised accordingly. Changes in loss estimates due to premium or exposure fluctuations are incurred in the accident year in which the premium is earned.
The following table summarizes calendar year net loss ratios by separating losses between the current accident year and all prior accident years. Net loss ratios for the period were as follows:
Net Loss Ratios | |||||||||||
Three Months Ended June 30 | Six Months Ended June 30 | ||||||||||
2020 | 2019 | Change | 2020 | 2019 | Change | ||||||
Calendar year net loss ratio | 72.9% | 68.4% | 4.5 pts | 70.0% | 63.3% | 6.7 pts | |||||
Less impact of prior accident years on the net loss ratio | 8.2% | (1.3%) | 9.5 pts | 3.2% | 1.5% | 1.7 pts | |||||
Current accident year net loss ratio | 64.7% | 69.7% | (5.0 pts) | 66.8% | 61.8% | 5.0 pts | |||||
The current accident year net loss ratio decreased during the three months ended June 30, 2020 as compared to the same period of 2019 driven by higher estimated reinsurance recoveries related to contingency and catastrophe related losses and, to a lesser extent, the effect of an increase in net premiums earned, as previously discussed. The current accident year net loss ratio increased during the six months ended June 30, 2020 as compared to the same period of 2019 driven by certain property and catastrophe related losses and, to a lesser extent, contingency related losses incurred during 2020.
We recognized $1.7 million and $1.4 million of unfavorable prior year development for the three and six months ended June 30, 2020, respectively, as compared to $0.2 million of favorable prior year development and $0.5 million of unfavorable prior year development for the same respective periods of 2019. The unfavorable development for the three and six months ended June 30, 2020 was driven by higher than expected losses and development on certain large claims, primarily property and catastrophe related losses, which resulted in unfavorable development with respect to a previous year of account.
We have exposures to potential COVID-19 claims through our participation in Syndicate 1729 and 6131. During the three and six months ended June 30, 2020, we recognized losses related to COVID-19 of approximately $1.5 million, net of reinsurance, primarily in Syndicate 6131's contingency book of business. As of August 1, 2020, the Syndicates estimate additional losses related to COVID-19 of approximately $1.4 million, net of reinsurance, which will be reflected in our results for the third quarter of 2020, due to the quarter lag. We are closely monitoring the impact of potential legislation or court decisions that could retroactively require Syndicate 1729 and 6131 to extend certain insurance to cover COVID-19 claims, even if the original contract excluded the cover of communicable diseases as is typical in certain policies the Syndicates write. These actions could result in a significant increase in claim frequency and severity due to an unintended increase in exposure for Syndicate 1729 and 6131 which could have a material effect on our financial condition, results of operations and cash flows given our participation in the Syndicates. See previous discussion in the Regulatory Environment section under the heading "COVID-19".
Underwriting, Policy Acquisition and Operating Expenses
Underwriting, policy acquisition and operating expenses decreased by $0.3 million for the 2020 three-month period and increased by $0.4 million during the 2020 six-month period as compared to the same respective periods of 2019. The decrease during the 2020 three-month period reflected our decreased participation in Syndicate 1729 and, to a lesser extent, the effect of higher operational expenses incurred associated with establishing Syndicate 6131 during 2019, largely offset by an increase in DPAC amortization due to the increase in net premiums earned, as previously discussed. The increase during the 2020 six-month period was primarily due to the increase in DPAC amortization, partially offset by a decrease in operational expenses incurred, as previously discussed.
The decrease in the underwriting expense ratio during the 2020 three- and six- month periods as compared to the same periods of 2019 was primarily driven by the increased volume of earned premium, as discussed above.
Investments
The change in net investment income for the 2020 and 2019 three- and six- month periods was primarily attributable to interest earned on our FAL investments, which primarily includes investment-grade corporate debt securities. Syndicate 1729's fixed maturities portfolio includes certain debt securities classified as trading securities. Investment results associated with these fixed maturity trading securities are reported on the same quarter lag.
Taxes
Operating results of this segment are subject to U.K. income tax law.
101
Segment Operating Results - Corporate
Our Corporate segment includes our investment operations, other than those reported in our Segregated Portfolio Cell Reinsurance and Lloyd's Syndicates segments, interest expense and U.S. income taxes as discussed in Note 12 of the Notes to Condensed Consolidated Financial Statements. Our Corporate segment also includes non-premium revenues generated outside of our insurance entities and corporate expenses. Segment operating results for our Corporate segment were net earnings of $35.8 million and $31.8 million for the three and six months ended June 30, 2020, respectively, as compared to $17.1 million and $57.3 million for the same respective periods of 2019 and included the following:
Three Months Ended June 30 | Six Months Ended June 30 | ||||||||||||||||||||||
($ in thousands) | 2020 | 2019 | Change | 2020 | 2019 | Change | |||||||||||||||||
Net investment income | $ | 16,693 | $ | 21,972 | $ | (5,279 | ) | (24.0 | %) | $ | 36,110 | $ | 43,337 | $ | (7,227 | ) | (16.7 | %) | |||||
Equity in earnings (loss) of unconsolidated subsidiaries | $ | (25,355 | ) | $ | (5,152 | ) | $ | (20,203 | ) | (392.1 | %) | $ | (26,917 | ) | $ | (5,962 | ) | $ | (20,955 | ) | (351.5 | %) | |
Net realized gains (losses) | $ | 16,850 | $ | 9,140 | $ | 7,710 | 84.4 | % | $ | (8,698 | ) | $ | 43,444 | $ | (52,142 | ) | (120.0 | %) | |||||
Other income | $ | 404 | $ | 833 | $ | (429 | ) | (51.5 | %) | $ | 1,038 | $ | 1,738 | $ | (700 | ) | (40.3 | %) | |||||
Operating expense | $ | 7,764 | $ | 5,426 | $ | 2,338 | 43.1 | % | $ | 12,589 | $ | 9,997 | $ | 2,592 | 25.9 | % | |||||||
Interest expense | $ | 3,714 | $ | 4,247 | $ | (533 | ) | (12.6 | %) | $ | 7,844 | $ | 8,576 | $ | (732 | ) | (8.5 | %) | |||||
Income tax expense (benefit) | $ | (38,686 | ) | $ | 27 | $ | (38,713 | ) | (143,381.5 | %) | $ | (50,732 | ) | $ | 6,685 | $ | (57,417 | ) | (858.9 | %) | |||
Net Investment Income, Equity in Earnings (Loss) of Unconsolidated Subsidiaries, Net Realized Investment Gains (Losses)
Net Investment Income
Net investment income is primarily derived from the income earned by our fixed maturity securities and also includes dividend income from equity securities, income from our short-term and cash equivalent investments, earnings from other investments and increases in the cash surrender value of BOLI contracts, net of investment fees and expenses.
Net investment income by investment category was as follows:
Three Months Ended June 30 | Six Months Ended June 30 | ||||||||||||||||||||||||||||
($ in thousands) | 2020 | 2019 | Change | 2020 | 2019 | Change | |||||||||||||||||||||||
Fixed maturities | $ | 16,375 | $ | 16,680 | $ | (305 | ) | (1.8 | %) | $ | 33,306 | $ | 32,832 | $ | 474 | 1.4 | % | ||||||||||||
Equities | 984 | 4,990 | (4,006 | ) | (80.3 | %) | 2,892 | 9,813 | (6,921 | ) | (70.5 | %) | |||||||||||||||||
Short-term investments, including Other | 355 | 1,449 | (1,094 | ) | (75.5 | %) | 1,698 | 3,116 | (1,418 | ) | (45.5 | %) | |||||||||||||||||
BOLI | 457 | 459 | (2 | ) | (0.4 | %) | 913 | 912 | 1 | 0.1 | % | ||||||||||||||||||
Investment fees and expenses | (1,478 | ) | (1,606 | ) | 128 | (8.0 | %) | (2,699 | ) | (3,336 | ) | 637 | (19.1 | %) | |||||||||||||||
Net investment income | $ | 16,693 | $ | 21,972 | $ | (5,279 | ) | (24.0 | %) | $ | 36,110 | $ | 43,337 | $ | (7,227 | ) | (16.7 | %) | |||||||||||
Fixed Maturities
Income from our fixed maturities decreased during the 2020 three-month period as compared to the same period of 2019 primarily due to lower yields from our corporate debt securities, partially offset by higher average investment balances. The increase in income from our fixed maturities during the 2020 six-month period as compared to the same period of 2019 was due to higher average investment balances. Average investment balances were approximately 5% higher for each of the 2020 three- and six- month periods as compared to the same respective periods of 2019.
Average yields for our fixed maturity portfolio were as follows:
Three Months Ended June 30 | Six Months Ended June 30 | ||||||
2020 | 2019 | 2020 | 2019 | ||||
Average income yield | 3.2% | 3.4% | 3.2% | 3.4% | |||
Average tax equivalent income yield | 3.2% | 3.4% | 3.3% | 3.4% | |||
Equities
Income from our equity portfolio decreased during the 2020 three- and six- month periods as compared to the same respective periods of 2019 which reflected a decrease in our allocation to this asset category.
102
Short-term Investments and Other Investments
Short-term investments, which have a maturity at purchase of one year or less are carried at fair value, which approximates their cost basis, and are primarily composed of investments in U.S. treasury obligations, commercial paper and money market funds. Income from our short-term and other investments decreased during the 2020 three- and six- month periods as compared to the same respective periods of 2019 primarily attributable to lower yields given the recent actions taken by the Federal Reserve to aggressively reduce interest rates in response to COVID-19.
Equity in Earnings (Loss) of Unconsolidated Subsidiaries
Equity in earnings (loss) of unconsolidated subsidiaries was comprised as follows:
Three Months Ended June 30 | Six Months Ended June 30 | ||||||||||||||||||||||||||||
($ in thousands) | 2020 | 2019 | Change | 2020 | 2019 | Change | |||||||||||||||||||||||
All other investments, primarily investment fund LPs/LLCs | $ | (18,581 | ) | $ | 317 | $ | (18,898 | ) | (5,961.5 | %) | $ | (15,479 | ) | $ | 4,126 | $ | (19,605 | ) | (475.2 | %) | |||||||||
Tax credit partnerships | (6,774 | ) | (5,469 | ) | (1,305 | ) | 23.9 | % | (11,438 | ) | (10,088 | ) | (1,350 | ) | 13.4 | % | |||||||||||||
Equity in earnings (loss) of unconsolidated subsidiaries | $ | (25,355 | ) | $ | (5,152 | ) | $ | (20,203 | ) | 392.1 | % | $ | (26,917 | ) | $ | (5,962 | ) | $ | (20,955 | ) | 351.5 | % | |||||||
We hold interests in certain LPs/LLCs that generate earnings from trading portfolios, secured debt, debt securities, multi-strategy funds and private equity investments. The performance of the LPs/LLCs is affected by the volatility of equity and credit markets. For our investments in LPs/LLCs, we record our allocable portion of the partnership operating income or loss as the results of the LPs/LLCs become available, typically following the end of a reporting period. Our investment results from our portfolio of investments in LPs/LLCs decreased for the 2020 three- and six- month periods as compared to the 2019 three- and six- month periods primarily due to lower reported earnings from several LPs/LLCs driven by the impact of the disruption in global financial markets during the first quarter of 2020 due to COVID-19. Given the results of our investments in LPs/LLCs are often reported to us on a one-quarter lag, the impact of COVID-19 on the global financial markets during the first quarter of 2020 was not captured in our results until the current period.
Our tax credit partnership investments are designed to generate returns in the form of tax credits and tax-deductible project operating losses and are comprised of qualified affordable housing project tax credit partnerships and a historic tax credit partnership. We account for our tax credit partnership investments under the equity method and record our allocable portion of the operating losses of the underlying properties based on estimates provided by the partnerships. For our qualified affordable housing project tax credit partnerships, we adjust our estimates of our allocable portion of operating losses periodically as actual operating results of the underlying properties become available. Our historic tax credit partnership is short-term in nature and the remaining operating losses, up to our total current funded commitment, were recognized during the second quarter of 2020. Losses from our tax credit partnerships increased during the three and six months ended June 30, 2020 due to an increase in our estimate of operating losses by $3.4 million in the three and six months ended June 30, 2020 as compared to $1.5 million in the three and six months ended June 30, 2019.
The tax benefits received from our tax credit partnerships, which are not reflected in our investment results above, reduced our tax expense in 2020 and 2019 as follows:
Three Months Ended June 30 | Six Months Ended June 30 | ||||||||||||||
(In millions) | 2020 | 2019 | 2020 | 2019 | |||||||||||
Tax credits recognized during the period | $ | 4.5 | $ | 4.7 | $ | 8.9 | $ | 9.3 | |||||||
Tax benefit of tax credit partnership operating losses | $ | 1.4 | $ | 1.1 | $ | 2.4 | $ | 2.1 | |||||||
Due to our consolidated loss before income taxes recognized during the three and six months ended June 30, 2020, the tax credits generated in 2020 from our tax credit partnership investments of $4.5 million and $8.9 million, respectively, were deferred and are expected to be utilized in future periods.
Tax credits provided by the underlying projects of our historic tax credit partnership are typically available in the tax year in which the project is put into active service, whereas the tax credits provided by qualified affordable housing project tax credit partnerships are provided over approximately a ten year period.
103
Non-GAAP Financial Measure – Tax Equivalent Investment Result
We believe that to fully understand our investment returns it is important to consider the current tax benefits associated with certain investments as the tax benefit received represents a portion of the return provided by our tax-exempt bonds, BOLI, common and preferred stocks, and tax credit partnership investments (collectively, our tax-preferred investments). We impute a pro forma tax-equivalent result by estimating the amount of fully-taxable income needed to achieve the same after-tax result as is currently provided by our tax-preferred investments. We believe this better reflects the economics behind our decision to invest in certain asset classes that are either taxed at lower rates and/or result in reductions to our current federal income tax expense. Our pro forma tax-equivalent investment result is shown in the table that follows as well as a reconciliation of our GAAP net investment result to our tax equivalent result.
Three Months Ended June 30 | Six Months Ended June 30 | ||||||||||||||
(In thousands) | 2020 | 2019 | 2020 | 2019 | |||||||||||
GAAP net investment result: | |||||||||||||||
Net investment income | $ | 16,693 | $ | 21,972 | $ | 36,110 | $ | 43,337 | |||||||
Equity in earnings (loss) of unconsolidated subsidiaries | (25,355 | ) | (5,152 | ) | (26,917 | ) | (5,962 | ) | |||||||
GAAP net investment result | $ | (8,662 | ) | $ | 16,820 | $ | 9,193 | $ | 37,375 | ||||||
Pro forma tax-equivalent investment result | $ | (8,376 | ) | $ | 23,195 | $ | 9,835 | $ | 50,097 | ||||||
Reconciliation of pro forma and GAAP tax-equivalent investment result: | |||||||||||||||
GAAP net investment result | $ | (8,662 | ) | $ | 16,820 | $ | 9,193 | $ | 37,375 | ||||||
Taxable equivalent adjustments, calculated using the 21% federal statutory tax rate | |||||||||||||||
State and municipal bonds | 157 | 247 | 318 | 467 | |||||||||||
BOLI | 121 | 122 | 243 | 242 | |||||||||||
Dividends received | 8 | 139 | 81 | 280 | |||||||||||
Tax credit partnerships* | — | 5,867 | — | 11,733 | |||||||||||
Pro forma tax-equivalent investment result | $ | (8,376 | ) | $ | 23,195 | $ | 9,835 | $ | 50,097 | ||||||
*Due to our consolidated pre-tax loss during the three and six months ended June 30, 2020, the tax credits recognized from our tax credit partnership investments were deferred to be utilized in future periods; therefore, there is no tax-equivalent adjustment required as tax credits had no impact on our current tax expense during the three and six months ended June 30, 2020. | |||||||||||||||
104
Net Realized Investment Gains (Losses)
The following table provides detailed information regarding our net realized investment gains (losses).
Three Months Ended June 30 | Six Months Ended June 30 | ||||||||||||||
(In thousands) | 2020 | 2019 | 2020 | 2019 | |||||||||||
Total impairment losses | |||||||||||||||
Corporate debt | $ | (582 | ) | $ | — | $ | (2,399 | ) | $ | (136 | ) | ||||
Portion of impairment losses recognized in other comprehensive income before taxes: | |||||||||||||||
Corporate debt | 237 | — | 891 | 87 | |||||||||||
Net impairment losses recognized in earnings | (345 | ) | — | (1,508 | ) | (49 | ) | ||||||||
Gross realized gains, available-for-sale fixed maturities | 4,391 | 966 | 6,670 | 1,226 | |||||||||||
Gross realized (losses), available-for-sale fixed maturities | (466 | ) | (20 | ) | (1,869 | ) | (328 | ) | |||||||
Net realized gains (losses), equity investments | (4,564 | ) | 9,179 | 10,633 | 10,969 | ||||||||||
Net realized gains (losses), other investments | 1,864 | 198 | 1,912 | 577 | |||||||||||
Change in unrealized holding gains (losses), equity investments | 12,053 | (2,294 | ) | (23,172 | ) | 27,931 | |||||||||
Change in unrealized holding gains (losses), convertible securities, carried at fair value as a part of other investments | 3,913 | 1,110 | (1,360 | ) | 3,116 | ||||||||||
Other | 4 | 1 | (4 | ) | 2 | ||||||||||
Net realized investment gains (losses) | $ | 16,850 | $ | 9,140 | $ | (8,698 | ) | $ | 43,444 | ||||||
For the three and six months ended June 30, 2020, we recognized credit-related impairment losses in earnings of $0.3 million and $1.5 million, respectively, and non-credit impairment losses in OCI of $0.2 million and $0.9 million, respectively. The credit-related impairment losses recognized during the 2020 three- and six- month periods related to corporate bonds in the energy, consumer and financial sectors. Additionally, the 2020 six-month period included credit-related impairment losses related to a corporate bond in the entertainment sector, which was sold during the second quarter of 2020. The non-credit impairment losses recognized during the 2020 three- and six- month periods related to three corporate bonds in the energy and consumer sectors. We did not recognize any impairment losses during the three months ended June 30, 2019. For the six months ended June 30, 2019, we recognized a nominal amount of both credit-related impairment losses and non-credit impairment losses in OCI, both of which related to a corporate bond.
We recognized $16.9 million of net realized investment gains during the 2020 three-month period and $8.7 million of net realized investment losses during the 2020 six-month period driven by changes in fair value on our equity portfolio and convertible securities due to the volatility in the global financial markets related to COVID-19 during the first half of 2020. During the 2019 three- and six- month periods, we recognized $9.1 million and $43.4 million of net realized investment gains, respectively. Net realized investment gains for the 2019 three-month period were driven by realized gains from the sale of equity investments during the period. For the 2019 six-month period, net realized investment gains were driven by unrealized holding gains on our equity portfolio and realized gains from the sale of equity investments during the period.
Operating Expenses
Corporate segment operating expenses were comprised as follows:
Three Months Ended June 30 | Six Months Ended June 30 | ||||||||||||||||||||||||||||
($ in thousands) | 2020 | 2019 | Change | 2020 | 2019 | Change | |||||||||||||||||||||||
Operating expenses | $ | 10,709 | $ | 8,856 | $ | 1,853 | 20.9 | % | $ | 19,799 | $ | 18,027 | $ | 1,772 | 9.8 | % | |||||||||||||
Management fee offset | (2,945 | ) | (3,430 | ) | 485 | (14.1 | %) | (7,210 | ) | (8,030 | ) | 820 | (10.2 | %) | |||||||||||||||
Segment Total | $ | 7,764 | $ | 5,426 | $ | 2,338 | 43.1 | % | $ | 12,589 | $ | 9,997 | $ | 2,592 | 25.9 | % | |||||||||||||
Operating expenses increased during the 2020 three- and six- month periods as compared to the same periods of 2019 primarily due to an increase in professional fees driven by corporate legal expenses and transaction-related costs associated with our planned acquisition of NORCAL (see Note 6 of the Notes to Condensed Consolidated Financial Statements). The increase in operating expenses during the 2020 three- and six- month periods was partially offset by a decrease in various operational expenses, primarily travel related costs of approximately $0.3 million during the second quarter of 2020, as a result of the COVID-19 pandemic.
105
Operating subsidiaries within our Specialty P&C and Workers' Compensation Insurance segments are charged a management fee by the Corporate segment for services provided to these subsidiaries. The management fee is based on the extent to which services are provided to the subsidiary and the amount of premium written by the subsidiary. Under the arrangement, the expenses associated with such services are reported as expenses of the Corporate segment, and the management fees charged are reported as an offset to Corporate operating expenses. While the terms of the arrangement were consistent between 2019 and 2020, fluctuations in the amount of premium written by each subsidiary can result in corresponding variations in the management fee charged to each subsidiary during a particular period.
Interest Expense
Consolidated interest expense for the three and six months ended June 30, 2020 and 2019 was comprised as follows:
Three Months Ended June 30 | Six Months Ended June 30 | ||||||||||||||||||||||||||||
($ in thousands) | 2020 | 2019 | Change | 2020 | 2019 | Change | |||||||||||||||||||||||
Senior Notes due 2023 | $ | 3,357 | $ | 3,357 | $ | — | — | % | $ | 6,714 | $ | 6,714 | $ | — | — | % | |||||||||||||
Revolving Credit Agreement (including fees and amortization) | 83 | 177 | (94 | ) | (53.1 | %) | 267 | 318 | (51 | ) | (16.0 | %) | |||||||||||||||||
Mortgage Loans (including amortization)* | 197 | 351 | (154 | ) | (43.9 | %) | 491 | 745 | (254 | ) | (34.1 | %) | |||||||||||||||||
(Gain)/loss on interest rate cap | 77 | 362 | (285 | ) | (78.7 | %) | 372 | 799 | (427 | ) | (53.4 | %) | |||||||||||||||||
Interest expense | $ | 3,714 | $ | 4,247 | $ | (533 | ) | (12.6 | %) | $ | 7,844 | $ | 8,576 | $ | (732 | ) | (8.5 | %) | |||||||||||
* During each of the three and six months ended June 30, 2019, we received a nominal cash payment associated with our interest rate cap which was recorded as a reduction to interest expense associated with our Mortgage Loans.
Consolidated interest expense decreased during the three and six months ended June 30, 2020 as compared to the same respective periods of 2019 driven by the change in the fair value of our interest rate cap and lower interest expense on our Mortgage Loans. The interest rate cap is designated as an economic hedge of interest rate risk associated with our variable rate Mortgage Loans. Our Mortgage Loans accrue interest at three month LIBOR plus 1.325%, and the decrease in interest expense during the three and six months ended June 30, 2020 as compared to the same respective periods of 2019 was primarily due to a decrease in the average three-month LIBOR. Interest expense on our Revolving Credit Agreement for the three and six months ended June 30, 2020 and 2019 primarily reflected unused commitment fees as there were no outstanding borrowings during those periods. See further discussion of our outstanding debt in Note 8 of the Notes to Condensed Consolidated Financial Statements and further discussion of our interest rate cap agreement in Note 12 of the Notes to Consolidated Financial Statements in ProAssurance's December 31, 2019 report on Form 10-K.
Taxes
Tax expense allocated to our Corporate segment includes U.S. tax only, which would include U.S. tax expense incurred from our corporate membership in Lloyd's of London. The U.K. tax expense incurred by the U.K. based subsidiaries of our Lloyd's Syndicates segment is allocated to that segment. The SPCs at Inova Re, one of our Cayman Islands reinsurance subsidiaries, have each made a 953(d) election under the U.S. Internal Revenue Code and are subject to U.S. federal income tax; therefore, tax expense allocated to our Corporate segment also includes tax expense incurred from any SPC at Inova Re in which we have a participation interest of 80% or greater as those SPCs are required to be included in our consolidated tax return. Consolidated tax expense reflects the tax expense of both segments, as shown in the table below:
Three Months Ended June 30 | Six Months Ended June 30 | ||||||||||||||
(In thousands) | 2020 | 2019 | 2020 | 2019 | |||||||||||
Corporate segment income tax expense (benefit) | $ | (38,686 | ) | $ | 27 | $ | (50,732 | ) | $ | 6,685 | |||||
Lloyd's Syndicates segment income tax expense (benefit) | — | (304 | ) | (29 | ) | — | |||||||||
Consolidated income tax expense (benefit) | $ | (38,686 | ) | $ | (277 | ) | $ | (50,761 | ) | $ | 6,685 | ||||
106
Listed below are the primary factors affecting our consolidated effective tax rate for three and six months ended June 30, 2020 and 2019. The comparability of each factor's impact on our effective tax rate is affected by the consolidated pre-tax loss recognized during the three and six months ended June 30, 2020 as compared to the consolidated pre-tax income recognized during the same periods of 2019. Factors that have the same directional impact on income tax expense in each period have an opposite impact on our effective tax rate due to the effective tax rate being calculated based upon a pre-tax loss during the three and six months ended June 30, 2020 versus pre-tax income during the same periods of 2019. These factors include the following:
Three Months Ended June 30 | |||||||||||
2020 | 2019 | ||||||||||
($ in thousands) | Income tax (benefit) expense | Rate Impact | Income tax (benefit) expense | Rate Impact | |||||||
Computed "expected" tax expense (benefit) at statutory rate | $ | (11,925 | ) | 21.0 | % | $ | 2,365 | 21.0 | % | ||
Tax-exempt income (1) | (227 | ) | 0.2 | % | (391 | ) | (3.5 | %) | |||
Tax credits | (4,472 | ) | 7.9 | % | (4,635 | ) | (41.2 | %) | |||
Non-U.S. operating results | (23 | ) | 0.1 | % | (66 | ) | (0.6 | %) | |||
Tax deficiency (excess tax benefit) on share-based compensation | 23 | — | % | (91 | ) | (0.8 | %) | ||||
Tax rate differential on loss carryback | (7,906 | ) | 13.9 | % | — | — | % | ||||
Estimated annual tax rate differential (2) | (14,155 | ) | 24.8 | % | 2,360 | 20.9 | % | ||||
Other | (1 | ) | 0.2 | % | 181 | 1.7 | % | ||||
Total income tax expense (benefit) | $ | (38,686 | ) | 68.1 | % | $ | (277 | ) | (2.5 | %) | |
Six Months Ended June 30 | |||||||||||
2020 | 2019 | ||||||||||
($ in thousands) | Income tax (benefit) expense | Rate Impact | Income tax (benefit) expense | Rate Impact | |||||||
Computed "expected" tax expense (benefit) at statutory rate | $ | (19,071 | ) | 21.0 | % | $ | 10,473 | 21.0 | % | ||
Tax-exempt income (1) | (507 | ) | 0.6 | % | (824 | ) | (1.6 | %) | |||
Tax credits | (8,943 | ) | 9.8 | % | (9,269 | ) | (18.6 | %) | |||
Non-U.S. operating results | 163 | (0.2 | %) | 66 | 0.1 | % | |||||
Tax deficiency (excess tax benefit) on share-based compensation | 428 | (0.5 | %) | 46 | 0.1 | % | |||||
Tax rate differential on loss carryback | (9,330 | ) | 10.3 | % | — | — | % | ||||
Estimated annual tax rate differential (2) | (14,155 | ) | 15.6 | % | 6,301 | 12.6 | % | ||||
Other | 654 | (0.7 | %) | (108 | ) | (0.2 | %) | ||||
Total income tax expense (benefit) | $ | (50,761 | ) | 55.9 | % | $ | 6,685 | 13.4 | % | ||
(1) Includes tax-exempt interest, dividends received deduction and change in cash surrender value of BOLI. | |||||||||||
(2) Represents the tax rate differential between our actual effective tax rate for the six months ended June 30, 2020 and our projected annual effective tax rate as of June 30, 2020. | |||||||||||
The provision (benefit) for income taxes and the effective tax rate for the 2020 and 2019 three- and six- month periods are determined based upon our current estimate of our annual effective tax rate at the end of each quarterly reporting period (the projected annual effective tax rate) plus the impact of certain discrete items that are not included in the projected annual effective tax rate. See further discussion around the methods utilized to compute interim taxes under the heading "Estimation of Taxes/Tax Credits" in the Critical Accounting Estimates section.
Our projected annual effective tax rates for 2020 and 2019 were 53.4% and (39.0%) at June 30, 2020 and 2019, respectively, before consideration of discrete items. Our projected annual effective tax rates at June 30, 2020 and 2019 and our effective tax rates for both the 2020 and 2019 six-month periods were different from the statutory federal income tax rate of 21% primarily due to the benefit recognized from the tax credits transferred to us from our tax credit partnership investments. Tax credits recognized during the three and six months ended June 30, 2020 were $4.5 million and $8.9 million, respectively, as compared to $4.7 million and $9.3 million for the same respective periods of 2019. While projected tax credits for 2020 are less
107
than 2019, they continue to have a significant impact on the effective tax rate for the 2020 three- and six- month periods. Additionally, our projected annual effective tax rate as of June 30, 2020 includes the additional tax rate differential of 14% on the carryback of our 2020 NOL to the 2015 tax year as a result of changes made by the CARES Act to the NOL provisions of the tax law.
Our projected annual effective tax rates as of June 30, 2020 and 2019 differed from the effective tax rates due to certain discrete items. These discrete items increased our effective tax rate by 2.5% and 52.4% for the 2020 and 2019 six-month periods, respectively. For the 2020 and 2019 six-month periods the most significant discrete item that affected our effective tax rate was the treatment of net realized investment gains and losses. This treatment of net realized investment losses of $8.7 million for the six months ended June 30, 2020 and net realized investment gains of $43.4 million for the six months ended June 30, 2019 in our Corporate segment accounted for 2.0% and 52.3% of the increase in the effective tax rate in the same respective periods. An additional discrete item impacting our effective tax rates for the 2020 three- and six- month periods is the additional tax rate differential of 14% on the carryback of our 2019 NOL to the 2014 tax year as a result of changes made by the CARES Act to the NOL provisions of the tax law.
108
ITEM 3. QUANTITATIVE AND QUALITATIVE DISCLOSURES ABOUT MARKET RISK.
We believe that we are principally exposed to three types of market risk; interest rate risk, credit risk and equity price risk. We have limited exposure to foreign currency risk as we issue few insurance contracts denominated in currencies other than the U.S. dollar and we have few monetary assets or obligations denominated in foreign currencies.
Interest Rate Risk
Investments
Our fixed maturities portfolio is exposed to interest rate risk. Fluctuations in interest rates have a direct impact on the market valuation of these securities. As interest rates rise, market values of fixed income portfolios fall and vice versa. Future market interest rates are particularly uncertain at this time given the abrupt interest rate cuts recently made by the Federal Reserve in response to the COVID-19 pandemic. Certain of the securities are held in an unrealized loss position; we do not intend to sell and believe we will not be required to sell any debt security held in an unrealized loss position before its anticipated recovery.
The following tables summarize estimated changes in the fair value of our available-for-sale fixed maturity securities for specific hypothetical changes in interest rates by asset class at June 30, 2020 and December 31, 2019. There are principally two factors that determine interest rates on a given security: changes in the level of yield curves and credit spreads. As different asset classes can be affected in different ways by movements in those two factors, we have separated our portfolio by asset class in the following tables.
Interest Rate Shift in Basis Points | |||||||||||||||||||
June 30, 2020 | |||||||||||||||||||
($ in millions) | (200) | (100) | Current | 100 | 200 | ||||||||||||||
Fair Value: | |||||||||||||||||||
Fixed maturities, available-for-sale: | |||||||||||||||||||
U.S. Treasury obligations | $ | 122 | $ | 119 | $ | 115 | $ | 112 | $ | 109 | |||||||||
U.S. Government-sponsored enterprise obligations | 9 | 9 | 9 | 9 | 8 | ||||||||||||||
State and municipal bonds | 318 | 305 | 294 | 283 | 272 | ||||||||||||||
Corporate debt | 1,366 | 1,319 | 1,274 | 1,232 | 1,193 | ||||||||||||||
Asset-backed securities | 594 | 581 | 568 | 554 | 539 | ||||||||||||||
Total fixed maturities, available-for-sale | $ | 2,409 | $ | 2,333 | $ | 2,260 | $ | 2,190 | $ | 2,121 | |||||||||
Duration: | |||||||||||||||||||
Fixed maturities, available-for-sale: | |||||||||||||||||||
U.S. Treasury obligations | 3.00 | 2.92 | 2.85 | 2.79 | 2.72 | ||||||||||||||
U.S. Government-sponsored enterprise obligations | 1.34 | 1.30 | 1.28 | 2.76 | 3.82 | ||||||||||||||
State and municipal bonds | 3.97 | 3.90 | 3.84 | 3.81 | 3.81 | ||||||||||||||
Corporate debt | 3.40 | 3.37 | 3.33 | 3.28 | 3.22 | ||||||||||||||
Asset-backed securities | 2.35 | 2.30 | 2.31 | 2.56 | 2.85 | ||||||||||||||
Total fixed maturities, available-for-sale | 3.19 | 3.14 | 3.11 | 3.14 | 3.18 | ||||||||||||||
109
Interest Rate Shift in Basis Points | |||||||||||||||||||
December 31, 2019 | |||||||||||||||||||
($ in millions) | (200) | (100) | Current | 100 | 200 | ||||||||||||||
Fair Value: | |||||||||||||||||||
Fixed maturities, available-for-sale: | |||||||||||||||||||
U.S. Treasury obligations | $ | 117 | $ | 113 | $ | 111 | $ | 108 | $ | 105 | |||||||||
U.S. Government-sponsored enterprise obligations | 18 | 17 | 17 | 17 | 16 | ||||||||||||||
State and municipal bonds | 320 | 308 | 296 | 285 | 274 | ||||||||||||||
Corporate debt | 1,425 | 1,382 | 1,340 | 1,300 | 1,261 | ||||||||||||||
Asset-backed securities | 548 | 537 | 525 | 511 | 497 | ||||||||||||||
Total fixed maturities, available-for-sale | $ | 2,428 | $ | 2,357 | $ | 2,289 | $ | 2,221 | $ | 2,153 | |||||||||
Duration: | |||||||||||||||||||
Fixed maturities, available-for-sale: | |||||||||||||||||||
U.S. Treasury obligations | 2.78 | 2.71 | 2.64 | 2.58 | 2.52 | ||||||||||||||
U.S. Government-sponsored enterprise obligations | 0.75 | 0.71 | 0.98 | 3.07 | 3.87 | ||||||||||||||
State and municipal bonds | 3.91 | 3.84 | 3.82 | 3.89 | 3.93 | ||||||||||||||
Corporate debt | 3.10 | 3.04 | 3.02 | 3.01 | 2.99 | ||||||||||||||
Asset-backed securities | 2.12 | 2.21 | 2.46 | 2.73 | 2.87 | ||||||||||||||
Total fixed maturities, available-for-sale | 2.95 | 2.92 | 2.96 | 3.04 | 3.07 | ||||||||||||||
Computations of prospective effects of hypothetical interest rate changes are based on numerous assumptions, including the maintenance of the existing level and composition of fixed income security assets, and should not be relied on as indicative of future results.
Certain shortcomings are inherent in the method of analysis presented in the computation of the fair value of fixed rate instruments. Actual values may differ from the projections presented should market conditions vary from assumptions used in the calculation of the fair value of individual securities, including non-parallel shifts in the term structure of interest rates and changing individual issuer credit spreads.
At June 30, 2020, our fixed maturities portfolio includes fixed maturities classified as trading securities which do not have a significant amount of exposure to market interest rates or credit spreads.
Our cash and short-term investments at June 30, 2020 were carried at fair value which approximates their cost basis due to their short-term nature. Our cash and short-term investments lack significant interest rate sensitivity due to their short duration.
Debt
Our Mortgage Loans are exposed to interest rate risk as they accrue interest at three-month LIBOR plus 1.325%. However, a 1% change in LIBOR will not materially impact our annualized interest expense. Additionally, we have economically hedged the risk of a change in interest rates in excess of 1% on the Mortgage Loans through the purchase of an interest rate cap derivative instrument, which effectively caps our annual interest rate on the Mortgage Loans at a maximum of 3.675% (see Note 12 of the Notes to Consolidated Financial Statements in ProAssurance's December 31, 2019 report on Form 10-K for additional information). The fair value of the interest rate cap is not materially impacted by a 1% change in LIBOR; however, the carrying value of the interest rate cap is impacted by future expectations for LIBOR as well as estimations of volatility in the future yield curve.
Our Revolving Credit Agreement is exposed to interest rate risk as it is LIBOR based and a 1% change in LIBOR will impact annual interest expense only to the extent that there is an outstanding balance. For every $100 million drawn on our Revolving Credit Agreement, a 1% change in interest rates will change our annual interest expense by $1 million. Any outstanding balances on the Revolving Credit Agreement can be repaid on each maturity date, which has typically ranged from one to three months. As of June 30, 2020, no borrowings were outstanding under our Revolving Credit Agreement.
110
Credit Risk
We have exposure to credit risk primarily as a holder of fixed income securities. We control this exposure by emphasizing investment grade credit quality in the fixed income securities we purchase.
As of June 30, 2020, 94% of our fixed maturity securities were rated investment grade as determined by NRSROs, such as Fitch, Moody’s and Standard & Poor’s. We believe that this concentration in investment grade securities reduces our exposure to credit risk on our fixed income investments to an acceptable level. However, investment grade securities, in spite of their rating, can rapidly deteriorate and result in significant losses. Ratings published by the NRSROs are one of the tools used to evaluate the creditworthiness of our securities. The ratings reflect the subjective opinion of the rating agencies as to the creditworthiness of the securities; therefore, we may be subject to additional credit exposure should the ratings prove to be unreliable.
We also have exposure to credit risk related to our premiums receivable and receivables from reinsurers; however, to-date we have not experienced any significant amount of credit losses. At June 30, 2020, our premiums receivable was approximately $235 million, net of an allowance for expected credit losses of approximately $7 million. See Note 1 of the Notes to the Condensed Consolidated Financial Statements for further information on our allowance for expected credit losses related to our premiums receivable. Our receivables from reinsurers (with regard to both paid and unpaid losses) approximated $416 million at June 30, 2020 and $403 million at December 31, 2019. We monitor the credit risk associated with our reinsurers using publicly available financial and rating agency data. We have not historically experienced material credit losses due to the financial condition of a reinsurer, and as of June 30, 2020 our expected credit losses associated with our receivables from reinsurers were nominal in amount. During the second quarter of 2020, we have received and granted requests for premium relief for certain insureds that have been adversely impacted by the recent COVID-19 pandemic in the form of either premium credits or premium deferrals. These efforts, along with the recent economic disruptions caused by COVID-19, may result in future increases in our allowance for expected credit losses associated with our premiums and reinsurance receivables.
Equity Price Risk
At June 30, 2020, the fair value of our equity investments, excluding our equity investments in bond investment funds as discussed in the following paragraph, was $33 million. These equity securities are subject to equity price risk, which is defined as the potential for loss in fair value due to a decline in equity prices. Recent disruptions in global financial markets related to COVID-19 have resulted in volatility in the fair value of our equity securities during the first half of 2020. We cannot predict the level of market disruption and subsequent declines in fair value that may occur should the COVID-19 pandemic and its related macro-economic impacts continue for an extended period of time. The weighted average beta of this group of securities was 1.10. Beta measures the price sensitivity of an equity security or group of equity securities to a change in the broader equity market, in this case the S&P 500 Index. If the value of the S&P 500 Index increased by 10%, the fair value of these securities would be expected to increase by 11.0% to $37 million. Conversely, a 10% decrease in the S&P 500 Index would imply a decrease of 11.0% in the fair value of these securities to $30 million. The selected hypothetical changes of plus or minus 10% do not reflect what could be considered the best or worst case scenarios and are used for illustrative purposes only.
Our equity investments include equity investments in certain bond investment funds which are not subject to significant equity price risk, and thus we have excluded these investments from the above analysis.
111
ITEM 4. CONTROLS AND PROCEDURES.
The principal executive officer and principal financial officer of the Company participated in management’s evaluation of our disclosure controls and procedures (as defined in SEC Rule 13a-15(e)) as of June 30, 2020. ProAssurance’s disclosure controls and procedures are designed to reasonably assure that information required to be disclosed by us in reports we file or submit under the Exchange Act is accumulated and communicated to our management as appropriate to allow timely decisions regarding disclosure and is recorded, processed, summarized and reported within the time periods specified in the Securities and Exchange Commission’s rules and forms. Based on that evaluation, the principal executive officer and principal financial officer have concluded that our disclosure controls and procedures are effective.
Changes in Internal Control over Financial Reporting
There have been no significant changes in our internal controls over financial reporting that have materially affected, or are reasonably likely to materially affect, those controls during the quarter.
PART II. OTHER INFORMATION
ITEM 1. LEGAL PROCEEDINGS.
See Note 6 of the Notes to Condensed Consolidated Financial Statements.
ITEM 1A. RISK FACTORS.
Our results may differ materially from those we expect and discuss in any forward-looking statements. The principal risk factors that may cause these differences are described in "Item 1A, Risk Factors" in our December 31, 2019 report on Form 10-K and other documents we file with the SEC, such as our current reports on Form 8-K. Other than as described below, there have been no material changes to the "Risk Factors" disclosed in Part 1, Item 1A of ProAssurance's December 31, 2019 report on Form 10-K.
The Company's results of operations could be adversely impacted by catastrophes, both natural and man-made, pandemics, severe weather conditions, climate change or closely related series of events.
Catastrophes can be caused by unpredictable natural events such as hurricanes, windstorms, severe storms, tornadoes, floods, hailstorms, severe winter weather, earthquakes, explosions and fire, and by other natural and man-made events, such as terrorist attacks, as well as pandemics and other similar outbreaks in many parts of the world, including the recent outbreak of a coronavirus referred to as “COVID-19”. These events may have a material adverse effect on our workforce and business operations as well as the workforce and operations of our insureds and independent agents. Some of the assets in our investment portfolio may be adversely affected by declines in the equity markets, changes in interest rates, reduced liquidity and economic activity caused by large-scale catastrophes, pandemics, terrorist attacks or similar events which could have a material adverse effect on our financial position, results of operations and liquidity.
The Company's disaster preparedness encompasses our Business Continuity Plan, Disaster Recovery Plan, Operations Plan and Pandemic Response Plan. Our disaster preparedness is focused on maintaining the continuity of the Company's data processing and network and telecommunications system as well as the use of alternate and temporary facilities in the event of a natural disaster or medical event. The Company's plans are externally reviewed during the insurance department examinations of the statutory insurance companies. While the Company has plans in place to respond to both short- and long-term disaster scenarios, the loss of certain key operating facilities or data processing capabilities could have a significant impact on Company operations.
The impact of the COVID-19 pandemic and related general economic conditions could have a material adverse effect on our results of operations, financial position or liquidity.
The continuing global COVID-19 pandemic has impacted the global economy, financial markets and our results of operations. Because of the size and breadth of this pandemic, all of the direct and indirect consequences of COVID-19 are not yet known and may not emerge for some time. Impacts to our results of operations could be widespread and material, including but not limited to, the following:
• | negative impact on premium volume due to reduced demand and decreased insured exposures due to the impact of COVID-19 on general economic activity, especially for lines of business that are sensitive to rates of economic growth and those that are impacted by audit premium adjustments; |
• | negative impact on expense ratios due to reduced premium volume; |
• | reduced cash flows from premium credits and from our policyholders delaying premium payments; |
• | increases in frequency and/or severity of compensable claims, losses litigation and related expenses; |
112
• | losses from COVID-19 related claims could be greater than our reserves for those losses; |
• | government mandates and/or legislative changes in response to COVID-19, including, but not limited to: actions prohibiting an insurance company from canceling insurance policies in accordance with policy terms; requiring an insurance company to cover losses when its policies specifically excluded coverage or did not provide coverage; preventing an insurance company from filing for a rate increase; ordering an insurance company to provide premium refunds; granting premium grace periods and presumed COVID-19 compensability for all or certain occupational groups; |
• | continued volatility and further disruption in global financial markets that could materially affect our investment portfolio valuations and returns; |
• | declining interest rates which could reduce future investment results; |
• | increased credit risk; |
• | increased cybersecurity risk as criminals seek new ways to target shifting business models; and |
• | business disruption to independent insurance agents and brokers. |
We are taking precautions to protect the safety and well-being of our employees while providing uninterrupted service to our policyholders and claimants. It is not possible at this time to estimate the impact that COVID-19 could have on our results of operations and financial condition, as the impact will depend on future developments, which are highly uncertain and cannot be predicted. Further, to the extent the COVID-19 pandemic adversely affects our business and financial results, it may also have the effect of heightening many of the other risks described in "Risk Factors" as disclosed in Part 1, Item 1A of ProAssurance's December 31, 2019 report on Form 10-K.
There are numerous risks and uncertainties around the Company's planned acquisition of NORCAL
We have entered into a definitive agreement to acquire NORCAL, an underwriter of medical professional liability insurance, subject to the demutualization of NORCAL Mutual, NORCAL's ultimate controlling party. See Note 6 of the Notes to Condensed Consolidated Financial Statements for further information. If consummated, the transaction will provide strategic and financial benefits including additional scale and geographic diversification in the physician professional liability market and is expected to be accretive to earnings over time; nevertheless, there are numerous risks and uncertainties around transaction. The completion of our planned acquisition of NORCAL is subject to a number of conditions, including required regulatory approvals. The failure to satisfy all the required conditions could prevent the acquisition from occurring. In addition, regulators could impose additional requirements or obligations as conditions for their approval. We can provide no assurance that we will obtain the necessary approvals within the estimated timeframe or at all, or that any such requirements that are imposed by regulators would not result in the termination of the transaction. Investors’ reactions to a failure to complete the acquisition of NORCAL, including possible speculation about alternative uses of capital, may cause volatility in our stock price. A failure to complete a proposed transaction of this nature could also result in litigation by stockholders and other affected parties.
In addition, even if we complete the proposed NORCAL acquisition, we may not be able to successfully integrate NORCAL into our business and therefore may not be able to achieve the synergies we would expect as a result of the acquisition. The process of integrating an acquired company or business can be complex and costly and may create unforeseen operating difficulties including ineffective integration of underwriting, risk management, claims handling, finance, information technology and actuarial practices and the design and operation of internal controls over financial reporting. Difficulties integrating an acquired business may also result in the acquired business performing differently than we expected including the loss of customers or in our failure to realize anticipated growth or expense-related efficiencies. We could be adversely affected by the acquisition due to unanticipated performance issues and additional expense, unforeseen or adverse changes in liabilities, including liabilities arising from events prior to the acquisition or that were unknown to us at the time of the acquisition, transaction-related charges, diversion of management time and resources to integration challenges, loss of key employees, regulatory requirements, exposure to tax liabilities, exposure to pension liabilities, amortization of expenses related to intangibles, and charges for impairment of assets or goodwill. Furthermore, the significant disruptions on global financial markets as of result of the recent COVID-19 pandemic could impact the future operating performance of NORCAL negatively, as well as negatively impact the fair value of its assets and liabilities. Therefore, our liquidity may be adversely impacted should NORCAL's operating performance deteriorate, requiring our holding company to infuse capital into NORCAL or preventing the ability to distribute capital from NORCAL to our holding company due to regulatory restrictions or other reasons.
In late 2020 or early 2021, we plan to utilize debt financing to partially fund our acquisition of NORCAL. The COVID-19 pandemic’s potential disruption to our business operations may require us to access our Revolving Credit Agreement which we have anticipated utilizing to partially fund the NORCAL transaction. Thus, we may be required to raise substantial additional financing to fund working capital, capital expenditures, acquisitions or other general corporate requirements. Our ability to arrange additional financing or refinancing will depend on, among other factors, our financial position and performance, as well as prevailing market conditions and other factors beyond our control. There can be no assurance that we will be able to
113
obtain additional financing or refinancing, if needed, on terms acceptable to us or at all. If we are not able to access capital on acceptable terms, we may encounter difficulty funding the transaction, our business requirements, including debt repayments when they become due, or both. In addition, due to the impacts of the COVID-19 pandemic, we could experience loss of revenue and profits due to delayed payments or insolvency of insureds facing liquidity issues as well as lower yields on our investment portfolio. As a result, we may be compelled to take additional measures to preserve our cash flow, including the reduction of operating expenses or reduction or suspension of dividend payments, at least until the impacts of the COVID-19 pandemic improve.
Increased levels of indebtedness associated with the NORCAL transaction or due to meeting our operational needs could make us more vulnerable to general adverse economic, regulatory and industry conditions in a period of uncertainty and volatility. This indebtedness could have the effect, among other things, of reducing our flexibility to respond to changing business and economic conditions and increasing interest expense. The increased levels of indebtedness following completion of the acquisition could also reduce funds available for working capital, capital expenditures, acquisitions and other general corporate purposes and may create competitive disadvantages relative to other companies with lower debt levels. If we do not achieve the expected benefits and cost savings from the NORCAL acquisition, or if the financial performance of the combined company does not meet current expectations, our ability to service our indebtedness may be adversely impacted.
Any of these events could materially adversely affect our business, financial condition, results of operations, cash flows, liquidity and stock price.
We are subject to numerous NYSE and SEC regulations including insider trading regulations, Regulation FD and the Securities Exchange Act of 1934 requiring timely and accurate reporting of our operating results as well as certain events and transactions. Noncompliance or alleged noncompliance with these regulations could subject us to enforcement actions by the NYSE or the SEC, or to other litigation, which could affect the value of our shares and our ability to raise additional capital.
The Company carefully adheres to NYSE and SEC requirements as the loss of trading privileges on the NYSE or an SEC enforcement action could have a significant financial impact on the Company. Failure to comply with various SEC reporting and record keeping requirements could result in a decline in the value of our stock or a decline in investor confidence which could directly impact our ability to efficiently raise capital. Failure to comply with SEC regulations could result in enforcement actions or litigation. Failure to adhere to NYSE requirements could result in fines, trading restrictions or delisting.
In June 2020, a putative class action lawsuit was filed against the Company in the Northern District of Alabama, alleging violations of the Securities Exchange Act of 1934 related to allegedly false and misleading statements the Company made regarding its Specialty Property and Casualty segment. The Company believes the lawsuit is without merit and intends to defend it vigorously; however, there can be no assurance regarding the ultimate outcome of the matter.
ITEM 2. UNREGISTERED SALES OF EQUITY SECURITIES AND USE OF PROCEEDS.
(a) | Not applicable. |
(b) | Not applicable. |
(c) | Information required by Item 703 of Regulation S-K. |
Period | Total Number of Shares Purchased | Average Price Paid per Share | Total Number of Shares Purchased as Part of Publicly Announced Plans or Programs | Approximate Dollar Value of Shares that May Yet Be Purchased Under the Plans or Programs* (In thousands) | ||||||
April 1 - 30, 2020 | — | N/A | — | $109,643 | ||||||
May 1 - 31, 2020 | — | N/A | — | $109,643 | ||||||
June 1 - 30, 2020 | — | N/A | — | $109,643 | ||||||
Total | — | $— | — | |||||||
* | Under its current plan begun in November 2010, the Board has authorized $600 million for the repurchase of common shares or the retirement of outstanding debt. This is ProAssurance’s only plan for the repurchase of common shares, and the plan has no expiration date. |
114
ITEM 6. EXHIBITS
Exhibit Number | Description | |
Certification of Principal Executive Officer of ProAssurance as required under SEC rule 13a-14(a). | ||
Certification of Principal Financial and Accounting Officer of ProAssurance as required under SEC rule 13a-14(a). | ||
Certification of Principal Executive Officer of ProAssurance as required under SEC Rule 13a-14(b) and Section 1350 of Chapter 63 of Title 18 of the United States Code, as amended (18 U.S.C. 1350). | ||
Certification of Principal Financial and Accounting Officer of ProAssurance as required under SEC Rule 13a-14(b) and Section 1350 of Chapter 63 of Title 18 of the United States Code, as amended (18 U.S.C. 1350). | ||
XBRL Instance Document | ||
XBRL Taxonomy Extension Schema Document | ||
XBRL Taxonomy Extension Calculation Linkbase Document | ||
XBRL Taxonomy Extension Definition Linkbase Document | ||
XBRL Taxonomy Extension Labels Linkbase Document | ||
XBRL Taxonomy Extension Presentation Linkbase Document | ||
115
SIGNATURE
Pursuant to the requirements of the Securities Exchange Act of 1934, the registrant has duly caused this report to be signed on its behalf by the undersigned, thereunto duly authorized.
PROASSURANCE CORPORATION |
August 10, 2020
/s/ Dana S. Hendricks |
Dana S. Hendricks |
Chief Financial Officer |
(Duly authorized officer and principal financial officer) |
116