UNIVERSITY OF CALIFORNIA, DAVIS
Berkeley · Davis · Irvine · Los Angeles · Riverside · San Diego · San Francisco · Santa Barbara · Santa Cruz
Paul A. Griffin
Professor of Management and Associate Dean
Graduate School of Management
(530) 752-7372
FAX (530) 752-2924
Tuesday, May 20, 2003
Jonathan G. Katz
Securities and Exchange Commission
450 Fifth Street, NW
Washington, DC 20549
Re: Proposed Rule: Certification of Disclosure in Certain Exchange Act Reports
Dear Mr. Katz:
I agree that the required certifications should be integrated as part of a regular quarterly or annual financial statement filing. This makes good sense from a cost and efficiency standpoint, particularly for those investors and analysts who make regular use of the EDGAR filing system. This should also help achieve an overall objective of the certification process-to provide greater assurance to the Commission and investors that an issuer's statements are in compliance with all appropriate securities laws and regulations.
However, my research (coauthored with Professor Lont) on the investor impact of the SEC certification requirement suggests that investors and the business community more generally were noticeably uncertain and, possibly, confused about the overall present and future cost of certification and the related provisions of Sarbanes-Oxley. I predicted that this uncertainty would increase the volatility of stock prices around dates that revealed information about the certification requirements and, indeed, my research confirms this prediction. Also, consistent with this prediction are some recent reports in the financial press about the high cost of compliance with the SEC regulations.
My research also supports the view that investors in smaller companies were more uncertain about the effects of SOX than investors in larger companies. The effects that I document in my research are incremental to the typical investor response to an SEC filing and also adjust for changes in volatility as a result of earnings announcements that precede an SEC filing.
While over a longer period, I would expect stock price volatility to decrease in response to assurances about the quality of SEC mandated information, and therefore decrease the overall information risk to investors, my results show that at least in the short term the opposite appears to be the case. If this result were to persist, then one consequence of the certification regulations would be an increase in the cost of capital faced by US companies. This, I am sure, was not an intended consequence of the regulations.
As an element of its deliberations on this proposed change in reporting, I therefore encourage the Commission to study the impact of certification on investor uncertainty in more detail and, in particular, how and why the quality of SEC information has changed in response to the certification regulations.
I attach a recent study on this issue and would be pleased to discuss my results with you further.
Sincerely,
Paul A. Griffin
Professor of Management
Graduate School of Management
University of California, Davis
Mailto:pagriffin@ucdavis.edu
PAG:pg
Attachment:
Taking the Oath: Investor Response to SEC Certification
By
Paul A. Griffin and David H. Lont*
Version of
April 10, 2003
Preliminary
Comments Welcome
Taking the Oath: Investor Response to SEC Certification
Abstract
This study investigates the market response to the requirement that the principal executive and financial officer of an SEC registrant each state under oath that the firm's annual and quarterly financial reports are materially accurate and complete pursuant to the Securities Act of 1934. We hypothesize that investors should recognize the importance of these changes in financial reporting and, thus, respond at or around those events that reveal the most information about those changes, particularly, the SEC order to certify, the passage of Sarbanes-Oxley, and the first financial statement filing by a registrant whose report is certified. The subtle nature of these effects, however, requires that we develop a precise and appropriate measure of information response. We base our measure on unsigned market-adjusted daily excess return around the dates where we expect certification effects to be greatest and compare these with identical measures for the same companies and reports in prior periods. We also test for variation in investor response across partitions of the sample on the basis of other attributes of the information environment, and subject the analyses to a number of robustness checks. These latter tests help assure that the investor effects we document are a response to the SEC requirement rather than to other, possibly unspecified, factors. Overall, the empirical results support our hypothesis and allow us to conclude with statistical reliability that the SEC certification requirement did in fact change how investors respond to information provided by financial reporting.
JEL Classification: G14, K22, M41
KEY WORDS: Securities and Exchange Commission, SEC certification, Sarbanes-Oxley, stock market response, securities regulation.
Taking the Oath: Investor Response to SEC Certification
"In a mad deadline rush, top executives from scores of large companies filed with federal securities regulators forms swearing that their latest financial results are accurate." The Wall Street Journal, August 15, 2002, p. A-1.
1 Introduction
This paper examines the market response to perhaps the most significant change in the regulation of accounting and reporting since the 1930s, namely, the SEC requirement that a company's principal executive officer and principal financial officer each swear under oath that, to their knowledge, the company's annual and quarterly financial reports are materially accurate and complete pursuant to the Securities Act of 1934. This change occurred in several stages, first, as an SEC order to require sworn statements of certification by the senior officials of SEC registrants with revenues in excess of $1.2 billion, proposed on June 12, 2002 and effective as of June 27, and, later, as an SEC rule for the senior officials of all registrants to provide certifications as mandated by Section 302 of the Sarbanes-Oxley Act of 20021, proposed on August 2, 2002 and effective as of August 29.
The SEC order identified 947 firms required to certify, of which 695 had a due date of August 142, with certifications by most of the remaining companies due before year end.3 Of the August 14 companies, 631 met the deadline and 64 did not, although many of the latter received a filing extension. A significant number of the August 14 filers, however, failed to comply fully with the prescribed rules such that only 334 certifications actually met the requirement as of the end of the next day, with the remainder requiring additional analysis or information.4
The purpose of this study is to assess the investor response to the SEC certification order. Due to its far reaching implications for CEO/CFOs and others such as auditors, investment bankers, and attorneys, we hypothesize that investors should recognize the SEC certification requirement as a significant, informational event. If, as we posit in section 2, certification changes the costs, consequences, and incentives for all parties to financial reporting, then investors should impound the implications of the order in the distribution of stock return, particularly around the most revealing events, such as the adoption of the certification requirements, the passage of Sarbanes-Oxley, and the first certification filing by a registrant subject to the SEC order.
This research objective presents an interesting challenge from a design standpoint, which is to control for other factors that might concurrently influence investor return and return volatility on those days where the effects of certification should be greatest. These other factors include not only general market influences but also the numerous precursors to certification and related events, for instance, the Enron and WorldCom bankruptcies, the demise of Arthur Andersen and Co., SEC and private securities litigation, and missteps regarding the establishment of the Public Company Accounting Oversight Board.5
We address the issue of control in three ways. First, we use an excess return metric by subtracting a market factor from total investor return. This metric, however, should understate the firm-particular effects of SEC certification because the market aggregates all firms' effects, including the certification and non-certification effects of the SEC certifiers themselves, which are all larger firms and thus dominate the market. A market factor will also encompass key events surrounding the Sarbanes-Oxley legislation, which among other items, mandated certification and introduced criminal penalties for all registrants.6
A second element of control is to benchmark the excess return metric to otherwise equivalent metrics around prior event periods for the same companies. An appropriate measure of the impact of SEC certification should be incremental to these prior effects. This approach, too, may be conservative in that prior research documents that the short window investor response to SEC 10-Q filings increases noticeably during 1995 to 2001 (e.g., Griffin, 2003).7
A third element of control is to examine differences across firms. We identify firm-specific factors that prior research has shown explain investor response to earnings announcements and similar regulations. These factors may help clarify why some firms' certification responses are different from others and control for other, possibly correlated, drivers of investor response.
In this regard, a key element is to control for the earnings release that precedes an SEC certification (or SEC filing if in an earlier period). Under pre-2003 SEC filing rules, issuers must file a 10-Q within 45 days of the end of the fiscal quarter, and most issuers file close to the due date. On the other hand, most companies release their quarterly earnings well before that date. However, should some earnings release dates be highly coincidental with those dates we posit should reveal information about the effects of certification, then we could erroneously conclude an effect due to certification that is a response to unexpected earnings. We therefore examine the response to earnings releases for the second quarter of 2002 and compare this with the earnings response in prior periods to assess whether there is anything unusual about second quarter 2002 earnings releases relative to prior years. To the extent that 2002 earnings responses are not reliably different from prior years' responses, we gain assurance that the effects of certification are not due to the differential effects of earnings announcements. But to the extent that 2002 earnings announcement effects are greater than in prior years, this may reflect an anticipated certification effect, which makes detection of a certification effect following earnings release more difficult.
In brief, we apply three levels of control to rule out or hold constant effects that could otherwise lead to an incorrect inference that the SEC certification order affected investor expectations of return. While we believe these controls are strenuous and conservative, they also increase the risk that an effect might be present that our research design fails to detect (type II error). One study reports, for example, nothing unusual about return behavior around the SEC certification filing dates and, thus, concludes that it was either a "non event" as far as investors are concerned or had been fully anticipated earlier (Bhattacharya et al., 2002).8
Overall, the results in this paper confirm our general hypothesis. Based on a measure of unsigned excess daily return (defined in section 3.2), we find that investors did indeed respond to the certification requirement and at exactly those times when the information effects of certification should have been greatest, that is, when the certification order was issued, Sarbanes-Oxley was passed, and registrants first made public their certifications. The responses we document are incremental to equivalent responses for the same firms in prior years and control for the effects of earnings releases. The investor response that we document is also robust to different versions of the excess return metric, controls for other factors unrelated to certification, and by design is conservative in that some of the effects we seek may be obscured by our procedures.
We cannot understate the importance of these results. This study documents what seems obvious to us-that investors did in fact respond to what most would agree are highly significant changes in accounting and financial reporting. Indeed, in our view, given the expected changes in costs and incentives for all parties affected by the certification process, which we outline in a later section, it would have been unusual not to detect an effect.
This result, however, runs counter to the financial media, some managers, and unpublished research that concludes that certification seemed to have little bearing on investors and/or was obscured by other factors. The media, it appears, looked for but did not find an "unveiling any new dark undergrowth of malfeasance in corporate America" and instead found only a "few stray weeds" (Porter, 2002).9 Moreover, the initial certifications did not uncover a trove of earnings restatements as might have been predicted.10 Nonetheless, our analysis suggests that investors did pay attention to the certification order. This evidence should be useful to an evaluation of whether certification helps the SEC achieve its broader objective, namely, to increase the integrity of financial reporting for investors and the public.11
The literature on the firm-specific effects of regulation based on stock market measures falls into two broad categories: one focuses on signed excess return (e.g., Schipper and Thompson, 1983; Binder, 1985; and Smith et al., 1986); the other on unsigned excess return (e.g., Simon, 1989). The first group examines signed excess return around common and unique regulatory events and, typically, uses a seemingly unrelated regression technique to test hypotheses regarding the sign and/or magnitude of excess return in response to a regulation (after controlling for other variables that might explain excess return and/or explain differential regulatory effects around those same dates). For example, Smith et al. (1986) formulate hypotheses about the stock market response to oil price regulation based on operating characteristics of petroleum firms. These studies, however, require a model to partition the unexpected information about regulation at event dates into good or bad news hypothesized to increase or decrease stock prices. However, if the expectations model is not well specified (or not specified at all), this approach may very well mask the effects being investigated. For example, Binder (1985) fails to detect a significant change in event period average excess return for 20 regulations applied to 14 different industries.
This study adopts an approach that does not require hypotheses regarding the sign and/or magnitude of excess return in response to the regulation (section 3.2 provides the detail). Instead, we require only the clear identification of an event date (or dates) around which time we hypothesize that firm specific information about the regulation is transmitted to the market. Our approach thus follows Simon (1989), for example, who examines the economic effects of the 1933 Securities Act and tests for changes in the variance of excess stock return by comparing event period volatility with pre- and post-event period volatility and examining sub-samples whose effects are hypothesized to differ. Our approach also mirrors those used in numerous studies of the information content of earnings (e.g., Beaver, 1968; May, 1971; Rohrbach and Chandra, 1989; Cready and Mynatt, 1991; El Gazzar, 1998; Landsman and Maydew, 2002) and, more recently, of SEC filings (e.g., Qi et al., 2000; Asthana and Balsam, 2001; Griffin, 2003). The more recent studies suggest methodological refinements, which we incorporate in the research design where appropriate.
Finally, we comment on a recent study of the impact of the SEC order by Bhattacharya et al. (2002) (BGH). Their conclusion is contrary to our own, even though they investigate the same sample and base their analysis, in part, on unsigned excess return. We identify (and address within our own research design) four critical differences between BGH and the present study.
First, in studying the impact of certification, BGH emphasize and test for differences between SEC filers and non-filers, where a non-filer is a firm listed in the SEC order that did not file a certification (or Exhibit A from the SEC order) by August 14. However, given that a non-filer is also an eventual filer, little distinguishes the two other than on the basis of filing delay and, thus, there is little reason to expect a regulation-induced difference in excess return (although there could be timing-induced effect). The effect of information transfer from early or on-time filers (certifiers) to late filers (non-certifiers) compounds this comparison, as information transfer can incorporate certification effects in non-certifiers' returns at the time of certifiers' earlier filings.12
Second, BGH deflate daily unsigned excess return by average daily unsigned excess return, where the average is from 75 days before to 10 days after the certification event. However, by including in their deflator the average return on those days hypothesized to be abnormally higher due to information effects, this metric increases the chances that the effects being investigated will not be detected. Research designs in this area of study typically hold out from the average those days hypothesized to have information effects. Also, rather than comparing the return volatility of certifiers with non-certifiers, an alternative would be to compare the responses (and change in responses) of filers (early, on time, and late) around the SEC certification dates with the responses (and change in responses) of the same SEC filers in prior periods. Third, BGH fail to control for earnings release dates, some of which coincide with the dates on which they test for certification effects, for example, July 25.13 Prior research documents that return volatility increases significantly on earnings release dates (see references earlier in this section). Fourth, BGH develop hypotheses based on signed excess return, an approach, to which we have alluded earlier, that requires specification of a model of investor expectations with respect to certification. Yet, to our knowledge, no such model exists and/or has been validated, which means that results based on average return are likely to uncover little about the impact of certification.14
3 Research Design, Variables, Sample
3.1 Design
Our design tests for an effect of SEC certification on investor return and controls for and/or extracts the influence of other variables that might otherwise explain that effect. As an appropriate measure of investor response, we select absolute excess return for firm i on day t, standardized by a measure of the standard deviation of absolute excess return in a non-informational period.15 This measure of unsigned excess return captures market-adjusted changes in investor expectations in response to news and events on day t relative to market-adjusted changes in a non-informational period.
Investors should reasonably have expected certification (including the implications of Sarbanes-Oxley for certification) to change many aspects of financial reporting. These include the cost of preparing and auditing financial statements (increased), oversight and enforcement authority by the SEC (strengthened), new rules for auditors, attorneys, board members, and outside financial analysts (increased reporting, fewer conflicts of interest), and penalties and litigation threats on errant managers (higher)16. However, with little specific guidance as to how these and other aspects would be resolved, exacerbated possibly by the relative haste with which the legislation was drafted, investors could only respond with caution and uncertainty, which, empirically, increases the variance of return.17 At a firm-specific level, these effects are best captured by a measure of unsigned excess return. Operationally, we therefore test a directional hypothesis-that unsigned excess return increases in response to those events expected to reveal the most information about certification, namely, the effective date of the SEC order, the passage of Sarbanes-Oxley, and a registrant's first certification filing.
To control for and/or extract the influence of other variables that might otherwise explain the effects of certification, we first compare unsigned excess return around the initial certification filing date with unsigned excess return around equivalent SEC filing dates in earlier years and, second, partition these responses on the basis of factors related to attributes of the information environment that also might be impacting return. Both aspects should incrementally explain investor response. For example, one factor might be the timing of an initial certification filing since clustered filings, which tend to arrive closer to due date, should be more informative given information transfer. Another factor is the level of institutional ownership as less institutionally owned firms have been shown to respond more at earnings release and SEC filing dates than more institutionally held firms (e.g., El-Gazzar, 1988). Finally, we control for the effects of prior earnings releases relating to second quarter 2002, from July 1 to September 30, 2002, relative to prior years. This also make our tests conservative in that a higher level of investor response to 2002 earnings releases, if related to the effects of certification, mitigates against finding an effect at the time of a certification filing.
The primary variable of analysis is standardized absolute excess return, defined as:
SAER = abs (Rit - Rmt) ÷  (abs (Rit* - Rmt*)),
where abs = absolute value operator, Rit = CRSP return on common stock of firm i for day t; Rmt = CRSP return on a value weighted market portfolio for day t, and _ = standard deviation of excess return Rit* - Rmt* measured over t* = tb to te, excluding days -5 to 5 relative to event date 0. The event dates are those dates hypothesized to reveal information about certification to investors, or in the case of the prior years, those dates in the same quarter during which the firm files a 10-Q or 10-K with the SEC.18 We also examine SAER around earnings release dates during the certification period and in prior years and use the same definition of a non-event window in these tests.
We test the statistical significance of SAER around an event date in two principal ways. First, we test for a change in SAER (or differential SAER) from day t-1 to day t-2, where day t0 is an event day and compare this with the change in SAER in a prior period. This variable, under the null hypothesis of no incremental investor response, has the advantage that it is symmetrically distributed around a mean of zero.19 In the presence of information effects, however, this difference should be positive before and negative after an event date (or the window during which information effects should occur). We examine four specific event dates, the first three of which are common calendar dates-the effective date of the SEC order (June 27, 2002), the passage of Sarbanes-Oxley (July 25, 2002), the SEC proposal under Section 302 of Sarbanes-Oxley for all firms to certify their financial statements (August 2, 2002), and the date of a certification filing.
Second, we test for incremental SAER effects using the following cross-sectional, time series regression applied to the combined sample of responses around the 2002 certifications and earlier year's filings aligned in calendar time from the third Monday in June to the third Friday of August of each year.20 This model applies to the calendar time series of absolute excess return, SAER it, for each firm i. The model is:
SAER it =  i +
i +  i1 ERD it + i2 CCD it + i3 CFD it + i4 CON it + i5 IND it +
  it (1)
where ERD it = 1 if t is an earnings release date, 0 otherwise; CCD it = 1 if t is a common certification date, 0 otherwise; CFD it = 1 if t is a certification filing date, 0 otherwise; CON it = 1, 0 otherwise for other partitions of the sample to control for non-certification factors that might otherwise influence SAER (e.g., size, institutional holdings), and INDit = ERD it for ERD in 2002 and 0 otherwise.21
Our expectations regarding the regression coefficients are as follows: The earnings release date (ERD) coefficient 1 should be positive, consistent with prior evidence on the impact of earnings releases on SAER (see section 2). We should also observe elevated SAER on or around a common SEC certification date (CCD) such as the effective date of the SEC order on June 27 or passage of Sarbanes-Oxley on July 25; and on or around the dates of the first certification filing (CFD) (mostly in August) and, thus, coefficients 2 and 3 should be positive. We also expect that other partitions of the sample, for example, based on high or low institutional holdings, would explain SAER consistent with prior research. These effects would be reflected as significant 4 coefficients for the variable CON it. The last variable IND it tests for an elevated effect at 2002 earnings release date after controlling for prior years' earnings effects, and thus 5 should be positive. Finally, observe that a significant positive coefficient on CFD is relative to an equivalent control date, which is the calendar day of an equivalent 10-Q filing in the prior years.
3.3 Sample
Table 1 summarizes the certification sample by market capitalization, market-to-book ratio, institutional holdings, event date less release date (in days), primary earnings per share, total assets, and the standard deviation of absolute excess return in a non-event period. The data are reported for each of the years 1995 through 2002 and in total as well. The stock return data are from CRSP; all financial data are from Compustat 2001; and the institutional holdings data through 2000 are from CDA/Investnet. These database constraints limit the number of sample firms for analysis to less than the 695 firms identified initially by the SEC with August 14 due dates. We analyze 645 companies with complete return data (or 92.8 percent of the initial group), which represents a substantial majority of firms required to certify by the August 14 due date.
As table 1 indicates, these companies are large, mostly profitable, and generally have been growing in size, except for market capitalization in the most recent year. The companies are also on average 53 percent owned by institutions. The table also indicates that the number of days from earnings release to SEC filing remains relatively constant across the years. Certification, thus, does not appear to have changed the time between earnings release and SEC filing, a factor that if decreasing could complicate the interpretation of investor response to an earnings release in that more earnings releases could be considered late. Finally, not including the days around earnings releases and certification events, the variance of absolute excess return generally increases. This favors the use of a standardized measure of unsigned excess return. Observe, however, that the variance of absolute excess return in 2002 in the non-event period, while not higher than in the two previous years, is generally higher than in the previous years combined. To the extent that this reflects information effects in the 2002 non-event period, standardized unsigned excess return in 2002 should be downward biased.
Table 2 summarizes the distribution of the SEC filing and earnings release dates by day of the month. As the table shows, the certification filings in 2002 occur mostly in August and cluster increasingly towards the August 14 due date. The distribution of equivalent SEC filing dates in 1995-2001 is similar, also clustering increasingly around 45 days after the end of the fiscal quarter. The table also shows the distribution of earnings release dates in 2002 versus prior years. Observe that these distributions are not as concentrated around a small number of dates, as are the SEC dates, with the majority occurring during mid to late July, well ahead of the SEC due date. Earnings release dates for 2002 are qualitatively similar to the same dates in earlier years. As such, this table offers no evidence that the distribution of earnings release and SEC filing dates has changed as a result of certification. Also, this table shows that most of the 2002 earnings news occurs in the window after the effective date of the certification order but before a certification filing. For example, 90 percent of 2002 earnings are released by August 8. Investor response to a 2002 earnings release, however, could reflect uncertainty as a result of the SEC order and in anticipation of a filing.
4 Results
The results are presented in three stages. First, we report the results of investor response based on a short window around certification filing date (section 4.1). We also examine investor response to prior SEC filings and earnings releases based on equivalent short window measures (section 4.2). The second stage examines investor response to certification filings in a multiple regression context, which allows for greater control of other information and events that might otherwise influence the measurable effects of certification (section 4.3). Third, section 4.4 summarizes certain tests of robustness of the research design, including a calendar day, portfolio analysis of investor response.
4.1 Certification Filing Date Tests
Table 3 summarizes the short-window tests of investor response around the day of a certification filing. This table reports changes in SAER (SAER on the later day minus the earlier day) from day -1 to day 2. Thus, a positive number in table 3 indicates an increase in SAER, whereas a negative number represents a decrease. Table 3 also reports the type-I error probability that the SAER change is zero. Following earlier research on the investor response to SEC 10-K and 10-Q filings, we expect the strongest positive response to occur on day 0, the day of the filing. Investor response following days 0 and/or 1 should be lower, however, and hence we expect these differences to be negative. We also expect investor response to a certification filing to be greater than in prior periods since those earlier SEC filings do not include or incorporate by reference a sworn certification.
The results confirm our hypothesis that investors responded positively and incrementally to the certification filing order. The results hold for the full certification sample, and the partitions accord with prior research. For example, the response for firms with low institutional holdings is generally stronger than firms with high institutional holdings (e.g., El-Gazzar, 1988) and the response on concentrated filing days (i.e., August 14) is greater than on less concentrated days (e.g., Griffin, 2003). Also, investor response increases when earnings announcement is closer to certification date, consistent with the view that certification may reflect some lagged component of the information in earnings. In short, table 3 documents with statistical reliability that investors responded positively around the certification filing date and in ways consistent with prior research on the market reaction to SEC filings. The response on August 14 is greater than on the other certification filing days.
A certification filing, however, is an ending point in the chronology leading up to certification and, thus, the effects that we capture at certification filing date do not include those not impounded by earlier events. However, the significant increase in abnormal excess return that we document could be affected by the possibility that some investors resolve their prior uncertainly around a filing date, and this may mitigate against finding an effect.
4.2 Earnings Release Date Tests
Given that the SEC order was effective in late June 2002, investor response to the announcement of second quarter 2002 earnings (for December 31 fiscal year firms) may include information about certification in addition to information about earnings more generally. As such, we examine whether the earnings announcement response in 2002 exceeds the response for the same firms and quarters in earlier years. As a non-statistical indicator, figure 1 compares mean SAER for second quarter 2002 with mean SAER in the earlier years. This plot clearly shows a higher market response in 2002 around the time of a second-quarter earnings release. It also shows a more protracted response in 2002 than in the earlier years, possibly, a result of additional news about certification. Recall that Sarbanes-Oxley was passed and signed into law in late July such that the deliberations relating thereto transpired during earnings season.22 We return to this point in section 4.3 but, first, we document formally that the investor response to a 2002 earnings release is significant and exceeds the response in earlier years. We present our tests in table 4 for the full certifier sample and for the same partitions as in table 3. The results of these partitions help us understand whether the elevated response to earnings releases is related to certification effects and/or to other factors.
As shown in all panels of table 4, investors responded significantly around earnings release date, and this response is higher in 2002 versus the other years and stronger for firms held less by institutions. SAER plainly increases from day -1 to day 0 and then generally declines from day 0 or 1 to day 2 as earnings information is transmitted into prices. We observe little difference at earnings release date, however, depending on whether the release is closer to or further away from certification. Overall, these results are consistent with prior research on the market reaction around an earnings release date.23 They do not address whether the events prior to and including SEC certification and other factors might explain the higher response to an earnings release in 2002. We use multiple regression to address this question.
This section presents the results from estimating regression model (1). This model specifies investor response for firm i on day t as a function of (a) unique events that affect each firm on specific, non-identical days, (b) common events that affect all firms on the same day, and (c) other factors intended to control for cross-sectional and/or time series variation possibly correlated with the effects of information releases such as earnings announcements, SEC certifications, and other filings. Specifically, we identify two categories of firm/day specific events as the second quarter earnings release date and the SEC filing date (for second quarter 10-Q for December 31 SEC filers in 1995 through 2001) or the 2002 SEC certification filing date. We assume investors receive this information on days -1, 0, and 1 relative to the actual day of announcement or public posting of the filing. Since all the independent variables are specified as unit variables, the parameter coefficients capture an overall "mean shift", that is, they estimate the average increase or decrease in mean unsigned excess return as a result of that variable.
We identify three common events at which time significant information about the effects of certification should be transmitted to investors. These are the SEC certification order on June 27, 2002, the passage of the Sarbanes-Oxley legislation on July 25, 2002, and the SEC proposal that certification be mandatory for all firms under Section 302 of Sarbanes-Oxley on August 2, 2002. As with earnings releases and SEC filings, we assume that investors receive this information on days -1, 0, and 1 relative to the actual day of the event. We exclude key events after the first certification filing date by design, as it is more likely that these events would resolve (rather than induce) investor uncertainty about the effects of certification.24
Since we are dealing with events that occur on common and different days, we estimate jointly the parameters in model (1) as a multivariate regression model system in the spirit of the seemingly unrelated regression method as proposed by Zellner (1962) and applied in the finance and accounting literature, for example, by Schipper and Thompson (1983) Hughes and Ricks (1984), Binder (1985), and Smith et al. (1986). We specify a system of linear equations and test the null hypothesis that the average coefficient across equations/firms for a particular independent variable is zero versus the alternative hypothesis that it is positive or negative conditional on our prediction and/or the prior literature.25 This econometric approach also allows for variation across equations/firms in residual variance as well as non-zero contemporaneous residual covariance, which can lead to biased test statistics if model (1) were estimated cross-sectionally in event time to test for the presence of an effect of each information variable. Our application differs from the previous applications, however, in that model (1) specifies the dependent variable vector as unsigned abnormal return rather than total or cumulative total return.
Table 5 summarizes the results for six specifications of multiple regression model (1). The dependent variable is SAER for models 1, 2, and 3 and AER for models 4, 5, and 6, where the standard deviation of absolute excess return in a non event period is based on all returns in the calendar period in each year from the third Monday in June to the third Friday in August except those days hypothesized to reflect information effects as specified by the independent variables.26 The independent variables are as follows: ERD = 1 if earnings release date, 0 otherwise; ERD2002 = 1 if 2002 ERD, 0 otherwise; CCD1 = 1 if June 27, 2002, 0 otherwise; CCD2 = 1 if July 25, 2002, 0 otherwise; CCD3 = 1 if August 2, 2002, 0 otherwise; CFD = 1 if certification or SEC filing date, 0 otherwise; CFDAug14 = 1 if August 14, 2002, 0 otherwise; CON1 = 1 if excess return year = 2002, 0 otherwise; CON2 = 1 if market capitalization > median market capitalization in given year, 0 otherwise; and CON3 = 1 if percentage institutional holdings > median institutional holdings in given year, 0 otherwise. Models 1, 3, 4, and 6 estimate the parameters of the regression system using maximum likelihood estimation, and models 2 and 4 estimate the parameters using ordinary least squares.
From table 5, we observe the following. The coefficients on ERD are positive and highly significant, thus indicating that investors respond around the day of an earnings announcement. It is less clear, however, whether investors respond differentially at earnings release date in 2002 compared to the other years. For example, investor response based on dependent variable SAER to 2002 earnings is no different from the response in the earlier years. On the other hand, investor response to 2002 earnings is significantly greater when the dependent variable is AER. The standardization procedure thus reduces the likelihood of detecting the presence of 2002-specific earnings effects. Does the standardization procedure reduce the likelihood of the presence of 2002-specific certification effects? Apparently not. As hypothesized, the coefficients on the three common dates-CCD1, CCD2, CCD3- are all positive and significant for both specifications of dependent variable (SAER and AER). In other words, unsigned, firm-specific return is incrementally higher around those days after controlling for day-specific earnings announcement effects (and the other control variables). Other than certification filing itself, as we have posited already, these three CCD events comprise the days on which it is most likely that investors receive information about the effects of certification.
Investors may also have responded around the day of the certification filing, even though, as we have suggested and shown, this response should be moderated by information conveyed by the earlier CCD events. The regression model estimates the filing response for both SEC and certification filing days in general and, specifically, for filings made on August 14, 2002. The results are as hypothesized, and indicate that investors responded positively and significantly to certification filings on August 14 but not to certifications on other dates, which if anything reflect a less-than-average response.27 This result is consistent with research on the market impact of 10-K and 10-Q filings that documents a stronger average response on days of concentrated filings than non-concentrated filings (under the view that information transfer is greater on concentrated filing days). Note that the results in table 5 control for SEC filings in other years as well as those earnings announcements that are closer to a certification date.
We comment on two further aspects of table 5. First, with regard to the impact of the control variables in the regression, the results differ predictably on the basis of market capitalization, in that the response of smaller firms is greater than the response of larger firms. The addition of a size factor makes little difference to the other parameter estimates, however. When market capitalization and institutional holdings are both included in the same regression, the institutional holdings coefficient is not significant, as expected, due to positive correlation between market capitalization and institutional holdings.28 Second, we observe little difference in the significance levels of the coefficients when estimated using maximum likelihood and ordinary least squares procedures. While the differences should be small in a regression system that contains several identical explanatory variables (i.e., CCD1, CCD2, CCD3), it is also apparent that the power from the large number of observations in the system more than offsets a loss of efficiency in estimating the coefficients using OLS, so that the same conclusions are drawn based on the two alternative econometric procedures.
In brief, the results in table 5 confirm those set forth earlier, and provide reliable evidence that investors did, in fact, respond to and thus found the events associated with the SEC certification requirement as "price relevant". The responses documented are not subsumed by an investor response to earnings announcements, which we explicitly control for in the multiple regression, and are incremental to the effects of otherwise equivalent SEC filings in earlier years. The analysis also controls for other factors that prior research finds explain cross-sectional variation in investor return, such as firm size and institutional holdings.
We conduct three kinds of analyses to examine the robustness of our results to alternative tests and procedures. First, we examine the results for additional partitions of the certifier sample and for different absolute excess return metrics, including an absolute excess return measure that adjusts for common market and industry factors. These alternative metrics enable us to examine further the effect of dependencies across same-day excess return, possibly not captured by market-adjusted return and/or the maximum likelihood estimation approach as described in section 4.3. Second, we reproduce certain of the results in a prior study on the impact of certification using our metrics. Third, we analyze unsigned excess return around the certification filing dates based on calendar day portfolios, thereby providing a further check on the effect of dependencies in contemporaneous excess return.29
The first set of tests comprises the following. We recast tables 3 through 5 based on (a) an excess return variable similar to May (1971), by dividing unsigned excess return by average unsigned excess return, (b) the assumption that the day on which information effects occur is day 0 (rather than days -1, 0, and 1), and (c) three additional partitions of the certifier sample. These additional partitions comprise certifiers that filed contemporaneously with a 10-Q, certifiers with December 31 fiscal year ends (for which the earnings and SEC filing date is for the second fiscal quarter), and certifiers with lower and higher analyst coverage, based on median IBES analyst forecast coverage as of the end of each fiscal year. In addition, we re-estimate model (1) under several alternative definitions of the variables. We use an alternative measure of excess daily return calculated as total return for firm i less an industry index of return for firm i, where the industry index is calculated as the mean return for all firms in the same three-digit SIC code as each firm in the certification sample.30 We also estimate model (1) specifying the dependent variable as log (SAER) or log (AER) so that the model residuals are distributed as more approximately normal.
Other than for industry adjusted excess returns and the partition based on IBES analyst coverage, both on which we comment next, our results and our conclusions with respect to certification do not change qualitatively when we adopt these different assumptions and procedures. In the case of industry-adjusted excess returns the results are less significant. However, while less significant, the type I probability values are still sufficiently below conventional norms to reject the hypothesis that they are non-zero. They should be less significant, however, as an additional "industry" element has been removed from total return. For example, for the equivalent SAER regression in table 5 (model specification (1)), the coefficient on the August 14, 2002 coefficient is 0.125, which is significant at p = 0.060. Without industry adjustment, the coefficient-as reported in table 5-is 0.175, which is significant at p < .01.
For the analyst coverage partition, while the univariate measures of investor response as summarized in tables 3 and 4 do not differ appreciably for firms with higher or lower analyst coverage, the multiple regression results in table 5 for the 2002 certification response variables are generally stronger for firms with lower coverage than with higher coverage (after controlling for the other variables). For example, for specification (1) in table 5, the 32 coefficient for August 14, 2002 for lower coverage firms is 0.231 (signif. at p. < 0.005) whereas the same coefficient for higher coverage firms is -0.121 (insignif.). Also, the 22coefficient for the passage of Sarbanes-Oxley for lower coverage firms is 0.364 (signif. at p. < 0.001) whereas the same coefficient for higher coverage firms is 0.256 (signif., at p. < 0.05). However, we would expect this result to the extent that prior research suggests that analyst coverage is a reasonable proxy for information quality (e.g., Lang and Lundholm, 1996) and/or information processing by informed investors (e.g., Brennan et al., 1993; Brennan and Subramanyam, 1995). Prices established by investors who are better informed or who have higher quality information should, ceteris paribus, respond less to a certification announcement, and this is what we find.
We also replicate and extend certain of the findings in Bhattacharya et al. (2002)(BGH). First, we examine their plot of "normalized volatility in event time" (in their figure 3), which is broadly similar to the SAER measure we use in this paper. We use the same standardization and sample partitioning procedures for the "certifier" group as used by BGH, and thus standardize by dividing absolute daily return |Rit| for a certifier by its average return from 75 days before to 20 days after the certification date, where a certifier is defined as a firm that reports on or before August 14, 2002. Our analysis shows similar patterns to those reported in BGH figure 3. We also replicate BGH figure 3 based on absolute market adjusted excess return, |(Rit - Rmt)|, for both a value weighted and an equally weighted version of the index Rmt, and find little difference in the patterns shown, except that "normalized volatility" measure based on excess return is slightly higher when we use an equally weighted market index than when we use a value weighted market index (which is expected given that a value-weighted market index "weights" certifiers more than an equally weight market index). We observe a similar pattern when we use an equally weighted market index in our measure of standardized absolute excess return (SAER).
BGH also test for differences or variation in signed excess return between certifiers and non certifiers, and report these results in their tables 3 and 4. We replicate these results too, even though, as we have noted earlier, signed excess return is less appropriate as a metric to study the effects of events that are predominantly a response to increased uncertainty rather than predictably positive or negative conditional on an expectations model.
Table 6 reports the mean excess returns and t-tests of the mean excess returns for portfolios of certifiers that share the same event date, which is similar to the approach adopted by BGH in their table 3. We use the same sample as in our replication of BGH figure 3, although our sample sizes for each event date are slightly different from BGH because we did not rely on the certification date that was stated by the SEC (as in BGH) and, instead, checked each date against the actual filing made and corrected the SEC date for any difference. Contrary to BGH table 3, our t tests reject the hypothesis that mean portfolio (signed) excess return is zero on several of the certification days, namely, August 8 (positive), 12 (negative), 13 (negative), and 14 (positive). We draw a similar conclusion when we widen our event window to include the day after certification.
Finally, we comment on the results in BGH table 5, which reports tests of unusual "volatility" on key event dates, in the same spirit as our approach based on SAER. Specifically, their table summarizes tests of whether the volatility for certifiers (certifications prior to and including August 14) and non-certifiers (certifications on August 15) differs from a series mean calculated 75 days before and 10 days after an event (or between April 1 and August 30, 2002 for a calendar day). Their results do not suggest an overall significant investor response. Table 5 (panel B) of BGH, nonetheless, does report a significant investor response (p. = 0.033) for certifications on August 14 only, which is consistent with the analyses in tables 3 and 5 of this study.31 A comparison of mean return volatility on the other two common dates-June 27 and July 25- reveals, however, that the choice of a standardization metric appears to make a difference. We choose a shorter standardization period to minimize the effects of other information on the certification or SEC filing measures and report in table 5 a significant response on these two dates. When a longer window is used with no days excluded (e.g., 85 days as in BGH), the standardization period more likely includes the information effects being examined, thus lowering the power of the test.
As a supplement to an event-based analysis, a third approach examines the investor response to certification based on calendar day portfolios. These results should be consistent with the event-based findings. For each certification date in 2002 and SEC filing date in 1995-2001, we form an excess return portfolio as an equally weighted average of all certifications/filings on that day. We then construct a portfolio excess return series for all trading days in August 2002. For example, if 10 certifications occur on August 1, 2002, the calendar day portfolio excess return is calculated as the mean of the 10 individual excess returns on that date. We also derive a calendar day portfolio excess return series for each equivalent trading day in the prior years, where the portfolios are based on SEC filing dates rather than certification dates. Finally, we calculate the difference between the mean certification date portfolio excess return for each trading day in August 2002 and the mean SEC filing date portfolio excess return on the equivalent day in August in the prior years. These differences reflect the additional SAER (or AER) for each trading day in August 2002 relative to the same trading day in a prior period. They do not necessarily represent the same firms, however, as a firm that files on a given day in August 2002 may not file on exactly the same day in a previous year.32
Table 7 presents the results of analyzing the effects of certification on a calendar day basis. The table reports the portfolio SAERs and AERs for each trading day in August 2002 and compares this to the portfolio SAERs and AERs for the equivalent trading day averaged over the prior years 1995 through 2001. Table 7 also reports the number of certification firms in each calendar day portfolio. Whether based on all days or only those days prior to August 14, this table shows that mean certification SAER and AER are reliably greater than non-certification SAER and AER. Also, the differences tend to be greater when more certification filings occur on a given day. In addition, this table reports that the average AER for certifiers in 2002 is at least 50 percent higher than equivalent measures based on the prior years; and more specifically, that the average AER on August 14 is 72.5 percent higher than in 1995-2001.33 Thus, on a calendar day basis, mean certification AER and SAER are appreciably higher than in previous years, with the strongest effects a few days before and after SEC certification due date. Finally, observe that the results in table 7 are fully consistent with table 5, in that the latter table reports stronger certification filing effects on days -1, 0, and 1 relative to August 14 than on the other dates. The AER data in table 7 are also plotted in figure 2. This figure clearly shows the higher levels of AER in 2002 versus in the earlier years.
5 Summary and conclusion
This study investigates the investor response to the implementation of the SEC certification order in July and August of 2002 that required the two senior officers of over 900 large SEC registrants each to submit sworn statements that certify their financial statements as materially accurate and complete pursuant to the Securities Act of 1934. Due to the significance of certification for financial reporting, and the purported haste in which the rules were drafted, we hypothesize that the initial reaction of investors will be one of caution and uncertainty, and therefore we should observe an increase in firm-specific return volatility around those events that contribute to this reaction.
We identify four certification-related events, three of which are common calendar dates the fourth being the firm-unique date of a certification filing. The common dates are June 27, 2002 (date of the SEC order for large registrants to certify), July 25, 2002 (passage of the Sarbanes-Oxley Act of 2002), and August 2, 2002 (date of the SEC proposal for all registrants to certify); and the firm-unique dates are those on which a certification filing was actually made, most of which are on or prior to the SEC due date of August 14, 2002. We benchmark the investor response to certification filings in 2002 to earnings releases in 2002 and an average of otherwise equivalent earnings and SEC filing response measures in the prior six years (1995-2001). We control for other factors known to explain variation in firm-specific unsigned excess return, such as market capitalization and institutional holdings.
Overall, the empirical results support our general hypothesis and, as such, we are able to conclude with statistical reliability that the SEC certification requirement did in fact change the attributes of financial reporting as perceived by investors. Not knowing the full impact of the new rules at the time, investors responded initially to the certification requirements with caution and uncertainty, which this study captures as an increase in unsigned excess return. Moreover, this increase in unsigned excess return transpires precisely around those events when it should have been anticipated. This, and the other controls and tests we employ, in our view, provide reasonable assurance the effects we document are indeed a response to certification and not to other unknown or uncontrolled factors.
These findings, however, differ from an earlier study that concludes "that certification was not only a non-event for the certifiers around their certification date, but it was also a non-event for the non-certifiers around Aug 15, 2002" (Bhattacharya et al., 2002)(BGH). To the extent that we are able to reproduce this earlier finding using their procedures and a similar excess return metric, we can only attribute this difference in conclusion to design factors. For example, BGH analyze differences in the average signed excess return between early certifiers and late certifiers (and without reference to otherwise equivalent prior years' excess return). They fail to find a significant investor response. This should not be unexpected, however, given the difficulty of specifying an appropriate model of investor expectations that would predict the effects of certification for each company. It is difficult, also, to specify an appropriate model when unfolding information causes investors to update their expectations (and possibly their models) on a continuing basis.
The present study focuses on many of the same events as BGH but uses the behavior of the same firm in an equivalent prior period to control for the effects of non-certification, standardizes unsigned excess return by excess return volatility in a shorter non-information period, and controls for earnings announcements in the same quarter as certification. Our design is also robust in that it documents certification effects incremental to current and prior earnings announcements and, concomitantly, produces results fully consistent with prior research on the investor response to earnings announcements generally (in non-certification periods). BGH do, however, report one result that is consistent with ours-of elevated normalized return volatility on August 14, 2002, when the largest number of companies filed a certification.
Finally, we comment on a broader implication of our main finding-that investors did apparently adjust to the SEC certification order and thus recognized it as a "price relevant" event. If the certification requirement and, more generally, the Sarbanes-Oxley legislation are to have their intended effect, however, of restoring confidence and integrity into financial reporting and accountability, then, eventually, this should be manifested in market prices a reduction in excess or firm specific return volatility. A natural extension of this study, therefore, would be to apply our same measures and procedures to future certification events and related earnings releases and SEC filings, where sufficient time has elapsed to potentially restore investor confidence and, thus, to hypothesize that firm specific return volatility should decrease.
References
Asthana, S., and S. Balsam, 2001, The Effect of EDGAR on the Market Reaction to 10-K Filings, Journal of Accounting and Public Policy 20, 349-372.
Beaver, W. H., 1968, The Information Content of Annual Earnings Announcements, Journal of Accounting Research 6, 67-100.
Bhattacharya, U., P. Groznik, and B. Haslem, 2002, Is CEO Certification of Earnings Numbers Value-Relevant? Unpublished working paper, Indiana University, September.
Binder, J. J., 1985, Measuring the Effects of Regulation With Stock Price Data, Rand Journal of Economics 16, 167-183.
Brennan, M., N. Jegadeesh, and B. Swaminathan, 1993. Investment Analysis and the Adjustment of Stock prices to Common Information, Review of Financial Studies 6, 799-824.
Brennan, M., amd A. Subramanyam, 1995, Investment Analysis and Price Formation in Securities Markets, Journal of Financial Economics 38, 361-381.
Cready, W. M., and P. G. Mynatt, 1991, The Information Content of Annual Reports: A Price and Trading Response Analysis, The Accounting Review 66, 291-312.
El-Gazzar, S. M., 1988, Predisclosure Information and Institutional Ownership: A Cross-sectional Examination of Market Revaluations During Earnings Announcement Periods, The Accounting Review 73, 119-129.
Griffin, P. A., 2003, Got Information? Investor Response to Form 10-K and Form 10-Q EDGAR Filings, Review of Accounting Studies, forthcoming.
Hughes, J. S., and W .E. Ricks, 1984, Accounting for Retail Land Sales: Analysis of a Mandated Change, Journal of Accounting and Economics 6, 101-132.
Huron Consulting Group, 2003, An Analysis of Restatement Matters: Rules, Errors, Ethics For the Five Years Ended December 31, 2002, Abstract and Summary, January.
Johnson, M. F., R. Kasznik, and K. K. Nelson, 2000, Shareholder Wealth Effects of Private Securities Litigation Reform of 1995, Research Paper, Review of Accounting Studies 5, 217-233.
Landsman, W. R., and E. L. Maydew, 2002, Has the Information Content of Quarterly Earnings Announcements Declined in the Past Three Decades?, Journal of Accounting Research 40, 797-808.
Lang, M., and R. Lundholm, 1996, Corporate Disclosure Policy and Analyst Behavior, The Accounting Review 71, 467-492.
May, R. G., 1971, The Influence of Quarterly Earnings Announcements on Investor Decisions as Reflected in Common Stock Price Changes, Journal of Accounting Research 9 (Supplement), 119-163.
Newman, J., 2002, "New Law Paves Way for Increased Funds for Injured Investors:
The Sarbanes-Oxley Act Opens the Door for More Settlements and New SEC Restitution" Securities Class Action Alert, Institutional Investor Services, September.
Noreen, E.W., and J. M. F. Lacey, 1981, Intra-Industry Information Transfers Associated With Earnings Releases, Journal of Accounting and Economics 3, 201-232.
Perino, M. A., 2002, Enron's Legislative Aftermath: Some Reflections on the Deterrence Aspects of the Sarbanes-Oxley Act of 2002, Working Paper No. 212 Center for Law and Economic Studies, Columbia Law School, October.
Porter, E., 2002, Certification Deadline Reveals Mostly Simple Account Errors, Wall Street Journal, August 15.
Qi, D., W. Wu, and I. Haw, 2000, The Incremental Information Content of SEC 10-K Reports Filed under the EDGAR System, Journal of Accounting, Auditing and Finance 15, 25-46.
Rohrbach, K., and R. Chandra, 1989, The Power of Beaver's U against a Variance Increase in Market Model Residuals, Journal of Accounting Research 27, 145-155.
Schipper, K., and R. Thompson, 1983, The Impact of Merger-Related Regulations on the Shareholder of Acquiring Firms, Journal of Accounting Research 21, 184-221
Simon, C. J., 1989, The Effect of the 1933 Securities Act on Investor Information and the Performance of New Issues, American Economic Review 79, 295-318.
Schroeder, M., 2002, Under the Gun From the SEC, Firms Divulge Accounting Issues Bristol-Myers, Household International Are Among the Companies Coming Clean, Wall Street Journal, August 15.
Securities and Exchange Commission, 2002a, File No. 4-460: Order Requiring the Filing of Sworn Statements Pursuant to Section 21(a)(1) of the Securities Exchange Act of 1934, June 27.
Securities and Exchange Commission, 2002b, Final Rule: Certification of Disclosure in Companies' Quarterly and Annual Reports, August 29.
Smith, R. T., M. Bradley, and G. Jarrell, 1986, Studying Firm-Specific Effects of Regulation with Stock Market Data: An Application to Oil Price Regulation, Rand Journal of Economics 17, 467-489.
Wild, J.J., and K. F. Ramesh, 1989, Managers' Earnings Forecasts and Intra-Industry Information Transfers, Journal of Accounting and Economics 11, 3-34.
Zellner, A., 1962, An Efficient Method of Estimating Seemingly Unrelated Regressions and Tests for Aggregation Bias, Journal of the American Statistical Association 57, 348-368.
Table 1
Summary Certification Sample Statistics
| Total | 1995 | 1996 | 1997 | 1998 | 1999 | 2000 | 2001 | 2002 | |
| Market Capitalization, in $000s | |||||||||
| Mean | 10,530 | 6,154 | 6,414 | 8,846 | 10,447 | 12,989 | 14,490 | 13,301 | 9,381 |
| Median | 2,766 | 2,231 | 2,161 | 2,891 | 2,841 | 3,169 | 3,103 | 3,398 | 2,506 |
| Standard Dev. | 29,533 | 12,345 | 14,372 | 20,976 | 26,791 | 36,414 | 42,380 | 36,352 | 24,184 |
| No. of Obs. | 4702 | 422 | 527 | 564 | 592 | 621 | 642 | 632 | 691 |
| Market-to-Book Ratio | |||||||||
| Mean | 3.90 | 3.36 | 4.02 | 4.23 | 3.82 | 5.43 | 3.53 | 2.85 | na |
| Median | 2.47 | 2.33 | 2.38 | 2.91 | 2.73 | 2.51 | 2.18 | 2.21 | na |
| Standard Dev. | 21.91 | 5.01 | 10.27 | 6.59 | 8.06 | 52.04 | 11.78 | 5.90 | na |
| No. of Obs. | 3919 | 420 | 517 | 548 | 580 | 608 | 628 | 618 | na |
| Institutional Holdings, in %s | |||||||||
| Mean | 0.58 | 0.52 | 0.51 | 0.50 | 0.52 | 0.53 | 0.56 | 0.63 | 0.65 |
| Median | 0.60 | 0.54 | 0.53 | 0.54 | 0.56 | 0.55 | 0.58 | 0.65 | 0.67 |
| Standard Dev. | 0.21 | 0.20 | 0.20 | 0.23 | 0.22 | 0.21 | 0.19 | 0.19 | 0.20 |
| No. of Obs. | 2973 | 186 | 244 | 288 | 306 | 329 | 339 | 579 | 620 |
| Event Date less Release Date, in days | |||||||||
| Mean | 19.4 | 18.9 | 20.5 | 19.5 | 20.0 | 19.4 | 17.8 | 17.8 | 23.9 |
| Median | 20.0 | 20.0 | 21.0 | 21.0 | 21.0 | 20.0 | 19.0 | 19.0 | 25.0 |
| Standard Dev. | 8.0 | 7.8 | 8.1 | 8.4 | 7.9 | 7.9 | 8.0 | 8.1 | 5.8 |
| No. of Obs. | 3869 | 374 | 473 | 507 | 529 | 572 | 595 | 588 | 231 |
| Primary Earnings Per Share, in $0s | |||||||||
| Mean | 3.28 | 2.14 | 2.11 | 1.85 | 1.93 | 5.50 | 3.48 | 5.18 | na |
| Median | 1.71 | 1.98 | 1.83 | 1.77 | 1.75 | 1.53 | 1.64 | 1.63 | na |
| Standard Dev. | 52.87 | 2.66 | 3.33 | 4.96 | 3.68 | 91.72 | 40.92 | 87.87 | na |
| No. of Obs. | 3921 | 421 | 518 | 548 | 580 | 608 | 628 | 618 | na |
| Total Assets, in $000s | |||||||||
| Mean | 6,514.9 | 5,678.8 | 5,383.9 | 5,554.0 | 6,024.4 | 6,535.9 | 7,428.3 | 8,392.9 | na |
| Median | 2,331.0 | 1,919.5 | 1,761.2 | 1,998.0 | 2,018.4 | 2,297.3 | 2,757.7 | 3,224.9 | na |
| Standard Dev. | 15,147.5 | 13,712.3 | 13,473.4 | 13,475.2 | 14,137.8 | 14,213.3 | 16,422.8 | 18,685.4 | na |
| Skewness | 7.18 | 6.74 | 7.44 | 7.51 | 7.30 | 6.62 | 6.84 | 6.93 | na |
| No. of Obs. | 3919 | 420 | 517 | 548 | 580 | 608 | 628 | 618 | na |
| Standard Dev. of Absolute Excess Return in Non-Event Period | |||||||||
| Mean | 1.40% | 1.00% | 1.10% | 1.20% | 1.50% | 1.50% | 2.00% | 1.60% | 1.60% |
| Median | 1.20% | 0.90% | 0.90% | 1.00% | 1.30% | 1.30% | 1.70% | 1.20% | 1.20% |
| Standard Dev. | 0.90% | 0.50% | 0.60% | 0.60% | 0.80% | 0.80% | 1.00% | 1.10% | 1.40% |
| Skewness | 4.02 | 1.94 | 2.94 | 1.83 | 3.82 | 4.35 | 3.56 | 3.95 | 4.37 |
| No. of Obs. | 4648 | 422 | 527 | 564 | 592 | 621 | 641 | 632 | 645 |
This table presents summary statistics for the SEC certification sample by year. na = not available. Source: Compustat, CRSP.
Table 2
Distribution of Certification, SEC Filing, and Earnings Release Dates
| SEC Date | Earnings Release Date | |||
| Date (mdd) | 2002 | 1995-2001 | 2002 | 1995-2001 |
| <715 | 0.4% | 0.4% | 6.8% | 3.6% |
| 715 | 0.0% | 0.4% | 9.8% | 6.5% |
| 716 | 0.0% | 0.5% | 13.8% | 12.9% |
| 717 | 0.0% | 0.7% | 19.1% | 22.3% |
| 718 | 0.0% | 0.8% | 24.8% | 35.3% |
| 719 | 0.0% | 1.0% | 29.8% | 37.9% |
| 720 | 0.0% | 1.1% | 36.0% | 37.9% |
| 721 | 0.0% | 1.2% | 41.6% | 37.9% |
| 722 | 0.0% | 1.4% | 47.3% | 42.6% |
| 723 | 0.0% | 1.5% | 52.4% | 53.7% |
| 724 | 0.0% | 2.0% | 58.4% | 62.3% |
| 725 | 0.0% | 2.4% | 63.0% | 72.8% |
| 726 | 0.0% | 2.9% | 68.4% | 74.6% |
| 727 | 0.0% | 3.5% | 72.8% | 74.6% |
| 728 | 0.0% | 4.0% | 75.2% | 74.6% |
| 729 | 0.0% | 4.4% | 77.5% | 77.0% |
| 730 | 1.3% | 5.2% | 79.4% | 80.7% |
| 731 | 2.6% | 6.2% | 81.2% | 85.1% |
| 801 | 4.3% | 6.9% | 82.6% | 88.3% |
| 802 | 6.8% | 7.7% | 83.8% | 88.5% |
| 803 | 6.8% | 8.9% | 85.1% | 88.5% |
| 804 | 6.8% | 10.1% | 85.9% | 88.5% |
| 805 | 8.4% | 10.7% | 86.9% | 88.8% |
| 806 | 10.9% | 12.3% | 87.6% | 91.3% |
| 807 | 15.6% | 14.4% | 88.9% | 93.0% |
| 808 | 20.7% | 17.3% | 90.0% | 93.9% |
| 809 | 28.8% | 20.8% | 90.7% | 93.9% |
| 810 | 28.8% | 26.4% | 91.5% | 93.9% |
| 811 | 28.8% | 34.7% | 92.2% | 93.9% |
| 812 | 38.8% | 41.1% | 92.7% | 93.9% |
| 813 | 59.6% | 54.6% | 93.4% | 93.9% |
| 814 | 88.0% | 83.4% | 94.4% | 93.9% |
| 815 | 89.9% | 85.2% | 95.1% | 93.9% |
| 816 | 91.2% | 89.4% | 95.5% | 93.9% |
| 817 | 91.2% | 90.1% | 95.9% | 93.9% |
| 818 | 91.2% | 90.7% | 96.2% | 93.9% |
| 819 | 92.2% | 91.0% | 96.4% | 93.9% |
| 820 | 92.6% | 91.1% | 96.6% | 93.9% |
| > 820 | 100.0% | 100.0% | 100.0% | 100.0% |
| Totals | 691 | 4278 | 680 | 3638 |
This table reports the cumulative distribution of the dates of SEC certification, prior equivalent SEC filing in 1995-2001, and earnings release for the SEC certification sample. Source: SEC Edgar header files, Compustat, and CRSP.
Table 3
Short Window Tests of Investor Response Around Certification Filing Date
| Change in SAER | Paired t test probabilities (2 tailed) | ||||||
| From Day To Day |
-1 | 0 | 1 | -1 | 0 | 1 | |
| Certification Filing Date 2002 (n=641) | |||||||
| 0 | 0.224 | 0.002 | |||||
| 1 | 0.123 | -0.100 | 0.061 | 0.154 | |||
| 2 | 0.114 | -0.109 | -0.007 | 0.185 | 0.209 | 0.930 | |
| SEC Filing Date 1995-2001 (n=4,642) | |||||||
| 0 | 0.099 | 0.001 | |||||
| 1 | 0.052 | -0.047 | 0.072 | 0.120 | |||
| 2 | 0.011 | -0.088 | -0.041 | 0.702 | 0.004 | 0.154 | |
| Certification Filing Date 2002: High Institutional Holdings (n=152) | |||||||
| 0 | 0.250 | 0.079 | |||||
| 1 | 0.073 | -0.180 | 0.572 | 0.203 | |||
| 2 | 0.170 | -0.080 | 0.101 | 0.237 | 0.557 | 0.471 | |
| Certification Filing Date 2002: Low Institutional Holdings (n=116) | |||||||
| 0 | 0.240 | 0.040 | |||||
| 1 | 0.323 | 0.089 | 0.022 | 0.563 | |||
| 2 | 0.262 | 0.024 | -0.055 | 0.035 | 0.869 | 0.725 | |
| Certification Filing Date 2002: August 14, 2002 (n=196) | |||||||
| 0 | 0.528 | 0.001 | |||||
| 1 | 0.406 | -0.122 | 0.002 | 0.434 | |||
| 2 | 0.285 | -0.244 | -0.114 | 0.021 | 0.132 | 0.338 | |
| Certification Filing Date 2002: Non-August 14, 2002 (n=445) | |||||||
| 0 | 0.110 | 0.202 | |||||
| 1 | -0.002 | -0.111 | 0.974 | 0.165 | |||
| 2 | 0.040 | -0.069 | 0.042 | 0.713 | 0.513 | 0.688 | |
| Certification Filing Date 2002: High Event Date less Release Date (n=186) | |||||||
| 0 | 0.279 | 0.037 | |||||
| 1 | 0.238 | -0.041 | 0.066 | 0.761 | |||
| 2 | 0.229 | -0.050 | -0.009 | 0.182 | 0.790 | 0.953 | |
| Certification Filing Date 2002: Low Event Date less Release Date (n=37) | |||||||
| 0 | 0.476 | 0.069 | |||||
| 1 | -0.073 | -0.549 | 0.699 | 0.065 | |||
| 2 | 0.163 | -0.312 | 0.236 | 0.538 | 0.184 | 0.405 | |
This table reports t tests of the difference between the SAER around certification filing date and the SAER around an earlier, equivalent SEC filing date. Results are also shown for three partitions of the certification sample: High versus low institutional holdings; Filings on August 14, 2002 versus other certification filings; and Filings further away from an earnings release date (high event date less release date) versus filings closer to an earnings release date (low event date less release date). Source of return data: CRSP.
Table 4
Short Window Tests of Investor Response Around Earnings Release Date
| Change in SAER | Paired t test probabilities (2 tailed) | ||||||
| From Day To Day |
-1 | 0 | 1 | -1 | 0 | 1 | |
| Earnings Release Date 2002 (n=226) | |||||||
| 0 | 1.192 | <.0001 | |||||
| 1 | 1.163 | -0.029 | <.0001 | 0.931 | |||
| 2 | 0.469 | -0.723 | -0.694 | 0.010 | 0.002 | 0.011 | |
| Earnings Release Date 1995-2001 (n=3611) | |||||||
| 0 | 0.526 | <.0001 | |||||
| 1 | 0.345 | -0.181 | <.0001 | <.0001 | |||
| 2 | -0.090 | -0.617 | -0.436 | 0.003 | <.0001 | <.0001 | |
| Earnings Release Date 2002: High Institutional Holdings (n=69) | |||||||
| 0 | 0.876 | 0.008 | |||||
| 1 | 0.789 | -0.088 | 0.065 | 0.869 | |||
| 2 | 0.016 | -0.861 | -0.773 | 0.956 | 0.036 | 0.043 | |
| Earnings Release Date 2002: Low Institutional Holdings (n=44) | |||||||
| 0 | 1.016 | 0.003 | |||||
| 1 | 0.776 | -0.240 | 0.021 | 0.623 | |||
| 2 | 0.703 | -0.313 | -0.073 | 0.214 | 0.594 | 0.912 | |
| Earnings Release Date 2002: August 14, 2002 (n=42) | |||||||
| 0 | 1.264 | 0.008 | |||||
| 1 | 2.718 | 1.453 | 0.029 | 0.271 | |||
| 2 | 0.871 | -0.393 | -1.847 | 0.067 | 0.544 | 0.058 | |
| Earnings Release Date 2002: Non-August 14, 2002 (n=184) | |||||||
| 0 | 1.176 | <.0001 | |||||
| 1 | 0.808 | -0.368 | <.0001 | 0.199 | |||
| 2 | 0.377 | -0.798 | -0.431 | 0.056 | 0.001 | 0.088 | |
| Earnings Release Date 2002: High Event Date less Release Date (n=188) | |||||||
| 0 | 1.198 | <.0001 | |||||
| 1 | 1.253 | 0.055 | <.0001 | 0.883 | |||
| 2 | 0.474 | -0.724 | -0.779 | 0.012 | 0.005 | 0.010 | |
| Earnings Release Date 2002: Low Event Date less Release Date (n=38) | |||||||
| 0 | 1.164 | 0.0228 | |||||
| 1 | 0.716 | -0.447 | 0.1563 | 0.5655 | |||
| 2 | 0.444 | -0.719 | -0.272 | 0.4373 | 0.2449 | 0.6789 | |
This table reports t tests of the difference between the SAER around 2002 earnings release date and the SAER around an earlier, equivalent earnings release date. Results are also shown for three partitions of the certification sample: High versus low institutional holdings; Filings on August 14, 2002 versus other Filings; and Filings further away from an earnings release date (high event date less release date) versus filings closer to an earnings release date (low event date less release date). Source of return data: CRSP.
Table 5
Multiple Regression Tests of Investor Response to Certification
| Dependent Variable | Intercept | ERD | ERD x 2002 | CCD1 | CCD2 | CCD3 | CFD | CFD x CDD | CON1 | CON2 | CON3 | F Statistic | Adjusted R2 | No. of Obs. |
| Specification | Earnings Release | 2002 vs. Other | June 27, 2002 | July 25, 2002 | August 2, 2002 | SEC Filing Date | August 14, 2002 | 2002 vs. Other | Market Cap. | Instit. Holdings | ||||
| Coefficient Exp. Sign |
+/- |
11 + |
12 +/- |
21 + |
22 + |
23 + |
31 + |
32 + |
41 ? |
42 - |
43 - |
|||
| SAER (1) | 1.035 | 0.392 | 0.000 | 0.081 | 0.356 | 0.098 | -0.062 | 0.175 | -0.188 | -0.185 | -0.006 | 221.9 | 1.96% | 110812 |
| REML | <*** | <*** | ns | * | <*** | ** | <*** | ** | ns | <*** | ns | <*** | 0.00% | 0 |
| SAER (2) | 1.036 | 0.385 | 0.061 | 0.098 | 0.356 | 0.111 | -0.066 | 0.202 | -0.193 | -0.185 | -0.006 | 222.7 | 1.96% | 110812 |
| OLS | <*** | <*** | ns | ** | <*** | ** | <*** | ** | <*** | <*** | ns | <*** | ||
| SAER (3) | 0.923 | 0.364 | 0.014 | 0.064 | 0.388 | 0.125 | -0.068 | 0.268 | -0.195 | na | na | 610.7 | 0.82% | 248027 |
| REML | <*** | <*** | ns | * | <*** | <*** | <*** | <*** | <*** | <*** | ||||
| AER (4) | 0.018 | 0.007 | 0.007 | 0.003 | 0.011 | 0.003 | -0.001 | 0.005 | 0.006 | -0.003 | 0.000 | 319.1 | 2.80% | 110812 |
| REML | <*** | <*** | <*** | <*** | <*** | <*** | <*** | *** | <*** | <*** | ns | <*** | ||
| AER (5) | 0.018 | 0.007 | 0.007 | 0.003 | 0.011 | 0.003 | -0.001 | 0.005 | 0.006 | -0.003 | 0.000 | 319.8 | 2.80% | 110812 |
| OLS | <*** | <*** | <*** | <*** | <*** | <*** | <*** | <*** | <*** | <*** | ns | <*** | ||
| AER (6) | 0.016 | 0.006 | 0.005 | 0.002 | 0.012 | 0.004 | -0.001 | 0.007 | 0.007 | na | na | 610.7 | 1.93% | 248027 |
| REML | <*** | <*** | <*** | <*** | *** | <*** | <*** | <*** | <*** | <*** |
This table summarizes the results of six different specifications of regression model (1). The dependent variable is either SAER or AER. The estimation procedure is REML (residual maximum likelihood) or OLS (ordinary least squares). The independent variables are: ERD = 1 if earnings release date, 0 otherwise; ERD x 2002 = 1 if 2002 ERD, 0 otherwise; CCD1 = 1 if June 27, 2002, 0 otherwise; CCD2 = 1 if July 25, 2002, 0 otherwise; CCD3 = 1 if August 2, 2002, 0 otherwise; CFD = 1 if certification or SEC filing date, 0 otherwise; CFD x CCD = 1 if August 14, 2002, 0 otherwise; CON1 = 1 if excess return year = 2002, 0 otherwise; CON2 = 1 if market capitalization > median in year, 0 otherwise; and CON3 = 1 if institutional holdings > median in year, 0 otherwise. All event day or calendar day variables are coded 1 for days -1, 0, and 1 relative to the event or calendar day. Tests of significance of coefficients: <*** = less than .0001; *** = less than .001, ** = less than .01, * = less than .1, and ns = not significant. Tests are relative to a zero regression coefficient. Variable not included in regression = na. Source of return data: CRSP.
Table 6
Mean Portfolio Excess Return: By Calendar Day
| Date in 2002 | Metric | No of obs. | Mean | t value | Signif. (2-tailed) |
| August 7 | Ex. Ret 0 | 33 (33) | -0.00153 | -0.212 | 0.830 |
| Cum Ex. Ret 0,1 | 33 (33) | 0.00663 | 0.639 | 0.530 | |
| August 8 | Ex. Ret 0 | 35 (42) | 0.01893 | 3.370 | 0.000 |
| Cum Ex. Ret 0,1 | 35 (42) | 0.02038 | 2.832 | 0.010 | |
| August 9 | Ex. Ret 0 | 56 (69) | -0.00033 | -0.111 | 0.910 |
| Cum Ex. Ret 0,1 | 56 (69) | -0.01005 | -1.752 | 0.090 | |
| August 12 | Ex. Ret 0 | 69 (86) | -0.00579 | -2.087 | 0.040 |
| Cum Ex. Ret 0,1 | 69 (86) | -0.01570 | -2.270 | 0.030 | |
| August 13 | Ex. Ret 0 | 144 (194) | -0.00529 | -2.638 | 0.010 |
| Cum Ex. Ret 0,1 | 144 (194) | 0.00749 | 2.434 | 0.020 | |
| August 14 | Ex. Ret 0 | 196 (205) | 0.00951 | 2.748 | 0.010 |
| Cum Ex. Ret 0,1 | 196 (205) | 0.01989 | 3.866 | 0.000 |
This table reports the mean (unsigned) portfolio excess return for the six certification filing days as shown in Bhattacharya et al. (2002)(BGH), table 3, for event day 0 (Ex. Ret 0) and event days 0 and 1 (Cum Ex. Ret 0,1). The t values test the hypothesis that the mean portfolio excess return is zero versus the alternative that it is non-zero. The number of observations in parentheses are from BGH table 3. Source of return data: CRSP.
Table 7
Mean Portfolio Standardized Absolute Excess Return
and Absolute Excess Return: By Calendar Day
| Calendar Day | SAER 2002 | SAER 1995-2001 | SAER Difference | Percentage Difference | AER 2002 | AER 1995-2001 | AER Difference | Percentage Difference | Obs. 2002 |
| 8/1/02 | 1.010 | 1.435 | -0.425 | -0.296 | 0.0131 | 0.0206 | -0.0075 | -0.365 | 12 |
| 8/2/02 | 1.259 | 0.960 | 0.299 | 0.312 | 0.0181 | 0.0144 | 0.0037 | 0.255 | 17 |
| 8/5/02 | 1.366 | 1.333 | 0.034 | 0.025 | 0.0198 | 0.0166 | 0.0033 | 0.197 | 11 |
| 8/6/02 | 1.381 | 1.406 | -0.025 | -0.018 | 0.0198 | 0.0165 | 0.0033 | 0.199 | 17 |
| 8/7/02 | 1.380 | 1.077 | 0.304 | 0.282 | 0.0216 | 0.0140 | 0.0076 | 0.544 | 33 |
| 8/8/02 | 1.618 | 0.907 | 0.711 | 0.785 | 0.0197 | 0.0114 | 0.0083 | 0.724 | 35 |
| 8/9/02 | 1.149 | 0.990 | 0.158 | 0.160 | 0.0200 | 0.0134 | 0.0066 | 0.495 | 56 |
| 8/12/02 | 1.271 | 1.248 | 0.023 | 0.019 | 0.0226 | 0.0149 | 0.0077 | 0.516 | 69 |
| 8/13/02 | 1.259 | 1.128 | 0.132 | 0.117 | 0.0186 | 0.0141 | 0.0046 | 0.324 | 144 |
| 8/14/02 | 1.406 | 1.046 | 0.360 | 0.344 | 0.0255 | 0.0148 | 0.0107 | 0.725 | 196 |
| 8/15/02 | 1.191 | 1.026 | 0.165 | 0.161 | 0.0249 | 0.0142 | 0.0107 | 0.751 | 13 |
| 8/16/02 | 1.075 | 1.229 | -0.154 | -0.126 | 0.0286 | 0.0236 | 0.0050 | 0.214 | 9 |
| 8/19/02 | 1.317 | 1.116 | 0.201 | 0.180 | 0.0420 | 0.0186 | 0.0233 | 1.251 | 7 |
| 8/20/02 | 1.835 | 0.996 | 0.838 | 0.842 | 0.0273 | 0.0209 | 0.0064 | 0.309 | 3 |
| 8/21/02 | 0.921 | 1.803 | -0.883 | -0.489 | 0.0211 | 0.0300 | -0.0089 | -0.296 | 4 |
| 8/22/02 | 1.187 | 1.466 | -0.280 | -0.191 | 0.0312 | 0.0107 | 0.0205 | 1.917 | 3 |
| 8/23/02 | 1.735 | 0.880 | 0.855 | 0.973 | 0.0246 | 0.0123 | 0.0123 | 0.995 | 3 |
| 8/26/02 | 1.735 | 1.066 | 0.669 | 0.627 | 0.0224 | 0.0196 | 0.0028 | 0.144 | 1 |
| 8/27/02 | 2.427 | 1.151 | 1.276 | 1.108 | 0.0370 | 0.0157 | 0.0213 | 1.360 | 3 |
| 8/28/02 | 1.024 | 1.506 | -0.483 | -0.320 | 0.0131 | 0.0181 | -0.0050 | -0.275 | 1 |
| 8/29/02 | 1.904 | 1.141 | 0.763 | 0.668 | 0.0241 | 0.0141 | 0.0100 | 0.705 | 2 |
| 8/30/02 | 0.805 | 0.741 | 0.063 | 0.085 | 0.0222 | 0.0099 | 0.0123 | 1.245 | 2 |
| Mean | 1.3752 | 1.1660 | 0.2092 | 23.9% | 0.0235 | 0.0163 | 0.0072 | 54.2% | |
| Median | 1.2941 | 1.1217 | 0.1618 | 16.0% | 0.0223 | 0.0148 | 0.0071 | 50.6% | |
t-test prob. (all days) |
<0.0001 | <0.0001 | |||||||
t-test prob. (to 8/14) |
0.0016 | 0.0638 | |||||||
This table reports the mean portfolio SAER and AER for certification filings in August 2002 and the mean portfolio SAER and AER for equivalent calendar days in 1995-2001. AER is absolute excess return and SAER is standardized AER, where AER is standardized by dividing by the standard deviation of AER over the non-report period over days -10,...,-6, 6,...,10 relative to a certification date (in 2002) or an SEC filing date (in 1995-2001). Source of return data: CRSP.
Figure 1
Standardized Abnormal Excess Return
Around Earnings Release Date Prior to Certification
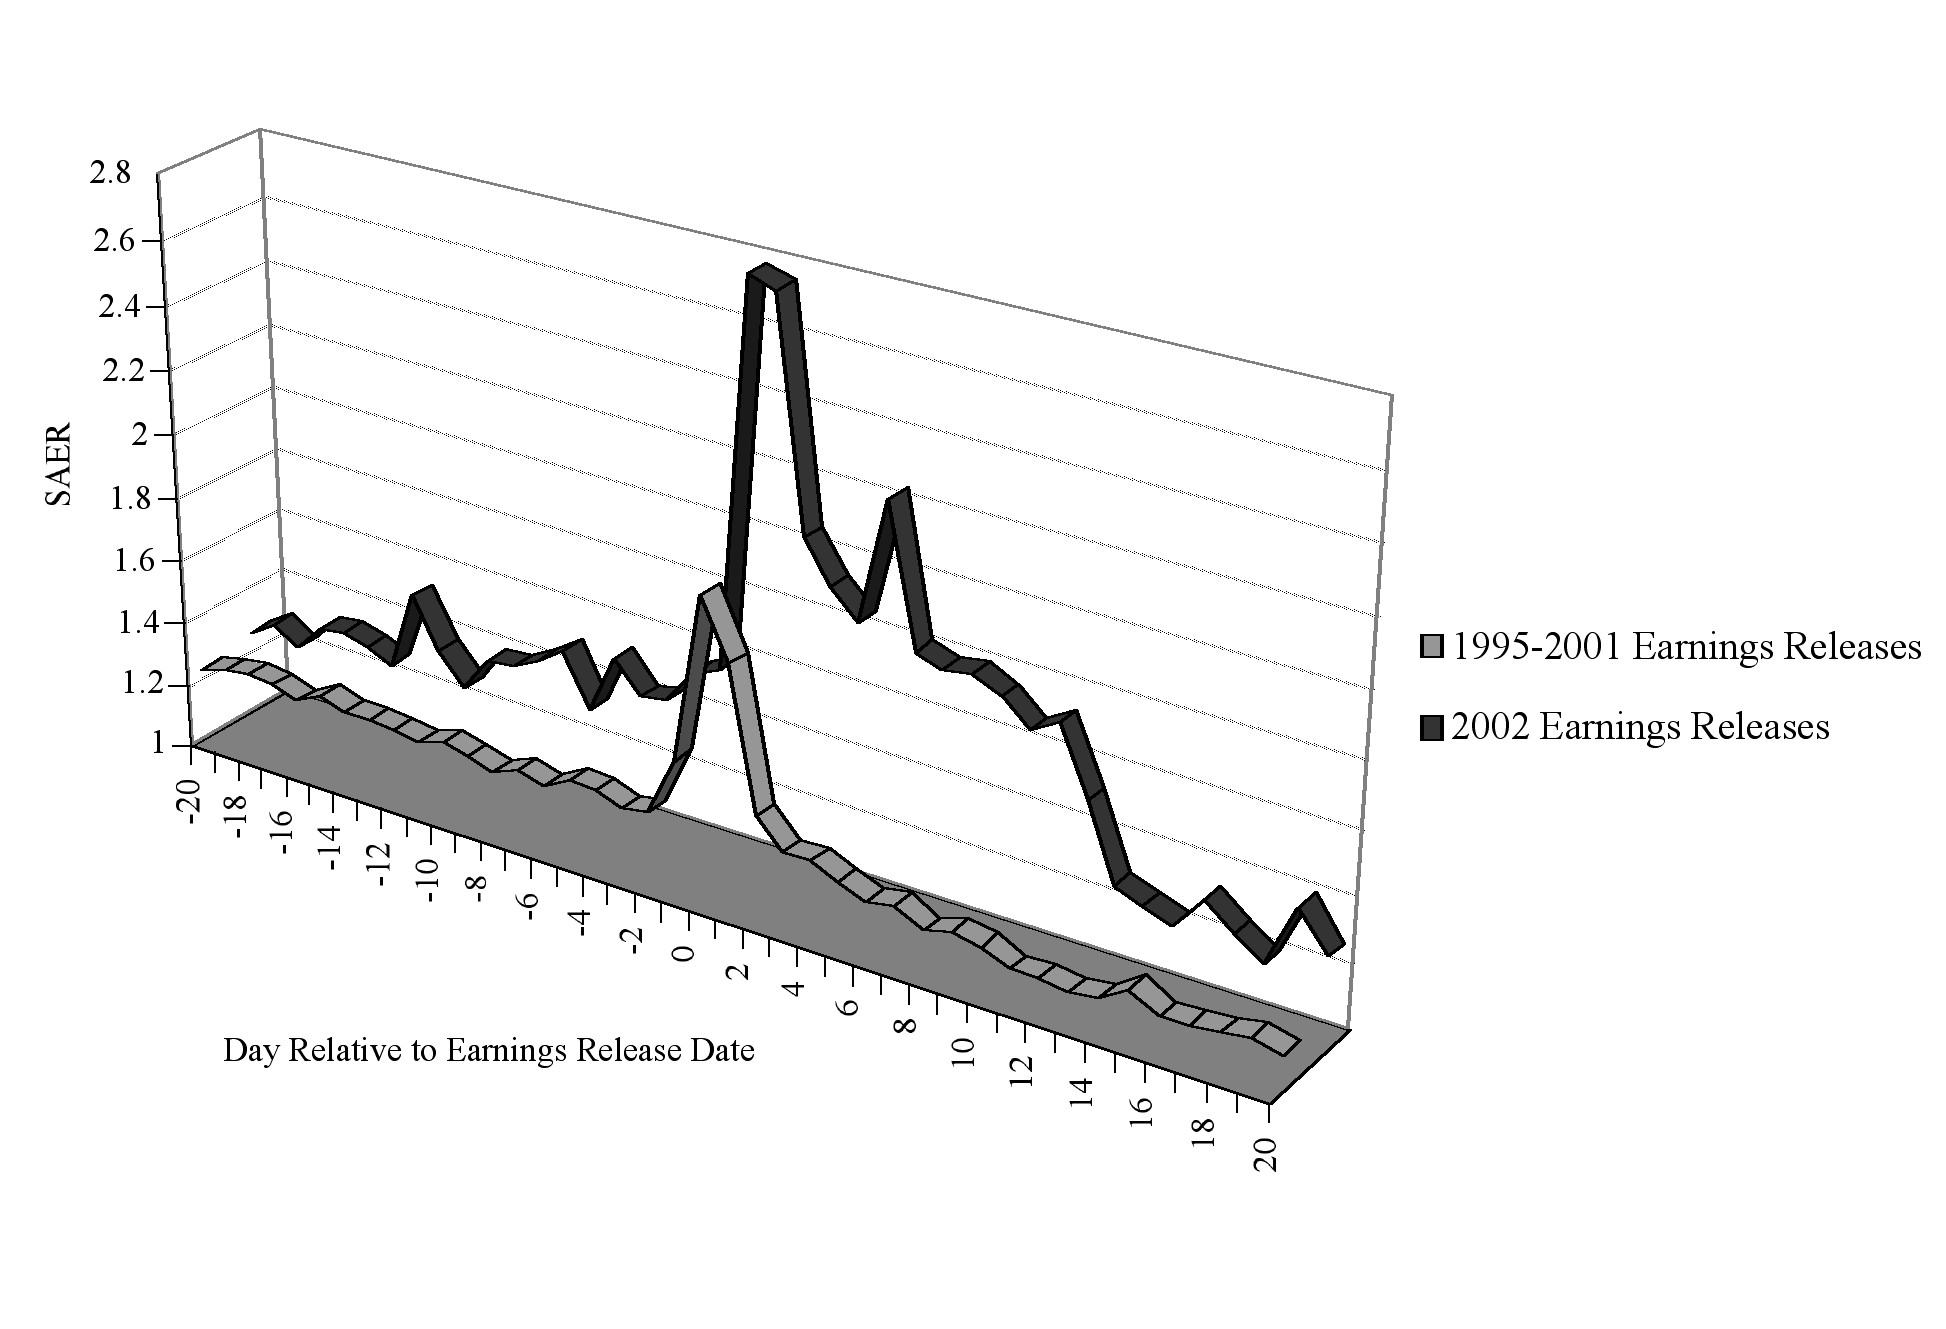
This figure plots the mean SAER from 20 days before to 20 days after the first earnings release date prior to certification for the certifier sample partitioned by SAER for the second quarter of 1995-2001 and SAER for the second quarter of 2002. (Table 2 shows the distribution of release dates across calendar time.) Source: Compustat, CRSP.
Figure 2
Calendar Trading Day Portfolio Absolute Excess Return:
2002 Certification Versus 1995-2001 SEC Filings
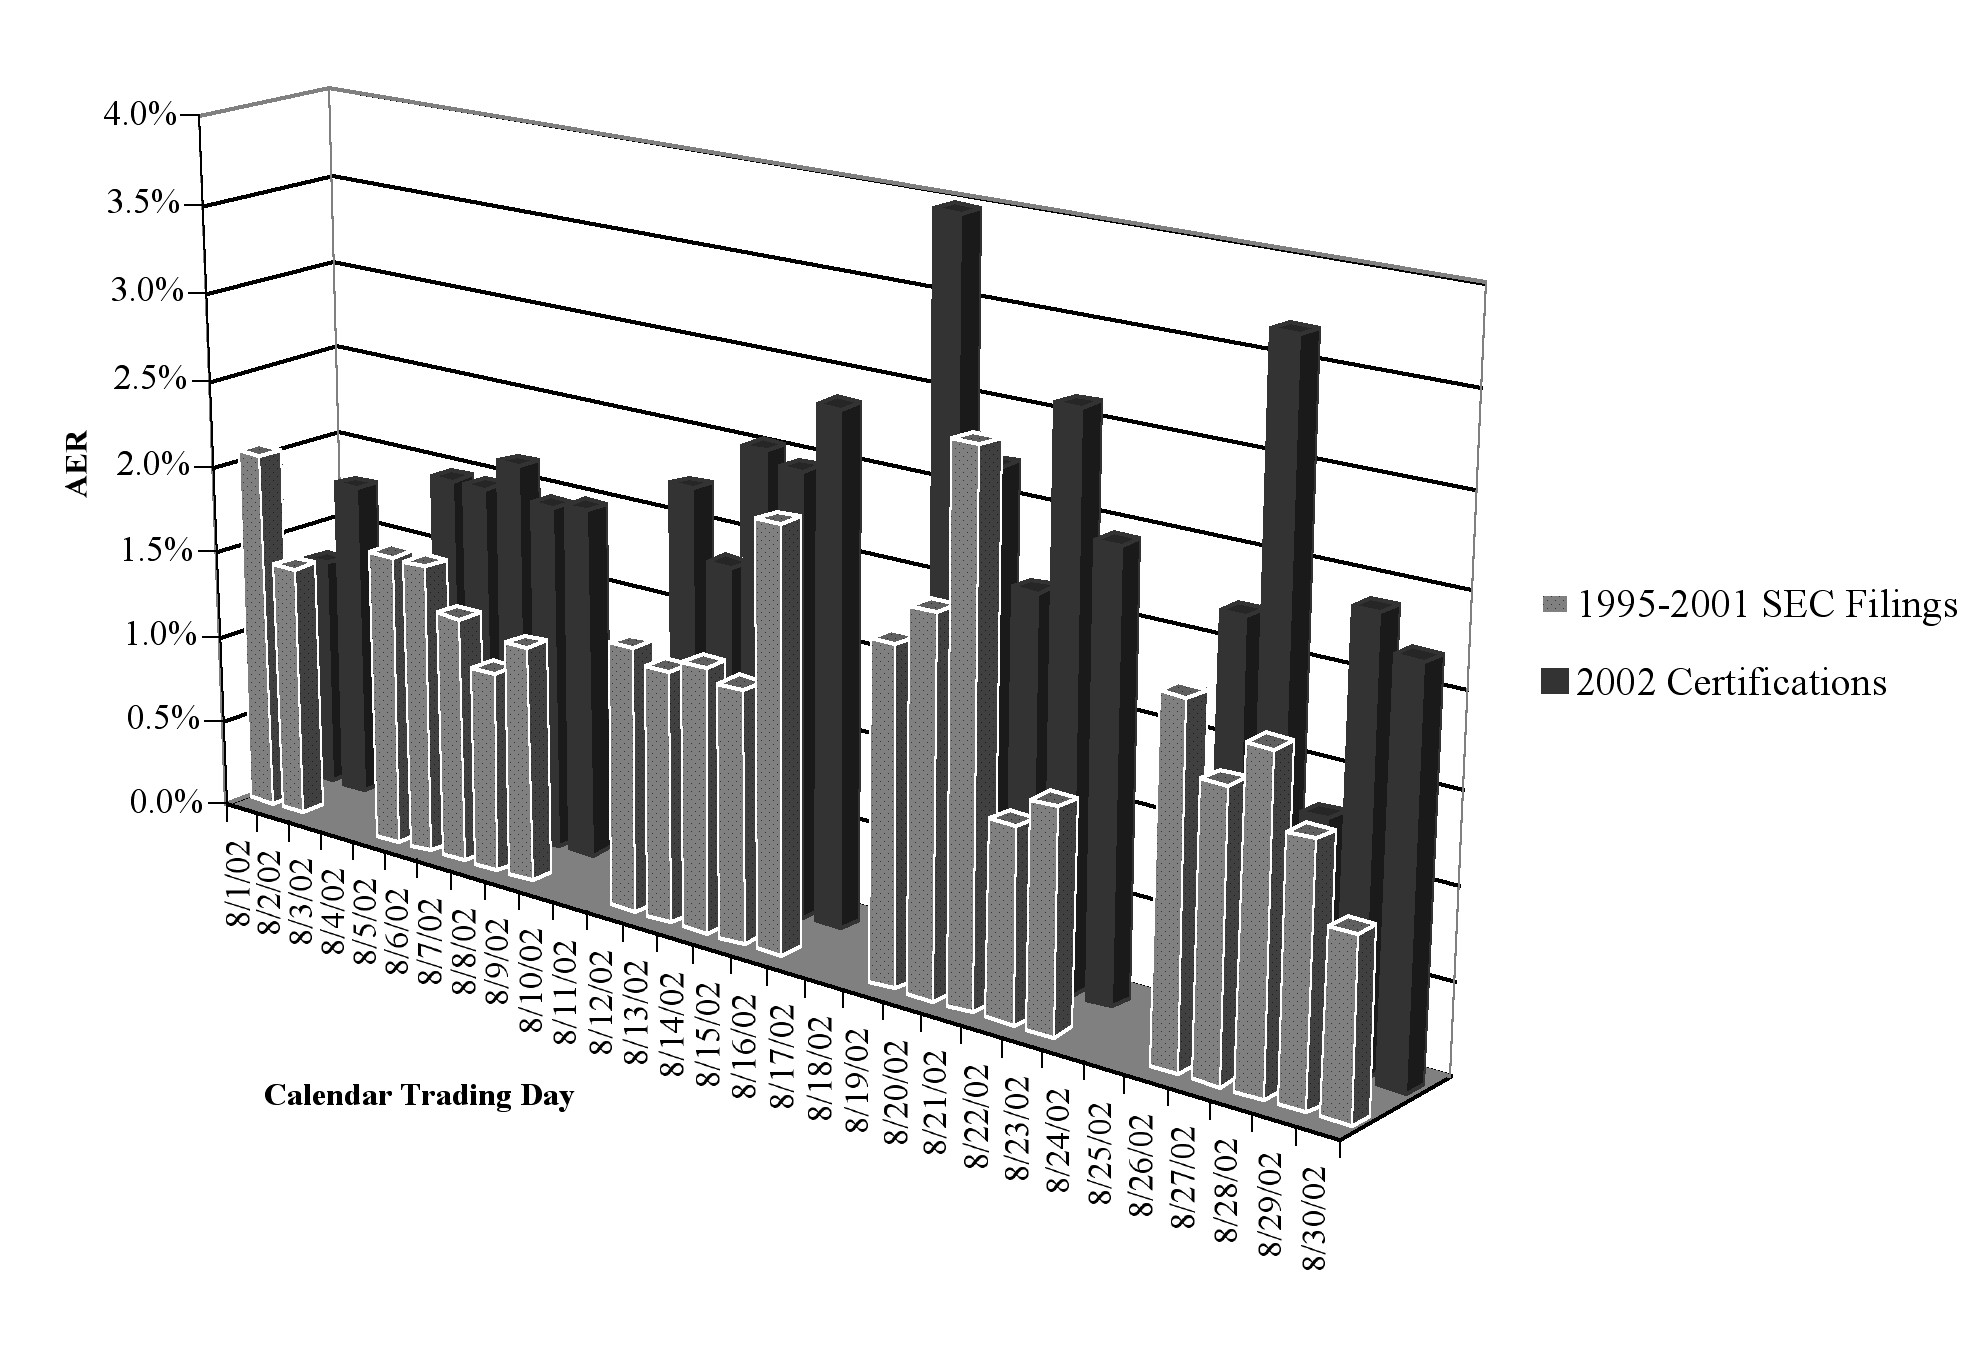
This figure plots the mean calendar trading day portfolio AER from August 1, 2002 to August 30, 2002 for the certifier sample partitioned by AER for August SEC filings in 1995-2001 and AER for August 2002 certifications in 2002. Source: Compustat, CRSP.
Appendix A
Chronology of SEC, WSJ, NYT, and LAT Headlines: April 2002-December 2002
| Headline | Source | Date |
| Tyco announces the resignation of CEO Dennis Kozlowski. | WSJ | 04/06 |
| H-P's plan to buy Compaq overcomes a final hurdle as a judge dismisses Walter Hewlett's lawsuit. | WSJ | 05/01 |
| The Fed leaves rates at a 40-year low, saying the risks of economic weakness and inflation are equally balanced. | WSJ | 05/08 |
| Commission Approves Rules to Address Analyst Conflicts; SEC Also Requires EDGAR Filings by Foreign Issuers | SEC | 05/08 |
| Audit-rules overhaul is proposed in Senate; Sarbanes plan goes beyond bill that passed House, may speed road to change. Michael Schroeder. | WSJ | 05/09 |
| IBM says it plans to lay off as many as 8,000 workers during the current quarter. | WSJ | 05/10 |
| Sears agrees to buy Lands' End in a $1.86 billion cash deal. | WSJ | 05/14 |
| CMS Energy says $4.4 billion of its electricity trading resulted from sham "round-trip" swaps. | WSJ | 05/16 |
| Kmart posts a $2.42 billion fiscal-year loss and restates its quarterly results. | WSJ | 05/16 |
| Schering-Plough agrees to pay $500 million to resolve manufacturing problems. | WSJ | 05/20 |
| SEC Brings Financial Fraud Charges Against Executives at Three Northern California Software Companies | SEC | 05/20 |
| Sarbanes agrees to a delay in accounting-overhaul bill. (Andersen: Called to Account)(Sen. Paul Sarbanes) Greg Hitt. | WSJ | 05/21 |
| Merrill agrees to pay a $100 million fine in settling New York's inquiry into allegations that it misled investors. | WSJ | 05/22 |
| ImClone CEO Samuel Waksal resigns amid controversy over its handling of a failed drug application. | WSJ | 05/23 |
| Nortel Networks announces plans to cut 3,500 jobs and take charges of $600 million. | WSJ | 05/30 |
| SEC Announces Free, Real-Time Public Access to EDGAR Database at www.sec.gov | SEC | 05/30 |
| Supreme Court Backs SEC's Interpretation of Securities Fraud | SEC | 06/03 |
| SEC Brings Settled Accounting Charges Against Microsoft Corporation | SEC | 06/03 |
| Statement by Harvey L. Pitt on the Draft Report of the NYSE's Corporate Accountability and Listing Standards Committee | SEC | 06/06 |
| SEC Proposes Requiring Certification of Quarterly and Annual Reports; Proposes New Form 8-K Disclosures and Filing Deadlines | SEC | 06/12 |
| SEC Charges Former ImClone CEO Samuel Waksal With Illegal Insider Trading | SEC | 06/12 |
| SEC Statement Regarding Andersen Case Conviction | SEC | 06/15 |
| Andersen convicted of one felony count of obstructing SEC's investigation into Enron's collapse. | WSJ | 06/17 |
| XO Communications becomes the latest telecom company to buckle under a heavy debt burden. | WSJ | 06/18 |
| SEC Announces Fraud Charges Against Former Rite Aid Senior Management | SEC | 06/21 |
| Three former Rite Aid executives are charged with masterminding an illegal accounting scheme. | WSJ | 06/24 |
| Dallas Law Firm Agrees to Pay $1.2 Million for Violating Order in SEC Enforcement Action | SEC | 06/25 |
| WorldCom's audit panel uncovers $3.8 billion in expenses improperly booked as capital expenditures. | WSJ | 06/26 |
| Adelphia files for bankruptcy-court protection amid probes into some of the largest self-dealing practices in U.S. corporate history. | WSJ | 06/26 |
| SEC Statement Concerning WorldCom | SEC | 06/26 |
| SEC Censures Dutch Ernst & Young Firm and Orders It to Pay $400,000 Civil Penalty | SEC | 06/27 |
| Motorola plans to cut 7,000 jobs and take $3.5 billion in charges, largely related to restructuring. | WSJ | 06/28 |
| SEC Publishes List of Companies Whose Officers Are Ordered To Certify Accuracy and Completeness of Recent Annual Reports | SEC | 06/28 |
| SEC Lists Firms to Certify Data; Accounting: Top executives will be required to personally attest to accuracy. (Business)(SEC ) | LAT | 06/29 |
| Northrop plans to buy TRW for $7.6 billion in stock, a sweetened deal that ends a four-month standoff. | WSJ | 07/01 |
| Xerox overstated its pretax income by 36%, or $1.4 billion, in the past five years. | WSJ | 07/01 |
| Vivendi CEO Jean-Marie Messier resigns after losing support of French board members. | WSJ | 07/02 |
| An SEC order requires executives to swear under oath that their companies' financial reports are accurate. | WSJ | 07/05 |
| Accounting-overhaul plans draw skepticism. Scot J. Paltrow. | WSJ | 07/08 |
| New SEC order doesn't apply to companies based offshore. (rule that would require CFOs and CEOs to swear that financial results are accurate) Paul Beckett, Christopher Oster. | WSJ | 07/08 |
| Who will audit the regulators? (concern over pending legislation to monitor auditors of public companies) James Freeman. | WSJ | 07/08 |
| Merck recorded $12.4 billion in revenue from its Medco unit that it never collected, an SEC filing says. | WSJ | 07/08 |
| Statement by SEC Chairman Pitt on the President's Speech on Corporate Responsibility | SEC | 07/09 |
| Pfizer agrees to buy Pharmacia for $60 billion, giving the world's biggest drug company full rights to the arthritis treatment Celebrex. | WSJ | 07/15 |
| Statement of Chairman Harvey L. Pitt on the Passage of S. 2673, The Public Company Accounting Reform and Investor Protection Act of 2002 | SEC | 07/15 |
| Bill overhauling audit regulation passes in Senate. Shailagh Murray. | WSJ | 07/16 |
| Bush unveils his strategy for homeland security. | WSJ | 07/17 |
| PricewaterhouseCoopers Settles SEC Auditor Independence Case | SEC | 07/17 |
| The SEC Takes Enforcement Action with Respect to the PNC Financial Services Group, Inc. Arising Out of PNC's Improper Accounting and Disclosures Regarding the Transfer of $762 Million of Loans and Other Assets to Special Purpose Entities | SEC | 07/18 |
| Auditors find no allies in Congress as clock ticks on accounting bills. (lobbyists rebuffed for the first time)(Statistical Data Included) Shailagh Murray, John D. McKinnon. | WSJ | 07/19 |
| Lawyers question order that CEOs take oath over results. Kathryn Kranhold. | WSJ | 07/22 |
| The beltway bubble. (Joe Biden and Orrin Hatch support bill that has CEO's certify accuracy of company financial statements)(Editorial) | WSJ | 07/22 |
| WorldCom files for Chapter 11 protection in the largest bankruptcy case in U.S. history; Dow suffers worst drop since 1987. | WSJ | 07/22 |
| Congress's stealth tax; the accounting board could levy taxes on market cap. Clark S. Judge. | WSJ | 07/24 |
| Dynegy shares plunge 64% amid fears of a possible liquidity crisis. | WSJ | 07/24 |
| Statement from SEC Chairman Harvey L. Pitt re: Agreement on Comp. Reform Legislation | SEC | 07/24 |
| SEC Charges Adelphia and Rigas Family With Massive Financial Fraud | SEC | 07/24 |
| Corporate-oversight bill passes, eases path for investor lawsuits. (Statistical Data Included) Richard B. Schmitt, Michael Schroeder, Shailagh Murray, Kemba Dunham, Jeanne Cummings. | WSJ | 07/26 |
| Governance bill has major consequences for many. (includes related information) Shailagh Murray, Michael Schroeder. | WSJ | 07/26 |
| Senate panel seeks methods to reduce predatory lending. (Senate Banking Committee) Vasugi Ganeshananthan. | WSJ | 07/27 |
| SEC Web Site Provides Link to CEO, CFO Certifications of Financial Statements of 947 Companies | SEC | 07/29 |
| CEOs face the music for irrational exuberance. George Melloan. | WSJ | 07/30 |
| IBM agrees to pay $3.5 billion in cash and stock for the consulting arm of PWC | WSJ | 07/31 |
| SEC Prepares to Implement Sarbanes-Oxley Act Requirement for CEO And CFO Certification of SEC Filings | SEC | 08/02 |
| Don't count on laws to restore trust in markets. Paul Maco. | WSJ | 08/06 |
| SEC Issues Supplemental Information on Accelerated Deadline for Insider Transaction Reports under Sarbanes-Oxley Act | SEC | 08/06 |
| SEC Charges 81 Defendants in Telemarketing Stock Fraud Schemes | SEC | 08/06 |
| Tyco says it may have spent more than $135 million to benefit former CEO Kozlowski. | WSJ | 08/07 |
| The IMF agrees to provide Brazil with a $30 billion rescue package. | WSJ | 08/08 |
| Affirmation of financial results can involve lower-level officers. (certification of corporate financial results) Evan Perez. | WSJ | 08/09 |
| US Airways files for bankruptcy-court protection. The move shields the airline from creditors. | WSJ | 08/12 |
| ImClone's Samuel Waksal is indicted for insider trading. He pleads not guilty. | WSJ | 08/13 |
| Companies certify data today; some seem quite confused. (corporate financial statements signed by CEOs and CFOs) Jonathan D. Glater. | NYT | 08/14 |
| Interpublic restates five years of earnings after uncovering $68.5 million in charges that hadn't been properly expensed. | WSJ | 08/14 |
| Conseco took a $2.95 billion goodwill write-down, eliminating most of the firm's shr. equity. | WSJ | 08/14 |
| Top executives scrambled to meet a SEC deadline to swear that their financial results are accurate. | WSJ | 08/15 |
| Certification Deadline Reveals Mostly Simple Account Errors. M. Porter | WSJ | 08/15 |
| Under the Gun From the SEC, Firms Divulge Accounting Issues Bristol-Myers, Household International Are Among the Companies Coming Clean. Michael Schroeder. | WSJ | 08/15 |
| SEC Awash in Deluge of Certifications. (Business) Debora Vrana. | LAT | 08/16 |
| Firms rush to meet deadline by SEC to certify statements. John D. McKinnon, Kelly K. Spors. | WSJ | 08/16 |
| Jack Grubman resigns from Salomon Smith Barney amid mounting pressure from regulators. | WSJ | 08/16 |
| Statement by SEC Chairman Harvey L. Pitt on Corporate Governance Reforms Approved by the Membership of the Chicago Board Options Exchange | SEC | 08/16 |
| SEC boosts tally of firms failing to certify results. John D. McKinnon. | WSJ | 08/19 |
| Qwest agrees to sell its yellow-pages business to a consortium led by Carlyle Group and Welsh Carson. | WSJ | 08/20 |
| SEC Staff Completes Processing of CEO, CFO Statements | SEC | 08/20 |
| Just 16 of 691 firms have yet to certify results with SEC. (financial statements) | WSJ | 08/21 |
| SEC Charges a Former High-Ranking Enron Official With Fraud; Defendant Permanently Barred From Serving as Officer or Director of Public Company; to Disgorge and Forfeit Approximately $12 Million | SEC | 08/21 |
| Europe's CEOs bite Sarbanes bullet; new corporate-reform law vexes some EU companies, but they still want U.S. listing. Charles Goldsmith, Wade Lambert, Michael Schroeder. | WSJ | 08/22 |
| Funds may have to certify results. (Fund Track)(Statistical Data Included) Judith Burns. | WSJ | 08/26 |
| Commission Approves Rules Implementing Provisions of SO Act, Accelerating Periodic Filings, and Other Measures | SEC | 08/27 |
| SEC gives broad interpretation of rules for accounting statute (SO) Michael Schroeder. | WSJ | 08/28 |
| SEC Approves Implementation of SuperMontage | SEC | 08/28 |
| Prosecutors win an indictment against WorldCom's former top finance | WSJ | 08/29 |
| UAL's board names oil-industry veteran Glenn F. Tilton as chairman, CEO and president. | WSJ | 09/03 |
| Stocks plunge worldwide. In Tokyo, stocks tumble 3.2% to a 19-year low on talk of more problems among Japanese banks. | WSJ | 09/04 |
| CSFB is thrust into the spotlight of regulatory scrutiny regarding IPO-allocation practices. | WSJ | 09/06 |
| The U.S. marks the one-year anniversary of the Sept. 11 terrorist attacks. | WSJ | 09/11 |
| Tyco's former CEO and ex-finance chief are charged with stealing over $170 million. | WSJ | 09/13 |
| Hershey is taken off the auction block as plans to sell the company to Wrigley are scrapped. | WSJ | 09/18 |
| Salomon Smith Barney agrees to pay $5 million to settle civil securities-fraud charges levied by the NASD. | WSJ | 09/24 |
| Adelphia founder John Rigas, two of his sons and two others are indicted on charges of looting the firm. | WSJ | 09/24 |
| SEC Files Financial Fraud Case Charging Three Former Homestore Executives; Defendants Agree to Repay $4.6 Million in Illegal Trading Profits | SEC | 09/25 |
| The buy-side revolution. (corporate reform) Charles Wolf Jr.. | WSJ | 09/27 |
| WorldCom's ex-controller David F. Myers pleads guilty to fraud charges. | WSJ | 09/27 |
| West Coast port employers close docks as contract talks stall. | WSJ | 09/30 |
| WorldCom-inspired 'whistle-blower' law has weaknesses. (includes related information) Michael Orey. | WSJ | 10/01 |
| SEC Charges Fastow, Former Enron CFO, With Fraud | SEC | 10/02 |
| SEC, NY Attorney General, NYSE, NASD, NASAA Reach Agreement on Reforming Wall Street Practices | SEC | 10/03 |
| Instinet plans to buy Island ECN for about $500 million in stock. | WSJ | 10/06 |
| SEC Sets Hearings on Enron Corp. Applications for Exemptions Under the Public Utility Holding Company Act | SEC | 10/07 |
| SEC widens hunt for audit board. (Public Company Accounting Oversight Board) Michael Schroeder. | WSJ | 10/08 |
| Corporate law firms explore gray areas of new ban on loans. | WSJ | 10/16 |
| SEC Proposes Additional Disclosures, Prohibitions to Implement Sarbanes-Oxley Act | SEC | 10/16 |
| SEC's Pitt faces dilemma on choice for oversight panel. (Harvey Pitt of the SEC) Alan Murray. | WSJ | 10/22 |
| Restatements of profits prove costly to investors. Rob Wells. | WSJ | 10/24 |
| SEC's Pitt faces a public battle over nominee; choice of Webster expected to prevail for audit panel; backers of Biggs plan fight. Michael Schroeder. | WSJ | 10/25 |
| Give the SEC its due: more money. (Bush Administration should honor the Sarbanes-Oxley Act of 2002 and give the SEC the funding it promised) Joseph A. Grundfest. | WSJ | 10/29 |
| Actions by FASB, IASB Praised | SEC | 10/29 |
| SEC to propose new financial-disclosure rules. (SEC) Michael Schroeder. | WSJ | 10/30 |
| SEC Proposes Rules to Implement Sarbanes-Oxley Act Reforms | SEC | 10/30 |
| The SEC and Spitzer might outlaw 'spinning' of IPOs; during the boom years for stocks, some CEOs would get hot stock in exchange for their business. Charles Gasparino. | WSJ | 11/05 |
| SEC Proposes Rules to Implement Sarbanes-Oxley Act Provisions Concerning Standards of Professional Conduct for Attorneys | SEC | 11/06 |
| Report to the SEC Regarding Arbitrator Conflict Disclosure Requirements in NASD and NYSE Securities Arbitrations | SEC | 11/12 |
| SEC Accepts Resignation of Judge Webster | SEC | 11/12 |
| An honest account. (conflict of interest in the auditing industry) Don A. Moore. | WSJ | 11/13 |
| Bertelsmann buys the stake in Zomba Music that it doesn't already own for about $3 billion. | WSJ | 12/06 |
| Univision is in talks to buy Hispanic Broadcasting for about $3.5 billion in stock. | WSJ | 12/06 |
| SEC Sues Former Tyco Director and Chairman of Compensation Committee Frank E. Walsh Jr. for Hiding $20 Million Payment From Shareholders; Walsh Had Secret Agreement With L. Dennis Kozlowski To Receive Payment for "Finder's Fee" in Tyco's Acquisition of The CIT Group Inc. | SEC | 12/17 |
| SEC, NY Attorney General, NASD, NASAA, NYSE and State Regulators Announce Historic Agreement To Reform Investment Practices; $1.4 Billion Global Settlement Includes Penalties and Funds for Investors | SEC | 12/20 |
| Insurers move to protect executive policy. (Sarbanes-Oxley Act on split-dollar life-insurance policies) Theo Francis, Ellen E. Schultz. | WSJ | 12/30 |
Source: Gale Group's Infotrac National Newspaper Index (WSJ = The Wall Street Journal, NYT = The New York Times, and LAT = Los Angeles Times) and SEC Press Releases (www.sec.gov).
____________________________
| 1 | The Sarbanes-Oxley Act of 2002 was passed on July 25, 2002 and signed into law as of July 30, 2002. |
| 2 | Specifically, the 695 companies were those whose next fiscal quarter ended on or after June 30, 2002 or whose fiscal year ended on or after May 16, 2002, regardless of whether they actually filed their 10-Q or 10-K before or after August 14, 2002. Certification filings were not permitted under EDGAR, however. Of the firms in our sample, 91.5% filed their Forms 10-K, 10-Q, or 8-K under EDGAR on days -1, 0, or 1, relative to the day of a CEO certification filing (and 72.2% filed on the same day as the certification). |
| 3 | Also due before year end, were firms not on the SEC list but those required to certify under the SEC rules for all firms as mandated by Sarbanes-Oxley. |
| 4 | As reported in Schroeder (2002). |
| 5 | Appendix A lists key events during the period April 2002 through December 2002, which includes the SEC certification study period, principally the third quarter of 2002. |
| 6 | An alternative to extracting a market index would to be to extract an equivalent return metric for a sample of firms with identical characteristics other than SEC certification. However, this would not be possible since there is no group that is equivalent to the approximately one thousand largest U. S. companies but for certification. Also, even if one were to construct a sample of approximately equivalent, smaller companies, this sample would reflect the anticipated effects of certification, since smaller firm certification would have been anticipated because of the proposed SEC rule and the Sarbanes-Oxley deliberations that indicated that certification would eventually be required for all firms. |
| 7 | For instance, the market response to SEC filings in 1995-2001 could be due to heightened investor interest in stocks as a result of the market's strong performance during this period, when the S&P 500 index increased 155%. This was not the case in the third quarter of 2002, when the S&P 500 index declined 19%. |
| 8 | We discuss this study further in section 2 on prior research. |
| 9 | See, also, "Worthless Promises?", The Economist, September 28, 2002. |
| 10 | Earnings restatements, however, did increase after the SEC due date according to a survey by the Huron Consulting Group (2003). The number of restatements filed in the five months from September 2002 to December 2002 (185) was higher than the number of the restatements in the first seven months of that year (145) and, likewise, as compared to restatements in the same five-month periods in 2000 and 2001, of 113 and 122 respectively. |
| 11 | The purpose of the SEC order was primarily to provide greater assurance for investors and the public. "In light of recent reports of accounting irregularities at public companies, including some large and seemingly well-regarded companies, the purpose of the Commission's investigation is to provide greater assurance to the Commission and to investors that persons have not violated, or are not currently violating, the provisions of the federal securities laws governing corporate issuers' financial reporting and accounting practices, and to aid the Commission in assessing whether it is necessary or appropriate in the public interest or for the protection of investors for the Commission to adopt or amend rules and regulations governing corporate issuers' reporting and accounting practices and/or for the Commission to recommend legislation to Congress concerning these matters." (SEC Order, 2002). |
| 12 | For example, Noreen and Lacey (1983) and Wild and Ramesh (1989) document this effect in the context of earnings releases. |
| 13 | Section 4 presents additional detail. |
| 14 | For completeness, we reproduce certain aspects of BGH based on their procedures applied to the same sample of certifiers (section 4.4). |
| 15 | Tests of unsigned investor response also employ squared excess stock return and the relative rank of squared excess stock return in the event period in the vector of event and non-event period excess returns. Rohrbach and Chandra (1989) suggest that the use of a standardized absolute value variable-which we use-gives a more powerful test than those based on standardized squared excess return, which is biased in favor of firms with large abnormal returns. We also examine our results using unstandardized excess stock return and a measure of abnormal response similar to May (1971), who deflates absolute excess return by average absolute excess return in a non-report period. See also section 4.4 on robustness tests. |
| 16 | For example, Sarbanes-Oxley increases the statute of limitations from one to two years after the discovery of the fraud and from three to five years after the alleged violation. Newman (2002) reports that this new time frame could increase class action settlements from $10 billion in the past decade to $30 to $40 billion in the next decade. |
| 17 | We are not claiming, however, that changes such as those mentioned are known fully to investors at or prior to an initial certification filing, only that investors are generally aware that such changes may occur, and thus they condition their expectations of future return on the likely implications of these (and other) possible changes including the passage of Sarbanes-Oxley. Perino (2002) discusses various legal aspects of certification (in Sarbanes-Oxley) that would likely have increased investor uncertainty, for instance, changes in criminal penalties, deterrence effects, and court rulings, and the fact that many aspects of certification simply called on the SEC to develop new rules and guidelines. |
| 18 | In our empirical tests, we set tb = -10 and te = 10 relative to event date t = 0. Although arbitrary, the choice of tb and te is motivated primarily by an assumption of our test statistic, which we standardize by a measure of the standard deviation of unsigned excess return in a non-informational period. A tb to te period longer than 21 trading days, excluding days -5 to 5, increases the possibility that the standardization measure includes the information effects that we seek to detect. For example, a period commencing at day -30 for an August 14, 2002 filing event dates back to July 2, 2002 and therefore includes almost all the effects of second-quarter 2002 earnings announcements. |
| 19 | This is consistent with the specification of each distribution of SAER as a weighted combination of a skewed distribution (e.g., chi square) and a symmetric distribution (e.g., normal), where the chi square parameters are the same across the two excess return distributions. To examine the effects of standardization on the regression, we also examine model (1) with unstandardized excess return (AER) as the dependent variable. See also section 4.4 on robustness tests. |
| 20 | This calendar period includes the same number of trading days and weekdays for all years. |
| 21 | ERDit, CCDit, and CFDit are set equal to 1 on those days when information effects are expected to be present. Consistent with much prior research, model (1) assumes a three-day event window, in that information effects relative to an event at t are assumed present at t-1, t, and t+1. ERDit, CCDit, and CFDit are thus coded "1" on days -1, 0, and 1, and 0 elsewhere. We also examine model (1) under the assumption that the information effects occur on day 1 only. |
| 22 | Observe that figure 1 spikes on event day 5 (relative to the day of a second quarter earnings release in 2002). To consider a possible source for this spike, we identify from the distribution of earnings release dates for the second quarter of 2002 the day with the highest frequency of earnings announcements, which is July 18, 2002. July 25, 2002 falls five trading days after this date, which is the date of passage of Sarbanes-Oxley. This is a date on which we hypothesize there should be a significant investor response. Figure 1, therefore, is consistent with a calendar day response to the passage of Sarbanes-Oxley on July 25. We test this hypothesis formally in the regression analysis in section 4.3. |
| 23 | Investor response partitioned on market capitalization indicates that investors respond more to smaller firms' earnings announcements than larger firms' announcements, which is consistent with prior research. |
| 24 | A natural extension of the research we present in this study would analyze the extent to which firm-specific return uncertainty is reduced as investors gain more experience and understanding of the consequences of certification and the many other effects of the passage of Sarbanes-Oxley. The central hypotheses here would be a reduction in SAER around selected uncertainty-resolving events rather than an increase in uncertainty, which is the focus here. As such, a future study of this kind would be in the spirit of Simon (1989), who studies the effect of the 1933 securities act on investor behavior. |
| 25 | We estimate model (1) using REML (residual maximum likelihood) estimation techniques, with the earnings announcement date and SEC filing date variables specified as random effects since these measures are "repeated" for each of six years. Unlike, ordinary least squares, this method recognizes contemporaneous correlation across equations/firms in estimating the system coefficients. REML estimates are generated using JMP Version 5 by JMP Software: A Division of SAS Institute, Inc. |
| 26 | While SAER is the more appropriate variable, we include results based on AER as the dependent variable to assess the effects of standardization on our results, which as we have indicated earlier tend to bias our tests conservatively. Recall that the second and third quarters of 2002 reflect more firm-specific volatility apart from any direct market effects of the events we study (e.g., the bankruptcy of Enron and WorldCom). As such, when we deflate by a measure of volatility based on non-event days in June through August 2002, this measure is still higher than in the other years, and this reduces the 2002 standardized measure, potentially obscuring from the standardized measure some of effects that we seek to identify. We include an indicator variable in the regression as an additional control for differential excess return volatility in 2002 versus the other years. |
| 27 | Note that these results are fully consistent with the short window tests in table 3, which also examine the increase in SAER around an SEC filing or certification filing date. |
| 28 | The sign of the coefficient for institutional holdings when market capitalization is not included in regression model (1) is negative and significant, consistent with the extant literature. |
| 29 | All robustness results are available on request. |
| 30 | We then take the absolute value or standardized absolute value of these differences and follow the same procedures as before. |
| 31 | The regressions in table 5 include an indicator variable only for those certifications on August 14, where the investor response is measured over a three-day window. We also estimate a specification of model (1) that includes an additional indicator variable as 1 for all the non-August 14 certification dates, otherwise 0. However, when estimated in conjunction with the other variables in the model (earnings releases and control variables), the coefficient for the "non-August 14 certifications" is not significant. |
| 32 | The earlier tests in tables 3 through 5, though, are constructed so that the event day returns for certification filings are based on the same sample of firms as the event day returns for the other SEC filings. |
| 33 | The percentage change in SAER is less than 72.5% because excess return in the non-information periods in 2002 (which are used to standardize) is generally higher than in the previous years. See, also, table 2. We highlight percentage change in AER because it may be more economically interpretable-as it represents the average increase in return volatility at certification date relative to an equivalent date in a prior period. According to table 7, average return volatility on August 14 increases from 1.48% in prior years on average to 2.55% in 2002, a jump of 72.5%.
|