UNITED STATES SECURITIES AND EXCHANGE COMMISSION
Washington, D.C. 20549
Form 10-K
(Mark One) | |
ANNUAL REPORT PURSUANT TO SECTION 13 OR 15(d) OF THE SECURITIES EXCHANGE ACT OF 1934 | |
For the fiscal year ended December 31, 2019
OR | |
TRANSITION REPORT PURSUANT TO SECTION 13 OR 15(d) OF THE SECURITIES EXCHANGE ACT OF 1934 | |
Commission File Number 1-6903

(Exact name of registrant as specified in its charter)
(State or Other Jurisdiction of Incorporation or Organization) | (I.R.S. Employer Identification No.) | |
(Address of principal executive offices) | (Zip Code) | |
Registrant's telephone number, including area code: (214 ) 631-4420
Securities Registered Pursuant to Section 12(b) of the Act
Title of each class | Trading Symbol(s) | Name of each exchange on which registered |
Securities registered Pursuant to Section 12(g) of the Act: None
Indicate by check mark if the Registrant is a well-known seasoned issuer, as defined in Rule 405 of the Securities Act. Yes þ No ¨
Indicate by check mark if the Registrant is not required to file reports pursuant to Section 13 or Section 15(d) of the Act. Yes ¨ No þ
Indicate by check mark whether the Registrant (1) has filed all reports required to be filed by Section 13 or 15(d) of the Securities Exchange Act of 1934 during the preceding 12 months (or for such shorter period that the Registrant was required to file such reports), and (2) has been subject to such filing requirements for the past 90 days. Yes þ No ¨
Indicate by check mark whether the registrant has submitted electronically every Interactive Data File required to be submitted pursuant to Rule 405 of Regulation S-T (§ 232.405 of this chapter) during the preceding 12 months (or for such shorter period that the registrant was required to submit such files). Yes þ No ¨
Indicate by check mark whether the registrant is a large accelerated filer, an accelerated filer, a non-accelerated filer, a smaller reporting company, or an emerging growth company. See the definitions of “large accelerated filer,” “accelerated filer,” “smaller reporting company,” and "emerging growth company" in Rule 12b-2 of the Exchange Act.
Smaller reporting company ¨ Emerging growth company ¨
If an emerging growth company, indicate by check mark if the registrant has elected not to use the extended transition period for complying with any new or revised financial accounting standards provided pursuant to Section 13(a) of the Exchange Act. ☐
Indicate by check mark whether the Registrant is a shell company (as defined in Rule 12b-2 of the Exchange Act). Yes ☐ No þ
The aggregate market value of voting and non-voting common equity held by non-affiliates computed by reference to the price at which the common equity was last sold as of the last business day of the Registrant's most recently completed second fiscal quarter (June 28, 2019) was $2,154.2 million.
At January 31, 2020, the number of shares of common stock, $0.01 par value, outstanding was 119,704,056 .
The information required by Part III of this report, to the extent not set forth herein, is incorporated by reference from the Registrant's definitive 2020 Proxy Statement.
1
TRINITY INDUSTRIES, INC.
FORM 10-K
TABLE OF CONTENTS
Caption | Page |
2
Forward-Looking Statements
This annual report on Form 10-K (or statements otherwise made by the Company or on the Company’s behalf from time to time in other reports, filings with the Securities and Exchange Commission (“SEC”), news releases, conferences, website postings or otherwise) contains forward-looking statements within the meaning of the Private Securities Litigation Reform Act of 1995. Any statements contained herein that are not historical facts are forward-looking statements and involve risks and uncertainties. These forward-looking statements include expectations, beliefs, plans, objectives, future financial performances, estimates, projections, goals, and forecasts. Trinity uses the words “anticipates,” “believes,” “estimates,” “expects,” “intends,” “forecasts,” “may,” “will,” “should,” and similar expressions to identify these forward-looking statements. Potential factors which could cause our actual results of operations to differ materially from those in the forward-looking statements include, among others:
• | market conditions and customer demand for our business products and services; |
• | the cyclical nature of the industries in which we compete; |
• | variations in weather in areas where our products are sold, used, or installed; |
• | naturally-occurring events, pandemics, and/or disasters causing disruption to our manufacturing, product deliveries, and production capacity, thereby giving rise to an increase in expenses, loss of revenue, and property losses; |
• | the timing of introduction of new products; |
• | the timing and delivery of customer orders, sales of leased railcars, or a breach of customer contracts; |
• | the creditworthiness of customers and their access to capital; |
• | product price changes; |
• | changes in mix of products sold; |
• | the costs incurred to align manufacturing capacity with demand and the extent of its utilization; |
• | the operating leverage and efficiencies that can be achieved by our manufacturing businesses; |
• | availability and costs of steel, component parts, supplies, and other raw materials; |
• | competition and other competitive factors; |
• | changing technologies; |
• | surcharges and other fees added to fixed pricing agreements for steel, component parts, supplies, and other raw materials; |
• | interest rates and capital costs; |
• | counter-party risks for financial instruments; |
• | long-term funding of our operations; |
• | taxes; |
• | the stability of the governments and political and business conditions in certain foreign countries, particularly Mexico; |
• | changes in import and export quotas and regulations; |
• | business conditions in emerging economies; |
• | costs and results of litigation, including trial and appellate costs; |
• | changes in accounting standards or inaccurate estimates or assumptions in the application of accounting policies; |
• | legal, regulatory, and environmental issues, including compliance of our products with mandated specifications, standards, or testing criteria and obligations to remove and replace our products following installation or to recall our products and install different products manufactured by us or our competitors; |
• | actions by U.S. and/or foreign governments (particularly Mexico and Canada) relative to federal government budgeting, taxation policies, government expenditures, borrowing/debt ceiling limits, tariffs, and trade policies; |
• | the use of social or digital media to disseminate false, misleading and/or unreliable or inaccurate information; |
• | the inability to sufficiently protect our intellectual property rights; |
• | if the Company does not realize some or all of the benefits expected to result from the spin-off of Arcosa, Inc. ("Arcosa"), a public company focused on infrastructure-related products and services, or if such benefits are delayed; and |
• | if the 2018 distribution of shares of Arcosa, together with certain related transactions, does not qualify as a transaction that is generally tax-free for U.S. federal income tax purposes, the Company's stockholders at the time of the distribution and the Company could be subject to significant tax liability. |
Any forward-looking statement speaks only as of the date on which such statement is made. Except as required by federal securities laws, Trinity undertakes no obligation to update any forward-looking statement to reflect events or circumstances after the date on which such statement is made. For a discussion of risks and uncertainties which could cause actual results to differ from those contained in the forward-looking statements, see Item 1A, “Risk Factors” included elsewhere herein.
3
PART I
Item 1. Business.
General
Trinity Industries, Inc. and its consolidated subsidiaries (“Trinity,” “Company,” “we,” “our,” or “us”) own businesses that are leading providers of railcar products and services in North America. Our rail-related businesses market their railcar products and services under the trade name TrinityRail®. The TrinityRail platform provides railcar leasing and management services, railcar manufacturing, and railcar maintenance and modification services. We also own businesses engaged in the manufacturing of products used on the nation's roadways and in traffic control, as well as a logistics business that primarily provides support services to Trinity.
Trinity was incorporated in 1933 and became a Delaware corporation in 1987. We are headquartered in Dallas, Texas, and our principal executive offices are located at 2525 N. Stemmons Freeway, Dallas, Texas 75207-2401. Our telephone number is 214-631-4420, and our Internet website address is www.trin.net.
Unless otherwise stated, any reference to income statement items in this Annual Report on Form 10-K (the "Form 10-K") refers to results from continuing operations.
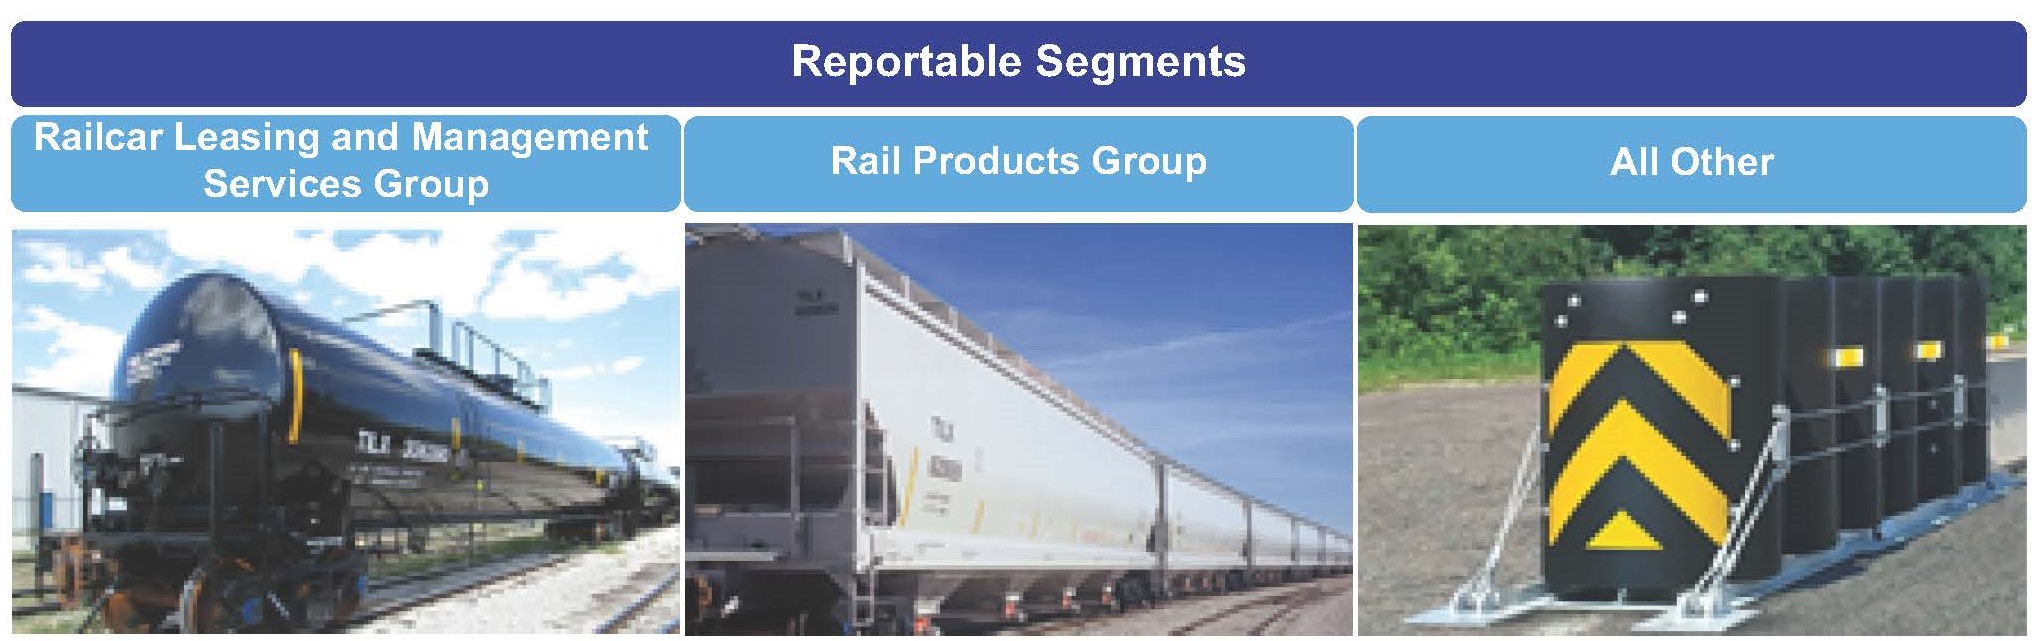
We report our operating results in three reportable segments.
Business Overview and Current Business Strategy
Our vision is to be the premier provider of railcar related products and services in North America. We strive to operate industry-leading railcar leasing, manufacturing, and services businesses, by providing a single source for comprehensive rail transportation solutions and services in North America. Our objective is to deliver a premier customer experience by providing high quality, innovative products and designing solutions that enhance and optimize our customers' businesses. As a railcar focused company, we see opportunities to grow and enhance our product and service offerings in ways that we expect will optimize the ownership and use of railcars. Our rail platform offers a complete portfolio of railcar solutions to our customers as summarized below:
4
Railcar Leasing and Management Services Group. Our Railcar Leasing and Management Services Group ("Leasing Group") is a leading provider in North America of comprehensive railcar industry services. Through wholly-owned subsidiaries, primarily Trinity Industries Leasing Company ("TILC"), and partially-owned subsidiaries, TRIP Rail Holdings LLC (“TRIP Holdings”) and RIV 2013 Rail Holdings LLC ("RIV 2013"), we primarily offer operating leases for freight and tank railcars. Trinity's Rail Products Group and TILC coordinate sales and marketing activities under the TrinityRail platform, thereby providing a single point of contact for railroads and shippers seeking rail equipment and services.
In addition, TILC originates and manages railcar leases for third-party investors and provides fleet maintenance and management services to industrial shippers. Our affiliations with third-party investor-owned funds, through strategic railcar alliances and the formation of railcar investment vehicles, combined with TILC's fleet maintenance and management services capabilities, complement our leasing business by generating stable fee income, strengthening customer relationships, and enhancing the view of TrinityRail as a leading provider of railcar products and services.
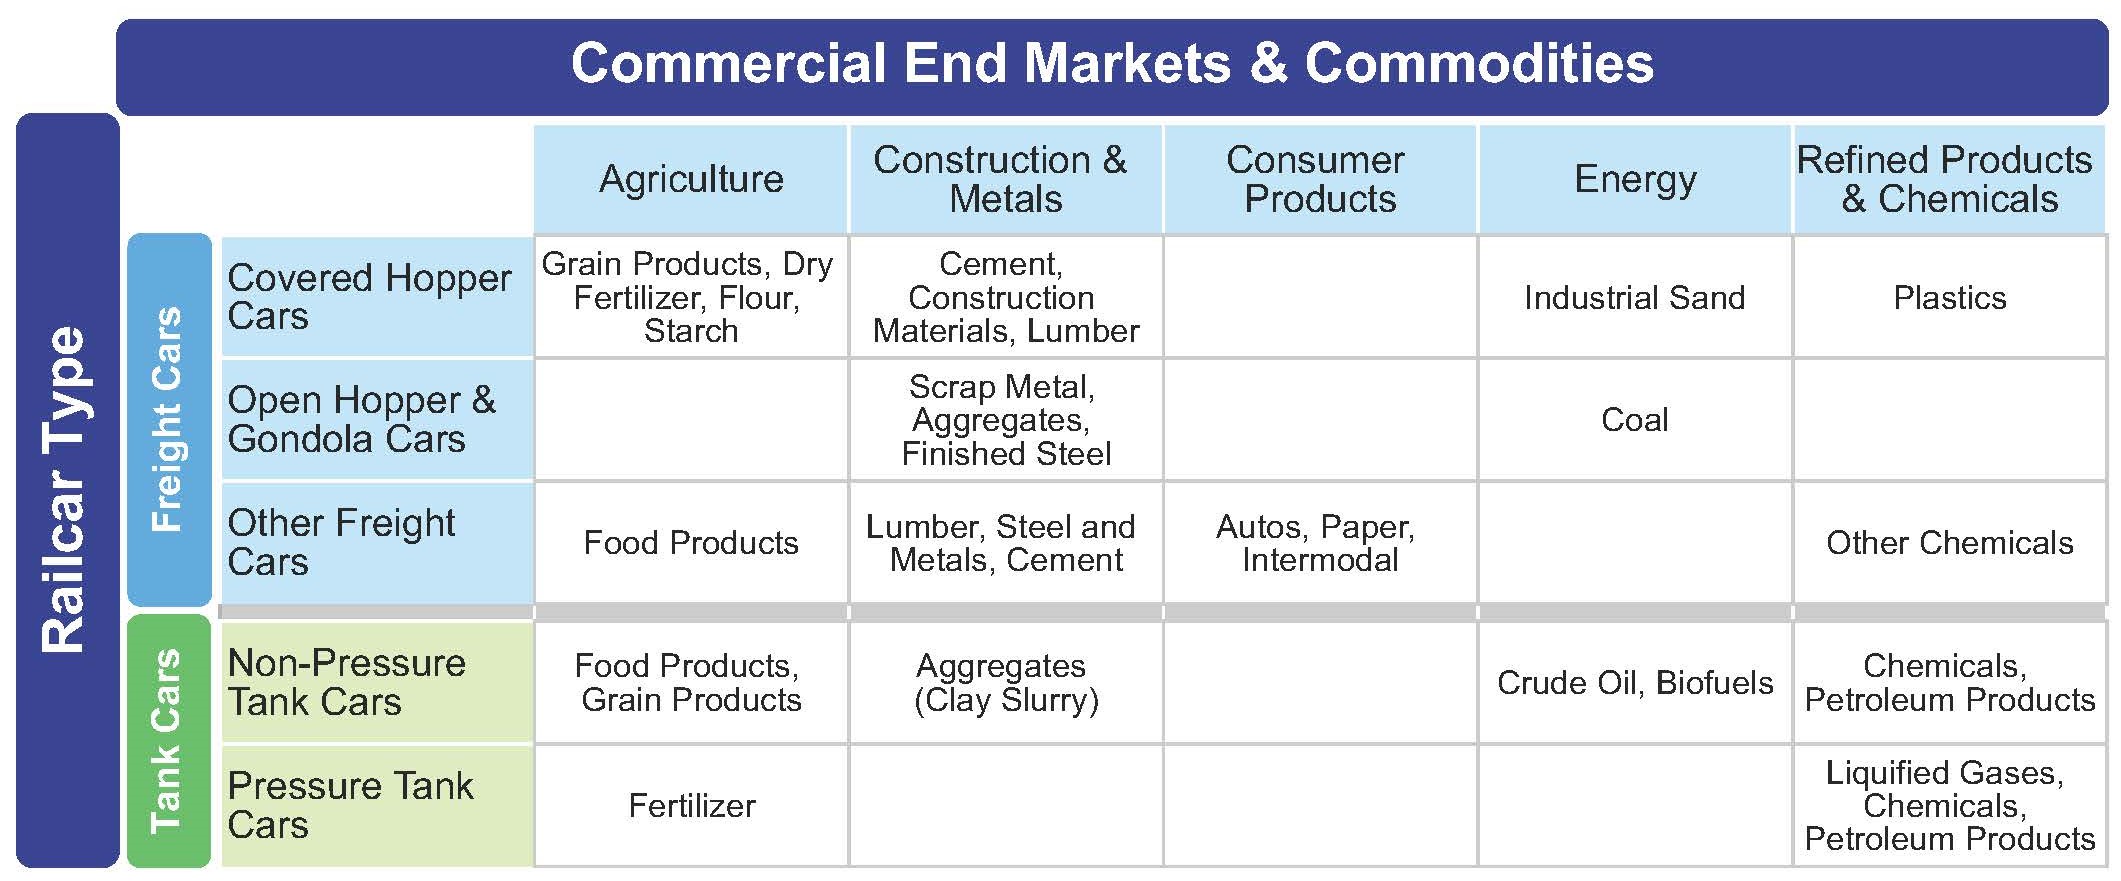
The railcars in our lease fleet are leased to industrial shippers and railroads. These companies operate in various markets including agriculture, construction and metals, consumer products, energy, and refined products and chemicals. Substantially all of the railcars in our lease fleet were manufactured by our Rail Products Group. The terms of our railcar leases generally vary from one to ten years, although certain leases entered into in prior periods had lease terms of up to twenty years, and provide for fixed monthly rentals, predominantly under full-service leases. A small percentage of our fleet is leased on a per diem basis. As of December 31, 2019, the lease fleet of our subsidiaries included 103,705 railcars that were 96.0% utilized, of which 101,530 railcars were owned by TILC or its affiliates and 2,175 railcars were financed in sale-leaseback transactions, which are not reflected in the property, plant, and equipment amounts reported on our Consolidated Balance Sheet. Railcars under management, including those owned by third-parties, totaled 128,540 railcars.
5
Lease Fleet Diversification
The following charts provide additional information with respect to the Company's wholly-owned, partially-owned, and managed leased fleet.
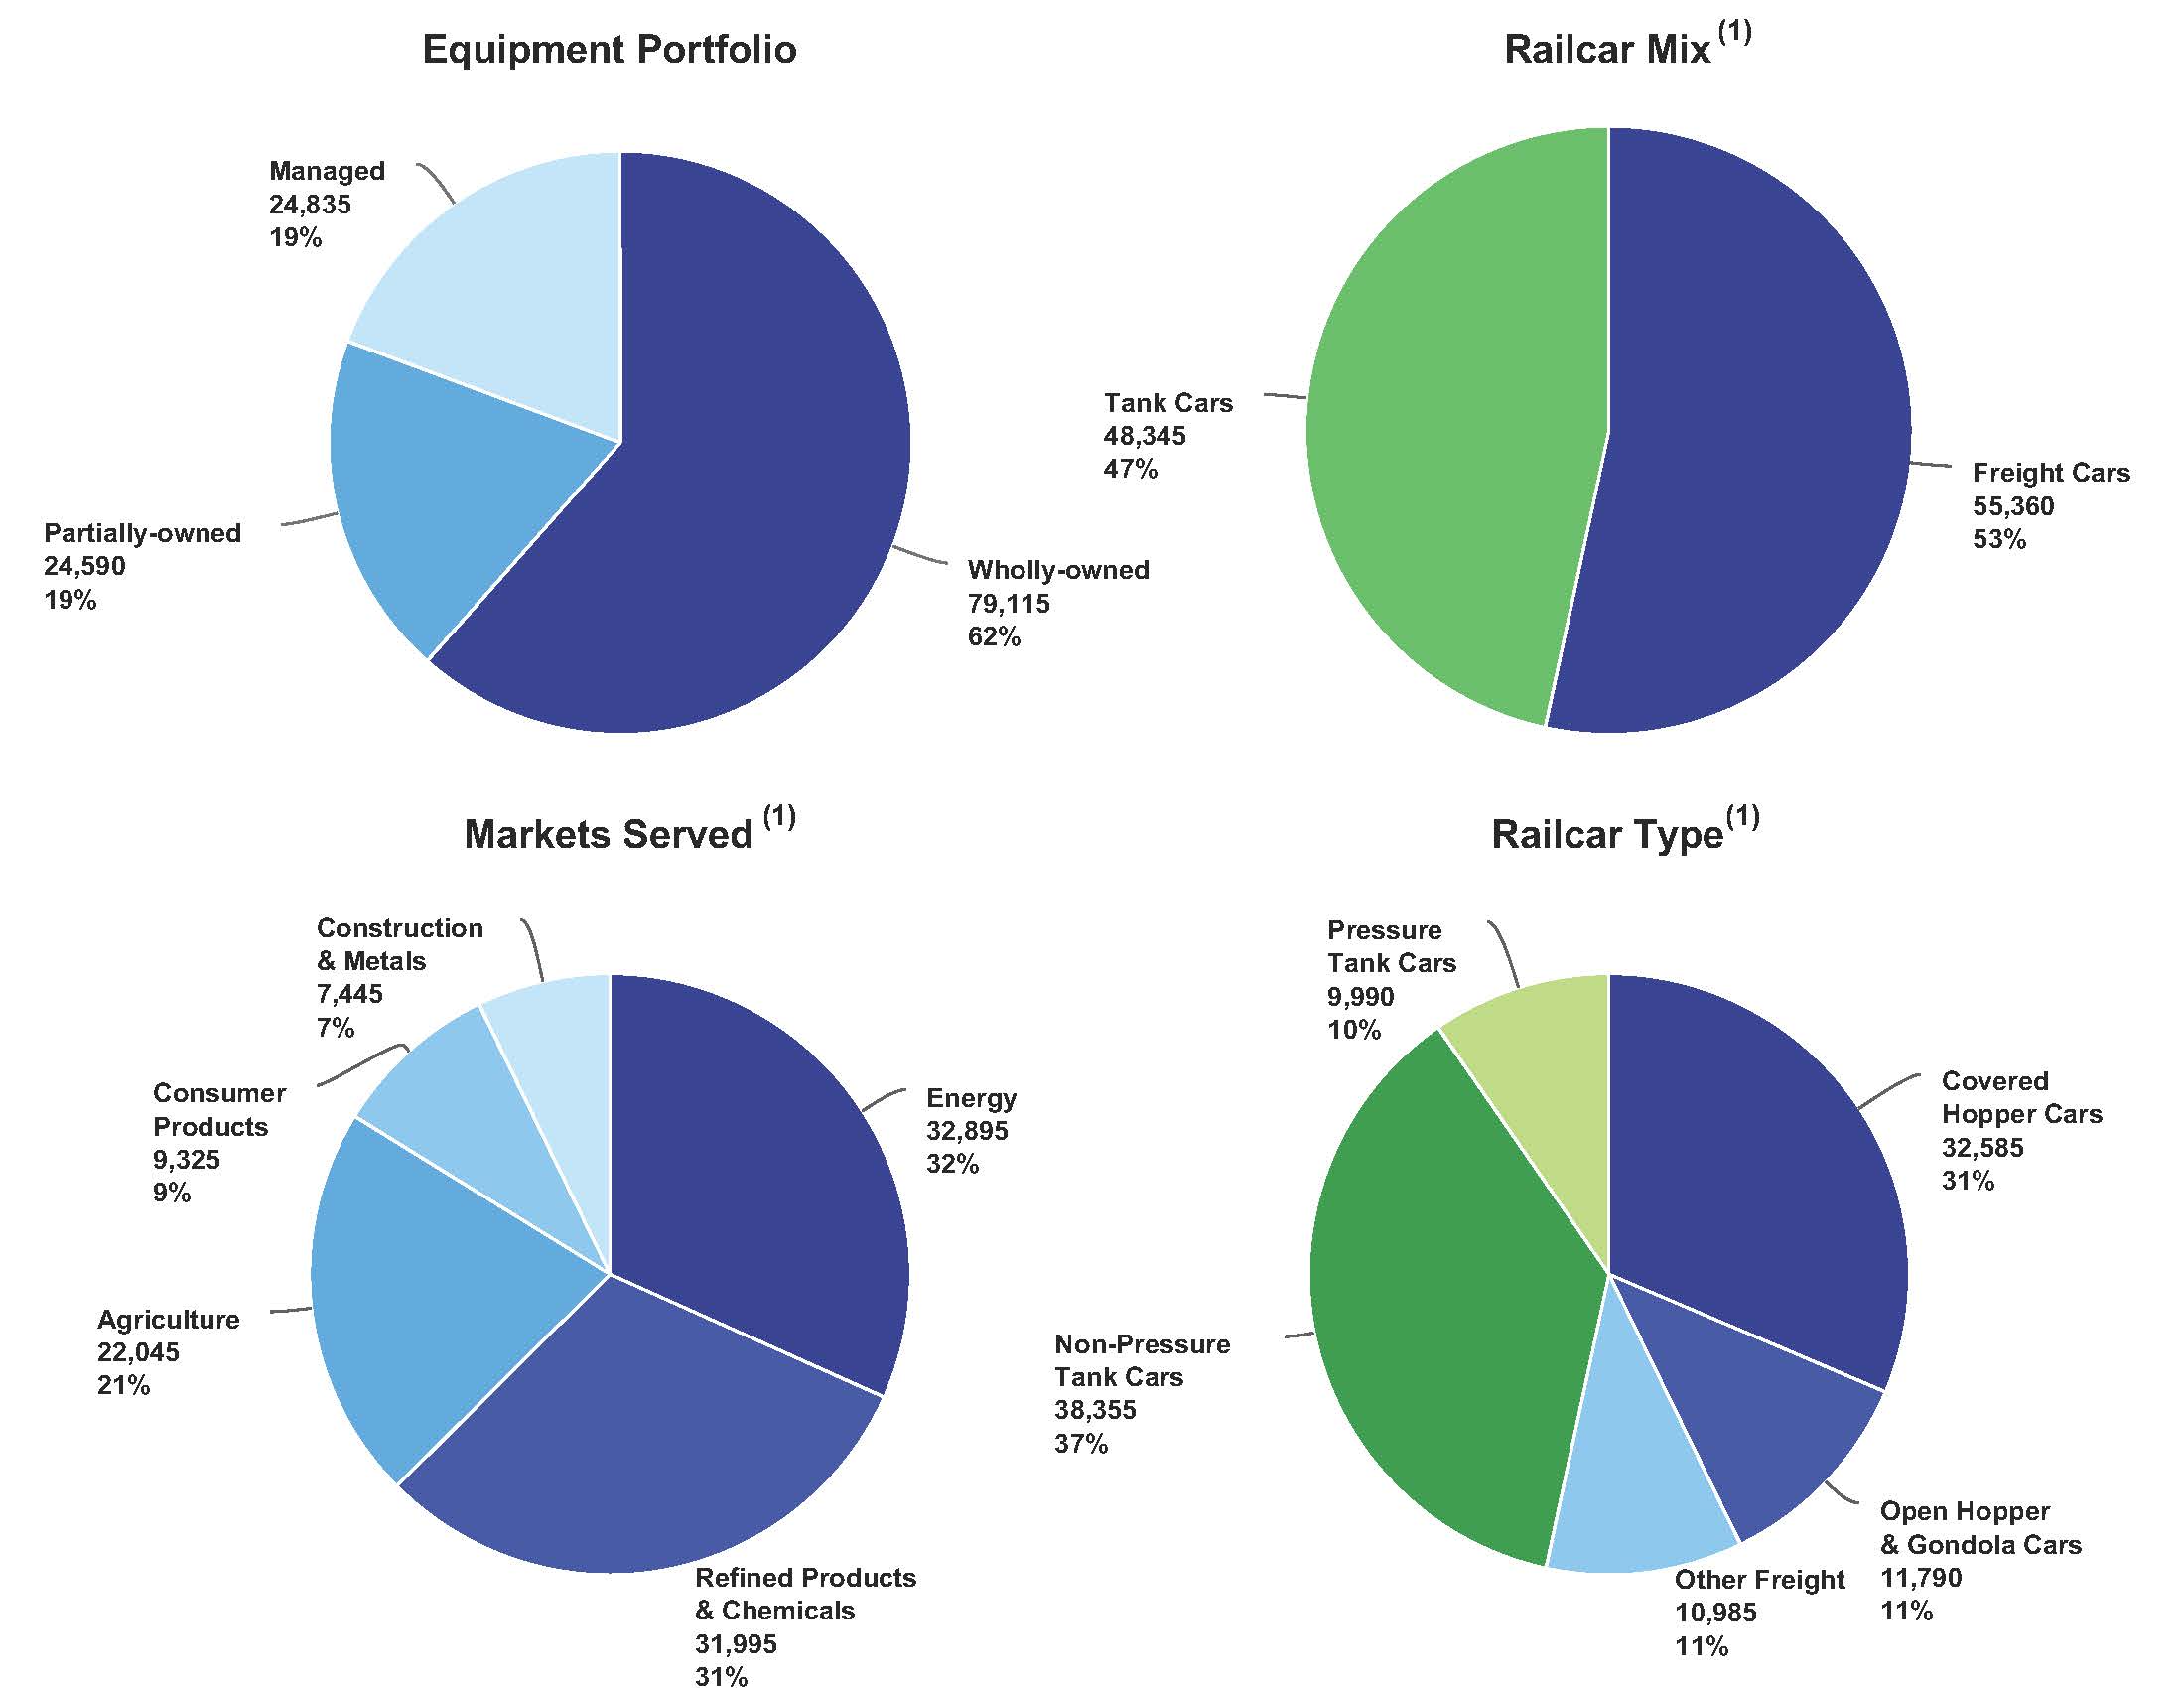
(1) Data presented in this chart reflects our wholly-owned and partially-owned lease fleet, which totaled 103,705 railcars as of December 31, 2019.
6
Rail Products Group. Through wholly-owned subsidiaries with manufacturing facilities in the U.S. and Mexico, our Rail Products Group is a leading manufacturer of freight and tank railcars in North America used for transporting a wide variety of liquids, gases, and dry cargo.
We believe that our Rail Products Group's diversified manufacturing capabilities enable us to capitalize on changing industry trends and developing opportunities in various markets. Additionally, we offer a full range of maintenance services and flexible solutions, from field inspections and comprehensive compliance testing to standard repairs and maintenance, specialized cleaning, inspection, and testing at multiple facilities in the U.S. We also provide modification capabilities and assist in transitioning railcars to new industry standards. We believe that our investment in maintenance services expands and enhances our ability to serve our customers and our lease fleet.
Our customers include railroads, leasing companies, and industrial shippers of products in various markets, such as agriculture, construction and metals, consumer products, energy, and refined products and chemicals. We compete in the North American market primarily against four major railcar manufacturers and numerous maintenance services providers.
We hold patents of varying duration for use in our manufacture of railcars and components. We believe patents offer a marketing advantage in certain circumstances. No material revenues are received from the licensing of these patents.
All Other. All Other includes our highway products business; our logistics business; legal, environmental, and maintenance costs associated with non-operating facilities; and other peripheral businesses.
Our highway products business is a leading U.S. manufacturer of guardrail, crash cushions, and other highway barriers. The Federal Highway Administration ("FHWA"), which determines product eligibility for cost reimbursement using federal funds, has approved many of our products as eligible for federal-aid reimbursement based on satisfactory performance testing pursuant to criteria established under either the National Cooperative Highway Research Program Report 350 or the Manual for Assessing Safety Hardware, as applicable. Our crash cushion, barrier, and guardrail product lines include multiple proprietary products manufactured under license from certain public and private research organizations and inventors as well as Company-held patents. We sell highway products throughout the U.S., Canada, and Mexico, and we export highway products, including proprietary products, internationally. We do not perform any installation services with respect to our highway products. Our highway products business is affected by seasonal fluctuations, with the second and third quarters historically being the quarters with the highest revenues.
Backlog. As of December 31, 2019 and 2018, our backlog of firm orders was as follows:
December 31, 2019 | December 31, 2018 | ||||||
(in millions) | |||||||
Rail Products Group | |||||||
Products: | |||||||
External Customers | $ | 1,213.4 | $ | 2,059.5 | |||
Leasing Group | 619.1 | 1,588.1 | |||||
$ | 1,832.5 | $ | 3,647.6 | ||||
Maintenance Services | $ | 44.8 | $ | 100.6 | |||
Railcar Leasing and Management Services Group | $ | 100.5 | $ | 112.6 | |||
For the year ended December 31, 2019, our rail manufacturing businesses received orders for 10,220 railcars with a value of approximately $1.0 billion. The change in backlog as of December 31, 2019 compared with our backlog as of December 31, 2018 reflects the value of orders taken, net of cancellations, executory contract change orders and price modifications, and orders delivered during the year. The orders in our backlog from the Leasing Group are fully supported by lease commitments with external customers. The final amount of backlog attributable to the Leasing Group may vary by the time of delivery as customers may choose to purchase railcars from the Rail Products Group rather than lease. Approximately 59% of our railcar backlog is expected to be delivered during the year ending December 31, 2020 with the remainder to be delivered through 2023.
Marketing. We sell or lease substantially all of our products and services through our own sales personnel operating from offices in multiple U.S locations as well as Canada and Mexico. We also use independent sales representatives on a limited basis.
7
Raw Materials and Suppliers.
Railcar Specialty Components and Steel. Products manufactured at our railcar manufacturing facilities require a significant supply of raw materials, such as steel, as well as numerous specialty components, such as brakes, wheels, heads, side frames, bolsters and bearings. The input costs for materials, including raw steel, specialty components, and other parts and coatings purchased from third parties represent, on average, more than 70% of the cost of most railcars. Although the number of alternative suppliers of specialty components has declined in recent years, at least two suppliers continue to produce most components.
The principal material used in railcar manufacturing is steel. During 2019, the supply of steel was sufficient to support our manufacturing requirements. Market steel prices continue to exhibit periods of volatility and were slightly lower exiting 2019 compared to 2018. Steel and component prices may be volatile in the future as a result of market conditions, changes in tariffs or other governmental policies. We often use contract-specific purchasing practices, existing supplier commitments, contractual price escalation provisions, and other arrangements with our customers to mitigate the effect of steel price volatility on our operating profits for the year. In general, we believe there is enough capacity in the supply industry to meet current production levels and that our existing contracts and other relationships we have in place will meet our current production forecasts.
Employees. The following table presents the approximate headcount breakdown of employees by reportable segment:
December 31, 2019 | ||
Railcar Leasing and Management Services Group | 150 | |
Rail Products Group | 10,470 | |
All Other | 910 | |
Corporate | 345 | |
11,875 | ||
As of December 31, 2019, approximately 4,910 employees were employed in the U.S. and 6,965 were employed in Mexico.
8
Information about our Executive Officers.
The following table sets forth the names and ages of all of our executive officers, positions and offices presently held by them, and the year each person first became an officer. All officer terms expire in May 2020.
Name | Age | Office | Officer Since | |||
E. Jean Savage | 55 | Chief Executive Officer and President | 2020 | |||
Melendy E. Lovett | 61 | Senior Vice President and Chief Financial Officer | 2014 | |||
Brian D. Madison | 59 | President, Trinity Industries Leasing Company | 2016 | |||
Eric R. Marchetto | 50 | Senior Vice President and Group President, TrinityRail | 2001 | |||
Paul E. Mauer | 61 | Executive Vice President, TrinityRail, President, TrinityRail Products | 1999 | |||
Steven L. McDowell | 58 | Vice President and Chief Accounting Officer | 2013 | |||
Sarah R. Teachout | 47 | Senior Vice President and Chief Legal Officer | 2016 | |||
The following officers, for the preceding five years, have either not been in full time employment with the Company or have had changes in responsibilities during that period:
Ms. Savage was appointed as the Company’s Chief Executive Officer and President, effective February 17, 2020, and has served as a member of the Company’s Board of Directors since 2018. Prior to her employment with the Company, from 2002 to 2020, she served in a variety of positions with Caterpillar, Inc. (“Caterpillar”), a manufacturer of construction and mining equipment, diesel and natural gas engines, industrial gas turbines, and diesel-electric locomotives. From 2017 until her retirement from Caterpillar in February 2020, she served as Vice President of Caterpillar’s Surface Mining and Technology Division. From 2014 to 2017, she was Chief Technology Officer and Vice President of Caterpillar’s Innovation and Technology Development Division.
From January 1, 2020 until Ms. Savage began her service as Chief Executive Officer and President, the Company was managed by an interim Office of the Chief Executive Officer, which consisted of Ms. Lovett, Mr. Marchetto, and Ms. Teachout.
Ms. Lovett has served as Senior Vice President and Chief Financial Officer since 2019. She joined the Company in 2014 as Senior Vice President and Chief Administrative Officer. A member of the Company's Board of Directors from 2012 to 2014, Ms. Lovett resigned her Board position at the time of her appointment as an officer of the Company. Prior to joining Trinity in 2014, she was the Senior Vice President and President of the Education Technology business for Texas Instruments.
Mr. Madison joined the Company in 2016 as President of Trinity Industries Leasing Company. Prior to joining the Company, he served as Executive Vice President at Key Equipment Finance from 2010 to 2016, overseeing manufacturer and vendor alliances. Prior to his tenure at Key Equipment, he served as General Manager, Microsoft Financing for Microsoft Corp.
Mr. Marchetto has served as Senior Vice President and Group President of TrinityRail since 2019. He joined the Company in 1995. He served as the Chief Commercial Officer for the Company’s rail businesses from 2018 to 2019. He served as Executive Vice President and Chief Administrative Officer for the Company’s rail businesses from 2016 to 2018, following having served as Executive Vice President and Chief Financial Officer for the rail businesses from 2012 to 2016.
Mr. McDowell has served as Vice President and Chief Accounting Officer since 2018. He joined the Company in 2013 as Vice President and Chief Audit Executive and was named Vice President and Chief Compliance Officer in 2017. Prior to joining Trinity, he worked for Dean Foods from 2007 to 2013, where he held a variety of management positions and most recently served as Vice President, Internal Audit and Risk Management. Prior to his tenure at Dean Foods, he served as Vice President - Internal Audit at Centex Corporation.
Ms. Teachout has served as Senior Vice President and Chief Legal Officer since 2018. She joined the Company in 2015 as Deputy General Counsel, and was elected Vice President and Deputy General Counsel in 2016. Prior to joining Trinity, Ms. Teachout was a partner at the law firm of Akin Gump Strauss Hauer & Feld LLP from 2012 to 2015. Before joining Akin Gump, Ms. Teachout had been a partner at the law firm of Haynes and Boone, LLP since 2007.
Mr. Mauer has been in full time employment of Trinity or its subsidiaries for more than five years and has performed essentially the same duties during the past five years.
9
Commitment to Sustainability. We strive to employ company resources in ways that make positive contributions to our stakeholders. As we pursue improvements to our products and services, we keep in mind the environmental and societal impacts of our decisions and work to protect natural resources and the environment for the benefit of current and future generations. We continuously look for ways to improve our governance practices with the goal of promoting the long-term interests of stakeholders, strengthening accountability and inspiring trust.
Environmental Stewardship. We aim to operate our business in a manner that minimizes the impact on natural resources and the environment. We believe railcars are a more environmentally friendly way to fuel the North American supply chain. U.S. freight railroads produce far fewer greenhouse gas emissions than certain other modes of commercial transportation, such as trucks. We strive to responsibly support customers' products at each stage of the product lifecycle, including recycling the railcar through scrap and salvage at the end of its useful life.
Social Responsibility. Our goal is to add value to the communities in which we live and work, strengthening our relationships and leveraging our partnerships to amplify our impact. We strive to attract and retain a diverse and empowered workforce. Our priorities include fostering an inclusive and collaborative workplace, promoting opportunities for professional development, improving the wellbeing of our employees and other stakeholders, and contributing to the communities in which we operate.
Governance. Our goal is to promote the long-term interests of stakeholders, strengthen accountability, and inspire trust. Our Board of Directors includes an independent Chairman and diverse and independent Board members who help ensure that our business strategies and programs, including our compensation program, are aligned with stakeholder interests.
Governmental Regulation.
Railcar Industry. Our railcar and related manufacturing, maintenance services, and leasing businesses are regulated by multiple governmental regulatory agencies such as the U.S. Environmental Protection Agency ("USEPA"); Transport Canada ("TC"); the U.S. Department of Transportation ("USDOT") and the administrative agencies it oversees, including the Federal Railroad Administration ("FRA"), the Pipeline and Hazardous Materials Safety Administration ("PHMSA"), the Research and Special Programs Administration; Mexico's Agencia Reguladora del Transporte Ferroviario; Mexico's Secretaria de Comunicaciones y Transportes; and industry authorities such as the Association of American Railroads ("AAR"). All such agencies and authorities promulgate rules, regulations, specifications or operating standards affecting railcar design, configuration, and mechanics; maintenance, and rail-related safety standards for railroad equipment, tracks, and operations, including the packaging and transportation of hazardous or toxic materials. We believe that our product designs and operations are in compliance with these specifications, standards, and regulations applicable to our business.
Revised regulations implemented in 2015 pertaining to the transportation of flammable materials by rail remain in effect. These regulatory changes materially impact: the rail industry as a whole; railroad operations; older and newer tank railcars that met or exceeded prior regulatory requirements and standards; future tank railcar specifications; and market decisions relative to capital investment in rail products.
Highway Products. The primary regulatory and industry authorities involved in the regulation of highway products manufacturers are the USDOT, the FHWA, and various state highway departments and administrative agencies. These organizations, with participation from the American Association of State Highway and Transportation Officials ("AASHTO"), establish certain specifications, product testing criteria, and performance standards related to the manufacture of our highway products. We believe that our highway products are in compliance with the standards and specifications applicable to our business.
Occupational Safety and Health Administration and Similar Regulations. Our operations are subject to regulation of health and safety matters by the U.S. Occupational Safety and Health Administration ("OSHA") and the Secretaria del Trabajo y Prevision Social ("STPS") in Mexico. We believe that we employ appropriate precautions to protect our employees and others from workplace injuries and harmful exposure to materials handled and managed at our facilities. However, claims that may be asserted against us for work-related illnesses or injury and the further adoption of occupational safety and health regulations in the U.S. or in foreign jurisdictions in which we operate could increase our operating costs. While we do not anticipate having to make material expenditures in order to remain in substantial compliance with health and safety laws and regulations, we are unable to predict the ultimate cost of compliance.
10
Environmental Matters. We are subject to comprehensive federal, state, local, and foreign environmental laws and regulations relating to the release or discharge of materials into the environment; the management, use, processing, handling, storage, transport, and disposal of hazardous and non-hazardous waste and materials; and other activities relating to the protection of human health, natural resources, and the environment.
Environmental operating permits are, or may be, required for our operations under these laws and regulations. These operating permits are subject to modification, renewal, and revocation. We regularly monitor and review our operations, procedures, and policies for compliance with our operating permits and related laws and regulations. We believe that our operations and facilities, whether owned, managed, or leased, are in substantial compliance with applicable environmental laws and regulations and that any non-compliance is not likely to have a material adverse effect on our operations or financial condition.
See Item 1A for further discussion of risk factors with regard to environmental, governmental, and other matters.
Additional Information.
Our Internet website address is www.trin.net. Information on the website is available free of charge. We make available on our website our annual report on Form 10-K, quarterly reports on Form 10-Q, current reports on Form 8-K, and any amendments thereto, as soon as reasonably practicable after such material is filed with, or furnished to, the SEC. The contents of our website are not intended to be incorporated by reference into this report or in any other report or document we file and any reference to our website is intended to be an inactive textual reference only.
Item 1A. Risk Factors.
Our business is subject to a number of risks, which are discussed below. There are risks and uncertainties that could cause our actual results to be materially different from those mentioned in forward-looking statements that we make from time to time in filings with the SEC, news releases, reports, proxy statements, registration statements, and other written communications, as well as oral forward-looking statements made from time to time by representatives of our Company. All known material risks and uncertainties are described below. You should consider carefully these risks and uncertainties in addition to the other information contained in this report and our other filings with the SEC including our subsequent reports on Forms 10-Q and 8-K, and any amendments thereto before deciding to buy, sell, or hold our securities. If any of the following known risks or uncertainties actually occurs with material adverse effects on us, our business, financial condition, results of operations, and/or liquidity could be harmed. In that event, the market price for our various securities could decline and you may lose all or part of your investment.
The cautionary statements below discuss important factors that could cause our business, financial condition, operating results, and cash flows to be materially adversely affected. Readers are cautioned not to place undue reliance on the forward-looking statements contained herein. Except as required by federal securities laws, we undertake no obligations to update or revise publicly any forward-looking statements, whether as a result of new information, future events, or otherwise.
Risks Related to our Business
The industries in which we operate are cyclical, and, accordingly, our business is subject to changes in the economy.
We operate in cyclical industries. Periodic downturns in economic conditions usually have a significant adverse effect on cyclical industries due to decreased demand for new and replacement products. Decreased demand could result in lower sales volumes, lower prices, and/or a decline in or loss of profits. The railcar industry has previously experienced sharp cyclical downturns and at such times operated with a minimal backlog. While the business cycles of our different operations may not typically coincide, an economic downturn could affect disparate cycles simultaneously. The impacts of such an economic downturn may magnify the adverse effect on our business.
Volatility in the global markets or in industries that our products serve may adversely affect our business and operating results.
Instability in the global economy, negative conditions in the global credit markets, volatility in the industries that our products serve, fluctuations in commodity prices that our customers produce and transport, changes in legislative or trade policy, adverse changes in the availability of raw materials and supplies, or adverse changes in the financial condition of our customers could lead to customers' requests for deferred deliveries of our backlog orders. Additionally, such events could result in our customers' attempts to unilaterally cancel or terminate firm contracts or orders in whole or in part, resulting in contract or purchase order breaches and increased commercial litigation costs. Such occurrences could adversely affect our cash flows and results of operations.
11
If volatile conditions in the global credit markets prevent our customers' access to credit, product order volumes may decrease or customers may default on payments owed to us. Likewise, if our suppliers face challenges obtaining credit, selling their products to customers that require purchasing credit, or otherwise operating their businesses, the supply of materials we purchase from them to manufacture our products may be interrupted. Any of these conditions or events could result in reductions in our revenues, increased price competition, or increased operating costs, which could adversely affect our business, results of operations, and financial condition.
Litigated disputes and other claims could increase our costs and weaken our financial condition.
We are currently, and may from time to time be involved in various claims or legal proceedings arising out of our operations. Adverse judgments and outcomes in some or all of these matters could result in significant losses and costs that could weaken our financial condition. Although we maintain reserves for our reasonably estimable liability, our reserves may be inadequate to cover our portion of claims or final judgments after taking into consideration rights in indemnity and recourse to third parties. As a result, there could be a material adverse effect on our business, operations, or financial condition. See Note 15 of the Consolidated Financial Statements for more detailed information on any material pending legal proceedings other than ordinary routine litigation incidental to our business, including the current status of the Company's highway products litigation.
While state and federal procedural rules exist to curtail the filing of claims against the Company in jurisdictions unrelated to the underlying claims, courts sometime may not enforce these rules, exposing us to a greater likelihood of unfavorable results and increased litigation costs. Whenever our products are sold to or ultimately owned and/or operated by governments or their authorized agencies, we may be unable to seek redress or recourse to at-fault parties. When litigation arising from the installation, maintenance, replacement, or use of our products is filed against the Company, recourse to such governments or authorized agencies may be subject to sovereign immunity or related defenses thereby exposing the Company to risk of liability and increased costs irrespective of fault.
Changes in the price and demand for steel could lower our margins and profitability.
The principal material used in our manufacturing segments is steel. Market steel prices may exhibit periods of volatility. Steel prices may experience further volatility as a result of scrap surcharges assessed by steel mills and other market factors. We often use contract-specific purchasing practices, supplier commitments, contractual price escalation provisions, and other arrangements with our customers to mitigate the effect of this volatility on our operating profits for the year. To the extent that we do not have such arrangements in place, a change in steel prices could materially lower our profitability. In addition, meeting production demands is dependent on our ability to obtain a sufficient amount of steel. An unanticipated interruption in our supply chain could have an adverse impact on both our margins and production schedules.
We have potential exposure to environmental liabilities that may increase costs and lower profitability.
We are subject to comprehensive federal, state, local, and foreign environmental laws and regulations relating to: (i) the release or discharge of materials into the environment at our facilities or with respect to our products while in operation; (ii) the management, use, processing, handling, storage, transport, and disposal of hazardous and non-hazardous waste, substances, and materials; and (iii) other activities relating to the protection of human health and the environment. Such laws and regulations expose us to liability for our own acts and in certain instances potentially expose us to liability for the acts of others. These laws and regulations also may impose liability on us currently under circumstances where at the time of the action taken, our acts or those of others complied with then applicable laws and regulations. In addition, such laws may require significant expenditures to achieve compliance, and are frequently modified or revised to impose new obligations. Civil and criminal fines and penalties may be imposed for non-compliance with these environmental laws and regulations. Our operations involving hazardous materials also raise potential risks of liability under common law.
Environmental operating permits are, or may be, required for our operations under these laws and regulations. These operating permits are subject to modification, renewal, and revocation. Although we regularly monitor and review our operations, procedures, and policies for compliance with our operating permits and related laws and regulations, the risk of environmental liability is inherent in the operation of our businesses, as it is with other companies operating under environmental permits.
However, future events, such as changes in, or modified interpretations of, existing environmental laws and regulations or enforcement policies, or further investigation or evaluation of the potential health hazards associated with the manufacture of our products and related business activities and properties, may give rise to additional compliance and other costs that could have a material adverse effect on our financial condition and operations.
12
In addition to environmental laws, the transportation of commodities by railcar raises potential risks in the event of an accident that results in the release of an environmentally sensitive substance. Generally, liability under existing laws for a derailment or other accident depends upon causation analysis and the acts, errors, or omissions, if any, of a party involved in the transportation activity, including, but not limited to, the railroad, the shipper, the buyer and seller of the substances being transported, or the manufacturer of the railcar, or its components. Additionally, the severity of injury or property damage arising from an incident may influence the causation responsibility analysis, exposing the Company to potentially greater liability. Under certain circumstances, strict liability concepts may apply and if we are found liable in any such incident, it could have a material adverse effect on our financial condition, business, and operations.
We operate in highly competitive industries. We may not be able to sustain our market leadership positions, which may impact our financial results.
We face aggressive competition in all geographic markets and each industry sector in which we operate. In addition to price, we face competition in respect to product performance and technological innovation, quality, reliability of delivery, customer service, and other factors. The effects of this competition, which is often intense, could reduce our revenues and operating profits, limit our ability to grow, increase pricing pressure on our products, and otherwise affect our financial results.
The limited number of customers for certain of our products, the variable purchase patterns of our customers in all of our segments, and the timing of completion, delivery, and customer acceptance of orders may cause our revenues and income from operations to vary substantially each quarter, potentially resulting in significant fluctuations in our quarterly results.
Some of the markets we serve have a limited number of customers. The volumes purchased by customers in each of our business segments vary from year to year, and not all customers make purchases every year. As a result, the order levels for our products have varied significantly from quarterly period to quarterly period in the past and may continue to vary significantly in the future. Therefore, our results of operations in any particular quarterly period may also vary. As a result of these quarterly fluctuations, we believe that comparisons of our sales and operating results between quarterly periods may not be meaningful and should not be relied upon as indicators of future performance.
Our access to capital may be limited or unavailable due to deterioration of conditions in the global capital markets, weakening of macroeconomic conditions, and negative changes in our credit ratings.
In general, the Company, and more specifically its leasing subsidiaries' operations, relies in large part upon banks and capital markets to fund its operations and contractual commitments and refinance existing debt. These markets can experience high levels of volatility and access to capital can be constrained for extended periods of time. In addition to conditions in the capital markets, a number of other factors could cause the Company to incur increased borrowing costs and have greater difficulty accessing public and private markets for both secured and unsecured debt. These factors include the Company's financial performance and its credit ratings and rating outlook as determined primarily by rating agencies such as Standard & Poor's Financial Services LLC, Moody's Investors Service, Inc., and Fitch Ratings, Inc. If the Company is unable to secure financing on acceptable terms, the Company's other sources of funds, including available cash, bank facilities, and cash flow from operations may not be adequate to fund its operations and contractual commitments and refinance existing debt.
We have indebtedness which could have negative consequences on our business or results of operations.
We have indebtedness both at the parent level and at the subsidiary level. Our level of indebtedness could have a material adverse effect on our business and make it more difficult for us to satisfy our obligations under our outstanding indebtedness and notes. As a result of our debt and debt service obligations, we face increased risks regarding, among other things, the following: (i) borrowing additional amounts or refinancing existing indebtedness may be limited or more costly; (ii) our available cash flow after satisfying our debt obligations due to a portion of our cash flow being needed to pay principal and interest on our debt; (iii) being at a competitive disadvantage relative to our competitors that have greater financial resources or more flexible capital structures than us; (iv) our exposure to increased interest rates for our borrowings that are at variable interest rates; (v) restrictive covenants under our indebtedness restricting our financial and operating flexibility; and (iv) although the parent entity has not secured any debt with its assets, our subsidiaries that have issued debt have pledged their specific assets to secure such indebtedness, and such assets could be foreclosed upon in connection with an event of default.
13
The phaseout of the London Interbank Offered Rate (LIBOR) and the replacement of LIBOR with a different reference rate may have an adverse effect on our business.
On July 27, 2017, the United Kingdom’s Financial Conduct Authority (the authority that regulates LIBOR) announced that it would phase out LIBOR by the end of 2021. Certain of our and our subsidiaries’ indebtedness utilize LIBOR or an alternative benchmark reference rate for calculating the applicable interest rate. After LIBOR is phased out, the interest rates for these obligations might be subject to change. The replacement of LIBOR with an alternative benchmark or lender calculated index rate may adversely affect interest rates and result in higher borrowing costs under these agreements and any future agreements. This could materially and adversely affect our results of operations, cash flows, ability to acquire debt financing, and liquidity. We cannot predict the effect of the elimination of LIBOR or the establishment and use of alternative benchmark reference rates and the corresponding effects on our cost of capital.
We may be unable to maintain railcar assets on lease at satisfactory lease rates.
The profitability of our railcar leasing business depends on our ability to lease railcars at satisfactory lease rates, to re-lease railcars at satisfactory lease rates upon the expiration and non-renewal of existing leases, and to sell railcars in the secondary market as part of our ordinary course of business. Our ability to accomplish these objectives is dependent upon several factors, including, among others:
•the cost of and demand for leases or ownership of newer or specific-use railcar types;
•the general availability in the market of competing used or new railcars;
• | the degree of obsolescence of leased or unleased railcars, including railcars subject to regulatory obsolescence; |
• | the prevailing market and economic conditions, including the availability of credit, interest rates, and inflation rates; |
•the market demand or governmental mandate for refurbishment; and
•the volume and nature of railcar traffic and loadings.
A downturn in the industries in which our lessees operate and decreased demand for railcars could also increase our exposure to re-marketing risk because lessees may demand shorter lease terms or newer railcars, requiring us to re-market leased railcars more frequently. Furthermore, the resale market for previously leased railcars has a limited number of potential buyers. Our inability to re-lease or sell leased or unleased railcars on favorable terms could result in lower lease rates, lower lease utilization percentages, and reduced revenues and operating profit.
Fluctuations in the price and supply of raw materials and parts and components used in the production of our products could have a material adverse effect on our ability to cost-effectively manufacture and sell our products. In some instances, we rely on a limited number of suppliers for certain raw materials and parts and components needed in our production.
A significant portion of our business depends on the adequate supply of numerous specialty and other parts and components at competitive prices such as brakes, wheels, side frames, bolsters, and bearings for the railcar business. Our manufacturing operations partially depend on our ability to obtain timely deliveries of raw materials, parts, and components in acceptable quantities and quality from our suppliers. Certain raw materials and parts and components for our products are currently available from a limited number of suppliers and, as a result, we may have limited control over pricing, availability, and delivery schedules. If we are unable to purchase a sufficient quantity of raw materials and parts and components on a timely basis, we could face disruptions in our production and incur delays while we attempt to engage alternative suppliers. Worsening economic or commercial conditions could reduce the number of available suppliers, potentially increasing our rejections for poor quality and requiring us to source unknown and distant supply alternatives. Any such disruption or conditions could harm our business and adversely impact our results of operations.
14
Reductions in the availability of energy supplies or an increase in energy costs may increase our operating costs.
We use various gases, including natural gas, at our manufacturing facilities and use diesel fuel in vehicles to transport our products to customers and to operate our plant equipment. An outbreak or escalation of hostilities between the U.S. and any foreign power and, in particular, prolonged conflicts could result in a real or perceived shortage of petroleum and/or natural gas, which could result in an increase in the cost of natural gas or energy in general. Extreme weather conditions and natural occurrences such as hurricanes, tornadoes, and floods, or a pandemic, could result in varying states of disaster and a real or perceived shortage of petroleum and/or natural gas, including rationing thereof, potentially resulting in an increase in natural gas prices or general energy costs. Speculative trading in energy futures in the world markets could also result in an increase in natural gas and general energy cost. Future limitations on the availability (including limitations imposed by increased regulation or restrictions on rail, road, and pipeline transportation of energy supplies) or consumption of petroleum products and/or an increase in energy costs, particularly natural gas for plant operations and diesel fuel for vehicles and plant equipment, could have an adverse effect upon our ability to conduct our business cost effectively.
Our manufacturer's warranties expose us to product replacement and repair claims.
Depending on the product, we warrant our workmanship and certain materials (including surface coatings, primers, sealants, and interior linings), parts, and components pursuant to express limited contractual warranties. We may be subject to significant warranty claims in the future such as multiple claims based on one defect repeated throughout our production process or claims for which the cost of repairing or replacing the defective part, component or material is highly disproportionate to the original price. These types of warranty claims could result in significant costs associated with product recalls or product repair or replacement, and damage to our reputation.
Increasing insurance claims and expenses could lower profitability and increase business risk.
We are subject to potential liability for claims alleging property damage and personal and bodily injury or death arising from the use of or exposure to our products, especially in connection with products we manufacture that our customers install along U.S. highways or that our customers use to transport hazardous, flammable, toxic, or explosive materials. As insurance policies expire, premiums for renewed or new coverage may increase and/or require that we increase our self-insured retention or deductibles. The Company maintains primary coverage and excess coverage policies. If the number of claims or the dollar amounts of any such claims rise in any policy year, we could suffer additional costs associated with accessing our excess coverage policies. Also, an increase in the loss amounts attributable to such claims could expose us to uninsured damages if we were unable or elected not to insure against certain claims because of high premiums or other reasons. While our liability insurance coverage is at or above typical levels for our industries, an unusually large liability claim or a string of claims coupled with an unusually large damage award could exceed our available insurance coverage. In addition, the availability of, and our ability to collect on, insurance coverage is often subject to factors beyond our control, including positions on policy coverage taken by insurers. If any of our third-party insurers fail, cancel, or refuse coverage, or otherwise are unable to provide us with adequate insurance coverage, then our risk exposure and our operational expenses may increase and the management of our business operations would be disrupted. Moreover, any accident or incident involving our industries in general or us or our products specifically, even if we are fully insured, contractually indemnified, or not held to be liable, could negatively affect our reputation among customers and the public, thereby making it more difficult for us to compete effectively, and could significantly affect the cost and availability of insurance in the future.
Many of our products are sold to leasing companies, contractors, distributors, and installers who may misuse, abuse, improperly install or improperly or inadequately maintain or repair such products thereby potentially exposing the Company to claims that could increase our costs and weaken our financial condition.
The products we manufacture are designed to work optimally when properly assembled, operated, installed, repaired, and maintained. When this does not occur, the Company may be subjected to claims or litigation associated with personal or bodily injuries or death and property damage.
15
Risks related to our operations outside of the U.S., particularly Mexico, could decrease our profitability.
Our operations outside of the U.S. are subject to the risks associated with cross-border business transactions and activities. Political, legal, trade, economic change or instability, criminal activities or social unrest could limit or curtail our respective foreign business activities and operations, including the ability to hire and retain employees. We have not, to date, been materially affected by any of these risks, but we cannot predict the likelihood of future effects from such risks or any resulting adverse impact on our business, results of operations or financial condition. Many items manufactured by us in Mexico are sold in the U.S. and the transportation and import of such products may be disrupted. Some foreign countries where we operate have regulatory authorities that regulate products sold or used in those countries. If we fail to comply with the applicable regulations within the foreign countries where we operate, we may be unable to market and sell our products in those countries. In addition, with respect to operations in foreign countries, unexpected changes in laws, rules, and regulatory requirements; tariffs and other trade barriers, including regulatory initiatives for buying goods produced in America; more stringent or restrictive laws, rules, and regulations relating to labor or the environment; adverse tax consequences; price exchange controls; and restrictions or regulations affecting cross-border rail and vehicular traffic could limit operations affecting production throughput and making the manufacture and distribution of our products less timely or more difficult. Furthermore, any material change in the quotas, regulations, or duties on imports imposed by the U.S. government and agencies, or on exports by the government of Mexico or its agencies, could affect our ability to export products that we manufacture in Mexico. Because we have operations outside the U.S., we could be adversely affected by final judgments of non-compliance with the U.S. Foreign Corrupt Practices Act or import/export rules and regulations and similar anti-corruption, anti-bribery, or import/export laws of other countries.
U.S. government actions relative to the federal budget, taxation policies, government expenditures, U.S. borrowing/debt ceiling limits, and trade policies could adversely affect our business and operating results.
Periods of impasse, deadlock, and last minute accords may continue to permeate many aspects of U.S. governance, including federal government budgeting and spending, taxation, U.S. deficit spending and debt ceiling adjustments, and international commerce. Such periods could negatively impact U.S. domestic and global financial markets thereby reducing customer demand for our products and services and potentially result in reductions in our revenues, increased price competition, or increased operating costs, any of which could adversely affect our business, results of operations, and financial condition. We produce many of our products at our manufacturing facilities in Mexico. Our business benefits from free trade agreements such as the North American Free Trade Agreement ("NAFTA"). The United States, Mexico, and Canada have reached a U.S.-Mexico-Canada Agreement ("USMCA") which would replace NAFTA. The USMCA would maintain duty-free access for many products. The USMCA still requires approval from Canada's Parliament before it takes effect. It is uncertain what the outcome of any further negotiations will be, but it is possible that additional revisions to the USMCA or failure to secure approvals could adversely affect our business, financial condition, and results of operations.
Equipment failures, a pandemic, or extensive damage to our facilities, including as might occur as a result of natural disasters, could lead to production, delivery, or service curtailments or shutdowns, loss of revenue or higher expenses.
We operate a substantial amount of equipment at our production facilities, several of which are situated in tornado and hurricane zones in the U.S. and Mexico. An interruption in production capabilities or maintenance and repair capabilities at our facilities, as a result of equipment failures, a pandemic, or acts of nature, could reduce or prevent our production, delivery, service, or repair of our products and increase our costs and expenses. A halt of production at any of our manufacturing facilities could severely affect delivery times to our customers. While we maintain emergency response and business recovery plans that are intended to allow us to recover from natural disasters that could disrupt our business, we cannot provide assurances that our plans would fully protect us from the effects of all such disasters. In addition, insurance may not adequately compensate us for any losses incurred as a result of natural or other disasters, which may adversely affect our financial condition. Any significant delay in deliveries not otherwise contractually mitigated by favorable force majeure provisions could result in cancellation of all or a portion of our orders, cause us to lose future sales, and negatively affect our reputation and our results of operations.
Because we do not have employment contracts with our key management employees, we may not be able to retain their services in the future.
Our success depends on the continued services of our key management employees, none of whom currently have an employment agreement with us. The loss of the services of one or more key members of our management team could result in increased costs associated with attracting and retaining a replacement and could disrupt our operations and result in a loss of revenues.
16
Repercussions from terrorist activities or armed conflict could harm our business.
Terrorist activities, anti-terrorist efforts, and other armed conflict involving the U.S. or its interests abroad may adversely affect the U.S. and global economies, potentially preventing us from meeting our financial and other obligations. In particular, the negative impacts of these events may affect the industries in which we operate. This could result in delays in or cancellations of the purchase of our products or shortages in raw materials, parts or components. Any of these occurrences could have a material adverse impact on our operating results, revenues, and costs.
Violations of or changes in the regulatory requirements applicable to the industries in which we operate may increase our operating costs.
Our leasing and railcar manufacturing businesses are regulated by multiple governmental regulatory agencies such as the USEPA; TC; the USDOT and the administrative agencies it oversees, including the FRA, the PHMSA, and the Research and Special Programs Administration; Mexico's Agencia Reguladora del Transporte Ferroviario; Mexico's Secretaria de Comunicaciones y Transportes; and industry authorities such as the AAR. All such agencies and authorities promulgate rules, regulations, specifications, or operating standards affecting railcar design, configuration, and mechanics; maintenance, and rail-related safety standards for railroad equipment, tracks, and operations, including the packaging and transportation of hazardous, flammable, explosive, and toxic materials.
Revised regulations implemented in 2015 pertaining to the transportation of flammable materials by rail remain in effect. These regulatory changes materially impact: the rail industry as a whole; railroad operations; older and newer tank railcars that met or exceeded prior regulatory requirements and standards; future tank railcar specifications; and market decisions relative to capital investment in rail products.
Our highway products business is subject to regulation by the USDOT, the FHWA, and various state highway departments and administrative agencies. These organizations, with participation from AASHTO, establish certain specifications, product testing criteria, and performance standards related to the manufacture of our highway products.
Our operations are also subject to regulation of health and safety matters by the U.S. OSHA and Mexico's STPS. We believe we employ appropriate precautions to protect our employees and others from workplace injuries and harmful exposure to materials handled and managed at our facilities.
Future regulatory changes or the determination that our products or processes are not in compliance with applicable requirements, rules, regulations, specifications, standards, or product testing criteria might result in additional operating expenses, administrative fines or penalties, product recalls or loss of business that could have a material adverse effect on our financial condition and operations.
Some of our customers place orders for our products (i) in reliance on their ability to utilize tax benefits or tax credits such as accelerated depreciation, or (ii) to utilize federal-aid programs that allow for purchase price reimbursement or other government funding or subsidies, any of which benefits or programs could be discontinued or allowed to expire without extension thereby reducing demand for certain of our products.
There is no assurance that the U.S. government will reauthorize, modify, or otherwise not allow the expiration of such tax benefits, subsidies, or federal-aid programs that may include funding of the purchase or purchase price reimbursement of certain of our products. In instances where such benefits, subsidies, or programs are allowed to expire or are otherwise modified or discontinued, the demand for our products could decrease, thereby creating the potential for a material adverse effect on our financial condition or results of operations.
We may be required to reduce the value of our long-lived assets and/or goodwill, which would weaken our financial results.
We periodically evaluate for potential impairment the carrying values of our long-lived assets to be held and used. The carrying value of a long-lived asset to be held and used is considered impaired when the carrying value is not recoverable through undiscounted future cash flows and the fair value of the asset is less than the carrying value. Fair value is determined primarily using the anticipated cash flows discounted at a rate commensurate with the risks involved or market quotes as available. Impairment losses on long-lived assets held for sale are determined in a similar manner, except that fair values are reduced commensurate with the estimated cost to dispose of the assets. In addition, goodwill is required to be tested for impairment annually or on an interim basis whenever events or circumstances change indicating that the carrying amount of the goodwill might be impaired. Impairment losses related to reductions in the value of our long-lived assets or our goodwill could weaken our financial condition and results of operations.
17
We may incur increased costs due to fluctuations in interest rates and foreign currency exchange rates.
We are exposed to risks associated with fluctuations in interest rates and changes in foreign currency exchange rates. Under varying circumstances, we may seek to minimize these risks through the use of interest rate hedges and similar financial instruments and other activities, although these measures, if and when implemented, may not be effective. Any material and untimely changes in interest rates or exchange rates could result in significant losses to us.
Railcars as a significant mode of transporting freight could decline, experience a shift in types of modal transportation, and/or certain railcar types could become obsolete.
As the freight transportation markets we serve continue to evolve, the use of railcars may decline in favor of other more economic transportation modalities or the number of railcars needed to transport current or an increasing volume of goods may decline. Features and functionality specific to certain railcar types could result in those railcars becoming obsolete as customer requirements for freight delivery change or as regulatory mandates are promulgated that affect railcar design, configuration, and manufacture.
Business, regulatory, and legal developments regarding climate change may affect the demand for our products or the ability of our critical suppliers to meet our needs.
We have followed the current debate over climate change in general, and the related science, policy discussion, and prospective legislation. Some scientific studies have suggested that emissions of certain gases, commonly referred to as greenhouse gases (“GHGs”) which include carbon dioxide and methane, may be contributing to warming of the Earth’s atmosphere and other climate changes. Additionally, we periodically review the potential challenges and opportunities for the Company that climate change policy and legislation may pose. However, any such challenges or opportunities are heavily dependent on the nature and degree of climate change legislation and the extent to which it applies to our industries.
In response to an emerging scientific and political consensus, legislation and new rules to regulate emission of GHGs have been introduced in numerous state legislatures, the U.S. Congress, and by the USEPA. Some of these proposals would require industries to meet stringent new standards that may require substantial reductions in carbon emissions. While Trinity cannot assess the direct impact of these or other potential regulations, it does recognize that new climate change protocols could affect demand for its products and/or affect the price of materials, input factors, and manufactured components. Potential opportunities could include greater demand for certain types of railcars, while potential challenges could include decreased demand for certain types of railcars or other products and higher energy costs. Other adverse consequences of climate change could include an increased frequency of severe weather events and rising sea levels that could affect operations at our manufacturing facilities, the price of insuring company assets, or other unforeseen disruptions of the Company’s operations, systems, property, or equipment. Ultimately, when or if these impacts may occur cannot be assessed until scientific analysis and legislative policy are more developed and specific legislative proposals begin to take shape.
Changes in accounting standards or inaccurate estimates or assumptions in the application of accounting policies could adversely affect our financial results.
Our accounting policies and methods are fundamental to how we record and report our financial condition and results of operations. Some of these policies require the use of estimates and assumptions that may affect the reported value of our assets or liabilities and financial results and are critical because they require management to make difficult, subjective, and complex judgments about matters that are inherently uncertain. Accounting standard setters and those who interpret the accounting standards (such as the Financial Accounting Standards Board, the SEC, the Public Company Accounting Oversight Board, and our independent registered public accounting firm) may amend or even reverse their previous interpretations or positions on how these standards should be applied. These changes can be difficult to predict and can materially impact how we record and report our financial condition and results of operations. In some cases, we could be required to apply a new or revised standard retroactively, resulting in the restatement of prior period financial statements. For a further discussion of some of our critical accounting policies and standards and recent accounting changes, see Critical Accounting Policies and Estimates in Management's Discussion and Analysis of Financial Condition and Results of Operations and Note 1 of the Consolidated Financial Statements.
Shortages of skilled labor could adversely impact our operations.
We depend on skilled labor in the manufacture, maintenance, and repair of our products. Some of our facilities are located in areas where demand for skilled laborers may exceed supply. Shortages of some types of skilled laborers, such as welders, could restrict our ability to maintain or increase production rates and could increase our labor costs.
18
Some of our employees belong to labor unions, and strikes or work stoppages could adversely affect our operations.
We are a party to collective bargaining agreements with various labor unions at some of our operations in the U.S. and all of our operations in Mexico. Disputes with regard to the terms of these agreements or our potential inability to negotiate acceptable contracts with these unions in the future could result in, among other things, strikes, work stoppages or other slowdowns by the affected workers. We cannot be assured that our relations with our workforce will remain positive or that union organizers will not be successful in future attempts to organize at some of our facilities. If our workers were to engage in a strike, work stoppage or other slowdown, or other employees were to become unionized, or the terms and conditions in future labor agreements were renegotiated, we could experience a significant disruption of our operations and higher ongoing labor costs. In addition, we could face higher labor costs in the future as a result of severance or other charges associated with lay-offs, shutdowns, or reductions in the size and scope of our operations or difficulties of restarting our operations that have been temporarily shuttered.
From time to time we may take tax positions that the Internal Revenue Service or other taxing jurisdictions may contest.
We have in the past and may in the future take tax positions that the Internal Revenue Service (“IRS”) or other taxing jurisdictions may challenge. We are required to disclose to the IRS as part of our tax returns particular tax positions in which we have a reasonable basis for the position but not a "more likely than not" chance of prevailing. If the IRS successfully contests a tax position that we take, we may be required to pay additional taxes or fines which may not have been previously accrued that may adversely affect our results of operations and financial position.
Our inability to produce and disseminate relevant and/or reliable data and information pertaining to our business in an efficient, cost-effective, secure, and well-controlled fashion may have significant negative impacts on confidentiality requirements and obligations and trade secret or other proprietary needs and expectations and, therefore, our future operations, profitability, and competitive position.
We rely on information technology infrastructure and architecture, including hardware, network, software, people, and processes to provide useful and confidential information to conduct our business. This includes correspondence and commercial data and information interchange with customers, suppliers, legal counsel, governmental agencies, and consultants, and to support assessments and conclusions about future plans and initiatives pertaining to market demands, operating performance, and competitive positioning. In addition, any material failure, interruption of service, compromised data security, phishing emails, or cybersecurity threat could adversely affect our relations with suppliers and customers, place us in violation of confidentiality and data protection laws, rules, and regulations, and result in negative impacts to our market share, operations, and profitability. Security breaches in our information technology could result in theft, destruction, loss, misappropriation, or release of confidential data, trade secret, or other proprietary or intellectual property that could adversely impact our future results.
We may be unable to effectively implement organizational redesigns, cost reductions, or restructuring efforts and our business might be adversely affected.
From time to time we engage in organizational redesigns, cost reductions, and/or similar restructuring plans (we announced one most recently in the fourth quarter of 2019), which may include organizational changes, workforce reductions, facility consolidations or closures, and other cost reduction initiatives. These types of activities are complex and can require a significant amount of management and other employees’ time and focus, which may divert attention from operating and growing our business. If we do not effectively manage and implement these activities, or any future similar activities, expected efficiencies and benefits might be delayed or not realized, and our operations and business could be disrupted. Risks associated with these actions include potential adverse effects on employee morale, loss of accumulated knowledge and/or inefficiency, unfavorable political responses to such actions, unforeseen delays in implementation, unexpected costs, and the failure to meet operational targets, any of which may impair our ability to achieve anticipated benefits, harm our business, or have a material adverse effect on our competitive position, results of operations, cash flows or financial condition.
The Company could potentially fail to successfully integrate new businesses or products into its current business.
The Company routinely engages in the search for growth opportunities, including assessment of merger and acquisition prospects in new markets and/or products. Any merger or acquisition into which the Company enters is subject to integration into the Company's businesses and culture. If such integration is unsuccessful to any material degree, such lack of success could result in unexpected claims or otherwise have a material adverse effect on our business, operations, or financial condition.
19
The use of social and other digital media (including websites, blogs and newsletters) to disseminate false, misleading and/or unreliable or inaccurate data and information about our Company could create unwarranted volatility in our stock price and losses to our stockholders and could adversely affect our reputation, products, business, and operating results.
The number of people relying on social and other digital media to receive news, data, and information is increasing. Social and other digital media can be used by anyone to publish data and information without regard for factual accuracy. The use of social and other digital media to publish inaccurate, offensive, and disparaging data and information coupled with the increasingly frequent use of strong language and hostile expression, may influence the public’s inability to distinguish between what is true and what is false and could obstruct an effective and timely response to correct inaccuracies or falsifications. Such use of social and other digital media could result in unexpected and unsubstantiated claims concerning the Company in general or our products, our leadership or our reputation among customers and the public at large, thereby making it more difficult for us to compete effectively, and potentially having a material adverse effect on our business, operations, or financial condition.
Our inability to sufficiently protect our intellectual property rights could adversely affect our business.
Our patents, copyrights, trademarks, service marks, trade secrets, proprietary processes, and other intellectual property are important to our success. We rely on patent, copyright and trademark law, trade secret protection, and confidentiality and/or license agreements with others to protect our intellectual property rights. Our trademarks, service marks, copyrights, patents, and trade secrets may be exposed to market confusion, commercial abuse, infringement, or misappropriation and possibly challenged, invalidated, circumvented, narrowed, or declared unenforceable by countries where our products and services are made available, but where the laws may not protect our intellectual property rights as fully as in the U.S. Such instances could negatively impact our competitive position and adversely affect our business. Additionally, we could be required to incur significant expenses to protect our intellectual property rights.
Risks Related to our Common Stock
The price for our common stock is subject to volatility which may result in losses to our shareholders.
Stock price volatility affects the price at which our common stock can be sold and could subject our stockholders to losses. The trading price of our common stock could fluctuate widely in response to, among other things, the risk factors described in this report and other factors including:
• | actual or anticipated variations in quarterly and annual results of operations; |
• | changes in recommendations by securities analysts; |
• | changes in composition and perception of the investors who own our stock and other securities; |
• | changes in ratings from national rating agencies on publicly or privately owned debt securities; |
• | operating and stock price performance of other companies that investors deem comparable to us; |
• | news reports relating to trends, concerns and other issues in the industries in which we operate; |
• | actual or expected economic conditions that are perceived to affect our Company; |
• | perceptions in the marketplace regarding us and/or our competitors; |
• | fluctuations in prices of commodities that our customers produce and transport; |
• | significant acquisitions or business combinations, strategic partnerships, joint ventures, or capital commitments by or involving us or our competitors; |
• | changes in government regulations and policies and interpretations of those regulations and policies; |
• | shareholder activism; and |
• | dissemination of false or misleading statements through the use of social and other media to discredit our Company, disparage our products, or to harm our reputation. |
Additionally, in the past, following periods of volatility in the market price of a public company’s securities, securities class action litigation has often been initiated. Any such litigation could result in substantial costs and a diversion of management’s attention and resources. We cannot predict the outcome of any such litigation. The initiation of any such litigation or an unfavorable result could have a material adverse effect on our financial condition and results of operations. See Note 15 of the Consolidated Financial Statements for more detailed information on any material pending legal proceedings other than ordinary routine litigation incidental to our business, including the current status of the Company's Highway Products litigation.
20
There can be no assurance that we will continue to pay dividends or repurchase shares of our common stock at current levels.
Although we have paid regular cash dividends for many years and conduct periodic share repurchase programs, the timing, amount and payment of future dividends to stockholders and repurchases of our common stock fall within the discretion of our Board of Directors (the "Board"). The Board’s decisions regarding the payment of dividends and repurchase of shares depend on many factors such as our financial condition, earnings, capital requirements, debt service obligations, legal requirements, regulatory constraints, and other factors that our Board may deem relevant. We cannot guarantee that we will continue to pay dividends, the amount of any such dividends, or that we will continue to repurchase shares in the future. Any payment of dividends or repurchases of shares could vary from historical practices and our stated expectations.
A small number of shareholders could significantly influence our business.
One shareholder controls more than 20% of our outstanding common stock. Accordingly, a small number of shareholders could affect matters that require shareholder approval, such as the election of directors and the approval of significant business transactions.
Risks Related to the Spin-Off of Arcosa
We may not achieve some or all of the expected benefits of the spin-off, and the spin-off may adversely affect our business.
We may not be able to achieve the full strategic and financial benefits expected to result from the spin-off, or such benefits may be delayed or not occur at all. The spin-off is expected to provide the following benefits, among others:
• | allow us to more effectively pursue our own distinct operating priorities and strategies, and enable our management to pursue opportunities for long-term growth and profitability, and to recruit, retain and motivate employees pursuant to compensation policies which are appropriate for our lines of business; |
• | permit us to concentrate our financial resources solely on our own operations, providing greater flexibility to invest capital in our business in a time and manner appropriate for our distinct strategy and business needs; and |
• | enable investors to evaluate the merits, performance and future prospects of our businesses and to invest in us separately based on these distinct characteristics. |
We may not achieve these or other anticipated benefits for a variety of reasons, including, among others: (a) following the spin-off, Trinity's stock price may be more susceptible to market fluctuations and other events particular to one or more of Trinity's products than if Arcosa were still a part of Trinity; and (b) following the spin-off, our operational and financial profiles have changed such that our diversification of revenue sources has diminished, and our results of operations, cash flows, working capital, and financing requirements may be subject to increased volatility than prior to the spin-off. Additionally, we may experience unanticipated competitive developments, including changes in the conditions of our rail-related businesses' market that could negate the expected benefits from the spin-off. If we do not realize some or all of the benefits expected to result from the spin-off, or if such benefits are delayed, the business, financial condition, and results of operations and cash flows of Trinity could be adversely affected.
Either Arcosa or Trinity may fail to perform under various transaction agreements that were executed as part of the spin-off.
Arcosa and Trinity have entered into certain agreements, including a separation and distribution agreement, a transition services agreement, and certain other agreements, which provide for the performance by each company for the benefit of the other for a period of time after the spin-off. If either company is unable to satisfy its obligations under these agreements, including its indemnification obligations, the other company could incur operational difficulties or losses.
Potential indemnification liabilities to Arcosa pursuant to the separation and distribution agreement could materially and adversely affect Trinity's business, financial condition, results of operations and cash flows.
The separation and distribution agreement, among other things, provides for indemnification obligations designed to make Trinity financially responsible for certain liabilities that may exist relating to its business activities. If Trinity is required to indemnify Arcosa under the circumstances set forth in the separation and distribution agreement, Trinity may be subject to substantial liabilities.
21
In connection with the spin-off, Arcosa agreed to indemnify Trinity for certain liabilities. However, there can be no assurance that the indemnity will be sufficient to insure Trinity against the full amount of such liabilities, or that Arcosa's ability to satisfy its indemnification obligation will not be impaired in the future.
Arcosa agreed to indemnify Trinity for certain liabilities. However, third parties could also seek to hold Trinity responsible for liabilities that Arcosa has agreed to assume, and there can be no assurance that the indemnity from Arcosa will be sufficient to protect Trinity against the full amount of such liabilities, or that Arcosa will be able to fully satisfy its indemnification obligations. In addition, insurers may attempt to deny coverage to Trinity for liabilities associated with certain occurrences of indemnified liabilities prior to the spin-off.
If the distribution of shares of Arcosa, together with certain related transactions, does not qualify as a transaction that is generally tax-free for U.S. federal income tax purposes, Trinity stockholders at the time of the distribution and Trinity could be subject to significant tax liability.
In connection with the distribution of shares in Arcosa, we obtained a private letter ruling from the IRS (the "IRS Ruling") and opinions from tax advisors (the "Tax Opinions"), in each case substantially to the effect that, among other things, the distribution of shares in Arcosa, together with certain related transactions, qualify as tax-free for U.S. federal income tax purposes under Sections 368(a)(1)(D) and 355 of the U.S. Internal Revenue Code of 1986, as amended (the “Code”). The IRS Ruling and the Tax Opinions rely on certain facts, assumptions, representations, and undertakings from Trinity and Arcosa, including those regarding the past and future conduct of the companies' respective businesses and other matters. Notwithstanding the IRS Ruling and the Tax Opinions, the IRS could determine that the distribution or any such related transaction is taxable if it determines that any of these facts, assumptions, representations or undertakings are not correct or have been violated, or that the distribution should be taxable for other reasons, including if the IRS were to disagree with the conclusions in the Tax Opinions that are not covered by the IRS Ruling.
If the distribution is determined to be taxable for U.S. federal income tax purposes, a stockholder of Trinity that has received shares of Arcosa common stock in the distribution would be treated as having received a distribution of property in an amount equal to the fair value of such Arcosa shares on the distribution date and could incur significant income tax liabilities. Such distribution would be taxable to such stockholder as a dividend to the extent of Trinity's current and accumulated earnings and profits. Any amount that exceeded Trinity's earnings and profits would be treated first as a non-taxable return of capital to the extent of such stockholder’s tax basis in its shares of Trinity stock, with any remaining amount being taxed as capital gain. Trinity would recognize a taxable gain in an amount equal to the excess, if any, of the fair market value of the shares of Arcosa common stock held by Trinity on the distribution date over Trinity's tax basis in such shares. In addition, if certain related transactions fail to qualify for tax-free treatment under federal, state and local tax law and/or foreign tax law, Trinity could incur significant tax liabilities under U.S. federal, state, local and/or foreign tax law.
The spin-off and related internal restructuring transactions may expose us to potential liabilities arising out of state and federal fraudulent conveyance laws and legal dividend requirements.
The spin-off could be challenged under various state and federal fraudulent conveyance laws. Fraudulent conveyances or transfers are generally defined to include transfers made or obligations incurred with the actual intent to hinder, delay, or defraud current or future creditors or transfers made or obligations incurred for less than reasonably equivalent value when the debtor was insolvent, or that rendered the debtor insolvent, inadequately capitalized, or unable to pay its debts as they become due. An unpaid creditor or an entity acting on behalf of a creditor (including, without limitation, a trustee or debtor-in-possession in a bankruptcy by us or Arcosa or any of our respective subsidiaries) may bring a lawsuit alleging that the spin-off or any of the related transactions constituted a constructive fraudulent conveyance. If a court accepts these allegations, it could impose a number of remedies, including, without limitation, voiding the distribution and returning Arcosa’s assets or Arcosa’s shares and subject us to liability.
The distribution of Arcosa common stock is also subject to state corporate distribution statutes. Under the Delaware General Corporation Law ("DGCL"), a corporation may only pay dividends to its stockholders either (i) out of its surplus (net assets minus capital) or (ii) if there is no such surplus, out of its net profits for the fiscal year in which the dividend is declared and/or the preceding fiscal year. Although Trinity made the distribution of Arcosa common stock entirely out of surplus, Trinity cannot ensure that a court would reach the same conclusion in determining the availability of funds for the separation and the distribution to our stockholders.
22
Item 1B. Unresolved Staff Comments.
None.
Item 2. Properties.
We principally operate in various locations throughout the U.S. and in Mexico. Our facilities are considered to be in good condition, well maintained, and adequate for our purposes.
Approximate Square Feet(1) | Approximate Square Feet Located In(1) | ||||||||||
Owned | Leased | U.S. | Mexico | ||||||||
Rail Products Group(2) | 5,288,700 | 133,400 | 3,159,400 | 2,262,700 | |||||||
All Other(2) | 1,028,500 | 88,800 | 1,117,300 | — | |||||||
Corporate Offices | 211,000 | 13,600 | 217,000 | 7,600 | |||||||
6,528,200 | 235,800 | 4,493,700 | 2,270,300 | ||||||||
(1) Excludes non-operating facilities and facilities classified as discontinued operations
(2) Estimated weighted average production capacity utilization was approximately 90% for the year ended December 31, 2019
Item 3. Legal Proceedings.
See Note 15 of the Consolidated Financial Statements.
Item 4. Mine Safety Disclosures
Not applicable.
23
PART II
Item 5. Market for Registrant's Common Equity, Related Stockholder Matters and Issuer Purchases of Equity Securities.
Our common stock is traded on the New York Stock Exchange under the ticker symbol “TRN”. Our transfer agent and registrar as of December 31, 2019 was American Stock Transfer & Trust Company.
Holders
At January 31, 2020, we had 1,554 record holders of common stock. The par value of the common stock is $0.01 per share.
Stock Performance Graph
The following Performance Graph and related information shall not be deemed “soliciting material” or to be “filed” with the SEC, nor shall such information be incorporated by reference into any future filing under the Securities Act of 1933 or Securities Exchange Act of 1934, each as amended, except to the extent that the Company specifically incorporates it by reference into such filing.
The following graph compares our cumulative total stockholder return (assuming reinvestment of dividends) during the five-year period ended December 31, 2019 with an overall stock market index (New York Stock Exchange Composite Index) and our peer group index (Dow Jones US Commercial Vehicles & Trucks Index). The S&P MidCap 400 is included as we believe it is a meaningful data point as the Company's common stock is included in this index. Additionally, the S&P MidCap 400 is used in measuring the Company's relative total stockholder return for purposes of determining the performance of certain stock awards granted in 2018 and 2019. The data in the graph assumes $100 was invested on December 31, 2014. For the purpose of this graph, historical stock prices of Trinity prior to the spin-off of Arcosa have been adjusted to reflect the impact of the spin.
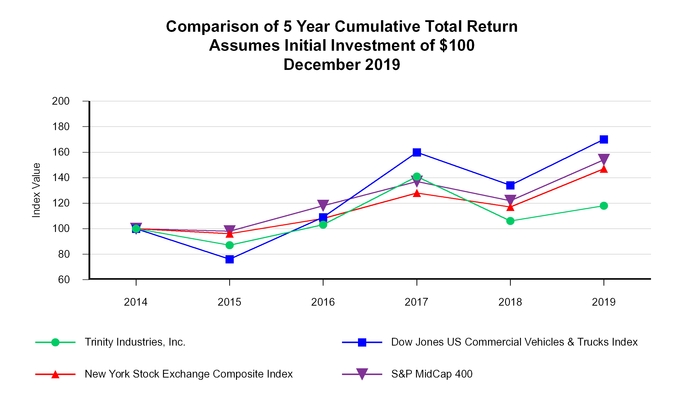
2014 | 2015 | 2016 | 2017 | 2018 | 2019 | ||||||||||||
Trinity Industries, Inc. | 100 | 87 | 103 | 141 | 106 | 118 | |||||||||||
Dow Jones US Commercial Vehicles & Trucks Index | 100 | 76 | 109 | 160 | 134 | 170 | |||||||||||
New York Stock Exchange Composite Index | 100 | 96 | 108 | 128 | 117 | 147 | |||||||||||
S&P MidCap 400 | 100 | 98 | 118 | 137 | 122 | 154 | |||||||||||
24
Issuer Purchases of Equity Securities N EED
This table provides information with respect to purchases by the Company of shares of its common stock during the quarter ended December 31, 2019:
Period | Number of Shares Purchased (1) | Average Price Paid per Share (1) | Total Number of Shares Purchased as Part of Publicly Announced Plans or Programs (2) | Maximum Number (or Approximate Dollar Value) of Shares that May Yet Be Purchased Under the Plans or Programs (2) | ||||||||||
October 1, 2019 through October 31, 2019 | 1,107,419 | $ | 19.65 | 1,102,622 | $ | 164,399,809 | ||||||||
November 1, 2019 through November 30, 2019 | 1,331,497 | $ | 21.34 | 1,330,852 | $ | 136,002,627 | ||||||||
December 1, 2019 through December 31, 2019 | 502,217 | $ | 21.48 | 500,000 | $ | 125,266,862 | ||||||||
Total | 2,941,133 | 2,933,474 | ||||||||||||
(1) These columns include the following transactions during the three months ended December 31, 2019: (i) the surrender to the Company of 7,126 shares of common stock to satisfy tax withholding obligations in connection with the vesting of restricted stock issued to employees, (ii) the purchase of 533 shares of common stock by the Trustee for assets held in a non-qualified employee profit-sharing plan trust, and (iii) the purchase of 2,933,474 shares of common stock on the open market as part of our share repurchase program.
(2) In March 2019, our Board of Directors authorized a new share repurchase program effective March 7, 2019 through December 31, 2020. The new share repurchase program authorizes the Company to repurchase up to $350.0 million of its common stock, not to exceed 13.7 million shares. The share repurchase program is designed to meet certain IRS safe harbor guidelines associated with the spin-off of Arcosa, which was completed November 1, 2018. 2,933,474 shares were repurchased under the new share repurchase program during the three months ended December 31, 2019, at a cost of approximately $60.8 million. As of December 31, 2019, the Company had a remaining authorization to repurchase up to $125.3 million, not to exceed 2.6 million shares, of its common stock under the current repurchase program. The approximate dollar value of shares that were eligible to be repurchased under such share repurchase program is shown as of the end of such month or quarter.
25
Item 6. Selected Financial Data.
The following selected financial data for the five years ended December 31, 2019 has been derived from our audited consolidated financial statements. The operating results and certain other directly attributable expenses related to the businesses transferred to Arcosa in connection with the spin-off, which was completed on November 1, 2018, are reflected as discontinued operations in the table below for all periods presented. This selected financial data should be read in conjunction with Management's Discussion and Analysis of Financial Condition and Results of Operations and our Consolidated Financial Statements and the Notes thereto.
Year Ended December 31, | |||||||||||||||||||
2019 | 2018 | 2017 | 2016 | 2015 | |||||||||||||||
(in millions, except percent and per share data) | |||||||||||||||||||
Statement of Operations Data: | |||||||||||||||||||
Revenues | $ | 3,005.1 | $ | 2,509.1 | $ | 2,397.4 | $ | 3,089.8 | $ | 4,602.3 | |||||||||
Operating profit | 416.3 | 315.1 | 368.3 | 478.9 | 1,068.6 | ||||||||||||||
Income from continuing operations before income taxes | 200.7 | 151.6 | 195.4 | 310.0 | 880.5 | ||||||||||||||
Provision (benefit) for income taxes (1) | 61.5 | 42.6 | (414.8 | ) | 106.8 | 295.5 | |||||||||||||
Income from continuing operations | 139.2 | 109.0 | 610.2 | 203.2 | 585.0 | ||||||||||||||
Income (loss) from discontinued operations, net of provision (benefit) for income taxes of $(1.0), $30.7, $73.1, $95.2, and $130.7 (2) | (3.1 | ) | 54.1 | 103.4 | 161.5 | 241.0 | |||||||||||||
Net income | $ | 136.1 | $ | 163.1 | $ | 713.6 | $ | 364.7 | $ | 826.0 | |||||||||
Net income attributable to Trinity Industries, Inc. | $ | 137.6 | $ | 159.3 | $ | 702.5 | $ | 343.6 | $ | 796.5 | |||||||||
Net income attributable to Trinity Industries, Inc. per common share: | |||||||||||||||||||
Basic earnings per common share: | |||||||||||||||||||
Income from continuing operations | $ | 1.11 | $ | 0.72 | $ | 3.94 | $ | 1.19 | $ | 3.58 | |||||||||
Income (loss) from discontinued operations | (0.02 | ) | 0.37 | 0.68 | 1.06 | 1.56 | |||||||||||||
$ | 1.09 | $ | 1.09 | $ | 4.62 | $ | 2.25 | $ | 5.14 | ||||||||||
Diluted earnings per common share: | |||||||||||||||||||
Income from continuing operations | $ | 1.09 | $ | 0.70 | $ | 3.85 | $ | 1.19 | $ | 3.54 | |||||||||
Income (loss) from discontinued operations | (0.02 | ) | 0.37 | 0.67 | 1.06 | 1.54 | |||||||||||||
$ | 1.07 | $ | 1.07 | $ | 4.52 | $ | 2.25 | $ | 5.08 | ||||||||||
Weighted average number of shares outstanding: | |||||||||||||||||||
Basic | 125.6 | 144.0 | 148.6 | 148.4 | 150.2 | ||||||||||||||
Diluted | 127.3 | 146.4 | 152.0 | 148.6 | 152.2 | ||||||||||||||
Dividends declared per common share | $ | 0.70 | $ | 0.52 | $ | 0.50 | $ | 0.44 | $ | 0.43 | |||||||||
Balance Sheet Data: | |||||||||||||||||||
Total assets (3) | $ | 8,701.4 | $ | 7,989.2 | $ | 9,543.2 | $ | 9,125.3 | $ | 8,885.9 | |||||||||
Debt — recourse | $ | 522.8 | $ | 397.4 | $ | 866.3 | $ | 850.6 | $ | 836.2 | |||||||||
Debt — non-recourse | $ | 4,359.1 | $ | 3,631.8 | $ | 2,375.6 | $ | 2,206.0 | $ | 2,358.7 | |||||||||
Stockholders' equity (4) | $ | 2,378.9 | $ | 2,562.0 | $ | 4,858.0 | $ | 4,311.1 | $ | 4,048.7 | |||||||||
Ratio of total debt to total capital (4) | 67.2 | % | 61.1 | % | 40.0 | % | 41.5 | % | 44.1 | % | |||||||||
Book value per share | $ | 19.89 | $ | 19.23 | $ | 32.21 | $ | 28.34 | $ | 26.50 | |||||||||
(1) | As a result of the Tax Cuts and Jobs Act (the "Tax Act"), which was enacted on December 22, 2017, income tax expense for the year ended December 31, 2017 includes a provisional net benefit of $476.2 million, or $3.06 per common diluted share, associated with the remeasurement of the Company's deferred tax assets and deferred tax liabilities and the impact of certain other provisions of the Tax Act. Income tax expense for the years ended December 31, 2019 and 2018 reflects the lower U.S. federal corporate income tax rate of 21% in comparison to a U.S. federal corporate income tax rate of 35% for the years ended December 31, 2017, 2016, and 2015. See Note 9 of the Consolidated Financial Statements for further information. |
(2) | Income (loss) from discontinued operations for the years ended December 31, 2019, 2018, and 2017 includes transaction costs and certain other expenses directly attributable to the Arcosa spin-off of $2.9 million, $31.2 million, and $14.2 million, respectively. |
(3) | The decrease in total assets from December 31, 2017 to December 31, 2018 is primarily attributable to the spin-off of Arcosa on November 1, 2018. |
(4) | In connection with the spin-off of Arcosa, which was completed on November 1, 2018, we recorded a reduction to stockholders' equity of approximately $1,732.2 million, representing the distribution of the net assets of Arcosa to Trinity's shareholders. |
26
Item 7. Management’s Discussion and Analysis of Financial Condition and Results of Operations.
Management’s Discussion and Analysis of Financial Condition and Results of Operations (“MD&A”) is intended to provide a reader of our financial statements with a narrative from the perspective of our management on our financial condition, results of operations, liquidity, and certain other factors that may affect our future results. Our MD&A should be read in conjunction with our Consolidated Financial Statements and related Notes in Item 8, Financial Statements and Supplementary Data, of this Annual Report on Form 10-K.
This MD&A includes financial measures compiled in accordance with generally accepted accounting principles ("GAAP") and certain non-GAAP measures. Please refer to the Non-GAAP Financial Measures section herein for information on the non-GAAP measures included in the MD&A, reconciliations to the most directly comparable GAAP financial measure, and the reasons why management believes each measure is useful to management and investors.
Company Overview
Trinity Industries, Inc. and its consolidated subsidiaries own businesses that are leading providers of railcar products and services in North America. Our rail-related businesses market their railcar products and services under the trade name TrinityRail®. The TrinityRail platform provides railcar leasing and management services, railcar manufacturing, and railcar maintenance and modification services. We also own businesses engaged in the manufacturing of products used on the nation's roadways and in traffic control, as well as a logistics business that primarily provides support services to Trinity. We report our operating results in three principal business segments: (1) the Railcar Leasing and Management Services Group, which owns and operates a fleet of railcars and provides third-party fleet leasing, management, and administrative services; (2) the Rail Products Group, which manufactures and sells railcars and related parts and components, and provides railcar maintenance and modification services; and (3) All Other.
On November 1, 2018, we completed the separation of Trinity Industries, Inc. into two public companies: (1) Trinity Industries, Inc., primarily comprised of Trinity’s rail-related businesses, and (2) Arcosa, Inc. ("Arcosa"), a public company focused on infrastructure-related products and services. The separation was effected through a pro rata dividend to Trinity's shareholders of all outstanding Arcosa shares and was structured to qualify as a tax-free distribution for federal income tax purposes. Following the distribution, Arcosa became an independent, publicly-traded company on the New York Stock Exchange. Trinity did not retain an ownership interest in Arcosa following the completion of the spin-off transaction. See Note 2 of the Consolidated Financial Statements for further information related to the spin-off transaction.
Arcosa's results of operations have been presented as discontinued operations for all periods presented in this Annual Report on Form 10-K. Additionally, all intersegment sales between Arcosa and us, previously recorded as intersegment sales and eliminated in consolidation prior to the Arcosa spin-off, are now reflected as third-party sales. These sales, along with their related costs, are no longer eliminated in consolidation.
All segment results set forth herein have been recast to present results on a comparable basis.
27
Executive Summary
Financial and Operational Highlights
• | Our revenues for the year ended December 31, 2019 were $3,005.1 million representing an increase of 19.8%, compared to the year ended December 31, 2018. Our operating profit for the year ended December 31, 2019 was $416.3 million representing an increase of 32.1%, compared to the year ended December 31, 2018. |
• | The Railcar Leasing and Management Services Group (the "Leasing Group") reported additions to the wholly-owned and partially-owned lease fleet of 4,490 railcars, for a total of 103,705 railcars as of December 31, 2019, an increase of 4.5% compared to December 31, 2018. |
• | For the year ended December 31, 2019, we made a net investment in our lease fleet of approximately $916.5 million, which primarily includes new railcar additions and railcar modifications, net of deferred profit, and secondary market purchases; and is net of proceeds from the sales of leased railcars owned more than one year at the time of sale. |
• | The Leasing Group's lease fleet of 103,705 company-owned railcars was 96.0% utilized as of December 31, 2019, in comparison to a lease fleet utilization of 98.5% on 99,215 company-owned railcars as of December 31, 2018. Our company-owned railcars include wholly-owned, partially-owned, and railcars under sale-leaseback arrangements. |
• | The total value of the railcar backlog at December 31, 2019 was $1.8 billion, compared to $3.6 billion at December 31, 2018. The Rail Products Group received orders for 10,220 railcars and delivered 21,960 railcars in 2019, in comparison to orders for 28,795 railcars and deliveries of 20,105 railcars in 2018. |
• | For the year ended December 31, 2019, our return on equity ("ROE") and Pre-Tax ROE were 5.6% and 9.0%(1), respectively, in comparison to 4.3% and 6.3%(1), respectively, for the year ended December 31, 2018. |
• | For the year ended December 31, 2019, we generated operating cash flows from continuing operations and Free Cash Flow of $396.7 million and $423.3 million(1), respectively, in comparison to $274.2 million and $390.0 million(1), respectively, for the year ended December 31, 2018. |
(1) Non-GAAP financial measure. See the Non-GAAP Financial Measures section within this Form 10-K for a reconciliation to the most directly comparable GAAP measure and why management believes this measure is useful to management and investors.
See "Consolidated Results of Operations" and "Segment Discussion" below for additional information regarding our operating results for the year ended December 31, 2019. See Part II, Item 7 of our 2018 Annual Report on Form 10-K for a discussion of our results of operations and liquidity and capital resources as of and for the year ended December 31, 2018, including a comparison to the year ended December 31, 2017.
28
Returns of Capital to Shareholders
For the year ended December 31, 2019, returns of capital to shareholders in the form of dividends and share repurchases are summarized below:
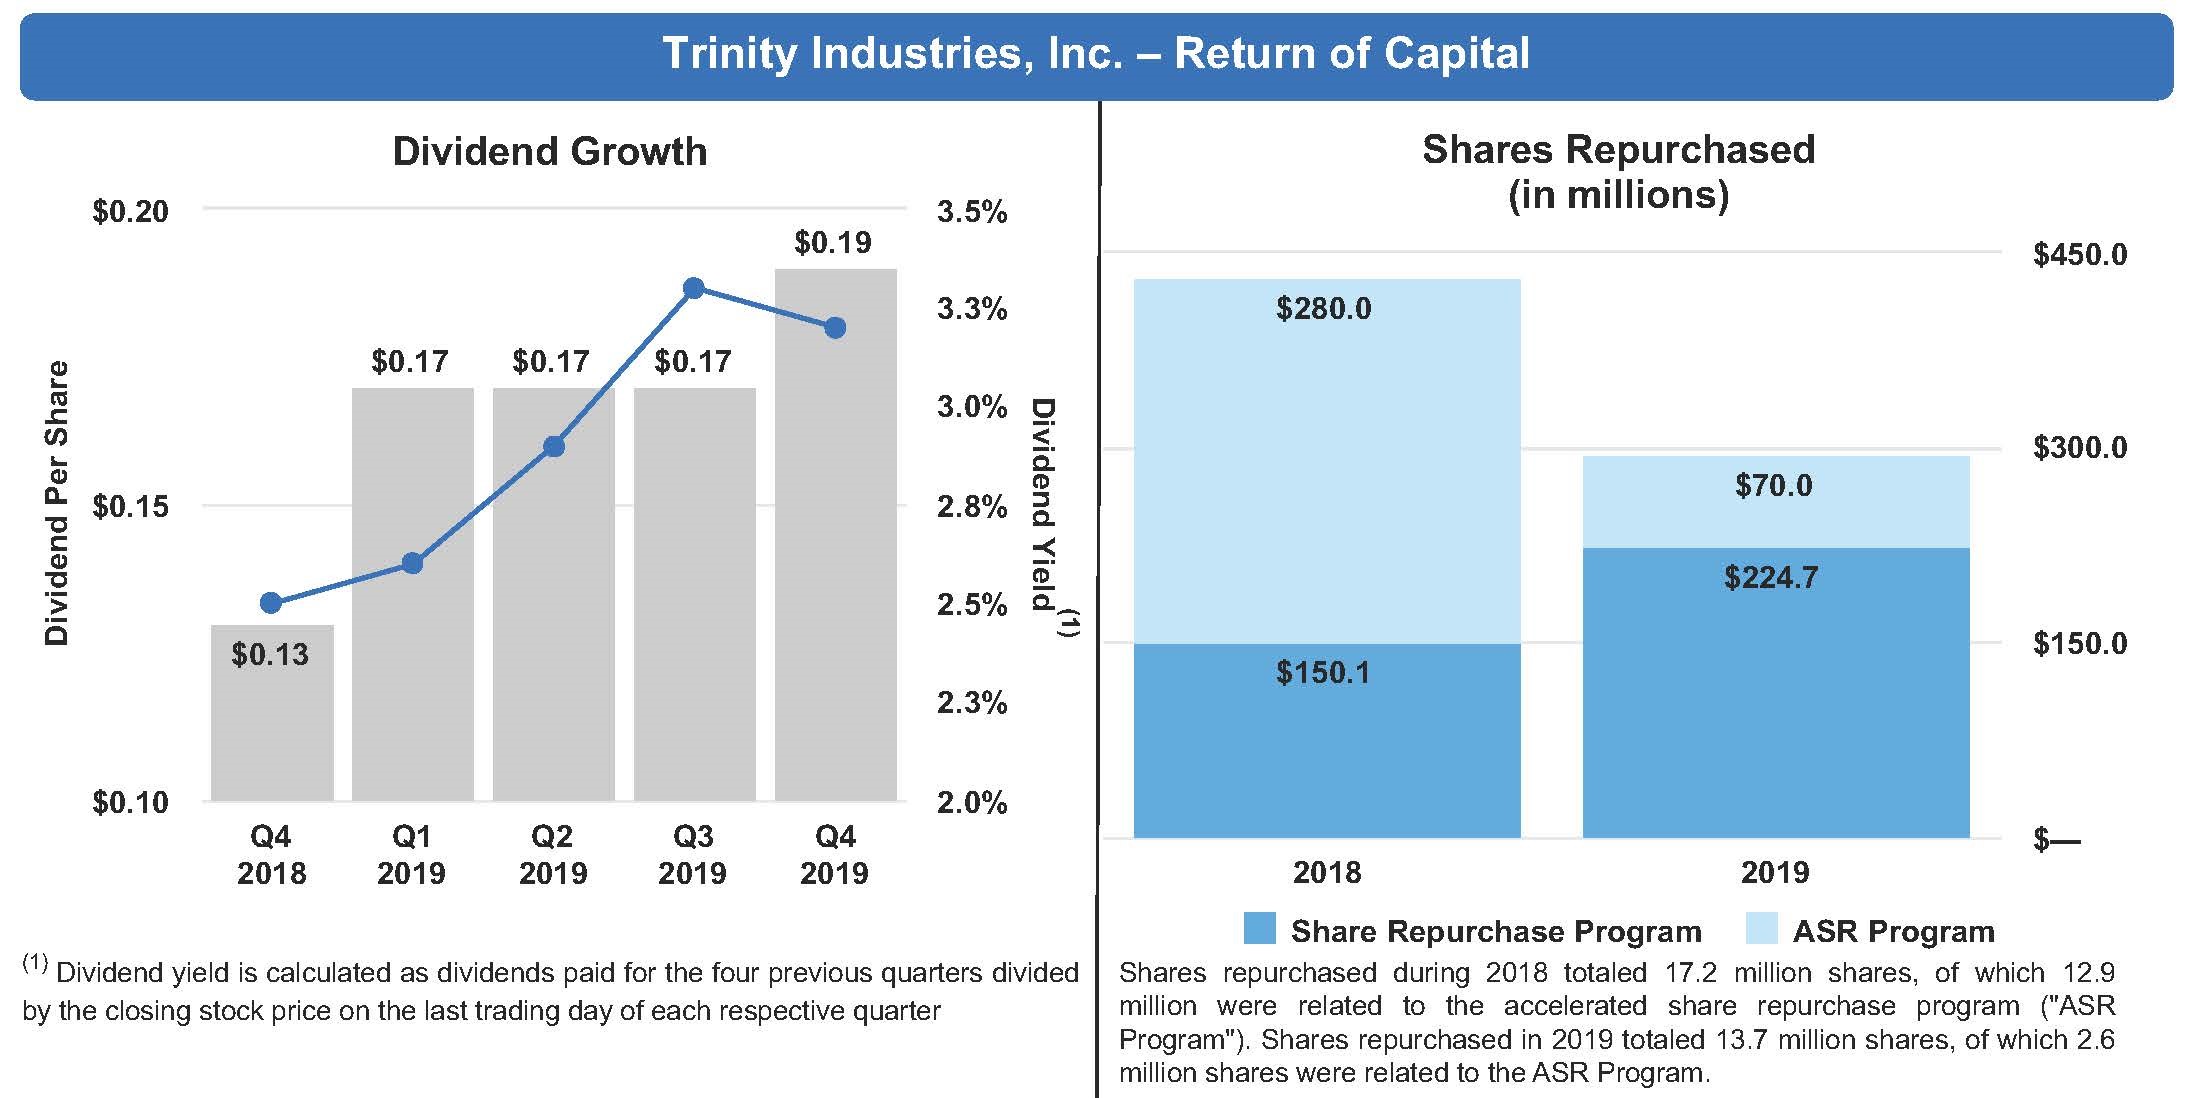
Capital Structure Updates
In connection with the Company's ongoing efforts to optimize its capital structure, in April 2019, Trinity Rail Leasing 2019 LLC ("TRL-2019"), a Delaware limited liability company and a limited purpose, indirect wholly-owned subsidiary of the Company owned through TILC, issued $528.3 million of TRL-2019 Secured Railcar Equipment Notes. In October 2019, TRL-2019 issued an additional $386.5 million of TRL-2019 Secured Railcar Equipment Notes, consisting of two classes of notes. These notes have a stated final maturity date of 2049.
See "Liquidity and Capital Resources" below for further information regarding these activities.
Litigation Updates
See Note 15 of the Consolidated Financial Statements for an update on the status of our Highway Products litigation.
Cyclical and Seasonal Trends Impacting Our Business
The industries in which we operate are cyclical in nature. Weaknesses in certain sectors of the North American and global economy may make it more difficult to sell or lease certain types of railcars. Additionally, adverse changes in commodity prices or lower demand for certain commodities could result in a decline in customer demand for various types of railcars. We continuously assess demand for our products and services and take steps to rationalize and diversify our leased railcar portfolio and align our manufacturing capacity appropriately. We diligently evaluate the creditworthiness of our customers and monitor performance of relevant market sectors; however, weaknesses in any of these market sectors could affect the financial viability of our underlying Leasing Group customers, which could negatively impact our recurring leasing revenues and operating profits. Due to their transactional nature, railcar sales from the lease fleet are the primary driver of fluctuations in results in the Leasing Group. Results in our All Other Group are affected by seasonal fluctuations, with the second and third quarters historically being the quarters with the highest revenues.
29
Recent Market Developments
Demand for railcars weakened in 2019 due to uncertainty associated with global tariffs and trade policies and declining industrial production. These economic factors, combined with declining railcar loading volumes and a growing supply of underutilized railcar assets in North America, are pressuring railcar lease rates and utilization, as well as orders for new railcar equipment. We currently expect this trend to continue in the near term. We believe that our integrated rail platform is designed to respond to cyclical changes in demand and perform throughout the railcar cycle.
Restructuring Activities
In the fourth quarter of 2019, we implemented the initial phase of efforts to streamline certain functions to support our rail-focused strategy and to begin disposing of underutilized assets and facilities. In connection with our assessment of future needs to support our go-forward business strategy, we recognized a restructuring charge of approximately $14.7 million, primarily from write-downs related to underutilized assets associated with our non-operational facilities, and employee transition costs. We estimate that these actions will generate future annualized cost savings of approximately $8 million to $10 million. We expect to identify additional streamlining and cost savings opportunities in 2020.
30
Consolidated Results of Operations
The following table summarizes our consolidated results of operations for the years ended December 31, 2019 and 2018:
Year Ended December 31, | |||||||
2019 | 2018 | ||||||
(in millions) | |||||||
Revenues | $ | 3,005.1 | $ | 2,509.1 | |||
Cost of revenues | 2,365.7 | 1,938.8 | |||||
Selling, engineering, and administrative expenses | 262.8 | 296.6 | |||||
Gains on disposition of property | 54.4 | 41.4 | |||||
Restructuring activities | 14.7 | — | |||||
Total operating profit | 416.3 | 315.1 | |||||
Interest expense, net | 214.5 | 167.4 | |||||
Other, net | 1.1 | (3.9 | ) | ||||
Income from continuing operations before income taxes | 200.7 | 151.6 | |||||
Provision for income taxes | 61.5 | 42.6 | |||||
Income from continuing operations | $ | 139.2 | $ | 109.0 | |||
Revenues
The tables below present revenues by segment for the years ended December 31, 2019 and 2018:
Year Ended December 31, 2019 | ||||||||||||||
Revenues | Percent | |||||||||||||
External | Intersegment | Total | Change | |||||||||||
(in millions) | ||||||||||||||
Railcar Leasing and Management Services Group | $ | 1,116.3 | $ | 0.9 | $ | 1,117.2 | 32.6 | % | ||||||
Rail Products Group | 1,595.4 | 1,331.1 | 2,926.5 | 24.7 | ||||||||||
All Other | 293.4 | 51.7 | 345.1 | (4.5 | ) | |||||||||
Segment Totals before Eliminations | 3,005.1 | 1,383.7 | 4,388.8 | 23.6 | ||||||||||
Eliminations – Lease Subsidiary | — | (1,331.1 | ) | (1,331.1 | ) | |||||||||
Eliminations – Other | — | (52.6 | ) | (52.6 | ) | |||||||||
Consolidated Total | $ | 3,005.1 | $ | — | $ | 3,005.1 | 19.8 | |||||||
Year Ended December 31, 2018 | ||||||||||||||
Revenues | ||||||||||||||
External | Intersegment | Total | ||||||||||||
(in millions) | ||||||||||||||
Railcar Leasing and Management Services Group | $ | 842.0 | $ | 0.8 | $ | 842.8 | ||||||||
Rail Products Group | 1,356.4 | 990.3 | 2,346.7 | |||||||||||
All Other | 310.7 | 50.6 | 361.3 | |||||||||||
Segment Totals before Eliminations | 2,509.1 | 1,041.7 | 3,550.8 | |||||||||||
Eliminations – Lease Subsidiary | — | (990.3 | ) | (990.3 | ) | |||||||||
Eliminations – Other | — | (51.4 | ) | (51.4 | ) | |||||||||
Consolidated Total | $ | 2,509.1 | $ | — | $ | 2,509.1 | ||||||||
31
Operating Costs
Operating costs are comprised of cost of revenues; selling, engineering, and administrative costs; gains or losses on property disposals; and restructuring activities. Operating costs by segment for the years ended December 31, 2019 and 2018 were as follows:
Year Ended December 31, | |||||||
2019 | 2018 | ||||||
(in millions) | |||||||
Railcar Leasing and Management Services Group | $ | 710.6 | $ | 491.7 | |||
Rail Products Group | 2,645.1 | 2,174.6 | |||||
All Other | 329.0 | 325.6 | |||||
Segment Totals before Eliminations, Corporate Expenses, and Restructuring activities | 3,684.7 | 2,991.9 | |||||
Corporate | 108.0 | 149.1 | |||||
Restructuring activities | 14.7 | — | |||||
Eliminations – Lease Subsidiary | (1,166.4 | ) | (895.2 | ) | |||
Eliminations – Other | (52.2 | ) | (51.8 | ) | |||
Consolidated Total | $ | 2,588.8 | $ | 2,194.0 | |||
Operating Profit
Operating profit by segment for the years ended December 31, 2019 and 2018 was as follows:
Year Ended December 31, | |||||||
2019 | 2018 | ||||||
(in millions) | |||||||
Railcar Leasing and Management Services Group | $ | 406.6 | $ | 351.1 | |||
Rail Products Group | 281.4 | 172.1 | |||||
All Other | 16.1 | 35.7 | |||||
Segment Totals before Eliminations, Corporate Expenses, and Restructuring activities | 704.1 | 558.9 | |||||
Corporate | (108.0 | ) | (149.1 | ) | |||
Restructuring activities | (14.7 | ) | — | ||||
Eliminations – Lease Subsidiary | (164.7 | ) | (95.1 | ) | |||
Eliminations – Other | (0.4 | ) | 0.4 | ||||
Consolidated Total | $ | 416.3 | $ | 315.1 | |||
Discussion of Consolidated Results
Revenues — Our revenues for the year ended December 31, 2019 were $3,005.1 million, representing an increase of $496.0 million, or 19.8%, over the prior year, primarily related to a higher volume of railcars sold from our lease fleet and higher leasing and management services revenue in the Leasing Group primarily associated with growth in the lease fleet. Additionally, revenues increased in the Rail Products Group as a result of favorable product mix on external railcar sales, higher unit deliveries and growth in our maintenance services business.
Cost of revenues — Our cost of revenues for the year ended December 31, 2019 were $2,365.7 million, representing an increase of $426.9 million, or 22.0%, over the prior year. The increase in cost of revenues in our Rail Products Group resulted primarily from product mix changes on external railcar sales and higher volumes in our maintenance services business. Additionally, cost of revenues increased in the Leasing Group due to a higher volume of railcars sold, including cost of revenues attributable to sales-type leases, and increased depreciation expense associated with the growth of our lease fleet.
Selling, engineering, and administrative expenses — Selling, engineering, and administrative expenses decreased by 11.4% for the year ended December 31, 2019, when compared to the prior year primarily due to cost reductions associated with optimizing our post-spin corporate structure.
Gains on disposition of property — Gains on disposition of property increased by $13.0 million for the year ended December 31, 2019, when compared to the prior year. Property disposition losses for the year ended December 31, 2018 included a non-cash charge of $12.6 million associated with our election to forego the early purchase options contained in certain lease agreements.
32
Restructuring activities — Our restructuring activities for the year ended December 31, 2019 were $14.7 million primarily as a result of write-downs related to underutilized assets in our manufacturing footprint and employee transition costs. We had no restructuring activities during the year ended December 31, 2018.
Operating profit — Operating profit for the year ended December 31, 2019 totaled $416.3 million, representing an increase of 32.1% from the prior year. The increase in operating profit resulted primarily from favorable product mix changes in the Rail Products Group, higher profits from railcar sales in the Leasing Group, and reductions in corporate selling, engineering, and administrative expenses.
For further information regarding the operating results of individual segments, see "Segment Discussion" below.
Interest expense, net — Interest expense, net for the year ended December 31, 2019 totaled $214.5 million, compared to $167.4 million for the year ended December 31, 2018. The increase in interest expense for the year ended December 31, 2019 was primarily driven by higher debt obligations in the Leasing Group in connection with the Company's efforts to optimize its capital structure, and lower interest income when compared to the prior year period.
Other, net — For the year ended December 31, 2019, the increase in expense was primarily due to higher net periodic benefit costs associated with our company-sponsored pension plans.
Income taxes — Our effective tax rates were 30.6% and 28.1% for the years ended December 31, 2019 and 2018, respectively. Our effective tax rates differ from the U.S. statutory rate of 21.0% primarily due to state income tax expense, foreign branch taxes, and changes in state tax laws and apportionment. For the year ended December 31, 2019, the difference also includes the effects of a one-time, non-cash, deferred tax impact of $9.7 million related to our planned Maintenance Services expansion into a new Midwest facility.
Income tax payments, net of refunds, differ from the current provision primarily based on when estimated tax payments were due as compared to when the related income was earned and taxable. Our consolidated income tax position was a net receivable of $13.0 million and $38.4 million from federal, state, and foreign jurisdictions at December 31, 2019 and 2018, respectively. Income tax payments (refunds) during the years ended December 31, 2019 and 2018 totaled $(16.7) million and $4.1 million, respectively.
33
Segment Discussion
Railcar Leasing and Management Services Group
Year Ended December 31, | Percent Change | |||||||||
2019 | 2018 | |||||||||
($ in millions) | ||||||||||
Revenues: | ||||||||||
Leasing and management | $ | 756.5 | $ | 728.9 | 3.8 | % | ||||
Sales of railcars owned one year or less at the time of sale (1) | 360.7 | 113.9 | 216.7 | % | ||||||
Total revenues | $ | 1,117.2 | $ | 842.8 | 32.6 | % | ||||
Operating profit(2): | ||||||||||
Leasing and management | $ | 314.7 | $ | 291.8 | 7.8 | % | ||||
Railcar sales: | ||||||||||
Railcars owned one year or less at the time of sale | 41.4 | 21.5 | 92.6 | % | ||||||
Railcars owned more than one year at the time of sale | 50.5 | 50.4 | 0.2 | % | ||||||
Property disposition losses (3) | — | (12.6 | ) | * | ||||||
Total operating profit | $ | 406.6 | $ | 351.1 | 15.8 | % | ||||
Total operating profit margin | 36.4 | % | 41.7 | % | ||||||
Leasing and management operating profit margin: | 41.6 | % | 40.0 | % | ||||||
Selected expense information: | ||||||||||
Depreciation | $ | 232.2 | $ | 196.6 | 18.1 | % | ||||
Maintenance and compliance | $ | 102.1 | $ | 99.3 | 2.8 | % | ||||
Rent | $ | 16.9 | $ | 42.4 | (60.1 | )% | ||||
Selling, engineering, and administrative expenses | $ | 49.5 | $ | 51.1 | (3.1 | )% | ||||
Interest | $ | 197.2 | $ | 142.3 | 38.6 | % | ||||
* Not meaningful
(1) Includes revenues associated with sales-type leases of $160.5 million for the year ended December 31, 2019.
(2) Operating profit includes: depreciation; maintenance and compliance; rent; and selling, engineering, and administrative expenses. Amortization of deferred profit on railcars sold from the Rail Products Group to the Leasing Group is included in the operating profits of the Leasing Group, resulting in the recognition of depreciation expense based on our original manufacturing cost of the railcars. Interest expense is not a component of operating profit and includes the effect of hedges.
(3) Property disposition losses for the year ended December 31, 2018 included a non-cash charge of $12.6 million associated with our election to forego the early purchase options contained in certain lease agreements.
During the years ended December 31, 2019 and 2018, information related to the sales of leased railcars is as follows:
Year Ended December 31, | |||||||
2019 | 2018 | ||||||
($ in millions) | |||||||
Sales of leased railcars: | |||||||
Railcars owned one year or less at the time of sale (1) | $ | 360.7 | $ | 113.9 | |||
Railcars owned more than one year at the time of sale | 205.7 | 230.5 | |||||
$ | 566.4 | $ | 344.4 | ||||
Operating profit on sales of leased railcars: | |||||||
Railcars owned one year or less at the time of sale | $ | 41.4 | $ | 21.5 | |||
Railcars owned more than one year at the time of sale | 50.5 | 50.4 | |||||
$ | 91.9 | $ | 71.9 | ||||
Operating profit margin on sales of leased railcars: | |||||||
Railcars owned one year or less at the time of sale | 11.5 | % | 18.9 | % | |||
Railcars owned more than one year at the time of sale | 24.6 | % | 21.9 | % | |||
Weighted average operating profit margin on sales of leased railcars | 16.2 | % | 20.9 | % | |||
(1) Includes revenues associated with sales-type leases of $160.5 million for the year ended December 31, 2019.
34
Total revenues for the Railcar Leasing and Management Services Group increased by 32.6% for the year ended December 31, 2019, compared to the prior year. Revenues related to sales of leased railcars owned one year or less increased due to a higher volume and mix of railcars sold from the fleet. Additionally, leasing and management revenues increased 3.8% for the year ended December 31, 2019, as a result of growth in the lease fleet partially offset by lower fleet utilization when compared to the year ended December 31, 2018. Although lease rates for current year lease originations increased throughout 2019, average lease rates across the lease fleet were lower when compared to the prior year.
Operating profit increased by 15.8% for the year ended December 31, 2019, compared to the prior year primarily due to higher profits from railcar sales, growth in the lease fleet, and lower rent expense resulting from the purchase of 6,779 railcars during the first quarter of 2019, which were previously under lease and are now wholly-owned. These increases were partially offset by higher depreciation expense associated with the growth in the lease fleet. Operating profit for the year ended December 31, 2018 was negatively impacted by $12.6 million associated with our election to forego the early purchase options contained in certain lease agreements. See "Liquidity and Capital Resources" below for further information regarding the leased railcar purchase.
The Leasing Group generally uses its non-recourse warehouse loan facility or cash to provide initial funding for a portion of the purchase price of the railcars. After initial funding, the Leasing Group may obtain long-term financing for the railcars in the lease fleet through non-recourse asset-backed securities; long-term non-recourse operating leases pursuant to sale-leaseback transactions; long-term recourse debt such as equipment trust certificates; long-term non-recourse promissory notes; or third-party equity.
Information regarding the Leasing Group’s lease fleet, managed or owned through its wholly-owned and partially-owned subsidiaries, follows:
December 31, | |||||
2019 | 2018 | ||||
Number of railcars: | |||||
Wholly-owned(1) | 79,115 | 74,565 | |||
Partially-owned | 24,590 | 24,650 | |||
103,705 | 99,215 | ||||
Managed (third-party owned) | 24,835 | 21,635 | |||
128,540 | 120,850 | ||||
Company-owned railcars (2): | |||||
Average age in years | 9.6 | 9.1 | |||
Average remaining lease term in years | 3.3 | 3.5 | |||
Fleet utilization | 96.0 | % | 98.5 | % | |
(1) Includes 2,175 railcars under sale-leaseback arrangements.
(2) Includes wholly-owned and partially-owned railcars and railcars under sale-leaseback arrangements.
35
Rail Products Group
Year Ended December 31, | Percent Change | |||||||||
2019 | 2018 | |||||||||
($ in millions) | ||||||||||
Revenues: | ||||||||||
Rail Products | $ | 2,506.7 | $ | 1,996.9 | 25.5 | % | ||||
Maintenance services | 371.0 | 300.1 | 23.6 | % | ||||||
Other | 48.8 | 49.7 | (1.8 | )% | ||||||
Total revenues | $ | 2,926.5 | $ | 2,346.7 | 24.7 | % | ||||
Operating costs: | ||||||||||
Cost of revenues | $ | 2,592.6 | $ | 2,122.8 | 22.1 | % | ||||
Selling, engineering, and administrative expenses | 52.3 | 51.8 | 1.0 | % | ||||||
Losses on dispositions of property | 0.2 | — | * | |||||||
Operating profit | $ | 281.4 | $ | 172.1 | 63.5 | % | ||||
Operating profit margin | 9.6 | % | 7.3 | % | ||||||
* Not meaningful
Additional information related to our Rail Products Group backlog of railcars is summarized below:
December 31, | Percent Change | |||||||||
2019 | 2018 | |||||||||
(in millions) | ||||||||||
External Customers | $ | 1,213.4 | $ | 2,059.5 | ||||||
Leasing Group | 619.1 | 1,588.1 | ||||||||
Total (1) | $ | 1,832.5 | $ | 3,647.6 | (49.8 | )% | ||||
Year Ended December 31, | Percent Change | |||||||||
2019 | 2018 | |||||||||
Beginning balance | 30,875 | 22,585 | ||||||||
Orders received | 10,220 | 28,795 | ||||||||
Deliveries | (21,960 | ) | (20,105 | ) | ||||||
Other adjustments (1) | (4,050 | ) | (400 | ) | ||||||
Ending balance | 15,085 | 30,875 | ||||||||
Average selling price in ending backlog | $ | 121,478 | $ | 118,141 | 2.8 | % | ||||
Revenues and cost of revenues for the Rail Products Group increased for the year ended December 31, 2019 by 24.7% and 22.1%, respectively, when compared to the prior year. The increases in revenues and cost of revenues for the year ended December 31, 2019 primarily resulted from favorable railcar product mix changes and higher deliveries compared to the prior year period, and growth in our maintenance services business.
Total backlog dollars decreased by 49.8% when compared to the prior year period primarily from a reduction in orders received, partially offset by a 2.8% higher average selling price on railcars included in backlog as a result of changes to the product mix. Approximately 59% of our railcar backlog value is expected to be delivered during 2020 with the remainder to be delivered thereafter into 2023. The orders in our backlog from the Leasing Group are fully supported by lease commitments with external customers. The final amount of backlog attributable to the Leasing Group may vary by the time of delivery as customers may choose to purchase railcars from the Rail Products Group rather than lease.
During the year ended December 31, 2019, railcar shipments included sales to the Leasing Group of $1,179.5 million with a deferred profit of $147.7 million, representing 9,363 railcars, compared to $876.0 million with a deferred profit of $77.2 million, representing 9,013 railcars, in the comparable period in 2018. In 2019, the Leasing Group purchased 42.6% of our railcar production, compared to 44.8% in 2018.
36
All Other
Year Ended December 31, | Percent Change | |||||||||
2019 | 2018 | |||||||||
(in millions) | ||||||||||
Revenues: | ||||||||||
Highway Products | $ | 259.8 | $ | 267.8 | (3.0 | )% | ||||
Other | 85.3 | 93.5 | (8.8 | )% | ||||||
Total revenues | $ | 345.1 | $ | 361.3 | (4.5 | )% | ||||
Operating costs: | ||||||||||
Cost of revenues | $ | 275.7 | $ | 284.0 | (2.9 | )% | ||||
Selling, engineering, and administrative expenses | 53.0 | 44.6 | 18.8 | % | ||||||
Losses (gains) on dispositions of property | 0.3 | (3.0 | ) | * | ||||||
Operating profit | $ | 16.1 | $ | 35.7 | (54.9 | )% | ||||
* Not meaningful
Revenues and cost of revenues decreased for the year ended December 31, 2019 when compared to the prior year primarily due to decreased demand and lower shipping volumes in our highway products and logistics businesses. The decrease in cost of revenues for the year ended December 31, 2019 was partially offset by increased production costs in our highway products business. The decline in operating profit in the year ended December 31, 2019 primarily resulted from insurance recoveries and gains on dispositions of property recognized in the prior year. Operating profit was further impacted by higher product development costs during the year ended December 31, 2019.
Corporate
Year Ended December 31, | Percent Change | |||||||||
2019 | 2018 | |||||||||
(in millions) | ||||||||||
Operating costs | $ | 108.0 | $ | 149.1 | (27.6 | )% | ||||
Operating costs for the year ended December 31, 2019 decreased 27.6%, compared to the prior year primarily due to cost reductions associated with optimizing our post-spin corporate structure and lower litigation-related expenses.
37
Liquidity and Capital Resources
Overview
We expect to finance future operating requirements with cash, cash equivalents, and short-term marketable securities; cash flows from operations; and short-term debt, long-term debt, and equity. Debt instruments that we have utilized include the TILC warehouse facility, senior notes, convertible subordinated notes, asset-backed securities, non-recourse promissory notes, sale-leaseback transactions, and our revolving credit facility.
As of December 31, 2019, we had an unrestricted cash and cash equivalents balance of $166.2 million, and $289.5 million available under our revolving credit facility. Under the TILC warehouse facility, $396.6 million was unused and available as of December 31, 2019 based on the amount of warehouse-eligible, unpledged equipment. Additionally, our revolving credit facility contains an expansion feature that allows us to access up to an additional $200.0 million, subject to certain conditions. We believe we have access to adequate capital resources to fund operating requirements and are an active participant in the capital markets.
Liquidity Highlights
TRL-2019 Railcar Financing — In April 2019, TRL-2019, a Delaware limited liability company and a limited purpose, indirect wholly-owned subsidiary of the Company owned through TILC, issued $528.3 million of TRL-2019 Secured Railcar Equipment Notes. These notes bear interest at a fixed rate of 3.82% and have a stated final maturity date of 2049.
In October 2019, TRL-2019 issued an additional $386.5 million of TRL-2019 Secured Railcar Equipment Notes, consisting of two classes of notes with (i) an aggregate principal amount of $106.9 million of TRL-2019's Series 2019-2 Class A-1 Secured Railcar Equipment Notes (the "Class A-1 Notes"), and (ii) an aggregate principal amount of $279.6 million of TRL-2019's Series 2019-2 Class A-2 Secured Railcar Equipment Notes (the “Class A-2 Notes”). The Class A-1 Notes and Class A-2 Notes bear interest at fixed rates of 2.39% and 3.10%, respectively, and have a stated final maturity date of 2049.
Leased Railcar Purchase — Our Leasing Group previously leased railcars from certain independent owner trusts under operating leases, which contained an option to purchase the railcars at a predetermined fixed price in 2019. On January 14, 2019, we exercised the purchase option at a purchase price of $218.4 million. As a result, 6,779 railcars previously under lease are now wholly-owned by our Leasing Group. The purchase was funded using cash on hand and borrowings available to us under our revolving credit facility.
Dividend Payments — In March 2019, our Board of Directors declared a 31% increase to our quarterly dividend from $0.13 per share to $0.17 per share. In December 2019, our Board of Directors declared a 12% increase to our quarterly dividend from $0.17 per share to $0.19 per share. We paid $82.1 million in dividends to our common stockholders during the year ended December 31, 2019.
Share Repurchases — In March 2019, our Board of Directors authorized a new share repurchase program effective March 7, 2019 through December 31, 2020. The new share repurchase program authorizes the Company to repurchase up to $350.0 million of its common stock, not to exceed 13.7 million shares, and is designed to meet certain IRS safe harbor guidelines associated with our spin-off of Arcosa. Share repurchase activity under the current program for the year ended December 31, 2019 is as follows:
Shares Repurchased | Remaining Authorization to Repurchase | ||||||||||||
Period | Number of shares | Cost (in millions) | Number of shares | Cost (in millions) | |||||||||
March 7, 2019 Authorization | 13,700,000 | $ | 350.0 | ||||||||||
March 7, 2019 through March 31, 2019 | 866,715 | $ | 19.0 | 12,833,285 | $ | 331.0 | |||||||
April 1, 2019 through June 30, 2019 | 2,133,116 | 44.0 | 10,700,169 | $ | 287.0 | ||||||||
July 1, 2019 through September 30, 2019 | 5,171,489 | 100.9 | 5,528,680 | $ | 186.1 | ||||||||
October 1, 2019 through December 31, 2019 | 2,933,474 | 60.8 | 2,595,206 | $ | 125.3 | ||||||||
Total | 11,104,794 | $ | 224.7 | ||||||||||
During the year ended December 31, 2019, in addition to the amounts reported above, we repurchased 2.6 million shares, at a cost of approximately $70.0 million, representing the final settlement of the ASR Program, which was funded in November 2018 but completed in March 2019.
38
Cash Flows
The Consolidated Statements of Cash Flows include amounts related to discontinued operations, which are primarily related to the spin-off of Arcosa, completed on November 1, 2018. These amounts have been reclassified as discontinued operations for all periods presented.
The following table summarizes our cash flows from operating, investing, and financing activities for the years ended December 31, 2019 and 2018:
Year Ended December 31, | |||||||
2019 | 2018 | ||||||
(in millions) | |||||||
Net cash flows from continuing operations: | |||||||
Operating activities | $ | 396.7 | $ | 274.2 | |||
Investing activities | (993.3 | ) | (412.3 | ) | |||
Financing activities | 526.5 | (291.1 | ) | ||||
Net cash flows from discontinued operations | (3.1 | ) | (193.8 | ) | |||
Net decrease in cash, cash equivalents, and restricted cash | $ | (73.2 | ) | $ | (623.0 | ) | |
Operating Activities. Net cash provided by operating activities from continuing operations for the year ended December 31, 2019 was $396.7 million compared to $274.2 million for the year ended December 31, 2018. The increase was driven primarily by changes in our operating assets and liabilities and higher net income from continuing operations.
Year Ended December 31, | |||||||
2019 | 2018 | ||||||
(in millions) | |||||||
Increase (decrease) in receivables, inventories, and other assets | $ | 17.7 | $ | (287.8 | ) | ||
(Increase) decrease in accounts payable, accrued liabilities, and other liabilities | (96.7 | ) | 145.3 | ||||
Changes in operating assets and liabilities | $ | (79.0 | ) | $ | (142.5 | ) | |
The changes in our operating assets and liabilities resulted in a net use of $79.0 million for the year ended December 31, 2019, compared to a net use of $142.5 million for the year ended December 31, 2018, primarily as a result of improved working capital management.
Investing Activities. Net cash used in investing activities from continuing operations for the year ended December 31, 2019 was $993.3 million compared to $412.3 million for the year ended December 31, 2018. Significant investing activities are as follows:
• | We made a net investment in the lease fleet of $916.5 million during the year ended December 31, 2019, compared to $717.8 million in the prior year period. Our net investment in the lease fleet primarily includes new railcar additions and railcar modifications, net of deferred profit, and secondary market purchases; and is net of proceeds from the sales of leased railcars owned more than one year at the time of sale. |
• | Short-term marketable securities decreased by $319.5 million for the year ended December 31, 2018. There were no investing activities related to short-term marketable securities during the year ended December 31, 2019. |
Financing Activities. Net cash provided by financing activities during the year ended December 31, 2019 was $526.5 million compared to $291.1 million of cash used in financing activities for the same period in 2018. Significant financing activities are as follows:
• | During the year ended December 31, 2019, we had total borrowings of $2,567.8 million and total repayments of $1,724.1 million, for net proceeds of $843.7 million, primarily to support our investment in the lease fleet and for general and corporate purposes. During the year ended December 31, 2018, we had total borrowings of $1,206.6 million and total repayments of $887.8 million, for net proceeds of $318.8 million, primarily related to proceeds from the issuance of debt in support of our investment in the lease fleet, partially offset by the cash settlement of our then-outstanding convertible notes of $646.6 million. |
• | We paid $82.1 million and $77.4 million in dividends to our common stockholders during the year ended December 31, 2019 and 2018, respectively. |
39
• | We repurchased common stock under our authorized share repurchase programs totaling $224.7 million and $506.1 million during the year ended December 31, 2019 and 2018, respectively. The cash outlay for shares repurchased during year ended December 31, 2019 excludes approximately $70.0 million related to the repurchased shares that were funded in November 2018 under the ASR program but delivered in the first quarter of 2019. |
Current Debt Obligations
Please refer to Note 8 of the Consolidated Financial Statements for a description of our current debt obligations.
Capital Expenditures
Capital expenditures for 2019 were $1,219.2 million with $1,122.2 million utilized for net lease fleet additions, which includes new railcar additions and railcar modifications, net of deferred profit, and secondary market purchases. Excluding proceeds from the sales of leased railcars owned more than one year of $205.7 million, our net investment in the lease fleet was $916.5 million.
For the full year 2020, we anticipate a net investment in our lease fleet of between $425 million and $475 million. Capital expenditures related to manufacturing and corporate are projected to range between $90 million and $100 million for the full year 2020.
Equity Investment
See Note 5 of the Consolidated Financial Statements for information about our investment in partially-owned leasing subsidiaries.
Off Balance Sheet Arrangements
As of December 31, 2019, we had letters of credit issued under our revolving credit facility in an aggregate principal amount of $35.5 million, the full amount of which is expected to expire in July 2020. Our letters of credit obligations support our various insurance programs and generally renew by their terms each year. See Note 8 of the Consolidated Financial Statements for further information about our corporate revolving credit facility.
See Note 6 of the Consolidated Financial Statements for information about off balance sheet arrangements with regard to our Leasing Group.
Stock-Based Compensation
We have a stock-based compensation plan covering our employees and our Board of Directors. See Note 13 of the Consolidated Financial Statements for further information.
Employee Retirement Plans
As disclosed in Note 10 of the Consolidated Financial Statements, the projected benefit obligations of the Trinity Industries, Inc. Consolidated Pension Plan (the "Pension Plan") were $543.0 million, with plan assets of $548.5 million, resulting in a net funded status of $5.5 million as of December 31, 2019. Additionally, as of December 31, 2019, the benefit obligation associated with our nonqualified retirement plan totaled $14.9 million. We continue to sponsor an employee savings plan under the existing 401(k) plan that covers substantially all domestic employees and includes both a Company matching contribution and an annual retirement contribution of up to 3% each of eligible compensation based on Company financial performance, as well as a Supplemental Profit Sharing Plan. Both the annual retirement contribution and the Company matching contribution are discretionary, require board approval, and are made annually with the investment of the funds directed by the participants.
Employer contributions for the year ending December 31, 2020 are expected to be $1.1 million for the defined benefit plans, which excludes any potential cash contribution that may be required to settle the Company's pension plan obligations as described further below. Employer contributions to the 401(k) plan and the Supplemental Profit Sharing Plan for the year ending December 31, 2020 are expected to be $11.4 million compared to $10.6 million contributed during 2019.
40
Planned Pension Plan Termination
On September 4, 2019, our Board of Directors approved the termination of the Pension Plan, effective December 31, 2019. Except for retirees currently receiving payments under the Pension Plan, participants will have the choice of receiving a single lump sum payment or an annuity from a highly-rated insurance company that will pay and administer future benefit payments. The Pension Plan is expected to be settled between late 2020 and early 2021, subject to required governmental approvals, and would then result in the Company no longer having any remaining funded pension plan obligations.
Upon settlement, we expect to recognize pre-tax pension settlement charges totaling between $155 million and $185 million. This range includes: (1) a non-cash charge for the recognition of all pre-tax actuarial losses accumulated in Accumulated Other Comprehensive Loss related to the Pension Plan, which totaled approximately $170.1 million ($131.2 million, net of tax) as of December 31, 2019; and (2) a potential additional cash contribution to settle all of the Pension Plan’s obligations, which is not expected to exceed $15.0 million. The actual amount of the settlement charges and any potential cash contribution will depend on interest rates, Pension Plan asset returns, the lump-sum election rate, and other factors.
See Note 10 of the Consolidated Financial Statements for further information regarding our defined benefit plans.
Derivative Instruments
We may use derivative instruments to mitigate the impact of changes in interest rates, both in anticipation of future debt issuances and to offset interest rate variability of certain floating rate debt issuances outstanding. We also may use derivative instruments from time to time to mitigate the impact of changes in natural gas and diesel fuel prices and changes in foreign currency exchange rates. Derivative instruments that are designated and qualify as cash flow hedges are accounted for in accordance with applicable accounting standards. See Note 3 of the Consolidated Financial Statements for discussion of how we utilize our derivative instruments.
LIBOR Transition
In July 2017, the United Kingdom's Financial Conduct Authority (the "FCA"), which regulates the London Interbank Offered Rate ("LIBOR"), announced that it will no longer persuade or require banks to submit rates for the calculation of LIBOR after 2021. We currently have LIBOR-based contracts that extend beyond 2021 including derivative instruments, promissory notes for Trinity Rail Leasing 2017, LLC, a Delaware limited liability company and a limited purpose, indirect wholly-owned subsidiary of the Company owned through TILC, TILC's warehouse loan facility, and our revolving credit facility. After LIBOR is phased out, the interest rates for these obligations might be subject to change. The replacement of LIBOR with an alternative benchmark reference rate may adversely affect interest rates and result in higher borrowing costs under these agreements and any future agreements.
41
Contractual Obligation and Commercial Commitments
As of December 31, 2019, we had the following contractual obligations and commercial commitments:
Payments Due by Period | |||||||||||||||||||
Contractual Obligations and Commercial Commitments | Total | 1 Year or Less | 2-3 Years | 4-5 Years | After 5 Years | ||||||||||||||
(in millions) | |||||||||||||||||||
Debt: | |||||||||||||||||||
Parent and wholly-owned subsidiaries (1) | $ | 3,631.6 | $ | 167.1 | $ | 671.2 | $ | 813.0 | $ | 1,980.3 | |||||||||
Partially-owned subsidiaries (1) | 1,289.3 | 52.2 | 121.7 | 284.3 | 831.1 | ||||||||||||||
Interest (2) | 812.4 | 194.5 | 297.8 | 202.3 | 117.8 | ||||||||||||||
Net of unamortized discount and debt issuance costs | 5,733.3 | 413.8 | 1,090.7 | 1,299.6 | 2,929.2 | ||||||||||||||
Operating leases: | |||||||||||||||||||
Leasing Group | 36.6 | 10.1 | 16.4 | 8.6 | 1.5 | ||||||||||||||
Other | 15.5 | 3.9 | 5.4 | 3.3 | 2.9 | ||||||||||||||
Obligations for purchase of goods and services (3) | 553.5 | 517.9 | 31.9 | 3.7 | — | ||||||||||||||
Other | 1.4 | 1.4 | — | — | — | ||||||||||||||
Total | $ | 6,340.3 | $ | 947.1 | $ | 1,144.4 | $ | 1,315.2 | $ | 2,933.6 | |||||||||
(1) Excludes unamortized discount and debt issuance costs.
(2) Includes fixed rate interest obligations and interest on variable rate debt based on the outstanding balances and the applicable rates at December 31, 2019.
(3) Includes $483.8 million in purchase obligations for raw materials and components, primarily by the Rail Products Group.
As of December 31, 2019 and 2018, we had $5.0 million and $11.8 million, respectively, of tax liabilities, including interest and penalties, related to uncertain tax positions. Because of the high degree of uncertainty regarding the timing of future cash outflows associated with these liabilities, we are unable to estimate the years in which settlement will occur with the respective taxing authorities, and, accordingly, such amounts are excluded from the table above. See Note 9 of the Consolidated Financial Statements.
On September 4, 2019, our Board of Directors approved the termination of the Pension Plan, effective December 31, 2019. The Pension Plan is expected to be settled between late 2020 and early 2021, subject to required governmental approvals. Any potential cash contribution that may be required to settle all of the Pension Plan’s obligations, is not expected to exceed $15.0 million and is excluded from the table above. See Note 10 of the Consolidated Financial Statements.
42
Critical Accounting Policies and Estimates
Management's Discussion and Analysis of Financial Condition and Results of Operations discusses our consolidated financial statements, which have been prepared in accordance with accounting principles generally accepted in the U.S. The preparation of these consolidated financial statements requires management to make estimates and assumptions that affect the reported amounts of assets and liabilities, the disclosure of contingent assets and liabilities at the date of the financial statements, and the reported amounts of revenues and expenses during the reporting period. Management bases its estimates and judgments on historical experience and on various other factors that are believed to be reasonable under the circumstances, the results of which form the basis for making judgments about the carrying values of assets and liabilities that are not readily apparent from other sources. Actual results may differ from these estimates under different assumptions or conditions.
We believe the following critical accounting policies, among others, affect our more significant judgments and estimates used in the preparation of our consolidated financial statements.
Estimate Description | Judgment and/or Uncertainty | Potential Impact if Results Differ | ||
Income Taxes We account for income taxes under the asset and liability method prescribed by ASC 740. Deferred tax assets and liabilities are recognized for the future tax consequences attributable to temporary differences between the financial statement carrying amount of existing assets and liabilities and their respective tax bases and other tax attributes using currently enacted tax rates. The effect of a change in tax rates on deferred tax assets and liabilities is recognized in the provision for income taxes in the period that includes the enactment date. Our net deferred tax liabilities totaled $780.1 million as of December 31, 2019, which includes valuation allowances of $19.5 million. For further information regarding income taxes, see Note 9 of the Consolidated Financial Statements. | Management is required to estimate the timing of the recognition of deferred tax assets and liabilities, make assumptions about the future deductibility of deferred tax assets and assess deferred tax liabilities based on enacted law and tax rates for the appropriate tax jurisdictions to determine the amount of such deferred tax assets and liabilities. We assess whether a valuation allowance should be established against deferred tax assets based on consideration of all available evidence, both positive and negative, using a more likely than not standard. This assessment considers, among other matters: the nature, frequency and severity of recent losses; a forecast of future profitability; the duration of statutory carryback and carryforward periods; our experience with tax attributes expiring unused; and tax planning alternatives. | Changes in the calculated deferred tax assets and liabilities may occur in certain circumstances, including statutory income tax rate changes, statutory tax law changes or changes in our structure or tax status. If such changes take place, there is a risk that our effective tax rate could increase or decrease in any period, impacting our net earnings. | ||
43
Estimate Description | Judgment and/or Uncertainty | Potential Impact if Results Differ | ||
Pensions We sponsor defined benefit plans which provide retirement income and death benefits for certain eligible employees. Substantially all of the accrued benefits of our remaining pension plans were frozen in 2009, with all qualified pension plans frozen as of December 31, 2019. Our pension costs and liabilities are primarily determined using actuarial assumptions regarding the expected rate of return on plan assets and the discount rate used to determine the present value of future benefit obligations. In September 2019, our Board of Directors approved the termination of our Pension Plan, effective December 31, 2019. The Pension Plan is expected to be settled between late 2020 and early 2021, subject to required governmental approvals. As of December 31, 2019, our benefit obligations and plan assets were valued at $557.9 million and $548.5 million, respectively. For further information regarding our Pension Plan, see Note 10 of the Consolidated Financial Statements. | Pension assumptions are reviewed annually by outside actuaries and our management. The obligation discount rate assumption is determined by deriving a single discount rate from a theoretical settlement portfolio of high quality corporate bonds sufficient to provide for the plans' projected benefit payments. The expected rate of return on plan assets is an assumption reflecting the anticipated weighted average rate of earnings on the portfolio. To arrive at this rate, estimates were developed based upon the anticipated performance of the plan's assets. In anticipation of the planned settlement of the Pension Plan, our benefit obligations as of December 31, 2019 were valued based on the amounts expected to be required to settle these obligations, including assumptions regarding the portion of obligations expected to be settled through lump sum payments or annuity contracts, and the current estimates of the cost to purchase such annuity contracts. | For the year ended December 31, 2019, a 0.5% reduction to the assumed rate of return on plan assets or a 0.5% reduction in the discount rate would have resulted in an increase in our annual pension expense of $2.3 million and $0.3 million, respectively. As of December 31, 2019, a 0.5% reduction to the discount rate would have resulted in an increase in our projected benefit obligations of $38.7 million. Alternatively, a 0.5% increase in the discount rate would have resulted in a decrease in our projected benefit obligations of $34.7 million. | ||
Goodwill Goodwill is required to be tested for impairment at least annually, or on an interim basis if events or circumstances change indicating that the carrying amount of the goodwill might be impaired. The quantitative goodwill impairment test is a two-step process with step one requiring the comparison of the reporting unit's estimated fair value with the carrying amount of its net assets. If necessary, step two of the impairment test determines the amount of goodwill impairment to be recorded when the reporting unit's recorded net assets exceed its fair value. Impairment is assessed at the “reporting unit” level by applying a fair value-based test for each unit with recorded goodwill. Goodwill totaled $208.8 million as of December 31, 2019. | The estimates and judgments that most significantly affect the fair value calculations are assumptions related to revenue and operating profit results, discount rates, terminal growth rates and exit multiples. We consider these to be Level 3 inputs in the fair value hierarchy, as they involve unobservable inputs for which there is little or no market data and thus require management to develop its own assumptions. | We believe that the assumptions used in our impairment analysis are reasonable; however, given the uncertainties of the economy and its potential impact on our businesses, there can be no assurance that our estimates and assumptions regarding the fair value of our reporting units will prove to be accurate predictions of the future. Additionally, variations in any of these assumptions may result in different calculations in fair value that could result in an impairment charge. Based on our annual goodwill impairment test performed at the reporting unit level as of December 31, 2019, we concluded that there was no impairment of goodwill and that none of the reporting units evaluated was at risk of failing the first step of the goodwill impairment test. A reporting unit is considered to be at risk if its estimated fair value does not exceed the carrying value of its net assets by 10% or more. An increase in the discount rate or a reduction to the terminal growth rate of 100 basis points would not have resulted in an impairment of goodwill for any of our reporting units. | ||
44
Estimate Description | Judgment and/or Uncertainty | Potential Impact if Results Differ | ||
Long-lived Assets We periodically evaluate the carrying value of long-lived assets for potential impairment. We assess the recoverability of long-lived assets to be held and used by comparing the carrying value of the assets to the undiscounted future net cash flows we expect the assets to generate. If the recoverability test indicates that an impairment exists, we would recognize an impairment charge equal to the amount by which the carrying value exceeds the fair value. As of December 31, 2019, our net property, plant, and equipment totaled $7.1 billion, and the net book value of our amortizing intangible assets totaled $18.7 million. | The estimates and judgments that most significantly affect the fair value calculations in our recoverability test include assumptions regarding revenue and operating profit results; the remaining useful life over which an asset is expected to generate cash flows; and expectations regarding lease rates, lease renewals, and lease fleet utilization. The measurement of an impairment loss involves a number of management judgments, including the selection of an appropriate discount rate, consideration of market quotes for comparable assets as available, and estimates regarding final disposition proceeds. | If actual results are not consistent with management's estimates and assumptions used to calculate estimated future cash flows, we could be exposed to impairment losses that may be material. We believe that the assumptions used in our impairment analysis are reasonable; however, given the uncertainties of the economy and its potential impact on our businesses, it is possible that impairments of remaining long-lived assets may be required in future periods as a result of changes in our operating results or our assumptions. | ||
Variable Interest Entities We continuously evaluate our investments and other contractual arrangements with third party entities to determine if our variable interests are considered a variable interest entity ("VIE"). Consolidation is required for VIEs in which we are the primary beneficiary. We have determined that we are the primary beneficiary for TRIP Holdings and RIV 2013. At December 31, 2019, the carrying value of our investment in TRIP Holdings and RIV 2013 totaled $186.5 million. For further information regarding our partially-owned leasing subsidiaries, see Note 5 of the Consolidated Financial Statements. | The determination of whether an entity is considered a VIE and, if so, if we are the primary beneficiary of the VIE, is highly subjective and is dependent on the specific facts and circumstances of each investment. Factors considered in these assessments include, but are not limited to, the entity's structure and equity ownership, the contractual terms, the key decision making powers, and the obligation to absorb losses or the right to receive benefits of the VIE. | Changes in the design or nature of the activities of a VIE, or our involvement with a VIE, could result in a change in conclusion of our status as a primary beneficiary. Such change could result in the consolidation or deconsolidation of the subsidiary, thus impacting financial results. | ||
Insurance We are effectively self-insured for workers' compensation and employee health care claims. Third-party administrators process all such claims. As of December 31, 2019, our liabilities associated with workers' compensation and group medical insurance were $58.5 million and $7.0 million, respectively. | We accrue our workers' compensation and group medical liabilities based upon independent actuarial studies. These liabilities are calculated based upon loss development factors, which contemplate a number of variables, including claims history and expected trends. These loss development factors are determined in consultation with third-party actuaries. | To the extent actuarial assumptions change and claims experience rates differ from historical rates, our liability may change. A 10% change in our insurance liabilities could impact net earnings by approximately $4.5 million. | ||
45
Estimate Description | Judgment and/or Uncertainty | Potential Impact if Results Differ | ||
Contingencies and Litigation We are involved in claims and lawsuits incidental to our business arising from various matters, including product warranty, personal injury, environmental issues, workplace laws, and various governmental regulations. We evaluate our exposure to such matters periodically and establish accruals for these contingencies when a range of loss can be reasonably estimated. As of December 31, 2019, the range of reasonably possible losses for such matters is $21.6 million to $35.3 million, which includes our rights in indemnity and recourse to third parties of approximately $15.2 million. For further information regarding our contingencies and litigation matters, see Note 15 of the Consolidated Financial Statements. | Assessments of contingencies are based on information obtained from internal and external legal counsel, including recent legal decisions and loss experience in similar situations. Based on information currently available with respect to such claims and lawsuits, including information as to which we are aware but for which we have not been served with legal process, it is management's opinion that the ultimate outcome of all such claims and litigation, including settlements, in aggregate will not have a material adverse effect on our results of operations or financial condition. | Due to the uncertain nature of these matters, there can be no assurance that we will not become involved in future litigation or other proceedings or, if we were found to be responsible or liable in any litigation or proceeding, that such costs would not be material to us. Additionally, changes in claims and lawsuits filed, settled or dismissed and differences between actual and estimated settlement costs or our rights in indemnity and recourse to third parties could impact operating results. | ||
46
Non-GAAP Financial Measures
We have included financial measures compiled in accordance with GAAP and certain non-GAAP measures in this Annual Report on Form 10-K to provide management and investors with additional information regarding our financial results. Non-GAAP measures should not be considered in isolation or as a substitute for our reporting results prepared in accordance with GAAP and, as calculated, may not be comparable to other similarly titled measures for other companies. For each non-GAAP financial measure, we provide a reconciliation to the most comparable GAAP measure.
Pre-Tax Return on Equity
Pre-Tax Return on Equity (“Pre-Tax ROE”) is defined as a ratio for which (i) the numerator is calculated as income from continuing operations, adjusted to exclude the effects of the provision for income taxes and net income or loss attributable to noncontrolling interest, and (ii) the denominator is calculated as average stockholders’ equity (which excludes noncontrolling interest), adjusted to exclude accumulated other comprehensive income or loss. In the following table, the numerator and denominator of our Pre-Tax ROE calculation are reconciled to income from continuing operations before income taxes and stockholders’ equity, respectively, which are the most directly comparable GAAP financial measures. Management believes that Pre-Tax ROE is a useful measure to both management and investors as it provides an indication of the economic return on the Company’s investments over time, and considers the Company’s expected tax position in the near-term.
December 31, 2019 | December 31, 2018 | ||||||
($ in millions) | |||||||
Numerator: | |||||||
Income from continuing operations | $ | 139.2 | $ | 109.0 | |||
Provision for income taxes | 61.5 | 42.6 | |||||
Income from continuing operations before income taxes | 200.7 | 151.6 | |||||
Net (income) loss attributable to noncontrolling interest | 1.5 | (3.8 | ) | ||||
Adjusted Profit Before Tax | $ | 202.2 | $ | 147.8 | |||
Denominator: | |||||||
Total stockholders' equity | $ | 2,378.9 | $ | 2,562.0 | |||
Noncontrolling interest | (348.8 | ) | (351.2 | ) | |||
Accumulated other comprehensive loss | 153.1 | 116.8 | |||||
Adjusted Stockholders' Equity | $ | 2,183.2 | $ | 2,327.6 | |||
Average total stockholders' equity (1) | $ | 2,470.5 | $ | 2,562.0 | |||
Return on Equity (2) | 5.6 | % | 4.3 | % | |||
Average Adjusted Stockholders' Equity (1) | $ | 2,255.4 | $ | 2,327.6 | |||
Pre-Tax Return on Equity (3) | 9.0 | % | 6.3 | % | |||
(1) Average total stockholders' equity and average adjusted stockholders' equity as of and for the year ended December 31, 2018 is calculated using ending balances as of December 31, 2018 because taking an average of beginning and ending stockholders' equity in 2018 would not have given effect to the reduction to stockholders' equity that occurred as a result of the spin-off of Arcosa on November 1, 2018.
(2) Return on Equity is calculated as income from continuing operations divided by average total stockholders' equity.
(3) Pre-Tax Return on Equity is calculated as adjusted profit before tax divided by average adjusted stockholders' equity, each as defined and reconciled above.
47
Free Cash Flow
Free Cash Flow before Capital expenditures – leasing ("Free Cash Flow") is defined as net cash provided by operating activities from continuing operations as computed in accordance with GAAP, plus cash proceeds from sales of leased railcars owned more than one year at the time of sale, less cash payments for manufacturing capital expenditures and dividends. We believe Free Cash Flow is useful to both management and investors as it provides a relevant measure of liquidity and a useful basis for assessing our ability to fund our operations and repay our debt. Free Cash Flow is reconciled to net cash provided by operating activities from continuing operations, the most directly comparable GAAP financial measure, in the following table.
Year Ended December 31, | |||||||
2019 | 2018 | ||||||
(in millions) | |||||||
Net cash provided by operating activities – continuing operations | $ | 396.7 | $ | 274.2 | |||
Add: | |||||||
Proceeds from railcar lease fleet sales owned more than one year at the time of sale | 205.7 | 230.5 | |||||
Adjusted Net Cash Provided by Operating Activities | $ | 602.4 | $ | 504.7 | |||
Less: | |||||||
Capital expenditures – manufacturing and other | (97.0 | ) | (37.3 | ) | |||
Dividends paid to common shareholders | (82.1 | ) | (77.4 | ) | |||
Free Cash Flow (before Capital expenditures – leasing) | $ | 423.3 | $ | 390.0 | |||
Recent Accounting Pronouncements
See Note 1 of the Consolidated Financial Statements for information about recent accounting pronouncements.
48
Item 7A. Quantitative and Qualitative Disclosures About Market Risk.
Our earnings could be affected by changes in interest rates due to the impact those changes have on our variable rate debt obligations, which represented 22.5% of our total debt as of December 31, 2019. If interest rates average one percentage point more in fiscal year 2020 than they did during 2019, our interest expense would increase by $5.3 million, after considering the effects of interest rate hedges. In comparison, at December 31, 2018, we estimated that if interest rates averaged one percentage point more in fiscal year 2019 than they did during 2018, our interest expense would increase by $6.4 million. The impact of an increase in interest rates was determined based on the impact of the hypothetical change in interest rates and scheduled principal payments on our variable-rate debt obligations as of December 31, 2019 and 2018. A one percentage point increase in the interest rate yield would decrease the fair value of the fixed rate debt by approximately $171.8 million. A one percentage point decrease in the interest rate yield would increase the fair value of the fixed rate debt by approximately $186.6 million.
We also may use derivative instruments to mitigate the impact of changes in natural gas and diesel fuel prices and changes in foreign currency exchange rates. Existing hedge transactions are based on the New York Mercantile Exchange for natural gas and heating oil. Foreign currency hedges are valued based on currency spot and forward rates and forward points. Hedge transactions are settled with the counterparty in cash. As of December 31, 2019, the effect of these transactions on the Consolidated Financial Statements for the periods presented in this Annual Report on Form 10-K was not significant.
In addition, we are subject to market risk related to our net investments in our foreign subsidiaries. The net investment in foreign subsidiaries as of December 31, 2019 was $94.4 million. The impact of such market risk exposures as a result of foreign exchange rate fluctuations has not historically been material to us.
49
Item 8. Financial Statements and Supplementary Data.
Trinity Industries, Inc.
Index to Financial Statements
Page | |
50
Report of Independent Registered Public Accounting Firm
The Board of Directors and Stockholders
Trinity Industries, Inc.
Opinion on the Financial Statements
We have audited the accompanying consolidated balance sheets of Trinity Industries, Inc. and subsidiaries (the Company) as of December 31, 2019 and 2018, the related consolidated statements of operations, comprehensive income, cash flows and stockholders' equity for each of the three years in the period ended December 31, 2019, and the related notes (collectively referred to as the "consolidated financial statements"). In our opinion, the consolidated financial statements present fairly, in all material respects, the financial position of the Company at December 31, 2019 and 2018, and the results of its operations and its cash flows for each of the three years in the period ended December 31, 2019, in conformity with U.S. generally accepted accounting principles.
We also have audited, in accordance with the standards of the Public Company Accounting Oversight Board (United States) (PCAOB), the Company's internal control over financial reporting as of December 31, 2019, based on criteria established in Internal Control – Integrated Framework issued by the Committee of Sponsoring Organizations of the Treadway Commission (2013 framework) and our report dated February 20, 2020 expressed an unqualified opinion thereon.
Basis for Opinion
These financial statements are the responsibility of the Company’s management. Our responsibility is to express an opinion on the Company’s financial statements based on our audits. We are a public accounting firm registered with the PCAOB and are required to be independent with respect to the Company in accordance with the U.S. federal securities laws and the applicable rules and regulations of the Securities and Exchange Commission and the PCAOB.
We conducted our audits in accordance with the standards of the PCAOB. Those standards require that we plan and perform the audit to obtain reasonable assurance about whether the financial statements are free of material misstatement, whether due to error or fraud. Our audits included performing procedures to assess the risks of material misstatement of the financial statements, whether due to error or fraud, and performing procedures that respond to those risks. Such procedures included examining, on a test basis, evidence regarding the amounts and disclosures in the financial statements. Our audits also included evaluating the accounting principles used and significant estimates made by management, as well as evaluating the overall presentation of the financial statements. We believe that our audits provide a reasonable basis for our opinion.
Critical Audit Matter
The critical audit matter communicated below is a matter arising from the current period audit of the financial statements that was communicated or required to be communicated to the audit committee and that: (1) relates to accounts or disclosures that are material to the financial statements and (2) involved our especially challenging, subjective or complex judgments. The communication of the critical audit matter does not alter in any way our opinion on the consolidated financial statements, taken as a whole, and we are not, by communicating the critical audit matter below, providing a separate opinion on the critical audit matter or on the accounts or disclosures to which it relates.
51
Defined Benefit Pension Obligation
Description of the Matter | At December 31, 2019, the Company’s defined benefit pension obligation was $557.9 million, and the fair value of pension plan assets were $548.5 million, resulting in an unfunded defined benefit pension obligation of $9.4 million. As described in Note 1 and Note 10 to the consolidated financial statements, the Board of Directors approved the termination of the Trinity Industries, Inc. Consolidated Pension Plan (the "Pension Plan"), effective December 31, 2019. Except for retirees currently receiving payments under the Pension Plan, participants will have the choice of receiving a single lump sum payment or an annuity from a highly-rated insurance company that will pay and administer future benefit payments. The Pension Plan is expected to be settled between late 2020 and early 2021, subject to required governmental approvals. The Company’s costs and liabilities related to the defined benefit pension obligation are primarily determined using actuarial assumptions regarding the expected rate of return on plan assets, the discount rate used to determine the present value of future obligations, and demographic assumptions regarding participant behavior, as well as assumptions related to the rate of election by participants to receive lump sum payments or annuities upon termination of the defined benefit pension plan in 2020 or 2021. Auditing the defined benefit pension obligation was complex due to the highly judgmental nature of the actuarial assumptions, specifically the discount rate, expected return on plan assets, and lump sum election rate for vested participants used in the Company’s measurement process. These assumptions had a significant effect on the projected benefit obligation. |
How We Addressed the Matter in Our Audit | We obtained an understanding, evaluated the design and tested the operating effectiveness of internal controls over the defined benefit pension obligation. This included management’s review of the defined benefit pension obligation calculations, the significant actuarial assumptions used and the data inputs provided to the actuary. To test the defined benefit pension obligation, we performed audit procedures that included, among others, evaluating the methodology used, the significant actuarial assumptions described above and the underlying data used by the Company. We compared the actuarial assumptions used by management to historical trends and evaluated the change in the defined benefit pension obligation from the prior year due to the change in service cost, interest cost, actuarial gains and losses, benefit payments, contributions and the impacts to the assumptions as a result of the announced plan termination. In addition, we involved our actuarial specialists to assist in evaluating management’s assumptions, including the methodology for determining the discount rate, the expected rate of return on plan assets, and the lump sum election rate. We also tested the completeness and accuracy of the underlying data, including the participant data used in the actuarial calculations. |
/s/ ERNST & YOUNG LLP |
We have served as the Company's auditor since 1958.
Dallas, Texas
February 20, 2020
52
Trinity Industries, Inc. and Subsidiaries
Consolidated Statements of Operations
Year Ended December 31, | |||||||||||
2019 | 2018 | 2017 | |||||||||
(in millions, except per share amounts) | |||||||||||
Revenues: | |||||||||||
Manufacturing | $ | $ | $ | ||||||||
Leasing | |||||||||||
Operating costs: | |||||||||||
Cost of revenues: | |||||||||||
Manufacturing | |||||||||||
Leasing | |||||||||||
Selling, engineering, and administrative expenses: | |||||||||||
Manufacturing | |||||||||||
Leasing | |||||||||||
Other | |||||||||||
Gains (losses) on dispositions of property: | |||||||||||
Net gains on railcar lease fleet sales owned more than one year at the time of sale | |||||||||||
Other | ( | ) | |||||||||
Restructuring activities | |||||||||||
Total operating profit | |||||||||||
Other (income) expense: | |||||||||||
Interest income | ( | ) | ( | ) | ( | ) | |||||
Interest expense | |||||||||||
Other, net | ( | ) | ( | ) | |||||||
Income from continuing operations before income taxes | |||||||||||
Provision (benefit) for income taxes: | |||||||||||
Current | ( | ) | ( | ) | |||||||
Deferred | ( | ) | |||||||||
( | ) | ||||||||||
Income from continuing operations | |||||||||||
Income (loss) from discontinued operations, net of provision (benefit) for income taxes of $(1.0), $30.7, and $73.1 | ( | ) | |||||||||
Net income | |||||||||||
Net income (loss) attributable to noncontrolling interest | ( | ) | |||||||||
Net income attributable to Trinity Industries, Inc. | $ | $ | $ | ||||||||
Basic earnings per common share: | |||||||||||
Income from continuing operations | $ | $ | $ | ||||||||
Income (loss) from discontinued operations | ( | ) | |||||||||
Basic net income attributable to Trinity Industries, Inc. | $ | $ | $ | ||||||||
Diluted earnings per common share: | |||||||||||
Income from continuing operations | $ | $ | $ | ||||||||
Income (loss) from discontinued operations | ( | ) | |||||||||
Diluted net income attributable to Trinity Industries, Inc. | $ | $ | $ | ||||||||
Weighted average number of shares outstanding: | |||||||||||
Basic | |||||||||||
Diluted | |||||||||||
See accompanying notes to Consolidated Financial Statements.
53
Trinity Industries, Inc. and Subsidiaries
Consolidated Statements of Comprehensive Income
Year Ended December 31, | |||||||||||
2019 | 2018 | 2017 | |||||||||
(in millions) | |||||||||||
Net income | $ | $ | $ | ||||||||
Other comprehensive income (loss): | |||||||||||
Derivative financial instruments: | |||||||||||
Unrealized losses arising during the period, net of tax benefit of $3.8, $3.0, and $0.2 | ( | ) | ( | ) | ( | ) | |||||
Reclassification adjustments for losses included in net income, net of tax benefit of $0.8, $0.4, and $0.7 | |||||||||||
Currency translation adjustment | |||||||||||
Defined benefit plans: | |||||||||||
Unrealized gains (losses) arising during the period, net of tax (benefit) expense of $(9.0), $(2.9), and $1.6 | ( | ) | ( | ) | |||||||
Amortization of net actuarial losses, net of tax benefit of $1.1, $1.1, and $1.5 | |||||||||||
( | ) | ( | ) | ||||||||
Comprehensive income | |||||||||||
Less: comprehensive income (loss) attributable to noncontrolling interest | ( | ) | |||||||||
Comprehensive income attributable to Trinity Industries, Inc. | $ | $ | $ | ||||||||
See accompanying notes to Consolidated Financial Statements.
54
Trinity Industries, Inc. and Subsidiaries
Consolidated Balance Sheets
December 31, 2019 | December 31, 2018 | ||||||
(in millions) | |||||||
ASSETS | |||||||
Cash and cash equivalents | $ | $ | |||||
Receivables, net of allowance of $12.6 and $19.9 | |||||||
Income tax receivable | |||||||
Inventories: | |||||||
Raw materials and supplies | |||||||
Work in process | |||||||
Finished goods | |||||||
Restricted cash, including partially-owned subsidiaries of $33.0 and $36.6 | |||||||
Property, plant, and equipment, at cost, including partially-owned subsidiaries of $2,065.3 and $2,032.0 | |||||||
Less accumulated depreciation, including partially-owned subsidiaries of $527.7 and $472.0 | ( | ) | ( | ) | |||
Goodwill | |||||||
Other assets | |||||||
Total assets | $ | $ | |||||
LIABILITIES AND STOCKHOLDERS' EQUITY | |||||||
Accounts payable | $ | $ | |||||
Accrued liabilities | |||||||
Debt: | |||||||
Recourse | |||||||
Non-recourse: | |||||||
Wholly-owned subsidiaries | |||||||
Partially-owned subsidiaries | |||||||
Deferred income | |||||||
Deferred income taxes | |||||||
Other liabilities | |||||||
Total liabilities | |||||||
Preferred stock – 1.5 shares authorized and unissued | |||||||
Common stock – shares authorized at December 31, 2019 and 2018 – 400.0; shares issued and outstanding at December 31, 2019 – 119.7; at December 31, 2018 – 133.3 | |||||||
Capital in excess of par value | |||||||
Retained earnings | |||||||
Accumulated other comprehensive loss | ( | ) | ( | ) | |||
Treasury stock – shares at December 31, 2019 and 2018 – 0.1 | ( | ) | ( | ) | |||
Noncontrolling interest | |||||||
Total stockholders' equity | |||||||
Total liabilities and stockholders' equity | $ | $ | |||||
See accompanying notes to Consolidated Financial Statements.
55
Trinity Industries, Inc. and Subsidiaries
Consolidated Statements of Cash Flows
Year Ended December 31, | |||||||||||
2019 | 2018 | 2017 | |||||||||
(in millions) | |||||||||||
Operating activities: | |||||||||||
Net income | $ | $ | $ | ||||||||
(Income) loss from discontinued operations, net of income taxes | ( | ) | ( | ) | |||||||
Adjustments to reconcile net income to net cash provided by operating activities: | |||||||||||
Depreciation and amortization | |||||||||||
Stock-based compensation expense | |||||||||||
Provision for deferred income taxes | ( | ) | |||||||||
Net gains on railcar lease fleet sales owned more than one year at the time of sale | ( | ) | ( | ) | ( | ) | |||||
(Gain) loss on dispositions of property and other assets | ( | ) | ( | ) | |||||||
Restructuring activities | |||||||||||
Non-cash interest expense | |||||||||||
Other | ( | ) | ( | ) | ( | ) | |||||
Changes in operating assets and liabilities: | |||||||||||
(Increase) decrease in receivables | ( | ) | |||||||||
(Increase) decrease in inventories | ( | ) | |||||||||
(Increase) decrease in other assets | ( | ) | ( | ) | ( | ) | |||||
Increase (decrease) in accounts payable | ( | ) | |||||||||
Increase (decrease) in accrued liabilities | ( | ) | |||||||||
Increase (decrease) in other liabilities | ( | ) | ( | ) | |||||||
Net cash provided by operating activities – continuing operations | |||||||||||
Net cash provided by (used in) operating activities – discontinued operations | ( | ) | |||||||||
Net cash provided by operating activities | |||||||||||
Investing activities: | |||||||||||
Decrease in short-term marketable securities | ( | ) | |||||||||
Proceeds from dispositions of property and other assets | |||||||||||
Proceeds from railcar lease fleet sales owned more than one year at the time of sale | |||||||||||
Capital expenditures – leasing, net of sold lease fleet railcars owned one year or less with a net cost of $319.3, $92.4, and $79.9 | ( | ) | ( | ) | ( | ) | |||||
Capital expenditures – manufacturing and other | ( | ) | ( | ) | ( | ) | |||||
Other | |||||||||||
Net cash used in investing activities – continuing operations | ( | ) | ( | ) | ( | ) | |||||
Net cash used in investing activities – discontinued operations | ( | ) | ( | ) | |||||||
Net cash used in investing activities | ( | ) | ( | ) | ( | ) | |||||
Financing activities: | |||||||||||
Payments to retire debt | ( | ) | ( | ) | ( | ) | |||||
Proceeds from issuance of debt | |||||||||||
Shares repurchased | ( | ) | ( | ) | ( | ) | |||||
Dividends paid to common shareholders | ( | ) | ( | ) | ( | ) | |||||
Purchase of shares to satisfy employee tax on vested stock | ( | ) | ( | ) | ( | ) | |||||
Distributions to noncontrolling interest | ( | ) | ( | ) | ( | ) | |||||
Other | ( | ) | |||||||||
Net cash provided by (used in) financing activities – continuing operations | ( | ) | ( | ) | |||||||
Cash distributions to Arcosa, Inc. | ( | ) | |||||||||
Net cash provided by (used in) financing activities | ( | ) | ( | ) | |||||||
Net (decrease) increase in cash, cash equivalents, and restricted cash | ( | ) | ( | ) | |||||||
Cash, cash equivalents, and restricted cash at beginning of period | |||||||||||
Cash, cash equivalents, and restricted cash at end of period | $ | $ | $ | ||||||||
Supplemental disclosure of cash flow information: | |||||||||||
Interest paid | $ | $ | $ | ||||||||
Income tax payments (refunds) | $ | ( | ) | $ | $ | ( | ) | ||||
Distribution of noncash net assets to Arcosa, Inc. | $ | $ | $ | ||||||||
Debt assumed in railcar purchase from unrelated seller | $ | $ | $ | ||||||||
See accompanying notes to Consolidated Financial Statements.
56
Trinity Industries, Inc. and Subsidiaries
Consolidated Statements of Stockholders' Equity
Common Stock | Capital in Excess of Par Value | Retained Earnings | Accumulated Other Comprehensive Loss | Treasury Stock | Trinity Stockholders’ Equity | Noncontrolling Interest | Total Stockholders’ Equity | ||||||||||||||||||||||||||||||
Shares | $0.01 Par Value | Shares | Amount | ||||||||||||||||||||||||||||||||||
(in millions, except par value and per common share amounts) | |||||||||||||||||||||||||||||||||||||
Balances at December 31, 2016 | $ | $ | $ | $ | ( | ) | ( | ) | $ | ( | ) | $ | $ | $ | |||||||||||||||||||||||
Net income | — | — | — | — | — | — | |||||||||||||||||||||||||||||||
Other comprehensive income | — | — | — | — | — | — | |||||||||||||||||||||||||||||||
Cash dividends declared on common stock (1) | — | — | — | ( | ) | — | — | — | ( | ) | — | ( | ) | ||||||||||||||||||||||||
Stock-based compensation expense | — | — | — | — | — | — | — | ||||||||||||||||||||||||||||||
Shares repurchased | — | — | — | — | ( | ) | ( | ) | ( | ) | — | ( | ) | ||||||||||||||||||||||||
Other restricted share activity | — | — | — | ( | ) | ( | ) | ( | ) | — | ( | ) | |||||||||||||||||||||||||
Stock options exercised | — | — | — | — | — | — | — | ||||||||||||||||||||||||||||||
Distributions to noncontrolling interest | — | — | — | — | — | — | — | ( | ) | ( | ) | ||||||||||||||||||||||||||
Retirement of treasury stock | ( | ) | — | ( | ) | — | — | ||||||||||||||||||||||||||||||
Shares issued for acquisition | — | — | — | — | — | — | |||||||||||||||||||||||||||||||
Other | — | — | ( | ) | — | — | — | ( | ) | ||||||||||||||||||||||||||||
Balances at December 31, 2017 | $ | $ | $ | $ | ( | ) | ( | ) | $ | ( | ) | $ | $ | $ | |||||||||||||||||||||||
Net income | — | — | — | — | — | — | |||||||||||||||||||||||||||||||
Other comprehensive (loss) income | — | — | — | — | ( | ) | — | — | ( | ) | ( | ) | |||||||||||||||||||||||||
Cash dividends declared on common stock (1) | — | — | — | ( | ) | — | — | — | ( | ) | — | ( | ) | ||||||||||||||||||||||||
Stock-based compensation expense | — | — | — | — | — | — | — | ||||||||||||||||||||||||||||||
Shares repurchased | — | — | ( | ) | — | ( | ) | ( | ) | ( | ) | — | ( | ) | |||||||||||||||||||||||
Other restricted share activity | — | — | — | ( | ) | ( | ) | ( | ) | — | ( | ) | |||||||||||||||||||||||||
Stock options exercised | — | — | — | — | — | — | — | ||||||||||||||||||||||||||||||
Distributions to noncontrolling interest | — | — | — | — | — | — | — | ( | ) | ( | ) | ||||||||||||||||||||||||||
Retirement of treasury stock | ( | ) | ( | ) | ( | ) | — | — | |||||||||||||||||||||||||||||
Cumulative effect of adopting new accounting standards | — | — | — | ( | ) | — | — | — | |||||||||||||||||||||||||||||
Redemption of convertible subordinated notes | — | — | ( | ) | — | — | — | — | ( | ) | — | ( | ) | ||||||||||||||||||||||||
Distribution of Arcosa, Inc. | — | — | — | ( | ) | — | — | ( | ) | — | ( | ) | |||||||||||||||||||||||||
Other | — | ( | ) | — | — | — | |||||||||||||||||||||||||||||||
Balances at December 31, 2018 | $ | $ | $ | $ | ( | ) | ( | ) | $ | ( | ) | $ | $ | $ | |||||||||||||||||||||||
Net income (loss) | — | — | — | — | — | — | ( | ) | |||||||||||||||||||||||||||||
Other comprehensive (loss) income | — | — | — | — | ( | ) | — | — | ( | ) | ( | ) | |||||||||||||||||||||||||
Cash dividends declared on common stock (1) | — | — | — | ( | ) | — | — | — | ( | ) | — | ( | ) | ||||||||||||||||||||||||
Stock-based compensation expense | — | — | — | — | — | — | — | ||||||||||||||||||||||||||||||
Shares repurchased | — | — | — | ( | ) | ( | ) | ( | ) | — | ( | ) | |||||||||||||||||||||||||
Other restricted share activity | — | — | — | ( | ) | ( | ) | ( | ) | — | ( | ) | |||||||||||||||||||||||||
Distributions to noncontrolling interest | — | — | — | — | — | — | — | ( | ) | ( | ) | ||||||||||||||||||||||||||
Retirement of treasury stock | ( | ) | ( | ) | ( | ) | ( | ) | — | — | |||||||||||||||||||||||||||
Cumulative effect of adopting new accounting standards | — | — | — | — | — | — | |||||||||||||||||||||||||||||||
Other | — | — | ( | ) | — | — | — | ( | ) | ( | ) | ||||||||||||||||||||||||||
Balances at December 31, 2019 | $ | $ | $ | $ | ( | ) | ( | ) | $ | ( | ) | $ | $ | $ | |||||||||||||||||||||||
(1) Dividends of $0.70 , $0.52 , and $0.50 per common share for the years ended December 31, 2019, 2018, and 2017.
See accompanying notes to Consolidated Financial Statements.
57
Trinity Industries, Inc. and Subsidiaries
Notes to Consolidated Financial Statements
Note 1. Summary of Significant Accounting Policies
Principles of Consolidation
The financial statements of Trinity Industries, Inc. and its consolidated subsidiaries (“Trinity,” “Company,” “we,” “our,” or "us") include the accounts of its wholly-owned subsidiaries and its partially-owned subsidiaries, TRIP Rail Holdings LLC ("TRIP Holdings") and RIV 2013 Rail Holdings LLC ("RIV 2013"), in which we have a controlling interest. All significant intercompany accounts and transactions have been eliminated.
Spin-off of Arcosa, Inc.
Upon completion of the spin-off of Arcosa, Inc. ("Arcosa") on November 1, 2018, the accounting requirements for reporting Arcosa as a discontinued operation were met. Accordingly, Arcosa's results of operations are presented as discontinued operations for all periods in this Form 10-K. See Note 2 for further information related to the spin-off transaction.
Revenue Recognition
Revenue is measured based on the allocation of the transaction price in a contract to satisfied performance obligations. The transaction price does not include any amounts collected on behalf of third parties. We recognize revenue when we satisfy a performance obligation by transferring control over a product or service to a customer. Payments for our products and services are generally due within normal commercial terms. The following is a description of principal activities from which we generate our revenue, separated by reportable segments. See Note 4 for a further discussion regarding our reportable segments.
Railcar Leasing and Management Services Group
In our Railcar Leasing and Management Services Group ("Leasing Group"), revenue from rentals and operating leases, including contracts that contain non-level fixed lease payments, is recognized monthly on a straight-line basis. Leases not classified as operating leases are generally considered sales-type leases as a result of an option to purchase.
We review our operating lease receivables for collectibility on a regular basis, taking into consideration changes in factors such as the lessee’s payment history, the financial condition of the lessee, and business and economic conditions in the industry in which the lessee operates. In the event that the collectibility of a receivable with respect to any lessee is no longer probable, we de-recognize the revenue and related receivable and recognize future revenue only when the lessee makes a rental payment. Contingent rents are recognized when the contingency is resolved.
Selling profit or loss associated with sales-type leases is recognized upon lease commencement, and a net investment in the sales-type lease is recorded on the Consolidated Balance Sheet. Interest income related to sales-type leases is recognized over the lease term using the effective interest method.
Revenue is recognized from the sales of railcars from the lease fleet on a gross basis in leasing revenues and cost of revenues if the railcar has been owned for one year or less at the time of sale. Sales of railcars from the lease fleet owned for more than one year are recognized as a net gain or loss from the disposal of a long-term asset. Revenue from servicing and management agreements is recognized as each performance period occurs.
We account for shipping and handling costs as activities to fulfill the promise to transfer the good; as such, these fees are recorded in revenue. The fees and costs of shipping and handling activities are accrued when the related performance obligation has been satisfied.
58
Rail Products Group
Our railcar manufacturing business recognizes revenue when the customer has submitted its certificate of acceptance and legal title of the railcar has passed to the customer. Certain long-term contracts for the sales of railcars include price adjustments based on steel-price indices; this amount represents variable consideration for which we are unable to estimate the final consideration until the railcar is delivered, at which time the pricing becomes fixed.
Within our maintenance services business, revenue is recognized over time as repair and maintenance projects are completed, using an input approach based on the costs incurred relative to the total estimated costs of performing the project. We recorded contract assets of $5.2 million and $10.2 million as of December 31, 2019 and 2018, respectively, related to unbilled revenues recognized on repair and maintenance services that have been performed, but for which the entire project has not yet been completed. These contract assets are included within the Receivables, net of allowance line in our Consolidated Balance Sheets.
All Other
Our highway products business recognizes revenue when shipment has occurred and legal title of the product has passed to the customer.
Unsatisfied Performance Obligations
The following table includes estimated revenue expected to be recognized in future periods related to performance obligations that are unsatisfied or partially satisfied as of December 31, 2019 and the percentage of the outstanding performance obligations as of December 31, 2019 expected to be delivered during 2020:
Unsatisfied performance obligations at December 31, 2019 | ||||||
Total Amount | Percent expected to be delivered in 2020 | |||||
(in millions) | ||||||
Rail Products Group: | ||||||
Products: | ||||||
External Customers | $ | |||||
Leasing Group | ||||||
$ | % | |||||
Maintenance Services | $ | % | ||||
Railcar Leasing and Management Services Group | $ | % | ||||
The remainder of the unsatisfied performance obligations for the Rail Products Group is expected to be delivered through 2023. Unsatisfied performance obligations for the Railcar Leasing and Management Services Group are related to servicing, maintenance, and management agreements and are expected to be performed through 2029.
59
Lease Accounting
Lessee
We are the lessee of operating leases predominantly for railcars, as well as office buildings, manufacturing equipment, and office equipment. Our operating leases have remaining lease terms ranging from one year to forty years , some of which include options to extend for up to five years , and some of which include options to terminate within one year . As of December 31, 2019, we had no finance leases in which we were the lessee.
The following table summarizes the impact of our operating leases on our Consolidated Financial Statements (in millions, except lease term and discount rate):
Year Ended December 31, 2019 | |||
Consolidated Statement of Operations | |||
Operating lease expense | $ | ||
Short-term lease expense | $ | ||
December 31, 2019 | |||
Consolidated Balance Sheet | |||
Right-of-use assets (1) | $ | ||
Lease liabilities (2) | $ | ||
Weighted average remaining lease term | |||
Weighted average discount rate | % | ||
Year Ended December 31, 2019 | |||
Consolidated Statement of Cash Flows | |||
Cash flows from operating activities | $ | ||
Right-of-use assets recognized in exchange for new lease liabilites | $ | ||
(1) Included in other assets in our Consolidated Balance Sheet
(2) Included in other liabilities in our Consolidated Balance Sheet
Future contractual minimum operating lease liabilities will mature as follows (in millions):
Leasing Group | Non-Leasing Group | Total | |||||||||
2020 | $ | $ | $ | ||||||||
2021 | |||||||||||
2022 | |||||||||||
2023 | |||||||||||
2024 | |||||||||||
Thereafter | |||||||||||
Total operating lease payments | $ | $ | $ | ||||||||
Less: Present value adjustment | ( | ) | |||||||||
Total operating lease liabilities | $ | ||||||||||
Lessor
Our Leasing Group enters into railcar operating leases with third parties with terms generally ranging between one year and ten years , although certain leases entered into in prior periods had lease terms of up to twenty years . The majority of our fleet operates on leases that earn fixed monthly lease payments. A portion of our fleet operates on per diem leases that earn usage-based variable lease payments. Some of our leases include options to extend the leases for up to five years , and a small percentage of our leases include options to terminate within one year with certain notice requirements and early termination penalties. Our sales-type leases include an option for the lessee to purchase the leased railcars with certain notice. As of December 31, 2019, non-Leasing Group operating leases were not significant, and we had no direct finance leases.
60
We manage risks associated with residual values of leased railcars by investing across a diverse portfolio of railcar types, staggering lease maturities within any given railcar type, avoiding concentration of railcar type and industry, and participating in active secondary markets. Additionally, our lease agreements contain normal wear and tear return condition provisions and high mileage thresholds designed to protect the value of our residual assets. Our lease agreements do not contain any material residual value guarantees or restrictive covenants.
The following table summarizes the impact of our leases on our Consolidated Statement of Operations (in millions):
Year Ended December 31, 2019 | |||
Operating lease revenues | $ | ||
Variable operating lease revenues | |||
Sales-type lease revenues | |||
Interest income on sales-type lease receivables | |||
Profit recognized at sales-type lease commencement | |||
Future contractual minimum lease receivables for sales-type leases will mature as follows (in millions):
2020 | $ | ||
2021 | |||
2022 | |||
2023 | |||
2024 | |||
Thereafter | |||
Total | $ | ||
Less: Unearned interest income | ( | ) | |
Net investment in sales-type leases (1) | $ | ||
(1) Included in other assets in our Consolidated Balance Sheet
Future contractual minimum revenues for operating leases will mature as follows (in millions):
2020 | $ | ||
2021 | |||
2022 | |||
2023 | |||
2024 | |||
Thereafter | |||
Total | $ | ||
Income Taxes
The liability method is used to account for income taxes. Deferred income taxes represent the tax effects of temporary differences between the carrying amounts of assets and liabilities for financial reporting purposes and the amounts used for income tax purposes. Valuation allowances reduce deferred tax assets to an amount that will more likely than not be realized.
We regularly evaluate the likelihood of realization of tax benefits derived from positions we have taken in various federal and state filings after consideration of all relevant facts, circumstances, and available information. For those tax positions that are deemed more likely than not to be sustained, we recognize the benefit we believe is cumulatively greater than 50% likely to be realized. To the extent that we were to prevail in matters for which accruals have been established or be required to pay amounts in excess of recorded reserves, the effective tax rate in a given financial statement period could be materially impacted.
Financial Instruments
We consider all highly liquid debt instruments to be either cash and cash equivalents if purchased with a maturity of three months or less, or short-term marketable securities if purchased with a maturity of more than three months and less than one year.
61
Financial instruments that potentially subject us to a concentration of credit risk are primarily cash investments including restricted cash and receivables. We place our cash investments in bank deposits and investment grade, short-term debt instruments and limit the amount of credit exposure to any one commercial issuer. Concentrations of credit risk with respect to receivables are limited due to control procedures that monitor the credit worthiness of customers, the large number of customers in our customer base, and their dispersion across different end markets and geographic areas. As receivables are generally unsecured, we maintain an allowance for doubtful accounts based upon the expected collectibility of all receivables. Receivable balances determined to be uncollectible are charged against the allowance. The carrying values of cash, receivables, and accounts payable are considered to be representative of their respective fair values.
Inventories
Inventories are valued at the lower of cost or net realizable value. Cost is determined principally on the first in first out method. Work in process and finished goods include material, labor, and overhead.
Property, Plant, and Equipment
Property, plant, and equipment are stated at cost and depreciated over their estimated useful lives using the straight-line method. The costs of ordinary maintenance and repair are charged to operating costs. The estimated useful lives are as follows:
Buildings and improvements | 3 – 30 years |
Leasehold improvements | The lesser of the term of the lease or 7 years |
Machinery and equipment | 2 – 10 years |
Information systems hardware and software | 2 – 5 years |
Railcars in our lease fleet | Generally 35 years |
As of early 2020, we are finalizing an assessment of the estimated useful lives and salvage value assumptions for the railcars in our lease fleet. Based upon analysis of historical fleet data, review of industry standards, and consideration of certain economic factors by railcar type, we have determined that it is appropriate to revise the useful lives and salvage values of certain railcar types in our lease fleet. We believe that the revised useful lives reflect the estimated economic lives of the railcars in our lease fleet. The net impact of these changes, which will become effective January 1, 2020, is expected to result in a change in the weighted average useful life of railcars in our lease fleet from approximately 34 years to approximately 37 years. This change will be accounted for as a change in accounting estimate, which is required to be accounted for on a prospective basis. Based on the composition of the lease fleet as of December 31, 2019, we expect this change to result in a net decrease in annual depreciation expense of between $27 million and $33 million for the year ended December 31, 2020.
Long-lived Assets
We periodically evaluate the carrying value of long-lived assets for potential impairment. The carrying value of long-lived assets is considered impaired when their carrying value is not recoverable through undiscounted future cash flows and the fair value of the assets is less than their carrying value. Fair value is determined primarily using the anticipated cash flows discounted at a rate commensurate with the risks involved or market quotes as available. Impairment losses on long-lived assets held for sale are determined in a similar manner, except that fair values are reduced by the estimated cost to dispose of the assets. Based on our evaluations, no impairment charges were determined to be necessary on assets held and used as of December 31, 2019 and 2018.
Goodwill and Intangible Assets
Goodwill is required to be tested for impairment at least annually, or on an interim basis if events or circumstances change indicating that the carrying amount of the goodwill might be impaired. The quantitative goodwill impairment test is a two-step process, with step one requiring the comparison of the reporting unit's estimated fair value with the carrying amount of its net assets. If necessary, step two of the impairment test determines the amount of goodwill impairment to be recorded when the reporting unit's recorded net assets exceed its fair value. Impairment is assessed at the reporting unit level by applying a fair value-based test for each unit with recorded goodwill. The estimates and judgments that most significantly affect the fair value calculations are assumptions, consisting of level three inputs, related to revenue and operating profit results, discount rates, terminal growth rates and exit multiples. As of December 31, 2019 and 2018, our annual impairment test of goodwill was completed at the reporting unit level, and no impairment charges were determined to be necessary.
The net book value of intangible assets totaled $18.7 million and $22.4 million as of December 31, 2019 and 2018, respectively, and included finite-lived intangible assets of $16.2 million and $19.9 million, respectively, which are
62
amortized over their estimated useful lives ranging from one year to twenty years . Based on our evaluations of intangible assets, no impairment charges were determined to be necessary as of December 31, 2019 and 2018.
Goodwill by segment is as follows:
December 31, 2019 | December 31, 2018 | ||||||
(in millions) | |||||||
Railcar Leasing and Management Services Group | $ | $ | |||||
Rail Products Group | |||||||
All Other | |||||||
$ | $ | ||||||
Restricted Cash
Restricted cash consists of cash and cash equivalents held either as collateral for our non-recourse debt and lease obligations or as security for the performance of certain product sales agreements. As such, they are restricted in use.
Investments in Affiliates
We continuously evaluate our investments and other contractual arrangements with third party entities to determine if our variable interests are considered a variable interest entity ("VIE"). Consolidation is required for VIEs in which we are the primary beneficiary. We have determined that we are the primary beneficiary for TRIP Holdings and RIV 2013. At December 31, 2019, the carrying value of our investment in TRIP Holdings and RIV 2013 totaled $186.5 million. For further information regarding our partially-owned leasing subsidiaries, see Note 5 of the Consolidated Financial Statements.
Other Investments
We hold certain other investments for which we do not have a controlling financial interest but have a significant influence over the financial and operating policies. The carrying values of our equity method investments totaled approximately $3.8 million and $3.4 million as of December 31, 2019 and 2018, respectively.
Insurance
We are effectively self-insured for workers' compensation and employee health care claims. A third party administrator is used to process claims. We accrue our workers' compensation and group medical liabilities based upon independent actuarial studies. These liabilities are calculated based upon loss development factors, which contemplate a number of variables, including claims history and expected trends.
Warranties
We provide various express, limited product warranties that generally range from one year to five years depending on the product. The warranty costs are estimated using a two-step approach. First, an engineering estimate is made for the cost of all claims that have been asserted by customers. Second, based on historical claims experience, a cost is accrued for all products still within a warranty period for which no claims have been filed. We provide for the estimated cost of product warranties at the time revenue is recognized related to products covered by warranties and assess the adequacy of the resulting reserves on a quarterly basis. The changes in the accruals for warranties for the years ended December 31, 2019, 2018, and 2017 are as follows:
Year Ended December 31, | |||||||||||
2019 | 2018 | 2017 | |||||||||
(in millions) | |||||||||||
Beginning balance | $ | $ | $ | ||||||||
Warranty costs incurred | ( | ) | ( | ) | ( | ) | |||||
Warranty originations and revisions | |||||||||||
Warranty expirations | ( | ) | |||||||||
Ending balance | $ | $ | $ | ||||||||
Foreign Currency Transactions
The functional currency of our Mexico operations is the United States dollar. Certain transactions in Mexico occur in currencies other than the United States dollar. The impact of foreign currency fluctuations on these transactions is recorded in other, net (income) expense in our Consolidated Statement of Operations.
63
Other Comprehensive Income (Loss)
Other comprehensive net income (loss) consists of foreign currency translation adjustments, unrealized gains and losses on our derivative financial instruments, and the net actuarial gains and losses of our defined benefit plans, the sum of which, together with net income (loss), constitutes comprehensive income (loss). See Note 12. All components are shown net of tax.
Recent Accounting Pronouncements
Adopted in 2019
ASU 2016-02 — In February 2016, the FASB issued ASU No. 2016-02, "Leases", ("ASC 842") which amended the existing accounting standards for lease accounting, including requiring lessees to recognize most leases on their balance sheets and making targeted changes to lessor accounting. ASC 842 is effective for public companies during interim and annual reporting periods beginning after December 15, 2018, with early adoption permitted. In July 2018, the FASB issued ASU No. 2018-11, which permitted entities to record the right-of-use asset and lease liability on the date of adoption, with no requirement to recast comparative periods.
We adopted ASC 842 effective January 1, 2019 using the optional transition method of recognizing a cumulative-effect adjustment to the opening balance of retained earnings on January 1, 2019. Therefore, comparative financial information was not adjusted and continues to be reported under the prior lease accounting guidance in ASC 840. We elected the transition relief package of practical expedients, and as a result, we did not assess 1) whether existing or expired contracts contain embedded leases, 2) lease classification for any existing or expired leases, and 3) whether lease origination costs qualified as initial direct costs. We elected the short-term lease practical expedient by establishing an accounting policy to exclude leases with a term of 12 months or less, as well as the land easement practical expedient for maintaining our current accounting policy for existing or expired land easements. For qualifying operating leases in which we are the lessor, we do not separate lease components for our leased railcars from non-lease components, which are comprised of stand-ready maintenance obligations. We did not elect the practical expedient to use hindsight in determining a lease term and impairment of right-of-use assets at the adoption date.
Upon adoption, we recognized right-of-use assets and corresponding lease liabilities of $47.0 million and $48.3 million, respectively, in our Consolidated Balance Sheet based on the present value of future minimum lease payments under operating leases for which we are the lessee. This excluded the impact of railcars that were previously under operating leases as of January 1, 2019 but which were purchased on January 14, 2019 and are now wholly-owned by our Leasing Group. Additionally, we recorded an adjustment to opening retained earnings of $17.7 million ($13.7 million, net of tax) related to the derecognition of deferred profit related to sale-leaseback transactions. Our accounting treatment under ASC 842 for leases in which we are the lessor remained substantially unchanged from our accounting treatment under ASC 840. The adoption of ASC 842 did not have a significant impact on our consolidated results of operations or cash flows.
ASU 2018-16 — In October 2018, the FASB issued ASU No. 2018-16, "Inclusion of the Secured Overnight Financing Rate (SOFR) Overnight Index Swap (OIS) Rate as a Benchmark Interest Rate for Hedge Accounting Purposes," which permits the use of the OIS rate based on SOFR as a U.S. benchmark interest rate for hedge accounting purposes under Topic 815. ASU 2018-16 is effective for public companies during interim and annual reporting periods beginning after December 15, 2019, with early adoption permitted. We adopted ASU 2018-16 effective January 1, 2019 on a prospective basis for qualifying new or redesignated hedges. The adoption did not have a significant impact on our Consolidated Financial Statements and did not impact pre-existing hedges.
Effective in 2020
ASU 2016-13 — In June 2016, the FASB issued ASU No. 2016-13, "Measurement of Credit Losses on Financial Instruments," which amends the impairment model by requiring entities to use a forward-looking approach based on expected losses rather than incurred losses to estimate credit losses on certain types of financial instruments, including trade receivables. This approach may result in the earlier recognition of allowances for losses. In November 2018, the FASB issued ASU No. 2018-19, "Codification Improvements to Topic 326, Financial Instruments—Credit Losses," which excludes operating lease receivables from the scope of ASU 2016-13. ASU 2016-13 is effective for public companies during interim and annual reporting periods beginning after December 15, 2019, with early adoption permitted. We are adopting ASU 2016-13 effective January 1, 2020, and we do not currently expect a material opening retained earnings adjustment as a result of the adoption. Further, we do not expect the ongoing application of ASU 2016-13 to materially impact our Consolidated Financial Statements.
64
ASU 2018-15 — In August 2018, the FASB issued ASU No. 2018-15, "Customer's Accounting for Implementation Costs Incurred in a Cloud Computing Arrangement That Is a Service Contract," which aligns the accounting for costs incurred to implement a cloud computing arrangement that is a service arrangement with the guidance on capitalizing costs associated with developing or obtaining internal-use software. ASU 2018-15 is effective for public companies during interim and annual reporting periods beginning after December 15, 2019, with early adoption permitted. We adopted ASU 2018-15 effective January 1, 2020 on a prospective basis. The adoption is not expected to have a significant impact on our Consolidated Financial Statements.
The preparation of financial statements in conformity with generally accepted accounting principles requires management to make estimates and assumptions that affect the reported amounts of assets and liabilities and disclosure of contingent assets and liabilities at the date of the financial statements as well as the reported amounts of revenues and expenses during the reporting period. Actual results could differ from those estimates.
Note 2. Discontinued Operations
On November 1, 2018, we completed the spin-off of Arcosa. Upon completion of the spin-off transaction, the accounting requirements for reporting Arcosa as a discontinued operation were met, and, accordingly, Arcosa's historical results have been reclassified to discontinued operations for the periods presented herein.
In connection with the spin-off transaction, Trinity and Arcosa entered into various agreements to effect the distribution and provide a framework for their relationship after the separation, including a separation and distribution agreement, a transition services agreement, an employee matters agreement, a tax matters agreement, and an intellectual property matters agreement. Trinity is also party to certain commercial agreements with Arcosa entities. These agreements have various durations ranging between one and eighteen months. We have determined that the continuing cash flows generated by these agreements do not constitute significant continuing involvement in the operations of Arcosa. The amount billed for transition services provided under the above agreements was not material to our results of operations for the years ended December 31, 2019 and 2018.
We incurred $2.9 million, $36.3 million, and $14.2 million in spin-off related transaction costs during the years ended December 31, 2019, 2018, and 2017, respectively, of which $2.9 million, $31.2 million, and $14.2 million are included in income from discontinued operations, net of income taxes in our Consolidated Statements of Operations. These costs primarily relate to the preparation of regulatory filings, investment banking fees, professional fees associated with various legal, accounting, and tax matters related to the spin-off, and other separation activities within the finance, tax, legal, and information technology functions.
Arcosa is a stand-alone public company that separately reports its financial results. Due to differences between the basis of presentation for discontinued operations and the basis of presentation as a stand-alone company, the financial results of Arcosa included within discontinued operations may not be indicative of the actual financial results of Arcosa as a stand-alone company.
The following is a summary of operating results included in income (loss) from discontinued operations for the years ended December 31, 2019, 2018, and 2017:
Year Ended December 31, | |||||||||||
2019 | 2018 | 2017 | |||||||||
(in millions) | |||||||||||
Revenues | $ | $ | $ | ||||||||
Cost of revenues | |||||||||||
Selling, engineering, and administrative expenses | |||||||||||
Other (income) expense | ( | ) | |||||||||
Income (loss) from discontinued operations before income taxes | ( | ) | |||||||||
Provision (benefit) for income taxes | ( | ) | |||||||||
Income (loss) from discontinued operations, net of income taxes | $ | ( | ) | $ | $ | ||||||
65
Note 3. Derivative Instruments and Fair Value Accounting
Derivative Instruments
We use derivative instruments to mitigate the impact of changes in interest rates, both in anticipation of future debt issuances and to offset interest rate variability of certain floating rate debt issuances outstanding. We also may use derivative instruments to mitigate the impact of changes in natural gas and diesel fuel prices and changes in foreign currency exchange rates. Derivative instruments that are designated and qualify as cash flow hedges are accounted for by recording the effective portion of the gain or loss on the derivative instrument in accumulated other comprehensive loss ("AOCL") as a separate component of stockholders' equity and reclassified into earnings in the period during which the hedged transaction affects earnings. We continuously monitor our derivative positions and the credit ratings of our counterparties and do not anticipate losses due to non-performance. See Note 8 for a description of our debt instruments.
Interest Rate Hedges
Included in accompanying balance sheet at December 31, 2019 | ||||||||||||||||||
Notional Amount | Interest Rate (1) | Asset/(Liability) | AOCL – loss/ (income) | Noncontrolling Interest | ||||||||||||||
(in millions, except %) | ||||||||||||||||||
Expired hedges: | ||||||||||||||||||
2006 secured railcar equipment notes | $ | % | $ | $ | ( | ) | $ | |||||||||||
2018 secured railcar equipment notes | $ | % | $ | $ | $ | |||||||||||||
TRIP Holdings warehouse loan | $ | % | $ | $ | $ | |||||||||||||
TRIP Master Funding secured railcar equipment notes | $ | % | $ | $ | $ | |||||||||||||
2017 promissory notes – interest rate cap | $ | % | $ | $ | ( | ) | $ | |||||||||||
Open hedge: | ||||||||||||||||||
2017 promissory notes – interest rate swap | $ | % | $ | ( | ) | $ | $ | |||||||||||
(1) Weighted average fixed interest rate, except for the interest rate cap on the 2017 promissory notes.
Effect on interest expense – increase/(decrease) | |||||||||||||||
Year Ended December 31, | Expected effect during next twelve months(1) | ||||||||||||||
2019 | 2018 | 2017 | |||||||||||||
(in millions) | |||||||||||||||
Expired hedges: | |||||||||||||||
2006 secured railcar equipment notes | $ | ( | ) | $ | ( | ) | $ | ( | ) | $ | ( | ) | |||
2018 secured railcar equipment notes | $ | $ | $ | $ | |||||||||||
TRIP Holdings warehouse loan | $ | $ | $ | $ | |||||||||||
TRIP Master Funding secured railcar equipment notes | $ | $ | $ | $ | |||||||||||
2017 promissory notes – interest rate cap | $ | ( | ) | $ | $ | $ | ( | ) | |||||||
Open hedge: | |||||||||||||||
2017 promissory notes – interest rate swap | $ | $ | $ | $ | |||||||||||
(1) Based on the fair value of open hedges as of December 31, 2019.
66
Other Derivatives
Included in accompanying balance sheet at December 31, 2019 | Effect on cost of revenues –increase/(decrease) | ||||||||||||||||||
Notional Amount | Asset/(Liability) | AOCL – loss/(income) | Year Ended December 31, 2019 | Expected effect during next twelve months(1) | |||||||||||||||
(in millions) | |||||||||||||||||||
Foreign currency hedge | $ | $ | $ | ( | ) | $ | $ | ||||||||||||
(1) Based on the fair value of open hedges as of December 31, 2019.
The effect of commodity hedge transactions was immaterial to the Consolidated Financial Statements for all periods presented herein.
Fair Value Measurements
Fair value is defined as the exchange price that would be received for an asset or paid to transfer a liability (an exit price) in the principal or most advantageous market for that asset or liability in an orderly transaction between market participants on the measurement date. An entity is required to establish a fair value hierarchy that maximizes the use of observable inputs and minimizes the use of unobservable inputs when measuring fair value. The three levels of inputs that may be used to measure fair value are listed below.
Level 1 — This level is defined as quoted prices in active markets for identical assets or liabilities. Our cash equivalents and restricted cash are instruments of the U.S. Treasury or highly-rated money market mutual funds. The assets measured as Level 1 in the fair value hierarchy are summarized below:
Level 1 | |||||||
December 31, 2019 | December 31, 2018 | ||||||
(in millions) | |||||||
Assets: | |||||||
Cash equivalents | $ | $ | |||||
Restricted cash | |||||||
Total assets | $ | $ | |||||
Level 2 — This level is defined as observable inputs other than Level 1 prices such as quoted prices for similar assets or liabilities; quoted prices in markets that are not active; or other inputs that are observable or can be corroborated by observable market data for substantially the full term of the assets or liabilities. Interest rate hedges are valued at exit prices obtained from each counterparty. Foreign currency hedges are valued at exit prices obtained from each counterparty, which are based on currency spot and forward rates and forward points. The liabilities measured as Level 2 in the fair value hierarchy are summarized below:
Level 2 | |||||||
December 31, 2019 | December 31, 2018 | ||||||
(in millions) | |||||||
Assets: | |||||||
Foreign currency hedge (1) | $ | $ | |||||
Total assets | $ | $ | |||||
Liabilities: | |||||||
Interest rate hedge (2) | $ | $ | |||||
Total liabilities | $ | $ | |||||
(1) Included in other assets in our Consolidated Balance Sheets.
(2) Included in accrued liabilities in our Consolidated Balance Sheets.
67
Level 3 — This level is defined as unobservable inputs that are supported by little or no market activity and that are significant to the fair value of the assets or liabilities. As of December 31, 2019 and 2018, we have no assets measured as Level 3 in the fair value hierarchy, except as described in Note 10 and Note 11.
See Note 8 for the estimated fair values of our debt instruments. The fair values of all other financial instruments are estimated to approximate carrying value.
Note 4. Segment Information
We report our operating results in three principal business segments: (1) the Railcar Leasing and Management Services Group, which owns and operates a fleet of railcars and provides third-party fleet leasing, management, and administrative services; (2) the Rail Products Group, which manufactures and sells railcars and related parts and components, and provides railcar maintenance and modification services; and (3) All Other. The All Other segment includes our highway products business; our logistics business; legal, environmental, and maintenance costs associated with non-operating facilities; and other peripheral businesses. Gains and losses from the sale of property, plant, and equipment are included in the operating profit of each respective segment. Our Chief Operating Decision Maker ("CODM") regularly reviews the operating results of our reportable segments in order to assess performance and allocate resources. Our CODM does not consider restructuring activities when evaluating segment operating results; therefore, restructuring activities are not allocated to segment profit or loss.
Sales and related net profits ("deferred profit") from the Rail Products Group to the Leasing Group are recorded in the Rail Products Group and eliminated in consolidation and are reflected in "Eliminations — Lease Subsidiary" in the tables below. Sales between these groups are recorded at prices comparable to those charged to external customers, taking into consideration quantity, features, and production demand. Amortization of deferred profit on railcars sold to the Leasing Group is included in the operating profit of the Leasing Group, resulting in the recognition of depreciation expense based on our original manufacturing cost of the railcars. Sales of railcars from the lease fleet are included in the Leasing Group, with related gains and losses computed based on the net book value of the original manufacturing cost of the railcars.
The financial information for these segments is shown in the tables below (in millions). We operate principally in North America.
Year Ended December 31, 2019 | |||||||||||||||||||||||||||
Railcar Leasing and Management Services Group | Rail Products Group | All Other | Corporate | Eliminations — Lease Subsidiary(1) | Eliminations — Other | Consolidated Total | |||||||||||||||||||||
External Revenue | $ | $ | $ | $ | — | $ | — | $ | — | $ | |||||||||||||||||
Intersegment Revenue | — | ( | ) | ( | ) | — | |||||||||||||||||||||
Total Revenues | $ | $ | $ | $ | — | $ | ( | ) | $ | ( | ) | $ | |||||||||||||||
Depreciation & Amortization | $ | $ | $ | $ | $ | $ | $ | ||||||||||||||||||||
Capital Expenditures | $ | $ | $ | $ | $ | $ | $ | ||||||||||||||||||||
Year Ended December 31, 2018 | |||||||||||||||||||||||||||
Railcar Leasing and Management Services Group | Rail Products Group | All Other | Corporate | Eliminations — Lease Subsidiary(1) | Eliminations — Other | Consolidated Total | |||||||||||||||||||||
External Revenue | $ | $ | $ | $ | — | $ | — | $ | — | $ | |||||||||||||||||
Intersegment Revenue | — | ( | ) | ( | ) | — | |||||||||||||||||||||
Total Revenues | $ | $ | $ | $ | — | $ | ( | ) | $ | ( | ) | $ | |||||||||||||||
Depreciation & Amortization | $ | $ | $ | $ | $ | $ | $ | ||||||||||||||||||||
Capital Expenditures | $ | $ | $ | $ | $ | $ | $ | ||||||||||||||||||||
68
Year Ended December 31, 2017 | |||||||||||||||||||||||||||
Railcar Leasing and Management Services Group | Rail Products Group | All Other | Corporate | Eliminations — Lease Subsidiary(1) | Eliminations — Other | Consolidated Total | |||||||||||||||||||||
External Revenue | $ | $ | $ | $ | — | $ | — | $ | — | $ | |||||||||||||||||
Intersegment Revenue | — | ( | ) | ( | ) | — | |||||||||||||||||||||
Total Revenues | $ | $ | $ | $ | — | $ | ( | ) | $ | ( | ) | $ | |||||||||||||||
Depreciation & Amortization | $ | $ | $ | $ | $ | $ | ( | ) | $ | ||||||||||||||||||
Capital Expenditures | $ | $ | $ | $ | $ | $ | $ | ||||||||||||||||||||
The reconciliation of segment operating profit or loss to consolidated net income is as follows:
Year Ended December 31, | |||||||||||
2019 | 2018 | 2017 | |||||||||
(in millions) | |||||||||||
Operating profit: | |||||||||||
Railcar Leasing and Management Services Group | $ | $ | $ | ||||||||
Rail Products Group | |||||||||||
All Other | |||||||||||
Segment Totals before Eliminations, Corporate Expenses, and Restructuring activities | |||||||||||
Corporate | ( | ) | ( | ) | ( | ) | |||||
Restructuring activities | ( | ) | |||||||||
Eliminations – Lease Subsidiary (1) | ( | ) | ( | ) | ( | ) | |||||
Eliminations – Other | ( | ) | ( | ) | |||||||
Consolidated operating profit | $ | $ | $ | ||||||||
Other (income) expense | |||||||||||
Provision (benefit) for income taxes | ( | ) | |||||||||
Income (loss) from discontinued operations, net of income taxes | ( | ) | |||||||||
Net income | $ | $ | $ | ||||||||
(1) Historically, "Eliminations – Lease Subsidiary" has included only railcar shipments from the Rail Products Group to the Leasing Group; however, beginning January 1, 2018, we elected to include the sales from our maintenance services business, previously reflected in Eliminations – Other, in "Eliminations – Lease Subsidiary." Previously reported amounts have been recast to conform to the current presentation.
Total assets for these segments is shown in the table below.
December 31, 2019 | December 31, 2018 | ||||||
(in millions) | |||||||
Railcar Leasing and Management Services Group | $ | $ | |||||
Rail Products Group | |||||||
All Other | |||||||
Segment Totals before Eliminations and Corporate | |||||||
Corporate | |||||||
Eliminations – Lease Subsidiary | ( | ) | ( | ) | |||
Eliminations – Other | ( | ) | ( | ) | |||
Total Assets | $ | $ | |||||
Corporate assets are composed of cash and cash equivalents, short-term marketable securities, notes receivable, certain property, plant, and equipment, and other assets.
We operate principally in North America. Our foreign operations are primarily located in Mexico. Revenues and operating profit for our Mexico operations for the years ended December 31, 2019, 2018, and 2017 were not significant in relation to the Consolidated Financial Statements. Total assets for our Mexico operations as of December 31, 2019 and 2018 are $136.0 million and $116.0 million, respectively. Total long-lived assets for our Mexico operations as of December 31, 2019 and 2018 are $112.2 million and $84.2 million, respectively.
69
Note 5. Partially-Owned Leasing Subsidiaries
Through our wholly-owned subsidiary, Trinity Industries Leasing Company (“TILC”), we formed two subsidiaries, TRIP Holdings and RIV 2013, for the purpose of providing railcar leasing services in North America for institutional investors. Each of TRIP Holdings and RIV 2013 are direct, partially-owned subsidiaries of TILC in which we have a controlling interest. Each is governed by a seven -member board of representatives, two of whom are designated by TILC. TILC is the agent of each of TRIP Holdings and RIV 2013 and, as such, has been delegated the authority, power, and discretion to take certain actions on behalf of the respective companies.
At December 31, 2019, the carrying value of our investment in TRIP Holdings and RIV 2013 totaled $186.5 million. Our weighted average ownership interest in TRIP Holdings and RIV 2013 is 38 % while the remaining 62 % weighted average interest is owned by third-party, investor-owned funds. The investment in our partially-owned leasing subsidiaries is eliminated in consolidation.
Each of TRIP Holdings and RIV 2013 has wholly-owned subsidiaries that are the owners of railcars acquired from our Rail Products and Leasing Groups. These wholly-owned subsidiaries are TRIP Master Funding (wholly-owned by TRIP Holdings) and Trinity Rail Leasing 2012 LLC ("TRL-2012", wholly-owned by RIV 2013). Railcar purchases by these subsidiaries were funded by secured borrowings and capital contributions from TILC and third-party equity investors. TILC is the contractual servicer for TRIP Master Funding and TRL-2012, with the authority to manage and service each entity's owned railcars. Our controlling interest in each of TRIP Holdings and RIV 2013 results from our combined role as both equity member and agent/servicer. The noncontrolling interest included in the accompanying Consolidated Balance Sheets represents the non-Trinity equity interest in these partially-owned subsidiaries.
Trinity has no obligation to guarantee performance under any of our partially-owned subsidiaries' (or their respective subsidiaries') debt agreements, guarantee any railcar residual values, shield any parties from losses or guarantee minimum yields.
The assets of each of TRIP Master Funding and TRL-2012 may only be used to satisfy the particular subsidiary's liabilities, and the creditors of each of TRIP Master Funding and TRL-2012 have recourse only to the particular subsidiary's assets. Each of TILC and the third-party equity investors receive distributions from TRIP Holdings and RIV 2013, when available, in proportion to its respective equity interests, and has an interest in the net assets of the partially-owned subsidiaries upon a liquidation event in the same proportion. TILC is paid fees for the services it provides to TRIP Master Funding and TRL-2012 and has the potential to earn certain incentive fees. TILC and the third-party equity investors have commitments to provide additional equity funding to TRIP Holdings that are scheduled to expire in May 2021, contingent upon certain returns on investment in TRIP Holdings and other conditions being met. There are no remaining equity commitments with respect to RIV 2013.
See Note 8 regarding the debt of TRIP Holdings and RIV 2013 and their respective subsidiaries.
70
Note 6. Railcar Leasing and Management Services Group
The Railcar Leasing and Management Services Group owns and operates a fleet of railcars as well as provides third-party fleet leasing, management, and administrative services. Selected consolidated financial information for the Leasing Group is as follows:
December 31, 2019 | |||||||||||||||||||
Wholly- Owned Subsidiaries | Partially-Owned Subsidiaries | Total Leasing Group | Eliminations — Lease Subsidiary(1) | Adjusted Total Leasing Group | |||||||||||||||
(in millions) | |||||||||||||||||||
Cash and cash equivalents | $ | $ | $ | $ | $ | ||||||||||||||
Accounts receivable | |||||||||||||||||||
Property, plant, and equipment, net | ( | ) | |||||||||||||||||
Restricted cash | |||||||||||||||||||
Other assets | |||||||||||||||||||
Total assets | $ | $ | $ | $ | ( | ) | $ | ||||||||||||
Accounts payable and accrued liabilities | $ | $ | $ | $ | $ | ||||||||||||||
Debt, net | |||||||||||||||||||
Deferred income taxes | ( | ) | |||||||||||||||||
Other liabilities | |||||||||||||||||||
Total liabilities | ( | ) | |||||||||||||||||
Noncontrolling interest | |||||||||||||||||||
Total Equity | $ | $ | $ | $ | ( | ) | $ | ||||||||||||
December 31, 2018 | |||||||||||||||||||
Wholly- Owned Subsidiaries | Partially-Owned Subsidiaries | Total Leasing Group | Eliminations — Lease Subsidiary(1) | Adjusted Total Leasing Group | |||||||||||||||
(in millions) | |||||||||||||||||||
Cash and cash equivalents | $ | $ | $ | $ | $ | ||||||||||||||
Accounts receivable | |||||||||||||||||||
Property, plant, and equipment, net | ( | ) | |||||||||||||||||
Restricted cash | |||||||||||||||||||
Other assets | |||||||||||||||||||
Total assets | $ | $ | $ | $ | ( | ) | $ | ||||||||||||
Accounts payable and accrued liabilities | $ | $ | $ | $ | $ | ||||||||||||||
Debt, net | |||||||||||||||||||
Deferred income taxes | ( | ) | |||||||||||||||||
Other liabilities | |||||||||||||||||||
Total liabilities | ( | ) | |||||||||||||||||
Noncontrolling interest | |||||||||||||||||||
Total Equity | $ | $ | $ | $ | ( | ) | $ | ||||||||||||
(1) Net deferred profit on railcars sold to the Leasing Group consists of intersegment profit that is eliminated in consolidation. Net deferred profit and the related deferred tax impact are included as adjustments to the property, plant, and equipment, net and deferred income taxes line items, respectively, in the Eliminations – Lease Subsidiary column above to reflect the net book value of the railcars purchased by the Leasing Group from the Rail Products Group based on manufacturing cost. See Note 5 and Note 8 for a further discussion regarding our investment in our partially-owned leasing subsidiaries and the related indebtedness.
71
Year Ended December 31, | Percent Change | ||||||||||||||||
2019 | 2018 | 2017 | 2019 versus 2018 | 2018 versus 2017 | |||||||||||||
($ in millions) | |||||||||||||||||
Revenues: | |||||||||||||||||
Leasing and management | $ | $ | $ | % | ( | )% | |||||||||||
Sales of railcars owned one year or less at the time of sale (1) | % | % | |||||||||||||||
Total revenues | $ | $ | $ | % | % | ||||||||||||
Operating profit(2): | |||||||||||||||||
Leasing and management | $ | $ | $ | % | ( | )% | |||||||||||
Railcar sales: | |||||||||||||||||
Railcars owned one year or less at the time of sale | % | % | |||||||||||||||
Railcars owned more than one year at the time of sale | % | ( | )% | ||||||||||||||
Property disposition losses (3) | ( | ) | * | * | |||||||||||||
Total operating profit | $ | $ | $ | % | ( | )% | |||||||||||
Total operating profit margin | % | % | % | ||||||||||||||
Leasing and management operating profit margin | % | % | % | ||||||||||||||
Selected expense information: | |||||||||||||||||
Depreciation | $ | $ | $ | % | % | ||||||||||||
Maintenance and compliance | $ | $ | $ | % | % | ||||||||||||
Rent | $ | $ | $ | ( | )% | % | |||||||||||
Selling, engineering, and administrative expenses | $ | $ | $ | ( | )% | % | |||||||||||
Interest | $ | $ | $ | % | % | ||||||||||||
* Not meaningful
(1) Includes revenues associated with sales-type leases of $160.5 million for the year ended December 31, 2019.
(2) Operating profit includes: depreciation; maintenance and compliance; rent; and selling, engineering, and administrative expenses. Amortization of deferred profit on railcars sold from the Rail Products Group to the Leasing Group is included in the operating profit of the Leasing Group, resulting in the recognition of depreciation expense based on our original manufacturing cost of the railcars. Interest expense is not a component of operating profit and includes the effect of hedges.
(3) Property disposition losses during the year ended December 31, 2018 included a non-cash charge of $12.6 million associated with our election to forego the early purchase options contained in certain lease agreements.
72
During the years ended December 31, 2019, 2018, and 2017, information related to the sales of leased railcars is as follows:
Year Ended December 31, | |||||||||||
2019 | 2018 | 2017 | |||||||||
(in millions) | |||||||||||
Sales of leased railcars: | |||||||||||
Railcars owned one year or less at the time of sale (1) | $ | $ | $ | ||||||||
Railcars owned more than one year at the time of sale | |||||||||||
$ | $ | $ | |||||||||
Operating profit on sales of leased railcars: | |||||||||||
Railcars owned one year or less at the time of sale | $ | $ | $ | ||||||||
Railcars owned more than one year at the time of sale | |||||||||||
$ | $ | $ | |||||||||
Operating profit margin on sales of leased railcars: | |||||||||||
Railcars owned one year or less at the time of sale | % | % | % | ||||||||
Railcars owned more than one year at the time of sale | % | % | % | ||||||||
Weighted average operating profit margin on sales of leased railcars | % | % | % | ||||||||
(1) Includes revenues associated with sales-type leases of $160.5 million for the year ended December 31, 2019.
Railcar Leasing Portfolio. The Leasing Group's Equipment consists primarily of railcars leased by third parties. The Leasing Group purchases equipment manufactured predominantly by the Rail Products Group and enters into lease contracts with third parties with terms generally ranging between one year and ten years , although certain leases entered into in prior periods had lease terms of up to twenty years . The Leasing Group primarily enters into operating leases. Future contractual minimum rental revenues on operating leases related to our wholly-owned and partially-owned subsidiaries are as follows:
2020 | 2021 | 2022 | 2023 | 2024 | Thereafter | Total | ||||||||||||||||||||||
(in millions) | ||||||||||||||||||||||||||||
Future contractual minimum rental revenue | $ | $ | $ | $ | $ | $ | $ | |||||||||||||||||||||
Debt. Wholly-owned subsidiaries. The Leasing Group’s debt at December 31, 2019 consisted primarily of non-recourse debt. As of December 31, 2019, Trinity’s wholly-owned subsidiaries included in the Leasing Group held equipment with a net book value of $4,501.2 million which is pledged solely as collateral for Leasing Group debt held by those subsidiaries. The net book value of unpledged equipment at December 31, 2019 was $1,303.5 million. See Note 8 for more information regarding the Leasing Group debt.
Partially-owned subsidiaries. Debt owed by TRIP Holdings and RIV 2013 and their respective subsidiaries is nonrecourse to Trinity and TILC. Creditors of each of TRIP Holdings and RIV 2013 and their respective subsidiaries have recourse only to the particular subsidiary's assets. TRIP Master Funding equipment with a net book value of $1,246.1 million is pledged as collateral for the TRIP Master Funding debt. TRL-2012 equipment with a net book value of $540.6 million is pledged solely as collateral for the TRL-2012 secured railcar equipment notes. See Note 5 for a description of TRIP Holdings and RIV 2013.
Off Balance Sheet Arrangements. In prior years, the Leasing Group completed a series of financing transactions whereby railcars were sold to one or more separate independent owner trusts (“Trusts”). Each of the Trusts financed the purchase of the railcars with a combination of debt and equity. In each transaction, the equity participant in each of the respective Trusts was considered to be the primary beneficiary of the Trust; and therefore, the accounts of the Trusts, including the debt related to each of the Trusts, were not included as part of the Consolidated Financial Statements. The Leasing Group, through wholly-owned, qualified subsidiaries, leased railcars from the Trusts under operating leases with terms of twenty-two years , and subleased the railcars to independent third-party customers under shorter term operating lease agreements. The terms of the operating lease agreements between the subsidiaries and the remaining Trusts provided the Leasing Group with the option to purchase, at a predetermined fixed price, certain railcars from the remaining Trusts in 2019. On January 14, 2019, we completed the purchase for a purchase price of $218.4 million. As a result, 6,779 railcars previously under lease are now wholly-owned by our Leasing Group. The future contractual minimum rental revenues associated with these railcars are included in the table above.
73
Operating Lease Obligations. Future amounts due as well as future contractual minimum rental revenues related to the Leasing Group's railcar operating lease obligations are as follows:
2020 | 2021 | 2022 | 2023 | 2024 | Thereafter | Total | ||||||||||||||||||||||
(in millions) | ||||||||||||||||||||||||||||
Future operating lease obligations | $ | $ | $ | $ | $ | $ | $ | |||||||||||||||||||||
Future contractual minimum rental revenues | $ | $ | $ | $ | $ | $ | $ | |||||||||||||||||||||
Operating lease obligations totaling $2.9 million are guaranteed by Trinity Industries, Inc. and certain subsidiaries. The Leasing Group also has future amounts due for operating lease obligations related to office space of approximately $2.4 million, which is excluded from the table above.
Note 7. Property, Plant, and Equipment
The following table summarizes the components of property, plant, and equipment:
December 31, 2019 | December 31, 2018 | ||||||
(in millions) | |||||||
Manufacturing/Corporate: | |||||||
Land | $ | $ | |||||
Buildings and improvements | |||||||
Machinery and other | |||||||
Construction in progress | |||||||
Less accumulated depreciation | ( | ) | ( | ) | |||
Leasing: | |||||||
Wholly-owned subsidiaries: | |||||||
Machinery and other | |||||||
Equipment on lease | |||||||
Less accumulated depreciation | ( | ) | ( | ) | |||
Partially-owned subsidiaries: | |||||||
Equipment on lease | |||||||
Less accumulated depreciation | ( | ) | ( | ) | |||
Deferred profit on railcars sold to the Leasing Group | ( | ) | ( | ) | |||
Less accumulated amortization | |||||||
( | ) | ( | ) | ||||
$ | $ | ||||||
We lease certain equipment and facilities under operating leases. See Note 1 for future operating lease obligations on non-Leasing Group leases. See Note 1 and Note 6 for information related to the lease agreements, future operating lease obligations, and future minimum rental revenues associated with the Leasing Group.
We did not capitalize any interest expense as part of the construction of facilities and equipment during 2019 or 2018.
We estimate the fair market value of properties no longer in use based on the location and condition of the properties, the fair market value of similar properties in the area, and our experience selling similar properties in the past. As of December 31, 2019, we had non-operating plants with a net book value of $13.8 million. See Note 11 for further information regarding asset impairment charges related to non-operating plants that were recorded during the year ended December 31, 2019.
74
Note 8. Debt
The carrying amounts and estimated fair values of our long-term debt are as follows:
December 31, 2019 | December 31, 2018 | ||||||||||||||
Carrying Value | Estimated Fair Value | Carrying Value | Estimated Fair Value | ||||||||||||
(in millions) | |||||||||||||||
Corporate – Recourse: | |||||||||||||||
Revolving credit facility | $ | $ | $ | $ | |||||||||||
Senior notes, net of unamortized discount of $0.2 and $0.3 | |||||||||||||||
Less: unamortized debt issuance costs | ( | ) | ( | ) | |||||||||||
Total recourse debt | |||||||||||||||
Leasing – Non-recourse: | |||||||||||||||
Wholly-owned subsidiaries: | |||||||||||||||
2006 secured railcar equipment notes | |||||||||||||||
2009 secured railcar equipment notes | |||||||||||||||
2010 secured railcar equipment notes | |||||||||||||||
2017 promissory notes | |||||||||||||||
2018 secured railcar equipment notes, net of unamortized discount of $0.2 and $0.2 | |||||||||||||||
TRIHC 2018 secured railcar equipment notes, net of unamortized discount of $1.4 and $2.5 | |||||||||||||||
2019 secured railcar equipment notes, net of unamortized discount of $0.4 and $- | |||||||||||||||
TILC warehouse facility | |||||||||||||||
Less: unamortized debt issuance costs | ( | ) | ( | ) | |||||||||||
Partially-owned subsidiaries: | |||||||||||||||
TRL 2012 secured railcar equipment notes | |||||||||||||||
TRIP Master Funding secured railcar equipment notes | |||||||||||||||
Less: unamortized debt issuance costs | ( | ) | ( | ) | |||||||||||
Total non–recourse debt | |||||||||||||||
Total debt | $ | $ | $ | $ | |||||||||||
The estimated fair value of our 4.55 % senior notes due 2024 ("Senior Notes") is based on a quoted market price in a market with little activity as of December 31, 2019 and December 31, 2018 (Level 2 input). The estimated fair values of our 2006, 2009, 2010, 2012, 2018, and 2019 secured railcar equipment notes, TRIHC 2018 LLC ("TRIHC 2018"), and TRIP Rail Master Funding LLC (“TRIP Master Funding”) secured railcar equipment notes are based on our estimate of their fair value as of December 31, 2019 and December 31, 2018 using unobservable input values provided by a third party (Level 3 inputs). The respective carrying values of our revolving credit facility, TILC warehouse facility, and 2017 promissory notes approximate fair value because the interest rate adjusts to the market interest rate.
Revolving Credit Facility — We have a $450.0 million unsecured corporate revolving credit facility that matures in November 2023. Additionally, we are permitted to increase the amount of the commitments under the revolving credit facility by an aggregate amount not to exceed $200.0 million, subject to certain conditions, including the agreement of existing lenders to increase their commitments or by obtaining commitments from one or more new lenders.
During the year ended December 31, 2019, we had total borrowings of $1.0 billion and total repayments of $875.0 million under the revolving credit facility, with a remaining outstanding balance of $125.0 million as of December 31, 2019. Additionally, we had outstanding letters of credit issued in an aggregate principal amount of $35.5 million, leaving $289.5 million available for borrowing as of December 31, 2019. The outstanding letters of credit as of December 31, 2019 are scheduled to expire in July 2020. Our letters of credit obligations support our various insurance programs and generally renew by their terms each year.
75
The revolving credit facility bears interest at a variable rate based on LIBOR or an alternate base rate at the time of the borrowing and Trinity’s leverage as measured by a consolidated total indebtedness to consolidated EBITDA ratio, and was initially set at LIBOR plus 1.25 % (1.50 % as of December 31, 2019). A commitment fee accrues on the average daily unused portion of the revolving facility at the rate of 0.175 % to 0.30 % (0.20 % as of December 31, 2019).
The revolving credit facility requires the maintenance of ratios related to minimum interest coverage for the leasing and manufacturing operations and maximum leverage. As of December 31, 2019, we were in compliance with all such financial covenants. Borrowings under the credit facility are guaranteed by certain of our 100%-owned subsidiaries.
Senior Notes Due 2024 — In September 2014, we issued $400.0 million aggregate principal amount of 4.55 % senior notes due October 2024. Interest on the Senior Notes is payable semiannually commencing April 1, 2015. The Senior Notes rank senior to existing and future subordinated debt, including our Notes and rank equal to existing and future senior indebtedness, including our revolving credit facility. The Senior Notes are subordinated to all our existing and future secured debt to the extent of the value of the collateral securing such indebtedness. The Senior Notes contain covenants that limit our ability and/or certain subsidiaries' ability to create or permit to exist certain liens; enter into sale and leaseback transactions; and consolidate, merge, or transfer all or substantially all of our assets. Our Senior Notes are fully and unconditionally and jointly and severally guaranteed by each of Trinity’s domestic subsidiaries that is a guarantor under our revolving credit facility. See Note 16.
Wholly-owned leasing subsidiaries
TRL V — In May 2006, Trinity Rail Leasing V, L.P., a limited partnership (“TRL V”) and a limited purpose, indirect wholly-owned subsidiary of the Company owned through TILC issued $355.0 million in aggregate principal amount of Secured Railcar Equipment Notes, Series 2006-1A (the “2006 Secured Railcar Equipment Notes”), of which $109.3 million was outstanding as of December 31, 2019. The 2006 Secured Railcar Equipment Notes were issued pursuant to a Master Indenture, dated May 24, 2006, between TRL V and Wilmington Trust Company, as indenture trustee. The 2006 Secured Railcar Equipment Notes bear interest at a fixed rate of 5.90 % per annum, are payable monthly, and have a final maturity of May 14, 2036. The 2006 Secured Railcar Equipment Notes are obligations of TRL V and are non-recourse to Trinity. The obligations are secured by a portfolio of railcars and operating leases thereon, certain cash reserves, and other assets acquired and owned by TRL V.
TRL VII — In November 2009, Trinity Rail Leasing VII LLC, a Delaware limited liability company (“TRL VII”) and a limited purpose, indirect wholly-owned subsidiary of the Company owned through TILC, issued $238.3 million in aggregate principal amount of Secured Railcar Equipment Notes, Series 2009-1 (the “2009 Secured Railcar Equipment Notes”), of which $147.8 million was outstanding as of December 31, 2019. The 2009 Secured Railcar Equipment Notes were issued pursuant to a Master Indenture, dated November 5, 2009 between TRL VII and Wilmington Trust Company, as indenture trustee. The 2009 Secured Railcar Equipment Notes bear interest at a fixed rate of 6.66 % per annum, are payable monthly, and have a final maturity date of November 16, 2039. The 2009 Secured Railcar Equipment Notes are obligations of TRL VII and are non-recourse to Trinity. The obligations are secured by a portfolio of railcars and operating leases thereon, certain cash reserves, and other assets acquired and owned by TRL VII.
TRL-2010 — In October 2010, Trinity Rail Leasing 2010 LLC, a Delaware limited liability company ("TRL-2010") and a limited purpose, indirect wholly-owned subsidiary of the Company owned through TILC, issued $369.2 million in aggregate principal amount of Secured Railcar Equipment Notes, Series 2010-1 (“2010 Secured Railcar Equipment Notes"), of which $248.5 million was outstanding as of December 31, 2019. The 2010 Secured Railcar Equipment Notes were issued pursuant to an Indenture, dated as of October 25, 2010 between TRL-2010 and Wilmington Trust Company, as indenture trustee. The 2010 Secured Railcar Equipment Notes bear interest at a fixed rate of 5.19 %, are payable monthly, and have a stated final maturity date of October 16, 2040. The 2010 Secured Railcar Equipment Notes are obligations of TRL-2010 and are non-recourse to Trinity. The obligations are secured by a portfolio of railcars and operating leases thereon, certain cash reserves, and other assets acquired and owned by TRL-2010.
TILC Warehouse Loan Facility — TILC has a $750.0 million warehouse loan facility, which was established to finance railcars owned by TILC. During the year ended December 31, 2019, we had total borrowings of $663.1 million and total repayments of $684.5 million under the TILC warehouse loan facility, with a remaining outstanding balance of $353.4 million as of December 31, 2019. The entire unused facility amount of $396.6 million was available as of December 31, 2019 based on the amount of warehouse-eligible, unpledged equipment. The warehouse loan facility is a non-recourse obligation and is secured by a portfolio of railcars and operating leases, certain cash reserves, and other assets acquired and owned by the warehouse loan facility trust. The principal and interest of this indebtedness are paid from the cash flows of the underlying leases. Advances under the facility bear interest at a defined index rate plus a margin, for an all-in interest rate of 3.32 % at December 31, 2019. Amounts outstanding at maturity, absent renewal, are payable in March 2022.
76
TRL-2017 — Trinity Rail Leasing 2017, LLC, a Delaware limited liability company ("TRL-2017") and a limited purpose, indirect wholly-owned subsidiary of the Company owned through TILC, previously issued $302.4 million of promissory notes (the "2017 Promissory Notes") due May 15, 2024. In November 2018, the 2017 Promissory Notes were extended through November 8, 2025 at an increased aggregate amount of $663.0 million, of which $627.1 million was outstanding as of December 31, 2019. The 2017 Promissory Notes are obligations of TRL-2017 and are non-recourse to Trinity. The 2017 Promissory Notes bear interest at Libor plus a margin for an all-in interest rate of 3.25 % as of December 31, 2019, payable monthly. The 2017 Promissory Notes are secured by a portfolio of railcars and operating leases thereon, certain cash reserves, and other assets acquired and owned by TRL-2017.
TRL-2018 — In June 2018, TRL-2018, a Delaware limited liability company and a limited purpose, indirect wholly-owned subsidiary of the Company owned through TILC, issued $482.5 million in Secured Railcar Equipment Notes (the "TRL-2018 Secured Railcar Equipment Notes"). The TRL-2018 Secured Railcar Equipment Notes consisted of two classes of notes with (i) an aggregate principal amount of $200.0 million of TRL-2018's Series 2018-1 Class A-1 Secured Railcar Equipment Notes (the "Class A-1 Notes"), and (ii) an aggregate principal amount of $282.5 million of TRL-2018's Series 2018-1 Class A-2 Secured Railcar Equipment Notes (the “Class A-2 Notes”). The TRL-2018 Secured Railcar Equipment Notes were issued pursuant to a Master Indenture, dated June 20, 2018 between TRL-2018 and Wilmington Trust Company, as indenture trustee. The Class A-1 Notes, of which $169.8 million was outstanding as of December 31, 2019, bear interest at a fixed rate of 3.82 %, are payable monthly, and have a stated final maturity date of June 17, 2048. The Class A-2 Notes, of which $282.5 million was outstanding as of December 31, 2019, bear interest at a fixed rate of 4.62 %, are payable monthly, and have a stated final maturity date of June 17, 2048. The Notes are obligations of TRL-2018 only, secured by a portfolio of railcars and operating leases thereon acquired and owned by TRL-2018, certain cash reserves, and other assets of TRL-2018.
TRIHC 2018 — In October 2018, TRIHC 2018 was acquired by the Leasing Group, from an unrelated seller, and included the entire equity interest of a railcar leasing entity for $75.4 million in cash. As a result of the purchase transaction, the Leasing Group acquired approximately 4,150 railcars, substantially all of which are currently under lease to third parties, and assumed indebtedness of approximately $283.9 million with maturities ranging from 2018 through 2035, of which $265.4 million, net of unamortized discount, was outstanding as of December 31, 2019.
TRL-2019 — In April 2019, Trinity Rail Leasing 2019 LLC ("TRL-2019"), a Delaware limited liability company and a limited purpose, indirect wholly-owned subsidiary of the Company owned through TILC, issued $528.3 million in Secured Railcar Equipment Notes (the "TRL-2019 Secured Railcar Equipment Notes"). The TRL-2019 Secured Railcar Equipment Notes were issued pursuant to a Master Indenture, dated as of April 10, 2019 between TRL-2019 and U.S. Bank National Association, as indenture trustee. The TRL-2019 Secured Railcar Equipment Notes, of which $516.2 million was outstanding as of December 31, 2019, bear interest at a fixed rate of 3.82 %, are payable monthly, and have a stated final maturity date of April 17, 2049. The TRL-2019 Secured Railcar Equipment Notes are obligations of TRL-2019 and are non-recourse to Trinity. The obligations are secured by a portfolio of railcars and operating leases thereon, certain cash reserves, and other assets acquired and owned by TRL-2019.
In October 2019, TRL-2019 issued an additional $386.5 million in Secured Railcar Equipment Notes (the "TRL-2019-2 Secured Railcar Equipment Notes"). The TRL-2019-2 Secured Railcar Equipment Notes consisted of two classes of notes with (i) an aggregate principal amount of $106.9 million of TRL-2019's Series 2019-2 Class A-1 Secured Railcar Equipment Notes (the "Class A-1 Notes"), and (ii) an aggregate principal amount of $279.6 million of TRL-2019's Series 2019-2 Class A-2 Secured Railcar Equipment Notes (the “Class A-2 Notes”). The TRL-2019-2 Secured Railcar Equipment Notes were issued pursuant to a Master Indenture, dated April 10, 2019 between TRL-2019 and U.S. Bank National Association, as indenture trustee, as supplemented by a Series 2019-2 Supplement dated as of October 17, 2019. The Class A-1 Notes, of which $105.6 million was outstanding as of December 31, 2019, bear interest at a fixed rate of 2.39 %, are payable monthly, and have a stated final maturity date of October 17, 2049. The Class A-2 Notes, of which $279.6 million was outstanding as of December 31, 2019, bear interest at a fixed rate of 3.10 %, are payable monthly, and have a stated final maturity date of October 17, 2049. The TRL-2019-2 Secured Railcar Equipment Notes are obligations of TRL-2019 and are non-recourse to Trinity. The obligations are secured by a portfolio of railcars and operating leases thereon, certain cash reserves, and other assets acquired and owned by TRL-2019.
Net proceeds received from these two transactions were used to repay approximately $514.0 million in outstanding borrowings under the Leasing Group's secured warehouse loan facility, to repay approximately $250.0 million in outstanding borrowings under the Company's revolving credit facility, and for general corporate purposes.
77
Partially-owned leasing subsidiaries
TRIP Master Funding — The TRIP Master Funding Secured Railcar Equipment Notes consisted of three classes with the Class A-1a notes bearing interest at 4.37 %, the Class A-1b notes bearing interest at LIBOR plus 2.50 %, and the Class A-2 notes bearing interest at 6.02 %, all payable monthly, with a final maturity date in July 2041. In May 2014, TRIP Master Funding issued $335.7 million in aggregate principal amount of Series 2014-1 Secured Railcar Equipment Notes consisting of two classes with the Class A-1 notes bearing interest at 2.86 % and the Class A-2 notes bearing interest at 4.09 %, with a final maturity date of April 2044. In August 2017, TRIP Master Funding issued $237.9 million in aggregate principal amount of Series 2017-1 Secured Railcar Equipment Notes pursuant to the Master Indenture between TRIP Master Funding and Wilmington Trust Company, as indenture trustee, with a final maturity date of August 2047. The proceeds from the issuance were used primarily to retire the TRIP Master Funding Secured Railcar Equipment Notes Class A-1a and Class A-1b notes as well as the TRIP Master Funding Series 2014-1 Secured Railcar Equipment Notes Class A-1 notes in full. The TRIP Master Funding Secured Railcar Equipment Notes and the TRIP Master Funding Series 2014-1 Secured Railcar Equipment Notes were issued pursuant to a Master Indenture dated July 6, 2011 between TRIP Master Funding and Wilmington Trust Company, as indenture trustee; are non-recourse to Trinity, TILC, TRIP Holdings, and the other equity investors in TRIP Holdings; and are secured by TRIP Master Funding's portfolio of railcars and operating leases thereon, its cash reserves, and all other assets owned by TRIP Master Funding. As of December 31, 2019, there were $508.8 million outstanding of the Class A-2 TRIP Master Funding Secured Railcar Equipment Notes and $220.7 million of the Class A-2 Series 2014-1 Secured Railcar Equipment Notes.
The TRIP Master Funding Series 2017-1 Secured Railcar Equipment Notes consist of two classes with the Class A-1 notes bearing interest at 2.71 % and the Class A-2 notes bearing interest at 3.74 %. The TRIP Master Funding Series 2017-1 Secured Railcar Equipment Notes are non-recourse to Trinity, TILC, TRIP Holdings, and the other equity investors in TRIP Holdings and are secured by TRIP Master Funding's portfolio of railcars and operating leases thereon, its cash reserves, and all other assets owned by TRIP Master Funding. As of December 31, 2019, there were $53.5 million and $134.9 million of Class A-1 and Class A-2 notes outstanding, respectively.
TRL-2012 — In December 2012, TRL-2012, a Delaware limited liability company and a limited purpose, indirect wholly-owned subsidiary of the Company owned through TILC, issued $145.4 million in aggregate principal amount of Series 2012-1 Class A-1 Secured Railcar Equipment Notes (the "2012 Class A-1 Notes") and $188.4 million in aggregate principal amount of Series 2012-1 Class A-2 Secured Railcar Equipment Notes (the "2012 Class A-2 Notes" and collectively with the 2012 Class A-1 Notes, the "2012 Secured Railcar Equipment Notes"), of which $41.6 million and $188.4 million, respectively, were outstanding as of December 31, 2019. The 2012 Class A-1 Notes bear interest at a fixed rate of 2.27 %, are payable monthly, and have a stated final maturity date of January 15, 2043. The 2012 Class A-2 Notes bear interest at a fixed rate of 3.53 %, are payable monthly, and have a stated final maturity date of January 15, 2043. In May 2013, TRL-2012 became a subsidiary of one of the Company's partially-owned subsidiaries, RIV 2013. See Note 5 for further explanation. In August 2013, TRL-2012 issued $183.4 million in aggregate principal amount of Series 2013-1 Secured Railcar Equipment Notes of which $141.4 million was outstanding as of December 31, 2019. The 2013-1 Secured Railcar Equipment Notes bear interest at a fixed rate of 3.90 %, are payable monthly, and have a stated final maturity date of July 15, 2043.
The 2012 Secured Railcar Equipment Notes and the 2013-1 Secured Railcar Equipment Notes were issued pursuant to a Master Indenture dated December 19, 2012 between TRL-2012 and Wilmington Trust Company, as indenture trustee; are non-recourse to Trinity, TILC, RIV 2013, and the other equity investors in RIV 2013; and are secured by TRL-2012's portfolio of railcars and operating leases thereon, its cash reserves, and all other assets owned by TRL-2012.
TRIP Master Funding and TRL-2012 are wholly-owned subsidiaries of TRIP Holdings and RIV 2013, respectively, which, in turn, are partially-owned subsidiaries of the Company, through its wholly-owned subsidiary, TILC. Our combined weighted average ownership interest in TRIP Holdings and RIV 2013 is 38 %. See Note 5 for further explanation.
78
The remaining principal payments under existing debt agreements as of December 31, 2019 are as follows:
2020 | 2021 | 2022 | 2023 | 2024 | Thereafter | Total | |||||||||||||||||||||
(in millions) | |||||||||||||||||||||||||||
Recourse: | |||||||||||||||||||||||||||
Corporate | $ | $ | $ | $ | $ | $ | $ | ||||||||||||||||||||
Non-recourse – leasing (Note 6): | |||||||||||||||||||||||||||
2006 secured railcar equipment notes | |||||||||||||||||||||||||||
2009 secured railcar equipment notes | |||||||||||||||||||||||||||
2010 secured railcar equipment notes | |||||||||||||||||||||||||||
2017 promissory notes | |||||||||||||||||||||||||||
2018 secured railcar equipment notes | |||||||||||||||||||||||||||
TRIHC 2018 secured railcar equipment notes | |||||||||||||||||||||||||||
2019 secured railcar equipment notes | |||||||||||||||||||||||||||
TILC warehouse facility | |||||||||||||||||||||||||||
Facility termination payments – TILC warehouse facility | |||||||||||||||||||||||||||
TRL 2012 secured railcar equipment notes | |||||||||||||||||||||||||||
TRIP Master Funding secured railcar equipment notes | |||||||||||||||||||||||||||
Total principal payments | $ | $ | $ | $ | $ | $ | $ | ||||||||||||||||||||
79
Note 9. Income Taxes
The components of the provision (benefit) for income taxes from continuing operations are as follows:
Year Ended December 31, | |||||||||||
2019 | 2018 | 2017 | |||||||||
(in millions) | |||||||||||
Current: | |||||||||||
Federal | $ | ( | ) | $ | ( | ) | $ | ( | ) | ||
State | ( | ) | ( | ) | |||||||
Foreign | |||||||||||
Total current | ( | ) | ( | ) | |||||||
Deferred: | |||||||||||
Federal | |||||||||||
Effect of Tax Cuts and Jobs Act | ( | ) | ( | ) | |||||||
Other | |||||||||||
( | ) | ||||||||||
State | ( | ) | |||||||||
Foreign | ( | ) | |||||||||
Total deferred | ( | ) | |||||||||
Provision (benefit) | $ | $ | $ | ( | ) | ||||||
The provision for income taxes from continuing operations results in effective tax rates that differ from the statutory rates. The following is a reconciliation between the statutory U.S. federal income tax rate and our effective income tax rate on income before income taxes:
Year Ended December 31, | ||||||||
2019 | 2018 | 2017 | ||||||
Statutory rate | % | % | % | |||||
State taxes | ( | ) | ||||||
Foreign branch taxes | ||||||||
Executive compensation limitations | ||||||||
Interest expense limitations from partially-owned subsidiaries | ||||||||
Noncontrolling interest in partially-owned subsidiaries | ( | ) | ( | ) | ||||
Equity compensation | ( | ) | ( | ) | ||||
Changes in state laws and apportionment | ( | ) | ||||||
Effect of Tax Cuts and Jobs Act | ( | ) | ( | ) | ||||
Changes in valuation allowances and reserves | ||||||||
Settlements with tax authorities | ( | ) | ||||||
Other, net | ( | ) | ||||||
Effective rate | % | % | ( | )% | ||||
The effective tax rate is based upon the U.S. statutory rate of 21.0 %, 21.0 %, and 35.0 % for the years ended December 31, 2019, 2018, and 2017, respectively. For the year ended December 31, 2019, the difference between the U.S. statutory rate and effective tax rate is primarily due to state income tax expense, foreign branch taxes, and changes in state tax laws and apportionment. The changes in apportionment include the effects of a one-time, non-cash, deferred tax impact related to our planned Maintenance Services expansion into a new Midwest facility of $9.7 million. For the year ended December 31, 2018, the difference between the U.S. statutory tax rate and the effective tax rate was primarily attributed to state taxes, foreign branch taxes, the impact changes in state apportionment and state tax laws, and the final accounting for the effects of the Tax Cuts and Jobs Act (the "Tax Act") that was enacted on December 22, 2017. For the year ended December 31, 2017, the difference between the statutory tax rate and effective tax rate was primarily attributable to the enactment of the Tax Act. See Note 5 for a further explanation of activities with respect to our partially-owned leasing subsidiaries.
80
The Tax Act reduced the U.S. federal corporate income tax rate from 35.0 % to 21.0 %. The Tax Act also required certain calendar year companies to pay a one-time transition tax on earnings of certain foreign subsidiaries that had previously not been taxed in the U.S. as part of their 2017 tax return filing. Beginning with the 2018 tax year, the Tax Act subjects certain earnings of foreign subsidiaries to U.S. taxation; in 2018, the Company did not incur the new U.S. tax on the income of its foreign subsidiaries. For the year ended December 31, 2017, we recognized a provisional net benefit of $476.2 million. During the year ended December 31, 2018, we finalized the accounting for the enactment of the Tax Act and recorded an additional benefit of $5.9 million, primarily as a result of truing up deferred taxes and our calculation of the one-time transition tax.
Income (loss) before income taxes for the years ended December 31, 2019, 2018, and 2017 was $201.1 million, $139.8 million, and $186.2 million, respectively, for U.S. operations, and $(0.4 ) million, $11.8 million, and $9.2 million, respectively, for foreign operations, principally Mexico and Canada.
Deferred income taxes represent the tax effects of temporary differences between the carrying amounts of assets and liabilities for financial reporting purposes and the amounts used for income tax purposes. The components of deferred tax liabilities and assets are as follows:
December 31, | |||||||
2019 | 2018 | ||||||
(in millions) | |||||||
Deferred tax liabilities: | |||||||
Depreciation, depletion, and amortization | $ | $ | |||||
Partially-owned subsidiaries basis difference | |||||||
Right-of-use assets | |||||||
Total deferred tax liabilities | |||||||
Deferred tax assets: | |||||||
Workers compensation, pensions, and other benefits | |||||||
Warranties and reserves | |||||||
Equity items | |||||||
Tax loss carryforwards and credits | |||||||
Inventory | |||||||
Accrued liabilities and other | |||||||
Lease liabilities | |||||||
Total deferred tax assets | |||||||
Net deferred tax liabilities before valuation allowances | |||||||
Valuation allowances | |||||||
Net deferred tax liabilities before reserve for uncertain tax positions | |||||||
Deferred tax assets included in reserve for uncertain tax positions | ( | ) | ( | ) | |||
Adjusted net deferred tax liabilities | $ | $ | |||||
At December 31, 2019, we had $940.5 million of federal consolidated net operating loss carryforwards and $13.2 million of tax-effected state loss carryforwards remaining. $18.9 million of the federal net operating loss carryforwards was acquired as part of an acquisition of a company in 2010 and is subject to limitations on the amount that can be utilized in any one tax year. The acquired federal net operating loss carryforwards are due to expire in 2028 and 2029. The federal net operating loss generated in the current year can be carried forward indefinitely. We have established a valuation allowance for federal, state, and foreign tax operating losses and credits that we have estimated may not be realizable.
Taxing authority examinations
We have settled our 2015 and 2016 tax years and received partial acceptance of our 2017 and 2018 tax years, pending final review of items related to the spin-off of Arcosa. The 2014-2019 tax years remain open. Our subsidiaries in Mexico file separate tax returns and are subject to examination by taxing authorities at different times. The entities statutes of limitations are open for their 2014 tax years and forward.
81
Unrecognized tax benefits
The change in unrecognized tax benefits for the years ended December 31, 2019, 2018, and 2017 was as follows:
Year Ended December 31, | |||||||||||
2019 | 2018 | 2017 | |||||||||
(in millions) | |||||||||||
Beginning balance | $ | $ | $ | ||||||||
Additions for tax positions of prior years | |||||||||||
Reductions for tax positions of prior years | ( | ) | |||||||||
Settlements | ( | ) | ( | ) | ( | ) | |||||
Expiration of statute of limitations | ( | ) | ( | ) | |||||||
Ending balance | $ | $ | $ | ||||||||
Settlements during the years ended December 31, 2019 and 2018 were due to the resolution of state audits. Settlements for the year ended December 31, 2017 were due to the Internal Revenue Service's ("IRS") resolution of our 2006-2009 tax years. Expiration of statutes of limitations during the years ended December 31, 2018 and 2017 relate to the 2013 and 2012 federal tax return, respectively, as well as some state statutes.
The total amount of unrecognized tax benefits including interest and penalties at December 31, 2019 and 2018, that would affect our effective tax rate if recognized, was $4.0 million and $9.4 million, respectively.
Trinity accounts for interest expense and penalties related to income tax issues as income tax expense. Accordingly, interest expense and penalties associated with an uncertain tax position are included in the income tax provision. The total amount of accrued interest and penalties from continuing operations as of December 31, 2019 and 2018 was $2.7 million and $3.7 million, respectively. Income tax expense for the years ended December 31, 2019, 2018, and 2017 included a decrease of $1.0 million, an increase of $0.5 million, and a decrease of $3.3 million, respectively, with regard to interest expense and penalties related to uncertain tax positions.
Note 10. Employee Retirement Plans
We sponsor defined benefit plans and defined contribution profit sharing plans that provide retirement income and death benefits for eligible employees. The annual measurement date of the benefit obligations, fair value of plan assets, and funded status is December 31.
Planned Pension Plan Termination
On September 4, 2019, our Board of Directors approved the termination of the Trinity Industries, Inc. Consolidated Pension Plan (the "Pension Plan"), effective December 31, 2019. Except for retirees currently receiving payments under the Pension Plan, participants will have the choice of receiving a single lump sum payment or an annuity from a highly-rated insurance company that will pay and administer future benefit payments. The Pension Plan is expected to be settled between late 2020 and early 2021, subject to required governmental approvals, and would then result in the Company no longer having any remaining funded pension plan obligations.
Upon settlement, we expect to incur pre-tax pension settlement charges totaling between $155 million and $185 million. The settlement charges will be recognized in our Statement of Operations in two phases, with the first charge to be recognized when payments are made to those participants electing to receive a lump sum distribution, and the second charge to be recognized when the annuity contracts are purchased to settle all remaining outstanding pension obligations. The range of settlement charges includes: (1) a non-cash charge for the recognition of all pre-tax actuarial losses accumulated in AOCL related to the Pension Plan, which totaled approximately $170.1 million ($131.2 million, net of tax) as of December 31, 2019; and (2) a potential additional cash contribution to settle all of the Pension Plan’s obligations, which is not expected to exceed $15.0 million. The actual amount of the settlement charges and any potential cash contribution will depend on interest rates, Pension Plan asset returns, the lump-sum election rate, and other factors.
In anticipation of the planned settlement of the Pension Plan, our benefit obligations as of December 31, 2019 were valued based on the amounts expected to be required to settle these obligations, which included assumptions regarding the portion of obligations expected to be settled through lump sum payments or annuity contracts, and the current estimates of the cost to purchase such annuity contracts.
82
Actuarial assumptions
Year Ended December 31, | |||||
2019 | 2018 | 2017 | |||
Assumptions used to determine benefit obligations at the annual measurement date were: | |||||
Obligation discount rate | |||||
Compensation increase rate(1) | n/a | n/a | |||
Assumptions used to determine net periodic benefit costs were: | |||||
Obligation discount rate | |||||
Long-term rate of return on plan assets | |||||
Compensation increase rate(1) | n/a | n/a | |||
(1) The compensation increase rate pertains to a plan associated with our Former Inland Barge Group. The Inland Barge Group was transferred to Arcosa in connection with the spin-off, but Trinity retained the pension plan. Effective as of November 1, 2018, all participants in this plan have been granted the maximum benefit allowed under the plan; therefore, the compensation increase rate is not applicable.
The obligation discount rate assumption is determined by deriving a single discount rate from a theoretical settlement portfolio of high quality corporate bonds sufficient to provide for the plans' projected benefit payments. The expected long-term rate of return on the plans' assets is an assumption reflecting the anticipated weighted average rate of earnings on the portfolio over the long-term. To arrive at this rate, estimates were developed based upon the anticipated performance of the plans' assets. Substantially all of the accrued benefits of our remaining pension plans were frozen in 2009, with all qualified pension plans frozen as of December 31, 2019.
Components of Net Periodic Benefit Cost and Other Retirement Expenses
Year Ended December 31, | |||||||||||
2019 | 2018 | 2017 | |||||||||
(in millions) | |||||||||||
Expense Components | |||||||||||
Service cost | $ | $ | $ | ||||||||
Interest | |||||||||||
Expected return on plan assets | ( | ) | ( | ) | ( | ) | |||||
Amortization of actuarial loss | |||||||||||
Other | |||||||||||
Net periodic benefit cost | ( | ) | ( | ) | |||||||
Profit sharing | |||||||||||
Net expense | $ | $ | $ | ||||||||
The expected return on plan assets is based on the plan assets' fair value. Amortization of actuarial loss is determined using the corridor method. Under the corridor method, unamortized actuarial gains or losses in excess of 10% of the greater of the projected benefit obligation or the fair value of plan assets as of the beginning of the plan year are amortized, for frozen plans, over the average expected remaining lifetime of frozen and inactive participants.
83
Obligations and funded status
Year Ended December 31, | |||||||
2019 | 2018 | ||||||
(in millions) | |||||||
Accumulated Benefit Obligations | $ | $ | |||||
Projected Benefit Obligations: | |||||||
Beginning of year | $ | $ | |||||
Service cost | |||||||
Interest | |||||||
Benefits paid | ( | ) | ( | ) | |||
Actuarial (gain) loss | ( | ) | |||||
Plan amendments | |||||||
Other | |||||||
End of year | $ | $ | |||||
Plans' Assets: | |||||||
Beginning of year | $ | $ | |||||
Actual return on assets | ( | ) | |||||
Employer contributions | |||||||
Benefits paid | ( | ) | ( | ) | |||
End of year | $ | $ | |||||
Consolidated Balance Sheet Components: | |||||||
Other assets | $ | $ | |||||
Accrued liabilities | ( | ) | ( | ) | |||
Net funded status | $ | ( | ) | $ | |||
Percent of projected benefit obligations funded | % | % | |||||
Amounts recognized in other comprehensive (loss) income
Year Ended December 31, | |||||||||||
2019 | 2018 | 2017 | |||||||||
(in millions) | |||||||||||
Actuarial (loss) gain | $ | ( | ) | $ | ( | ) | $ | ||||
Amortization of actuarial loss | |||||||||||
New prior service cost base | ( | ) | |||||||||
Total before income taxes | ( | ) | ( | ) | |||||||
Income tax (benefit) expense | ( | ) | ( | ) | |||||||
Net amount recognized in other comprehensive (loss) income | $ | ( | ) | $ | ( | ) | $ | ||||
At December 31, 2019, AOCL included unrecognized actuarial losses of $173.5 million and prior service cost of $1.5 million ($133.9 million net of related income taxes). Actuarial losses included in AOCL and expected to be recognized in net periodic pension cost for the year ended December 31, 2020 are $6.0 million ($4.6 million net of related income taxes). Amortization of prior service cost included in AOCL and expected to be recognized in net periodic pension cost for the year ended December 31, 2020 is $1.2 million ($0.9 million net of related income taxes).
84
Plan assets
Our pension plan investment strategies have been developed as part of a comprehensive asset/liability management process that considers the relationship between both the assets and liabilities of the plans for the purpose of providing the capital assets necessary to meet the financial obligations made to participants of our pension plans. These strategies consider not only the expected risk and returns on the plans' assets, but also the actuarial projections of liabilities, projected contributions, and funded status. Our investment policy statement allocates our pension plan assets into two portfolios as follows:
• | Liability hedging portfolio — The objective of the liability hedging portfolio is to match the characteristics of the pension plans' liabilities. This portfolio consists of fixed income holdings which are generally investment grade. |
• | Growth portfolio — The objective of the growth portfolio is to focus upon total return with an acceptable level of risk. This portfolio is heavily weighted toward U.S. equities with a lesser exposure to international equities, domestic real estate investment trusts, U.S. high yield and emerging market sovereign debt. |
The target allocation between these two portfolios varies based on the pension plans' percentage of projected benefit obligations funded status. The range of target asset allocations has been determined after giving consideration to the expected returns of each asset category within the two portfolios, the expected performance of each asset category, the volatility of asset returns over time, and the complementary nature of the asset mix within the portfolio. The principal pension investment strategies include asset allocation and active asset management within approved guidelines. These assets are managed by an investment advisor.
Following our Board of Directors approval to terminate our Pension Plan, a new investment allocation strategy was implemented to protect the funded status of the plan assets. The target allocation at December 31, 2019 is 100 % liability hedging portfolio, compared to 90 % liability hedging portfolio and 10 % growth portfolio at December 31, 2018.
The target and actual allocations of the plans' assets at December 31, 2019 are as follows:
Target Allocation | December 31, 2019 | ||||
Cash and cash equivalents | % | % | |||
Liability hedging portfolio | % | % | |||
Growth portfolio | % | % | |||
Total | % | % | |||
The estimated fair value of the plans' assets at December 31, 2019 and 2018, indicating input levels used to determine fair value are as follows:
Fair Value Measurement as of December 31, 2019 | |||||||||||||||
(in millions) | |||||||||||||||
Level 1 | Level 2 | Level 3 | Total | ||||||||||||
Temporary cash investments | $ | $ | — | $ | — | $ | |||||||||
Fixed Income — Government and agencies | — | — | |||||||||||||
Fixed Income — Corporate | — | — | |||||||||||||
Fixed Income — Asset-backed securities | — | — | |||||||||||||
Fixed Income — Collateralized mortgage-backed | — | — | |||||||||||||
Equity common trust funds | — | — | |||||||||||||
Debt common trust funds | — | — | |||||||||||||
$ | $ | $ | $ | ||||||||||||
Fair Value Measurement as of December 31, 2018 | |||||||||||||||
(in millions) | |||||||||||||||
Level 1 | Level 2 | Level 3 | Total | ||||||||||||
Temporary cash investments | $ | $ | — | $ | — | $ | |||||||||
Fixed Income — Government and agencies | — | — | |||||||||||||
Fixed Income — Corporate | — | — | |||||||||||||
Fixed Income — Collateralized mortgage-backed | — | — | |||||||||||||
Equity common trust funds | — | — | |||||||||||||
Debt common trust funds | — | — | |||||||||||||
$ | $ | $ | $ | ||||||||||||
85
The pension plans' assets are valued at fair value. The following is a description of the valuation methodologies used in determining fair value, including the general classification of such instruments pursuant to the valuation hierarchy as described further in Note 3:
Temporary cash investments — These investments consist of U.S. dollars held in master trust accounts with the trustee. These temporary cash investments are classified as Level 1 instruments.
Fixed Income — Government and agencies — These investments consist primarily of U.S. treasury bonds and notes, U.S. treasury inflation protected securities, U.S. government agency debt, municipal bonds, and other global government bonds. The fair value of these securities is based on quoted market prices when available or is based on yields currently available on comparable securities or on an industry valuation model, which maximizes observable inputs. These securities are categorized as Level 2 instruments.
Fixed Income — Corporate — These investments consist of U.S. and global corporate bonds and notes. The fair value of these securities is based on yields currently available on comparable securities of issuers with similar credit ratings. When quoted prices are not available for identical or similar debt instruments, the fair value is based upon an industry valuation model, which maximizes observable inputs. These securities are categorized as Level 2 instruments.
Fixed Income — Asset-backed securities — Asset-backed securities are valued using quotes from independent pricing vendors based on recent trading activity and other relevant information, including market interest rate curves, referenced credit spreads, and estimated prepayment rates, where applicable. These securities are categorized as Level 2 instruments.
Fixed Income — Collateralized mortgage-backed — Mortgage-backed securities are valued using quotes from independent pricing vendors based on recent trading activity and other relevant information, including market interest rate curves, referenced credit spreads, and estimated prepayment rates, where applicable. These securities are categorized as Level 2 instruments.
Common trust funds — Common trust funds are comprised of shares or units in commingled funds that are not publicly traded. The underlying assets in these funds are publicly traded on exchanges and price quotes for the assets held by these funds are readily available. Holdings of common trust funds are classified as a combination of Level 2 and Level 3 instruments.
Cash flows
Employer contributions for the year ending December 31, 2020 are expected to be $1.1 million for the defined benefit plans, which excludes any potential cash contribution that may be required to settle the Company's pension plan obligations as described above, compared to $1.1 million contributed during 2019. Employer contributions to the 401(k) plan and the Supplemental Profit Sharing Plan for the year ending December 31, 2020 are expected to be $11.4 million compared to $10.6 million contributed during 2019.
Benefit payments for our defined benefit plans are expected to be approximately $225 million in 2020 and approximately $336 million in 2021, which reflects the impact of the Pension Plan termination.
Participants in the 401(k) plan are eligible to receive future retirement benefits through a company-funded annual retirement contribution provided through the Profit Sharing Plan for Employees of Trinity Industries, Inc. and Certain Affiliates. The contribution ranges from one to three percent of eligible compensation based on service. Both the annual retirement contribution and the company matching contribution are discretionary, requiring board approval, and are made annually with the investment of the funds directed by the participants.
86
Note 11. Restructuring Activities
In November 2019, we approved a restructuring plan to resize certain resources, reduce stranded costs, and better align support services with our rail-focused strategy. As part of the restructuring program, we eliminated positions across multiple locations and functions, including certain corporate and operational support functions. Other restructuring actions associated with this plan are expected to be substantially completed in 2020.
During the year ended December 31, 2019, we recorded total restructuring charges of $14.7 million, consisting of approximately $3.8 million in cash charges for severance costs and approximately $10.9 million of non-cash charges, primarily from write-downs of assets associated with our non-operating facilities that will no longer be utilized as we execute our rail-focused strategy. The final liquidation of our non-operating facilities could result in the disposition of certain assets, which were not included in the fourth quarter 2019 restructuring charge, at amounts in excess of their carrying value. As we continue to reposition the organization, it is possible that we will engage in additional restructuring activities in 2020.
The following table sets forth the restructuring activity and balance of the restructuring liability, which is included in other liabilities in our Consolidated Balance Sheet:
Accrued charges as of December 31, 2018 | Charges and adjustments | Payments | Accrued charges as of December 31, 2019 | ||||||||||||
(in millions) | |||||||||||||||
Cash charges: | |||||||||||||||
Employee severance costs | $ | $ | $ | ( | ) | $ | |||||||||
$ | $ | $ | ( | ) | $ | ||||||||||
Non-cash charges: | |||||||||||||||
Write-down of assets | $ | ||||||||||||||
Total restructuring activities | $ | ||||||||||||||
Although restructuring activities are not allocated to our reportable segments, the following table summarizes the restructuring activities by reportable segment:
Year Ended December 31, 2019 | |||||||||||
Employee Severance Costs | Write-down of Assets | Total | |||||||||
(in millions) | |||||||||||
Railcar Leasing and Management Services Group | $ | $ | $ | ||||||||
Rail Products Group | |||||||||||
All Other | |||||||||||
Corporate | |||||||||||
Total restructuring activities | $ | $ | $ | ||||||||
87
Note 12. Accumulated Other Comprehensive Loss
Changes in AOCL for the years ended December 31, 2019 and 2018 are as follows:
Currency translation adjustments | Unrealized gain/(loss) on derivative financial instruments | Net actuarial gains/(losses) of defined benefit plans | Accumulated Other Comprehensive Loss | ||||||||||||
(in millions) | |||||||||||||||
Balances at December 31, 2017 | $ | ( | ) | $ | $ | ( | ) | $ | ( | ) | |||||
Other comprehensive loss, net of tax, before reclassifications | ( | ) | ( | ) | ( | ) | |||||||||
Amounts reclassified from accumulated other comprehensive loss, net of tax benefit of $-, $-, $1.1, and $1.1 | |||||||||||||||
Less: noncontrolling interest | — | ( | ) | — | ( | ) | |||||||||
Other comprehensive loss | ( | ) | ( | ) | ( | ) | |||||||||
Spin-off of Arcosa | — | — | |||||||||||||
Cumulative effect of adopting accounting standard | ( | ) | ( | ) | ( | ) | |||||||||
Balances at December 31, 2018 | ( | ) | ( | ) | ( | ) | ( | ) | |||||||
Other comprehensive loss, net of tax, before reclassifications | ( | ) | ( | ) | ( | ) | |||||||||
Amounts reclassified from accumulated other comprehensive loss, net of tax benefit of $-, $0.8, $1.1, and $1.9 | |||||||||||||||
Less: noncontrolling interest | — | ( | ) | — | ( | ) | |||||||||
Other comprehensive (loss) | ( | ) | ( | ) | ( | ) | |||||||||
Balances at December 31, 2019 | $ | ( | ) | $ | ( | ) | $ | ( | ) | $ | ( | ) | |||
See Note 3 for information on the reclassification of amounts in AOCL into earnings. Reclassifications of unrealized before-tax losses on derivative financial instruments are included in interest expense for our interest rate hedges and in cost of revenues for our foreign currency hedges in our Consolidated Statements of Operations. Reclassifications of before-tax net actuarial gains/(losses) of defined benefit plans are included in other, net (income) expense in our Consolidated Statements of Operations.
88
Note 13. Common Stock and Stock-Based Compensation
Stockholders' Equity
In December 2017, our Board of Directors authorized a $500 million share repurchase program effective January 1, 2018 through December 31, 2019. On November 16, 2018, we entered into an accelerated share repurchase program (the "ASR Program") to repurchase $350 million of the Company's common stock. The $350 million notional value of the ASR Program represented the entire remaining amount that was available to us under the share repurchase program that was in effect at that time. The ASR Program was completed in March 2019.
In March 2019, our Board of Directors authorized a new share repurchase program effective March 7, 2019 through December 31, 2020. The new share repurchase program authorizes the Company to repurchase up to $350.0 million of its common stock, not to exceed 13.7 million shares. The share repurchase program is designed to meet certain IRS safe harbor guidelines associated with our spin-off of Arcosa, which was completed on November 1, 2018.
During the years ended December 31, 2019, 2018, and 2017, we repurchased 13.7 million, 17.2 million, and 2.8 million shares, respectively, at a cost of approximately $294.7 million, $430.1 million, and $85.4 million, respectively. The total for the year ended December 31, 2019 includes 2.6 million shares at a cost of approximately $70.0 million representing the final settlement of the ASR Program, which was funded in November 2018 but a portion of which remained outstanding as of December 31, 2018. As of December 31, 2019, the Company had a remaining authorization to repurchase up to $125.3 million, not to exceed 2.6 million shares, of its common stock under the current repurchase program.
Stock-Based Compensation
Stock Award Plans
Our 2004 Fourth Amended and Restated Stock Option and Incentive Plan (the "Plan”) provides for awarding 20,150,000 (adjusted for stock splits) shares of common stock plus (i) shares covered by forfeited, expired, and canceled options granted under prior plans; and (ii) shares tendered as full or partial payment for the purchase price of an award or to satisfy tax withholding obligations. At December 31, 2019, a total of 2,737,464 shares were available for issuance. The Plan provides for the granting of nonqualified and incentive stock options having maximum ten-year terms to purchase common stock at its market value on the award date; stock appreciation rights based on common stock fair market values with settlement in common stock or cash; restricted stock awards; restricted stock units; and performance awards with settlement in common stock or cash on achievement of specific business objectives. Options become exercisable in various percentages over periods ranging up to five years.
Stock-Based Compensation Expense
The cost of employee services received in exchange for awards of equity instruments is referred to as share-based compensation and is based on the grant date fair-value of those awards. Stock-based compensation includes compensation expense, recognized over the applicable vesting periods, for share-based awards. Stock-based compensation expense totaled $29.2 million, $29.3 million, and $24.6 million for the years ended December 31, 2019, 2018, and 2017, respectively.
The income tax benefit related to stock-based compensation expense was $6.6 million, $7.7 million, and $14.5 million for the years ended December 31, 2019, 2018, and 2017, respectively.
89
Restricted Stock
Restricted share awards consist of restricted stock and restricted stock units. Restricted stock and restricted stock units generally vest for periods ranging from one to fifteen years from the date of grant. Certain restricted stock and restricted stock units vest in their entirety upon the employee's retirement from the Company, taking into consideration the employee's age and years of service to the Company, as defined more specifically in our benefit plans. Restricted stock and restricted stock units granted to non-employee directors under the Plan generally vest one year from the grant date and are released at that time or upon completion of the directors' service to the Company. Expense related to restricted stock units issued to eligible employees under the Plan is recognized ratably over the vesting period, generally between three years and four years. Expense related to restricted stock awards granted to non-employee directors under the Plan is recognized ratably over the vesting period, generally one year. Forfeitures are recognized as a reduction to expense in the period in which they occur.
Number of Restricted Share Awards | Weighted Average Grant-Date Fair Value per Award | |||||
Restricted share awards outstanding at December 31, 2018 | $ | |||||
Granted | ||||||
Vested | ( | ) | ||||
Forfeited | ( | ) | ||||
Restricted share awards outstanding at December 31, 2019 (1) | $ | |||||
At December 31, 2019, unrecognized compensation expense related to restricted share awards totaled $39.2 million, which will be recognized over a weighted average period of 2.8 years. The total grant-date fair value of shares vested and released during the years ended December 31, 2019, 2018, and 2017 was $26.4 million, $30.1 million, and $28.2 million, respectively. The weighted average grant-date fair value of restricted share awards granted during the years ended December 31, 2019, 2018, and 2017 was $22.20 , $25.52 , and $23.28 per share, respectively.
Performance Units
Performance units are granted to employees based upon a target level; however, depending upon the achievement of certain specified goals during the performance period, performance units may be adjusted to a level ranging between 0% and 200% of the target level. The performance units vest upon certification by the Human Resources Committee of the Board of Directors of the achievement of the specified performance goals. Expense related to performance units is recognized ratably from their award date to the end of the performance period, generally three years. Forfeitures are recognized as a reduction to expense in the period in which they occur.
Number of Performance Units | Weighted Average Grant-Date Fair Value per Award | |||||
Performance units outstanding at December 31, 2018 | $ | |||||
Granted | ||||||
Vested | ||||||
Forfeited | ||||||
Performance units outstanding at December 31, 2019 | $ | |||||
90
Note 14. Earnings Per Common Share
Basic net income attributable to Trinity Industries, Inc. per common share ("EPS") is computed by dividing net income attributable to Trinity remaining after allocation to unvested restricted shares by the weighted average number of basic common shares outstanding for the period. Except when the effect would be antidilutive, the calculation of diluted EPS includes 1) the net impact of unvested RSAs and RSUs and 2) with respect to the years ended December 31, 2018 and 2017, the dilutive impact of our then-outstanding convertible notes due 2036 (the "Convertible Notes"), which were converted and settled in cash during the second quarter of 2018. See Note 11 of our 2018 Annual Report on Form 10-K for further information regarding the settlement of the Convertible Notes. Total weighted average restricted shares were 5.5 million, 5.8 million, and 6.4 million shares for the years ended December 31, 2019, 2018, and 2017, respectively. Approximately 0.2 million of these shares were excluded from the EPS calculation for the year ended December 31, 2019, as their effect would have been antidilutive. There were no antidilutive restrictive shares for the years ended December 31, 2018 and 2017.
The computation of basic and diluted net income attributable to Trinity Industries, Inc. is as follows:
Year Ended December 31, | |||||||||||
2019 | 2018 | 2017 | |||||||||
(in millions, except per share amounts) | |||||||||||
Income from continuing operations | $ | $ | $ | ||||||||
Less: Net (income) loss attributable to noncontrolling interest | ( | ) | ( | ) | |||||||
Unvested restricted share participation — continuing operations | ( | ) | ( | ) | ( | ) | |||||
Convertible subordinated notes | |||||||||||
Net income from continuing operations attributable to Trinity Industries, Inc. | |||||||||||
Net income (loss) from discontinued operations, net of income taxes | ( | ) | |||||||||
Unvested restricted share participation — discontinued operations | ( | ) | ( | ) | |||||||
Net income (loss) from discontinued operations attributable to Trinity Industries, Inc. | ( | ) | |||||||||
Net income attributable to Trinity Industries, Inc., including the effect of unvested restricted share participation | $ | $ | $ | ||||||||
Basic weighted average shares outstanding | |||||||||||
Effect of dilutive securities: | |||||||||||
Nonparticipating unvested RSUs and RSAs | |||||||||||
Convertible subordinated notes | |||||||||||
Diluted weighted average shares outstanding | |||||||||||
Basic earnings per common share: | |||||||||||
Income from continuing operations | $ | $ | $ | ||||||||
Income (loss) from discontinued operations | ( | ) | |||||||||
Basic net income attributable to Trinity Industries, Inc. | $ | $ | $ | ||||||||
Diluted earnings per common share: | |||||||||||
Income from continuing operations | $ | $ | $ | ||||||||
Income (loss) from discontinued operations | ( | ) | |||||||||
Diluted net income attributable to Trinity Industries, Inc. | $ | $ | $ | ||||||||
91
Note 15. Contingencies
Highway products litigation
We previously reported the filing of a False Claims Act (“FCA”) complaint in the United States District Court for the Eastern District of Texas, Marshall Division (“District Court”) styled Joshua Harman, on behalf of the United States of America, Plaintiff/Relator v. Trinity Industries, Inc., Defendant, Case No. 2:12-cv-00089-JRG (E.D. Tex.). In this case, in which the U.S. Government declined to intervene, the relator, Mr. Joshua Harman, alleged the Company violated the FCA pertaining to sales of the Company's ET-Plus® System, a highway guardrail end-terminal system (“ET Plus”). On October 20, 2014, a trial in this case concluded with a jury verdict stating that the Company and its subsidiary, Trinity Highway Products, LLC (“Trinity Highway Products”), “knowingly made, used or caused to be made or used, a false record or statement material to a false or fraudulent claim" and awarding $175.0 million in damages. On June 9, 2015 the District Court entered judgment on the verdict in the total amount of $682.4 million, comprised of $175.0 million in damages, which amount was automatically trebled under the FCA to $525.0 million plus $138.4 million in civil penalties and $19.0 million in costs and attorneys' fees.
On September 29, 2017, the United States Court of Appeals for the Fifth Circuit ("Fifth Circuit") reversed the District Court’s $682.4 million judgment and rendered judgment as a matter of law in favor of the Company and Trinity Highway Products. On October 27, 2017, Mr. Harman filed a Petition for Rehearing En Banc in the Fifth Circuit, which was denied by the Fifth Circuit on November 14, 2017. On February 12, 2018, Mr. Harman, filed a petition for certiorari with the United States Supreme Court, seeking a review of the Fifth Circuit's decision. On January 7, 2019, the United States Supreme Court denied Mr. Harman's petition for certiorari. The denial of Mr. Harman's petition ends this action.
State, county, and municipal actions
Mr. Harman also has separate state qui tam actions currently pending pursuant to: the Virginia Fraud Against Taxpayers Act (Commonwealth of Virginia ex rel. Joshua M. Harman v. Trinity Industries, Inc. and Trinity Highway Products, LLC, Case No. CL13-698, in the Circuit Court, Richmond, Virginia); the Tennessee False Claims Act (State of Tennessee ex rel. Joshua M. Harman v. Trinity Industries, Inc., and Trinity Highway Products, LLC, Case No. 14C2652, in the Circuit Court for Davidson County, Tennessee); the Massachusetts False Claims Act (Commonwealth of Massachusetts ex rel. Joshua M. Harman Qui Tam v. Trinity Industries, Inc. and Trinity Highway Products, LLC, Case No. 1484-CV-02364, in the Superior Court Department of the Trial Court); the New Jersey False Claims Act (State of New Jersey ex rel. Joshua M. Harman v. Trinity Industries, Inc. and Trinity Highway Products, LLC, Case No.L-1344-14, in the Superior Court of New Jersey Law Division: Mercer County); and the California False Claims Act (State of California ex rel. Joshua M. Harman Qui Tam v. Trinity Industries, Inc. and Trinity Highway Products, LLC, Case No. RG 14721864, in the Superior Court of California, Alameda County). In each of these cases, Mr. Harman alleged the Company violated the respective states' false claims act pertaining to sales of the ET Plus, and he is seeking damages, civil penalties, attorneys’ fees, costs and interest. Also, the respective states’ Attorneys General filed Notices of Election to Decline Intervention in all of these matters, with the exception of the Commonwealth of Virginia Attorney General, who intervened in the Virginia matter. Following the United States Supreme Court’s denial of Mr. Harman’s petition for certiorari, the stays have expired or been lifted by court order in all of the above-referenced state qui tam cases except Virginia.
As previously reported, state qui tam actions filed by Mr. Harman in the states of Delaware, Florida, Georgia, Illinois, Indiana, Iowa, Minnesota, Montana, Nevada, and Rhode Island were dismissed.
The Company believes these state qui tam lawsuits are without merit and intends to vigorously defend all allegations. Other states could take similar or different actions, and could be considering similar state false claims or other litigation against the Company.
92
The Company has been served in a lawsuit filed November 5, 2015, titled Jackson County, Missouri, individually and on behalf of a class of others similarly situated vs. Trinity Industries, Inc. and Trinity Highway Products, LLC, Case No. 1516-CV23684 (Circuit Court of Jackson County, Missouri). The case is being brought by plaintiff for and on behalf of itself and all Missouri counties with a population of 10,000 or more persons, including the City of St. Louis, and the State of Missouri’s transportation authority. The plaintiff alleges that the Company and Trinity Highway Products did not disclose design changes to the ET Plus and these allegedly undisclosed design changes made the ET Plus allegedly defective, unsafe, and unreasonably dangerous. The plaintiff alleges product liability negligence, product liability strict liability, and negligently supplying dangerous instrumentality for supplier’s business purposes. The plaintiff seeks compensatory damages, interest, attorneys' fees and costs, and in the alternative plaintiff seeks a declaratory judgment that the ET Plus is defective, the Company’s conduct was unlawful, and class-wide costs and expenses associated with removing and replacing the ET Plus throughout Missouri. On December 6, 2017, the Court granted plaintiff's Motion for Class Certification, certifying a class of Missouri counties with populations of 10,000 or more persons, including the City of St. Louis and the State of Missouri's transportation authority that have or had ET Plus guardrail end terminals with 4-inch wide guide channels installed on roadways they own or maintain. A trial date has been scheduled in this case for April 27, 2020.
The Company believes this lawsuit is without merit and intends to vigorously defend all allegations. While the financial impacts of these state, county, and municipal actions are currently unknown, they could be material.
Based on information currently available to the Company and previously disclosed, including, but not limited to the significance of the successful completion of eight post-verdict crash tests of the ET Plus in 2015, the favorable findings and conclusions published in 2015 by two joint task forces of the Federal Highway Administration and the American Association of State Highway and Transportation Officials regarding the ET Plus end terminal system, the Fifth Circuit's unanimous panel opinion reversing the $682.4 million judgment and rendering judgment in favor of the Company, and the United States Supreme Court’s subsequent denial of Mr. Harman's petition for certiorari in the FCA case, we currently do not believe that a loss is probable in any one or more of the actions described under "State, county, and municipal actions," therefore no accrual has been included in the accompanying Consolidated Financial Statements. Because of the complexity of these actions as well as the current status of certain of these actions, we are not able to estimate a range of possible losses with respect to any one or more of these actions.
Product liability cases
The Company is currently defending product liability lawsuits in several different states that are alleged to involve the ET Plus as well as other products manufactured by Trinity Highway Products. These cases are diverse in light of the randomness of collisions in general and the fact that each accident involving a roadside device, such as an end terminal, or any other fixed object along the highway, has its own unique facts and circumstances. The Company carries general liability insurance to mitigate the impact of adverse judgment exposures in these product liability cases. To the extent that the Company believes that a loss is probable with respect to these product liability cases, the accrual for such losses is included in the amounts described below under "Other matters".
Shareholder class actions
On January 11, 2016, the previously reported cases styled Thomas Nemky, Individually and On Behalf of All Other Similarly Situated v. Trinity Industries, Inc., Timothy R. Wallace, and James E. Perry, Case No. (2:15-CV-00732) (“Nemky”) and Richard J. Isolde, Individually and On Behalf of All Other Similarly Situated v. Trinity Industries, Inc., Timothy R. Wallace, and James E. Perry, Case No. (3:15-CV-2093) ("Isolde"), were consolidated in the District Court for the Northern District of Texas, with all future filings to be filed in the Isolde case. On May 11, 2016, the Lead Plaintiffs filed their Consolidated Complaint alleging defendants Trinity Industries, Inc., Timothy R. Wallace, James E. Perry, and Gregory B. Mitchell violated Section 10(b) of the Securities Exchange Act of 1934, Rule 10b-5 promulgated thereunder, and defendants Mr. Wallace and Mr. Perry violated Section 20(a) of the Securities Exchange Act of 1934 by making materially false and misleading statements and/or by failing to disclose material facts about Trinity's ET Plus and the FCA case styled Joshua Harman, on behalf of the United States of America, Plaintiff/Relator v. Trinity Industries, Inc., Defendant, Case No. 2:12-cv-00089-JRG (E.D. Tex.). The parties reached an agreement to settle all claims in this case without any admission of liability or fault for $7.5 million, and on September 23, 2019, entered into a Stipulation of Settlement. Defendants have denied and continue to deny specifically each and all of the claims and contentions alleged by Lead Plaintiffs in this case. The settlement is subject to final court approval. On September 24, 2019, Lead Plaintiffs filed with the Court an Unopposed Motion for Preliminary Approval of Settlement and Approval of Notice to the Class. On November 12, 2019, the Court entered an Order Preliminarily Approving Settlement and Providing for Notice and scheduled a settlement hearing on March 31, 2020.
93
Other matters
The Company is involved in claims and lawsuits incidental to our business arising from various matters, including product warranty, personal injury, environmental issues, workplace laws, and various governmental regulations. The Company evaluates its exposure to such claims and suits periodically and establishes accruals for these contingencies when a range of loss can be reasonably estimated. The range of reasonably possible losses for such matters is $21.6 million to $35.3 million, which includes our rights in indemnity and recourse to third parties of approximately $15.2 million, which is recorded in Other Assets on our Consolidated Balance Sheet as of December 31, 2019. This range includes any amounts related to the Highway Products litigation matters described above in the section titled “Highway products litigation.” At December 31, 2019, total accruals of $23.0 million, including environmental and workplace matters described below, are included in accrued liabilities in the accompanying Consolidated Balance Sheets. The Company believes any additional liability would not be material to its financial position or results of operations.
Trinity is subject to remedial orders and federal, state, local, and foreign laws and regulations relating to the environment and the workplace. The Company has reserved $1.2 million to cover our probable and estimable liabilities with respect to the investigations, assessments, and remedial responses to such matters, taking into account currently available information and our contractual rights to indemnification and recourse to third parties. However, estimates of liability arising from future proceedings, assessments, or remediation are inherently imprecise. Accordingly, there can be no assurance that we will not become involved in future litigation or other proceedings involving the environment and the workplace or, if we are found to be responsible or liable in any such litigation or proceeding, that such costs would not be material to the Company. We believe that we are currently in substantial compliance with environmental and workplace laws and regulations.
94
Note 16. Financial Statements for Guarantors of the Senior Notes
Our Senior Notes are fully and unconditionally and jointly and severally guaranteed by certain of Trinity’s 100%-owned subsidiaries: Trinity Industries Leasing Company; Trinity North American Freight Car, Inc.; Trinity Rail Group, LLC; Trinity Tank Car, Inc.; Trinity Highway Products, LLC; and TrinityRail Maintenance Services, Inc. (collectively, the "Combined Guarantor Subsidiaries”).
The Senior Notes indenture agreement includes customary provisions for the release of the guarantees by the Combined Guarantor Subsidiaries upon the occurrence of certain allowed events including the release of one or more of the Combined Guarantor Subsidiaries as guarantor under our revolving credit facility. See Note 8. The Senior Notes are not guaranteed by any of our remaining 100%-owned subsidiaries or partially-owned subsidiaries (“Combined Non-Guarantor Subsidiaries”).
On November 1, 2018, we amended our Credit Agreement and the Supplemental Indenture governing our Senior Notes to release Trinity Marine Products, Inc., Trinity Meyer Utility Structures LLC and Trinity Structural Towers, Inc. from their obligations as guarantors for the Credit Agreement and the Senior Notes effective upon completion of the Arcosa spin-off as these businesses were transferred to Arcosa in connection with the spin-off. Additionally, upon completion of the Arcosa spin-off, the accounting requirements for reporting Arcosa as a discontinued operation were met. Accordingly, we have recast the financial information included in the tables below for all periods presented to: 1) reflect the historical balances and operating results of Arcosa as discontinued operations, 2) reclassify the historical balances and operating results of Trinity Marine Products, Inc., Trinity Meyer Utility Structures LLC and Trinity Structural Towers, Inc., who were formerly guarantor subsidiaries and whose results were previously reflected in the guarantor column, to the non-guarantor column, and 3) include Trinity Highway Products, LLC in the guarantor column. Additionally, amounts previously reported have been restated to include TrinityRail Maintenance Services, Inc. as a Guarantor Subsidiary for all periods presented and to affect reallocations of certain corporate costs between the parent, guarantor, and non-guarantor columns for the year ended December 31, 2018.
As of December 31, 2019, assets held by the Combined Non-Guarantor Subsidiaries included $86.1 million of restricted cash that was not available for distribution to Trinity Industries, Inc. (“Parent”), $6,409.8 million of equipment securing certain non-recourse debt, and $136.0 million of assets located in foreign locations. As of December 31, 2018, assets held by the Combined Non-Guarantor Subsidiaries included $132.9 million of restricted cash that was not available for distribution to the Parent, $5,316.2 million of equipment securing certain non-recourse debt, $67.5 million of equipment securing certain lease obligations held by the Combined Non-Guarantor Subsidiaries, and $116.0 million of assets located in foreign locations.
95
Condensed Consolidating Statement of Operations and Comprehensive Income | |||||||||||||||||||
Year Ended December 31, 2019 | |||||||||||||||||||
Parent | Combined Guarantor Subsidiaries | Combined Non-Guarantor Subsidiaries | Eliminations | Consolidated | |||||||||||||||
(in millions) | |||||||||||||||||||
Revenues | $ | $ | $ | $ | ( | ) | $ | ||||||||||||
Cost of revenues | ( | ) | |||||||||||||||||
Selling, engineering, and administrative expenses | |||||||||||||||||||
Gains on dispositions of property | ( | ) | |||||||||||||||||
Restructuring activities | 14.7 | ||||||||||||||||||
( | ) | ||||||||||||||||||
Operating profit (loss) | ( | ) | |||||||||||||||||
Other (income) expense | ( | ) | ( | ) | |||||||||||||||
Equity in earnings of subsidiaries, net of taxes | ( | ) | |||||||||||||||||
Income from continuing operations before income taxes | ( | ) | |||||||||||||||||
Provision (benefit) for income taxes | ( | ) | |||||||||||||||||
Income from continuing operations | ( | ) | |||||||||||||||||
Loss from discontinued operations, net of income taxes | ( | ) | ( | ) | |||||||||||||||
Net income | ( | ) | |||||||||||||||||
Net loss attributable to noncontrolling interest | ( | ) | ( | ) | |||||||||||||||
Net income attributable to controlling interest | $ | $ | $ | $ | ( | ) | $ | ||||||||||||
Net income | $ | $ | $ | $ | ( | ) | $ | ||||||||||||
Other comprehensive income (loss) | ( | ) | ( | ) | ( | ) | |||||||||||||
Comprehensive income | ( | ) | |||||||||||||||||
Comprehensive loss attributable to noncontrolling interest | ( | ) | ( | ) | |||||||||||||||
Comprehensive income attributable to controlling interest | $ | $ | $ | $ | ( | ) | $ | ||||||||||||
Condensed Consolidating Statement of Operations and Comprehensive Income | |||||||||||||||||||
Year Ended December 31, 2018 | |||||||||||||||||||
Parent | Combined Guarantor Subsidiaries | Combined Non-Guarantor Subsidiaries | Eliminations | Consolidated | |||||||||||||||
(in millions) | |||||||||||||||||||
Revenues | $ | $ | $ | $ | ( | ) | $ | ||||||||||||
Cost of revenues | ( | ) | |||||||||||||||||
Selling, engineering, and administrative expenses | |||||||||||||||||||
Gains on dispositions of property | |||||||||||||||||||
( | ) | ||||||||||||||||||
Operating profit (loss) | ( | ) | |||||||||||||||||
Other (income) expense | ( | ) | |||||||||||||||||
Equity in earnings of subsidiaries, net of taxes | ( | ) | |||||||||||||||||
Income from continuing operations before income taxes | ( | ) | |||||||||||||||||
Provision (benefit) for income taxes | ( | ) | ( | ) | |||||||||||||||
Income from continuing operations | ( | ) | |||||||||||||||||
Income (loss) from discontinued operations, net of income taxes | ( | ) | |||||||||||||||||
Net income | ( | ) | |||||||||||||||||
Net income attributable to noncontrolling interest | |||||||||||||||||||
Net income attributable to controlling interest | $ | $ | $ | $ | ( | ) | $ | ||||||||||||
Net income | $ | $ | $ | $ | ( | ) | $ | ||||||||||||
Other comprehensive loss | ( | ) | ( | ) | ( | ) | ( | ) | |||||||||||
Comprehensive income | ( | ) | |||||||||||||||||
Comprehensive income attributable to noncontrolling interest | |||||||||||||||||||
Comprehensive income attributable to controlling interest | $ | $ | $ | $ | ( | ) | $ | ||||||||||||
96
Condensed Consolidating Statement of Operations and Comprehensive Income | |||||||||||||||||||
Year Ended December 31, 2017 | |||||||||||||||||||
Parent | Combined Guarantor Subsidiaries | Combined Non-Guarantor Subsidiaries | Eliminations | Consolidated | |||||||||||||||
(in millions) | |||||||||||||||||||
Revenues | $ | $ | $ | $ | ( | ) | $ | ||||||||||||
Cost of revenues | ( | ) | |||||||||||||||||
Selling, engineering, and administrative expenses | |||||||||||||||||||
Gains on dispositions of property | |||||||||||||||||||
( | ) | ||||||||||||||||||
Operating profit (loss) | ( | ) | |||||||||||||||||
Other (income) expense | ( | ) | |||||||||||||||||
Equity in earnings of subsidiaries, net of taxes | ( | ) | |||||||||||||||||
Income from continuing operations before income taxes | ( | ) | |||||||||||||||||
Provision (benefit) for income taxes | ( | ) | ( | ) | ( | ) | ( | ) | |||||||||||
Income from continuing operations | ( | ) | |||||||||||||||||
Income from discontinued operations, net of income taxes | |||||||||||||||||||
Net income | ( | ) | |||||||||||||||||
Net income attributable to noncontrolling interest | |||||||||||||||||||
Net income attributable to controlling interest | $ | $ | $ | $ | ( | ) | $ | ||||||||||||
Net income | $ | $ | $ | $ | ( | ) | $ | ||||||||||||
Other comprehensive income | |||||||||||||||||||
Comprehensive income | ( | ) | |||||||||||||||||
Comprehensive income attributable to noncontrolling interest | |||||||||||||||||||
Comprehensive income attributable to controlling interest | $ | $ | $ | $ | ( | ) | $ | ||||||||||||
97
Condensed Consolidating Balance Sheet | |||||||||||||||||||
December 31, 2019 | |||||||||||||||||||
Parent | Combined Guarantor Subsidiaries | Combined Non-Guarantor Subsidiaries | Eliminations | Consolidated | |||||||||||||||
(in millions) | |||||||||||||||||||
Assets: | |||||||||||||||||||
Cash and cash equivalents | $ | $ | $ | $ | ( | ) | $ | ||||||||||||
Receivables, net of allowance | ( | ) | |||||||||||||||||
Income tax receivable | |||||||||||||||||||
Inventory | ( | ) | |||||||||||||||||
Property, plant, and equipment, net | ( | ) | |||||||||||||||||
Investments in and advances to subsidiaries | ( | ) | |||||||||||||||||
Restricted cash | |||||||||||||||||||
Goodwill and other assets | ( | ) | |||||||||||||||||
$ | $ | $ | $ | ( | ) | $ | |||||||||||||
Liabilities: | |||||||||||||||||||
Accounts payable | $ | $ | $ | $ | ( | ) | $ | ||||||||||||
Accrued liabilities | ( | ) | |||||||||||||||||
Debt | |||||||||||||||||||
Deferred income taxes | ( | ) | ( | ) | |||||||||||||||
Advances from subsidiaries | ( | ) | |||||||||||||||||
Other liabilities | |||||||||||||||||||
Total stockholders' equity | ( | ) | |||||||||||||||||
$ | $ | $ | $ | ( | ) | $ | |||||||||||||
Condensed Consolidating Balance Sheet | |||||||||||||||||||
December 31, 2018 | |||||||||||||||||||
Parent | Combined Guarantor Subsidiaries | Combined Non-Guarantor Subsidiaries | Eliminations | Consolidated | |||||||||||||||
(in millions) | |||||||||||||||||||
Assets: | |||||||||||||||||||
Cash and cash equivalents | $ | $ | $ | $ | ( | ) | $ | ||||||||||||
Receivables, net of allowance | |||||||||||||||||||
Income tax receivable | |||||||||||||||||||
Inventory | ( | ) | |||||||||||||||||
Property, plant, and equipment, net | ( | ) | |||||||||||||||||
Investments in and advances to subsidiaries | ( | ) | |||||||||||||||||
Restricted cash | |||||||||||||||||||
Goodwill and other assets | ( | ) | |||||||||||||||||
$ | $ | $ | $ | ( | ) | $ | |||||||||||||
Liabilities: | |||||||||||||||||||
Accounts payable | $ | $ | $ | $ | ( | ) | $ | ||||||||||||
Accrued liabilities | ( | ) | |||||||||||||||||
Debt | |||||||||||||||||||
Deferred income | |||||||||||||||||||
Deferred income taxes | ( | ) | |||||||||||||||||
Advances from subsidiaries | ( | ) | ( | ) | |||||||||||||||
Other liabilities | |||||||||||||||||||
Total stockholders' equity | ( | ) | |||||||||||||||||
$ | $ | $ | $ | ( | ) | $ | |||||||||||||
98
Condensed Consolidating Statement of Cash Flows | |||||||||||||||||||
Year Ended December 31, 2019 | |||||||||||||||||||
Parent | Combined Guarantor Subsidiaries | Combined Non-Guarantor Subsidiaries | Eliminations | Consolidated | |||||||||||||||
(in millions) | |||||||||||||||||||
Operating activities: | |||||||||||||||||||
Net income | $ | $ | $ | $ | ( | ) | $ | ||||||||||||
Loss from discontinued operations | |||||||||||||||||||
Equity in earnings of subsidiaries, net of taxes | ( | ) | ( | ) | ( | ) | |||||||||||||
Other | ( | ) | ( | ) | |||||||||||||||
Net cash provided by operating activities – continuing operations | |||||||||||||||||||
Net cash used in operating activities – discontinued operations | ( | ) | ( | ) | |||||||||||||||
Net cash provided by operating activities | $ | $ | $ | $ | $ | ||||||||||||||
Investing activities: | |||||||||||||||||||
Proceeds from railcar lease fleet sales owned more than one year | ( | ) | |||||||||||||||||
Proceeds from dispositions of property and other assets | |||||||||||||||||||
Capital expenditures – leasing | ( | ) | ( | ) | ( | ) | |||||||||||||
Capital expenditures – manufacturing and other | ( | ) | ( | ) | ( | ) | ( | ) | |||||||||||
(Increase) decrease in investment in partially-owned subsidiaries | ( | ) | |||||||||||||||||
Net cash (used in) provided by investing activities | ( | ) | ( | ) | ( | ) | ( | ) | |||||||||||
Financing activities: | |||||||||||||||||||
Payments to retire debt | ( | ) | ( | ) | ( | ) | |||||||||||||
Proceeds from issuance of debt | |||||||||||||||||||
Shares repurchased | ( | ) | ( | ) | |||||||||||||||
Dividends paid to common shareholders | ( | ) | ( | ) | |||||||||||||||
Purchase of shares to satisfy employee tax on vested stock | ( | ) | ( | ) | |||||||||||||||
Distributions to noncontrolling interest | ( | ) | ( | ) | |||||||||||||||
Distributions to controlling interest in partially-owned subsidiaries | ( | ) | |||||||||||||||||
Change in intercompany financing between entities | ( | ) | ( | ) | |||||||||||||||
Net cash (used in) provided by financing activities | ( | ) | ( | ) | ( | ) | |||||||||||||
Net decrease in cash, cash equivalents, and restricted cash | ( | ) | ( | ) | ( | ) | |||||||||||||
Cash, cash equivalents, and restricted cash at beginning of period | |||||||||||||||||||
Cash, cash equivalents, and restricted cash at end of period | $ | $ | $ | $ | $ | ||||||||||||||
99
Condensed Consolidating Statement of Cash Flows | |||||||||||||||||||
Year Ended December 31, 2018 | |||||||||||||||||||
Parent | Combined Guarantor Subsidiaries | Combined Non-Guarantor Subsidiaries | Eliminations | Consolidated | |||||||||||||||
(in millions) | |||||||||||||||||||
Operating activities: | |||||||||||||||||||
Net income | $ | $ | $ | $ | ( | ) | $ | ||||||||||||
Income (loss) from discontinued operations | ( | ) | ( | ) | |||||||||||||||
Equity in earnings of subsidiaries, net of taxes | ( | ) | ( | ) | ( | ) | |||||||||||||
Other | ( | ) | ( | ) | |||||||||||||||
Net cash (used in) provided by operating activities – continuing operations | ( | ) | |||||||||||||||||
Net cash (used in) provided by operating activities – discontinued operations | ( | ) | |||||||||||||||||
Net cash (used in) provided by operating activities | ( | ) | |||||||||||||||||
Investing activities: | |||||||||||||||||||
Decrease in short-term marketable securities | |||||||||||||||||||
Proceeds from railcar lease fleet sales owned more than one year | ( | ) | |||||||||||||||||
Proceeds from dispositions of property and other assets | |||||||||||||||||||
Capital expenditures – leasing | ( | ) | ( | ) | ( | ) | |||||||||||||
Capital expenditures – manufacturing and other | ( | ) | ( | ) | ( | ) | ( | ) | |||||||||||
(Increase) decrease in investment in partially-owned subsidiaries | ( | ) | |||||||||||||||||
Other | ( | ) | |||||||||||||||||
Net cash (used in) provided by investing activities – continuing operations | ( | ) | ( | ) | ( | ) | ( | ) | |||||||||||
Net cash used in investing activities – discontinued operations | ( | ) | ( | ) | |||||||||||||||
Net cash (used in) provided by investing activities | ( | ) | ( | ) | ( | ) | ( | ) | |||||||||||
Financing activities: | |||||||||||||||||||
Payments to retire debt | ( | ) | ( | ) | ( | ) | ( | ) | |||||||||||
Proceeds from issuance of debt | |||||||||||||||||||
Shares repurchased | ( | ) | ( | ) | |||||||||||||||
Dividends paid to common shareholders | ( | ) | ( | ) | |||||||||||||||
Purchase of shares to satisfy employee tax on vested stock | ( | ) | ( | ) | |||||||||||||||
Distributions to noncontrolling interest | ( | ) | ( | ) | |||||||||||||||
Distributions to controlling interest in partially-owned subsidiaries | ( | ) | |||||||||||||||||
Change in intercompany financing between entities | ( | ) | ( | ) | ( | ) | |||||||||||||
Other | ( | ) | ( | ) | |||||||||||||||
Net cash (used in) provided by financing activities – continuing operations | ( | ) | ( | ) | ( | ) | ( | ) | |||||||||||
Cash distributions to Arcosa, Inc. | ( | ) | ( | ) | |||||||||||||||
Net cash (used in) provided by financing activities | ( | ) | ( | ) | ( | ) | ( | ) | |||||||||||
Net (decrease) increase in cash, cash equivalents, and restricted cash | ( | ) | ( | ) | ( | ) | |||||||||||||
Cash, cash equivalents, and restricted cash at beginning of period | |||||||||||||||||||
Cash, cash equivalents, and restricted cash at end of period | $ | $ | $ | $ | $ | ||||||||||||||
100
Condensed Consolidating Statement of Cash Flows | |||||||||||||||||||
Year Ended December 31, 2017 | |||||||||||||||||||
Parent | Combined Guarantor Subsidiaries | Combined Non-Guarantor Subsidiaries | Eliminations | Consolidated | |||||||||||||||
(in millions) | |||||||||||||||||||
Operating activities: | |||||||||||||||||||
Net income | $ | $ | $ | $ | ( | ) | $ | ||||||||||||
Loss from discontinued operations | ( | ) | ( | ) | ( | ) | |||||||||||||
Equity in earnings of subsidiaries, net of taxes | ( | ) | ( | ) | ( | ) | |||||||||||||
Other | ( | ) | ( | ) | |||||||||||||||
Net cash provided by operating activities – continuing operations | |||||||||||||||||||
Net cash provided by operating activities – discontinued operations | |||||||||||||||||||
Net cash provided by operating activities | |||||||||||||||||||
Investing activities: | |||||||||||||||||||
Decrease in short-term marketable securities | ( | ) | ( | ) | |||||||||||||||
Proceeds from railcar lease fleet sales owned more than one year | ( | ) | |||||||||||||||||
Proceeds from dispositions of property and other assets | |||||||||||||||||||
Capital expenditures – leasing | ( | ) | ( | ) | ( | ) | |||||||||||||
Capital expenditures – manufacturing and other | ( | ) | ( | ) | ( | ) | ( | ) | |||||||||||
(Increase) decrease in investment in partially-owned subsidiaries | ( | ) | |||||||||||||||||
Other | |||||||||||||||||||
Net cash (used in) provided by investing activities – continuing operations | ( | ) | ( | ) | ( | ) | ( | ) | |||||||||||
Net cash used in investing activities – discontinued operations | ( | ) | ( | ) | |||||||||||||||
Net cash (used in) provided by investing activities | ( | ) | ( | ) | ( | ) | ( | ) | |||||||||||
Financing activities: | |||||||||||||||||||
Payments to retire debt | ( | ) | ( | ) | ( | ) | |||||||||||||
Proceeds from issuance of debt | |||||||||||||||||||
Shares repurchased | ( | ) | ( | ) | |||||||||||||||
Dividends paid to common shareholders | ( | ) | ( | ) | |||||||||||||||
Purchase of shares to satisfy employee tax on vested stock | ( | ) | ( | ) | |||||||||||||||
Distributions to noncontrolling interest | ( | ) | ( | ) | |||||||||||||||
Distributions to controlling interest in partially-owned subsidiaries | ( | ) | |||||||||||||||||
Change in intercompany financing between entities | ( | ) | ( | ) | |||||||||||||||
Other | |||||||||||||||||||
Net cash (used in) provided by financing activities | ( | ) | ( | ) | ( | ) | |||||||||||||
Net (decrease) increase in cash, cash equivalents, and restricted cash | ( | ) | |||||||||||||||||
Cash, cash equivalents, and restricted cash at beginning of period | |||||||||||||||||||
Cash, cash equivalents, and restricted cash at end of period | $ | $ | $ | $ | $ | ||||||||||||||
101
Note 17. Selected Quarterly Financial Data (Unaudited)
Three Months Ended | |||||||||||||||
March 31, 2019 | June 30, 2019 | September 30, 2019 | December 31, 2019 | ||||||||||||
(in millions, except per share data) | |||||||||||||||
Revenues: | |||||||||||||||
Manufacturing | $ | $ | $ | $ | |||||||||||
Leasing | |||||||||||||||
Operating costs: | |||||||||||||||
Costs of revenues: | |||||||||||||||
Manufacturing | |||||||||||||||
Leasing | |||||||||||||||
Selling, engineering, and administrative expenses | |||||||||||||||
Gains on disposition of property | |||||||||||||||
Restructuring activities (1) | |||||||||||||||
Operating profit | |||||||||||||||
Income from continuing operations before income taxes | |||||||||||||||
Provision for income taxes (2) | |||||||||||||||
Income from continuing operations | |||||||||||||||
Loss from discontinued operations, net of income taxes | ( | ) | ( | ) | ( | ) | ( | ) | |||||||
Net income | |||||||||||||||
Net income (loss) attributable to noncontrolling interest | ( | ) | ( | ) | ( | ) | |||||||||
Net income attributable to Trinity Industries, Inc. | $ | $ | $ | $ | |||||||||||
Basic earnings per common share (3): | |||||||||||||||
Income from continuing operations | $ | $ | $ | $ | |||||||||||
Loss from discontinued operations | ( | ) | ( | ) | ( | ) | |||||||||
Basic net income attributable to Trinity Industries, Inc. | $ | $ | $ | $ | |||||||||||
Diluted earnings per common share (3): | |||||||||||||||
Income from continuing operations | $ | $ | $ | $ | |||||||||||
Loss from discontinued operations | ( | ) | ( | ) | ( | ) | |||||||||
Diluted net income attributable to Trinity Industries, Inc. | $ | $ | $ | $ | |||||||||||
(1) Restructuring activities for the three months ended December 31, 2019 were $14.7 million primarily as a result of write-downs related to underutilized assets in our manufacturing footprint and employee transition costs. See Note 2 of the Consolidated Financial Statements.
(2) Provision for income taxes for the three months ended December 31, 2019 includes the effects of a one-time, non-cash, deferred tax impact related to our planned Maintenance Services expansion into a new Midwest facility of $9.7 million. See Note 9 of the Consolidated Financial Statements.
(3) The sum of the quarters may not necessarily be equal to the full year net income per common share amount.
102
Three Months Ended | |||||||||||||||
March 31, 2018 | June 30, 2018 | September 30, 2018 | December 31, 2018 | ||||||||||||
(in millions, except per share data) | |||||||||||||||
Revenues: | |||||||||||||||
Manufacturing | $ | $ | $ | $ | |||||||||||
Leasing | |||||||||||||||
Operating costs: | |||||||||||||||
Costs of revenues: | |||||||||||||||
Manufacturing | |||||||||||||||
Leasing | |||||||||||||||
Selling, engineering, and administrative expenses | |||||||||||||||
Gains on disposition of property | |||||||||||||||
Operating profit | |||||||||||||||
Income from continuing operations before income taxes | |||||||||||||||
Provision for income taxes | |||||||||||||||
Income from continuing operations | |||||||||||||||
Income (loss) from discontinued operations, net of income taxes | ( | ) | ( | ) | |||||||||||
Net income | |||||||||||||||
Net income attributable to noncontrolling interest | |||||||||||||||
Net income attributable to Trinity Industries, Inc. | $ | $ | $ | $ | |||||||||||
Basic earnings per common share (1): | |||||||||||||||
Income from continuing operations | $ | $ | $ | $ | |||||||||||
Income from discontinued operations | |||||||||||||||
Basic net income attributable to Trinity Industries, Inc. | $ | $ | $ | $ | |||||||||||
Diluted earnings per common share (1): | |||||||||||||||
Income from continuing operations | $ | $ | $ | $ | |||||||||||
Income from discontinued operations | |||||||||||||||
Diluted net income attributable to Trinity Industries, Inc. | $ | $ | $ | $ | |||||||||||
(1) The sum of the quarters may not necessarily be equal to the full year net income per common share amount.
103
Item 9. Changes in and Disagreements with Accountants on Accounting and Financial Disclosure.
None.
Item 9A. Controls and Procedures.
Disclosure Controls and Procedures.
We maintain disclosure controls and procedures designed to ensure that we are able to collect and record the information we are required to disclose in the reports we file with the SEC, and to process, summarize, and disclose this information within the time periods specified in the rules of the SEC. Our Chief Executive and Chief Financial Officers are responsible for establishing and maintaining these procedures and, as required by the rules of the SEC, evaluating their effectiveness. Based on their evaluation of our disclosure controls and procedures that took place as of the end of the period covered by this report, the Chief Executive and Chief Financial Officers believe that these procedures are effective to 1) ensure that we are able to collect, process, and disclose the information we are required to disclose in the reports we file with the SEC within the required time periods and 2) accumulate and communicate this information to our management, including our Chief Executive and Chief Financial Officers, to allow timely decisions regarding this disclosure.
Management's Annual Report on Internal Control over Financial Reporting.
Our management is responsible for establishing and maintaining effective internal control over financial reporting as defined in Rules 13a-15(f) under the Securities Exchange Act of 1934. Our internal control over financial reporting is designed to provide reasonable assurance regarding the reliability of financial reporting and the preparation of financial statements for external purposes in accordance with accounting principles generally accepted in the United States.
Because of its inherent limitations, internal control over financial reporting may not prevent or detect misstatements. Therefore, even those systems determined to be effective can provide only reasonable assurance, as opposed to absolute assurance, of achieving their internal control objectives.
During the three months ended December 31, 2019, there have been no changes in our internal controls over financial reporting that have materially affected or are reasonably likely to materially affect our internal controls over financial reporting.
Management assessed the effectiveness of our internal control over financial reporting as of December 31, 2019. In making this assessment, management used the criteria set forth by the Committee of Sponsoring Organizations of the Treadway Commission (the 2013 Framework) (COSO) in Internal Control — Integrated Framework. Based on our assessment, we believe that, as of December 31, 2019, our internal control over financial reporting was effective based on those criteria.
The effectiveness of internal control over financial reporting as of December 31, 2019, has been audited by Ernst & Young LLP, the independent registered public accounting firm who also audited our Consolidated Financial Statements. Ernst & Young LLP's attestation report on effectiveness of our internal control over financial reporting follows.
104
Report of Independent Registered Public Accounting Firm
The Board of Directors and Stockholders
Trinity Industries, Inc.
Opinion on Internal Control over Financial Reporting
We have audited Trinity Industries, Inc. and subsidiaries' internal control over financial reporting as of December 31, 2019, based on criteria established in Internal Control – Integrated Framework issued by the Committee of Sponsoring Organizations of the Treadway Commission (2013 framework) (the COSO criteria). In our opinion, Trinity Industries, Inc. (and subsidiaries) (the Company) maintained, in all material respects, effective internal control over financial reporting as of December 31, 2019, based on the COSO criteria.
We also have audited, in accordance with the standards of the Public Company Accounting Oversight Board (United States) (PCAOB), the consolidated balance sheets of the Company as of December 31, 2019 and 2018, the related consolidated statements of operations, comprehensive income, cash flows, and stockholders' equity for each of the three years in the period ended December 31, 2019, and the related notes and our report dated February 20, 2020 expressed an unqualified opinion thereon.
Basis for Opinion
The Company’s management is responsible for maintaining effective internal control over financial reporting and for its assessment of the effectiveness of internal control over financial reporting included in the accompanying Management’s Annual Report on Internal Control over Financial Reporting. Our responsibility is to express an opinion on the Company’s internal control over financial reporting based on our audit. We are a public accounting firm registered with the PCAOB and are required to be independent with respect to the Company in accordance with the U.S. federal securities laws and the applicable rules and regulations of the Securities and Exchange Commission and the PCAOB.
We conducted our audit in accordance with the standards of the PCAOB. Those standards require that we plan and perform the audit to obtain reasonable assurance about whether effective internal control over financial reporting was maintained in all material respects.
Our audit included obtaining an understanding of internal control over financial reporting, assessing the risk that a material weakness exists, testing and evaluating the design and operating effectiveness of internal control based on the assessed risk, and performing such other procedures as we considered necessary in the circumstances. We believe that our audit provides a reasonable basis for our opinion.
Definition and Limitations of Internal Control Over Financial Reporting
A company’s internal control over financial reporting is a process designed to provide reasonable assurance regarding the reliability of financial reporting and the preparation of financial statements for external purposes in accordance with generally accepted accounting principles. A company’s internal control over financial reporting includes those policies and procedures that (1) pertain to the maintenance of records that, in reasonable detail, accurately and fairly reflect the transactions and dispositions of the assets of the company; (2) provide reasonable assurance that transactions are recorded as necessary to permit preparation of financial statements in accordance with generally accepted accounting principles, and that receipts and expenditures of the company are being made only in accordance with authorizations of management and directors of the company; and (3) provide reasonable assurance regarding prevention or timely detection of unauthorized acquisition, use, or disposition of the company’s assets that could have a material effect on the financial statements.
Because of its inherent limitations, internal control over financial reporting may not prevent or detect misstatements. Also, projections of any evaluation of effectiveness to future periods are subject to the risk that controls may become inadequate because of changes in conditions, or that the degree of compliance with the policies or procedures may deteriorate.
/s/ ERNST & YOUNG LLP |
Dallas, Texas
February 20, 2020
105
Item 9B. Other Information.
None.
PART III
Item 10. Directors, Executive Officers, and Corporate Governance.
Information regarding the directors of the Company is incorporated by reference to the information set forth under the caption “Proposal 1 — Election of Directors” in the Company's Proxy Statement for the 2020 Annual Meeting of Stockholders (the “2020 Proxy Statement”). Information relating to the executive officers of the Company is set forth in Part I of this report under the caption “Information about our Executive Officers.” Information relating to the Board of Directors' determinations concerning whether at least one of the members of the Audit Committee is an “audit committee financial expert” as that term is defined under Item 407 (d)(5) of Regulation S-K is incorporated by reference to the information set forth under the caption “Corporate Governance — Board Committees — Audit Committee” in the Company's 2020 Proxy Statement. Information regarding the Company's Audit Committee is incorporated by reference to the information set forth under the caption “Corporate Governance — Board Committees — Audit Committee” in the Company's 2020 Proxy Statement. There were no delinquent Section 16(a) reports.
The Company has adopted a Code of Business Conduct and Ethics that applies to all of its directors, officers, and employees. The Code of Business Conduct and Ethics is on the Company's website at www.trin.net under the caption “Investor Relations/Governance.” The Company intends to post any amendments or waivers for its Code of Business Conduct and Ethics to the Company's website at www.trin.net to the extent applicable to an executive officer, principal accounting officer, controller, or director of the Company.
Item 11. Executive Compensation.
Information regarding compensation of executive officers and directors is incorporated by reference to the information set forth under the caption “Executive Compensation” in the Company's 2020 Proxy Statement. Information concerning compensation committee interlocks and insider participation is incorporated by reference to the information set forth under the caption “Corporate Governance — Compensation Committee Interlocks and Insider Participation” in the Company's 2020 Proxy Statement. Information about the compensation committee report is incorporated by reference to the information set forth under the caption “Executive Compensation — Human Resources Committee Report” in the Company's 2020 Proxy Statement.
106
Item 12. Security Ownership of Certain Beneficial Owners and Management and Related Stockholder Matters.
Information concerning security ownership of certain beneficial owners and management is incorporated herein by reference from the Company's 2020 Proxy Statement, under the caption “Security Ownership — Security Ownership of Certain Beneficial Owners and Management.”
The following table sets forth information about Trinity common stock that may be issued under all of Trinity's existing equity compensation plans as of December 31, 2019.
Equity Compensation Plan Information | |||||||||
(a) | (b) | (c) | |||||||
Number of Securities to be Issued Upon Exercise of Outstanding Options, Warrants and Rights | Weighted-Average Exercise Price of Outstanding Options, Warrants and Rights | Number of Securities Remaining Available for Future Issuance under Equity Compensation Plans (Excluding Securities Reflected in Column (a)) | |||||||
Plan Category: | |||||||||
Equity compensation plans approved by security holders: | |||||||||
Stock options | — | $ | — | ||||||
Restricted stock units | 3,294,859 | (1) | $ | — | |||||
Performance units | 800,762 | (1) | $ | — | |||||
4,095,621 | 2,737,464 | ||||||||
Equity compensation plans not approved by security holders | — | (2) | — | ||||||
Total | 4,095,621 | 2,737,464 | |||||||
____________
(1) The restricted stock units and performance units do not have an exercise price. The performance units are granted to employees based upon a target level, however, depending upon the achievement of certain specified goals during the performance period, performance units may be adjusted to a level ranging between 0% and 200% of the target level.
(2) Excludes information regarding the Trinity Deferred Plan for Director Fees. This plan permits the deferral of the payment of the annual retainer fee and board and committee meeting fees. At the election of the participant, the deferred fees may be converted into stock units with a fair market value equal to the value of the fees deferred, and such stock units are credited to the director's account (along with the amount of any dividends or stock distributions). At the time a participant ceases to be a director, cash will be distributed to the participant. At December 31, 2019, there were 145,300 stock units credited to the accounts of participants. Also excludes information regarding the Trinity Industries Supplemental Profit Sharing Plan (“Supplemental Plan”) for certain of its highly compensated employees. Information about the Supplemental Plan is incorporated herein by reference from the Company's 2020 Proxy Statement, under the caption “Executive Compensation — Compensation Discussion and Analysis — Components of Compensation — Post-employment Benefits.” At December 31, 2019, there were 70,673 stock units credited to the accounts of participants under the Supplemental Plan.
Item 13. Certain Relationships and Related Transactions, and Director Independence.
Information regarding certain relationships and related person transactions is incorporated by reference to the information set forth under the captions “Corporate Governance — Compensation Committee Interlocks and Insider Participation” and “Transactions with Related Persons” in the Company's 2020 Proxy Statement. Information regarding the independence of directors is incorporated by reference to the information set forth under the captions “Corporate Governance — Independence of Directors” in the Company's 2020 Proxy Statement.
Item 14. Principal Accountant Fees and Services.
Information regarding principal accountant fees and services is incorporated by reference to the information set forth under the captions “Fees of Independent Registered Public Accounting Firm for Fiscal Years 2019 and 2018” in the Company's 2020 Proxy Statement.
107
PART IV
Item 15. Exhibits and Financial Statement Schedules.
(a) (1) Financial Statements.
See Item 8.
(2) Financial Statement Schedule.
All schedules are omitted because they are not required, not significant, not applicable or the information is shown in the Consolidated Financial Statements or the Notes to Consolidated Financial Statements.
(3) Exhibits.
108
INDEX TO EXHIBITS Trinity Industries, Inc. Index to Exhibits (Item 15(b)) | ||
NO. | DESCRIPTION | |
(2.1) | ||
(3.1) | ||
(3.2) | ||
(4.1) | ||
(4.2) | ||
(4.2.1) | ||
(4.2.2) | ||
(4.2.3) | ||
(4.2.4) | ||
(4.2.5) | ||
(4.2.6) | ||
(4.3) | ||
(10.1) | ||
(10.2) | 1993 Stock Option and Incentive Plan (incorporated by reference to Exhibit 4.1 of Registration Statement No. 33-73026 filed December 15, 1993).* | |
(10.2.1) | ||
(10.2.2) | ||
(10.2.3) | ||
(10.2.4) | ||
(10.2.5) | ||
(10.3) | ||
109
INDEX TO EXHIBITS Trinity Industries, Inc. Index to Exhibits (Item 15(b)) | ||
NO. | DESCRIPTION | |
(10.3.1) | ||
(10.3.2) | ||
(10.4) | ||
(10.4.1) | ||
(10.5) | ||
(10.6) | ||
(10.6.1) | ||
(10.6.2) | ||
(10.6.3) | ||
(10.6.4) | ||
(10.7) | ||
(10.7.1) | ||
(10.7.1.1) | ||
(10.7.2) | ||
(10.7.2.1) | ||
(10.7.3) | ||
(10.7.4) | ||
(10.7.5) | ||
(10.7.6) | ||
(10.7.7) | ||
110
INDEX TO EXHIBITS Trinity Industries, Inc. Index to Exhibits (Item 15(b)) | ||
NO. | DESCRIPTION | |
(10.7.8) | ||
(10.7.9) | ||
(10.8) | ||
(10.8.1) | ||
(10.9) | ||
(10.10) | ||
(10.10.1) | ||
(10.11) | ||
(10.12) | ||
(10.12.1) | ||
(10.13) | ||
(10.13.1) | ||
(10.14) | ||
(10.15) | ||
(10.15.1) | ||
(10.16) | ||
(10.16.1) | ||
111
INDEX TO EXHIBITS Trinity Industries, Inc. Index to Exhibits (Item 15(b)) | ||
NO. | DESCRIPTION | |
(10.17) | ||
(10.18) | ||
(10.18.1) | ||
(10.19) | ||
(10.19.1) | ||
(10.20) | ||
(10.21) | ||
(10.22) | ||
(10.22.1) | ||
(10.23) | ||
(10.24) | ||
(10.25) | ||
(10.26) | ||
(10.27) | ||
(10.28) | ||
(10.28.1) | ||
(10.28.2) | ||
(21) | ||
(23) | Consent of Ernst & Young LLP (contained on page 114 of this document and filed herewith). | |
(31.1) | ||
(31.2) | ||
112
INDEX TO EXHIBITS Trinity Industries, Inc. Index to Exhibits (Item 15(b)) | ||
NO. | DESCRIPTION | |
(32.1) | ||
(32.2) | ||
101.INS | Inline XBRL Instance Document — the instance document does not appear in the Interactive Data File because its XBRL tags are embedded within the Inline XBRL document. | |
101.SCH | Inline XBRL Taxonomy Extension Schema Document (filed electronically herewith) | |
101.CAL | Inline XBRL Taxonomy Extension Calculation Linkbase Document (filed electronically herewith) | |
101.LAB | Inline XBRL Taxonomy Extension Label Linkbase Document (filed electronically herewith) | |
101.PRE | Inline XBRL Taxonomy Extension Presentation Linkbase Document (filed electronically herewith) | |
101.DEF | Inline XBRL Taxonomy Extension Definition Linkbase Document (filed electronically herewith) | |
104 | Cover Page Interactive Data File (formatted as Inline XBRL and contained in Exhibit 101). | |
* Management contracts and compensatory plan arrangements.
Item 16. Form 10-K Summary.
None.
113
EXHIBIT 23
CONSENT OF INDEPENDENT REGISTERED PUBLIC ACCOUNTING FIRM
We consent to the incorporation by reference in the following Registration Statements:
1) | Post-Effective Amendment No. 3 to the Registration Statement (Form S-8, No. 2-64813), |
2) | Post-Effective Amendment No. 1 to the Registration Statement (Form S-8, No. 33-10937), |
3) | Registration Statement (Form S-8, No. 33-35514), |
4) | Registration Statement (Form S-8, No. 33-73026), |
5) | Registration Statement (Form S-8, No. 333-77735), |
6) | Registration Statement (Form S-8, No. 333-91067), |
7) | Registration Statement (Form S-8, No. 333-85588), |
8) | Registration Statement (Form S-8, No. 333-85590), |
9) | Registration Statement (Form S-8, No. 333-114854), |
10) | Registration Statement (Form S-8, No. 333-115376), |
11) | Registration Statement (Form S-8, No. 333-159552), |
12) | Registration Statement (Form S-8, No. 333-169452), |
13) | Registration Statement (Form S-8, No. 333-183941), |
14) | Registration Statement (Form S-8, No. 333-203876), |
15) | Registration Statement (Form S-8, No. 333-215067), and |
16) | Registration Statement (Form S-8, No. 333-230537); |
of our reports dated February 20, 2020 with respect to the consolidated financial statements of Trinity Industries, Inc. and Subsidiaries and the effectiveness of internal control over financial reporting of Trinity Industries, Inc. and Subsidiaries included in this Annual Report (Form 10-K) of Trinity Industries, Inc. and Subsidiaries for the year ended December 31, 2019.
/s/ ERNST & YOUNG LLP |
Dallas, Texas
February 20, 2020
114
SIGNATURES
Pursuant to the requirements of Section 13 or 15(d) of the Securities Exchange Act of 1934, the registrant has duly caused this report to be signed on its behalf by the undersigned, thereunto duly authorized.
TRINITY INDUSTRIES, INC. | By | /s/ Melendy E. Lovett |
Registrant | ||
Melendy E. Lovett | ||
Senior Vice President and | ||
Chief Financial Officer | ||
February 20, 2020 | ||
Pursuant to the requirements of the Securities Exchange Act of 1934, this report has been signed below by the following persons on behalf of the registrant and in the capacities and on the dates indicated.
Directors: | Principal Executive Officer: |
/s/ Leldon E. Echols | /s/ E. Jean Savage |
Leldon E. Echols | E. Jean Savage |
Non-Executive Chairman | Chief Executive Officer, President, and Director |
Dated: February 20, 2020 | Dated: February 20, 2020 |
/s/ John L. Adams | |
John L. Adams | Principal Financial Officer: |
Director | |
Dated: February 20, 2020 | /s/ Melendy E. Lovett |
Melendy E. Lovett | |
/s/ Brandon B. Boze | Senior Vice President and Chief Financial Officer |
Brandon B. Boze | Dated: February 20, 2020 |
Director | |
Dated: February 20, 2020 | |
Principal Accounting Officer: | |
/s/ John J. Diez | |
John J. Diez | /s/ Steven L. McDowell |
Director | Steven L. McDowell |
Dated: February 20, 2020 | Vice President and Chief Accounting Officer |
Dated: February 20, 2020 | |
/s/ Charles W. Matthews | |
Charles W. Matthews | |
Director | |
Dated: February 20, 2020 | |
/s/ Dunia A. Shive | |
Dunia A. Shive | |
Director | |
Dated: February 20, 2020 | |
115