Exhibit 99.1
| NEWS RELEASE |
Transcat, Inc. 35 Vantage Point Drive • Rochester • NY • 14624 • Phone: (585) 352-7777
IMMEDIATE RELEASE
Transcat Diluted Earnings per Share up 33%
in
Fiscal Year 2016 First
Quarter
| ● | Consolidated operating income grew 35.3% on 1.9% revenue growth |
| ● | Strong Service segment operating leverage: operating income more than doubled on 11.5% revenue growth |
| ● | Expanded life science market position with acquisition of Calibration Technologies, Inc. |
ROCHESTER, NY, July 28, 2015 – Transcat, Inc. (NASDAQ: TRNS) (“Transcat” or the “Company”), a leading provider of accredited calibration and compliance services and distributor of professional grade handheld test, measurement and control instrumentation, today reported financial results for its first quarter ended June 27, 2015. Included in the reported results are those of Ulrich Metrology Inc., acquired on August 31, 2014, and Apex Metrology Solutions, acquired on March 6, 2015. The acquisition of Calibration Technologies, Inc. on June 22, 2015, had no material effect on financial results.
Lee D. Rudow, President and CEO, commented, “Our first quarter was a strong start for fiscal 2016 and clearly demonstrated the operating leverage gained through higher volume in our Service segment. As anticipated, we achieved double-digit revenue growth in our Service segment. Our Distribution segment continued to be affected by a soft market; however, we are encouraged by the effectiveness of our efforts to maintain market share. Overall, both our new business and acquisition pipelines remain strong. We are maximizing our complementary segments, recent investments, and competitive strengths in quality and service capabilities to drive earnings growth.”
First Quarter Fiscal 2016 Review (Results are compared with the first quarter of fiscal 2015)
First quarter consolidated revenue was $29.7 million, an increase of $0.6 million, or 1.9%, over the prior-year period. Service segment revenue grew $1.4 million, or 11.5%, more than offsetting a $0.8 million, or 5.0%, decline in Distribution segment sales.
Service segment gross profit increased 20.2% to $3.5 million in the first quarter. This was partially offset by a $0.2 million reduction in Distribution segment gross profit. As a result, first quarter consolidated gross profit improved 5.9% to $7.1 million. As a percentage of total revenue, gross profit was 23.8%, an improvement of 90 basis points over the prior fiscal year period.
First quarter consolidated operating income increased 35.3% to $1.0 million, driven by operating leverage achieved on Service segment revenue growth. Net income was $0.6 million, a 35.1% increase over the prior-year period. Diluted earnings per share increased 33.3% from $0.06 to $0.08.
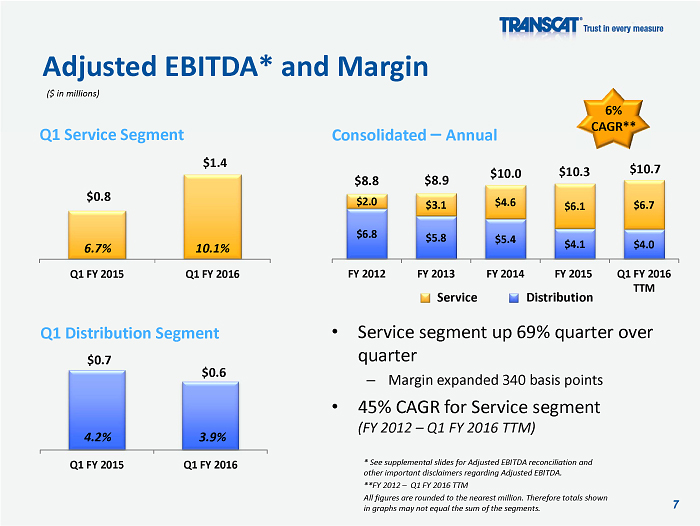
Adjusted EBITDA increased 30.8%, or $0.5 million, to $2.0 million, over the same quarter of the prior fiscal year. Adjusted EBITDA as a percent of total revenue expanded 150 basis points to 6.7%. See Note 1 on page 3 for a description of this non-GAAP financial measure and page 8 for the Adjusted EBITDA Reconciliation table.
Transcat Diluted Earnings
per Share up 33% in Fiscal Year 2016 First Quarter
July 28, 2015
Page 2 of
9
Service Segment Shows Strong Revenue Growth and Operating Margin Expansion
The Service segment represents the Company’s accredited calibration and compliance services business (46% of total revenue for the first quarter of fiscal 2016)
| ● | Service segment revenue grew 11.5% to a first quarter record of $13.5 million driven by a combination of organic and acquisition-related growth. On a trailing twelve-month basis, Service segment revenue was $53.2 million, an increase of 9.5% when compared with the corresponding trailing-twelve month period of fiscal 2015. The Company believes that trailing twelve-month data is more indicative of the long-term progress of the Service segment. |
| ● |
Service segment gross profit improved $0.6 million, or 20.2%, to $3.5 million. Gross margin for the segment improved 190 basis points to 26.1%. |
| ● | Operating income more than doubled to $0.6 million, up $0.4 million, and segment operating margin expanded 260 basis points to 4.8%. The Service segment produced 27.1% operating leverage in the quarter. Operating leverage is defined as the year-over-year change in Service segment operating income divided by the year-over-year change in Service segment revenue. |
| ● | Service segment contribution margin grew 49.3% to $1.9 million, from $1.3 million in the prior fiscal year period. Service segment Adjusted EBITDA increased 69.0%, or $0.6 million, to $1.4 million. As a percentage of Service segment revenue, Adjusted EBITDA was 10.1%, a 340 basis point expansion. See Note 1 on page 3 for descriptions of these non-GAAP financial measures and pages 8 and 9 for the Adjusted EBITDA Reconciliation table and the contribution margin calculation in the Additional Information – Business Segment Data table. |
Distribution Segment Revenue Declines; Gross Margin Holds Consistent
The Distribution segment represents the Company’s distribution of professional grade handheld test, measurement and control instrumentation business (54% of total revenue for the first quarter of fiscal 2016)
| ● | Distribution sales decreased $0.8 million, or 5.0%, to $16.1 million in the first quarter. |
| ● |
Distribution segment gross profit was $3.5 million, down $0.2 million, or 5.4%, from the first quarter of fiscal 2015. Year-over-year increases in vendor rebates helped to offset the impact of reduced volume and price discounts. Gross margin was 21.9%, consistent with the prior-year period. Vendor rebates accounted for 130 basis points of segment gross margin in the quarter. |
| ● | Reduced Distribution segment operating costs partially offset the year-over-year decline in segment gross profit, resulting in segment operating income of $0.4 million, a decrease of $0.1 million from the first quarter of fiscal 2015. |
| ● | Contribution margin for the Distribution segment was $1.7 million, consistent with the prior-year period. Distribution segment Adjusted EBITDA was $0.6 million, down $0.1 million. See Note 1 on page 3 for descriptions of these non-GAAP financial measures and pages 8 and 9 for the Adjusted EBITDA Reconciliation table and contribution margin calculation in the Additional Information – Business Segment Data table. |
Strong Balance Sheet Supports Growth Strategy
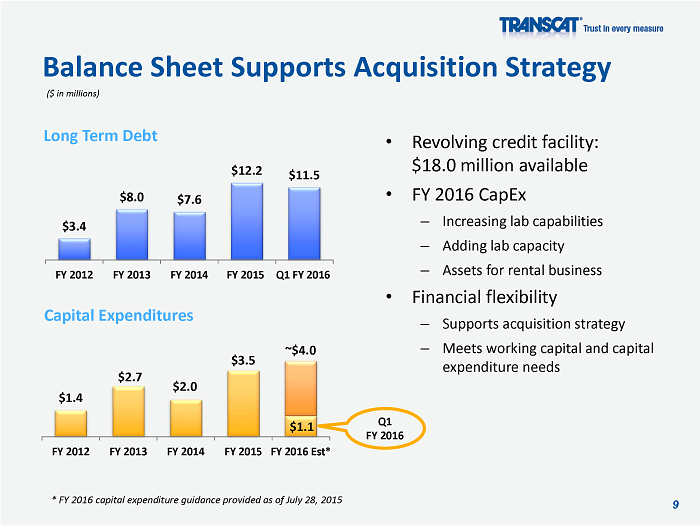
As of June 27, 2015, the Company had $18.0 million in availability under its secured revolving credit facility.
Transcat Diluted Earnings
per Share up 33% in Fiscal Year 2016 First Quarter
July 28, 2015
Page 3 of
9
Capital expenditures in the first quarter of fiscal 2016 were $1.1 million, up from $0.7 million in the first quarter of fiscal 2015, and were primarily for expanded Service segment capabilities and assets for the Company’s growing rental business. The Company expects total capital expenditures to be approximately $4.0 million in fiscal 2016.
Outlook
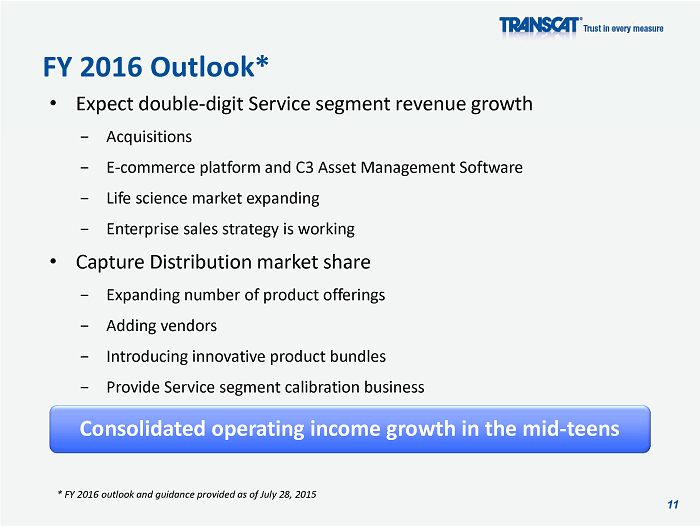
Mr. Rudow concluded, “We have made great strides in taking market share in our calibration services business, both organically and through acquisitions. As a result, we believe fiscal 2016 will be a strong year and expect consolidated operating income growth in the mid-teens. This annualized rate of growth reflects a normalized expectation to accommodate for higher performance-based variable compensation expenses, particularly in the fourth quarter.”
Webcast and Conference Call
Transcat will host a conference call and webcast on Wednesday, July 29, 2015 at 11:00 a.m. ET. Management will review the financial and operating results for the quarter, as well as the Company’s strategy and outlook. A question and answer session will follow the formal discussion. The review will be accompanied by a slide presentation which will be available at www.transcat.com/investor-relations.
The conference call can be accessed by calling (201) 689-8471. Alternatively, the webcast can be monitored at www.transcat.com/investor-relations.
A telephonic replay will be available from 2:00 p.m. ET the day of the call through Wednesday, August 5, 2015. To listen to the archived call, dial (858) 384-5517 and enter conference ID number 13614133, or access the webcast replay at www.transcat.com/investor-relations. A transcript will also be posted to the website, once available.
NOTE 1 – Non-GAAP Financial Measures
In addition to reporting net income, a U.S. generally accepted accounting principle (“GAAP”) measure, we present Adjusted EBITDA (earnings before interest, income taxes, depreciation and amortization, other income and expenses, and non-cash stock compensation expense), which is a non-GAAP measure. The Company believes Adjusted EBITDA allows investors to view its performance in a manner similar to the methods used by management and provides additional insight into its operating results. Adjusted EBITDA is not calculated through the application of GAAP and is not the required form of disclosure by the Securities and Exchange Commission. As such, it should not be considered as a substitute for the GAAP measure of net income and, therefore, should not be used in isolation of, but in conjunction with, the GAAP measure. The use of any non-GAAP measure may produce results that vary from the GAAP measure and may not be comparable to a similarly defined non-GAAP measure used by other companies. See the attached Adjusted EBITDA Reconciliation table on page 8.
Contribution margin, a non-GAAP financial measure, consists of gross profit less selling, marketing and warehouse expenses. We believe contribution margin provides management and users of the financial statements information about our ability to cover our operating costs, such as technology and general and administrative expenses. Contribution margin is used in addition to and in conjunction with results presented in accordance with GAAP and should not be relied upon to the exclusion of GAAP financial measures. The material limitation associated with the use of contribution margin is that it is an incomplete measure of profitability as it does not include all operating expenses or non-operating income and expenses. Management compensates for these limitations when using this measure by looking at other GAAP measures, such as operating income (loss) and net income (loss). For further details on contribution margin, see the calculation of this non-GAAP financial measure and the reconciliation of contribution margin to gross profit in the Additional Information – Business Segment Data tables on page 9.
Transcat Diluted Earnings
per Share up 33% in Fiscal Year 2016 First Quarter
July 28, 2015
Page 4 of
9
ABOUT TRANSCAT
Transcat, Inc. is a leading provider of accredited calibration and compliance services, including analytical instrument qualifications, equipment and process validation. The Company is focused on providing best-in-class calibration analytics to highly regulated industries, particularly life science, including pharmaceuticals, medical device manufacturing and biotechnology. Transcat performs over 250,000 specialized technical services annually through a variety of delivery options, including permanent and periodic on-site services, mobile calibration services and in-house services (often accompanied by pick-up and delivery). The in-house services are offered through 19 Calibration Service Centers strategically located across the United States, Puerto Rico and Canada. The breadth and depth of measurement parameters addressed by Transcat’s ISO/IEC 17025 scopes of accreditation are believed to be the best in the industry. Transcat also answers the call with cGMP and GLP compliant services.
In addition, Transcat operates as a leading distributor of professional grade handheld test, measurement and control instrumentation, marketing more than 100,000 premier and proprietary brand instruments to approximately 22,000 customers.
Transcat’s growth strategy is to leverage its service capabilities, strong brand and leading distribution platform to drive organic sales growth and to expand its addressable calibration market through acquisitions and capability investments to further realize the inherent leverage of its business model.
More information about Transcat can be found on its website at: Transcat.com.
Safe Harbor
Statement
This press
release contains forward-looking statements within the meaning of the Private
Securities Litigation Reform Act of 1995. Forward-looking statements are not
statements of historical fact and thus are subject to risks, uncertainties and
assumptions that often are identified by words such as “expects,” “estimates,”
“projects,” “anticipates,” “believes,” “could,” and other similar words. All
statements addressing operating performance, events, or developments that
Transcat, Inc. expects or anticipates will occur in the future, including but
not limited to statements relating to anticipated revenue, profit margins, sales
operations, capital expenditures, growth strategy, potential acquisitions,
customer preferences and changes in market conditions in the industries in which
Transcat operates are forward-looking statements. Forward-looking statements
should be evaluated in light of important risk factors and uncertainties. These
risk factors and uncertainties are more fully described in Transcat’s Annual and
Quarterly Reports filed with the Securities and Exchange Commission, including
under the heading entitled “Risk Factors.” Should one or more of these risks or
uncertainties materialize, or should any of the Company’s underlying assumptions
prove incorrect, actual results may vary materially from those currently
anticipated. In addition, undue reliance should not be placed on the Company’s
forward-looking statements. Except as required by law, the Company disclaims any
obligation to update or publicly announce any revisions to any of the
forward-looking statements contained in this press release.
For more information contact:
John J. Zimmer, Chief
Financial Officer
Phone: (585) 352-7777
Email: jzimmer@transcat.com
-OR-
Deborah K. Pawlowski, Investor
Relations
Phone: (716) 843-3908
Email: dpawlowski@keiadvisors.com
FINANCIAL TABLES FOLLOW.
Transcat Diluted Earnings
per Share up 33% in Fiscal Year 2016 First Quarter
July 28, 2015
Page 5 of
9
TRANSCAT, INC.
CONSOLIDATED STATEMENTS OF
INCOME
(In Thousands, Except
Per Share Amounts)
| (Unaudited) | |||||
| First Quarter Ended | |||||
| June 27, | June 28, | ||||
| 2015 | 2014 | ||||
| Service Revenue | $ | 13,535 | $ | 12,138 | |
| Distribution Sales | 16,135 | 16,981 | |||
| Total Revenue | 29,670 | 29,119 | |||
| Cost of Service Revenue | 10,004 | 9,201 | |||
| Cost of Distribution Sales | 12,604 | 13,249 | |||
| Total Cost of Revenue | 22,608 | 22,450 | |||
| Gross Profit | 7,062 | 6,669 | |||
| Selling, Marketing and Warehouse | |||||
| Expenses | 3,540 | 3,735 | |||
| Administrative Expenses | 2,495 | 2,175 | |||
| Total Operating Expenses | 6,035 | 5,910 | |||
| Operating Income | 1,027 | 759 | |||
| Interest and Other Expense, net | 95 | 45 | |||
| Income Before Income Taxes | 932 | 714 | |||
| Provision for Income Taxes | 331 | 269 | |||
| Net Income | $ | 601 | $ | 445 | |
| Basic Earnings Per Share | $ | 0.09 | $ | 0.07 | |
| Average Shares Outstanding | 6,851 | 6,746 | |||
| Diluted Earnings Per Share | $ | 0.08 | $ | 0.06 | |
| Average Shares Outstanding | 7,132 | 7,025 | |||
Transcat Diluted Earnings
per Share up 33% in Fiscal Year 2016 First Quarter
July 28, 2015
Page 6 of
9
TRANSCAT, INC.
CONSOLIDATED BALANCE
SHEETS
(In Thousands, Except
Share and Per Share Amounts)
| (Unaudited) | |||||||
| June 27, | March 28, | ||||||
| 2015 | 2015 | ||||||
| ASSETS | |||||||
| Current Assets: | |||||||
| Cash | $ | 50 | $ | 65 | |||
| Accounts Receivable, less allowance for doubtful accounts of | |||||||
| $113 and $111 as of June 27, 2015 and March 28, 2015, | |||||||
| respectively | 14,514 | 16,899 | |||||
| Other Receivables | 776 | 1,171 | |||||
| Inventory, net | 6,583 | 6,750 | |||||
| Prepaid Expenses and Other Current Assets | 1,180 | 1,209 | |||||
| Deferred Tax Assets | 976 | 1,048 | |||||
| Total Current Assets | 24,079 | 27,142 | |||||
| Property and Equipment, net | 9,953 | 9,397 | |||||
| Goodwill | 21,660 | 20,923 | |||||
| Intangible Assets, net | 3,841 | 3,554 | |||||
| Other Assets | 1,151 | 1,133 | |||||
| Total Assets | $ | 60,684 | $ | 62,149 | |||
| LIABILITIES AND SHAREHOLDERS' EQUITY | |||||||
| Current Liabilities: | |||||||
| Accounts Payable | $ | 6,533 | $ | 7,695 | |||
| Accrued Compensation and Other Liabilities | 3,435 | 4,195 | |||||
| Income Taxes Payable | 410 | 43 | |||||
| Total Current Liabilities | 10,378 | 11,933 | |||||
| Long-Term Debt | 11,471 | 12,168 | |||||
| Deferred Tax Liabilities | 1,501 | 1,684 | |||||
| Other Liabilities | 2,103 | 2,046 | |||||
| Total Liabilities | 25,453 | 27,831 | |||||
| Shareholders' Equity: | |||||||
| Common Stock, par value $0.50 per share, 30,000,000 shares | |||||||
| authorized; 6,870,869 and 6,835,828 shares issued and | |||||||
| outstanding as of June 27, 2015 and March 28, 2015, | |||||||
| respectively | 3,435 | 3,418 | |||||
| Capital in Excess of Par Value | 12,540 | 12,289 | |||||
| Accumulated Other Comprehensive Loss | (42 | ) | (143 | ) | |||
| Retained Earnings | 19,298 | 18,754 | |||||
| Total Shareholders' Equity | 35,231 | 34,318 | |||||
| Total Liabilities and Shareholders' Equity | $ | 60,684 | $ | 62,149 | |||
Transcat Diluted Earnings
per Share up 33% in Fiscal Year 2016 First Quarter
July 28, 2015
Page 7 of
9
TRANSCAT, INC.
CONSOLIDATED STATEMENTS OF
CASH FLOWS
(In Thousands)
| (Unaudited) | |||||||
| First Quarter Ended | |||||||
| June 27, | June 28, | ||||||
| 2015 | 2014 | ||||||
| Cash Flows from Operating Activities: | |||||||
| Net Income | $ | 601 | $ | 445 | |||
| Adjustments to Reconcile Net Income to Net Cash | |||||||
| Provided by Operating Activities: | |||||||
| Loss on Disposal of Property and Equipment | 25 | 1 | |||||
| Deferred Income Taxes | (139 | ) | 447 | ||||
| Depreciation and Amortization | 840 | 624 | |||||
| Provision for Accounts Receivable and Inventory | |||||||
| Reserves | 52 | 34 | |||||
| Stock-Based Compensation Expense | 171 | 155 | |||||
| Changes in Assets and Liabilities: | |||||||
| Accounts Receivable and Other Receivables | 2,896 | 1,457 | |||||
| Inventory | 161 | (2,042 | ) | ||||
| Prepaid Expenses and Other Assets | (26 | ) | (182 | ) | |||
| Accounts Payable | (1,162 | ) | 182 | ||||
| Accrued Compensation and Other Liabilities | (1,172 | ) | (2,500 | ) | |||
| Income Taxes Payable | 389 | (1,035 | ) | ||||
| Net Cash Provided by Operating Activities | 2,636 | (2,414 | ) | ||||
| Cash Flows from Investing Activities: | |||||||
| Purchases of Property and Equipment | (1,091 | ) | (711 | ) | |||
| Proceeds from Sale of Property and Equipment | 2 | 8 | |||||
| Business Acquisition | (700 | ) | - | ||||
| Net Cash Used in Investing Activities | (1,789 | ) | (703 | ) | |||
| Cash Flows from Financing Activities: | |||||||
| (Repayments of) Proceeds from Revolving Credit | |||||||
| Facility, net | (697 | ) | 3,228 | ||||
| Issuance of Common Stock | 127 | 228 | |||||
| Repurchase of Common Stock | (65 | ) | (69 | ) | |||
| Excess Tax Effect Related to Stock-Based | |||||||
| Compensation | (22 | ) | - | ||||
| Net Cash (Used in) Provided by Financing | |||||||
| Activities | (657 | ) | 3,387 | ||||
| Effect of Exchange Rate Changes on Cash | (205 | ) | (125 | ) | |||
| Net (Decrease) Increase in Cash | (15 | ) | 145 | ||||
| Cash at Beginning of Period | 65 | 23 | |||||
| Cash at End of Period | $ | 50 | $ | 168 | |||
Transcat Diluted Earnings per Share up
33% in Fiscal Year 2016 First Quarter
July 28, 2015
Page 8 of
9
TRANSCAT, INC.
Adjusted EBITDA
Reconciliation Table
(Dollars in
thousands)
(Unaudited)
| FY2016 | ||||||||||||||||||||
| Q1 | Q2 | Q3 | Q4 | YTD | ||||||||||||||||
| Net Income | $ | 601 | $ | 601 | ||||||||||||||||
| + Interest Expense | 51 | 51 | ||||||||||||||||||
| + Other Expense / (Income) | 44 | 44 | ||||||||||||||||||
| + Tax Provision | 331 | 331 | ||||||||||||||||||
| Operating Income | $ | 1,027 | $ | - | $ | - | $ | - | $ | 1,027 | ||||||||||
| + Depreciation & Amortization | 840 | 840 | ||||||||||||||||||
| + Other (Expense) / Income | (44 | ) | (44 | ) | ||||||||||||||||
| + Noncash Stock Compensation | 171 | 171 | ||||||||||||||||||
| Adjusted EBITDA | $ | 1,994 | $ | - | $ | - | $ | - | $ | 1,994 | ||||||||||
| Segment Breakdown | ||||||||||||||||||||
| Service Operating Income | $ | 646 | $ | 646 | ||||||||||||||||
| + Depreciation & Amortization | 680 | 680 | ||||||||||||||||||
| + Other (Expense) / Income | (39 | ) | (39 | ) | ||||||||||||||||
| + Noncash Stock Compensation | 85 | 85 | ||||||||||||||||||
| Service Adjusted EBITDA | $ | 1,372 | $ | - | $ | - | $ | - | $ | 1,372 | ||||||||||
| Distribution Operating Income | $ | 381 | $ | 381 | ||||||||||||||||
| + Depreciation & Amortization | 160 | 160 | ||||||||||||||||||
| + Other (Expense) / Income | (5 | ) | (5 | ) | ||||||||||||||||
| + Noncash Stock Compensation | 86 | 86 | ||||||||||||||||||
| Distribution Adjusted EBITDA | $ | 622 | $ | - | $ | - | $ | - | $ | 622 | ||||||||||
| FY2015 | ||||||||||||||||||||
| Q1 | Q2 | Q3 | Q4 | YTD | ||||||||||||||||
| Net Income | $ | 445 | $ | 859 | $ | 813 | $ | 1,909 | $ | 4,026 | ||||||||||
| + Interest Expense | 31 | 47 | 77 | 79 | 234 | |||||||||||||||
| + Other Expense / (Income) | 14 | 91 | 6 | 0 | 111 | |||||||||||||||
| + Tax Provision | 269 | 519 | 481 | 1,128 | 2,397 | |||||||||||||||
| Operating Income | $ | 759 | $ | 1,516 | $ | 1,377 | $ | 3,116 | $ | 6,768 | ||||||||||
| + Depreciation & Amortization | 624 | 747 | 897 | 822 | 3,090 | |||||||||||||||
| + Other (Expense) / Income | (14 | ) | (91 | ) | (6 | ) | 0 | (111 | ) | |||||||||||
| + Noncash Stock Compensation | 155 | 234 | 85 | 33 | 507 | |||||||||||||||
| Adjusted EBITDA | $ | 1,524 | $ | 2,406 | $ | 2,353 | $ | 3,971 | $ | 10,254 | ||||||||||
| Segment Breakdown | ||||||||||||||||||||
| Service Operating Income | $ | 267 | $ | 665 | $ | 562 | $ | 2,199 | $ | 3,693 | ||||||||||
| + Depreciation & Amortization | 488 | 577 | 676 | 621 | 2,362 | |||||||||||||||
| + Other (Expense) / Income | (15 | ) | (85 | ) | (33 | ) | (5 | ) | (138 | ) | ||||||||||
| + Noncash Stock Compensation | 72 | 103 | 39 | 10 | 224 | |||||||||||||||
| Service Adjusted EBITDA | $ | 812 | $ | 1,260 | $ | 1,244 | $ | 2,825 | $ | 6,141 | ||||||||||
| Distribution Operating Income | $ | 492 | $ | 851 | $ | 815 | $ | 917 | $ | 3,075 | ||||||||||
| + Depreciation & Amortization | 136 | 170 | 221 | 201 | 728 | |||||||||||||||
| + Other (Expense) / Income | 1 | (6 | ) | 27 | 5 | 27 | ||||||||||||||
| + Noncash Stock Compensation | 83 | 131 | 46 | 23 | 283 | |||||||||||||||
| Distribution Adjusted EBITDA | $ | 712 | $ | 1,146 | $ | 1,109 | $ | 1,146 | $ | 4,113 | ||||||||||
Transcat Diluted Earnings per Share up
33% in Fiscal Year 2016 First Quarter
July 28, 2015
Page 9 of
9
TRANSCAT, INC.
Additional Information - Business
Segment Data
(Dollars in thousands)
(Unaudited)
| Change | |||||||||||||||
| SERVICE | FY 2016 Q1 | FY 2015 Q1 | $'s | % | |||||||||||
| Service Revenue | $ | 13,535 | $ | 12,138 | $ | 1,397 | 11.5 | % | |||||||
| Cost of Revenue | $ | 10,004 | $ | 9,201 | $ | 803 | 8.7 | % | |||||||
| Gross Profit | $ | 3,531 | $ | 2,937 | $ | 594 | 20.2 | % | |||||||
| Gross Margin | 26.1 | % | 24.2 | % | |||||||||||
| Selling, Marketing & Warehouse | |||||||||||||||
| Expenses | $ | 1,663 | $ | 1,686 | $ | (23 | ) | (1.4 | %) | ||||||
| Contribution Margin | $ | 1,868 | $ | 1,251 | $ | 617 | 49.3 | % | |||||||
| % of Revenue | 13.8 | % | 10.3 | % | |||||||||||
| Administrative Expenses | $ | 1,222 | $ | 984 | $ | 238 | 24.2 | % | |||||||
| Operating Income | $ | 646 | $ | 267 | $ | 379 | 141.9 | % | |||||||
| % of Revenue | 4.8 | % | 2.2 | % | |||||||||||
| Change | |||||||||||||||
| DISTRIBUTION | FY 2016 Q1 | FY 2015 Q1 | $'s | % | |||||||||||
| Distribution Sales | $ | 16,135 | $ | 16,981 | $ | (846 | ) | (5.0 | %) | ||||||
| Cost of Sales | $ | 12,604 | $ | 13,249 | $ | (645 | ) | (4.9 | %) | ||||||
| Gross Profit | $ | 3,531 | $ | 3,732 | $ | (201 | ) | (5.4 | %) | ||||||
| Gross Margin | 21.9 | % | 22.0 | % | |||||||||||
| Selling, Marketing & Warehouse | |||||||||||||||
| Expenses | $ | 1,877 | $ | 2,049 | $ | (172 | ) | (8.4 | %) | ||||||
| Contribution Margin | $ | 1,654 | $ | 1,683 | $ | (29 | ) | (1.7 | %) | ||||||
| % of Sales | 10.3 | % | 9.9 | % | |||||||||||
| Administrative Expenses | $ | 1,273 | $ | 1,191 | $ | 82 | 6.9 | % | |||||||
| Operating Income | $ | 381 | $ | 492 | $ | (111 | ) | (22.6 | %) | ||||||
| % of Sales | 2.4 | % | 2.9 | % | |||||||||||
| Change | |||||||||||||||
| TOTAL | FY 2016 Q1 | FY 2015 Q1 | $'s | % | |||||||||||
| Total Revenue | $ | 29,670 | $ | 29,119 | $ | 551 | 1.9 | % | |||||||
| Total Cost of Revenue | $ | 22,608 | $ | 22,450 | $ | 158 | 0.7 | % | |||||||
| Gross Profit | $ | 7,062 | $ | 6,669 | $ | 393 | 5.9 | % | |||||||
| Gross Margin | 23.8 | % | 22.9 | % | |||||||||||
| Selling, Marketing & Warehouse | |||||||||||||||
| Expenses | $ | 3,540 | $ | 3,735 | $ | (195 | ) | (5.2 | %) | ||||||
| Contribution Margin | $ | 3,522 | $ | 2,934 | $ | 588 | 20.0 | % | |||||||
| % of Revenue | 11.9 | % | 10.1 | % | |||||||||||
| Administrative Expenses | $ | 2,495 | $ | 2,175 | $ | 320 | 14.7 | % | |||||||
| Operating Income | $ | 1,027 | $ | 759 | $ | 268 | 35.3 | % | |||||||
| % of Revenue | 3.5 | % | 2.6 | % | |||||||||||