4Q 2015 Earnings Investor Presentation February 3, 2016
2 4Q 2015 EARNINGS CONFERENCE CALL DETAIL Conference Call: Wednesday, Feb. 3, 2016 9:00 a.m. Eastern Time Live Dial-In: 888-240-1251 or 913-981-5544 (Call in 10 minutes prior to be included) Conference ID: Timken Earnings Call Conference Call Replay: Replay Dial-In available through Feb. 17, 2016 888-203-1112 or 719-457-0820 Replay Passcode: 8118267 Live Webcast: www.timken.com/investors
3 FORWARD-LOOKING STATEMENTS SAFE HARBOR AND NON-GAAP FINANCIAL INFORMATION Certain statements in this presentation (including statements regarding the company's forecasts, beliefs, estimates and expectations) that are not historical in nature are "forward-looking" statements within the meaning of the Private Securities Litigation Reform Act of 1995. In particular, the statements related to Timken’s plans, outlook, future financial performance, targets, projected sales, cash flows, liquidity and expectations regarding the future financial performance of the company, including the information under the headings, “Improving Cost Structure – SG&A”, “ Accelerating Organic Growth”, “2016 Market Outlook and Drivers”, “2016 Outlook Highlights”, “4Q 2015 Net Income and Diluted EPS”, “2016 Full-Year Outlook”, “Capital Allocation”, “Pension Strategy & De-Risking Update”, “2016 Adjusted Outlook – Walk from 2015” and “What to Expect in 2016” are forward-looking. The company cautions that actual results may differ materially from those projected or implied in forward-looking statements due to a variety of important factors, including: the finalization of the company's financial statements for the fourth quarter and full-year of 2015; the company's ability to respond to the changes in its end markets that could affect demand for the company's products; unanticipated changes in business relationships with customers or their purchases from the company; changes in the financial health of the company's customers, which may have an impact on the company's revenues, earnings and impairment charges; fluctuations in raw material and energy costs; the impact of the company's last-in, first-out accounting; weakness in global or regional economic conditions and capital markets; fluctuations in currency valuations; changes in the expected costs associated with product warranty claims; the ability to achieve satisfactory operating results in the integration of acquired companies; the impact on operations of general economic conditions; fluctuations in customer demand; the impact on the company’s pension obligations due to changes in interest rates, investment performance and other tactics designed to reduce risk; the company’s ability to complete and achieve the benefits of announced plans, programs, initiatives, and capital investments; the company’s ability to avoid any indemnification liabilities under certain agreements it entered into with TimkenSteel Corporation in connection with the spinoff and the ability of TimkenSteel Corporation to satisfy any indemnification liabilities it entered into in connection with the spinoff; and the taxable nature of the spinoff. Additional factors are discussed in the company's filings with the Securities and Exchange Commission, including the company's Annual Report on Form 10-K for the year ended Dec. 31, 2014, quarterly reports on Form 10-Q and current reports on Form 8-K. Except as required by the federal securities laws, the company undertakes no obligation to publicly update or revise any forward-looking statement, whether as a result of new information, future events or otherwise. This presentation includes certain non-GAAP financial measures as defined by the rules and regulations of the Securities and Exchange Commission. Reconciliation of those measures to the most directly comparable GAAP equivalents are provided in the Appendix to this presentation.
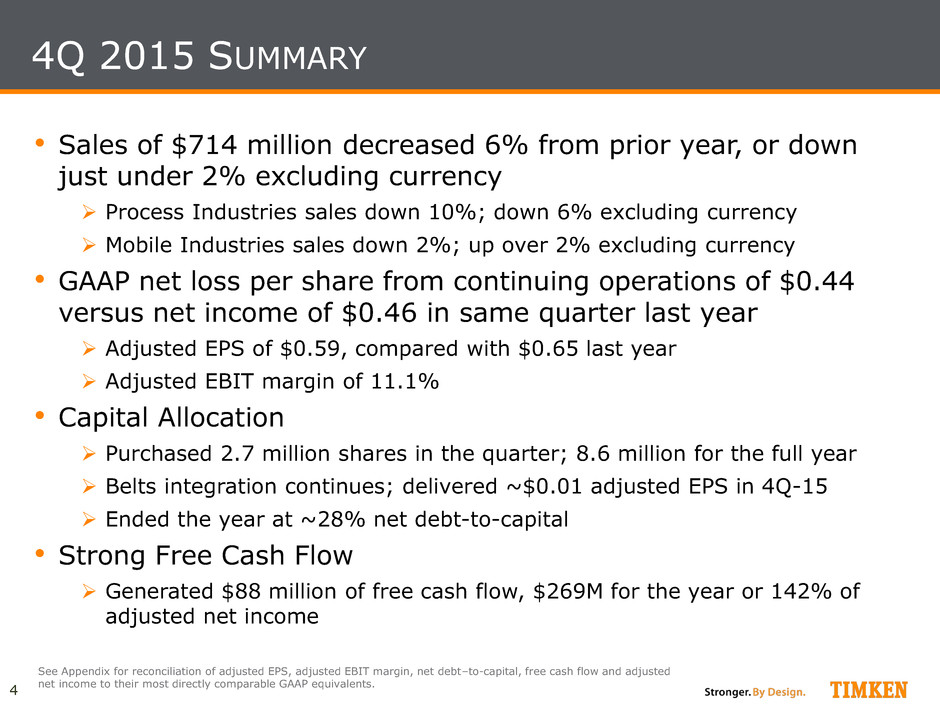
4 4Q 2015 SUMMARY • Sales of $714 million decreased 6% from prior year, or down just under 2% excluding currency Process Industries sales down 10%; down 6% excluding currency Mobile Industries sales down 2%; up over 2% excluding currency • GAAP net loss per share from continuing operations of $0.44 versus net income of $0.46 in same quarter last year Adjusted EPS of $0.59, compared with $0.65 last year Adjusted EBIT margin of 11.1% • Capital Allocation Purchased 2.7 million shares in the quarter; 8.6 million for the full year Belts integration continues; delivered ~$0.01 adjusted EPS in 4Q-15 Ended the year at ~28% net debt-to-capital • Strong Free Cash Flow Generated $88 million of free cash flow, $269M for the year or 142% of adjusted net income See Appendix for reconciliation of adjusted EPS, adjusted EBIT margin, net debt–to-capital, free cash flow and adjusted net income to their most directly comparable GAAP equivalents.
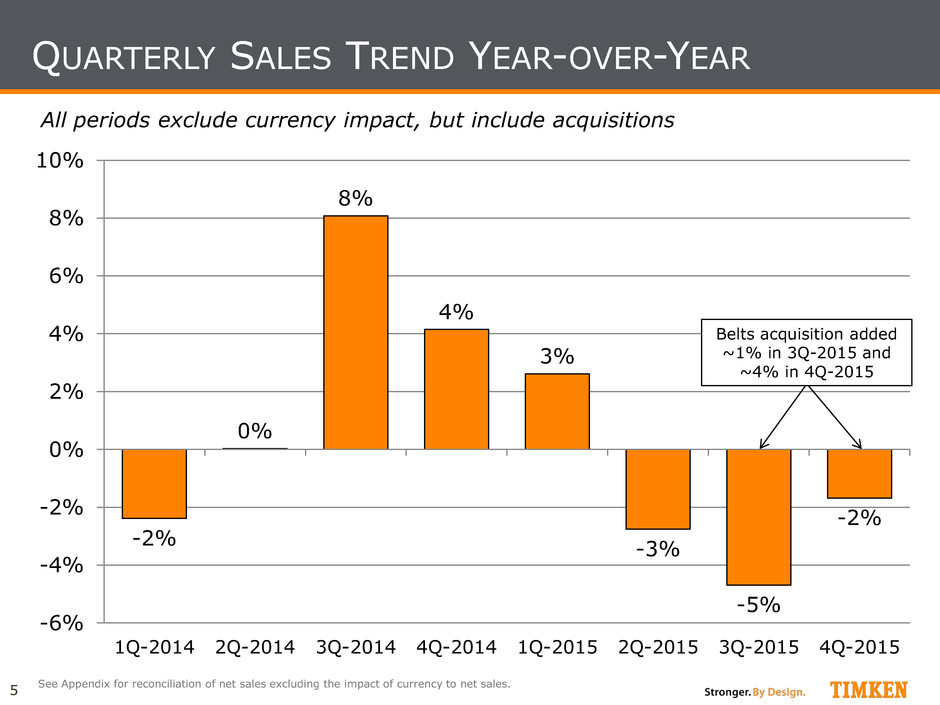
5 QUARTERLY SALES TREND YEAR-OVER-YEAR -2% 0% 8% 4% 3% -3% -5% -2% -6% -4% -2% 0% 2% 4% 6% 8% 10% 1Q-2014 2Q-2014 3Q-2014 4Q-2014 1Q-2015 2Q-2015 3Q-2015 4Q-2015 All periods exclude currency impact, but include acquisitions See Appendix for reconciliation of net sales excluding the impact of currency to net sales. Belts acquisition added ~1% in 3Q-2015 and ~4% in 4Q-2015
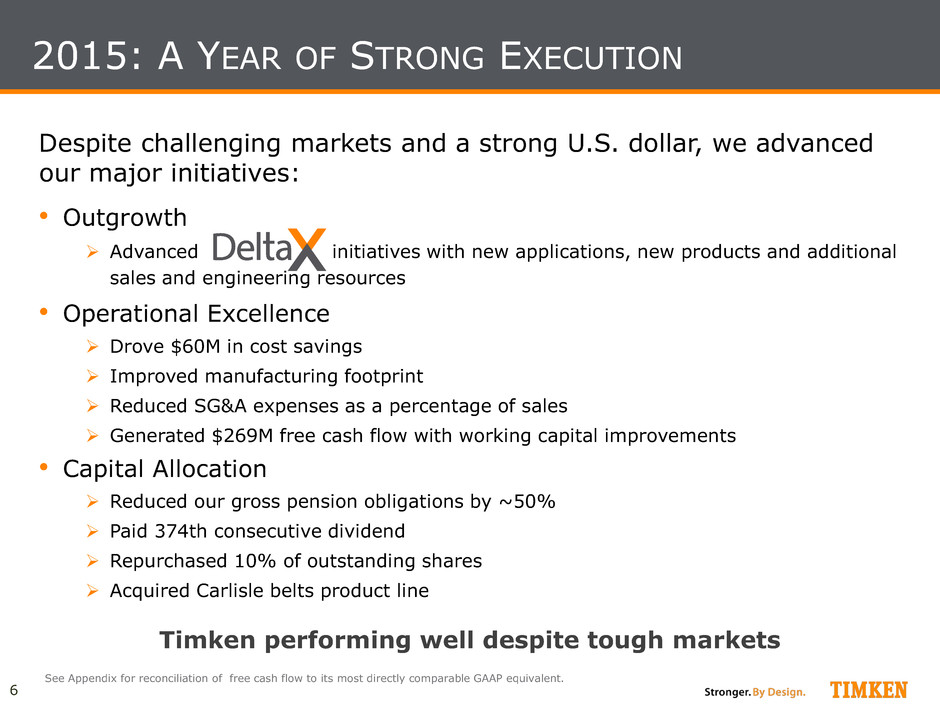
6 Timken performing well despite tough markets Despite challenging markets and a strong U.S. dollar, we advanced our major initiatives: • Outgrowth Advanced initiatives with new applications, new products and additional sales and engineering resources • Operational Excellence Drove $60M in cost savings Improved manufacturing footprint Reduced SG&A expenses as a percentage of sales Generated $269M free cash flow with working capital improvements • Capital Allocation Reduced our gross pension obligations by ~50% Paid 374th consecutive dividend Repurchased 10% of outstanding shares Acquired Carlisle belts product line 2015: A YEAR OF STRONG EXECUTION See Appendix for reconciliation of free cash flow to its most directly comparable GAAP equivalent.
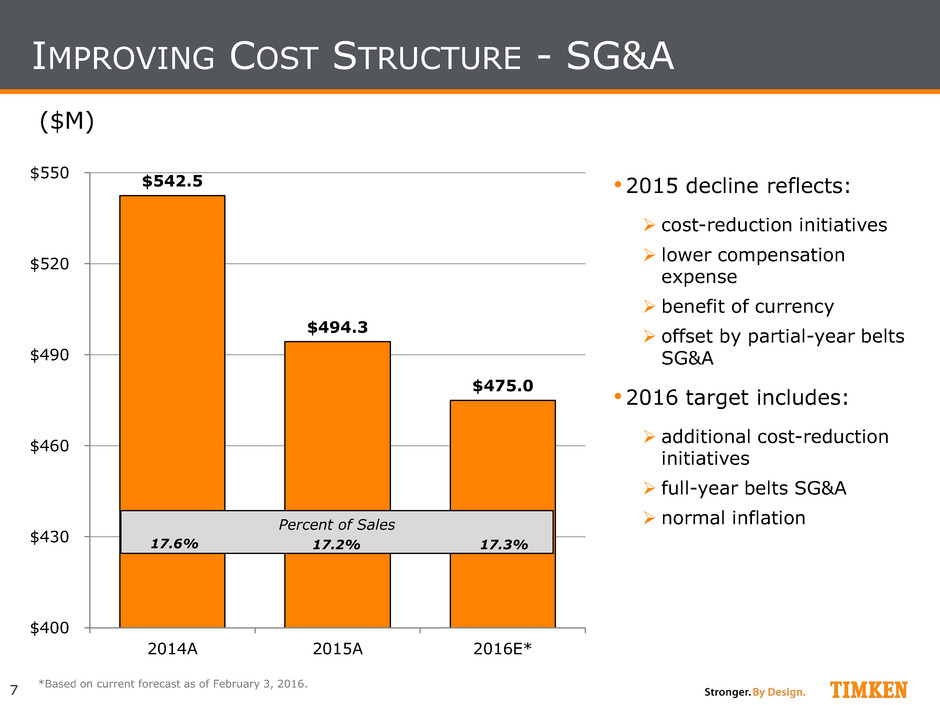
7 IMPROVING COST STRUCTURE - SG&A $542.5 $494.3 $475.0 $400 $430 $460 $490 $520 $550 2014A 2015A 2016E* ($M) Percent of Sales 17.6% 17.2% 17.3% *Based on current forecast as of February 3, 2016. •2015 decline reflects: cost-reduction initiatives lower compensation expense benefit of currency offset by partial-year belts SG&A •2016 target includes: additional cost-reduction initiatives full-year belts SG&A normal inflation

8 ACCELERATING ORGANIC GROWTH Our multi-year global initiative to accelerate organic growth in bearings and win in the marketplace: • Increase and accelerate product and application development • Enhance and expand our best-in-class collaborative technical sales model • Increase global penetration
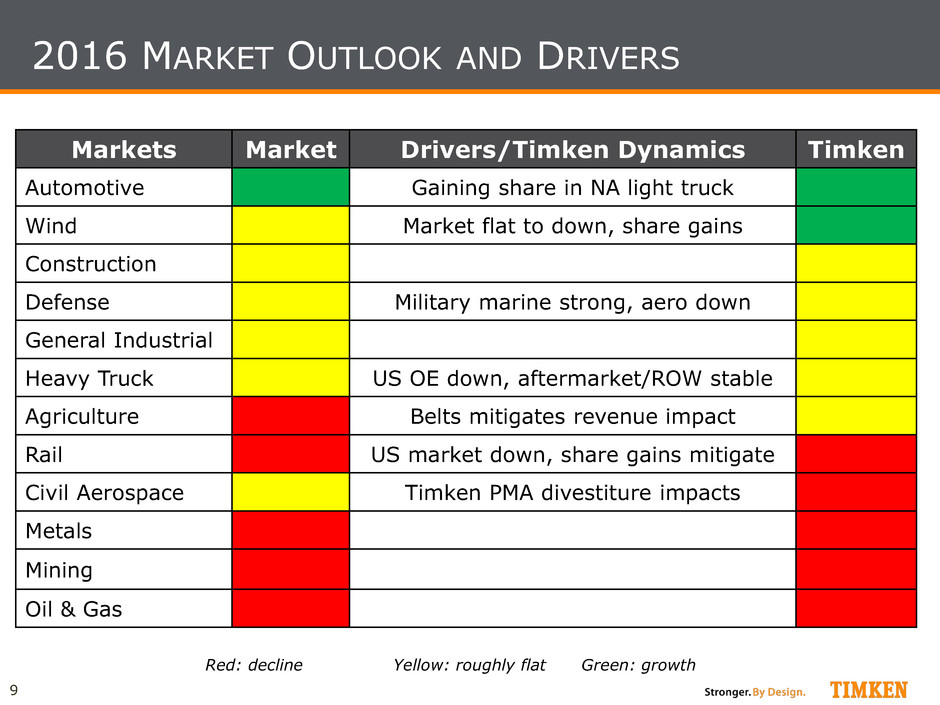
9 2016 MARKET OUTLOOK AND DRIVERS Markets Market Drivers/Timken Dynamics Timken Automotive Gaining share in NA light truck Wind Market flat to down, share gains Construction Defense Military marine strong, aero down General Industrial Heavy Truck US OE down, aftermarket/ROW stable Agriculture Belts mitigates revenue impact Rail US market down, share gains mitigate Civil Aerospace Timken PMA divestiture impacts Metals Mining Oil & Gas Red: decline Yellow: roughly flat Green: growth
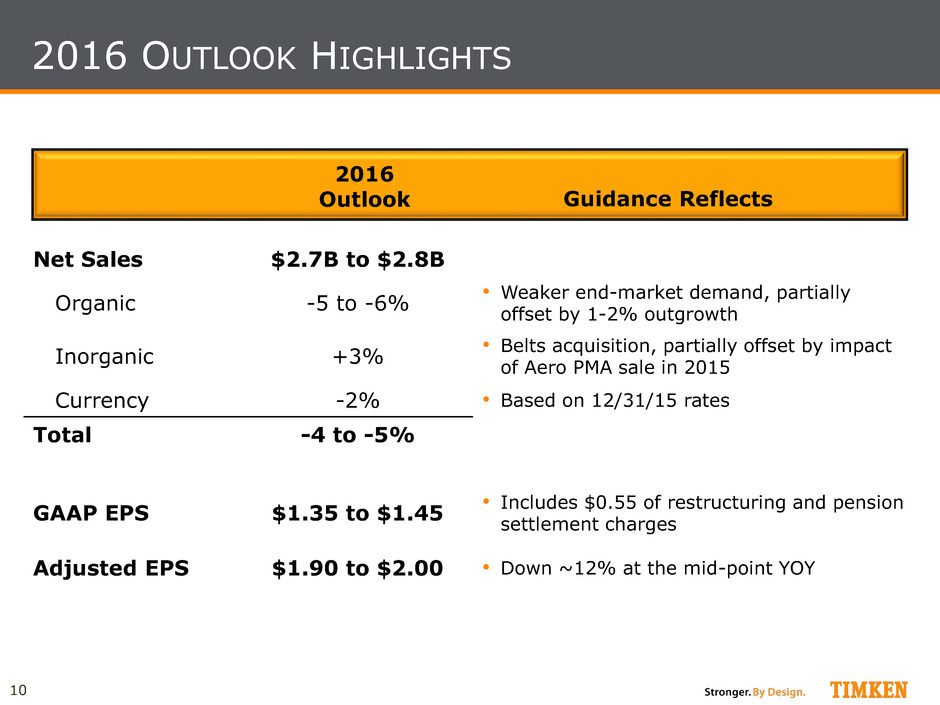
10 2016 OUTLOOK HIGHLIGHTS Net Sales $2.7B to $2.8B Organic -5 to -6% • Weaker end-market demand, partially offset by 1-2% outgrowth Inorganic +3% • Belts acquisition, partially offset by impact of Aero PMA sale in 2015 Currency -2% • Based on 12/31/15 rates Total -4 to -5% GAAP EPS $1.35 to $1.45 • Includes $0.55 of restructuring and pension settlement charges Adjusted EPS $1.90 to $2.00 • Down ~12% at the mid-point YOY 2016 Outlook Guidance Reflects
Financial Review

12 4Q-2015 Excluding vs. impact Region 4Q-2014 of currency NA -4% -3% EMEA -6% 6% APAC -9% -4% LatAm -19% -4% Geographic Sales Comparison4Q 2015 FINANCIAL HIGHLIGHTS - SALES • Sales of $714 million, down 6.3% from a year ago Excluding currency impact of ~4.6%, sales declined ~1.7% Decline driven by weakness across most industrial sectors partially offset by growth in automotive, military marine, wind energy and the benefit of acquisitions 4Q-15 4Q-14 $714.4 $762.2 $ B/(W) Sales % B/(W) $(47.8) (6.3)% ($M) 4Q 2014 Organic Currency Inorganic 4Q 2015 $(35) $25 $762 $714 $(38)
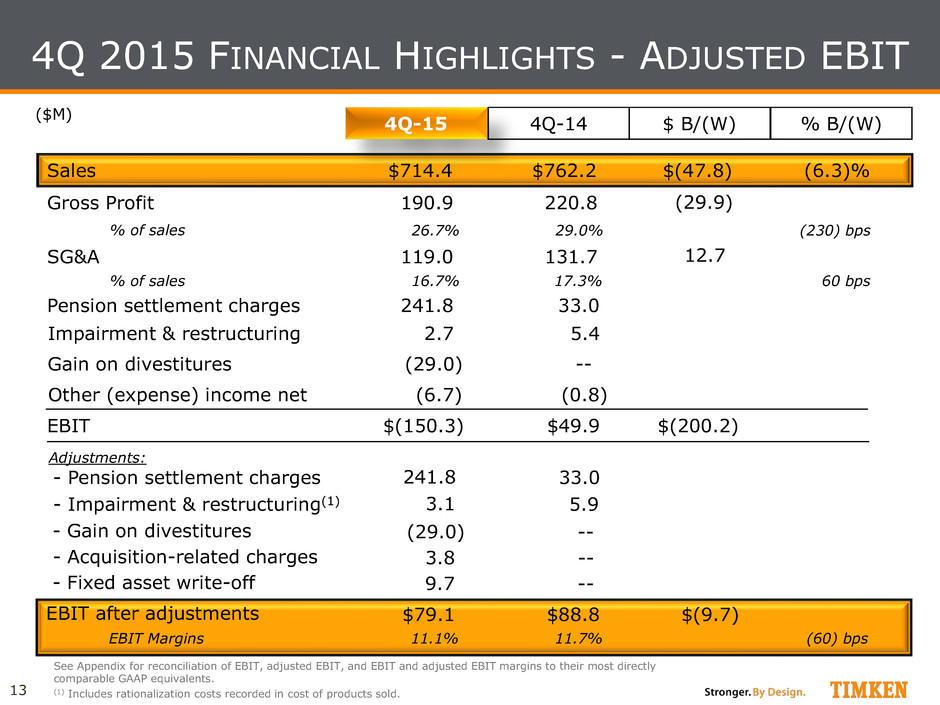
13 4Q 2015 FINANCIAL HIGHLIGHTS - ADJUSTED EBIT 4Q-15 4Q-14 $714.4 $762.2 $ B/(W) Sales % B/(W) $(47.8) (6.3)% 190.9 220.8 Gross Profit 119.0 131.7 SG&A 33.0 Pension settlement charges $49.9 EBIT ($M) % of sales 16.7% 17.3% % of sales 26.7% 29.0% (230) bps 60 bps See Appendix for reconciliation of EBIT, adjusted EBIT, and EBIT and adjusted EBIT margins to their most directly comparable GAAP equivalents. (1) Includes rationalization costs recorded in cost of products sold. (0.8) 12.7 241.8 $(150.3) (6.7) $(200.2) (29.9) 5.4 Impairment & restructuring 2.7 - Impairment & restructuring(1) - Pension settlement charges Adjustments: $79.1 $88.8 EBIT after adjustments $(9.7) 11.1% 11.7% EBIT Margins (60) bps 33.0 5.9 3.1 241.8 - Gain on divestitures (29.0) -- -- Gain on divestitures (29.0) - Acquisition-related charges 3.8 -- - Fixed asset write-off 9.7 -- Other (expense) income net
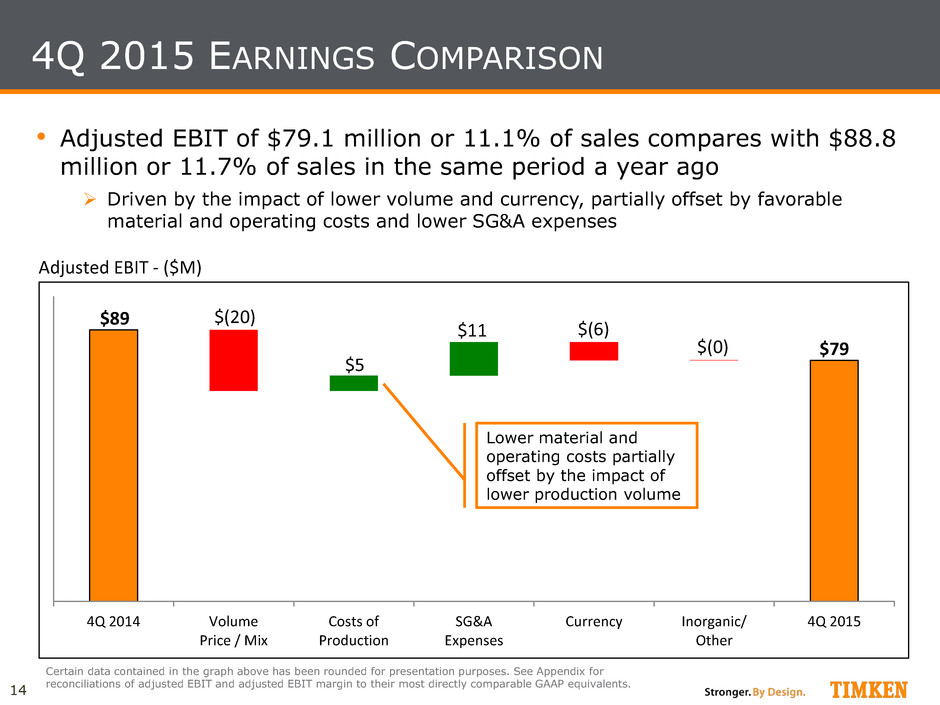
14 4Q 2015 EARNINGS COMPARISON • Adjusted EBIT of $79.1 million or 11.1% of sales compares with $88.8 million or 11.7% of sales in the same period a year ago Driven by the impact of lower volume and currency, partially offset by favorable material and operating costs and lower SG&A expenses Certain data contained in the graph above has been rounded for presentation purposes. See Appendix for reconciliations of adjusted EBIT and adjusted EBIT margin to their most directly comparable GAAP equivalents. 4Q 2014 Volume Price / Mix Costs of Production SG&A Expenses Currency Inorganic/ Other 4Q 2015 Adjusted EBIT - ($M) $89 $79 $(6) $(20) $5 $11 $(0) Lower material and operating costs partially offset by the impact of lower production volume
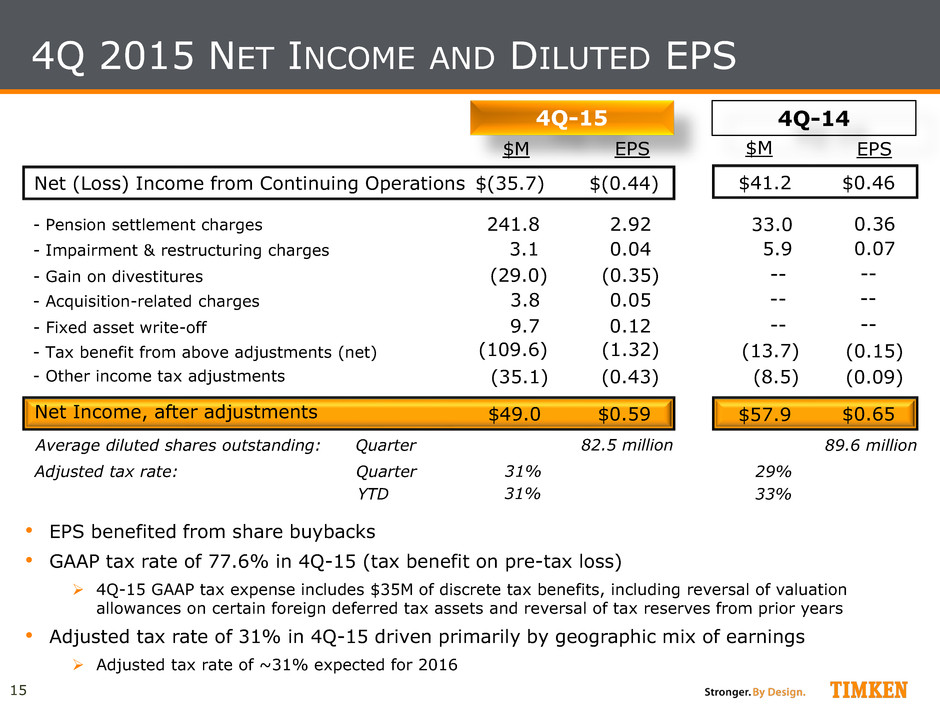
15 4Q 2015 NET INCOME AND DILUTED EPS 4Q-15 $(35.7) $(0.44) Net (Loss) Income from Continuing Operations - Fixed asset write-off Net Income, after adjustments $49.0 $0.59 $M EPS 4Q-14 $41.2 $0.46 $57.9 $0.65 EPS Adjusted tax rate: Quarter 31% 29% - Impairment & restructuring charges 3.1 5.9 0.04 • EPS benefited from share buybacks • GAAP tax rate of 77.6% in 4Q-15 (tax benefit on pre-tax loss) 4Q-15 GAAP tax expense includes $35M of discrete tax benefits, including reversal of valuation allowances on certain foreign deferred tax assets and reversal of tax reserves from prior years • Adjusted tax rate of 31% in 4Q-15 driven primarily by geographic mix of earnings Adjusted tax rate of ~31% expected for 2016 0.07 - Pension settlement charges 241.8 33.0 2.92 - Gain on divestitures (29.0) (0.35) -- 0.36 -- $M - Acquisition-related charges 3.8 0.05 -- -- YTD 31% 33% Average diluted shares outstanding: Quarter 82.5 million 89.6 million - Other income tax adjustments (35.1) (8.5) (0.43) (0.09) - Tax benefit from above adjustments (net) 9.7 0.12 -- -- (109.6) (13.7) (1.32) (0.15)
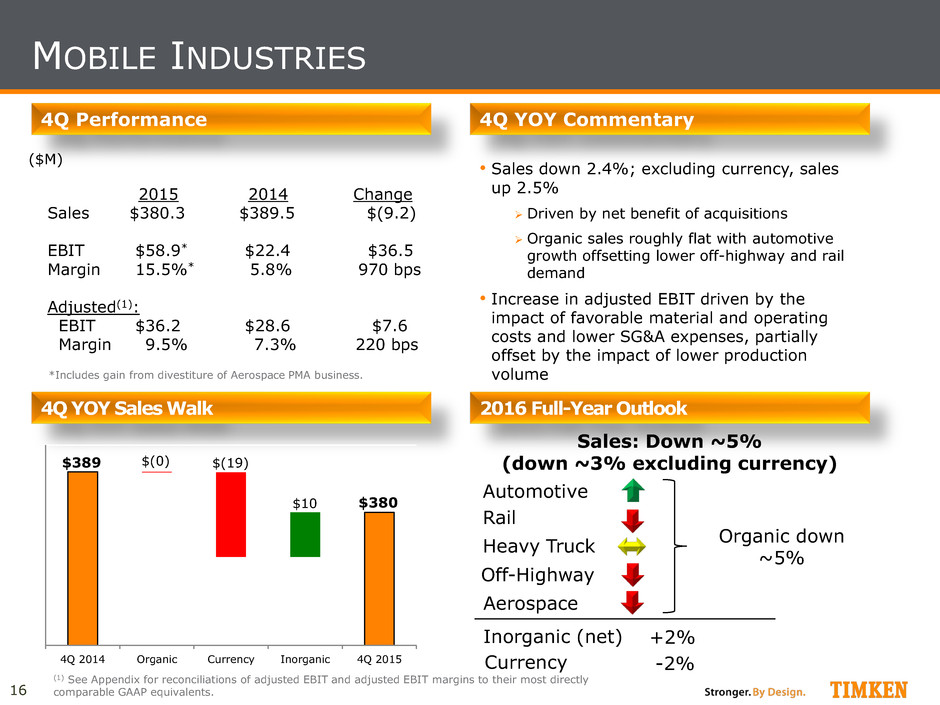
16 MOBILE INDUSTRIES Heavy Truck Automotive Aerospace Rail ($M) 2015 2014 Change Sales $380.3 $389.5 $(9.2) EBIT $58.9* $22.4 $36.5 Margin 15.5%* 5.8% 970 bps Adjusted(1): EBIT $36.2 $28.6 $7.6 Margin 9.5% 7.3% 220 bps 4Q YOY Commentary 4Q Performance • Sales down 2.4%; excluding currency, sales up 2.5% Driven by net benefit of acquisitions Organic sales roughly flat with automotive growth offsetting lower off-highway and rail demand • Increase in adjusted EBIT driven by the impact of favorable material and operating costs and lower SG&A expenses, partially offset by the impact of lower production volume Off-Highway Inorganic (net) +2% (1) See Appendix for reconciliations of adjusted EBIT and adjusted EBIT margins to their most directly comparable GAAP equivalents. 4Q YOY Sales Walk 2016 Full-Year Outlook 4Q 2014 Organic Currency Inorganic 4Q 2015 $(19) $10 $389 $380 $(0) *Includes gain from divestiture of Aerospace PMA business. Currency Organic down ~5% Sales: Down ~5% (down ~3% excluding currency) -2%
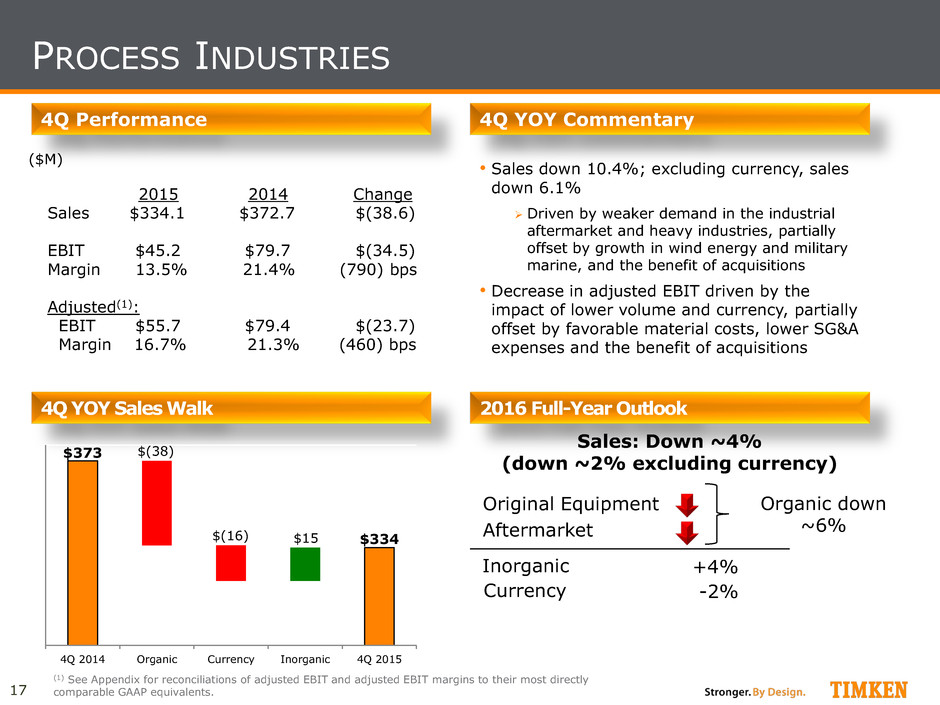
17 PROCESS INDUSTRIES Original Equipment Aftermarket ($M) 2015 2014 Change Sales $334.1 $372.7 $(38.6) EBIT $45.2 $79.7 $(34.5) Margin 13.5% 21.4% (790) bps Adjusted(1): EBIT $55.7 $79.4 $(23.7) Margin 16.7% 21.3% (460) bps 4Q YOY Commentary 4Q Performance • Sales down 10.4%; excluding currency, sales down 6.1% Driven by weaker demand in the industrial aftermarket and heavy industries, partially offset by growth in wind energy and military marine, and the benefit of acquisitions • Decrease in adjusted EBIT driven by the impact of lower volume and currency, partially offset by favorable material costs, lower SG&A expenses and the benefit of acquisitions (1) See Appendix for reconciliations of adjusted EBIT and adjusted EBIT margins to their most directly comparable GAAP equivalents. 4Q YOY Sales Walk 2016 Full-Year Outlook Inorganic +4% 4Q 2014 Organic Currency Inorganic 4Q 2015 $(16) $15 $373 $334 $(38) Currency -2% Organic down ~6% Sales: Down ~4% (down ~2% excluding currency)
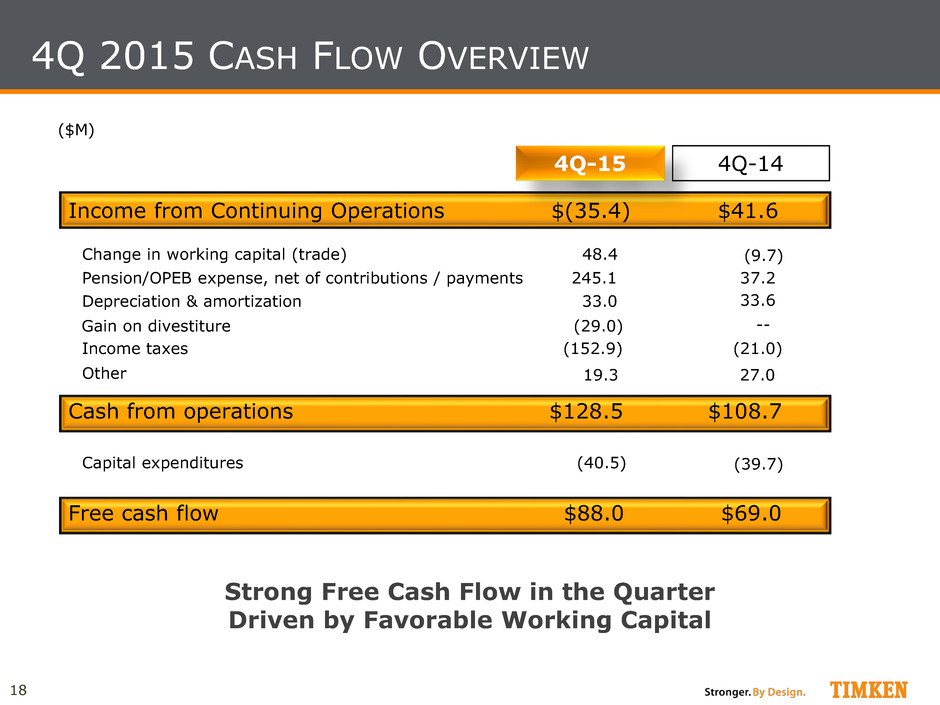
18 4Q 2015 CASH FLOW OVERVIEW 4Q-15 4Q-14 $(35.4) $41.6 Income from Continuing Operations $128.5 $108.7 Cash from operations (9.7) 48.4 Change in working capital (trade) (152.9) (21.0) Income taxes 33.0 37.2 Depreciation & amortization $88.0 $69.0 Free cash flow 245.1 Pension/OPEB expense, net of contributions / payments 33.6 (39.7) (40.5) Capital expenditures 19.3 Other ($M) 27.0 (29.0) Gain on divestiture -- Strong Free Cash Flow in the Quarter Driven by Favorable Working Capital
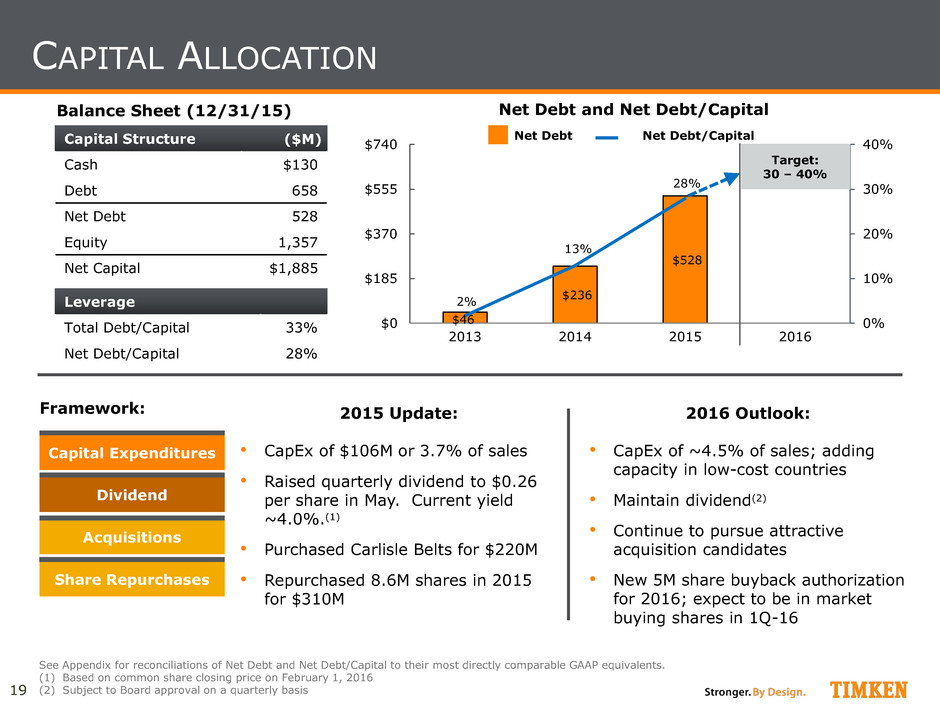
19 $46 $236 $528 0% 10% 20% 30% 40% $0 $185 $370 $555 $740 2013 2014 2015 2016 Capital Expenditures Dividend Share Repurchases Acquisitions Framework: Capital Structure Cash $130 Debt 658 Net Debt 528 Equity 1,357 Net Capital $1,885 Leverage Total Debt/Capital 33% Net Debt/Capital 28% ($M) Balance Sheet (12/31/15) Net Debt and Net Debt/Capital See Appendix for reconciliations of Net Debt and Net Debt/Capital to their most directly comparable GAAP equivalents. (1) Based on common share closing price on February 1, 2016 (2) Subject to Board approval on a quarterly basis CAPITAL ALLOCATION Net Debt Net Debt/Capital 13% 2% 28% Target: 30 – 40% 2015 Update: • CapEx of $106M or 3.7% of sales • Raised quarterly dividend to $0.26 per share in May. Current yield ~4.0%.(1) • Purchased Carlisle Belts for $220M • Repurchased 8.6M shares in 2015 for $310M 2016 Outlook: • CapEx of ~4.5% of sales; adding capacity in low-cost countries • Maintain dividend(2) • Continue to pursue attractive acquisition candidates • New 5M share buyback authorization for 2016; expect to be in market buying shares in 1Q-16
20 PENSION STRATEGY & DE-RISKING UPDATE In 2015, we continued to de-risk our fully funded pension plans and took strategic actions to reduce our gross liability Gross Pension Liability Reduced by ~50% in 2015 • Moved to liability-driven investment strategy to protect fully funded status in our US and UK plans • Purchased 2 group annuity contracts from Prudential for US retirees, funded entirely with plan assets, reducing our gross liability by over $1B or more than 50% Affected plans remain fully funded • Continued to offer lump sum payments to retirees and other deferred vested participants • Incurred $465M of non-cash pension settlement charges in 2015 ($242M in 4Q-15) • No significant pension contributions required in 2016
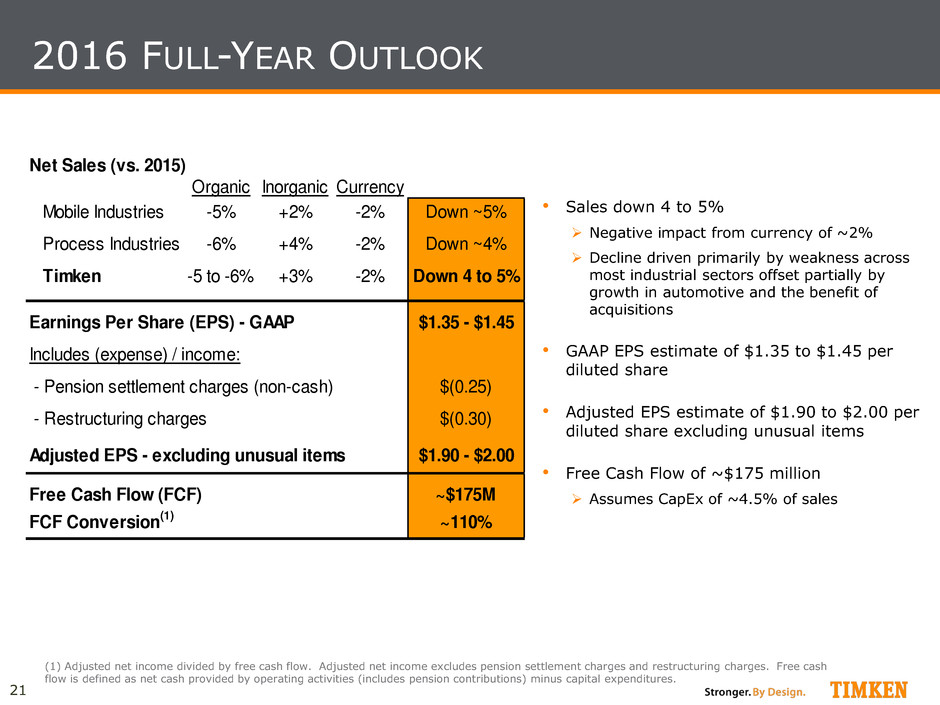
21 2016 FULL-YEAR OUTLOOK (1) Adjusted net income divided by free cash flow. Adjusted net income excludes pension settlement charges and restructuring charges. Free cash flow is defined as net cash provided by operating activities (includes pension contributions) minus capital expenditures. Net Sales (vs. 2015) Organic Inorganic Currency Mobile Industries -5% +2% -2% Down ~5% Process Industries -6% +4% -2% Down ~4% Timken -5 to -6% +3% -2% Down 4 to 5% Earnings Per Share (EPS) - GAAP $1.35 - $1.45 Includes (expense) / income: - Pension settlement charges (non-cash) $(0.25) - Restructuring charges $(0.30) Adjusted EPS - excluding unusual items $1.90 - $2.00 Free Cash Flow (FCF) ~$175M FCF Conversion(1) ~110% • Sales down 4 to 5% Negative impact from currency of ~2% Decline driven primarily by weakness across most industrial sectors offset partially by growth in automotive and the benefit of acquisitions • GAAP EPS estimate of $1.35 to $1.45 per diluted share • Adjusted EPS estimate of $1.90 to $2.00 per diluted share excluding unusual items • Free Cash Flow of ~$175 million Assumes CapEx of ~4.5% of sales
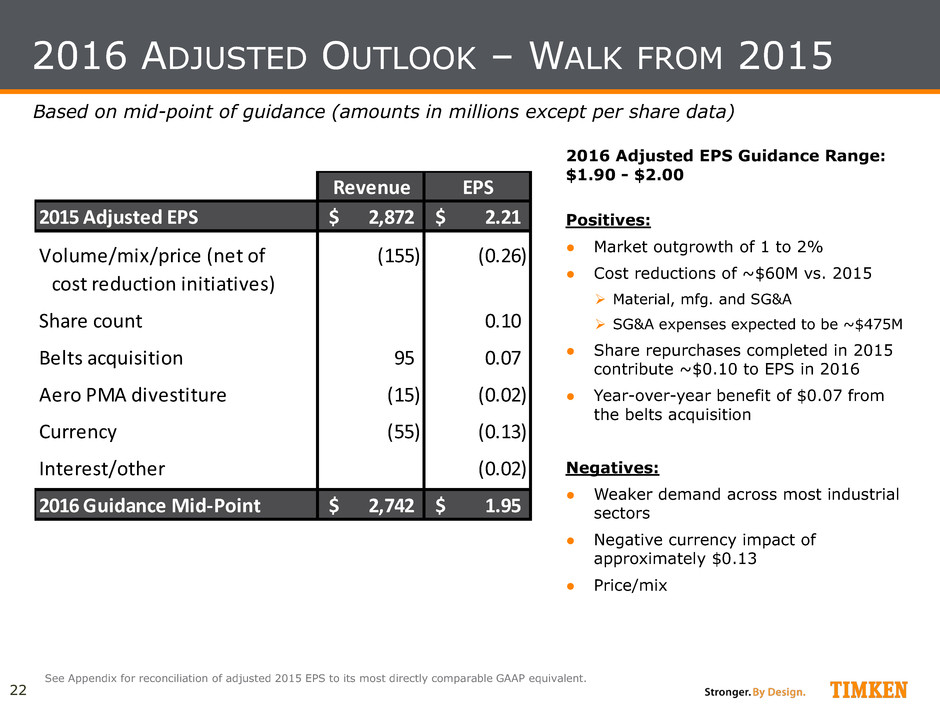
22 2016 ADJUSTED OUTLOOK – WALK FROM 2015 See Appendix for reconciliation of adjusted 2015 EPS to its most directly comparable GAAP equivalent. 2016 Adjusted EPS Guidance Range: $1.90 - $2.00 Positives: ● Market outgrowth of 1 to 2% ● Cost reductions of ~$60M vs. 2015 Material, mfg. and SG&A SG&A expenses expected to be ~$475M ● Share repurchases completed in 2015 contribute ~$0.10 to EPS in 2016 ● Year-over-year benefit of $0.07 from the belts acquisition Negatives: ● Weaker demand across most industrial sectors ● Negative currency impact of approximately $0.13 ● Price/mix Based on mid-point of guidance (amounts in millions except per share data) Revenue EPS 2015 Adjusted EPS 2,872$ 2.21$ Volume/mix/price (net of (155) (0.26) cost reduction initiatives) Share count 0.10 Belts acquisition 95 0.07 Aero PMA divestiture (15) (0.02) Currency (55) (0.13) Interest/other (0.02) 2016 Guidance Mid-Point 2,742$ 1.95$
23 • Emphasis on outgrowing our markets • Drive further margin enhancement/competitiveness initiatives Operational excellence SG&A efficiency Investments in the business • Continued focus on capital allocation WHAT TO EXPECT IN 2016
Appendix
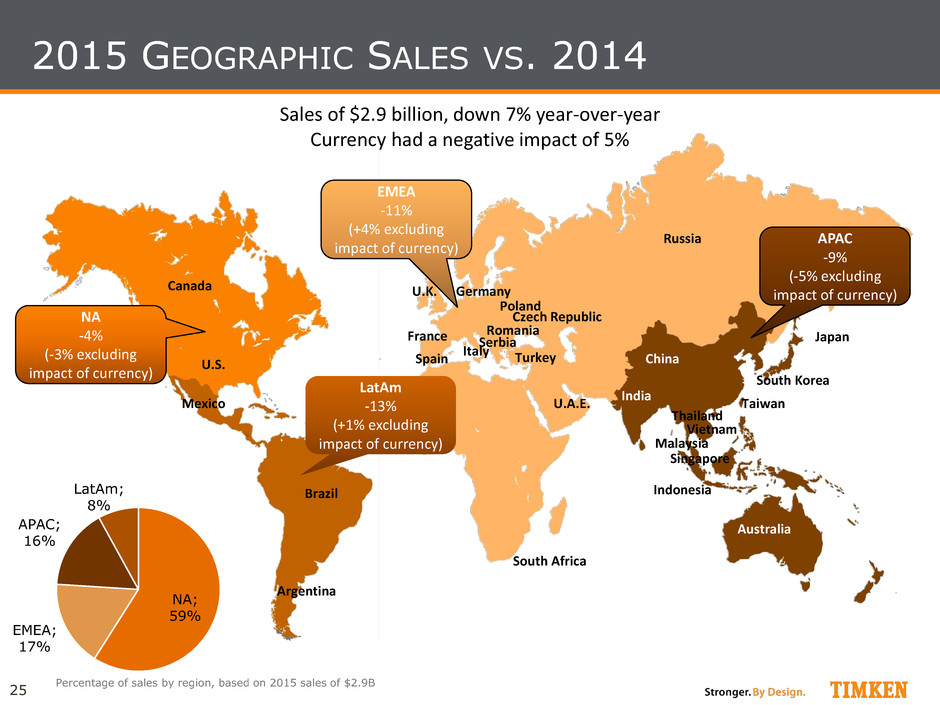
25 2015 GEOGRAPHIC SALES VS. 2014 Argentina U.S. Mexico Brazil Australia China Spain France India South Africa Poland Italy U.K. Romania Russia Czech Republic Germany Indonesia Taiwan Thailand Singapore Japan South Korea Vietnam Turkey U.A.E. Canada LatAm -13% (+1% excluding impact of currency) NA -4% (-3% excluding impact of currency) EMEA -11% (+4% excluding impact of currency) APAC -9% (-5% excluding impact of currency) Sales of $2.9 billion, down 7% year-over-year Currency had a negative impact of 5% NA; 59% EMEA; 17% APAC; 16% LatAm; 8% Percentage of sales by region, based on 2015 sales of $2.9B Malaysia Serbia

26 GAAP RECONCILIATION: NET INCOME & EPS (Unaudited) (Dollars in millions, except share data) 2015 EPS 2014 EPS 2015 EPS (Loss) Income from Continuing Operations (35.4)$ 41.6$ (68.0)$ Less: Net Income Attributable to Noncontrolling Interest 0.3 0.4 2.8 Net (Loss) Income from Continuing Operations attributable to The Timken Company (35.7)$ (0.44)$ 41.2$ 0.46$ (70.8)$ (0.84)$ Adjustments: Pension settlement charges (1) 241.8$ 2.92$ 33.0$ 0.36$ 465.0$ 5.45$ Impairment and restructuring charges (2) 3.1 0.04 5.9 0.07 15.9 0.19 Gain on divestitures (3) (29.0) (0.35) - - (28.7) (0.33) Acquisition related charges (4) 3.8 0.05 - - 5.7 0.07 Fixed asset write-off (5) 9.7 0.12 - - 9.7 0.11 Tax benefit from above adjustments (net) (6) (109.6) (1.32) (13.7) (0.15) (173.1) (2.03) Other income tax adjustments (7) (35.1) (0.43) (8.5) (0.09) (34.6) (0.41) Total Adjustments: 84.7 1.03 16.7 0.19 259.9 3.05 Adjusted Net Income from Continuing Operations 49.0$ 0.59$ 57.9$ 0.65$ 189.1$ 2.21$ (6) Tax benefit from above adjustments (net) included the tax impact on pre-tax special items as well as adjustments to reflect the use of one overall effective tax rate on adjusted pre-tax income in interim periods. (7) Other income tax adjustments included the impact of discrete tax items recorded during the respective periods, including the reversal of certain valuation allowances on deferred tax assets and reversals of uncertain tax positions in the fourth quarter of 2015. Reconciliations of Adjusted Net Income from Continuing Operations to GAAP (Loss) Income from Continuing Operations and Adjusted Diluted Earnings Per Share to GAAP (Loss) Earnings Per Share: These reconciliations are provided as additional relevant information about the Company's performance. Management believes that adjusted net income from continuing operations and adjusted diluted earnings per share, adjusted to remove: (a) pension settlement charges; (b) impairment and restructuring charges; (c) gain on divestitures; (d) acquisition related charges; (e) fixed asset write-offs; and (f) the benefit from income taxes are representative of the Company's performance and therefore useful to investors. (1) Pension settlement charges primarily related to two agreements pursuant to which two of the Company's U.S. defined benefit pension plans purchased group annuity contracts from Prudential, which require Prudential to pay and administer future benefits for a total of approximately 8,400 U.S. Timken retirees, as well as lump sum distributions to new retirees during 2015. (5) The fixed asset write-off related to costs that remained in construction in process (CIP) after the related assets were placed into service. The majority of these assets were placed into service between 2008 and 2012. This error was identified during an examination of aged balances in the CIP account. Management of the Company concluded that the correction of this error in the fourth quarter of 2015 and the presence of this error in prior periods is immaterial to all periods presented. (2) Impairment and restructuring charges, including rationalization costs recorded in cost of products sold, related to plant closures, the rationalization of certain plants and severance related to cost reduction initiatives. (3) Gain on the divestiture related to the gain on the sale of Timken Alcor Aerospace Technologies, Inc. (Alcor) located in Mesa, Arizona, of $29.0 million in the fourth quarter of 2015. Three Months Ended December 31, Twelve Months Ended December 31, (4) Acquisition charges related to the acquisition of the Carlisle belts product line, including an inventory step up and one time transaction costs.
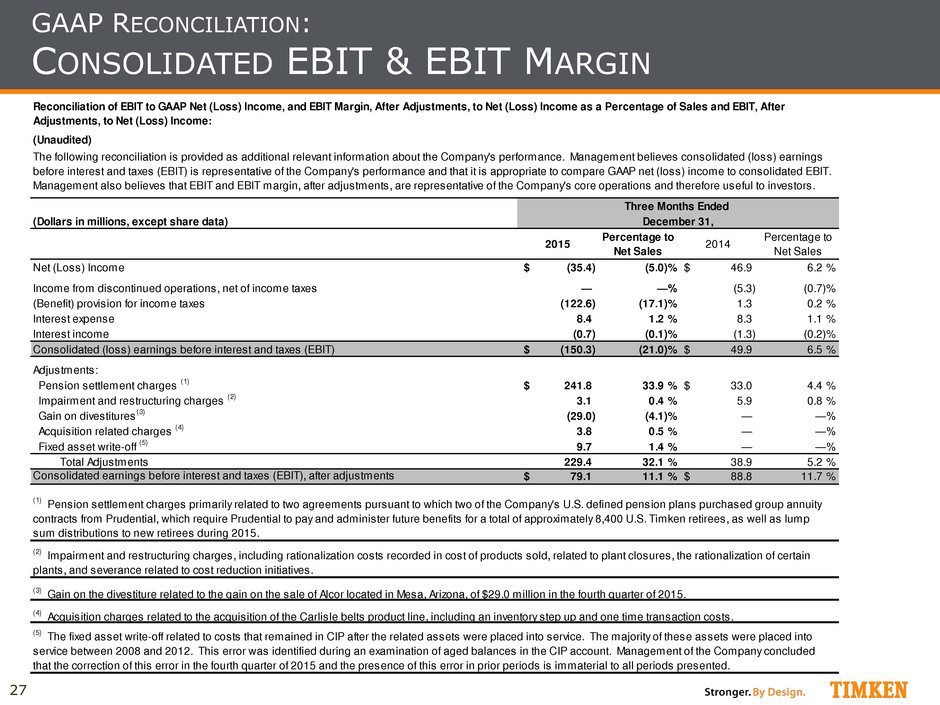
27 GAAP RECONCILIATION: CONSOLIDATED EBIT & EBIT MARGIN (Unaudited) (Dollars in millions, except share data) 2015 Percentage to Net Sales 2014 Percentage to Net Sales Net (Loss) Income (35.4)$ (5.0)% 46.9$ 6.2 % Income from discontinued operations, net of income taxes — —% (5.3) (0.7)% (Benefit) provision for income taxes (122.6) (17.1)% 1.3 0.2 % Interest expense 8.4 1.2 % 8.3 1.1 % Interest income (0.7) (0.1)% (1.3) (0.2)% Consolidated (loss) earnings before interest and taxes (EBIT) (150.3)$ (21.0)% 49.9$ 6.5 % Adjustments: Pension settlement charges (1) 241.8$ 33.9 % 33.0$ 4.4 % Impairment and restructuring charges (2) 3.1 0.4 % 5.9 0.8 % Gain on divestitures (3) (29.0) (4.1)% — —% Acquisition related charges (4) 3.8 0.5 % — —% Fixed asset write-off (5) 9.7 1.4 % — —% Total Adjustments 229.4 32.1 % 38.9 5.2 % Consolidated earnings before interest and taxes (EBIT), after adjustments 79.1$ 11.1 % 88.8$ 11.7 % (5) The fixed asset write-off related to costs that remained in CIP after the related assets were placed into service. The majority of these assets were placed into service between 2008 and 2012. This error was identified during an examination of aged balances in the CIP account. Management of the Company concluded that the correction of this error in the fourth quarter of 2015 and the presence of this error in prior periods is immaterial to all periods presented. (4) Acquisition charges related to the acquisition of the Carlisle belts product line, including an inventory step up and one time transaction costs. (3) Gain on the divestiture related to the gain on the sale of Alcor located in Mesa, Arizona, of $29.0 million in the fourth quarter of 2015. (2) Impairment and restructuring charges, including rationalization costs recorded in cost of products sold, related to plant closures, the rationalization of certain plants, and severance related to cost reduction initiatives. Reconciliation of EBIT to GAAP Net (Loss) Income, and EBIT Margin, After Adjustments, to Net (Loss) Income as a Percentage of Sales and EBIT, After Adjustments, to Net (Loss) Income: December 31, Three Months Ended The following reconciliation is provided as additional relevant information about the Company's performance. Management believes consolidated (loss) earnings before interest and taxes (EBIT) is representative of the Company's performance and that it is appropriate to compare GAAP net (loss) income to consolidated EBIT. Management also believes that EBIT and EBIT margin, after adjustments, are representative of the Company's core operations and therefore useful to investors. (1) Pension settlement charges primarily related to two agreements pursuant to which two of the Company's U.S. defined pension plans purchased group annuity contracts from Prudential, which require Prudential to pay and administer future benefits for a total of approximately 8,400 U.S. Timken retirees, as well as lump sum distributions to new retirees during 2015.
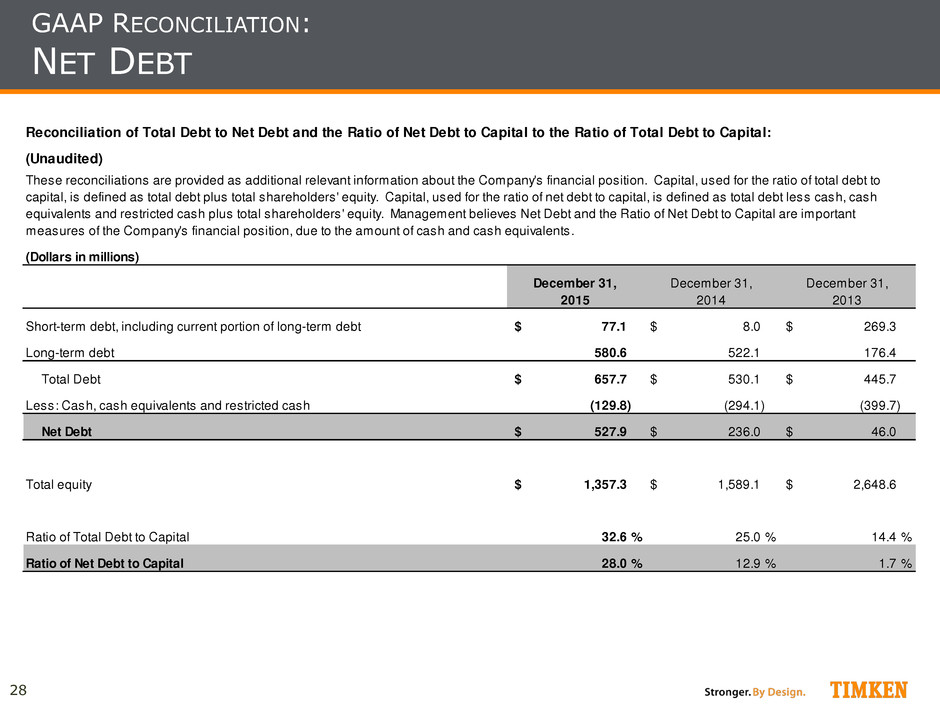
28 GAAP RECONCILIATION: NET DEBT (Unaudited) (Dollars in millions) December 31, 2015 December 31, 2014 December 31, 2013 Short-term debt, including current portion of long-term debt 77.1$ 8.0$ 269.3$ Long-term debt 580.6 522.1 176.4 Total Debt 657.7$ 530.1$ 445.7$ Less: Cash, cash equivalents and restricted cash (129.8) (294.1) (399.7) Net Debt 527.9$ 236.0$ 46.0$ Total equity 1,357.3$ 1,589.1$ 2,648.6$ Ratio of Total Debt to Capital 32.6 % 25.0 % 14.4 % Ratio of Net Debt to Capital 28.0 % 12.9 % 1.7 % Reconciliation of Total Debt to Net Debt and the Ratio of Net Debt to Capital to the Ratio of Total Debt to Capital: These reconciliations are provided as additional relevant information about the Company's financial position. Capital, used for the ratio of total debt to capital, is defined as total debt plus total shareholders' equity. Capital, used for the ratio of net debt to capital, is defined as total debt less cash, cash equivalents and restricted cash plus total shareholders' equity. Management believes Net Debt and the Ratio of Net Debt to Capital are important measures of the Company's financial position, due to the amount of cash and cash equivalents.
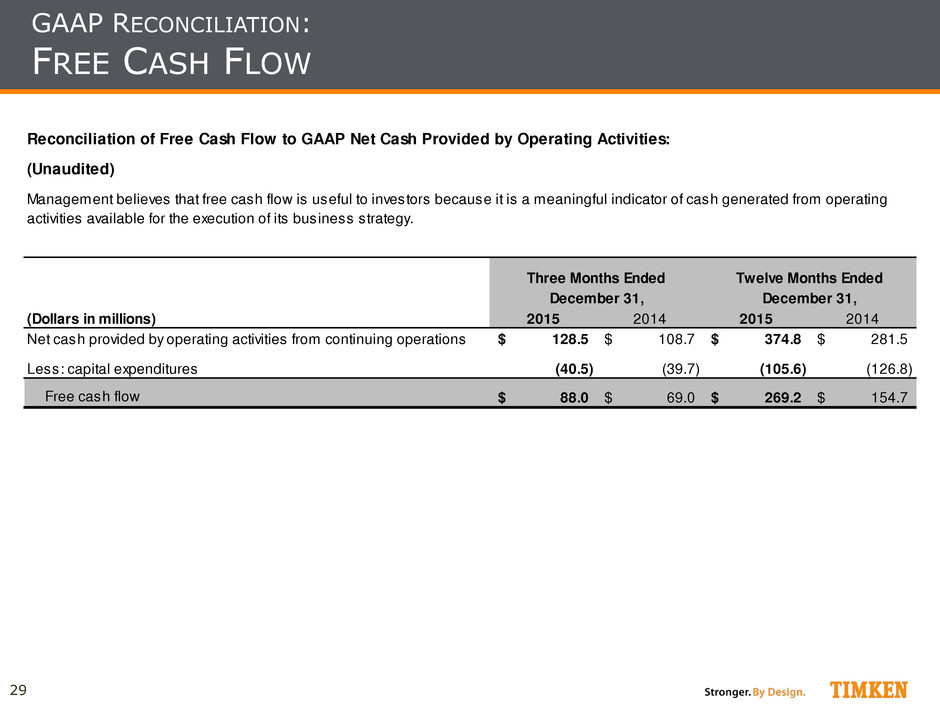
29 GAAP RECONCILIATION: FREE CASH FLOW (Unaudited) (Dollars in millions) 2015 2014 2015 2014 Net cash provided by operating activities from continuing operations 128.5$ 108.7$ 374.8$ 281.5$ Less: capital expenditures (40.5) (39.7) (105.6) (126.8) Free cash flow 88.0$ 69.0$ 269.2$ 154.7$ Three Months Ended Twelve Months Ended December 31, December 31, Reconciliation of Free Cash Flow to GAAP Net Cash Provided by Operating Activities: Management believes that free cash flow is useful to investors because it is a meaningful indicator of cash generated from operating activities available for the execution of its business strategy.
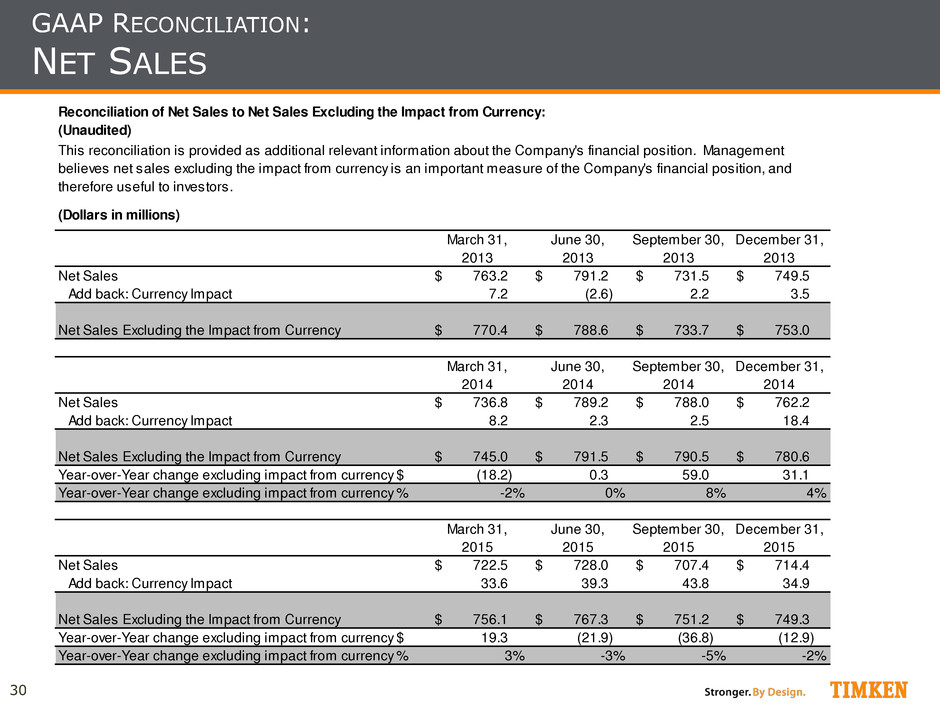
30 GAAP RECONCILIATION: NET SALES (Unaudited) (Dollars in millions) March 31, 2013 June 30, 2013 September 30, 2013 December 31, 2013 Net Sales 763.2$ 791.2$ 731.5$ 749.5$ Add back: Currency Impact 7.2 (2.6) 2.2 3.5 Net Sales Excluding the Impact from Currency 770.4$ 788.6$ 733.7$ 753.0$ March 31, 2014 June 30, 2014 September 30, 2014 December 31, 2014 Net Sales 736.8$ 789.2$ 788.0$ 762.2$ Add back: Currency Impact 8.2 2.3 2.5 18.4 Net Sales Excluding the Impact from Currency 745.0$ 791.5$ 790.5$ 780.6$ Year-over-Year change excluding impact from currency $ (18.2) 0.3 59.0 31.1 Year-over-Year change excluding impact from currency % -2% 0% 8% 4% March 31, 2015 June 30, 2015 September 30, 2015 December 31, 2015 Net Sales 722.5$ 728.0$ 707.4$ 714.4$ Add back: Currency Impact 33.6 39.3 43.8 34.9 Net Sales Excluding the Impact from Currency 756.1$ 767.3$ 751.2$ 749.3$ Year-over-Year change excluding impact from currency $ 19.3 (21.9) (36.8) (12.9) Year-over-Year change excluding impact from currency % 3% -3% -5% -2% This reconciliation is provided as additional relevant information about the Company's financial position. Management believes net sales excluding the impact from currency is an important measure of the Company's financial position, and therefore useful to investors. Reconciliation of Net Sales to Net Sales Excluding the Impact from Currency:
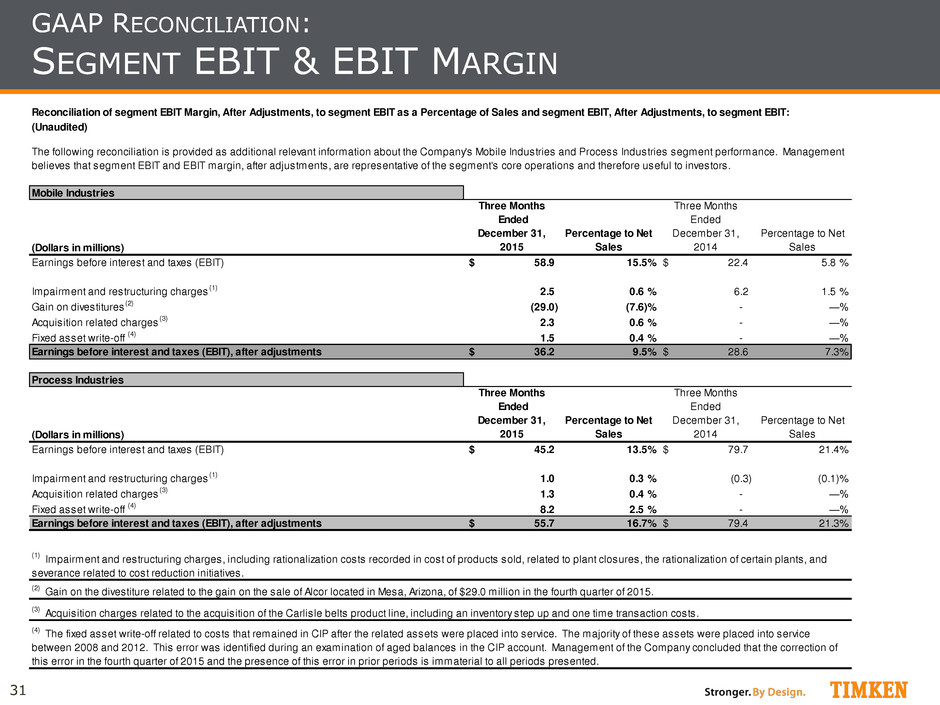
31 GAAP RECONCILIATION: SEGMENT EBIT & EBIT MARGIN (Unaudited) Mobile Industries (Dollars in millions) Three Months Ended December 31, 2015 Percentage to Net Sales Three Months Ended December 31, 2014 Percentage to Net Sales Earnings before interest and taxes (EBIT) 58.9$ 15.5% 22.4$ 5.8 % Impairment and restructuring charges (1) 2.5 0.6 % 6.2 1.5 % Gain on divestitures (2) (29.0) (7.6)% - —% Acquisition related charges (3) 2.3 0.6 % - —% Fixed asset write-off (4) 1.5 0.4 % - —% Earnings before interest and taxes (EBIT), after adjustments 36.2$ 9.5% 28.6$ 7.3% Process Industries (Dollars in millions) Three Months Ended December 31, 2015 Percentage to Net Sales Three Months Ended December 31, 2014 Percentage to Net Sales Earnings before interest and taxes (EBIT) 45.2$ 13.5% 79.7$ 21.4% Impairment and restructuring charges (1) 1.0 0.3 % (0.3) (0.1)% Acquisition related charges (3) 1.3 0.4 % - —% Fixed asset write-off (4) 8.2 2.5 % - —% Earnings before interest and taxes (EBIT), after adjustments 55.7$ 16.7% 79.4$ 21.3% (4) The fixed asset write-off related to costs that remained in CIP after the related assets were placed into service. The majority of these assets were placed into service between 2008 and 2012. This error was identified during an examination of aged balances in the CIP account. Management of the Company concluded that the correction of this error in the fourth quarter of 2015 and the presence of this error in prior periods is immaterial to all periods presented. (3) Acquisition charges related to the acquisition of the Carlisle belts product line, including an inventory step up and one time transaction costs. (2) Gain on the divestiture related to the gain on the sale of Alcor located in Mesa, Arizona, of $29.0 million in the fourth quarter of 2015. Reconciliation of segment EBIT Margin, After Adjustments, to segment EBIT as a Percentage of Sales and segment EBIT, After Adjustments, to segment EBIT: The following reconciliation is provided as additional relevant information about the Company's Mobile Industries and Process Industries segment performance. Management believes that segment EBIT and EBIT margin, after adjustments, are representative of the segment's core operations and therefore useful to investors. (1) Impairment and restructuring charges, including rationalization costs recorded in cost of products sold, related to plant closures, the rationalization of certain plants, and severance related to cost reduction initiatives.