Pay vs Performance Disclosure
|
12 Months Ended |
|
Dec. 31, 2022
USD ($)
|
Dec. 31, 2021
USD ($)
|
Dec. 31, 2020
USD ($)
|
| Pay vs Performance Disclosure [Table] |
|
|
|
| Pay vs Performance [Table Text Block] |
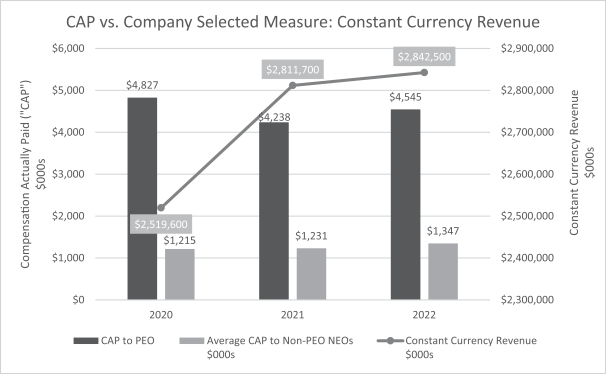
The following table reports the compensation of our principal executive officer (PEO) and the average compensation of the other named executive officers (Non-PEO NEOs) as reported in the Summary Compensation Table for the past three fiscal years, as well as their “compensation actually paid” as calculated pursuant to recently adopted SEC rules and certain performance measures required by the rules. The Compensation Committee does not utilize “compensation actually paid” as the basis for making compensation decisions. For further information concerning our compensation philosophy and how we align executive compensation with our performance, see the “Compensation Discussion and Analysis” section of this proxy statement.
|
|
|
|
|
|
|
|
|
|
|
|
|
|
|
|
|
|
|
|
|
|
|
|
|
|
|
|
|
|
|
|
| |
| |
|
|
|
|
|
|
|
|
|
|
|
|
|
Value of Initial Fixed $100
Investment Based On: |
|
|
|
|
|
|
|
Year |
|
Summary
Compensation
Table (“SCT”)
|
|
|
Compensation
Actually Paid to
PEO
|
|
|
Average SCT Total for Non-PEO NEOs
|
|
|
Average Compensation Actually Paid to Non-PEO NEOs
|
|
|
|
|
|
Peer Group
Total
Shareholder
Return
|
|
|
|
|
|
Constant Currency
Revenue
|
|
2022 |
|
|
$8,190,461 |
|
|
|
$4,544,685 |
|
|
|
$2,047,296 |
|
|
|
$1,347,223 |
|
|
|
$67.16 |
|
|
|
$112.36 |
|
|
|
$363,139,000 |
|
|
|
$2,842,500,000 |
|
2021 |
|
|
$8,673,634 |
|
|
|
$4,238,150 |
|
|
|
$2,074,095 |
|
|
|
$1,231,022 |
|
|
|
$87.92 |
|
|
|
$142.45 |
|
|
|
$485,374,000 |
|
|
|
$2,811,700,000 |
|
2020 |
|
|
$6,328,349 |
|
|
|
$4,827,257 |
|
|
|
$1,603,056 |
|
|
|
$1,215,470 |
|
|
|
$109.75 |
|
|
|
$118.81 |
|
|
|
$335,324,000 |
|
|
|
$2,519,600,000 |
|
| (1) |
Liam J. Kelly was our principal executive officer in each of 2022, 2021 and 2020. |
| (2) |
The amounts set forth in this column were calculated by making the following adjustments to the amounts set forth in the “Summary Compensation Table (“SCT”) Total for PEO” column: |
|
|
|
|
|
|
|
|
|
|
|
|
| |
| |
|
2022 |
|
|
2021 |
|
|
2020 |
|
Deductions for amounts reported under the “Stock Awards” column of the SCT |
|
|
$2,683,159 |
|
|
|
$2,664,264 |
|
|
|
$1,975,833 |
|
Deductions for amounts reported under the “Option Awards” column of the SCT |
|
|
$3,502,779 |
|
|
|
$3,000,606 |
|
|
|
$2,343,414 |
|
Increase for fair value of awards granted during year that remain outstanding and unvested as of year end |
|
|
$4,247,471 |
|
|
|
$4,025,539 |
|
|
|
$5,248,152 |
|
Increase/deduction for change in fair value from prior year end to current year end of awards granted prior to year that were outstanding and unvested as of year end |
|
|
$(2,033,539) |
|
|
|
$(2,366,658) |
|
|
|
$(1,025,440) |
|
Increase/deduction for change in fair value from prior year end to vesting date of awards granted prior to year that vested during year |
|
|
$326,230 |
|
|
|
$(429,495) |
|
|
|
$(1,404,556) |
|
| (3) |
Our named executive officers, other than our principal executive officer, for (a) 2022 and 2021 were Thomas E. Powell, Jay K. White, Cameron P. Hicks and James P. Winters; and (b) 2020 were Thomas E. Powell, James J. Leyden, Cameron P. Hicks and James P. Winters. |
| (4) |
The amounts set forth in this column were calculated by making the following adjustments to the amounts set forth in the “Average SCT Total for Non-PEO NEOs” column: |
|
|
|
|
|
|
|
|
|
|
|
|
| |
| |
|
2022 |
|
|
2021 |
|
|
2020 |
|
Deductions for change in the actuarial present values reported under the “Change in Pension Value and Nonqualified Deferred Compensation” column of the SCT |
|
|
– |
|
|
|
– |
|
|
|
$3,306 |
|
Deductions for amounts reported under the “Stock Awards” column of the SCT |
|
|
$556,786 |
|
|
|
$481,872 |
|
|
|
$412,719 |
|
Deductions for amounts reported under the “Option Awards” column of the SCT |
|
|
$726,798 |
|
|
|
$542,719 |
|
|
|
$489,640 |
|
Increase for fair value of awards granted during year that remain outstanding and unvested as of year end |
|
|
$881,351 |
|
|
|
$728,082 |
|
|
|
$1,096,461 |
|
Increase/deduction for change in fair value from prior year end to current year end of awards granted prior to year that were outstanding and unvested as of year end |
|
|
$(362,564) |
|
|
|
$(468,507) |
|
|
|
$(187,684) |
|
Increase/deduction for change in fair value from prior year end to vesting date of awards granted prior to year that vested during year |
|
|
$64,724 |
|
|
|
$(78,058) |
|
|
|
$(390,698) |
|
| (5) |
The peer group used to determine the total shareholder return values included in this column was the S&P 500 Healthcare Equipment & Supply Index. Total shareholder return (TSR) is cumulative for the measurement periods beginning on December 31, 2019 and ending on the last fiscal day in 2022, 2021 and 2020, respectively, calculated in accordance with Item 201(e) of Regulation S-K. |
| (6) |
Constant Currency Revenue is the amount of our consolidated revenues for a given year, adjusted to eliminate the effect of foreign currency exchange rate fluctuations for such year. |
|
|
|
| Company Selected Measure Name |
Constant Currency Revenue
|
|
|
| Named Executive Officers, Footnote [Text Block] |
Our named executive officers, other than our principal executive officer, for (a) 2022 and 2021 were Thomas E. Powell, Jay K. White, Cameron P. Hicks and James P. Winters; and (b) 2020 were Thomas E. Powell, James J. Leyden, Cameron P. Hicks and James P. Winters.
|
|
|
| Peer Group Issuers, Footnote [Text Block] |
The peer group used to determine the total shareholder return values included in this column was the S&P 500 Healthcare Equipment & Supply Index.
|
|
|
| PEO Total Compensation Amount |
$ 8,190,461
|
$ 8,673,634
|
$ 6,328,349
|
| PEO Actually Paid Compensation Amount |
$ 4,544,685
|
4,238,150
|
4,827,257
|
| Adjustment To PEO Compensation, Footnote [Text Block] |
| (2) |
The amounts set forth in this column were calculated by making the following adjustments to the amounts set forth in the “Summary Compensation Table (“SCT”) Total for PEO” column: |
|
|
|
|
|
|
|
|
|
|
|
|
| |
| |
|
2022 |
|
|
2021 |
|
|
2020 |
|
Deductions for amounts reported under the “Stock Awards” column of the SCT |
|
|
$2,683,159 |
|
|
|
$2,664,264 |
|
|
|
$1,975,833 |
|
Deductions for amounts reported under the “Option Awards” column of the SCT |
|
|
$3,502,779 |
|
|
|
$3,000,606 |
|
|
|
$2,343,414 |
|
Increase for fair value of awards granted during year that remain outstanding and unvested as of year end |
|
|
$4,247,471 |
|
|
|
$4,025,539 |
|
|
|
$5,248,152 |
|
Increase/deduction for change in fair value from prior year end to current year end of awards granted prior to year that were outstanding and unvested as of year end |
|
|
$(2,033,539) |
|
|
|
$(2,366,658) |
|
|
|
$(1,025,440) |
|
Increase/deduction for change in fair value from prior year end to vesting date of awards granted prior to year that vested during year |
|
|
$326,230 |
|
|
|
$(429,495) |
|
|
|
$(1,404,556) |
|
|
|
|
| Non-PEO NEO Average Total Compensation Amount |
$ 2,047,296
|
2,074,095
|
1,603,056
|
| Non-PEO NEO Average Compensation Actually Paid Amount |
$ 1,347,223
|
1,231,022
|
1,215,470
|
| Adjustment to Non-PEO NEO Compensation Footnote [Text Block] |
| (4) |
The amounts set forth in this column were calculated by making the following adjustments to the amounts set forth in the “Average SCT Total for Non-PEO NEOs” column: |
|
|
|
|
|
|
|
|
|
|
|
|
| |
| |
|
2022 |
|
|
2021 |
|
|
2020 |
|
Deductions for change in the actuarial present values reported under the “Change in Pension Value and Nonqualified Deferred Compensation” column of the SCT |
|
|
– |
|
|
|
– |
|
|
|
$3,306 |
|
Deductions for amounts reported under the “Stock Awards” column of the SCT |
|
|
$556,786 |
|
|
|
$481,872 |
|
|
|
$412,719 |
|
Deductions for amounts reported under the “Option Awards” column of the SCT |
|
|
$726,798 |
|
|
|
$542,719 |
|
|
|
$489,640 |
|
Increase for fair value of awards granted during year that remain outstanding and unvested as of year end |
|
|
$881,351 |
|
|
|
$728,082 |
|
|
|
$1,096,461 |
|
Increase/deduction for change in fair value from prior year end to current year end of awards granted prior to year that were outstanding and unvested as of year end |
|
|
$(362,564) |
|
|
|
$(468,507) |
|
|
|
$(187,684) |
|
Increase/deduction for change in fair value from prior year end to vesting date of awards granted prior to year that vested during year |
|
|
$64,724 |
|
|
|
$(78,058) |
|
|
|
$(390,698) |
|
|
|
|
| Compensation Actually Paid vs. Net Income [Text Block] |
|
|
|
| Compensation Actually Paid vs. Company Selected Measure [Text Block] |
|
|
|
| Total Shareholder Return Vs Peer Group [Text Block] |
| * |
Peer group used to determine total shareholder return values included in this graph was the S&P 500 Healthcare Equipment & Supply Index. |
|
|
|
| Tabular List [Table Text Block] |
Financial Performance Measures The most important financial performance measures we use to link compensation actually paid to our Named Executives Officers, for the most recently completed fiscal year, to company performance are as follows:
| |
• |
|
Constant Currency Revenue |
| |
• |
|
Adjusted Earnings Per Share |
| |
• |
|
Adjusted Operating Cash Flow |
|
|
|
| Total Shareholder Return Amount |
$ 67.16
|
87.92
|
109.75
|
| Peer Group Total Shareholder Return Amount |
112.36
|
142.45
|
118.81
|
| Net Income (Loss) |
$ 363,139,000
|
$ 485,374,000
|
$ 335,324,000
|
| Company Selected Measure Amount |
2,842,500,000
|
2,811,700,000
|
2,519,600,000
|
| PEO Name |
Liam J. Kelly
|
|
|
| Measure [Axis]: 1 |
|
|
|
| Pay vs Performance Disclosure [Table] |
|
|
|
| Measure Name |
Constant Currency Revenue
|
|
|
| Measure [Axis]: 2 |
|
|
|
| Pay vs Performance Disclosure [Table] |
|
|
|
| Measure Name |
Adjusted Earnings Per Share
|
|
|
| Measure [Axis]: 3 |
|
|
|
| Pay vs Performance Disclosure [Table] |
|
|
|
| Measure Name |
Adjusted Operating Cash Flow
|
|
|
| PEO [Member] | Deductions For Amounts Reported Under The Stock Awards [Member] |
|
|
|
| Pay vs Performance Disclosure [Table] |
|
|
|
| Adjustment to Compensation Amount |
$ 2,683,159
|
$ 2,664,264
|
$ 1,975,833
|
| PEO [Member] | Deductions For Amounts Reported Under The Option Awards [Member] |
|
|
|
| Pay vs Performance Disclosure [Table] |
|
|
|
| Adjustment to Compensation Amount |
3,502,779
|
3,000,606
|
2,343,414
|
| PEO [Member] | Increase For Fair Value Of Awards Granted [Member] |
|
|
|
| Pay vs Performance Disclosure [Table] |
|
|
|
| Adjustment to Compensation Amount |
4,247,471
|
4,025,539
|
5,248,152
|
| PEO [Member] | Increase Deduction For Change In Fair Value From Prior Year End To Current Year End Of Awards Granted [Member] |
|
|
|
| Pay vs Performance Disclosure [Table] |
|
|
|
| Adjustment to Compensation Amount |
(2,033,539)
|
(2,366,658)
|
(1,025,440)
|
| PEO [Member] | Increase Deduction For Change In Fair Value From Prior Year End To Vesting Date Of Awards Granted [Member] |
|
|
|
| Pay vs Performance Disclosure [Table] |
|
|
|
| Adjustment to Compensation Amount |
326,230
|
(429,495)
|
(1,404,556)
|
| Non-PEO NEO [Member] | Deductions For Change In The Actuarial Present Values Reported Under The Change In Pension Value And Nonqualified Deferred Compensation [Member] |
|
|
|
| Pay vs Performance Disclosure [Table] |
|
|
|
| Adjustment to Compensation Amount |
0
|
0
|
3,306
|
| Non-PEO NEO [Member] | Deductions For Amounts Reported Under The Stock Awards [Member] |
|
|
|
| Pay vs Performance Disclosure [Table] |
|
|
|
| Adjustment to Compensation Amount |
556,786
|
481,872
|
412,719
|
| Non-PEO NEO [Member] | Deductions For Amounts Reported Under The Option Awards [Member] |
|
|
|
| Pay vs Performance Disclosure [Table] |
|
|
|
| Adjustment to Compensation Amount |
726,798
|
542,719
|
489,640
|
| Non-PEO NEO [Member] | Increase For Fair Value Of Awards Granted [Member] |
|
|
|
| Pay vs Performance Disclosure [Table] |
|
|
|
| Adjustment to Compensation Amount |
881,351
|
728,082
|
1,096,461
|
| Non-PEO NEO [Member] | Increase Deduction For Change In Fair Value From Prior Year End To Current Year End Of Awards Granted [Member] |
|
|
|
| Pay vs Performance Disclosure [Table] |
|
|
|
| Adjustment to Compensation Amount |
(362,564)
|
(468,507)
|
(187,684)
|
| Non-PEO NEO [Member] | Increase Deduction For Change In Fair Value From Prior Year End To Vesting Date Of Awards Granted [Member] |
|
|
|
| Pay vs Performance Disclosure [Table] |
|
|
|
| Adjustment to Compensation Amount |
$ 64,724
|
$ (78,058)
|
$ (390,698)
|