related to compensation levels and practices. We believe, however, that any such comparison should be merely a point of reference and not the determinative factor for our executives’ compensation. The purpose of the comparison is to inform, but not supplant, the analyses of internal pay equity and individual performance that we consider when making compensation decisions. Accordingly, the Compensation Committee has discretion in determining the nature and extent of its use of comparative compensation information.
When reviewing executive compensation, the Compensation Committee may also consider our company’s performance during the person’s tenure and the anticipated level of compensation that would be required to replace the person with someone of comparable experience and skill. In addition to our periodic compensation review, we also regularly monitor market conditions and may adjust compensation levels as necessary to remain competitive and retain valuable employees.
Impact of Chapter 11 and Depressed Market Conditions
Beginning in 2014, oil prices declined significantly and have remained volatile, our oil and gas customers reduced their capital spending and the offshore drilling market has remained oversupplied with available offshore drilling rigs. These market factors resulted in a sharp decline in the demand for offshore drilling services, including services that we provide, as well as a significant decline in dayrates for contract drilling services. The offshore drilling environment worsened significantly in 2020 because of the
COVID-19
pandemic and a “price war” between Russia and OPEC. The decline in demand for contract drilling services and the dayrates for those services has adversely affected our financial condition, results of operations and cash flows and has resulted in a substantial and protracted decline in our stock price, leading to the filing by us and 14 of our subsidiaries of voluntary petitions for reorganization under chapter 11 of the United States Bankruptcy Code in the United States Bankruptcy Court for the Southern District of Texas on April 26, 2020. In light of these conditions, our Compensation Committee has continuously re-evaluated
and, as necessary, revised our compensation programs to make the programs more effective and responsive in achieving their intended reward, retention and incentive goals in the depressed market. Elements of Compensation
In 2020, the principal components of compensation for our named executive officers were:
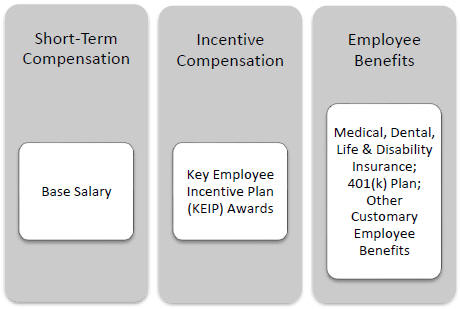
Base Salary
The position of each of our salaried employees, including our named executive officers, is assigned a salary grade at the commencement of employment. The salary grade, which is reviewed periodically, considers objective criteria relevant to the position, such as the position’s level of financial and operational responsibility and supervisory duties, as well as the education and skills required to perform the functions of the position. Each salary
8