SECURITIES AND EXCHANGE COMMISSION
| ◻ |
REGISTRATION STATEMENT PURSUANT TO SECTION 12(b) OR (g) OF THE SECURITIES EXCHANGE ACT OF 1934
|
| ☑ |
ANNUAL REPORT PURSUANT TO SECTION 13 OR 15(d) OF THE SECURITIES EXCHANGE ACT OF 1934
|
| ◻ |
TRANSITION REPORT PURSUANT TO SECTION 13 OR 15(d) OF THE SECURITIES EXCHANGE ACT OF 1934
|
| ◻ |
SHELL COMPANY REPORT PURSUANT TO SECTION 13 OR 15(d) OF THE SECURITIES EXCHANGE ACT OF 1934
|
(Name, Telephone, E-mail and/or Facsimile number and Address of Company Contact Person)
|
Title of each class
|
Trading Symbol
|
Name of each exchange on which registered
|
||
|
Ordinary Shares, par value NIS 10.00 per share
|
ELLO
|
NYSE American LLC
|
|
Large accelerated filer ☐
|
Accelerated filer ☑
|
Non-accelerated filer ☐
|
Emerging growth company ☐
|
| 1 |
Does not include a total of 258,046 ordinary shares held at that date as treasury shares under Israeli law, all of which were repurchased by Ellomay. For so long as such treasury shares are owned by Ellomay they have no rights and,
accordingly, are neither eligible to participate in or receive any future dividends which may be paid to Ellomay’s shareholders nor are they entitled to participate in, be voted at or be counted as part of the quorum for, any meetings of
Ellomay’s shareholders.
|
|
U.S. GAAP ☐
|
International Financial Reporting Standards as issued ☑
by the International Accounting Standards Board
|
Other ☐
|
|
Page
|
||
|
6
|
||
|
7
|
||
|
Part I
|
||
|
10
|
||
|
10
|
||
|
10
|
||
|
34
|
||
|
109
|
||
|
110
|
||
|
132
|
||
|
157
|
||
|
163
|
||
|
165
|
||
|
165
|
||
|
186
|
||
|
188
|
||
|
Part II
|
||
|
188
|
||
|
188
|
||
|
188
|
||
|
189
|
||
|
189
|
||
|
190
|
||
|
191
|
||
|
191
|
||
| Item 16F: | Change in Registrant’s Certifying Accountants | 191 |
| Item 16G: | Corporate Governance | 191 |
| Item 16H: | Mine Safety Disclosure | 192 |
|
|
|
|
|
Part III
|
||
|
192
|
||
|
192
|
||
|
193
|
||

| • |
risks related to projects that are in the development stage, among other issues due to the inability to obtain or maintain licenses or project finance and to regulatory
requirements;
|
| • |
our EPC contractors’ technical, professional and financial ability to construct, install, test and commission a renewable energy plant;
|
| • |
changes in the prices of electricity;
|
| • |
our contractors’ technical, professional and financial ability to deliver on and comply with their operation and maintenance, or O&M, undertakings in connection with
the operation of our renewable energy plants;
|
| • |
the effects of the Covid-19 pandemic on the development, construction and operation of projects, including in connection with actions taken by governments and
authorities, delays in construction due to quarantine and other measures, changes in regulation, changes in the price of electricity and in the consumption of electricity;
|
| • |
dependency on the availability of financial incentives and government subsidies and on governmental regulations for our operating renewable energy projects and the
potential reduction or elimination, including retroactive amendments, of the government subsidies and economic incentives applicable to, or amendments to regulations governing the, renewable energy markets in which we operate or to which
we may in the future enter;
|
| • |
defects in the components of the renewable energy plants we operate;
|
| • |
risks relating to operations in foreign countries, including cross currency movements, payment cycles and tax issues;
|
| • |
changes in the prices of the components or raw materials required for the production of renewable energy;
|
| • |
the market, economic and political factors in the countries in which we operate;
|
| • |
weather conditions and various meteorological and geographic factors;
|
| • |
our ability to maintain and gain expertise in the energy market, and to track, monitor and manage the projects which we have undertaken;
|
| • |
our ability to meet our undertakings under various financing agreements, including to our debenture holders, and our ability to raise additional equity or debt financing
in the future;
|
| • |
future disagreements with our partners who own a portion of the renewable energy plants;
|
| • |
the risks we are exposed to due to our holdings in U. Dori Energy Infrastructures Ltd. and Dorad Energy Ltd.;
|
| • |
the risks we are exposed to due to our involvement in Waste-to-Energy, or WtE, projects in the Netherlands;
|
| • |
fluctuations in the value of currency and interest rates;
|
| • |
the price and market liquidity of our ordinary shares;
|
| • |
the fact that we may be deemed to be an “investment company” under the Investment Company Act of 1940 under certain circumstances (including due to the investments of
assets following the sale of our business), and the risk that we may be required to take certain actions with respect to the investment of our assets or the distribution of cash to
shareholders in order to avoid being deemed an “investment company”;
|
| • |
our plans with respect to the management of our financial and other assets and our ability to identify, evaluate and consummate additional suitable business
opportunities and strategic alternatives; and
|
| • |
the resolution of existing litigation and the possibility of future litigation.
|
(in thousands except per share and share data)
|
Year ended December 31,
|
||||||||||||||||||||||||
|
2020
|
2019
|
2018
|
2017
|
2016
|
2020
|
|||||||||||||||||||
|
euro
|
Convenience Translation into US$(1)
|
|||||||||||||||||||||||
|
Revenues
|
9,645
|
18,988
|
18,117
|
13,636
|
11,632
|
11,832
|
||||||||||||||||||
|
Operating expenses
|
(4,951
|
)
|
(6,638
|
)
|
(6,342
|
)
|
(2,549
|
)
|
(2,082
|
)
|
(6,074
|
)
|
||||||||||||
|
Depreciation and amortization expenses
|
(2,975
|
)
|
(6,416
|
)
|
(5,816
|
)
|
(4,518
|
)
|
(4,411
|
)
|
(3,650
|
)
|
||||||||||||
|
Gross profit
|
1,719
|
5,934
|
5,959
|
6,569
|
5,139
|
2,108
|
||||||||||||||||||
|
Project development costs
|
(3,491
|
)
|
(4,213
|
)
|
(2,878
|
)
|
*(2,739
|
)
|
*(2,201
|
)
|
(4,283
|
)
|
||||||||||||
|
General and administrative expenses
|
(4,512
|
)
|
(3,827
|
)
|
(3,600
|
)
|
*(2,420
|
)
|
*(2,032
|
)
|
(5,535
|
)
|
||||||||||||
|
Share of profits of equity accounted investee
|
1,525
|
3,086
|
2,545
|
1,531
|
1,375
|
1,871
|
||||||||||||||||||
|
Other income (expenses), net
|
2,100
|
(2,100
|
)
|
884
|
18
|
90
|
2,576
|
|||||||||||||||||
|
Capital gain
|
-
|
18,770
|
-
|
-
|
-
|
-
|
||||||||||||||||||
|
Operating profit
|
(2,659
|
)
|
17,650
|
2,910
|
2,959
|
2,371
|
(3,263
|
)
|
||||||||||||||||
|
Financing income
|
2,134
|
1,827
|
2,936
|
1,333
|
263
|
2,618
|
||||||||||||||||||
|
Financing income (expenses) in connection with derivatives, net
|
1,094
|
897
|
494
|
(3,156
|
)
|
636
|
1,342
|
|||||||||||||||||
|
Financing expenses
|
(6,862
|
)
|
(10,877
|
)
|
(5,521
|
)
|
(7,405
|
)
|
(3,333
|
)
|
(8,418
|
)
|
||||||||||||
|
Financing income (expenses), net
|
(3,634
|
)
|
(8,153
|
)
|
(2,091
|
)
|
(9,228
|
)
|
(2,434
|
)
|
(4,458
|
)
|
||||||||||||
|
Profit (loss) before taxes on income
|
(6,293
|
)
|
9,497
|
819
|
(6,269
|
)
|
(63
|
)
|
(7,721
|
)
|
||||||||||||||
|
Tax benefit (taxes on income)
|
125
|
287
|
(215
|
)
|
(372
|
)
|
(569
|
)
|
153
|
|||||||||||||||
|
Profit (loss) for the year
|
(6,168
|
)
|
9,784
|
604
|
(6,641
|
)
|
(632
|
)
|
(7,568
|
)
|
||||||||||||||
|
Profit (Loss) attributable to:
|
||||||||||||||||||||||||
|
Owners of the Company
|
(4,627
|
)
|
12,060
|
1,057
|
(6,115
|
)
|
(209
|
)
|
(5,676
|
)
|
||||||||||||||
|
Non-controlling interests
|
(1,541
|
)
|
(2,276
|
)
|
(453
|
)
|
(526
|
)
|
(423
|
)
|
(1,892
|
)
|
||||||||||||
|
Profit (loss) for the year
|
(6,168
|
)
|
9,784
|
604
|
(6,641
|
)
|
(632
|
)
|
(7,568
|
)
|
||||||||||||||
|
Other comprehensive income (loss) items that after initial recognition in comprehensive income (loss) were
|
||||||||||||||||||||||||
|
or will be transferred to profit or loss:
|
||||||||||||||||||||||||
|
Foreign currency translation differences for foreign operations
|
(482
|
)
|
2,103
|
(787
|
)
|
(359
|
)
|
692
|
(591
|
)
|
||||||||||||||
|
Effective portion of change in fair value of cash flow hedges
|
2,210
|
1,076
|
(1,008
|
)
|
(1,244
|
)
|
-
|
2,711
|
||||||||||||||||
|
Net change in fair value of cash flow hedges transferred to profit or loss
|
555
|
(1,922
|
)
|
643
|
1,382
|
-
|
681
|
|||||||||||||||||
|
Total other comprehensive income (loss)
|
2,283
|
1,257
|
(1,152
|
)
|
(221
|
)
|
692
|
2,801
|
||||||||||||||||
|
Total comprehensive income (loss) for the year
|
(3,885
|
)
|
11,041
|
(548
|
)
|
(6,862
|
)
|
60
|
(4,767
|
)
|
||||||||||||||
|
Basic earnings (loss) per share
|
(0.38
|
)
|
1.09
|
0.10
|
(0.57
|
)
|
(0.02
|
)
|
(0.47
|
)
|
||||||||||||||
|
Diluted earnings (loss) per share
|
(0.38
|
)
|
1.09
|
0.10
|
(0.57
|
)
|
(0.02
|
)
|
(0.47
|
)
|
||||||||||||||
|
Weighted average number of shares used for computing basic earnings (loss) per share
|
12,304,269
|
11,064,847
|
10,675,508
|
10,675,757
|
10,667,700
|
12,304,269
|
||||||||||||||||||
|
Weighted average number of shares used for computing diluted earnings (loss) per share
|
12,327,818
|
11,070,436
|
10,678,857
|
10,675,757
|
10,667,700
|
12,327,818
|
||||||||||||||||||
|
Year ended December 31,
|
||||||||||||||||||||||||
|
2020
|
2019
|
2018
|
2017
|
2016
|
2020
|
|||||||||||||||||||
|
euro
|
Convenience Translation into US$(1)
|
|||||||||||||||||||||||
|
EBITDA*
|
316
|
24,066
|
8,726
|
7,477
|
6,782
|
387
|
||||||||||||||||||
| * |
EBITDA is a non-IFRS measure and is defined as earnings before financial expenses, net, taxes, depreciation and amortization. We present this measure to enhance the understanding of our historical financial performance and to enable
comparability between periods. While we consider EBITDA to be an important measure of comparative operating performance, EBITDA should not be considered in isolation or as a substitute for net income or other statement of operations or cash
flow data prepared in accordance with IFRS as a measure of profitability or liquidity. EBITDA does not take into account our commitments, including capital expenditures and restricted cash and, accordingly, is not necessarily indicative of
amounts that may be available for discretionary uses. Not all companies calculate EBITDA in the same manner, and the measure as presented may not be comparable to similarly-titled measures presented by other companies. Our EBITDA may not be
indicative of our historic operating results; nor is it meant to be predictive of potential future results.
|
|
Year ended December 31,
|
||||||||||||||||||||||||
|
2020
|
2019
|
2018
|
2017
|
2016
|
2020
|
|||||||||||||||||||
|
euro
|
Convenience Translation into US$(1)
|
|||||||||||||||||||||||
|
Profit (loss) for the year
|
(6,168
|
)
|
9,784
|
604
|
(6,641
|
)
|
(632
|
)
|
(7,568
|
)
|
||||||||||||||
|
Financing expenses (income), net
|
3,634
|
8,153
|
2,091
|
9,228
|
2,434
|
4,458
|
||||||||||||||||||
|
Taxes on income (tax benefit)
|
(125
|
)
|
(287
|
)
|
215
|
372
|
569
|
(153
|
)
|
|||||||||||||||
|
Depreciation and amortization
|
2,975
|
6,416
|
5,816
|
4,518
|
4,411
|
3,650
|
||||||||||||||||||
|
EBITDA
|
316
|
24,066
|
8,726
|
7,477
|
6,782
|
387
|
||||||||||||||||||
|
At December 31,
|
||||||||||||||||||||||||
|
2020
|
2019
|
2018
|
2017
|
2016
|
2020
|
|||||||||||||||||||
|
euro
|
Convenience Translation into US$(1)
|
|||||||||||||||||||||||
|
Working capital
|
42,883
|
45,436
|
35,675
|
31,286
|
22,402
|
52,607
|
||||||||||||||||||
|
Total assets
|
460,172
|
310,172
|
211,160
|
198,088
|
148,464
|
564,530
|
||||||||||||||||||
|
Total liabilities
|
335,146
|
202,606
|
134,203
|
120,588
|
64,093
|
411,150
|
||||||||||||||||||
|
Total equity
|
125,026
|
107,566
|
76,957
|
77,500
|
84,371
|
153,380
|
||||||||||||||||||
|
Capital stock
|
105,767
|
(2)
|
84,422
|
(2)
|
76,588
|
(2)
|
76,583
|
(2)
|
76,592
|
(3)
|
129,753
|
(2)
|
||||||||||||
|
Ordinary shares outstanding
|
12,910,140
|
(2)
|
11,737,140
|
(2)
|
10,675,508
|
(2)
|
10,675,508
|
(2)
|
10,677,370
|
(3)
|
12,910,140
|
(2)
|
||||||||||||
| 1. |
The euro figures at December 31, 2020, and for the period then ended have been translated throughout this report into U.S. dollars using the representative exchange rate of the dollar at December 31, 2020 (euro 1 = US$1.227). The
translation was made solely for convenience, is supplementary information, and is distinguished from the financial statements. The translated dollar figures should not be construed as a representation that the European currency amounts
actually represent, or could be converted into, U.S. dollars.
|
| 2. |
Net of 258,046 treasury shares.
|
| 3. |
Net of 256,184 treasury shares.
|
| • |
As the raw materials used to produce energy in the WtE market are not freely available (as is the case with wind and solar energies), the success of a WtE plant depends, among other things, on the prices of
feedstock required in order to maintain the optimal mix of feedstock necessary to maximize performance of the plants, in order to meet a certain of range of energy (gas, electricity or heat) production levels. In order to ensure
continuous supply of raw materials, both in terms of the quantity and the quality and composition of the raw materials, the WtE plant is required to enter into supply relationships with several feedstock suppliers, such as farmers, food
manufacturers and other specialized feedstock suppliers and to continuously monitor the proposed sales in order to locate the most efficient and beneficial offers. Any increase in the price of feedstock or shortage in the type or
quality of feedstock required to produce the desired energy levels with the technology used by the plant could slow down or halt operations, causing a material adverse effect on the results of operations. The price and quality of a
range of a certain feedstock mix might also increase the plant’s operating costs, either due to the need to purchase a more expensive feedstock mix in order to meet the desired energy production levels, or due to increase in the amounts
of residues and the resulting increase of surplus quantities that require removal. In addition to the impact of the quality of the feedstock on the production levels, maintaining and monitoring the feedstock quality is crucial for
preventing malfunctions in the process, for example due to high levels of certain chemicals that might harm the CHP engines. Additionally, a wrong feedstock mix and/or low feedstock quality might create biology problems such as lower
bacteria population, which directly adversely impacts the biogas production. Therefore, any shortage of quality feedstock and changes in the feedstock mix available for use could have a material adverse effect on the results of
operations of our WtE plants.
|
| • |
The WtE industry is subject to many laws and regulations which govern the protection of the environment, quality control standards, health and safety requirements, and the management, transportation and disposal of different types of
waste. Environmental laws and regulations may require removal or remediation of pollutants and may impose civil and criminal penalties for violations. The costs arising from compliance with environmental laws and regulations may increase
operating costs for our WtE plants and we may be exposed to penalties for failure to comply with such laws and regulations. In addition, existing regulation governing waste management and waste disposal provide incentives to feedstock
suppliers to use waste management solutions such as the provision of feedstock to WtE plants. Any regulatory changes that impose additional environmental restrictions on the WtE industry or that relieve feedstock suppliers from the
stringent regulation concerning waste management and disposal could increase our operating costs, limit or change the cost of the feedstock available to us, and adversely affect our results of operations.
|
| • |
The operation of the Dorad Power Plant is highly complex and depends upon the continued ability: (i) to operate the various turbines, and (ii) to turn the turbines on and shut them down quickly based on demand. The profitability of
Dorad also depends on the accuracy of the proprietary forecasting system used by Dorad. Any defects or disruptions, or inaccuracies in forecasts, may result in an inability to provide the amount of electricity required by Dorad’s
customers or in over-production, both of which could have a material adverse effect on Dorad’s operations and profitability.
|
| • |
Dorad’s operations depend upon the expertise and success of its operations and maintenance contractor, who is responsible for the day-to-day operations of the Dorad Power Plant. If the services provided by such contractor will cause
delays in the production of energy or any other damage to the Dorad Power Plant or to Dorad’s customers, Dorad may be subject to claims for damages and to additional expenses and losses and therefore Dorad’s profitability could be adversely
affected.
|
| • |
Significant equipment failures may limit Dorad’s production of energy. Although such damages are generally covered by insurance policies, any such failures may cause disruption in the production, may not all be covered by the insurance
and the correction of such failures may involve a considerable amount of resources and investment and could therefore adversely affect Dorad’s profitability.
|
| • |
The construction of the Dorad Power Plant was mainly financed by a consortium of financing entities pursuant to a long-term credit facility and such credit facility provides for pre-approval by the consortium of certain of Dorad’s
actions and contracts with third parties. Changes in the credit ratings of Dorad and its shareholders, non-compliance with financing and other covenants, delays in provision of required pre-approvals or disagreements with the financial
entities and additional factors may adversely affect Dorad’s operations and profitability.
|
| • |
Dorad entered into a long-term natural gas supply agreement with the partners in the “Tamar” license, or Tamar, located in the Mediterranean Sea off the coast of Israel. This agreement includes a “take or pay” mechanism, subject to
certain restrictions and conditions that may result in Dorad paying for natural gas not actually required for its operations. In the event Dorad will be required to pay for natural gas that it does not need, Dorad’s results of operations
and profitability could be adversely affected. Tamar is currently (until the agreement regarding the acquisition of natural gas from Energean Israel Ltd., or Energean, becomes effective, as expected by the end of 2021 or the first quarter
of 2022) Dorad’s sole supplier of natural gas and has undertaken to supply natural gas to various customers and is permitted to export a certain amount of the natural gas to customers outside of Israel. Dorad’s operations depend on the
timely, continuous and uninterrupted supply of natural gas from Tamar and on the existence of sufficient reserves throughout the term of the agreement with Tamar. In addition, the price of natural gas under the supply agreement with Tamar
is linked to production tariffs determined by the Israeli Electricity Authority but cannot be lower than the “final floor price” included in the agreement. Due to the reduction in fuel and energy prices and the resulting reduction in the
production tariff during 2019, the price for natural gas under the agreement with Tamar reached the final floor price in January 2020. Therefore, in the event of future reductions in the fuel and energy prices and the production tariff, the
price of gas will not be further reduced. Any delays, disruptions, increases in the price of natural gas under the agreement, or shortages in the gas supply from Tamar will adversely affect Dorad’s results of operations.
|
| • |
The Dorad power plant is subject to environmental regulations, aimed at increasing the protection of the environment and reducing environmental hazards, including by way of imposing restrictions regarding noise, harmful emissions to the
environment and handling of hazardous materials. Currently the costs of compliance with the foregoing requirements are not material. Any breach or other noncompliance with the applicable laws may cause Dorad to incur additional costs due to
penalties and fines and expenses incurred in order to regain compliance with the applicable laws, all of which may have an adverse effect on Dorad’s profitability and results of operations.
|
| • |
Due to the agreements with contractors of the Dorad Power Plant and the indexation included in the gas supply agreement, Dorad is exposed to changes in the exchange rates of the U.S. dollar against the NIS. To minimize this exposure
Dorad executed forward transactions to purchase U.S. dollars against the NIS. In addition, due to the indexing to the Israeli consumer price index under Dorad’s credit facility, it is exposed to fluctuations in the Israeli CPI, which may
adversely affect its results of operations and profitability. Dorad’s profitability might be adversely affected due to future changes in exchange rates or in the Israeli consumer price index.
|
| • |
Dorad is involved in several arbitration and court proceedings initiated by Dorad’s shareholders, including Dori Energy, most recently in connection with Dorad’s examination of the possible expansion of the Dorad Power Plant, or the
“Dorad 2” project. Disagreements and disputes among shareholders may interfere with Dorad’s operations and specifically with Dorad’s business plan and potential growth.
|
| • |
The Covid-19 crisis affects Dorad’s customers (which include hotels and other industrial customers), and therefore any decrease in electricity consumption by Dorad’s customers and in Israel generally (affecting the amount of electricity
purchased by the IEC from Dorad), may affect Dorad’s financial results. During 2020, Dorad reported a certain decrease in consumption of electricity by its customers and by the IEC due to the Covid-19 crisis, which did not have a material
impact on Dorad as of December 31, 2020, and it is continuously examining the options available to it in the event of a material impact on in its revenues as a result of the spread of Covid-19.
|
| • |
increasing our vulnerability to adverse economic, industry or business conditions and cross currency movements and limiting our flexibility in planning for, or reacting to, changes in our industry and the economy in general;
|
| • |
requiring us to dedicate a substantial portion of our cash flow from operations to service our debt, thus reducing the funds available for operations and future business development; and
|
| • |
limiting our ability to obtain additional financing to operate, develop and expand our business.
|
| • |
Reliability - Solar energy production does not require fossil fuels and is therefore less dependent on this limited natural resource with volatile prices. Although there is variability in the amount and timing of sunlight over the day,
season and year, a properly sized and configured system can be designed to be highly reliable while providing long-term, fixed price electricity supply.
|
| • |
Convenience - Solar power systems can be installed on a wide range of sites, including small residential roofs, the ground, covered parking structures and large industrial buildings. Most solar power systems also have few, if any, moving
parts and are generally guaranteed to operate for 20-25 years, resulting in low maintenance and operating costs and reliability compared to other forms of power generation.
|
| • |
Cost-effectiveness - While solar power has historically been more expensive than fossil fuels, there are continual advancements in solar panel technology which increase the efficiency and lower the cost of production, thus making the
production of solar energy even more cost effective.
|
| • |
Environmental - Solar power is one of the cleanest electric generation sources, capable of generating electricity without air or water emissions, noise, vibration, habitat impact or waste generation. In particular, solar power does not
generate greenhouse gases that contribute to global climate change or other air pollutants, as power generation based on fossil fuel combustion does, and does not generate radioactive or other wastes as nuclear power and coal combustion do.
It is anticipated that environmental protection agencies will limit the use of fossil fuel based electric generation and increase the attractiveness of solar power as a renewable electricity source.
|
| • |
Security - Producing solar power improves energy security both on an international level (by reducing fossil energy purchases from hostile countries) and a local level (by reducing power strains on local electrical transmission and
distribution systems).
|

|
Name
|
Installed Production / Capacity1
|
Location
|
Type of Plant
|
Connection to Grid
|
Fixed Tariff
|
Revenue in the year ended December 31, 2019 (in thousands)2
|
Revenue in the year ended December 31, 2020 (in thousands)2
|
|
“Rinconada II”
|
2,275 kWp
|
Municipality of Córdoba, Andalusia, Spain
|
PV – Fixed Panels
|
July 2010
|
N/A
|
€871
|
€732
|
|
“Rodríguez I”
|
1,675 kWp
|
Province of Murcia, Spain
|
PV – Fixed Panels
|
November 2011
|
N/A
|
€612
|
€531
|
|
“Rodríguez II”
|
2,691 kWp
|
Province of Murcia, Spain
|
PV – Fixed Panels
|
November 2011
|
N/A
|
€1,010
|
€882
|
|
“Fuente Librilla”
|
1,248 kWp
|
Province of Murcia, Spain
|
PV – Fixed Panels
|
June 2011
|
N/A
|
€494
|
€432
|
|
“Talmei Yosef”
|
9,000 kWp
|
Talmei Yosef, Israel
|
PV – Fixed Panels
|
November 2013
|
0.98573 (NIS/kWh)
|
€1,1334
|
€1,066
|
|
“Talasol”
|
300,000 kWp
|
Talaván, Cáceres, Spain
|
PV – Fixed Panels
|
December 2020
|
N/A
|
--5
|
--5
|
| 1. |
The actual capacity of a photovoltaic plant is generally subject to a degradation of 0.5%-0.7% per year, depending on climate conditions and quality of the solar panels.
|
| 2. |
These results are not indicative of future results due to various factors, including changes in the climate and the degradation of the solar panels.
|
| 3. |
The tariff of NIS 0.9631/kWh is fixed for a period of 20 years and is updated once a year based on changes to the Israeli CPI of October 2011. The tariff increased from NIS 0.976/kWh in November 2013 to NIS 1.005/kWh in 2020.
|
| 4. |
As a result of the accounting treatment of the Talmei Yosef PV Plant as a financial asset, out of total proceeds from the sale of electricity of approximately €4.1 million for the years ended December 31, 2019 and 2020, only revenues
related to the ongoing operation of the plant in the amount of approximately €1.1 million are recognized as revenues in 2019 and 2020.
|
| 5. |
The Talasol PV Plant is 51% owned by us. As it was connected to the Spanish national grid at the end of December 2020 and achieved PAC in January 2021, no revenues were recorded in connection with this PV Plant for the years ended
December 31, 2019 and 2020.
|
| • |
Development Agreement with a local experienced developer for the provision of development services with respect to photovoltaic greenfield projects from initial processing, obtaining of approvals and clearances with the aim of
reaching “ready to build” status;
|
| • |
an Engineering, Procurement & Construction projects Contract, or an EPC Contract, which governs the installation, testing and commissioning of a photovoltaic plant by the respective Contractor;
|
| • |
an Operation and Maintenance (O&M) Agreement, which governs the operation and maintenance of the photovoltaic plant by the respective Contractor;
|
| • |
a number of ancillary agreements, including:
|
| • |
one or more “surface rights agreements” or “lease agreements” with the land owners, which provide the terms and conditions for the lease of land on which the photovoltaic plants are constructed and operated;
|
| • |
Standard “power distribution agreements” with the applicable Spanish power distribution grid company such as Endesa Distribución Eléctrica, S.L.U., or Endesa, or Iberdrola Distribución Eléctrica, S.A.U., or Iberdrola, regarding the
rights and obligations of each party, concerning, inter alia, the evacuation of the power generated in the plant to the grid;
|
| • |
Standard “representation agreements” with an entity that will act as the energy sales agent of the PV Plant in the energy market, in accordance with Spanish Royal Decree 436/2004; and
|
| • |
Assignment Contract (“contrato de encargo de proyecto”) and the Technical Access Contract (“Contracto técnico de acceso a la red de transporte") with Red Eléctrica de España (the Spanish grid operator, or REE).
|
| • |
A power purchase agreement with the IEC for the purchase of electricity by the IEC with a term of 20 years commencing on the date of connection to the grid.
|
| • |
to the extent the FiT or any other incentive will be applicable - standard “incentive agreements” with GSE, Italy’s energy regulation agency responsible, inter alia, for incentivizing and
developing renewable energy sources in Italy and purchasing energy and re-selling it on the electricity market. Under such agreements, it is anticipated that GSE will grant the applicable FiT governing the purchase of electricity (FiTs are
further detailed in “Material Effects of Government Regulations on the Italian PV Plants”);
|
| • |
one or more “power purchase agreements” with GSE, specifying the power output to be purchased by GSE for resale and the consideration in respect thereof or, alternatively, a “power purchase agreements” with a private energy broker,
specifying the power output to be purchased for resale and the consideration in respect thereof; and
|
| • |
one or more “interconnection agreements” with the Enel Distribuzione S.p.A, or ENEL, the Italian national electricity grid operator, which provide the terms and conditions for the connection to the Italian national grid.
|
| • |
optionally, one or more “project financing agreements” with financing entities, as were already executed with respect to several of the PV Plants and as more fully described below, and as may be executed in the future with respect to one
or more of the remaining PV Plants; and
|
| • |
a stock purchase agreement in the event we acquire an existing company that owns a photovoltaic plant that is under construction or is already constructed.
|
| • |
by way of sale on the electricity market (Italian Power Exchange IPEX), the so called “Borsa Elettrica”;
|
| • |
through bilateral contracts with wholesale dealers; and
|
| • |
via the so-called “Dedicated Withdrawal” introduced by AEEGSI Resolution no. 280/07 and subsequent amendments. This is the most common way of selling electricity, as it affords direct and quick negotiations with the national energy
handler (GSE), which will in turn deal with energy buyers on the market.
|
|
Plant Type
|
Power level (kW)
|
Reference Tariff
(€/MWh)
|
A2 plants Bonus (€/MWh)
|
Bonus for self-consumption (€/MWh)
|
|
Group A
|
20 <P ≤100
|
105
|
-
|
10
|
|
100 <P ≤1000
|
90
|
-
|
-
|
|
|
P>1000
|
70
|
-
|
-
|
|
|
Group A2
|
20 <P ≤100
|
105
|
12
|
10
|
|
100 <P ≤1000
|
90
|
12
|
-
|
|
(i)
|
The so called “Fare 2” Decree
|
| • |
a measure consisting of granting the option to access a new revised incentive plan. This specific provision applies to producers of renewable energy and owners of plants to which the
“all-inclusive tariff” (tariffa omnicomprensiva) or certain “Green Certificates” (certificati verdi) apply and provides an alternative incentive system for
production of renewable energy, which can be activated voluntarily on demand of each producer. The latter must choose either to continue maintaining the same incentive regime for the remaining period of duration of the plan, or access a new
plan, enforced for the remaining duration of the plan extended by 7 years, but with a correspondent reduction in the nominal amount of the incentive, in a percentage which varies based on, inter alia, the remaining duration of the plan and
the type of energy source.
|
| • |
a replacement, starting from January 1, 2014, of the minimum guaranteed prices currently foreseen under the Italian mandatory purchase regime with the zonal hourly prices set out for each specific area (so called prezzi zonali orari, i.e. the average monthly price, correspondent to each hour, as resulting from the electric market price on the area where the PV plant is located). The replacement of minimum guaranteed prices with
zonal prices applies to PV plants exceeding 100kWp.
|
| • |
For photovoltaic plants with an installed capacity of up to and including 100 kW – the minimum price, as defined by AEEGSI; and
|
| • |
For photovoltaic plants with installed capacity higher than 100 kW – the hourly zonal price.
|
|
(ii)
|
Minimum Guaranteed Prices determined by AEEGSI
|
|
(iii)
|
AAEG resolution 36/E on depreciation of PV Plants
|
|
(iv)
|
Imbalance costs under AEEGSI Resolution n. 281/2012
|
| (i) |
imbalance costs are to be borne by the owners of PV plants, in an amount calculated by multiplying the discrepancy of the production forecast by a fixed parameter;
|
| (ii) |
in the case that the owner of the PV plant is party to the GSE mandatory purchase regime, administrative costs borne by GSE in connection with forecast services are to be charged on the owner.
|
| 1. |
application of the actual imbalancing (i.e., the difference, hour by hour, between the measurement of the energy delivered/withdrawn into the grid in one day and the final delivery/withdrawal program as a consequence of the closing of
the Electrical Markets and the Dispatchment Services Market).
In other words, based on the first option, production units powered by non-programmable renewable energy are subject to the same criteria of determination of imbalancing (regolazione
di valorizzazione degli sbilanciamenti) applicable to the programmable ones.
|
| 2. |
sum of three components, which are a result of the application:
|
| • |
to the actual imbalancing which falls within the tolerated thresholds of the price equal to that provided under section 40.3 of Resolution AEEGSI SI 111/06, as amended by Resolution 522/2014/R/eel; and
|
| • |
to the actual imbalancing exceeding the tolerated thresholds of the price equal to that provided under section 30.4(b) of Resolution AEEGSISI 111/06, as amended by Resolution 522/2014/R/eel.
|
| • |
to the actual imbalancing which falls within the tolerated thresholds, considered as an absolute value, of an imbalancing price equal to the area quota. The area quota must be intended as the ratio between the imbalancing costs which
have not been allocated pursuant to the two aforementioned points and the sum of the absolute values of imbalancing costs, which fall within the tolerated thresholds.
|
|
(v)
|
Law 116/2014 on the tariff cuts
|
|
(i)
|
a reduction of 8% in the FiT for photovoltaic plants with nominal capacity above 900 kW, a reduction of 7% in the FiT for photovoltaic plants with nominal capacity between 500 kW and 900 kW and a reduction of 6% in the FiT for
photovoltaic plants with nominal capacity between 200 kW and 500 kW (i.e., out of the twelve Italian photovoltaic plants owned by us, eight would be subject to a reduction of 8% in the FiT and four would be subject to a reduction of 7% in
the FiT);
|
|
(ii)
|
extending the 20-year term of the FiT to 24 years with a reduction in the FiT in a range of 17%-25%, depending on the time remaining on the term of the FiT for the relevant photovoltaic plant, with higher reductions applicable to
photovoltaic plants that commenced operations earlier (based on the remaining years in the initial guaranteed FiT period of our existing Italian photovoltaic plants, the expected reduction in the FiT for the our photovoltaic plants would
have been approximately 19%);
|
|
(iii)
|
a rescheduling in the FiT so that during an initial period the FiT is reduced and during the second period the FiT is increased in the same amount of the reduction with the goal to guarantee an annual saving of at least €600 million by
the Italian public between 2015 and 2019, assuming all photovoltaic operators opt for this alternative); or
|
|
(iv)
|
the beneficiaries of FiT incentive schemes can sell up to 80% of the revenues deriving from the incentives generated by the photovoltaic plant to a selected buyer to be identified among the top EU banks. The selected buyer will become
eligible to receive the original FiT and will not be subject to the changes set forth in alternatives (i) through (iii) above.
|
|
A.
|
Measures on revamping interventions, which provide in particular that in order for a plant to continue benefitting from incentives, such interventions:
|
|
(i)
|
shall not entail an increase of more than 1% (5% for plants up to 20 kWp) of the nominal power of the plant or its single units;
|
| (ii) |
shall use new or regenerated components, in the case of definitive replacements; and
|
| (iii) |
shall be communicated to GSE within 60 days.
|
|
B.
|
Measures on the so called “fake fractioning”, providing in particular that in the case that two or more plants are:
|
| (i) |
fed by the same renewable source;
|
| (ii) |
owned by the same entity or by entities belonging to the same group; and
|
| (iii) |
built on the same plot or on bordering plots;
|
| (i) |
re-determine the applicable tariff, if the procedures on tariff admission were complied with notwithstanding the fake fractioning; or
|
| (ii) |
declare the retrospective forfeiture from the tariff, if the procedures on tariff admission were not complied with as a result of the fake fractioning.
|
| (i) |
It introduces three principles in the activity of self-consumption: (i) the right to self-consume electricity without charges; (ii) the right to shared self-consumption by one or more consumers to take advantage of economies of
scale; and (iii) administrative and technical simplification.
|
| (ii) |
Any consumer – whether or not a direct consumer of the market – may acquire energy through bilateral contracting with a producer.
|
| (iii) |
Regarding access and connection permits: (i) the validity of the access and connection permissions granted prior to the entry into force of Law 24/2013 is extended and the aforementioned permits will expire if they have not obtained the
authorization of exploitation, on the later of: (a) before March 31, 2020, or (b) five years from the obtaining of the right of access and connection; (ii) the guarantees to be placed for the access and connection permits are increased from
€10/kW to €40/kW; (iii) with regards to the actions carried out in the transport or distribution networks by the owners of the access and connection permits which must be developed by the grid operator or distributor, the promoter must
advance 10% of the total investment value to be undertaken within a period not exceeding 12 months. Once the aforementioned amount has been paid and the administrative authorization for the generation facility has been obtained, its holder
shall, within four months, enter into an Assignment Contract with the transportation grid operator or distributor, otherwise, the validity of the access and connection permits will expire.
|
| • |
Request of connection permit required in 6 months.
|
| • |
Valid request of Prior Administrative Authorization required in 6 months.
|
| • |
Obtention of environmental permit required in 22 months.
|
| • |
Obtention of Prior Administrative Authorization required in 25 months.
|
| • |
Obtention of Construction Administrative Authorization required in 28 months.
|
| • |
Obtention of Exploitation Authorization required in 5 years.
|
| 1. |
Royal Decree 413/2014 which regulates electricity generation activity using renewable energy sources, cogeneration and waste, or RD 413/2014.
|
| 2. |
Order IET/1045/2014 approving the retribution parameters for certain types of generation facilities of electricity from renewable energy sources, cogeneration and waste facilities, or Order 1045/2014.
|
| 3. |
Order ETU/130/2017 updating the retribution parameters for certain types of generation facilities of electricity from renewable energy sources, cogeneration and waste facilities, for the purposes of their application to the Regulatory
Semi-period beginning on January 1, 2017 and ending on December 31, 2019, or Order 130/2017.
|
| 4. |
RDL 17/2019, adopting urgent measures for the necessary adaptation of remuneration parameters affecting the electricity system and responding to the process of cessation of activity of thermal generation plants.
|
| 5. |
Order TED/171/2020, updating the retribution parameters for certain types of generation facilities of electricity from renewable energy sources, cogeneration and waste facilities, for the purposes of their application to the Regulatory
Period beginning on January 1, 2020, or Order 171/2020.
|
| a) |
The Specific Remuneration is calculated by reference to a “standard facility” during its “useful regulatory life”. Order 1045/2014 characterized the
existing renewable installations into different categories (referred to as IT-category). These categories were created taking into account the type of technology, the date of the operating license and the geographical location of renewable
installations.
|
| b) |
According to RD 413/2014, the calculation of the Specific Remuneration of each IT-category shall be performed taking into account the following parameters:
|
|
(i)
|
the standard revenues for the sale of energy production, valued at the production market prices (currently set at €54.42/MWh, €52.12/MWh and €48.82/MWh for 2020, 2021 and 2022, respectively);
|
|
(ii)
|
the standard exploitation costs; and
|
| (iii) |
the standard value of the initial investment. For this calculation, only those costs and investments that correspond exclusively to the electricity production activity will be taken into account. Furthermore, costs or investments
determined by administrative rules or acts that do not apply throughout Spanish territory will not be taken into account.
|
| c) |
Order 1045/2014 established the relevant parameters applicable to each IT-category. Therefore, to ascertain the total amount of the Specific Remuneration applicable to a particular installation it is necessary to (i) identify the
applicable IT-category and (ii) integrate in the Specific Remuneration formula set forth in RD 413/2014 the economic parameters established by Order 1045/2014 for the relevant IT-category and the relevant update regulation (i.e., Order
171/2020).
|
| d) |
The Specific Remuneration is calculated for regulatory periods of six years, each divided into two regulatory semi-periods of three years. The first Regulatory Period commenced July 14, 2013 and terminated on December 31, 2019. The
second Regulatory Period commenced January 1, 2020 and terminates December 31, 2025 (the corresponding first Regulatory Semi-Period ends December 31, 2022).
|
| e) |
The Specific Remuneration is designed to ensure a “reasonable rate of return” or profitability that during the first regulatory period (i.e., until December 2019) shall be equivalent to a Spanish 10-year sovereign bond calculated as the
average of stock price in the stock markets during the months of April, May and June 2013, increased by 300 basis points (7.398% for plants prior to RDL 9/2013). RDL 17/2019 has fixed the reasonable rate of return for the second Regulatory
Period at 7.09%. However, for plants prior to RDL the reasonable rate of return will remain at 7.398% if the conditions set forth in RDL 17/2019 are met (mainly to withdraw from any arbitration procedure, or to renounce any compensation, in
connection with the regulatory changes in Spain that modified the remuneration regime).
|
| f) |
Pursuant to RD 413/2014, the revenues from the Specific Remuneration are set based on the number of operating hours reached by the installation in a given year and adjusted to electricity market price deviations. Furthermore, the
economic parameters of the Specific Remuneration might be reviewed by the Spanish government at the end of a regulatory period or semi-period, however the standard value of the initial investment and the useful regulatory life will remain
unchanged for the entire Regulatory Useful Life of the installation, as determined by Order 1045/2014.
|
| • |
Tamar has committed to supply natural gas to Dorad in an aggregate quantity of up to approximately 11.2 billion cubic meters (BCM), or the Total Contract Quantity, in accordance with the conditions set forth in the Tamar Agreement.
|
| • |
The Tamar Agreement will terminate on the earlier to occur of: (i) sixteen (16) years following the commencement of delivery of natural gas to the Dorad power plant or (ii) the date on which Dorad will consume the Total Contract Quantity
in its entirety. Each of the parties to the Tamar Agreement has the right to extend the Tamar Agreement until the earlier of: (i) an additional year provided certain conditions set forth in the Tamar Agreement were met, or (ii) the date
upon which Dorad consumes the Total Contract Quantity in its entirety.
|
| • |
Dorad has committed to purchase or pay for (“take or pay”) a minimum annual quantity of natural gas in a scope and in accordance with a mechanism set forth in the Tamar Agreement. The Tamar Agreement provides that if Dorad did not use
the minimum quantity of gas as committed, it shall be entitled to consume this quantity every year during the three following years and this is in addition to the minimum quantity of gas Dorad is committed to.
|
| • |
The Tamar Agreement grants Dorad the option to reduce the minimum annual quantity so that it will not exceed 50% of the average annual gas quantity that Dorad will actually consume in the three years preceding the notice of exercise of
the option, subject to adjustments set forth in the Tamar Agreement. The reduction of the minimum annual quantity will be followed by a reduction of the other contractual quantities set forth in the Tamar Agreement. The option described
herein is exercisable during the period commencing as of the later of: (i) the end of the fifth year after the commencement of delivery of natural gas to Dorad in accordance with the Tamar Agreement or (ii) January 1, 2020, and ending on
the later of: (i) the end of the seventh year after the commencement of delivery of natural gas to Dorad in accordance with the Tamar Agreement or (ii) December 31, 2022. In the event Dorad exercises this option, the quantity will be
reduced at the end of a one year period from the date of the notice and until the termination of the Tamar Agreement.
|
| • |
The natural gas price set forth in the Tamar Agreement is linked to the production tariff as determined from time to time by the Israeli Electricity Authority, which includes a “final floor price.” Following the decreases in the price of
fuel and electricity during 2015, the Israeli Electricity Authority reduced the rate of electricity production, and as a result the natural gas price under the Tamar Agreement reached the “final floor price” in March 2016. Commencing
January 1, 2020, the production component rate was decreased by approximately 7.9%, resulting in a decrease of the gas price under the Tamar Agreement to the final floor price and therefore will not be further reduced in the future.
Commencing January 1, 2020, the production component rate was decreased by approximately 4.5%, however due to the floor price arrangement, the gas price was not reduced. Any delays, disruptions, increases in the price of natural gas under
the agreement, or shortages in the gas supply from Tamar will adversely affect Dorad’s results of operations. In addition, as future reductions in the production tariff will not affect the price of natural gas under the agreement with
Tamar, Dorad’s profitability may be adversely affected.
|
| • |
Dorad may be required to provide Tamar with guarantees or securities in the amounts and subject to the conditions set forth in the Tamar Agreement.
|
| • |
The Tamar Agreement includes additional provisions and undertakings as customary in agreements of this type such as compensation mechanisms in the event of shortage in supply, the quality of the natural gas, limitation of liability, etc.
|
|
Plant Title
|
Installed/ production Capacity
|
Location
|
Connection to Grid
|
Revenue in the year ended December 31, 2019 (in thousands)
|
Revenue in the year ended December 31, 2020 (in thousands)
|
|
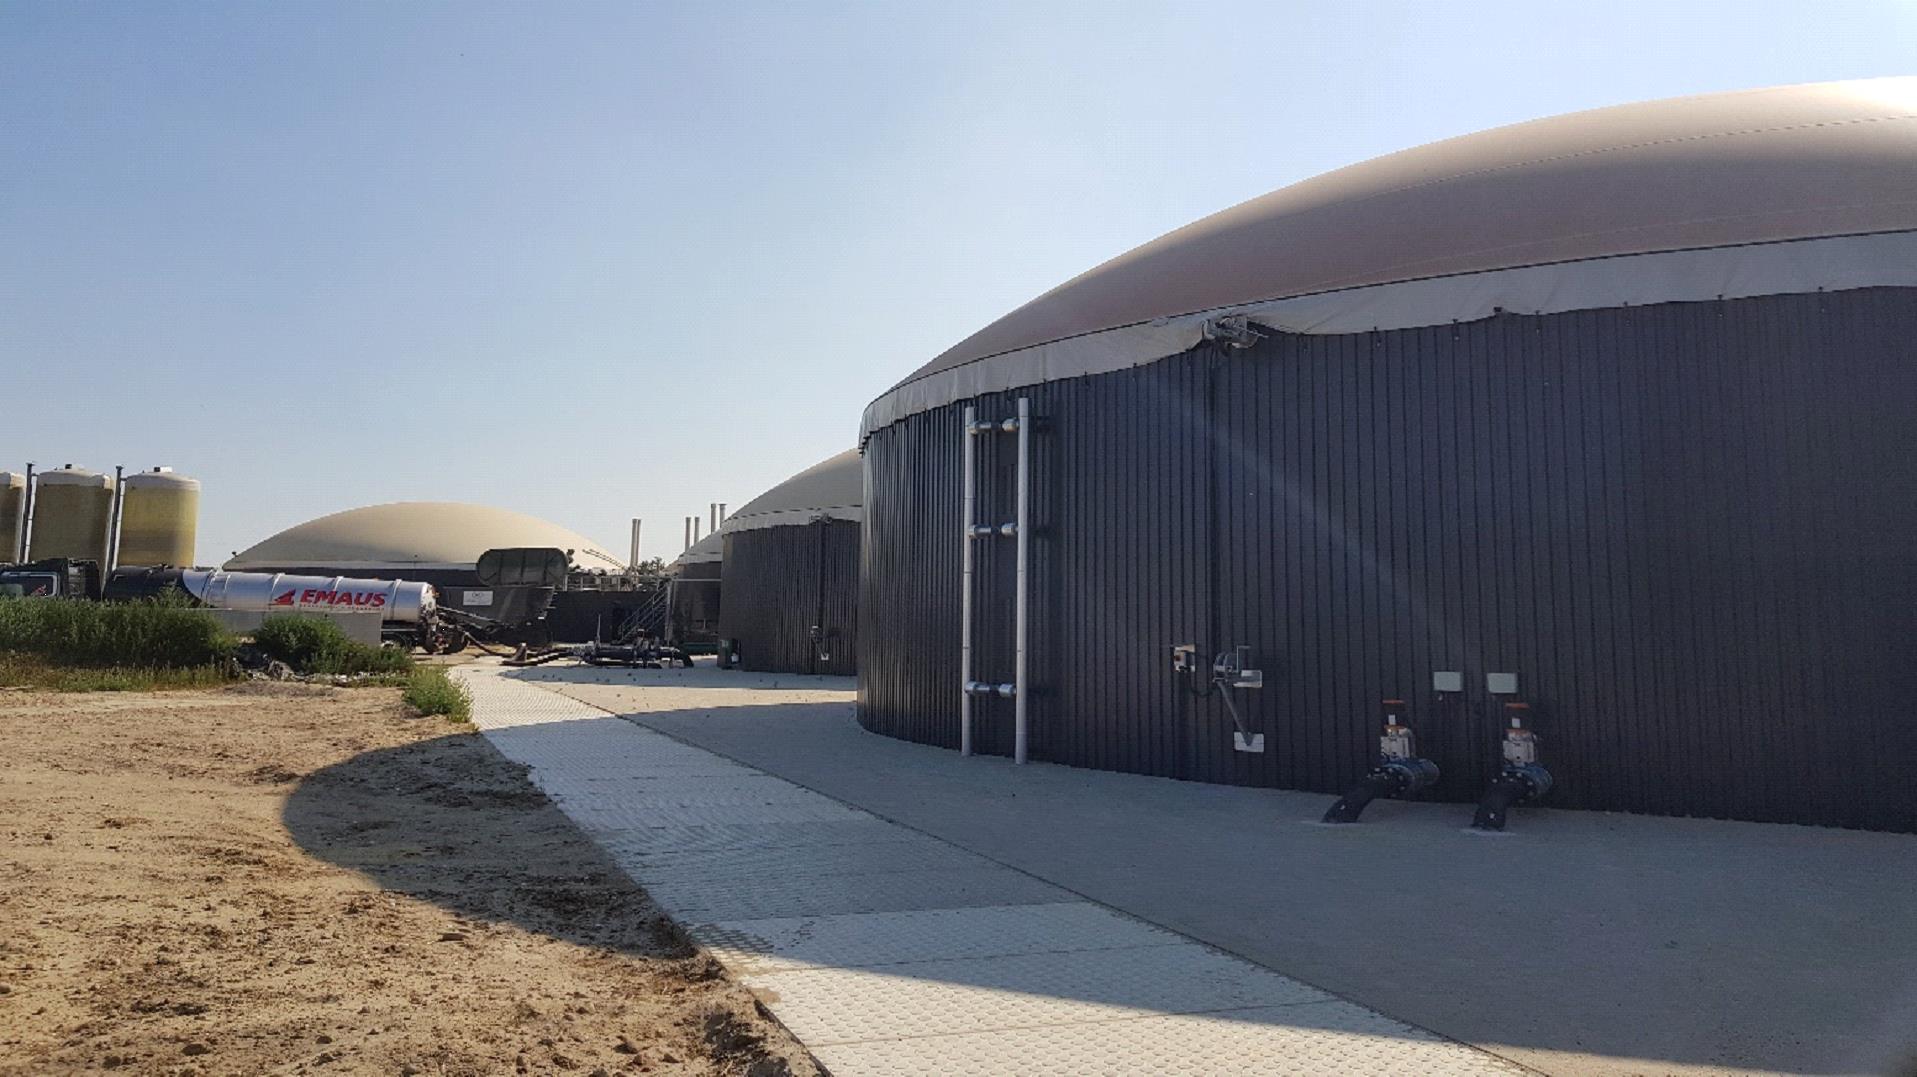
“Groen Gas Goor”
|
3 million Nm3 per year
|
Goor, the Netherlands
|
November 2017
|
€2,314
|
€3,414
|
|
“Groen Gas Oude-Tonge”
|
3.8 million Nm3 per year,
|
Oude-Tonge, the Netherlands
|
June 2018
|
€2,472
|
€2,588
|
|
“Groen Gas Gelderland”
|
7.5 million Nm3 per year1
|
Gelderland, the Netherlands
|
April 2017
|
-2
|
-2
|
| 1. |
This plant’s permit enables it to produce approximately 7.5 million Nm3 per year, however the actual production capacity of the plant is approximately 9.5 million Nm3 per year.
|
| 2. |
This plant was acquired in December 1, 2020, therefore revenues for the period prior to the acquisition are not reflected herein.
|
| • |
Purchase of availability from a licensed private producer;
|
| • |
Payment for availability, start-ups and dynamic benefits;
|
| • |
The plant is required to be under the full control of the system manager (currently the IEC);
|
| • |
Capital and operational tariff for availability – including exchange rate linkage, indexes and interests;
|
| • |
During the first eighteen years of its operation, the plant shall be entitled to capital and operational tariff; after which and for an additional period of two years, the plant shall be entitled to operational tariff only; and
|
| • |
Bonuses and fines mechanism, based on standard technical operational parameters.
|
|
PV Plant
|
Size of Property
|
Location
|
Owners of the PV Plants/Lands
|
|||
|
“Rinconada II”
|
81,103 m²
|
Municipality of Córdoba, Andalusia, Spain
|
PV Plant owned by Ellomay Spain S.L. Land held by owners and leased to Ellomay Spain S.L.
|
|||
|
“Rodríguez I”
|
65,600 m2
|
Lorca Municipality, Murcia Region, Spain
|
PV Plant owned by Rodríguez I Parque Solar, S.L. Lease Agreement executed between the owners and Rodríguez I Parque Solar, S.L.
|
|||
|
“Rodríguez II”
|
50,300 m2
|
Lorca Municipality, Murcia Region, Spain
|
PV Plant owned by Rodríguez II Parque Solar, S.L. Lease Agreement executed between the owners and Rodríguez II Parque Solar, S.L.
|
|||
|
“Fuente Librilla”
|
64,000 m2
|
Fuente Librilla Municipality, Murcia Region, Spain
|
PV Plant owned by Seguisolar S.L. Lease Agreement executed between owners and Seguisolar S.L.
|
|||
|
“Talasol”
|
6,040,000 m2
|
Talavan (Cáceres) – Extremadura Region, Spain
|
Lease Agreements executed with the Talavan Municipality, which owns the land
|
|||
|
“Talmei Yosef”
|
164,000 m2
|
Talmei Yosef, Israel
|
Lease Agreement executed with the entity that leased the property from the ILA.
|
|
Year ended December 31,
|
||||||||||||
|
2020
|
2019
|
2018
|
||||||||||
|
Appreciation (Devaluation) of the NIS against the euro
|
1.7
|
%
|
(9.6
|
%)
|
3.3
|
%
|
||||||
| a |
A term facility in the amount of approximately €65.9 million, with a term ending on September 30, 2033, repaid in unequal sculptured semi-annual installments. Loan amounts drawn from this facility will bear an annual interest of 6 month
Euribor (with a zero floor and synchronous with the applicable interest period described below) plus a margin determined based on the stage of the Talasol PV Plant. The applicable margins are: (i) 2.25% until technical completion, (ii) 2%
from technical completion until the 5th anniversary of technical completion, (iii) 2.25% from the 5th anniversary of technical completion until the termination date of the power hedge agreement that Talasol entered into last June
(the “PPA”, i.e., September 30, 2030), and (iv) 2.5% from the termination date of the PPA until the end of the term of the commercial term facility;
|
| b |
A revolving debt service reserve facility in the amount of €4.45 million, with a term ending on the earlier of: (i) September 30, 2033, or (ii) the date on which the commercial term loan set forth under (a) above has been repaid in full.
Loan amounts drawn from this facility will bear an annual interest of 6 month Euribor (with a zero floor) plus a margin determined based on the stage of the Talasol PV Plant. The applicable margins are: (i) 2.5% until technical completion,
(ii) 2.25% from technical completion until the 5th anniversary of technical completion, (iii) 2.50% from the 5th anniversary of technical completion until the termination date of the PPA, and (iv) 2.75% from the termination date of the PPA
until the termination date;
|
| c |
A VAT facility in the amount of €6.67 million, with a term ending on June 30, 2021, repaid by using balances available in the VAT reimbursement account but in no event later than June 30, 2021. Loan amounts drawn from this facility will
bear an annual interest of 1 month Euribor (with a zero floor) plus a margin of 2%;
|
| d |
A letter of credit facility in the initial amount of €12 million, with a term ending on September 30, 2030, to be repaid in full on its termination date and bearing an annual interest of (i) 1.25% for amounts cash covered, and (ii) 2%
for any other amounts;
|
| e |
A term facility in the amount of €65 million from EIB, granted under the Investment Plan for Europe known as the Juncker Plan, with a term ending on September 30, 2033, repaid in unequal sculptured semi-annual installments. Loan amounts
drawn from this facility will bear an annual interest of Euribor synchronous with the applicable interest period described below plus a margin (expected to be 1.76%); and
|
| f |
A revolving debt service reserve facility from the EIB in the amount of €4.45 million granted by EIB under the Investment Plan for Europe, with a term ending on the earlier of: (i) September 30, 2033 or (ii) the date on which the
commercial term loan set forth under (e) above has been repaid in full. Loans drawn from this facility will bear an annual interest of 6 month Euribor (with a zero floor) plus a margin, which is expected to be similar to the CFL Debt
Service Reserve Facility under (b) above.
|
| a. |
in an amount of approximately €3.6 million, granted to Rodríguez I Parque Solar, S.L.U.;
|
| b. |
in an amount of approximately €6 million, granted to Rodríguez II Parque Solar, S.L.U.;
|
| c. |
in an amount of approximately €3 million, granted to Seguisolar, S.L.U.;
|
| d. |
in an amount of approximately €5 million, granted to Ellomay Spain, S.L.; and
|
| e. |
a revolving credit facility to attend the debt service if needed, for a maximum amount of €0.8 million granted to any of the Spanish Subsidiaries.
|
| a. |
a loan in the aggregate amount of approximately NIS 80 million provided during 2013 through 2014, linked to the Israeli CPI and bearing an average annual interest of approximately 4.65%. This loan is payable (principal and interest)
every six months commencing June 30, 2014. The final maturity date is December 31, 2031; and
|
| b. |
a loan in the aggregate amount of approximately NIS 25 million provided during 2014, linked to the Israeli CPI and bearing an annual interest of approximately 4.52%. This loan is payable (principal and interest) every six months
commencing June 30, 2015 through June 30, 2028.
|
| a |
Our balance sheet equity, on a consolidated basis, shall not be less than €50 million for purposes of the immediate repayment provision and shall not be less than €60 for purposes of the annual interest
update provision;
|
| b |
The ratio of (a) the short-term and long-term debt from banks, in addition to the debt to holders of debentures issued by us and any other interest-bearing financial obligations, net of cash and cash
equivalents and short-term investments and net of financing of projects, including hedging transactions in connection with such financing, of our subsidiaries, or, together, the Net Financial Debt, to (b) our equity (which we calculate in
line with the definition of Balance Sheet Equity in the Series C Deed of Trust), on a consolidated basis, plus the Net Financial Debt, or our CAP, Net, to which we refer herein as the Ratio of Net Financial Debt to CAP, Net, shall not
exceed the rate of 67.5% for purposes of the immediate repayment provision and shall not exceed a rate of 60% for purposes of the annual interest update provision; and
|
| c |
The ratio of (a) our Net Financial Debt, to (b) our earnings before financial expenses, net, taxes, depreciation and amortization, where the revenues from our operations, such as the Talmei Yosef project, are
calculated based on the fixed asset model and not based on the financial asset model (IFRIC 12), and before share-based payments, based on the aggregate four preceding quarters, or our Adjusted EBITDA, to which we refer to herein as the
Ratio of Net Financial Debt to Adjusted EBITDA, shall not be higher than 12 for purposes of the immediate repayment provision and shall not be higher than 10 for purposes of the annual interest update provision.
|
|
Year ended December 31,
|
||||||||||||||||
|
2020
|
2019
|
2018
|
2020
|
|||||||||||||
|
euro
|
Convenience Translation into US$*
|
|||||||||||||||
|
(in thousands)
|
||||||||||||||||
|
Net cash provided by (used in) operating activities
|
(5,826
|
)
|
3,712
|
6,590
|
(7,148
|
)
|
||||||||||
|
Net cash used in investing activities
|
(112,135
|
)
|
(68,862
|
)
|
(5,795
|
)
|
(137,564
|
)
|
||||||||
|
Net cash provided by financing activities
|
141,637
|
72,518
|
12,258
|
173,759
|
||||||||||||
|
Effect of exchange rate fluctuations on cash and cash equivalents
|
(1,340
|
)
|
259
|
(133
|
)
|
(1,646
|
)
|
|||||||||
|
Increase in cash and cash equivalents
|
22,332
|
7,627
|
12,920
|
27,401
|
||||||||||||
|
Cash and cash equivalents at the beginning of the year
|
44,509
|
36,882
|
23,962
|
54,603
|
||||||||||||
|
Cash and cash equivalents at the end of the year
|
66,845
|
44,509
|
36,882
|
82,004
|
||||||||||||
|
Payments due by period
(in thousands of euro)
|
||||||||||||||||||||
|
Contractual Obligations*
|
Total
|
Less than 1 year
|
1 – 3 years
|
3 – 5 years
|
more than
5 years
|
|||||||||||||||
|
Long-term loans (including current maturities)(1)
|
263,112
|
20,896
|
34,645
|
32,594
|
174,977
|
|||||||||||||||
|
Debentures (including current maturities)(1)
|
91,431
|
13,502
|
33,368
|
44,561
|
-
|
|||||||||||||||
|
Lease liability
|
28,910
|
1,051
|
1,941
|
1,799
|
24,119
|
|||||||||||||||
|
SWAP contracts
|
9,570
|
1,378
|
2,490
|
2,109
|
3,593
|
|||||||||||||||
|
Currency SWAP
|
132
|
(12
|
)
|
63
|
81
|
-
|
||||||||||||||
|
Total
|
393,155
|
36,815
|
72,507
|
81,144
|
202,689
|
|||||||||||||||
| * |
For contractual obligations related to our investment in the Italian and Spanish photovoltaic market, please refer to “Business.”
|
| (1) |
These amounts include future payments of interest.
|
|
Name
|
Age
|
Position with Ellomay
|
||
|
Shlomo Nehama(1)(2)
|
66
|
Chairman of the Board of Directors
|
||
|
Ran Fridrich(1)(2)
|
68
|
Director and Chief Executive Officer
|
||
|
Anita Leviant(1)(3)(4)
|
66
|
Director
|
||
|
Ehud Gil
|
46
|
Director
|
||
|
Dr. Michael J. Anghel(3)(4)(5)
|
82
|
Director
|
||
|
Daniel Vaknin(3)(4)(5)
|
65
|
Director
|
||
|
Kalia Weintraub
|
42
|
Chief Financial Officer
|
||
|
Ori Rosenzweig
|
44
|
Chief Investment Officer
|
||
|
Yehuda Saban
|
42
|
Director of Operations for Israel and EVP of Business Development
|
| (1) |
Elected pursuant to the Shareholders Agreement, dated as of March 24, 2008, between S. Nechama Investments(2008) Ltd. and Kanir Joint Investments (2005) Limited Partnership (See “Item 7.A: Major Shareholders”).
|
| (2) |
Provides management services to the Company pursuant to the Management Services Agreement (See “Item 6.B: Compensation”).
|
| (3) |
Independent Director pursuant to the NYSE American LLC rules.
|
| (4) |
Member of our Audit and Compensation Committees.
|
| (5) |
External Director pursuant to the Companies Law.
|
|
Salary(1)
|
Management Fees
|
Bonus
|
Share-Based Payment
|
Total
|
|||||||||||||||
|
Name and Position
|
(euro in thousands)
|
||||||||||||||||||
|
Shlomo Nehama, Chairman of the Board
|
-
|
175
|
(2)
|
-
|
-
|
175
|
(2)
|
||||||||||||
|
Ran Fridrich, CEO and Director
|
-
|
175
|
(2)(3)
|
-
|
-
|
175
|
(2)(3)
|
||||||||||||
|
Yehuda Saban, Director of Operations for Israel and EVP of Business Development
|
249
|
-
|
69
|
-
|
318
|
||||||||||||||
|
Kalia Weintraub, Chief Financial Officer
|
244
|
-
|
59
|
-
|
303
|
||||||||||||||
|
Ori Rosenzweig, Chief Investment Officer
|
259
|
-
|
-
|
-
|
259
|
||||||||||||||
| 1. |
Salary and related benefits are paid to our executive officers in NIS. Salary as reported herein includes the recipient’s gross salary plus payment of social and other benefits made by us to or on behalf of the recipient. Such benefits
may include, to the extent applicable, payments, contributions and/or allocations for education funds, pension funds, managers’ insurance, severance, risk insurances (e.g., life, or work disability insurance), social security, tax gross-up
payments, vacation, car, phone, convalescence pay and other benefits and perquisites consistent with our policies.
|
| 2. |
Such amounts are paid pursuant to the terms of the Management Services Agreement among the Company, Kanir and Meisaf Blue & White Holdings Ltd., which provides for an annual aggregate payment of $400,000. For additional information,
see “Management Services Agreement” below.
|
| 3. |
The Management Services Agreement provides for an aggregate payment to Kanir of $200,000 in connection with services provided by Messrs. Fridrich and Raphael (that served as a member of our board and provided
management services to us until shortly before he passed away in December 2020). For purposes of this tabular presentation, we attribute the aggregate annual payment to Kanir to Mr. Fridrich, however, this division does not necessarily
represent the actual amounts received by each of Mr. Fridrich and Mr. Raphael from Kanir during the year.
|
| • |
With respect to our chief executive officer, a controlling shareholder or a relative of a controlling shareholder, approval is required by the (i) compensation committee, (ii) board of directors and (iii) company’s shareholders with the
“special majority” described above (in that order). Subject to certain conditions, the Israeli Companies Law provides an exemption from the shareholder approval requirement in connection with the approval of the Terms of Service and
Employment of a CEO candidate.
|
| • |
With respect to a director, approval is required by the (i) compensation committee, (ii) board of directors and (iii) company’s shareholders with a regular majority (in that order).
|
| • |
With respect to any other office holder, approval is required by the compensation committee and the board of directors (in that order); however, in the event of an update of existing Terms of Service and Employment, which the
Compensation Committee confirms is not material, the approval of the compensation committee is sufficient.
|
| a. |
monetary liability imposed on the office holder in favor of a third party by a judgment, including a settlement or a decision of an arbitrator which is given the force of a judgment by court order;
|
| b. |
reasonable litigation expenses, including legal fees, incurred by the office holder as a result of an investigation or proceeding instituted against such office holder by a competent authority, which investigation or proceeding has ended
without the filing of an indictment or in the imposition of financial liability in lieu of a criminal proceeding, or has ended in the imposition of a financial obligation in lieu of a criminal proceeding for an offence that does not require
proof of criminal intent (the phrases “proceeding that has ended without the filing of an indictment” and “financial obligation in lieu of a criminal proceeding” shall have the meanings ascribed to such phrases in Section 260(a)(1a) of the
Companies Law) or in connection with an administrative enforcement proceeding or a financial sanction. Without derogating from the generality of the foregoing, such expenses will include a payment imposed on the office holder in favor of an
injured party as set forth in Section 52[54](a)(1)(a) of the Securities Law, and expenses that the office holder incurred in connection with a proceeding under Chapters H’3, H’4 or I’1 of the Securities Law or in connection with Article D
of Chapter Four of Part Nine of the Companies Law, including reasonable legal expenses, which term includes attorney fees;
|
| c. |
reasonable litigation expenses, including legal fees, which the office holder has incurred or is obliged to pay by the court in proceedings commenced against him by the Company or in its name or by any other person, or pursuant to
criminal charges of which he is acquitted or criminal charges pursuant to which he is convicted of an offence which does not require proof of criminal intent; and
|
| d. |
Expenses, including reasonable legal fees, including attorney fees, incurred by the office holder with respect to a proceeding in accordance with the Restrictive Trade Practices Law, 1988, as amended, or the Restrictive Trade Practices
Law.
|
In the event the employment agreement with an employee provides that the provisions of Section 14 of the Severance Pay Law will apply, our contributions for severance pay are in lieu of our severance liability and the employee is entitled to receive such contributions whether her or his employment is terminated by us or she or he resigns. Therefore, upon fulfillment of our obligation to make a monthly contribution to the managers’ insurance policies or similar financial instruments in the amount of 8.33% of the employee’s monthly salary and of the other terms of the relevant permit with respect to this arrangement, no additional payments must later be made to the employee on account of severance pay upon termination of the employment relationship. As required by Israeli law, our employees are also provided with a contribution toward their retirement that amounts to 12.5% of wages, of which the employee contributes 6%. Furthermore, Israeli employees and employers are required to pay predetermined sums to the National Insurance Institute, which is similar to the United States Social Security Administration, and additional sums towards compulsory health insurance.
|
Name of Beneficial Owner
|
Number of Shares
Beneficially Held (1) |
Percent of Class
|
||||||
|
Shlomo Nehama(2)(4)
|
3,588,577
|
27.9
|
%
|
|||||
|
Ran Fridrich(3)(4)
|
2,605,845
|
20.3
|
%
|
|||||
|
Ehud Gil(3)(4)
|
2,605,845
|
|
20.3
|
%
|
||||
|
Anita Leviant(6)
|
3,000
|
*
|
||||||
|
Dr. Michael J. Anghel(6)
|
1,500
|
*
|
||||||
|
Daniel Vaknin
|
-
|
-
|
||||||
|
Kalia Weintraub
|
-
|
-
|
||||||
|
Ori Rosenzweig(6)
|
3,290
|
*
|
||||||
|
Yehuda Saban
|
-
|
-
|
||||||
| 1. |
As used in this table, “beneficial ownership” means the sole or shared power to vote or direct the voting or to dispose or direct the disposition of any security. For purposes of this table, a person is deemed to be the beneficial owner of securities that can be acquired within 60 days from March 15, 2021 through the exercise of any option or warrant. Ordinary shares subject to options or warrants that are currently exercisable or exercisable within 60 days are deemed outstanding for computing the ownership percentage of the person holding such options or warrants, but are not deemed outstanding for computing the ownership percentage of any other person. The amounts and percentages are based upon 12,839,427 ordinary shares outstanding as of March 15, 2021. This number of outstanding ordinary shares does not include a total of 258,046 ordinary shares held at that date as treasury shares under Israeli law, all of which were repurchased by us. For so long as such treasury shares are owned by us they have no rights and, accordingly, are neither eligible to participate in or receive any future dividends which may be paid to our shareholders nor are they entitled to participate in, be voted at or be counted as part of the quorum for, any meetings of our shareholders. |
| 2. |
According to information provided by the holders, the 3,588,577 ordinary shares beneficially owned by Mr. Nehama consist of: (i) 3,123,604 ordinary shares held by Nechama Investments, an Israeli company, which constitute approximately 24.3% of our outstanding ordinary shares, and (ii) 464,973 ordinary shares held directly by Mr. Nehama, which constitute approximately 3.6% of our outstanding ordinary shares. Mr. Nehama, as the sole officer, director and shareholder of Nechama Investments, may be deemed to indirectly beneficially own any ordinary shares beneficially owned by Nechama Investments, which constitute (together with the shares held directly by him) approximately 27.9% of our outstanding ordinary shares. |
| 3. |
The 2,605,845 ordinary shares beneficially owned by Mr. Fridrich and Mr. Gil consist of ordinary shares held by Kanir, which constitute approximately 20.3% of our outstanding share capital. Mr. Fridrich and
Mr. Gil are the board members of Kanir Investments Ltd., or Kanir Ltd., the general partner in Kanir, and by virtue of their position with Kanir Ltd. may be deemed to indirectly beneficially own the ordinary shares beneficially owned by
Kanir. Each of Mr. Fridrich and Mr. Gil disclaims beneficial ownership of the shares held by Kanir, except to the extent of his pecuniary interest therein, if any.
|
| 4. |
By virtue of the 2008 Shareholders Agreement between Nechama Investments and Kanir (see “Item 7.A: Major Shareholders”), Mr. Nehama, Nechama Investments, Kanir and Messrs. Fridrich and Gil may be deemed to be
members of a group that holds shared voting power with respect to 5,729,449 ordinary shares, which together constitute approximately 44.62% of our outstanding ordinary shares, and holds shared dispositive power with respect to 5,232,201
ordinary shares, which constitute 40.8% of our outstanding ordinary shares. Accordingly, taking into account the shares directly held by Mr. Nehama, he may be deemed to beneficially own approximately 48.2% of our outstanding ordinary
shares. Mr. Nehama and Nechama Investments both disclaim beneficial ownership of the ordinary shares beneficially owned by Kanir and Kanir Ltd., Kanir and Messrs. Fridrich and Gil all disclaim beneficial ownership of the shares held by
Nechama Investments.
|
| 5. | (i) Anita Leviant holds currently exercisable options to purchase 2,000 ordinary shares with expiration dates ranging from August 1, 2028 to August 1, 2029 and exercise prices per share ranging between $8.95 - $13, and (ii) Dr. Michael J. Anghel holds currently exercisable options to purchase 1,500 ordinary shares with an expiration dates ranging from January 24, 2029 to August 1, 2029 and an exercise price per share ranging between $8.41 - $13. |
| 6. |
Mr. Ori Rosenzweig holds currently exercisable options to purchase 3,290 ordinary shares at an exercise price per share of $11.19. |
|
Ordinary Shares
Beneficially Owned(1) |
Percentage of Ordinary Shares Beneficially Owned
|
|||||||
|
Shlomo Nehama (2)(5)(6)
|
3,588,577
|
27.9
|
%
|
|||||
|
Kanir Joint Investments (2005) Limited Partnership (3)(4)(5)(6)
|
2,605,845
|
20.3
|
%
|
|||||
|
Yelin Lapidot Holdings Management Ltd.(7)
|
1,456,332
|
11.3
|
%
|
|||||
|
Clal Insurance Enterprises Holdings Ltd.(8)
|
1,137,678
|
8.9
|
%
|
|||||
| (1) |
As used in this table, “beneficial ownership” means the sole or shared power to vote or direct the voting or to dispose or direct the disposition of any security as determined pursuant to Rule 13d-3 promulgated under the U.S. Securities
Exchange Act of 1934, as amended. For purposes of this table, a person is deemed to be the beneficial owner of securities that can be acquired within 60 days from March 15, 2021 through the exercise of any option or warrant. Ordinary shares
subject to options or warrants that are currently exercisable or exercisable within 60 days are deemed outstanding for computing the ownership percentage of the person holding such options or warrants, but are not deemed outstanding for
computing the ownership percentage of any other person. The amounts and percentages are based on a total of 12,839,427 ordinary shares outstanding as of March 15, 2021. This number of outstanding ordinary shares does not include a total of
258,046 ordinary shares held at that date as treasury shares under Israeli law, all of which were repurchased by us. For so long as such treasury shares are owned by us they have no rights and, accordingly, are neither eligible to
participate in or receive any future dividends which may be paid to our shareholders nor are they entitled to participate in, be voted at or be counted as part of the quorum for, any meetings of our shareholders.
|
| (2) |
The 3,588,577 ordinary shares beneficially owned by Mr. Nehama consist of: (i) 3,123,604 ordinary shares held by Nechama Investments, which constitute approximately 24.3% of our outstanding ordinary shares and (ii) 464,973 ordinary
shares and held directly by Mr. Nehama, which constitute approximately 3.6% of our outstanding ordinary shares. Mr. Nehama, as the sole officer, director and shareholder of Nechama Investments, may be deemed to indirectly beneficially own
any ordinary shares owned by Nechama Investments, which constitute (together with his shares) approximately 27.9% of our outstanding ordinary shares.
|
| (3) |
Kanir is an Israeli limited partnership. Kanir Ltd., in its capacity as the general partner of Kanir, has the voting and dispositive power over the ordinary shares directly beneficially owned by Kanir. As a result, Kanir Ltd. may
be deemed to indirectly beneficially own the ordinary shares beneficially owned by Kanir. Messrs. Ran Fridrich and Ehud Gil, who are members of our Board of Directors, are the sole directors of Kanir Ltd. As a result, Messrs. Fridrich
and Gil may be deemed to indirectly beneficially own the ordinary shares beneficially owned by Kanir. In addition, the estate of Mr. Raphael, who passed away in December 2020, is the majority shareholder of Kanir Ltd. and beneficially
owns 254,524 ordinary shares, which constitute approximately 2% of our outstanding shares and which constitute, together with Kanir’s holdings, 22.3% of our outstanding ordinary shares. Each of Kanir Ltd. and Messrs. Fridrich and Gil
disclaims beneficial ownership of such ordinary shares except to the extent of their respective pecuniary interest therein, if any.
|
| (4) |
By virtue of the 2008 Shareholders Agreement, Mr. Nehama, Nechama Investments, Kanir, Kanir Ltd., and Messrs. Fridrich and Gil may be deemed to be members of a
group that holds shared voting power with respect to 5,729,449 ordinary shares, which constitute approximately 44.6% of our outstanding ordinary shares, and holds shared dispositive power with respect to 5,232,201 ordinary shares, which
constitute 40.8% of our outstanding ordinary shares. Accordingly, taking into account the shares directly held by Mr. Nehama, he may be deemed to beneficially own approximately 48.2% of our outstanding ordinary shares. Each of Mr. Nehama
and Nechama Investments disclaims beneficial ownership of the ordinary shares beneficially owned by Kanir. Each of Kanir, Kanir Ltd. and Messrs. Fridrich and Gil disclaims beneficial ownership of the ordinary shares beneficially owned by
Nechama Investments. A copy of the 2008 Shareholders Agreement was filed with the Securities and Exchange Commission, or the SEC, on March 31, 2008 as Exhibit 14 to an amendment to a Schedule 13D and is not incorporated by reference
herein.
|
| (5) |
Bonstar Investments Ltd., or Bonstar, an Israeli company, holds 148,567 ordinary shares, which constitute approximately 1.2% of our outstanding ordinary shares. Bonstar is a limited partner of Kanir and assisted Kanir in the
financing of the purchase of some of its ordinary shares. Accordingly, Bonstar may be deemed to be a member of a group with Kanir and its affiliates, although there are no agreements between Bonstar and either of such persons and
entities with respect to the ordinary shares beneficially owned by each of them. Mr. Joseph Mor and Mr. Ishay Mor are the sole shareholders of Bonstar and Mr. Joseph Mor serves as the sole director of Bonstar. Messrs. Joseph Mor and
Ishay Mor also hold, through a company jointly held by them, 75,000 ordinary shares, which constitute approximately 0.6% of our outstanding ordinary shares. By virtue of their control over Bonstar and the other company, Messrs. Joseph
Mor and Ishay Mor may be deemed to indirectly beneficially own the 223,567 ordinary shares beneficially owned by Bonstar and by the other company, which constitute approximately 1.7% of our outstanding ordinary shares. Each of Bonstar
and Messrs. Joseph Mor and Ishay Mor disclaims beneficial ownership of the ordinary shares beneficially owned by Kanir and Nechama Investments, except to the extent of their respective pecuniary interest therein, if any.
|
| (6) |
The information included in this table concerning the beneficial ownership of Nechama Investments, Kanir, Kanir Ltd., Bonstar and Messrs. Nehama, Gil, Fridrich, Joseph Mor and Ishay Mor is based on a Schedule 13D/A submitted on October
13, 2020 and on information provided by the shareholders.
|
| (7) |
Based on a Schedule 13G/A submitted on February 2, 2021 by Mr. Dov Yelin, Mr. Yair Lapidot, Yelin Lapidot Holdings Management Ltd., or Yelin Lapidot, and Yelin Lapidot Mutual Funds Management Ltd., or Yelin Lapidot Mutual. According to
the Schedule 13G/A: (i) the securities reported therein are beneficially owned as follows: (a) 971,883 ordinary shares, which constitute approximately 7.6% of our outstanding ordinary shares, by mutual funds managed by Yelin Lapidot Mutual
and (b) 484,449 ordinary shares, which constitute approximately 3.8% of our outstanding ordinary shares, by provident funds managed by Yelin Lapidot Provident Fund Management Ltd., or Yelin Lapidot Provident, (ii) both Yelin Lapidot Mutual
and Yelin Lapidot Provident are wholly-owned subsidiaries of Yelin Lapidot and operate under independent management and make their own independent voting and investment decisions, and (iii) Messrs. Yelin and Lapidot each own 24.38% of the
share capital and 25.004% of the voting rights of Yelin Lapidot, and are responsible for the day-to-day management of Yelin Lapidot. Pursuant to the Schedule 13G/A, any economic interest or beneficial ownership in any of the securities
covered by the Schedule 13G/A is held for the benefit of the members of the provident funds or mutual funds, as the case may be, and each of Messrs. Yelin and Lapidot, Yelin Lapidot and wholly-owned subsidiaries of Yelin Lapidot, disclaims
beneficial ownership of any such securities.
|
| (8) |
Based on a Schedule 13G/A submitted on February 16, 2021 by Clal Insurance Enterprises Holdings Ltd., or Clal. Based on the Schedule 13G/A, of the 1,137,678 ordinary shares reported as beneficially owned by Clal: (i) 159,678 ordinary
shares are beneficially held for Clal’s own account and (ii) 978,000 ordinary shares are held for members of the public through, among others, provident funds and/or pension funds and/or insurance policies, which are managed by subsidiaries
of Clal, which subsidiaries operate under independent management and make independent voting and investment decisions. Consequently, Clal notes in the Schedule 13G/A that the Schedule 13G/A will not constitute an admission that it is the
beneficial owner of more than 159,678 ordinary shares.
|
| • |
any amendment to the articles;
|
| • |
an increase in the company’s authorized share capital;
|
| • |
a merger; or
|
| • |
approval of related party transactions that require shareholder approval.
|
| a. |
Our Adjusted Balance Sheet Equity (as such term is defined in the Series D Deed of Trust), on a consolidated basis, shall not be less than €70 million for two consecutive quarters for purposes of the
immediate repayment provision and shall not be less than €75 for purposes of the annual interest update provision;
|
| b. |
The ratio of (a) the short-term and long-term debt from banks, in addition to the debt to holders of debentures issued by us and any other interest-bearing financial obligations provided by entities who are
in the business of lending money (excluding financing of projects and other exclusions as set forth in the Series D Deed of Trust), net of cash and cash equivalents, short-term investments, deposits, financial funds and negotiable
securities, to the extent that these are not restricted (with the exception of a restriction for the purpose of securing any financial debt according to this definition), or, together, the Series D Net Financial Debt, to (b) our Adjusted
Balance Sheet Equity, on a consolidated basis, plus the Series D Net Financial Debt, or our CAP, Net, to which we refer herein as the Series D Ratio of Net Financial Debt to CAP, Net, shall not exceed the rate of 68% for three consecutive
quarters for purposes of the immediate repayment provision and shall not exceed a rate of 60% for purposes of the annual interest update provision; and
|
| c. |
The ratio of (a) our Series D Net Financial Debt, to (b) our earnings before financial expenses, net, taxes, depreciation and amortization, where the revenues from our operations, such as the Talmei Yosef
project, are calculated based on the fixed asset model and not based on the financial asset model (IFRIC 12), and before share-based payments, when the data of assets or projects whose Commercial Operation Date occurred in the four quarters
that preceded the test date will be calculated based on Annual Gross Up (as such terms are defined in the Series D Deed of Trust), based on the aggregate four preceding quarters, or our Series D Adjusted EBITDA, to which we refer to herein
as the Ratio of Net Financial Debt to Series D Adjusted EBITDA, shall not be higher than 14 for purposes of the immediate repayment provision and shall not be higher than 12 for purposes of the annual interest update provision.
|
| • |
tax-exempt entities or any individual retirement account or Roth IRA;
|
| • |
banks and other financial institutions;
|
| • |
insurance companies;
|
| • |
real estate investment trusts and regulated investment companies;
|
| • |
broker-dealers;
|
| • |
traders in securities that elect to use a mark-to-market method of accounting for their securities holdings;
|
| • |
persons liable for alternative minimum tax;
|
| • |
“U.S. shareholders” (as defined in Code Section 951(b), generally persons owning directly, indirectly or constructively at least 10% of our shares by vote or value);
|
| • |
persons that hold ordinary shares as part of a straddle, hedge, conversion transaction or other integrated transaction;
|
| • |
U.S. expatriates;
|
| • |
persons whose functional currency is not the U.S. dollar;
|
| • |
persons that are residents of or have a permanent establishment in a jurisdiction outside the United States or persons who are not U.S. Holders; and
|
| • |
persons who acquired the shares pursuant to the exercise of any employee share option or otherwise as compensation.
|
| (1) |
an individual citizen or resident of the United States;
|
| (2) |
a corporation or other entity taxable as a corporation for U.S. federal income tax purposes created or organized in or under the laws of the United States or any political subdivision thereof;
|
| (3) |
an estate the income of which is subject to U.S. federal income tax without regard to its source; or
|
| (4) |
a trust, if such trust was in existence on August 20, 1996 and has validly elected to be treated as a U.S. person for U.S. federal income tax purposes, or if (a) a court within the U.S. can exercise primary supervision over its
administration and (b) one or more U.S. persons have the authority to control all of the substantial decisions of such trust.
|
| (1) |
the excess distribution or gain will be allocated ratably over each U.S. Holder’s holding period for the ordinary shares;
|
| (2) |
the amount allocated to the current taxable year, and any taxable year prior to the first taxable year in which we were a PFIC, will be treated as ordinary income; and
|
| (3) |
the amount allocated to each other year will be subject to tax at the highest tax rate in effect for that year and the interest charge generally applicable to underpayments of tax will be imposed on the resulting tax attributable to each
such year.
|
|
December 31, 2020
|
||||||||
|
Increase
|
Decrease
|
|||||||
|
Equity
|
Equity
|
|||||||
|
€ thousands
|
||||||||
|
Change in the exchange rate of:
|
||||||||
|
5% in the USD
|
79
|
(79
|
)
|
|||||
|
5% in NIS
|
308
|
(308
|
)
|
|||||
|
December 31, 2019
|
||||||||
|
Increase
|
Decrease
|
|||||||
|
Equity
|
Equity
|
|||||||
|
€ thousands
|
||||||||
|
Change in the exchange rate of:
|
||||||||
|
5% in the USD
|
185
|
185
|
||||||
|
5% in NIS
|
(412
|
)
|
(412
|
)
|
||||
|
December 31,
|
||||||||
|
2020
|
2019
|
|||||||
|
Profit or loss
|
Profit or loss
|
|||||||
|
€ in thousands
|
||||||||
|
Increase of 1%
|
803
|
580
|
||||||
|
Increase of 3%
|
2,444
|
1,701
|
||||||
|
Decrease of 1%
|
(836
|
)
|
(542
|
)
|
||||
|
Decrease of 3%
|
(2,477
|
)
|
(1,663
|
)
|
||||
|
2020
|
2019
|
|||||||
|
(euro in thousands)
|
||||||||
|
Audit Fees(1)
|
317
|
236
|
||||||
|
Audit-Related Fees(2)
|
35
|
34
|
||||||
|
Tax Fees(3)
|
53
|
31
|
||||||
|
Total
|
405
|
301
|
||||||
| (1) |
Professional services rendered by our independent registered public accounting firm for the audit of our annual financial statements or services that are normally provided by the accountants in connection with statutory and regulatory
filings or engagements.
|
| (2) |
Including professional services related to due diligence investigations.
|
| (3) |
Professional services rendered by our independent registered public accounting firm for international and local tax compliance, tax advice services and tax planning performed during the fiscal year.
|
|
Number
|
Description
|
|
Number
|
Description
|
|
101.INS**
|
XBRL Instance Document
|
|
101.SCH**
|
XBRL Taxonomy Extension Schema Document
|
|
101.CAL**
|
XBRL Taxonomy Calculation Linkbase Document
|
|
101.DEF**
|
XBRL Taxonomy Extension Definition Linkbase Document
|
|
101.LAB**
|
XBRL Taxonomy Label Linkbase Document
|
|
101.PRE**
|
XBRL Taxonomy Presentation Linkbase Document
|
| * |
The original language version is on file with the Registrant and is available upon request.
|
| ** |
Pursuant to Rule 406T of Regulation S-T, these interactive data files are deemed not filed or part of a registration statement or prospectus for purposes of Sections 11 or 12 of the Securities Act of 1933, as amended, are deemed not
filed for the purposes of Section 18 of the Securities and Exchange Act of 1934, as amended, and otherwise are not subject to liability under those sections.
|
| (1) |
Previously filed with the Registrant’s Form 20-F for the year ended December 31, 2012 and incorporated by reference herein.
|
| (2) |
Previously filed with the Registrant’s Form 20-F for the year ended December 31, 2018 and incorporated by reference herein.
|
| (3) |
Previously filed with the Registrant’s Form 20-F for the year ended December 31, 2011 and incorporated by reference herein.
|
| (4) |
Previously filed with the Registrant’s Form 20-F for the year ended December 31, 2019 and incorporated by reference herein.
|
| (5) |
Included in the Registrant’s Form 6-K dated May 17, 2018 and incorporated by reference herein.
|
| (6) |
Included in the Registrant’s Form 6-K dated October 14, 2005 and incorporated by reference herein.
|
| (7) |
Included in the Registrant’s Form 6-K dated December 1, 2008 and incorporated by reference herein.
|
| (8) |
Previously filed with the Registrant’s Form 20-F for the year ended December 31, 2010 and incorporated by reference herein.
|
| (9) |
Previously filed with the Registrant’s Form 20-F for the year ended December 31, 2013 and incorporated by reference herein.
|
| (10) |
Previously filed with the Registrant’s Form 20-F for the year ended December 31, 2014 and incorporated by reference herein.
|
| (11) |
Previously filed with the Registrant’s Form 20-F for the year ended December 31, 2017 and incorporated by reference herein.
|
| (12) |
Included in the Registrant’s Form 6-K dated September 25, 2019 and incorporated by reference herein.
|
|
|
Ellomay Capital Ltd.
By: /s/ Ran Fridrich
|
|
Ran Fridrich
|
|
|
Chief Executive Officer and Director
|
|
Ellomay Capital Ltd. and its
Subsidiaries
Consolidated Financial Statements
As at December 31, 2020
|
|
|
|
Page
|
| Report of Independent Registered Public Accounting Firm | F-2 - F-4 |
|
|
|
|
|
|
F-5
|
||
|
|
|
|
|
F-6
|
||
|
|
|
|
|
F-7 - F-9
|
||
|
|
|
|
| Consolidated Statements of Cash Flows | F-10 - F-11 | |
| Notes to the Consolidated Financial Statements | F-12 - F-107 | |

Ellomay Capital Ltd.
Opinions on the Consolidated Financial Statements and Internal Control over Financial Reporting
We have audited the accompanying consolidated statements of financial position of Ellomay Capital Ltd. and subsidiaries (the Company) as of December 31, 2020 and 2019, the related consolidated statements of profit or loss and other comprehensive income (loss), changes in equity and cash flows for each of the years in the three‑year period ended December 31, 2020, and the related notes (collectively, the consolidated financial statements). We also have audited the Company’s internal control over financial reporting as of December 31, 2020, based on criteria established in Internal Control - Integrated Framework (2013) issued by the Committee of Sponsoring Organizations of the Treadway Commission.
In our opinion, the consolidated financial statements present fairly, in all material respects, the financial position of the Company as of December 31, 2020 and 2019, and the results of its operations and its cash flows for each of the years in the three‑year period ended December 31, 2020, in conformity with International Financial Reporting Standards (IFRS) as issued by the International Accounting Standards Board. Also in our opinion, the Company maintained, in all material respects, effective internal control over financial reporting as of December 31, 2020, based on criteria established in Internal Control - Integrated Framework (2013) issued by the Committee of Sponsoring Organizations of the Treadway Commission.
Convenience translation
The accompanying consolidated financial statements as of and for the year ended December 31, 2020 have been translated into United States dollars (“dollars”) solely for the convenience of the reader. We have audited the translation and, in our opinion, the consolidated financial statements expressed in euro have been translated into dollars on the basis set forth in note 3B of the notes to the consolidated financial statements.
Change in Accounting Principle
As discussed in note 3J to the consolidated financial statements, the Company has changed its method of accounting for leases as of January 1, 2019, due to the adoption of International Financial Reporting Standard No.16, Leases.
Basis for Opinions
The Company’s management is responsible for these consolidated financial statements, for maintaining effective internal control over financial reporting, and for its assessment of the effectiveness of internal control over financial reporting included in the accompanying Management’s Report on Internal Control over Financial Reporting. Our responsibility is to express an opinion on these consolidated financial statements and an opinion on the Company’s internal control over financial reporting based on our audits. We are a public accounting firm registered with the Public Company Accounting Oversight Board (United States) (PCAOB) and are required to be independent with respect to the Company in accordance with the U.S. federal securities laws and the applicable rules and regulations of the Securities and Exchange Commission and the PCAOB.
We conducted our audits in accordance with the standards of the PCAOB. Those standards require that we plan and perform the audits to obtain reasonable assurance about whether the consolidated financial statements are free of material misstatement, whether due to error or fraud, and whether effective internal control over financial reporting was maintained in all material respects.
|
December 31,
|
|||||||||||||||
|
2020
|
2019
|
2020
|
|||||||||||||
|
Note
|
€ in thousands
|
Convenience Translation into US$ in thousands (Note 3B)
|
|||||||||||||
|
Assets
|
|||||||||||||||
|
Current assets:
|
|||||||||||||||
|
Cash and cash equivalents
|
4
|
66,845
|
44,509
|
82,004
|
|||||||||||
|
Marketable securities
|
5
|
1,761
|
2,242
|
2,160
|
|||||||||||
|
Short term deposits
|
5
|
8,113
|
6,446
|
9,953
|
|||||||||||
|
Restricted cash
|
5
|
-
|
22,162
|
-
|
|||||||||||
|
Receivable from concession project
|
6E
|
|
1,491
|
1,463
|
1,829
|
||||||||||
|
Financial assets
|
6B
|
|
-
|
1,418
|
-
|
||||||||||
|
Trade and other receivables
|
7
|
9,825
|
4,882
|
12,053
|
|||||||||||
|
88,035
|
83,122
|
107,999
|
|||||||||||||
|
Non-current assets
|
|||||||||||||||
|
Investment in equity accounted investee
|
6A
|
|
32,234
|
33,561
|
39,544
|
||||||||||
|
Advances on account of investments
|
6C
|
|
2,423
|
883
|
2,972
|
||||||||||
|
Receivable from concession project
|
6E
|
|
25,036
|
27,122
|
30,714
|
||||||||||
|
Fixed assets
|
8
|
264,095
|
114,389
|
323,987
|
|||||||||||
|
Right-of-use asset
|
14
|
17,209
|
15,401
|
21,112
|
|||||||||||
|
Intangible asset
|
6E
|
|
4,604
|
5,042
|
5,648
|
||||||||||
|
Restricted cash and deposits
|
5
|
9,931
|
10,956
|
12,183
|
|||||||||||
|
Deferred tax
|
19
|
3,605
|
2,285
|
4,423
|
|||||||||||
|
Long term receivables
|
7
|
2,762
|
12,249
|
3,388
|
|||||||||||
|
Derivatives
|
10,238
|
5,162
|
12,560
|
||||||||||||
|
372,137
|
227,050
|
456,531
|
|||||||||||||
|
Total assets
|
460,172
|
310,172
|
564,530
|
||||||||||||
|
Liabilities and Equity
|
|||||||||||||||
|
Current liabilities
|
|||||||||||||||
|
Current maturities of long term bank loans
|
10
|
10,232
|
4,138
|
12,552
|
|||||||||||
|
Current maturities of long term loans
|
4,021
|
-
|
4,933
|
||||||||||||
|
Debentures
|
12
|
10,600
|
26,773
|
13,004
|
|||||||||||
|
Trade payables
|
12,387
|
1,765
|
15,197
|
||||||||||||
|
Other payables
|
9
|
7,912
|
5,010
|
9,706
|
|||||||||||
|
45,152
|
37,686
|
55,392
|
|||||||||||||
|
Non-current liabilities
|
|||||||||||||||
|
Lease liability
|
14
|
17,299
|
15,402
|
21,222
|
|||||||||||
|
Long-term loans
|
11
|
134,520
|
40,805
|
165,027
|
|||||||||||
|
Other long-term bank loans
|
11
|
49,396
|
48,377
|
60,598
|
|||||||||||
|
Debentures
|
12
|
72,124
|
44,811
|
88,480
|
|||||||||||
|
Deferred tax
|
19
|
7,806
|
6,467
|
9,576
|
|||||||||||
|
Other long-term liabilities
|
13
|
513
|
1,795
|
629
|
|||||||||||
|
Derivatives
|
8,336
|
7,263
|
10,226
|
||||||||||||
|
289,994
|
164,920
|
355,758
|
|||||||||||||
|
Total liabilities
|
335,146
|
202,606
|
411,150
|
||||||||||||
|
Equity
|
|||||||||||||||
|
Share capital
|
16
|
25,102
|
21,998
|
30,795
|
|||||||||||
|
Share premium
|
82,401
|
64,160
|
101,088
|
||||||||||||
|
Treasury shares
|
(1,736
|
)
|
(1,736
|
)
|
(2,130
|
)
|
|||||||||
|
Transaction reserve with non-controlling Interests
|
6,106
|
6,106
|
7,491
|
||||||||||||
|
Reserves
|
4,164
|
3,283
|
5,108
|
||||||||||||
|
Retained earnings
|
8,191
|
12,818
|
10,049
|
||||||||||||
|
Total equity attributed to shareholders of the Company
|
124,228
|
106,629
|
152,401
|
||||||||||||
|
Non-Controlling Interest
|
798
|
937
|
979
|
||||||||||||
|
Total equity
|
125,026
|
107,566
|
153,380
|
||||||||||||
|
Total liabilities and equity
|
460,172
|
310,172
|
564,530
|
||||||||||||
|
For the year ended December 31,
|
|||||||||||||||||||
|
2020
|
2019
|
2018
|
2020
|
||||||||||||||||
|
Note
|
€ in thousands (except per share data)
|
Convenience Translation into US$ in thousands (Note 3B)
|
|||||||||||||||||
|
Revenues
|
18E
|
|
9,645
|
18,988
|
18,117
|
11,832
|
|||||||||||||
|
Operating expenses
|
18B
|
|
(4,951
|
)
|
(6,638
|
)
|
(6,342
|
)
|
(6,074
|
)
|
|||||||||
|
Depreciation and amortization expenses
|
18B
|
|
(2,975
|
)
|
(6,416
|
)
|
(5,816
|
)
|
(3,650
|
)
|
|||||||||
|
Gross profit
|
1,719
|
5,934
|
5,959
|
2,108
|
|||||||||||||||
|
Project development costs
|
6
|
(3,491
|
)
|
(4,213
|
)
|
(2,878
|
)
|
(4,283
|
)
|
||||||||||
|
General and administrative expenses
|
18C
|
|
(4,512
|
)
|
(3,827
|
)
|
(3,600
|
)
|
(5,535
|
)
|
|||||||||
|
Share of profits of equity accounted investee
|
6A
|
|
1,525
|
3,086
|
2,545
|
1,871
|
|||||||||||||
|
Other income (expenses), net
|
18D
|
|
2,100
|
(2,100
|
)
|
884
|
2,576
|
||||||||||||
|
Capital gain
|
6D
|
|
-
|
18,770
|
-
|
-
|
|||||||||||||
|
Operating profit (loss)
|
(2,659
|
)
|
17,650
|
2,910
|
(3,263
|
)
|
|||||||||||||
|
Financing income
|
18A
|
|
2,134
|
1,827
|
2,936
|
2,618
|
|||||||||||||
|
Financing income (expenses) in connection with derivatives, net
|
18A
|
|
1,094
|
897
|
494
|
1,342
|
|||||||||||||
|
Financing expenses
|
18A
|
|
(6,862
|
)
|
(10,877
|
)
|
(5,521
|
)
|
(8,418
|
)
|
|||||||||
|
Financing expenses, net
|
(3,634
|
)
|
(8,153
|
)
|
(2,091
|
)
|
(4,458
|
)
|
|||||||||||
|
Profit (loss) before taxes on income
|
(6,293
|
)
|
9,497
|
819
|
(7,721
|
)
|
|||||||||||||
|
Tax benefit (taxes on income)
|
19
|
125
|
287
|
(215
|
)
|
153
|
|||||||||||||
|
Profit (loss) for the year
|
(6,168
|
)
|
9,784
|
604
|
(7,568
|
)
|
|||||||||||||
|
Profit (loss) attributable to:
|
|||||||||||||||||||
|
Owners of the Company
|
(4,627
|
)
|
12,060
|
1,057
|
(5,676
|
)
|
|||||||||||||
|
Non-controlling interests
|
(1,541
|
)
|
(2,276
|
)
|
(453
|
)
|
(1,892
|
)
|
|||||||||||
|
Profit (loss) for the year
|
(6,168
|
)
|
9,784
|
604
|
(7,568
|
)
|
|||||||||||||
|
Other comprehensive income (loss) items
|
|||||||||||||||||||
|
That after initial recognition in comprehensive income (loss) were or will be transferred to profit or loss:
|
|||||||||||||||||||
|
Foreign currency translation differences for foreign operations
|
(482
|
)
|
2,103
|
(787
|
)
|
(591
|
)
|
||||||||||||
|
Effective portion of change in fair value of cash flow hedges
|
2,210
|
1,076
|
(1,008
|
)
|
2,711
|
||||||||||||||
|
Net change in fair value of cash flow hedges transferred to profit or loss
|
555
|
(1,922
|
)
|
643
|
681
|
||||||||||||||
|
Total other comprehensive income (loss)
|
2,283
|
1,257
|
(1,152
|
)
|
2,801
|
||||||||||||||
|
Total other comprehensive income (loss) attributable to:
|
|||||||||||||||||||
|
Owners of the Company
|
881
|
2,114
|
(1,188
|
)
|
1,081
|
||||||||||||||
|
Non-controlling interests
|
1,402
|
(857
|
)
|
36
|
1,720
|
||||||||||||||
|
Total other comprehensive income (loss)
|
2,283
|
1,257
|
(1,152
|
)
|
2,801
|
||||||||||||||
|
Total comprehensive income (loss) for the year
|
(3,885
|
)
|
11,041
|
(548
|
)
|
(4,767
|
)
|
||||||||||||
|
Total comprehensive income (loss) for the year attributable to:
|
|||||||||||||||||||
|
Owners of the Company
|
(3,746
|
)
|
14,174
|
(131
|
)
|
(4,595
|
)
|
||||||||||||
|
Non-controlling interests
|
(139
|
)
|
(3,133
|
)
|
(417
|
)
|
(172
|
)
|
|||||||||||
|
Total comprehensive income (loss) for the year
|
(3,885
|
)
|
11,041
|
(548
|
)
|
(4,767
|
)
|
||||||||||||
|
Earnings (loss) per share
|
|||||||||||||||||||
|
Basic earnings (loss) per share
|
20
|
(0.38
|
)
|
1.09
|
0.10
|
(0.47
|
)
|
||||||||||||
|
Diluted earnings (loss) per share
|
20
|
(0.38
|
)
|
1.09
|
0.10
|
(0.47
|
)
|
||||||||||||
|
Non- controlling
|
Total
|
|||||||||||||||||||||||||||||||||||||||
|
Attributable to shareholders of the Company
|
Interests
|
Equity
|
||||||||||||||||||||||||||||||||||||||
|
Retained
earnings (accumulated
|
Translation
Reserve from
foreign
|
Transaction
reserve with
non-
controlling
|
||||||||||||||||||||||||||||||||||||||
|
Share
|
Share
|
Treasury
|
Hedging
|
|||||||||||||||||||||||||||||||||||||
|
capital
|
premium
|
deficit)
|
shares
|
operations
|
Reserve
|
Interests
|
Total
|
|||||||||||||||||||||||||||||||||
|
€ in thousands
|
||||||||||||||||||||||||||||||||||||||||
|
Balance as at January 1, 2020
|
21,998
|
64,160
|
12,818
|
(1,736
|
)
|
4,356
|
(1,073
|
)
|
6,106
|
106,629
|
937
|
107,566
|
||||||||||||||||||||||||||||
|
Profit (loss) for the year
|
-
|
-
|
(4,627
|
)
|
-
|
-
|
-
|
-
|
(4,627
|
)
|
(1,541
|
)
|
(6,168
|
)
|
||||||||||||||||||||||||||
|
Other comprehensive loss for the year
|
-
|
-
|
-
|
-
|
(533
|
)
|
1,414
|
-
|
881
|
1402
|
2,283
|
|||||||||||||||||||||||||||||
|
Total comprehensive loss for the year
|
-
|
-
|
(4,627
|
)
|
-
|
(533
|
)
|
1,414
|
-
|
(3,746
|
)
|
(139
|
)
|
(3,885
|
)
|
|||||||||||||||||||||||||
|
Transactions with owners of the Company, recognized directly in equity:
|
||||||||||||||||||||||||||||||||||||||||
|
Issuance of ordinary shares
|
3,084
|
18,191
|
-
|
-
|
-
|
-
|
-
|
21,275
|
-
|
21,275
|
||||||||||||||||||||||||||||||
|
Options exercise
|
20
|
-
|
-
|
-
|
-
|
-
|
-
|
20
|
-
|
20
|
||||||||||||||||||||||||||||||
|
Share-based payments
|
-
|
50
|
-
|
-
|
-
|
-
|
-
|
50
|
-
|
50
|
||||||||||||||||||||||||||||||
|
Balance as at
|
||||||||||||||||||||||||||||||||||||||||
|
December 31, 2020
|
25,102
|
82,401
|
8,191
|
(1,736
|
)
|
3,823
|
341
|
6,106
|
124,228
|
798
|
125,026
|
|||||||||||||||||||||||||||||
|
Non- controlling
Interests
|
Total
Equity
|
|||||||||||||||||||||||||||||||||||||||
|
Attributable to shareholders of the Company
|
||||||||||||||||||||||||||||||||||||||||
|
Retained
earnings (accumulated
deficit)
|
Translation
Reserve from
foreign
operations
|
Transaction
reserve with
non-controlling
Interests
|
||||||||||||||||||||||||||||||||||||||
|
Share
capital
|
Share
premium
|
Treasury
shares
|
Hedging
Reserve
|
|||||||||||||||||||||||||||||||||||||
|
Total
|
||||||||||||||||||||||||||||||||||||||||
|
€ in thousands
|
||||||||||||||||||||||||||||||||||||||||
|
Balance as at January 1, 2019
|
19,980
|
58,344
|
758
|
(1,736
|
)
|
1,396
|
(227
|
)
|
-
|
78,515
|
(1,558
|
)
|
76,957
|
|||||||||||||||||||||||||||
|
Profit (loss) for the year
|
-
|
-
|
12,060
|
-
|
-
|
-
|
-
|
12,060
|
(2,276
|
)
|
9,784
|
|||||||||||||||||||||||||||||
|
Other comprehensive loss for the year
|
-
|
-
|
-
|
-
|
2,960
|
(846
|
)
|
-
|
2,114
|
(857
|
)
|
1,257
|
||||||||||||||||||||||||||||
|
Total comprehensive loss for the year
|
-
|
-
|
12,060
|
-
|
2,960
|
(846
|
)
|
-
|
14,174
|
(3,133
|
)
|
11,041
|
||||||||||||||||||||||||||||
|
Transactions with owners of the Company, recognized directly in equity:
|
||||||||||||||||||||||||||||||||||||||||
|
Sale of shares in subsidiaries to
|
||||||||||||||||||||||||||||||||||||||||
|
non-controlling interests
|
-
|
-
|
-
|
-
|
-
|
-
|
5,439
|
5,439
|
5,374
|
10,813
|
||||||||||||||||||||||||||||||
|
Purchase of shares in subsidiaries from non-controlling interests
|
-
|
-
|
-
|
-
|
-
|
-
|
667
|
667
|
254
|
921
|
||||||||||||||||||||||||||||||
|
Issuance of ordinary shares
|
2,010
|
5,797
|
-
|
-
|
-
|
-
|
-
|
7,807
|
-
|
7,807
|
||||||||||||||||||||||||||||||
|
Options exercise
|
8
|
11
|
-
|
-
|
-
|
-
|
-
|
19
|
-
|
19
|
||||||||||||||||||||||||||||||
|
Share-based payments
|
-
|
8
|
-
|
-
|
-
|
-
|
-
|
8
|
-
|
8
|
||||||||||||||||||||||||||||||
|
Balance as at
|
||||||||||||||||||||||||||||||||||||||||
|
December 31, 2019
|
21,998
|
64,160
|
12,818
|
(1,736
|
)
|
4,356
|
(1,073
|
)
|
6,106
|
106,629
|
937
|
107,566
|
||||||||||||||||||||||||||||
|
Balance as at January 1, 2018
|
19,980
|
58,339
|
(299
|
)
|
(1,736
|
)
|
2,219
|
138
|
-
|
78,641
|
(1,141
|
)
|
77,500
|
|||||||||||||||||||||||||||
|
Profit (loss) for the year
|
-
|
-
|
1,057
|
-
|
-
|
-
|
-
|
1,057
|
(453
|
)
|
604
|
|||||||||||||||||||||||||||||
|
Other comprehensive loss for the year
|
-
|
-
|
-
|
-
|
(823
|
)
|
(365
|
)
|
-
|
(1,188
|
)
|
36
|
(1,152
|
)
|
||||||||||||||||||||||||||
|
Total comprehensive loss for the year
|
-
|
-
|
1,057
|
-
|
(823
|
)
|
(365
|
)
|
-
|
(131
|
)
|
(417
|
)
|
(548
|
)
|
|||||||||||||||||||||||||
|
Transactions with owners of the Company, recognized directly in equity:
|
||||||||||||||||||||||||||||||||||||||||
|
Share-based payments
|
-
|
5
|
-
|
-
|
-
|
-
|
-
|
5
|
-
|
5
|
||||||||||||||||||||||||||||||
|
Balance as at
|
||||||||||||||||||||||||||||||||||||||||
|
December 31, 2018
|
19,980
|
58,344
|
758
|
(1,736
|
)
|
1,396
|
(227
|
)
|
-
|
78,515
|
(1,558
|
)
|
76,957
|
|||||||||||||||||||||||||||
|
Non- controlling
|
Total
|
|||||||||||||||||||||||||||||||||||||||
|
Attributable to shareholders of the Company
|
Interests
|
Equity
|
||||||||||||||||||||||||||||||||||||||
| Retained
earnings (accumulated
|
Translation
Reserve from
Foreign
|
Transaction
reserve with
non-
controlling
|
||||||||||||||||||||||||||||||||||||||
|
Share
|
Share
|
Treasury
|
Hedging
|
|||||||||||||||||||||||||||||||||||||
|
capital
|
premium
|
deficit)
|
shares
|
Operations
|
Reserve
|
Interests
|
Total
|
|||||||||||||||||||||||||||||||||
|
US$ in thousands
|
||||||||||||||||||||||||||||||||||||||||
|
Convenience translation into US$ (exchange rate as at December 31, 2020: euro 1 = US$ 1.227)
|
||||||||||||||||||||||||||||||||||||||||
|
Balance as at January 1, 2020
|
26,987
|
78,711
|
15,725
|
(2,130
|
)
|
5,343
|
(1,316
|
)
|
7,491
|
130,811
|
1,151
|
131,962
|
||||||||||||||||||||||||||||
|
Profit (loss) for the year
|
-
|
-
|
(5,676
|
)
|
-
|
-
|
-
|
-
|
(5,676
|
)
|
(1,892
|
)
|
(7,568
|
)
|
||||||||||||||||||||||||||
|
Other comprehensive loss for the year
|
-
|
-
|
-
|
-
|
(654
|
)
|
1,735
|
-
|
1,081
|
1,720
|
2,801
|
|||||||||||||||||||||||||||||
|
Total comprehensive loss for the year
|
-
|
-
|
(5,676
|
)
|
-
|
(654
|
)
|
1,735
|
-
|
(4,595
|
)
|
(172
|
)
|
(4,767
|
)
|
|||||||||||||||||||||||||
|
Transactions with owners of the Company, recognized directly in equity:
|
||||||||||||||||||||||||||||||||||||||||
|
Issuance of ordinary shares
|
3,783
|
22,316
|
-
|
-
|
-
|
-
|
-
|
26,099
|
-
|
26,099
|
||||||||||||||||||||||||||||||
|
Options exercise
|
25
|
-
|
-
|
-
|
-
|
-
|
-
|
25
|
-
|
25
|
||||||||||||||||||||||||||||||
|
Share-based payments
|
-
|
61
|
-
|
-
|
-
|
-
|
-
|
61
|
-
|
61
|
||||||||||||||||||||||||||||||
|
Balance as at
|
||||||||||||||||||||||||||||||||||||||||
|
December 31, 2020
|
30,795
|
101,088
|
10,049
|
(2,130
|
)
|
4,689
|
419
|
7,491
|
152,401
|
979
|
153,380
|
|||||||||||||||||||||||||||||
|
For the year ended December 31
|
||||||||||||||||
|
2020
|
2019
|
2018
|
2020
|
|||||||||||||
|
€ in thousands
|
Convenience Translation into US$ in thousands (Note 3B)
|
|||||||||||||||
|
Cash flows from operating activities
|
||||||||||||||||
|
Profit (loss) for the year
|
(6,168
|
)
|
9,784
|
604
|
(7,568
|
)
|
||||||||||
|
Adjustments for:
|
||||||||||||||||
|
Financing expenses, net
|
3,634
|
8,153
|
2,091
|
4,458
|
||||||||||||
|
Capital gain
|
-
|
(18,770
|
)
|
-
|
-
|
|||||||||||
|
Depreciation and amortization
|
2,975
|
6,416
|
5,816
|
3,650
|
||||||||||||
|
Share-based payment transactions
|
50
|
8
|
5
|
61
|
||||||||||||
|
Share of profits of equity accounted investees
|
(1,525
|
)
|
(3,086
|
)
|
(2,545
|
)
|
(1,871
|
)
|
||||||||
|
Payment of interest on loan from an equity accounted investee
|
582
|
370
|
3,036
|
714
|
||||||||||||
|
Change in trade receivables and other receivables
|
(3,868
|
)
|
403
|
(17
|
)
|
(4,745
|
)
|
|||||||||
|
Change in other assets
|
179
|
(1,950
|
)
|
37
|
220
|
|||||||||||
|
Change in receivables from concessions project
|
1,426
|
1,329
|
1,431
|
1,749
|
||||||||||||
|
Change in accrued severance pay, net
|
-
|
9
|
15
|
-
|
||||||||||||
|
Change in trade payables
|
190
|
461
|
633
|
233
|
||||||||||||
|
Change in other payables
|
(1,226
|
)
|
5,336
|
(1,565
|
)
|
(1,504
|
)
|
|||||||||
|
Taxes on income (tax benefit)
|
(125
|
)
|
(287
|
)
|
215
|
(153
|
)
|
|||||||||
|
Income taxes paid
|
(119
|
)
|
(100
|
)
|
(77
|
)
|
(146
|
)
|
||||||||
|
Interest received
|
2,075
|
1,719
|
1,835
|
2,546
|
||||||||||||
|
Interest paid
|
(3,906
|
)
|
(6,083
|
)
|
(4,924
|
)
|
(4,792
|
)
|
||||||||
|
342
|
|
(6,072
|
)
|
5,986
|
420
|
|
||||||||||
|
Net cash provided by (used in) operating activities
|
(5,826
|
)
|
3,712
|
6,590
|
(7,148
|
)
|
||||||||||
|
For the year ended December 31,
|
||||||||||||||||
|
2020
|
2019
|
2018
|
2020
|
|||||||||||||
|
€ in thousands
|
Convenience Translation into US$ in thousands (Note 3B)
|
|||||||||||||||
|
Cash flows from investing activities:
|
||||||||||||||||
|
Acquisition of fixed assets
|
(128,420
|
)
|
(74,587
|
)
|
(3,708
|
)
|
(157,543
|
)
|
||||||||
|
Acquisition of subsidiary, net of cash acquired (see Note 6C and Note 6D)
|
(7,464
|
)
|
(1,000
|
)
|
(1,000
|
)
|
(9,157
|
)
|
||||||||
|
Compensation as per agreement with Erez Electricity Ltd.
|
1,418
|
-
|
-
|
1,740
|
||||||||||||
|
Repayment of loan from an equity accounted investee
|
1,978
|
-
|
1,540
|
2,427
|
||||||||||||
|
Loan to an equity accounted investee
|
(181 |
) |
- |
- |
(222 |
) |
||||||||||
|
Proceeds from sale of investments
|
-
|
34,586
|
-
|
-
|
||||||||||||
|
Advances on account of investments
|
(1,554
|
)
|
-
|
-
|
(1,906
|
)
|
||||||||||
|
Proceeds from marketable securities
|
1,800
|
-
|
3,316
|
2,208
|
||||||||||||
|
Acquisition of marketable securities
|
(1,481
|
)
|
-
|
-
|
(1,817
|
)
|
||||||||||
|
Proceeds from settlement of derivatives, net
|
-
|
532
|
664
|
-
|
||||||||||||
|
Proceed (investment) in restricted cash, net
|
23,092
|
(26,003
|
)
|
(3,107
|
)
|
28,329
|
||||||||||
|
Investment in short term deposit
|
(1,323
|
)
|
(6,302
|
)
|
-
|
(1,623
|
)
|
|||||||||
|
Repayment (grant) Loan to others
|
-
|
3,912
|
(3,500
|
)
|
-
|
|||||||||||
|
Net cash used in investing activities
|
(112,135
|
)
|
(68,862
|
)
|
(5,795
|
)
|
(137,564
|
)
|
||||||||
|
Cash flows from financing activities:
|
||||||||||||||||
|
Issuance of warrants
|
2,544
|
-
|
-
|
3,121
|
||||||||||||
|
Repayment of long-term loans and finance lease obligations
|
(3,959
|
)
|
(5,844
|
)
|
(17,819
|
)
|
(4,857
|
)
|
||||||||
|
Repayment of Debentures
|
(26,923
|
)
|
(9,836
|
)
|
(4,668
|
)
|
(33,029
|
)
|
||||||||
|
Cost associated with long term loans
|
(734
|
)
|
(12,218
|
)
|
-
|
(900
|
)
|
|||||||||
|
Proceeds from options
|
20
|
19
|
-
|
25
|
||||||||||||
|
Sale of shares in subsidiaries to non-controlling interests
|
-
|
13,936
|
-
|
-
|
||||||||||||
|
Acquisition of shares in subsidiaries from non-controlling interests
|
-
|
(2,961
|
)
|
-
|
-
|
|||||||||||
|
Issuance of ordinary shares
|
21,275
|
7,807
|
-
|
26,100
|
||||||||||||
|
Proceeds from long term loans, net
|
111,357
|
59,298
|
34,745
|
136,611
|
||||||||||||
|
Proceeds from issuance of Debentures, net
|
38,057
|
22,317
|
-
|
46,688
|
||||||||||||
|
Net cash provided by financing activities
|
141,637
|
72,518
|
12,258
|
173,759
|
||||||||||||
|
Effect of exchange rate fluctuations on cash and
|
||||||||||||||||
|
cash equivalents
|
(1,340
|
)
|
259
|
(133
|
)
|
(1,646
|
)
|
|||||||||
|
Increase in cash and cash equivalents
|
22,336
|
7,627
|
12,920
|
27,401
|
||||||||||||
|
Cash and cash equivalents at the beginning of year
|
44,509
|
36,882
|
23,962
|
54,603
|
||||||||||||
|
Cash and cash equivalents at the end of the year
|
66,845
|
44,509
|
36,882
|
82,004
|
||||||||||||
| A. |
Ellomay Capital Ltd. (hereinafter - the "Company"), is an Israeli Company operating in the business of renewable energy and a power generator and developer of renewable energy and power projects in Europe and Israel. As of December
31, 2020, the Company owns six photovoltaic plants (each, a “PV Plant” and, together, the “PV Plants”) that are connected to their respective national grids and operating as follows: (i) four photovoltaic plants in Spain with an
aggregate installed capacity of approximately 7.9 MWp; (ii) 51% of Talasol Solar S.L.U that owns a photovoltaic plant with a peak capacity of 300 MW in the municipality of Talaván, Cáceres, Spain and (iii) one photovoltaic plant in
Israel with an aggregate installed capacity of approximately 9 MWp. In addition, the Company indirectly owns: (i) 9.375% of Dorad Energy Ltd. (hereinafter - “Dorad”), (ii) 75% of Ellomay Pumped Storage (2014) Ltd. (increased to 83.333%
in January 2021), which is promoting a project to construct a 156 MW pumped storage hydro power plant in the Manara Cliff, Israel, (iii) Ellomay Solar S.L.U that is constructing a photovoltaic plant with a peak capacity of 28 MW in the
municipality of Talaván, Cáceres, Spain and (iv) Groen Gas Goor B.V., Groen Gas Oude-Tonge B.V. and Groen Gas Gelderland B.V., project companies operating anaerobic digestion plants in the Netherlands, with a green gas production
capacity of approximately 3 million, 3.8 million and 9.5 million (with a license to produce 7.5 million) Nm3 per year, respectively.
|
| B. |
Definitions:
|
| C. |
Effects of the spreading of the coronavirus:
|
| D. |
Material events in the reporting period
|
| 1. |
In December 2020, the Company indirectly acquired all issued and outstanding shares of Groen Gas Gelderland B.V. (“GG Gelderland”) through its wholly-owned subsidiary, Ellomay Luxembourg Holdings S.àr.l. (“Ellomay Luxembourg”). GG
Gelderland owns an operating anaerobic digestion plant in Gelderland, the Netherlands, with a permit that enables it to produce approximately 7.5 million Nm3 per year. The Company paid €1,567 thousand for the shares and the repayment of
shareholder loans. An additional shareholder loan of approximately €5,897 thousand was granted to GG Gelderland for the repayment of other existing loans as at the date of the acquisition. (See Note 6).
|
| 2. |
In February 2020, the Company issued 715,000 ordinary shares and warrants to purchase an additional 178,750 ordinary shares to several Israeli institutional investors in a private placement undertaken in accordance with Regulation S
of the Securities Act of 1933, as amended. The gross proceeds to the Company in connection with the private placement were NIS 50.05 million (approximately €13.5 million based on the Euro /NIS exchange rate at that time).
|
| 3. |
In July 2020, the Company issued 450,000 ordinary shares to several Israeli qualified investors in a private placement undertaken in accordance with Regulation S. The Company received gross proceeds of approximately NIS 31,725
thousand (approximately €8,097 thousand based on the Euro/NIS exchange rate at that time).
|
| 4. |
In October 2020, the Company completed a public offering in Israel of additional Series C Debentures and a of a new series of options ("Series 1 Options"), tradable on the Tel Aviv Stock Exchange, to purchase the Company’s
ordinary shares at an exercise price per share of NIS 150 (approximately €37.5 based on the Euro/NIS exchange rate at that time) subject to adjustments upon customary terms. The Company issued an aggregate principal amount of
NIS 154,000 thousand (approximately €38,520 thousand based on the Euro/NIS exchange rate at that time) of Series C Debentures and 385,000 Series 1 Options and received gross proceeds of approximately NIS 164,200 thousand
(approximately €41.1 million based on the Euro/NIS exchange rate at that time).
|
| A. |
Basis of preparation of the financial statements
|
| 1. |
The consolidated financial statements of the Company have been prepared in accordance with International Financial Reporting Standards (IFRS) as issued by the International Accounting Standards Board. The operating cycle of the
Company is one year.
|
|
The consolidated financial statements were authorized by the Company’s Board of Directors for issue on March 31, 2021.
|
| 2. |
Consistent accounting policies
|
|
The accounting policies set out below have been applied consistently to all periods presented in these consolidated financial statements.
|
| 3. |
Basis of measurement - The consolidated financial statements have been prepared on the historical cost basis, except for the following:
|
| (i) |
Investment in investee accounted for using the equity method;
|
| (ii) |
Marketable securities;
|
| (iii) |
Deferred tax assets and liabilities;
|
| (iv) |
Financial instruments measured at fair value through other comprehensive income;
|
| (v) |
Derivative financial instruments and other receivables measured at fair value through profit or loss; and
|
| (vi) |
Provisions.
|
| B. |
Significant accounting judgments, estimates and assumptions used in the preparation of the financial statements
The preparation of the Company's consolidated financial statements in conformity with IFRS requires management to make judgments, estimates and assumptions regarding circumstances and
events that involve considerable uncertainty, that affect the application of accounting policies and the reported amounts of assets, liabilities, income and expenses. Actual results may differ from these estimates. The Company’s
management prepares the estimates on the basis of past experience, various facts, external circumstances, and reasonable assumptions according to the pertinent circumstances of each estimate. Estimates and underlying assumptions are
reviewed on an ongoing basis. Revisions to accounting estimates are recognized in the period in which the estimates are revised and in any future periods affected. The key assumptions made in the financial statements with respect to
the future and other reasons for uncertainty with respect to estimates that have a significant risk of resulting in a material adjustment to carrying amounts of assets and liabilities within the next financial year are discussed
below:
Recoverable amount of cash generating unit:
The Company examines at the end of each reporting year whether there have been any events or changes in circumstances that indicate impairment of fixed assets. When indication of impairment revealed
the company checks whether the carrying amount of the fixed assets is recoverable.
Fair value measurement of non-trading derivatives:
Within the scope of the valuation of financial assets and derivatives not traded on an active market, management makes assumptions about inputs used in the valuation models. For
information on a sensitivity analysis of levels 2 and 3 financial instruments carried at fair value see Note 21 regarding financial instruments.
Recognition of deferred tax asset in respect of tax losses:
The probability that in the future there will be taxable profits against which carried forward losses can be utilized. See Note 19 regarding taxes on income.
|
| B. |
Significant accounting judgments, estimates and assumptions used in the preparation of the financial statements (cont'd)
Business combination:
Fair value of assets and liabilities acquired in a business combination. See Note 6 regarding subsidiaries.
Determination of fair value
Preparation of the financial statements requires the Company to determine the fair value of certain assets and liabilities.
When determining the fair value of an asset or liability, the Company uses observable market data as much as possible. There are three levels of fair value measurements in the fair
value hierarchy that are based on the data used in the measurement, as follows:
• Level 1: quoted prices (unadjusted) in active markets for identical assets or liabilities.
• Level 2: inputs other than quoted prices included within Level 1 that are observable, either directly or indirectly.
• Level 3: inputs that are not based on observable market data (unobservable inputs).
|
| C. |
Initial application of new standards, amendments to standards and interpretations
|
| (1) |
Amendment to IFRS 3, Business Combinations (“the Amendment”)
The Amendment clarifies when a transaction to acquire an operation is the acquisition of a "business" and when it is the acquisition of a group of assets that according to the standard is not
considered the acquisition of a "business". For the purpose of this examination, the Amendment added an optional concentration test which determines that if substantially all of the fair value of the acquired assets is
attributable to a group of similar identifiable assets or to a single identifiable asset, this will not be the acquisition of a business. In addition, the minimum requirements for definition as a business have been clarified,
and examples illustrating the aforesaid examination were added.
The Amendment is effective for transactions to acquire assets or businesses occurring in annual periods beginning on or after January 1, 2020.
Application of the Amendment will not have a material effect on the Company's financial statements. Nonetheless, the Amendment may have a material effect in the Company's future acquisitions.
|
| C. |
Initial application of new standards, amendments to standards and interpretations (cont'd)
|
| (2) |
Amendments to IFRS 9, Financial Instruments, IAS 39, Financial Instruments:
Recognition and Measurement and IFRS 7, Financial Instruments: Disclosures, Interest Rate Benchmark
Reform - Phase 1 ("the Amendments")
The Amendments include several mandatory reliefs relevant for examining whether a hedging relationship affected by the uncertainty arising from the IBOR interest rate reform (a reform that in the
future will lead to the replacement of interest rates such as the Libor and Euribor) qualifies for hedge accounting. Thus for example:
When determining the probability of occurrence of the hedged cash flows, the existing contractual cash flows should be used, and future changes arising from the IBOR reform should be ignored.
When performing a prospective assessment of effectiveness, the existing contractual terms of the hedged item and hedging item should be taken into consideration, and the uncertainties arising from
the reform be ignored.
The Amendments are applicable retrospectively. The relief included in the Amendments will end prospectively on the earlier of: the date the uncertainty arising from the reform no longer exists and
the date the hedging relationship was discontinued.
In the opinion of the Company, application of the Amendments is not expected to have a material effect on the financial statements. See Note 21 E regarding market risk.
|
| (3) |
Amendment to IAS 8, Accounting Policies, Changes in Accounting Estimates and Errors and to IAS 1, Presentation of Financial Statements (“the Amendment”)
The Amendment redefines the term "materiality" so that it be used consistently in the Conceptual Framework and in the other various standards.
According to the Amendment, information is material if omitting, misstating or obscuring it could reasonably be expected to influence decisions made by the primary users on the basis of the financial
statements.
The Amendment is applicable on a prospective basis for annual periods beginning on or after January 1, 2020.
In the opinion of the Company, application of the Amendment is not expected to have a material effect on the financial statements.
|
| A. |
Basis of consolidation and equity method accounting
|
| 1. |
Subsidiaries
Subsidiaries are entities controlled by the Company. The financial statements of subsidiaries are included in the consolidated financial statements from the date that control commences until the date
that control is lost. The accounting policies of subsidiaries have been changed when necessary to align them with the policies adopted by the Company.
|
| 2. |
Transactions eliminated upon consolidation
Intercompany balances and transactions, and any unrealized income and expenses arising from intercompany transactions, are eliminated in preparing the consolidated financial statements.
Unrealized gains arising from transactions with associates are eliminated against the investment to the extent of the Company’s interest in these investments. Unrealized losses are eliminated in the same way as unrealized
gains, but only to the extent that there is no evidence of impairment.
|
| 3. |
Investment in associates and joint ventures (equity accounted investees)
Associates are those entities in which the Company has significant influence, but not control or joint control, over the financial and operating policies. In assessing significant
influence, potential voting rights that are currently exercisable or convertible into shares of the investee are taken into account. Joint ventures are joint arrangements in which the Company has rights to the net
assets of the arrangement.
Associates and joint ventures are accounted for using the equity method (equity accounted investees) and are recognized initially at cost. The cost of the investment includes transaction
costs that are directly attributable to an expected acquisition of an associate or joint venture. The consolidated financial statements include the Company’s share of the income and expenses in profit or loss and of
other comprehensive income of equity accounted investees, after adjustments to align the accounting policies with those of the Company, from the date that significant influence commences until the date that significant
influence ceases. When the Company increases its interest in an equity accounted investee while retaining significant influence, it implements the acquisition method only with respect to the additional interest
obtained whereas the previous interest remains the same. When the Company’s share of losses exceeds its interest in an equity accounted investee, the carrying amount of that interest, including any long-term interests
that form a part thereof, is reduced to zero.
When the Company’s share of long-term interests that form a part of the investment in the investee is different from its share in the investee’s equity, the Company continues to
recognize its share of the investee’s losses, after the equity investment was reduced to zero, according to its economic interest in the long-term interests. The recognition of further losses is discontinued except
to the extent that the Company has an obligation or has made payments on behalf of the investee.
Long-term interests in associates and joint ventures that, in substance, form part of the net investment in the associate or joint venture, such as preferred shares and long-term loans
that their repayment is not expected and is unlikely to occur in the foreseeable future, are first accounted for in accordance with the guidance of IFRS 9 and then the equity method is applied in accordance with the
guidance of IAS 28.
|
| A. |
Basis of consolidation and equity method accounting (cont’d)
|
| 4. |
Business combinations
The Company implements the acquisition method to all business combinations. The acquisition date is the date on which the acquirer obtains control over the acquiree. Control exists when the Company is
exposed, or has rights, to variable returns from its involvement with the acquiree and it has the ability to affect those returns through its power over the acquiree. Substantive rights held by the Company and others are taken
into account when assessing control.
The Company recognizes goodwill on acquisition according to the fair value of the consideration transferred including any amounts recognized in respect of rights that do not confer control in the
acquiree as well as the fair value at the acquisition date of any pre-existing equity right of the Company in the acquiree, less the net amount of the identifiable assets acquired and the liabilities assumed.
If the Company pays a bargain price for the acquisition (including negative goodwill), it recognizes the resulting gain in profit or loss on the acquisition date. Furthermore, goodwill is not adjusted
in respect of the utilization of carry-forward tax losses that existed on the date of the business combination.
The consideration transferred includes the fair value of the assets transferred to the previous owners of the acquiree, the liabilities incurred by the acquirer to the previous owners of the acquiree
and equity instruments that were issued by the Company. In a step acquisition, the difference between the acquisition date fair value of the Company’s pre-existing equity rights in the acquiree and the carrying amount at that date
is recognized in profit or loss under other income or expenses.
Costs associated with the acquisitions that were incurred by the acquirer in the business combination such as: finder’s fees, advisory, legal, valuation and other professional or consulting fees, are
expensed in the period the services are received.
|
| 5. |
Non-controlling interests
Non-controlling interests comprise the equity of a subsidiary that cannot be attributed, directly or indirectly, to the parent company.
Measurement of non-controlling interests on the date of the business combination:
Non-controlling interests that are instruments that give rise to a present ownership interest and entitle the holder to a share of net assets in the event of liquidation (for example: ordinary
shares), are measured at the date of the business combination at either fair value, or at their proportionate interest in the identifiable assets and liabilities of the acquire, on a transaction-by-transaction basis. This
accounting policy choice does not apply to other instruments that meet the definition of non-controlling interests (for example: options to acquire ordinary shares). Such instruments will be measured at fair value or in
accordance with other relevant IFRSs.
Allocation of comprehensive income to the shareholders:
Profit or loss and any part of other comprehensive income are allocated to the owners of the Company and the non-controlling interests. Total comprehensive income is allocated to the owners of the
Company and the non-controlling interests even if the result is a negative balance of non-controlling interests.
Transactions with non-controlling interests, while retaining control
Transactions with non-controlling interests while retaining control are accounted for as equity transactions. Any difference between the consideration paid or received and the change in
non-controlling interests is included in the owners’ share in equity of the Company directly in retained earnings.
|
| A. |
Basis of consolidation and equity method accounting (cont’d)
Non-controlling interests (cont’d)
Transactions with non-controlling interests, while retaining control (cont’d)
The amount of the adjustment to non-controlling interests is calculated as follows:
For an increase in the holding rate, according to the proportionate share acquired from the balance of non-controlling interests in the consolidated financial statements prior to the
transaction.
For a decrease in the holding rate, according to the proportionate share realized by the owners of the subsidiary in the net assets of the subsidiary, including goodwill.
Furthermore, when the holding rate of the subsidiary changes, while retaining control, the Company re-attributes the accumulated amounts that were recognized in other comprehensive
income to the owners of the Company and the non-controlling interests.
Loss of control
Upon the loss of control, the Company derecognizes the assets and liabilities of the subsidiary, any non-controlling interests and the other components of equity related to the
subsidiary. The amounts recognized in capital reserves through other comprehensive income with respect to the same subsidiary are reclassified to profit or loss or to retained earnings in the same manner that would have been
applicable if the subsidiary had itself realized the same assets or liabilities.
|
| B. |
Functional and presentation currency
These consolidated financial statements are presented in euro, which is the Company’s functional currency, and have been rounded to the nearest thousand, except when otherwise
indicated. The functional currency is examined for the Company and for each of the subsidiaries separately. Items included in the financial statements of each of the Company’s subsidiaries and investee are measured using their
functional currency. The euro is the currency that represents the principal economic environment in which the Company operates.
Foreign currency transactions-
Transactions in foreign currencies are translated to the respective functional currencies of the Company at exchange rates at the dates of the transactions.
Monetary assets and liabilities denominated in foreign currencies at the reporting date are translated to the functional currency at the exchange rate at that date. The foreign
currency gain or loss on monetary items is the difference between amortized cost in the functional currency at the beginning of the year, adjusted for effective interest and payments during the year, and the amortized cost in foreign
currency translated at the exchange rate at the end of the year.
Non-monetary assets and liabilities denominated in foreign currencies that are measured at fair value are retranslated to the functional currency at the exchange rate at the date that
the fair value was determined. Non-monetary items that are measured in terms of historical cost in a foreign currency are translated using the exchange rate at the date of the transaction.
Foreign currency differences arising on translation are generally recognized in profit or loss, except for the following differences which are recognized in other comprehensive
income, arising on the translation of:
|
| - |
A financial liability designated as a hedge of the net investment in a foreign operation to the extent that the hedge is effective;
|
| B. |
Functional and presentation currency (cont’d)
Foreign operations (cont’d)-
|
| - |
Qualifying cash flow hedges to the extent the hedge is effective.
Foreign operations-
The assets and liabilities of foreign operations, including adjustments arising on acquisition, are translated at exchange rates at the reporting date. The income and expenses for each period
presented in the statement of profit or loss and other comprehensive income (loss) are translated at average exchange rates for the presented periods; however, if exchange rates fluctuate significantly, income and expenses are
translated at the exchange rates at the date of the transactions.
Foreign currency exchange differences are recognized in equity as a separate component of other comprehensive income (loss): "foreign currency translation adjustments".
When the foreign operation is a non-wholly-owned subsidiary of the Company, then the relevant proportionate share of the foreign operation translation difference is allocated to the non-controlling
interests. On a total or partial disposal of a foreign operation, the relevant part of the other comprehensive income (loss) is recognized in the statement of comprehensive income (loss).
Generally, foreign currency differences from a monetary item receivable from or payable to a foreign operation, including foreign operations that are subsidiaries, are recognized in profit or loss in
the consolidated financial statements. Foreign exchange gains and losses arising from a monetary item receivable from or payable to a foreign operation, the settlement of which is neither planned nor likely in the foreseeable
future, are considered to form part of a net investment in a foreign operation and are recognized in other comprehensive income, and are presented within equity as part of the translation reserve.
Presentation Currency-
For the convenience of the reader, the reported euro figures as of December 31, 2020 and for the year then ended, are presented in dollars, translated at the representative rate of exchange as of
December 31, 2020 (euro 0.815 = US$ 1.00). The dollar amounts presented in these financial statements should not be construed as representing amounts that are receivable or payable in dollars or convertible into dollars, unless
otherwise indicated.
|
| C. |
Financial instruments
Non-derivative Financial assets
The Company's financial assets include cash and cash equivalents, marketable securities, restricted cash, trade receivables, loan to an equity accounted investee, service
concession receivables and other receivables.
Initial recognition and measurement of financial assets
The Company initially recognizes loans, receivables and deposits on the date that they are created. All other financial assets, including assets designated at fair value through
profit or loss, are recognized initially on the trade date at which the Company becomes a party to the contractual provisions of the instrument. A financial asset is initially measured at fair value plus transaction costs that are
directly attributable to the acquisition or issuance of the financial asset (except for financial assets that are measured at fair value through profit and loss, for which transaction costs are recognized in profit and loss). A
trade receivable without a significant financing component is initially measured at the transaction price.
|
| C. |
Financial instruments (cont’d)
Non-derivative Financial assets (cont’d)
Derecognition of financial assets
Financial assets are derecognized when the contractual rights of the Company to the cash flows from the asset expire, or when the Company transfers the rights to receive the
cash flows on the financial asset in a transaction in which substantially all the risks and rewards of ownership of the financial asset are transferred.
Classification of financial assets into categories and the accounting treatment of each category
Financial assets are classified at initial recognition to one of the following measurement categories: amortized cost; fair value through other comprehensive income –
investments in debt instruments; fair value through other comprehensive income – investments in equity instruments; or fair value through profit or loss.
Financial assets are not reclassified in subsequent periods unless, and only if, the Company changes its business model for the management of financial debt assets, in which
case the affected financial debt assets are reclassified at the beginning of the period following the change in the business model.
A financial asset is measured at amortized cost if it meets both of the following conditions and is not designated at fair value through profit or loss:
|
| - |
It is held within a business model whose objective is to hold assets so as to collect contractual cash flows; and
|
| - |
The contractual terms of the financial asset give rise to cash flows representing solely payments of principal and interest on the principal amount outstanding on specified dates.
A debt instrument is measured at fair value through other comprehensive income if it meets both of the following conditions and is not designated at fair value through profit or loss:
|
| - |
It is held within a business model whose objective is achieved by both collecting contractual cash flows and selling financial assets; and
|
| - |
The contractual terms of the debt instrument give rise to cash flows representing solely payments of principal and interest on the principal amount outstanding on specified dates.
All financial assets not classified as measured at amortized cost or fair value through other comprehensive income as described above, as well as financial assets designated at fair value through profit
or loss, are measured at fair value through profit or loss.
Assessment whether cash flows are solely payments of principal and interest
For the purpose of assessing whether the cash flows are solely payments of principal and interest, ‘principal’ is defined as the fair value of the financial asset on initial recognition. ‘Interest’ is
defined as consideration for the time value of money, for the credit risk associated with the principal amount outstanding during a particular period of time and for other basic lending risks and costs, as well as a profit margin.
|
| C. |
Financial instruments (cont’d)
Non-derivative Financial assets – policy applicable as from January 1, 2018 (cont’d)
Assessment whether cash flows are solely payments of principal and interest (cont’d)
In assessing whether the contractual cash flows are solely payments of principal and interest, the Company considers the contractual terms of the
instrument. This includes assessing whether the financial asset contains a contractual term that could change the timing or amount of contractual cash flows such that it would not meet this condition. In making this
assessment, the Company considers:
|
| - |
Contingent events that would change the timing or amount of the cash flows;
|
| - |
Terms that may change the stated interest rate, including variable interest;
|
| - |
Extension or prepayment features; and
|
| - |
Terms that limit the Company's claim to cash flows from specified assets (for example a non-recourse financial asset).
A prepayment feature is consistent with the solely payments of principal and interest criterion if the prepayment amount substantially represents unpaid amounts of principal and interest on the
principal amount outstanding, which may include reasonable compensation, received or paid, for early termination of the contract. Additionally, for a financial asset acquired at a significant premium or discount compared to its
contractual stated value, a feature that permits or requires prepayment at an amount that substantially represents the contractual stated value plus accrued (but unpaid) interest (which may also include reasonable additional
compensation, received or paid, for early termination), is treated as consistent with this criterion if the fair value of the prepayment feature is insignificant at initial recognition.
Subsequent measurement and gains and losses
Financial assets at fair value through profit or loss
These assets are subsequently measured at fair value. Net gains and losses, including any interest income or dividend income, are recognized in profit or loss (other than certain derivatives
designated as hedging instruments).
Financial assets at amortized cost
These assets are subsequently measured at amortized cost using the effective interest method. The amortized cost is reduced by impairment losses. Interest income, foreign exchange gains and losses
and impairment are recognized in profit or loss. Any gain or loss on derecognition is recognized in profit or loss.
Classification of financial assets into categories and the accounting treatment of each category
The Company classifies its financial assets according to the following categories:
Held-to-maturity investments
If the Company has the positive intent and ability to hold debt securities to maturity, then such debt securities are classified as held-to-maturity. Held-to-maturity investments are recognized
initially at fair value plus any directly attributable transaction costs. Subsequent to initial recognition held-to-maturity investments are measured at amortized cost using the effective interest method, less any impairment
losses. Held-to-maturity financial assets include debentures.
|
| C. |
Financial instruments (cont’d)
Non-derivative financial assets – policy applicable before January 1, 2018 (cont’d)
Financial assets at fair value through profit or loss
A financial asset is classified at fair value through profit or loss if it is classified as held for trading or is designated as such upon initial recognition. Financial
assets are designated at fair value through profit or loss if the Company manages such investments and makes purchase and sale decisions based on their fair value in accordance with the Company’s documented risk management
or investment strategy, providing that the designation is intended to prevent an accounting mismatch, or the asset is a combined instrument including an embedded derivative.
Financial assets at fair value through profit or loss (cont'd)
Attributable transaction costs are recognized in profit or loss as incurred. Financial assets at fair value through profit or loss are measured at fair value, and changes
therein are recognized in profit or loss.
Financial assets designated at fair value through profit or loss also include equity investments that otherwise would have been classified as available for sale.
Financial assets classified as held-for-trading comprise securities that are held to support the Company’s short-term liquidity needs.
Loans and receivables
Loans and receivables are non-derivative financial assets with fixed or determinable payments that are not quoted in an active market. Such assets are recognized initially
at fair value plus any directly attributable transaction costs. Subsequent to initial recognition loans and receivables are measured at amortized cost using the effective interest method, less any impairment losses.
Loans and receivables comprise cash and cash equivalents, trade and other receivables, investments in non-marketable debentures and service concession receivables.
Cash and cash equivalents include cash balances available for immediate use and call deposits. Cash equivalents include short-term highly liquid investments (with original
maturities of three months or less) that are readily convertible into known amounts of cash and are exposed to insignificant risks of change in value. Bank overdrafts that are repayable on demand and form an integral part of
the Company’s cash management are included as a component of cash and cash equivalents for the purpose of the statement of cash flows.
Available-for-sale financial assets
Available-for-sale financial assets are non-derivative financial assets that are designated as available-for-sale or that are not classified in any of the previous
categories. The Company’s investments in equity securities and certain debt securities are classified as available-for-sale financial assets. Available-for-sale financial assets are recognized initially at fair value plus
any directly attributable transaction costs. Subsequent to initial recognition, they are measured at fair value and changes therein, other than impairment losses, foreign currency differences and the accrual of effective
interest on available-for-sale debt instruments, are recognized directly in other comprehensive income and presented within equity in a reserve for financial assets classified as available-for-sale. A dividend received in
respect of available-for-sale financial assets is recognized in profit or loss on the date the entity’s right to receive the dividend is established. When an investment is derecognized, the cumulative gain or loss in the
reserve for available-for-sale financial assets is transferred to profit or loss.
|
| C. |
Financial instruments (cont’d)
Non-derivative financial assets – policy applicable before January 1, 2018 (cont’d)
Non-derivative financial liabilities
The Company's financial liabilities include loans and borrowings, trade payables, other payables, finance lease obligations, debentures, long-term loans and other
long-term liabilities.
Initial recognition of financial liabilities
The Company initially recognizes debt securities issued on the date that they originated. All other financial liabilities are recognized initially on the trade date at
which the Company becomes a party to the contractual provisions of the instrument.
Subsequent measurement of financial liabilities
Financial liabilities (other than financial liabilities at fair value through profit or loss) are recognized initially at fair value less any directly attributable
transaction costs. Subsequent to initial recognition these financial liabilities are measured at amortized cost using the effective interest method. Financial liabilities are designated at fair value through profit or loss
if the Company manages such liabilities and their performance is assessed based on their fair value in accordance with the Company’s documented risk management strategy, providing that the designation is intended to
prevent an accounting mismatch, or the liability is a combined instrument including an embedded derivative.
Transaction costs directly attributable to an expected issuance of an instrument that will be classified as a financial liability are recognized as an asset in the
framework of deferred expenses in the statement of financial position. These transaction costs are deducted from the financial liability upon its initial recognition, or are amortized as financing expenses in the statement
of income when the issuance is no longer expected to occur.
Derecognition of financial liabilities
Financial liabilities are derecognized when the obligation of the Company, as specified in the agreement, expires or when it is discharged or cancelled.
Offset of financial instruments
Financial assets and liabilities are offset and the net amount presented in the statement of financial position when, and only when, the Company currently has a legal
right to offset the amounts and intends either to settle on a net basis or to realize the asset and settle the liability simultaneously.
Derivative financial instruments, including hedge accounting
The Company holds both derivative financial instruments to hedge its foreign currency and interest rate risk exposures and derivatives that do not serve hedging purposes.
Hedge accounting
The Company designates certain derivatives as hedging instruments in order to hedge changes in cash flows that relate to highly probable forecasted transactions and which
derive from changes in foreign currency exchange rates, fluctuation in the electricity prices and changes in the flow and interest on variable-rate loans. The Company continue to apply IAS 39 for the hedge accounting.
|
| C. |
Financial instruments (cont’d)
Derivative financial instruments, including hedge accounting (cont’d)
Hedge accounting (cont’d)
At the inception of the hedging relationship the Company documents its risk management objective and its hedging strategy. The Company also documents the economic
relationship between the hedged item and the hedging instrument, including whether the changes in cash flows of the hedged item and the hedging instrument are expected to offset each other.
The Company makes an assessment, both at the inception of the hedge relationship as well as on an ongoing basis, as to whether the hedging instruments are expected to be
“highly effective” in offsetting the changes in the fair value or cash flows of the respective hedged items during the period for which the hedge is designated, and whether the actual results of each hedge are within a
range of 80-125 percent.
Measurement of derivative financial instruments
Derivatives are recognized initially at fair value; attributable transaction costs are recognized in profit or loss as incurred. Subsequent to initial recognition,
derivatives are measured at fair value, and changes therein are accounted for as described below.
Cash flow hedges
When a derivative instrument is designated as a cash flow hedge, the effective portion of the changes in fair value of the derivative is recognized in other
comprehensive income, directly within a hedging reserve. The effective portion of changes in fair value of a derivative, recognized in other comprehensive income, is limited to the cumulative change in fair value of the
hedged item (based on present value), from inception of the hedge. The change in fair value in respect of the ineffective portion is recognized immediately in profit or loss.
If the result of a forecasted transaction is recognition of a non-financial asset, the amounts that were accumulated in the hedging reserve and the cost of hedging
reserve are included in the initial cost of the non-financial item upon its recognition. For all other hedged forecasted transactions, the amounts accumulated in the hedging reserve and cost of hedging reserve are
reclassified to profit or loss in the same period, or periods, in which the hedged forecasted future cash flows affect profit or loss.
If the hedge no longer qualifies as an accounting hedge, or the hedging instrument is sold, expires, is terminated or exercised, hedge accounting is discontinued on a
prospective basis. When hedge accounting is discontinued, the amounts accumulated in the past in the hedging reserve and cost of hedging reserve remain in the reserve, until such time as they are included in the initial
cost of the non-financial item (for hedged transactions whose result is a non-financial item), or until such time as they are reclassified to profit or loss in the period, or periods, in which the hedged forecasted
future cash flows affect profit or loss (for other cash flows hedges).
If the hedged future cash flows are no longer expected to occur, the amounts accumulated in the past in the hedging reserve and cost of hedging reserve are immediately
reclassified to profit or loss.
Economic hedges
Hedge accounting is not applied to derivative instruments that economically hedge financial assets and liabilities denominated in foreign currencies. Changes in the fair
value of such derivatives are recognized in profit or loss under financing income or expenses.
|
| C. |
Financial instruments (cont’d)
Derivative financial instruments, including hedge accounting (cont’d)
CPI-linked assets and liabilities that are not measured at fair value
The value of CPI-linked financial assets and liabilities, which are not measured at fair value, is re-measured every period in accordance with the actual
increase/decrease in the CPI.
Share capital
Ordinary shares
Ordinary shares are classified as equity. Incremental costs directly attributable to the issue of ordinary shares and share options and warrants are recognized as a
deduction from equity.
Treasury shares
When share capital recognized as equity is repurchased by the Company, the amount of the consideration paid, which includes directly attributable costs, net of any tax
effects, is recognized as a deduction from equity. Repurchased shares are classified as treasury shares. When treasury shares are sold or reissued subsequently, the amount received is recognized as an increase in equity,
and the resulting surplus on the transaction is carried to share premium, whereas a deficit on the transaction is deducted from retained earnings.
|
| D. |
Fixed assets
|
| 1. |
Recognition and measurement
Fixed assets items are measured at cost less accumulated depreciation and accumulated impairment losses. Cost includes expenditures that are directly attributable to the acquisition of the
fixed asset. The cost of self-constructed assets includes the cost of materials and direct labor, any other costs directly attributable to bringing the assets to a working condition for their intended use, an estimate of
the costs of dismantling and removing the items and restoring the site on which they are located (when the Company has an obligation to dismantle and remove the asset or to restore the site), and capitalized borrowing
costs. Project licenses are included in the cost of photovoltaic plants.
The costs of replacing part of a fixed asset item and other subsequent expenses are capitalized if it is probable that the future economic benefits associated with them will flow to the
Company and their cost can be measured reliably. The carrying amount of the replaced part of a fixed asset item is derecognized. The costs of day-to-day servicing are recognized in profit or loss as incurred.
Gains and losses on disposal of a fixed asset item are determined by comparing the net proceeds from disposal with the carrying amount of the asset, and are recognized in profit or loss.
|
| 2. |
Depreciation
Depreciation is a systematic allocation of the depreciable amount of an asset over its useful life. The depreciable amount is the cost of the asset, or other amount substituted for cost,
less its residual value. An asset is depreciated from the date it is ready for use, meaning the date it reaches the location and condition required for it to operate in the manner intended by management. Depreciation is
recognized in profit or loss on a straight-line basis over the estimated useful lives of each part of the fixed asset item.
|
| D. |
Fixed assets (cont’d)
Depreciation (cont’d)
The estimated useful lives are as follows:
|
|
%
|
Mainly %
|
|||||
|
Office furniture and equipment
|
6-33
|
33
|
||||
|
Photovoltaic plants in Spain
|
4
|
4
|
||||
|
Photovoltaic plants in Italy
|
5
|
5
|
||||
|
Anaerobic digestion plants in the Netherlands
|
8
|
8
|
||||
|
Leasehold improvements
|
Over the shorter of the lease period or the life of the asset
|
7
|
|
The estimated useful life of the project licenses of photovoltaic plants that are carried at cost is 20 years for the Company’s Italian
subsidiaries and 25 years for the Company’s Spanish subsidiaries. The estimated useful life of the project licenses of anaerobic digestion plants that are carried at cost is 12 years. The fixed assets' residual values,
useful lives and methods of depreciation are reviewed at each financial year-end and adjusted if appropriate.
|
| E. |
Capitalization of borrowing costs |
|
A qualifying asset is an asset that necessarily takes a substantial period of time to get ready for its
intended use or sale. Specific and non-specific borrowing costs are capitalized to qualifying assets throughout the period required for completion and construction until they are ready
for their intended use. Other borrowing costs are recognized as incurred as financing expenses in profit or loss.
|
| F. |
Impairment
Non-financial assets
|
|
The carrying amounts of the Company’s non-financial assets are reviewed at each reporting date to
determine whether there is any indication of impairment. If any such indication exists, then the asset’s recoverable amount is estimated.
The recoverable amount of an asset is the higher of its fair value less costs of disposal and its
value in use. In assessing value in use, the estimated future cash flows are discounted using a pre-tax discount rate that reflects the assessments
of market participants regarding the time value of money and the risks specific to the asset.
The recoverable amount of an asset that does not generate independent cash flows is determined for
the smallest group of assets that generates cash inflows from continuing use that are largely independent of the cash inflows of other assets
(“cash-generating unit”). An impairment loss is recognized if the carrying amount of an asset or cash-generating unit exceeds its estimated
recoverable amount. Impairment losses are recognized in profit or loss. An impairment loss of an asset, other than goodwill, is reversed only if
there have been changes in the estimates used to determine the asset's recoverable amount. An impairment loss is reversed only to the extent that
the asset’s carrying amount does not exceed the carrying amount that would have been determined, net of depreciation or amortization, if no
impairment loss had been recognized.
|
|
Investments in associates
|
|
An investment in an associate is tested for impairment when objective evidence indicates
there has been impairment such as: significant financial difficulty, probability that the associate will enter bankruptcy or other financial reorganization or losses in operation for a long period of
time. Goodwill that forms part of the carrying amount of an investment in an associate is not recognized separately, and therefore is not tested for impairment separately.
If objective evidence indicates that the value of the investment may have been impaired, the
Company estimates the recoverable amount of the investment, which is the greater of its value in use and its net selling price. In assessing value in use of an investment in an associate, the Company
estimates its share of the present value of estimated future cash flows that are expected to be generated by the associate, including cash flows from operations of the associate and the consideration from
the final disposal of the investment.
An impairment loss is recognized when the carrying amount of the investment, after applying
the equity method, exceeds its recoverable amount, and it is recognized in profit or loss under other expenses. An impairment loss is reversed only if there has been a change in the estimates used to
determine the recoverable amount of the investment after the impairment loss was recognized, and only to the extent that the investment’s carrying amount, after the reversal of the impairment loss, does
not exceed the carrying amount of the investment that would have been determined by the equity method if no impairment loss had been recognized.
|
| G. |
Share-based payment transactions
The Company's directors are entitled to, and certain of the Company’s employees receive, remuneration in the form of
equity-settled share-based payment transactions. The cost of equity-settled transactions with directors and employees is measured at the fair value of the equity instruments at the date on which they are granted. The
fair value is determined by using the Black-Scholes option-pricing model taking into account the terms and conditions upon which the instruments were granted, additional details are included in Note 17.
The cost of equity-settled transactions is recognized in profit or loss, together with a corresponding increase in equity,
over the period in which the service conditions are fulfilled, ending on the date on which the director or the employee becomes fully entitled to the award (the "vesting date"). The cumulative expense recognized for
equity-settled transactions at each reporting date until the vesting date reflects the extent to which the vesting period has expired and the Company's best estimate of the number of equity instruments that will
ultimately vest.
|
| H. |
Employee benefits
|
| 1. |
Short-term employee benefits:
Short-term employee benefits include salaries, paid annual leave, paid sick leave, recreation and social
security contributions. Short-term employee benefits are measured on an undiscounted basis and are expensed as the related services are rendered or upon the actual absence of the
employee when the benefit is not accumulated (such as maternity leave). A liability in respect of a cash bonus is recognized when the Company has a legal or constructive obligation
to make such payment as a result of past service rendered by an employee and the obligation can be estimated reliably.
|
| H. |
Employee benefits (cont’d)
|
| 2. |
Post-employment benefits:
The post-employment plans are usually financed by deposits with insurance companies and classified as a defined contribution plan or as a defined benefit plan.
The Company has defined contribution plans pursuant to Section 14 to the Israeli Severance Pay Law, 5723-1963 (the “Severance Pay Law”) with the vast majority of its
employees under which the Company pays fixed contributions and has no legal or constructive obligation to pay further amounts.
Contributions to the defined contribution plan in respect of severance or retirement pay are recognized as an expense in
profit or loss in the periods during which related services are rendered by employees and no additional provision is required in the financial statements.
The Company also operates a defined benefit plan in respect of severance pay pursuant to the Severance Pay Law. According to
the Severance Pay Law, employees are entitled to severance pay upon dismissal or retirement.
The Company makes current deposits in respect of severance pay obligations to pay compensation to certain of its employees
in their pension funds and insurance companies (the "plan assets"). Plan assets are not available to the Company's own creditors and cannot be returned directly to the Company. The liability for
employee benefits is presented in the statements of financial position at present value of the defined benefit obligation less the fair value of the plan assets.
|
| I. |
Provisions
A provision is recognized if the Company has a present obligation (legal or constructive) that can be
estimated reliably, as a result of a past event, and it is probable that an outflow of economic benefits will be required to settle the obligation. If the effect is material,
provisions are determined by discounting the expected future cash flows at a pre-tax rate that reflects current market assessments of the time value of money and the risks specific
to the liability without adjustment for the Company’s credit risk. The carrying amount of the provision is adjusted each period to reflect the time that has passed and the amount of
the adjustment is recognized as a financing expense.
A provision for legal claims is recognized if the Company has a present legal or constructive obligation as
a result of a past event, and it is more likely than not that an outflow of economic benefits will be required to settle the obligation and the amount of the obligation can be
estimated reliably.
|
| J. |
Leases
|
|
Policy applicable as from January 1, 2019
Determining whether an arrangement contains a lease
On the inception date of the lease, the Company determines whether the arrangement is a lease or contains a lease, while
examining if it conveys the right to control the use of an identified asset for a period of time in exchange for consideration. In its assessment of whether an arrangement conveys the right to control
the use of an identified asset, the Company assesses whether it has the following two rights throughout the lease term:
|
| (a) |
The right to obtain substantially all the economic benefits from use of the identified asset;
|
| (b) |
The right to direct the identified asset’s use.
|
|
Leased assets and lease liabilities
Contracts that award the Company control over the use of a leased asset
for a period of time in exchange for consideration, are accounted for as leases. Upon initial recognition, the Company recognizes a liability
at the present value of the balance of future lease payments (these payments do not include certain variable lease payments), and concurrently
recognizes a right-of-use asset at the same amount of the lease liability, adjusted for any prepaid or accrued lease payments, plus initial
direct costs incurred in respect of the lease.
Since the interest rate implicit in the Company's leases is not readily
determinable, the incremental borrowing rate of the lessee is used. Subsequent to initial recognition, the right-of-use asset is accounted for
using the cost model, and depreciated over the shorter of the lease term or useful life of the asset.
The Company has elected to apply the practical expedient by which
short-term leases of up to one year and/or leases in which the underlying asset has a low value, are accounted for such that lease payments
are recognized in profit or loss on a straight-line basis, over the lease term, without recognizing an asset and/or liability in the statement
of financial position.
The lease term
The lease term is the non-cancellable period of the lease plus periods
covered by an extension or termination option if it is reasonably certain that the lessee will or will not exercise the option, respectively.
Variable lease payments
Variable lease payments that depend on an index or a rate, are
initially measured using the index or rate existing at the commencement of the lease and are included in the measurement of the lease
liability. When the cash flows of future lease payments change as the result of a change in an index or a rate, the balance of the liability
is adjusted against the right-of-use asset.
Other variable lease payments that are not included in the measurement
of the lease liability are recognized in profit or loss in the period in which the event or condition that triggers payment occurs.
|
| J. |
Leases (cont’d) |
|
Policy applicable as from January 1, 2019 (cont’d)
|
|
Depreciation of right-of-use asset
After lease commencement, a right-of-use asset is measured on a cost basis less accumulated depreciation and accumulated impairment
losses and is adjusted for re-measurements of the lease liability. Depreciation is calculated on a straight-line basis over the useful life or contractual lease period, whichever
earlier, as follows:
|
|
●
Lands 20-40
years
● Machinery
equipment 1-4 years
|
|
Reassessment of lease liability
Upon the occurrence of a significant event or a significant change in circumstances that is under the control
of the Company and had an effect on the decision whether it is reasonably certain that the Company will exercise an option, which was not included before in the
lease term, or will not exercise an option, which was previously included in the lease term, the Company re-measures the lease liability according to the
revised leased payments using a new discount rate. The change in the carrying amount of the liability is recognized against the right-of-use asset, or
recognized in profit or loss if the carrying amount of the right-of-use asset was reduced to zero.
The criteria for classifying leases as finance or operating leases depend on the substance of the agreements
and classification is made at the inception of the lease.
Finance leases: leases where the Company
assumes substantially all the risks and rewards incident to ownership of the leased asset are classified as Finance leases. Upon initial recognition
the leased assets are measured and a liability is recognized at an amount equal to the lower of its fair value and the present value of the minimum lease
payments. The lease payments are allocated to each period during the lease term and apportioned between finance expenses and a reduction of the lease
obligation. Subsequent to initial recognition, the asset is accounted for in accordance with the accounting policy applicable to that asset.
Other leases are classified as Operating leases: the leased assets are not recognized in the
Company’s statement of financial position. Payments made under operating leases are recognized in the statements of comprehensive income (loss) on a
straight-line basis over the term of the lease.
Determining whether an arrangement contains a lease
At inception or upon reassessment of an arrangement, the Company determines whether such an arrangement is or
contains a lease. An arrangement is a lease or contains a lease if the following two criteria are met:
|
| - |
The fulfillment of the arrangement is dependent on the use of a specific asset or assets; and |
| - |
The arrangement contains rights to use the asset.
At inception or upon reassessment of the arrangement, the Company separates payments and other consideration required
by such an arrangement into those for the lease and those for other elements on the basis of their relative fair values.
If the Company concludes for a finance lease that it is impracticable to separate the payments reliably, an asset and a
liability are recognized at an amount equal to the fair value of the underlying asset. Subsequently the liability is
reduced as payments are made and an imputed finance charge on the liability is recognized using the buyer’s incremental
borrowing rate.
|
| J. |
Leases (cont’d)
Leased assets and lease liabilities
Leases, including leases of lands from the Israel Lands Administration or from other third parties, where the Company assumes substantially all
the risks and rewards of ownership are classified as finance leases. Upon initial recognition the leased assets are measured and a liability is recognized at an amount equal to the lower of its fair value and the
present value of the minimum lease payments. Future payments for exercising an option to extend the lease from the Israel Lands Administration are not recognized as part of an asset and corresponding liability since
they constitute contingent lease payments that are derived from the fair value of the land on the future dates of renewing the lease agreement.
Subsequent to initial recognition, the asset is accounted for in accordance with the accounting policy applicable to that asset.
Prepaid lease fees to the Israel Lands Administration in respect of land leases classified as operating leases are presented on the statement of
financial position as prepaid expenses and recognized in profit or loss over the lease period. The lease period takes into consideration an option to extend the lease period if at the beginning of the lease it was
probable that the option will be exercised.
Lease payments
Payments made under operating leases, other than conditional lease payments, are recognized in profit or loss on a straight-line basis over the
term of the lease.
Minimum lease payments made under finance leases are apportioned between the financing expense and the reduction of the outstanding liability.
The financing expense is allocated to each period during the lease term so as to produce a constant periodic rate of interest on the remaining balance of the liability. Contingent lease payments are accounted for by
revising the minimum lease payments over the remaining term of the lease when the lease adjustment is confirmed.
|
| K. |
Revenue recognition
The Company recognizes revenue when the customer obtains control over the promised goods. The revenue is measured
according to the amount of the consideration to which the Company expects to be entitled in exchange for the goods promised to the customer, other than amounts collected for third parties.
Revenues from the sale of electricity and gas are recognized when the units produced are transferred to the grid at
connection points on the basis of a meter reading.
Revenues in respect of units produced and transferred to the grid in the period between the most recent meter reading and
the date of the statement of financial position, are included based on an estimate.
|
| K. |
Revenue recognition (cont’d)
Identifying the contract
The Company accounts for a contract with a customer only when the following conditions are met:
|
| (a) |
The parties to the contract have approved the contract (in writing, orally or according to other customary business practices) and they are committed to satisfying the obligations attributable to them;
|
| (b) |
The Company can identify the rights of each party in relation to the goods that will be transferred;
|
| (c) |
The Company can identify the payment terms for the goods that will be transferred;
|
| (d) |
The contract has a commercial substance (i.e. the risk, timing and amount of the entity’s future cash flows are expected to change as a result of the contract);and
|
| (e) |
It is probable that the consideration, to which the Company is entitled to in exchange for the goods transferred to the customer, will be collected.
|
|
For the purpose of paragraph (e) the Company examines, inter alia, the percentage of the advance payments received and the spread of the
contractual payments, past experience with the customer and the status and existence of sufficient collateral.
If a contract with a customer does not meet all of the above criteria, consideration received from the customer is recognized as a liability
until the criteria are met or when one of the following events occurs: the Company has no remaining obligations to transfer goods to the customer and any consideration promised by the customer has been received and
cannot be returned; or the contract has been terminated and the consideration received from the customer cannot be refunded.
Determining the transaction price
The transaction price is the amount of the consideration to which the Company expects to be entitled in exchange for the goods promised to
the customer.
Contract modifications
A contract modification is a change in the scope or price (or both) of a contract that was approved by the parties to the contract. A
contract modification can be approved in writing, orally or be implied by customary business practices. A contract modification can take place also when the parties to the contract have a disagreement regarding the
scope or price (or both) of the modification or when the parties have approved the modification in scope of the contract but have not yet agreed on the corresponding price modification.
When a contract modification has not yet been approved by the parties, the Company continues to recognize revenues according to the existing
contract, while disregarding the contract modification, until the date the contract modification is approved or the contract modification is legally enforceable.
The Company accounts for a contract modification as an adjustment of the existing contract since the remaining goods after the contract
modification are not distinct and therefore constitute a part of one performance obligation that is partially satisfied on the date of the contract modification. The effect of the modification on the transaction
price is recognized as an adjustment to revenues (increase or decrease) on the date of the contract modification, meaning on a catch-up basis.
|
| K. |
Revenue recognition (cont’d)
Seasonality
Solar power production has a seasonal cycle due to its dependency on the direct and indirect sunlight and the effect the amount of sunlight
has on the output of energy produced. Thus, low radiation levels during the winter months decrease power production.
Service concession arrangements
Operation revenue is recognized in the period in which the goods are provided by the Company.
Sale of goods
Revenue from the sale of goods in the ordinary course of business is measured at the fair value of the consideration received or receivable,
net of returns and discounts. When the credit period is short and constitutes the accepted credit in the industry, the future consideration is not discounted.
Revenue is recognized when persuasive evidence exists (usually in the form of an executed sales agreement) that the significant risks and
rewards of ownership have been transferred to the buyer, recovery of the consideration is probable, the associated costs and possible return of goods can be estimated reliably, there is no continuing management
involvement with the goods, and the amount of revenue can be measured reliably. Transfers of risks and rewards vary depending on the individual terms of the contract of sale. Transfer usually occurs when the
products are received by the customer.
|
| L. |
Income tax
Income tax comprises of current tax and deferred tax. Current tax and deferred tax are recognized in profit or loss
except to the extent that the tax arises from items which are recognized directly in equity. In such cases, the tax effect is also recognized in the relevant item in equity.
Current tax is the expected tax payable (or receivable) on the taxable income for the year, using tax rates enacted
or substantively enacted at the reporting date. Current taxes also include taxes in respect of prior years. Current tax assets and liabilities are offset if there is a legally enforceable
right to offset current tax liabilities and assets, and there is intent to settle current tax liabilities and assets on a net basis or the tax assets and liabilities will be realized
simultaneously.
Deferred tax is recognized in respect of temporary differences between the carrying amounts of assets and
liabilities for financial reporting purposes and the amounts used for taxation purposes, except for a limited number of exceptions:
|
| - |
The initial recognition of goodwill,
|
| - |
The initial recognition of assets and liabilities in a transaction that is not a business combination and that affects neither accounting nor taxable profit or loss, and
|
| L. |
Income tax (cont'd) |
| - |
Differences relating to investments in subsidiaries, joint arrangements and associates, to the extent that the Company is able to control the timing of the reversal of the temporary difference and it is probable that they will not
reverse in the foreseeable future, either by way of selling the investment or by way of distributing dividends in respect of the investment.
A deferred tax asset is recognized for unused tax losses, tax benefits and deductible temporary differences, to the extent that it is probable that future taxable profits will be available against which
they can be utilized. Deferred tax assets are reviewed at each reporting date and are reduced to the extent that it is no longer probable that the related tax benefit will be realized.
Deferred tax assets that were not recognized are reevaluated at each reporting date and recognized if it has become probable that future taxable profits will be available against which they can be
utilized.
The measurement of deferred tax reflects the tax consequences that would follow the manner in which the Company expects, at the end of the reporting period, to recover or settle the carrying amount of its
assets and liabilities. Deferred tax is measured at the tax rates that are expected to apply to temporary differences when they reverse, based on tax laws that have been enacted or substantively enacted by the balance sheet date.
Deferred tax assets and liabilities are offset if there is a legally enforceable right to offset deferred tax liabilities and assets, and they relate to income taxes levied by the same tax authority on
the same taxable entity, or on different tax entities, but they intend to settle deferred tax liabilities and assets on a net basis or their deferred tax assets and liabilities will be realized simultaneously.
A provision for uncertain tax positions, including additional tax and interest expenses, is recognized when it is more probable than not that the Company will have to use its economic resources to pay the
obligation.
|
| M. |
Earnings (loss) per share
The Company presents basic and diluted earnings per share (EPS) data for its ordinary shares. Basic EPS is calculated by dividing the profit
or loss attributable to ordinary shareholders of the Company by the weighted average number of ordinary shares outstanding during the year, adjusted for treasury shares. Diluted EPS is determined by adjusting the
profit or loss attributable to ordinary shareholders of the Company and the weighted average number of ordinary shares outstanding, after adjustment for treasury shares, for the effects of all dilutive potential
ordinary shares, which comprise share options granted to directors and employees.
|
| N. |
Financing income and expenses
Financing income comprises interest income on bank deposits and marketable securities, gains on changes in the fair value of financial assets at
fair value through profit or loss, gains on hedging instruments that are recognized in profit or loss and exchange rate differences. Interest income is recognized as it accrues. Changes in the fair value of financial
assets at fair value through profit or loss also include income from dividends and interest.
Financing expenses consist of bank charges, interest expenses on borrowings and debentures, changes in the fair value of financial assets at
fair value through profit or loss, losses on hedging instruments that are recognized in profit or loss, and exchange rate differences.
Borrowing costs, which are not capitalized to qualifying assets, are recognized in profit or loss using the effective interest method. Foreign
currency gains and losses on financial assets and financial liabilities are reported on a net basis as either financing income or financing expenses depending on whether foreign currency movements are in a net gain or
net loss position.
In the statements of cash flows, interest received and Interest paid are presented as part of cash flows from operating activities.
|
| O. |
Service concession arrangements
As part of service concession arrangements with Government bodies for the construction and operation of a facility in
consideration for fixed and variable payments, the Company recognizes a financial asset commencing from the start of the construction of the facility when it has an unconditional right to
receive cash or some other financial asset for the construction services. The financial asset reflects the unconditional payments receivable in the future from the Government body and bears an
appropriate rate of interest for risk that is determined based on the risk of the customer. The aforementioned financial assets are stated at fair value upon initial recognition and at amortized
cost in subsequent periods.
As from January 1, 2018, the Company's right to receive consideration for the construction services, constitutes a
contract asset until the end of the construction period.
In projects accounted for using the financial asset model, when at the end of the construction period there is an
unconditional right (other than that of the passing of time) to receive consideration for the construction services, the contract asset is classified to receivables (financial asset) according
to the carrying amount of the contract asset. When at the end of the construction period the right to receive consideration for the construction services is conditional on other than the passing
of time (such as current operation of the facility), the contract asset is not reclassified until the right to receive consideration is unconditional, which for certain projects means
classification as a contract asset until actual receipt of the consideration.
|
| P. |
New standards, amendments to standards and interpretations not yet adopted |
| (1) |
Amendment to IAS 1, Presentation of Financial Statements: Classification of Liabilities as Current or Non-Current (“the Amendment”)
The Amendment replaces certain requirements for classifying liabilities as current or non-current. Thus for example, according to the Amendment, a liability will be classified as
non-current when the entity has the right to defer settlement for at least 12 months after the reporting period, and it "has substance" and is in existence at the end of the reporting period, this instead of the requirement that there
be an "unconditional" right. According to the Amendment, a right is in existence at the reporting date only if the entity complies with conditions for deferring settlement at that date. Furthermore, the Amendment clarifies that the
conversion option of a liability will affect its classification as current or non-current, other than when the conversion option is recognized as equity. The Amendment is effective for reporting periods beginning on or after January
1, 2023 with earlier application being permitted. The Amendment is applicable retrospectively, including an amendment to comparative data.
The Company has not yet commenced examining the effects of applying the Amendment on the financial statements.
|
| (2) |
Amendment to IAS 37, Provisions, Contingent Liabilities and Contingent Assets (“the Amendment”)
According to the Amendment, when assessing whether a contract is onerous, the costs of fulfilling a contract that should be taken into consideration are costs that relate directly to
the contract, which include as follows:
- Incremental costs; and
- An allocation of other costs that relate directly to fulfilling a contract (such as depreciation expenses for fixed
assets used in fulfilling that contract and other contracts).
The Amendment is effective retrospectively for annual periods beginning on or after January 1, 2022, in respect of contracts where the entity has not yet fulfilled all its
obligations. Early application is permitted. Upon application of the Amendment, the entity will not restate comparative data, but will adjust the opening balance of retained earnings at the date of initial application, by the amount
of the cumulative effect of the Amendment.
The Company has not yet commenced examining the effects of applying the Amendment on the financial statements.
|
| (3) |
Amendment to IAS 16, Property, Plant and Equipment (“the Amendment”)
The Amendment annuls the requirement by which in the calculation of costs directly attributable to fixed assets, the net proceeds from selling certain items that were produced while
the Company tested the functioning of the asset should be deducted (such as samples that were produced when testing the equipment). Instead, such proceeds shall be recognized in profit or loss according to the relevant standards and
the cost of the sold items will be measured according to the measurement requirements of IAS 2, Inventories. The Amendment is effective for annual periods beginning on or after January 1, 2022. Early application is permitted. The
Amendment shall be applied on a retrospective basis, including an amendment of comparative data, only with respect to fixed asset items that have been brought to the location and condition required for them to operate in the manner
intended by management subsequent to the earliest reporting period presented at the date of initial application of the Amendment. The cumulative effect of the Amendment will adjust the opening balance of retained earnings for the
earliest reporting period presented.
The Company commences examining the effects of applying the Amendment on the financial statements.
|
| P. |
New standards, amendments to standards and interpretations not yet adopted (cont'd) |
| (4) |
Amendment to IFRS 3, Business Combinations (“the Amendment”)
The Amendment replaces the requirement to recognize liabilities from business combinations in accordance with the conceptual framework, the reason being that the interaction between
those instructions and the guidance provided in IAS 37 regarding recognition of liabilities was unclear in certain cases. The Amendment adds an exception to the principle for recognizing liabilities in IFRS 3. According to the
exception, contingent liabilities are to be recognized according to the requirements of IAS 37 and IFRIC 21 and not according to the conceptual framework. The Amendment prevents differences in the timing of recognizing liabilities
that could have led to the recognition of gains and losses immediately after the business combination (day 2 gain or loss). The Amendment also clarifies that contingent assets are not to be recognized on the date of the business
combination.
The Amendment is effective for annual periods beginning on or after January 1, 2022.
The Company has not yet commenced examining the effects of applying the Amendment on the financial statements.
|
| (5) |
Amendment to IFRS 9, Financial Instruments, IAS 39, Financial Instruments:
Recognition and Measurement, IFRS 7, Financial Instruments: Disclosures, IFRS 4 Insurance Contracts and IFRS 16, Leases, Interest Rate Benchmark Reform – Phase 2 ("the Amendments")
The Amendments include practical expedients regarding the accounting treatment of modifications in contractual terms that are a result of the interest rate benchmark reform (a
reform that in the future will lead to the replacement of interest rates such as the Libor and Euribor). Thus for example:
- When certain modifications are made in the terms of financial assets or financial liabilities as a result of the
reform, the entity shall update the effective interest rate of the financial instrument instead of recognizing a gain or loss.
- Certain modifications in lease terms that are a result of the reform shall be accounted for as an update to lease
payments that depend on an index or rate.
- Certain modifications in terms of the hedging instrument or hedged item that are a result of the reform shall not
lead to the discontinuance of hedge accounting.
The Amendments are applicable retrospectively as from January 1, 2021 with early application permitted. All the amendments are applicable retrospectively by amending the opening
balance of equity for the annual reporting period in which the amendment was adopted without a restatement of comparative data. Restatement of comparative data is permitted if this is possible without using "hindsight".
In the opinion of the Company, application of the Amendments is not expected to have a material effect on the financial statements. See Note 21 E regarding market risk.
|
|
December 31
|
||||||||
|
2020
|
2019
|
|||||||
|
€ in thousands
|
||||||||
|
Cash
|
37,887
|
24,948
|
||||||
|
On call deposits
|
28,958
|
19,561
|
||||||
|
Cash and cash equivalents
|
66,845
|
44,509
|
||||||
|
Cash and cash equivalents in the statement of cash flows
|
66,845
|
44,509
|
||||||
|
December 31
|
||||||||
|
|
2020
|
2019
|
||||||
|
€ in thousands
|
||||||||
|
Marketable securities (1)
|
1,761
|
2,242
|
||||||
|
Short-term restricted cash
|
-
|
22,162
|
||||||
|
Short-term deposits
|
8,113
|
6,446
|
||||||
|
Long-term restricted non-interest bearing bank deposits (2)
|
2,138
|
3,094
|
||||||
|
Restricted cash, long-term bank deposits (3)
|
7,793
|
7,862
|
||||||
|
Long-term restricted cash and deposits
|
9,931
|
10,956
|
||||||
| (1) |
During 2020, the Company invested in a traded Corporate Bond (rated BB+ by Moody's) with a coupon rate of 5.569%.
|
| (2) |
Deposits used to secure obligations towards the Israeli Electricity Authority for the license for the pumped-storage project in the Manara Cliff in Israel and to secure obligations under loan
agreements (see Note 11).
|
| (3) |
Bank deposits used to secure obligations under loan agreements (see Note 11).
|
| A. |
Equity accounted investees
U. Dori Energy Infrastructures Ltd. (“Dori Energy”) –
On November 25, 2010, the Company through its wholly owned subsidiary, Ellomay Clean Energy Ltd. ("Ellomay Energy") entered into an Investment Agreement (the "Dori Investment Agreement") with Dori Group
Ltd. ("Dori Group") (currently Amos Luzon Entrepreneurship and Energy Group Ltd. – “Luzon Group”), and Dori Energy, with respect to an investment in Dori Energy. The Company holds 50% of Dori Energy that holds 18.75% of the share
capital of Dorad Energy Ltd. ("Dorad"), which owns an approximate 860 MWp dual-fuel operated power plant in the vicinity of Ashkelon, Israel (the "Dorad Power Plant").
Concurrently with the execution of the Dori Investment Agreement, Ellomay Energy, Dori Energy and Dori Group have also entered into the Dori Shareholders Agreement ("Dori SHA"). The
Dori SHA grants each of Dori Group and Ellomay Energy with equal rights to nominate directors in Dorad, provided that in the event Dori Energy is entitled to nominate only one director in Dorad, such director shall be nominated by
Ellomay Energy for so long as Ellomay Energy holds at least 30% of Dori Energy.
On May 12, 2014, Dorad was issued production licenses for 20 years and a supply license for one year and, on May 19, 2014, Dorad began commercial operation of the power plant. In July
2015, Dorad was issued a long term supply license that will expire on May 11, 2034.
As of December 31, 2020, subordinated shareholder loans granted by the Company to Dori Energy amount to approximately NIS 35,725 thousand (approximately €9,058 thousand). The
shareholder loans are linked to the Israeli CPI and bear an annual interest rate that is 3% higher than the interest Dorad is committed to pay to Dorad's financing consortium during the financial period in respect of the "senior debt"
(5.1% as of December 31, 2020).
During January and November 2018, Dorad repaid interest and principal on account of shareholders loans in the aggregate amount of approximately NIS 80,000 thousand and NIS 110,000 thousand, respectively
(approximately €19,265 thousand and €26,040 thousand, respectively based on the euro/NIS exchange rate at that time). During 2018, Dori Energy paid the Company an aggregate amount of approximately NIS 19,250 thousand (approximately
€4,576 thousand based on the euro/NIS exchange rate at that time) as repayment of shareholders loans. In June 2019, Dorad made the final repayment of shareholders loans in the aggregate amount of NIS 19 million, of which Dori Energy
received approximately NIS 3,733 thousand (approximately €896 thousand based on the euro/NIS exchange rate at that time). In connection with the June 2019 repayment by Dorad, the Company received an amount of NIS 1,500 thousand
(approximately €370 thousand based on the euro/NIS exchange rate at that time). In February 2020, Dorad declared a dividend distribution of NIS 120,000 thousand (approximately €31,600 based on the euro/NIS exchange rate at that time
thousand). In connection with such dividend distribution, in March 2020 Dori Energy received NIS 22,500 thousand (approximately €5,800 thousand based on the euro/NIS exchange rate at that time) and repaid an amount of NIS 10,250
thousand (approximately €2,560 thousand based on the euro/NIS exchange rate at that time) loan to the Company.
|
| A. |
Equity accounted investees (cont'd)
U. Dori Energy Infrastructures Ltd. (“Dori Energy”) (cont’d)–
As of December 31, 2020, Dorad provided, through its shareholders at their proportionate holdings and as required by the
financing agreements executed by Dorad, guarantees in favor of the Israeli Electricity Authority, the Israeli Electric Company (“IEC”) and the Israel Natural Gas Lines Ltd. Total performance guarantees provided by Dorad amounted to
approximately NIS 175,000 thousand (approximately €44,370 thousand ). The Company's indirect share of guarantees provided on behalf of Dorad by Dorad’s shareholders
is approximately NIS 16,406 thousand (approximately €4,160 thousand).
On December 24, 2018 the Israeli Electricity Authority published a decision regarding “Electricity Rates for Customers of IEC in 2019” which in accordance the average production component will
increase by about 3.3% from January 1, 2019 and will remain in effect to the end of 2019. On December 23, 2019, the Israeli Electricity Authority published a decision regarding "Annual Electricity Rate Update 2020", which, among
other things, averaged a 7.9% decrease in the production component as of January 1, 2020, and will remain in effect to the end of 2020. On December 27, 2020, the Israeli Electricity Authority published a decision regarding “2021
Annual Update to the Electricity Rate,” which, among other things, provided for a decrease of approximately 5.7% in the average production component commencing January 1, 2021 and effective throughout 2021.
In August 2019, the Israeli Electricity Authority published a proposed resolution that is subject to a public hearing concerning an amendment to the standards governing deviations from consumption
plans. These standards regulate the accounting mechanism in the event the actual consumer consumption is different than the consumption plan submitted by the electricity manufacturers, and include a mechanism protecting the
manufacturers from random deviations in actual consumption volumes. The Israeli Electricity Authority proposed revoking the protections included in the aforementioned standards, claiming that the manufacturers are misusing the
protections and regularly submit plans and forecasts that deviate from the actual expected consumption, and also seeks to impose financial sanctions on the manufacturers, which may be in material amounts upon the occurrence of
certain deviation events. On January 27, 2020, the Israeli Electricity Authority issued a resolution amending the standards and imposing financial sanctions in cases of certain extraordinary events that may add up to significant
sums. The resolution entered into effect as of September 1, 2020.
On November 22, 2020, the IEC filed a third-party notice against Dorad in connection with a class action submitted against the IEC claiming that the IEC was negligent in overseeing the private
electricity manufacturers thereby damaging the electricity consumers. The claim against the IEC alleges that the private electricity manufacturers provided false reports in the consumption plans they submitted to the system
manager in the IEC, based on the standards set by the Israeli Electricity Authority. At this point, based on the advice of legal counsel, Dorad cannot estimate the outcome of this legal proceeding.
The investment in Dori Energy is accounted for under the equity method.
|
| A. |
Equity accounted investees (cont'd)
U. Dori Energy Infrastructures Ltd. (“Dori Energy”) (cont’d)–
Dorad and its shareholders are involved in several legal proceedings as follows:
Petition to Approve a Derivative Claim filed by Dori Energy
On July 16, 2015, Dori Energy and Dori Energy’s representative on Dorad’s board of directors, Mr. Hemi Raphael , filed a petition (the "Petition"), for approval of a derivative
action on behalf of Dorad with the Economic Department of the Tel Aviv-Jaffa District Court. The Petition was filed originally against Zorlu Enerji Elektrik Uretim A.S, which holds 25% of Dorad (“Zorlu”), Zorlu’s current and past
representatives on Dorad’s board of directors and Wood Group Gas Turbines Services Ltd. (“Wood Group”) and several of its affiliates, and thereafter amended to add Mr. Ori Edelsburg (a director in Dorad) and affiliated companies.
Petition to Approve a Derivative Claim filed by Dori Energy (cont’d)
The petition requested, inter alia, that the court instruct the defendants to disclose and provide to Dorad documents and information relating to the contractual relationship
between Zorlu and Wood Group, which included the transfer of funds from Wood Group to Zorlu in connection with the EPC agreement of the Dorad Power Plant.
On December 27, 2016, this proceeding, as well as the two proceedings mentioned below, were moved to an arbitration proceeding. On February 23, 2017, a statement of claim was
filed by Dori Energy and Mr. Hemi Raphael on behalf of Dorad against Zorlu, Mr. Edelsburg, Edelcom Ltd. (“Edelcom”) and Edeltech Holdings 2006 Ltd. in which they repeated their claims included in the Petition and in which they
required the arbitrator to obligate the defendants, jointly and severally, to pay an amount of $183,367,953 plus interest and linkage to Dorad.
In April 2017, the defendants filed their statements of defense. Within the said statements of defense, Zorlu attached a third party notice against Dorad, Dori Energy and the
Luzon Group, in the framework of which it repeated the claims on which its defense statement was based and claimed, among other claims, that if the plaintiffs’ claim against Zorlu was accepted and would negate Zorlu’s right
receive compensation and profit from its agreement with Dorad and therefore Zorlu should be compensated in the amount of approximately NIS 906.4 million (approximately €218 million). Similarly, also within their statement of
defense, Edelcom, Mr. Edelsburg and Edeltech (together, the “Edelsburg Group”) filed a third party notice against Dori Energy claiming for breaches by Dori Energy of the duty to act in good faith in contract negotiations and that
any amount ruled will constitute unlawful enrichment.
On October 1, 2017, Eilat Ashkelon Infrastructure Services Ltd. (“EAIS”), which holds 37.5% of Dorad’s shares, filed a statement of claim in the arbitration proceedings. In its
statement of claim, EAIS joins Dori Energy’s and Mr. Raphael’s request as set forth in the statement of claim filed by them in the arbitration proceeding and raises claims that are similar to the claims raised by Dori Energy and
Mr. Raphael. In January 2018 the arbitrator provided its ruling that the legal validity of the actions or inactions of board members of Dorad will be attributed to the entities that are shareholders of Dorad on whose behalf the
relevant board member acted and the legal determinations, if any, will be directed only towards the shareholders of Dorad.
|
| A. |
Equity accounted investees (cont'd)
U. Dori Energy Infrastructures Ltd. (“Dori Energy”) (cont’d)–
Petition to Approve a Derivative Claim filed by Dori Energy (cont’d)
During January 2018, Mr. Edelsburg, Edelcom and Zorlu filed their statement of defense in connection with the claim filed by EAIS and also filed third party notices against
EAIS, Dori Energy and the Luzon Group claiming that EAIS and the Luzon Group enriched themselves at Dorad’s account without providing disclosure to the other shareholders and requesting that, should the position of Dori Energy
and EAIS be accepted in the main proceeding, the arbitrator, among other things, obligate EAIS to refund to Doard all of the rent paid to date and determine that Dorad is not required to pay any rent in the future or determine
that the rent fees be reduced to their market value and refund Dorad the excess amounts paid by it to EAIS, determine that the board members that represent EAIS and Dori Energy breached their fiduciary duties towards Dorad and
obligate EAIS and Dori Energy to pay the amount of $140 million (approximately €123 million), plus interest in the amount of $43 million (approximately €38 million), which is the amount Zorlu received for the sale of its rights
under the Dorad EPC agreement, and rule that in connection with the engineering and construction works performed by the Luzon Group, the Luzon Group and Dori Energy are required to refund to Dorad or compensate the defendants in
an amount of $24 million (approximately €21 million), plus interest and linkage and, alternatively, determine that Mr. Edelsburg, Edelcom and Zorlu are entitled to indemnification from the third parties for the entire amount
they will be required to pay.
In May 2019, a new arbitrator was appointed and dates were set for the discovery process. The evidentiary hearings were scheduled during March-June 2020 and commencing August
2020. Due to the COVID-19 crisis, several evidentiary hearings scheduled during the period commencing March 2020 were cancelled. Evidentiary hearings were held during June, August, September, October and November 2020 and
during February and March 2021 and the parties filed several motions in connection with the discovery process, the evidentiary hearings and expert opinions. Additional evidentiary hearings are scheduled for April-May 2021. On
February 15, 2021 the arbitrator approved replacing the late Mr. Hemi Raphael as the claimant with Mr. Ran Fridrich.
With respect to the said third party notices, the Company estimates (after consulting with legal counsel) that if the main (Derivative) claim is dismissed then the third party
notices will be redundant, whereas if the main claim is accepted, it is more likely than not that the third party notices shall be rejected, as they are based on arguments similar to those raised by the defendants in their
statements against of defense filed against the main claim. The Company estimates (after consulting with legal counsel), that at this stage it is not yet possible to assess the outcome of the proceeding.
Petition to Approve a Derivative Claim filed by Edelcom
On July 25, 2016, Edelcom, which holds 18.75% of Dorad, filed a petition for approval of a derivative action on behalf of Dorad (the “Edelcom Petition”) against Ellomay Energy,
Luzon Group, Dori Energy and Dorad following a letter delivered to Dorad on February 25, 2016. The Edelcom Petition refers to an entrepreneurship agreement that was signed on November 25, 2010 between Dorad and the Luzon Group,
pursuant to which the Luzon Group received payment in the amount of approximately NIS 49.4 million (approximately €11.9 million) in consideration for management and entrepreneurship services.
|
| A. |
Equity accounted investees (cont'd)
U. Dori Energy Infrastructures Ltd. (“Dori Energy”) (cont’d)–
Petition to Approve a Derivative Claim filed by Edelcom (cont’d)
Pursuant to this agreement, the Dori Group undertook to continue holding, directly or indirectly, at least 10% of Dorad’s share capital for a period of 12 months from the date
the Dorad Power Plant is handed over to Dorad by the construction contractor. The Edelcom Petition claims that as a consequence of the management rights and the options to acquire additional shares of Dori Energy granted to
the Company pursuant to the Dori Investment Agreement, the holdings of the Dori Group in Dorad have fallen below 10% upon execution of the Dori Investment Agreement. The Edelcom Petition therefore claims that Dori Group
breached its commitment according to entrepreneurship agreement and requests that a derivative action be approved to recover an amount of NIS 49.4 million, plus linkage and interest from the defendants. As noted above, on
December 27, 2016, this proceeding, along with the proceeding mentioned above and below, was moved to arbitration. For more information see above.
The Company estimates (after consulting with legal counsel), that as at December 31, 2020, it is not yet possible to assess the outcome of the proceeding.
Opening Motion filed by Zorlu
On April 8, 2019, Zorlu filed an opening motion with the District Court in Tel Aviv against Dorad and the directors serving on Dorad’s board on behalf of Dori Energy and EAIS.
In the opening motion, Zorlu asked the court to instruct Dorad to convene a shareholders meeting and to include a discussion and a vote on the planning and construction of an additional power plant adjacent to the existing
power plant (the “Dorad 2 Project”), on the agenda of this meeting. Zorlu claimed that while the articles of association of Dorad provides that the planning and construction of an additional power plant requires a unanimous
consent of the Dorad shareholders, and while Zorlu and Edelcom are opposed to this project, including due to the current disagreements among Dorad’s shareholders, Dorad continued taking actions to advance the project, which
include spending substantial amounts our of Dorad’s funds. Zorlu further claims that the representatives of Dori Energy and EAIS on the Dorad board have acted to prevent the convening of a shareholders meeting as requested by
Zorlu. On April 16, 2019, Edelcom submitted a request to join the opening motion as an additional respondent as Edelcom claims that it is another shareholder in Dorad that opposes the advancement of the project at this stage.
In addition, Edelcom joined Dori Energy and EAIS as additional respondents to its request, claiming that these entities are required to be part of the proceeding in order to reach a complete and efficient resolution. All
parties agreed to the joining of Edelcom, Dori Energy and EAIS to the proceeding. On June 15, 2019, Edelcom filed its response to the petition, requesting that the court accept the petition. On August 13, 2019, Dorad, EAIC and
the Dorad board members submitted their responses and requested that the petition be dismissed.
|
| A. |
Equity accounted investees (cont'd)
U. Dori Energy Infrastructures Ltd. (“Dori Energy”) (cont’d)–
On December 8, 2019 an evidentiary hearing was held. The parties filed their summations in writing during June and July 2020. On August 27, 2020, Dorad informed the District Court that the National Infrastructure Committee resolved, inter alia, to approve the presentation of the plan submitted by Doard in
connection with the additional power plant to the District Committee’s and the public’s comments, subject to amendments. On September 9, 2020, Eilat-Ashkelon Infrastructure Services Ltd., one of the shareholders of
Dorad, and its representatives on the Dorad board of directors submitted a response to the notice, claiming that the information included in the notice supports a rejection of the opening motion. Zurlo and Edelcom each
filed a response on September 13, 2020 asking to remove the notice provided by Dorad from the District Court’s file. On September 17, 2020, the District Court ruled that the notice will not be removed from the file. To the Company’s knowledge, the Dorad 2 Project is currently under initial internal examination by Dorad and there can be no assurance as to if, when and under what terms it will be
advanced or promoted by Dorad.
|
|
December 31
|
||||||||
|
2020
|
2019
|
|||||||
|
€ in thousands
|
||||||||
|
Investment in shares
|
24,047
|
23,580
|
||||||
|
Long-term loans
|
8,745
|
10,595
|
||||||
|
Deferred interest
|
(558
|
)
|
(614
|
)
|
||||
|
32,234
|
33,561
|
|||||||
| 2020 |
2019
|
|||||||
|
Changes in equity and loans:
|
€ in thousands
|
|||||||
|
Balance as at January 1
|
33,561
|
28,161
|
||||||
|
Long term loans extended
|
181
|
-
|
||||||
|
Repayment of long term loans
|
(2,560
|
)
|
(370
|
)
|
||||
|
Interest and reevaluation in connection with long term loans
|
758
|
782
|
||||||
|
Deferred interest
|
56
|
54
|
||||||
|
Elimination of interest on loan from related party
|
(676
|
)
|
(868
|
)
|
||||
|
The Company’s share of income
|
1,525
|
3,086
|
||||||
|
Foreign currency translation adjustments
|
(611
|
)
|
2,716
|
|||||
|
Balance as at December 31
|
32,234
|
33,561
|
||||||
| A. |
Equity accounted investees (cont'd)
|
| (a) |
Summary information on financial position
|
|
Equity
attributable to
the owners of the
Company
|
||||||||||||||||||||||||||||||||||||||||||||||||
|
Rate of
ownership
|
Current
Assets
|
Non-current
assets
|
Total
assets
|
Current
liabilities
|
Non-current
liabilities
|
Total
liabilities
|
Company’s
share
|
Surplus
Costs and
goodwill
|
Other
Adjustments
|
Carrying
Amount of
investment
|
||||||||||||||||||||||||||||||||||||||
|
%
|
€ in thousands
|
|||||||||||||||||||||||||||||||||||||||||||||||
|
2020
|
||||||||||||||||||||||||||||||||||||||||||||||||
|
Dori Energy
|
50
|
276
|
60,257
|
60,533
|
(256
|
)
|
(16,885
|
)
|
(17,141
|
)
|
43,392
|
21,696
|
2,800
|
(449
|
)
|
24,047
|
||||||||||||||||||||||||||||||||
|
2019
|
||||||||||||||||||||||||||||||||||||||||||||||||
|
Dori Energy
|
50
|
55
|
62,500
|
62,555
|
(208
|
)
|
(20,864
|
)
|
(21,072
|
)
|
41,483
|
20,742
|
3,269
|
(431
|
)
|
23,580
|
||||||||||||||||||||||||||||||||
| (b) |
Summary information on operating results
|
|
Rate of ownership
as of December
|
Income
for the year
|
Company’s
share
|
Elimination of interest on loan from related party
|
Other
Adjustments
|
Company’s share
of income of investee
|
|||||||||||||||||||
|
%
|
€ in thousands
|
|||||||||||||||||||||||
|
2020
|
||||||||||||||||||||||||
|
Dori Energy
|
50
|
2,619
|
1,310
|
676
|
(461
|
)
|
1,525
|
|||||||||||||||||
|
2019
|
||||||||||||||||||||||||
|
Dori Energy
|
50
|
5,281
|
2,640
|
868
|
(422
|
)
|
3,086
|
|||||||||||||||||
| B. |
Pumped Storage Projects
Loan to PSP Gilboa and Related Receivables
In June, 2020, following the commencement of operations of a pumped storage project in the Gilboa, Israel, we received an amount of approximately
NIS 5,500 thousand (approximately €1,418 thousand) from A.R.Z. Electricity Ltd. (“A.R.Z.”). The amount was due to us as part of an agreement between us and A.R.Z. related to the repayment of a loan we provided to
A.R.Z. during 2013 and is the second and last installment under such agreement.
Pumped-storage project in the Manara Cliff in Israel (“Manara PSP”)-
On November 3, 2014, Ellomay Manara (2014) Ltd., the Company’s indirectly wholly-owned subsidiary ("Ellomay Manara”), consummated the acquisition
of 75% of the rights in Agira Sheuva Electra, L.P. (the “Partnership“), as well as 75% of the holdings in Chashgal Elyon Ltd., which is the general partner in the Partnership (the “GP”), from Electra Ltd. (“Electra”),
Ortam Sahar Engineering Ltd. (“Ortam”) and the Galilee Development Cooperative Ltd., an Israeli cooperative (“Galilee”). The remaining 25% of the holdings in the Partnership and in the GP are held by Sheva Mizrakot
Ltd., an Israeli private company (“Sheva Mizrakot”). The Company and Ellomay Manara did not pay any consideration upon the acquisition, and undertook to pay certain consideration upon the fulfillment of certain
conditions and milestones. On the same date, Ellomay Manara acquired Ortam’s holdings (50%) in the engineering, procurement and construction contractor of the aforementioned project (the “EPC”) and immediately
transferred such holdings to a subsidiary of Electra, which, following such transfer, now holds 100% of the EPC. According to the various agreements executed in connection with the Manara PSP, the Company and Ellomay
Manara are jointly and severally liable to all the monetary obligations under these agreements.
In December 2018, the Company executed a settlement agreement (the "A.R.Z. Settlement Agreement") with A.R.Z., an Israeli private company that at
the time held 33.33% of Sheva Mizrakot. The A.R.Z. Settlement Agreement resolves a claim made by A.R.Z. and Mr. Raanan Aloni against the Company and its affiliates, in connection with the Manara PSP, and other disputes
between such parties concerning the Manara PSP. In connection with the Manara PSP Project Finance that occurred on February 2021, and based on the A.R.Z. Settlement Agreement, A.R.Z. was required to provide its
indirect share of equity investment and financing to the Manara PSP. Due to the failure to provide the required funds, Ellomay Water Plants Holdings (2014) Ltd., the Company’s wholly-owned subsidiary that holds 75% of
Ellomay PS, seized E.R.Z.’s holdings in Sheva Mizrakot (33%) and, as a result, the Company’s indirect holdings in the Manara PSP increased from 75% to 83.333% in January 2021.
As of December 31, 2020, the Company paid an amount of approximately NIS 3,400 thousand (approximately €869 thousand) on account of the consideration upon the acquisition and may be
required, if certain conditions and milestones are met (which conditions and milestones have not currently been met), to pay certain parties additional amounts, which in the aggregate are not expected to exceed an
amount of approximately NIS 26,000 thousands (approximately €6,592 thousand).
Ellomay Pumped Storage (2014) Ltd. (“Ellomay PS”), the Company’s subsidiary, initially received a conditional license for the Manara PSP from the
Israeli Minister of Energy (the “Minister”) for the construction of a pumped storage plant in the Manara Cliff with a capacity of 340 MW. The Conditional License includes several conditions precedent to the entitlement
of the holder of the Prior Conditional License to receive an electricity production license.
|
| B. |
Pumped Storage Projects (cont’d)
On March 3, 2017, Ellomay PS filed a Petition, with the Israeli High Court of Justice against the Minister, the Electricity Authority and Kochav Pumped Storage Ltd.
(“Kochav PS”). Ellomay PS has also filed concurrently with the Petition, a motion for an interim relief, which would prevent the Minister and the Israeli Electricity Authority from granting Kochav PS any approval in
connection with its compliance with any milestones stipulated in its conditional license. The Petition was filed in connection with the decision of the Israeli Electricity Authority, dated February 20, 2017, to extend
the following milestones deadlines stipulated in Kochav PS’s conditional license: (i) financial closing milestone deadline; and (ii) construction period for Kochav PS’s project. The Minister and the Israeli Electricity
Authority claimed, amongst other claims, that the motion should be dismissed, as should the Petition. In May 2017, the Israeli High Court of Justice dismissed the Petition.
On December 27, 2017, Kochav PS filed a statement of claim against Ellomay PS with the Tel Aviv – Jaffa Magistrate Court claiming damages allegedly caused due to
delays in connection with the Petition. Kochav PS claims damages in an aggregate amount of approximately NIS 4.2 million (approximately €1.02 million). Kochav PS claims damages in an aggregate amount of approximately
NIS 4,238 thousand (approximately €1,020 thousand). On March 18, 2018 the Court ordered Kochav PS to submit a Letter of Commitment. In April 2018 Ellomay PS submitted a statement of defense and in August 2018 Kochav PS
submitted a plea. In July 2020 the parties reached a settlement whereby Ellomay PS paid an amount of NIS 350 thousand (approximately €88 thousand).
On December 4, 2017, the Israeli Electricity Authority announced the reduction of the capacity stipulated in the Prior Conditional License issued to Ellomay PS from
340 MW to 156 MW. The reduced capacity is based on the remaining portion of the quota for pumped storage projects in Israel as determined by the Israeli Government and implemented by the Israeli Electricity Authority,
which is currently 800 MW, after deducting the capacity already allocated to two projects that were at the time in more advanced stages than the Manara PSP.
On February 26, 2020, Ellomay PS retracted the Prior Conditional License issued to it, which was due to expire on February 28, 2020 because Ellomay PS did not reach
financial closing by such date as was required under the milestones included in the Prior Conditional License. On the same date, Ellomay PS filed an application for a new similar conditional license for a pumped
storage facility with a capacity of 156 MW.
On June, 2020, the Israeli Minister of Energy executed a new conditional license for the Manara Project (the “Conditional License”), following the retraction of the
previous conditional license, which permits Ellomay PS to construct the Manara PSP. The Conditional License included several conditions precedent to the entitlement of Ellomay PS to receive an electricity production
license. The Conditional License is valid for a period of seventy two (72) months commencing from the date of its approval by the Minister of Energy, subject to compliance by Ellomay PS with the milestones set forth
therein and subject to the other provisions set forth therein (including a financial closing, the provision of guarantees and the construction of the pumped storage hydro power plant).
In December 2020 Ellomay PS received a land assessment from the Israel Land Authority ("ILA"), in connection with the Manara PSP and paid approximately NIS
66,700 thousand including VAT (approximately €16,980 thousand) in consideration for the ILA’s consent to the sublease of the land on which the Manara PSP is currently planned to be constructed. The amount paid includes
an amount of approximately NIS 9,900 thousand (approximately €2,520 thousand), excluding VAT, for royalties related to excess ground removal to the ILA.
|
| B. |
Pumped Storage Projects (cont’d)
|
|
On December 31, 2020 Ellomay PS received the conditional tariff approval for the project from the Israeli Electricity Authority that regulates the tariffs and formulas
for purchasing energy from a pumped storage manufacturer connected to the transmission network for a period of 20 years beginning on the date of receipt of the permanent production license. The conditional tariff
became effective following the financial closing of the Manara PSP in February 2021.
On February 11, 2021, the Manara PSP Project Finance reached financial closing. The Manara PSP Project Finance will be provided by a consortium of Israeli banks and
institutional investors, arranged and led by Mizrahi-Tefahot Bank Ltd. The Manara PSP Project Finance is in the aggregate amount of NIS 1.18 billion (approximately €300 million based on the euro/NIS exchange rate as of
December 31, 2020), and includes: (i) a Senior Secured Tranche at a fixed rate of interest for each drawdown, with base interest rate equal to the yield to maturity of Israeli treasury bonds with like duration of the
loan drawdown, plus a spread of 3.25% per-annum during the Construction Period of the Project and a spread of 2.40% per-annum from the Actual Completion Date of the Project which proceeds the Commercial Operation Date
of the Project. The Senior Secured Tranche is linked to the Israeli Consumer Price Index and is to be repaid over a period of 19.5 years from the commercial operation date; and (ii) a Subordinated Secured B Tranche at
a floating rate of interest, with the base interest being the Bank of Israel rate, plus a spread of 4.35% per-annum during the Construction Period and a spread of 3.90% per-annum from the Actual Completion Date. The
stated maturity of the Tranche B loan is one year less than the maturity of the Senior Secured Loan with a cash sweep mechanism that shortens its maturity to approximately 12 years from the Commercial Operation Date
under the Base Case Financial Model.
The Manara PSP Project Finance includes customary terms in connection with early prepayment, acceleration of payments upon certain breaches and limitations on
distributions. The Manara PSP Project Finance also includes ancillary facilities such as Standby, VAT, Guarantees and Debt Service Reserve facilities in an aggregate amount of approximately NIS 146 million
(approximately €37 million based on the euro/NIS exchange rate as of December 31, 2020).
The Average Annual Debt Service Cover Ratio (ADSCR) is 1.35:1.00 under the base case financial model for the Senior Secured Tranche. The default ADSCR is 1.05:1.00.
Sheva Mizrakot and Ellomay Water undertook to provide aggregate financing of approximately NIS 353 million (approximately €90 million based on the euro/NIS exchange
rate as of December 31, 2020), pro rata to their holdings in the Manara PSP.
The Manara PSP Project Finance includes mandatory cash sweeps upon certain cover ratio and other events with respect to the Senior Secured Tranche, Cash sweep payments
in connection with the Subordinated Secured Tranche as mentioned above and other lender protection mechanisms. In addition, the Manara PSP Project Finance agreement permits the shareholders of the Manara PSP to
withdraw a developers’ fee at the Actual Completion Date (as such term is defined in the Manara PSP Project Finance agreement) of the Manara Project, subject to availability of funding in the Standby Facility at the
time and provided certain the Average ADSCR at the time is not less than a certain ratio.
Ellomay and Ampa Investments Ltd., which indirectly owns 16.667% of Ellomay PS, provided certain sponsor support undertakings towards the lenders commensurate with the
size and complexity of the project and the length of the construction period.
|
| B. |
Pumped Storage Projects (cont’d)
In 2019 and 2020 the Company recorded approximately €3,487 thousand and €925 thousand, respectively, under project development costs. The amounts are mainly attributable to consultancy
expenses for the planned construction of Manara PSP power plant. Commencing the fourth quarter of 2020, as it is probable that the Company will enjoy future economic benefits in connection with the Manara PSP,
expenses in connection with the Manara PSP are capitalized as assets. As at December 31, 2020, amount of €16,607 thousand were capitalized as assets.
|
| C. |
Development of PV Projects in Italy
First Framework Agreement
In November 2019, Ellomay Luxembourg executed a Framework Agreement, or the First Framework Agreement, with an established and experienced European developer and contractor.
Pursuant to the First Framework Agreement, the developer will scout and develop photovoltaic greenfield projects in Italy with the aim of reaching an aggregate authorized capacity of at least 250 MW over a
three-year period. The First Framework Agreement provides that each project will be presented to Ellomay Luxembourg when it becomes “ready to build”. Thereafter, if Ellomay Luxembourg accepts the project,
the developer is obligated to transfer to Ellomay Luxembourg 100% of the share capital of the entity that holds the rights to the project. With respect to each project, subject to the conditions set forth
in the First Framework Agreement, Ellomay Luxembourg will enter into engineering, procurement and construction, or EPC, and O&M contracts with the developer to construct and operate the projects.
The First Framework Agreement provides that when the first project under the First Framework Agreement achieves the positive environmental impact assessment, the parties will
negotiate the terms of a model lump-sum, turnkey EPC contract and O&M contract that will be executed with the developer in connection with all projects acquired under the First Framework Agreement.
In connection with the execution of the First Framework Agreement, Ellomay Luxembourg paid the developer an advance payment of approximately €1,250 thousand and undertook to
pay an additional advance payment per each project when the project submits its environmental impact assessment application. In September 2020 Ellomay Luxembourg paid an additional advance payment in the
amount of approximately €304 thousand. In the event the target aggregate capacity is not achieved within a three-year period or in the event a project does not reach “ready to build” status, the advance
payment will be proportionately refunded.
Second Framework Agreement
In December 2019, Ellomay Luxembourg executed an additional Framework Agreement, or the Second Framework Agreement, with an established and experienced European developer.
Pursuant to the Second Framework Agreement, the developer will provide Ellomay Luxembourg with development services with respect to photovoltaic greenfield projects in Italy in the scope of 350 MW with the
aim of reaching an aggregate “ready to build” authorized capacity of at least 265 MW over a forty-one month period. The Second Framework Agreement provides that the developer will offer all projects
identified during the term of the Second Framework Agreement exclusively to Ellomay Luxembourg and that, with respect to each project acquired by Ellomay Luxembourg, the developer will be entitled to provide
development services until it reaches the “ready to build” status. The parties agreed on a development budget including a monthly development service consideration, to be paid to the developer and all other
payments for the tasks required to bring the projects to a ready to build. In addition, Ellomay Luxembourg undertook to pay a success fee to the developer with respect to each project that achieves a “ready
to build” status. Currently development is progressing as planned.
|
| C. |
Development of PV Projects in Italy (cont’d)
In addition to the 265 MW mentioned above, Ellomay Luxembourg has the option to purchase approximately 37 MW that are already under development by the developer, 30 MW of which
have already received the approval for connection to the Italian electricity grid.
The advancement and development of projects that will become part of the First and Second Framework Agreement is subject to various conditions, including
receipt of regulatory approvals and authorizations and procurement of land rights. There can be no assurance as to the aggregate capacity of projects that will reach the “ready to build” status and as to the
number and aggregate capacity of projects that Ellomay Luxembourg will decide to acquire or the success in completing construction of any of such projects. Any future decision of the Company with respect to the
continued development of projects will be subject to the relevant circumstances existing at the time such decision will be made.
|
|
December 31
|
||||||||
|
2020
|
2019
|
|||||||
|
€ in thousands
|
||||||||
|
On account of the Manara PSP
|
869
|
883
|
||||||
|
On account of Development of PV Projects in Italy
|
1,554
|
-
|
||||||
|
2,423
|
883
|
|||||||
|
December 31
|
||||||||
|
2020
|
2019
|
|||||||
|
€ in thousands
|
||||||||
|
Income receivable in connection with the A.R.Z. loan
|
-
|
1,418
|
||||||
|
-
|
1,418
|
|||||||
| D. |
Subsidiaries -
|
| 1. |
Biogas Projects in the Netherlands
In July 2016, the Company, through its wholly-owned subsidiary Ellomay Luxembourg, entered into a strategic agreement (“the Ludan Agreement”), with Ludan Energy Overseas B.V. (an
indirectly wholly-owned subsidiary of Ludan Engineering Co. Ltd. (TASE: LUDN)) (“Ludan”) in connection with Waste-to-Energy (specifically Gasification and Bio-Gas (anaerobic digestion)) projects in the Netherlands. Pursuant to the
Ludan Agreement, subject to the fulfillment of certain conditions, the Company, through Ellomay Luxembourg, was to acquire at least 51% of each project company and Ludan will own the remaining 49%.
|
| D. |
Subsidiaries - (cont’d)
|
| 1. |
Biogas Projects in the Netherlands (cont'd)
Groen Goor Anaerobic Digestion Project-
Pursuant to the Ludan Agreement, the Company, through Ellomay Luxembourg, acquired 51% of Groen Gas Goor B.V. (“Groen Goor”), a project company developing an
anaerobic digestion plant, with a green gas production capacity of approximately 375 Nm3/h, in Goor, the Netherlands (“the Goor Plant”) during 2016.
During September 2016, the Company, through Ellomay Luxembourg, entered into two separate memorandums of understanding (“MOUs”), with Ludan, setting forth Ludan’s and the Company agreed material
principles and understandings with respect to the Goor Project's EPC and O&M agreements. Pursuant to such MOUs, in November 2016 Groen Goor entered into an EPC agreement with Ludan. The Groen Goor Plant commenced
operations in November 2017.
Groen Gas Oude-Tonge Anaerobic Digestion Project-
The Company, through Ellomay Luxembourg, acquired 51% of Groen Gas Oude-Tonge B.V. (“Groen Gas Oude-Tonge”) a project company developing an anaerobic digestion
plant, with a green gas production capacity of approximately 475 Nm3/h, in Oude-Tonge, the Netherlands (“the Oude-Tonge Plant”) during 2017. During April 2017, Oude-Tonge, entered into an EPC agreement with Ludan. The Oude-Tonge
Plant commenced operations in June 2018.
In March 2019, the Company executed an agreement with Ludan and several entities affiliated with Ludan, for the acquisition of 49% of Groen Goor and Groen Gas Oude-Tonge in
consideration for approximately €3 million. The acquisition was consummated during 2019, and the Company currently indirectly wholly-owns the Goor Plant and the Oude-Tonge Plant.
During 2020, the Company assessed the value in use of two cash generating Biogas plants in the Netherlands in the Biogas segment in light of operating losses suffered by these
projects in previous years and lower results than forecasted for 2020. The examination was conducted based on projected cash flows that were discounted at a rate 6%. The examination concluded that the value in use of the plants is
higher than the carrying value of the plants and therefore there is no need for a provision for impairment. The assumptions on which the examination was based could be affected by the Company’s inability to meet the budget in
certain circumstances including, the prices of feedstock required in order to maintain the optimal mix of feedstock necessary to maximize performance of the plants, by technical malfunctions and by other circumstances that
influence the operation of the plants.
Acquisition of a new subsidiary in the Netherlands
On December 1, 2020, the Company indirectly acquired all issued and outstanding shares of GG Gelderland through its wholly-owned subsidiary, Ellomay Luxembourg. GG Gelderland owns an operating
anaerobic digestion plant in Gelderland, the Netherlands, with a permit that enables it to produce approximately 7.5 million Nm3 per year. The actual production capacity of the plant is approximately 9.5 million Nm3 per year. The
Company paid €1,567 thousand for the shares and the repayment of shareholder loans. An additional shareholder loan of approximately €5,897 thousand was granted to GG Gelderland by Ellomay Luxembourg on December 1, 2020 for the
repayment of other existing loans as at the date of the acquisition. The previous owners are entitled to receive an additional amount estimated at €493 thousand in connection with subsidy payments from the Dutch Government. This
amount estimated will be determined and paid before June 2021. Ellomay Luxembourg has no liability to compensate the previous owners if the Dutch government pays less than the estimated amount.
|
| D. |
Subsidiaries - (cont’d)
|
| 1. |
Biogas Projects in the Netherlands (cont'd)
Identifiable assets acquired and liabilities assumed (based on provisional amounts as described hereunder):
|
|
€ thousands
|
||||
|
Trade and other receivables
|
1,243
|
|||
|
Deferred tax
|
488
|
|||
|
Right of use asset
|
355
|
|||
|
Fixed assets, net
|
13,961
|
|||
|
Trade and other payables
|
(1,717
|
)
|
||
|
Lease liability
|
(355
|
)
|
||
|
Loans and borrowings
|
(6,511
|
)
|
||
|
Net identifiable assets
|
7,464
|
|||
|
Measurement of fair values
Presented hereunder is information regarding the techniques the Company used to measure the fair value of the assets and liabilities recognized as a result
of the business combination:
Fixed assets
The fair value of fixed assets is based on market values. The market value of fixed assets is the estimated amount for which a fixed asset could be exchanged on the date of
valuation between a willing buyer and a willing seller in an arm’s length transaction wherein the parties each acted knowledgeably. The market value is based on quoted market prices for similar items, when
available, and on replacement costs when such quotes are unavailable.
Acquisition-related costs
The Company incurred acquisition-related costs of €60 thousand related to legal fees and due diligence costs. These costs have been included in general and administrative
expenses in the statement of income.
|
| 2. |
PV Projects in Spain
The Talasol Project-
In April 2017, the Company, through one of its subsidiaries, entered into a share purchase agreement (the “SPA”), pursuant to which it purchased the entire share capital of a
Spanish company, Talasol Solar S.L.U (“Talasol”), which at the time was promoting the construction of a photovoltaic plant with a peak capacity of 300 MW in the municipality of Talaván, Cáceres, Spain (the “Talasol Project”). The
SPA provides that the purchase price for Talasol's shares is €10 million that was paid following the occurrence of customary conditions subsequent.
In June 2018 Talasol, entered into an engineering, procurement & construction agreement (the "EPC Agreement") with METKA EGN Limited ("METKA EGN"). The EPC Agreement provides a fixed and
lump-sum amount of €192.5 million for the complete execution and performance of the works defined in the EPC Agreement. The works include the engineering, procurement and construction of the Talasol Project and the ancillary
facilities for injecting power into the grid, including a 400 kV step-up substation, the high voltage interconnection line to the point of connection to the grid and performance of two years of O&M services.
|
| D. |
Subsidiaries - (cont’d)
|
| 2. |
PV Projects in Spain (cont’d)
The Talasol Project (cont’d)-
METKA EGN was expected to complete the works under the EPC Agreement within a period of 16 months from the commencement date. The EPC Agreement includes standard provisions, including with
respect to liquidated damages in connection with delays and performance, performance guarantees, suspension and termination.
In June 2018, Talasol executed a financial power swap in respect of approximately 80% of the output of the Talasol Project for a period of 10 years (the "PPA").The power
produced by the Talasol Project is expected to be sold by Talasol in the open market for the then current market power price and the PPA is expected to hedge the risks associated with fluctuating electricity market prices by
allowing Talasol to secure a certain level of income for the power production included under the PPA. The PPA hedge transaction became effective in March 2019.
In July 2018, Talasol executed a pre-hedge transaction with Goldman Sachs International in connection with the prospective project financing for the construction of a photovoltaic plant. The
pre-hedge transaction is a fixed for floating interest rate swap intended to lock-in current market floating rates. The hedge transaction is contingent up on the financial closing of the Talasol Project.
In December 2018, Talasol entered into a set of agreements governing the procurement of financing in the aggregate amount of approximately €177 million (the "Project Finance"). The Project Finance
consists of several facilities from Deutsche Bank AG and from the European Investment Bank ("EIB") under the Investment Plan for Europe known as the Juncker Plan. On April 30, 2019, the Talasol Project reached financial
closing (see Note 11).
On April 17, 2019, the Company, through its wholly owned subsidiary Ellomay Luxembourg, executed a Credit Facilities Assignment and Sale and Purchase of Shares Agreement (“the Talasol SPA”), with
GSE 3 UK Limited and Fond-ICO Infraestructuras II, FICC (together, “the Talasol Partners”), pursuant to which it agreed to sell to each of the Talasol Partners 24.5% of its holdings in Talasol. The Talasol SPA further provides
that the Company will assign to the Talasol Partners, in equal parts, 49% of its rights and obligations under the agreements executed in connection with the project finance obtained for the Talasol Project. The transactions
contemplated under the Talasol SPA were consummated in April 2019. The aggregate purchase price paid by the Talasol Partners, in the amount of approximately €16.1 million, represented 49% of the amounts withdrawn and interests
accrued from and by Talasol Project’s financing as of the closing date of the Talasol SPA (approximately €4.9 million), plus a payment for 49% of Talasol’s shares (approximately €4.9 million) plus a premium of approximately
€6.1 million. Of such aggregate purchase price, the payment of €1.4 million was deferred until the achievement of a preliminary acceptance certificate (PAC) under the EPC agreement of the Talasol Project. Following the
achievement of PAC on January 27, 2021 the deferred payment amount of €1.4 million was received by Ellomay Luxembourg.
|
| D. |
Subsidiaries - (cont’d)
|
| 2. |
PV Projects in Spain (cont’d)
The Talasol Project (cont’d) -
As the Company directs the operations of Talasol and the rights granted to the Talasol Partners are minority protective rights, these changes in the Company’s ownership interest
in Talasol did not result in loss of control and were accounted for as equity transactions. The Company therefore recognized in Equity an amount of approximately €6.1 million, less associated expenses in the amount of
approximately €0.7 million.
On the closing date of the Talasol SPA, the Company, through its wholly owned subsidiary Ellomay Luxembourg, and the Talasol Partners entered into a Partners’ Agreement (“the
Talasol PA”) setting forth the relationship between the prospective shareholders of Talasol, the governance and management of Talasol, the funding and financing of Talasol and the mechanism for future transfers of Talasol’s
shares.
The Talasol PA further provides that Ellomay Luxembourg will be entitled to receive a management fee from Talasol in consideration for the administrative, support and management
services to be provided to Talasol by Ellomay Luxembourg.
The Talasol PV Plant reached mechanical completion in September 2020 and was connected to the electricity grid and electricity production commenced at the end of December 2020.
PAC was achieved on January 27, 2021.
The Ellomay Solar Project -
Ellomay Solar S.L.U. (“Ellomay Solar”), wholly owned by Ellomay Luxembourg, is promoting the construction of a photovoltaic plant with an installed capacity of 28 MW in the municipality of Talaván,
Cáceres, Spain (the “Ellomay Solar Project”). Ellomay Solar entered into an engineering, procurement & construction agreement in connection with the Ellomay Solar Project (the “EPC Agreement”) with METKA EGN Spain S.L.U., a
100% indirect subsidiary of MYTILINEOS S.A., under the Renewables & Storage Development Business Unit. The EPC Agreement provides a fixed and lump-sum amount of €15.32 million, for the complete execution and performance of the
works defined in the EPC Agreement. The works include the engineering, procurement and construction of the Ellomay Solar Project and the ancillary facilities for injecting power into the grid and performance of two years of
O&M services. The EPC Agreement includes additional standard provisions, including with respect to liquidated damages in connection with delays and performance, performance guarantees, suspension and termination. METKA EGN
Spain is expected to complete the works under the EPC Agreement within a period of 9 months from receipt of the Notice to Proceed. The early works commenced on March 1, 2021.
|
| D. |
Subsidiaries - (cont’d)
|
| 3. |
Sale of Italian indirect wholly-owned subsidiaries
On December 20, 2019, the Company sold ten Italian indirect wholly-owned subsidiaries, which own twelve photovoltaic plants with an aggregate nominal capacity of approximately 22.6 MW (the “Italian
Subsidiaries”), and sold the receivables arising from shareholder loans provided to such companies. The agreed purchase price was €38.7 million (after approximately €2.3 million adjustments in connection with funds received by the
Company from the Italian Subsidiaries during 2019). As a result of such sale, the Company recorded a capital gain of approximately €18.8 million.
Identifiable sold assets and liabilities:
|
|
December 31 2019
|
||||
|
€ in thousands
|
||||
|
Cash and cash equivalents
|
4,106
|
|||
|
Trade and other receivables
|
4,569
|
|||
|
Deferred tax and advance tax payment and tax provision
|
2,864
|
|||
|
Fixed assets
|
41,431
|
|||
|
Restricted cash
|
156
|
|||
|
Right of use asset
|
1,356
|
|||
|
Trade and other payables
|
(2,458
|
)
|
||
|
Loans and borrowings
|
(30,725
|
)
|
||
|
Lease liability
|
(1,377
|
)
|
||
|
Total net identifiable assets
|
19,922
|
|||
|
Capital gain
|
18,770
|
|||
|
38,692
|
||||
|
Cash and cash equivalents
|
(4,106
|
)
|
||
|
Proceeds from sale of investments
|
34,586
|
|||
| 3. |
Sale of Italian indirect wholly-owned subsidiaries (cont'd)-
The Sale and Purchase Agreement governing the sale of the subsidiaries and the receivables includes customary representations and warranties and indemnification mechanisms,
including specific indemnification for existing risks for a limited time as follows:
|
| (i) |
Indemnification in the amount of up to €250 thousand in connection with potential tax liabilities (until December 31, 2023).
|
| (ii) |
Indemnification in the amount of up to €500 thousand in connection with potential incentive reduction under limited circumstances in one of the Italian subsidiaries sold (until December 31, 2023).
|
| (iii) |
Indemnification in the amount of up to €2.1 million in connection with the announcement received from GSE, Italy’s energy regulation agency, by one of the Italian Subsidiaries, claiming alleged non-compliance of the installed
modules with the required certifications under the applicable regulation and raising the need to examine incentive eligibility implications (the “GSE Claim”). The Company recorded this potential payment as other expenses. In 2020, with the cooperation of the acquirer of the Italian subsidiaries, an appeal was submitted to GSE. Following the positive outcomes of such appeal, the provision for the potential
indemnification was cancelled.
|
| 4. |
Subsidiaries – Israeli Service Concession project
In June 2017, the Company executed an agreement (the “Talmei Yosef Agreement”) to acquire 100% of the equity of an Israeli company ("Talmei Yosef") that owns (through its
subsidiaries) a photovoltaic site with fixed technology and a nominal capacity of approximately 9 MWp in Talmei Yosef, Israel (the “Talmei Yosef Project”). The Talmei Yosef Project is primarily financed by an Israeli
consortium led by Israel Discount Bank.
The fair value of the income receivable in connection with concession project was calculated according to the cash flows expected to be received from the Israeli Electricity
Authority for a period of 16 years, discounted at a weighted interest rate of 5.9% reflecting the credit risk of the debtor.
Talmei Yosef entered into a service concession agreement with the IEC for the construction of a PV plant in Talmei Yosef. The construction of the PV plant was completed and
the PV plant was connected to the grid in November 2013. Under the terms of the agreement with the IEC, Talmei Yosef will operate the PV plant for a period of 20 years as from November 15, 2013. The IEC provides the Company a
guaranteed tariff for the electricity produced of NIS 0.9631 per KWp linked to the CPI as of October 2011. The service concession agreement does not contain a renewal option.
|
| D. |
Subsidiaries – Israeli Service Concession project (cont’d)
|
|
Asset from concession project
|
||||
|
€ in thousands
|
||||
|
Balance as at December 31, 2019
|
28,585
|
|||
|
Total income recognized in profit or loss
|
1,422
|
|||
|
Proceeds from asset from concession project
|
(3,018
|
)
|
||
|
Foreign Currency translation adjustments
|
(462
|
)
|
||
|
Balance as at December 31, 2020
|
26,527
|
|||
|
Less current maturities
|
1,491
|
|||
|
Long-term Asset from concession project
|
25,036
|
|||
|
December 31
|
||||||||
|
2020
|
2019
|
|||||||
|
€ in thousands
|
||||||||
|
Current Assets - Other receivables:
|
||||||||
|
Government authorities
|
3,232
|
781
|
||||||
|
Income receivable
|
3,420
|
1,075
|
||||||
|
Interest receivable
|
36
|
38
|
||||||
|
Current tax
|
32
|
-
|
||||||
|
Trade receivable
|
382
|
805
|
||||||
|
Inventory
|
306
|
284
|
||||||
|
Derivatives (refer to Note 21)
|
78
|
94
|
||||||
|
Prepaid expenses and other
|
2,339
|
1,805
|
||||||
|
9,825
|
4,882
|
|||||||
|
Non-current Assets - Long term receivables:
|
||||||||
|
Advance tax payment
|
- |
-
|
||||||
|
Prepaid expenses associated with long term loans
|
2,731
|
12,218
|
||||||
|
Annual rent deposits
|
30
|
30
|
||||||
|
Other
|
1
|
1
|
||||||
|
2,762
|
12,249
|
|||||||
|
Office
|
||||||||||||||||||||||||
|
Photovoltaic
|
Pumped
|
Biogas
|
furniture and
|
Leasehold
|
||||||||||||||||||||
|
Plants
|
storage
|
installations
|
equipment
|
Improvements
|
Total
|
|||||||||||||||||||
|
€ in thousands
|
||||||||||||||||||||||||
|
Cost
|
||||||||||||||||||||||||
|
Balance as at January 1, 2019
|
98,289
|
-
|
18,656
|
138
|
52
|
117,135
|
||||||||||||||||||
|
Additions
|
*73,402
|
-
|
932
|
9
|
-
|
74,343
|
||||||||||||||||||
|
Disposals
|
*(68,908
|
)
|
-
|
-
|
-
|
-
|
(68,908
|
)
|
||||||||||||||||
|
Effect of changes in exchange rates
|
1
|
-
|
-
|
-
|
-
|
1
|
||||||||||||||||||
|
Balance as at December 31, 2019
|
102,784
|
-
|
19,588
|
147
|
52
|
122,571
|
||||||||||||||||||
|
Balance as at January 1, 2020
|
102,784
|
-
|
19,588
|
147
|
52
|
122,571
|
||||||||||||||||||
|
Additions
|
120,842
|
16,607
|
558
|
38
|
-
|
138,045
|
||||||||||||||||||
|
New companies
|
-
|
-
|
17,233
|
-
|
-
|
17,233
|
||||||||||||||||||
|
Disposals
|
-
|
-
|
-
|
-
|
(52
|
)
|
(52
|
)
|
||||||||||||||||
|
Effect of changes in exchange rates
|
-
|
-
|
-
|
(5
|
)
|
-
|
(5
|
)
|
||||||||||||||||
|
Balance as at December 31, 2020
|
223,626
|
16,607
|
37,379
|
180
|
-
|
277,792
|
||||||||||||||||||
|
Depreciation
|
||||||||||||||||||||||||
|
Balance as at January 1, 2019
|
28,550
|
-
|
1,192
|
121
|
52
|
29,915
|
||||||||||||||||||
|
Depreciation for the year
|
4,383
|
-
|
1,353
|
8
|
-
|
5,744
|
||||||||||||||||||
|
Disposals
|
*(27,477
|
)
|
-
|
-
|
-
|
-
|
(27,477
|
)
|
||||||||||||||||
|
Balance as at December 31, 2019
|
5,456
|
-
|
2,545
|
129
|
52
|
8,182
|
||||||||||||||||||
|
Balance as at January 1, 2020
|
5,456
|
-
|
2,545
|
129
|
52
|
8,182
|
||||||||||||||||||
|
Depreciation for the year
|
830
|
-
|
1,457
|
12
|
-
|
2,299
|
||||||||||||||||||
|
New companies
|
-
|
-
|
3,272
|
-
|
-
|
3,272
|
||||||||||||||||||
|
Disposals
|
-
|
-
|
-
|
-
|
(52
|
)
|
(52
|
)
|
||||||||||||||||
|
Effect of changes in exchange rates
|
-
|
-
|
-
|
(4
|
)
|
-
|
(4
|
)
|
||||||||||||||||
|
Balance as at December 31, 2020
|
6,286
|
-
|
7,274
|
137
|
-
|
13,697
|
||||||||||||||||||
|
Carrying amounts
|
||||||||||||||||||||||||
|
As at January 1, 2019
|
69,739
|
-
|
17,464
|
17
|
-
|
87,220
|
||||||||||||||||||
|
As at December 31, 2019
|
97,328
|
-
|
17,043
|
18
|
-
|
114,389
|
||||||||||||||||||
|
As at December 31, 2020
|
217,340
|
16,607
|
30,105
|
43
|
-
|
264,095
|
||||||||||||||||||
|
PV Plant Title
|
Nominal Capacity
|
Connection to Grid
|
Cost included in the Book value as at
|
|||||
|
December 31, 2020
|
||||||||
|
€ in thousands
|
||||||||
|
“Ellomay Spain – Rinconada II”
|
2,275 kWp
|
June 2010
|
5,509
|
|||||
|
“Rodríguez I”
|
1,675 kWp
|
November 2011
|
3,662
|
|||||
|
“Rodríguez II”
|
2,691 kWp
|
November 2011
|
6,631
|
|||||
|
“Fuente Librilla”
|
1,248 kWp
|
June 2011
|
3,212
|
|||||
|
"Talasol"
|
300 MWP
|
January 2021
|
204,196
|
|||||
|
“Ellomay Solar”
|
28 MWP
|
under construction
|
415
|
|||||
|
December 31
|
||||||||
|
2020
|
2019
|
|||||||
|
€ in thousands
|
||||||||
|
Employees and payroll accruals
|
278
|
224
|
||||||
|
Indemnification liability (refer to Note 18D)
|
-
|
2,100
|
||||||
|
Government authorities
|
213
|
155
|
||||||
|
Lease liability (S/T)
|
490
|
225
|
||||||
|
Forward contracts closed (1)
|
666
|
-
|
||||||
|
Derivatives (refer to Note 21)
|
1,378
|
766
|
||||||
|
Warrants Liability (refer to Note 16)
|
2,451
|
-
|
||||||
|
Accrued expenses
|
2,376
|
1,430
|
||||||
|
Current tax
|
60
|
110
|
||||||
|
7,912
|
5,010
|
|||||||
| (1) |
The Company closed euro/USD forward contracts with an accumulated loss of approximately €666 thousand (approximately $817 thousand) that are expected to be paid in 2021.
|
|
Linkage
|
Interest rate
|
December 31
|
December 31
|
|||||||||||||
|
terms
|
2019 and 2020
|
2020
|
2019
|
|||||||||||||
|
%
|
€ in thousands
|
|||||||||||||||
|
Current maturities of long term
bank loans (refer to Note 11)
|
EURIBOR
|
2-3.55
|
8,470
|
2,469
|
||||||||||||
|
Consumer
price index in
Israel
|
4.65
|
1,762
|
1,669
|
|||||||||||||
|
10,232
|
4,138
|
|||||||||||||||
|
Linkage
|
Interest rate
|
December 31
|
December 31
|
|||||||||||||
|
terms
|
2019 and 2020
|
2020
|
2019
|
|||||||||||||
|
|
%
|
€ in thousands
|
||||||||||||||
|
Current maturities of other long
term loans
|
EURIBOR
|
5.27
|
4,021
|
-
|
||||||||||||
|
4,021
|
-
|
|||||||||||||||
| A. |
Loans details
Composed as follows:
|
|
Linkage
|
Interest rate
|
December 31
|
December 31
|
||||||||||||
|
terms
|
2019 and 2020
|
2020
|
2019
|
||||||||||||
|
%
|
€ in thousands
|
||||||||||||||
|
Bank loans
|
EURIBOR
|
2-3.55
|
127,470
|
25,620
|
|||||||||||
|
Consumer
price index in
Israel
|
4.65
|
17,282
|
19,323
|
||||||||||||
|
144,752
|
44,943
|
||||||||||||||
|
Linkage
|
Interest rate
|
December 31
|
December 31
|
||||||||||||
|
terms
|
2019 and 2020
|
2020
|
2019
|
||||||||||||
|
|
%
|
€ in thousands
|
|||||||||||||
|
Other long term loans
|
EURIBOR
|
5.27
|
47,563
|
46,622
|
|||||||||||
|
2-3%
|
|
5,854
|
1,755
|
||||||||||||
|
53,417
|
48,377
|
||||||||||||||
| 1. |
The Company's 75% owned Israeli subsidiary promoting the Manara PSP, entered into a loan agreement with the owner of the remaining 25% of its outstanding shares, Sheva Mizrakot Ltd. The unpaid balance
(principal and interest) of the loan will bear interest at an annual rate in accordance with the interest rate for the purpose of Section 3(j) of the Israeli Income Tax Ordinance in accordance with the provisions of Regulation
2(a) of the Income Tax Regulations (Determination of Interest Rate for the Purpose of Section 3(j)), 1986. The maturity date of this loan is December 31, 2025. As of December 31, 2020, the amount of the loan is €5,102 thousand.
|
| 2. |
On May 16, 2012, Talmei Yosef entered into a loan agreement with Israeli consortium led by Israel Discount Bank (the “Israeli Consortium”) in connection with the financing of its PV Plant,
pursuant to which Talmei Yosef received financing amounting to NIS 80,000 thousand. During 2013, in accordance with the millstones set on the loan agreement, an aggregate amount of NIS 60,000 thousand was withdrawn on
account of such loan agreement. During 2014, an additional aggregate amount of NIS 20,000 thousand was withdrawn. The loan is linked to the consumer price index and bears an annual interest of 4.65%. The interest on the
loan and the principal are repaid semi-annually. The final maturity date of this loan is December 31, 2031.
On December 24, 2014, Talmei Yosef entered into an additional loan agreement with the Israeli Consortium in connection with additional financing in the amount of NIS 25,000 thousand. The
loan is linked to the consumer price index and bears an annual interest of 4.52%. The final maturity date of this loan is June 30, 2028.
The interest on the loan and the principal are repaid semi-annually.
|
| A. |
Loans details (cont’d)
|
|
In connection with these loans, the Talmei Yosef project company provided charges on its rights in the PV Plant, notes, equity, goodwill, on all assets of the PV Plant and on future receivables
from the IEC and undertook customary limitations and undertakings, including maintaining the following financial ratios: (i) upon withdrawal of funds on account of the loan framework (based on milestones), maintaining an
annual Historic ADSCR (Average Debt Service Coverage Ratio), a Projected ADSCR and a Projected LLCR (loan life coverage ratio) of 1.25:1.00, (ii) upon a distribution of profits from the project company, maintaining a Historic
ADSCR, a Projected ADSCR and a Projected LLCR of 1.20:1.00, and (iii) throughout the term of the loan, maintaining an annual ADSCR and a Projected ADSCR of 1.05:1.00 for the following 12 months and maintaining an LLCR of
1.08:1.00.
As of December 31, 2020, the financial covenants were met.
|
| 1. |
Groen Goor, Independent Power Plant B.V. (“IPP”) (the entity that holds the permits and subsidies in connection with the Goor Project and is wholly-owned by Groen
Goor), and Ellomay Luxembourg entered into a senior project finance agreement in 2017 (the “Goor Loan Agreement”), with Coöperatieve Rabobank U.A. (“Rabobank”), that includes the following tranches: (i) two loans with
principal amounts of €3,510 thousand (with a fixed interest rate of 3% for the first five years) and €2,090 thousand, (with a fixed interest rate of 2.5% for the first five years), for a period of 12.25 years, repayable in
equal monthly installments commencing three months following the connection of the Goor Project’s facility to the grid and (ii) an on-call credit facility of €370 thousand with variable interest. The amount of €5,600
thousand was withdrawn in 2017 on account of these loans. In connection with the Goor Loan Agreement, the following securities were provided to Rabobank: (i) pledge on the present and future rights arising from the
feedstock purchase agreement, the EPC agreement, the O&M agreement, the SDE subsidy, the various power and green gas purchase agreements, and the green gas certification supply agreement, (ii) pledge on all present and
future (a) receivables arising from business and trade, and (b) stock and inventory including machinery and transport vehicles of Groen Goor and IPP; (iii) all rights/claims of Groen Goor and IPP against third parties
existing at the time of the execution of the Loan Agreement, including rights from insurance agreements.
|
| 2. |
Groen Gas Oude Tonge, Groen Gas Oude-Tonge Holding B.V. (the entity that holds the permits and subsidies in connection with the Oude Tonge Project and is wholly-owned by Groen Gas
Oude Tonge), and Ellomay Luxembourg entered into a senior project finance agreement (the “Oude Tonge Loan Agreement”), with Rabobank, that includes the following tranches: (i) three loans with principal amounts
of €3,150 thousand (with a fixed interest rate of 3.1% for the first five years), €1,540 thousand (with a fixed interest rate of 2.9% for the first five years) and €160 thousand, (with a fixed interest rate of
3.4% for the first five years), for a period of 12.25 years, repayable in equal monthly installments commencing three months following the connection of the Oude Tonge Project’s facility to the grid and (ii) an
on-call credit facility of €100 thousand with variable interest. The amount of €4,850 thousand was withdrawn in 2017 and 2018 on account of these loans.
|
| A. |
Loans details (cont’d)
|
|
In connection with the Oude Tonge Loan Agreement, the following securities were provided to Rabobank: (i) pledge on the present and future rights arising from the feedstock
purchase agreement, the EPC agreement, the O&M agreement, the SDE subsidy, the various power and green gas purchase agreements, and the green gas certification supply agreement, (ii) pledge on all present and future (a)
receivables arising from business and trade, and (b) stock and inventory including machinery and transport vehicles of Groen Gas Oude Tonge and Groen Gas Oude Tonge Holding B.V.; (iii) all rights/claims of Groen Gas Oude Tonge and
Groen Gas Oude Tonge Holding B.V. against third parties existing at the time of the execution of the Loan Agreement, including rights from insurance agreements.
In connection with the Loan Agreements Ellomay Luxembourg, the Company wholly-owned subsidiary: (i) provided the following undertakings to Rabobank: (a) that Groen Goor and
Groen Gas Oude Tonge, as applicable, will not make distributions to its shareholders for a period of two years following the execution of the Loan Agreement, (b) that Groen Goor will not make distributions or repurchase its
shares so long as the equity (including owners loans) to total assets ratio of Groen Goor is less than 40%, (c) that in the event the equity (including owners loans) to total assets ratio of Groen Goor and Groen Gas Oude Tonge
will be below 40%, its shareholders will invest the equity required in order to increase this ratio to 40%, pro rata to their holdings in Groen Goor and Groen Gas Oude Tonge, as applicable, and up to a maximum of €1.2 million,
and (d) that they will provide the equity required for the completion of the Goor Project (ii) provided pledges on their respective rights in connection with the shareholders loans which each provided to Groen Goor and Groen Gas
Oude Tonge, which loans shall also be subordinated by Ellomay Luxembourg in the favor of Rabobank. As of December 31, 2020, the financial covenants were met.
In addition, the Company provided a guarantee to Rabobank for the fulfillment of Ellomay Luxembourg’s undertakings set forth above.
|
| 3. |
GG Gelderland entered into a senior project finance agreement (the “Gelderland Loan Agreement”), with Rabobank, that includes the following tranches: (i) four loans with principal amounts of (a)
€2,453 thousand (with a fixed interest rate of 3.6% for the first five years), (b) €1,200 thousand (with a fixed interest rate of 4.5% for the first five years), (c) €400 thousand (with a fixed interest rate of 3.55% for the
first five years) and (d) €2,847 thousand, (with a fixed interest rate of 4.5% for the first five years), for a period of 12 years (144 monthly payments), repayable in equal monthly installments and (ii) an on-call credit
facility of €750 thousand with variable interest. An aggregate amount of €6,900 thousand was withdrawn in 2015, 2016 and 2018 on account of these loans. On November 30, 2020 GG Gelderland replaced the loan set forth in
(i)(a) above which as of that date had an outstanding principal amount of €1,890 thousand, with a another loan from Rabobank with a fixed interest rate of 3.1% per year, repayable in 56 payments monthly, with a repayment of
principal in one payments on August 2025. On the same date, the interest for the other loans bearing a fixed interest rate of 4.5% per year for 5 years was reduced to 3.5% per year for the next 5 years, commencing December
2020.
|
| A. |
Loans details (cont’d)
|
|
In connection with the Gelderland Loan Agreement, the following securities were provided to Rabobank: (i) pledge on the present and future rights arising from the feedstock purchase agreement, the
EPC agreement, the O&M agreement, the SDE subsidy, the various power and green gas purchase agreements, and the green gas certification supply agreement, (ii) pledge on all present and future (a) receivables arising from
business and trade, and (b) stock and inventory including machinery and transport vehicles of GG Gelderland, and (iii) all rights/claims of GG Gelderland against third parties existing at the time of the execution of the
Gelderland Loan Agreement, including rights from insurance agreements. In connection with the Gelderland Loan Agreement, Ellomay Luxembourg, the Company wholly-owned subsidiary, provided the undertaking to Rabobank that
Ellomay Luxembourg will not sell the shares of GG Gelderland without the prior written consent of Rabobank.
|
| 4. |
GG Gelderland, entered into a loan agreement in the end of November, 2020, with Ontwikkelingsnaatscgappij Oost-Nederland N.V. (“Oost”), as a benefit created
following the corona period. The loan is with a principal amounts of €750 thousand with a fixed interest rate of 3 % per year for 3 years. The interest and the principle will be fully repaid in one single amount
after 3 years. According to the agreement with Oost, the loan term may be prolonged up to 5 years.
|
| 1. |
On March 12, 2019, four of the Company’s Spanish subsidiaries (together, hereinafter – the “Subsidiaries”) entered into a €18.4 million project finance Facility Agreement (the “Facility
Agreement”). The €18.4 million principal amount is divided into: (i) four term loan facilities, one for each Subsidiary, in the aggregate amount of €17.6 million with terms ending in December 2037, and (ii) a revolving
credit facility to attend the debt service if needed, for a maximum amount of euro 0.8 million granted to any of the Subsidiaries.
The loans provided under the Facility Agreement bear an annual interest at the rate of Euribor 6 months plus a margin of 2% (with a zero interest floor) and repaid semi-annually on June 20
and December 20. The principal is repaid on a semi-annual basis based on a pre-determined sculptured repayment schedule.
The Facility Agreement provides for mandatory prepayment upon the occurrence of certain events and includes various customary representations, warranties and covenants, including covenants
to maintain a DSCR on an aggregate basis not lower than 1.05:1, and not to make distributions unless, among other things: (i) the DSCR, on an aggregate basis, is equal to or higher than 1.15:1.0, (ii) the first
instalment of the Project Finance has been repaid, (iii) no amount under the revolving credit tranche has been withdrawn and not fully repaid and no drawdowns of the revolving credit tranche are expected within the
next six months, and (iv) the Subsidiaries’ net debt to regulatory value (as such terms are defined in the Facility Agreement) ratio is equal to or higher than 0.7:1.
|
| A. |
Loans details (cont’d)
|
|
The regulatory value of the photovoltaic plants owned by the Subsidiaries is approximately €23.5 million, compared to their aggregate nominal purchase price, which was
approximately €14.85 million and their aggregate book value, which was approximately €14.6 million as of September 30, 2018. The Facility Agreements includes a cash-sweep payment mechanism and obligation that applies in the event
the Subsidiaries’ net debt to regulatory value ratio is equal to or higher than 0.7:1. As of December 31, 2020, the financial covenants were met.
The Subsidiaries entered into swap agreements on March 12, 2019 with respect to approximately Euro 17.6 million (with a decreasing notional principal amount based on the
amortization table) until December 2037, replacing the Euribor 6 month rate with a fixed 6 month rate of approximately 1%, resulting in a fixed annual interest rate of approximately 3%. Such swap transactions qualify for hedge
accounting. See Note 21 E regarding the effect of the expected transition away from Libor and Euribor.
The documents ancillary to the Facility Agreements require that security interests be provided in connection with the following: (i) the Subsidiaries’ shares (held by Ellomay
Luxembourg(, (ii) pledges over accounts, (iii) pledges over relevant agreements including hedging agreements; and (iv) promissory equipment mortgage.
|
| 1. |
On April 30, 2019, the Talasol Project reached financial closing in the aggregate amount of approximately €158.5 million (“the Project Finance”). The Project Finance
consists of several facilities from Deutsche Bank AG and from the European Investment Bank (“EIB”). The Talasol Project Finance includes the following facilities:
(a) a term facility in the amount of approximately €65.9 million, with a term ending on September 30, 2033, repaid in unequal sculptured semi-annual installments. Loan amounts drawn from this
facility will bear an annual interest of EURIBOR (with a zero floor and synchronous with the applicable interest period described below) plus a margin determined based on the stage of the Talasol Project. The applicable
margins are: (i) 2.25% until technical completion, (ii) 2% from technical completion until the 5th anniversary of technical completion, (iii) 2.25% from the 5th anniversary of technical completion until the termination date of
the financial power swap agreement that Talasol entered into last June (see Note 21) (the “PPA”, i.e., September 30, 2030), and (iv) 2.5% from the termination date of the PPA until the end of the term of the commercial term
facility. As of December 31, 2020, the Company made €54.3 million withdrawals on account of this facility;
(b) a revolving debt service reserve facility in the amount of €4.45 million, with a term ending on the earlier of: (i) September 30, 2033 or (ii) the date on which the commercial term loan
set forth under (a) above has been repaid in full. Loan amounts drawn from this facility will bear an annual interest of 6 month EURIBOR (with a zero floor) plus a margin determined based on the stage of the Talasol Project.
The applicable margins are: (i) 2.5% until technical completion, (ii) 2.25% from technical completion until the 5th anniversary of technical completion, (iii) 2.50% from the 5th anniversary of technical completion until the
termination date of the PPA, and (iv) 2.75% from the termination date of the PPA until the termination date;
|
| A. |
Loans details (cont’d)
|
|
(c) VAT facility in the amount of €6.67 million, with a term ending on June 30, 2021, repaid by using balances
available in the VAT reimbursement account but in no event later than June 30, 2021. Loan amounts drawn from this facility will bear an annual interest of 1 month EURIBOR (with a zero floor) plus a margin of 2%. As of December
31, 2020, the amount of the VAT facility is €58 thousand;
(d) a letter of credit facility in the initial amount of €12 million, with a term ending on September 30, 2030, to
be repaid in full on its termination date and bearing an annual interest of (i) 1.25% for amounts cash covered, and (ii) 2% for any other amounts;
(e) a term facility in the amount of €65 million from EIB, granted under the Investment Plan for Europe known as the
Juncker Plan, with a term ending on September 30, 2033, repaid in unequal sculptured semi-annual installments. Loan amounts drawn from this facility will bear an annual interest of EURIBOR synchronous with the applicable
interest period plus a margin (expected to be 1.76%). As of December 31, 2020, the Company made €53.6 million withdrawals on account of this facility; and
(f) a revolving debt service reserve facility from the EIB in the amount of €4.45 million granted by EIB under the
Investment Plan for Europe, with a term ending on the earlier of: (i) September 30, 2033 or (ii) the date on which the commercial term loan set forth under (e) above has been repaid in full. Loans drawn from this facility will
bear an annual interest of 6 month EURIBOR (with a zero floor) plus a margin, which is expected to be similar to the CFL Debt Service Reserve Facility under (b) above.
During the construction period, interest payments on the term, revolving debt and VAT facilities are made on a monthly basis, and semi-annually thereafter (commencing March 31,
2021). The VAT facilities’ interest period, however, remains on a monthly basis. The agreements executed in connection with the Talasol Project Finance provide for mandatory prepayment upon the occurrence of certain events and
various customary representations, warranties and covenants, including covenants to maintain a Historic and Projected DSCR not lower than 1.05:1, and not to make distributions in the event that: (i) the Historic and Projected
DSCR will be lower than 1.15:1.0 and (ii) the Loan Life Cover Ratio will be lower than 1.20:1.0. The facilities provided by the EIB include certain other representations and undertakings mandated by applicable EU regulation.
The Talasol Project Finance documents require that security interests be provided in connection with the following: (i) Talasol’s shares (held by the Company’s wholly-owned
subsidiary, Ellomay Luxembourg), (ii) pledges over accounts, (iii) pledges over Talasol Project’s documents, (iv) pledges over receivables under the shareholders loans, (v) security assignment of hedging claims and (vi)
promissory equipment mortgage.
In connection with the Talasol Project Finance, Ellomay Luxembourg, and the parent company of Talasol, and the Company undertook separately to (indirectly) retain at least 50.1%
of the shares in Talasol and not to buy any debt of, or hedging claims against, Talasol from the entities providing the financing to the Talasol Project.
On April 30, 2019, Talasol entered into a swap agreement for an amount equal to at least 95% of the maximum amount of the term facilities and replacing the Euribor 6 month rate with a fixed 6 month
rate of approximately 0.9412%. See Note 21 E regarding the effect of the expected transition away from Libor and Euribor.
|
| A. |
Loans details (cont’d)
|
|
As the financing was structured for the term of the PPA signed in connection with the Talasol Project (ten years) plus additional three years beyond the term of the PPA, the Talasol Project Finance
documentation requires Talasol to prepay the term loans via cash-sweeps to ensure that the term loans are repaid in full until the termination date of the PPA. Talasol has the option to place the relevant cash sweep amounts on a
reserve account instead, and, in the event it enters into a satisfactory new power purchase agreement or power hedge agreement, the amounts on the reserve account may be transferred to the operating account of Talasol, to the
extent they are not required in prepayment of the term loans to ensure that during the remainder of the term loans the base case ratios are complied with.
|
| 2. |
On April 30, 2019, following the financial closing of Talasol Project and sale of 49% holdings of the Talasol Project, Talasol entered into a loan agreement with GSE 3 UK Limited and Fond-ICO
Infraestructuras II, FICC (the minority shareholders of Talasol, each of whom owns 24.5% of Talasol). The unpaid balance (principal and interest) of the loan will bear interest of Euribor 6 mount plus 5.27%. The maturity date
of this loan is December 31, 2037. As of December 31, 2020, the amount of the loan is €47,563 thousand.
|
|
December 31
|
December 31
|
|||||||
|
2020
|
2019
|
|||||||
|
€ in thousands
|
||||||||
|
Second year
|
12,910
|
7,656
|
||||||
|
Third year
|
13,034
|
5,274
|
||||||
|
Fourth year
|
12,539
|
5,342
|
||||||
|
Fifth year
|
13,264
|
5,242
|
||||||
|
Sixth year and thereafter
|
132,169
|
65,668
|
||||||
|
Long-term loans
|
183,916
|
89,182
|
||||||
|
Current maturities
|
14,253
|
4,138
|
||||||
|
198,169
|
93,320
|
|||||||
| C. |
In order to minimize the interest-rate risk resulting from liabilities to banks and financing institutions in Italy linked to the Euribor, the Company executed swap transactions. For more information , see Note 21.
|
|
Liabilities
|
||||||||||||||||
|
Loans and
|
||||||||||||||||
|
Note
|
borrowings
|
Debentures
|
Total
|
|||||||||||||
|
€ in thousands
|
||||||||||||||||
|
Balance as at January 1, 2020
|
93,320
|
71,584
|
164,904
|
|||||||||||||
|
Changes from financing cash flows
|
||||||||||||||||
|
Proceeds from issue of debentures
|
12
|
-
|
38,057
|
38,057
|
||||||||||||
|
Repayment of Debentures
|
12
|
-
|
(26,923
|
)
|
(26,923
|
)
|
||||||||||
|
Receipt of loans
|
11
|
111,357
|
-
|
111,357
|
||||||||||||
|
Repayment of loans
|
11
|
(3,959
|
)
|
-
|
(3,959
|
)
|
||||||||||
|
Accrued interest
|
11
|
822
|
-
|
822
|
||||||||||||
|
Transaction costs related to borrowings
|
(9,538
|
)
|
247
|
(9,291
|
)
|
|||||||||||
|
Purchase of the operation (see note 6D)
|
6,511
|
-
|
6,511
|
|||||||||||||
|
Total net financing cash flows
|
198,513
|
82,965
|
281,478
|
|||||||||||||
|
Effect of changes in foreign exchange rates
|
(344
|
)
|
(241
|
)
|
(585
|
)
|
||||||||||
|
Balance as at December 31, 2020
|
198,169
|
82,724
|
280,893
|
|||||||||||||
|
December 31, 2020
|
December 31, 2019
|
|||||||||||||||
|
Face value
|
Carrying amount
|
Face value
|
Carrying amount
|
|||||||||||||
|
€ in thousands
|
€ in thousands
|
|||||||||||||||
|
Debentures
|
83,499
|
82,724
|
72,137
|
71,584
|
||||||||||||
|
Less current maturities
|
10,849
|
10,600
|
26,928
|
26,773
|
||||||||||||
|
Total long-term debentures
|
72,650
|
72,124
|
45,209
|
44,811
|
||||||||||||
| 1. |
The Company’s equity, on a consolidated basis, shall not be less than $55 million;
|
| 2. |
The ratio of (a) the short-term and long-term debt from banks, in addition to the debt to holders of debentures issued by us and any other interest-bearing financial obligations, net of cash and cash equivalents and short-term
investments and net of project finance, including hedging transactions in connection with such project finance, of the Company’s subsidiaries, or, together, the Net Financial Debt, to (b) the Company’s equity, on a consolidated basis,
plus the Net Financial Debt, shall not exceed a rate of 65%; and
|
| 3. |
The ratio of (a) the Company’s equity, on a consolidated basis, to (b) the Company’s balance sheet, on a consolidated basis, shall not be less than a rate of 20%.
|
| 1. |
the Company’s balance sheet equity, on a consolidated basis, shall not be less than $55 million;
|
| 2. |
The ratio of (a) the short-term and long-term debt from banks, in addition to the debt to holders of debentures issued by us and any other interest-bearing financial obligations, net of cash and cash equivalents and short-term
investments and net of financing of projects, including hedging transactions in connection with such financing, of the Company’s subsidiaries, or, together, the Net Financial Debt, to (b) the Company’s equity (which the Company
calculate in line with the definition of balance sheet equity in the Series B Deed of Trust), on a consolidated basis, plus the Net Financial Debt, commencing from the financial results for September 30, 2018 – shall not exceed the rate
of 60% for purposes of the immediate repayment provision and shall not exceed the rate of 55% for purposes of the annual interest update provision; and
|
| 3. |
The ratio of (a) the Company’s equity (which the Company calculate in line with the definition of balance sheet equity in the Series B Deed of Trust), on a consolidated basis, to (b) the Company’s balance sheet, on a consolidated
basis, commencing from the financial results for September 30, 2018 – shall not be less than a rate of 25% for purposes of the immediate repayment provision and shall not be less than a rate of 30% for purposes of the annual interest
update provision.
|
| A. |
Debentures – Details (cont'd)
|
| 1. |
the Company’s balance sheet equity, on a consolidated basis, shall not be less than €50 million for purposes of the immediate repayment provision and shall not be less than €60 for purposes of the annual interest update provision;
|
| 2. |
The ratio of (a) the short-term and long-term debt from banks, in addition to the debt to holders of debentures issued by us and any other interest-bearing financial obligations, net of cash and cash equivalents and short-term
investments and net of financing of projects, including hedging transactions in connection with such financing, of the Company’s subsidiaries, or, together, the Net Financial Debt, to (b) the Company’s equity (which the Company
calculate in line with the definition of Balance Sheet Equity in the Series C Deed of Trust), on a consolidated basis, plus the Net Financial Debt, or the Company’s CAP, Net, to which the Company refer herein as the Ratio of Net
Financial Debt to CAP, Net, shall not exceed the rate of 67.5% for purposes of the immediate repayment provision and shall not exceed a rate of 60% for purposes of the annual interest update provision; and
|
| B. |
Debentures – Details (cont'd)
|
| 3. |
The ratio of (a) the Company’s Net Financial Debt, to (b) the Company’s earnings before financial expenses, net, taxes, depreciation and amortization, where the revenues from the Company’s operations, such as the Talmei Yosef
project, are calculated based on the fixed asset model and not based on the financial asset model (IFRIC 12), and before share-based payments, based on the aggregate four preceding quarters, or the Company’s Adjusted EBITDA, to which
the Company refer to herein as the Ratio of Net Financial Debt to Adjusted EBITDA, shall not be higher than 12 for purposes of the immediate repayment provision and shall not be higher than 10 for purposes of the annual interest update
provision.
|
|
December 31
|
December 31
|
|||||||
|
2020
|
2019
|
|||||||
|
€ in thousands
|
||||||||
|
Second year
|
13,716
|
6,927
|
||||||
|
Third year
|
15,322
|
8,098
|
||||||
|
Fourth year
|
24,629
|
9,714
|
||||||
|
Fifth year
|
18,457
|
13,195
|
||||||
|
Sixth year and thereafter
|
-
|
6,877
|
||||||
|
Long-term loans
|
72,124
|
44,811
|
||||||
|
Current maturities
|
10,600
|
26,773
|
||||||
|
82,724
|
71,584
|
|||||||
|
December 31
|
December 31
|
|||||||
|
2020
|
2019
|
|||||||
|
€ in thousands
|
||||||||
|
Forward contracts closed (1)
|
486
|
1,767
|
||||||
|
Liabilities for employees benefits
|
27
|
28
|
||||||
|
513
|
1,795
|
|||||||
| (1) |
The Company closed euro/USD forward contracts with an accumulated loss of approximately €1,767 thousand (approximately $1,982 thousand) in 2019 that are expected to be paid in
2021 and 2022. For the amount expected to be paid in 2021, please see note 9.
|
| a. |
The Company leases land in Spain from private lessors for a period of approximately 35 years, on which it sets up Ellomay Solar photovoltaic site. The contractual period of the aforesaid lease agreements ends on February, 2056. A
lease liability in the amount of €1,789 thousand and right-of-use asset in the amount of €1,789 thousand have been recognized in the statement of financial positon as at December 31, 2020 in respect of leases of land.
|
| b. |
The Company leases machinery equipment in Gelderland, the Netherlands for a period of approximately 1-4 years, on which the Biogas Installations plant in Gelderland is located. The contractual period of the aforesaid lease agreements
ends on October 1st, 2024. A lease liability in the amount of €355 thousand and right-of-use asset in the amount of €355 thousand have been recognized in the statement of financial positon as at December 31, 2020 in respect of leases of
machinery equipment.
|
|
Gelderland
|
Spain
|
Talasol
|
Talmei Yosef
|
Total
|
||||||||||||||||
|
€ in thousands
|
||||||||||||||||||||
|
Cost
|
||||||||||||||||||||
|
Balance as at January 1, 2020
|
-
|
1,235
|
12,686
|
1,688
|
15,609
|
|||||||||||||||
|
Additions
|
-
|
1,789
|
-
|
10
|
1,799
|
|||||||||||||||
|
New companies
|
355
|
-
|
-
|
-
|
355
|
|||||||||||||||
|
Disposals
|
-
|
-
|
-
|
-
|
-
|
|||||||||||||||
|
Effect of changes in exchange rates
|
-
|
-
|
-
|
(26
|
)
|
(26
|
)
|
|||||||||||||
|
Balance as at December 31, 2020
|
355
|
3,024
|
12,686
|
1,672
|
17,737
|
|||||||||||||||
|
Depreciation
|
||||||||||||||||||||
|
Balance as at January 1, 2020
|
-
|
75
|
30
|
103
|
208
|
|||||||||||||||
|
Depreciation for the year
|
-
|
75
|
139
|
106
|
320
|
|||||||||||||||
|
New companies
|
-
|
-
|
-
|
-
|
-
|
|||||||||||||||
|
Disposals
|
-
|
-
|
-
|
-
|
-
|
|||||||||||||||
|
Balance as at December 31, 2020
|
-
|
150
|
169
|
209
|
528
|
|||||||||||||||
|
Carrying amounts
|
||||||||||||||||||||
|
As at January 1, 2019
|
-
|
-
|
-
|
-
|
-
|
|||||||||||||||
|
As at December 31, 2019
|
-
|
1,160
|
12,656
|
1,585
|
15,401
|
|||||||||||||||
|
As at December 31, 2020
|
355
|
2,874
|
12,517
|
1,463
|
17,209
|
|||||||||||||||
|
December 31, 2020
|
||||
|
€ in thousands
|
||||
|
Less than one year
|
489
|
|||
|
One to five years
|
2,096
|
|||
|
More than five years
|
15,203
|
|||
|
Total
|
17,788
|
|||
|
Current maturities of lease liability
|
489
|
|||
|
Long-term lease liability
|
17,299
|
|||
|
2020
|
||||
|
€ in thousands
|
||||
|
Interest expenses on lease liability
|
494
|
|||
|
Total
|
494
|
|||
| A. |
On December 30, 2008, the Company's shareholders approved the terms of a management services agreement entered into among the Company, Kanir Joint Investments (2005) Limited Partnership ("Kanir") and Meisaf Blue & White Holdings
Ltd. ("Meisaf"), a company controlled by the Company's chairman of the board and controlling shareholder, effective as of March 31, 2008 (the "Management Agreement"). According to the Management Agreement, Kanir and Meisaf, through
their employees, officers and directors, provide assistance to the Company in all aspects of the new operations process, including but not limited to, any activities to be conducted in connection with identification and evaluation of
the business opportunities, the negotiations and the integration and management of any new operations and including discussions with the Company's management to assist and advise them on such matters and on any matters concerning the
Company's affairs and business and provide board services and chief executive officer services. In consideration of the performance of the management services and the board services pursuant to the Management Agreement, the Company
initially agreed to pay Kanir and Meisaf an aggregate annual management services fee in the amount of $250 thousand.
This annual management fee was increased to $400 thousand in June 2013 (approximately €326 thousand, based on the NIS/euro exchange rate as at December 31, 2020 following approval by the Audit Committee,
Compensation Committee, Board of Directors and by the Company's shareholders at the shareholders' meeting held in June 2013. The current term of the Management Agreement is until June 17, 2022.
The Company sub-leases a small part of its office space to a company controlled by Mr. Shlomo Nehama, the Company's chairman of the Board and a controlling shareholder, at a price per square meter based
on the price that it pays under its lease agreements. This sub-lease agreement was approved by the Company's Board of Directors.
|
| B. |
Compensation to key management personnel and interested parties (including directors)
|
|
Year ended December 31
|
||||||||||||||||||||||||
|
2020
|
2019
|
2018
|
||||||||||||||||||||||
|
Number of
|
Number of
|
Number of
|
||||||||||||||||||||||
|
People
|
Amount
|
People
|
Amount
|
People (*)
|
Amount
|
|||||||||||||||||||
|
€ thousands
|
€ thousands
|
€ thousands
|
||||||||||||||||||||||
|
Short-term employee
|
||||||||||||||||||||||||
|
Benefits
|
3
|
880
|
3
|
689
|
2
|
371
|
||||||||||||||||||
|
Post-employment
|
||||||||||||||||||||||||
|
Benefits
|
2
|
62
|
2
|
56
|
2
|
48
|
||||||||||||||||||
|
Share-based payments
|
1
|
-
|
1
|
29
|
2
|
-
|
||||||||||||||||||
| B. |
Compensation to key management personnel and interested parties (including directors) (cont’d)
|
|
Year ended December 31
|
||||||||||||||||||||||||
|
2020
|
2019
|
2018
|
||||||||||||||||||||||
|
Number of
|
Number of
|
Number of
|
||||||||||||||||||||||
|
people
|
Amount
|
people
|
Amount
|
People (*)
|
Amount
|
|||||||||||||||||||
|
€ thousands
|
€ thousands
|
€ thousands
|
||||||||||||||||||||||
|
Total compensation to
|
||||||||||||||||||||||||
|
directors not employed
|
||||||||||||||||||||||||
|
by the Company
|
3
|
63
|
3
|
72
|
3
|
49
|
||||||||||||||||||
|
share-based payments
|
3
|
34
|
3
|
9
|
3
|
5
|
||||||||||||||||||
|
The terms of the loan
|
Balance as at December 31
|
Interest income recognized instatement of
|
||||||||||||||||||||||
|
Interest
|
Linkage
|
income for the year endedDecember 31
|
||||||||||||||||||||||
|
rate
|
base
|
2020
|
2019
|
2020
|
2019
|
2018
|
||||||||||||||||||
|
%
|
€ thousands
|
|||||||||||||||||||||||
|
Dori Energy
|
8.1 (*)
|
|
NIS+CPI
|
8,745
|
10,595
|
620
|
814
|
1,130
|
||||||||||||||||
|
December 31, 2020
|
December 31, 2019
|
December 31, 2018
|
||||||||||||||||||||||
|
Issued and
|
Issued and
|
Issued and
|
||||||||||||||||||||||
|
Authorized
|
Outstanding(1)
|
Authorized
|
outstanding(1)
|
Authorized |
Outstanding
|
|||||||||||||||||||
|
Number of shares
|
||||||||||||||||||||||||
|
Ordinary shares
Of NIS 10.00 par value each
|
17,000,000
|
12,652,094
|
(1)
|
17,000,000
|
11,479,094
|
(1)
|
17,000,000
|
10,675,508
|
(1)
|
|||||||||||||||
| (1) |
Net of treasury shares as follows: 258,046 Ordinary shares as of December 31, 2019, 2018 and 2017, all of which have been purchased according to share buyback programs that were authorized the Company's Board of Directors.
|
| A. |
Composition of share capital (cont'd)
|
| 1. |
Voting rights at the general meeting, right to dividend and rights upon liquidation of the Company.
|
| 2. |
Commencing August 22, 2011, the Company’s ordinary shares have been listed on the NYSE American (formerly the NYSE MKT and the NYSE Amex). On October 27, 2013, the Company's ordinary shares were also listed for trading on the Tel
Aviv Stock Exchange in Israel.
|
| 1. |
To preserve the Company's ability to ensure business continuity thereby creating a return for the shareholders, investors and other interested parties.
|
| 2. |
To ensure adequate return for the shareholders by making reasonable investment decisions based on the level of internal rate of return that is in line with the Company's business activity.
|
| 3. |
To maintain healthy capital ratios in order to support business activity and maximize shareholders value.
|
| E. |
Dividend distribution and buyback program
|
|
Year ended December 31
|
||||||||||||
|
2020
|
2019
|
2018
|
||||||||||
|
€ thousand
|
||||||||||||
|
Expenses arising from share-based payment
|
||||||||||||
|
Transactions
|
50
|
8
|
5
|
|||||||||
|
Year ended December 31
|
||||||||||||
|
2020
|
2019
|
2018
|
||||||||||
|
Dividend yield
|
0
|
%
|
0
|
%
|
0
|
%
|
||||||
|
Expected volatility
|
0.427
|
0.428
|
0.384
|
|||||||||
|
Risk-free interest
|
0.11
|
%
|
1.73
|
%
|
2.67
|
%
|
||||||
|
Expected life (in years)
|
2-3
|
2-3
|
2-3
|
|||||||||
|
Equal market price
|
||||||||
|
2020
|
2019
|
|||||||
|
US$
|
||||||||
|
Weighted average exercise prices
|
28.91
|
11.41
|
||||||
|
Weighted average fair value on grant date
|
9.63
|
3.4
|
||||||
|
2020
|
2019
|
2018
|
||||||||||||||||||||||
|
Weighted
|
Weighted
|
Weighted
|
||||||||||||||||||||||
|
Average
|
average
|
Average
|
||||||||||||||||||||||
|
Number of
|
Exercise
|
Number of
|
exercise
|
Number of
|
Exercise
|
|||||||||||||||||||
|
options
|
Price
|
options
|
price
|
options
|
Price
|
|||||||||||||||||||
|
US$
|
US$
|
US$
|
||||||||||||||||||||||
|
Outstanding at
|
||||||||||||||||||||||||
|
beginning of year
|
34,886
|
8.09
|
27,169
|
7.82
|
25,502
|
7.54
|
||||||||||||||||||
|
Granted during
|
||||||||||||||||||||||||
|
the year
|
4,249
|
28.91
|
18,303
|
11.41
|
3,000
|
8.95
|
||||||||||||||||||
|
Exercised during
|
||||||||||||||||||||||||
|
the year
|
(8,000
|
)
|
7.87
|
(3,586
|
)
|
6.27
|
-
|
-
|
||||||||||||||||
|
Expired during
|
||||||||||||||||||||||||
|
the year
|
-
|
-
|
(7,000
|
)
|
8.25
|
(1,333
|
)
|
5
|
||||||||||||||||
|
Outstanding at
|
||||||||||||||||||||||||
|
end of year
|
31,135
|
12.94
|
34,886
|
9.83
|
27,169
|
7.82
|
||||||||||||||||||
|
Exercisable at
|
||||||||||||||||||||||||
|
end of year
|
17,018
|
6.3
|
16,583
|
8.09
|
24,169
|
7.68
|
||||||||||||||||||
| D. |
The weighted average remaining contractual life for the share options outstanding as of December 31, 2020 was 7.62 years (as of December 31, 2019 was 7.33 years and as of December
31, 2018 was 5.51 years).
|
| E. |
The range of exercise prices for share options outstanding as of December 31, 2020: $5.55- $34.44 (as of December 31, 2019 the range was $5.55- $13 and as of December 31, 2018 the range was $4.7- $9.37).
|
|
For the year ended December 31
|
||||||||||||
|
2020
|
2019
|
2018
|
||||||||||
|
€ in thousands
|
||||||||||||
|
Interest income and consumer price index in Israel in connection to concession project
|
1,423
|
1,757
|
1,948
|
|||||||||
|
Interest income
|
553
|
70
|
291
|
|||||||||
|
Change in fair value of derivatives, net
|
1,094
|
897
|
494
|
|||||||||
|
Consumer price index in Israel for loan
|
103
|
-
|
-
|
|||||||||
|
Swap interest
|
55
|
-
|
-
|
|||||||||
|
Gain from exchange rate differences, net
|
-
|
-
|
697
|
|||||||||
|
Total financing income
|
3,228
|
2,724
|
3,430
|
|||||||||
|
For the year ended December 31
|
||||||||||||
|
2020
|
2019
|
2018
|
||||||||||
|
€ in thousands
|
||||||||||||
|
Swap interest
|
-
|
270
|
206
|
|||||||||
|
Debentures interest and related expenses
|
2,155
|
4,696
|
2,604
|
|||||||||
|
Interest on loans
|
1,518
|
(*) 2,325
|
|
2,330
|
||||||||
|
Consumer price index in Israel for loan
|
-
|
102
|
171
|
|||||||||
|
Bank charges and other commissions
|
576
|
585
|
210
|
|||||||||
|
Forward loss
|
-
|
513
|
-
|
|||||||||
|
Interest on lease liability
|
494
|
(*) 341
|
|
-
|
||||||||
|
Loss from exchange rate differences, net
|
2,119
|
2,045
|
-
|
|||||||||
|
Total financing expenses
|
6,862
|
10,877
|
5,521
|
|||||||||
|
For the year ended December 31
|
||||||||||||
|
2020
|
2019
|
2018
|
||||||||||
|
€ in thousands
|
||||||||||||
|
Depreciation from fixed assets
|
2,299
|
5,744
|
5,500
|
|||||||||
|
Depreciation from Right-of-use assets
|
320
|
321
|
-
|
|||||||||
|
Amortization
|
356
|
351
|
316
|
|||||||||
|
Professional services
|
466
|
663
|
375
|
|||||||||
|
Annual rent
|
16
|
9
|
390
|
|||||||||
|
Operating and maintenance services
|
4,025
|
5,322
|
4,942
|
|||||||||
|
Insurance
|
178
|
344
|
245
|
|||||||||
|
Other
|
266
|
300
|
390
|
|||||||||
|
Total operating costs
|
7,926
|
13,054
|
12,158
|
|||||||||
|
For the year ended December 31
|
||||||||||||
|
2020
|
2019
|
2018
|
||||||||||
|
€ in thousands
|
||||||||||||
|
Salaries and related compensation
|
1,442
|
1,324
|
1,016
|
|||||||||
|
Professional services
|
2,057
|
1,978
|
2,185
|
|||||||||
|
Other
|
1,013
|
525
|
399
|
|||||||||
|
Total general and administrative expenses
|
4,512
|
3,827
|
3,600
|
|||||||||
|
For the year ended December 31
|
||||||||||||
|
2020
|
2019
|
2018
|
||||||||||
|
€ in thousands
|
||||||||||||
|
Other income in connection with the A.R.Z. electricity pumped storage project (see Note 6B)
|
-
|
-
|
73
|
|||||||||
|
Compensation from contractor (*)
|
-
|
-
|
811
|
|||||||||
|
Other (**)
|
2,100
|
(2,100
|
)
|
-
|
||||||||
|
Total other income (expenses), net
|
2,100
|
(2,100
|
)
|
884
|
||||||||
|
For the year ended December 31
|
||||||||||||
|
2020
|
2019
|
2018
|
||||||||||
|
€ in thousands
|
||||||||||||
|
Revenues from the sale of solar electricity
|
2,577
|
13,069
|
12,593
|
|||||||||
|
Revenues from the sale of gas and power produced by anaerobic digestion plants
|
6,002
|
4,786
|
4,483
|
|||||||||
|
Revenues from concessions project
|
1,066
|
1,133
|
1,041
|
|||||||||
|
Total Revenues
|
9,645
|
18,988
|
18,117
|
|||||||||
|
For the year ended December 31
|
||||||||||||
|
2020
|
2019
|
2018
|
||||||||||
|
€ in thousands
|
||||||||||||
|
Current tax income (expense)
|
||||||||||||
|
Current year
|
(119
|
)
|
(741
|
)
|
(438
|
)
|
||||||
|
Adjustments for prior years, net
|
(4
|
)
|
(14
|
)
|
26
|
|||||||
|
(123
|
)
|
(755
|
)
|
(412
|
)
|
|||||||
|
Deferred tax income
|
||||||||||||
|
Creation and reversal of temporary differences
|
248
|
1,042
|
197
|
|||||||||
|
Tax benefit (taxes on income)
|
125
|
287
|
(215
|
)
|
||||||||
|
2020
|
2019
|
2018
|
||||||||||
|
€ in thousands
|
||||||||||||
|
Profit (loss) before taxes on income
|
(6,293
|
)
|
9,497
|
819
|
||||||||
|
Primary tax rate of the Company
|
23
|
%
|
23
|
%
|
23
|
%
|
||||||
|
Tax calculated according to the Company’s primary tax rate
|
1,447
|
(2,184
|
)
|
(188
|
)
|
|||||||
|
Additional tax (tax saving) in respect of:
|
||||||||||||
|
Different tax rate of foreign subsidiaries
|
(576
|
)
|
(11
|
)
|
45
|
|||||||
|
Neutralization of tax calculated in respect of the Company’s share in profits of equity accounted investees
|
351
|
710
|
585
|
|||||||||
|
Changes in deferred taxes for tax losses and benefits from previous years for which deferred taxes were not created in the past
|
483
|
3,681
|
-
|
|||||||||
|
Change in temporary differences for which deferred tax were not recognized
|
325
|
(166
|
)
|
(576
|
)
|
|||||||
|
Current year tax losses and benefits for which deferred taxes were not created
|
(1,910
|
)
|
(1,740
|
)
|
(136
|
)
|
||||||
|
Tax benefit (taxes) in respect to previous years and others
|
5
|
(3
|
)
|
55
|
||||||||
|
Actual Tax benefit (tax on income)
|
125
|
287
|
(215
|
)
|
||||||||
| Carry- forward | ||||||||||||||||||||
|
Financial
|
Fixed
|
Swap
|
tax
|
|||||||||||||||||
|
assets
|
assets
|
contract
|
losses
|
Total
|
||||||||||||||||
|
€ in thousands
|
||||||||||||||||||||
|
Balance of deferred tax asset (liability)
|
||||||||||||||||||||
|
as at January 1, 2020
|
(6,972
|
)
|
(1,294
|
)
|
678
|
3,406
|
(4,182
|
)
|
||||||||||||
|
Changes recognized in profit or loss
|
(219
|
)
|
704
|
-
|
(237
|
) |
248
|
|||||||||||||
|
Changes recognized due to business combination
|
-
|
(919
|
)
|
-
|
1,407
|
488
|
||||||||||||||
|
Changes recognized in other comprehensive income
|
127
|
-
|
(846
|
)
|
(36
|
)
|
(755
|
)
|
||||||||||||
|
Balance of deferred tax asset (liability) as at
|
||||||||||||||||||||
|
December 31, 2020
|
(7,064
|
)
|
(1,509
|
)
|
(168
|
)
|
4,540
|
(4,201
|
)
|
|||||||||||
|
Carry-
|
||||||||||||||||||||||||
|
Financial
|
Fixed
|
Long term
|
Swap
|
forward tax
|
||||||||||||||||||||
|
assets
|
assets
|
loans
|
contract
|
losses
|
Total
|
|||||||||||||||||||
|
€ in thousands
|
||||||||||||||||||||||||
|
Balance of deferred tax asset (liability)
|
||||||||||||||||||||||||
|
as at January 1, 2019
|
(6,935
|
)
|
(1,916
|
)
|
710
|
198
|
4,147
|
(3,796
|
)
|
|||||||||||||||
|
Changes recognized in profit or loss
|
719
|
865
|
(97
|
)
|
(27
|
)
|
(418
|
)
|
1,042
|
|||||||||||||||
|
Changes recognized due to sale of operation
|
-
|
(243
|
)
|
(613
|
)
|
(261
|
)
|
(555
|
)
|
(1,672
|
)
|
|||||||||||||
|
Changes recognized in other comprehensive income
|
(756
|
)
|
-
|
-
|
768
|
232
|
244
|
|||||||||||||||||
|
Balance of deferred tax asset (liability) as at
|
||||||||||||||||||||||||
|
December 31, 2019
|
(6,972
|
)
|
(1,294
|
)
|
-
|
678
|
3,406
|
(4,182
|
)
|
|||||||||||||||
|
For the year ended December 31
|
||||||||||||
|
2020
|
2019
|
2018
|
||||||||||
|
€ in thousands (other than share and per share data)
|
||||||||||||
|
Net income (loss) attributed to owners of the Company
|
(4,627
|
)
|
12,060
|
1,057
|
||||||||
|
Weighted average ordinary shares outstanding (1)
|
12,304,269
|
11,064,847
|
10,675,508
|
|||||||||
|
Dilutive effect:
|
||||||||||||
|
Stock options and warrants
|
23,549
|
5,589
|
3,349
|
|||||||||
|
Diluted weighted average ordinary shares Outstanding
|
12,327,818
|
(2)
|
11,070,436
|
10,678,857
|
||||||||
|
Basic profit (loss) per share from continuing operations
|
(0.38
|
)
|
1.09
|
0.10
|
||||||||
|
Diluted profit (loss) per share from continuing operations
|
(0.38
|
)
|
1.09
|
0.10
|
||||||||
| (1) |
Net of treasury shares.
|
| (2) |
In 2020 Stock options and warrants did not have a dilutive effect.
|
| A. |
Overview
|
| — |
Credit risk
|
| — |
Liquidity risk
|
| — |
Market risk
|
|
For the year ended December
|
||||||||
|
2020
|
2019
|
|||||||
|
€ in thousands
|
||||||||
|
Derivatives presented under current assets
|
||||||||
|
Currency swap
|
12
|
94
|
||||||
|
Forward contracts
|
66
|
-
|
||||||
|
78
|
94
|
|||||||
|
Derivatives presented under non-current assets
|
||||||||
|
Financial power swap
|
10,238
|
4,967
|
||||||
|
Currency swap
|
-
|
103
|
||||||
|
Forward contracts
|
-
|
92
|
||||||
|
10,238
|
5,162
|
|||||||
|
Derivatives presented under current liabilities
|
||||||||
|
Swap contracts
|
(1,378
|
)
|
(766
|
)
|
||||
|
Derivatives presented under non-current liabilities
|
||||||||
|
Forward contracts
|
-
|
(344
|
)
|
|||||
|
Currency swap
|
(144
|
)
|
-
|
|||||
|
Swap contracts
|
(8,192
|
)
|
(6,919
|
)
|
||||
|
(8,336
|
)
|
(7,263
|
)
|
|||||
|
December 31, 2020
|
||||||||
|
Currency/
|
Currency/
|
|||||||
|
linkage/interest rate
|
Linkage/interest rate
|
Fair value - € in
|
||||||
|
receivable
|
Payable
|
Date of expiration
|
thousand
|
|||||
|
Euro 17.6 million interest swap transaction for a period of 18 years, semi-annually.
|
Euribor 6 months
|
Fixed 1%
|
December 20, 2037
|
(1,199
|
) |
|||
|
The principal of the interest rate swap transaction is based on a pre-determined sculptured repayment schedule in the maximum amount of Euro 131 million for a period of 12 years, semi-annually.
|
Euribor 6 months
|
Fixed 0.9412%
|
September 30, 2031
|
(8,371
|
) |
|||
|
Forward Euro/NIS contracts with an aggregate Euro denominated principal of Euro 8 million.
|
weighted average rate of approximately 4.03
|
January 2021
|
66
|
|||||
|
NIS 83.2 million currency swap transaction Euro/NIS for a period of 7 years, semi-annually.
|
NIS
|
Euro
|
June 2024
|
(132
|
) |
|||
|
Financial power swap- Electricity price swap fixed for float
|
Electricity price in Spain
|
Fixed price
|
September 30, 2030
|
10,238
|
||||
| B. |
Risk management framework
|
| C. |
Credit Risk
|
| C. |
Credit Risk (cont’d)
|
| D. |
Liquidity risk
|
| D. |
Liquidity risk (cont’d)
|
|
December 31, 2020
|
||||||||||||||||||||||||
|
Carrying
|
Contractual
|
Less than
|
More than
|
|||||||||||||||||||||
|
amount
|
cash flows
|
1 year
|
2 years
|
3-5 years
|
5 years
|
|||||||||||||||||||
|
€ in thousands
|
||||||||||||||||||||||||
|
Non-derivative financial liabilities
|
||||||||||||||||||||||||
|
Long term loans, including current maturities
|
198,169
|
263,112
|
20,896
|
34,645
|
32,594
|
174,977
|
||||||||||||||||||
|
Debentures
|
82,724
|
91,431
|
13,502
|
33,368
|
44,561
|
-
|
||||||||||||||||||
|
Lease liabilities
|
17,789
|
28,910
|
1,051
|
1,941
|
1,799
|
24,119
|
||||||||||||||||||
|
Trade payables and other accounts payable
|
13,706
|
13,706
|
13,706
|
-
|
-
|
-
|
||||||||||||||||||
|
312,388
|
397,159
|
49,155
|
69,954
|
78,954
|
199,096
|
|||||||||||||||||||
|
Derivative finance liabilities
|
||||||||||||||||||||||||
|
Currency swap
|
132
|
132
|
(12
|
)
|
63
|
81
|
-
|
|||||||||||||||||
|
Swap contracts
|
9,570
|
9,570
|
1,378
|
2,490
|
2,109
|
3,593
|
||||||||||||||||||
|
9,702
|
9,702
|
1,366
|
2,553
|
2,190
|
3,593
|
|||||||||||||||||||
|
December 31, 2019
|
||||||||||||||||||||||||
|
Carrying
|
Contractual
|
Less than
|
More than
|
|||||||||||||||||||||
|
amount
|
cash flows
|
1 year
|
2 years
|
3-5 years
|
5 years
|
|||||||||||||||||||
|
€ in thousands
|
||||||||||||||||||||||||
|
Non-derivative financial liabilities
|
||||||||||||||||||||||||
|
Long term loans, including current maturities
|
93,320
|
100,415
|
5,075
|
9,041
|
19,154
|
67,145
|
||||||||||||||||||
|
Debentures
|
71,584
|
78,235
|
28,718
|
8,615
|
33,899
|
7,003
|
||||||||||||||||||
|
Lease liabilities
|
15,627
|
25,859
|
462
|
806
|
2,417
|
22,174
|
||||||||||||||||||
|
Trade payables and other accounts payable
|
2,928
|
2,928
|
2,928
|
-
|
-
|
-
|
||||||||||||||||||
|
183,459
|
207,437
|
37,183
|
18,462
|
55,470
|
96,322
|
|||||||||||||||||||
|
Derivative finance liabilities
|
||||||||||||||||||||||||
|
Forward contracts
|
252
|
252
|
-
|
252
|
-
|
-
|
||||||||||||||||||
|
Swap contracts
|
7,685
|
7,685
|
766
|
2,682
|
2,172
|
2,065
|
||||||||||||||||||
|
7,937
|
7,937
|
766
|
2,934
|
2,172
|
2,065
|
|||||||||||||||||||
| E. |
Market risk
|
| (1) |
Foreign currency risk
|
| E. |
Market risk (cont’d)
|
| (1) |
Foreign currency risk (cont’d)
|
| (a) |
The exposure to linkage and foreign currency risk
|
|
December 31, 2020
|
||||||||||||||||||||
|
Non-monetary/ Non finance
|
NIS(*)
|
Unlinked
|
EURO
|
Total
|
||||||||||||||||
|
€ in thousands
|
||||||||||||||||||||
|
Current assets:
|
||||||||||||||||||||
|
Cash and cash equivalents
|
-
|
50,195
|
952
|
15,698
|
66,845
|
|||||||||||||||
|
Marketable securities
|
-
|
-
|
1,761
|
-
|
1,761
|
|||||||||||||||
|
Short term deposits
|
-
|
8,113
|
-
|
-
|
8,113
|
|||||||||||||||
|
Asset from concession project
|
-
|
1,491
|
-
|
-
|
1,491
|
|||||||||||||||
|
Trade and other receivables
|
380
|
3,155
|
384
|
5,906
|
9,825
|
|||||||||||||||
|
Non-current assets:
|
||||||||||||||||||||
|
Investments in equity
|
||||||||||||||||||||
|
accounted investees
|
23,489
|
8,745
|
-
|
-
|
32,234
|
|||||||||||||||
|
Advances on account of
|
||||||||||||||||||||
|
investments in process
|
2,423
|
-
|
-
|
-
|
2,423
|
|||||||||||||||
|
Asset from concession project
|
-
|
25,036
|
-
|
-
|
25,036
|
|||||||||||||||
|
Fixed assets
|
264,095
|
-
|
-
|
-
|
264,095
|
|||||||||||||||
|
Right of use asset
|
-
|
1,463
|
-
|
15,746
|
17,209
|
|||||||||||||||
|
Concession intangible asset
|
4,604
|
-
|
-
|
-
|
4,604
|
|||||||||||||||
|
Restricted cash long-term
|
-
|
5,882
|
-
|
4,049
|
9,931
|
|||||||||||||||
|
Deferred tax
|
3,605
|
-
|
-
|
-
|
3,605
|
|||||||||||||||
|
Other assets
|
2,593
|
30
|
-
|
139
|
2,762
|
|||||||||||||||
|
Derivatives
|
-
|
-
|
-
|
10,238
|
10,238
|
|||||||||||||||
|
Current liabilities:
|
||||||||||||||||||||
|
Current maturities of long term bank loans
|
-
|
(1,762
|
)
|
-
|
(8,470
|
)
|
(10,232
|
)
|
||||||||||||
|
Current maturities of long term loans
|
-
|
-
|
-
|
(4,021
|
)
|
(4,021
|
)
|
|||||||||||||
|
Short-term debentures
|
-
|
(10,600
|
)
|
-
|
-
|
(10,600
|
)
|
|||||||||||||
|
Trade payables
|
-
|
(221
|
)
|
-
|
(12,166
|
)
|
(12,387
|
)
|
||||||||||||
|
Accrued expenses and
|
||||||||||||||||||||
|
other payables
|
-
|
(3,502
|
)
|
(666
|
)
|
(3,744
|
)
|
(7,912
|
)
|
|||||||||||
|
Non-current liabilities:
|
||||||||||||||||||||
|
Lease liability
|
-
|
(1,436
|
)
|
-
|
(15,863
|
)
|
(17,299
|
)
|
||||||||||||
|
Liabilities to banks
|
-
|
(15,520
|
)
|
-
|
(119,000
|
)
|
(134,520
|
)
|
||||||||||||
|
Other long-term loans
|
-
|
(5,102
|
)
|
-
|
(44,294
|
)
|
(49,396
|
)
|
||||||||||||
|
Long-term debentures
|
-
|
(72,124
|
)
|
-
|
-
|
(72,124
|
)
|
|||||||||||||
|
Deferred tax
|
(7,806
|
)
|
-
|
-
|
-
|
(7,806
|
)
|
|||||||||||||
|
Derivatives
|
-
|
-
|
-
|
(8,336
|
)
|
(8,336
|
)
|
|||||||||||||
|
Other long-term liabilities
|
-
|
(27
|
)
|
(486
|
)
|
-
|
(513
|
)
|
||||||||||||
|
Total exposure in statement
|
||||||||||||||||||||
|
of financial position in
|
||||||||||||||||||||
|
respect of financial assets
|
||||||||||||||||||||
|
and financial liabilities
|
293,383
|
(6,184
|
)
|
1,945
|
(164,118
|
)
|
125,026
|
|||||||||||||
| E. |
Market risk (cont’d)
|
| (1) |
Foreign currency risk (cont’d)
|
| (a) |
The exposure to linkage and foreign currency risk (cont’d)
|
|
December 31, 2019
|
||||||||||||||||||||
|
Non-monetary/ Non finance
|
NIS(*)
|
Unlinked
|
EURO
|
Total
|
||||||||||||||||
|
€ in thousands
|
||||||||||||||||||||
|
Current assets:
|
||||||||||||||||||||
|
Cash and cash equivalents
|
-
|
23,385
|
1,517
|
19,607
|
44,509
|
|||||||||||||||
|
Marketable securities
|
-
|
-
|
2,242
|
-
|
2,242
|
|||||||||||||||
|
Short term deposits
|
-
|
6,446
|
-
|
-
|
6,446
|
|||||||||||||||
|
Restricted cash
|
-
|
22,162
|
-
|
-
|
22,162
|
|||||||||||||||
|
Asset from concession project
|
-
|
1,463
|
-
|
-
|
1,463
|
|||||||||||||||
|
Financial asset short-term
|
-
|
1,418
|
-
|
-
|
1,418
|
|||||||||||||||
|
Trade and other receivables
|
304
|
1,199
|
396
|
2,983
|
4,882
|
|||||||||||||||
|
Non-current assets:
|
||||||||||||||||||||
|
Investments in equity
|
||||||||||||||||||||
|
accounted investees
|
26,131
|
7,430
|
-
|
-
|
33,561
|
|||||||||||||||
|
Advances on account of
|
||||||||||||||||||||
|
investments in process
|
883
|
-
|
-
|
-
|
883
|
|||||||||||||||
|
Asset from concession project
|
-
|
27,122
|
-
|
-
|
27,122
|
|||||||||||||||
|
Fixed assets
|
114,389
|
-
|
-
|
-
|
114,389
|
|||||||||||||||
|
Right of use asset
|
-
|
1,585
|
-
|
13,816
|
15,401
|
|||||||||||||||
|
Concession intangible asset
|
5,042
|
-
|
-
|
-
|
5,042
|
|||||||||||||||
|
Restricted cash long-term
|
-
|
5,639
|
-
|
5,317
|
10,956
|
|||||||||||||||
|
Deferred tax
|
2,285
|
-
|
-
|
-
|
2,285
|
|||||||||||||||
|
Other assets
|
12,218
|
31
|
-
|
-
|
12,249
|
|||||||||||||||
|
Derivatives
|
-
|
-
|
-
|
5,162
|
5,162
|
|||||||||||||||
|
Current liabilities:
|
||||||||||||||||||||
|
Loans and borrowings
|
-
|
(1,669
|
)
|
-
|
(2,469
|
)
|
(4,138
|
)
|
||||||||||||
|
Short-term debentures
|
-
|
(26,773
|
)
|
-
|
-
|
(26,773
|
)
|
|||||||||||||
|
Trade payables
|
-
|
(266
|
)
|
-
|
(1,499
|
)
|
(1,765
|
)
|
||||||||||||
|
Accrued expenses and
|
||||||||||||||||||||
|
other payables
|
-
|
(3,519
|
)
|
-
|
(1,491
|
)
|
(5,010
|
)
|
||||||||||||
|
Non-current liabilities:
|
||||||||||||||||||||
|
Lease liability
|
-
|
(1,529
|
)
|
-
|
(13,873
|
)
|
(15,402
|
)
|
||||||||||||
|
Long-term loans
|
-
|
(19,409
|
)
|
-
|
(69,773
|
)
|
(89,182
|
)
|
||||||||||||
|
Long-term debentures
|
-
|
(44,811
|
)
|
-
|
-
|
(44,811
|
)
|
|||||||||||||
|
Deferred tax
|
(6,467
|
)
|
-
|
-
|
-
|
(6,467
|
)
|
|||||||||||||
|
Derivatives
|
-
|
-
|
-
|
(7,263
|
)
|
(7,263
|
)
|
|||||||||||||
|
Other long-term liabilities
|
-
|
(28
|
)
|
-
|
(1,767
|
)
|
(1,795
|
)
|
||||||||||||
|
Total exposure in statement
|
||||||||||||||||||||
|
of financial position in
|
||||||||||||||||||||
|
respect of financial assets
|
||||||||||||||||||||
|
and financial liabilities
|
154,785
|
(124
|
)
|
4,155
|
(51,250
|
)
|
107,566
|
|||||||||||||
| E. |
Market risk (cont’d)
|
| (1) |
Foreign currency risk (cont’d)
|
| (a) |
The exposure to linkage and foreign currency risk (cont’d)
|
|
For the year ended December 31
|
||||||||||||||||
|
Rate of
|
Rate of
|
|||||||||||||||
|
Change
|
Change
|
|||||||||||||||
|
%
|
Dollar
|
%
|
NIS
|
|||||||||||||
|
1 Euro in 2020
|
9.3
|
1.227
|
1.7
|
3.944
|
||||||||||||
|
1 Euro in 2019
|
(2
|
)
|
1.122
|
(9.6
|
)
|
3.878
|
||||||||||
| (b) |
Sensitivity analysis
|
|
December 31, 2020
|
||||||||
|
Increase
|
Decrease
|
|||||||
|
Equity
|
Equity
|
|||||||
|
€ thousands
|
||||||||
|
Change in the exchange rate of:
|
||||||||
|
5% in the USD
|
79
|
(79
|
)
|
|||||
|
5% in NIS
|
308
|
(308
|
)
|
|||||
|
December 31, 2019
|
||||||||
|
Increase
|
Increase
|
|||||||
|
Equity
|
Equity
|
|||||||
|
€ thousands
|
||||||||
|
Change in the exchange rate of:
|
||||||||
|
5% in the USD
|
185
|
(185
|
)
|
|||||
|
5% in NIS
|
412
|
(412
|
)
|
|||||
| E. |
Market risk (cont’d)
|
| (2) |
Interest rate risk
|
|
December 31,
|
||||||||
|
2020
|
2019
|
|||||||
|
Profit or loss
|
Profit or loss
|
|||||||
|
€ in thousands
|
||||||||
|
Increase of 1%
|
803
|
580
|
||||||
|
Increase of 3%
|
2,444
|
1,701
|
||||||
|
Decrease of 1%
|
(836
|
)
|
(542
|
)
|
||||
|
Decrease of 3%
|
(2,477
|
)
|
(1,663
|
)
|
||||
| (3) |
Electricity market prices risk
|
| F. |
Fair value
|
| (1) |
Fair values versus carrying amounts
|
|
December 31, 2020
|
|||||||||||||||||||
|
Fair value
|
|||||||||||||||||||
|
Carrying
|
Valuation techniques for
|
Inputs used to
|
|||||||||||||||||
|
amount
|
Level 1
|
Level 2
|
Level 3
|
determining fair value
|
determine fair value
|
||||||||||||||
|
€ in thousands
|
|||||||||||||||||||
|
Non-current liabilities:
|
|||||||||||||||||||
|
Debentures
|
82,724
|
84,814
|
-
|
-
|
|||||||||||||||
|
Loans from banks and others (including current maturities)
|
198,169
|
-
|
209,005
|
-
|
Discounting future cash flows by the market interest rate on the date of measurement.
|
Discount rate of Euribor+ 1.76%- 2.75% with a zero floor, Euribor+ 5.27%, fix rate for 5 years 2.9%-3.55% and 4.65% Linkage to Consumer price index in Israel
|
|||||||||||||
|
280,893
|
84,814
|
209,005
|
-
|
||||||||||||||||
|
December 31, 2019
|
|||||||||||||||||||
|
Fair value
|
|||||||||||||||||||
|
Carrying
|
Valuation techniques for
|
Inputs used to
|
|||||||||||||||||
|
amount
|
Level 1
|
Level 2
|
Level 3
|
determining fair value
|
determine fair value
|
||||||||||||||
|
€ in thousands
|
|||||||||||||||||||
|
Non-current liabilities:
|
|||||||||||||||||||
|
Debentures
|
71,584
|
73,211
|
-
|
-
|
|||||||||||||||
|
Loans from banks and others (including current maturities)
|
93,320
|
-
|
94,677
|
-
|
Discounting future cash flows by the market interest rate on the date of measurement.
|
Discount rate of Euribor+ 2.53%, fix rate for 5 years 2.9%-3.1% and 4.65% Linkage to Consumer price index in Israel
|
|||||||||||||
|
164,904
|
73,211
|
94,677
|
-
|
||||||||||||||||
| F. |
Fair value (cont'd)
|
| (2) |
Interest rates used for determining fair value
|
|
December 31
|
|||
|
2020
|
2019
|
||
|
%
|
|||
|
Non-current liabilities:
|
|||
|
Loans from banks
|
Euribor+ 1.76%- 2.75% with a zero floor
|
Euribor+ 2.53%
|
|
|
Loans from banks
|
4.65% Linkage to Consumer price index in Israel
|
4.65% Linkage to Consumer price index in Israel
|
|
|
Loans from banks
|
fix rate for 5 years 2.9% - 3.55%
|
fix rate for 5 years 2.9% - 3.1%
|
|
|
Loans from others
|
Euribor+ 5.27%
|
Euribor+ 5.27%
|
|
|
Loans from others
|
3%
|
-
|
|
| (3) |
Fair values hierarchy
|
|
Level 1
|
-
|
Quoted prices (unadjusted) in active markets for identical assets or liabilities.
|
|
Level 2
|
-
|
Inputs other than quoted prices included within Level 1 that are observable either directly or indirectly.
|
|
Level 3
|
-
|
Inputs that are not based on observable market data (unobservable inputs).
|
| F. |
Fair value (cont'd)
|
| (3) |
Fair values hierarchy (Cont'd)
|
|
December 31, 2020
|
|||||||||||||||||
|
Level 1
|
Level 2
|
Level 3
|
Total
|
Valuation techniques for
|
|||||||||||||
|
€ in thousands
|
determining fair value
|
||||||||||||||||
|
Marketable securities
|
-
|
1,761
|
-
|
1,761
|
Market price
|
||||||||||||
|
Forward contracts
|
-
|
66
|
-
|
66
|
Fair value measured on the basis of discounting the difference between the forward price in the contract and the current forward price for the residual period until redemption using
market interest rates appropriate for similar instruments, including the adjustment required for the parties’ credit risks.
|
||||||||||||
|
Swap contracts
|
-
|
(9,570
|
)
|
-
|
(9,570
|
)
|
Fair value is measured by discounting the future cash flows, over the period of the contract and using market interest rates appropriate for similar instruments, including the
adjustment required for the parties’ credit risks.
|
||||||||||
|
Currency swap
|
-
|
(132
|
)
|
-
|
(132
|
)
|
Fair value is measured by discounting the future cash flows, over the period of the contract and using market interest rates appropriate for similar instruments, including the
adjustment required for the parties’ credit risks.
|
||||||||||
|
Dori Energy loan
|
-
|
-
|
8,745
|
8,745
|
The fair value is measured by discounting the expected future loan repayments and using market interest rates appropriate for similar instruments, including the adjustment required for
the parties’ credit risks. The discounting rate was estimated at approximately 10% and the expected yearly change of Israeli Consumer Price Index, during the expected lifetime of the loan, was estimated at approximately 1%.
|
||||||||||||
|
Financial power swap
|
-
|
-
|
10,238
|
10,238
|
Fair value is measured by discounting the future fixed and assessed cash flows, over the period of the contract and using market interest rates appropriate for similar instruments. The
value is adjusted for the parties’ credit risks.
|
||||||||||||
| F. |
Fair value (cont'd)
|
| (3) |
Fair values hierarchy (Cont'd)
|
|
December 31, 2019
|
|||||||||||||||||
|
Level 1
|
Level 2
|
Level 3
|
Total
|
Valuation techniques for
|
|||||||||||||
|
€ in thousands
|
determining fair value
|
||||||||||||||||
|
Income receivable in connection with the A.R.Z. electricity pumped storage project (see Note 6B)
|
-
|
-
|
1,418
|
1,418
|
The fair value of the income receivable in connection with the A.R.Z. electricity pumped storage project was calculated according to the cash flows expected to be received in 4.5 years
following the financial closing of the project, discounted at a weighted interest rate of 2.36% reflecting the credit risk of the debtor.
|
||||||||||||
|
Marketable securities
|
-
|
2,242
|
-
|
2,242
|
Market price
|
||||||||||||
|
Forward contracts
|
-
|
(252
|
)
|
-
|
(252
|
)
|
Fair value measured on the basis of discounting the difference between the forward price in the contract and the current forward price for the residual period until redemption using
market interest rates appropriate for similar instruments, including the adjustment required for the parties’ credit risks.
|
||||||||||
|
Swap contracts
|
-
|
(7,685
|
)
|
-
|
(7,685
|
)
|
Fair value is measured by discounting the future cash flows, over the period of the contract and using market interest rates appropriate for similar instruments, including the
adjustment required for the parties’ credit risks.
|
||||||||||
|
Currency swap
|
-
|
197
|
-
|
197
|
Fair value is measured by discounting the future cash flows, over the period of the contract and using market interest rates appropriate for similar instruments, including the
adjustment required for the parties’ credit risks.
|
||||||||||||
|
Dori Energy loan
|
-
|
-
|
10,595
|
10,595
|
The fair value is measured by discounting the expected future loan repayments and using market interest rates appropriate for similar instruments, including the adjustment required for
the parties’ credit risks. The discounting rate was estimated at approximately 10% and the expected yearly change of Israeli Consumer Price Index, during the expected lifetime of the loan, was estimated at approximately 1%.
|
||||||||||||
|
Financial power swap
|
-
|
-
|
4,967
|
4,967
|
Fair value is measured by discounting the future fixed and assessed cash flows, over the period of the contract and using market interest rates appropriate for similar instruments. The
value is adjusted for the parties’ credit risks.
|
||||||||||||
| F. |
Fair value (cont'd)
|
|
Financial assets
|
||||
|
Income receivable in connection with the A.R.Z. electricity
|
||||
|
pumped storage project
|
||||
|
€ in thousands
|
||||
|
Balance as at December 31, 2019
|
1,418
|
|||
|
Total amount paid
|
1,418
|
|||
|
Balance as at December 31, 2020
|
-
|
|||
|
Financial assets
|
||||
|
Dori Energy loan
|
||||
|
€ in thousands
|
||||
|
Balance as at December 31, 2019
|
10,595
|
|||
|
Total income recognized in profit or loss
|
758
|
|||
|
Repayment
|
(2,378
|
)
|
||
|
Foreign Currency translation adjustments
|
(230
|
)
|
||
|
Balance as at December 31, 2020
|
8,745
|
|||
|
Financial assets
|
||||
|
Financial power swap
|
||||
|
€ in thousands
|
||||
|
Balance as at December 31, 2019
|
4,967
|
|||
|
Total income is recognized in other comprehensive income
|
5,271
|
|||
|
Balance as at December 31, 2020
|
10,238
|
|||
| ● |
Photovoltaic power plants (PV Plants) – Operation of installations that convert the energy in sunlight into electrical energy as follows: (i) approximately 22.6MWp aggregate installed capacity of photovoltaic power plants in
Italy, that the Company sold on December 20, 2019, (ii) approximately 7.9MWp aggregate installed capacity of photovoltaic power plants in Spain, (iii) a photovoltaic power plant of approximately 9 MWp installed capacity in Israel,
(iv) Ellomay Solar S.L.U that is constructing a photovoltaic plant with a peak capacity of 28 MW in the municipality of Talaván, Cáceres, Spain and and (v) 51% of Talasol, which during the majority of the reporting period was
constructing a photovoltaic plant with a peak capacity of 300 MW in the municipality of Talaván, Cáceres, Spain.
|
| ● |
Dorad Energy Ltd. (Dorad) – 9.375% indirect interest in Dorad, which owns and operates a combined cycle power plant based on natural gas, with production capacity of approximately 860 MW, located south of Ashkelon, Israel.
|
| ● |
Groen Gas Goor B.V., Groen Gas Oude-Tonge B.V. and Groen Gas Gelderland B.V., project companies operating anaerobic digestion plants in the Netherlands, with a green gas production capacity of approximately 3 million, 3.8 million
and 9.5 million (with a license to produce 7.5 million) Nm3 per year, respectively.
|
| ● |
Pumped storage hydro power plant (Manara) – 75% of a project to construct a 156 MW pumped storage hydro power plant in the Manara Cliff, Israel.
|
|
PV
|
Total
|
|||||||||||||||||||||||||||||||||||||||
|
reportable
|
Total
|
|||||||||||||||||||||||||||||||||||||||
|
Italy
|
Spain
|
Israel
|
Talasol
|
Biogas
|
Dorad
|
Manara
|
segments
|
Reconciliations
|
consolidated
|
|||||||||||||||||||||||||||||||
|
For the year ended December 31, 2020
|
||||||||||||||||||||||||||||||||||||||||
|
€ in thousands
|
||||||||||||||||||||||||||||||||||||||||
|
Revenues
|
-
|
2,577
|
4,089
|
-
|
6,002
|
57,495
|
-
|
70,163
|
(60,518
|
)
|
9,645
|
|||||||||||||||||||||||||||||
|
Operating expenses
|
-
|
(463
|
)
|
(379
|
)
|
-
|
(4,109
|
)
|
(44,489
|
)
|
-
|
(49,440
|
)
|
44,489
|
(4,951
|
)
|
||||||||||||||||||||||||
|
Depreciation and amortization expenses
|
-
|
(905
|
)
|
(2,310
|
)
|
-
|
|
(1,457
|
)
|
(5,674
|
)
|
-
|
(10,346
|
)
|
7,371
|
(2,975
|
)
|
|||||||||||||||||||||||
|
Gross profit (loss)
|
-
|
1,209
|
1,400
|
-
|
436
|
7,332
|
-
|
10,377
|
(8,658
|
)
|
1,719
|
|||||||||||||||||||||||||||||
|
Project development costs
|
(3,491
|
)
|
||||||||||||||||||||||||||||||||||||||
|
General and
|
||||||||||||||||||||||||||||||||||||||||
|
administrative expenses
|
(4,512
|
)
|
||||||||||||||||||||||||||||||||||||||
|
Share of profits (loss) of
|
||||||||||||||||||||||||||||||||||||||||
|
equity accounted investee
|
1,525
|
|||||||||||||||||||||||||||||||||||||||
|
Other income, net
|
2,100
|
|||||||||||||||||||||||||||||||||||||||
|
Capital gain (loss)
|
-
|
|||||||||||||||||||||||||||||||||||||||
|
Operating profit (loss)
|
(2,659
|
)
|
||||||||||||||||||||||||||||||||||||||
|
Financing income
|
2,134
|
|||||||||||||||||||||||||||||||||||||||
|
Financing income
|
||||||||||||||||||||||||||||||||||||||||
|
(expenses) in connection
|
||||||||||||||||||||||||||||||||||||||||
|
with derivatives, net
|
1,094
|
|||||||||||||||||||||||||||||||||||||||
|
Financing expenses, net
|
(6,862
|
)
|
||||||||||||||||||||||||||||||||||||||
|
Profit (loss) before taxes
|
||||||||||||||||||||||||||||||||||||||||
|
on Income
|
(6,293
|
)
|
||||||||||||||||||||||||||||||||||||||
|
Segment assets as at
|
||||||||||||||||||||||||||||||||||||||||
|
December 31, 2020
|
503
|
17,574
|
36,521
|
232,955
|
36,253
|
109,983
|
21,925
|
455,714
|
4,458
|
460,172
|
||||||||||||||||||||||||||||||
|
PV
|
Total
|
|||||||||||||||||||||||||||||||||||||||
|
reportable
|
Total
|
|||||||||||||||||||||||||||||||||||||||
|
Italy
|
Spain
|
Israel
|
Talasol
|
Biogas
|
Dorad
|
Manara
|
segments
|
Reconciliations
|
consolidated
|
|||||||||||||||||||||||||||||||
|
For the year ended December 31, 2019
|
||||||||||||||||||||||||||||||||||||||||
|
€ in thousands
|
||||||||||||||||||||||||||||||||||||||||
|
Revenues
|
10,082
|
2,987
|
4,114
|
-
|
4,786
|
63,416
|
-
|
85,385
|
(66,397
|
)
|
18,988
|
|||||||||||||||||||||||||||||
|
Operating expenses
|
(1,422
|
)
|
(504
|
)
|
(325
|
)
|
-
|
(4,387
|
)
|
(48,558
|
)
|
-
|
(55,196
|
)
|
48,558
|
(6,638
|
)
|
|||||||||||||||||||||||
|
Depreciation and amortization expenses
|
(3,668
|
)
|
(903
|
)
|
(2,271
|
)
|
(30
|
)
|
(1,353
|
)
|
(5,031
|
)
|
-
|
(13,256
|
)
|
6,840
|
(6,416
|
)
|
||||||||||||||||||||||
|
Gross profit (loss)
|
4,992
|
1,580
|
1,518
|
(30
|
)
|
(954
|
)
|
9,827
|
-
|
16,933
|
(10,999
|
)
|
5,934
|
|||||||||||||||||||||||||||
|
Project development costs
|
(4,213
|
)
|
||||||||||||||||||||||||||||||||||||||
|
General and
|
||||||||||||||||||||||||||||||||||||||||
|
administrative expenses
|
(3,827
|
)
|
||||||||||||||||||||||||||||||||||||||
|
Share of profits (loss) of
|
||||||||||||||||||||||||||||||||||||||||
|
equity accounted investee
|
3,086
|
|||||||||||||||||||||||||||||||||||||||
|
Other income, net
|
(2,100
|
)
|
||||||||||||||||||||||||||||||||||||||
|
Capital gain (loss)
|
18,770
|
|||||||||||||||||||||||||||||||||||||||
|
Operating profit
|
17,650
|
|||||||||||||||||||||||||||||||||||||||
|
Financing income
|
1,827
|
|||||||||||||||||||||||||||||||||||||||
|
Financing income
|
||||||||||||||||||||||||||||||||||||||||
|
(expenses) in connection
|
||||||||||||||||||||||||||||||||||||||||
|
with derivatives, net
|
897
|
|||||||||||||||||||||||||||||||||||||||
|
Financing expenses, net
|
(10,877
|
)
|
||||||||||||||||||||||||||||||||||||||
|
Profit before taxes on
|
||||||||||||||||||||||||||||||||||||||||
|
Income
|
9,497
|
|||||||||||||||||||||||||||||||||||||||
|
Segment assets as at
|
||||||||||||||||||||||||||||||||||||||||
|
December 31, 2019
|
-
|
16,324
|
38,942
|
118,848
|
18,463
|
116,561
|
2,473
|
311,611
|
(1,439
|
)
|
310,172
|
|||||||||||||||||||||||||||||
|
PV
|
Total
|
|||||||||||||||||||||||||||||||||||||||
|
reportable
|
Total
|
|||||||||||||||||||||||||||||||||||||||
|
Italy
|
Spain
|
Israel
|
Talasol
|
Biogas
|
Dorad
|
Manara
|
segments
|
Reconciliations
|
consolidated
|
|||||||||||||||||||||||||||||||
|
For the year ended December 31, 2018
|
||||||||||||||||||||||||||||||||||||||||
|
€ in thousands
|
||||||||||||||||||||||||||||||||||||||||
|
Revenues
|
9,560
|
3,033
|
4,011
|
-
|
4,483
|
58,063
|
-
|
79,150
|
(61,033
|
)
|
18,117
|
|||||||||||||||||||||||||||||
|
Operating expenses
|
(1,579
|
)
|
(574
|
)
|
(507
|
)
|
-
|
(3,682
|
)
|
(44,600
|
)
|
-
|
(50,942
|
)
|
44,600
|
(6,342
|
)
|
|||||||||||||||||||||||
|
Depreciation and amortization expenses
|
(3,569
|
)
|
(828
|
)
|
(2,042
|
)
|
-
|
(1,081
|
)
|
(4,811
|
)
|
-
|
(12,331
|
)
|
6,515
|
(5,816
|
)
|
|||||||||||||||||||||||
|
Gross profit (loss)
|
4,412
|
1,631
|
1,462
|
-
|
(280
|
)
|
8,652
|
-
|
15,877
|
(9,918
|
)
|
5,959
|
||||||||||||||||||||||||||||
|
Project development costs
|
(2,878
|
)
|
||||||||||||||||||||||||||||||||||||||
|
General and
|
||||||||||||||||||||||||||||||||||||||||
|
administrative expenses
|
(3,600
|
)
|
||||||||||||||||||||||||||||||||||||||
|
Share of profits (loss) of
|
||||||||||||||||||||||||||||||||||||||||
|
equity accounted investee
|
2,545
|
|||||||||||||||||||||||||||||||||||||||
|
Other income, net
|
884
|
|||||||||||||||||||||||||||||||||||||||
|
Operating profit
|
2,910
|
|||||||||||||||||||||||||||||||||||||||
|
Financing income
|
2,936
|
|||||||||||||||||||||||||||||||||||||||
|
Financing income
|
||||||||||||||||||||||||||||||||||||||||
|
(expenses) in connection
|
||||||||||||||||||||||||||||||||||||||||
|
with derivatives, net
|
494
|
|||||||||||||||||||||||||||||||||||||||
|
Financing expenses, net
|
(5,521
|
)
|
||||||||||||||||||||||||||||||||||||||
|
Profit before taxes on
|
||||||||||||||||||||||||||||||||||||||||
|
Income
|
819
|
|||||||||||||||||||||||||||||||||||||||
|
Segment assets as at
|
||||||||||||||||||||||||||||||||||||||||
|
December 31, 2018
|
54,539
|
16,799
|
34,258
|
15,169
|
18,879
|
105,246
|
2,318
|
247,208
|
(36,048
|
)
|
211,160
|
|||||||||||||||||||||||||||||
|
For the year ended December 31
|
||||||||||||
|
2020
|
2019
|
2018
|
||||||||||
|
€ in thousands
|
||||||||||||
|
Israel
|
1,066
|
1,133
|
1,041
|
|||||||||
|
The Netherlands
|
6,002
|
4,786
|
4,483
|
|||||||||
|
Italy
|
-
|
10,082
|
9,560
|
|||||||||
|
Spain
|
2,577
|
2,987
|
3,033
|
|||||||||
|
Total revenues
|
9,645
|
18,988
|
18,117
|
|||||||||
|
As at December 31
|
||||||||
|
2020
|
2019
|
|||||||
|
€ in thousands
|
||||||||
|
Israel
|
16,651
|
19
|
||||||
|
Italy
|
-
|
-
|
||||||
|
Spain
|
217,339
|
97,327
|
||||||
|
The Netherlands
|
30,105
|
17,043
|
||||||
|
Total fixed assets, net
|
264,095
|
114,389
|
||||||
| a. |
On February 23, 2021, the Company issued additional Series C Debentures in a public offering in Israel in an aggregate principal amount of NIS 100,939 thousand (approximately €25,592 thousand based on the Euro /NIS exchange rate as
of December 31, 2020). The gross proceeds from the offering were NIS 102,400 thousand and the net proceeds of the offering, net of related expenses such as consultancy fee and commissions, were approximately NIS 101,500 thousand
(approximately €25,735 thousand based on the Euro /NIS exchange rate as of December 31, 2020).
|
| b. |
On February 23, 2021, the Company issued our new Series D Convertible Debentures in a public offering in Israel in the aggregate principal amount of NIS 62,000 thousand (approximately €15,720 thousand
based on the Euro /NIS exchange rate as of December 31, 2020). The principal amount of the Series D Debentures is repayable in one installment on December 31, 2026. The Series D Debentures bear a fixed interest at the rate of 1.2%
per year (that is not linked to the Israeli CPI or otherwise), payable semi-annually on June 30 and December 31 commencing June 30, 2021 through December 31, 2026 (inclusive). The Series D Debentures are convertible into the
Company’s ordinary shares, NIS 10.00 par value per share, at a conversion price of NIS 165 (approximately € 41.8 based on the Euro /NIS exchange rate as of December 31, 2020), subject to adjustments upon customary terms. The Series
D Debentures are not rated. The gross proceeds from the offering were approximately NIS 62,600 thousand and the net proceeds of the offering, net of related expenses such as consultancy fee and commissions, were approximately NIS
61,800 thousand (approximately €15,669 thousand based on the Euro /NIS exchange rate as of December 31, 2020).
|
| c. |
On February 28, 2021, the Company announced that it will fully repay the Series B Debentures and on March 18, 2021, the Series B Debentures were repaid in full. Pursuant to the terms of the deed of trust governing the Series B
Debentures, the early repayment amount consisted of a principal payment in the amount of approximately NIS 86,300 million (approximately €21,500 million), accrued interest in the amount of approximately NIS 700 thousand (approximately
€160 thousand) and a prepayment charge of approximately NIS 3,400 thousand (approximately €860 thousand), amounting to an aggregate repayment amount of approximately NIS 90,400 thousand (approximately €22,500 thousand).
|
| d. |
On February 11, 2021, the Manara PSP Project Finance reached financial closing. The Manara PSP Project Finance will be provided by a consortium of Israeli banks and institutional investors, arranged and led by Mizrahi-Tefahot Bank
Ltd. The Manara PSP Project Finance is in the aggregate amount of NIS 1.18 billion (approximately €300 million based on the euro/NIS exchange rate as of December 31, 2020), and includes: (i) a Senior Secured Tranche at a fixed rate of
interest for each drawdown, with base interest rate equal to the yield to maturity of Israeli treasury bonds with like duration of the loan drawdown, plus a spread of 3.25% per-annum during the Construction Period of the Project and a
spread of 2.40% per-annum from the Actual Completion Date of the Project which proceeds the Commercial Operation Date of the Project. The Senior Secured Tranche is linked to the Israeli Consumer Price Index and is to be repaid over a
period of 19.5 years from the commercial operation date; and (ii) a Subordinated Secured B Tranche at a floating rate of interest, with the base interest being the Bank of Israel rate, plus a spread of 4.35% per-annum during the
Construction Period and a spread of 3.90% per-annum from the Actual Completion Date. The stated maturity of the Tranche B loan is one year less than the maturity of the Senior Secured Loan with a cash sweep mechanism that shortens its
maturity to approximately 12 years from the Commercial Operation Date under the Base Case Financial Model.
|
| e. |
In connection with the Manara PSP Project Finance that occurred on February 2021, and based on the A.R.Z. Settlement Agreement, A.R.Z. was required to provide its indirect share of equity investment and financing to the Manara PSP.
Due to the failure to provide the required funds, Ellomay Water Plants Holdings (2014) Ltd., the Company’s wholly-owned subsidiary that holds 75% of Ellomay PS, seized E.R.Z.’s holdings in Sheva Mizrakot (33%) and, as a result, the
Company’s indirect holdings in the Manara PSP increased from 75% to 83.333% in January 2021.
|
|
Page
|
|
|
FD-2
|
|
|
FD-3
|
|
|
FD-4
|
|
|
FD-5
|
|
|
FD-6
|
|
|
FD-7 – FD-47
|

Member Firm of KPMG International
February 18, 2021
|
December 31
|
December 31
|
|||||||||||
|
2020
|
2019
|
|||||||||||
|
Note
|
NIS thousands
|
NIS thousands
|
||||||||||
|
Current assets
|
||||||||||||
|
Cash and cash equivalents
|
4
|
247,079
|
266,021
|
|||||||||
|
Trade receivables
|
5
|
297,719
|
292,759
|
|||||||||
|
Other receivables
|
6
|
21,401
|
22,685
|
|||||||||
|
Total current assets
|
566,199
|
581,465
|
||||||||||
|
Non-current assets
|
||||||||||||
|
Restricted deposit
|
12A1B
|
|
433,265
|
438,032
|
||||||||
|
Prepaid expenses
|
12A2, 12A5
|
35,230
|
37,225
|
|||||||||
|
Fixed assets
|
7
|
3,526,839
|
3,698,716
|
|||||||||
|
Intangible assets
|
5,402
|
2,247
|
||||||||||
|
Right of use assets
|
17
|
60,113
|
64,161
|
|||||||||
|
Total non-current assets
|
4,060,849
|
4,240,381
|
||||||||||
|
Total assets
|
4,627,048
|
4,821,846
|
||||||||||
|
Current liabilities
|
||||||||||||
|
Current maturities of loans from banks
|
8
|
242,098
|
231,380
|
|||||||||
|
Current maturities of lease liabilities
|
17
|
4,535
|
4,551
|
|||||||||
|
Trade payables
|
9
|
309,380
|
288,127
|
|||||||||
|
Other payables
|
10
|
3,808
|
10,509
|
|||||||||
|
Financial derivatives
|
16
|
2,993
|
-
|
|||||||||
|
Total current liabilities
|
562,814
|
534,567
|
||||||||||
|
Non-current liabilities
|
||||||||||||
|
Loans from banks
|
8
|
2,561,302
|
2,803,975
|
|||||||||
|
Long-term lease liabilities
|
17
|
50,858
|
54,052
|
|||||||||
|
Provision for dismantling and restoration
|
7
|
50,000
|
36,102
|
|||||||||
|
Deferred tax liabilities, net
|
11
|
200,298
|
170,676
|
|||||||||
|
Liabilities for employee benefits, net
|
160
|
160
|
||||||||||
|
Total non-current liabilities
|
2,862,618
|
3,064,965
|
||||||||||
|
Equity
|
13
|
|||||||||||
|
Share capital
|
11
|
11
|
||||||||||
|
Share premium
|
642,199
|
642,199
|
||||||||||
|
Capital reserve for activities with controlling shareholders
|
3,748
|
3,748
|
||||||||||
|
Retained earnings
|
555,658
|
576,356
|
||||||||||
|
Total equity
|
1,201,616
|
1,222,314
|
||||||||||
|
Total liabilities and equity
|
4,627,048
|
4,821,846
|
||||||||||
|
/s/ Shouky Oren
|
/s/ Eli Asulin
|
/s/ David Bitton
|
||
|
Shouky Oren
|
Eli Asulin
|
David Bitton
|
||
|
Chairman of the
|
Chief Executive Officer
|
Chief Financial Officer
|
||
|
Board of Directors
|
|
2020
|
2019
|
2018
|
||||||||||||||
|
Note
|
NIS thousands
|
NIS thousands
|
NIS thousands
|
|||||||||||||
|
Revenues
|
2,407,221
|
2,700,766
|
2,628,607
|
|||||||||||||
|
Operating costs of the power plant
|
||||||||||||||||
|
Energy costs
|
522,110
|
708,662
|
687,431
|
|||||||||||||
|
Electricity purchase and infrastructure services
|
1,185,225
|
1,208,223
|
1,194,948
|
|||||||||||||
|
Depreciation and amortization
|
237,575
|
214,248
|
217,795
|
|||||||||||||
|
Other operating costs
|
155,368
|
151,116
|
136,705
|
|||||||||||||
|
Total cost of power plant
|
2,100,278
|
2,282,249
|
2,236,879
|
|||||||||||||
|
Profit from operating the power plant
|
306,943
|
418,517
|
391,728
|
|||||||||||||
|
General and administrative expenses
|
14
|
24,926
|
20,676
|
20,740
|
||||||||||||
|
Other incomes
|
12.A.15
|
1,279
|
-
|
-
|
||||||||||||
|
Operating profit
|
283,296
|
397,841
|
370,988
|
|||||||||||||
|
Financing income
|
3,056
|
4,237
|
24,650
|
|||||||||||||
|
Financing expenses
|
157,428
|
192,881
|
227,988
|
|||||||||||||
|
Financing expenses, net
|
15
|
154,372
|
188,644
|
203,338
|
||||||||||||
|
Profit before taxes on income
|
128,924
|
209,197
|
167,650
|
|||||||||||||
|
Taxes on income
|
11
|
29,622
|
47,873
|
33,505
|
||||||||||||
|
Profit for the year
|
99,302
|
161,324
|
134,145
|
|||||||||||||
|
Capital
|
||||||||||||||||||||
|
reserve for
|
||||||||||||||||||||
|
activities with
|
||||||||||||||||||||
|
Share
|
controlling
|
Retained
|
||||||||||||||||||
|
Share capital
|
premium
|
shareholders
|
earnings
|
Total equity
|
||||||||||||||||
|
NIS thousands
|
NIS thousands
|
NIS thousands
|
NIS thousands
|
NIS thousands
|
||||||||||||||||
|
For the year ended December 31, 2020
|
||||||||||||||||||||
|
Balance as at January 1, 2020
|
11
|
642,199
|
3,748
|
576,356
|
1,222,314
|
|||||||||||||||
|
Dividend to the Company’s shareholders
|
-
|
-
|
-
|
(120,000
|
)
|
(120,000
|
)
|
|||||||||||||
|
Profit for the year
|
-
|
-
|
-
|
99,302
|
99,302
|
|||||||||||||||
|
Balance as at December 31, 2020
|
11
|
642,199
|
3,748
|
555,658
|
1,201,616
|
|||||||||||||||
|
For the year ended December 31, 2019
|
||||||||||||||||||||
|
Balance as at January 1, 2019
|
11
|
642,199
|
3,748
|
415,032
|
1,060,990
|
|||||||||||||||
|
Profit for the year
|
-
|
-
|
-
|
161,324
|
161,324
|
|||||||||||||||
|
Balance as at December 31, 2019
|
11
|
642,199
|
3,748
|
576,356
|
1,222,314
|
|||||||||||||||
|
For the year ended December 31, 2018
|
||||||||||||||||||||
|
Balance as at January 1, 2018
|
11
|
642,199
|
3,748
|
280,887
|
926,845
|
|||||||||||||||
|
Profit for the year
|
-
|
-
|
-
|
134,145
|
134,145
|
|||||||||||||||
|
Balance as at December 31, 2018
|
11
|
642,199
|
3,748
|
415,032
|
1,060,990
|
|||||||||||||||
|
2020
|
2019
|
2018
|
||||||||||
|
NIS thousands
|
NIS thousands
|
NIS thousands
|
||||||||||
|
Cash flows from operating activities:
|
||||||||||||
|
Profit for the year
|
99,302
|
161,324
|
134,145
|
|||||||||
|
Adjustments:
|
||||||||||||
|
Depreciation, amortization and fuel consumption
|
241,288
|
239,323
|
223,028
|
|||||||||
|
Taxes on income
|
29,622
|
47,873
|
33,505
|
|||||||||
|
Financing expenses, net
|
154,372
|
188,644
|
203,338
|
|||||||||
|
425,282
|
475,840
|
459,871
|
||||||||||
|
Change in trade receivables
|
(4,959
|
)
|
5,238
|
32,536
|
||||||||
|
Change in other receivables
|
1,284
|
25,394
|
6,119
|
|||||||||
|
Change in trade payables
|
16,627
|
(57,719
|
)
|
(81,273
|
)
|
|||||||
|
Change in other payables
|
(6,700
|
)
|
4,543
|
304
|
||||||||
|
6,252
|
(22,544
|
)
|
(42,314
|
)
|
||||||||
|
Net cash provided by operating activities
|
530,836
|
614,620
|
551,702
|
|||||||||
|
Cash flows from investing activities:
|
||||||||||||
|
Proceeds from (payment for) settlement of financial derivatives
|
(4,318
|
)
|
(4,551
|
)
|
9,957
|
|||||||
|
Insurance proceeds in respect of damage to fixed asset
|
-
|
8,336
|
20,619
|
|||||||||
|
Investment in long-term restricted deposits
|
(6,000
|
)
|
(14,000
|
)
|
(12,158
|
)
|
||||||
|
Investment in fixed assets
|
(48,309
|
)
|
(60,476
|
)
|
(79,855
|
)
|
||||||
|
Investment in intangible assets
|
(4,738
|
)
|
(939
|
)
|
(222
|
)
|
||||||
|
Interest received
|
3,046
|
4,213
|
3,497
|
|||||||||
|
Net cash used in investing activities
|
(60,319
|
)
|
(67,417
|
)
|
(58,162
|
)
|
||||||
|
Cash flows from financing activities:
|
||||||||||||
|
Repayment of lease liability principal
|
(4,523
|
)
|
(8,513
|
)
|
-
|
|||||||
|
Repayment of loans from related parties
|
-
|
(17,704
|
)
|
(160,326
|
)
|
|||||||
|
Repayment of loans from banks
|
(195,359
|
)
|
(189,893
|
)
|
(181,970
|
)
|
||||||
|
Dividends and exchange rate paid
|
(123,739
|
)
|
-
|
-
|
||||||||
|
Interest paid
|
(170,003
|
)
|
(182,435
|
)
|
(220,765
|
)
|
||||||
|
Net cash used in financing activities
|
(493,624
|
)
|
(398,545
|
)
|
(563,061
|
)
|
||||||
|
Net increase (decrease) in cash and cash equivalents
|
(23,107
|
)
|
148,658
|
(69,521
|
)
|
|||||||
|
Effect of exchange rate fluctuations on cash and
|
||||||||||||
|
cash equivalents
|
4,165
|
143
|
2,559
|
|||||||||
|
Cash and cash equivalents at beginning of year
|
266,021
|
117,220
|
184,182
|
|||||||||
|
Cash and cash equivalents at end of year
|
247,079
|
266,021
|
117,220
|
|||||||||
| • |
Related party as defined in International Accounting Standard (2009) 24 regarding related parties.
|
| • |
Interested parties Within their meaning in Paragraph (1) of the definition of an “interested party” in Section 1 of the Securities Law - 1968.
|
| • |
All references to laws, regulations, court proceedings refer to the State of Israel, unless otherwise indicated.
|
| C. |
Licenses and legal environment
|
| 1. |
The construction of the power plant was officially designated a “National Infrastructure” Project, as defined in paragraph 1 of the Planning and Building Law-1965 by the Prime Minister, Minister of Finance and Minister of the
Interior. In July 2009, the Licensing Authority of the National Planning and Construction Board for National Infrastructures approved the building permit for the establishment of a power station. (Building License No. 2-01-2008).
|
| C. |
Licenses and legal environment (cont’d)
|
| 2. |
On December 24, 2018 the PUA published a decision regarding “Electricity Rates for Customers of IEC in 2019” which in accordance the average production component will increase by about 3.3% from January 1, 2019 and will remain in
effect to the end of 2019. On December 23, 2019, the PUA published a decision regarding "Annual Electricity Rate Update 2020", which, among other things, averaged a 7.9% decrease in the production component as of January 1, 2020, and
will remain in effect to the end of 2020. On December 27, 2020, the PUA published a decision regarding "Annual Electricity Rate Update 2020", which, among other things, averaged a 5.7% decrease in the production component as of January
1, 2020, and will remain in effect to the end of 2021.
|
| • |
Derivative financial instruments at fair value through profit or loss;
|
| • |
Deferred tax liabilities
|
| • |
Provisions
|
| E. |
Use of estimates and judgments
|
| A. |
Foreign currency transactions
|
| B. |
Financial instruments
|
| 1. |
Non-derivative financial assets
|
| B. |
Financial instruments (cont’d)
|
| 2. |
Non-derivative financial liabilities
|
| 3. |
Derivative financial instruments
|
| 4. |
CPI-linked assets and liabilities that are not measured at fair value
|
| 5. |
Share capital
|
| C. |
Fixed assets
|
| 1. |
Recognition and measurement
|
| 2. |
Subsequent costs
|
| 3. |
Depreciation
|
| C. |
Fixed assets (cont’d)
|
| 3. |
Depreciation (cont’d)
|
|
Depreciation
|
||||
|
rate
|
||||
|
(percentage)
|
||||
|
Buildings and permanent connections
|
4
|
|||
|
Turbine components
|
4 or by operating hours
|
|||
|
Machinery, equipment and apparatus
|
mainly 4
|
|||
|
Monitoring station
|
10
|
|||
|
Spare parts
|
4
|
|||
|
Backup diesel
|
upon usage
|
|||
|
Leasehold improvements
|
10
|
|||
| D. |
Intangible assets
|
| 1. |
Recognition and measurement
|
| 2. |
Subsequent expenditure
|
| 3. |
Amortization
|
| E. |
Impairment
|
| 1) |
Non derivative financial assets
|
| 2) |
Non-financial assets
|
| F. |
Capitalization of borrowing costs
|
| G. |
Provisions
|
| H. |
Indemnification Asset
|
| I. |
Revenues
|
| (a) |
The parties to the contract have approved the contract (in writing, orally or according to other customary business practices) and they are committed to satisfying the obligations attributable to them.
|
| (b) |
The company can identify the rights of each party in relation to the goods or services that will be transferred.
|
| (c) |
The company can identify the payment terms for the goods or services that will be transferred.
|
| (d) |
The contract has a commercial substance (i.e. the risk, timing and amount of the entity’s future cash flows are expected to change as a result of the contract); and
|
| (e) |
It is probable that the consideration, to which the Company is entitled to in exchange for the goods or services transferred to the customer, will be collected.
|
| (a) |
Goods or services (or a bundle of goods or services) that are distinct; or
|
| (b) |
A series of distinct goods or services that are substantially the same and have the same pattern of transfer to the customer.
|
| J. |
Taxes on Income
|
| K |
Defined contribution plans
|
| L. |
Lease
|
| (1) |
Determining whether an arrangement contains a lease
|
| L. |
Lease (cont’d)
|
| (2) |
Leased assets and lease liabilities
|
| (3) |
The lease term
|
| (4) |
Variable lease payments
|
| (5) |
Depreciation of right-of-use asset
|
| (6) |
Reassessment of lease liability
|
| L. |
Lease (cont’d)
|
| M. |
Financing income and expenses
|
| M. |
Financing income and expenses (cont’d)
|
| N. |
Transactions with controlling shareholder
|
|
December 31
|
||||||||
|
2020
|
2019
|
|||||||
|
NIS thousands
|
NIS thousands
|
|||||||
|
Balance in banks
|
6
|
5
|
||||||
|
Deposits on demand
|
247,073
|
266,016
|
||||||
|
247,079
|
266,021
|
|||||||
|
December 31
|
||||||||
|
2020
|
2019
|
|||||||
|
NIS thousands
|
NIS thousands
|
|||||||
|
Trade receivables
|
59,729
|
360
|
||||||
|
Income receivable
|
238,091
|
292,602
|
||||||
|
297,820
|
292,962
|
|||||||
|
Provision for doubtful debt
|
(101
|
)
|
(203
|
)
|
||||
|
297,719
|
292,759
|
|||||||
|
December 31
|
||||||||
|
2020
|
2019
|
|||||||
|
NIS thousands
|
NIS thousands
|
|||||||
|
Government institutions
|
3,095
|
311
|
||||||
|
Receivables for insurance
|
-
|
3,555
|
||||||
|
Advances to suppliers
|
254
|
272
|
||||||
|
Prepaid expenses
|
18,052
|
18,547
|
||||||
|
21,401
|
22,685
|
|||||||
| A. |
Composition
|
|
Furniture
|
Leasehold
|
|||||||||||||||
|
Power plant
|
and equipment
|
improvements
|
Total
|
|||||||||||||
|
NIS thousands
|
||||||||||||||||
|
Cost
|
||||||||||||||||
|
Balance as at January 1, 2019
|
4,878,045
|
2,722
|
744
|
4,881,511
|
||||||||||||
|
Additions
|
60,016
|
397
|
63
|
60,476
|
||||||||||||
|
Balance as at December 31, 2019
|
4,938,061
|
3,119
|
807
|
4,941,987
|
||||||||||||
|
Additions
|
61,852
|
150
|
18
|
62,020
|
||||||||||||
|
Disposals
|
(44,629
|
)
|
-
|
-
|
(44,629
|
)
|
||||||||||
|
Balance as at December 31, 2020
|
4,955,284
|
3,269
|
825
|
4,959,378
|
||||||||||||
|
Depreciation and impairment losses
|
||||||||||||||||
|
Balance as at January 1, 2019
|
1,009,201
|
2,171
|
339
|
1,011,711
|
||||||||||||
|
Depreciation for the year
|
231,349
|
132
|
79
|
231,560
|
||||||||||||
|
Balance as at December 31, 2019
|
1,240,550
|
2,303
|
418
|
1,243,271
|
||||||||||||
|
Depreciation for the year
|
209,999
|
252
|
83
|
210,334
|
||||||||||||
|
Impairment loss
|
23,563
|
-
|
-
|
23,563
|
||||||||||||
|
Disposals
|
(44,629
|
)
|
-
|
-
|
(44,629
|
)
|
||||||||||
|
Balance as at December 31, 2020
|
1,429,483
|
2,555
|
501
|
1,432,539
|
||||||||||||
|
Carrying amounts
|
||||||||||||||||
|
As at January 1, 2019
|
3,868,844
|
551
|
405
|
3,869,800
|
||||||||||||
|
As at December 31, 2019
|
3,697,511
|
816
|
389
|
3,698,716
|
||||||||||||
|
As at December 31, 2020
|
3,525,801
|
714
|
324
|
3,526,839
|
||||||||||||
| B. |
Security
|
| C. |
Provision for restoration and dismantling
|
|
Carrying amount as at December 31
|
|||||||||||||
|
Currency and
|
|||||||||||||
|
linkage base
|
Effective interest
|
2020
|
2019
|
||||||||||
|
%
|
NIS thousands
|
NIS thousands
|
|||||||||||
|
Loans from banks
|
CPI-linked
|
5.1
|
%
|
2,803,400
|
3,035,355
|
||||||||
|
Less current maturities (including
|
NIS
|
||||||||||||
|
interest as at December 31)
|
242,098
|
231,380
|
|||||||||||
|
2,561,302
|
2,803,975
|
||||||||||||
|
December 31
|
||||||||
|
2020
|
2019
|
|||||||
|
NIS thousands
|
NIS thousands
|
|||||||
|
Open debts
|
102,642
|
24,744
|
||||||
|
Accrued expenses
|
206,738
|
263,383
|
||||||
|
309,380
|
288,127
|
|||||||
|
December 31
|
||||||||
|
2020
|
2019
|
|||||||
|
NIS thousands
|
NIS thousands
|
|||||||
|
Accrued expenses (*)
|
2,898
|
2,801
|
||||||
|
Other payables
|
910 |
1,031
|
||||||
|
Institutions
|
-
|
6,677
|
||||||
|
3,808
|
10,509
|
|||||||
|
(*) Including other payables due to related and interested parties (see note 18)
|
1,461
|
1,151
|
||||||
| A. |
Details regarding the tax environment of the Company
|
| (1) |
Presented hereunder are the tax rates relevant to the Company in the years 2018-2020:
|
| (2) |
The Company is an “Industrial Company” as defined in the Encouragement of Industry (Taxes) 1969 and accordingly is entitled to certain benefits including accelerated depreciation.
|
| B. |
Composition of income tax expense
|
|
Year ended
|
Year ended
|
Year ended
|
||||||||||
|
December 31,
|
December 31,
|
December 31,
|
||||||||||
|
2020
|
2019
|
2018
|
||||||||||
|
NIS thousands
|
NIS thousands
|
NIS thousands
|
||||||||||
|
Deferred tax expense
|
29,622
|
47,873
|
33,505
|
|||||||||
| C. |
Deferred tax liabilities and assets recognized
|
|
Provisions
|
||||||||||||||||
|
and other
|
||||||||||||||||
|
timing
|
Tax losses
|
|||||||||||||||
|
Fixed assets
|
differences
|
carried forward
|
Total
|
|||||||||||||
|
NIS thousands
|
||||||||||||||||
|
Balance of deferred tax
|
||||||||||||||||
|
asset (liability) as at
|
||||||||||||||||
|
January 1, 2019
|
(612,526
|
)
|
8,544
|
481,179
|
(122,803
|
)
|
||||||||||
|
Changes recognized in the
|
||||||||||||||||
|
profit and loss statements
|
(35,797
|
)
|
(746
|
)
|
(12,330
|
)
|
(47,873
|
)
|
||||||||
|
Balance of deferred tax
|
||||||||||||||||
|
asset (liability) as at
|
||||||||||||||||
|
December 31, 2019
|
(648,323
|
)
|
7,798
|
469,849
|
(170,676
|
)
|
||||||||||
|
Changes recognized in the
|
||||||||||||||||
|
profit and loss statements
|
28,059
|
4,309
|
(61,990
|
)
|
(29,622
|
)
|
||||||||||
|
Balance of deferred tax
|
||||||||||||||||
|
asset (liability) as at
|
||||||||||||||||
|
December 31, 2020
|
(620,264
|
)
|
12,107
|
407,859
|
(200,298
|
)
|
||||||||||
| D. |
Reconciliation between the theoretical tax on the pre-tax profit and the tax expense.
|
|
Year ended
|
Year ended
|
Year ended
|
||||||||||
|
December 31,
|
December 31,
|
December 31,
|
||||||||||
|
2020
|
2019
|
2018
|
||||||||||
|
NIS thousands
|
NIS thousands
|
NIS thousands
|
||||||||||
|
Profit before taxes on income
|
128,924
|
209,197
|
167,650
|
|||||||||
|
Statutory tax rate of the company
|
23
|
%
|
23
|
%
|
23
|
%
|
||||||
|
Tax calculated according to the Company’s statutory tax rate
|
29,652
|
48,115
|
38,559
|
|||||||||
|
Creation of deferred taxes in respect of losses from previous years for which no deferred taxes were recorded in the past
|
(36
|
)
|
(286
|
)
|
(5,092
|
)
|
||||||
|
Impact of decrease in tax rate
|
-
|
-
|
-
|
|||||||||
|
Non-deductible expenses and others
|
6
|
44
|
38
|
|||||||||
|
Income tax expense
|
29,622
|
47,873
|
33,505
|
|||||||||
| E. |
Tax losses carried forward
|
| F. |
Tax assessments
|
| A. |
Commitments
|
| 1. |
Financing agreements
|
| 1. |
The Company is required to maintain a debt coverage ratio of 1.10:1 over two consecutive calculation periods, and a debt coverage ratio of 1.05:1 over the entire calculation period.
|
| 2. |
The Company is required to maintain a minimal loan life coverage ratio of 1.10:1.
|
| a. |
Capital Injection Agreement and a Subordinated Loan Agreement
|
| A. |
Commitments (cont’d)
|
| 1. |
Financing agreements (cont’d)
|
| a. |
Capital Injection Agreement and a Subordinated Loan Agreement (cont’d)
|
| b. |
Bank accounts agreement
|
| 2. |
Agreement to lease land under operating lease
|
| A. |
Commitments (cont’d)
|
| 3. |
O&M Agreement
|
| 4. |
Gas Pipeline Agreement
|
| 5. |
Diesel Storage agreement
|
| A. |
Commitments (cont’d)
|
| 6. |
Agreement to purchase natural gas
|
| A. |
Commitments (cont’d)
|
| 7. |
Agreement to sell electricity
|
| 8. |
Property tax assessments in respect of the station
|
| 9. |
Claims by Dori Energy, Zorlu, Edelcom and EAIS
|
| a) |
Petition to Approve a Derivative Claim filed by Dori Energy and Hemi Raphael within the arbitration
|
| A. |
Commitments (cont’d)
|
| 9. |
Claims by Dori Energy, Zorlu, Edelcom and EAIS (cont’d)
|
| a) |
Petition to Approve a Derivative Claim filed by Dori Energy and Hemi Raphael within the arbitration (cont’d)
|
| b) |
Third party notice from Zorlu within the arbitration
|
|
c)
|
Petition to Approve a Derivative Claim filed by Edelcom within the arbitration (cont’d)
|
| A. |
Commitments (cont’d)
|
| 9. |
Claims by Dori Energy, Zorlu, Edelcom and EAIS (cont’d)
|
|
c)
|
Petition to Approve a Derivative Claim filed by Edelcom within the arbitration (cont’d)
|
|
d)
|
Statement of Claim filed by Edelcom within the arbitration
|
|
e)
|
Statement of Claim filed by Edelcom
|
| A. |
Commitments (cont’d)
|
| 9. |
Claims by Dori Energy, Zorlu, Edelcom and EAIS (cont’d)
|
|
f)
|
Zorlu motion
|
| 10. |
Faults in production units
|
| A. |
Commitments (cont’d)
|
| 11. |
Memorandum of understanding with Alon Energy Centers
|
| 12. |
Acquisition of natural gas
|
| A. |
Commitments (cont’d)
|
| 12. |
Acquisition of natural gas (cont’d)
|
| 13. |
PUA resolution
|
| 14. |
Dividend distribution
|
| 15. |
Settlement agreement with the Egyptian gas supplier
|
| A. |
Commitments (cont’d)
|
| 16. |
Third party notice from IEC
|
| 17. |
Possibility of constructing another power plant
|
| B. |
Bank guarantees
|
| C. |
Liens
|
| 1. |
Fixed lien – A fixed lien and first priority mortgage and an assignment by way of lien on all the assets and rights with respect to the power plant in Ashkelon (“the Project”) and all as detailed in the mortgage deed and its
appendices.
|
| 2. |
Floating lien - An unlimited first priority floating lien on all of the rights and assets of the borrower, any object and/or equipment and any other tangible or intangible asset of any type as specified in the financing
agreements.
|
| 3. |
Lien on account of guarantees to third parties – a fixed lien, mortgage and assignment by way of a first priority lien, and a second priority lien on all assets and rights with respect to the account of guarantees including
the funds, the securities, the documents and the notes of others of any type that will be deposited in the account from time to time, as detailed in the mortgage deed and all of its appendices.
|
| 4. |
Lien on the land of the project – A fixed lien and first priority mortgage and an assignment by way of lien on all of the rights, existing and future, of the pledger with no exceptions, per the development agreement that was
signed between the pledger and the Israel Lands Administration (“ILA”) with respect to the land.
|
|
Number of shares
|
||||||||||||
|
December 31
|
||||||||||||
|
Issued and
|
Issued and
|
|||||||||||
|
Authorized
|
paid-in
|
paid-in
|
||||||||||
|
2020
|
2019
|
|||||||||||
|
Ordinary shares of NIS 1 par value
|
500,000
|
10,640
|
10,640
|
|||||||||
|
For the year ended December 31
|
||||||||||||
|
2020
|
2019
|
2018
|
||||||||||
|
NIS thousands
|
||||||||||||
|
Wages and related expenses
|
13,191
|
10,835
|
11,141
|
|||||||||
|
Rental and office maintenance
|
2,310
|
2,546
|
2,971
|
|||||||||
|
Profession services
|
8,583
|
6,145
|
6,268
|
|||||||||
|
Depreciation
|
913
|
793
|
196
|
|||||||||
|
Other
|
30
|
155
|
164
|
|||||||||
|
Expenses (income) doubtful debt
|
(101
|
)
|
202
|
-
|
||||||||
|
24,926
|
20,676
|
20,740
|
||||||||||
|
Year ended December 31
|
||||||||||||
|
2020
|
2019
|
2018
|
||||||||||
|
NIS thousands
|
||||||||||||
|
Financing income
|
||||||||||||
|
Revaluation of derivatives
|
-
|
-
|
11,536
|
|||||||||
|
Net foreign exchange gain
|
-
|
-
|
9,753
|
|||||||||
|
Other
|
3,056
|
4,237
|
3,361
|
|||||||||
|
3,056
|
4,237
|
24,650
|
||||||||||
|
Financing expenses
|
||||||||||||
|
Revaluation of derivatives
|
11,050
|
4,939
|
-
|
|||||||||
|
Interest expense on bank loans
|
132,763
|
171,962
|
212,367
|
|||||||||
|
Interest expense on loans from related parties
|
-
|
838
|
12,577
|
|||||||||
|
Net foreign exchange loss
|
11,228
|
11,935
|
-
|
|||||||||
|
Bank commissions
|
645
|
972
|
2,581
|
|||||||||
|
Lease financing expenses
|
1,546
|
1,631
|
-
|
|||||||||
|
Other financing expenses
|
196
|
604
|
463
|
|||||||||
|
157,428
|
192,881
|
227,988
|
||||||||||
|
Net financing expenses
|
154,372
|
188,644
|
203,338
|
|||||||||
| A. |
Overview
|
| ● |
Credit risk
|
| ● |
Liquidity risk
|
| ● |
Market risk
|
|
December 31
|
||||||||
|
2020
|
2019
|
|||||||
|
NIS thousands
|
||||||||
|
Derivatives presented under current liability
|
||||||||
|
Forward exchange contracts used for economic hedge
|
(2,993
|
)
|
-
|
|||||
| B. |
Risk management framework
|
| C. |
Credit Risk
|
| C. |
Credit Risk (cont’d)
|
| D. |
Liquidity risk
|
| D. |
Liquidity risk (cont’d)
|
|
December 31, 2020
|
||||||||||||||||||||||||||||
|
Carrying
|
Contractual
|
6 months
|
More than
|
|||||||||||||||||||||||||
|
amount
|
cash flows
|
or less
|
6-12 months
|
1-2 years
|
2-5 years
|
5 years
|
||||||||||||||||||||||
|
NIS thousands
|
||||||||||||||||||||||||||||
|
Non-derivative financial liabilities
|
||||||||||||||||||||||||||||
|
Trade payables
|
309,380
|
309,380
|
309,380
|
-
|
-
|
-
|
-
|
|||||||||||||||||||||
|
Other payables
|
2,933
|
2,933
|
2,933
|
-
|
-
|
-
|
-
|
|||||||||||||||||||||
|
Loans from banks
|
2,803,401
|
3,519,668
|
184,907
|
172,080
|
381,190
|
1,058,904
|
1,722,587
|
|||||||||||||||||||||
|
3,115,714
|
3,831,981
|
497,220
|
172,080
|
381,190
|
1,058,904
|
1,722,587
|
||||||||||||||||||||||
| D. |
Liquidity risk (cont’d)
|
|
December 31, 2019
|
||||||||||||||||||||||||||||
|
Carrying
|
Contractual
|
6 months
|
More than
|
|||||||||||||||||||||||||
|
amount
|
cash flows
|
or less
|
6-12 months
|
1-2 years
|
2-5 years
|
5 years
|
||||||||||||||||||||||
|
NIS thousands
|
||||||||||||||||||||||||||||
|
Non-derivative financial liabilities
|
||||||||||||||||||||||||||||
|
Trade payables
|
288,127
|
288,127
|
288,127
|
-
|
-
|
-
|
-
|
|||||||||||||||||||||
|
Other payables
|
9,478
|
9,478
|
9,478
|
-
|
-
|
-
|
-
|
|||||||||||||||||||||
|
Loans from banks
|
3,035,355
|
3,874,688
|
184,207
|
170,813
|
356,987
|
1,089,365
|
2,073,316
|
|||||||||||||||||||||
|
3,332,960
|
4,172,293
|
481,812
|
170,813
|
356,987
|
1,089,365
|
2,073,316
|
||||||||||||||||||||||
| E. |
Market risk
|
| E. |
Market risk (Cont'd)
|
| (1) |
Linkage and foreign currency risk
|
| (a) |
The exposure to linkage and foreign currency risk
|
|
December 31, 2020
|
||||||||||||||||||||
|
Non-financial
|
Unlinked
|
CPI-linked
|
US Dollar linked
|
Total
|
||||||||||||||||
|
NIS thousand
|
||||||||||||||||||||
|
Financial assets and financial
|
||||||||||||||||||||
|
liabilities:
|
||||||||||||||||||||
|
Current assets:
|
||||||||||||||||||||
|
Cash and cash equivalents
|
-
|
177,937
|
-
|
69,142
|
247,079
|
|||||||||||||||
|
Trade receivables
|
-
|
297,719
|
-
|
-
|
297,719
|
|||||||||||||||
|
Other receivables
|
21,401
|
-
|
-
|
-
|
21,401
|
|||||||||||||||
|
Non-current assets:
|
||||||||||||||||||||
|
Restricted deposits
|
-
|
230,956
|
-
|
202,309
|
433,265
|
|||||||||||||||
|
Prepaid expenses
|
35,230
|
-
|
-
|
-
|
35,230
|
|||||||||||||||
|
Fixed assets
|
3,526,839
|
-
|
-
|
-
|
3,526,839
|
|||||||||||||||
|
Intangible assets
|
5,402
|
-
|
-
|
-
|
5,402
|
|||||||||||||||
|
Right of use assets
|
60,113
|
-
|
-
|
-
|
60,113
|
|||||||||||||||
|
Current liabilities:
|
||||||||||||||||||||
|
Current maturities of loans
|
||||||||||||||||||||
|
from banks
|
-
|
-
|
242,098
|
-
|
242,098
|
|||||||||||||||
|
Current maturities of
|
||||||||||||||||||||
|
lease liabilities
|
-
|
-
|
4,535
|
-
|
4,535
|
|||||||||||||||
|
Trade payables
|
-
|
285,065
|
-
|
24,315
|
309,380
|
|||||||||||||||
|
Other accounts payable
|
876
|
2,932
|
-
|
-
|
3,808
|
|||||||||||||||
|
Financial derivatives
|
-
|
-
|
-
|
2,993
|
2,993
|
|||||||||||||||
|
Non-current liabilities:
|
||||||||||||||||||||
|
Loans from banks
|
-
|
-
|
2,561,302
|
-
|
2,561,302
|
|||||||||||||||
|
Long-term lease liabilities
|
-
|
-
|
50,858
|
-
|
50,858
|
|||||||||||||||
|
Provisions for dismantling
|
||||||||||||||||||||
|
and restoration
|
50,000
|
-
|
-
|
-
|
50,000
|
|||||||||||||||
|
Deferred tax liabilities
|
200,298
|
-
|
-
|
-
|
200,298
|
|||||||||||||||
|
Liabilities for employee
|
||||||||||||||||||||
|
benefits, net
|
160
|
-
|
-
|
-
|
160
|
|||||||||||||||
|
Total exposure in statement
|
||||||||||||||||||||
|
of financial position
|
||||||||||||||||||||
|
in respect of financial assets
|
||||||||||||||||||||
|
and financial liabilities
|
3,397,651
|
418,615
|
(2,858,793
|
)
|
244,143
|
1,201,616
|
||||||||||||||
| E. |
Market risk (cont’d)
|
| (1) |
Linkage and foreign currency risks (cont’d)
|
| (a) |
The exposure to linkage and foreign currency risk (cont’d)
|
|
December 31, 2019
|
||||||||||||||||||||||||
|
Non-financial
|
Unlinked
|
CPI-linked
|
US Dollar linked
|
EURO
|
Total
|
|||||||||||||||||||
|
NIS thousand
|
||||||||||||||||||||||||
|
Financial assets and financial
|
||||||||||||||||||||||||
|
liabilities:
|
||||||||||||||||||||||||
|
Current assets:
|
||||||||||||||||||||||||
|
Cash and cash equivalents
|
-
|
195,082
|
-
|
70,931
|
8
|
266,021
|
||||||||||||||||||
|
Trade receivables
|
-
|
292,759
|
-
|
-
|
-
|
292,759
|
||||||||||||||||||
|
Other receivables
|
22,685
|
-
|
-
|
-
|
-
|
22,685
|
||||||||||||||||||
|
Non-current assets:
|
||||||||||||||||||||||||
|
Restricted deposits
|
-
|
303,263
|
-
|
134,769
|
-
|
438,032
|
||||||||||||||||||
|
Prepaid expenses
|
37,225
|
-
|
-
|
-
|
-
|
37,225
|
||||||||||||||||||
|
Fixed assets
|
3,698,716
|
-
|
-
|
-
|
-
|
3,698,716
|
||||||||||||||||||
|
Intangible assets
|
2,247
|
-
|
-
|
-
|
-
|
2,247
|
||||||||||||||||||
|
Right of use assets
|
64,161
|
-
|
-
|
-
|
-
|
64,161
|
||||||||||||||||||
|
Current liabilities:
|
||||||||||||||||||||||||
|
Current maturities of loans
|
||||||||||||||||||||||||
|
from banks
|
-
|
-
|
231,380
|
-
|
-
|
231,380
|
||||||||||||||||||
|
Current maturities of
|
||||||||||||||||||||||||
|
lease liabilities
|
-
|
-
|
4,551
|
-
|
-
|
4,551
|
||||||||||||||||||
|
Trade payables
|
-
|
247,464
|
-
|
40,663
|
-
|
288,127
|
||||||||||||||||||
|
Other accounts payable
|
1,031
|
9,478
|
-
|
-
|
-
|
10,509
|
||||||||||||||||||
|
Non-current liabilities:
|
||||||||||||||||||||||||
|
Loans from banks
|
-
|
-
|
2,803,975
|
-
|
-
|
2,803,975
|
||||||||||||||||||
|
Long-term lease liabilities
|
-
|
-
|
54,052
|
-
|
-
|
54,052
|
||||||||||||||||||
|
Provisions for dismantling
|
||||||||||||||||||||||||
|
and restoration
|
36,102
|
-
|
-
|
-
|
-
|
36,102
|
||||||||||||||||||
|
Deferred tax liabilities
|
170,676
|
-
|
-
|
-
|
-
|
170,676
|
||||||||||||||||||
|
Liabilities for employee
|
||||||||||||||||||||||||
|
benefits, net
|
160
|
-
|
-
|
-
|
-
|
160
|
||||||||||||||||||
|
Total exposure in statement
|
||||||||||||||||||||||||
|
of financial position
|
||||||||||||||||||||||||
|
in respect of financial assets
|
||||||||||||||||||||||||
|
and financial liabilities
|
3,617,065
|
534,162
|
(3,093,958
|
)
|
165,037
|
8
|
1,222,314
|
|||||||||||||||||
| E. |
Market risk (cont’d)
|
| (1) |
Linkage and foreign currency risks (cont’d)
|
| (a) |
The exposure to linkage and foreign currency risk (cont’d)
|
|
December 31, 2020
|
||||||||||||||||||||
|
Currency/
|
Currency/
|
Principal
|
||||||||||||||||||
|
linkage
|
linkage
|
amount in
|
Dates range of
|
|||||||||||||||||
|
receivable
|
payable
|
$ millions
|
expiration
|
Fair value
|
||||||||||||||||
|
NIS thousands
|
||||||||||||||||||||
|
Instruments used
|
||||||||||||||||||||
|
Economic Hedge:
|
||||||||||||||||||||
|
Forward foreign
|
29.01.2021
|
|||||||||||||||||||
|
currency contracts
|
US dollars
|
NIS
|
63
|
31.12.2021
|
(2,993
|
)
|
||||||||||||||
|
December 31, 2019
|
||||||||||||||||||||
|
Currency/
|
Currency/
|
Principal
|
||||||||||||||||||
|
linkage
|
linkage
|
amount in
|
Dates range of
|
|||||||||||||||||
|
receivable
|
payable
|
$ millions
|
expiration
|
Fair value
|
||||||||||||||||
|
NIS thousands
|
||||||||||||||||||||
|
Instruments used
|
||||||||||||||||||||
|
Economic Hedge:
|
||||||||||||||||||||
|
Forward foreign
|
||||||||||||||||||||
|
currency contracts
|
-
|
-
|
-
|
-
|
-
|
|||||||||||||||
| (b) |
Sensitivity analysis
|
|
December 31, 2020
|
December 31, 2019
|
|||||||||||||||
|
Increase
|
Decrease
|
Increase
|
Decrease
|
|||||||||||||
|
Profit or loss
|
Profit or loss
|
Profit or loss
|
Profit or loss
|
|||||||||||||
|
NIS thousands
|
NIS thousands
|
NIS thousands
|
NIS thousands
|
|||||||||||||
|
Change in the exchange rate of:
|
||||||||||||||||
|
5% in the US dollar (1)
|
23,200
|
(23,200
|
)
|
8,252
|
(8,252
|
)
|
||||||||||
|
10% in the U.S. dollar (1)
|
45,684
|
(45,684
|
)
|
16,504
|
(16,504
|
)
|
||||||||||
|
1% change in CPI (2)
|
(28,034
|
)
|
28,034
|
(30,354
|
)
|
30,354
|
||||||||||
|
2% change in CPI (2)
|
(56,068
|
)
|
56,068
|
(60,707
|
)
|
60,707
|
||||||||||
| (1) |
The sensitivity derives mainly from balances of cash, restricted deposits, derivatives and balances of trade and other payables in foreign currency.
|
| (2) |
The effect of the change on equity is the same as in profit or loss.
|
| F. |
Fair value
|
| (1) |
Fair values versus carrying amounts
|
|
December 31
|
||||||||||||||||
|
2020
|
2019
|
|||||||||||||||
|
Carrying
|
Fair
|
Carrying
|
Fair
|
|||||||||||||
|
amount
|
value
|
amount
|
value
|
|||||||||||||
|
NIS thousands
|
NIS thousands
|
NIS thousands
|
NIS thousands
|
|||||||||||||
|
Long-term loans from banks (*)
|
2,803,400
|
2,970,255
|
3,035,355
|
3,165,760
|
||||||||||||
| (*) |
Including current maturities.
|
| (2) |
Interest rates used for determining fair value
|
|
December 31
|
||||||||
|
2020
|
2019
|
|||||||
|
%
|
%
|
|||||||
|
Long-term loans from banks
|
3.3
|
%
|
3.9
|
%
|
||||
| (3) |
Fair value hierarchy
|
| ● |
Level 1: quoted prices (unadjusted) in active markets for identical instruments
|
| ● |
Level 2: inputs other than quoted prices included within Level 1 that are observable, either directly or indirectly
|
| ● |
Level 3: inputs that are not based on observable market data (unobservable inputs).
|
|
December 31, 2020
|
||||||||||||||||
|
Level 1
|
Level 2
|
Level 3
|
Total
|
|||||||||||||
|
NIS thousands
|
NIS thousands
|
NIS thousands
|
NIS thousands
|
|||||||||||||
|
Derivatives used for hedging:
|
||||||||||||||||
|
Forward foreign currency contracts
|
-
|
(2,993
|
)
|
-
|
(2,993
|
)
|
||||||||||
|
December 31, 2019
|
||||||||||||||||
|
Level 1
|
Level 2
|
Level 3
|
Total
|
|||||||||||||
|
NIS thousands
|
NIS thousands
|
NIS thousands
|
NIS thousands
|
|||||||||||||
|
Derivatives used for hedging:
|
||||||||||||||||
|
Forward foreign currency contracts
|
-
|
-
|
-
|
-
|
||||||||||||
| (1) |
Land
|
| (2) |
Offices
|
| (1) |
Information regarding material lease agreements
|
| (a) |
The Company leases land from EAIS for a period of 25 years during which the Company established a power station. The contractual period ends on May 20, 2039. The total liability for the lease and the right of use assets recognized in
the statement of financial position as of December 31, 2020 for the lease was approximately NIS 54,237 thousand and NIS 56,751 thousand respectively.
|
| (b) |
The Company leases offices from Africa Israel for a period of 5 years with extension options for another 6 years, the ending date for the extension periods is December 8, 2022. The Company is in an option period to extend the
agreement, under the same conditions as the original agreement. The total liability for the lease and the right of use assets recognized in the statement of financial position as of December 31, 2020 for the lease of the offices is
approximately NIS 1,157 thousand and approximately NIS 1,122 thousand respectively.
|
| (2) |
Right-of-use assets
|
| (a) |
Composition and changes
|
|
Land *
|
offices
|
Total
|
||||||||||
|
NIS thousands
|
NIS thousands
|
NIS thousands
|
||||||||||
|
|
||||||||||||
|
Balance as at January 1, 2019
|
65,675
|
2,289
|
67,964
|
|||||||||
|
Depreciation on right-of-use assets
|
3,222
|
581
|
3,803
|
|||||||||
|
Balance as at January 1, 2020
|
62,453
|
1,708
|
64,161
|
|||||||||
|
Depreciation on right-of- use assets
|
3,462
|
586
|
4,048
|
|||||||||
|
|
||||||||||||
|
Balance as at December 31, 2020
|
58,991
|
1,122
|
60,113
|
|||||||||
| (3) |
Lease liability
|
|
December 31, 2020
|
||||
|
NIS thousands
|
||||
|
Less than one year
|
4,535
|
|||
|
One to five years
|
20,322
|
|||
|
More than five years
|
30,536
|
|||
|
Total
|
55,393
|
|||
|
Current maturities of lease liability
|
4,535
|
|||
|
Long-term lease liability
|
50,858
|
|||
|
55,393
|
||||
| (4) |
Additional information on leases
|
|
December 31, 2020
|
December 31, 2019
|
|||||||
|
NIS thousands
|
NIS thousands
|
|||||||
|
(a) Amounts recognized in profit or loss
|
||||||||
|
Interest expenses on lease liability
|
1,546
|
1,631
|
||||||
|
(b) Amounts recognized in the statement of cash flows
|
||||||||
|
Cash outflow for leases
|
4,523
|
8,513
|
||||||
|
Year ended December 31
|
December 31
|
|||||||||||||||||||||
|
2020
|
2019
|
2018
|
2020
|
2019
|
||||||||||||||||||
|
Related party/Interested party
|
Nature of transaction
|
Transactions amounts
|
Outstanding balance
|
|||||||||||||||||||
|
Parties having significant influence
|
On December 2017 the Company entered into an agreement with EZOM regarding operation and maintenance of the power plant including the purchasing of spare parts
|
170,765
|
163,152
|
203,050
|
5,805
|
5,798
|
||||||||||||||||
|
Parties having significant influence
|
The Company entered into an agreement with EAPSS regarding operation and maintenance of the power plant including the purchasing of spare parts and repairs as from November 2012 see
Note 12A(10). The payments will be made on a monthly basis throughout the period of the agreement. See Note 12A(3)) regarding a subcontracting agreement between EAPSS and Ezom Ltd. As of December 2017, the agreement is directly with
Ezom.
|
3,310
|
3,326
|
3,291
|
-
|
-
|
||||||||||||||||
|
Parties having significant influence
|
The Company entered into an agreement with Eilat Ashkelon Pipeline Company Ltd. (EAPC) regarding Diesel storage services and use of emergency pumps as of July 2013. The payments will be
paid on a quarterly basis (see Note 12A(5)).
|
-
|
918
|
4,312
|
-
|
-
|
||||||||||||||||
|
Parties having significant influence
|
The Company entered into a lease agreement of the land for the power plant (see Note 12A(2)).
|
4,056
|
3,951
|
3,892
|
-
|
-
|
||||||||||||||||
|
Related Companies
|
The Company has several agreements with related companies for the sale of electricity.
|
-
|
4,697
|
16,278
|
-
|
-
|
||||||||||||||||
|
Related Party
|
The Company engage with Ramat Negev Energy for purchase electricity and gas.
|
1,594
|
1,877
|
127
|
-
|
-
|
||||||||||||||||
|
Key management personnel
|
Salary and benefits for the company Key management personnel
|
5,621
|
4,865
|
4,611
|
1,815
|
1,498
|
||||||||||||||||
|
Number
|
Description
|
|
Number
|
Description
|
|
101.INS**
|
XBRL Instance Document
|
|
101.SCH**
|
XBRL Taxonomy Extension Schema Document
|
|
101.CAL**
|
XBRL Taxonomy Calculation Linkbase Document
|
|
101.DEF**
|
XBRL Taxonomy Extension Definition Linkbase Document
|
|
101.LAB**
|
XBRL Taxonomy Label Linkbase Document
|
|
101.PRE**
|
XBRL Taxonomy Presentation Linkbase Document
|
| * |
The original language version is on file with the Registrant and is available upon request.
|
| ** |
Pursuant to Rule 406T of Regulation S-T, these interactive data files are deemed not filed or part of a registration statement or prospectus for purposes of Sections 11 or 12 of the Securities Act of 1933, as amended, are deemed
not filed for the purposes of Section 18 of the Securities and Exchange Act of 1934, as amended, and otherwise are not subject to liability under those sections.
|
| (1) |
Previously filed with the Registrant’s Form 20-F for the year ended December 31, 2012 and incorporated by reference herein.
|
| (2) |
Previously filed with the Registrant’s Form 20-F for the year ended December 31, 2018 and incorporated by reference herein.
|
| (3) |
Previously filed with the Registrant’s Form 20-F for the year ended December 31, 2011 and incorporated by reference herein.
|
| (4) |
Previously filed with the Registrant’s Form 20-F for the year ended December 31, 2019 and incorporated by reference herein.
|
| (5) |
Included in the Registrant’s Form 6-K dated May 17, 2018 and incorporated by reference herein.
|
| (6) |
Included in the Registrant’s Form 6-K dated October 14, 2005 and incorporated by reference herein.
|
| (7) |
Included in the Registrant’s Form 6-K dated December 1, 2008 and incorporated by reference herein.
|
| (8) |
Previously filed with the Registrant’s Form 20-F for the year ended December 31, 2010 and incorporated by reference herein.
|
| (9) |
Previously filed with the Registrant’s Form 20-F for the year ended December 31, 2013 and incorporated by reference herein.
|
| (10) |
Previously filed with the Registrant’s Form 20-F for the year ended December 31, 2014 and incorporated by reference herein.
|
| (11) |
Previously filed with the Registrant’s Form 20-F for the year ended December 31, 2017 and incorporated by reference herein.
|
| (12) |
Included in the Registrant’s Form 6-K dated September 25, 2019 and incorporated by reference herein.
|