Exhibit 99.1

Ellomay Capital Reports Results for the Three and Nine Months Ended September 30, 2017
Tel-Aviv, Israel, December 19, 2017 – Ellomay Capital Ltd. (NYSE American; TASE: ELLO) (“Ellomay” or the “Company”) an emerging operator in the renewable energy and energy infrastructure sector, today reported its unaudited financial results for the three and nine month periods ended September 30, 2017.
Financial Highlights
| · |
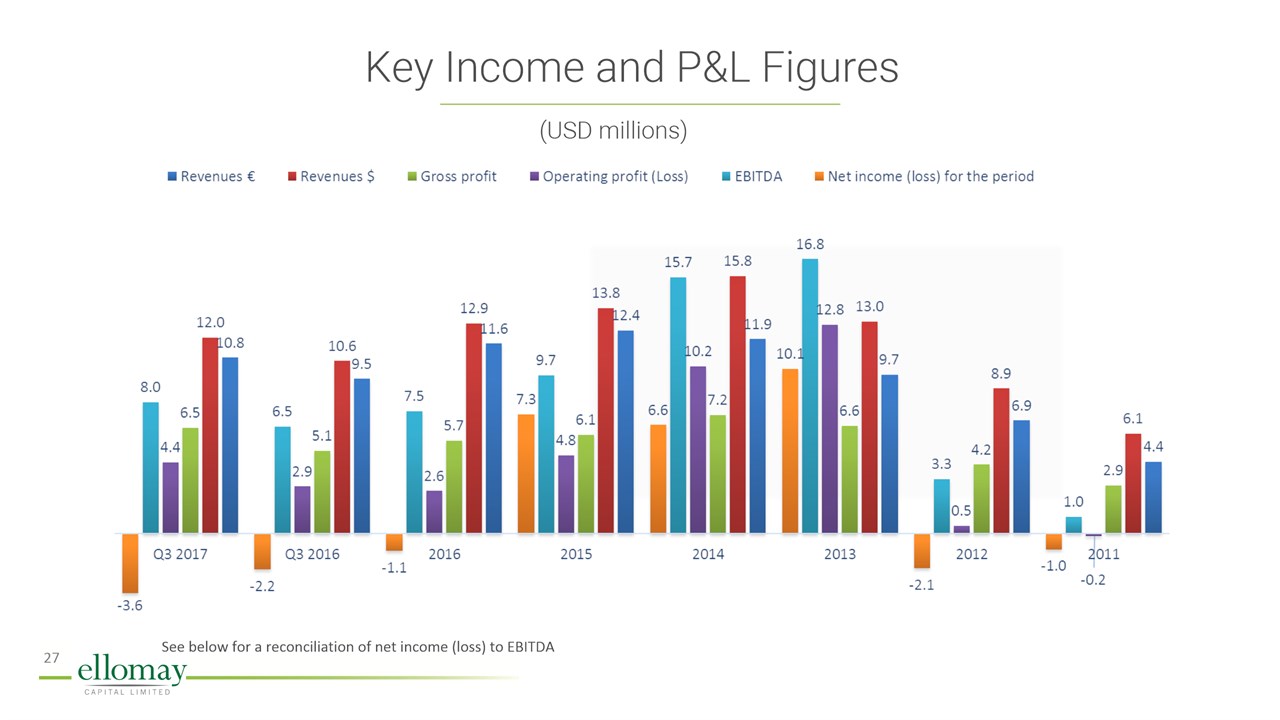
Revenues were approximately $12 million (approximately €10.8 million) for the nine months ended September 30, 2017, compared to approximately $10.6 million (approximately €9.5 million) for the nine months ended September 30, 2016. The increase in revenues is mainly a result of higher spot rates and higher radiation levels in Italy and Spain during the nine months ended September 30, 2017 compared to the nine months ended September 30, 2016, as 2016 was characterized by low levels of radiation.
|
| · |
Operating expenses remained stable at approximately $1.8 million (approximately €1.7 million) for the nine months ended September 30, 2017, compared to approximately $1.9 million (approximately €1.7 million) for the nine months ended September 30, 2016. Depreciation expenses were approximately $3.7 million (approximately €3.3 million) for the nine months ended September 30, 2017 and 2016.
|
| · |
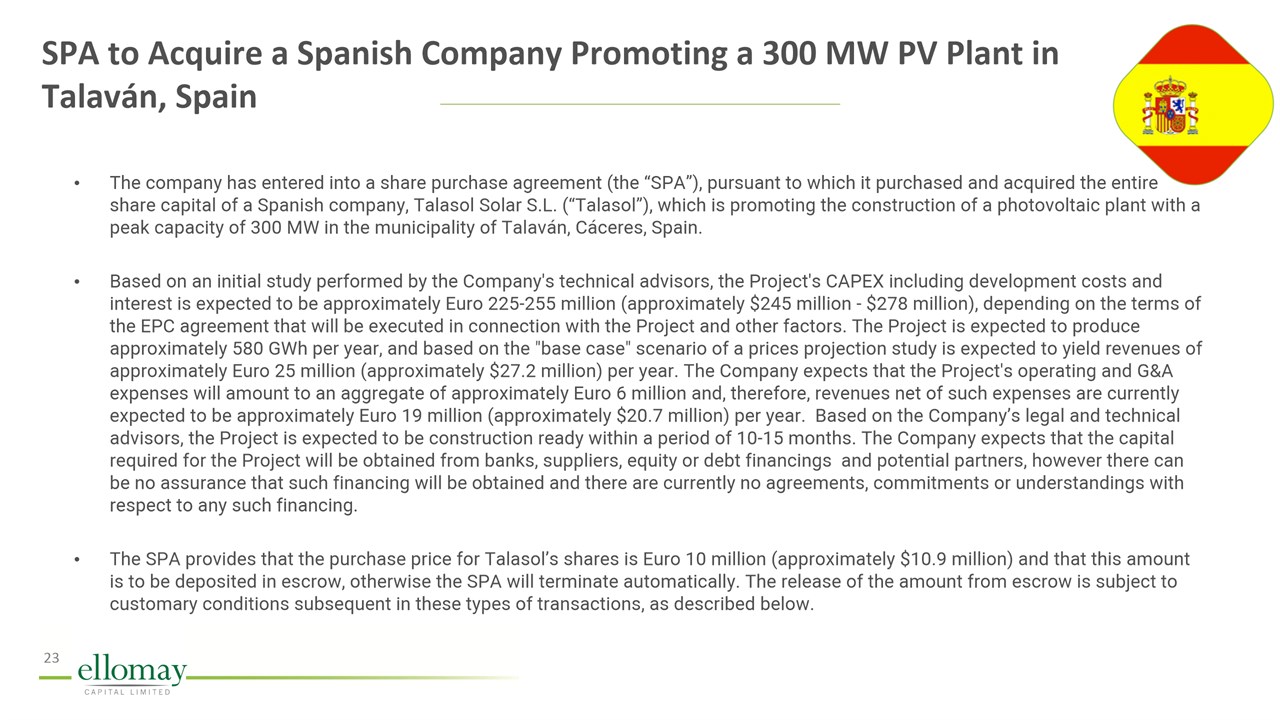
Project development costs were approximately $1.9 million for the nine months ended September 30, 2017, compared to approximately $1.5 million for the nine months ended September 30, 2016. The increase in project development costs is mainly attributable to consultancy expenses in connection with the execution of an agreement to acquire a photovoltaic site in Talmei Yosef, Israel (the “Talmei Yosef Project”), in June 2017 and the execution in April 2017 of an agreement to acquire the shares of Talasol Solar S.L., which is promoting the construction of a photovoltaic plant with a peak capacity of 300 MW in Spain.
|
| · |
General and administrative expenses were approximately $2.1 million for the nine months ended September 30, 2017, compared to approximately $1.9 million for the nine months ended September 30, 2016. There was no material change in the substance and composition of the expenses included in general and administrative expenses between the two periods.
|
| · |
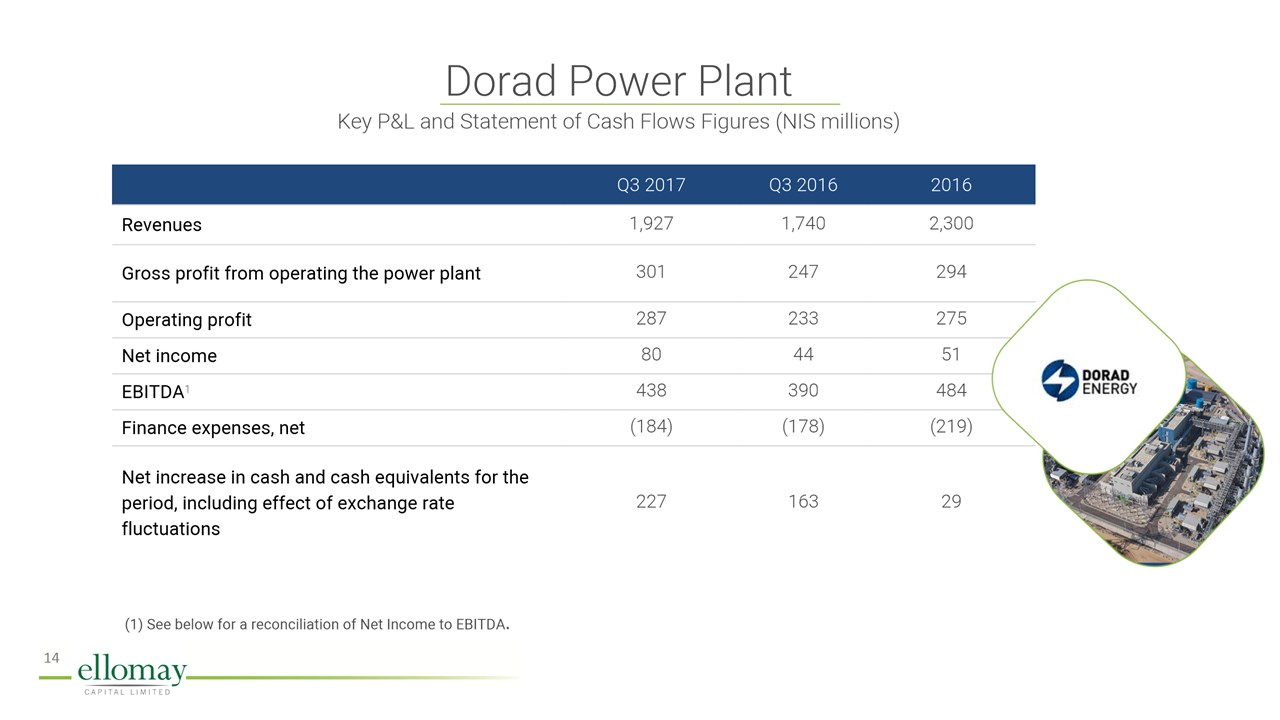
Company’s share of income of equity accounted investee, after elimination of intercompany transactions, was approximately $1.9 million for the nine months ended September 30, 2017, compared to approximately $1.1 million in the nine months ended September 30, 2016. The increase in the Company’s share of profit of equity accounted investee is mainly attributable to an increase in sales of electricity to Dorad’s customers, resulting in an increase in operating profit, and to lower financing expenses incurred by Dorad for the period as a result of the CPI indexation of loans from banks and related parties, partially offset by an increase in taxes on income.
|
| · |
Financing expenses, net was approximately $6.8 million for the nine months ended September 30, 2017, compared to approximately $4.5 million for the nine months ended September 30, 2016. The increase in financing expenses was mainly due to the reevaluation of the Company’s EUR/USD forward transactions, interest rate swap transactions and marketable securities in the aggregate amount of approximately $3.2 million loss compared to approximately $1.5 million loss during the nine months ended September 30, 2017 and September 30, 2016, respectively, and increased expenses resulting from exchange rate differences in the amount of approximately $1.3 million compared to approximately $0.6 million during the nine months ended September 30, 2017 and 2016, respectively.
|
| · |
Taxes on income were approximately $1.2 million for the nine months ended September 30, 2017, compared to approximately $0.6 million for the nine months ended September 30, 2016. This increase in taxes on income compared to the corresponding period in 2016 resulted mainly from increased profit in 2017 and from previous utilization of loss carry forwards for several of the Company’s Italian subsidiaries.
|
| · |
Net loss was approximately $3.6 million for the nine months ended September 30, 2017, compared to net loss of approximately $2.2 million for the nine months ended September 30, 2016.
|
| · |
Total other comprehensive income was approximately $9 million for the nine months ended September 30, 2017, compared to approximately $2.5 million for the nine months ended September 30, 2016. The change was mainly due to presentation currency translation adjustments as a result of fluctuations in the Euro/USD exchange rates.
|
| · |
Total comprehensive income was approximately $5.4 million for the nine months ended September 30, 2017, compared to approximately $0.3 million for the nine months ended September 30, 2016.
|
| · |
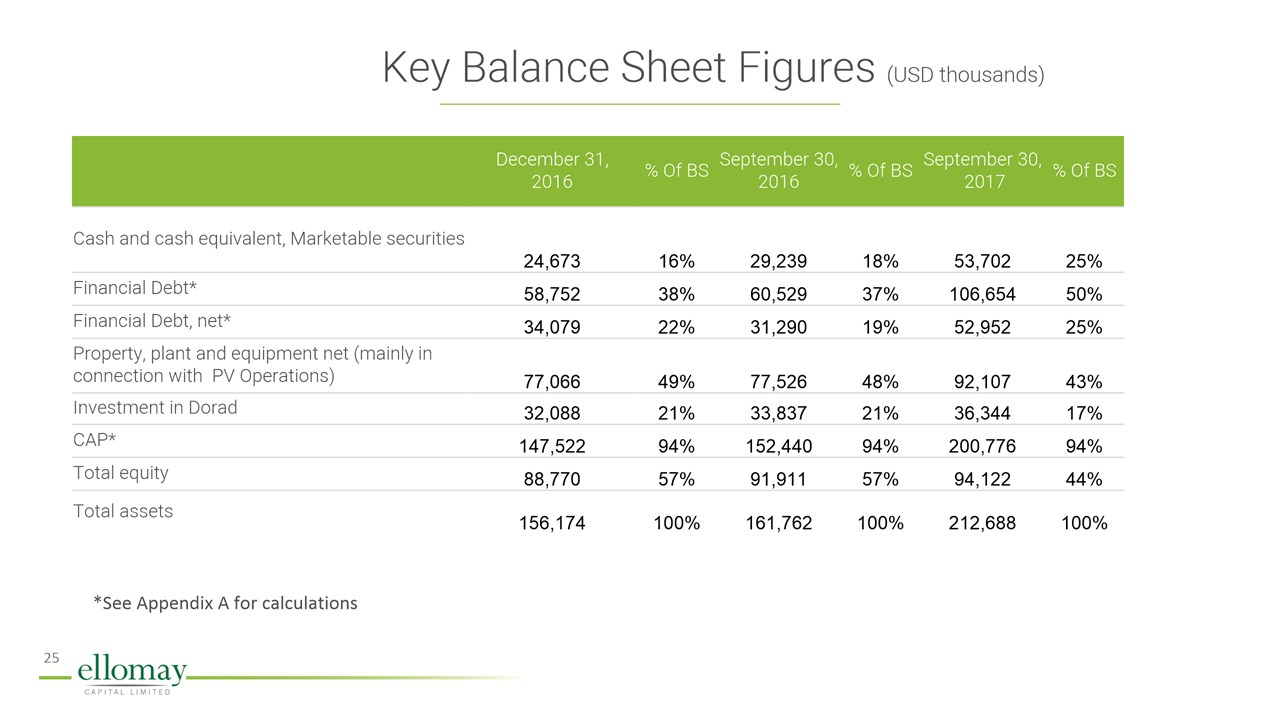
Total equity was approximately $94.1 million as of September 30, 2017, compared to approximately $88.8 million of December 31, 2016. The increase in total equity was mainly due to presentation currency translation adjustments.
|
| · |
EBITDA was approximately $8 million for the nine months ended September 30, 2017, compared to approximately $6.5 million for the nine months ended September 30, 2016. The increase in EBITDA is mainly due to increased revenues and an increase in the Company’s share of profit of equity accounted investee.
|
| · |
Net cash from operating activities was approximately $3.9 million for the nine months ended September 30, 2017, compared to approximately $7.5 million for the nine months ended September 30, 2016. The decrease in net cash from operating activities is mainly attributable to payment of interest on a loan from an equity accounted investee of approximately $0.5 million for the nine months ended September 30, 2017, compared to approximately $5.1 million in the nine months ended September 30, 2016, partially offset by increased revenues during the period as a result of higher spot rates and higher radiation levels in Italy and Spain.
|
| · |
On October 18, 2017, the Company completed the purchase of the Talmei Yosef Project. Therefore, the results of the Talmei Yosef Project are not included in the financial results for the nine months ended September 30, 2017.
|
| · |
As of December 1, 2017, the Company held approximately $36.8 million in cash and cash equivalents, approximately $6.5 million in marketable securities and approximately $4.4 million in short-term and long-term restricted cash.
|
| · |
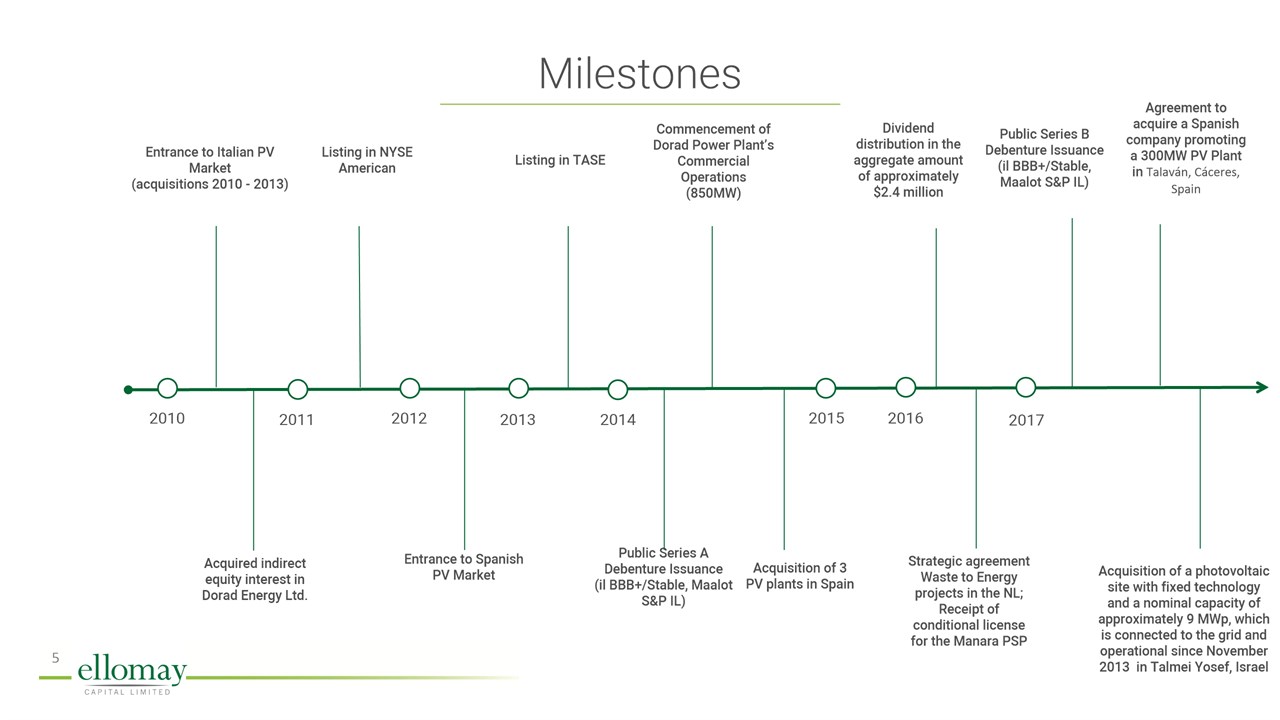
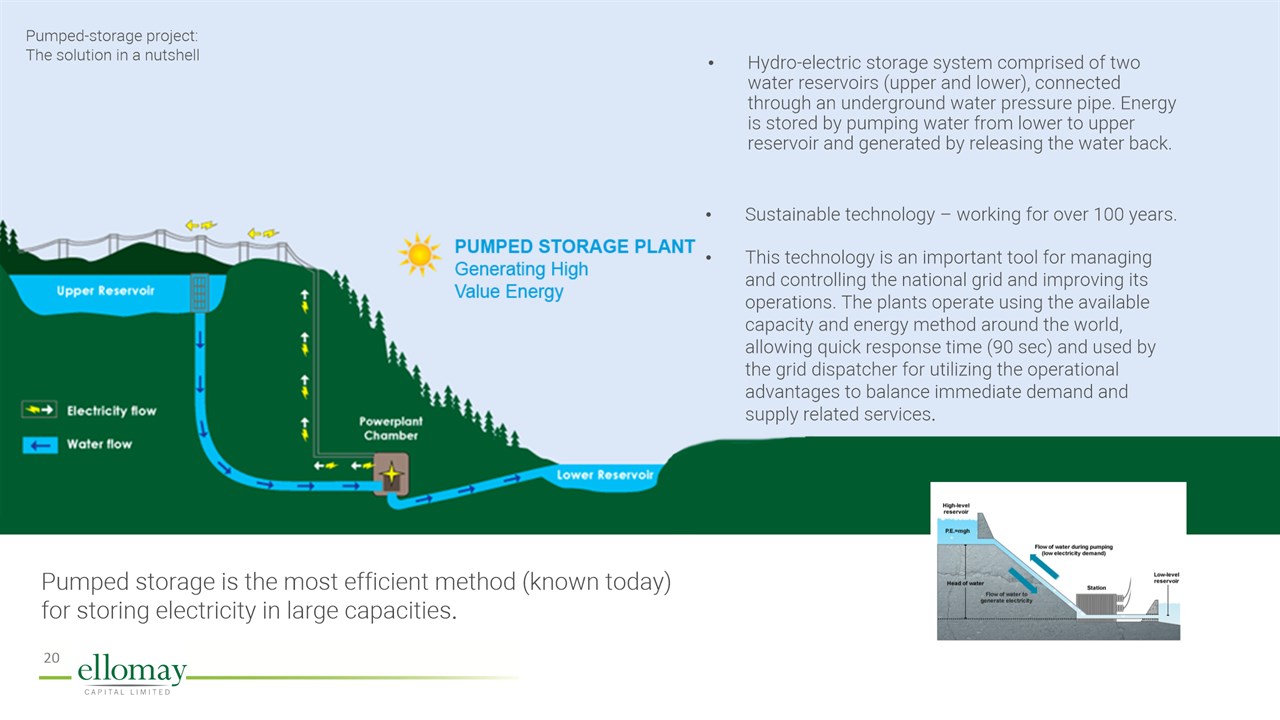
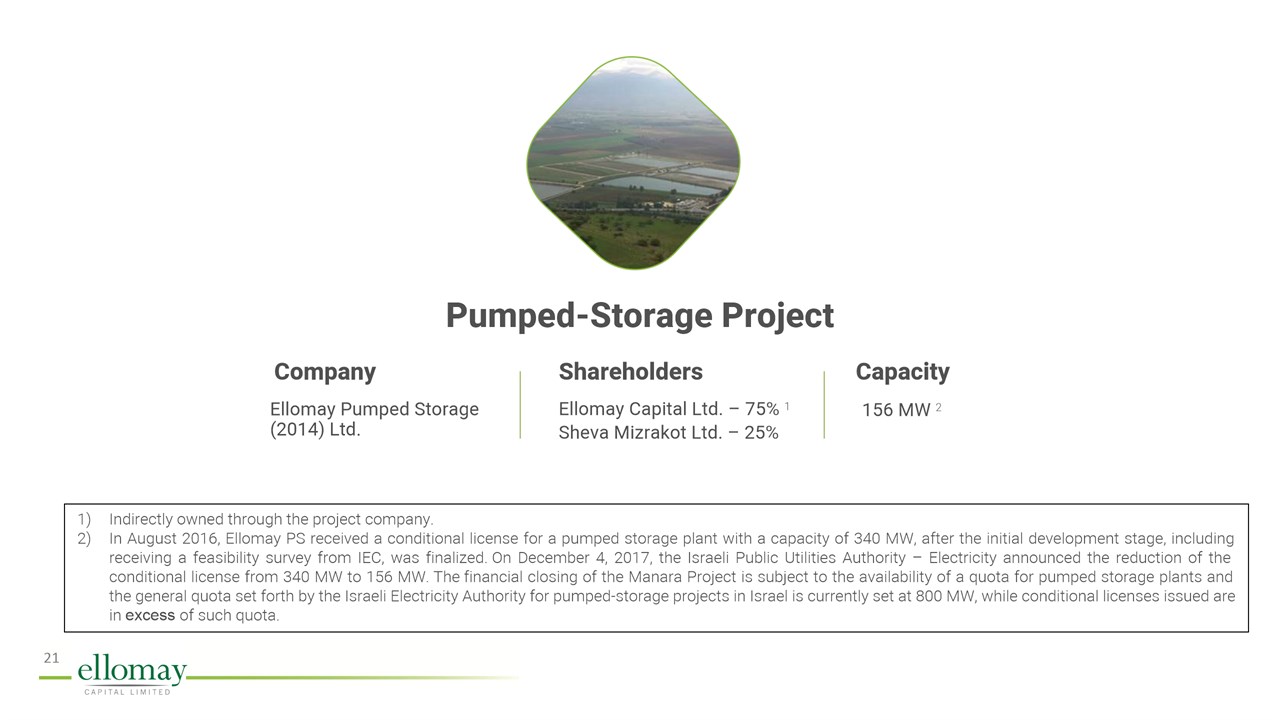
On December 4, 2017, the Israeli Public Utilities Authority – Electricity (the “Israeli Electricity Authority”) announced the reduction of the conditional license issued to Ellomay Pumped Storage (2014) Ltd., the Company’s 75%-owned subsidiary engaged in promoting a pumped storage project in the Manara Cliff in Israel (the “Manara PSP”) from 340 MW to 156 MW. The reduced capacity is based on the remaining capacity in the hydro pumped storage quota determined by the Israeli Electricity Authority after deducting the capacity already allocated to two projects that are in more advanced stages than the Manara PSP. The Israeli Electricity Authority also announced the extension by four months of the deadline for producing a connection survey in both conditional licenses. In its decision, the Israeli Electricity Authority noted that in the event one of the holders of the conditional licenses reaches financial closing, the Israeli Electricity Authority will commence the process of cancelling the other conditional licenses for projects that have not yet reached financial closing.
|
| · |
Estimated 2018 CF projection from projects are:
|
| ✓ |
Projects income of $26.1 million.
|
| ✓ |
Net expected CF from projects of $15.2 million.
|
| ✓ |
Total 2018 estimated CF from projects of $12.3 million.
|
For more information concerning the Company’s cash flow projections see the Company’s Immediate Report on Form 6-K furnished to the Securities and Exchange Commission on November 1, 2017.
Ran Fridrich, CEO and a board member of Ellomay commented: “Ellomay continues its extensive development and investment program, while constantly improving the performance of its existing projects. The results for the period show an improvement in all the parameters, including revenues and EBITDA, while maintaining liquidity and increasing cash balances. Management expects that the results of the investments made during 2017 in connection with the Talmei Yosef project and the two bio-gas projects in the Netherlands will be reflected in the 2018 financial results.”
Information for the Company’s Series A and Series B Debenture Holders
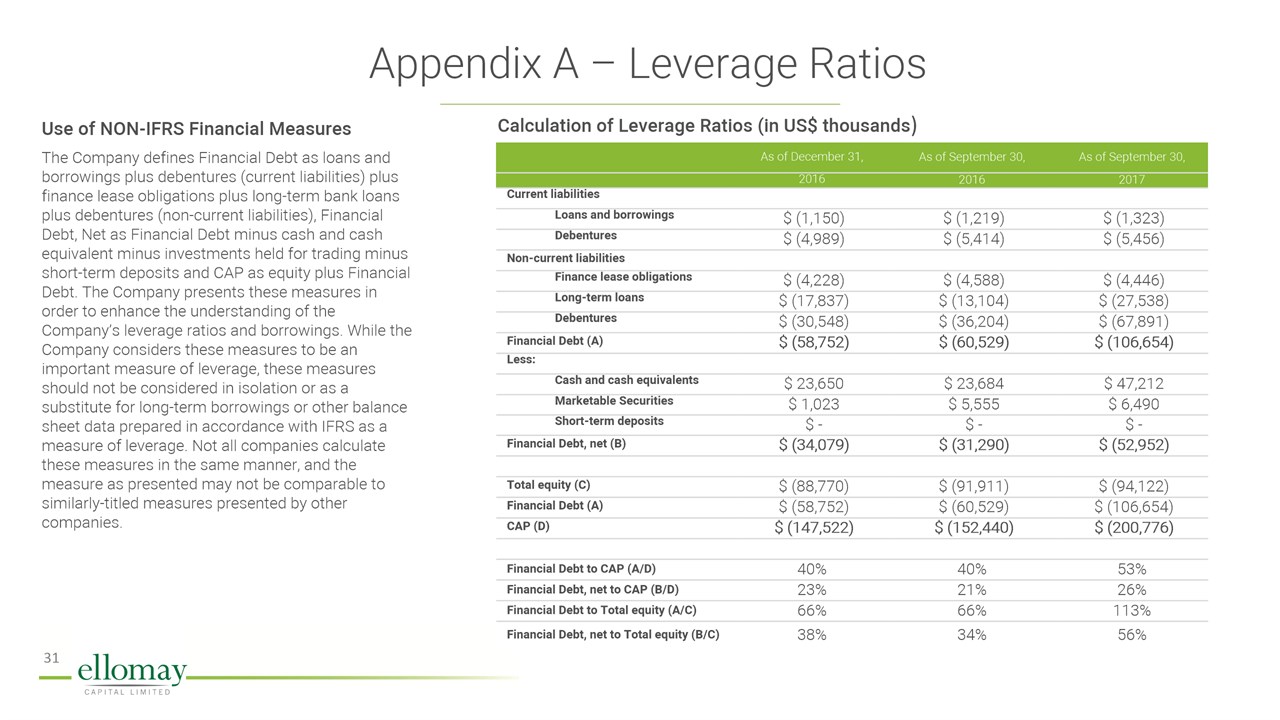
As of September 30, 2017, the Company’s Net Financial Debt (as such term is defined in the Deeds of Trust of the Company’s Debentures) was approximately $24.7 million (consisting of approximately $34.1 million of short-term and long-term debt from banks and other interest bearing financial obligations and approximately $73.3 million in connection with the Series A Debentures issuances (in January and September 2014) and the Series B Debentures issuance (in March 2017), net of approximately $53.7 million of cash and cash equivalents and marketable securities and net of approximately $29 million of project finance and related hedging transactions of the Company’s subsidiaries).
Use of NON-IFRS Financial Measures
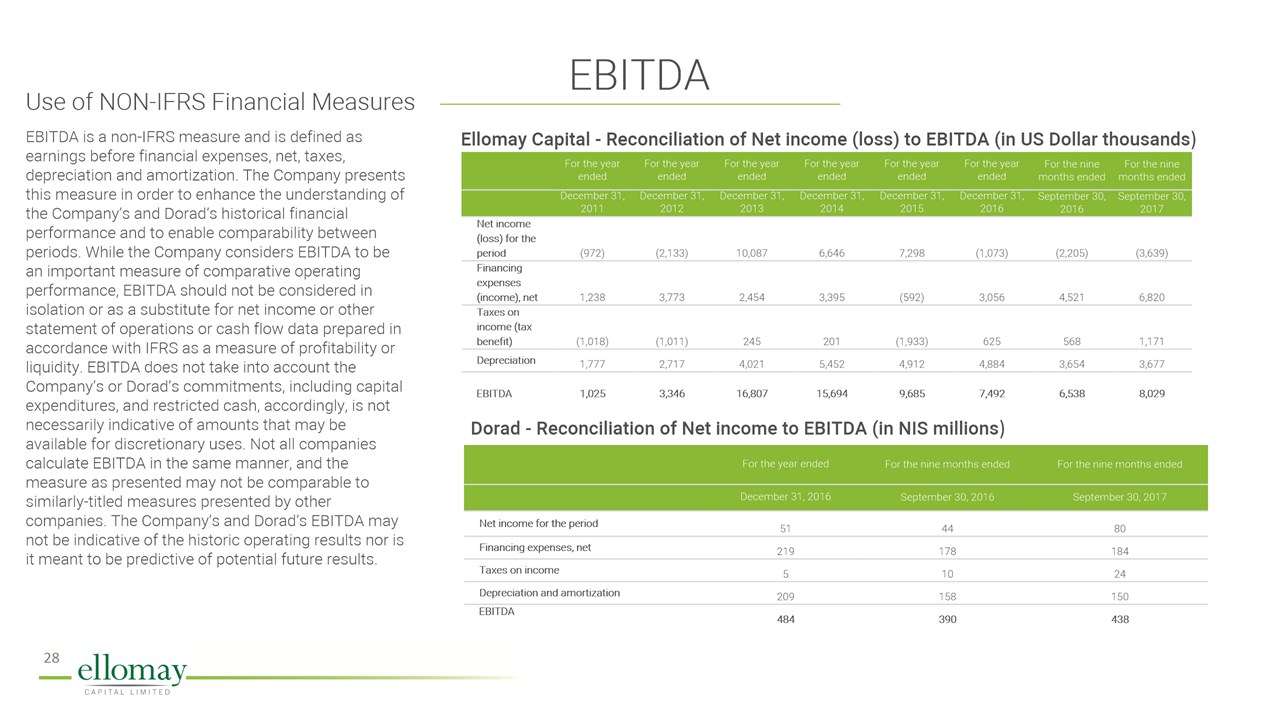
EBITDA is a non-IFRS measure and is defined as earnings before financial expenses, net, taxes, depreciation and amortization. The Company presents this measure in order to enhance the understanding of the Company’s historical financial performance and to enable comparability between periods. While the Company considers EBITDA to be an important measure of comparative operating performance, EBITDA should not be considered in isolation or as a substitute for net income or other statement of operations or cash flow data prepared in accordance with IFRS as a measure of profitability or liquidity. EBITDA does not take into account the Company’s commitments, including capital expenditures, and restricted cash and, accordingly, is not necessarily indicative of amounts that may be available for discretionary uses. Not all companies calculate EBITDA in the same manner, and the measure as presented may not be comparable to similarly-titled measures presented by other companies. The Company’s EBITDA may not be indicative of the historic operating results of the Company; nor is it meant to be predictive of potential future results. A reconciliation between results on an IFRS and non-IFRS basis is provided in the last table of this press release.
About Ellomay Capital Ltd.
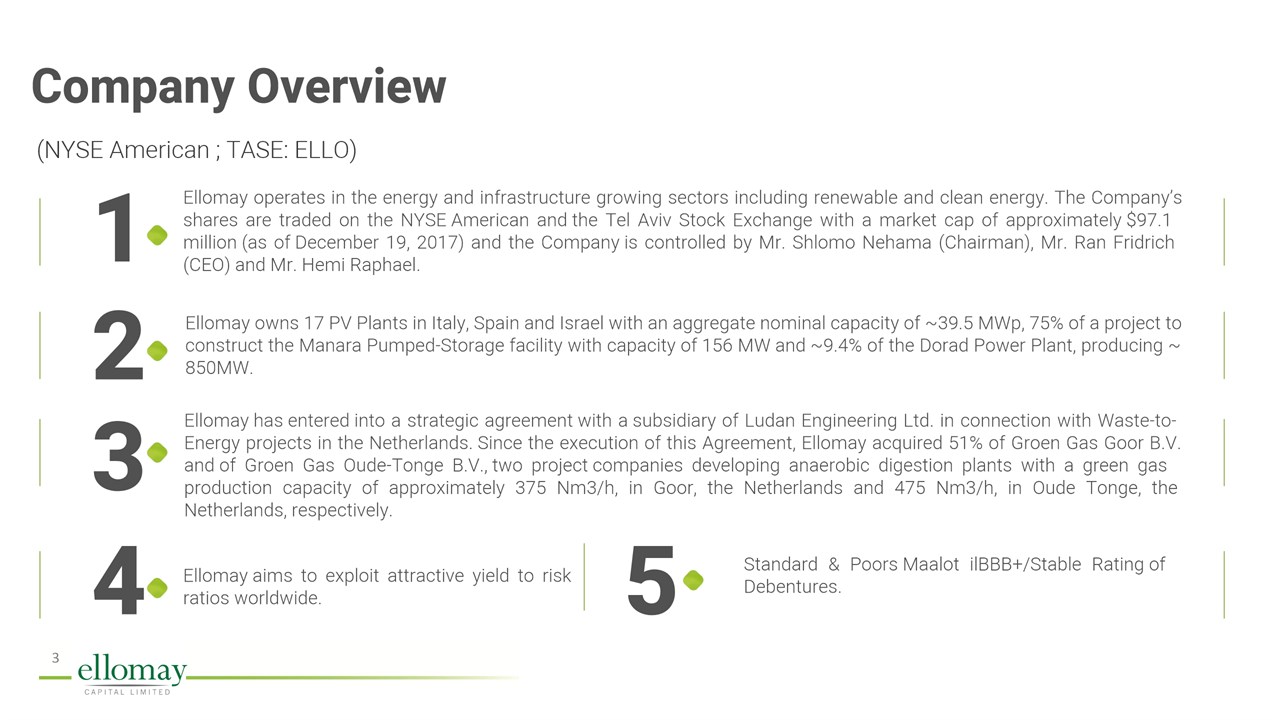
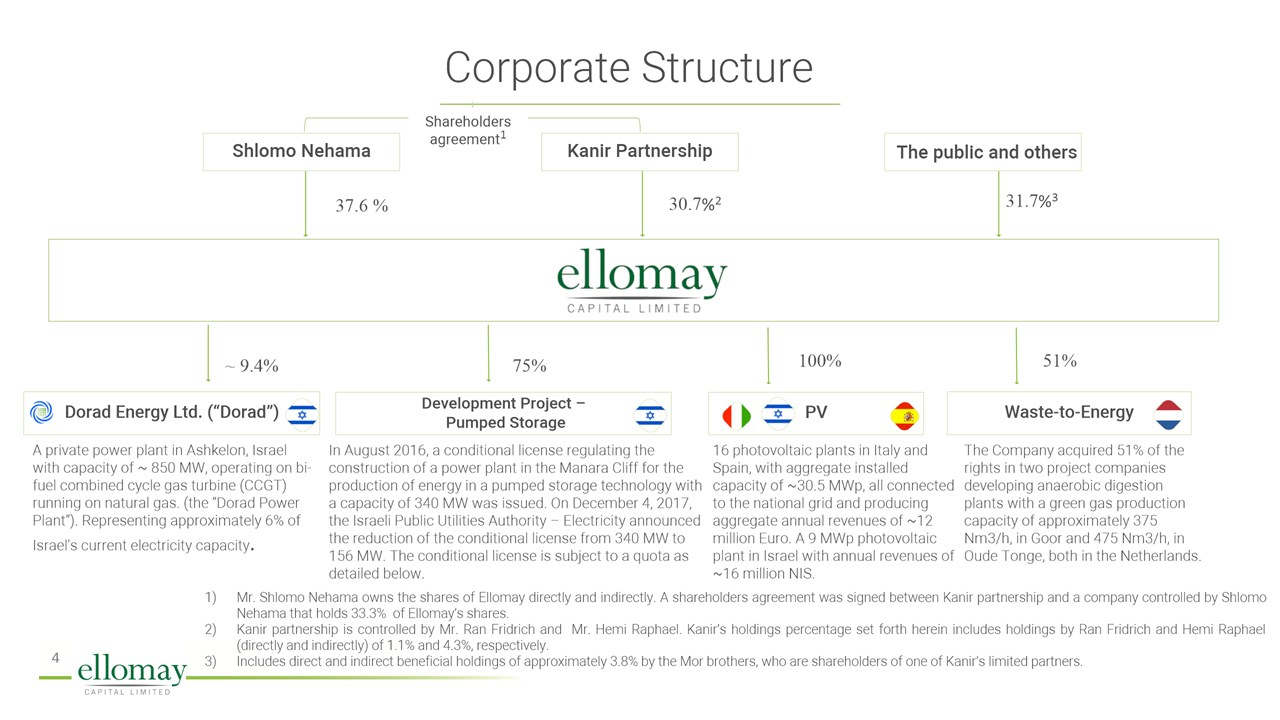
Ellomay is an Israeli based company whose shares are registered with the NYSE American and with the Tel Aviv Stock Exchange under the trading symbol “ELLO”. Since 2009, Ellomay Capital focuses its business in the energy and infrastructure sectors worldwide. Ellomay (formerly Nur Macroprinters Ltd.) previously was a supplier of wide format and super-wide format digital printing systems and related products worldwide, and sold this business to Hewlett-Packard Company during 2008 for more than $100 million.
To date, Ellomay has evaluated numerous opportunities and invested significant funds in the renewable, clean energy and natural resources industries in Israel, Italy and Spain, including:
| · |
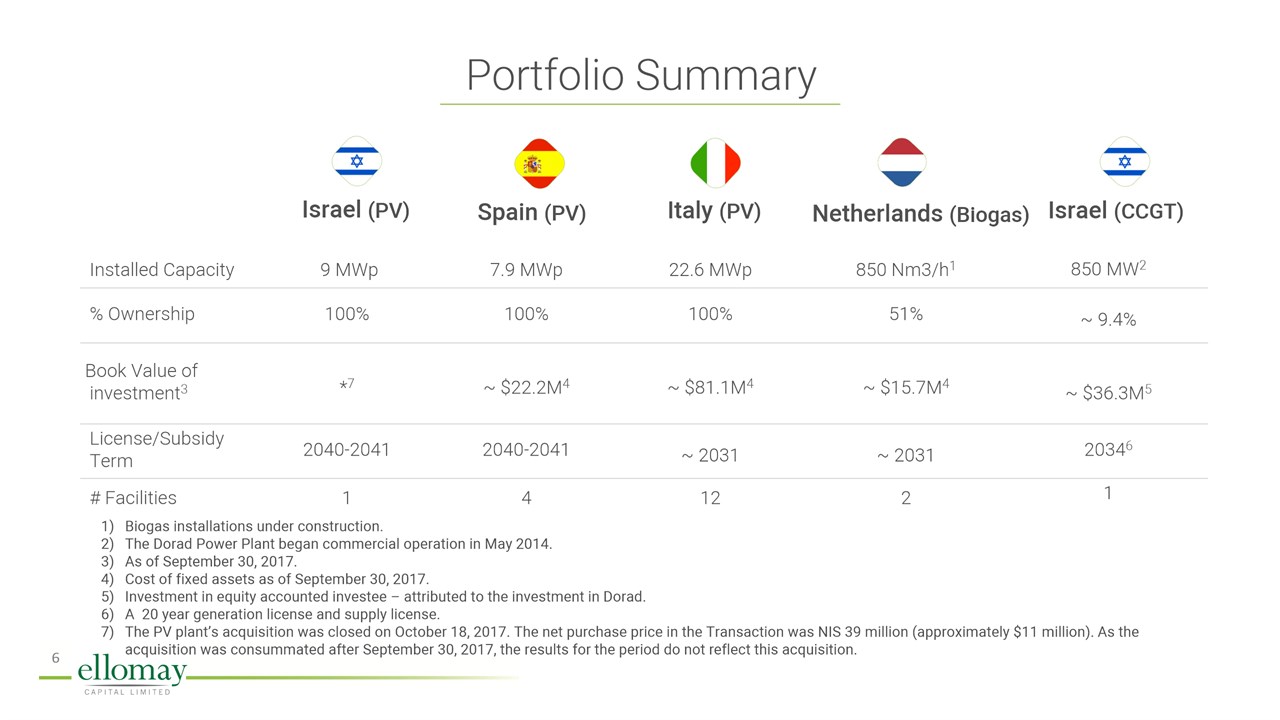
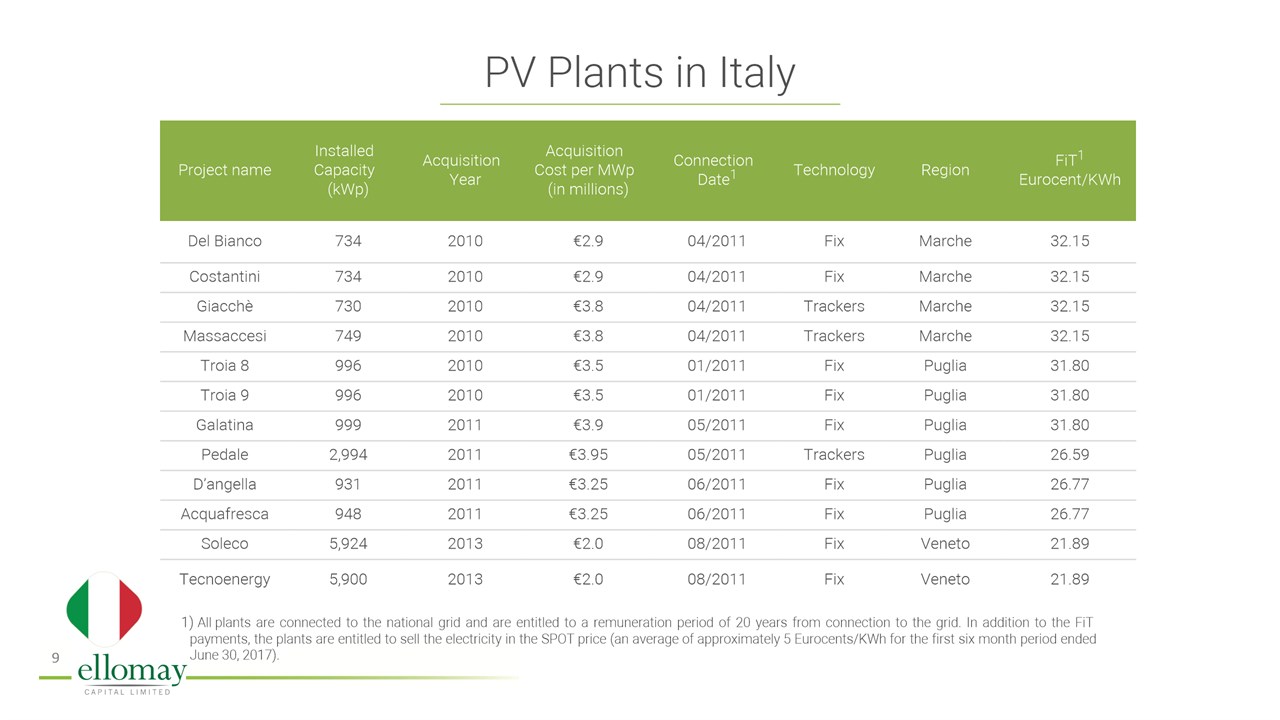
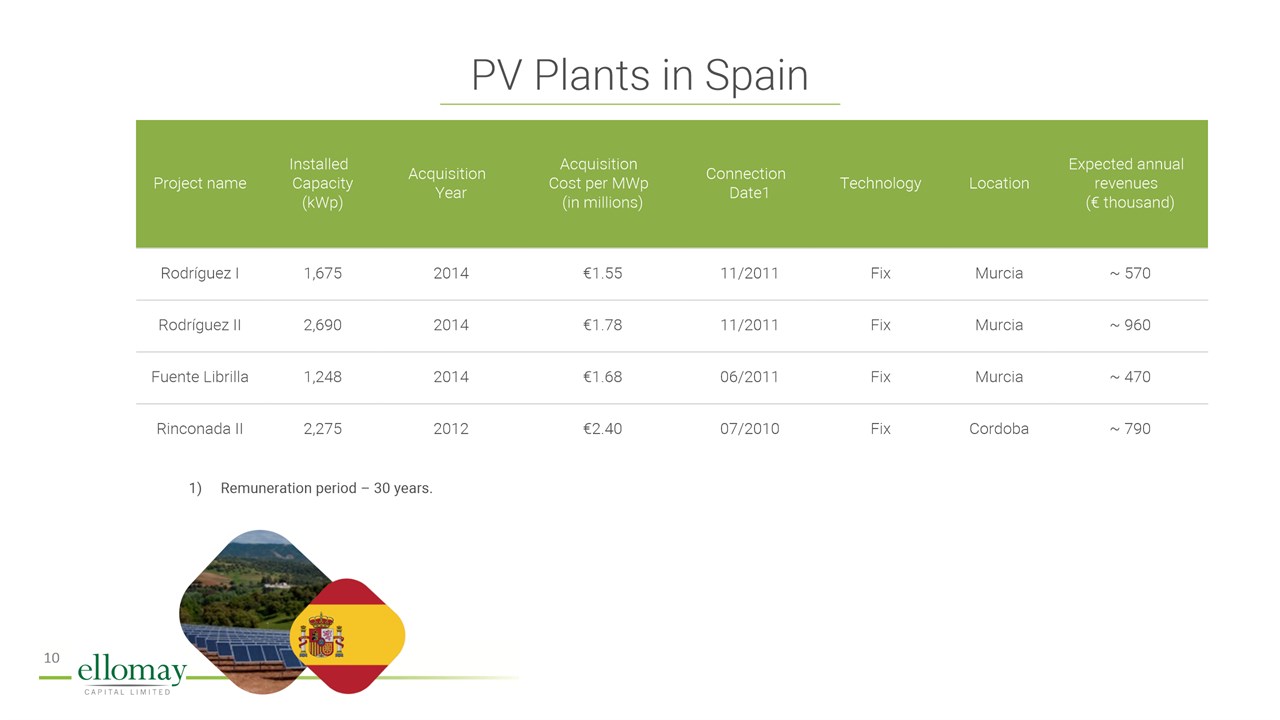
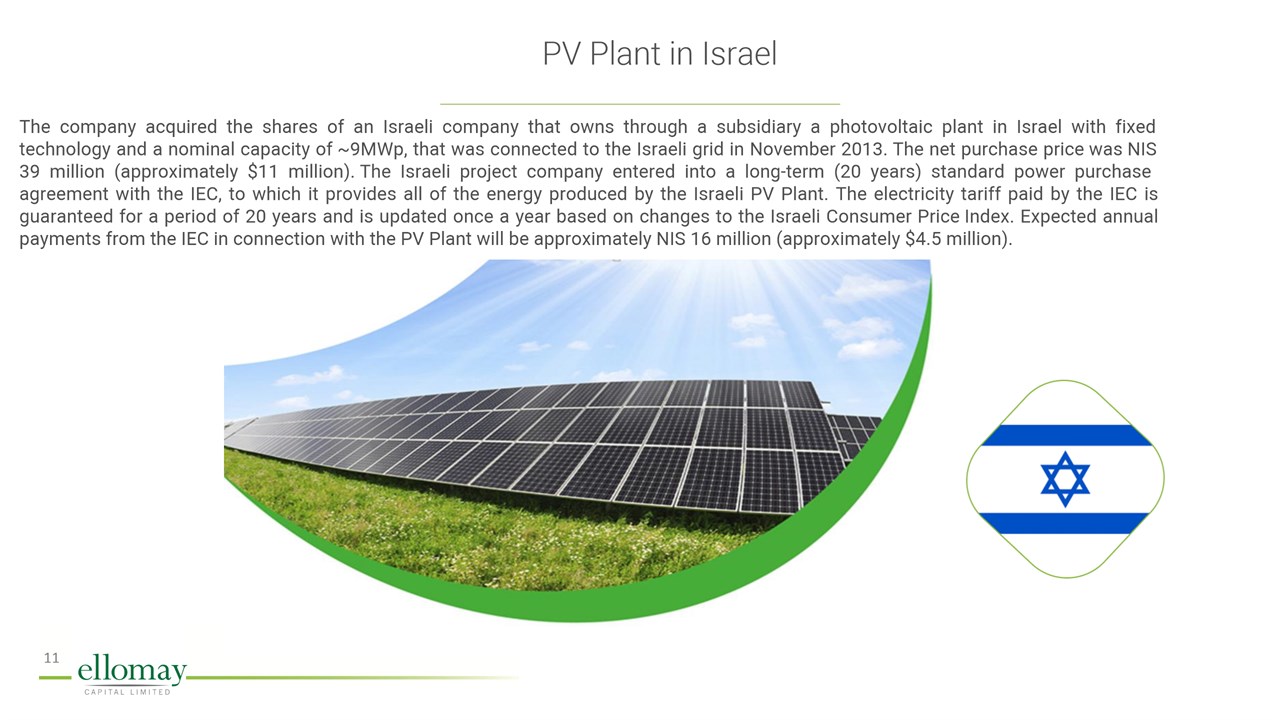
Approximately 22.6MW of photovoltaic power plants in Italy, approximately 7.9MW of photovoltaic power plants in Spain and a photovoltaic power plant of approximately 9 MW in Israel;
|
| · |
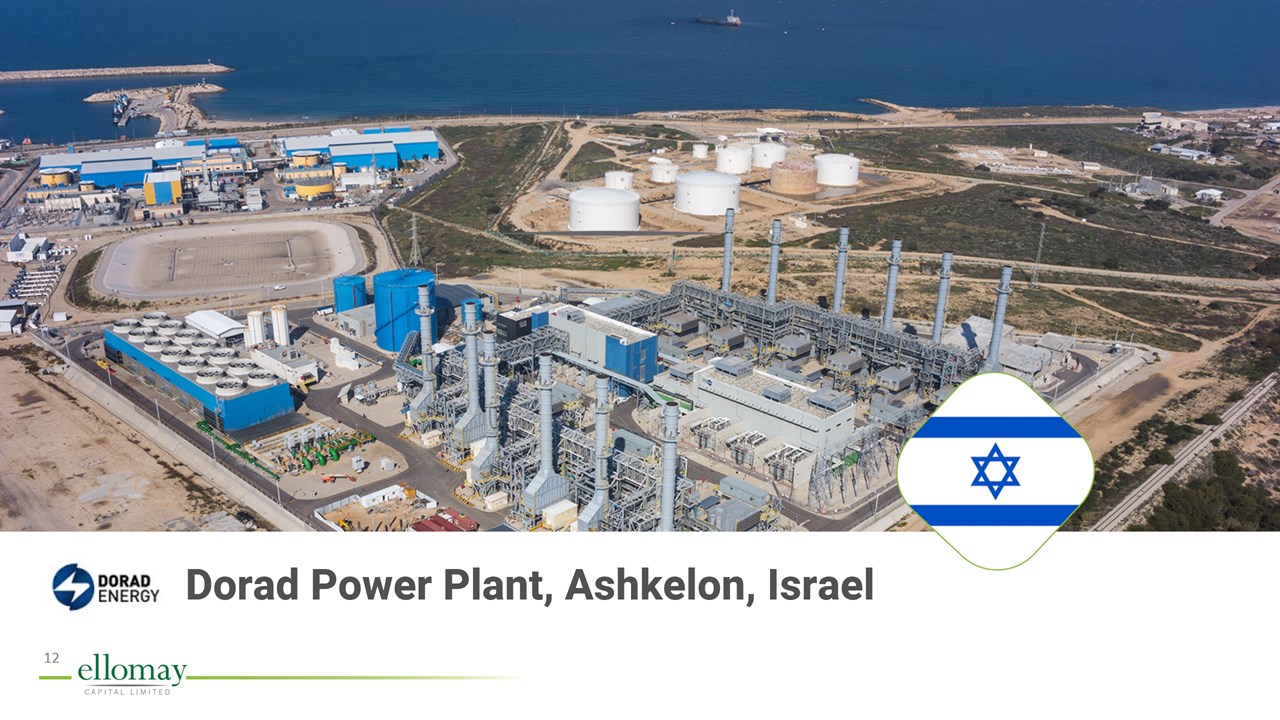
9.375% indirect interest in Dorad Energy Ltd., which owns and operates one of Israel’s largest private power plants with production capacity of approximately 850 MW, representing about 6%-8% of Israel’s total current electricity consumption;
|
| · |
75% of Chashgal Elyon Ltd., Agira Sheuva Electra, L.P. and Ellomay Pumped Storage (2014) Ltd., all of which are involved in a project to construct a 156 MW pumped storage hydro power plant in the Manara Cliff, Israel;
|
| · |
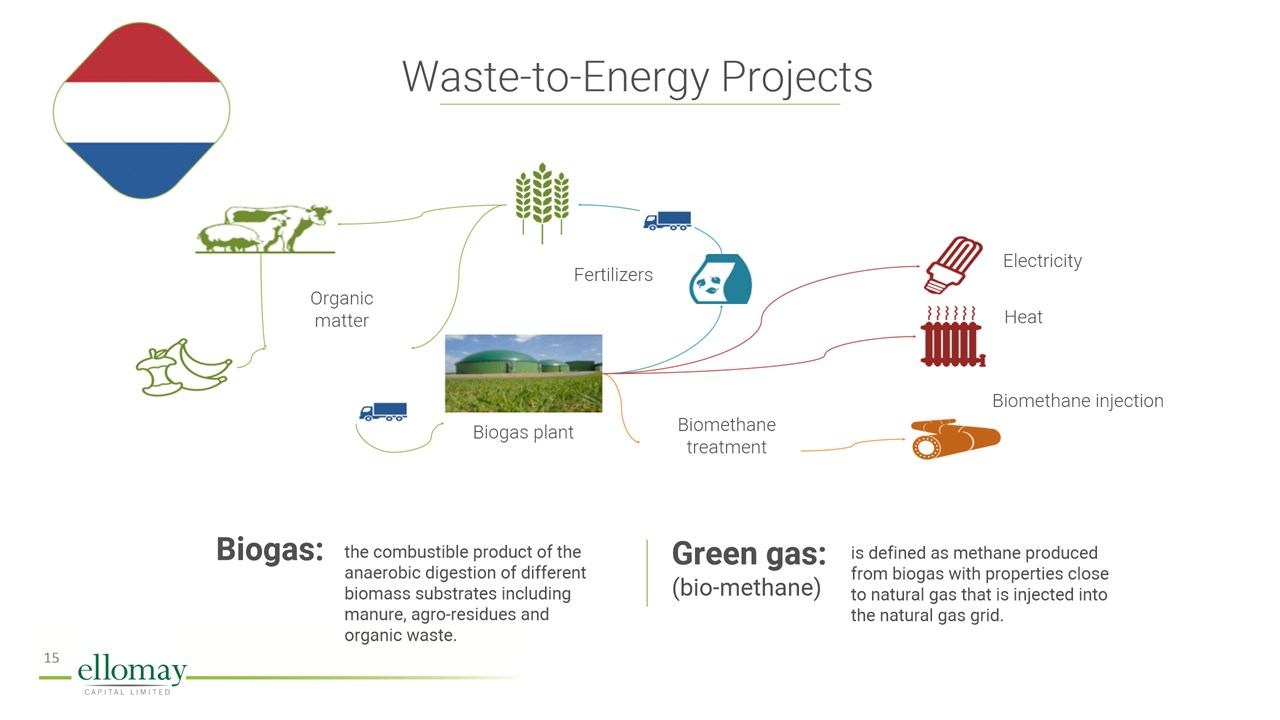
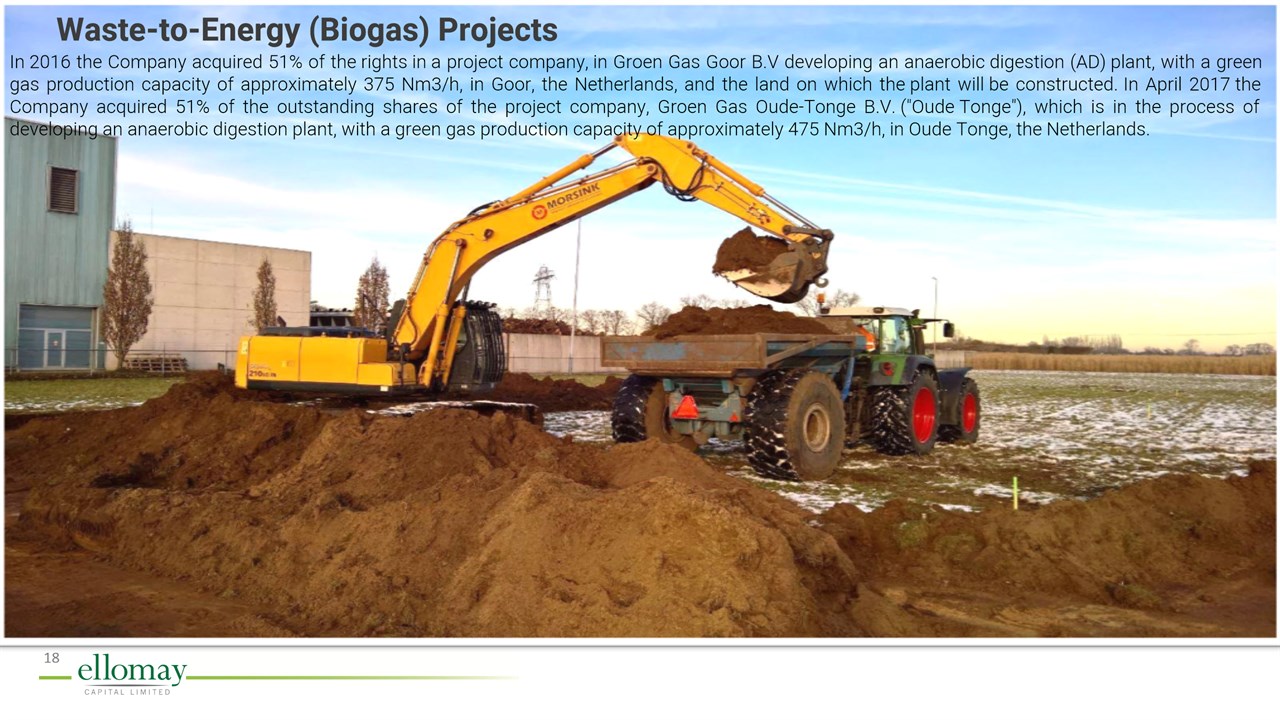
51% of Groen Gas Goor B.V. and of Groen Gas Oude-Tonge B.V., project companies developing anaerobic digestion plants with a green gas production capacity of approximately 375 Nm3/h, in Goor, the Netherlands and 475 Nm3/h, in Oude Tonge, the Netherlands, respectively.
|
Ellomay Capital is controlled by Mr. Shlomo Nehama, Mr. Hemi Raphael and Mr. Ran Fridrich. Mr. Nehama is one of Israel’s prominent businessmen and the former Chairman of Israel’s leading bank, Bank Hapohalim, and Messrs. Raphael and Fridrich both have vast experience in financial and industrial businesses. These controlling shareholders, along with Ellomay’s dedicated professional management, accumulated extensive experience in recognizing suitable business opportunities worldwide. Ellomay believes the expertise of Ellomay’s controlling shareholders and management enables the Company to access the capital markets, as well as assemble global institutional investors and other potential partners. As a result, we believe Ellomay is capable of considering significant and complex transactions, beyond its immediate financial resources.
For more information about Ellomay, visit http://www.ellomay.com.
Information Relating to Forward-Looking Statements
This press release contains forward-looking statements that involve substantial risks and uncertainties, including statements that are based on the current expectations and assumptions of the Company’s management. All statements, other than statements of historical facts, included in this press release regarding the Company’s plans and objectives, expectations and assumptions of management are forward-looking statements. The use of certain words, including the words “estimate,” “project,” “intend,” “expect,” “believe” and similar expressions are intended to identify forward-looking statements within the meaning of the Private Securities Litigation Reform Act of 1995. The Company may not actually achieve the plans, intentions or expectations disclosed in the forward-looking statements and you should not place undue reliance on the Company’s forward-looking statements. Various important factors could cause actual results or events to differ materially from those that may be expressed or implied by the Company’s forward-looking statements, including weather conditions, regulatory changes, changes in the supply and prices of resources required for the operation of our facilities (such as waste and natural gas), changes in demand and technical and other disruptions in the operations or construction of the power plants owned by us. These and other risks and uncertainties associated with the Company’s business are described in greater detail in the filings the Company makes from time to time with Securities and Exchange Commission, including its Annual Report on Form 20-F. The forward-looking statements are made as of this date and the Company does not undertake any obligation to update any forward-looking statements, whether as a result of new information, future events or otherwise.
Contact:
Kalia Weintraub
CFO
Tel: +972 (3) 797-1111
Email: miria@ellomay.com
Ellomay Capital Ltd. and its Subsidiaries
Condensed Consolidated Interim Statements of Financial Position
|
September 30
|
December 31
|
|||||||
|
2017
|
2016
|
|||||||
|
Unaudited
|
Audited
|
|||||||
|
US$ in thousands
|
||||||||
|
Assets
|
||||||||
|
Current assets
|
||||||||
|
Cash and cash equivalents
|
47,212
|
23,650
|
||||||
|
Marketable securities
|
6,490
|
1,023
|
||||||
|
Restricted cash
|
18
|
16
|
||||||
|
Trade and other receivables
|
12,419
|
9,952
|
||||||
|
66,139
|
34,641
|
|||||||
|
Non-current assets
|
||||||||
|
Investment in equity accounted investee
|
34,484
|
30,788
|
||||||
|
Advances on account of investments
|
11,546
|
905
|
||||||
|
Financial assets
|
1,465
|
1,330
|
||||||
|
Fixed assets
|
92,107
|
77,066
|
||||||
|
Restricted cash and deposits
|
2,200
|
5,399
|
||||||
|
Deferred tax
|
2,549
|
2,614
|
||||||
|
Long term receivables
|
2,198
|
3,431
|
||||||
|
146,549
|
121,533
|
|||||||
|
Total assets
|
212,688
|
156,174
|
||||||
|
Liabilities and Equity
|
||||||||
|
Current liabilities
|
||||||||
|
Current maturities of long term loans
|
1,323
|
1,150
|
||||||
|
Debentures
|
5,456
|
4,989
|
||||||
|
Trade payables
|
1,813
|
1,684
|
||||||
|
Other payables
|
4,547
|
3,279
|
||||||
|
13,139
|
11,102
|
|||||||
|
Non-current liabilities
|
||||||||
|
Finance lease obligations
|
4,446
|
4,228
|
||||||
|
Long-term loans
|
27,538
|
17,837
|
||||||
|
Debentures
|
67,891
|
30,548
|
||||||
|
Deferred tax
|
1,241
|
925
|
||||||
|
Other long-term liabilities
|
4,311
|
2,764
|
||||||
|
105,427
|
56,302
|
|||||||
|
Total liabilities
|
118,566
|
67,404
|
||||||
|
Equity
|
||||||||
|
Share capital
|
26,597
|
26,597
|
||||||
|
Share premium
|
77,731
|
77,727
|
||||||
|
Treasury shares
|
(1,999
|
)
|
(1,985
|
)
|
||||
|
Reserves
|
(7,948
|
)
|
(17,024
|
)
|
||||
|
Retained earnings
|
848
|
4,191
|
||||||
|
Total equity attributed to shareholders of the Company
|
95,229
|
89,506
|
||||||
|
Non-Controlling Interest
|
(1,107
|
)
|
(736
|
)
|
||||
|
Total equity
|
94,122
|
88,770
|
||||||
|
Total liabilities and equity
|
212,688
|
156,174
|
||||||
Ellomay Capital Ltd. and its Subsidiaries
Condensed Consolidated Interim Statements of Comprehensive income
|
For the nine months
ended September 30,
|
For the three months
ended September 30
|
|||||||||||||||
|
2017
|
2016
|
2017
|
2016
|
|||||||||||||
|
Unaudited
|
||||||||||||||||
|
US$ in thousands (except per share amounts)
|
||||||||||||||||
|
Revenues
|
11,990
|
10,574
|
4,659
|
4,061
|
||||||||||||
|
Operating expenses
|
(1,843
|
)
|
(1,858
|
)
|
(908
|
)
|
(699
|
)
|
||||||||
|
Depreciation expenses
|
(3,677
|
)
|
(3,654
|
)
|
(1,299
|
)
|
(1,136
|
)
|
||||||||
|
Gross profit
|
6,470
|
5,062
|
2,452
|
2,226
|
||||||||||||
|
Project development costs
|
(1,935
|
)
|
*(1,497
|
)
|
(355
|
)
|
*(784
|
)
|
||||||||
|
General and administrative expenses
|
(2,076
|
)
|
*(1,862
|
)
|
(763
|
)
|
*(735
|
)
|
||||||||
|
Share of profits of equity accounted investee
|
1,878
|
1,097
|
1,945
|
785
|
||||||||||||
|
Other income, net
|
15
|
85
|
5
|
-
|
||||||||||||
|
Operating Profit
|
4,352
|
2,885
|
3,284
|
1,492
|
||||||||||||
|
Financing income
|
531
|
196
|
1,241
|
32
|
||||||||||||
|
Financing expenses in connection with derivatives, net
|
(3,170
|
)
|
(1,458
|
)
|
(1,448
|
)
|
(434
|
)
|
||||||||
|
Financing expenses
|
(4,181
|
)
|
(3,260
|
)
|
(1,087
|
)
|
(1,365
|
)
|
||||||||
|
Financing expenses, net
|
(6,820
|
)
|
(4,522
|
)
|
(1,294
|
)
|
(1,767
|
)
|
||||||||
|
Profit (Loss) before taxes on income
|
(2,468
|
)
|
(1,637
|
)
|
1,990
|
(275
|
)
|
|||||||||
|
Taxes on income
|
(1,171
|
)
|
(568
|
)
|
(446
|
)
|
(259
|
)
|
||||||||
|
Profit (Loss) for the period
|
(3,639
|
)
|
(2,205
|
)
|
1,544
|
(534
|
)
|
|||||||||
|
Profit (Loss) attributable to:
|
||||||||||||||||
|
Shareholders of the Company
|
(3,343
|
)
|
(1,910
|
)
|
1,491
|
(434
|
)
|
|||||||||
|
Non-controlling interests
|
(296
|
)
|
(295
|
)
|
53
|
(100
|
)
|
|||||||||
|
Profit (Loss) for the period
|
(3,639
|
)
|
(2,205
|
)
|
1,544
|
(534
|
)
|
|||||||||
|
Other comprehensive income (loss)
|
||||||||||||||||
|
Items that are or may be reclassified to profit or loss:
|
||||||||||||||||
|
Effective portion of change in fair value of cash flow hedges
|
(372
|
)
|
-
|
(246
|
)
|
-
|
||||||||||
|
Net change in fair value of cash flow hedges transferred to profit or loss
|
1,602
|
-
|
984
|
-
|
||||||||||||
|
Foreign currency translation adjustments
|
1,651
|
(699
|
)
|
(168
|
)
|
(432
|
)
|
|||||||||
|
Items that would not be reclassified to profit or loss:
|
||||||||||||||||
|
Presentation currency translation adjustments
|
6,195
|
3,164
|
1,733
|
1,146
|
||||||||||||
|
Presentation currency translation adjustments attributable to Non-controlling interests
|
(75
|
)
|
-
|
(75
|
)
|
-
|
||||||||||
|
Total other comprehensive income for the period
|
9,001
|
2,465
|
2,228
|
714
|
||||||||||||
|
Total comprehensive income
|
5,362
|
260
|
3,772
|
180
|
||||||||||||
|
Basic net profit (loss) per share
|
(0.31
|
)
|
(0.18
|
)
|
0.14
|
(0.04
|
)
|
|||||||||
|
Diluted net profit (loss) per share
|
(0.31
|
)
|
(0.18
|
)
|
0.14
|
(0.04
|
)
|
|||||||||
___________________
* During the nine and three month periods ended September 30, 2017, the Company changed the income statement classification of expenses related to project development from general and administrative expenses to project development costs to reflect more appropriately their nature and the way in which economic benefits are expected to be derived from the use of such costs. Comparative amounts were reclassified for consistency.
Ellomay Capital Ltd. and its Subsidiaries
Condensed Consolidated Interim Statements of Changes in Equity
| Attributable to owners of the Company | ||||||||||||||||||||||||||||||||||||||||
|
Translation
|
||||||||||||||||||||||||||||||||||||||||
|
reserve
|
Presentation
|
|||||||||||||||||||||||||||||||||||||||
|
from
|
currency
|
Non-
|
||||||||||||||||||||||||||||||||||||||
|
Share
|
Share
|
Retained
|
Treasury
|
foreign
|
Hedging
|
translation
|
controlling
|
Total
|
||||||||||||||||||||||||||||||||
|
capital
|
premium
|
earnings
|
shares
|
operations
|
Reserve
|
reserve
|
Total
|
interests
|
Equity
|
|||||||||||||||||||||||||||||||
|
Unaudited
|
||||||||||||||||||||||||||||||||||||||||
|
US$ in thousands
|
||||||||||||||||||||||||||||||||||||||||
|
For the nine months ended
|
||||||||||||||||||||||||||||||||||||||||
|
September 30, 2017
|
||||||||||||||||||||||||||||||||||||||||
|
Balance as at
|
||||||||||||||||||||||||||||||||||||||||
|
January 1, 2017
|
26,597
|
77,727
|
4,191
|
(1,985
|
)
|
547
|
-
|
(17,571
|
)
|
89,506
|
(736
|
)
|
88,770
|
|||||||||||||||||||||||||||
|
Loss for the period
|
-
|
-
|
(3,343
|
)
|
-
|
-
|
-
|
-
|
(3,343
|
)
|
(296
|
)
|
(3,639
|
)
|
||||||||||||||||||||||||||
|
Other comprehensive income
|
-
|
-
|
-
|
-
|
1,651
|
1,230
|
6,195
|
9,076
|
(75
|
)
|
9,001
|
|||||||||||||||||||||||||||||
|
Total comprehensive income (loss)
|
-
|
-
|
(3,343
|
)
|
-
|
1,651
|
1,230
|
6,195
|
5,733
|
(371
|
)
|
5,362
|
||||||||||||||||||||||||||||
|
Transactions with owners of the Company, recognized directly in equity:
|
||||||||||||||||||||||||||||||||||||||||
|
Share-based payments
|
-
|
4
|
-
|
-
|
-
|
-
|
-
|
4
|
-
|
4
|
||||||||||||||||||||||||||||||
|
Own shares acquired
|
-
|
-
|
-
|
(14
|
)
|
-
|
-
|
-
|
(14
|
)
|
-
|
(14
|
)
|
|||||||||||||||||||||||||||
|
Balance as at
|
||||||||||||||||||||||||||||||||||||||||
|
September 30, 2017
|
26,597
|
77,731
|
848
|
(1,999
|
)
|
2,198
|
1,230
|
(11,376
|
)
|
95,229
|
(1,107
|
)
|
94,122
|
|||||||||||||||||||||||||||
| Attributable to owners of the Company | ||||||||||||||||||||||||||||||||||||||||
|
Translation
|
||||||||||||||||||||||||||||||||||||||||
|
reserve
|
Presentation
|
|||||||||||||||||||||||||||||||||||||||
|
from
|
currency
|
Non-
|
||||||||||||||||||||||||||||||||||||||
|
Share
|
Share
|
Retained
|
Treasury
|
foreign
|
Hedging
|
translation
|
controlling
|
Total
|
||||||||||||||||||||||||||||||||
|
capital
|
premium
|
earnings
|
shares
|
operations
|
Reserve
|
reserve
|
Total
|
interests
|
Equity
|
|||||||||||||||||||||||||||||||
|
Unaudited
|
||||||||||||||||||||||||||||||||||||||||
|
US$ in thousands
|
||||||||||||||||||||||||||||||||||||||||
|
For the three months ended
|
||||||||||||||||||||||||||||||||||||||||
|
September 30, 2017
|
||||||||||||||||||||||||||||||||||||||||
|
Balance as at
|
||||||||||||||||||||||||||||||||||||||||
|
June 30, 2017
|
26,597
|
77,729
|
(643
|
)
|
(1,999
|
)
|
2,366
|
492
|
(13,109
|
)
|
91,433
|
(1,085
|
)
|
90,348
|
||||||||||||||||||||||||||
|
Loss for the period
|
-
|
-
|
1,491
|
-
|
-
|
-
|
-
|
1,491
|
53
|
1,544
|
||||||||||||||||||||||||||||||
|
Other comprehensive income (loss)
|
-
|
-
|
-
|
-
|
(168
|
)
|
738
|
1,733
|
2,303
|
(75
|
)
|
2,228
|
||||||||||||||||||||||||||||
|
Total comprehensive income (loss)
|
-
|
-
|
1,491
|
-
|
(168
|
)
|
738
|
1,733
|
3,794
|
(22
|
)
|
3,772
|
||||||||||||||||||||||||||||
|
Transactions with owners of the Company, recognized directly in equity:
|
||||||||||||||||||||||||||||||||||||||||
|
Share-based payments
|
-
|
2
|
-
|
-
|
-
|
-
|
-
|
2
|
-
|
2
|
||||||||||||||||||||||||||||||
|
Balance as at
|
||||||||||||||||||||||||||||||||||||||||
|
September 30, 2017
|
26,597
|
77,731
|
848
|
(1,999
|
)
|
2,198
|
1,230
|
(11,376
|
)
|
95,229
|
(1,107
|
)
|
94,122
|
|||||||||||||||||||||||||||
Ellomay Capital Ltd. and its Subsidiaries
Condensed Consolidated Interim Statements of Changes in Equity (cont’d)
|
Non- controlling
|
Total
|
|||||||||||||||||||||||||||||||||||
| Attributable to owners of the Company |
interests
|
Equity
|
||||||||||||||||||||||||||||||||||
|
Translation
|
||||||||||||||||||||||||||||||||||||
|
Reserve
|
Presentation
|
|||||||||||||||||||||||||||||||||||
|
From
|
currency
|
|||||||||||||||||||||||||||||||||||
|
Share
|
Share
|
Retained
|
Treasury
|
Foreign
|
translation
|
|||||||||||||||||||||||||||||||
|
capital
|
premium
|
earnings
|
shares
|
operations
|
reserve
|
Total
|
||||||||||||||||||||||||||||||
|
Unaudited
|
||||||||||||||||||||||||||||||||||||
|
US$ in thousands
|
||||||||||||||||||||||||||||||||||||
|
For the nine months ended
|
||||||||||||||||||||||||||||||||||||
|
September 30, 2016
|
||||||||||||||||||||||||||||||||||||
|
Balance as at
|
||||||||||||||||||||||||||||||||||||
|
January 1, 2016
|
26,597
|
77,723
|
7,200
|
(1,972
|
)
|
814
|
(16,029
|
)
|
94,333
|
(268
|
)
|
94,065
|
||||||||||||||||||||||||
|
Loss for the period
|
-
|
-
|
(1,910
|
)
|
-
|
-
|
-
|
(1,910
|
)
|
(295
|
)
|
(2,205
|
)
|
|||||||||||||||||||||||
|
Other comprehensive income
|
-
|
-
|
-
|
-
|
(699
|
)
|
3,164
|
2,465
|
-
|
2,465
|
||||||||||||||||||||||||||
|
Total comprehensive income
|
-
|
-
|
(1,910
|
)
|
-
|
(699
|
)
|
3,164
|
555
|
(295
|
)
|
260
|
||||||||||||||||||||||||
|
Own shares acquired
|
-
|
-
|
-
|
(11
|
)
|
-
|
-
|
(11
|
)
|
-
|
(11
|
)
|
||||||||||||||||||||||||
|
Cost of share-based payments
|
-
|
1
|
-
|
-
|
-
|
-
|
1
|
-
|
1
|
|||||||||||||||||||||||||||
|
Dividend distribution
|
-
|
-
|
(2,404
|
)
|
-
|
-
|
-
|
(2,404
|
)
|
-
|
(2,404
|
)
|
||||||||||||||||||||||||
|
Balance as at
|
||||||||||||||||||||||||||||||||||||
|
September 30, 2016
|
26,597
|
77,724
|
2,886
|
(1,983
|
)
|
115
|
(12,865
|
)
|
92,474
|
(563
|
)
|
91,911
|
||||||||||||||||||||||||
|
Non- controlling
|
Total
|
|||||||||||||||||||||||||||||||||||
| Attributable to owners of the Company |
interests
|
Equity
|
||||||||||||||||||||||||||||||||||
|
Translation
|
||||||||||||||||||||||||||||||||||||
|
Reserve
|
Presentation
|
|||||||||||||||||||||||||||||||||||
|
From
|
currency
|
|||||||||||||||||||||||||||||||||||
|
Share
|
Share
|
Retained
|
Treasury
|
Foreign
|
translation
|
|||||||||||||||||||||||||||||||
|
capital
|
premium
|
earnings
|
shares
|
operations
|
reserve
|
Total
|
||||||||||||||||||||||||||||||
|
Unaudited
|
||||||||||||||||||||||||||||||||||||
|
US$ in thousands
|
||||||||||||||||||||||||||||||||||||
|
For the three months ended
|
||||||||||||||||||||||||||||||||||||
|
September 30, 2016
|
||||||||||||||||||||||||||||||||||||
|
Balance as at
|
||||||||||||||||||||||||||||||||||||
|
June 30, 2016
|
26,597
|
77,724
|
3,320
|
(1,980
|
)
|
547
|
(14,011
|
)
|
92,197
|
(463
|
)
|
91,734
|
||||||||||||||||||||||||
|
Loss for the period
|
-
|
-
|
(434
|
)
|
-
|
-
|
-
|
(434
|
)
|
(100
|
)
|
(534
|
)
|
|||||||||||||||||||||||
|
Other comprehensive income
|
-
|
-
|
-
|
-
|
(432
|
)
|
1,146
|
714
|
-
|
714
|
||||||||||||||||||||||||||
|
Total comprehensive income
|
-
|
-
|
(434
|
)
|
-
|
(432
|
)
|
1,146
|
280
|
(100
|
)
|
180
|
||||||||||||||||||||||||
|
Own shares acquired
|
-
|
-
|
-
|
(3
|
)
|
-
|
-
|
(3
|
)
|
-
|
(3
|
)
|
||||||||||||||||||||||||
|
Balance as at
|
||||||||||||||||||||||||||||||||||||
|
September 30, 2016
|
26,597
|
77,724
|
2,886
|
(1,983
|
)
|
115
|
(12,865
|
)
|
92,474
|
(563
|
)
|
91,911
|
||||||||||||||||||||||||
Ellomay Capital Ltd. and its Subsidiaries
Condensed Consolidated Interim Statements of Cash Flow
|
For the nine months
ended September 30,
|
For the three months
ended September 30,
|
|||||||||||||||
|
2017
|
2016
|
2017
|
2016
|
|||||||||||||
|
Unaudited
|
||||||||||||||||
|
US$ in thousands
|
||||||||||||||||
|
Cash flows from operating activities
|
||||||||||||||||
|
Loss for the period
|
(3,639
|
)
|
(2,205
|
)
|
1,544
|
(534
|
)
|
|||||||||
|
Adjustments for:
|
||||||||||||||||
|
Financing expenses, net
|
6,820
|
4,522
|
1,294
|
1,767
|
||||||||||||
|
Depreciation
|
3,677
|
3,654
|
1,299
|
1,136
|
||||||||||||
|
Share-based payment
|
4
|
1
|
2
|
-
|
||||||||||||
|
Share of loss (profits) of equity accounted investees
|
(1,878
|
)
|
(1,097
|
)
|
(1,945
|
)
|
(785
|
)
|
||||||||
|
Payment of interest on loan from an equity accounted investee
|
489
|
5,134
|
489
|
5,134
|
||||||||||||
|
Change in trade receivables and other receivables
|
2,521
|
(976
|
)
|
2,555
|
112
|
|||||||||||
|
Change in other assets
|
(1,986
|
)
|
(537
|
)
|
(1,965
|
)
|
(424
|
)
|
||||||||
|
Change in accrued severance pay, net
|
3
|
-
|
2
|
-
|
||||||||||||
|
Change in trade payables
|
104
|
122
|
(27
|
)
|
(2
|
)
|
||||||||||
|
Change in accrued expenses and other payables
|
(1,890
|
)
|
66
|
(360
|
)
|
581
|
||||||||||
|
Income tax expense
|
1,171
|
568
|
446
|
259
|
||||||||||||
|
Interest received
|
400
|
176
|
156
|
32
|
||||||||||||
|
Interest paid
|
(1,916
|
)
|
(1,921
|
)
|
(276
|
)
|
(326
|
)
|
||||||||
|
Net cash from operating activities
|
3,880
|
7,507
|
3,214
|
6,950
|
||||||||||||
|
Cash flows from investing activities
|
||||||||||||||||
|
Acquisition of fixed assets
|
(7,124
|
) |
-
|
(2,673
|
) |
-
|
||||||||||
|
Advances on account of investments
|
(9,815
|
) |
(2,039
|
)
|
-
|
(1,893
|
)
|
|||||||||
|
Investment in equity accounted investee
|
-
|
(803
|
)
|
-
|
-
|
|||||||||||
|
Repayment of loan from an equity accounted investee
|
-
|
2,638
|
-
|
2,638
|
||||||||||||
|
Decrease (increase) in restricted cash, net
|
3,387
|
(812
|
)
|
-
|
(812
|
)
|
||||||||||
|
Proceeds from marketable securities
|
1,468
|
2,011
|
1,468
|
1,003
|
||||||||||||
|
Acquisition of marketable securities
|
(7,017
|
)
|
(1,022
|
)
|
-
|
(1,022
|
)
|
|||||||||
|
Settlement of derivatives, net
|
(2,180
|
) |
-
|
-
|
-
|
|||||||||||
|
Proceeds of Forward contract
|
2,128
|
-
|
2,128
|
-
|
||||||||||||
|
Loans to others
|
(390
|
)
|
-
|
-
|
-
|
|||||||||||
|
Net cash from (used in) investing activities
|
(19,543
|
)
|
(27
|
)
|
923
|
(86
|
)
|
|||||||||
|
Cash flows from financing activities
|
||||||||||||||||
|
Dividend paid
|
-
|
(2,404
|
)
|
-
|
-
|
|||||||||||
|
Repayment of long-term loans and finance lease obligations
|
(1,343
|
)
|
(736
|
)
|
(516
|
)
|
(91
|
)
|
||||||||
|
Proceeds from issuance of Debentures
|
33,707
|
-
|
-
|
-
|
||||||||||||
|
Proceeds from long-term and short term borrowings
|
5,927
|
182
|
-
|
92
|
||||||||||||
|
Repurchase of own shares
|
(14
|
)
|
(11
|
)
|
-
|
(3
|
)
|
|||||||||
|
Net cash from (used in) financing activities
|
38,277
|
(2,969
|
)
|
(516
|
)
|
(2
|
)
|
|||||||||
|
Exchange differences on balance of cash and cash equivalents
|
948
|
456
|
101
|
107
|
||||||||||||
|
Increase in cash and cash equivalents
|
23,562
|
4,967
|
3,722
|
6,969
|
||||||||||||
|
Cash and cash equivalents at the beginning of the period
|
23,650
|
18,717
|
43,490
|
16,715
|
||||||||||||
|
Cash and cash equivalents at the end of the period
|
47,212
|
23,684
|
47,212
|
23,684
|
||||||||||||
Ellomay Capital Ltd. and its Subsidiaries
Reconciliation of Net Profit to EBITDA
|
For the nine months ended
September 30,
|
For the three months ended
September 30,
|
|||||||||||||||
|
2017
|
2016
|
2017
|
2016
|
|||||||||||||
|
Unaudited
|
||||||||||||||||
|
US$ in thousands
|
||||||||||||||||
|
Net income (loss) for the period
|
(3,639
|
)
|
(2,205
|
)
|
1,544
|
(534
|
)
|
|||||||||
|
Financing expenses, net
|
6,820
|
4,522
|
1,294
|
1,767
|
||||||||||||
|
Taxes on income
|
1,171
|
568
|
446
|
259
|
||||||||||||
|
Depreciation
|
3,677
|
3,654
|
1,299
|
1,136
|
||||||||||||
|
EBITDA
|
8,029
|
6,539
|
4,583
|
2,628
|
||||||||||||