מצגת לשוקההון Investor Presentation November 2016
General: The information contained in this presentation is subject to, and must be read in conjunction with, all other publically available information, including our Annual Report on Form 20-F for the year ended December 31, 2015, and other filings that we make from time to time with the SEC. Any person at any time acquiring securities must do so only on the basis of such person’s own judgment as to the merits or the suitability of the securities for its purpose and only based on such information as is contained in such public filings, after having taken all such professional or other advice as it considers necessary or appropriate in the circumstances and not in reliance on the information contained in the presentation. In making this presentation available, we give no advice and make no recommendation to buy, sell or otherwise deal in our shares or in any other securities or investments whatsoever. We do not warrant that the information is either complete or accurate, nor will we bear any liability for any damage or losses that may result from any use of the information.Neither this presentation nor any of the information contained herein constitute an offer to sell or the solicitation of an offer to buy any securities. No offering of securities shall be made in the United States except pursuant to registration under the U.S. Securities Act of 1933, as amended, or an exemption therefrom. No offering of securities shall be made in Israel except pursuant to an effective prospectus under the Israeli Securities Law, 1968 or an exemption from the prospectus requirements under such law. Historical facts and past operating results are not intended to mean that future performances or results for any period will necessarily match or exceed those of any prior year. This presentation and the information contained herein are the sole property of the company and cannot be published, circulated or otherwise used in any way without our express prior written consent.Information Relating to Forward-Looking Statements:This presentation contains forward-looking statements that involve substantial risks and uncertainties. All statements, other than statements of historical facts, included in this presentation regarding our plans and the objectives of management are forward-looking statements. The use of certain words, including the words “estimate,” “project,” “intend,” “expect,” “believe” and similar expressions are intended to identify forward-looking statements within the meaning of the Private Securities Litigation Reform Act of 1995 and the Israeli Securities Law, 1968. We may not actually achieve the plans, intentions or expectations disclosed in our forward-looking statements and you should not place undue reliance on our forward-looking statements. Various important factors could cause actual results or events to differ materially from those that may be expressed or implied by our forward-looking statements. These risks and uncertainties associated with our business are described in greater detail in the filings we make from time to time with SEC, including our Annual Report on Form 20-F. The forward-looking statements are made as of this date and we do not undertake any obligation to update any forward-looking statements, whether as a result of new information, future events or otherwise. Disclaimer
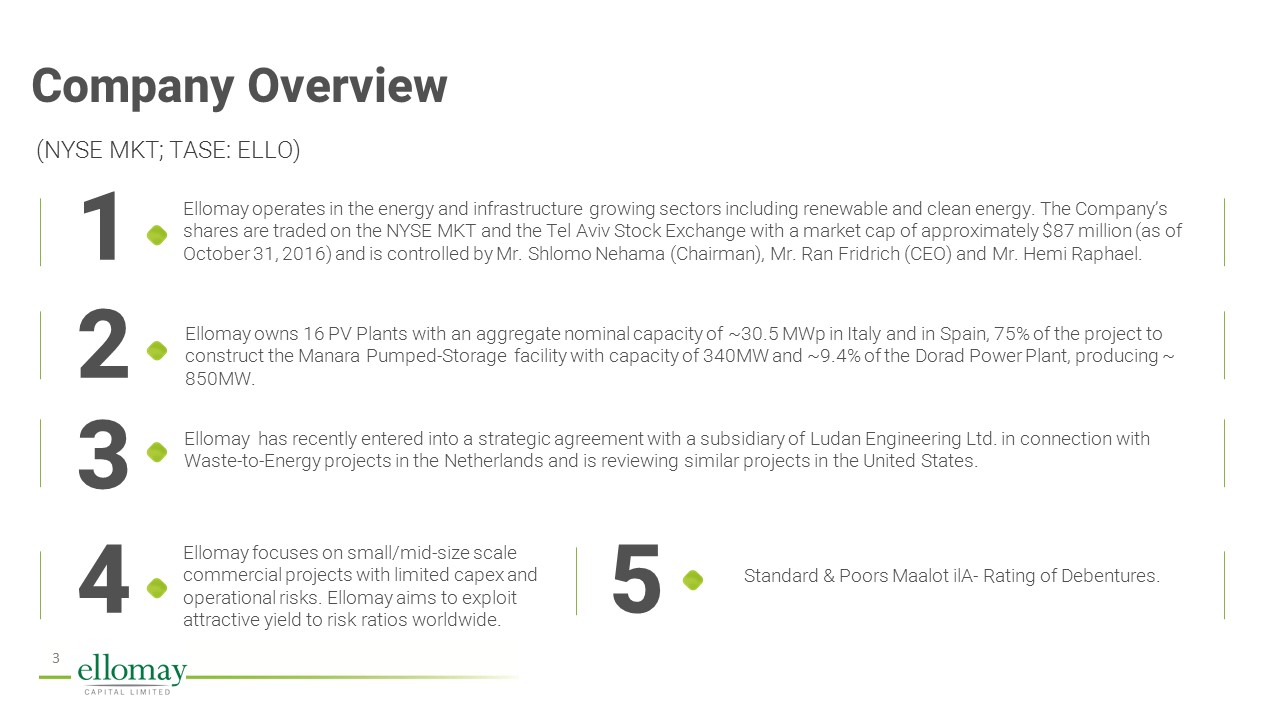
Ellomay operates in the energy and infrastructure growing sectors including renewable and clean energy. The Company’s shares are traded on the NYSE MKT and the Tel Aviv Stock Exchange with a market cap of approximately $87 million (as of October 31, 2016) and is controlled by Mr. Shlomo Nehama (Chairman), Mr. Ran Fridrich (CEO) and Mr. Hemi Raphael. Ellomay owns 16 PV Plants with an aggregate nominal capacity of ~30.5 MWp in Italy and in Spain, 75% of the project to construct the Manara Pumped-Storage facility with capacity of 340MW and ~9.4% of the Dorad Power Plant, producing ~ 850MW. Ellomay has recently entered into a strategic agreement with a subsidiary of Ludan Engineering Ltd. in connection with Waste-to-Energy projects in the Netherlands and is reviewing similar projects in the United States. Ellomay focuses on small/mid-size scale commercial projects with limited capex and operational risks. Ellomay aims to exploit attractive yield to risk ratios worldwide. Standard & Poors Maalot ilA- Rating of Debentures. 1 2 3 4 5 Company Overview (NYSE MKT; TASE: ELLO)
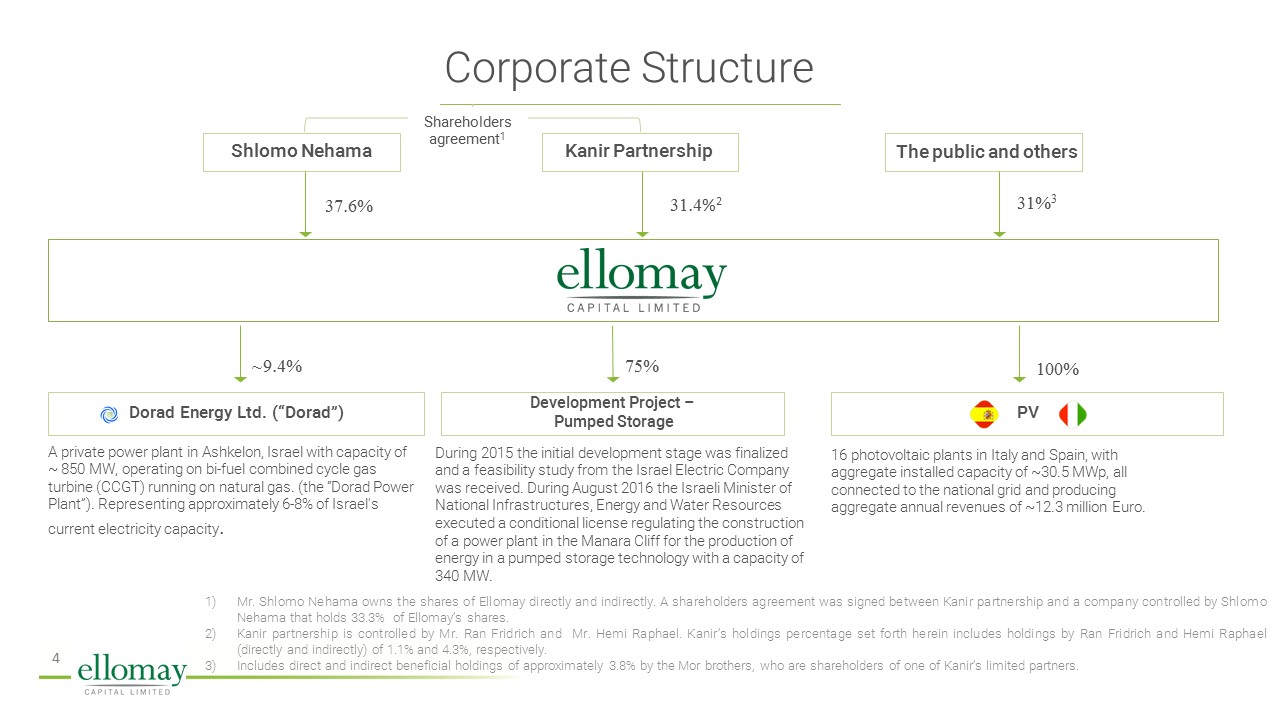
Dorad Energy Ltd. (“Dorad”) PV Kanir Partnership Shlomo Nehama 31.4%2 31%3 9.4%~ 100% 37.6% Development Project – Pumped Storage 75% Corporate Structure The public and others Shareholders agreement1 16 photovoltaic plants in Italy and Spain, with aggregate installed capacity of ~30.5 MWp, all connected to the national grid and producing aggregate annual revenues of ~12.3 million Euro. During 2015 the initial development stage was finalized and a feasibility study from the Israel Electric Company was received. During August 2016 the Israeli Minister of National Infrastructures, Energy and Water Resources executed a conditional license regulating the construction of a power plant in the Manara Cliff for the production of energy in a pumped storage technology with a capacity of 340 MW. A private power plant in Ashkelon, Israel with capacity of ~ 850 MW, operating on bi-fuel combined cycle gas turbine (CCGT) running on natural gas. (the “Dorad Power Plant”). Representing approximately 6-8% of Israel's current electricity capacity. Mr. Shlomo Nehama owns the shares of Ellomay directly and indirectly. A shareholders agreement was signed between Kanir partnership and a company controlled by Shlomo Nehama that holds 33.3% of Ellomay’s shares.Kanir partnership is controlled by Mr. Ran Fridrich and Mr. Hemi Raphael. Kanir’s holdings percentage set forth herein includes holdings by Ran Fridrich and Hemi Raphael (directly and indirectly) of 1.1% and 4.3%, respectively. Includes direct and indirect beneficial holdings of approximately 3.8% by the Mor brothers, who are shareholders of one of Kanir’s limited partners.
Dorad Energy Ltd. (“Dorad”) PV Kanir Partnership Shlomo Nehama 31.4%2 31%3 9.4%~ 100% 37.6% Development Project – Pumped Storage 75% Corporate Structure The public and others Shareholders agreement1 16 photovoltaic plants in Italy and Spain, with aggregate installed capacity of ~30.5 MWp, all connected to the national grid and producing aggregate annual revenues of ~12.3 million Euro. During 2015 the initial development stage was finalized and a feasibility study from the Israel Electric Company was received. During August 2016 the Israeli Minister of National Infrastructures, Energy and Water Resources executed a conditional license regulating the construction of a power plant in the Manara Cliff for the production of energy in a pumped storage technology with a capacity of 340 MW. A private power plant in Ashkelon, Israel with capacity of ~ 850 MW, operating on bi-fuel combined cycle gas turbine (CCGT) running on natural gas. (the “Dorad Power Plant”). Representing approximately 6-8% of Israel's current electricity capacity. Mr. Shlomo Nehama owns the shares of Ellomay directly and indirectly. A shareholders agreement was signed between Kanir partnership and a company controlled by Shlomo Nehama that holds 33.3% of Ellomay’s shares.Kanir partnership is controlled by Mr. Ran Fridrich and Mr. Hemi Raphael. Kanir’s holdings percentage set forth herein includes holdings by Ran Fridrich and Hemi Raphael (directly and indirectly) of 1.1% and 4.3%, respectively. Includes direct and indirect beneficial holdings of approximately 3.8% by the Mor brothers, who are shareholders of one of Kanir’s limited partners.
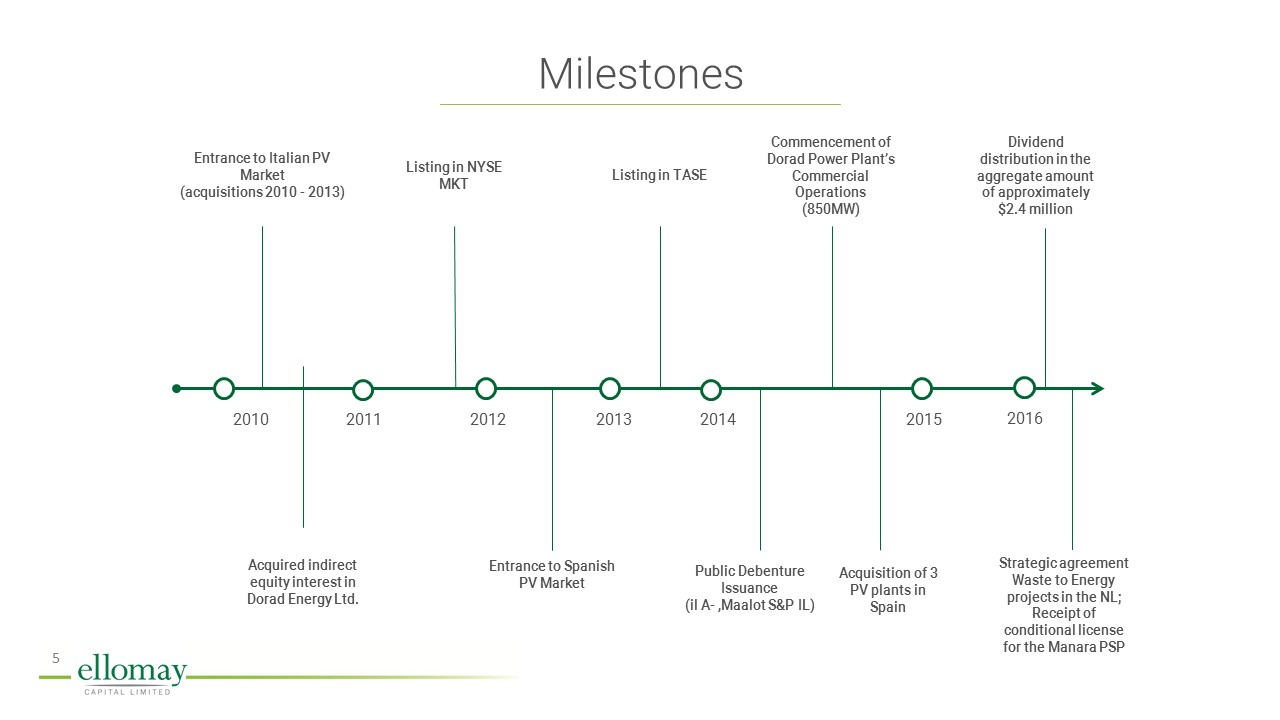
Entrance to Italian PV Market (acquisitions 2010 - 2013) Acquired indirect equity interest in Dorad Energy Ltd. Listing in NYSE MKT Public Debenture Issuance (il A- ,Maalot S&P IL) 2010 2011 2012 2013 2014 2015 Listing in TASE Entrance to Spanish PV Market Commencement of Dorad Power Plant’s Commercial Operations (850MW) Acquisition of 3 PV plants in Spain 2016 Strategic agreement Waste to Energy projects in the NL; Receipt of conditional license for the Manara PSP Dividend distribution in the aggregate amount of approximately $2.4 million Milestones
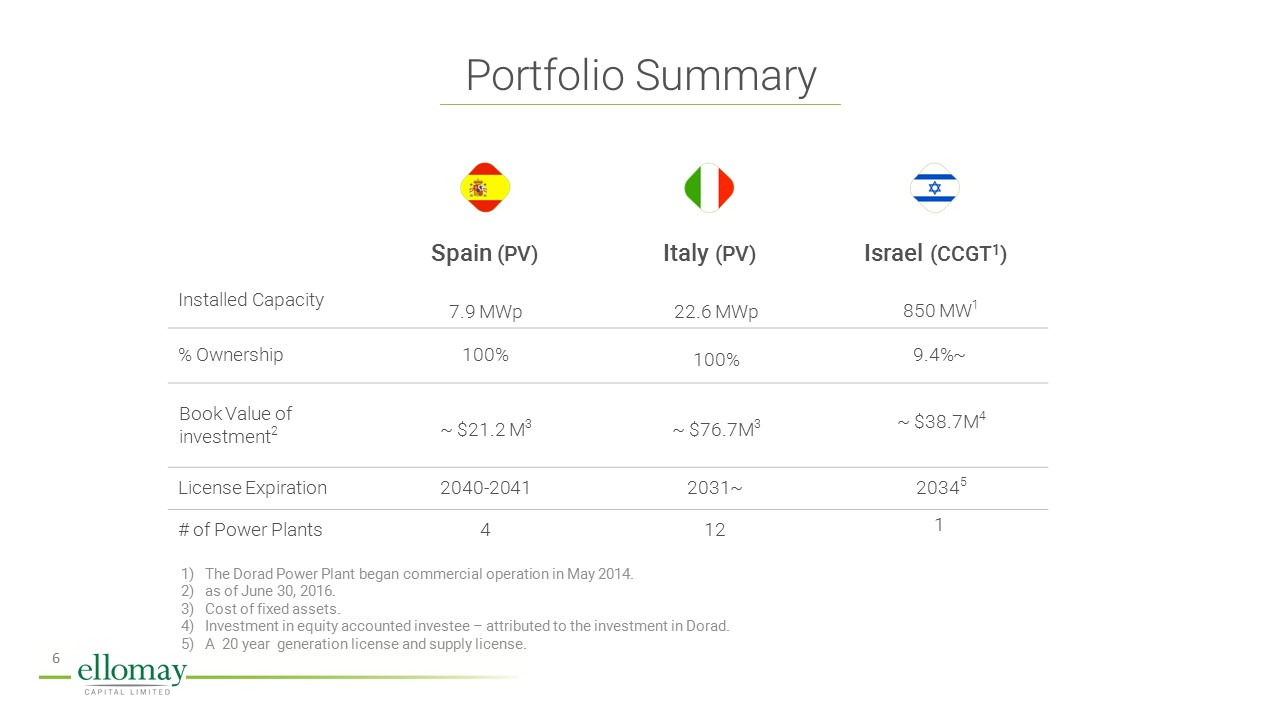
850 MW1 22.6 MWp 7.9 MWp Installed Capacity 9.4%~ 100% 100% % Ownership ~ $38.7M4 ~ $76.7M3 ~ $21.2 M3 Book Value of investment2 20345 2031~ 2040-2041 License Expiration 1 12 4 # of Power Plants Spain (PV) Italy (PV) Israel (CCGT1) Portfolio Summary The Dorad Power Plant began commercial operation in May 2014.as of June 30, 2016.Cost of fixed assets.Investment in equity accounted investee – attributed to the investment in Dorad.A 20 year generation license and supply license.
Photovoltaic Operations: Italy and Spain
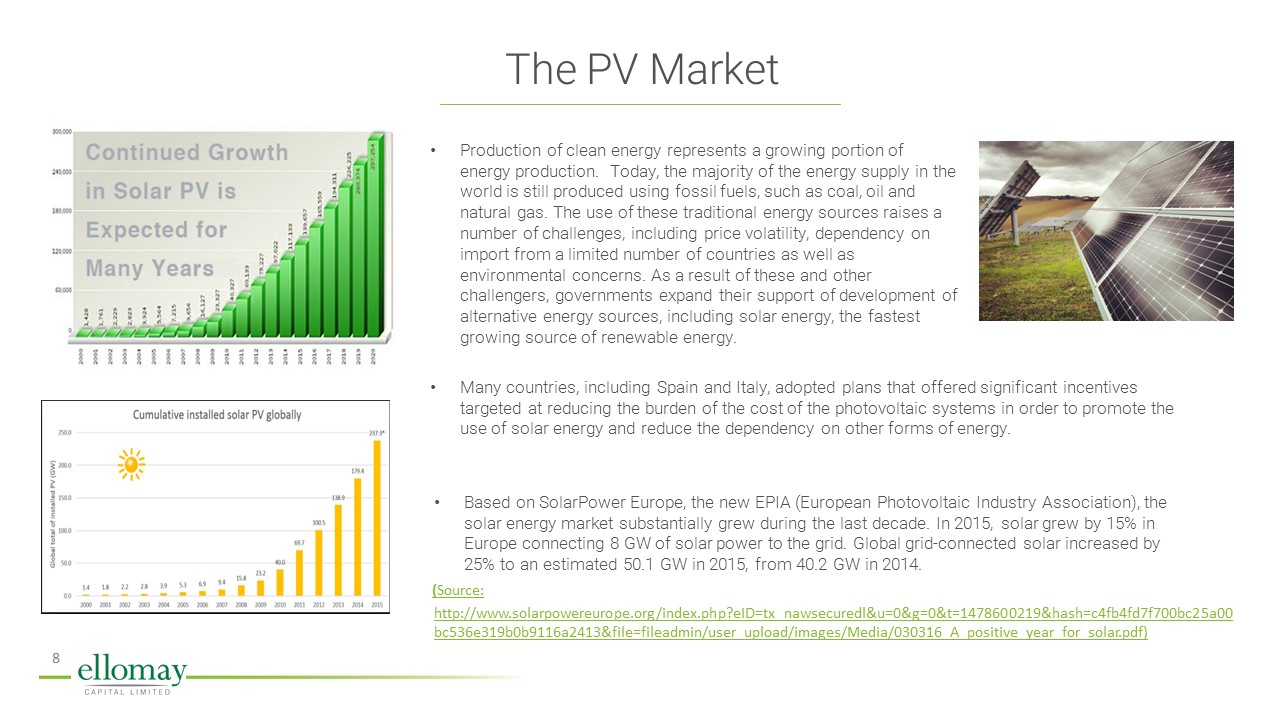
Production of clean energy represents a growing portion of energy production. Today, the majority of the energy supply in the world is still produced using fossil fuels, such as coal, oil and natural gas. The use of these traditional energy sources raises a number of challenges, including price volatility, dependency on import from a limited number of countries as well as environmental concerns. As a result of these and other challengers, governments expand their support of development of alternative energy sources, including solar energy, the fastest growing source of renewable energy. Many countries, including Spain and Italy, adopted plans that offered significant incentives targeted at reducing the burden of the cost of the photovoltaic systems in order to promote the use of solar energy and reduce the dependency on other forms of energy. Based on SolarPower Europe, the new EPIA (European Photovoltaic Industry Association), the solar energy market substantially grew during the last decade. In 2015, solar grew by 15% in Europe connecting 8 GW of solar power to the grid. Global grid-connected solar increased by 25% to an estimated 50.1 GW in 2015, from 40.2 GW in 2014. http://www.solarpowereurope.org/index.php?eID=tx_nawsecuredl&u=0&g=0&t=1478600219&hash=c4fb4fd7f700bc25a00bc536e319b0b9116a2413&file=fileadmin/user_upload/images/Media/030316_A_positive_year_for_solar.pdf) The PV Market (Source:
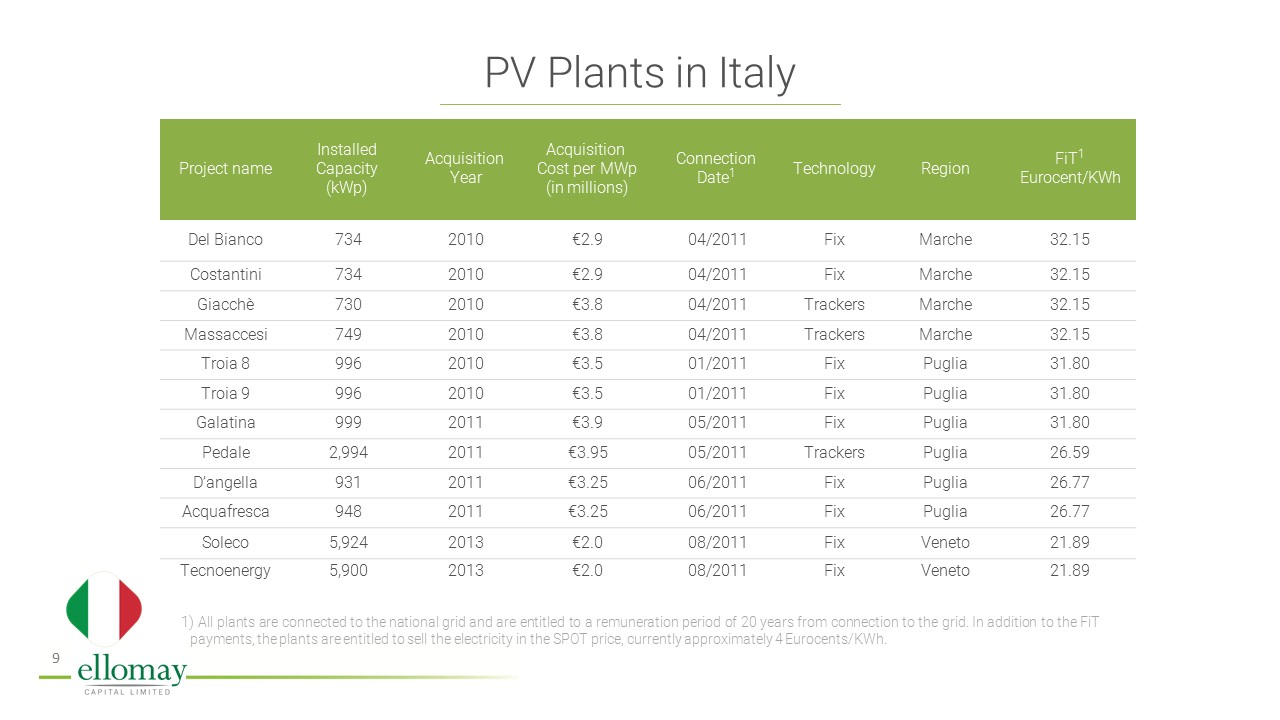
Project name Installed Capacity (kWp) Acquisition Year Acquisition Cost per MWp (in millions) Connection Date1 Technology Region FiT1 Eurocent/KWh Del Bianco 734 2010 €2.9 04/2011 Fix Marche 32.15 Costantini 734 2010 €2.9 04/2011 Fix Marche 32.15 Giacchè 730 2010 €3.8 04/2011 Trackers Marche 32.15 Massaccesi 749 2010 €3.8 04/2011 Trackers Marche 32.15 Troia 8 996 2010 €3.5 01/2011 Fix Puglia 31.80 Troia 9 996 2010 €3.5 01/2011 Fix Puglia 31.80 Galatina 999 2011 €3.9 05/2011 Fix Puglia 31.80 Pedale 2,994 2011 €3.95 05/2011 Trackers Puglia 26.59 D’angella 931 2011 €3.25 06/2011 Fix Puglia 26.77 Acquafresca 948 2011 €3.25 06/2011 Fix Puglia 26.77 Soleco 5,924 2013 €2.0 08/2011 Fix Veneto 21.89 Tecnoenergy 5,900 2013 €2.0 08/2011 Fix Veneto 21.89 PV Plants in Italy All plants are connected to the national grid and are entitled to a remuneration period of 20 years from connection to the grid. In addition to the FiT payments, the plants are entitled to sell the electricity in the SPOT price, currently approximately 4 Eurocents/KWh.
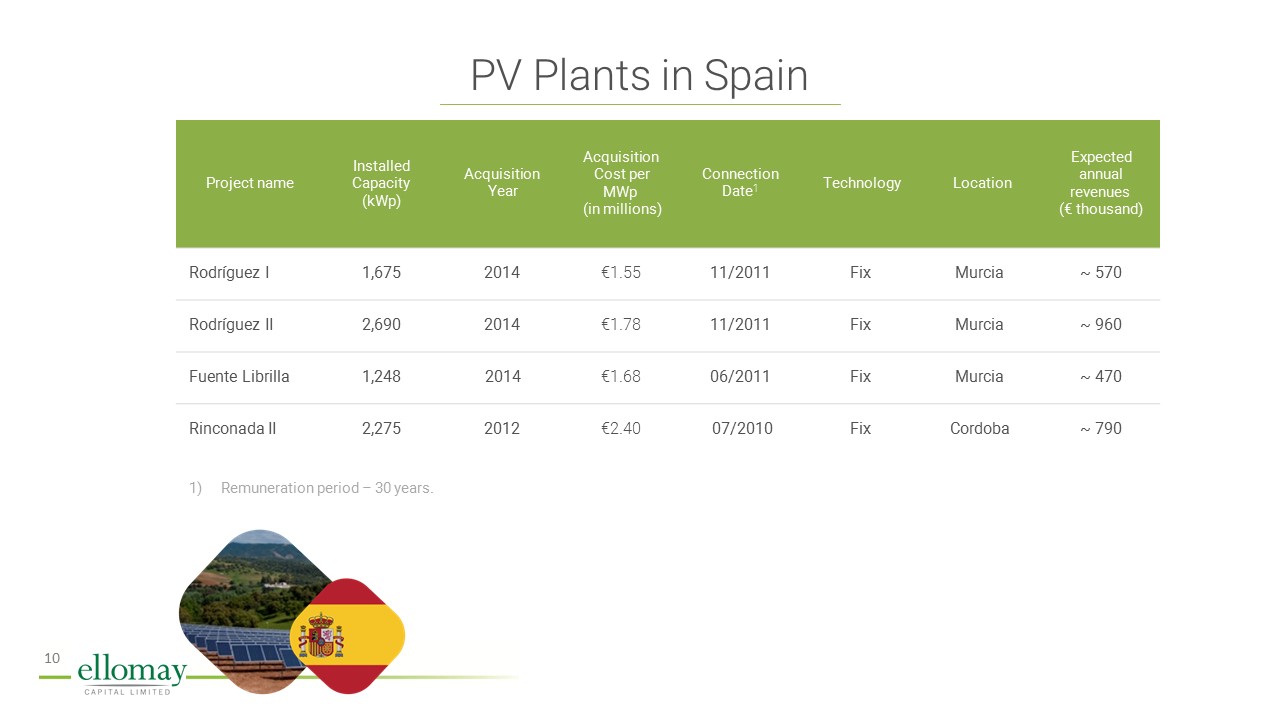
Project name Installed Capacity(kWp) Acquisition Year Acquisition Cost per MWp (in millions) Connection Date1 Technology Location Expected annual revenues (€ thousand) Rodríguez I 1,675 2014 €1.55 11/2011 Fix Murcia ~ 570 Rodríguez II 2,690 2014 €1.78 11/2011 Fix Murcia ~ 960 Fuente Librilla 1,248 2014 €1.68 06/2011 Fix Murcia ~ 470 Rinconada II 2,275 2012 €2.40 07/2010 Fix Cordoba ~ 790 Remuneration period – 30 years. PV Plants in Spain
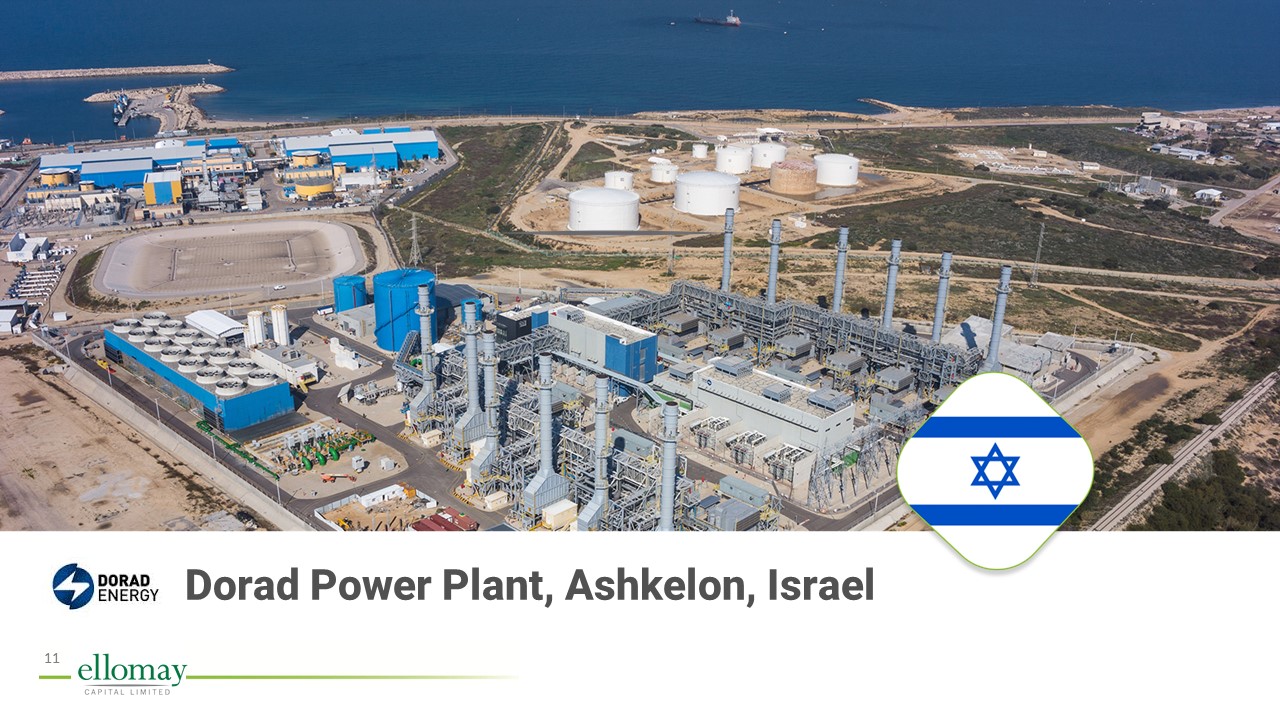
Dorad Power Plant, Ashkelon, Israel
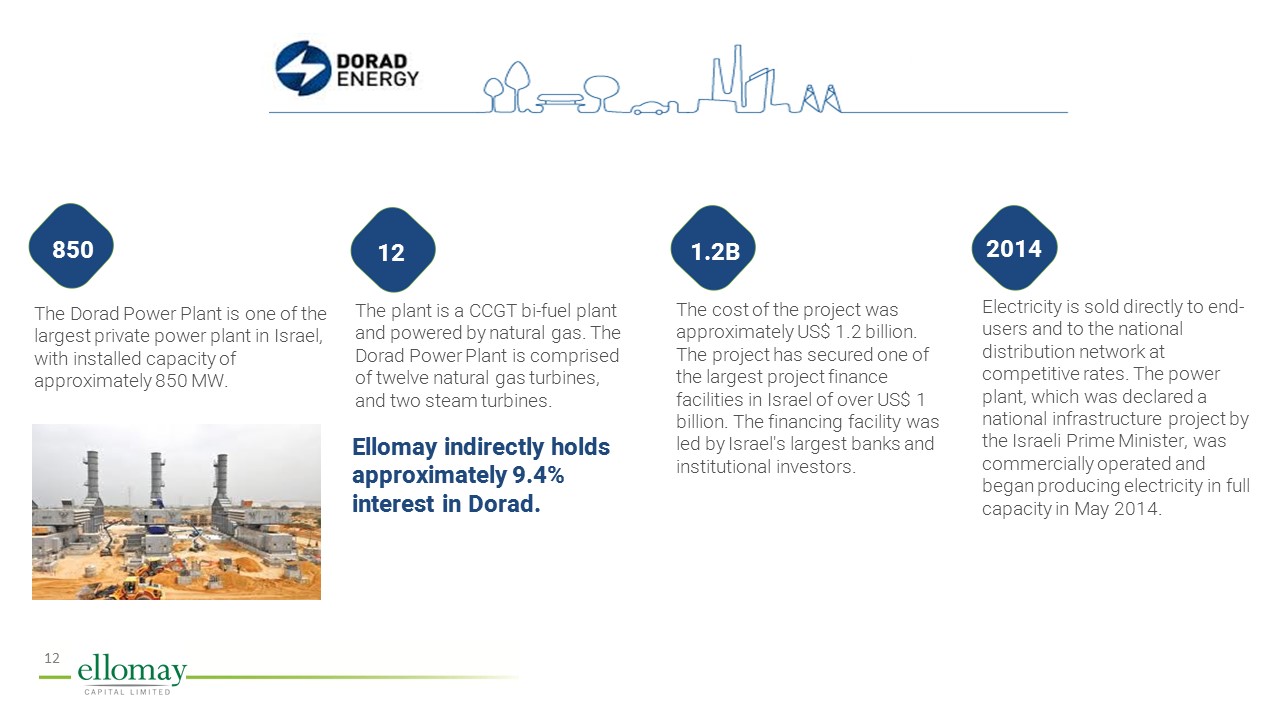
The Dorad Power Plant is one of the largest private power plant in Israel, with installed capacity of approximately 850 MW. The plant is a CCGT bi-fuel plant and powered by natural gas. The Dorad Power Plant is comprised of twelve natural gas turbines, and two steam turbines. Ellomay indirectly holds approximately 9.4% interest in Dorad. The cost of the project was approximately US$ 1.2 billion. The project has secured one of the largest project finance facilities in Israel of over US$ 1 billion. The financing facility was led by Israel's largest banks and institutional investors. Electricity is sold directly to end-users and to the national distribution network at competitive rates. The power plant, which was declared a national infrastructure project by the Israeli Prime Minister, was commercially operated and began producing electricity in full capacity in May 2014. 850 12 1.2B 2014
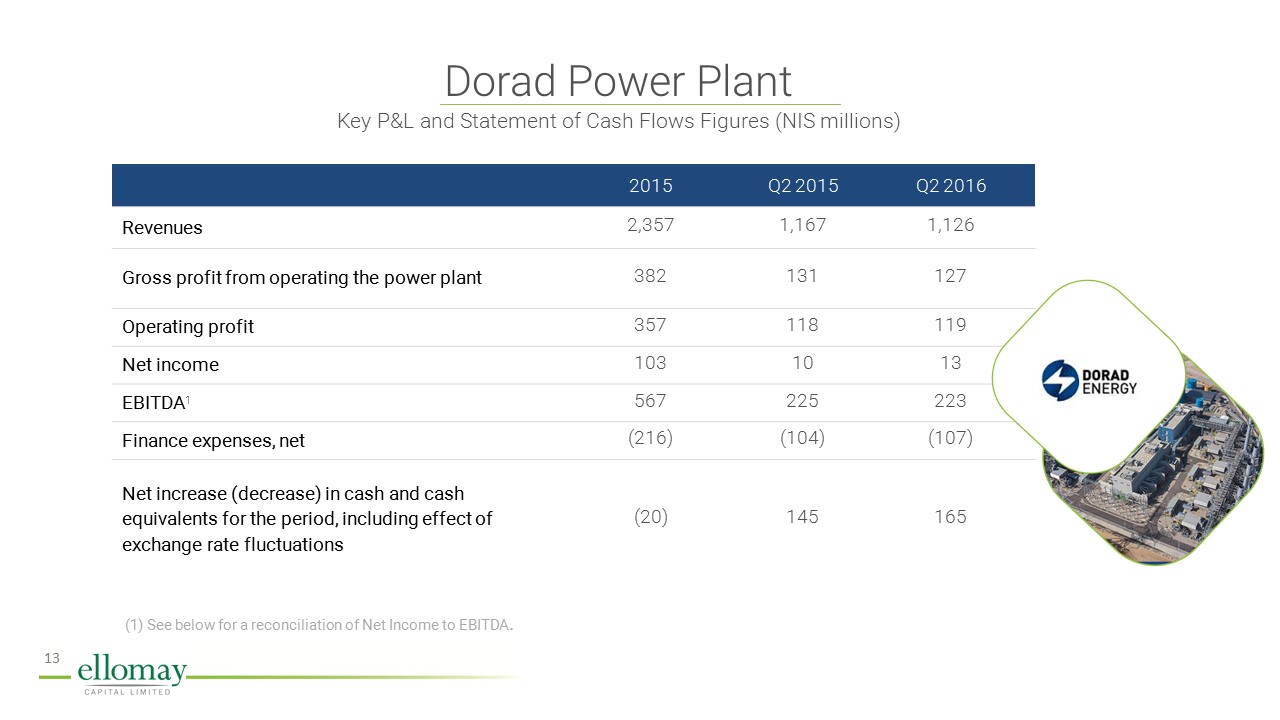
2015 Q2 2015 Q2 2016 Revenues 2,357 1,167 1,126 Gross profit from operating the power plant 382 131 127 Operating profit 357 118 119 Net income 103 10 13 EBITDA1 567 225 223 Finance expenses, net (216) (104) (107) Net increase (decrease) in cash and cash equivalents for the period, including effect of exchange rate fluctuations (20) 145 165 Dorad Power PlantKey P&L and Statement of Cash Flows Figures (NIS millions) (1) See below for a reconciliation of Net Income to EBITDA.
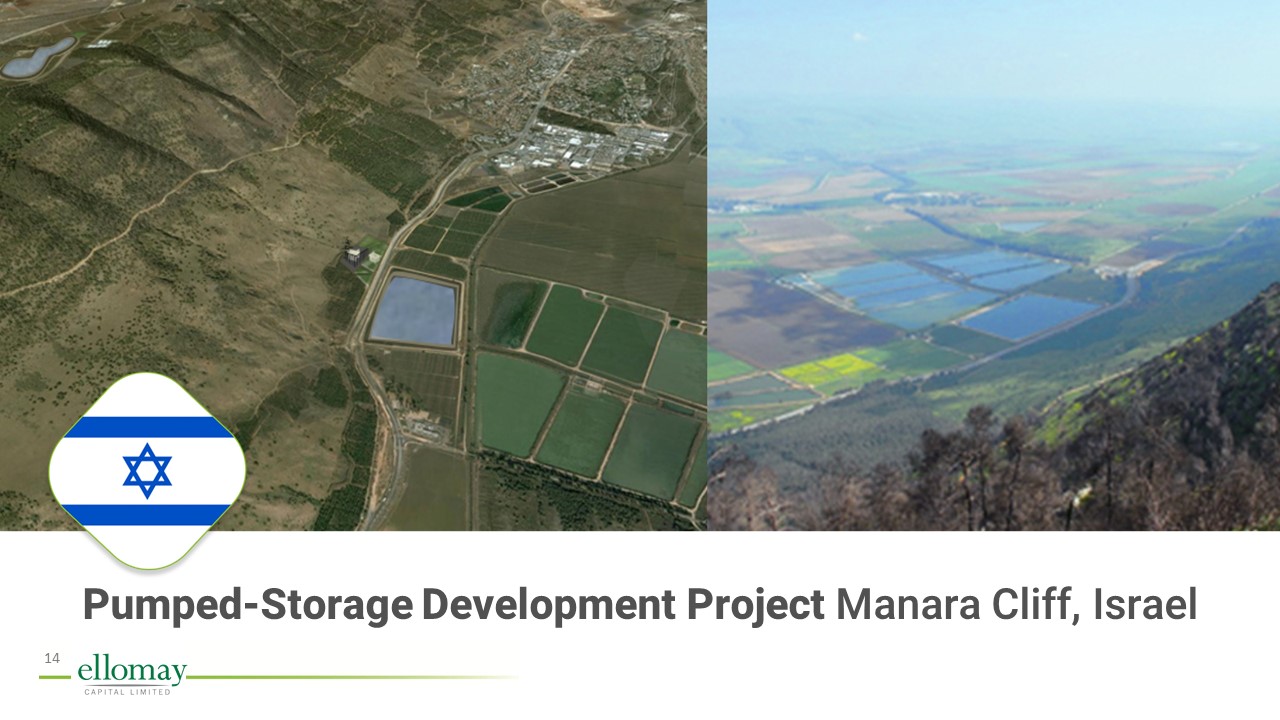
Pumped-Storage Development Project Manara Cliff, Israel
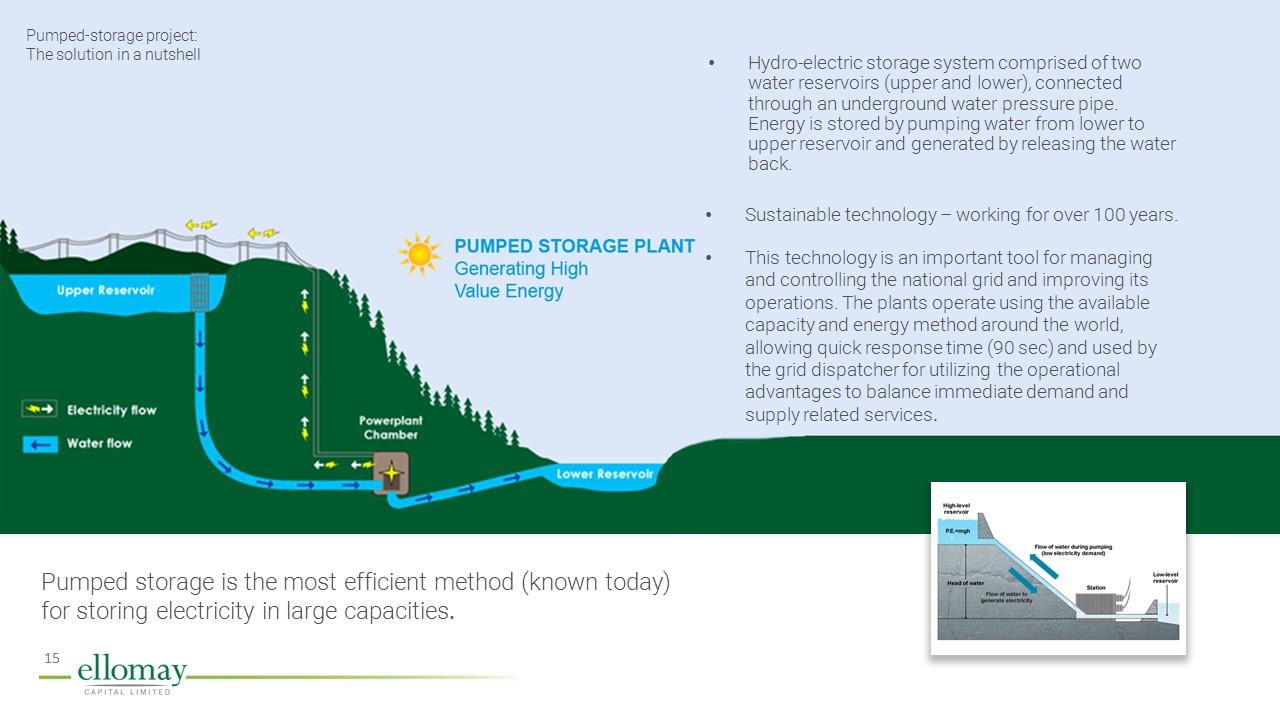
Hydro-electric storage system comprised of two water reservoirs (upper and lower), connected through an underground water pressure pipe. Energy is stored by pumping water from lower to upper reservoir and generated by releasing the water back. Sustainable technology – working for over 100 years. This technology is an important tool for managing and controlling the national grid and improving its operations. The plants operate using the available capacity and energy method around the world, allowing quick response time (90 sec) and used by the grid dispatcher for utilizing the operational advantages to balance immediate demand and supply related services. Pumped storage is the most efficient method (known today) for storing electricity in large capacities. Pumped-storage project:The solution in a nutshell
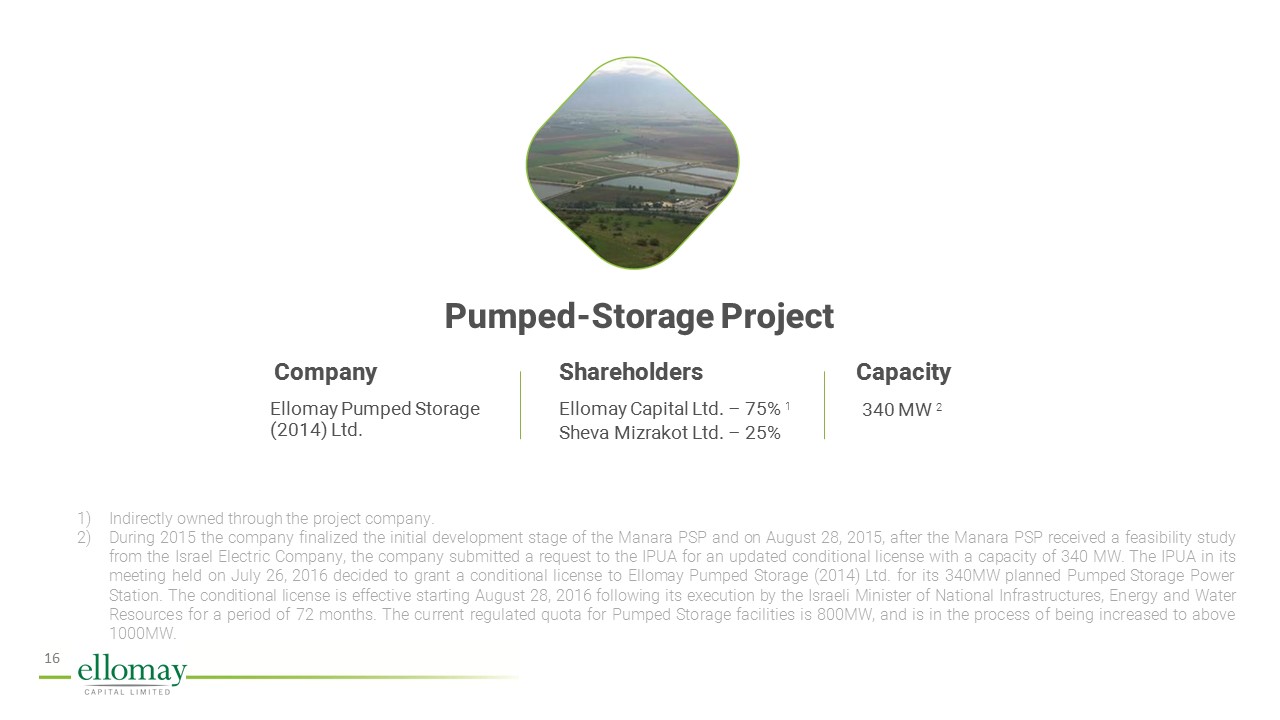
340 MW 2 Ellomay Pumped Storage (2014) Ltd. Ellomay Capital Ltd. – 75% 1Sheva Mizrakot Ltd. – 25% Capacity Shareholders Company Pumped-Storage Project Indirectly owned through the project company.During 2015 the company finalized the initial development stage of the Manara PSP and on August 28, 2015, after the Manara PSP received a feasibility study from the Israel Electric Company, the company submitted a request to the IPUA for an updated conditional license with a capacity of 340 MW. The IPUA in its meeting held on July 26, 2016 decided to grant a conditional license to Ellomay Pumped Storage (2014) Ltd. for its 340MW planned Pumped Storage Power Station. The conditional license is effective starting August 28, 2016 following its execution by the Israeli Minister of National Infrastructures, Energy and Water Resources for a period of 72 months. The current regulated quota for Pumped Storage facilities is 800MW, and is in the process of being increased to above 1000MW.
Expected Projects
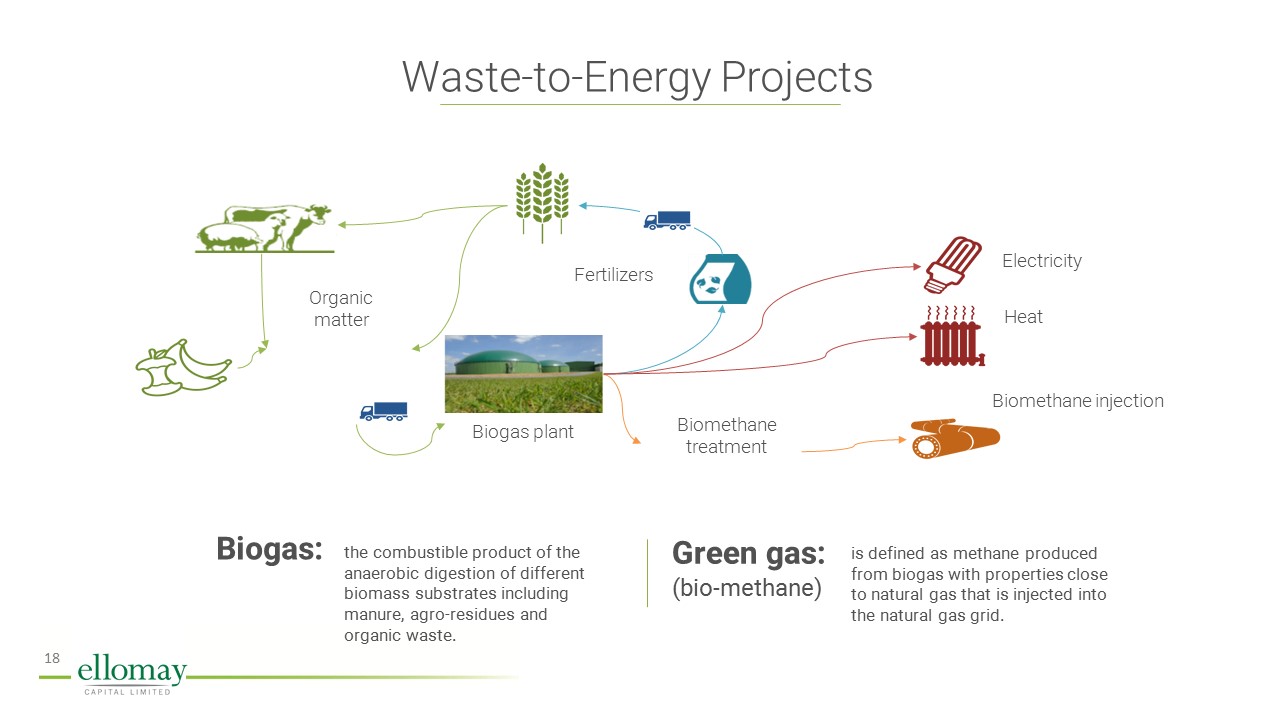
Waste-to-Energy Projects Biomethane injection Biogas plant Electricity Heat Biomethane treatment Organic matter Fertilizers Biogas: the combustible product of the anaerobic digestion of different biomass substrates including manure, agro-residues and organic waste. Green gas:(bio-methane) is defined as methane produced from biogas with properties close to natural gas that is injected into the natural gas grid.
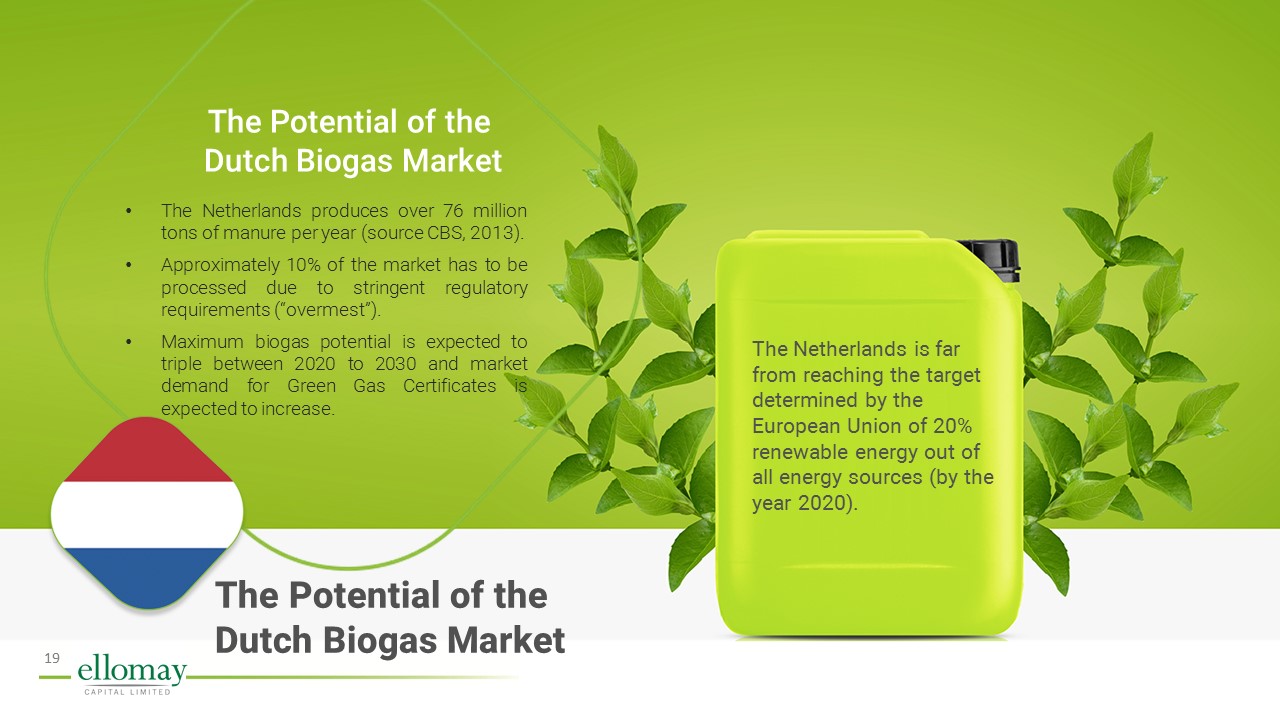
The Potential of the Dutch Biogas Market The Netherlands produces over 76 million tons of manure per year (source CBS, 2013).Approximately 10% of the market has to be processed due to stringent regulatory requirements (“overmest”). Maximum biogas potential is expected to triple between 2020 to 2030 and market demand for Green Gas Certificates is expected to increase. The Netherlands is far from reaching the target determined by the European Union of 20% renewable energy out of all energy sources (by the year 2020). The Potential of theDutch Biogas Market
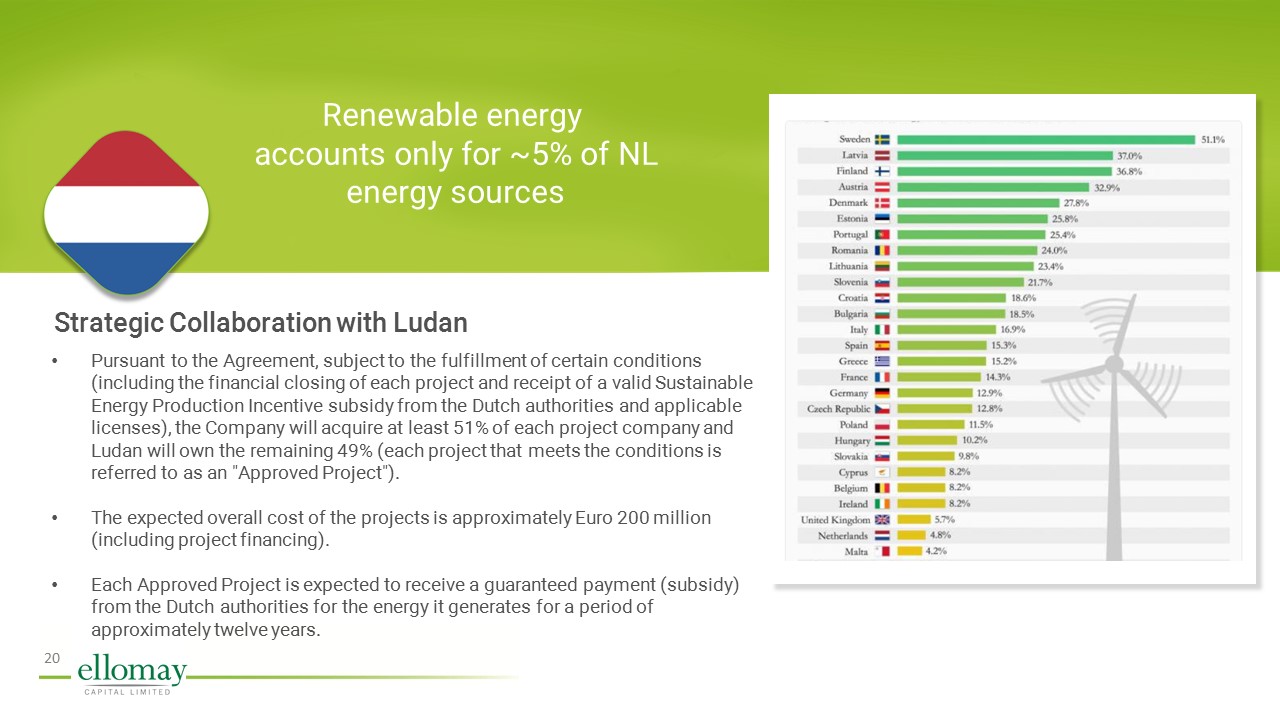
Strategic Collaboration with Ludan Pursuant to the Agreement, subject to the fulfillment of certain conditions (including the financial closing of each project and receipt of a valid Sustainable Energy Production Incentive subsidy from the Dutch authorities and applicable licenses), the Company will acquire at least 51% of each project company and Ludan will own the remaining 49% (each project that meets the conditions is referred to as an "Approved Project"). The expected overall cost of the projects is approximately Euro 200 million (including project financing).Each Approved Project is expected to receive a guaranteed payment (subsidy) from the Dutch authorities for the energy it generates for a period of approximately twelve years. Renewable energy accounts only for ~5% of NL energy sources
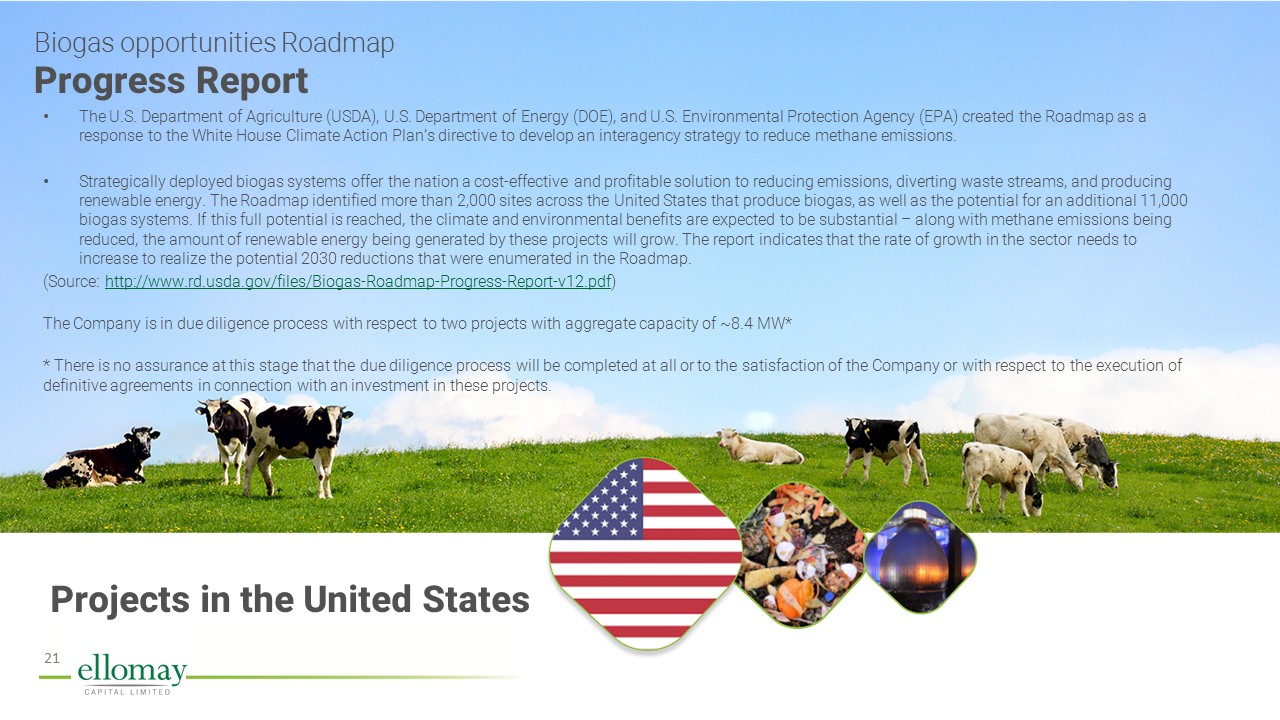
Projects in the United States Biogas opportunities RoadmapProgress Report The U.S. Department of Agriculture (USDA), U.S. Department of Energy (DOE), and U.S. Environmental Protection Agency (EPA) created the Roadmap as a response to the White House Climate Action Plan’s directive to develop an interagency strategy to reduce methane emissions. Strategically deployed biogas systems offer the nation a cost-effective and profitable solution to reducing emissions, diverting waste streams, and producing renewable energy. The Roadmap identified more than 2,000 sites across the United States that produce biogas, as well as the potential for an additional 11,000 biogas systems. If this full potential is reached, the climate and environmental benefits are expected to be substantial – along with methane emissions being reduced, the amount of renewable energy being generated by these projects will grow. The report indicates that the rate of growth in the sector needs to increase to realize the potential 2030 reductions that were enumerated in the Roadmap.(Source: http://www.rd.usda.gov/files/Biogas-Roadmap-Progress-Report-v12.pdf)The Company is in due diligence process with respect to two projects with aggregate capacity of ~8.4 MW** There is no assurance at this stage that the due diligence process will be completed at all or to the satisfaction of the Company or with respect to the execution of definitive agreements in connection with an investment in these projects.
Financial Results
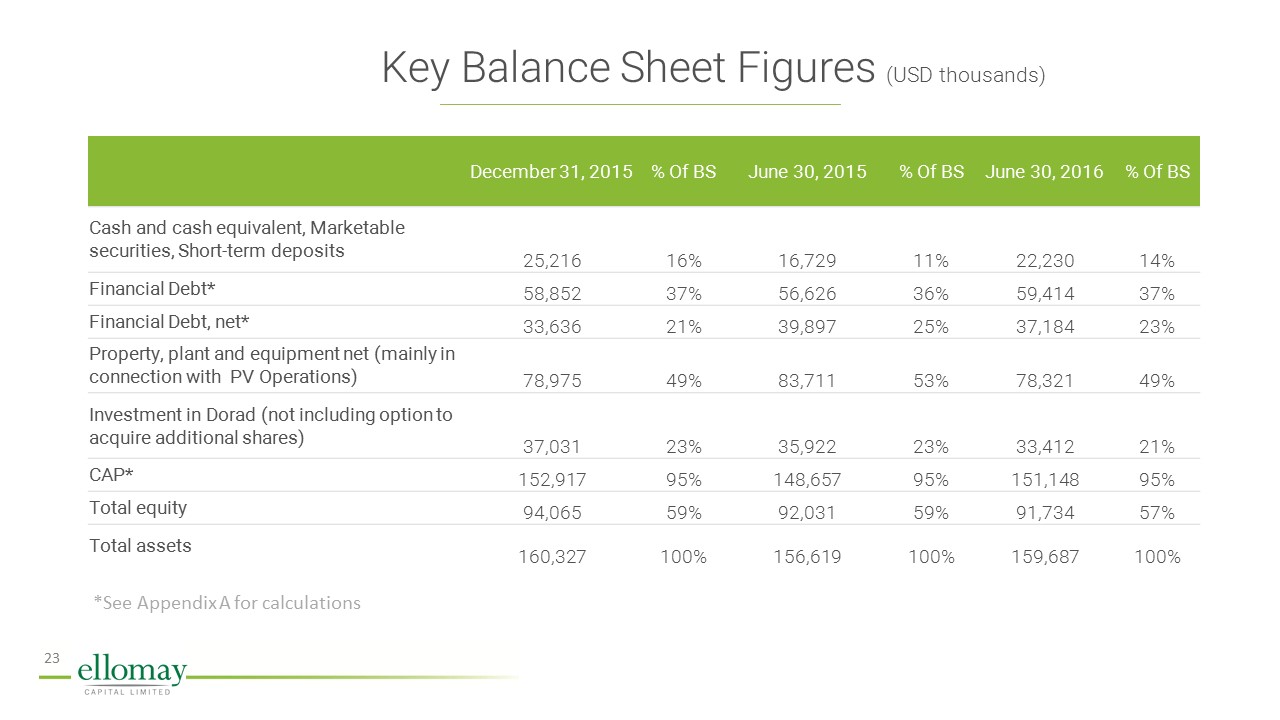
December 31, 2015 % Of BS June 30, 2015 % Of BS June 30, 2016 % Of BS Cash and cash equivalent, Marketable securities, Short-term deposits 25,216 16% 16,729 11% 22,230 14% Financial Debt* 58,852 37% 56,626 36% 59,414 37% Financial Debt, net* 33,636 21% 39,897 25% 37,184 23% Property, plant and equipment net (mainly in connection with PV Operations) 78,975 49% 83,711 53% 78,321 49% Investment in Dorad (not including option to acquire additional shares) 37,031 23% 35,922 23% 33,412 21% CAP* 152,917 95% 148,657 95% 151,148 95% Total equity 94,065 59% 92,031 59% 91,734 57% Total assets 160,327 100% 156,619 100% 159,687 100% Key Balance Sheet Figures (USD thousands) *See Appendix A for calculations
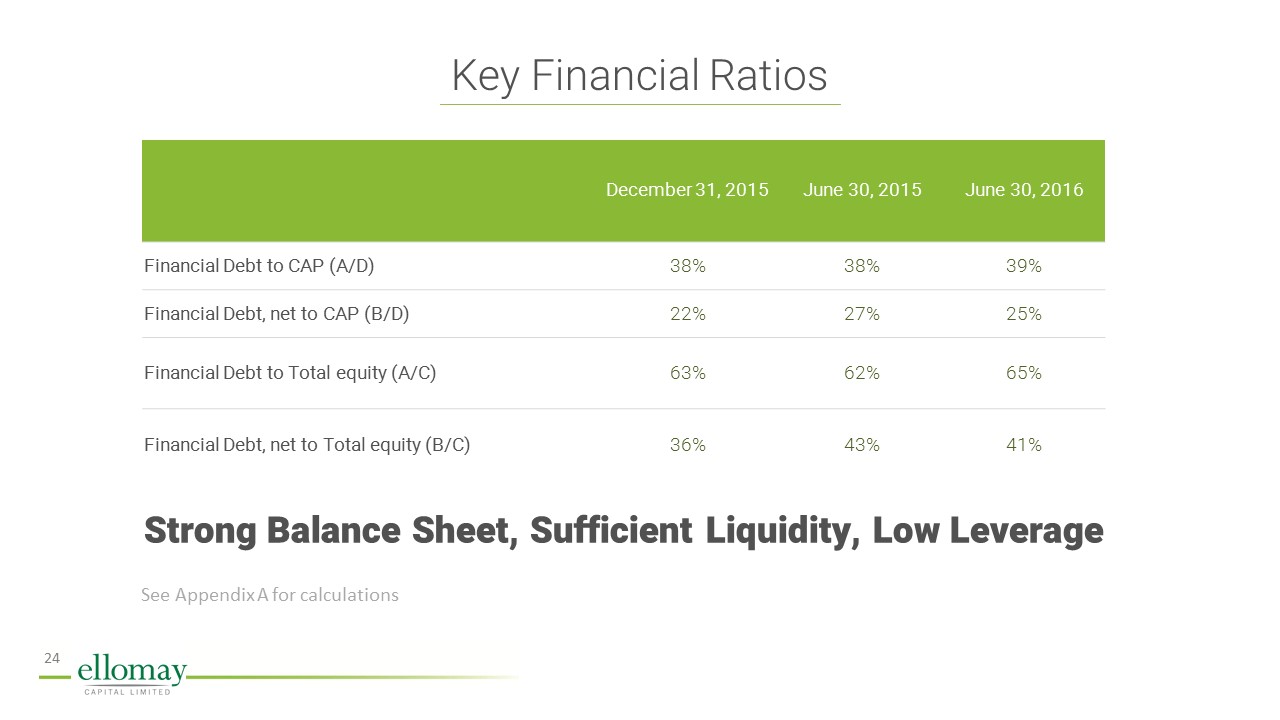
Key Financial Ratios December 31, 2015 June 30, 2015 June 30, 2016 Financial Debt to CAP (A/D) 38% 38% 39% Financial Debt, net to CAP (B/D) 22% 27% 25% Financial Debt to Total equity (A/C) 63% 62% 65% Financial Debt, net to Total equity (B/C) 36% 43% 41% Strong Balance Sheet, Sufficient Liquidity, Low Leverage See Appendix A for calculations
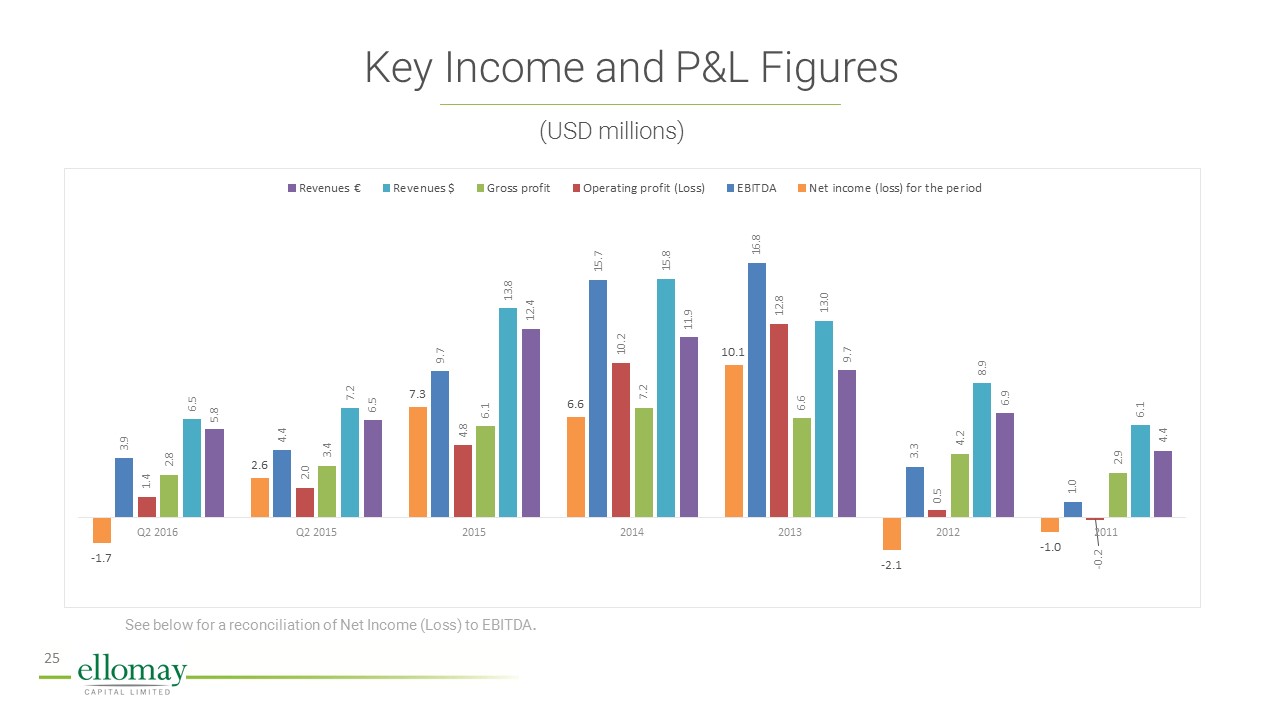
(USD millions) Key Income and P&L Figures See below for a reconciliation of Net Income (Loss) to EBITDA.
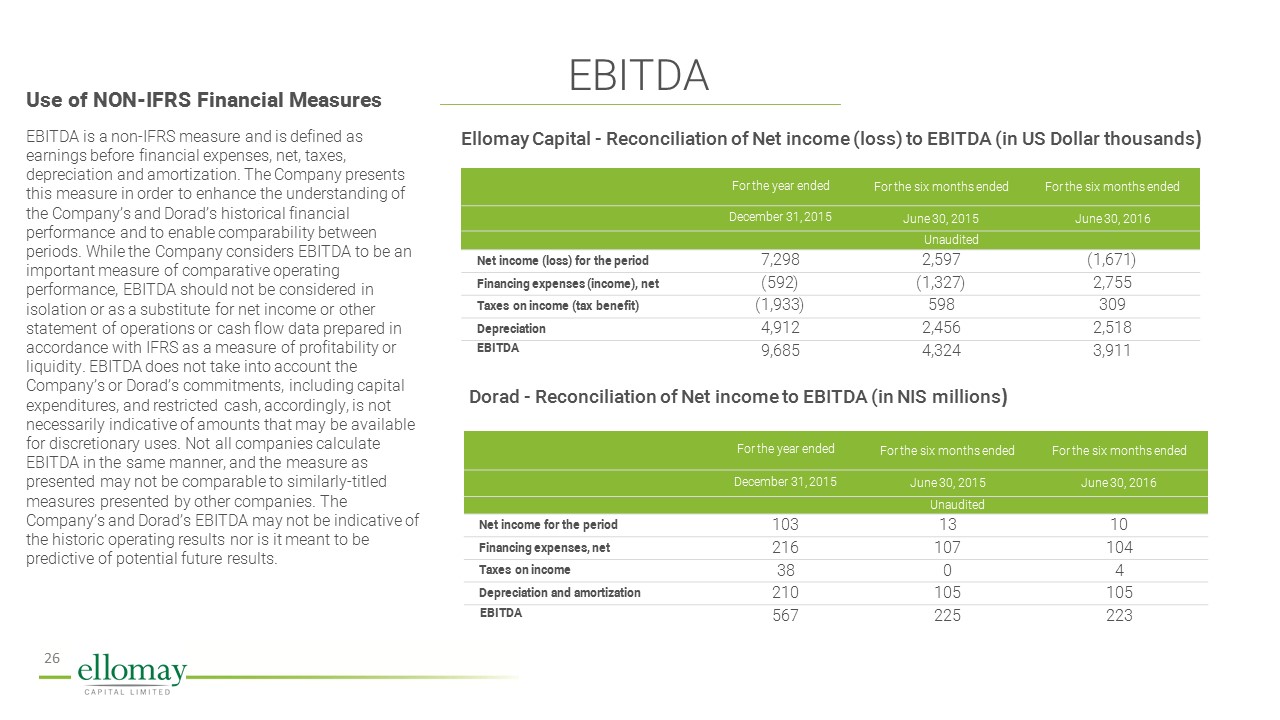
EBITDA EBITDA is a non-IFRS measure and is defined as earnings before financial expenses, net, taxes, depreciation and amortization. The Company presents this measure in order to enhance the understanding of the Company’s and Dorad’s historical financial performance and to enable comparability between periods. While the Company considers EBITDA to be an important measure of comparative operating performance, EBITDA should not be considered in isolation or as a substitute for net income or other statement of operations or cash flow data prepared in accordance with IFRS as a measure of profitability or liquidity. EBITDA does not take into account the Company’s or Dorad’s commitments, including capital expenditures, and restricted cash, accordingly, is not necessarily indicative of amounts that may be available for discretionary uses. Not all companies calculate EBITDA in the same manner, and the measure as presented may not be comparable to similarly-titled measures presented by other companies. The Company’s and Dorad’s EBITDA may not be indicative of the historic operating results nor is it meant to be predictive of potential future results. Ellomay Capital - Reconciliation of Net income (loss) to EBITDA (in US Dollar thousands) For the year ended For the six months ended For the six months ended December 31, 2015 June 30, 2015 June 30, 2016 Unaudited Net income (loss) for the period 7,298 2,597 )1,671( Financing expenses (income), net )592( )1,327( 2,755 Taxes on income (tax benefit) )1,933( 598 309 Depreciation 4,912 2,456 2,518 EBITDA 9,685 4,324 3,911 Dorad - Reconciliation of Net income to EBITDA (in NIS millions) For the year ended For the six months ended For the six months ended December 31, 2015 June 30, 2015 June 30, 2016 Unaudited Net income for the period 103 13 10 Financing expenses, net 216 107 104 Taxes on income 38 0 4 Depreciation and amortization 210 105 105 EBITDA 567 225 223 Use of NON-IFRS Financial Measures
1 2 3 4 Summary Diversified and growing base of cash flow generating assets. The Company is characterized by low leverage and revenues based on regulatory tariffs. Focus on small/medium commercial projects with limited capex and operational risks. Seasoned management team, with extensive sector knowledge and access to attractive opportunities.
www.ellomay.com Investor RelationsHadas FriedmanKM Investor relations Direct: +972 (0)3-5167620hadas@km-ir.co.ilwww.km-ir.co.il CompanyKalia WeintraubChief Financial OfficerEllomay Capital LTD.9 Rothschild Blvd., Tel AvivDirect: +972-3-7971111Email: anatb@ellomay.com Thank you!
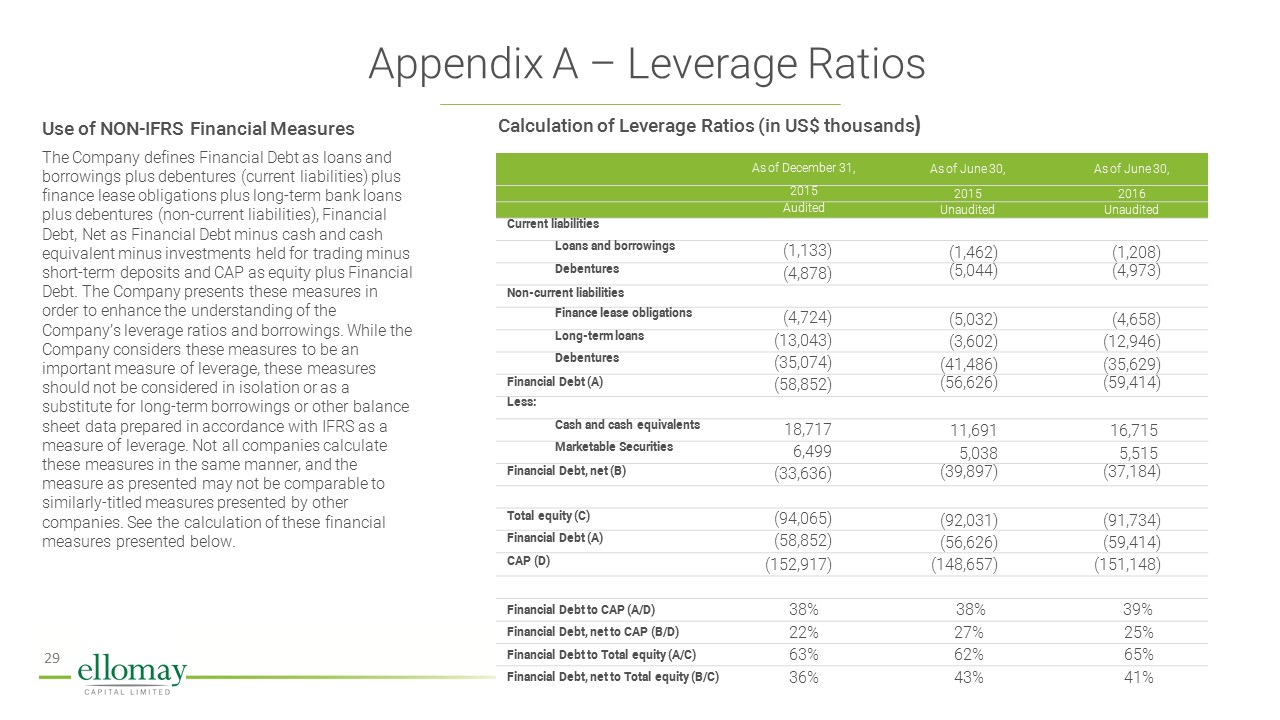
Appendix A – Leverage Ratios As of December 31, As of June 30, As of June 30, 2015 2015 2016 Audited Unaudited Unaudited Current liabilities Loans and borrowings (1,133) (1,462) (1,208) Debentures (4,878) (5,044) (4,973) Non-current liabilities Finance lease obligations (4,724) (5,032) (4,658) Long-term loans (13,043) (3,602) (12,946) Debentures (35,074) (41,486) (35,629) Financial Debt (A) (58,852) (56,626) (59,414) Less: Cash and cash equivalents 18,717 11,691 16,715 Marketable Securities 6,499 5,038 5,515 Financial Debt, net (B) (33,636) (39,897) (37,184) Total equity (C) (94,065) (92,031) (91,734) Financial Debt (A) (58,852) (56,626) (59,414) CAP (D) (152,917) (148,657) (151,148) Financial Debt to CAP (A/D) 38% 38% 39% Financial Debt, net to CAP (B/D) 22% 27% 25% Financial Debt to Total equity (A/C) 63% 62% 65% Financial Debt, net to Total equity (B/C) 36% 43% 41% The Company defines Financial Debt as loans and borrowings plus debentures (current liabilities) plus finance lease obligations plus long-term bank loans plus debentures (non-current liabilities), Financial Debt, Net as Financial Debt minus cash and cash equivalent minus investments held for trading minus short-term deposits and CAP as equity plus Financial Debt. The Company presents these measures in order to enhance the understanding of the Company’s leverage ratios and borrowings. While the Company considers these measures to be an important measure of leverage, these measures should not be considered in isolation or as a substitute for long-term borrowings or other balance sheet data prepared in accordance with IFRS as a measure of leverage. Not all companies calculate these measures in the same manner, and the measure as presented may not be comparable to similarly-titled measures presented by other companies. See the calculation of these financial measures presented below. Use of NON-IFRS Financial Measures Calculation of Leverage Ratios (in US$ thousands)