false2021FY--12-310000945764201,108492,1011,212,02050,658216,9591.012.890.471.012.890.4550,000495,560459,52450,000495,560510,3411,902,9531,634,758360,880296,0311,135,3901,053,668134,509—0.0010.00150,000,00050,000,000————0.0010.001250,000,000250,000,00050,193,65649,999,999——4,5851,26122,88536,67150,6581,432,578216,959P1YP1YP1YP7Y00P5YP3Y5040P5Y575P3YP3YP3Y3 years, 3 months00009457642021-01-012021-12-3100009457642021-06-30iso4217:USD00009457642022-01-31xbrli:shares0000945764den:PlainsMarketingMemberus-gaap:SalesRevenueNetMemberus-gaap:CustomerConcentrationRiskMember2021-01-012021-12-31xbrli:pure0000945764den:HuntCrudeOilSupplyCompanyMemberus-gaap:SalesRevenueNetMemberus-gaap:CustomerConcentrationRiskMember2021-01-012021-12-310000945764den:MarathonPetroleumCompanyLlcMemberus-gaap:SalesRevenueNetMemberus-gaap:CustomerConcentrationRiskMember2021-01-012021-12-310000945764den:SunocoIncMemberus-gaap:SalesRevenueNetMemberus-gaap:CustomerConcentrationRiskMember2021-01-012021-12-310000945764us-gaap:OilAndGasMember2020-09-192020-12-310000945764us-gaap:OilAndGasMember2020-01-012020-09-180000945764us-gaap:OilAndGasMember2019-01-012019-12-3100009457642020-09-192020-12-3100009457642019-01-012019-12-31iso4217:USDxbrli:shares00009457642020-01-012020-09-1800009457642021-12-3100009457642020-12-31iso4217:USDden:Barrel00009457642020-01-012020-12-310000945764us-gaap:OilAndGasMember2021-01-012021-12-310000945764den:CarbonDioxideMember2021-01-012021-12-310000945764den:CarbonDioxideMember2020-09-192020-12-310000945764den:CarbonDioxideMember2020-01-012020-09-180000945764den:CarbonDioxideMember2019-01-012019-12-310000945764us-gaap:OilAndGasPurchasedMember2021-01-012021-12-310000945764us-gaap:OilAndGasPurchasedMember2020-09-192020-12-310000945764us-gaap:OilAndGasPurchasedMember2020-01-012020-09-180000945764us-gaap:OilAndGasPurchasedMember2019-01-012019-12-310000945764us-gaap:OtherIncomeMember2021-01-012021-12-310000945764us-gaap:OtherIncomeMember2020-09-192020-12-310000945764us-gaap:OtherIncomeMember2020-01-012020-09-180000945764us-gaap:OtherIncomeMember2019-01-012019-12-310000945764us-gaap:OilAndGasRefiningAndMarketingMember2021-01-012021-12-310000945764us-gaap:OilAndGasRefiningAndMarketingMember2020-09-192020-12-310000945764us-gaap:OilAndGasRefiningAndMarketingMember2020-01-012020-09-180000945764us-gaap:OilAndGasRefiningAndMarketingMember2019-01-012019-12-3100009457642020-09-1800009457642019-12-3100009457642018-12-310000945764us-gaap:CommonStockMember2018-12-310000945764us-gaap:AdditionalPaidInCapitalMember2018-12-310000945764us-gaap:RetainedEarningsMember2018-12-310000945764us-gaap:TreasuryStockMember2018-12-310000945764us-gaap:CommonStockMember2019-01-012019-12-310000945764us-gaap:AdditionalPaidInCapitalMember2019-01-012019-12-310000945764us-gaap:RetainedEarningsMember2019-01-012019-12-310000945764us-gaap:TreasuryStockMember2019-01-012019-12-310000945764us-gaap:CommonStockMember2019-12-310000945764us-gaap:AdditionalPaidInCapitalMember2019-12-310000945764us-gaap:RetainedEarningsMember2019-12-310000945764us-gaap:TreasuryStockMember2019-12-310000945764us-gaap:CommonStockMember2020-01-012020-09-180000945764us-gaap:AdditionalPaidInCapitalMember2020-01-012020-09-180000945764us-gaap:TreasuryStockMember2020-01-012020-09-180000945764us-gaap:RetainedEarningsMember2020-01-012020-09-180000945764us-gaap:CommonStockMember2020-09-180000945764us-gaap:AdditionalPaidInCapitalMember2020-09-180000945764us-gaap:RetainedEarningsMember2020-09-180000945764us-gaap:TreasuryStockMember2020-09-180000945764us-gaap:AdditionalPaidInCapitalMember2020-09-192020-12-310000945764us-gaap:RetainedEarningsMember2020-09-192020-12-310000945764us-gaap:CommonStockMember2020-12-310000945764us-gaap:AdditionalPaidInCapitalMember2020-12-310000945764us-gaap:RetainedEarningsMember2020-12-310000945764us-gaap:TreasuryStockMember2020-12-310000945764us-gaap:AdditionalPaidInCapitalMember2021-01-012021-12-310000945764us-gaap:CommonStockMember2021-01-012021-12-310000945764us-gaap:RetainedEarningsMember2021-01-012021-12-310000945764us-gaap:CommonStockMember2021-12-310000945764us-gaap:AdditionalPaidInCapitalMember2021-12-310000945764us-gaap:RetainedEarningsMember2021-12-310000945764us-gaap:TreasuryStockMember2021-12-310000945764den:LendersUnderPredecessorCreditFacilityMember2020-07-280000945764den:SecondLienNoteHoldersMember2020-07-280000945764den:ConvertibleNoteHoldersMember2020-07-2800009457642020-09-182020-09-180000945764den:SecondLienNoteHoldersMember2020-09-180000945764den:ConvertibleNoteHoldersMember2020-09-180000945764den:SeriesAWarrantsMemberden:ConvertibleNoteHoldersMember2020-09-180000945764den:SeriesAWarrantsMemberden:ConvertibleNoteHoldersMembersrt:MaximumMember2020-09-180000945764den:SeriesBWarrantsMemberden:SubordinatedNoteHoldersMember2020-09-180000945764srt:MaximumMemberden:SeriesBWarrantsMemberden:SubordinatedNoteHoldersMember2020-09-180000945764den:EquityHoldersMemberden:SeriesBWarrantsMember2020-09-180000945764den:EquityHoldersMembersrt:MaximumMemberden:SeriesBWarrantsMember2020-09-180000945764den:SeriesAWarrantsMember2020-09-180000945764den:SeriesBWarrantsMember2020-09-1800009457642021-01-012021-03-310000945764srt:MinimumMemberus-gaap:PipelinesMember2021-01-012021-12-310000945764srt:MaximumMemberus-gaap:PipelinesMember2021-01-012021-12-310000945764us-gaap:VehiclesMembersrt:MinimumMember2021-01-012021-12-310000945764us-gaap:VehiclesMembersrt:MaximumMember2021-01-012021-12-310000945764srt:MinimumMemberus-gaap:FurnitureAndFixturesMember2021-01-012021-12-310000945764srt:MaximumMemberus-gaap:FurnitureAndFixturesMember2021-01-012021-12-310000945764srt:MinimumMemberus-gaap:ComputerEquipmentMember2021-01-012021-12-310000945764srt:MaximumMemberus-gaap:ComputerEquipmentMember2021-01-012021-12-310000945764srt:MinimumMember2021-01-012021-12-310000945764srt:MaximumMember2021-01-012021-12-310000945764den:PlainsMarketingMemberus-gaap:SalesRevenueNetMemberus-gaap:CustomerConcentrationRiskMember2020-09-192020-12-310000945764den:MarathonPetroleumCompanyLlcMemberus-gaap:SalesRevenueNetMemberus-gaap:CustomerConcentrationRiskMember2020-09-192020-12-310000945764den:HuntCrudeOilSupplyCompanyMemberus-gaap:SalesRevenueNetMemberus-gaap:CustomerConcentrationRiskMember2020-09-192020-12-310000945764den:PlainsMarketingMemberus-gaap:SalesRevenueNetMemberus-gaap:CustomerConcentrationRiskMember2020-01-012020-09-180000945764den:HuntCrudeOilSupplyCompanyMemberus-gaap:SalesRevenueNetMemberus-gaap:CustomerConcentrationRiskMember2020-01-012020-09-180000945764den:MarathonPetroleumCompanyLlcMemberus-gaap:SalesRevenueNetMemberus-gaap:CustomerConcentrationRiskMember2020-01-012020-09-180000945764den:PlainsMarketingMemberus-gaap:SalesRevenueNetMemberus-gaap:CustomerConcentrationRiskMember2019-01-012019-12-310000945764den:HuntCrudeOilSupplyCompanyMemberus-gaap:SalesRevenueNetMemberus-gaap:CustomerConcentrationRiskMember2019-01-012019-12-310000945764den:SunocoIncMemberus-gaap:SalesRevenueNetMemberus-gaap:CustomerConcentrationRiskMember2019-01-012019-12-310000945764den:NetIncomeScenarioMember2020-09-192020-12-310000945764den:NetIncomeScenarioMember2020-01-012020-09-180000945764den:PerformanceBasedAndRestrictedStockUnitsMember2021-01-012021-12-310000945764us-gaap:RestrictedStockUnitsRSUMember2021-12-310000945764us-gaap:RestrictedStockUnitsRSUMember2020-12-310000945764us-gaap:RestrictedStockUnitsRSUMember2019-12-310000945764us-gaap:WarrantMember2021-12-310000945764us-gaap:WarrantMember2020-12-310000945764us-gaap:WarrantMember2019-12-310000945764us-gaap:StockAppreciationRightsSARSMember2021-12-310000945764us-gaap:StockAppreciationRightsSARSMember2020-12-310000945764us-gaap:StockAppreciationRightsSARSMember2019-12-310000945764us-gaap:RestrictedStockMember2021-12-310000945764us-gaap:RestrictedStockMember2020-12-310000945764us-gaap:RestrictedStockMember2019-12-310000945764den:SeriesAWarrantsMember2021-12-310000945764den:SeriesBWarrantsMember2021-12-310000945764srt:MinimumMember2020-09-180000945764srt:MaximumMember2020-09-180000945764srt:MedianMember2020-09-1800009457642020-07-302020-09-180000945764us-gaap:MeasurementInputSharePriceMember2020-09-180000945764den:SeriesAWarrantsMember2020-09-182020-09-180000945764den:SeriesBWarrantsMember2020-09-182020-09-180000945764us-gaap:ReorganizationChapter11PredecessorBeforeAdjustmentMember2020-09-180000945764us-gaap:ReorganizationChapter11PlanEffectAdjustmentMember2020-09-180000945764us-gaap:ReorganizationChapter11FreshStartAdjustmentMember2020-09-180000945764den:PredecessorAdjustmentMemberus-gaap:ReorganizationChapter11PlanEffectAdjustmentMember2020-09-180000945764den:SuccessorAdjustmentMemberus-gaap:ReorganizationChapter11PlanEffectAdjustmentMember2020-09-1800009457642021-03-032021-03-030000945764den:BigSandDrawAndBeaverCreekFieldsMember2021-03-032021-03-030000945764den:Year2021Memberden:BigSandDrawAndBeaverCreekFieldsMember2021-03-030000945764den:Year2021Membersrt:MinimumMemberden:BigSandDrawAndBeaverCreekFieldsMember2021-01-012021-12-310000945764den:Year2022Memberden:BigSandDrawAndBeaverCreekFieldsMember2021-03-030000945764den:BigSandDrawAndBeaverCreekFieldsMember2021-03-0300009457642021-03-032021-12-3100009457642021-06-302021-06-3000009457642021-07-012021-12-3100009457642020-03-042020-03-040000945764den:Year2022Membersrt:MinimumMemberden:BigSandDrawAndBeaverCreekFieldsMember2021-01-012021-12-310000945764us-gaap:SubsequentEventMemberden:BigSandDrawAndBeaverCreekFieldsMember2022-01-012022-01-310000945764den:OilSalesMember2021-01-012021-12-310000945764den:OilSalesMember2020-09-192020-12-310000945764den:OilSalesMember2020-01-012020-09-180000945764den:OilSalesMember2019-01-012019-12-310000945764den:NaturalGasSalesMember2021-01-012021-12-310000945764den:NaturalGasSalesMember2020-09-192020-12-310000945764den:NaturalGasSalesMember2020-01-012020-09-180000945764den:NaturalGasSalesMember2019-01-012019-12-310000945764den:CO2SalesAndTransportationFeesMember2021-01-012021-12-310000945764den:CO2SalesAndTransportationFeesMember2020-09-192020-12-310000945764den:CO2SalesAndTransportationFeesMember2020-01-012020-09-180000945764den:CO2SalesAndTransportationFeesMember2019-01-012019-12-310000945764srt:MaximumMember2021-12-310000945764srt:MaximumMemberus-gaap:LandMember2021-12-31utr:Rate0000945764us-gaap:GeneralAndAdministrativeExpenseMember2021-01-012021-12-310000945764us-gaap:GeneralAndAdministrativeExpenseMember2020-09-192020-12-310000945764us-gaap:GeneralAndAdministrativeExpenseMember2020-01-012020-09-180000945764us-gaap:GeneralAndAdministrativeExpenseMember2019-01-012019-12-310000945764us-gaap:OperatingExpenseMember2021-01-012021-12-310000945764us-gaap:OperatingExpenseMember2020-09-192020-12-310000945764us-gaap:OperatingExpenseMember2020-01-012020-09-180000945764us-gaap:OperatingExpenseMember2019-01-012019-12-310000945764us-gaap:OtherExpenseMember2021-01-012021-12-310000945764us-gaap:OtherExpenseMember2020-09-192020-12-310000945764us-gaap:OtherExpenseMember2020-01-012020-09-180000945764us-gaap:OtherExpenseMember2019-01-012019-12-310000945764us-gaap:LetterOfCreditMember2021-12-310000945764den:SwinglineLoanMember2021-12-310000945764srt:MinimumMember2021-12-310000945764den:DividendOrOtherRestrictedPaymentMembersrt:MaximumMember2021-01-012021-12-310000945764den:DividendOrOtherRestrictedPaymentMembersrt:MinimumMember2021-12-310000945764us-gaap:BaseRateMembersrt:MinimumMember2021-01-012021-12-310000945764us-gaap:BaseRateMembersrt:MaximumMember2021-01-012021-12-310000945764us-gaap:LondonInterbankOfferedRateLIBORMember2021-01-012021-12-310000945764us-gaap:LondonInterbankOfferedRateLIBORMembersrt:MinimumMember2021-01-012021-12-310000945764us-gaap:LondonInterbankOfferedRateLIBORMembersrt:MaximumMember2021-01-012021-12-310000945764den:NEJDPipelineMember2021-01-012021-12-310000945764den:FreeStatePipelineMember2020-10-302020-10-300000945764den:A638ConvertibleSeniorNotesDue2024Member2020-04-012020-06-3000009457642020-04-012020-06-3000009457642020-06-300000945764den:A9SeniorSecuredSecondLienNotesDue2021Member2020-03-3100009457642020-03-012020-03-310000945764us-gaap:StateAndLocalJurisdictionMember2021-12-310000945764us-gaap:ValuationAllowanceOfDeferredTaxAssetsMember2021-01-012021-12-310000945764us-gaap:ValuationAllowanceOfDeferredTaxAssetsMember2020-12-310000945764us-gaap:ValuationAllowanceOfDeferredTaxAssetsMember2020-09-180000945764us-gaap:ValuationAllowanceOfDeferredTaxAssetsMember2019-12-310000945764us-gaap:ValuationAllowanceOfDeferredTaxAssetsMember2018-12-310000945764us-gaap:ValuationAllowanceOfDeferredTaxAssetsMember2020-09-192020-12-310000945764us-gaap:ValuationAllowanceOfDeferredTaxAssetsMember2020-01-012020-09-180000945764us-gaap:ValuationAllowanceOfDeferredTaxAssetsMember2019-01-012019-12-310000945764us-gaap:ValuationAllowanceOfDeferredTaxAssetsMember2021-12-310000945764den:BenefitPlanFourZeroOneKMember2021-01-012021-12-310000945764den:BenefitPlanFourZeroOneKMembersrt:MaximumMember2021-01-012021-12-310000945764den:BenefitPlanFourZeroOneKMember2020-09-192020-12-310000945764den:BenefitPlanFourZeroOneKMember2020-01-012020-09-180000945764den:BenefitPlanFourZeroOneKMember2019-01-012019-12-310000945764den:A2020OmnibusStockAndIncentivePlanMember2021-12-310000945764den:A2020OmnibusStockAndIncentivePlanMember2020-12-042020-12-040000945764us-gaap:RestrictedStockUnitsRSUMember2021-01-012021-12-310000945764us-gaap:RestrictedStockUnitsRSUMember2021-12-310000945764us-gaap:RestrictedStockUnitsRSUMember2020-12-310000945764us-gaap:PhantomShareUnitsPSUsMember2021-01-012021-12-310000945764us-gaap:PhantomShareUnitsPSUsMember2021-12-310000945764us-gaap:PhantomShareUnitsPSUsMember2020-09-192020-12-310000945764us-gaap:PhantomShareUnitsPSUsMember2020-12-3100009457642020-06-012020-06-300000945764den:ContinuedEmploymentMember2020-06-300000945764den:SpecifiedIncentiveMetricMember2020-06-3000009457642020-07-012020-09-180000945764den:A2004OmnibusStockAndIncentivePlanMember2020-09-180000945764us-gaap:RestrictedStockMember2020-01-012020-09-180000945764us-gaap:RestrictedStockMember2021-01-012021-12-310000945764us-gaap:RestrictedStockMember2019-01-012019-12-310000945764us-gaap:RestrictedStockMember2020-09-180000945764us-gaap:PerformanceSharesMember2020-01-012020-09-180000945764us-gaap:PerformanceSharesMember2021-01-012021-12-310000945764den:PerformanceBasedTsrAwardsMember2020-01-012020-09-180000945764den:PerformanceBasedTsrAwardsMember2019-01-012019-12-310000945764den:PerformanceBasedOperationalAwardMember2020-01-012020-09-180000945764den:PerformanceBasedOperationalAwardMember2019-01-012019-12-310000945764us-gaap:PerformanceSharesMember2020-09-180000945764us-gaap:PerformanceSharesMember2019-01-012019-12-310000945764us-gaap:SwapMemberden:NYMEXMemberden:Q1Q22022Member2021-12-31utr:bblden:d0000945764us-gaap:SwapMembersrt:MinimumMemberden:NYMEXMemberden:Q1Q22022Member2021-12-310000945764us-gaap:SwapMembersrt:MaximumMemberden:NYMEXMemberden:Q1Q22022Member2021-12-310000945764us-gaap:SwapMemberden:Q3Q42022Memberden:NYMEXMember2021-12-310000945764us-gaap:SwapMemberden:Q3Q42022Membersrt:MinimumMemberden:NYMEXMember2021-12-310000945764us-gaap:SwapMemberden:Q3Q42022Membersrt:MaximumMemberden:NYMEXMember2021-12-310000945764us-gaap:OptionMemberden:NYMEXMemberden:Q1Q22022Member2021-12-310000945764us-gaap:OptionMembersrt:MinimumMemberden:NYMEXMemberden:Q1Q22022Member2021-12-310000945764us-gaap:OptionMembersrt:MaximumMemberden:NYMEXMemberden:Q1Q22022Member2021-12-310000945764us-gaap:OptionMemberden:Q3Q42022Memberden:NYMEXMember2021-12-310000945764us-gaap:OptionMemberden:Q3Q42022Membersrt:MinimumMemberden:NYMEXMember2021-12-310000945764us-gaap:OptionMemberden:Q3Q42022Membersrt:MaximumMemberden:NYMEXMember2021-12-310000945764us-gaap:FairValueInputsLevel1Member2021-12-310000945764us-gaap:FairValueInputsLevel2Member2021-12-310000945764us-gaap:FairValueInputsLevel3Member2021-12-310000945764us-gaap:FairValueInputsLevel1Member2020-12-310000945764us-gaap:FairValueInputsLevel2Member2020-12-310000945764us-gaap:FairValueInputsLevel3Member2020-12-310000945764den:IndustrialSourceCO2PurchaseContractsMember2021-01-012021-12-310000945764den:IndustrialSourceCO2PurchaseContractsAndProcessingFeeRelatedToOverridingRoyaltyInterestInCO2Membersrt:MinimumMember2021-01-012021-12-310000945764den:IndustrialSourceCO2PurchaseContractsAndProcessingFeeRelatedToOverridingRoyaltyInterestInCO2Membersrt:MaximumMember2021-01-012021-12-310000945764den:IndustrialCO2CustomersMember2021-12-31utr:MMcf0000945764den:IndustrialCO2CustomersMember2021-01-012021-12-310000945764us-gaap:AllowanceForNotesReceivableMember2021-01-012021-12-310000945764us-gaap:AllowanceForNotesReceivableMember2020-12-310000945764us-gaap:AllowanceForNotesReceivableMember2020-09-180000945764us-gaap:AllowanceForNotesReceivableMember2019-12-310000945764us-gaap:AllowanceForNotesReceivableMember2018-12-310000945764us-gaap:AllowanceForNotesReceivableMember2020-09-192020-12-310000945764us-gaap:AllowanceForNotesReceivableMember2020-01-012020-09-180000945764us-gaap:AllowanceForNotesReceivableMember2019-01-012019-12-310000945764us-gaap:AllowanceForNotesReceivableMember2021-12-31
UNITED STATES SECURITIES AND EXCHANGE COMMISSION
Washington, D.C. 20549
2021 FORM 10-K
(Mark One)
☑ Annual report pursuant to Section 13 or 15(d) of the Securities Exchange Act of 1934
For the fiscal year ended December 31, 2021
OR
☐ Transition report pursuant to Section 13 or 15(d) of the Securities Exchange Act of 1934
For the transition period from _________ to________
Commission file number: 001-12935
DENBURY INC.
(Exact name of Registrant as specified in its charter) | | | | | | | | | | | | | | |
| Delaware | | 20-0467835 |
(State or other jurisdiction of incorporation or organization) | | (I.R.S. Employer Identification No.) |
| | | | |
| 5851 Legacy Circle, | | |
| Plano, | TX | | | 75024 |
| (Address of principal executive offices) | | (Zip Code) |
| | | | | | | | | | | |
| Registrant’s telephone number, including area code: | | (972) | 673-2000 |
Securities registered pursuant to Section 12(b) of the Act: | | | | | | | | |
| Title of Each Class: | Trading Symbol: | Name of Each Exchange on Which Registered: |
| Common Stock $.001 Par Value | DEN | New York Stock Exchange |
Securities registered pursuant to Section 12(g) of the Act: None
Indicate by check mark if the registrant is a well-known seasoned issuer, as defined in Rule 405 of the Securities Act. Yes ☑ No ☐
Indicate by check mark if the registrant is not required to file reports pursuant to Section 13 or Section 15(d) of the Act. Yes ☐ No ☑
Indicate by check mark whether the registrant (1) has filed all reports required to be filed by Section 13 or 15(d) of the Securities Exchange Act of 1934 during the preceding 12 months (or for such shorter period that the registrant was required to file such reports), and (2) has been subject to such filing requirements for the past 90 days. Yes ☑ No ☐
Indicate by check mark whether the registrant has submitted electronically every Interactive Data File required to be submitted pursuant to Rule 405 (§232.405 of this chapter) of Regulation S-T during the preceding 12 months (or for such shorter period that the registrant was required to submit such files). Yes ☑ No ☐
Indicate by check mark whether the registrant is a large accelerated filer, an accelerated filer, a non-accelerated filer, a smaller reporting company, or an emerging growth company. See the definitions of “large accelerated filer”, “accelerated filer”, “smaller reporting company,” and “emerging growth company” in Rule 12-b2 of the Exchange Act. | | | | | | | | | | | | | | | | | | | | | | | | | | | | | |
Large accelerated filer | ☑ | Accelerated filer | ☐ | Non-accelerated filer | ☐ | Smaller reporting company | ☐ | Emerging growth company | ☐ |
If an emerging growth company, indicate by check mark if the registrant has elected not to use the extended transition period for complying with any new or revised financial accounting standards provided pursuant to Section 13(a) of the Exchange Act. ☐
Indicate by check mark whether the registrant has filed a report on and attestation to its management’s assessment of the effectiveness of its internal control over financial reporting under Section 404(b) of the Sarbanes-Oxley Act (15 U.S.C. 7262(b)) by the registered public accounting firm that prepared or issued its audit report. ☑
Indicate by check mark whether the registrant is a shell company (as defined in Rule 12b-2 of the Act). Yes ☐ No ☑
Indicate by check mark whether the registrant has filed all documents and reports required to be filed by Section 12, 13 or 15(d) of the Securities Exchange Act of 1934 subsequent to the distribution of securities under a plan confirmed by a court. Yes ☑ No ☐
The aggregate market value of the registrant’s common stock held by non-affiliates, based on the closing price of the registrant’s common stock as of the last business day of the registrant’s most recently completed second fiscal quarter was $3,839,619,307.
The number of shares outstanding of the registrant’s Common Stock as of January 31, 2022, was 50,199,676.
DOCUMENTS INCORPORATED BY REFERENCE | | | | | | | | |
| Document: | | Incorporated as to: |
| 1. Notice and Proxy Statement for the Annual Meeting of Stockholders to be held May 26, 2022. | | 1. Part III, Items 10, 11, 12, 13, 14 |
2021 Annual Report on Form 10-K
Glossary and Selected Abbreviations | | | | | |
| Bbl | One stock tank barrel, of 42 U.S. gallons liquid volume, used herein in reference to crude oil or other liquid hydrocarbons. |
| |
| Bbls/d | Barrels of oil or other liquid hydrocarbons produced per day. |
| |
| Bcf | One billion cubic feet of natural gas or CO2. |
| |
| BOE | One barrel of oil equivalent, using the ratio of one barrel of crude oil, condensate or natural gas liquids to 6 Mcf of natural gas. |
| |
| BOE/d | BOEs produced per day. |
| |
| Btu | British thermal unit, which is the heat required to raise the temperature of a one-pound mass of water from 58.5 to 59.5 degrees Fahrenheit (°F). |
| |
| CCUS | Carbon Capture, Use, and Storage. |
| |
CO2 | Carbon dioxide. |
| |
| EOR | Enhanced oil recovery. In the context of our oil production, EOR is also referred to as tertiary recovery. Primary types of EOR include thermal, gas injection (such as natural gas, nitrogen, or CO2) and chemical injection (such as the use of polymers). |
| |
| Finding and development costs | The average cost per BOE to find and develop proved reserves during a given period. It is calculated by dividing (a) costs, which include the sum of (i) the total acquisition, exploration and development costs incurred during the period plus (ii) future development and abandonment costs related to the specified property or group of properties, by (b) the sum of (i) the change in total proved reserves during the period plus (ii) total production during that period. |
| |
| GAAP | Accounting principles generally accepted in the United States of America. |
| |
| MBbls | One thousand barrels of crude oil or other liquid hydrocarbons. |
| |
| MBOE | One thousand BOEs. |
| |
| Mcf | One thousand cubic feet of natural gas or CO2 at a temperature base of 60 degrees Fahrenheit (°F) and at the legal pressure base (14.65 to 15.025 pounds per square inch absolute) of the state or area in which the reserves are located or sales are made. |
| |
| Mcf/d | One thousand cubic feet of natural gas or CO2 per day. |
| |
| MMBOE | One million BOEs. |
| |
| MMBtu | One million Btus. |
| |
| MMcf | One million cubic feet of natural gas or CO2. |
| |
| MMcf/d | One million cubic feet of natural gas or CO2 produced per day. |
| |
Noncash fair value gains (losses) on commodity derivatives
| The net change during the period in the fair market value of commodity derivative positions. Noncash fair value gains (losses) on commodity derivatives is a non-GAAP measure and makes up only a portion of “Commodity derivatives expense (income)” in the Consolidated Statements of Operations, which also includes the impact of settlements on commodity derivatives during the period.
|
| |
| NYMEX | The New York Mercantile Exchange. In the context of prices received for oil and natural gas, NYMEX prices represent the West Texas Intermediate benchmark price for crude oil and Henry Hub benchmark price for natural gas. |
| |
| Probable Reserves* | Reserves that are less certain to be recovered than proved reserves but which, together with proved reserves, are as likely as not to be recovered. |
| |
| Proved Developed Reserves* | Reserves that can be expected to be recovered through existing wells with existing equipment and operating methods. |
| |
| Proved Reserves* | Reserves that geological and engineering data demonstrate with reasonable certainty to be recoverable in future years from known reservoirs under existing economic and operating conditions. |
| |
| | | | | |
| Proved Undeveloped Reserves* | Reserves that are expected to be recovered from new wells on undrilled acreage or from existing wells, in each case where a relatively major expenditure is required. |
| |
| PV-10 Value | The estimated future gross revenue to be generated from the production of proved reserves, net of estimated future production, development and abandonment costs, and before income taxes, discounted to a present value using an annual discount rate of 10%. PV-10 Values were prepared using average hydrocarbon prices equal to the unweighted arithmetic average of hydrocarbon prices on the first day of each month within the 12-month period preceding the reporting date. PV-10 Value is a non-GAAP measure and does not purport to represent the fair value of our oil and natural gas reserves; its use is further discussed in Item 7, Management’s Discussion and Analysis of Financial Condition and Results of Operations – Non-GAAP Financial Measure and Reconciliation. |
| |
| Tcf | One trillion cubic feet of natural gas or CO2. |
| |
| Tertiary Recovery | A term used to represent techniques for extracting incremental oil out of existing oil fields (as opposed to primary and secondary recovery or “non-tertiary” recovery). See also “EOR.”
|
* This definition is an abbreviated version of the complete definition set forth in Rule 4-10(a) of Regulation S-X. For the complete definition see:
http://www.ecfr.gov/cgi-bin/text-idx?SID=2d916841db86d079fa060fa63b08d34e&mc=true&node=se17.3.210_14_610&rgn=div8.
PART I
Item 1. Business and Properties
GENERAL
Denbury Inc., a Delaware corporation, is an independent energy company with operations focused in the Gulf Coast and Rocky Mountain regions of the United States. The Company is differentiated by its focus on CO2 EOR and the emerging CCUS industry, supported by the Company’s CO2 EOR technical and operational expertise and its extensive CO2 pipeline infrastructure. The utilization of captured industrial-sourced CO2 in EOR significantly reduces the carbon footprint of the oil that Denbury produces, making the Company’s Scope 1 and 2 CO2 emissions negative today, with a goal to also fully offset Scope 3 CO2 emissions within this decade, primarily through increasing the amount of captured industrial-sourced CO2 used in its operations. Throughout this Annual Report on Form 10-K (“Form 10-K”) we use the terms “Denbury,” “Company,” “we,” “our” and “us” to refer to Denbury Inc. and, as the context may require, its subsidiaries.
Our CO2 EOR oil recovery operations result in the associated underground storage of CO2. This means that Denbury’s activities are supporting and advancing the national energy transition today through the increasing use of industrially sourced CO2 in EOR operations, as well as building out a dedicated CCUS platform for long-term carbon management at scale.
As part of our corporate strategy, we are committed to creating long-term value for our shareholders through the following key principles:
•leverage our extensive CO2 pipeline assets and CO2 EOR expertise to expand our operations and leadership position in the emerging CCUS industry;
•seek to expand the use of industrial-sourced CO2 in our tertiary recovery operations, with an ultimate objective of producing oil with a negative carbon footprint;
•increase the value of our assets by applying our technical expertise in CO2 tertiary recovery and target specific regions where we either have, or believe we can create, a competitive advantage;
•optimize the timing and allocation of capital among our investment opportunities to maximize the rates of return on our investments;
•exercise financial discipline and maintain a strong balance sheet; and
•attract and maintain a highly competitive team of experienced and incentivized personnel.
As further described in Emergence from Voluntary Reorganization Under Chapter 11 of the Bankruptcy Code below, Denbury Inc. became the successor reporting company (the “Successor”) of Denbury Resources Inc. (the “Predecessor”) upon the Predecessor’s emergence from bankruptcy on September 18, 2020. As part of the plan of reorganization, upon emergence from bankruptcy, all of the Predecessor’s previously authorized and/or issued common stock or stock equivalents were cancelled, and new common stock was issued to the Predecessor’s debt holders and equity holders upon cancellation of approximately $2.1 billion principal amount of debt and all of the Predecessor’s equity instruments, respectively. On September 21, 2020, the Successor’s new common stock commenced trading on the New York Stock Exchange under the ticker symbol DEN, as distinguished from, Denbury Resources Inc.’s common stock having been publicly traded on the New York Stock Exchange since 1997. Our corporate headquarters is located at 5851 Legacy Circle, Plano, Texas 75024, and our phone number is 972-673-2000.
We make our annual report on Form 10-K, quarterly reports on Form 10-Q, current reports on Form 8-K, and amendments to those reports, filed or furnished pursuant to Section 13(a) or 15(d) of the Securities Exchange Act of 1934, available free of charge on or through our website, www.denbury.com, as soon as reasonably practicable after we electronically file such material with, or furnish it to, the Securities and Exchange Commission (“SEC”). The SEC also maintains a website, http://www.sec.gov, which contains periodic reports on Forms 8-K, 10-Q and 10-K filed with the SEC, along with other reports, proxy and information statements and other information filed by Denbury.
Emergence from Voluntary Reorganization Under Chapter 11 of the Bankruptcy Code
On July 30, 2020, Denbury Resources Inc. and its subsidiaries filed petitions for reorganization in a “prepackaged” voluntary bankruptcy under chapter 11 of the Bankruptcy Code in the United States Bankruptcy Court for the Southern District of Texas (the “Bankruptcy Court”) under the caption “In re Denbury Resources Inc., et al., Case No. 20-33801”. On September
2, 2020, the Bankruptcy Court entered an order confirming the prepackaged joint plan of reorganization (the “Plan”) and approving the Disclosure Statement, and on September 18, 2020 (the “Emergence Date”), the Plan became effective in accordance with its terms and the Company emerged from Chapter 11 as the successor reporting company of Denbury Resources Inc. On April 23, 2021, the Bankruptcy Court entered a final decree closing the Chapter 11 case captioned “In re Denbury Resources Inc., et al., Case No. 20-33801”; therefore, we have no remaining obligations related to this reorganization.
Upon emergence from bankruptcy, we met the criteria and were required to adopt fresh start accounting in accordance with Financial Accounting Standards Board Codification (“FASC”) Topic 852, Reorganizations. Fresh start accounting requires that new fair values be established for the Company’s assets, liabilities and equity as of the Emergence Date, and therefore certain values and operational results of the condensed consolidated financial statements subsequent to September 18, 2020 are not comparable to those in the Company’s condensed consolidated financial statements prior to, and including September 18, 2020. The Emergence Date fair values of the Successor’s assets and liabilities differ materially from their recorded values as reflected on the historical balance sheets of the Predecessor contained in periodic reports previously filed with the Securities and Exchange Commission. References to “Successor” relate to the financial position and results of operations of the Company subsequent to September 18, 2020, and references to “Predecessor” relate to the financial position and results of operations of the Company prior to, and including, September 18, 2020.
BUSINESS ENVIRONMENT AND 2021 DEVELOPMENTS
Oil prices generally constitute the single largest variable in our operating results. Over the last several years, oil prices have been extremely volatile, with NYMEX WTI oil prices averaging approximately $57 per barrel in 2019, $39 per barrel in 2020 and $68 per barrel in 2021. The impact of the COVID-19 coronavirus (“COVID-19”) pandemic caused a rapid and precipitous drop in oil demand during 2020, which worsened an already deteriorated oil market caused by a concurrent decision among the group of oil producing nations known as OPEC+ to increase oil supply. In 2021, global economies generally began to recover from the impacts of COVID-19 and worldwide oil demand slowly began to increase to near pre-pandemic levels, as oil and gas companies significantly reduced capital investments due to lower oil prices, and OPEC+ proactively worked to reduce excess oil inventories around the world. As we approached the end of 2021, the fundamentals for global oil supply and demand were very tight, with inventory levels in the U.S. rebounding from five-year lows, and a near-term outlook for increasing oil demand as global economies and worldwide travel continued to recover. As oil prices strengthened during 2021, from around $50 per barrel in early 2021 to around $80 per barrel near the end of 2021, the Company’s financial results also improved, although the positive oil price impact was offset in large part by the commodity hedges we were obligated to have in place under our bank credit facility shortly after we emerged from bankruptcy in September 2020.
The following include some of our key 2021 business developments:
•Completed our 105-mile CO2 pipeline from Bell Creek Field to Cedar Creek Anticline (“CCA”).
•Acquired a nearly 100% working interest in the Big Sand Draw and Beaver Creek oil fields (collectively “Wind River Basin”) located in Wyoming, including surface facilities and a 46-mile CO2 pipeline.
•Sold non-producing surface acreage in the Houston area for $15.2 million and divested undeveloped deep mineral rights in Wyoming for $18 million.
•Reduced the Company’s total debt by $103.0 million and exited 2021 with $531.8 million of financial liquidity and total debt of $35.0 million.
In addition to the items listed above, the Company advanced its evolving CCUS business in 2021 through the following:
•Established an executive leadership team for Denbury Carbon Solutions.
•Executed a term sheet with Mitsubishi Corporation covering a 20-year period for the transport and storage of CO2 captured from Mitsubishi’s proposed ammonia project along the U.S. Gulf Coast.
•Commenced a joint evaluation with Mitsui E&P USA LLC of potential opportunities across the U.S. Gulf Coast to develop carbon-negative oil assets utilizing industrial-sourced CO2.
•Announced joint development of a Texas Gulf Coast sequestration site with Gulf Coast Midstream Partners, with potential to store up to 400 million metric tons of CO2.
CARBON CAPTURE, USE AND STORAGE
CCUS is a process that captures CO2 from industrial sources and reuses it or stores the CO2 in geologic formations in order to avoid its release into the atmosphere. We utilize CO2 from industrial sources in our EOR operations, and our extensive CO2 pipeline infrastructure and operations, particularly in the Gulf Coast, are strategically located in close proximity to one of the nation’s highest concentrations of power generation, industrial and petrochemical plants. We believe that the assets and technical expertise required for CCUS are highly aligned with our existing CO2 EOR operations, which have been a significant focus for us for over 22 years.
Supportive U.S. government policy and public pressure on industrial CO2 emitters provide strong incentives for them to capture their CO2 emissions; for example, in January 2021, the IRS issued final regulations under Section 45Q of the Internal Revenue Code (“Section 45Q”) on the expanded carbon capture tax credit, implementing a number of changes and clarifications to previous regulations. The tax credit structure provides the capturing parties a tax credit that escalates until 2026, when it reaches $35 per ton for CO2 used in EOR operations or other qualified uses, and $50 per ton for CO2 directly stored in geologic formations, annually escalating for inflation thereafter. The tax credit is available for a 12-year period for qualifying facilities that begin construction before January 1, 2026. Several enhancements to Section 45Q have been discussed and proposed, including increases to the tax credit, a direct pay feature and extensions to the construction commencement deadline. In addition to the Section 45Q tax credits, some entities may be eligible for other financial incentives or benefits for products that are created through CCUS.
We believe the incentives offered under Section 45Q will drive demand for CCUS and will allow us to collect a fee for the transportation and storage of captured industrial-sourced CO2, including its utilization in our EOR operations. While a portion of the CO2 we currently utilize in our EOR operations is captured from industrial sources and qualifies as CCUS, we have historically paid a fee for that CO2 as those arrangements were entered into many years ago. As the enhanced Section 45Q regulations are relatively new, it will likely take several years for new capture facilities to be built and for dedicated storage sites to be developed.
As we seek to grow our CCUS business and pursue new CCUS opportunities, we have focused on the following strategic priorities:
•securing transportation and storage agreements with existing and new-build industrial emitters for the transport and storage of captured CO2;
•adding safe, reliable, uninterruptible and secure permanent storage capacity through development of a diverse portfolio of subsurface sequestration sites;
•increasing our carbon-negative oil production by seeking to replace the use of naturally-sourced CO2 in our EOR operations;
•preparing for a capital efficient expansion of our Green Pipeline capacity to meet expected rapid growth in demand from Gulf Coast industrial facility owners; and
•pursuing strategic partnerships throughout the CCUS value chain.
Since mid-2021, we have executed several term sheets for the future transportation and sequestration of CO2, and we continue to work with numerous third parties on definitive agreements and collaborative discussions for the transportation and storage of CO2 and development of storage sites. We believe our existing CO2 pipeline infrastructure, EOR operations, and experience and expertise in working with CO2 positions us well to be a leader in this rapidly developing industry.
OIL AND NATURAL GAS OPERATIONS
Our oil and natural gas properties are concentrated in the Gulf Coast and Rocky Mountain regions of the United States. Currently our properties with proved and producing reserves in the Gulf Coast region are situated in Mississippi, Texas, and Louisiana, and in the Rocky Mountain region are situated in Montana, Wyoming and North Dakota. Approximately 97% of our production is oil, and over two-thirds of our production is from CO2 EOR. Over time, we have grown primarily through the acquisition of mature oil fields, where we focus on increasing the value of those properties through a combination of exploitation, drilling and proven engineering extraction processes, with our most significant emphasis relating to CO2 EOR operations. Our current portfolio of CO2 EOR projects provides us significant oil production and reserve growth potential, assuming crude oil prices are at levels that support the development of those projects.
We have been conducting and expanding EOR operations on our properties in the Gulf Coast region since 1999, and as a result, we currently have many more CO2 EOR projects in this region than in the Rocky Mountain region. We began operations in the Rocky Mountain region in 2010 in connection with, and following, our merger with Encore Acquisition Company (“Encore”). In 2012, as part of a significant sale and exchange transaction with Exxon Mobil Corporation (“ExxonMobil”), we sold to ExxonMobil our Bakken area assets in North Dakota and Montana in exchange for (1) $1.3 billion in cash, (2) operating interests in Hartzog Draw and Webster fields in Wyoming and Texas, respectively, and (3) an overriding royalty interest equivalent to an approximate one-third ownership interest in ExxonMobil’s CO2 reserves in LaBarge Field in Wyoming (the “Bakken Exchange Transaction”). In the Gulf Coast region, we own what is, to our knowledge, the region’s only significant naturally occurring source of CO2, and these large volumes of naturally occurring CO2 give us a significant competitive advantage in this area. In addition to this naturally occurring CO2 source, we utilize CO2 captured from industrial sources which would otherwise be released into the atmosphere (sometimes referred to as industrial-sourced CO2) in our tertiary operations, including CO2 from the LaBarge Field in Wyoming, which is captured in conjunction with processing helium from the LaBarge Field gas stream at ExxonMobil’s Shute Creek gas plant. These industrial sources of CO2 help us recover additional oil from mature oil fields and, we believe, also provide an economical way to reduce CO2 emissions through the associated underground storage of CO2 which occurs as part of our oil-producing EOR operations.
We own and operate more than 1,300 miles of CO2 transportation pipelines. Our extensive CO2 pipeline infrastructure in the Gulf Coast and Rocky Mountain regions gives us the ability to deliver CO2 from our natural and industrial CO2 sources for use in our CO2 EOR fields, as well as to deliver CO2 to our customers who are industrial end-users of CO2 or EOR customers. In the future, we plan to utilize these same pipelines for the transportation and sequestration of CO2 in our emerging CCUS business. Our Green Pipeline currently has ample capacity to handle additional volumes, and we can further expand capacity by adding pump stations or looping sections of the pipeline.
Oil and Natural Gas Reserve Estimates
DeGolyer and MacNaughton (“D&M”) prepared estimates of our net proved oil and natural gas reserves as of December 31, 2021, 2020 and 2019 (see the summary of D&M’s report as of December 31, 2021 included as an exhibit to this Form 10-K). These estimates of reserves were prepared using an average price equal to the unweighted arithmetic average of hydrocarbon prices on the first day of each month within the 12-month period in accordance with rules and regulations of the SEC. These oil and natural gas reserve estimates do not include any value for probable or possible reserves that may exist, nor do they include any value for undeveloped acreage. The reserve estimates represent our net revenue interest in our properties.
The following table provides estimated proved reserve information prepared by D&M as of December 31, 2021, 2020 and 2019, as well as PV-10 Values and Standardized Measures for each period. The Company’s December 31, 2021 proved oil and natural gas reserve quantities and PV-10 Values increased significantly from December 31, 2020 due largely to the increase in oil prices used in preparing the December 31, 2020 and 2021 reserve information, whereby the average NYMEX oil price used in estimating our proved reserves increased from $39.57 per Bbl at December 31, 2020, to $66.56 per Bbl at December 31, 2021. There are numerous uncertainties inherent in estimating quantities of proved oil and natural gas reserves and their values, including many factors beyond our control, which are further discussed in Item 1A, Risk Factors – Estimating our reserves, production and future net cash flows is difficult to do with any certainty. See also Field Summary Table below within this
section and Supplemental Oil and Natural Gas Disclosures (Unaudited) to the consolidated financial statements for further discussion of reserve inputs and changes between periods.
| | | | | | | | | | | | | | | | | |
| | December 31, |
| | 2021 | | 2020 | | 2019 |
| Estimated proved reserves | | | | | |
| Oil (MBbls) | 188,938 | | | 140,499 | | | 226,133 | |
| Natural gas (MMcf) | 16,506 | | | 15,604 | | | 24,334 | |
| Oil equivalent (MBOE) | 191,689 | | | 143,100 | | | 230,189 | |
| Reserve volumes categories | | | | | |
| Proved developed producing | | | | | |
| Oil (MBbls) | 164,744 | | | 123,802 | | | 178,538 | |
| Natural gas (MMcf) | 14,844 | | | 14,132 | | | 21,627 | |
| Oil equivalent (MBOE) | 167,218 | | | 126,158 | | | 182,143 | |
| Proved developed non-producing | | | | | |
| Oil (MBbls) | 14,403 | | | 12,600 | | | 24,278 | |
| Natural gas (MMcf) | 1,662 | | | 1,472 | | | 2,706 | |
| Oil equivalent (MBOE) | 14,680 | | | 12,845 | | | 24,729 | |
| Proved undeveloped | | | | | |
| Oil (MBbls) | 9,791 | | | 4,097 | | | 23,317 | |
| Natural gas (MMcf) | — | | | — | | | 1 | |
| Oil equivalent (MBOE) | 9,791 | | | 4,097 | | | 23,317 | |
| Percentage of total MBOE | | | | | |
| Proved developed producing | 87 | % | | 88 | % | | 79 | % |
| Proved developed non-producing | 8 | % | | 9 | % | | 11 | % |
| Proved undeveloped | 5 | % | | 3 | % | | 10 | % |
Representative oil and natural gas prices(1) | | | | | |
| Oil (NYMEX price per Bbl) | $ | 66.56 | | | $ | 39.57 | | | $ | 55.69 | |
| Natural gas (Henry Hub price per MMBtu) | 3.60 | | | 1.99 | | | 2.58 | |
Present values (in thousands)(2) | | | | | |
Discounted estimated future net cash flows before income taxes (PV-10 Value)(3) | $ | 2,673,822 | | | $ | 703,080 | | | $ | 2,615,668 | |
Standardized measure of discounted estimated future net cash flows after income taxes (“Standardized Measure”) | $ | 2,187,051 | | | $ | 654,734 | | | $ | 2,261,039 | |
(1)The reference prices were based on the arithmetic average of the first-day-of-the-month NYMEX commodity prices for each month during the respective year. These prices do not reflect adjustments for market differentials and transportation expenses by field that are utilized in the preparation of our reserve report to arrive at the appropriate net price we receive. Further, we do not designate our oil and natural gas derivative contracts as hedging instruments for accounting purposes under the Derivatives and Hedging topic of the FASC, and as a result, the impact of these contracts is not included in the prices used in determining our reserve quantities or values. See Item 7, Management’s Discussion and Analysis of Financial Condition and Results of Operations – Results of Operations – Financial and Operating Results Tables for details of oil and natural gas prices received, both including and excluding the impact of derivative settlements.
(2)Determined based on the average first-day-of-the-month prices for each month, adjusted to prices received by the field in accordance with standards set forth in the FASC. PV-10 Values and the Standardized Measure are significantly impacted by the oil prices we receive relative to NYMEX oil prices (our NYMEX oil price differential). The weighted average oil price differentials utilized were $2.70 per Bbl below representative NYMEX oil prices as of December 31, 2021, compared to $3.73 per Bbl below NYMEX oil prices as of December 31, 2020, and $0.14 per Bbl below NYMEX oil prices as of December 31, 2019.
(3)PV-10 Value is a non-GAAP measure and is different from the Standardized Measure in that PV-10 Value is a pre-tax number and the Standardized Measure is an after-tax number. See Item 7, Management’s Discussion and Analysis of Financial Condition and Results of Operations – Non-GAAP Financial Measure and Reconciliation for further discussion.
Our proved developed non-producing reserves primarily consist of (1) reserves within a proved tertiary flood in areas that have not yet experienced a response from CO2 injection, (2) reserves that will be recovered from currently productive zones utilizing minor modifications to manage the flow of CO2 or water within the reservoir, and (3) reserves that will be recovered through recompletions to other intervals above or below the currently producing interval.
As of December 31, 2021, our estimated proved undeveloped reserves totaled approximately 9.8 MMBOE, or approximately 5% of our estimated total proved reserves. Approximately 98% (9.6 MMBOE) of our proved undeveloped oil reserves relate to planned future development within our CO2 tertiary operating fields. We generally consider the CO2 tertiary proved undeveloped reserves to be lower risk than other proved undeveloped reserves that require drilling at locations offsetting existing production, because all of these proved undeveloped reserves are associated with tertiary recovery operations in fields and reservoirs that historically produced substantial volumes of oil under primary production. As of December 31, 2021, 0.8 MMBOE of our total proved undeveloped reserves are not scheduled to be developed within five years of initial booking, all of which are part of CO2 EOR projects. We believe these reserves satisfy the conditions to be included as proved reserves because (1) we have established and continue to follow the previously adopted development plan for each of these projects; (2) we have significant ongoing development activities in each of these CO2 EOR projects and (3) we have a historical record of completing the development of comparable long-term projects.
Our proved undeveloped reserves at December 31, 2021 were 5.7 MMBOE (139%) higher than at December 31, 2020. During 2021, we spent approximately $5 million to convert 0.7 MMBOE of proved undeveloped reserves to proved developed reserves, primarily related to non-tertiary development activities at CCA. The primary changes in our proved undeveloped reserves during 2021 were related to adding an additional 3.0 MMBOE primarily related to tertiary operations at Hastings, Eucutta and Cranfield fields and 1.0 MMBOE related to the acquisition of our Wind River Basin properties, as well as recognizing net upward revisions of our proved undeveloped reserves of 2.4 MMBOE, primarily the result of the significant improvement in commodity prices between December 31, 2020 and 2021.
During 2021, we provided oil and natural gas reserve estimates for 2020 to the United States Energy Information Agency that were substantially the same as the reserve estimates included in our Form 10-K for the year ended December 31, 2020.
Internal Controls Over Reserve Estimates
Reserve information in this report is based on estimates prepared by D&M, independent petroleum engineers located in Dallas, Texas, utilizing data provided by our internal reservoir engineering team and is the responsibility of management. We rely on D&M’s expertise to ensure that our reserve estimates are prepared in compliance with SEC rules and regulations and that appropriate geologic, petroleum engineering, and evaluation principles and techniques are applied in accordance with practices generally recognized by the petroleum industry as presented in the publication of the Society of Petroleum Engineers entitled “Standards Pertaining to the Estimating and Auditing of Oil and Gas Reserves Information (Revision as of June 2019)”. The person responsible for the preparation of the reserve report is a Senior Vice President and Division Manager of North America at D&M. He received a Bachelor of Science degree in Petroleum Engineering in 2003 from Istanbul Technical University and a Master’s degree and Doctorate in Petroleum Engineering in 2005 and 2010, respectively, from Texas A&M University, and he has in excess of 11 years of experience in oil and gas reservoir studies and evaluations. Our Senior Vice President – Business Development and Technology is primarily responsible for overseeing the independent petroleum engineers during the process. Our Senior Vice President – Business Development and Technology has a Bachelor of Science degree in Petroleum Engineering from the Colorado School of Mines and over 35 years of industry experience working with petroleum engineering and reserve estimates. D&M relies on various data provided by our internal reservoir engineering team in preparing its reserve estimates, including such items as oil and natural gas prices, ownership interests, production information, operating costs, planned capital expenditures and other technical data. Our internal reservoir engineering team consists of qualified petroleum engineers who maintain the Company’s internal evaluation of reserves and compare the Company’s information to the reserves prepared by D&M. Management is responsible for designing the internal control procedures used in the preparation of our oil and gas reserves, which include verification of data input into reserve forecasting and economics evaluation software, as well as multi-discipline management reviews. The internal reservoir engineering team reports directly to our Senior Vice President – Business Development and Technology. In addition, our Audit Committee of the Board of
Directors oversees the qualifications, independence, performance and hiring of our independent petroleum engineers and reviews the final report and subsequent reporting of our oil and natural gas reserve estimates. The Chairman of the Board holds a Ph.D. in Chemical Engineering from the Massachusetts Institute of Technology and bachelor’s degrees in Chemistry and Mathematics from Capital University in Ohio. He has more than 40 years of industry experience, with responsibilities including reserves preparation and approval.
Field Summary Table. The following table provides a summary by field and region of selected proved oil and natural gas reserve information, including total proved reserve quantities as of December 31, 2021, and average daily sales volumes for 2021, all based on Denbury’s net revenue interest (“NRI”). The reserve estimates presented were prepared by D&M, independent petroleum engineers located in Dallas, Texas. We serve as operator of nearly all of our significant properties, in which we also own most of the interests, although typically less than a 100% working interest, and a lesser NRI due to royalties and other burdens. For additional oil and natural gas reserves information, see Oil and Natural Gas Reserve Estimates above and Supplemental Oil and Natural Gas Disclosures (Unaudited) in the consolidated financial statements.
| | | | | | | | | | | | | | | | | | | | | | | | | | | | | | | | | | | | | | | | | |
| Proved Reserves as of December 31, 2021(1) | | 2021 Average Daily Sales Volumes | | |
| Oil
(MBbls) | | Natural Gas
(MMcf) | | MBOEs | | % of Company Total
MBOEs | | Oil
(Bbls/d) | | Natural Gas
(Mcf/d) | | Average 2021 NRI |
| Tertiary oil and gas properties | | | | | | | | | | | | | |
| Gulf Coast region | | | | | | | | | | | | | |
| Delhi | 11,007 | | | — | | | 11,007 | | | 5.7 | % | | 2,861 | | | — | | | 58.5 | % |
| Hastings | 19,832 | | | — | | | 19,832 | | | 10.3 | % | | 4,317 | | | — | | | 80.0 | % |
| Heidelberg | 15,071 | | | — | | | 15,071 | | | 7.9 | % | | 3,921 | | | — | | | 81.2 | % |
| Oyster Bayou | 15,780 | | | — | | | 15,780 | | | 8.2 | % | | 3,833 | | | — | | | 87.4 | % |
| Tinsley | 14,879 | | | — | | | 14,879 | | | 7.8 | % | | 3,405 | | | — | | | 81.9 | % |
Other(2) | 12,795 | | | — | | | 12,795 | | | 6.7 | % | | 5,969 | | | — | | | 74.4 | % |
| Total Gulf Coast region | 89,364 | | | — | | | 89,364 | | | 46.6 | % | | 24,306 | | | — | | | 76.8 | % |
| Rocky Mountain region | | | | | | | | | | | | | |
| Bell Creek | 11,265 | | | — | | | 11,265 | | | 5.9 | % | | 4,416 | | | — | | | 84.1 | % |
Other(3) | 14,328 | | | — | | | 14,328 | | | 7.5 | % | | 4,059 | | | — | | | 33.9 | % |
| Total Rocky Mountain region | 25,593 | | | — | | | 25,593 | | | 13.4 | % | | 8,475 | | | — | | | 49.2 | % |
| Total tertiary properties | 114,957 | | | — | | | 114,957 | | | 60.0 | % | | 32,781 | | | — | | | 67.0 | % |
| Non-tertiary oil and gas properties | | | | | | | | | | | | | |
| Gulf Coast region | | | | | | | | | | | | | |
| Total Gulf Coast region | 16,985 | | | 15,888 | | | 19,633 | | | 10.2 | % | | 3,068 | | | 3,690 | | | 34.0 | % |
| Rocky Mountain region | | | | | | | | | | | | | |
Cedar Creek Anticline(4) | 55,047 | | | 6 | | | 55,048 | | | 28.7 | % | | 10,745 | | | 1,578 | | | 81.2 | % |
Other(5) | 1,949 | | | 612 | | | 2,051 | | | 1.1 | % | | 687 | | | 3,665 | | | 66.4 | % |
| Total Rocky Mountain region | 56,996 | | | 618 | | | 57,099 | | | 29.8 | % | | 11,432 | | | 5,243 | | | 79.9 | % |
| Total non-tertiary properties | 73,981 | | | 16,506 | | | 76,732 | | | 40.0 | % | | 14,500 | | | 8,933 | | | 61.4 | % |
| | | | | | | | | | | | | |
| | | | | | | | | | | | | |
| | | | | | | | | | | | | |
| Company Total | 188,938 | | | 16,506 | | | 191,689 | | | 100.0 | % | | 47,281 | | | 8,933 | | | 65.2 | % |
(1)Reserve estimates were prepared in accordance with FASC Topic 932, Extractive Industries – Oil and Gas, using the arithmetic averages of the first-day-of-the-month NYMEX commodity price for each month during 2021, which were $66.56 per Bbl for crude oil and $3.60 per MMBtu for natural gas.
(2)Includes Brookhaven, Cranfield, Eucutta, Little Creek, Mallalieu, Martinville, McComb, Soso and West Yellow Creek fields.
(3)Includes tertiary operations from Wind River Basin, as well as Salt Creek and Grieve fields.
(4)The Cedar Creek Anticline consists of a series of 13 different operating areas.
(5)Includes non-tertiary operations from Wind River Basin, as well as Hartzog Draw and Bell Creek fields.
Enhanced Oil Recovery Overview. EOR using CO2 is one of the most efficient tertiary recovery mechanisms for producing crude oil. When injected under pressure into underground, oil-bearing rock formations, CO2 acts somewhat like a solvent as it travels through the reservoir rock, mixing with and modifying the characteristics of the oil so it can be produced and sold. The terms “tertiary flood,” “CO2 flood” and “CO2 EOR” are used interchangeably throughout this document.
While enhanced oil recovery projects utilizing CO2 have been successfully performed by numerous oil and gas companies in a wide range of oil-bearing reservoirs in different oil-producing basins, we believe our investments, experience and acquired knowledge give us a strategic and competitive advantage in the areas in which we operate. We apply what we have learned and developed over the years to improve and increase sweep efficiency within the CO2 EOR projects we operate.
We began our CO2 operations in August 1999, when we acquired Little Creek Field, followed by our acquisition of Jackson Dome CO2 reserves and the NEJD pipeline in 2001. Based upon our success at Little Creek and the ownership of the CO2 reserves, we began to transition our capital spending and acquisition efforts to focus more heavily on CO2 EOR and, over time, transformed our strategy to focus primarily on owning and operating oil fields that are well suited for CO2 EOR projects. Prior to tertiary flooding, we strive to maximize the currently sizeable primary and secondary production from our prospective tertiary fields and from fields in which tertiary floods have commenced but still contain significant non-tertiary production. Our asset base today almost entirely consists of, or otherwise relates to, oil fields that we are currently flooding with CO2 or plan to flood with CO2 in the future, or assets that produce CO2.
Although the up-front cost of tertiary production infrastructure and time to construct pipelines and production facilities is greater than in primary oil recovery in most circumstances, we believe tertiary recovery has several favorable, offsetting and unique attributes, including:
•a lower exploration risk, as we are operating oil fields that have significant historical production and reservoir and geological data;
•lower production decline rates than unconventional development;
•reasonable return metrics at currently anticipated long-term prices;
•limited competition for this recovery method in our geographic regions and a strategic advantage due to our ownership of the CO2 reserves and CO2 pipeline infrastructure;
•being generally less disruptive to new habitats in comparison to other oil and natural gas development because we further develop existing (as opposed to new) oil fields; and
•allowing us to concurrently store CO2 captured from industrial sources in the same underground formations that previously trapped and stored oil and natural gas.
Our tertiary operations represent 67% of our 2021 total production (on a BOE basis). At year-end 2021, the proved oil reserves in our tertiary recovery oil fields had an estimated PV-10 Value of approximately $1.8 billion, or 66% of our total PV-10 Value, and represented 60% of our total proved reserves. In addition, there are significant probable and possible reserves at several other fields for which tertiary operations are underway or planned.
Gulf Coast Region Assets
CO2 Sources and Pipelines
Natural CO2 Sources
Jackson Dome. Our primary Gulf Coast CO2 source, Jackson Dome, located near Jackson, Mississippi, was discovered during the 1970s by oil and gas companies that were exploring for hydrocarbons. This large and relatively pure source of naturally occurring CO2 (98% CO2) is, to our knowledge, the only significant underground deposit of CO2 in the United States east of the Mississippi River. We acquired Jackson Dome in February 2001 in a purchase that also gave us ownership and control of the NEJD CO2 pipeline and provided us with a reliable supply of CO2 at a reasonable and predictable cost for our Gulf Coast CO2 tertiary recovery operations. Together with its related CO2 pipeline infrastructure, Jackson Dome provides us a significant competitive advantage in the acquisition and development of properties in Mississippi, Louisiana and southeastern Texas that are well suited for CO2 EOR.
Since 2001, we have drilled numerous CO2-producing wells, significantly increasing our estimated proved Gulf Coast CO2 reserves at Jackson Dome from approximately 800 Bcf at the time of acquisition to approximately 4.5 Tcf as of December 31, 2021. The proved CO2 reserve estimates are based on a gross (8/8ths) basis, of which our net revenue interest is approximately 3.6 Tcf, and is included in the evaluation of proved CO2 reserves prepared by D&M, independent petroleum engineers. In discussing our available CO2 reserves, we make reference to the gross amount of proved and probable reserves, as this is the amount that is available both for our own tertiary recovery programs and for our customers who are industrial end-users of CO2 or EOR customers, as we are responsible for distributing the entire CO2 production stream.
In addition to our proved reserves, we estimate that we have 910.1 Bcf, on a gross (8/8ths) basis, of probable CO2 reserves at Jackson Dome. While the majority of these probable reserves are located in structures that have been drilled and tested, such reserves are still considered probable reserves because (1) the original well is plugged; (2) they are located in fault blocks that are immediately adjacent to fault blocks with proved reserves; or (3) they are reserves associated with increasing the ultimate recovery factor from our existing reservoirs with proved reserves. In addition, a significant portion of these probable reserves at Jackson Dome are located in undrilled structures where we have sufficient subsurface and seismic data indicating geophysical attributes that, coupled with our historically high drilling success rate, provide a reasonably high degree of certainty that CO2 is present.
Industrial-sourced CO2
In addition to our naturally occurring CO2 source at Jackson Dome, in our tertiary operations we utilize CO2 captured from industrial sources which would otherwise be released into the atmosphere. Industrial sources of CO2 help us recover additional oil from mature oil fields and, we believe, also provide an economical way to reduce CO2 emissions through the associated underground storage of CO2 which occurs as part of our oil-producing EOR operations (see Carbon Capture, Use and Storage below). In the Gulf Coast, we are currently party to two long-term contracts to purchase CO2: an industrial facility in Port Arthur, Texas and an industrial facility in Geismar, Louisiana, which combined supplied an average of approximately 63 MMcf/d of CO2 to our EOR operations during 2021. During the year ended December 31, 2021, approximately 15% of the CO2 utilized in our Gulf Coast oil and gas operations was industrial-sourced CO2.
In the Gulf Coast region, approximately 77% of our average daily CO2 produced from Jackson Dome or captured from industrial sources in 2021 was used in our tertiary recovery operations, compared to 78% in 2020 and 84% in 2019, with the balance delivered to third-party industrial end-users or EOR customers. During 2021, we used an average of 407 MMcf/d of CO2 (including CO2 captured from industrial sources) for our tertiary activities.
Gulf Coast CO2 Pipelines. We acquired the 183-mile NEJD CO2 pipeline that runs from Jackson Dome to near Donaldsonville, Louisiana, as part of the 2001 acquisition of our Jackson Dome CO2 source. Since 2001, we have acquired or constructed nearly 750 miles of CO2 pipelines in the Gulf Coast, and as of December 31, 2021, we own nearly 925 miles of CO2 pipelines, which gives us the ability to deliver CO2 throughout the Gulf Coast region.
Completion of the Green Pipeline allowed for the first CO2 injection into Hastings Field, located near Houston, Texas, in 2010, and gives us the ability to deliver CO2 to oil fields all along the Gulf Coast from Baton Rouge, Louisiana, to Alvin, Texas. At the present time, most of the CO2 flowing in the Green Pipeline is delivered from the Jackson Dome area, but also includes the CO2 we are receiving from the industrial facilities in Port Arthur, Texas and Geismar, Louisiana, and we are currently transporting a third party’s CO2 for a fee to the sales point at Hastings Field. We currently have ample capacity within the Green Pipeline to handle additional volumes that may be required to develop our inventory of CO2 EOR projects in this
area, as well as to support the transportation of CO2 for the emerging CCUS business. The following table summarizes our most significant CO2 pipelines owned and operated in the Gulf Coast region as of December 31, 2021:
| | | | | | | | | | | | | | | | | | | | | | | | | | |
CO2 pipelines | | Completion Date | | Pipeline Diameter
(in inches) | | Pipeline Mileage | | Service Area |
| Green Pipeline | | 2010 | | 24” | | 320 | | Gulf Coast corridor from near Donaldsonville, Louisiana to Hastings Field in Texas; including connections to 2 industrial-source CO2 providers |
| NEJD Pipeline | | 1986 | | 20” | | 183 | | Jackson Dome CO2 source to Green Pipeline connection |
| Delta Pipeline | | 2009 | | 24” | | 111 | | Jackson Dome CO2 source to Delhi Field in Louisiana |
| Free State Pipeline | | 2005 | | 20” | | 91 | | Jackson Dome CO2 source to West Yellow Creek in Mississippi |
| West Gwinville | | 1959/2008(1) | | 18” | | 51 | | NEJD Pipeline to Cranfield Field |
(1)Repurposed from a natural gas pipeline to a CO2 pipeline in 2008.
Oil Fields
Delhi Field. Delhi Field is located east of Monroe, Louisiana. In May 2006, we purchased our initial interest in Delhi for $50 million. We began well and facility development in 2008, began delivering CO2 to the field in 2009 via the Delta Pipeline, and first tertiary production occurred at Delhi Field in 2010. During 2016, we completed construction of a natural gas liquids extraction plant, which provides us with the ability to sell natural gas liquids from the produced stream, improves the efficiency of the CO2 flood, and utilizes extracted methane to power the plant and reduce field operating expenses. Our 2022 development plans include the purchase and installation of an inlet heat exchanger to increase production reliability and reduce costs.
Hastings Field. Hastings Field is located south of Houston, Texas. We acquired a majority interest in this field in February 2009 for $247 million. We initiated CO2 injection in the West Hastings Unit during 2010 upon completion of the construction of the Green Pipeline. Due to the large vertical oil column that exists in the field, we are developing the Frio reservoir using dedicated CO2 injection and producing wells for each of the major sand intervals. We began producing oil from our EOR operations at Hastings Field in 2012, and we booked initial proved tertiary reserves for the West Hastings Unit in 2012.
Heidelberg Field. Heidelberg Field is located in Mississippi off of the Free State Pipeline and consists of an East Unit and a West Unit. Construction of the CO2 facility, connecting pipeline and well work commenced on the West Heidelberg Unit during 2008, with our first CO2 injections into the Eutaw zone. Our first tertiary oil production occurred in 2009, and we began flooding the Christmas and Tuscaloosa zones in 2013 and 2014, respectively. During 2019, we expanded our tertiary flood of the Christmas zone and invested in non-tertiary behind pipe projects. Our 2022 development plans include developing the remaining CO2 flood in the Tuscaloosa reservoir at East Heidelberg.
Oyster Bayou Field. We acquired a majority interest in Oyster Bayou Field in 2007. The field is located in southeast Texas, east of Galveston Bay, and is somewhat unique when compared to our other CO2 EOR projects because the field covers a relatively small area of 3,912 acres. We began CO2 injections into Oyster Bayou Field in 2010, commenced tertiary production in 2011 from the Frio A-1 zone, and booked initial proved tertiary reserves for the field in 2012. Our 2022 development plans include additional A-2 zone development.
Tinsley Field. We acquired Tinsley Field in 2006. This Mississippi field was discovered and first developed in the 1930s and is separated by different fault blocks. As is the case with the majority of fields in Mississippi, Tinsley Field produces from multiple reservoirs. Our CO2 enhanced oil recovery operations at Tinsley Field have thus far targeted the Woodruff formation, although there is additional potential in the Perry sandstone and other smaller reservoirs. We commenced tertiary oil production from Tinsley Field in 2008 and substantially completed development of the Woodruff formation during 2014. Although production from Tinsley Field peaked in 2015 and is generally on decline, we continue to evaluate future potential investment opportunities in this field.
Future Gulf Coast Tertiary Opportunities. Future development projects beyond 2022 may include additional opportunities at Tinsley Field’s Perry sandstone reservoir and expansion of our existing CO2 floods. In addition to our existing CO2 floods, we continue to evaluate tertiary potential in our non-tertiary properties such as Webster, Conroe and Thompson fields, the development of which is primarily dependent upon capital availability and priorities, future oil prices and in some cases pipeline construction.
Rocky Mountain Region Assets
CO2 Sources and Pipelines
LaBarge Field. We acquired an overriding royalty interest equivalent to an approximate one-third ownership interest in ExxonMobil’s CO2 reserves in LaBarge Field in the fourth quarter of 2012 as part of the Bakken Exchange Transaction. LaBarge Field is located in southwestern Wyoming, and as of December 31, 2021, our interest in LaBarge Field held approximately 1.0 Tcf of proved CO2 reserves.
During 2021, we received an average of approximately 110 MMcf/d of CO2 from the Shute Creek gas processing plant at LaBarge Field that we used in our Rocky Mountain region CO2 floods or sold to another third-party operator. Based on current capacity, and subject to availability of CO2, we currently expect our CO2 volumes from Shute Creek to increase in future years. We pay ExxonMobil a fee to process and deliver the CO2, which we use in our Rocky Mountain region CO2 floods.
Other Rocky Mountain CO2 Sources. We have a contract in place to receive all of the CO2 from the Lost Cabin gas plant in central Wyoming, which we estimate has the capability to provide us as much as 30 MMcf/d of CO2 for use in our Rocky Mountain region CO2 floods. We did not receive any CO2 volumes from this source in 2021 but expect to receive CO2 from this source in 2022. We currently estimate that our existing CO2 sources, plus additional CO2 from those or other CO2 sources in the region, are sufficient to carry out our Rocky Mountain region EOR development plans.
Rocky Mountain CO2 Pipelines. The 20-inch Greencore Pipeline in Wyoming is the first CO2 pipeline we constructed in the Rocky Mountain region. The 232-mile pipeline begins at the Lost Cabin gas plant in Wyoming and terminates at Bell Creek Field in Montana. We completed construction of the pipeline in 2012 and received our first CO2 deliveries from the Lost Cabin gas plant during 2013. During 2014, we completed construction of an interconnect between our Greencore Pipeline and an existing third-party CO2 pipeline in Wyoming, which enables us to transport CO2 from LaBarge Field to our Bell Creek Field. In 2021, we completed construction of the CCA CO2 pipeline, which delivers CO2 to our new tertiary development project at CCA. The following table summarizes our most significant CO2 pipelines owned and operated in the Rocky Mountain region as of December 31, 2021:
| | | | | | | | | | | | | | | | | | | | | | | | | | |
CO2 pipelines | | Completion Date | | Pipeline Diameter
(in inches) | | Pipeline Mileage | | Service Area |
Greencore Pipeline | | 2012 | | 20” | | 232 | | Lost Cabin gas plant in Wyoming to Bell Creek Field in Montana |
| CCA Pipeline | | 2021 | | 16” | | 105 | | Bell Creek Field in Montana to CCA |
| Beaver Creek Pipeline | | 2008 | | 8” | | 46 | | Wyoming Wind River Basin properties |
Oil Fields
Cedar Creek Anticline. CCA is the largest property that we own and currently our largest producing property, contributing approximately 23% of our 2021 total sales volumes. Historical production from the property has primarily been from the Red River interval. The field is primarily located in Montana but extends over such a large area (approximately 126 miles) that it also extends into North Dakota. CCA is a series of 13 different operating areas on a common geological trend, each of which could be considered a field by itself. We acquired our initial interest in CCA as part of the Encore merger in 2010 and acquired additional interests from a wholly-owned subsidiary of ConocoPhillips in 2013 for $1.0 billion, adding 42.2 MMBOE of incremental proved reserves at that date.
During November 2021, we completed a 105-mile CO2 pipeline from Bell Creek Field to CCA. Our first CO2 injections in CCA’s Red River formation commenced in early February 2022, and tertiary oil production response is anticipated in the
second half of 2023. Our CCA EOR development utilizes 100% industrial-sourced CO2. Incremental peak production from phase 1 development is expected to range from 7,500 BOE/d to 12,500 Bbls/d, net to our interest. During 2022, we currently plan for a CO2 pilot project targeting the Interlake formation and to drill additional non-tertiary wells in other oil-bearing intervals including Mission Canyon and the Charles B formation. Future phases of CCA CO2 EOR development are expected to target the Interlake, Stony Mountain and Red River formations across the various fields within CCA, with full development at CCA potentially spanning multiple decades.
Wind River Basin. During March 2021, we acquired a nearly 100% working interest (approximately 83% net revenue interest) in the Big Sand Draw and Beaver Creek EOR fields located in Wyoming, including surface facilities and a 46-mile CO2 transportation pipeline to the acquired fields. The acquisition purchase price was $10.9 million cash (after final closing adjustments) plus two contingent $4 million cash payments if NYMEX WTI oil prices average at least $50 per Bbl during each of 2021 and 2022. Wind River Basin sales averaged approximately 2,879 BOE/d during the fourth quarter of 2021 utilizing 100% industrial-sourced CO2. During 2022, we plan to further develop the Beaver Creek Madison EOR flood expansion.
Bell Creek Field. The oil-producing reservoir in Bell Creek Field is a sandstone reservoir with characteristics similar to those we have successfully flooded with CO2 in the Gulf Coast region. We began first CO2 injections into Bell Creek Field in 2013, completed the phase five expansion in 2018, and commenced CO2 injection in the phase six field development in April 2019. Although production from Bell Creek Field peaked during the second quarter of 2019 and is generally on decline, we continued to see new production from the phase six expansion during 2021. During 2022, we intend to drill a new phase six horizontal well, along with additional wells in other areas.
Future Rocky Mountain Tertiary Opportunities. In addition to the oil fields described above, we continue to evaluate tertiary potential in Hartzog Draw Field located in the Powder River Basin of northeastern Wyoming, the development of which is primarily dependent upon capital availability and priorities and future oil prices. The field is located approximately 12 miles from our Greencore Pipeline.
Oil and Gas Acreage, Productive Wells and Drilling Activity
In the data below, “gross” represents the total acres or wells in which we own a working interest and “net” represents the gross acres or wells multiplied by our working interest percentage. For the wells that produce both oil and gas, the well is typically classified as an oil or natural gas well based on the ratio of oil to natural gas production.
Oil and Gas Acreage
The following table sets forth our acreage position at December 31, 2021:
| | | | | | | | | | | | | | | | | | | | | | | | | | | | | | | | | | | |
| | Developed | | Undeveloped | | Total |
| | Gross | | Net | | Gross | | Net | | Gross | | Net |
| Gulf Coast region | 188,978 | | | 147,860 | | | 286,700 | | | 17,980 | | | 475,678 | | | 165,840 | |
| Rocky Mountain region | 385,858 | | | 343,711 | | | 110,390 | | | 22,862 | | | 496,248 | | | 366,573 | |
| Total | 574,836 | | | 491,571 | | | 397,090 | | | 40,842 | | | 971,926 | | | 532,413 | |
The percentage of our net undeveloped acreage that is subject to expiration over the next three years, if not renewed, is less than 1% in 2022, approximately 5% in 2023 and none in 2024.
Productive Wells
The following table sets forth our gross and net productive oil and natural gas wells as of December 31, 2021:
| | | | | | | | | | | | | | | | | | | | | | | | | | | | | | | | | | | |
| | Producing Oil Wells | | Producing Natural Gas Wells | | Total |
| | Gross | | Net | | Gross | | Net | | Gross | | Net |
| Operated wells | | | | | | | | | | | |
| Gulf Coast region | 1,032 | | | 907 | | | 125 | | | 116 | | | 1,157 | | | 1,023 | |
| Rocky Mountain region | 948 | | | 914 | | | 267 | | | 236 | | | 1,215 | | | 1,150 | |
| Total | 1,980 | | | 1,821 | | | 392 | | | 352 | | | 2,372 | | | 2,173 | |
| Non-operated wells | | | | | | | | | | | |
| Gulf Coast region | 46 | | | 19 | | | — | | | — | | | 46 | | | 19 | |
| Rocky Mountain region | 583 | | | 131 | | | 77 | | | 28 | | | 660 | | | 159 | |
| Total | 629 | | | 150 | | | 77 | | | 28 | | | 706 | | | 178 | |
| Total wells | | | | | | | | | | | |
| Gulf Coast region | 1,078 | | | 926 | | | 125 | | | 116 | | | 1,203 | | | 1,042 | |
| Rocky Mountain region | 1,531 | | | 1,045 | | | 344 | | | 264 | | | 1,875 | | | 1,309 | |
| Total | 2,609 | | | 1,971 | | | 469 | | | 380 | | | 3,078 | | | 2,351 | |
Drilling Activity
The following table sets forth the results of our drilling activities over the last three years. As of December 31, 2021, we did not have any wells in progress.
| | | | | | | | | | | | | | | | | | | | | | | | | | | | | | | | | | | |
| | Year Ended December 31, |
| | 2021 | | 2020 | | 2019 |
| | Gross | | Net | | Gross | | Net | | Gross | | Net |
Exploratory wells(1) | | | | | | | | | | | |
Productive(2) | — | | | — | | | — | | | — | | | 1 | | | 1 | |
Non-productive(3) | — | | | — | | | — | | | — | | | — | | | — | |
Development wells(1)(4) | | | | | | | | | | | |
Productive(2) | 12 | | | 4 | | | 5 | | | 3 | | | 19 | | | 18 | |
Non-productive(3)(5) | 1 | | | — | | | — | | | — | | | — | | | — | |
| Total | 13 | | | 4 | | | 5 | | | 3 | | | 20 | | | 19 | |
(1)An exploratory well is a well drilled to find a new field or to find a new reservoir in a field previously found to be productive of oil or natural gas in another reservoir. Generally, an exploratory well is any well that is not a development well, an extension well, a service well or a stratigraphic test well. A development well is a well drilled within the proved area of an oil or gas reservoir to the depth of a stratigraphic horizon known to be productive.
(2)A productive well is an exploratory or development well drilled and completed during the year and found to be capable of producing either oil or natural gas in sufficient quantities to justify completion as an oil or natural gas well.
(3)A non-productive well is an exploratory or development well that is not a productive well.
(4)Includes 8 productive gross wells and 1 non-productive gross well during 2021, and 2 productive gross wells during 2020, in which we incurred no cost but have an overriding royalty interest prior to the combined payout of the wells. Subsequent to payout, Denbury will hold and bear the cost of its working interest in each well.
(5)During 2019, an additional 7 wells were drilled for water or CO2 injection purposes. There were no wells drilled during 2021 or 2020 for water or CO2 injection purposes.
Sales Volumes and Unit Prices
The following table summarizes sales volumes, sales prices and production cost information for our net oil and natural gas production for the years ended December 31, 2021, 2020 and 2019:
| | | | | | | | | | | | | | | | | |
| | Year Ended December 31, |
| | 2021 | | 2020 | | 2019 |
| Net sales volumes | | | | | |
| Gulf Coast region | | | | | |
| Oil (MBbls) | 9,991 | | | 10,958 | | | 12,638 | |
| Natural gas (MMcf) | 1,347 | | | 1,612 | | | 1,779 | |
| Total Gulf Coast region (MBOE) | 10,216 | | | 11,227 | | | 12,935 | |
| Rocky Mountain region | | | | | |
| Oil (MBbls) | 7,266 | | | 7,278 | | | 8,047 | |
| Natural gas (MMcf) | 1,914 | | | 1,293 | | | 1,595 | |
| Total Rocky Mountain region (MBOE) | 7,585 | | | 7,494 | | | 8,313 | |
Total Company (MBOE)(1) | 17,801 | | | 18,721 | | | 21,248 | |
| | | | | |
| Average sales prices – excluding impact of derivative settlements | | | | | |
| Gulf Coast region | | | | | |
| Oil (per Bbl) | $ | 66.48 | | | $ | 38.44 | | | $ | 60.32 | |
| Natural gas (per Mcf) | 3.97 | | | 1.98 | | | 2.49 | |
| | | | | |
| Rocky Mountain region | | | | | |
| Oil (per Bbl) | $ | 66.58 | | | $ | 36.79 | | | $ | 55.02 | |
| Natural gas (per Mcf) | 3.44 | | | 0.77 | | | 1.57 | |
| | | | | |
| Total Company | | | | | |
| Oil (per Bbl) | $ | 66.52 | | | $ | 37.78 | | | $ | 58.26 | |
| Natural gas (per Mcf) | 3.66 | | | 1.44 | | | 2.06 | |
| | | | | |
Average production cost (per BOE sold)(2) | | | | | |
Gulf Coast region(3) | $ | 22.50 | | | $ | 18.20 | | | $ | 22.49 | |
| Rocky Mountain region | 25.67 | | | 19.63 | | | 22.40 | |
Total Company(3) | 23.85 | | | 18.78 | | | 22.46 | |
(1)Total Company sales volumes include 71 MBOE and 474 MBOE related to properties divested during 2020 and 2019, respectively.
(2)Excludes oil and natural gas ad valorem and production taxes.
(3)Production costs during 2021 include a $16.1 million benefit resulting from compensation under certain of the Company’s power agreements for power interruption during the severe weather storm in February 2021 which created widespread power outages in Texas and disrupted the Company’s operations. If these amounts were excluded, production cost per BOE for the Gulf Coast region and total Company would have averaged $24.07 and $24.75, respectively, for the year ended December 31, 2021. In addition, production costs during 2020 include insurance reimbursements of $15.4 million related to recovery of prior years’ expenses. If these amounts were excluded, production cost per BOE for the Gulf Coast region and total Company would have averaged $19.58 and $19.60, respectively, for the year ended December 31, 2020.
Further information regarding average sales volumes, unit sales prices and unit costs per BOE are set forth under Item 7, Management’s Discussion and Analysis of Financial Condition and Results of Operations – Results of Operations – Financial and Operating Results Tables, included herein.
TITLE TO PROPERTIES
As is customary in the oil and natural gas industry, Denbury conducts a limited title examination at the time of its acquisition of properties or leasehold interests targeted for enhanced recovery, and curative work is performed with respect to significant defects on higher-value properties of the greatest significance. We believe that title to our oil and natural gas properties is good and defensible, subject only to such exceptions that we believe do not materially interfere with the use of such properties, including encumbrances, easements, restrictions and royalty, overriding royalty and other similar interests.
SIGNIFICANT OIL AND GAS PURCHASERS AND PRODUCT MARKETING
Oil and natural gas sales are made on a day-to-day basis or under short-term contracts at the current area market price. We would not expect the loss of any single purchaser to have a material adverse effect upon our operations; however, the loss of a large single purchaser could potentially reduce the competition for our oil and natural gas production, which in turn could negatively impact the prices we receive. For the year ended December 31, 2021, four purchasers each accounted for 10% or more of our oil and natural gas revenues: Plains Marketing LP (28%), Hunt Crude Oil Supply Company (12%), Marathon Petroleum (11%) and Sunoco Inc. (11%).
Our ability to market oil and natural gas depends on many factors beyond our control, including the extent of domestic production and imports of oil and natural gas, available oil storage at Cushing, Oklahoma, and other inventory hubs, the proximity of our oil and natural gas production to pipelines and corresponding markets, the available capacity in such pipelines, the demand for oil and natural gas, the effects of weather, and the effects of state and federal regulation. While we have not experienced significant difficulty in finding a market for our production as it becomes available or in transporting our production to those markets, there is no assurance that we will always be able to market all of our production or obtain favorable prices.
Oil Marketing and Differentials
Prices received in a regional market fluctuate frequently and can differ from NYMEX pricing due to a variety of reasons, including supply and/or demand factors, crude oil quality and location differentials. With the recent exception of 2020 and 2021, our crude oil prices in the Gulf Coast region have generally been positive to NYMEX and highly correlated to the changes in prices of crude oil sold under Light Louisiana Sweet (“LLS”) index. Our current markets at various sales points along the Gulf Coast have sufficient demand to accommodate our production, but there can be no assurance of future demand.
The marketing of our Rocky Mountain region oil production is dependent on transportation through local pipelines to our primary market centers in Guernsey, Wyoming and Cushing, Oklahoma, although some of our production may ultimately be transported by third parties to Wood River, Illinois. Shipments on some of the pipelines are at or near capacity and may be subject to apportionment. We currently have access to, or have contracted for, sufficient pipeline capacity to move our oil production; however, there can be no assurance that we will be allocated sufficient pipeline capacity to move all of our oil production in the future. Because local demand for production is small in comparison to current production levels, much of the production in the Rocky Mountain region is transported to markets outside of the region. Therefore, prices in the Rocky Mountain region are further influenced by fluctuations in prices (primarily Brent and LLS) in coastal markets and by available pipeline capacity in the Midwest and Cushing markets.
COMPETITION AND MARKETS
We face competition from other oil and natural gas companies in all aspects of our business, including acquisition of producing properties, oil and gas leases, drilling rights, and CO2 properties; marketing of oil and natural gas; and obtaining and maintaining goods, services and labor. Many of our competitors have substantially larger financial and other resources. Factors that affect our ability to acquire producing properties include available liquidity, available information about prospective properties and our expectations for earning a minimum projected return on our investments. Because of the primary nature of our core assets (our tertiary operations) and our ownership of relatively uncommon significant natural sources
of CO2 in the Gulf Coast and Rocky Mountain regions, we believe that we are effective in competing in the market and have less competition than our peers in certain aspects of our business.
CLIMATE CHANGE AND ENVIRONMENTAL CONSIDERATIONS
Climate change is a continuing global concern for governments, businesses, and society. The reduction of carbon emissions is important, and we take the responsibility of protecting our environment seriously. Part of our obligation is to report greenhouse gas emissions and develop procedures and methods to collect data critical for calculating these emissions. In addition, our operating strategy, which focuses on CO2 EOR and CCUS, has measurable environmental benefits. We are committed to utilizing emerging technologies, where feasible, to capture or reduce emissions and to improve our carbon efficiency.
We strive to be environmentally responsible in all aspects of our operations. Our operations have been subject to federal, state and local environmental compliance for many years, the costs of which are well integrated into our budgeting and our operating results. With our focus on CO2 EOR, we offer environmental benefits not generally associated with oil and gas operations. We utilize technology and techniques that reduce the risks to, and impacts on, the environment. Our programs include measures to prevent spills and releases and to quickly respond to incidents if they do occur; efforts to manage, minimize and remediate our environmental impacts; and an operating strategy that is conscious of our carbon footprint.
As the world demands energy to fuel tomorrow’s economy and provide a better quality of life, we must meet the demand with a focus on reducing CO2 emissions. The Greenhouse Gas Protocol Corporate Accounting and Reporting Standard classifies a company’s greenhouse gas emissions into three scopes: Scope 1 emissions are direct emissions from owned or controlled sources; Scope 2 emissions are indirect emissions from the generation of purchased energy; and Scope 3 emissions are all indirect emissions (not included in Scope 2) that occur in the value chain of the reporting company, including both upstream and downstream emissions. The utilization of industrial-sourced CO2 in EOR significantly reduces the carbon footprint of our oil production, making our Scope 1 and 2 CO2 emissions negative today. We have set a target to fully offset our emissions, including Scope 3 emissions associated with the refining and combustion of our produced hydrocarbons, within this decade.
In our Corporate Responsibility Report, which is published on our website, we report in detail our direct greenhouse gas emissions resulting from our operations, as well as indirect greenhouse gas emissions associated with the consumption of electricity.
In addition, we are committed to engaging with stakeholders, policy makers, regulators, and our industry on climate change issues and to addressing our impact on the environment. The Sustainability and Governance Committee of the Board of Directors oversees our health and safety, climate change, environmental, social and community policies, practices and procedures. The Committee focuses upon climate change risk management and strategy, CCUS activities, sustainability targets, operating efficiencies and asset retirement obligations, along with broader community climate change concerns.
HUMAN CAPITAL RESOURCES
We recognize that our employees are crucial to Denbury’s future, and we care about our employees’ and their families’ well-being beyond the work environment. As of December 31, 2021, we had 716 employees, of whom 402 were employed in our field operations or at our field offices and 314 were employed at our headquarters in Plano, TX, none of whom are currently covered by a labor union or other collective bargaining arrangement.
Workforce Health and Safety
We continuously seek to improve our health and safety performance by fostering a culture that prioritizes safe work, then ensuring that this culture is exemplified in all levels of leadership. We provide our employees with tools to succeed, including relevant and timely training, and we monitor our performance using established measurement statistics. With oversight from the Sustainability and Governance Committee of the Company’s Board of Directors, each year, Denbury establishes corporate goals specifically related to employee and contractor safety performance and monitors progress toward those goals throughout the year using performance metrics. Results are regularly reported to our Board of Directors, senior management and all employees to ensure accountability and to reinforce their importance. Two safety performance metrics Denbury closely monitors are the Total Recordable Incident Rate (“TRIR”) and the Significant Injury or Fatality Rate (“SIFR”), which also
captures near misses that may not have resulted in an injury. We have set new record lows for TRIR over the last five consecutive years and our 2021 SIFR was our lowest ever.
We have implemented numerous health and safety protocols in response to the COVID-19 pandemic. Our COVID-19 task force, comprised of members of senior management and other key employees, has developed a systematic, data-based approach to monitor national, state and local orders and guidelines related to the COVID-19 pandemic, established internal processes, training and communications, conducted contact tracing, and engaged a third-party medical consulting firm to identify and clear COVID-19 cases and exposures. Additionally, we continue to provide voluntary COVID-19 testing for all employees and their dependents and ensure that necessary sanitation supplies are available at all Denbury offices and locations.
Compensation and Benefits
As part of our compensation philosophy, we believe that we must offer and maintain competitive compensation and benefit programs for our employees in order to attract and retain outstanding talent. In addition to competitive base wages, other benefit programs include an annual bonus plan, long-term incentive plan, Company matched 401(k) plan, healthcare and insurance benefits, health savings and flexible spending accounts and employee assistance programs.
Diversity and Inclusion
We understand the importance of, and are committed to increasing, diversity and fostering an inclusive work environment that supports the workforce and the communities where we operate. Denbury strives to ensure equal opportunity in recruitment and reaching a pool of diverse candidates by utilizing a digital recruiting program that posts available employment opportunities to websites worldwide, several of which are specifically targeted to reach diverse candidates. In 2021, women and minorities accounted for 21% and 16% of our workforce, respectively, and 20% and 26% of our new hires, respectively.
Our diversity, equity and inclusion principles are also reflected in our employee training and policies. To foster a diverse and collaborative workplace, Denbury requires all employees to complete annual training to raise awareness and encourage diversity and inclusion. Each year, our employee training program includes courses related to diversity, anti-discrimination, and anti-harassment to help employees better appreciate diversity, cultural differences, recognize unconscious biases, and increase collaboration. We continue to enhance our diversity, equity and inclusion policies which are guided by our Board of Directors and executive leadership team.
Talent Acquisition, Retention and Development
Our success depends to a significant degree upon our ability to hire, develop, and retain highly skilled and experienced personnel, including our executive officers as well as other key management and technical specialists, such as geologists, geophysicists, engineers and other oil and gas industry professionals. Denbury provides employees with many ways to expand their skills and advance their careers through training and development initiatives. We believe this is critical to each employee’s professional growth and success, as well as to our success as a company.
Human Rights
Denbury is committed to protecting human rights in the workplace. This commitment includes respecting the dignity and worth of all individuals, encouraging all individuals to reach their full potential, encouraging the initiative of each employee, and providing equal opportunity for development to all employees. Specifically, Denbury recognizes its responsibility with regards to: workplace health and safety, the prohibition of forced and child labor, a workplace free from harassment or any form of discrimination, freedom of association, complying with all laws regarding hours and wages and employee privacy. Denbury respects international human rights principles and our commitments to human rights are guided by the United National Global Compact and the International Labor Organization’s Declaration of Fundamental Principals and Rights at Work. Our Code of Conduct and Human Rights Policy require employees to report any suspected human rights abuses. Denbury’s Human Rights Policy is available on our website at www.denbury.com under the “Sustainability” link.
FEDERAL AND STATE REGULATIONS
Numerous federal, state and local laws and regulations govern the oil and gas industry. Additions or changes to these laws and regulations are often made in response to the current political or economic environment. Compliance with the evolving
regulatory landscape is often difficult, and noncompliance can result in substantial penalties or the potential shutdown of operations. Compliance has also been complicated by an increasing trend for litigation challenging policy and regulatory changes, with judicial decisions increasing regulatory uncertainty, often delaying necessary approvals from agencies that may be the subject of conflicting injunctions, rulings or appeals. Additionally, the future annual cost of complying with all laws and regulations applicable to our operations is uncertain and will be ultimately determined by several factors, including future changes to legal and regulatory requirements. Management believes that continued compliance with existing laws and regulations applicable to our operations and future compliance therewith will not have a materially adverse effect on our consolidated financial position, results of operations or cash flows, although such laws and regulations, and compliance therewith, could cause significant delays or otherwise impede operations, which may, among other things, cause our expected production rates and cash flows to be less than anticipated.
The following sections describe some specific laws and regulations that may affect us. We cannot predict the cost or impact of these or other future legislative or regulatory initiatives.
Regulation of Oil and Gas Exploration and Production
Our operations are subject to various types of laws and regulations at the federal, state and local levels. Such regulation includes requiring sometimes lengthy environmental review prior to approval of potential leasing, drilling, or other development projects; permits for drilling wells; maintaining bonding requirements in order to drill or operate wells and regulating the location of wells; the method of drilling and casing wells; the surface use and restoration of properties upon which wells are drilled; the compensation due to surface, and potentially pore space, owners for mineral development, enhanced oil recovery, and fluid disposal activities; the plugging and abandoning of wells; and the composition or disposal of chemicals and fluids used in connection with operations. Our operations are also subject to various environmental and conservation laws and regulations. These include regulation of the size of drilling, spacing or proration units and the density of wells that may be drilled in those units, and the unitization or pooling of oil and gas properties. In addition, federal and state environmental and conservation laws, which establish maximum rates of production from oil and gas wells, generally prohibit or restrict the venting or flaring of natural gas and impose certain requirements regarding the ratability of production. The effect of these laws and regulations may delay proposed development projects, limit the amount of oil and natural gas we can produce from our wells and may limit the number of wells or the locations at which we can drill. Regulatory requirements and compliance relative to the oil and gas industry increase our costs of doing business and, consequently, affect our profitability.
Federal Energy and Climate Change Legislation and Regulation
The Pipeline Safety, Regulatory Certainty and Job Creation Act of 2011, among other things, updated federal pipeline safety standards, increased penalties for violations of such standards, gave the Department of Transportation’s Pipeline and Hazardous Materials Safety Administration (the “PHMSA”) authority for new damage prevention and incident notification, and directed PHMSA to prescribe new minimum safety standards for CO2 pipelines. In late 2021, PHMSA adopted new regulations related to incident and annual reporting and safety requirements for onshore, rural natural gas gathering lines. The new regulations extend PHMSA’s jurisdiction to previously unregulated rural gathering lines.
Both federal and state authorities have in recent years proposed and enacted new regulations and policies to limit the emission of pollutants, including greenhouse gas emissions, as part of climate change initiatives and the Clean Air Act. During the last ten years, both the EPA and Bureau of Land Management (“BLM”) have proposed and issued such regulations and policies for the oil and gas industry. Those proposed and final regulations and policies were the subject of extensive administrative, judicial, and Congressional consideration during the Obama and Trump Administrations, which caused significant difficulty in determining which regulations were in force at any given time. The Biden Administration, through various executive orders and other policy statements, has made climate change a primary priority. On January 20, 2021, the Biden Administration issued Executive Order 13990, directing agencies to review all agency actions related to emissions and climate change taken under the Trump Administration. On June 30, 2021, President Biden signed into law a joint Congressional resolution disapproving the EPA’s 2020 policy rules related to greenhouse gas emissions from oil and gas industry activities under the Clean Air Act. On November 2, 2021, the EPA proposed new regulations for greenhouse gas emissions. The comment period for the new proposed rule closed on January 31, 2022, with a potential final rule to be published thereafter. BLM has also announced plans to introduce a new proposed rule related to venting and flaring in the oil and gas industry. While BLM’s proposal is listed on its regulatory agenda, the agency has not yet issued a proposed rule. Any resulting regulations adopted by the EPA or BLM could possibly be similar to, or even more stringent than, those promulgated by the agencies under the Obama Administration. Enforcement of such regulations may impose additional costs related to
compliance with these new emission limits, as well as inspections and maintenance of several types of equipment used in our operations.
Federal, State or Indian Leases
As of December 31, 2021, approximately 30% of our net developed acreage and 22% of our December 2021 production related to oil and natural gas operations performed on federal acreage, including portions of CCA. Our operations on federal, state or Indian oil and gas leases, especially those in the Rocky Mountain region, are subject to numerous restrictions, including nondiscrimination statutes. Such operations must be conducted pursuant to certain on-site security regulations and other permits and authorizations issued by the BLM, the Bureau of Ocean Energy Management, the Bureau of Safety and Environmental Enforcement, the Bureau of Indian Affairs, and other federal and state stakeholder agencies. On January 27, 2021, the Biden Administration, through executive action, suspended new leasing and other oil and natural gas approvals on federal lands. The executive action was challenged in court by a number of States and industry trade associations. A federal court in Louisiana granted a nationwide preliminary injunction against the executive action. While BLM has stated it will resume its oil and gas leasing program, the executive order, judicial challenge, and related additional environmental review have caused significant delay and caused some potentially available parcels to be delayed for bidding. On January 20, 2021, in addition, the Department of the Interior issued a secretarial order rescinding the ability for state and local offices of BLM and other Department of the Interior Bureaus to approve various oil and gas development activities – including permits to drill, certain surface distributing activities, resource management plans, and amendments to existing federal leases. The secretarial order instead consolidated that approval authority to the bureaus’ respective assistant secretaries and higher-ranked management. The secretarial order dissolved by its own terms in March 2021, but, on March 19, 2021, the Department of the Interior issued a memorandum that retained certain authority for approvals related to oil and gas development with the assistant secretary. Also, on January 20, 2021, the Biden Administration, through executive action, mandated that agencies calculate the social cost of potential emissions when considering approval for permits, development, leasing, or related approvals. This executive action was challenged in court by a number of states, and on February 11, 2022, a federal court in Louisiana granted a preliminary injunction preventing federal agencies from using the social cost metric. In subsequent filings with the court, the Department of the Interior stated that the court’s injunction will suspend and delay regulatory consideration of pending permits, development, leasing, and related approvals. While the courts have enjoined the executive actions and the secretarial order has expired, the actions have caused and continue to cause considerable delay related to the ability to obtain new leases and necessary approvals for oil and gas development. The inability to secure new leases or permits to drill on existing leases could prevent us from expanding our oil and gas operations, in both new locations and in areas currently leased for which permits have not yet been obtained. In addition, any action by the federal government to rescind previously issued permits on the Company’s existing leases could significantly disrupt our existing and future operations.
BLM has also announced plans to introduce a new proposed rule to update its oil and gas leasing process. The proposed rule may include increases to the fees, rents, royalty rates, and bonding requirements for new federal oil and gas leases. While BLM’s proposal is listed on its regulatory agenda, the agency has not yet issued a proposed rule. If such a rule is finalized, any increase in the fees related to oil and gas development on federal lands will increase our costs of doing business and, consequently, affect our profitability.
In September 2021, the Office of Natural Resources Revenue (“ONRR”), the agency primarily responsible for collecting and ensuring correct federal and Indian royalty payments, withdrew a 2020 Trump Administration regulation regarding the valuation of oil and gas products and potential civil penalties for incorrect valuation related to federal royalties. ONRR’s action largely returns the valuation of oil and gas products and potential civil penalties for incorrect payment to the regulations in effect prior to 2020 and is ultimately expected to increase the amount of royalties collected by the federal government and potential civil penalties for incorrect payment, increasing our costs of doing business.
Environmental Regulations
Our oil and natural gas production, saltwater disposal operations, injection of CO2, and the processing, handling and disposal of materials such as hydrocarbons and naturally occurring radioactive materials (“NORM”) are subject to stringent regulation. We could incur significant costs, including cleanup costs resulting from a release of product, third-party claims for property damage and personal injuries, or penalties and other sanctions as a result of any violations or liabilities under environmental laws and regulations or other laws and regulations applicable to our operations. Changes in, or more stringent enforcement of, environmental laws and other laws applicable to our operations could also result in delays or additional operating costs and capital expenditures.
Various federal, state and local laws and regulations controlling the discharge of materials into the environment, or otherwise relating to the protection of the environment and human health, directly impact our oil and gas exploration, development and production operations. These include, among others, (1) regulations adopted by the EPA and various state agencies regarding approved methods of disposal for certain hazardous and nonhazardous wastes; (2) the Comprehensive Environmental Response, Compensation, and Liability Act and analogous state laws that regulate the removal or remediation of previously disposed wastes (including wastes disposed of or released by prior owners or operators), property contamination (including groundwater contamination), and remedial plugging operations to prevent future contamination; (3) the Clean Air Act and comparable state and local requirements already applicable to our operations and new restrictions on air emissions from our operations, including greenhouse gas emissions and those that could discourage the production of fossil fuels that, when used, ultimately release CO2; (4) the Clean Water Act and comparable state and local requirements already applicable to our operations and new restrictions on wastewater discharges from our operations; (5) the Oil Pollution Act of 1990, which contains numerous requirements relating to the prevention of, and response to, oil spills into waters of the United States; (6) the Resource Conservation and Recovery Act, which is the principal federal statute governing the treatment, storage and disposal of hazardous wastes; (7) the Endangered Species Act and counterpart state legislation, which protects certain species (and their related habitats), including certain species that could be present on our leases, as threatened or endangered; (8) the Migratory Bird Treaty Act and Bald and Golden Eagle Protection Act, which protects certain bird species, including certain species that could be present on our leases, from intentional and unintentional killing and other disturbances; and (9) state regulations and statutes governing the handling, treatment, storage and disposal of NORM and other wastes.
In the Rocky Mountain region, federal agencies’ actions based upon their environmental review responsibilities under the National Environmental Policy Act can significantly impact the scope and timing of hydrocarbon development by slowing the timing of individual applications for permits to drill and requests for rights-of-way and delaying large scale planning associated with region-level resource management plans, oil and gas lease sales, and project-level master development plans. In 2020, the Trump Administration enacted new regulations designed to streamline the federal environmental review process. In June 2021, the Biden Administration, acting through the Council on Environmental Quality (“CEQ”) responsible for enacting National Environmental Policy Act regulations, postponed federal agencies’ compliance with the 2020 regulations. On October 7, 2021, CEQ issued a notice of proposed rulemaking to largely return the National Environmental Policy Act regulations to those that existed prior to 2020 and to ensure federal agencies are adequately analyzing the potential climate change impacts from proposed projects. If such a rule is finalized, the federal environmental review process is expected to continue or even increase delay in federal decision making related to oil and gas development.
Management believes that we are currently in substantial compliance with existing applicable environmental laws and regulations, and does not currently anticipate that future compliance will have a materially adverse effect on our consolidated financial position, results of operations or cash flows, although such laws and regulations, and compliance therewith, could cause significant delays or otherwise impede operations, which may, among other things, cause our expected production rates and cash flows to be less than anticipated.
Item 1A. Risk Factors
The risks described below fall into five broad categories related to (1) oil price volatility and demand, (2) future executive, legislative or regulatory actions, (3) financial risks, (4) cybersecurity risks, and (5) those related to our operations and industry. These are not the only risks we face but are considered to be the most material. There may be other unknown or unpredictable economic, business, competitive, regulatory or other factors that could have material adverse effects on our future results. Past financial performance is not a reliable indicator of future performance, and historical trends should not be used to anticipate results or trends in future periods.
Risks Relating to Volatility in Oil Pricing and Demand for Oil
Oil prices have been very volatile in recent years, which is expected to continue or increase, which may lead to significant periods of reduced cash flows and negatively affect our financial condition and results of operations.
Oil prices are the most important determinant of our operational and financial success. Oil prices are highly impacted by worldwide oil supply, demand and prices and have historically been subject to significant price changes over short periods of time. Over the last several years, NYMEX oil prices have been extremely volatile, reaching a three-year peak over $84 per Bbl in October 2021 compared to lows averaging $17 per Bbl in April 2020. The year-to-year volatility has been due to the reduction in worldwide economic activity and oil demand amid the COVID-19 pandemic, plus OPEC supply pressures. More recently, oil prices plunged in late November 2021 upon identification of the new Omicron variant of COVID-19, with NYMEX oil prices ranging between $65.57 and $95.46 per barrel between December 1, 2021 and February 23, 2022.
Oil price volatility will remain. Although global petroleum demand is currently rising faster than petroleum supply, driving higher prices towards the end of 2021, factors beyond our control could cause prices to move downward on a rapid or repeated basis, making planning and budgeting, acquisition transactions, capital raising, and sustaining business strategies more difficult. For example, Iran is currently reported to have sizeable oil reserves in storage; if talks underway regarding Iran’s nuclear program lead to reduction or removal of current oil sanctions on Iran, Iran’s stored oil reserves could be released onto the market, depressing oil prices. Our cash flow from operations is highly dependent on the prices that we receive for oil, as oil comprised approximately 97% of our 2021 average daily sales volumes and approximately 99% of our proved reserves at December 31, 2021. The prices for oil and natural gas are subject to a variety of factors that are beyond our control. These factors include:
•the level of worldwide demand for oil and natural gas;
•worldwide economic conditions;
•the degree to which members of OPEC maintain oil price and production controls;
•the degree to which domestic oil and natural gas production affects worldwide supply of crude oil or its price, which has been negatively affected by the economic impact of the worsening COVID-19 pandemic;
•the scope, duration, and severity of the COVID-19 pandemic and any related variants; and
•worldwide political events, conditions and policies, including actions taken by foreign oil and natural gas producing nations.
Negative movements in oil prices could harm us in a number of ways, including:
•lower cash flows from operations may require reduced levels of capital expenditures; which in turn could lower our present and future production levels and lower the quantities and value of our oil and gas reserves, which constitute our major asset;
•we could be forced to increase our level of indebtedness, issue additional equity, or sell assets; and/or
•we could be required to impair various assets, including a write-down of our oil and natural gas assets or the value of other tangible or intangible assets.
Furthermore, some or all of our tertiary projects could become or remain uneconomical. We may also decide to suspend future expansion projects, and if prices were to drop below our operating cash break-even points for an extended period of time, we may decide to shut-in existing production, both of which could have a material adverse effect on our operations and financial condition and reduce our production.
The continued COVID-19 pandemic is likely to significantly affect worldwide economic activity, which in turn could negatively affect demand for oil.
The spread and emergence of new variants of the COVID-19 virus continues to evolve, both in the United States and abroad. The ultimate impact on our operational and financial performance will depend on future developments, including (1) the effectiveness of administration of available vaccines and other therapeutics related to the treatment of COVID-19 and its variants domestically and around the world, (2) the continued efforts to contain the virus or mitigate its impact, and (3) related restrictions on business activity and travel, all of which have had a direct impact on continued lower levels of domestic and global oil demand.
Geopolitical tensions from the February 2022 Russian troop movements surrounding Ukraine may rise, and create heightened oil market volatility that could negatively affect both our ability to execute our 2020 business plan and our financial condition.
Movement of Russian military units into provinces in Eastern Ukraine, and trade and monetary sanctions in response to future developments, could significantly affect worldwide oil prices and demand and cause turmoil in the global financial system. This could materially affect our business and financial condition, along with our operating and development costs, making it difficult to execute our 2022 business plan in a very volatile market. These Eastern European tensions could also increase China/Taiwan political tensions and U.S./China trade and other relations, with a further effect on world oil markets and the prices we receive for our oil production.
Risks Relating to Any Future Executive, Legislative or Regulatory Actions
Any future climate change initiatives by the Biden Administration, by Congress or by state regulatory or legislative bodies could negatively affect our business and operations, especially in the Rocky Mountain region.
In early 2021, the Biden Administration recommitted the United States to the Paris Climate Agreement and targeted a reduction of 50-52% greenhouse gas emissions by the year 2030. In order to achieve such goal, in 2021, the Biden Administration introduced initiatives, which include policies to address climate change, energy efficiency, and clean energy. If the Biden Administration and Congress adopt stricter standards for, and increase oversight and regulation over, the exploration and production industry at the federal level, these measures could lead to increased costs or additional operating restrictions. Also, there is the potential for climate change legislation which could affect demand for oil on a long-term basis.
Our operations on federal, state or Indian oil and natural gas leases in the Rocky Mountain region, conducted pursuant to permits and authorizations issued by the Bureau of Land Management, the Bureau of Ocean Energy Management, the Bureau of Safety and Environmental Enforcement, the Bureau of Indian Affairs, and other federal and state stakeholder agencies, may be impacted by the risks outlined above (See Federal and State Regulations – Federal Leases).
A number of governmental bodies have introduced or are contemplating regulatory changes in response to various proposals to combat climate change and how it should be dealt with. Legislation and increased regulation regarding climate change could impose significant costs on us and possibly affect our financial condition and operating performance.
Environmental laws and regulations applicable to our industry are costly and stringent.
Our exploration, production, and marketing operations are subject to complex and stringent federal, state, and local laws and regulations governing, among other things, the discharge of substances into the environment or otherwise relating to the protection of human health and the protection of endangered species. These laws and regulations and related public policy considerations affect the costs, manner, and feasibility of our operations and require us to make significant expenditures in order to comply. Failure to comply with these laws and regulations may result in the assessment of administrative, civil, and criminal penalties, the imposition of investigatory and remedial obligations, and the issuance of injunctions that could limit or prohibit our operations. Some of these laws and regulations may impose joint and several, strict liability for contamination resulting from spills, discharges, and releases of substances, including petroleum hydrocarbons and other wastes, without regard to fault or the legality of the original conduct. Under such laws and regulations, we could be required to remove or remediate previously disposed substances and property contamination, including wastes disposed or released by prior owners or operators.
Financial Risks
Commodity derivative contracts may expose us to potential financial loss.
To reduce our exposure to fluctuations in the prices of oil and natural gas, we enter into commodity derivative contracts in order to economically hedge a portion of our forecasted oil and natural gas production. As of February 23, 2022, we have oil derivative contracts in place covering approximately 26,500 Bbls/d for the first half of 2022, 21,000 Bbls/d for the second half of 2022, 10,000 Bbls/d for the first half of 2023, and 4,000 Bbls/d for the second half of 2023. Such derivative contracts expose us to risk of financial loss, including when there is a change in the expected differential between the underlying price in the hedging agreement and actual prices received, when the cash benefit from hedges including a sold put is limited to the extent oil prices fall below the price of any sold puts in our derivative portfolio, or when the counterparty to the derivative contract is financially constrained and defaults on its contractual obligations. In addition, these derivative contracts may limit the benefit we would otherwise receive from increases in the prices for oil and natural gas.
Risks of future participation in significant CCUS activities.
Denbury’s successful future participation in the developing CCUS industry utilizing our technical expertise in injection of CO2 and our significant CO2 pipeline system is dependent upon a number of factors, including: (i) the speed with which current and potential third party emitters are able to finance and build (often over a multi-year period) the equipment to capture CO2 emissions from various industrial processes; (ii) continued support of CO2 capture and sequestration by the federal and state governments; and (iii) the pace at which we can bring together captured CO2 emissions, and pipelines to transport those emissions to appropriately tested and prepared sequestration sites. These activities will require significant capital investment by emitting entities or other third parties, and require us to generate or raise capital to build interconnecting CO2 pipelines and fund the testing, drilling and installation of facilities at various sequestration sites. These activities subject us to the financial risks of rising costs of equipment and capital, possible delays in acquiring them, along with the financial impact of our expending capital on these activities well before realizing CCUS cash flows, any of which could negatively impact our financial condition and operational results in future periods.
Continuing or worsening inflationary or supply chain issues could lower our margins and operational efficiency.
Although our 2021 results reflected oilfield cost inflation only toward the end of the year, our 2022 budget anticipates cost increases in specific fields and for specific equipment, supplies, and third-party labor costs. Expectations of lingering or increasing inflationary pressures in our industry are becoming widespread (including anticipated double digit percentage price increases in certain expense categories). In addition to price increases by third-party service companies, it may become more costly for us to recruit and retain key employees, particularly specialized/technical personnel, in the face of increased competition for specialized and experienced oilfield workers.
Most of the cost inflation pressures we experienced during late 2021 were tied to rising fuel and power costs in our operations but were not material to our 2021 financial results. We have increased our 2022 operational budget for anticipated inflation and have taken steps to build our on-hand supply stock for items frequently used in our operations to address possible supply chain disruptions. Supply chain issues could cause operational delays in availability of goods and materials necessary to drill new wells or perform workovers or repairs on existing wells or infrastructure.
Government and societal reaction to climate change could drive down our stock price and increase our costs, while pressure to meet environment, social and governance (“ESG”) standards may impact our business.
Increasing attention to climate change and public and investor demands that companies address climate change may increase our costs, reduce demand for oil or negatively impact our stock price and access to capital markets. Furthermore, organizations that advise many institutional investors on corporate governance and investment and voting decisions have developed ratings processes for evaluating companies related to ESG matters. Negative ratings by these organizations, together with ESG advocates’ pressure for investors to divest fossil fuel equities and for lenders to limit funding to oil and gas producers, may lead to negative investor sentiment toward the oil and gas industry, including the Company, which could have a negative impact on our stock price and cause us reputational harm.
Tax proposals under discussion within the Biden Administration, if enacted, could change or remove long-time tax benefits available to the oil and gas industry for drilling and production activities.
As part of its 2021 budgetary planning, the Biden Administration discussed a number of changes to certain provisions of federal tax law applicable to the exploration and production industry, including imposing a tax on carbon emissions, as well as eliminating long-standing deductions that benefit the fossil fuel industry. Among the specific provisions focused upon were Internal Revenue Code (“IRC”) Section 263, which allows expensing of exploration, development and intangible drilling costs, and IRC Section 613, which allows use of percentage depletion instead of cost depletion to recover drilling and development costs of oil and gas wells. Any such changes would require the U.S. Congress to pass new legislation and are likely to be part of a broader set of tax revisions.
Open-market sales of a substantial number of shares of our common stock acquired upon exercise by holders of our outstanding warrants, could cause the market price of our common stock to drop significantly, even if our business is doing well.
In connection with our plan of reorganization, we issued series A and series B warrants to holders of our pre-emergence debt and equity, entitling the warrant holders to exercise the warrants at prices of either $32.59 or $35.41 per share, respectively, of which outstanding warrants may convert into approximately 5.2 million shares (approximately 9%) of our common stock outstanding as of December 31, 2021. The future exercise of a large number of warrants, followed by the subsequent sale of the acquired stock into the market, could negatively affect our common stock price. We cannot predict the likelihood of exercise of the warrants or sales of shares of our common stock acquired upon exercise, or the effect of any such sales on the prevailing market price of our common stock.
Risks Relating to a Cybersecurity Breach
A cyber breach could occur and result in information theft, data corruption, operational disruption, and/or financial loss.
Our business has become increasingly dependent on digital technologies to conduct day-to-day operations, including certain of our exploration, development and production activities. We depend on digital technology, among other things, to process and record financial and operating data; analyze seismic and drilling information; monitor and control pipeline and plant equipment; and process and store personally identifiable information of our employees, industry partners and royalty owners. Cyberattacks on businesses have escalated in recent years. Our technologies, systems and networks, or those of software providers that we use, may become the target of cyberattacks or information security breaches that could compromise our process control networks or other critical systems and infrastructure, resulting in disruptions to our business operations, harm to the environment or our assets, disruptions in access to our financial reporting systems, or loss, misuse or corruption of our critical data and proprietary information, including our business information and that of our employees, partners and other third parties. Successful attacks which disable third-party pipelines or processing facilities upon which we depend could materially adversely affect our operations. Any of the foregoing may be exacerbated by a delay or failure to detect a cyber incident. Although we have not incurred any material losses from cyberattacks, future cyberattacks could result in significant financial losses, legal or regulatory violations, reputational harm, and legal liability.
Although we utilize various procedures and controls to monitor and protect against these threats and to mitigate our exposure to such threats, there can be no assurance that these procedures and controls will be sufficient in preventing successful attacks from the increasing number of sophisticated intrusions based on technological advances. In addition, in connection with COVID-19 precautions, many of our employees and those of our service providers, vendors and industry partners have been working, and some may continue to work, from home or other remote-work locations, where cybersecurity protections may be less robust and cybersecurity procedures and safeguards may be less effective. We may be required to expend significant additional resources to continue to modify or enhance our procedures and controls or to upgrade our digital and operational systems, related infrastructure, technologies and network security, which could increase our costs. The Audit Committee’s duties and responsibilities include reviewing and discussing the Company’s guidelines and policies with respect to risk assessment and risk management, as well as the Company’s major financial and cybersecurity risk exposures and the steps that management has taken to monitor and control such exposures.
Risks Relating to Our Operations and Industry
Our future performance depends upon our ability to effectively develop our existing oil and natural gas reserves and find or acquire additional oil and natural gas reserves that are economically recoverable.
Unless we can successfully develop our existing reserves and/or replace the reserves that we produce, our reserves will decline, resulting eventually in a decrease in oil and natural gas production and lower revenues and cash flows from operations. We have historically replaced reserves through both acquisitions and internal organic growth activities. For internal organic growth activities, the magnitude of proved reserves that we can book in any given year depends on our progress with new floods and the timing of the production response, especially our development of fields in the CCA area in the Rocky Mountains. In the future, we may not be able to continue to replace reserves at acceptable costs. The business of exploring for, developing or acquiring reserves is capital intensive. We may not be able to make the necessary capital investment to maintain or expand our oil and natural gas reserves if our cash flows from operations are reduced, whether due to current oil or natural gas prices or otherwise, or if external sources of capital become limited or unavailable. Further, the process of using CO2 for tertiary recovery, and the related infrastructure, requires significant capital investment prior to any resulting and associated production and cash flows from these projects, heightening potential capital constraints. If our capital expenditures are restricted, or if outside capital resources become limited, we will not be able to maintain our current production levels.
Our production will decline if our access to sufficient amounts of carbon dioxide is limited.
Our CO2 tertiary recovery operations are a critical component of our long-term strategy. The crude oil production from our tertiary recovery projects depends, in large part, on having access to sufficient amounts of naturally occurring and industrial-sourced CO2. Our ability to produce oil from these projects would be hindered if our supply of CO2 was limited due to, among other things, problems with our current CO2 producing wells and facilities, including compression equipment, catastrophic pipeline failure or our ability to economically purchase CO2 from industrial sources. This could have a material adverse effect on our financial condition, results of operations and cash flows. Our anticipated future crude oil production from tertiary operations is also dependent on the timing, volumes and location of CO2 injections and, in particular, on our ability to increase our combined purchased and produced volumes of CO2 and inject adequate amounts of CO2 into the proper formation and area within each of our tertiary oil fields.
The development of our naturally occurring CO2 sources involves the drilling of wells to increase and extend the CO2 reserves available for use in our tertiary fields. These drilling activities are subject to many of the same drilling and geological risks of drilling and producing oil and gas wells (see Oil and natural gas development and producing operations involve various risks below). Furthermore, market conditions and government and/or public pressure may limit the amount of industrial-sourced CO2 available for our use in our tertiary operations. In addition, U.S. government policy and public pressure on industrial CO2 emitters could provide stronger incentives for these entities to capture their CO2 emissions and permanently sequester the CO2 underground rather than making it available for use in our EOR operations.
Certain of our operations may be limited during certain periods due to severe weather conditions or government regulations.
Our operations in the Gulf Coast region may be subjected to adverse weather conditions such as hurricanes, flooding and tropical storms in and around the Gulf of Mexico, as well as freezing temperatures, ice and snow, that can damage oil and natural gas facilities and delivery systems and disrupt operations, which can also increase costs and have a negative effect on our results of operations. Certain of our operations in Montana, Wyoming and North Dakota, including the construction of CO2 pipelines, the drilling of new wells and production from existing wells, are conducted in areas subject to extreme weather conditions including severe cold, snow and rain, which conditions may cause such operations to be hindered or delayed or otherwise require that they be conducted only during non-winter months, and depending on the severity of the weather, could have a negative effect on our results of operations in these areas. Further, the potential impacts of climate change on our operations may include unusually intense rainfall and storm patterns, rising sea levels and increased high temperatures, the last of which imposes certain physical constraints on our CO2 injections in our operations in the Gulf Coast.
Certain of our operations in the Rocky Mountain region are confined to certain time periods due to environmental regulations, federal restrictions on when drilling can take place on federal lands, and lease stipulations designed to protect certain wildlife, which regulations, restrictions and limitations could slow down our operations, cause delays, increase costs and have a negative effect on our results of operations.
Oil and natural gas development and producing operations involve various risks.
Our operations are subject to all of the risks normally incident and inherent to the operation and development of oil and natural gas properties and the drilling of oil and natural gas wells, including, without limitation, pipe failure; fires; formations with abnormal pressures; uncontrollable flows of oil, natural gas, brine or well fluids; release of contaminants into the environment and other environmental hazards and risks; and well blowouts, cratering or explosions. In addition, our operations are sometimes near populated commercial or residential areas, which adds additional risks. The nature of these risks is such that some liabilities could exceed our insurance policy limits or otherwise be excluded from, or limited by, our insurance coverage, as in the case of environmental fines and penalties, for example, which are excluded from coverage as they cannot be insured.
We could incur significant costs related to these risks that could have a material adverse effect on our results of operations, financial condition and cash flows or could have an adverse effect upon the profitability of our operations. Additionally, a portion of our production activities involves CO2 injections into fields with wells plugged and abandoned by prior operators. It is often difficult (or impracticable) to determine whether a well has been properly plugged prior to commencing injections and pressuring the oil reservoirs. We may incur significant costs in connection with remedial plugging operations to prevent environmental contamination and to otherwise comply with federal, state and local regulations relative to the plugging and abandoning of our oil, natural gas and CO2 wells. In addition to the increased costs, if wells have not been properly plugged, modification to those wells may delay our operations and reduce our production.
Development activities are subject to many risks, including the risk that we will not recover all or any portion of our investment in such wells. The cost of drilling, completing and operating a well is often uncertain, and cost factors can adversely affect the economics of a project. Further, our drilling operations may be curtailed, delayed or canceled as a result of numerous factors, including:
•unexpected drilling conditions;
•pressure or irregularities in formations;
•equipment failures or accidents;
•adverse weather conditions, including hurricanes and tropical storms in and around the Gulf of Mexico, as well as freezing temperatures, ice and snow, that can damage oil and natural gas facilities and delivery systems and disrupt operations, and winter conditions and forest fires in the Rocky Mountain region that can delay or impede operations;
•compliance with environmental and other governmental requirements;
•the cost of, or shortages or delays in the availability of, drilling rigs, equipment, pipelines and services; and
•title problems.
Our planned tertiary and CCUS operations and the related construction of necessary CO2 pipelines could be delayed by difficulties in obtaining pipeline rights-of-way and/or permits and/or by the listing of certain species as threatened or endangered.
The production of crude oil from our planned tertiary operations is dependent upon having access to pipelines to transport available CO2 to our oil fields at a cost that is economically viable. Future extensions of our Green Pipeline, construction to connect third-party CO2 emitters to sequestration sites, and preparation for CCUS activities require us to obtain rights-of-way from private landowners, state and local governments and the federal government in certain areas. Certain states where we operate have considered or may again consider the adoption of laws or regulations that could limit or eliminate the ability of a pipeline owner or of a state, state’s legislature or its administrative agencies to exercise eminent domain over private property, in addition to possible judicially imposed constraints on, and additional requirements for, the exercise of eminent domain. We also often conduct Rocky Mountain operations on federal and other oil and natural gas leases inhabited by species that may be listed as threatened or endangered under the Endangered Species Act, which listing may lead to tighter restrictions as to federal land use and other land use where federal approvals are required. These laws and regulations, together with any other changes in law related to the use of eminent domain or the listing of certain species as threatened or endangered, could inhibit or eliminate our ability to secure rights-of-way or otherwise access land for future pipeline construction projects and may require additional regulatory and environmental compliance, and increased costs in connection therewith, which could delay our CO2 pipeline construction schedule and initiation of our EOR or CCUS operations.
Estimating our reserves, production and future net cash flows is difficult to do with any certainty.
Estimating quantities of proved oil and natural gas reserves requires interpretations of available technical data and various assumptions, including future production rates, production costs, severance and excise taxes, capital expenditures and workover and remedial costs, and the assumed effect of governmental rules and regulations. There are numerous uncertainties about when a property may have proved reserves as compared to potential or probable reserves, particularly relating to our tertiary recovery operations. Forecasting the amount of oil reserves recoverable from tertiary operations, and the production rates anticipated therefrom, requires estimates, one of the most significant being the oil recovery factor. Actual results most likely will vary from our estimates. Also, the use of a 10% discount factor for reporting purposes, as prescribed by the SEC, may not necessarily represent the most appropriate discount factor, given actual interest rates and risks to which our business, and the oil and natural gas industry in general, are subject. Any significant inaccuracies in these interpretations or assumptions, or changes of conditions, could result in a revision of the quantities and net present value of our reserves.
The reserves data included in documents incorporated by reference represents estimates only. Quantities of proved reserves are estimated based on economic conditions, including first-day-of-the-month average oil and natural gas prices for the 12-month period preceding the date of the assessment. The representative oil and natural gas prices used in estimating our December 31, 2021 reserves, after adjustments for market differentials and transportation expenses by field, were $63.86 per Bbl for crude oil and $3.39 per Mcf for natural gas. Our reserves and future cash flows may be subject to revisions based upon changes in economic conditions, including oil and natural gas prices, as well as due to production results, results of future development, operating and development costs, and other factors. Downward revisions of our reserves could have an adverse effect on our financial condition and operating results. Actual future prices and costs may be materially higher or lower than the prices and costs used in our estimates.
The marketability of our production is dependent upon transportation lines and other facilities, most of which we do not control. When these facilities are unavailable, our operations can be interrupted and our revenues reduced.
The marketability of our oil and natural gas production depends, in part, upon the availability, proximity and capacity of transportation lines owned by third parties. In general, we do not control these transportation facilities, and our access to them may be limited or denied. A significant disruption in the availability of, and access to, these transportation lines or other production facilities could adversely impact our ability to deliver to market or produce our oil and thereby cause a significant interruption in our operations.
We may lose key executive officers or specialized technical employees, which could endanger the future success of our operations.
Our success depends to a significant degree upon the continued contributions of our executive officers, other key management and specialized technical personnel. Our employees, including our executive officers, are employed at will and do not have employment agreements. We believe that our future success depends, in large part, upon our ability to hire and retain highly skilled personnel.
The loss of one or more of our large oil and natural gas purchasers could have an adverse effect on our operations.
For the year ended December 31, 2021, four purchasers individually accounted for 10% or more of our oil and natural gas revenues and, in the aggregate, for 62% of such revenues. The loss of a large single purchaser could adversely impact the prices we receive or the transportation costs we incur.
Item 1B. Unresolved Staff Comments
There are no unresolved written SEC staff comments regarding our periodic or current reports under the Securities Exchange Act of 1934 received 180 days or more before the end of the fiscal year to which this annual report on Form 10-K relates.
Item 2. Properties
Information regarding the Company’s properties called for by this item is included in Item 1, Business and Properties – Oil and Natural Gas Operations. We also have various operating leases for rental of office space, office and field equipment, and
land easements. See Item 7, Management’s Discussion and Analysis of Financial Condition and Results of Operations – Capital Resources and Liquidity – Commitments, Obligations and Off-Balance Sheet Arrangements, and Note 5, Leases, to the consolidated financial statements for the future minimum rental payments. Such information is incorporated herein by reference.
Item 3. Legal Proceedings
We are involved in various lawsuits, claims and regulatory proceedings incidental to our businesses. While we currently believe that the ultimate outcome of these proceedings, individually and in the aggregate, will not have a material adverse effect on our business or finances, litigation is subject to inherent uncertainties. We accrue for losses from litigation and claims if we determine that a loss is probable and the amount can be reasonably estimated.
The information under Note 14, Commitments and Contingencies, to the consolidated financial statements is incorporated herein by reference.
Item 4. Mine Safety Disclosures
Not applicable.
PART II
Item 5. Market for Registrant’s Common Equity, Related Stockholder Matters and Issuer Purchases of Equity Securities
Market Information and Holders of Record
On September 18, 2020, upon emergence from bankruptcy, all existing shares of Predecessor common stock were cancelled and new shares of common stock in the Successor were issued to former holders of debt cancelled in bankruptcy. On September 21, 2020 the Successor’s common stock commenced trading on the New York Stock Exchange (“NYSE”) under the symbol “DEN.” As of January 31, 2022, based on information from the Company’s transfer agent, Broadridge Stock Transfer Agent, there were two holders of record of Denbury’s common stock.
Dividends
We have not paid dividends on our Successor common stock and have no current plans to declare common stock dividends. Our credit agreement with JPMorgan Chase Bank, N.A., as administrative agent, and other lenders party thereto requires us to meet certain financial covenants at the time dividend payments are made. For further discussion, see Note 8, Long-Term Debt, to the consolidated financial statements.
Purchases of Equity Securities by the Issuer and Affiliated Purchasers
We did not repurchase any shares of our Successor common stock during the fourth quarter of 2021.
Stock Performance Graphs
The following Performance Graphs and related information shall not be deemed “soliciting material” or to be “filed” with the Securities and Exchange Commission (“SEC”), nor shall such information be incorporated by reference into any future filings under the Securities Act of 1933 or Securities Exchange Act of 1934, each as amended, except to the extent that the Company specifically incorporates it by reference into such filings.
The following graph illustrates changes over the period September 21, 2020 through December 31, 2021, in cumulative total stockholder return on the Successor common stock as measured against the cumulative total return of the S&P 500 Index and the Dow Jones U.S. Exploration and Production Index. The graph tracks the performance of a $100 investment in our common stock and in each index (with the reinvestment of all dividends for the index securities) from September 21, 2020 to December 31, 2021.
SEPTEMBER 21, 2020 to DECEMBER 31, 2021
COMPARISON OF CUMULATIVE TOTAL RETURN – POST BANKRUPTCY EMERGENCE
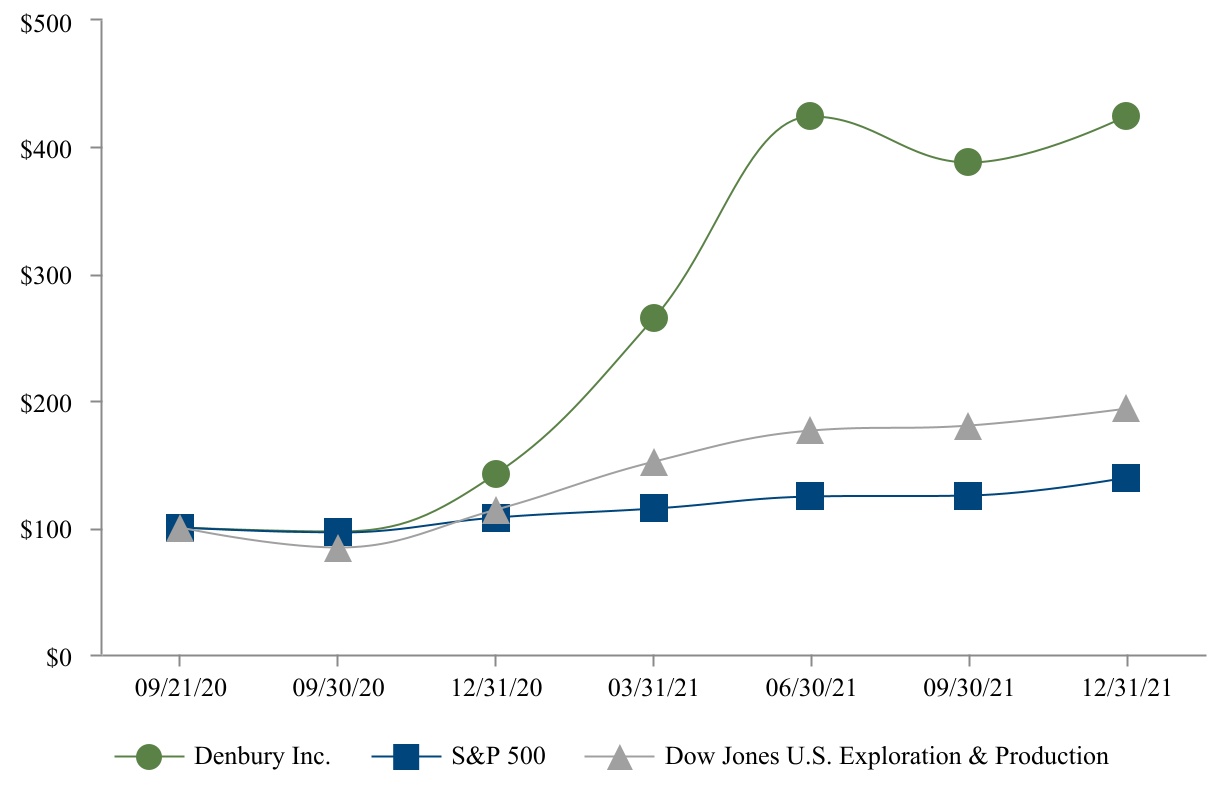
| | | | | | | | | | | | | | | | | | | | | | | | | | | | | | | | | | | | | | | | | | | | | |
| | 9/21/20 | | 9/30/20 | | 12/31/20 | | 3/31/21 | | 6/30/21 | | 9/30/21 | | 12/31/21 | | | | |
| Denbury Inc. | $ | 100 | | | $ | 97 | | | $ | 142 | | | $ | 265 | | | $ | 424 | | | $ | 388 | | | $ | 423 | | | | | |
| S&P 500 | 100 | | | 96 | | | 108 | | | 115 | | | 124 | | | 125 | | | 139 | | | | | |
| Dow Jones U.S. Exploration & Production | 100 | | | 84 | | | 114 | | | 152 | | | 176 | | | 180 | | | 194 | | | | | |
Item 6. [Reserved]
Denbury Inc.
Management’s Discussion and Analysis of Financial Condition and Results of Operations
Item 7. Management’s Discussion and Analysis of Financial Condition and Results of Operations
The following discussion and analysis should be read in conjunction with our consolidated financial statements and Notes thereto included in Item 8, Financial Statements and Supplementary Information. Our discussion and analysis includes forward-looking information that involves risks and uncertainties and should be read in conjunction with Risk Factors under Item 1A of this Form 10-K, along with Forward-Looking Information at the end of this section for information on the risks and uncertainties that could cause our actual results to be materially different from our forward-looking statements. For a discussion of the financial results for the fiscal year ended December 31, 2019, see Part II, Item 7, Management’s Discussion and Analysis of Financial Condition and Results of Operations, of our Annual Report on Form 10-K for the fiscal year ended December 31, 2020, as filed with the Securities and Exchange Commission (“SEC”) on March 5, 2021.
As a result of the Company’s emergence from bankruptcy and adoption of fresh start accounting on September 18, 2020 (the “Emergence Date”), certain values and operational results of the consolidated financial statements subsequent to September 18, 2020 are not comparable to those in the Company’s consolidated financial statements prior to, and including September 18, 2020. The Emergence Date fair values of the Successor’s assets and liabilities differ materially from their recorded values as reflected on the historical balance sheets of the Predecessor contained in periodic reports previously filed with the Securities and Exchange Commission. References to “Successor” relate to the financial position and results of operations of the Company subsequent to September 18, 2020, and references to “Predecessor” relate to the financial position and results of operations of the Company prior to, and including, September 18, 2020.
OVERVIEW
Denbury is an independent energy company with operations focused in the Gulf Coast and Rocky Mountain regions. The Company is differentiated by our focus on CO2 EOR and the emerging CCUS industry, supported by the Company’s CO2 EOR technical and operational expertise and extensive CO2 pipeline infrastructure. The utilization of captured industrial-sourced CO2 in EOR significantly reduces the carbon footprint of the oil that Denbury produces, making the Company’s Scope 1 and 2 CO2 emissions negative today, with a goal to also fully offset our Scope 1, 2, and 3 CO2 emissions within this decade, primarily through increasing the amount of captured industrial-sourced CO2 used in our operations.
Oil Price Impact on Our Business. Our financial results are significantly impacted by changes in oil prices, as 97% of our sales volumes are oil. Changes in oil prices impact all aspects of our business, most notably our cash flows from operations, revenues, capital and budgeting decisions, and oil and natural gas reserves volumes. The table below outlines selected financial items and sales volumes, along with our realized oil prices, before and after commodity derivative impacts, over the last three years:
| | | | | | | | | | | | | | | | | | | | |
| | Year Ended December 31, |
| In thousands, except per-unit data | | 2021 | | 2020 | | 2019 |
| Oil, natural gas, and related product sales | | $ | 1,159,955 | | | $ | 693,209 | | | $ | 1,212,020 | |
| Receipt (payment) on settlements of commodity derivatives | | (277,240) | | | 102,485 | | | 23,606 | |
| Oil, natural gas, and related product sales and commodity settlements, combined | | $ | 882,715 | | | $ | 795,694 | | | $ | 1,235,626 | |
| | | | | | |
| Average daily sales (BOE/d) | | 48,770 | | | 51,151 | | 58,213 | |
| | | | | | |
| Average net realized prices | | | | | | |
| Oil price per Bbl - excluding impact of derivative settlements | | $ | 66.52 | | | $ | 37.78 | | | $ | 58.26 | |
| Oil price per Bbl - including impact of derivative settlements | | 50.46 | | | 43.40 | | | 59.40 | |
Over the last several years, NYMEX oil prices have been extremely volatile, reaching a three-year peak over $84 per Bbl in October 2021 compared to lows averaging $17 per Bbl in April 2020. The year-to-year volatility has been due to the reduction in worldwide economic activity and oil demand amid the COVID-19 coronavirus (“COVID-19”) pandemic, plus OPEC supply pressures. NYMEX WTI oil prices strengthened from an average of approximately $39 per Bbl in 2020 to $68 per Bbl during 2021, reaching highs over $84 per Bbl in late-October 2021, followed by oil prices plunging in late November 2021 upon
Denbury Inc.
Management’s Discussion and Analysis of Financial Condition and Results of Operations
identification of the new Omicron variant of COVID-19, with NYMEX oil prices recovering in early 2022 to new seven year highs of $95.46 per barrel as of February 23, 2022.
As reflected in the table above, in 2021, our oil and natural gas sales increased by $466.7 million, or 67%, over 2020 levels due to rising oil prices; however, after considering the significant payments made upon settlements under our commodity derivative contracts, our oil and natural gas sales net of hedging settlements increased only $87.0 million. Upon emergence from bankruptcy in September 2020, we were required to hedge through mid-2022 certain levels of estimated production under our post-emergence bank credit facility, which significantly limited our ability to fully benefit from the significant oil price recovery in 2021. Although we were required to hedge a certain percentage of our production in the first half of 2022, that percentage is less than in 2021. Additionally, our hedges in 2022, on average, are at more favorable prices and with a greater mix of collars, providing us more upside price exposure. We currently have no further hedging requirements under our bank credit facility.
Comparative Financial Results and Highlights. We recognized net income of $56.0 million, or $1.04 per diluted common share, during 2021. As a result of Denbury filing for bankruptcy and emerging from bankruptcy during September 2020, our 2020 financial results are broken out between the Predecessor period (January 1, 2020 through September 18, 2020) and the Successor period (September 19, 2020 through December 31, 2020). For the Predecessor period from January 1, 2020 through September 18, 2020, we recognized a net loss of $1.4 billion, and for the Successor period from September 19, 2020 through December 31, 2020, we recognized a net loss of $50.7 million. The principal determinants of our comparative annual results between 2020 and 2021 were (a) an $850.0 million charge for reorganization items, net, during the prior-year Predecessor period, primarily consisting fresh start accounting adjustments and (b) a $996.7 million full cost pool ceiling test write-down during the prior-year Predecessor period. Additional drivers of the comparative operating results between full-year 2021 and 2020 include the following:
•Oil and natural gas revenues increased by $466.7 million (67%), with 72% of the increase due to higher commodity prices, slightly offset by lower sales volumes;
•Commodity derivative expense increased by $393.1 million consisting of a $379.7 million decrease in cash receipts upon contract settlements ($277.2 million in payments during 2021 compared to $102.5 million in receipts upon settlements during 2020) and a $13.4 million increase in noncash fair value losses between periods;
•Depletion, depreciation, and amortization expense decreased $83.8 million primarily due to lower depletable costs due to the step down in book value resulting from fresh start accounting as of September 18, 2020 and an accelerated depreciation charge of $39.2 million during 2020 related to unevaluated properties; and
•Lease operating expenses increased by $73.0 million (21%), primarily due to an increase of $25.9 million related to the March 2021 Wind River Basin acquisition and higher expenses across nearly all lease operating expense categories, largely driven by higher commodity prices and increased workover activity.
March 2021 Acquisition of Wyoming CO2 EOR Fields. On March 3, 2021, we acquired a nearly 100% working interest (approximately 83% net revenue interest) in the Big Sand Draw and Beaver Creek EOR fields (collectively “Wind River Basin”) located in Wyoming, including surface facilities and a 46-mile CO2 transportation pipeline to the acquired fields. The acquisition purchase price was $10.9 million cash (after final closing adjustments) plus two contingent $4 million cash payments if NYMEX WTI oil prices average at least $50 per Bbl during each of 2021 and 2022. We made the first contingent payment in January 2022 and if the price condition is met, the second $4 million payment will be due in January 2023. As of December 31, 2021, the contingent consideration was recorded on our Consolidated Balance Sheets at its fair value of $7.7 million, a $2.4 million increase from the March 2021 acquisition date fair value. This $2.4 million increase at December 31, 2021 was the result of higher NYMEX WTI oil prices and was recorded to “Other expenses” in our Consolidated Statements of Operations. Wind River Basin sales averaged approximately 2,879 BOE/d during the fourth quarter of 2021 and the CO2 flood utilizes 100% industrial-sourced CO2.
Cedar Creek Anticline CO2 Pipeline Completion. During 2021, we spent $123.4 million, approximately 49% of our development capital expenditures, on Cedar Creek Anticline (“CCA”) pipeline construction and tertiary development. We completed the 105-mile CO2 pipeline from Bell Creek to CCA, along with an additional pipeline lateral that will service the initial EOR development and additional future phases. First CO2 injections in CCA’s Red River formation commenced in early February 2022, and tertiary oil production response is anticipated in the second half of 2023.
Denbury Inc.
Management’s Discussion and Analysis of Financial Condition and Results of Operations
Divestiture of Hartzog Draw Deep Mineral Rights. On June 30, 2021, we closed the sale of undeveloped, unconventional deep mineral rights in Hartzog Draw Field in Wyoming. The cash proceeds of $18 million reduced our full cost pool; therefore, no gain or loss was recorded on the transaction, and the sale had no impact on our production or reserves.
Houston Area Land Sales. During the second half of 2021, we completed the sales of a portion of certain non-producing surface acreage in the Houston area. We received cash proceeds of $15.2 million from the sales and recognized a $10.3 million gain to “Other income” in our Consolidated Statements of Operations.
Advancing Carbon Capture, Use and Storage. CCUS is a process that captures CO2 from industrial sources and reuses it or stores the CO2 in geologic formations in order to avoid its release into the atmosphere. We utilize CO2 from industrial sources in our EOR operations, and our extensive CO2 pipeline infrastructure and operations, particularly in the Gulf Coast, are strategically located in close proximity to large sources of industrial emissions. We believe that the assets and technical expertise required for CCUS are highly aligned with our existing CO2 EOR operations, providing us with a significant advantage and opportunity to participate in the emerging CCUS industry, as the building of a permanent carbon sequestration business requires both time and capital to build assets such as those we own and have been operating for years. During the year ended December 31, 2021, approximately 33% of the CO2 utilized in our oil and gas operations was industrial-sourced CO2, and we anticipate this percentage could increase in the future as supportive U.S. government policy and public pressure on industrial CO2 emitters will provide strong incentives for these entities to capture their CO2 emissions.
As we seek to grow our CCUS business and pursue new CCUS opportunities, we have been engaged in discussions with existing and potential third-party industrial CO2 emitters regarding transportation and storage solutions, while also identifying potential future sequestration sites and landowners of those locations. We continue to make progress in these discussions and have executed several term sheets for the future transportation and sequestration of CO2. While EOR is the only CCUS operation reflected in our current and historical financial and operational results (as a cost), we believe the incentives offered under Section 45Q of the Internal Revenue Code (“Section 45Q”) or otherwise will drive demand for CCUS and will allow us to collect a fee for the transportation and storage of captured industrial-sourced CO2, including CO2 utilized in our EOR operations. As the enhanced Section 45Q regulations are relatively new, it will likely take several years to construct new capture facilities and for dedicated storage sites to be developed. We believe our existing CO2 pipeline infrastructure, EOR operations, and experience and expertise in working with CO2 all position us to be a leader in this rapidly developing industry.
CAPITAL RESOURCES AND LIQUIDITY
Overview. Our primary sources of capital and liquidity are our cash flows from operations and availability of borrowing capacity under our senior secured bank credit facility. Our most significant cash outlays relate to our development capital expenditures, and in 2021 the repayment of $70.0 million of pipeline financing obligations associated with the NEJD pipeline system. At December 31, 2021, we had $35.0 million of borrowings outstanding on our $575 million senior secured bank credit facility, leaving us with $528.1 million of borrowing capacity after consideration of $11.9 million of letters of credit outstanding. Our borrowing base availability, coupled with unrestricted cash of $3.7 million provides us total liquidity of $531.8 million as of December 31, 2021, which is more than adequate to meet our anticipated near-term operating and capital needs.
As further discussed below, based on oil price futures as of the middle of February 2022, we currently anticipate funding all of our 2022 capital budget from projected operating cash flow while also generating excess cash flow. The ultimate level of excess cash we may generate will be highly dependent on oil prices and many other factors, but we currently plan to utilize our excess cash to build cash for anticipated CCUS capital needs over the next several years, as we believe that the potential exists for our CCUS business to grow to a significant scale. During 2022, we will continue to evaluate anticipated capital needs for our CCUS business in relation to our excess cash flow, and therefore, at the current time, our first priority is to utilize and build cash for CCUS growth rather than returning capital to stockholders.
2021 Cash Sources and Uses. During 2021, we generated cash flows from operations of $317.2 million, while incurring development capital expenditures of $252.2 million and capitalized interest of $4.6 million, resulting in approximately $55 million of cash flow in excess of capital expenditures (excluding working capital changes). In addition, we paid $70.0 million to Genesis Energy, L.P. in accordance with the October 2020 restructuring of the financing arrangements of our NEJD CO2 pipeline system and acquired our Wind River Basin properties in Wyoming for $10.9 million during 2021. These supplemental cash outflows were partially offset with $18 million of proceeds from the sale of undeveloped, unconventional deep mineral
Denbury Inc.
Management’s Discussion and Analysis of Financial Condition and Results of Operations
rights at Hartzog Draw Field in June 2021 and $15.2 million of proceeds during the second half of 2021 from sales of non-producing surface acreage primarily around the Houston area. Average outstanding borrowings under our bank credit facility during 2021 were $85.0 million.
Capital Expenditure Summary. Our 2021 capital expenditures for CCA tertiary development and pipeline construction totaled $123.4 million, or 49% of our 2021 development capital expenditures. The following table reflects incurred capital expenditures (including accrued capital) for the years ended December 31, 2021, 2020 and 2019:
| | | | | | | | | | | | | | | | | | | | |
| | Year Ended December 31, |
| In thousands | | 2021 | | 2020 | | 2019 |
Capital expenditure summary(1) | | | | | | |
| CCA EOR field expenditures | | $ | 35,754 | | | $ | 810 | | | $ | 2,424 | |
CCA CO2 pipelines | | 87,688 | | | 10,942 | | | 23,843 | |
| CCA tertiary development | | 123,442 | | | 11,752 | | | 26,267 | |
| Non-CCA tertiary and non-tertiary fields | | 97,085 | | | 49,800 | | | 161,921 | |
CO2 sources and other CO2 pipelines | | 1,657 | | | 660 | | | 2,702 | |
| Development excluding CCA tertiary | | 98,742 | | | 50,460 | | | 164,623 | |
Capitalized internal costs(2) | | 29,987 | | | 32,956 | | | 46,031 | |
| Development capital expenditures | | 252,171 | | | 95,168 | | | 236,921 | |
Acquisitions of oil and natural gas properties(3) | | 10,979 | | | 176 | | | 284 | |
| Capital expenditures, before capitalized interest | | 263,150 | | | 95,344 | | | 237,205 | |
| Capitalized interest | | 4,585 | | | 24,146 | | | 36,671 | |
| Capital expenditures, total | | $ | 267,735 | | | $ | 119,490 | | | $ | 273,876 | |
(1)Capital expenditures in this summary are presented on an as-incurred basis (including accruals), and are $36.6 million higher than the capital expenditures in the Consolidated Statements of Cash Flows which are presented on a cash paid basis.
(2)Includes capitalized internal acquisition, exploration and development costs and pre-production tertiary startup costs.
(3)Primarily consists of working interest positions in the Wind River Basin enhanced oil recovery fields acquired on March 3, 2021.
Supply Chain Issues and Potential Cost Inflation. Recent U.S. supply chain constraints, together with tight labor markets, could increase our costs in 2022 and future periods. Most of the cost inflation pressures we experienced during late 2021 were tied to rising fuel and power costs in our operations but were not material to our 2021 financial results. We have increased our 2022 operational budget for anticipated inflation and have taken steps to build our on-hand supply stock for items frequently used in our operations to address possible supply chain disruptions.
2022 Plans and Capital Budget. We estimate that our total oil and natural gas development capital expenditures in 2022, excluding acquisitions and capitalized interest, will be in a range of $290 million to $320 million, which at the midpoint includes approximately $115 million for CCA’s new EOR development (inclusive of an estimated $25 million of pre-production CO2 costs) and $190 million for other tertiary and non-tertiary oil-focused development projects, capitalized internal costs and CO2 sources and pipelines. This compares to total oil and natural gas development expenditures of $252.2 million in 2021, of which $123.4 million was for CCA’s new EOR development and $128.8 million for our other tertiary and non-tertiary development, capitalized internal costs, and CO2 sources and other CO2 pipelines. We continue to work on the timing of development plans at CCA and have increased our 2022 planned activities over our previously anticipated level to now include a CO2 pilot in the Pennel area of CCA.
In addition to our budgeted oil and natural gas capital investments, we anticipate spending approximately $50 million in connection with our CCUS strategic priorities, potentially raising our 2022 total estimated capital range to between $340 million and $370 million. Based on oil prices as of the middle of February 2022, the Company’s hedge positions and other projections, we estimate that our 2022 cash flows from operations should exceed our budgeted level of capital expenditures.
Denbury Inc.
Management’s Discussion and Analysis of Financial Condition and Results of Operations
Also, at December 31, 2021, we had $528.1 million of availability under our bank credit facility, which we believe is more than adequate to cover any near-term liquidity needs.
Based on our capital spending plans, we currently anticipate 2022 average daily production will be between 46,000 BOE/d and 49,000 BOE/d. Our anticipated 2022 production level compares to 2021 average production of 48,770 BOE/d.
Senior Secured Bank Credit Agreement. In September 2020, we entered into a bank credit agreement with JPMorgan Chase Bank, N.A., as administrative agent, and other lenders party thereto (the “Bank Credit Agreement”). The Bank Credit Agreement is a senior secured revolving credit facility with an initial borrowing base and lender commitments of $575 million, under which we had $35.0 million borrowed as of December 31, 2021, leaving us with $528.1 million of availability after consideration of $11.9 million of outstanding letters of credit. Availability under the Bank Credit Agreement is subject to a borrowing base, which is redetermined semiannually on or around May 1 and November 1 of each year, with our next scheduled redetermination around May 1, 2022. The borrowing base is adjusted at the lenders’ discretion and is based, in part, upon external factors over which we have no control. The borrowing base is subject to a reduction by twenty-five percent (25%) of the principal amount of any unsecured or subordinated debt issued or incurred. The borrowing base may also be reduced if we sell borrowing base properties and/or cancel commodity derivative positions with an aggregate value in excess of 5% of the then-effective borrowing base between redeterminations. The Bank Credit Agreement matures on January 30, 2024.
The Bank Credit Agreement limits our ability to pay dividends on our common stock or make other restricted payments in an amount not to exceed “Distributable Free Cash Flow”, but only if (1) no event of default or borrowing base deficiency exists; (2) our total leverage ratio is 2 to 1 or lower; and (3) availability under the Bank Credit Agreement is at least 20%. The Bank Credit Agreement also limits our ability to, among other things, incur and repay other indebtedness; grant liens; engage in certain mergers, consolidations, liquidations and dissolutions; engage in sales of assets; make acquisitions and investments; make other restricted payments (including redeeming, repurchasing or retiring our common stock); and enter into commodity derivative agreements, in each case subject to customary exceptions.
The Bank Credit Agreement contains certain financial performance covenants including the following:
•A Consolidated Total Debt to Consolidated EBITDAX covenant (as defined in the agreement), with such ratio not to exceed 3.5 times; and
•A requirement to maintain a current ratio (i.e., Consolidated Current Assets to Consolidated Current Liabilities) of 1.0.
For purposes of computing the current ratio per the Bank Credit Agreement, Consolidated Current Assets exclude the current portion of derivative assets but include available borrowing capacity under the Bank Credit Agreement, and Consolidated Current Liabilities exclude the current portion of derivative liabilities as well as the current portions of long-term indebtedness outstanding. Under these financial performance covenant calculations, as of December 31, 2021, our ratio of consolidated total debt to consolidated EBITDAX was 0.10 to 1.0 (with a maximum permitted ratio of 3.5 to 1.0) and our current ratio was 2.58 to 1.0 (with a required ratio of not less than 1.0 to 1.0). Based upon our currently forecasted levels of production and costs, hedges in place as of February 23, 2022, and current oil commodity futures prices, we currently anticipate continuing to be in compliance with our financial performance covenants during the foreseeable future.
The above description of our Bank Credit Agreement is qualified by the express language and defined terms contained in the Bank Credit Agreement, which is filed as an exhibit to our Form 8-K Report filed with the SEC on September 18, 2020.
Commitments, Obligations and Off-Balance Sheet Arrangements. As of December 31, 2021, we had a total of $11.9 million of letters of credit outstanding under our senior secured bank credit facility. Additionally, we have obligations for development and exploratory expenditures that arise from our normal capital expenditure program or from other transactions common to our industry, none of which are recorded on our balance sheet. Certain of these capital spending plans are further described in 2022 Plans and Capital Budget above. In addition, in order to recover our undeveloped proved reserves, we must also fund the associated future development costs estimated in our proved reserve reports. For a further discussion of our future development costs, see Supplemental Oil and Natural Gas Disclosures (Unaudited) to the consolidated financial statements.
Our periodic obligations include operational expenses that we anticipate being paid out of our cash flow from sale of production, plus the capital expenditures detailed above. In addition to these periodic expenditures, we have various future cash
Denbury Inc.
Management’s Discussion and Analysis of Financial Condition and Results of Operations
commitments under contracts in place as of December 31, 2021. The most material of these commitments within the next 12 months include:
•Approximately $46 million under contracts for the purchase of CO2 captured from industrial sources and for processing fees related to our overriding royalty interest in the CO2 at LaBarge Field, both of which are used in our tertiary recovery activities, assuming a $70 per Bbl NYMEX oil price. The commitment level declines in 2023 and again in 2028 due to the expiration of certain industrial-CO2 purchase commitments (see Note 14, Commitments and Contingencies, to the consolidated financial statements for further discussion); and
•Approximately $6 million in operating lease obligations (see Note 5, Leases, to the consolidated financial statements for further discussion).
In addition to these commitments, we have recurring expenditures for such things as accounting, engineering and legal fees; software maintenance; subscriptions; and other overhead-type items. Normally these expenditures do not change materially on an aggregate basis from year to year and are part of our general and administrative expenses. Most of these recurring expenditures could be quickly canceled with regard to any specific vendor, even though the expense itself may be required for our ongoing normal operations. Other commitments include certain transportation agreements and well-related costs. Our longer-term commitments that extend beyond the next 12 months include the following:
•Obligations and periodic interest payments under our senior secured bank credit facility, which matures on January 30, 2024, and of which $35.0 million was outstanding as of December 31, 2021; and
•Asset retirement obligations related to future costs associated with plugging and abandoning our oil, natural gas and CO2 wells, removing equipment and facilities from leased acreage, and returning land to its original condition (see Note 6, Asset Retirement Obligations, to the consolidated financial statements).
As detailed throughout this report, the largest determinant of our cash flow is the oil price we receive. Oil prices and cash flow are highly impacted by worldwide oil supply and fluctuations in demand due to economic activity, which volatility we attempt to offset to some extent with our hedging program. The variability of proceeds from the sale of our production is partially offset by similar directional variances in certain expenses, including a portion of our lease operating expenses and production taxes, as these expenses correlate to some degree with changes in oil prices.
FINANCIAL OVERVIEW OF TERTIARY OPERATIONS
Our tertiary operations represent a significant portion of our overall operations. The economics of a tertiary field and the related impact on our financial statements differ from a conventional oil and gas play and are explained further below.
While it is difficult to accurately forecast future production, we believe our tertiary recovery operations provide significant long-term production growth potential at reasonable return metrics, with relatively low risk, assuming crude oil prices are at levels that support the development of those projects. We have been developing tertiary oil properties for over 22 years, and the financial impact of such operations is reflected in our historical financial statements. The summary below highlights our observations regarding how tertiary operations have impacted our financial statements.
Finding and Development Costs. We currently expect finding and development costs (including future development and abandonment costs but excluding CO2 pipeline infrastructure capital expenditures) over the life of each field to be competitive with the industry average costs for other oil properties. See the definition of finding and development costs in the Glossary and Selected Abbreviations.
Timing of Capital Costs. When initiating a new tertiary flood, there generally is a delay between the initial capital expenditures and the resulting production increases. We must build facilities, and often a CO2 pipeline to the field, before CO2 flooding can commence, and it usually takes six to twelve months before the field responds to the injection of CO2 (i.e., oil production commences). For certain fields such as those in CCA, we estimate it could take up to 18 months or longer for a tertiary production response to occur. Further, we may spend significant amounts of capital before we can recognize any proved reserves from fields we flood and, even after a field has proved reserves, significant amounts of additional capital will usually be required to fully develop the field.
Denbury Inc.
Management’s Discussion and Analysis of Financial Condition and Results of Operations
Recognition of Proved Reserves. In order to recognize proved tertiary oil reserves, we must either demonstrate production resulting from the tertiary process or the field must be analogous to an existing tertiary flood. The magnitude of proved reserves that we can book in any given year will depend on our progress with new floods, the timing of the production response from new floods and the performance of our existing floods.
Production Rates. The production rate at a tertiary flood can vary from quarter to quarter, as a tertiary field’s production may increase rapidly when wells respond to the CO2, plateau temporarily, and then resume growth as additional areas of the field are developed. During a tertiary flood life cycle, facility capacity is increased from time to time, which occasionally requires temporary shutdowns during installation, thereby causing temporary declines in production. We also find it difficult to precisely predict when any given well will respond to the injected CO2, as the CO2 seldom travels through the rock consistently due to heterogeneity in the oil-bearing formations. We find all of these fluctuations to be normal and generally expect oil production at a tertiary field to increase over time until the field is fully developed, albeit sometimes in inconsistent patterns.
Operating Costs. Tertiary projects may be more expensive to operate than traditional industry operations because of the cost of injecting and recycling the CO2 (primarily due to the cost of the CO2 and the significant energy requirements to re-compress the CO2 back into a near-liquid state for re-injection purposes). The costs of our CO2 and the electricity required to recycle and inject this CO2 comprise over half of our typical tertiary operating expenses. Since these costs vary along with commodity and commercial electricity prices, they are highly variable and will increase in a high-commodity-price environment and decrease in a low-price environment. The cost of purchasing and/or producing CO2 for use in tertiary floods is allocated to our tertiary oil fields and recorded as lease operating expenses (following the commencement of tertiary oil production) at the time the CO2 is injected. These costs have historically represented approximately 20% to 25% of the total operating costs for our tertiary operations. Since we expense all of the operating costs to produce and inject our CO2 (following the commencement of tertiary oil production), operating costs per barrel for a new flood will be higher at the inception of CO2 injection projects because of minimal related oil production at that time.
Denbury Inc.
Management’s Discussion and Analysis of Financial Condition and Results of Operations
RESULTS OF OPERATIONS
Financial and Operating Results Tables
Certain of our financial results for our Successor and Predecessor periods are included in the following table.
| | | | | | | | | | | | | | | | | | | | | | | | | | | | | |
| | Successor | | | Predecessor |
| | | Year Ended
Dec. 31, 2021 | | Period from
Sept. 19, 2020 through
Dec. 31, 2020 | | | Period from
Jan. 1, 2020 through
Sept. 18, 2020 | | Year Ended
Dec. 31, 2019 |
| In thousands, except per-share data | | | | | |
| Financial results | | | | | | | | | |
Net income (loss)(1) | | $ | 56,002 | | | $ | (50,658) | | | | $ | (1,432,578) | | | $ | 216,959 | |
Net income (loss) per common share – basic(1) | | 1.10 | | | (1.01) | | | | (2.89) | | | 0.47 | |
Net income (loss) per common share – diluted(1) | | 1.04 | | | (1.01) | | | | (2.89) | | | 0.45 | |
| Net cash provided by operating activities | | 317,158 | | | 40,326 | | | | 113,408 | | | 494,143 | |
(1)Includes a pre-tax full cost pool ceiling test write-down of our oil and natural gas properties of $14.4 million for the year ended December 31, 2021, $1.0 million for the Successor period September 19, 2020 through December 31, 2020, and $996.7 million for the Predecessor period January 1, 2020 through September 18, 2020. In addition, the Predecessor period January 1, 2020 through September 18, 2020 includes reorganization adjustments, net totaling $850.0 million.
Denbury Inc.
Management’s Discussion and Analysis of Financial Condition and Results of Operations
Certain of our financial and operating results and statistics for each of the last three years are included in the following table.
| | | | | | | | | | | | | | | | | | | | |
| | | Year Ended December 31, |
| In thousands, except per-unit data | | 2021 | | 2020 | | 2019 |
| Average daily sales volumes | | | | | | |
| Bbls/d | | 47,281 | | | 49,828 | | | 56,672 | |
| Mcf/d | | 8,933 | | | 7,938 | | | 9,246 | |
| BOE/d | | 48,770 | | | 51,151 | | | 58,213 | |
| Oil and natural gas sales | | | | | | |
| Oil sales | | $ | 1,148,022 | | | $ | 689,020 | | | $ | 1,205,083 | |
| Natural gas sales | | 11,933 | | | 4,189 | | | 6,937 | |
| Total oil and natural gas sales | | $ | 1,159,955 | | | $ | 693,209 | | | $ | 1,212,020 | |
Commodity derivative contracts(1) | | | | | | |
| Receipt (payment) on settlements of commodity derivatives | | $ | (277,240) | | | $ | 102,485 | | | $ | 23,606 | |
| Noncash fair value losses on commodity derivatives | | (75,744) | | | (62,355) | | | (93,684) | |
| Commodity derivatives income (expense) | | $ | (352,984) | | | $ | 40,130 | | | $ | (70,078) | |
| Unit prices – excluding impact of derivative settlements | | | | | | |
| Oil price per Bbl | | $ | 66.52 | | | $ | 37.78 | | | $ | 58.26 | |
| Natural gas price per Mcf | | 3.66 | | | 1.44 | | | 2.06 | |
Unit prices – including impact of derivative settlements(1) | | | | | | |
| Oil price per Bbl | | $ | 50.46 | | | $ | 43.40 | | | $ | 59.40 | |
| Natural gas price per Mcf | | 3.66 | | | 1.44 | | | 2.06 | |
| Oil and natural gas operating expenses | | | | | | |
| Lease operating expenses | | $ | 424,550 | | | $ | 351,505 | | | $ | 477,220 | |
| Transportation and marketing expenses | | 28,817 | | | 37,759 | | | 41,810 | |
| Production and ad valorem taxes | | 88,468 | | | 53,708 | | | 86,820 | |
| Oil and natural gas operating revenues and expenses per BOE | | | | | | |
| Oil and natural gas revenues | | $ | 65.16 | | | $ | 37.03 | | | $ | 57.04 | |
| Lease operating expenses | | 23.85 | | | 18.78 | | | 22.46 | |
| Transportation and marketing expenses | | 1.62 | | | 2.02 | | | 1.97 | |
| Production and ad valorem taxes | | 4.97 | | | 2.87 | | | 4.09 | |
CO2 sources – revenues and expenses | | | | | | |
CO2 sales and transportation fees | | $ | 44,175 | | | $ | 30,468 | | | $ | 34,142 | |
CO2 operating and discovery expenses | | (6,678) | | | (4,568) | | | (2,922) | |
CO2 revenue and expenses, net | | $ | 37,497 | | | $ | 25,900 | | | $ | 31,220 | |
(1)See also Commodity Derivative Contracts below and Market Risk Management for information concerning our commodity derivative transactions.
Denbury Inc.
Management’s Discussion and Analysis of Financial Condition and Results of Operations
Sales Volumes
Average daily sales volumes by area for 2021, 2020 and 2019, and for each of the quarters of 2021, is shown below:
| | | | | | | | | | | | | | | | | | | | | | | | | | | | | | | | |
| | | Average Daily Sales Volumes (BOE/d) |
| | | 2021 Quarters | | | Year Ended December 31, |
| Operating Area | | First
Quarter | Second
Quarter | Third
Quarter | Fourth
Quarter | | | 2021 | 2020 | 2019 |
| Tertiary oil sales volumes | | | | | | | | | | |
| Gulf Coast region | | | | | | | | | | |
| Delhi | | 2,925 | | 2,931 | | 2,859 | | 2,731 | | | | 2,861 | | 3,419 | | 4,324 | |
| Hastings | | 4,226 | | 4,487 | | 4,343 | | 4,212 | | | | 4,317 | | 4,755 | | 5,403 | |
| Heidelberg | | 4,054 | | 3,942 | | 3,895 | | 3,797 | | | | 3,921 | | 4,297 | | 4,195 | |
| Oyster Bayou | | 3,554 | | 3,791 | | 3,942 | | 4,039 | | | | 3,833 | | 3,818 | | 4,345 | |
| Tinsley | | 3,424 | | 3,455 | | 3,390 | | 3,353 | | | | 3,405 | | 3,959 | | 4,608 | |
| | | | | | | | | | |
Other(1) | | 6,098 | | 6,074 | | 5,907 | | 5,801 | | | | 5,969 | | 6,427 | | 7,062 | |
| Total Gulf Coast region | | 24,281 | | 24,680 | | 24,336 | | 23,933 | | | | 24,306 | | 26,675 | | 29,937 | |
| Rocky Mountain region | | | | | | | | | | |
| Bell Creek | | 4,614 | | 4,394 | | 4,330 | | 4,331 | | | | 4,416 | | 5,518 | | 5,228 | |
Other(2) | | 2,573 | | 4,378 | | 4,703 | | 4,551 | | | | 4,059 | | 1,942 | | 2,196 | |
| Total Rocky Mountain region | | 7,187 | | 8,772 | | 9,033 | | 8,882 | | | | 8,475 | | 7,460 | | 7,424 | |
| Total tertiary oil sales volumes | | 31,468 | | 33,452 | | 33,369 | | 32,815 | | | | 32,781 | | 34,135 | | 37,361 | |
| Non-tertiary oil and gas sales volumes | | | | | | | | | | |
| Gulf Coast region | | | | | | | | | | |
| Total Gulf Coast region | | 3,621 | | 3,415 | | 3,763 | | 3,929 | | | | 3,683 | | 3,807 | | 4,201 | |
| Rocky Mountain region | | | | | | | | | | |
| Cedar Creek Anticline | | 11,150 | | 10,918 | | 11,182 | | 10,784 | | | | 11,008 | | 11,985 | | 14,090 | |
Other(3) | | 1,118 | | 1,348 | | 1,368 | | 1,354 | | | | 1,298 | | 1,030 | | 1,262 | |
| Total Rocky Mountain region | | 12,268 | | 12,266 | | 12,550 | | 12,138 | | | | 12,306 | | 13,015 | | 15,352 | |
| Total non-tertiary sales volumes | | 15,889 | | 15,681 | | 16,313 | | 16,067 | | | | 15,989 | | 16,822 | | 19,553 | |
| Total continuing sales volumes | | 47,357 | | 49,133 | | 49,682 | | 48,882 | | | | 48,770 | | 50,957 | | 56,914 | |
| Property sales | | | | | | | | | | |
Gulf Coast Working Interests Sale(4) | | — | | — | | — | | — | | | | — | | 194 | | 1,299 | |
| Total sales volumes | | 47,357 | | 49,133 | | 49,682 | | 48,882 | | | | 48,770 | | 51,151 | | 58,213 | |
(1)Includes Brookhaven, Cranfield, Eucutta, Little Creek, Mallalieu, Martinville, McComb, Soso and West Yellow Creek fields.
(2)Includes tertiary sales volumes related to our working interest positions in the Wind River Basin properties acquired on March 3, 2021, as well as Salt Creek and Grieve fields.
(3)Includes non-tertiary sales volumes from Wind River Basin, as well as Hartzog Draw and Bell Creek fields.
(4)Includes non-tertiary sales related to the March 2020 sale of 50% of our working interests in Webster, Thompson, Manvel, and East Hastings fields (the “Gulf Coast Working Interests Sale”).
Total sales volumes during 2021 averaged 48,770 BOE/d, including 32,781 Bbls/d from tertiary properties and 15,989 BOE/d from non-tertiary properties. This sales volume represents a decrease of 2,187 BOE/d (4%) compared to 2020 continuing sales volumes which excludes sales volumes related to our Gulf Coast Working Interests Sale in March 2020. The year-over-year decline was primarily impacted by (1) the carryover impact of exceptionally low levels of capital investment over the past several years and development spending in 2021 below levels required to hold production flat (excluding new EOR development at CCA) and (2) decreases at CCA due to the net profits interest of a third party, whereby increased oil prices have resulted in increased profitability and thus, reducing sales volumes net to Denbury by approximately 360 BOE/d when
Denbury Inc.
Management’s Discussion and Analysis of Financial Condition and Results of Operations
compared to 2020, partially offset by sales increases from our Wind River Basin enhanced oil recovery fields acquired on March 3, 2021. Our production during 2021 was 97% oil, consistent with 2020 and 2019.
Oil and Natural Gas Revenues
Oil and natural gas revenues increased 67% between 2020 and 2021 and decreased 43% between 2019 and 2020. The changes in our oil and natural gas revenues are due to changes in production quantities and realized commodity prices (excluding any impact of our commodity derivative contracts), as reflected in the following table:
| | | | | | | | | | | | | | | | | | | | | | | | | | |
| | Year Ended December 31,
2021 vs. 2020 | | Year Ended December 31,
2020 vs. 2019 |
| In thousands | | Increase (Decrease) in Revenues | | Percentage Increase (Decrease) in Revenues | | Decrease in Revenues | | Percentage Decrease in Revenues |
| Change in oil and natural gas revenues due to: | | | | | | | | |
| Decrease in production | | $ | (34,069) | | | (5) | % | | $ | (144,118) | | | (12) | % |
| Increase (decrease) in commodity prices | | 500,815 | | | 72 | % | | (374,693) | | | (31) | % |
| Total increase (decrease) in oil and natural gas revenues | | $ | 466,746 | | | 67 | % | | $ | (518,811) | | | (43) | % |
Excluding any impact of our commodity derivative contracts, our average net realized commodity prices and NYMEX differentials were as follows during 2021, 2020 and 2019:
| | | | | | | | | | | | | | | | | |
| | Year Ended December 31, |
| | 2021 | | 2020 | | 2019 |
| Average net realized prices | | | | | |
| Oil price per Bbl | $ | 66.52 | | | $ | 37.78 | | | $ | 58.26 | |
| Natural gas price per Mcf | 3.66 | | | 1.44 | | | 2.06 | |
| Price per BOE | 65.16 | | | 37.03 | | | 57.04 | |
| Average NYMEX differentials | | | | | |
| Gulf Coast region | | | | | |
| Oil per Bbl | $ | (1.42) | | | $ | (1.14) | | | $ | 3.30 | |
| Natural gas per Mcf | 0.26 | | | (0.14) | | | (0.04) | |
| Rocky Mountain region | | | | | |
| Oil per Bbl | $ | (1.32) | | | $ | (2.80) | | | $ | (2.01) | |
| Natural gas per Mcf | (0.27) | | | (1.36) | | | (0.96) | |
| Total Company | | | | | |
| Oil per Bbl | $ | (1.38) | | | $ | (1.81) | | | $ | 1.23 | |
| Natural gas per Mcf | (0.05) | | | (0.69) | | | (0.47) | |
Prices received in a regional market fluctuate frequently and can differ from NYMEX pricing due to a variety of reasons, including supply and/or demand factors, crude oil quality, and location differentials.
•Gulf Coast Region. Our average NYMEX oil differential in the Gulf Coast region was a negative $1.42 per Bbl in 2021 and a negative $1.14 per Bbl during 2020. NYMEX WTI oil prices continued to strengthen during 2021; however, the pricing for our Gulf Coast grades weakened relative to NYMEX WTI index prices. For our crude oil sold under Light Louisiana Sweet (“LLS”) index prices, the LLS-to-NYMEX differential averaged a positive $1.49 per Bbl on a trade-month basis during 2021, compared to a positive $2.12 per Bbl differential during 2020.
•Rocky Mountain Region. NYMEX oil differentials in the Rocky Mountain region averaged $1.32 per Bbl below NYMEX during 2021, compared to an average differential of $2.80 per Bbl below NYMEX in 2020. Differentials in the Rocky Mountain region can fluctuate with regional supply and demand trends and can fluctuate significantly on a
Denbury Inc.
Management’s Discussion and Analysis of Financial Condition and Results of Operations
month-to-month basis due to weather, refinery or transportation issues, and Canadian and U.S. crude oil price index volatility.
CO2 Revenues and Expenses
We sell a portion of the CO2 we produce from Jackson Dome to third-party industrial users at various contracted prices primarily under long-term contracts. We recognize the revenue received on these CO2 sales as “CO2 sales and transportation fees” with the corresponding costs recognized as “CO2 operating and discovery expenses” in our Consolidated Statements of Operations. CO2 sales and transportation fees were $44.2 million during 2021, compared to $30.5 million during the combined Predecessor and Successor periods included within the year ended December 31, 2020. The increase from the prior-year period was primarily due to new contracts and an increase in CO2 sales volumes to our industrial CO2 customers.
Oil Marketing Revenues and Purchases
In certain situations, we purchase and subsequently sell oil from third parties. We recognize the revenue received and the associated expenses incurred on these sales on a gross basis as “Oil marketing revenues” and “Oil marketing purchases” in our Consolidated Statements of Operations.
Commodity Derivative Contracts
We have routinely entered into oil derivative contracts to provide an economic hedge of our exposure to commodity price risk associated with anticipated future oil production and to provide more certainty to our future cash flows. These contracts have historically consisted of price floors, collars, three-way collars, fixed-price swaps, fixed-price swaps enhanced with a sold put, and basis swaps.
The following tables summarize the impact our commodity derivative contracts had on our operating results for the periods indicated:
| | | | | | | | | | | | | | | | | | | | | | | | | | | | | | | | |
| | Successor |
| | Three Months Ended | | |
| In thousands | | March 31 | | June 30 | | September 30 | | December 31 | | Full Year |
| 2021 | | | | | | | | | | |
| Payment on settlements of commodity derivatives | | $ | (38,453) | | | $ | (63,343) | | | $ | (77,670) | | | $ | (97,774) | | | $ | (277,240) | |
Noncash fair value gains (losses) on commodity derivatives(1) | | (77,290) | | | (109,321) | | | 35,925 | | | 74,942 | | | (75,744) | |
| Commodity derivatives expense | | $ | (115,743) | | | $ | (172,664) | | | $ | (41,745) | | | $ | (22,832) | | | $ | (352,984) | |
| | | | | | | | | | | | | | | | | | | | | | | | | | | | | | | | | | | | | | | | | |
| | Predecessor | | | Successor | | |
| | Three Months Ended | | Period from July 1
through
September 18 | | | Period from September 19
through
September 30 | | Three Months Ended | | |
| In thousands | | March 31 | | June 30 | | | | | December 31 | | Full Year |
| 2020 | | | | | | | | | | | | | |
| Receipt on settlements of commodity derivatives | | $ | 24,638 | | | $ | 45,629 | | | $ | 11,129 | | | | $ | 6,660 | | | $ | 14,429 | | | $ | 102,485 | |
Noncash fair value gains (losses) on commodity derivatives(1) | | 122,133 | | | (85,759) | | | (15,738) | | | | (2,625) | | | (80,366) | | | (62,355) | |
| Commodity derivatives income (expense) | | $ | 146,771 | | | $ | (40,130) | | | $ | (4,609) | | | | $ | 4,035 | | | $ | (65,937) | | | $ | 40,130 | |
| | | | | | | | | | | | | | | | | | | | | | | | | | | | | | | | |
| | Predecessor |
| | Three Months Ended | | |
| In thousands | | March 31 | | June 30 | | September 30 | | December 31 | | Full Year |
| 2019 | | | | | | | | | | |
| Receipt (payment) on settlements of commodity derivatives | | $ | 8,206 | | | $ | (1,549) | | | $ | 8,057 | | | $ | 8,892 | | | $ | 23,606 | |
| Noncash fair value gains (losses) on commodity derivatives | | (91,583) | | | 26,309 | | | 35,098 | | | (63,508) | | | (93,684) | |
| Commodity derivatives income (expense) | | $ | (83,377) | | | $ | 24,760 | | | $ | 43,155 | | | $ | (54,616) | | | $ | (70,078) | |
Denbury Inc.
Management’s Discussion and Analysis of Financial Condition and Results of Operations
Changes in our commodity derivatives expense during 2021 were primarily related to the expiration of commodity derivative contracts, new commodity derivative contracts entered into for future periods, and to the changes in oil futures prices between December 31, 2020 and December 31, 2021. The benefit of the significant increase in our oil sales during 2021 over 2020 sales levels due to rising oil prices has been offset by payments on settlement of commodity derivative contracts, principally due to the strike prices of our fixed-price swaps which were entered into in late 2020 based on the hedging requirements we were obligated to meet under our bank credit facility entered into upon emergence from Chapter 11 restructuring. During 2021, we paid $277.2 million upon expiration of commodity derivative contracts, compared to cash receipts upon settlement of $102.5 million during 2020. The period-to-period changes reflect the very large fluctuation in oil prices between March 2020 ($30.45 per barrel), when worldwide financial markets were beginning to absorb the potential impact of a global pandemic, and December 2021 ($71.69 per barrel) as prospects for increased economic activity and oil demand improved.
In order to provide a level of price protection to our oil production, we have hedged a portion of our estimated oil production through 2023 using NYMEX fixed-price swaps and costless collars. Relative to 2021, our current hedge levels are significantly lower in 2022 and 2023, and we are hedged at more favorable prices and with a greater mix of collars, allowing us to benefit from additional upside in oil prices to a greater degree. We have no further hedging requirements under our bank credit facility. See Note 12, Commodity Derivative Contracts, to the consolidated financial statements for additional details of our outstanding commodity derivative contracts as of December 31, 2021, and Market Risk Management below for additional discussion. In addition, the following table summarizes our oil derivative contracts as of February 23, 2022:
| | | | | | | | | | | | | | | | | | | | | | | | | | | | | |
| | | 1H 2022 | | 2H 2022 | | 1H 2023 | | 2H 2023 |
| WTI NYMEX | Volumes Hedged (Bbls/d) | | 15,500 | | 9,500 | | 4,500 | | 2,000 |
| Fixed-Price Swaps | Weighted Average Swap Price | | $49.01 | | $57.52 | | $74.88 | | $76.80 |
| WTI NYMEX | Volumes Hedged (Bbls/d) | | 11,000 | | 11,500 | | 5,500 | | 2,000 |
| Collars | Weighted Average Floor / Ceiling Price | | $49.77 / $64.31 | | $52.39 / $67.29 | | $63.64 / $84.77 | | $65.00 / $86.47 |
| Total Volumes Hedged (Bbls/d) | | 26,500 | | 21,000 | | 10,000 | | 4,000 |
Based on current contracts in place and NYMEX oil futures prices as of February 23, 2022, which averaged approximately $87 per Bbl for the remainder of 2022, we currently expect that we would make cash payments of approximately $250 million during 2022 upon settlement of these contracts, the amount of which is dependent upon fluctuations in future NYMEX oil prices in relation to the prices of our 2022 fixed-price swaps which have a weighted average NYMEX oil price of $52.28 per Bbl and weighted average ceiling prices of our 2022 collars of $65.85 per Bbl. See Note 12, Commodity Derivative Contracts, to the consolidated financial statements for further discussion. Changes in commodity prices, expiration of contracts, and new commodity contracts entered into cause fluctuations in the estimated fair value of our oil derivative contracts. Because we do not utilize hedge accounting for our commodity derivative contracts, the period-to-period changes in the fair value of these contracts, as outlined above, are recognized in our statements of operations.
Production Expenses
Lease Operating Expenses
| | | | | | | | | | | | | | | | | | | | | | | | | | | | | |
| | Successor | | | Predecessor |
| | Year Ended
Dec. 31, 2021 | | Period from Sept. 19, 2020 through
Dec. 31, 2020 | | | Period from Jan. 1, 2020 through
Sept. 18, 2020 | | Year Ended
Dec. 31, 2019 |
| In thousands, except per-BOE data | | | | | |
| Total lease operating expenses | | $ | 424,550 | | | $ | 101,234 | | | | $ | 250,271 | | | $ | 477,220 | |
| | | | | | | | | |
| Total lease operating expenses per BOE | | $ | 23.85 | | | $ | 19.90 | | | | $ | 18.36 | | | $ | 22.46 | |
Denbury Inc.
Management’s Discussion and Analysis of Financial Condition and Results of Operations
Total lease operating expenses were $424.6 million, or $23.85 per BOE, during the year ended December 31, 2021, compared to $351.5 million, or $18.78 per BOE, for the combined Predecessor and Successor periods included within the year ended December 31, 2020. The $73.0 million increase on an absolute-dollar basis was primarily due to $25.9 million of expense during the 2021 period related to the Wind River Basin acquisition in March 2021, with the remainder largely spread across all expense categories but reflective of the different oil price environments in 2020 and 2021. During 2020, we curtailed production for a short period of time and significantly reduced workover costs due to the extremely low oil price environment. In 2021, workover activity increased as oil prices improved, and we returned to a more normal activity level. Lease operating expenses for the year ended December 31, 2021 included a $16.1 million benefit resulting from compensation under certain of the Company’s power agreements for power interruption during the severe winter storm in February 2021 which created widespread power outages in Texas and disrupted the Company’s operations.
We currently expect lease operating expenses during 2022 to increase on an absolute-dollar and per-BOE basis as a result of CO2 and power expenses correlated with higher oil and natural gas prices; inflationary impacts across numerous cost categories such as contract labor, chemicals, and workovers; the 2022 period reflecting a full year’s worth of operating expenses for our Wind River Basin properties; and the absence of a one-time $16.1 million benefit during the 2021 period related to power agreements.
Transportation and Marketing Expenses
Transportation and marketing expenses primarily consist of amounts incurred related to the transportation, marketing, and processing of oil and natural gas production. Transportation and marketing expenses were $28.8 million during 2021, compared to $37.8 million for the combined Predecessor and Successor periods included within the year ended December 31, 2020. The decrease between periods was primarily due to changes to a portion of our transportation agreements in the Rocky Mountain region during the third quarter of 2021 to begin selling our production at Guernsey, Wyoming versus Cushing, Oklahoma and due to lower sales volumes during 2021.
Taxes Other than Income
Taxes other than income, which includes production, ad valorem and franchise taxes, were $91.4 million during 2021, compared to $60.1 million for the combined Predecessor and Successor periods included within the year ended December 31, 2020. The increase between periods was primarily due to an increase in production taxes resulting from higher oil and natural gas revenues.
General and Administrative Expenses (“G&A”)
| | | | | | | | | | | | | | | | | | | | | | | | | | | | | |
| | Successor | | | Predecessor |
| | | Year Ended
Dec. 31, 2021 | | Period from Sept. 19, 2020 through
Dec. 31, 2020 | | | Period from Jan. 1, 2020 through
Sept. 18, 2020 | | Year Ended
Dec. 31, 2019 |
| In thousands, except per-BOE data and employees | | | | | |
| Cash G&A costs | | $ | 53,936 | | | $ | 11,258 | | | | $ | 41,096 | | | $ | 51,932 | |
| Stock-based compensation | | 25,322 | | | 8,212 | | | | 4,111 | | | 12,470 | |
| Severance-related costs | | — | | | — | | | | 3,315 | | | 18,627 | |
| G&A expense | | $ | 79,258 | | | $ | 19,470 | | | | $ | 48,522 | | | $ | 83,029 | |
| | | | | | | | | |
| G&A per BOE | | | | | | | | | |
| Cash G&A costs | | $ | 3.03 | | | $ | 2.21 | | | | $ | 3.02 | | | $ | 2.44 | |
| Stock-based compensation | | 1.42 | | | 1.62 | | | | 0.30 | | | 0.59 | |
| Severance-related costs | | — | | | — | | | | 0.24 | | | 0.88 | |
| G&A expenses | | $ | 4.45 | | | $ | 3.83 | | | | $ | 3.56 | | | $ | 3.91 | |
| | | | | | | | | |
| Employees as of period end | | 716 | | | 657 | | | | 662 | | | 806 | |
Denbury Inc.
Management’s Discussion and Analysis of Financial Condition and Results of Operations
Our G&A expense on an absolute-dollar basis was $79.3 million during 2021, compared to $68.0 million for the combined Predecessor and Successor periods included within the year ended December 31, 2020. The increase in our G&A expenses during 2021 was primarily due to a $13.0 million increase in stock-based compensation expense resulting from the vesting of performance-based equity awards granted in late 2020, as well as being due to a full year of expense for restricted stock unit awards also granted in late 2020. Although the performance criteria for these performance-based equity awards were met in 2021, the shares are not currently outstanding as actual delivery of the shares is not scheduled to occur until after the end of the performance period, December 4, 2023. We expect stock compensation expense will be lower in 2022 as future performance awards will be more traditional in nature and will be expensed over a longer time period.
Interest and Financing Expenses | | | | | | | | | | | | | | | | | | | | | | | | | | | | | |
| | Successor | | | Predecessor |
| | | Year Ended
Dec. 31, 2021 | | Period from Sept. 19, 2020 through
Dec. 31, 2020 | | | Period from Jan. 1, 2020 through
Sept. 18, 2020 | | Year Ended
Dec. 31, 2019 |
| In thousands, except per-BOE data and interest rates | | | | | |
Cash interest(1) | | $ | 5,992 | | | $ | 2,277 | | | | $ | 108,824 | | | $ | 191,454 | |
Less: interest not reflected as expense for financial reporting purposes(1) | | — | | | — | | | | (49,243) | | | (85,454) | |
| Noncash interest expense | | 2,740 | | | 799 | | | | 2,439 | | | 4,554 | |
Amortization of debt discount(2) | | — | | | — | | | | 9,132 | | | 7,749 | |
| Less: capitalized interest | | (4,585) | | | (1,261) | | | | (22,885) | | | (36,671) | |
| Interest expense, net | | $ | 4,147 | | | $ | 1,815 | | | | $ | 48,267 | | | $ | 81,632 | |
| Interest expense, net per BOE | | $ | 0.23 | | | $ | 0.36 | | | | $ | 3.54 | | | $ | 3.84 | |
Average debt principal outstanding(3) | | $ | 84,970 | | | $ | 123,120 | | | | $ | 1,767,605 | | | $ | 2,433,245 | |
Average cash interest rate(4) | | 7.1 | % | | 6.5 | % | | | 8.6 | % | | 7.9 | % |
(1)Cash interest during the Predecessor periods includes the portion of interest on certain debt instruments accounted for as a reduction of debt for GAAP financial reporting purposes in accordance with Financial Accounting Standards Board Codification (“FASC”) 470-60, Troubled Debt Restructuring by Debtors. The portion of interest treated as a reduction of debt was related to the Predecessor’s 9% Senior Secured Second Lien Notes due 2021 (the “2021 Notes”) and 9¼% Senior Secured Second Lien Notes due 2022 (the “2022 Notes”) during the Predecessor period from January 1, 2020 through September 18, 2020 and year ended December 31, 2019. Amounts related to the 2021 Notes and 2022 Notes remaining in future interest payable were written-off to “Reorganization items, net” in the Consolidated Statements of Operations on July 30, 2020 (the “Petition Date”).
(2)Represents amortization of debt discounts related to the 7¾% Senior Secured Second Lien Notes due 2024 (the “7¾% Senior Secured Notes”) and 6⅜% Convertible Senior Notes due 2024 (the “2024 Convertible Notes”) during the Predecessor period January 1, 2020 through September 18, 2020. Remaining debt discounts were written-off to “Reorganization items, net” in the Consolidated Statements of Operations on the Petition Date.
(3)Excludes debt discounts related to the Predecessor’s 7¾% Senior Secured Notes and 2024 Convertible Notes.
(4)Includes commitment fees but excludes debt issue costs and amortization of discount.
Cash interest was $6.0 million during 2021, compared to $111.1 million for the combined Predecessor and Successor periods included within the year ended December 31, 2020. The decrease between periods was primarily due to a decrease in the average debt principal outstanding, with the Successor periods reflecting the full extinguishment of all outstanding obligations under the senior secured second lien notes, convertible senior notes, and senior subordinated notes on the Emergence Date, pursuant to the terms of the prepackaged joint plan of reorganization (the “Plan”), relieving us of approximately $2.1 billion of debt by issuing equity and/or warrants in the Successor period to the holders of that debt.
Denbury Inc.
Management’s Discussion and Analysis of Financial Condition and Results of Operations
Depletion, Depreciation, and Amortization (“DD&A”)
| | | | | | | | | | | | | | | | | | | | | | | | | | | | | |
| | Successor | | | Predecessor |
| | | Year Ended
Dec. 31, 2021 | | Period from Sept. 19, 2020 through
Dec. 31, 2020 | | | Period from Jan. 1, 2020 through
Sept. 18, 2020 | | Year Ended
Dec. 31, 2019 |
| In thousands, except per-BOE data | | | | | |
| Oil and natural gas properties | | $ | 119,997 | | | $ | 37,188 | | | | $ | 104,495 | | | $ | 159,478 | |
CO2 properties, pipelines, plants and other property and equipment | | 30,643 | | | 8,624 | | | | 44,939 | | | 74,338 | |
Accelerated depreciation charge(1) | | — | | | — | | | | 39,159 | | | — | |
| Total DD&A | | $ | 150,640 | | | $ | 45,812 | | | | $ | 188,593 | | | $ | 233,816 | |
| | | | | | | | | |
| DD&A per BOE | | | | | | | | | |
| Oil and natural gas properties | | $ | 6.74 | | | $ | 7.31 | | | | $ | 7.66 | | | $ | 7.51 | |
CO2 properties, pipelines, plants and other property and equipment | | 1.72 | | | 1.69 | | | | 3.30 | | | 3.49 | |
Accelerated depreciation charge(1) | | — | | | — | | | | 2.87 | | | — | |
| Total DD&A cost per BOE | | $ | 8.46 | | | $ | 9.00 | | | | $ | 13.83 | | | $ | 11.00 | |
| | | | | | | | | |
| Write-down of oil and natural gas properties | | $ | 14,377 | | | $ | 1,006 | | | | $ | 996,658 | | | $ | — | |
(1)Represents an accelerated depreciation charge related to capitalized amounts associated with unevaluated properties that were transferred to the full cost pool.
DD&A expense was $150.6 million during 2021, compared to $234.4 million for the combined Predecessor and Successor periods included within the year ended December 31, 2020. The decrease during 2021 compared to the comparable 2020 period was primarily due to lower depletable costs due to the step down in book value resulting from fresh start accounting as of September 18, 2020 and an accelerated depreciation charge of $39.2 million during the Predecessor period from January 1, 2020 through September 18, 2020. Our oil and natural gas properties depletion rate was $6.71 per BOE during the fourth quarter of 2021.
Full Cost Pool Ceiling Test
Under full cost accounting rules, we are required each quarter (as well as at the end of the Predecessor period) to perform a ceiling test calculation. Under these rules, the full cost ceiling value is calculated using the average first-day-of-the-month oil and natural gas prices for each month during a 12-month rolling period prior to the end of a particular reporting period. The average first-day-of-the-month NYMEX oil price used in estimating our proved reserves, after adjustments for market differentials and transportation expenses by field, was $63.86 at December 31, 2021, $35.84 at December 31, 2020, $40.08 at September 18, 2020 and $55.55 at December 31, 2019. We recognized a full cost pool ceiling test write-down of $14.4 million during the first quarter of 2021, with first-day-of-the-month NYMEX oil prices for the preceding 12 months averaging $36.40 per Bbl, after adjustments for market differentials and transportation expenses by field. The write-down was primarily a result of the March 2021 acquisition of Wyoming property interests (see Note 3, Acquisition and Divestitures) which was recorded based on a valuation that utilized NYMEX strip oil prices at the acquisition date, which were significantly higher than the average first-day-of-the-month NYMEX oil prices used to value the cost ceiling. Primarily as a result of commodity price declines during 2020, the Predecessor recognized full cost pool ceiling test write-downs of $996.7 million during the period from January 1, 2020 through September 18, 2020, and an additional full cost pool ceiling test write-down of $1.0 million was recognized during the Successor period from September 19, 2020 through December 31, 2020.
Reorganization Items, Net
“Reorganization items, net” in our Consolidated Statements of Operations includes (i) expenses incurred during the Company’s “prepackaged” voluntary bankruptcy subsequent to the Petition Date as a direct result of the Plan, (ii) gains or
Denbury Inc.
Management’s Discussion and Analysis of Financial Condition and Results of Operations
losses from liabilities settled and (iii) fresh start accounting adjustments. Professional service provider charges associated with our restructuring that were incurred outside of this period (before the Petition Date and after the Emergence Date) are recorded in “Other expenses” in our Consolidated Statements of Operations.
The following table summarizes the losses (gains) on reorganization items, net:
| | | | | | | | |
| | Predecessor |
| | Period from
Jan. 1, 2020 through
Sept. 18, 2020 |
| In thousands | |
| Gain on settlement of liabilities subject to compromise | | $ | (1,024,864) | |
| Fresh start accounting adjustments | | 1,834,423 | |
| Professional service provider fees and other expenses | | 11,267 | |
| Success fees for professional service providers | | 9,700 | |
| Loss on rejected contracts and leases | | 10,989 | |
| Valuation adjustments to debt classified as subject to compromise | | 757 | |
| Debtor-in-possession credit agreement fees | | 3,107 | |
| Acceleration of Predecessor stock compensation expense | | 4,601 | |
| Total reorganization items, net | | $ | 849,980 | |
Other Expenses
Other expenses totaled $10.8 million during 2021 and primarily includes plant operating expenses, litigation accruals and noncash fair value adjustments for contingent consideration payments related to our March 2021 Wind River Basin CO2 EOR field acquisition, slightly offset by insurance reimbursements for previously-incurred costs associated with the February 2020 Delta-Tinsley CO2 pipeline repair. Other expenses totaled $43.9 million for the combined Predecessor and Successor periods included within the year ended December 31, 2020. Other expenses during 2020 primarily are comprised of $28.2 million of professional fees associated with restructuring activities, $5.1 million for the write-off of certain trade receivables, $4.3 million of costs associated with the Delta-Tinsley CO2 pipeline repair, and $0.9 million of costs associated with the APMTG Helium, LLC helium supply contract ruling.
Income Taxes
| | | | | | | | | | | | | | | | | | | | | | | | | | | | | |
| | Successor | | | Predecessor |
| | | Year Ended
Dec. 31, 2021 | | Period from Sept. 19, 2020 through
Dec. 31, 2020 | | | Period from Jan. 1, 2020 through
Sept. 18, 2020 | | Year Ended
Dec. 31, 2019 |
| In thousands, except per-BOE amounts and tax rates | | | | | |
| Current income tax expense (benefit) | | $ | 403 | | | $ | 30 | | | | $ | (7,260) | | | $ | 3,881 | |
| Deferred income tax expense (benefit) | | 364 | | | (2,556) | | | | (408,869) | | | 100,471 | |
| Total income tax expense (benefit) | | $ | 767 | | | $ | (2,526) | | | | $ | (416,129) | | | $ | 104,352 | |
| Average income tax expense (benefit) per BOE | | $ | 0.04 | | | $ | (0.49) | | | | $ | (30.52) | | | $ | 4.91 | |
| Effective tax rate | | 1.4 | % | | 4.7 | % | | | 22.5 | % | | 32.5 | % |
| Total net deferred tax liability | | $ | 1,638 | | | $ | 1,274 | | | | | | $ | 410,230 | |
Our income tax provisions were based on an estimated combined federal and state statutory tax rate of approximately 25% for 2021, 2020 and 2019. Our effective tax rate for 2021 was lower than our estimated statutory rate, primarily due to our overall deferred tax asset position and the valuation allowance offsetting those assets. As we had pre-tax income for the year ended December 31, 2021, the income tax expense resulting from our income is substantially offset by a change in valuation allowance, resulting in essentially no tax provision.
Denbury Inc.
Management’s Discussion and Analysis of Financial Condition and Results of Operations
As of December 31, 2021, we are in a net deferred tax asset position primarily due to net operating loss and tax credit carryforwards and differences in the tax basis of accrued liabilities, including derivative contract liabilities. Based on all available evidence, both positive and negative, we continue to record a valuation allowance on our underlying deferred tax assets as of December 31, 2021, as we believe our deferred tax assets are not more-likely-than-not to be realized. We intend to maintain the valuation allowances on our deferred tax assets until there is sufficient evidence to support the reversal of all or some portion of the allowances. It is reasonably possible that sufficient evidence required to release our valuation allowance will exist in the future if the current strength being observed in commodity prices is sustained. Such positive evidence may allow us to reach a conclusion that all, or a portion of, the valuation allowance associated with our federal net deferred tax assets, totaling $51.4 million as of December 31, 2021, will no longer be needed. Release of the valuation allowance would result in the recognition of certain deferred tax assets and a decrease to income tax expense in the period the release is recorded. The exact timing and amount of the valuation allowance are subject to the level of profitability that we are able to actually achieve.
The current income tax benefit for the Predecessor period ended September 18, 2020 represents amounts expected to be realized from refundable alternative minimum tax credits and certain state tax obligations that we expect to be realized.
As provided for under FASC 740-270-35-2, we determined the actual effective tax rate for the Predecessor period from January 1, 2020 through September 18, 2020 was the best estimate of our annual effective tax rate. Our effective tax rate for the 2020 Predecessor period was lower than our estimated statutory rate, primarily due to the establishment of a valuation allowance on our federal and state deferred tax assets after the application of fresh start accounting. Our income tax provision for the Successor 2020 period was also based on the same estimated statutory rate of approximately 25% but was near zero, as any tax expense or benefit associated with pre-tax book income or loss was offset with a change in valuation allowance on our federal and state deferred tax assets. The Successor’s effective tax rate of 4.7% was primarily due to adjustments related to our Texas net deferred tax liabilities.
We have $0.6 million of alternative minimum tax credits, which under the Tax Cut and Jobs Act will be refunded in 2022 and are recorded as a receivable on the balance sheet. Our state net operating loss carryforwards expire in various years, starting in 2025. The statutes of limitation for our income tax returns for tax years ending prior to 2018 have lapsed and therefore are not subject to examination by respective taxing authorities.
Denbury Inc.
Management’s Discussion and Analysis of Financial Condition and Results of Operations
Per-BOE Data
The following table summarizes our cash flow and results of operations on a per-BOE basis for the comparative periods. Each of the significant individual components is discussed above.
| | | | | | | | | | | | | | | | | | | | |
| | | Year Ended December 31, |
| Per-BOE data | | 2021 | | 2020 | | 2019 |
| Oil and natural gas revenues | | $ | 65.16 | | | $ | 37.03 | | | $ | 57.04 | |
| Receipt (payment) on settlements of commodity derivatives | | (15.57) | | | 5.47 | | | 1.11 | |
| Lease operating expenses | | (23.85) | | | (18.78) | | | (22.46) | |
| Production and ad valorem taxes | | (4.97) | | | (2.87) | | | (4.09) | |
| Transportation and marketing expenses | | (1.62) | | | (2.02) | | | (1.97) | |
| Production netback | | 19.15 | | | 18.83 | | | 29.63 | |
CO2 sales, net of operating and discovery expenses | | 2.10 | | | 1.39 | | | 1.47 | |
General and administrative expenses(1) | | (4.45) | | | (3.63) | | | (3.91) | |
| Interest expense, net | | (0.23) | | | (2.68) | | | (3.84) | |
| Reorganization items settled in cash | | — | | | (2.08) | | | — | |
| Stock compensation and other | | 0.97 | | | (0.38) | | | 0.43 | |
| Changes in assets and liabilities relating to operations | | 0.28 | | | (3.24) | | | (0.52) | |
| Cash flows from operations | | 17.82 | | | 8.21 | | | 23.26 | |
| DD&A – excluding accelerated depreciation charge | | (8.46) | | | (10.43) | | | (11.00) | |
DD&A – accelerated depreciation charge(2) | | — | | | (2.09) | | | — | |
| Write-down of oil and natural gas properties | | (0.81) | | | (53.29) | | | — | |
| Deferred income taxes | | (0.02) | | | 21.98 | | | (4.73) | |
| Gain on extinguishment of debt | | — | | | 1.01 | | | 7.34 | |
| Noncash fair value losses on commodity derivatives | | (4.26) | | | (3.33) | | | (4.41) | |
| Noncash reorganization items, net | | — | | | (43.32) | | | — | |
| Other noncash items | | (1.12) | | | 2.03 | | | (0.25) | |
| Net income (loss) | | $ | 3.15 | | | $ | (79.23) | | | $ | 10.21 | |
(1)General and administrative expenses include (a) $15.3 million of performance stock-based compensation related to the full vesting of outstanding performance awards during the year ended December 31, 2021, resulting in a significant non-recurring expense, which if excluded, would have caused these expenses to average $3.60 per BOE and (b) an accrual for severance-related costs of $18.6 million associated with our voluntary separation program for the year ended December 31, 2019, which if excluded, would have averaged $3.03 per BOE.
(2)Represents an accelerated depreciation charge related to impaired unevaluated properties that were transferred to the full cost pool.
Denbury Inc.
Management’s Discussion and Analysis of Financial Condition and Results of Operations
MARKET RISK MANAGEMENT
Debt and Interest Rate Sensitivity
At December 31, 2021, we had $35.0 million of outstanding borrowing under our Bank Credit Agreement. At this level of variable-rate debt, an increase or decrease of 10% in interest rates would have an immaterial effect on our interest expense. Our Bank Credit Agreement does not have any triggers or covenants regarding our debt ratings with rating agencies. The following table presents the principal and fair values of our outstanding debt as of December 31, 2021:
| | | | | | | | | | | | | | | | | | | | | | | | | | | | | | | | | | | | | | |
| In thousands | | 2022 | | 2023 | | 2024 | | 2025 | | Total | | Fair
Value |
| Variable rate debt | | | | | | | | | | | | |
| Senior Secured Bank Credit Facility (weighted average interest rate of 4.0% at December 31, 2021) | | $ | — | | | $ | — | | | $ | 35,000 | | | $ | — | | | $ | 35,000 | | | $ | 35,000 | |
Commodity Derivative Contracts
We enter into oil derivative contracts to provide an economic hedge of our exposure to commodity price risk associated with anticipated future oil production and to provide more certainty to our future cash flows. We do not hold or issue derivative financial instruments for trading purposes. Generally, these contracts have consisted of various combinations of price floors, collars, three-way collars, fixed-price swaps, fixed-price swaps enhanced with a sold put, and basis swaps. The production that we hedge has varied from year to year depending on our levels of debt, financial strength, expectation of future commodity prices, and occasionally requirements under our bank credit facility. As of December 31, 2020, we were in compliance with the hedging requirements under our Bank Credit Agreement requiring certain non-recurring minimum commodity hedge levels covering anticipated crude oil production through July 31, 2022, and we have no further hedging requirements under our Bank Credit Agreement. In order to provide a level of price protection to our oil production, we have hedged a portion of our estimated oil production through 2023 using NYMEX fixed-price swaps and costless collars. Depending on market conditions, we may continue to add to our existing 2022 and 2023 hedges. See also Note 12, Commodity Derivative Contracts, and Note 13, Fair Value Measurements, to the consolidated financial statements for additional information regarding our commodity derivative contracts.
All of the mark-to-market valuations used for our commodity derivatives are provided by external sources. We manage and control market and counterparty credit risk through established internal control procedures that are reviewed on an ongoing basis. We attempt to minimize credit risk exposure to counterparties through formal credit policies, monitoring procedures and diversification. All of our commodity derivative contracts are with parties that are lenders under our senior secured bank credit facility (or affiliates of such lenders). We have included an estimate of nonperformance risk in the fair value measurement of our commodity derivative contracts, which we have measured for nonperformance risk based upon credit default swaps or credit spreads.
For accounting purposes, we do not apply hedge accounting to our commodity derivative contracts. This means that any changes in the fair value of these commodity derivative contracts will be charged to earnings instead of charging the effective portion to other comprehensive income and the ineffective portion to earnings.
At December 31, 2021, our commodity derivative contracts were recorded at their fair value, which was a net liability of $134.5 million, $75.7 million higher than the $58.8 million net liability recorded at December 31, 2020. This change is primarily related to the expiration of commodity derivative contracts during 2021, new commodity derivative contracts entered into during 2021 for future periods, and to the changes in oil futures prices between December 31, 2020 and 2021.
Denbury Inc.
Management’s Discussion and Analysis of Financial Condition and Results of Operations
Commodity Derivative Sensitivity Analysis
Based on NYMEX oil futures prices and derivative contracts in place as of December 31, 2021, and assuming both a 10% increase and decrease thereon, we would expect to make payments on our crude oil derivative contracts as shown in the following table:
| | | | | | | | |
| In thousands | | Receipt / (Payment) |
| Based on: | | |
| Futures prices as of December 31, 2021 | | $ | (124,394) | |
| 10% increase in prices | | (184,362) | |
| 10% decrease in prices | | (70,439) | |
Our commodity derivative contracts are used as an economic hedge of our exposure to commodity price risk associated with anticipated future production. As a result, changes in receipts or payments of our commodity derivative contracts due to changes in commodity prices, as reflected in the above table, would be mostly offset by a corresponding increase or decrease in the cash receipts on sales of our oil production to which those commodity derivative contracts relate.
CRITICAL ACCOUNTING ESTIMATES
The preparation of financial statements in accordance with generally accepted accounting principles requires that we make certain estimates and judgments. Our significant accounting policies are included in Note 1, Nature of Operations and Summary of Significant Accounting Policies, to the consolidated financial statements. These policies, along with the underlying assumptions and judgments by our management in their application, have a significant impact on our consolidated financial statements. Following is a discussion of our most critical accounting estimates, judgments and uncertainties that are inherent in the preparation of our financial statements.
Fresh Start Accounting
Upon emergence from bankruptcy, we met the criteria and were required to adopt fresh start accounting in accordance with FASC Topic 852, Reorganizations, which on the Emergence Date resulted in a new entity, the Successor, for financial reporting purposes, with no beginning retained earnings or deficit as of the fresh start reporting date. Fresh start accounting requires that new fair values be established for the Company’s assets, liabilities and equity as of the date of emergence from bankruptcy, September 18, 2020. The Emergence Date fair values of the Successor’s assets and liabilities differ materially from their recorded values as reflected on the historical balance sheet of the Predecessor and required a number of estimates and judgments to be made. All estimates, assumptions, valuations and financial projections, including the fair value adjustments, financial projections, enterprise value and equity value, are inherently subject to significant uncertainties and the resolution of contingencies beyond our control. Accordingly, there is no assurance that the estimates, assumptions, valuations or financial projections will be realized, and actual results could vary materially. Among the most material of these judgments and estimates that were made were the following:
•Reorganization Value – The reorganization value derived from the range of enterprise values associated with the Plan was allocated to the Company’s identifiable tangible and intangible assets and liabilities based on their fair values. The value of the reconstituted entity (i.e., Successor) was based on management projections and the valuation models as determined by the Company’s financial advisors in setting an estimated range of enterprise values. With the assistance of third-party valuation advisors, we determined the enterprise and corresponding equity value of the Successor using various valuation approaches and methods, including: (i) income approach using a calculation of the present value of future cash flows based on our financial projections, (ii) the market approach using selling prices of similar assets and (iii) the cost approach.
•Oil and Natural Gas Properties – The fair value of our oil and natural gas properties was determined based on the discounted cash flows expected to be generated from these assets. The computations were based on market conditions and reserves in place as of the Emergence Date.
The fair value analysis was based on the Company’s estimated future production rates of proved and probable reserves as prepared by the Company’s independent petroleum engineers. Discounted cash flow models were prepared using the
Denbury Inc.
Management’s Discussion and Analysis of Financial Condition and Results of Operations
estimated future revenues and operating costs for all developed wells and undeveloped properties comprising the proved and probable reserves. Future revenue estimates were based upon estimated future production rates and forward strip oil and natural gas prices as of the Emergence Date through 2024 and escalated for inflation thereafter, adjusted for differentials. Operating costs were adjusted for estimated inflation beginning in year 2025. A risk adjustment factor was applied to each reserve category, consistent with the risk of the category. The discounted cash flow models also included adjustments for income tax expenses.
Discount factors utilized were derived using a weighted average cost of capital computation, which included an estimated cost of debt and equity for market participants with similar geographies and asset development type and varying corporate income tax rates based on the expected point of sale for each property’s produced assets. Reserve values were also adjusted for any asset retirement obligations as well as for CO2 indirect costs not directly allocable to oil fields.
•CO2 Properties – The fair value of CO2 properties includes the value of CO2 mineral rights and associated infrastructure and was determined using the discounted cash flow method under the income approach. After-tax cash flows were forecast based on expected costs to produce and transport CO2 as estimated by management, and income was imputed using a gross-up of costs based on a five-year average historical EBITDA margin for publicly traded companies that primarily develop or produce natural gas. Cash flows were also adjusted for a market participant profit on CO2 costs, since Denbury charges oil fields for CO2 use on a cost basis. Cash flows were then discounted using a rate considering reduced risk associated with CO2 industrial sales.
•Pipelines – The fair values of our pipelines were determined using a combination of the replacement cost method under the cost approach and the discounted cash flow method under the income approach. The replacement cost method considers historical acquisition costs for the assets adjusted for inflation, as well as factors in any potential obsolescence based on the current condition of the assets and the ability of those assets to generate cash flow. For assets valued using the discounted cash flow method, after-tax cash flows were forecast based on expected costs estimated by management, and profits were imputed using a gross-up of costs based on a five-year average historical EBITDA margin for publicly traded companies that primarily transport natural gas.
Full Cost Method of Accounting, Depletion and Depreciation and Oil and Natural Gas Properties
Businesses involved in the production of oil and natural gas are required to follow accounting rules that are unique to the oil and gas industry. We apply the full cost method of accounting for our oil and natural gas properties. Another acceptable method of accounting for oil and natural gas production activities is the successful efforts method of accounting. In general, the primary differences between the two methods are related to the capitalization of costs and the evaluation for asset impairment. Under the full cost method, all geological and geophysical costs, exploratory dry holes and delay rentals are capitalized to the full cost pool, whereas under the successful efforts method such costs are expensed as incurred. In the assessment of impairment of oil and natural gas properties, the successful efforts method follows the Accounting for the Impairment or Disposal of Long-Lived Assets topic of the FASC, under which the net book value of assets is measured for impairment against the undiscounted future cash flows using commodity prices consistent with management expectations. Under the full cost method, the full cost pool (net book value of oil and natural gas properties) is measured against future cash flows discounted at 10% using the average first-day-of-the-month oil and natural gas price for each month during a 12-month rolling period through the end of each quarterly reporting period. The financial results for a given period could be substantially different depending on the method of accounting that an oil and gas entity applies. Further, we do not designate our oil and natural gas derivative contracts as hedging instruments for accounting purposes under the Derivatives and Hedging topic of the FASC (see below), and as a result, these contracts are not considered in the full cost ceiling test.
We make significant estimates at the end of each period related to accruals for oil and natural gas revenues, production, capitalized costs and operating expenses. We calculate these estimates with our best available data, which includes, among other things, production reports, price posting, information compiled from daily drilling reports and other internal tracking devices, and analysis of historical results and trends. While management is not aware of any required revisions to its estimates, there will likely be future adjustments resulting from such things as revisions in estimated oil and natural gas volumes, changes in ownership interests, payouts, joint venture audits, re-allocations by the purchasers or pipelines, or other corrections and adjustments common in the oil and gas industry, many of which will require retroactive application. These types of adjustments cannot be currently estimated or determined and will be recorded in the period during which the adjustment occurs.
Denbury Inc.
Management’s Discussion and Analysis of Financial Condition and Results of Operations
Under full cost accounting, the estimated quantities of proved oil and natural gas reserves used to compute depletion and the related present value of estimated future net cash flows therefrom used to perform the full cost ceiling test have a significant impact on the underlying financial statements. The process of estimating oil and natural gas reserves is very complex, requiring significant decisions in the evaluation of all available geological, geophysical, engineering and economic data. The data for a given field may also change substantially over time as a result of numerous factors, including additional development activity, evolving production history and continued reassessment of the viability of production under varying economic conditions. As a result, material revisions to existing reserve estimates may occur from time to time. Although every reasonable effort is made to ensure the reported reserve estimates represent the most accurate assessments possible, including the hiring of independent engineers to prepare reported estimates, the subjective decisions and variances in available data for various fields make these estimates generally less precise than other estimates included in our financial statement disclosures. Over the last three years, annual revisions to our reserve estimates, excluding any revisions related to changes in commodity prices, have averaged approximately 3.9% of the previous year’s estimates and have been both positive and negative.
Changes in commodity prices also affect our reserve quantities. These changes in quantities affect our DD&A rate, and the combined effect of changes in quantities and commodity prices impacts our full cost ceiling test calculation. For example, we estimate that a 5% increase in our estimate of proved reserve quantities would have lowered our fourth quarter 2021 oil and natural gas property DD&A rate from $6.71 per BOE to approximately $6.43 per BOE, and a 5% decrease in our proved reserve quantities would have increased our DD&A rate to approximately $7.01 per BOE. Also, reserve quantities and their ultimate values, determined solely by our lenders, are the primary factors in determining the maximum borrowing base under our senior secured bank credit facility, particularly quantities and values of our proved developed producing reserves.
Under full cost accounting rules, we are required each quarter (as well as at the end of the Predecessor period) to perform a ceiling test calculation. The net capitalized costs of oil and natural gas properties are limited to the lower of unamortized cost or the cost center ceiling. The cost center ceiling is defined as (1) the present value of estimated future net revenues from proved oil and natural gas reserves before future abandonment costs (discounted at 10%), based on the average first-day-of-the-month oil and natural gas price for each month during a 12-month rolling period prior to the end of a particular reporting period; plus (2) the cost of properties not being amortized; plus (3) the lower of cost or estimated fair value of unproved properties included in the costs being amortized, if any; less (4) related income tax effects. Our future net revenues from proved oil and natural gas reserves are not reduced for development costs related to the cost of drilling for and developing CO2 reserves nor those related to the cost of constructing CO2 pipelines, as we do not have to incur additional CO2 capital costs to develop the proved oil and natural gas reserves. Therefore, we include in the ceiling test, as a reduction of future net revenues, that portion of our capitalized CO2 costs related to CO2 reserves and CO2 pipelines that we estimate will be consumed in the process of producing our proved oil and natural gas reserves. The fair value of our oil and natural gas derivative contracts is not included in the ceiling test, as we do not designate these contracts as hedging instruments for accounting purposes. The cost center ceiling test is prepared quarterly.
The average first-day-of-the-month NYMEX oil price used in estimating our proved reserves, after adjustments for market differentials and transportation expenses by field, was $63.86 at December 31, 2021, $35.84 at December 31, 2020, $40.08 at September 18, 2020, and $55.55 at December 31, 2019. We recognized a full cost pool ceiling test write-down of $14.4 million during the first quarter of 2021, with first-day-of-the-month NYMEX oil prices for the preceding 12 months averaging $36.40 per Bbl, after adjustments for market differentials and transportation expenses by field. The write-down was primarily a result of the March 2021 acquisition of Wyoming property interests (see Note 3, Acquisition and Divestitures) which was recorded based on a valuation that utilized NYMEX strip oil prices at the acquisition date, which were significantly higher than the average first-day-of-the-month NYMEX oil prices used to value the cost ceiling. Primarily as a result of commodity price declines during 2020, the Predecessor recognized full cost pool ceiling test write-downs of $996.7 million during the period from January 1, 2020 through September 18, 2020, and an additional full cost pool ceiling test write-down of $1.0 million was recognized during the Successor period from September 19, 2020 through December 31, 2020.
We exclude certain unevaluated costs from the amortization base and full cost ceiling test pending the determination of whether proved reserves can be assigned to such properties. The costs classified as unevaluated are transferred to the full cost amortization base as the properties are developed, tested and evaluated. At least annually, we test these assets for impairment based on an evaluation of management’s expectations of future pricing, evaluation of lease expiration terms, and planned project development activities. Given the significant declines in NYMEX oil prices in March and April 2020 due to the oil supply and demand imbalance precipitated by the dramatic fall in demand associated with the COVID-19 pandemic combined with the concurrent OPEC+ decision to increase oil supply, we reassessed our development plans and transferred $244.9
Denbury Inc.
Management’s Discussion and Analysis of Financial Condition and Results of Operations
million of our unevaluated costs to the full cost pool during the Predecessor period from January 1, 2020 through September 18, 2020. Upon emergence from bankruptcy, the Company adopted fresh start accounting which resulted in our oil and natural gas properties, including unevaluated properties, being recorded at their fair values at the Emergence Date (see Note 2, Fresh Start Accounting, for additional information).
Tertiary Injection Costs
Our tertiary operations are conducted in reservoirs that have already produced significant amounts of oil over many years; however, in accordance with the rules for recording proved reserves, we cannot recognize proved reserves associated with enhanced recovery techniques, such as CO2 injection, until we can demonstrate production resulting from the tertiary process or unless the field is analogous to an existing flood. Our costs associated with the CO2 we produce (or acquire) and inject are principally our cash out-of-pocket costs of production, transportation and acquisition, and to pay royalties.
We capitalize, as a development cost, injection costs in fields that are in their development stage, which means we have not yet seen incremental oil production due to the CO2 injections (i.e., a production response). These capitalized development costs will be included in our unevaluated property costs until we are able to recognize proved oil reserves associated with the development project. After we see a production response to the CO2 injections (i.e., the production stage), injection costs will be expensed as incurred, and any previously deferred unevaluated development costs will become subject to depletion. We capitalized $7.6 million of tertiary injection costs associated with our tertiary projects during 2021, $2.3 million during the Successor period from September 19, 2020 through December 31, 2020 and $16.2 million during the Predecessor period from January 1, 2020 through September 18, 2020.
Income Taxes
We make certain estimates and judgments in determining our income tax expense for financial reporting purposes. These estimates and judgments occur in the calculation of certain tax assets and liabilities that arise from differences in the timing and recognition of revenue and expense for tax and financial reporting purposes. Our federal and state income tax returns are generally not prepared or filed before the consolidated financial statements are prepared; therefore, we estimate the tax basis of our assets and liabilities at the end of each period as well as the effects of tax rate changes, tax credits and net operating loss carryforwards. Adjustments related to these estimates are recorded in our tax provision in the period in which we finalize our income tax returns. Further, we must assess the likelihood that we will be able to recover or utilize our deferred tax assets. If recovery is not likely, we must record a valuation allowance against such deferred tax assets for the amount we would not expect to recover, which would result in an increase to our income tax expense. As of December 31, 2021 and 2020, we had tax valuation allowances totaling $125.5 million and $129.4 million, respectively, to reduce the carrying value of our federal and state deferred tax assets. As of December 31, 2021 and 2020, our underlying deferred tax assets were comprised of federal deferred tax assets of $51.4 million and $54.3 million and state deferred tax assets of $74.1 million and $75.1 million, respectively. The valuation allowances will remain until the realization of future deferred tax benefits are more likely than not to become utilized. Management considers all available evidence (both positive and negative) in determining whether a valuation allowance is required. Such evidence includes our cumulative loss position, the scheduled reversal of deferred tax liabilities, projected future taxable income and tax planning strategies and judgment is required in considering the relative weight of negative and positive evidence. Significant judgment is involved in this determination as we are required to make assumptions about forecasted commodity prices and economics in the oil and gas industry that may impact our ability to generate future earnings. Such estimates are inherently subjective. Changes in judgment regarding future realization of deferred tax assets may result in a reversal of all or a portion of the valuation allowance in the period that determination is made, and our net income during that period would benefit from a lower effective tax rate. A 1% increase in our statutory tax rate would have increased our calculated income tax expense (benefit) by approximately $0.6 million for the year ended December 31, 2021, ($0.5 million) during the Successor period from September 19, 2020 through December 31, 2020, although any change would be offset by a corresponding change in our valuation allowance, and ($18.5 million) during the Predecessor period from January 1, 2020 through September 18, 2020. See Note 9, Income Taxes, to the consolidated financial statements and Results of Operations – Income Taxes above for further information concerning our income taxes.
Fair Value Estimates
The FASC defines fair value, establishes a framework for measuring fair value and requires disclosures about fair value measurements. It does not require us to make any new fair value measurements, but rather establishes a fair value hierarchy
Denbury Inc.
Management’s Discussion and Analysis of Financial Condition and Results of Operations
that prioritizes the inputs to the valuation techniques used to measure fair value. Level 1 inputs are given the highest priority in the fair value hierarchy, as they represent observable inputs that reflect unadjusted quoted prices for identical assets or liabilities in active markets as of the reporting date, while Level 3 inputs are given the lowest priority, as they represent unobservable inputs that are not corroborated by market data. Valuation techniques that maximize the use of observable inputs are favored. See Note 13, Fair Value Measurements, to the consolidated financial statements for disclosures regarding our recurring fair value measurements.
Significant uses of fair value measurements include:
•valuation of the Company’s assets, liabilities and equity upon application of fresh start accounting (see Fresh Start Accounting above);
•allocation of the purchase price to assets acquired and liabilities assumed in acquisitions;
•assessment of impairment of long-lived assets; and
•recorded value of commodity derivative instruments.
Impairment Assessment of Long-Lived Assets
We test long-lived assets that are not subject to our quarterly full cost pool ceiling test for impairment, including a portion of our capitalized CO2 properties and pipelines, and long-term contracts to sell CO2 to industrial customers, whenever events or changes in circumstances indicate that the carrying value may not be recoverable. The factors we assess to determine if a long-lived asset impairment test is necessary include, among other factors, a significant adverse change in the business climate that could affect the value of a long-lived asset, a significant decrease in the market price of an asset group, a significant adverse change in the extent or manner in which a long-lived asset (asset group) is being used or in its physical condition, or a current-period operating or cash flow loss combined with a history of operating or cash flow losses or a projection or forecast that demonstrates continuing losses associated with the use of a long-lived asset (asset group).
We perform our long-lived asset impairment test by comparing the net carrying costs of our long-lived asset groups to the respective expected future undiscounted net cash flows that are supported by these long-lived assets which include production of our probable and possible oil and natural gas reserves. If the undiscounted net cash flows are below the net carrying costs for an asset group, we must record an impairment loss by the amount, if any, that net carrying costs exceed the fair value of the long-lived asset group. Significant assumptions impacting expected future undiscounted net cash flows include projections of future oil and natural gas prices, projections of estimated quantities of oil and natural gas reserves, projections of future rates of production, timing and amount of future development and operating costs, projected availability and cost of CO2, projected recovery factors of tertiary reserves and risk-adjustment factors applied to the cash flows. We performed a qualitative assessment as of December 31, 2021 and determined there were no material changes to our key cash flow assumptions and no triggering events since September 18, 2020 when the Company’s assets were revalued in fresh start accounting; therefore, no impairment test was performed for the fourth quarter of 2021.
Commodity Derivative Contracts
Historically, we have entered into oil and natural gas derivative contracts to provide an economic hedge of our exposure to commodity price risk associated with anticipated future oil and natural gas production and to provide more certainty to our future cash flows. We do not hold or issue derivative financial instruments for trading purposes. Generally, these contracts have consisted of various combinations of price floors, collars, three-way collars, fixed-price swaps, fixed-price swaps enhanced with a sold put, and basis swaps. Our derivative financial instruments are recorded on the balance sheet as either an asset or liability measured at fair value. The valuation methods used to measure the fair values of these assets and liabilities require considerable management judgment and estimates to derive the inputs necessary to determine fair value estimates, such as forward prices for commodities, interest rates, volatility factors and credit worthiness, as well as other relevant economic measures. We do not apply hedge accounting to our commodity derivative contracts under the FASC Derivatives and Hedging topic; accordingly, changes in the fair value of these instruments are recognized in earnings instead of charging the effective portion to other comprehensive income and the ineffective portion to earnings. While we may experience more volatility in our net income (loss) than if we were to apply hedge accounting treatment as permitted by the FASC Derivatives and Hedging topic, we believe that for us, the benefits associated with applying hedge accounting do not outweigh the cost, time and effort to comply with hedge accounting. We estimate that a 10% increase in NYMEX oil futures prices as of December 31, 2021 would
Denbury Inc.
Management’s Discussion and Analysis of Financial Condition and Results of Operations
increase our estimated payments on our crude oil derivative contracts by $60 million, and a 10% decrease in NYMEX oil futures prices would reduce our estimated payments by $54 million.
Recent Accounting Pronouncements
See Note 1, Nature of Operations and Summary of Significant Accounting Policies, to the consolidated financial statements for a discussion of recent accounting pronouncements.
NON-GAAP FINANCIAL MEASURE AND RECONCILIATION
Reconciliation of Standardized Measure to PV-10 Value
PV-10 Value is a non-GAAP measure and is different from the Standardized Measure in that PV-10 Value is a pre-tax number and the Standardized Measure is an after-tax number. The information used to calculate PV-10 Value is derived directly from data determined in accordance with FASC Topic 932. We believe that PV-10 Value is a useful supplemental disclosure to the Standardized Measure because the Standardized Measure can be impacted by a company’s unique tax situation, and it is not practical to calculate the Standardized Measure on a property-by-property basis. Because of this, PV-10 Value is a widely used measure within the industry and is commonly used by securities analysts, banks and credit rating agencies to evaluate the estimated future net cash flows from proved reserves on a comparative basis across companies or specific properties. PV-10 Value is commonly used by us and others in our industry to evaluate properties that are bought and sold, to assess the potential return on investment in our oil and natural gas properties, and to perform our impairment testing of oil and natural gas properties. PV-10 Value is not a measure of financial or operating performance under GAAP, nor should it be considered in isolation or as a substitute for the Standardized Measure. Our PV-10 Value and the Standardized Measure do not purport to represent the fair value of our oil and natural gas reserves. See also Glossary and Selected Abbreviations for the definition of “PV-10 Value” and Supplemental Oil and Natural Gas Disclosures (Unaudited) to the consolidated financial statements for additional disclosures about the Standardized Measure.
The following table provides a reconciliation of the Standardized Measure to PV-10 Value for the periods indicated:
| | | | | | | | | | | | | | | | | |
| | Year Ended December 31, |
| In thousands | 2021 | | 2020 | | 2019 |
| Standardized Measure (GAAP measure) | $ | 2,187,051 | | | $ | 654,734 | | | $ | 2,261,039 | |
| Discounted estimated future income tax | 486,771 | | | 48,346 | | | 354,629 | |
| PV-10 Value (non-GAAP measure) | $ | 2,673,822 | | | $ | 703,080 | | | $ | 2,615,668 | |
FORWARD-LOOKING INFORMATION
The data and/or statements contained in this Annual Report on Form 10-K that are not historical facts, including, but not limited to, statements found in the sections entitled “Business and Properties,” “Risk Factors” and “Management’s Discussion and Analysis of Financial Condition and Results of Operations,” are forward-looking statements, as that term is defined in Section 21E of the Securities Exchange Act of 1934, as amended (the “Exchange Act”), and are statements that involve a number of risks and uncertainties. Such forward-looking statements may be or may concern, among other things, the level and sustainability of the recent increases in worldwide oil prices from their COVID-19 coronavirus caused downturn, financial forecasts, the extent of future oil price volatility, current or future liquidity sources or their adequacy to support our anticipated future activities, statements or predictions related to the ultimate nature, timing and economic impacts of proposed carbon capture, use and storage industry arrangements, together with assumptions based on current and projected production levels, oil and gas prices and oilfield costs, the impact of current supply chain and inflationary pressures or expectations on our operations or costs, current or future expectations or estimations of our cash flows or the impact of changes in commodity prices on cash flows, price and availability of advantageous commodity derivative contracts or their predicted downside cash flow protection or cash settlement payments required, forecasted drilling activity or methods, including the timing and location thereof, estimated timing of commencement of CO2 injections in particular fields or areas, or initial production responses in tertiary flooding projects, other development activities, finding costs, interpretation or prediction of formation details, hydrocarbon reserve quantities and values, CO2 reserves and supply and their availability, potential reserves, barrels or percentages of recoverable original oil in place, the impact of changes or proposed changes in Federal or state laws or outcomes of any
Denbury Inc.
Management’s Discussion and Analysis of Financial Condition and Results of Operations
pending litigation, prospective legislation, orders or regulations affecting the oil and gas industry or environmental regulations, competition, rates of return, and overall worldwide or U.S. economic conditions, and other variables surrounding operations and future plans. Such forward-looking statements generally are accompanied by words such as “plan,” “estimate,” “expect,” “predict,” “forecast,” “to our knowledge,” “anticipate,” “projected,” “preliminary,” “should,” “assume,” “believe,” “may” or other words that convey, or are intended to convey, the uncertainty of future events or outcomes. Such forward-looking information is based upon management’s current plans, expectations, estimates, and assumptions that could significantly and adversely affect current plans, anticipated actions, the timing of such actions and our financial condition and results of operations. As a consequence, actual results may differ materially from expectations, estimates or assumptions expressed in or implied by any forward-looking statements made by us or on our behalf. Among the factors that could cause actual results to differ materially are fluctuations in worldwide oil prices or in U.S. oil price differentials and consequently in the prices received or demand for our oil produced; geopolitical actions and reactions to recent Russian troop movements surrounding Ukraine; relaxation or removal of oil sanctions against Iran as part of diplomatic negotiations about Iran’s nuclear program; decisions as to production levels and/or pricing by OPEC or U.S. producers in future periods; the impact of COVID-19 on oil demand and economic activity levels; whether inflation impacts future expenses; success of our risk management techniques; access to and terms of credit in the commercial banking or other debt markets; fluctuations in the prices of goods and services; the uncertainty of drilling results and reserve estimates; operating hazards and remediation costs; disruption of operations and damages from cybersecurity breaches, or from well incidents, climate events such as hurricanes, tropical storms, floods, forest fires, or other natural occurrences; conditions in the worldwide financial, trade and credit markets; general economic conditions; competition; government regulations, including changes in tax or environmental laws or regulations and consequent unexpected delays, as well as the risks and uncertainties inherent in oil and gas drilling and production activities or that are otherwise discussed in this annual report, including, without limitation, the portions referenced above, and the uncertainties set forth from time to time in our other public reports, filings and public statements.
Item 7A. Quantitative and Qualitative Disclosures About Market Risk
The information required by Item 7A is set forth under Market Risk Management in Item 7, Management’s Discussion and Analysis of Financial Condition and Results of Operations.
Item 8. Financial Statements and Supplementary Information | | | | | | | | | | | |
| | | | Page |
| | | | |
| |
| |
| |
| |
| |
| |
| 1. | | | |
| 2. | | | |
| 3. | | | |
| 4. | | | |
| 5. | | | |
| 6. | | | |
| 7. | | | |
| 8. | | | |
| 9. | | | |
| 10. | | | |
| 11. | | | |
| 12. | | | |
| 13. | | | |
| 14. | | | |
| 15. | | | |
| 16. | | | |
| | | |
| |
| |
| |
Report of Independent Registered Public Accounting Firm
To the Board of Directors and Stockholders of Denbury Inc.
Opinions on the Financial Statements and Internal Control over Financial Reporting
We have audited the accompanying consolidated balance sheets of Denbury Inc. and its subsidiaries (Successor) (the “Company”) as of December 31, 2021 and 2020, and the related consolidated statements of operations, of changes in stockholders’ equity and of cash flows for the year ended December 31, 2021 and for the period from September 19, 2020 to December 31, 2020 including the related notes (collectively referred to as the “consolidated financial statements”). We also have audited the Company's internal control over financial reporting as of December 31, 2021, based on criteria established in Internal Control - Integrated Framework (2013) issued by the Committee of Sponsoring Organizations of the Treadway Commission (COSO).
In our opinion, the consolidated financial statements referred to above present fairly, in all material respects, the financial position of the Company as of December 31, 2021 and 2020, and the results of its operations and its cash flows for the year ended December 31, 2021 and for the period from September 19, 2020 to December 31, 2020 in conformity with accounting principles generally accepted in the United States of America. Also in our opinion, the Company maintained, in all material respects, effective internal control over financial reporting as of December 31, 2021, based on criteria established in Internal Control - Integrated Framework (2013) issued by the COSO.
Basis of Accounting
As discussed in Note 1 to the consolidated financial statements, the United States Bankruptcy Court for the Southern District of Texas confirmed the Company’s prepackaged joint plan of reorganization (“the plan”) on September 2, 2020. Confirmation of the plan resulted in the discharge of all claims against the Company that arose before July 30, 2020 and terminates all rights and interests of equity security holders as provided for in the plan. The plan was substantially consummated on September 18, 2020 and the Company emerged from bankruptcy. In connection with its emergence from bankruptcy, the Company adopted fresh start accounting as of September 18, 2020.
Basis for Opinions
The Company's management is responsible for these consolidated financial statements, for maintaining effective internal control over financial reporting, and for its assessment of the effectiveness of internal control over financial reporting, included in Management’s Report on Internal Control over Financial Reporting appearing under Item 9A. Our responsibility is to express opinions on the Company’s consolidated financial statements and on the Company's internal control over financial reporting based on our audits. We are a public accounting firm registered with the Public Company Accounting Oversight Board (United States) (PCAOB) and are required to be independent with respect to the Company in accordance with the U.S. federal securities laws and the applicable rules and regulations of the Securities and Exchange Commission and the PCAOB.
We conducted our audits of these consolidated financial statements in accordance with the standards of the PCAOB. Those standards require that we plan and perform the audits to obtain reasonable assurance about whether the consolidated financial statements are free of material misstatement, whether due to error or fraud, and whether effective internal control over financial reporting was maintained in all material respects.
Our audits included performing procedures to assess the risks of material misstatement of the consolidated financial statements, whether due to error or fraud, and performing procedures that respond to those risks. Such procedures included examining, on a test basis, evidence regarding the amounts and disclosures in the consolidated financial statements. Our audits also included evaluating the accounting principles used and significant estimates made by management, as well as evaluating the overall presentation of the consolidated financial statements. Our audit of internal control over financial reporting included obtaining an understanding of internal control over financial reporting, assessing the risk that a material weakness exists, and testing and evaluating the design and operating effectiveness of internal control based on the assessed risk. Our audits also included performing such other procedures as we considered necessary in the circumstances. We believe that our audits provide a reasonable basis for our opinions.
Definition and Limitations of Internal Control over Financial Reporting
A company’s internal control over financial reporting is a process designed to provide reasonable assurance regarding the reliability of financial reporting and the preparation of financial statements for external purposes in accordance with generally accepted accounting principles. A company’s internal control over financial reporting includes those policies and procedures that (i) pertain to the maintenance of records that, in reasonable detail, accurately and fairly reflect the transactions and dispositions of the assets of the company; (ii) provide reasonable assurance that transactions are recorded as necessary to permit preparation of financial statements in accordance with generally accepted accounting principles, and that receipts and expenditures of the company are being made only in accordance with authorizations of management and directors of the company; and (iii) provide reasonable assurance regarding prevention or timely detection of unauthorized acquisition, use, or disposition of the company’s assets that could have a material effect on the financial statements.
Because of its inherent limitations, internal control over financial reporting may not prevent or detect misstatements. Also, projections of any evaluation of effectiveness to future periods are subject to the risk that controls may become inadequate because of changes in conditions, or that the degree of compliance with the policies or procedures may deteriorate.
Critical Audit Matters
The critical audit matter communicated below is a matter arising from the current period audit of the consolidated financial statements that was communicated or required to be communicated to the audit committee and that (i) relates to accounts or disclosures that are material to the consolidated financial statements and (ii) involved our especially challenging, subjective, or complex judgments. The communication of critical audit matters does not alter in any way our opinion on the consolidated financial statements, taken as a whole, and we are not, by communicating the critical audit matter below, providing a separate opinion on the critical audit matter or on the accounts or disclosures to which it relates.
The Impact of Proved Oil and Natural Gas Reserves on Net Proved Oil and Natural Gas Properties
The Company’s net property and equipment balance, which includes net proved oil and natural gas properties, was $1,541.5 million as of December 31, 2021, depletion, depreciation and amortization (DD&A) expense was $150.6 million, and write-down of oil and natural gas properties was $14.4 million. As described in Note 1, the Company follows the full cost method of accounting for oil and gas properties. Under this method, all costs related to the acquisition, exploration and development of oil and natural gas reserves are capitalized and accumulated into a single cost center. The costs capitalized, including production equipment and future development costs, are depleted or depreciated using the unit-of-production method based on proved oil and natural gas reserves. As disclosed by management, under full cost accounting rules, management is required each quarter to perform a ceiling test calculation. The net capitalized costs of oil and natural gas properties are limited to the lower of unamortized cost or the cost center ceiling. The cost center ceiling is defined as (1) the present value of estimated future net revenues from proved oil and natural gas reserves before future abandonment costs (discounted at 10%), based on the average first-day-of-the-month oil and natural gas price for each month during a 12-month rolling period prior to the end of a particular reporting period; plus (2) the cost of properties not being amortized; plus (3) the lower of cost or estimated fair value of unproved properties included in the costs being amortized, if any; less (4) related income tax effects. The process of estimating oil and natural gas reserves is very complex, requiring significant decisions in the evaluation of all available geological, geophysical, engineering and economic data. The data for a given field may also change substantially over time as a result of numerous factors, including additional development activity, evolving production history and continued reassessment of the viability of production under varying economic conditions. As a result, material revisions to existing reserve estimates may occur from time to time. Estimating quantities of proved oil and natural gas reserves requires interpretations of available technical data and various assumptions, including future production rates, production costs, severance and excise taxes, capital expenditures and workover and remedial costs, and the assumed effect of governmental rules and regulations. Net proved oil and natural gas reserve estimates are determined by the Company’s internal reservoir engineering team and independent petroleum engineers (collectively “specialists”).
The principal considerations for our determination that performing procedures relating to the impact of proved oil and natural gas reserves on net proved oil and natural gas properties is a critical audit matter are (i) the significant judgment by management, including the use of specialists, when developing the estimates of proved oil and natural gas reserves, which in turn led to (ii) a high degree of auditor judgment, subjectivity, and effort in performing procedures and evaluating audit evidence obtained related to the data, methods, and assumptions used by management and its specialists in developing the
estimates of proved oil and natural gas reserves and the assumptions applied to the cost center ceiling test and the depletion, depreciation and amortization calculation related to future production rates.
Addressing the matter involved performing procedures and evaluating audit evidence in connection with forming our overall opinion on the consolidated financial statements. These procedures included testing the effectiveness of controls relating to management’s estimates of proved oil and natural gas reserves, ceiling test calculation and the depletion, depreciation and amortization calculation. The work of management’s specialists was used in performing the procedures to evaluate the reasonableness of the proved oil and natural gas reserves and the reasonableness of the future production rates applied in the cost center ceiling test and the depletion, depreciation and amortization calculation. As a basis for using this work, the specialists’ qualifications were understood and the company’s relationship with the specialists was assessed. The procedures performed also included evaluation of the methods and assumptions used by the specialists, tests of the data used by the specialists, and an evaluation of the specialists’ findings.
/s/ PricewaterhouseCoopers LLP
Dallas, Texas
February 24, 2022
We have served as the Company’s auditor since 2004.
Report of Independent Registered Public Accounting Firm
To the Board of Directors and Stockholders of Denbury Inc.
Opinion on the Financial Statements
We have audited the accompanying consolidated statements of operations, of changes in stockholders’ equity and of cash flows of Denbury Resources Inc. and its subsidiaries (Predecessor) (the “Company”) for the period from January 1, 2020 to September 18, 2020 and the year ended December 31, 2019 including the related notes (collectively referred to as the “consolidated financial statements”). In our opinion, the consolidated financial statements present fairly, in all material respects, the results of operations and cash flows of the Company for the period from January 1, 2020 to September 18, 2020 and the year ended December 31, 2019 in conformity with accounting principles generally accepted in the United States of America.
Basis of Accounting
As discussed in Note 1 to the consolidated financial statements, the Company filed petitions on July 30, 2020 with the United States Bankruptcy Court for the Southern District of Texas for reorganization under the provisions of Chapter 11 of the Bankruptcy Code. The Company’s prepackaged joint plan of reorganization was substantially consummated on September 18, 2020 and the Company emerged from bankruptcy. In connection with its emergence from bankruptcy, the Company adopted fresh start accounting.
Basis for Opinion
These consolidated financial statements are the responsibility of the Company’s management. Our responsibility is to express an opinion on the Company’s consolidated financial statements based on our audits. We are a public accounting firm registered with the Public Company Accounting Oversight Board (United States) (PCAOB) and are required to be independent with respect to the Company in accordance with the U.S. federal securities laws and the applicable rules and regulations of the Securities and Exchange Commission and the PCAOB.
We conducted our audits of these consolidated financial statements in accordance with the standards of the PCAOB. Those standards require that we plan and perform the audit to obtain reasonable assurance about whether the consolidated financial statements are free of material misstatement, whether due to error or fraud.
Our audits included performing procedures to assess the risks of material misstatement of the consolidated financial statements, whether due to error or fraud, and performing procedures that respond to those risks. Such procedures included examining, on a test basis, evidence regarding the amounts and disclosures in the consolidated financial statements. Our audits also included evaluating the accounting principles used and significant estimates made by management, as well as evaluating the overall presentation of the consolidated financial statements. We believe that our audits provide a reasonable basis for our opinion.
/s/ PricewaterhouseCoopers LLP
Dallas, Texas
March 5, 2021
We have served as the Company’s auditor since 2004.
Denbury Inc.
Consolidated Balance Sheets
(In thousands, except par value and share data)
| | | | | | | | | | | | | | |
| | | Successor |
| | | December 31, 2021 | | December 31, 2020 |
| Assets | | | | |
| Current assets | | | | |
| Cash and cash equivalents | | $ | 3,671 | | | $ | 518 | |
| Restricted cash | | — | | | 1,000 | |
| Accrued production receivable | | 143,365 | | | 91,421 | |
| Trade and other receivables, net | | 19,270 | | | 19,682 | |
| Derivative assets | | — | | | 187 | |
| Prepaids | | 9,099 | | | 14,038 | |
| Total current assets | | 175,405 | | | 126,846 | |
| Property and equipment | | | | |
| Oil and natural gas properties (using full cost accounting) | | | | |
| Proved properties | | 1,109,011 | | | 851,208 | |
| Unevaluated properties | | 112,169 | | | 85,304 | |
CO2 properties | | 183,369 | | | 188,288 | |
| Pipelines | | 224,394 | | | 133,485 | |
| Other property and equipment | | 93,950 | | | 86,610 | |
| Less accumulated depletion, depreciation, amortization and impairment | | (181,393) | | | (41,095) | |
| Net property and equipment | | 1,541,500 | | | 1,303,800 | |
| Operating lease right-of-use assets | | 19,502 | | | 20,342 | |
| Intangible assets, net | | 88,248 | | | 97,362 | |
| Other assets | | 78,298 | | | 86,408 | |
| Total assets | | $ | 1,902,953 | | | $ | 1,634,758 | |
| Liabilities and Stockholders’ Equity | | |
| Current liabilities | | | | |
| Accounts payable and accrued liabilities | | $ | 191,598 | | | $ | 112,671 | |
| Oil and gas production payable | | 75,899 | | | 49,165 | |
| Derivative liabilities | | 134,509 | | | 53,865 | |
| Current maturities of long-term debt | | — | | | 68,008 | |
| Operating lease liabilities | | 4,677 | | | 1,350 | |
| Total current liabilities | | 406,683 | | | 285,059 | |
| Long-term liabilities | | | | |
| Long-term debt, net of current portion | | 35,000 | | | 70,000 | |
| Asset retirement obligations | | 284,238 | | | 179,338 | |
| Derivative liabilities | | — | | | 5,087 | |
| Deferred tax liabilities, net | | 1,638 | | | 1,274 | |
| Operating lease liabilities | | 17,094 | | | 19,460 | |
| Other liabilities | | 22,910 | | | 20,872 | |
| Total long-term liabilities | | 360,880 | | | 296,031 | |
| Commitments and contingencies (Note 14) | | | | |
| Stockholders’ equity | | | | |
| Preferred stock, $.001 par value, 50,000,000 shares authorized, none issued and outstanding | | — | | | — | |
| Common stock, $.001 par value, 250,000,000 shares authorized; 50,193,656 and 49,999,999 shares issued, respectively | | 50 | | | 50 | |
| Paid-in capital in excess of par | | 1,129,996 | | | 1,104,276 | |
| Retained earnings (accumulated deficit) | | 5,344 | | | (50,658) | |
| Total stockholders’ equity | | 1,135,390 | | | 1,053,668 | |
| Total liabilities and stockholders’ equity | | $ | 1,902,953 | | | $ | 1,634,758 | |
| | | | |
See accompanying Notes to Consolidated Financial Statements.
Denbury Inc.
Consolidated Statements of Operations
(In thousands, except per-share data)
| | | | | | | | | | | | | | | | | | | | | | | | | | | | | |
| | Successor | | | Predecessor |
| | | Year Ended
Dec. 31, 2021 | | Period from
Sept. 19, 2020 through
Dec. 31, 2020 | | | Period from
Jan. 1, 2020 through
Sept. 18, 2020 | | Year Ended
Dec. 31, 2019 |
| | | | | | |
| Revenues and other income | | | | | | | | | |
| Oil, natural gas, and related product sales | | $ | 1,159,955 | | | $ | 201,108 | | | | $ | 492,101 | | | $ | 1,212,020 | |
CO2 sales and transportation fees | | 44,175 | | | 9,419 | | | | 21,049 | | | 34,142 | |
| Oil marketing revenues | | 38,742 | | | 5,376 | | | | 8,543 | | | 14,198 | |
| Other income | | 15,288 | | | 4,697 | | | | 8,419 | | | 14,523 | |
| Total revenues and other income | | 1,258,160 | | | 220,600 | | | | 530,112 | | | 1,274,883 | |
| Expenses | | | | | | | | | |
| Lease operating expenses | | 424,550 | | | 101,234 | | | | 250,271 | | | 477,220 | |
| Transportation and marketing expenses | | 28,817 | | | 10,595 | | | | 27,164 | | | 41,810 | |
CO2 operating and discovery expenses | | 6,678 | | | 1,976 | | | | 2,592 | | | 2,922 | |
| Taxes other than income | | 91,390 | | | 16,584 | | | | 43,531 | | | 93,752 | |
| Oil marketing purchases | | 37,734 | | | 5,318 | | | | 8,399 | | | 14,124 | |
| General and administrative expenses | | 79,258 | | | 19,470 | | | | 48,522 | | | 83,029 | |
| Interest, net of amounts capitalized of $4,585, $1,261, $22,885 and $36,671, respectively | | 4,147 | | | 1,815 | | | | 48,267 | | | 81,632 | |
| Depletion, depreciation, and amortization | | 150,640 | | | 45,812 | | | | 188,593 | | | 233,816 | |
| Commodity derivatives expense (income) | | 352,984 | | | 61,902 | | | | (102,032) | | | 70,078 | |
| Gain on debt extinguishment | | — | | | — | | | | (18,994) | | | (155,998) | |
| Write-down of oil and natural gas properties | | 14,377 | | | 1,006 | | | | 996,658 | | | — | |
| Reorganization items, net | | — | | | — | | | | 849,980 | | | — | |
| Other expenses | | 10,816 | | | 8,072 | | | | 35,868 | | | 11,187 | |
| Total expenses | | 1,201,391 | | | 273,784 | | | | 2,378,819 | | | 953,572 | |
| Income (loss) before income taxes | | 56,769 | | | (53,184) | | | | (1,848,707) | | | 321,311 | |
| Income tax provision (benefit) | | 767 | | | (2,526) | | | | (416,129) | | | 104,352 | |
| Net income (loss) | | $ | 56,002 | | | $ | (50,658) | | | | $ | (1,432,578) | | | $ | 216,959 | |
| | | | | | | | | |
| Net income (loss) per common share | | | | | | | | | |
| Basic | | $ | 1.10 | | | $ | (1.01) | | | | $ | (2.89) | | | $ | 0.47 | |
| Diluted | | $ | 1.04 | | | $ | (1.01) | | | | $ | (2.89) | | | $ | 0.45 | |
| | | | | | | | | |
| Weighted average common shares outstanding | | | | | | | | | |
| Basic | | 50,918 | | | 50,000 | | | | 495,560 | | | 459,524 | |
| Diluted | | 53,818 | | | 50,000 | | | | 495,560 | | | 510,341 | |
See accompanying Notes to Consolidated Financial Statements.
Denbury Inc.
Consolidated Statements of Cash Flows
(In thousands)
| | | | | | | | | | | | | | | | | | | | | | | | | | | | | |
| | Successor | | | Predecessor |
| | | Year Ended
Dec. 31, 2021 | | Period from
Sept. 19, 2020 through
Dec. 31, 2020 | | | Period from
Jan. 1, 2020 through
Sept. 18, 2020 | | Year Ended
Dec. 31, 2019 |
| | | | | | |
| Cash flows from operating activities | | | | | | | | | |
| Net income (loss) | | $ | 56,002 | | | $ | (50,658) | | | | $ | (1,432,578) | | | $ | 216,959 | |
| Adjustments to reconcile net income (loss) to cash flows from operating activities | | | | | | | | | |
| Noncash reorganization items, net | | — | | | — | | | | 810,909 | | | — | |
| Depletion, depreciation, and amortization | | 150,640 | | | 45,812 | | | | 188,593 | | | 233,816 | |
| Write-down of oil and natural gas properties | | 14,377 | | | 1,006 | | | | 996,658 | | | — | |
| Deferred income taxes | | 364 | | | (2,556) | | | | (408,869) | | | 100,471 | |
| Stock-based compensation | | 25,322 | | | 8,212 | | | | 4,111 | | | 12,470 | |
| Commodity derivatives expense (income) | | 352,984 | | | 61,902 | | | | (102,032) | | | 70,078 | |
| Receipt (payment) on settlements of commodity derivatives | | (277,240) | | | 21,089 | | | | 81,396 | | | 23,606 | |
| Gain on debt extinguishment | | — | | | — | | | | (18,994) | | | (155,998) | |
| Debt issuance costs and discounts | | 2,740 | | | 799 | | | | 11,571 | | | 12,303 | |
| Gain from asset sales and other | | (10,609) | | | (3,546) | | | | (6,723) | | | (8,504) | |
| Other, net | | (2,465) | | | 1,197 | | | | 7,162 | | | (92) | |
| Changes in assets and liabilities, net of effects from acquisitions | | | | | | | | | |
| Accrued production receivable | | (51,944) | | | 21,411 | | | | 26,575 | | | (13,619) | |
| Trade and other receivables | | (284) | | | 15,567 | | | | (22,343) | | | 9,379 | |
| Other current and long-term assets | | 10,390 | | | (1,795) | | | | 743 | | | 7,629 | |
| Accounts payable and accrued liabilities | | 28,500 | | | (67,167) | | | | (16,102) | | | (3,275) | |
| Oil and natural gas production payable | | 29,351 | | | (6,912) | | | | (6,792) | | | 2,170 | |
| Other liabilities | | (10,970) | | | (4,035) | | | | 123 | | | (13,250) | |
| Net cash provided by operating activities | | 317,158 | | | 40,326 | | | | 113,408 | | | 494,143 | |
| | | | | | | | | |
| Cash flows from investing activities | | | | | | | | | |
| Oil and natural gas capital expenditures | | (150,911) | | | (17,964) | | | | (99,582) | | | (262,005) | |
| Acquisitions of oil and natural gas properties | | (10,979) | | | (82) | | | | — | | | (79) | |
| Pipeline capital expenditures | | (69,223) | | | (618) | | | | (11,601) | | | (27,319) | |
| Net proceeds from sales of oil and natural gas properties and equipment | | 19,053 | | | 938 | | | | 41,322 | | | 10,196 | |
| Other | | 9,128 | | | 15,842 | | | | 12,747 | | | 9,515 | |
| Net cash used in investing activities | | (202,932) | | | (1,884) | | | | (57,114) | | | (269,692) | |
| | | | | | | | | |
| Cash flows from financing activities | | | | | | | | | |
| Bank repayments | | (933,000) | | | (190,000) | | | | (551,000) | | | (925,791) | |
| Bank borrowings | | 898,000 | | | 120,000 | | | | 691,000 | | | 925,791 | |
| Interest payments treated as a reduction of debt | | — | | | — | | | | (46,417) | | | (85,303) | |
| Cash paid in conjunction with debt exchange | | — | | | — | | | | — | | | (136,427) | |
| Cash paid in conjunction with debt repurchases | | — | | | — | | | | (14,171) | | | — | |
| Costs of debt financing | | — | | | (8) | | | | (12,482) | | | (11,065) | |
| Pipeline financing and capital lease debt repayments | | (68,008) | | | (22,938) | | | | (51,792) | | | (13,908) | |
| Other | | (3,122) | | | 1,638 | | | | (9,363) | | | 348 | |
| Net cash provided by (used in) financing activities | | (106,130) | | | (91,308) | | | | 5,775 | | | (246,355) | |
| Net increase (decrease) in cash, cash equivalents, and restricted cash | | 8,096 | | | (52,866) | | | | 62,069 | | | (21,904) | |
| Cash, cash equivalents, and restricted cash at beginning of period | | 42,248 | | | 95,114 | | | | 33,045 | | | 54,949 | |
| Cash, cash equivalents, and restricted cash at end of period | | $ | 50,344 | | | $ | 42,248 | | | | $ | 95,114 | | | $ | 33,045 | |
See accompanying Notes to Consolidated Financial Statements.
Denbury Inc.
Consolidated Statements of Changes in Stockholders’ Equity
(Dollar amounts in thousands)
| | | | | | | | | | | | | | | | | | | | | | | | | | | | | | | | | | | | | | | | | | | | |
| | | Common Stock
($.001 Par Value) | | Paid-In
Capital in
Excess of
Par | | Retained
Earnings (Accumulated Deficit) | | Treasury Stock
(at cost) | | Total Equity |
| Shares | | Amount | Shares | | Amount |
| Balance – December 31, 2018 (Predecessor) | | 462,355,725 | | | $ | 462 | | | $ | 2,685,211 | | | $ | (1,533,112) | | | 1,941,749 | | | $ | (10,784) | | | $ | 1,141,777 | |
| Issued pursuant to stock compensation plans | | 9,315,016 | | | 9 | | | (9) | | | — | | | — | | | — | | | — | |
| Issued pursuant to directors’ compensation plan | | 97,537 | | | — | | | — | | | — | | | — | | | — | | | — | |
| Issued pursuant to senior subordinated notes exchanges | | 36,297,217 | | | 37 | | | 37,409 | | | (5,161) | | | (1,990,000) | | | 7,270 | | | 39,555 | |
| Stock-based compensation | | — | | | — | | | 16,488 | | | — | | | — | | | — | | | 16,488 | |
| Tax withholding for stock compensation plans | | — | | | — | | | — | | | — | | | 1,701,022 | | | (2,520) | | | (2,520) | |
| Net income | | — | | | — | | | — | | | 216,959 | | | — | | | — | | | 216,959 | |
| Balance – December 31, 2019 (Predecessor) | | 508,065,495 | | | 508 | | | 2,739,099 | | | (1,321,314) | | | 1,652,771 | | | (6,034) | | | 1,412,259 | |
| Issued pursuant to stock compensation plans | | 312,516 | | | — | | | — | | | — | | | — | | | — | | | — | |
| Issued pursuant to directors' compensation plan | | 37,367 | | | — | | | — | | | — | | | — | | | — | | | — | |
| Stock-based compensation | | — | | | — | | | 14,317 | | | — | | | — | | | — | | | 14,317 | |
| Issued pursuant to notes conversion | | 7,372,250 | | | 8 | | | 11,493 | | | — | | | — | | | — | | | 11,501 | |
| Canceled pursuant to stock compensation plans | | (6,313,884) | | | (6) | | | 6 | | | — | | | — | | | — | | | — | |
| Tax withholding for stock compensation plans | | — | | | — | | | — | | | — | | | 742,862 | | | (168) | | | (168) | |
| Net loss | | — | | | — | | | — | | | (1,432,578) | | | — | | | — | | | (1,432,578) | |
| Cancellation of Predecessor equity | | (509,473,744) | | | (510) | | | (2,764,915) | | | 2,753,892 | | | (2,395,633) | | | 6,202 | | | (5,331) | |
| Issuance of Successor equity | | 49,999,999 | | | 50 | | | 1,095,369 | | | — | | | — | | | — | | | 1,095,419 | |
| Balance – September 18, 2020 (Predecessor) | | 49,999,999 | | | $ | 50 | | | $ | 1,095,369 | | | $ | — | | | — | | | $ | — | | | $ | 1,095,419 | |
| | | | | | | | | | | | | | |
| | | | | | | | | | | | | | |
| Balance – September 19, 2020 (Successor) | | 49,999,999 | | | $ | 50 | | | $ | 1,095,369 | | | $ | — | | | — | | | $ | — | | | $ | 1,095,419 | |
| | | | | | | | | | | | | | |
| Stock-based compensation | | — | | | — | | | 8,907 | | | — | | | — | | | — | | | 8,907 | |
| Net loss | | — | | | — | | | — | | | (50,658) | | | — | | | — | | | (50,658) | |
| Balance – December 31, 2020 (Successor) | | 49,999,999 | | | 50 | | | 1,104,276 | | | (50,658) | | | — | | | — | | | 1,053,668 | |
| Stock-based compensation | | — | | | — | | | 27,205 | | | — | | | — | | | — | | | 27,205 | |
| Tax withholding for stock compensation plans | | — | | | — | | | (2,244) | | | — | | | — | | | — | | | (2,244) | |
| Issued pursuant to exercise of warrants | | 193,657 | | | — | | | 759 | | | — | | | — | | | — | | | 759 | |
| Net income | | — | | | — | | | — | | | 56,002 | | | — | | | — | | | 56,002 | |
| Balance – December 31, 2021 (Successor) | | 50,193,656 | | | $ | 50 | | | $ | 1,129,996 | | | $ | 5,344 | | | — | | | $ | — | | | $ | 1,135,390 | |
See accompanying Notes to Consolidated Financial Statements.
Denbury Inc.
Notes to Consolidated Financial Statements
Note 1. Nature of Operations and Summary of Significant Accounting Policies
Organization and Nature of Operations
Denbury Inc. (“Denbury,” “Company” or the “Successor”), a Delaware corporation, is an independent energy company with operations focused in the Gulf Coast and Rocky Mountain regions of the United States. The Company is differentiated by our focus on CO2 EOR and the emerging CCUS industry, supported by the Company’s CO2 EOR technical and operational expertise and extensive CO2 pipeline infrastructure.
As further described in Emergence from Voluntary Reorganization Under Chapter 11 of the Bankruptcy Code below, Denbury Inc. became the successor reporting company of Denbury Resources Inc. (the “Predecessor”) upon the Predecessor’s emergence from bankruptcy on September 18, 2020. References to “Successor” relate to the financial position and results of operations of the Company subsequent to September 18, 2020, and references to “Predecessor” relate to the financial position and results of operations of the Company prior to, and including, September 18, 2020. On September 18, 2020, Denbury filed the Third Restated Certificate of Incorporation with the Delaware Secretary of State to effect a change of the Company’s corporate name from Denbury Resources Inc. to Denbury Inc., and on September 21, 2020, the Successor’s new common stock commenced trading on the New York Stock Exchange under the ticker symbol DEN.
Emergence from Voluntary Reorganization Under Chapter 11 of the Bankruptcy Code
On July 28, 2020, Denbury Resources Inc. and its subsidiaries entered into a restructuring support agreement with lenders holding 100% of the revolving loans under our pre-petition revolving bank credit facility and debtholders holding approximately 67.1% of our senior secured second lien notes and approximately 73.1% of our convertible senior notes, which contemplated a restructuring of the Company pursuant to a prepackaged joint plan of reorganization (the “Plan”). On July 30, 2020 (the “Petition Date”), Denbury Resources Inc. and its subsidiaries filed petitions for reorganization in a “prepackaged” voluntary bankruptcy (the “Chapter 11 Restructuring”) under chapter 11 of the Bankruptcy Code in the United States Bankruptcy Court for the Southern District of Texas (the “Bankruptcy Court”) under the caption “In re Denbury Resources Inc., et al., Case No. 20-33801”. On September 2, 2020, the Bankruptcy Court entered an order (the “Confirmation Order”) confirming the Plan and approving the Disclosure Statement, and on September 18, 2020 (the “Emergence Date”), the Plan became effective in accordance with its terms and the Company emerged from Chapter 11. On April 23, 2021, the Bankruptcy Court entered a final decree closing the Chapter 11 case captioned “In re Denbury Resources Inc., et al., Case No. 20-33801”; therefore, we have no remaining obligations related to this reorganization.
On the Emergence Date and pursuant to the terms of the Plan and the Confirmation Order, all outstanding obligations under the senior secured second lien notes, convertible senior notes, and senior subordinated notes were fully extinguished, relieving approximately $2.1 billion in aggregate principal of debt by issuing equity and/or warrants in the Successor to the former holders of that debt, and the Company:
•Adopted an amended and restated certificate of incorporation and bylaws which reserved for issuance 250,000,000 shares of common stock, par value $0.001 per share, of Denbury (the “New Common Stock”) and 50,000,000 shares of preferred stock, par value $0.001 per share;
•Cancelled all outstanding senior secured second lien notes, convertible senior notes, and senior subordinated notes issued by the Predecessor. In accordance with the Plan, claims against and interests in the Predecessor were treated as follows:
◦Holders of secured pipeline lease claims received payment in full in cash, the collateral securing such pipeline lease claim, reinstatement, or such other treatment rendering such pipeline lease claim unimpaired (see Note 8, Long-Term Debt – Restructuring of Pipeline Financing Transactions, for discussion of subsequent pipeline transactions);
◦Holders of senior secured second lien notes claims received their pro rata share of 47,499,999 shares representing 95% of the New Common Stock issued on the Emergence Date, subject to dilution on account of warrants and a management incentive plan;
◦Holders of convertible senior notes claims received their pro rata share of (a) 2,500,000 shares representing 5% of the New Common Stock issued on the Emergence Date, subject to dilution on account of warrants and
Denbury Inc.
Notes to Consolidated Financial Statements
a management incentive plan and (b) 100% of the series A warrants (see below), reflecting up to a maximum of 5% ownership stake in the reorganized company’s equity interests;
◦Holders of subordinated notes claims received their pro rata share of 54.55% of the series B warrants (see below), reflecting up to a maximum of 3% of the reorganized company’s equity interests after giving effect to the exercise of the series A warrants;
◦Holders of existing equity interests received their pro rata share of 45.45% of the series B warrants (see below), reflecting up to a maximum of 2.5% of the reorganized company’s equity interests after giving effect to the exercise of the series A warrants;
◦Issued 2,631,579 series A warrants at an exercise price of $32.59 per share to former holders of the Predecessor’s convertible senior notes and 2,894,740 series B warrants at an exercise price of $35.41 per share to former holders of the Predecessor’s senior subordinated notes and Predecessor’s equity interests; and
◦Holders of general unsecured claims received payment in full in cash, reimbursement, or such other treatment rendering such general unsecured claim unimpaired.
•Entered into a new senior secured revolving credit agreement with a syndicate of banks (the “Successor Bank Credit Agreement”) with total aggregate commitments of $575 million;
•Appointed a new board of directors (the “Board”) consisting of four new independent members: Anthony Abate, Caroline Angoorly, Brett Wiggs and James N. “Jim” Chapman, and three continuing members: Dr. Kevin O. Meyers (Chairman of the Board), Lynn A. Peterson and Chris Kendall, Denbury’s President and Chief Executive Officer; and
•Adopted a framework for a management incentive plan which reserves for officers, other employees, directors and other service providers a pool of shares of New Common Stock, with initial awards issued on December 4, 2020 (see Note 11, Stock Compensation, for further discussion).
During the Predecessor period, the Company applied Financial Accounting Standards Board Codification (“FASC”) Topic 852, Reorganizations, in preparing the consolidated financial statements. FASC Topic 852 requires the financial statements, for periods subsequent to the commencement of the Chapter 11 Restructuring, to distinguish transactions and events that are directly associated with the reorganization from the ongoing operations of the business. Accordingly, certain charges incurred during 2020 related to the Chapter 11 Restructuring, including the write-off of unamortized long-term debt fees and discounts associated with debt classified as liabilities subject to compromise, and professional fees incurred directly as a result of the Chapter 11 Restructuring are recorded as “Reorganization items, net” in our Consolidated Statements of Operations in the Predecessor period. FASC Topic 852 requires certain additional reporting for financial statements prepared between the bankruptcy filing date and the date of emergence from bankruptcy, including:
•Reclassification of pre-petition liabilities that are unsecured, under-secured or where it cannot be determined that the liabilities are fully secured, to a separate line item in the Unaudited Condensed Consolidated Balance Sheet titled “Liabilities subject to compromise”; and
•Segregation of “Reorganization items, net” as a separate line in the Unaudited Condensed Consolidated Statements of Operations.
The accompanying consolidated financial statements have been prepared assuming that the Company will continue as a going concern and contemplate the realization of assets and the satisfaction of liabilities in the normal course of business.
Principles of Reporting and Consolidation
The consolidated financial statements herein have been prepared in accordance with GAAP and include the accounts of Denbury and entities in which we hold a controlling financial interest. Undivided interests in oil and gas joint ventures are consolidated on a proportionate basis. All intercompany balances and transactions have been eliminated.
Use of Estimates
The preparation of financial statements in conformity with GAAP requires management to make estimates and assumptions that affect the reported amount of certain assets and liabilities, disclosure of contingent assets and liabilities at the date of the financial statements, and the reported amounts of revenues and expenses during each reporting period. Management believes its estimates and assumptions are reasonable; however, such estimates and assumptions are subject to a number of risks and uncertainties that may cause actual results to differ materially from such estimates. Significant estimates underlying these financial statements include (1) the fair value of financial derivative instruments; (2) the estimated quantities of proved oil and
Denbury Inc.
Notes to Consolidated Financial Statements
natural gas reserves used to compute depletion of oil and natural gas properties, the related present value of estimated future net cash flows therefrom and the ceiling test; (3) future net cash flow estimates used in the impairment assessment of long-lived assets; (4) the estimated quantities of proved and probable CO2 reserves used to compute depletion of CO2 properties; (5) estimated useful lives used to compute depreciation and amortization of long-lived assets; (6) accruals related to oil and natural gas sales volumes and revenues, capital expenditures and lease operating expenses; (7) the estimated costs and timing of future asset retirement obligations; (8) estimates made in the calculation of income taxes; (9) estimates made in determining the fair values for purchase price allocations; and (10) fair value estimates including estimates of reorganization value, enterprise value, and the fair value of assets and liabilities recorded as a result of the adoption of fresh start accounting. While management is not aware of any significant revisions to any of its current year-end estimates, there will likely be future revisions to its estimates resulting from matters such as revisions in estimated oil and natural gas volumes, changes in ownership interests, payouts, joint venture audits, re-allocations by purchasers or pipelines, or other corrections and adjustments common in the oil and natural gas industry, many of which require retroactive application. These types of adjustments cannot be currently estimated and will be recorded in the period in which the adjustment occurs.
Business Segment Information
We have evaluated the organization and management of our business and identified only one operating segment related to our oil and natural gas operations. Management measures financial performance and makes capital allocation decisions as a single enterprise and not on a geographical or area-by-area basis. All of our operating revenues, income from operations and assets are generated in the United States.
Reclassifications
Certain prior period amounts have been reclassified to conform to the current year presentation. Such reclassifications had no impact on our reported total revenues, expenses, net income (loss), current assets, total assets, current liabilities, total liabilities or stockholders’ equity.
Cash, Cash Equivalents, and Restricted Cash
We consider all highly liquid investments to be cash equivalents if they have maturities of three months or less at the date of purchase. The following table provides a reconciliation of cash, cash equivalents, and restricted cash as reported within the Consolidated Balance Sheets to “Cash, cash equivalents, and restricted cash at end of period” as reported within the Consolidated Statements of Cash Flows:
| | | | | | | | | | | | | | |
| | Successor |
| In thousands | | December 31, 2021 | | December 31, 2020 |
| Cash and cash equivalents | | $ | 3,671 | | | $ | 518 | |
| Restricted cash, current | | — | | | 1,000 | |
| Restricted cash, long-term | | 46,673 | | | 40,730 | |
| Total cash, cash equivalents, and restricted cash shown in the Consolidated Statements of Cash Flows | | $ | 50,344 | | | $ | 42,248 | |
Restricted cash, long-term in the table above consists of escrow accounts that are legally restricted for certain of our asset retirement obligations, and are included in “Other assets” in the accompanying Consolidated Balance Sheets.
Oil and Natural Gas Properties
Capitalized Costs. We follow the full cost method of accounting for oil and natural gas properties. Under this method, all costs related to the acquisition, exploration and development of oil and natural gas reserves are capitalized and accumulated in a single cost center representing our activities, which are undertaken exclusively in the United States. Such costs include lease acquisition costs, geological and geophysical expenditures, lease rentals on undeveloped properties, costs of drilling both productive and nonproductive wells, capitalized interest on qualifying projects, and general and administrative expenses directly related to exploration and development activities, and do not include any costs related to production, general corporate overhead or similar activities. We assign the purchase price of oil and natural gas properties we acquire to proved and unevaluated properties based on the estimated fair values as defined in the FASC Fair Value Measurement topic. Proceeds
Denbury Inc.
Notes to Consolidated Financial Statements
received from disposals are credited against accumulated costs except when the sale represents a significant disposal of reserves, in which case a gain or loss would be recognized. A disposal of 25% or more of our proved reserves would be considered significant.
Depletion. The costs capitalized, including production equipment and future development costs, are depleted using the unit-of-production method, based on proved oil and natural gas reserves as determined by independent petroleum engineers. Oil and natural gas reserves are converted to equivalent units on a basis of 6,000 cubic feet of natural gas to one barrel of crude oil.
Under full cost accounting, we may exclude certain unevaluated costs from the amortization base pending determination of whether proved reserves can be assigned to such properties. The costs classified as unevaluated are transferred to the full cost amortization base as the properties are developed, tested and evaluated. At least annually, we test these assets for impairment based on an evaluation of management’s expectations of future pricing, evaluation of lease expiration terms, and planned project development activities. As a result of this analysis, we recognized impairments of our unevaluated costs totaling $18.2 million during the year ended December 31, 2019, whereby these costs were transferred to the full cost amortization base. Given the significant declines in NYMEX oil prices in March and April 2020 due to the oil supply and demand imbalance precipitated by the dramatic fall in demand associated with the COVID-19 coronavirus pandemic combined with the concurrent OPEC+ decision to increase oil supply, we reassessed our development plans and transferred $244.9 million of our unevaluated costs to the full cost pool during the Predecessor period from January 1, 2020 through September 18, 2020. Upon emergence from bankruptcy, the Company adopted fresh start accounting which resulted in our oil and natural gas properties, including unevaluated properties, being recorded at their fair values at the Emergence Date (see Note 2, Fresh Start Accounting, for additional information).
Write-Down of Oil and Natural Gas Properties. The net capitalized costs of oil and natural gas properties are limited to the lower of unamortized cost or the cost center ceiling. The cost center ceiling is defined as (1) the present value of estimated future net revenues from proved oil and natural gas reserves before future abandonment costs (discounted at 10%), based on the average first-day-of-the-month oil and natural gas price for each month during a 12-month rolling period prior to the end of a particular reporting period; plus (2) the cost of properties not being amortized; plus (3) the lower of cost or estimated fair value of unproved properties included in the costs being amortized, if any; less (4) related income tax effects. Our future net revenues from proved oil and natural gas reserves are not reduced for development costs related to the cost of drilling for and developing CO2 reserves nor those related to the cost of constructing CO2 pipelines, as we do not have to incur additional CO2 capital costs to develop the proved oil and natural gas reserves. Therefore, we include in the ceiling test, as a reduction of future net revenues, that portion of our capitalized CO2 costs related to CO2 reserves and CO2 pipelines that we estimate will be consumed in the process of producing our proved oil and natural gas reserves. The fair value of our oil and natural gas derivative contracts is not included in the ceiling test, as we do not designate these contracts as hedge instruments for accounting purposes. The cost center ceiling test is prepared quarterly.
The average first-day-of-the-month NYMEX oil price used in estimating our proved reserves, after adjustments for market differentials and transportation expenses by field, was $63.86 at December 31, 2021, $35.84 at December 31, 2020, $40.08 at September 18, 2020, and $55.55 at December 31, 2019. We recognized a full cost pool ceiling test write-down of $14.4 million during the first quarter of 2021, with first-day-of-the-month NYMEX oil prices for the preceding 12 months averaging $36.40 per Bbl, after adjustments for market differentials and transportation expenses by field. The write-down was primarily a result of the March 2021 acquisition of Wyoming property interests (see Note 3, Acquisition and Divestitures) which was recorded based on a valuation that utilized NYMEX strip oil prices at the acquisition date, which were significantly higher than the average first-day-of-the-month NYMEX oil prices used to value the cost ceiling. Primarily as a result of the commodity price declines during 2020, the Predecessor recognized full cost pool ceiling test write-downs of $996.7 million during the period from January 1, 2020 through September 18, 2020, and an additional full cost pool ceiling test write-down of $1.0 million was recognized during the Successor period from September 19, 2020 through December 31, 2020. We did not record any ceiling test write-downs during the 2019 Predecessor period.
Joint Interest Operations. Substantially all of our oil and natural gas exploration and production activities are conducted jointly with others. These financial statements reflect only our proportionate interest in such activities, and any amounts due from other partners are included in trade receivables.
Denbury Inc.
Notes to Consolidated Financial Statements
Tertiary Injection Costs. Our tertiary operations are conducted in reservoirs that have already produced significant amounts of oil over many years; however, in accordance with the Securities and Exchange Commission (“SEC”) rules and regulations for recording proved reserves, we cannot recognize proved reserves associated with enhanced recovery techniques, such as CO2 injection, until we can demonstrate production resulting from the tertiary process or unless the field is analogous to an existing flood.
We capitalize, as a development cost, injection costs in fields that are in their development stage, which means we have not yet seen incremental oil production due to the CO2 injections (i.e., a production response). These capitalized development costs are included in our unevaluated property costs until we are able to recognize proved reserves associated with the development project. After we see a production response to the CO2 injections (i.e., the production stage), injection costs are expensed as incurred, and any previously deferred unevaluated development costs become subject to depletion.
CO2 Properties
We own and produce CO2 reserves, a non-hydrocarbon resource, that are used in our tertiary oil recovery operations on our own behalf and on behalf of other interest owners in enhanced recovery fields, with a portion sold to third-party industrial users. We record revenue from our sales of CO2 to third parties when it is produced and sold. Expenses related to the production of CO2 are allocated between volumes sold to third parties and volumes consumed internally that are directly related to our tertiary production. The expenses related to third-party sales are recorded in “CO2 operating and discovery expenses,” and the expenses related to internal use are recorded in “Lease operating expenses” in the Consolidated Statements of Operations or are capitalized as oil and natural gas properties in our Consolidated Balance Sheets, depending on the stage of the tertiary flood that is receiving the CO2 (see Tertiary Injection Costs above for further discussion).
Costs incurred to search for CO2 are expensed as incurred until proved or probable reserves are established. Once proved or probable reserves are established, costs incurred to obtain those reserves are capitalized and classified as “CO2 properties” on our Consolidated Balance Sheets. Capitalized CO2 costs are aggregated by geologic formation and depleted on a unit-of-production basis over proved and probable reserves.
Pipelines
CO2 used in our tertiary floods is transported to our fields through CO2 pipelines. Costs of CO2 pipelines under construction are not depreciated until the pipelines are placed into service. Pipelines are depreciated on a straight-line basis over their estimated useful lives, which range from 20 to 50 years. Capitalized costs include $22.4 million of CO2 pipelines as of December 31, 2021, that were either under construction or had not been placed into service and therefore, were not subject to depreciation during 2021.
Property and Equipment – Other
Other property and equipment, which includes furniture and fixtures, vehicles, and computer equipment and software, is depreciated principally on a straight-line basis over each asset’s estimated useful life. Vehicles are generally depreciated over a useful life of one to five years, furniture and fixtures over a life of one to ten years, and computer equipment and software are generally depreciated over a useful life of one to five years. Leasehold improvements are amortized over the shorter of the estimated useful life or the remaining lease term.
Maintenance and repair costs that do not extend the useful life of the property or equipment are charged to expense as incurred.
Intangible Assets
Our intangible assets subject to amortization represent amounts assigned in fresh start accounting to long-term contracts to sell CO2 to industrial customers. We amortize the CO2 contract intangible assets on a straight-line basis over their estimated useful lives, which range from seven to 14 years. Total amortization expense for our intangible assets was $9.1 million during the year ended December 31, 2021, $2.7 million during the Successor period September 19, 2020 through December 31, 2020,
Denbury Inc.
Notes to Consolidated Financial Statements
$1.7 million for the Predecessor period January 1, 2020 through September 18, 2020, and $2.4 million during the year ended 2019. The following table summarizes the carrying value of our intangible assets as of December 31, 2021 and 2020:
| | | | | | | | | | | | | | | | |
| | Successor |
| In thousands | | December 31, 2021 | | | | December 31, 2020 |
Long-term contracts to sell CO2 to industrial customers | | $ | 97,943 | | | | | $ | 97,943 | |
| Other intangibles | | 2,179 | | | | | 2,167 | |
| Accumulated amortization | | (11,874) | | | | | (2,748) | |
| Net book value | | $ | 88,248 | | | | | $ | 97,362 | |
As of December 31, 2021, our estimated amortization expense for our intangible assets subject to amortization over the next five years is as follows:
| | | | | | | | |
| In thousands | | |
| 2022 | | $ | 9,120 | |
| 2023 | | 9,117 | |
| 2024 | | 9,117 | |
| 2025 | | 9,117 | |
| 2026 | | 9,117 | |
Impairment Assessment of Long-Lived Assets
We test long-lived assets for impairment whenever events or changes in circumstances indicate that their carrying value may not be recoverable. These long-lived assets, which are not subject to our full cost pool ceiling test, are principally comprised of our capitalized CO2 properties and pipelines, and for the Successor period also included long-term contracts to sell CO2 to industrial customers.
We perform our long-lived asset impairment test by comparing the net carrying costs of our long-lived asset groups to the respective expected future undiscounted net cash flows that are supported by these long-lived assets which include production of our probable and possible oil and natural gas reserves. The portion of our capitalized CO2 costs related to CO2 reserves and CO2 pipelines that we estimate will be consumed in the process of producing our proved oil and natural gas reserves is included in the full cost pool ceiling test as a reduction to future net revenues. The remaining net capitalized costs that are not included in the full cost pool ceiling test, and related intangible assets, are subject to long-lived asset impairment testing. If the undiscounted net cash flows are below the net carrying costs for an asset group, we must record an impairment loss by the amount, if any, that net carrying costs exceed the fair value of the long-lived asset group. We did not record an impairment of long-lived assets during the year ended December 31, 2021, 2020 or 2019.
Asset Retirement Obligations
In general, our future asset retirement obligations relate to future costs associated with plugging and abandoning our oil, natural gas and CO2 wells, removing equipment and facilities from leased acreage, and returning land to its original condition. The fair value of a liability for an asset retirement obligation is recorded in the period in which it is incurred, discounted to its present value using our credit-adjusted-risk-free interest rate, and a corresponding amount capitalized by increasing the carrying amount of the related long-lived asset. The liability is accreted each period, and the capitalized cost is depreciated over the useful life of the related asset. Revisions to estimated retirement obligations will result in an adjustment to the related capitalized asset and corresponding liability. If the liability for an oil or natural gas well is settled for an amount other than the recorded amount, the difference is recorded to the full cost pool.
Asset retirement obligations are estimated at the present value of expected future net cash flows. We utilize unobservable inputs in the estimation of asset retirement obligations that include, but are not limited to, costs of labor and materials, profits on costs of labor and materials, the effect of inflation on estimated costs, and the discount rate. Accordingly, asset retirement obligations are considered a Level 3 measurement under the FASC Fair Value Measurement topic.
Denbury Inc.
Notes to Consolidated Financial Statements
Commodity Derivative Contracts
We utilize oil and natural gas derivative contracts to mitigate our exposure to commodity price risk associated with our future oil and natural gas production. These derivative contracts have historically consisted of options, in the form of price floors, collars, three-way collars, fixed-price swaps, fixed-price swaps enhanced with a sold put, and basis swaps. Our derivative financial instruments, other than any derivative instruments that are designated under the “normal purchase normal sale” exclusion, are recorded on the balance sheet as either an asset or a liability measured at fair value. We do not apply hedge accounting to our commodity derivative contracts; accordingly, changes in the fair value of these instruments are recognized in “Commodity derivatives expense (income)” in our Consolidated Statements of Operations in the period of change.
Concentrations of Credit Risk
Our financial instruments that are exposed to concentrations of credit risk consist primarily of cash equivalents, trade and accrued production receivables, and the derivative instruments discussed above. Our cash equivalents represent high-quality securities placed with various investment-grade institutions. This investment practice limits our exposure to concentrations of credit risk. Our trade and accrued production receivables are dispersed among various customers and purchasers; therefore, concentrations of credit risk are limited. We evaluate the credit ratings of our purchasers, and if customers are considered a credit risk, letters of credit are the primary security obtained to support lines of credit. We attempt to minimize our credit risk exposure to the counterparties of our oil and natural gas derivative contracts through formal credit policies, monitoring procedures and diversification. All of our derivative contracts are with parties that are lenders under our senior secured bank credit facility (or affiliates of such lenders). There are no margin requirements with the counterparties of our derivative contracts.
Oil and natural gas sales are made on a day-to-day basis or under short-term contracts at the current area market price. We would not expect the loss of any purchaser to have a material adverse effect upon our operations. For the year ended December 31, 2021 (Successor), four purchasers each accounted for 10% or more of our oil and natural gas revenues: Plains Marketing LP (28%), Hunt Crude Oil Supply Company (12%), Marathon Petroleum (11%) and Sunoco Inc. (11%). For the Successor period September 19, 2020 through December 31, 2020, three purchasers each accounted for 10% or more of our oil and natural gas revenues: Plains Marketing LP (30%), Marathon Petroleum (13%) and Hunt Crude Oil Supply Company (12%), and for the Predecessor period January 1, 2020 through September 18, 2020, three purchasers each accounted for 10% or more of our oil and natural gas revenues: Plains Marketing LP (30%), Hunt Crude Oil Supply Company (12%) and Marathon Petroleum (12%). For the year ended December 31, 2019 (Predecessor), three purchasers each accounted for 10% or more of our oil and natural gas revenues: Plains Marketing LP (32%), Hunt Crude Oil Supply Company (11%) and Sunoco Inc. (11%).
Income Taxes
Income taxes are accounted for using the asset and liability method, under which deferred income taxes are recognized for the future tax effects of temporary differences between the financial statement carrying amounts and the tax basis of existing assets and liabilities using the enacted statutory tax rates in effect at year end. The effect on deferred taxes for a change in tax rates is recognized in income in the period that includes the enactment date. A valuation allowance for deferred tax assets is recorded when it is more likely than not that the benefit from the deferred tax asset will not be realized.
We recognize the tax benefit from an uncertain tax position only if it is more likely than not that the tax position will be sustained upon examination by the taxing authorities, based on the technical merits of the position. The tax benefits recognized in the financial statements from such a position are measured based on the largest benefit that has a greater than 50% likelihood of being realized upon ultimate settlement.
Denbury Inc.
Notes to Consolidated Financial Statements
Net Income (Loss) per Common Share
Basic net income (loss) per common share is computed by dividing the net income (loss) attributable to common stockholders by the weighted average number of shares of common stock outstanding during the period. Diluted net income (loss) per common share is calculated in the same manner but includes the impact of potentially dilutive securities. Potentially dilutive securities during the Successor periods consist of nonvested restricted stock units, nonvested performance stock units, and outstanding series A and series B warrants, and during the Predecessor periods consisted of nonvested restricted stock, nonvested performance-based equity awards, and convertible senior notes.
The following table sets forth the reconciliations of net income (loss) and weighted average shares used for purposes of calculating basic and diluted net income (loss) per common share for the periods indicated:
| | | | | | | | | | | | | | | | | | | | | | | | | | | | | |
| | Successor | | | Predecessor |
| | | Year Ended
Dec. 31, 2021 | | Period from
Sept. 19, 2020 through
Dec. 31, 2020 | | | Period from
Jan. 1, 2020 through
Sept. 18, 2020 | | Year Ended
Dec. 31, 2019 |
| In thousands | | | | | |
| Numerator | | | | | | | | | |
| Net income (loss) – basic | | $ | 56,002 | | | $ | (50,658) | | | | $ | (1,432,578) | | | $ | 216,959 | |
| Effect of potentially dilutive securities | | | | | | | | | |
| Interest on convertible senior notes including amortization of discount, net of tax | | — | | | — | | | | — | | | 14,134 | |
| Net income (loss) – diluted | | $ | 56,002 | | | $ | (50,658) | | | | $ | (1,432,578) | | | $ | 231,093 | |
| | | | | | | | | |
| Denominator | | | | | | | | | |
| Weighted average common shares outstanding – basic | | 50,918 | | | 50,000 | | | | 495,560 | | | 459,524 | |
| Effect of potentially dilutive securities | | | | | | | | | |
| Restricted stock units | | 762 | | | — | | | | — | | | — | |
| Warrants | | 2,138 | | | — | | | | — | | | — | |
| Restricted stock and performance-based equity awards | | — | | | — | | | | — | | | 2,396 | |
Convertible senior notes(1) | | — | | | — | | | | — | | | 48,421 | |
| Weighted average common shares outstanding – diluted | | 53,818 | | | 50,000 | | | | 495,560 | | | 510,341 | |
(1)For the year ended December 31, 2019, shares shown under “convertible senior notes” represent the prorated portion of the approximately 90.9 million shares of the Predecessor’s common stock issuable upon full conversion of the convertible senior notes which were issued on June 19, 2019 (see Note 8, Long-Term Debt – 2019 Predecessor Debt Reduction Transactions).
For each of the periods from September 19, 2020 through December 31, 2020 (Successor) and from January 1, 2020 through September 18, 2020 (Predecessor), the weighted average common shares outstanding used to calculate basic earnings per share and diluted earnings per share were the same, since the Company generated a net loss during those periods. The weighted average diluted shares outstanding would have been 50.0 million for the period September 19, 2020 through December 31, 2020 and 584.4 million for the period January 1, 2020 through September 18, 2020, if the Company had recognized net income during those periods.
Basic weighted average common shares during the year ended December 31, 2021 includes 1,383,144 performance-based and restricted stock units which are fully vested as of December 31, 2021. Although vesting criteria for these awards have been achieved, the shares underlying these awards are not currently outstanding as actual delivery of the shares is not scheduled to occur until December 4, 2023. During the Predecessor periods, basic weighted average common shares includes restricted stock that vested during the periods.
For purposes of calculating diluted weighted average common shares for the years ended December 31, 2021 and 2019, the nonvested restricted stock units, nonvested restricted stock and performance-based equity awards, along with unexercised
Denbury Inc.
Notes to Consolidated Financial Statements
warrants are included in the computation using the treasury stock method, and for the shares underlying the convertible senior notes as if the convertible senior notes were converted at the earliest date outstanding during the respective periods.
The following outstanding securities were excluded from the computation of diluted net income (loss) per share for the year ended December 31, 2021, the period September 19, 2020 through December 31, 2020, and the year ended December 31, 2019, as their effect would have been antidilutive, as of the respective dates:
| | | | | | | | | | | | | | | | | | | | | | |
| | Successor | | Predecessor | | |
| In thousands | | December 31, 2021 | | December 31, 2020 | | December 31, 2019 | | |
| Restricted stock units | | — | | | 1,220 | | | — | | | |
| Warrants | | — | | | 5,526 | | | — | | | |
| Stock appreciation rights | | — | | | — | | | 1,981 | | | |
| Restricted stock and performance-based equity awards | | — | | | — | | | 4,445 | | | |
For the period September 19, 2020 through December 31, 2020, the Company’s restricted stock units and series A and series B warrants were antidilutive based on the Company’s net loss position for the periods. At December 31, 2021, the Company had approximately 5.2 million warrants outstanding that can be exercised for shares of the Successor’s common stock, at an exercise price of $32.59 per share for the 2.6 million series A warrants outstanding and at an exercise price of $35.41 per share for the 2.6 million series B warrants outstanding. The series A warrants are exercisable until September 18, 2025, and the series B warrants are exercisable until September 18, 2023, at which time the warrants expire. The warrants were issued pursuant to the Plan to holders of the Predecessor’s convertible senior notes, senior subordinated notes, and equity. As of December 31, 2021, 11,694 series A warrants and 327,266 series B warrants have been exercised in exchange for a total of 193,657 shares. The warrants may be exercised for cash or on a cashless basis.
Environmental and Litigation Contingencies
The Company makes judgments and estimates in recording liabilities for contingencies such as environmental remediation or ongoing litigation. Liabilities are recorded when it is both probable that a loss has been incurred and such loss is reasonably estimable. Assessments of liabilities are based on information obtained from independent and in-house experts, loss experience in similar situations, actual costs incurred, and other case-by-case factors. Any related insurance recoveries are recognized in our financial statements during the period received or at the time receipt is determined to be virtually certain.
Recent Accounting Pronouncements
Recently Adopted
Income Taxes. In December 2019, the Financial Accounting Standards Board issued Accounting Standards Update (“ASU”) 2019-12, Income Taxes (Topic 740) – Simplifying the Accounting for Income Taxes (“ASU 2019-12”). The objective of ASU 2019-12 is to simplify the accounting for income taxes by removing certain exceptions to the general principles in Topic 740 and to provide more consistent application to improve the comparability of financial statements. Effective January 1, 2021, we adopted ASU 2019-02. The implementation of this standard did not have a material impact on our consolidated financial statements and related footnote disclosures.
Note 2. Fresh Start Accounting
Fresh Start Accounting
Upon emergence from bankruptcy, we met the criteria and were required to adopt fresh start accounting in accordance with FASC Topic 852, Reorganizations, which on the Emergence Date resulted in a new entity, the Successor, for financial reporting purposes, with no beginning retained earnings or deficit as of the fresh start reporting date. The criteria requiring fresh start accounting are: (1) the holders of the then-existing common shares of the Predecessor received less than 50 percent of the new common shares of the Successor outstanding upon emergence from bankruptcy and (2) the reorganization value of the Company’s assets immediately prior to confirmation of the Plan was less than the total of all post-petition liabilities and allowed claims.
Denbury Inc.
Notes to Consolidated Financial Statements
Fresh start accounting requires that new fair values be established for the Company’s assets, liabilities and equity as of the date of emergence from bankruptcy, September 18, 2020, and therefore certain values and operational results of the consolidated financial statements subsequent to September 18, 2020 are not comparable to those in the Company’s consolidated financial statements prior to, and including September 18, 2020. The Emergence Date fair values of the Successor’s assets and liabilities differ materially from their recorded values as reflected on the historical balance sheet of the Predecessor.
Reorganization Value
The reorganization value derived from the range of enterprise values associated with the Plan was allocated to the Company’s identifiable tangible and intangible assets and liabilities based on their fair values. Under FASC Topic 852, reorganization value generally approximates the fair value of the entity before considering liabilities and is intended to approximate the amount a willing buyer would pay for the assets immediately after the effects of the restructuring. The value of the reconstituted entity (i.e., Successor) was based on management projections and the valuation models as determined by the Company’s financial advisors in setting an estimated range of enterprise values. As set forth in the Plan and Disclosure Statement approved by the Bankruptcy Court, the valuation analysis resulted in an enterprise value between $1.1 billion and $1.5 billion, with a midpoint of $1.3 billion. For U.S. GAAP purposes, we valued the Successor’s individual assets, liabilities, and equity instruments and determined the value of the enterprise was approximately $1.3 billion as of the Emergence Date, which fell in line with the midpoint of the forecast enterprise value ranges approved by the Bankruptcy Court. Specific valuation approaches and key assumptions used to arrive at reorganization value, and the value of discrete assets and liabilities resulting from the application of fresh start accounting, are described below in greater detail within the valuation process.
The following table reconciles the enterprise value to the equity value of the Successor as of the Emergence Date:
| | | | | | | | |
| In thousands | | Sept. 18, 2020 |
| Enterprise value | | $ | 1,280,856 | |
| Plus: Cash and cash equivalents | | 45,585 | |
| Less: Total debt | | (231,022) | |
| Equity value | | $ | 1,095,419 | |
The following table reconciles enterprise value to reorganization value of the Successor (i.e., value of the reconstituted entity) and total reorganization value:
| | | | | | | | |
| In thousands | | Sept. 18, 2020 |
| Enterprise value | | $ | 1,280,856 | |
| Plus: Cash and cash equivalents | | 45,585 | |
| Plus: Current liabilities excluding current maturities of long-term debt | | 239,738 | |
| Plus: Non-interest-bearing noncurrent liabilities | | 185,228 | |
| Reorganization value of the reconstituted Successor | | $ | 1,751,407 | |
With the assistance of third-party valuation advisors, we determined the enterprise and corresponding equity value of the Successor using various valuation approaches and methods, including: (i) income approach using a calculation of the present value of future cash flows based on our financial projections, (ii) the market approach using selling prices of similar assets and (iii) the cost approach.
The enterprise value and corresponding equity value are dependent upon achieving the future financial results set forth in our valuation using an asset-based methodology of estimated proved reserves, undeveloped properties, and other financial information, considerations and projections, applying a combination of the income, cost and market approaches as of the fresh start reporting date of September 18, 2020. All estimates, assumptions, valuations and financial projections, including the fair value adjustments, the financial projections, the enterprise value and equity value projections, are inherently subject to significant uncertainties and the resolution of contingencies beyond our control. Accordingly, there is no assurance that the estimates, assumptions, valuations or financial projections will be realized, and actual results could vary materially.
Denbury Inc.
Notes to Consolidated Financial Statements
Reorganization Items, Net
“Reorganization items, net” in our Consolidated Statements of Operations includes (i) expenses incurred during the Chapter 11 Restructuring subsequent to the Petition Date as a direct result of the Plan, (ii) gains or losses from liabilities settled and (iii) fresh start accounting adjustments. Professional service provider charges associated with our restructuring that were incurred outside of this period (before the Petition Date and after the Emergence Date) are recorded in “Other expenses” in our Consolidated Statements of Operations. Contractual interest expense of $22.0 million from the Petition Date through the Emergence Date associated with our outstanding senior secured second lien notes, convertible senior notes, and senior subordinated notes was not accrued or recorded in the consolidated statement of operations as interest expense.
The following table summarizes the losses (gains) on reorganization items, net:
| | | | | | | | |
| | Predecessor |
| | Period from
Jan. 1, 2020 through
Sept. 18, 2020 |
| In thousands | |
| Gain on settlement of liabilities subject to compromise | | $ | (1,024,864) | |
| Fresh start accounting adjustments | | 1,834,423 | |
| Professional service provider fees and other expenses | | 11,267 | |
| Success fees for professional service providers | | 9,700 | |
| Loss on rejected contracts and leases | | 10,989 | |
| Valuation adjustments to debt classified as subject to compromise | | 757 | |
| Debtor-in-possession credit agreement fees | | 3,107 | |
| Acceleration of Predecessor stock compensation expense | | 4,601 | |
| Total reorganization items, net | | $ | 849,980 | |
Valuation Process
The fair values of our principal assets, including oil and natural gas properties, CO2 properties, pipelines, other property and equipment, long-term contracts to sell CO2 to industrial customers, favorable and unfavorable vendor contracts, pipeline financing liabilities and right-of-use assets, asset retirement obligations and warrants were estimated as of the Emergence Date.
Oil and Natural Gas Properties
The Company’s principal assets are its oil and natural gas properties, which are accounted for under the full cost accounting method as described in Note 1, Nature of Operations and Summary of Significant Accounting Policies – Oil and Natural Gas Properties. The Company determined the fair value of its oil and gas properties based on the discounted cash flows expected to be generated from these assets. The computations were based on market conditions and reserves in place as of the Emergence Date.
The fair value analysis was based on the Company’s estimated future production rates of proved and probable reserves as prepared by the Company’s independent petroleum engineers. Discounted cash flow models were prepared using the estimated future revenues and operating costs for all developed wells and undeveloped properties comprising the proved and probable reserves. Future revenues were based upon future production rates and forward strip oil and natural gas prices as of the Emergence Date through 2024 and escalated for inflation thereafter, adjusted for differentials. Operating costs were adjusted for inflation beginning in year 2025. A risk adjustment factor was applied to each reserve category, consistent with the risk of the category. The discounted cash flow models also included adjustments for income tax expenses.
Discount factors utilized were derived using a weighted average cost of capital computation, which included an estimated cost of debt and equity for market participants with similar geographies and asset development type and varying corporate income tax rates based on the expected point of sale for each property’s produced assets. Reserve values were also adjusted for any asset retirement obligations as well as for CO2 indirect costs not directly allocable to oil fields. Based on this analysis, the
Denbury Inc.
Notes to Consolidated Financial Statements
Company concluded the fair value of its proved and probable reserves was $865.4 million as of the Emergence Date (see footnote 10 to Fresh Start Adjustments discussion below).
CO2 Properties
The fair value of CO2 properties includes the value of CO2 mineral rights and associated infrastructure and was determined using the discounted cash flow method under the income approach. After-tax cash flows were forecast based on expected costs to produce and transport CO2 as estimated by management, and income was imputed using a gross-up of costs based on a five-year average historical EBITDA margin for publicly traded companies that primarily develop or produce natural gas. Cash flows were also adjusted for a market participant profit on CO2 costs, since Denbury charges oil fields for CO2 use on a cost basis. Cash flows were then discounted using a rate considering reduced risk associated with CO2 industrial sales.
Pipelines
The fair values of our pipelines were determined using a combination of the replacement cost method under the cost approach and the discounted cash flow method under the income approach. The replacement cost method considers historical acquisition costs for the assets adjusted for inflation, as well as factors in any potential obsolescence based on the current condition of the assets and the ability of those assets to generate cash flow. For assets valued using the discounted cash flow method, after-tax cash flows were forecast based on expected costs estimated by management, and profits were imputed using a gross-up of costs based on a five-year average historical EBITDA margin for publicly traded companies that primarily transport natural gas. Pipeline depreciable lives represent the remaining estimated useful lives of the pipelines.
Other Property and Equipment
The fair value of the non-reserve related property and equipment such as land, buildings, equipment, leasehold improvements and software was determined using the replacement cost method under the cost approach which considers historical acquisition costs for the assets adjusted for inflation, as well as factors in any potential obsolescence based on the current condition of the assets and the ability of those assets to generate cash flow.
Long-Term Contracts to Sell CO2 to Industrial Customers
The fair value of long-term contracts to sell CO2 to industrial customers was determined using the multi-period excess earnings method (“MPEEM”) under the income approach. MPEEM attributes cash flow to a specific intangible asset based on residual cash flows from a set of assets generating revenues after accounting for appropriate returns on and of other assets contributing to that revenue generation. Cash flows were forecast based on expected changes in pricing, volumes, renewal rates, and costs using volumes and prices through and beyond the initial contract terms. After-tax cash flows were discounted using a rate considering reduced risk of these industrial contracts relative to overall oil and gas production risks.
Favorable and Unfavorable Vendor Contracts
We recognized both favorable and unfavorable contracts using the incremental value method under the income approach. The incremental value method calculates value on the basis of the pricing differential between historical contracted rates and estimated pricing that the Company would most likely receive if it entered into similar contract conditions (other than the price) as of the Emergence Date. The differential is applied to expected contract volumes, tax-affected and discounted at a discount rate consistent with the risk of the associated cash flows.
Asset Retirement Obligations
The fair value of the asset retirement obligations was revalued based upon estimated current reclamation costs for our assets with reclamation obligations, an appropriate long-term inflation adjustment, and our revised credit adjusted risk-free rate (“CARFR”). The new CARFR was based on an evaluation of similar industry peers with similar factors such as emergence, new capital structure and current rates for oil and gas companies.
Denbury Inc.
Notes to Consolidated Financial Statements
Pipeline Financing Liabilities
The fair value of the pipeline financing liabilities was measured as the present value of the remaining payments under the restructured pipeline agreements (see Note 8, Long-Term Debt – Restructuring of Pipeline Financing Transactions, for further discussion).
Warrants
The fair values of the warrants issued upon the Emergence Date were estimated by applying a Black-Scholes model. The Black-Scholes model is a pricing model used to estimate the fair value of a European-style call or put option/warrant based on a current stock price, strike price, time to maturity, risk-free rate, annual volatility rate, and annual dividend yield.
The model used the following assumptions: implied stock price (total equity divided by total shares outstanding) of the Successor’s shares of common stock of $22.14; exercise price per share of $32.59 and $35.41 for series A and B warrants, respectively; expected volatility of 49.3% and 53.6% for series A and B warrants, respectively; risk-free interest rates of 0.3% and 0.2% for series A and B warrants, respectively, using the United States Treasury Constant Maturity rates; and an expected annual dividend yield of 0%. Expected volatility was estimated using volatilities of similar entities whose share or option prices and assumptions were publicly available. The time to maturity of the warrants was based on the contractual terms of the warrants of five and three years for series A and series B warrants, respectively. The values were also adjusted for potential dilution impacts.
Condensed Consolidated Balance Sheet
The following illustrates the effects on the Company’s consolidated balance sheet due to the reorganization and fresh start accounting adjustments. The explanatory notes following the table below provide further details on the adjustments, including the assumptions and methods used to determine fair value for its assets, liabilities, and warrants.
| | | | | | | | | | | | | | | | | | | | | | | | | | |
| | As of September 18, 2020 |
| In thousands | | Predecessor | | Reorganization Adjustments | | Fresh Start Adjustments | | Successor |
| Assets | | | | | | | | |
| Current assets | | | | | | | | |
| Cash and cash equivalents | | $ | 73,372 | | | $ | (27,787) | | (1) | $ | — | | | $ | 45,585 | |
| Restricted cash | | — | | | 10,662 | | (2) | — | | | 10,662 | |
| Accrued production receivable | | 112,832 | | | — | | | — | | | 112,832 | |
| Trade and other receivables, net | | 36,221 | | | — | | | — | | | 36,221 | |
| Derivative assets | | 32,635 | | | — | | | — | | | 32,635 | |
| Other current assets | | 12,968 | | | (539) | | (3) | — | | | 12,429 | |
| Total current assets | | 268,028 | | | (17,664) | | | — | | | 250,364 | |
| Property and equipment | | | | | | | | |
| Oil and natural gas properties (using full cost accounting) | | | | | | | | |
| Proved properties | | 11,723,546 | | | — | | | (10,941,313) | | | 782,233 | |
| Unevaluated properties | | 650,553 | | | — | | | (538,570) | | | 111,983 | |
CO2 properties | | 1,198,515 | | | — | | | (1,011,169) | | | 187,346 | |
| Pipelines | | 2,339,864 | | | — | | | (2,207,246) | | | 132,618 | |
| Other property and equipment | | 201,565 | | | — | | | (104,152) | | | 97,413 | |
| Less accumulated depletion, depreciation, amortization and impairment | | (12,864,141) | | | — | | | 12,864,141 | | | — | |
| Net property and equipment | | 3,249,902 | | | — | | | (1,938,309) | | (10) | 1,311,593 | |
| Operating lease right-of-use assets | | 1,774 | | | — | | | 69 | | (10) | 1,843 | |
| Derivative assets | | 501 | | | — | | | — | | | 501 | |
| Intangible assets, net | | 20,405 | | | — | | | 79,678 | | (11) | 100,083 | |
| Other assets | | 81,809 | | | 8,241 | | (4) | (3,027) | | (12) | 87,023 | |
| Total assets | | $ | 3,622,419 | | | $ | (9,423) | | | $ | (1,861,589) | | | $ | 1,751,407 | |
Denbury Inc.
Notes to Consolidated Financial Statements
| | | | | | | | | | | | | | | | | | | | | | | | | | |
| | As of September 18, 2020 |
| In thousands | | Predecessor | | Reorganization Adjustments | | Fresh Start Adjustments | | Successor |
| Liabilities and Stockholders’ Equity | | | | | | | | |
| Current liabilities | | | | | | | | |
| Accounts payable and accrued liabilities | | $ | 67,789 | | | $ | 102,793 | | (5) | $ | 3,738 | | (13) | $ | 174,320 | |
| Oil and gas production payable | | 39,372 | | | 16,705 | | (6) | — | | | 56,077 | |
| Derivative liabilities | | 8,613 | | | — | | | — | | | 8,613 | |
| Current maturities of long-term debt | | — | | | 73,199 | | (6) | 364 | | (14) | 73,563 | |
| Operating lease liabilities | | — | | | 757 | | (6) | (29) | | (10) | 728 | |
| Total current liabilities | | 115,774 | | | 193,454 | | | 4,073 | | | 313,301 | |
| Long-term liabilities | | | | | | | | |
| Long-term debt, net of current portion | | 140,000 | | | 42,610 | | (6) | (25,151) | | (14) | 157,459 | |
| Asset retirement obligations | | 2,727 | | | 180,408 | | (6) | (24,697) | | (10) | 158,438 | |
| Derivative liabilities | | 295 | | | — | | | — | | | 295 | |
| Deferred tax liabilities, net | | — | | | 417,951 | | (6)(15) | (414,120) | | (15) | 3,831 | |
| Operating lease liabilities | | — | | | 515 | | (6) | 10 | | (10) | 525 | |
| Other liabilities | | — | | | 3,540 | | (6) | 18,599 | | (16) | 22,139 | |
| Total long-term liabilities not subject to compromise | | 143,022 | | | 645,024 | | | (445,359) | | | 342,687 | |
| Liabilities subject to compromise | | 2,823,506 | | | (2,823,506) | | (6) | — | | | — | |
| Commitments and contingencies (Note 14) | | | | | | | | |
| Stockholders’ equity | | | | | | | | |
| Predecessor preferred stock | | — | | | — | | | — | | | — | |
| Predecessor common stock | | 510 | | | (510) | | (7) | — | | | — | |
| Predecessor paid-in capital in excess of par | | 2,764,915 | | | (2,764,915) | | (7) | — | | | — | |
| Predecessor treasury stock, at cost | | (6,202) | | | 6,202 | | (7) | — | | | — | |
| Successor preferred stock | | — | | | — | | | — | | | — | |
| Successor common stock | | — | | | 50 | | (8) | — | | | 50 | |
| Successor paid-in capital in excess of par | | — | | | 1,095,369 | | (8) | — | | | 1,095,369 | |
| Accumulated deficit | | (2,219,106) | | | 3,639,409 | | (9) | (1,420,303) | | (17) | — | |
Total stockholders’ equity | | 540,117 | | | 1,975,605 | | | (1,420,303) | | | 1,095,419 | |
| Total liabilities and stockholders’ equity | | $ | 3,622,419 | | | $ | (9,423) | | | $ | (1,861,589) | | | $ | 1,751,407 | |
Reorganization Adjustments
(1)Represents the net cash payments that occurred on the Emergence Date as follows:
| | | | | | | | |
| In thousands | | |
| Sources: | | |
| Cash proceeds from Successor Bank Credit Agreement | | $ | 140,000 | |
| Total cash proceeds | | 140,000 | |
| | |
| Uses: | | |
| Payment in full of DIP Facility and pre-petition revolving bank credit facility | | (140,000) | |
| Retained professional service provider fees paid to escrow account | | (10,662) | |
| Non-retained professional service provider fees paid | | (7,420) | |
| Accrued interest and fees on DIP Facility | | (1,464) | |
| Debt issuance costs related to Successor Bank Credit Agreement | | (8,241) | |
| Total cash uses | | (167,787) | |
| | |
| Net uses | | $ | (27,787) | |
Denbury Inc.
Notes to Consolidated Financial Statements
(2)Represents the transfer of funds to a restricted cash account utilized for the payment of fees to retained professional service providers assisting in the bankruptcy process.
(3)Represents the write-off of costs related to the DIP Facility and a run-off policy for directors’ and officers’ insurance coverage, partially offset by the recording of prepaid amounts for non-retained professional service provider fees.
(4)Represents debt issuance costs related to the Successor Bank Credit Agreement.
(5)Adjustments to accounts payable and accrued liabilities as follows:
| | | | | | | | |
| In thousands | | |
| Accrual of professional service provider fees | | $ | 2,826 | |
| Payment of accrued interest and fees on DIP Facility | | (1,464) | |
| Reinstatement of accounts payable and accrued liabilities from liabilities subject to compromise | | 101,431 | |
| Accounts payable and accrued liabilities | | $ | 102,793 | |
(6)Liabilities subject to compromise were settled as follows in accordance with the Plan:
| | | | | | | | |
| In thousands | | |
| Liabilities subject to compromise prior to the Emergence Date: | | |
| Settled liabilities subject to compromise | | |
| Senior secured second lien notes | | $ | 1,629,457 | |
| Convertible senior notes | | 234,015 | |
| Senior subordinated notes | | 251,480 | |
| Total settled liabilities subject to compromise | | 2,114,952 | |
| Reinstated liabilities subject to compromise | | |
| Current maturities of long-term debt | | 73,199 | |
| Accounts payable and accrued liabilities | | 101,431 | |
| Oil and gas production payable | | 16,705 | |
| Operating lease liabilities, current | | 757 | |
| Long-term debt, net of current portion | | 42,610 | |
| Asset retirement obligations | | 180,408 | |
| Deferred tax liabilities | | 289,389 | |
| Operating lease liabilities, long-term | | 515 | |
| Other long-term liabilities | | 3,540 | |
| Total reinstated liabilities subject to compromise | | 708,554 | |
| Total liabilities subject to compromise | | 2,823,506 | |
| | |
| Issuance of New Common Stock to second lien note holders | | (1,014,608) | |
| Issuance of New Common Stock to convertible note holders | | (53,400) | |
| Issuance of series A warrants to convertible note holders | | (15,683) | |
| Issuance of series B warrants to senior subordinated note holders | | (6,398) | |
| Reinstatement of liabilities subject to compromise | | (708,553) | |
| Gain on settlement of liabilities subject to compromise | | $ | 1,024,864 | |
(7)Represents the cancellation of the Predecessor’s common stock, treasury stock, and related components of the Predecessor’s paid-in capital in excess of par. Paid-in capital in excess of par includes $4.6 million as a result of terminated Predecessor stock compensation plans.
Denbury Inc.
Notes to Consolidated Financial Statements
(8)Represents the Successor’s common stock and additional paid-in capital as follows:
| | | | | | | | |
| In thousands | | |
| Capital in excess of par value of 47,499,999 issued and outstanding shares of New Common Stock issued to holders of the senior secured second lien note claims | | $ | 1,014,608 | |
| Capital in excess of par value of 2,500,000 issued and outstanding shares of New Common Stock issued to holders of the convertible senior note claims | | 53,400 | |
| Fair value of series A warrants issued to convertible senior note holders | | 15,683 | |
| Fair value of series B warrants issued to senior subordinated note holders | | 6,398 | |
| Fair value of series B warrants issued to Predecessor equity holders | | 5,330 | |
| Total change in Successor common stock and additional paid-in capital | | 1,095,419 | |
| Less: Par value of Successor common stock | | (50) | |
| Change in Successor additional paid-in capital | | $ | 1,095,369 | |
(9)Reflects the cumulative net impact of the effects on accumulated deficit as follows:
| | | | | | | | |
| In thousands | | |
| Cancellation of Predecessor common stock, paid-in capital in excess of par, and treasury stock | | $ | 2,763,824 | |
| Gain on settlement of liabilities subject to compromise | | 1,024,864 | |
| Acceleration of Predecessor stock compensation expense | | (4,601) | |
| Recognition of tax expenses related to reorganization adjustments | | (128,556) | |
| Professional service provider fees recognized at emergence | | (9,700) | |
| Issuance of series B warrants to Predecessor equity holders | | (5,330) | |
| Other | | (1,092) | |
| Net impact to Predecessor accumulated deficit | | $ | 3,639,409 | |
Fresh Start Adjustments
(10)Reflects fair value adjustments to our (i) oil and natural gas properties, CO2 properties, pipelines, and other property and equipment, as well as the elimination of accumulated depletion, depreciation, and amortization, (ii) operating lease right-of-use assets and liabilities, and (iii) asset retirement obligations.
(11)Reflects fair value adjustments to our long-term contracts to sell CO2 to industrial customers.
(12)Reflects fair value adjustments to our other assets as follows:
| | | | | | | | |
| In thousands | | |
Fair value adjustment for CO2 and oil pipeline line-fill | | $ | (3,698) | |
| Fair value adjustments for escrow accounts | | 671 | |
| Fair value adjustments to other assets | | $ | (3,027) | |
(13)Reflects fair value adjustments to accounts payable and accrued liabilities as follows:
| | | | | | | | |
| In thousands | | |
| Fair value adjustment for the current portion of an unfavorable vendor contract | | $ | 3,500 | |
| Fair value adjustment for the current portion of Predecessor asset retirement obligation | | 689 | |
| Write-off accrued interest on NEJD pipeline financing | | (451) | |
| Fair value adjustments to accounts payable and accrued liabilities | | $ | 3,738 | |
Denbury Inc.
Notes to Consolidated Financial Statements
(14)Represents adjustments to current and long-term maturities of debt associated with pipeline lease financings. The cumulative effect is as follows:
| | | | | | | | |
| In thousands | | |
| Fair value adjustment for Free State pipeline lease financing | | $ | (24,699) | |
| Fair value adjustment for NEJD pipeline lease financing | | (88) | |
| Fair value adjustments to current and long-term maturities of debt | | $ | (24,787) | |
Our pipeline lease financings were restructured in late October 2020 (see Note 8, Long-Term Debt – Restructuring of Pipeline Financing Transactions).
(15)Represents (i) adjustment to deferred taxes, including the recognition of tax expenses related to reorganization adjustments as a result of the cancellation of debt and retaining tax attributes for the Successor and the reinstatement of deferred tax liabilities subject to compromise totaling $128.6 million and (ii) adjustments to deferred tax liabilities related to fresh start accounting of $414.1 million.
(16)Represents a fair value adjustment for the long-term portion of an unfavorable vendor contract.
(17)Represents the cumulative effect of the fresh start accounting adjustments discussed above.
Note 3. Acquisition and Divestitures
Acquisition of Wyoming CO2 EOR Fields
On March 3, 2021, we acquired a nearly 100% working interest (approximately 83% net revenue interest) in the Big Sand Draw and Beaver Creek EOR fields located in Wyoming from a subsidiary of Devon Energy Corporation, including surface facilities and a 46-mile CO2 transportation pipeline to the acquired fields. The acquisition purchase price was $10.9 million cash (after final closing adjustments) plus two contingent $4 million cash payments if NYMEX WTI oil prices average at least $50 per Bbl during each of 2021 and 2022. We made the first contingent payment in January 2022 and if the price condition is met, the second $4 million payment will be due in January 2023. The fair value of the contingent consideration on the acquisition date was $5.3 million, and as of December 31, 2021, the fair value of the contingent consideration recorded on our Consolidated Balance Sheets was $7.7 million. The $2.4 million increase at December 31, 2021 from the March 2021 acquisition date fair value was the result of higher NYMEX WTI oil prices and was recorded to “Other expenses” in our Consolidated Statements of Operations.
The fair values allocated to our assets acquired and liabilities assumed for the acquisition were based on significant inputs not observable in the market and considered level 3 inputs. The fair value of the assets acquired and liabilities assumed was finalized during the third quarter of 2021, after consideration of final closing adjustments and evaluation of reserves and
Denbury Inc.
Notes to Consolidated Financial Statements
liabilities assumed. The following table presents a summary of the fair value of assets acquired and liabilities assumed in the acquisition:
| | | | | | | | |
| In thousands | | |
| Consideration: | | |
| Cash consideration | | $ | 10,906 | |
| | |
| Less: Fair value of assets acquired and liabilities assumed: | | |
| Proved oil and natural gas properties | | 60,101 | |
| Other property and equipment | | 1,685 | |
| Asset retirement obligations | | (39,794) | |
| Contingent consideration | | (5,320) | |
| Other liabilities | | (5,766) | |
| Fair value of net assets acquired | | $ | 10,906 | |
Divestitures
Hartzog Draw Deep Mineral Rights
On June 30, 2021, we closed the sale of undeveloped, unconventional deep mineral rights in Hartzog Draw Field in Wyoming. The cash proceeds of $18 million were recorded to “Proved properties” in our Consolidated Balance Sheets. The proceeds reduced our full cost pool; therefore, no gain or loss was recorded on the transaction, and the sale had no impact on our production or reserves.
Houston Area Land Sales
During the second half of 2021, we completed sales of a portion of certain non-producing surface acreage in the Houston area. We received cash proceeds of $15.2 million from the sales and recognized a $10.3 million gain to “Other income” in our Consolidated Statements of Operations.
Gulf Coast Working Interests Sale
On March 4, 2020, the Predecessor sold half of its working interest positions in four southeast Texas oil fields for $40 million net cash and a carried interest in ten wells to be drilled by the purchaser. The Predecessor did not record a gain or loss on the sale of the properties in accordance with the full cost method of accounting.
Note 4. Revenue Recognition
We record revenue in accordance with FASC Topic 606, Revenue from Contracts with Customers. The core principle of FASC Topic 606 is that an entity should recognize revenue for the transfer of goods or services equal to the amount of consideration that it expects to be entitled to receive for those goods or services. This principle is achieved through applying a five-step process for customer contract revenue recognition:
•Identify the contract or contracts with a customer – We derive the majority of our revenues from oil and natural gas sales contracts and CO2 sales and transportation contracts. The contracts specify each party’s rights regarding the goods or services to be transferred and contain commercial substance as they impact our financial statements. A high percentage of our receivables balance is current, and we have not historically entered into contracts with counterparties that pose a credit risk without requiring adequate economic protection to ensure collection.
•Identify the performance obligations in the contract – Each of our revenue contracts specify a volume per day, or production from a lease designated in the contract (a distinct good), to be delivered at the delivery point over the term of the
Denbury Inc.
Notes to Consolidated Financial Statements
contract (the identified performance obligation). The customer takes delivery and physical possession of the product at the delivery point, which generally is also the point at which title transfers and the customer obtains control (the identified performance obligation is satisfied).
•Determine the transaction price – Typically, our oil and natural gas contracts define the price as a formula price based on the average market price, as specified on set dates each month, for the specific commodity during the month of delivery. Certain of our CO2 contracts define the price as a fixed contractual price adjusted to an inflation index to reflect market pricing. Given the industry practice to invoice customers the month following the month of delivery and our high probability of collection of payment, no significant financing component is included in our contracts.
•Allocate the transaction price to the performance obligations in the contract – The majority of our revenue contracts are short-term, with terms of one year or less, to which we have applied the practical expedient permitted under the standard eliminating the requirement to disclose the transaction price allocated to remaining performance obligations. In limited instances, we have revenue contracts with terms greater than one year; however, the future delivery volumes are wholly unsatisfied as they represent separate performance obligations with variable consideration. We utilized the practical expedient which eliminates the requirement to disclose the transaction price allocated to remaining performance obligations if the variable consideration is allocated entirely to wholly unsatisfied performance obligations. As there is only one performance obligation associated with our contracts, no allocation of the transaction price is necessary.
•Recognize revenue when, or as, we satisfy a performance obligation – Once we have delivered the volume of commodity to the delivery point and the customer takes delivery and possession, we are entitled to payment and we invoice the customer for such delivered production. Payment under most oil and CO2 contracts is received within a month following product delivery, and for natural gas and NGL contracts, payment is generally received within two months following delivery. Timing of revenue recognition may differ from the timing of invoicing to customers; however, as the right to consideration after delivery is unconditional based on only the passage of time before payment of the consideration is due, upon delivery we record a receivable in “Accrued production receivable” in our Consolidated Balance Sheets.
In addition to revenues from oil and natural gas sales contracts and CO2 sales and transportation contracts, in certain situations, the Company enters into marketing arrangements for the purchase and subsequent sale of crude oil from third parties. We recognize the revenue received and the associated expenses incurred on these sales on a gross basis, as “Oil marketing revenues” and “Oil marketing purchases” in our Consolidated Statements of Operations, since we act as a principal in the transaction by assuming control of the commodities purchased and the responsibility to deliver the commodities sold. Revenue is recognized when control transfers to the purchaser at the delivery point based on the price received from the purchaser.
Disaggregation of Revenue
The following table summarizes our revenues by product type:
| | | | | | | | | | | | | | | | | | | | | | | | | | | | | |
| | Successor | | | Predecessor |
| | Year Ended
Dec. 31, 2021 | | Period from
Sept. 19, 2020 through
Dec. 31, 2020 | | | Period from
Jan. 1, 2020 through
Sept. 18, 2020 | | Year Ended
Dec. 31, 2019 |
| In thousands | | | | | |
| Oil sales | | $ | 1,148,022 | | | $ | 199,769 | | | | $ | 489,251 | | | $ | 1,205,083 | |
| Natural gas sales | | 11,933 | | | 1,339 | | | | 2,850 | | | 6,937 | |
CO2 sales and transportation fees | | 44,175 | | | 9,419 | | | | 21,049 | | | 34,142 | |
| Oil marketing revenues | | 38,742 | | | 5,376 | | | | 8,543 | | | 14,198 | |
| Total revenues | | $ | 1,242,872 | | | $ | 215,903 | | | | $ | 521,693 | | | $ | 1,260,360 | |
Note 5. Leases
We evaluate contracts for leasing arrangements at inception. We lease office space, equipment, and vehicles that have non-cancelable lease terms. Currently, our outstanding leases have remaining terms up to 14 years, with certain land leases having
Denbury Inc.
Notes to Consolidated Financial Statements
remaining terms up to 48 years. Leases with a term of 12 months or less are not recorded on our balance sheet. The table below reflects our operating lease right-of-use assets and operating lease liabilities, which primarily consist of our office leases:
| | | | | | | | | | | | | | |
| | Successor |
| In thousands | | December 31, 2021 | | December 31, 2020 |
| Operating leases | | | | |
| Operating lease right-of-use assets | | $ | 19,502 | | | $ | 20,342 | |
| | | | |
| Operating lease liabilities – current | | $ | 4,677 | | | $ | 1,350 | |
| Operating lease liabilities – long-term | | 17,094 | | | 19,460 | |
| Total operating lease liabilities | | $ | 21,771 | | | $ | 20,810 | |
| | | | |
| | | | |
| | | | |
| | | | |
| | | | |
| | | | |
| | | | |
| | | | |
The majority of our leases contain renewal options, typically exercisable at our sole discretion. At emergence, we recorded right-of-use assets and liabilities based on the fair value of lease payments and utilized our incremental borrowing rate based on information available at the Emergence Date. The following weighted average remaining lease terms and discount rates related to our outstanding operating leases:
| | | | | | | | | | | | | | |
| | Successor |
| | December 31, 2021 | | December 31, 2020 |
| Weighted average remaining lease term | | 5.2 years | | 6.3 years |
| Weighted average discount rate | | 5.4 | % | | 5.6 | % |
We account for lease and nonlease components in a contract as a single lease component for all asset classes. Lease costs for operating leases or leases with a term of 12 months or less are recognized on a straight-line basis over the lease term. For finance leases, interest on the lease liability and the amortization of the right-of-use asset are recognized separately, with the depreciable life reflective of the expected lease term. Variable lease costs represent additional payments in excess of our minimum base rental payments under our office space leases. The Predecessor Company previously subleased part of the office space included in its operating leases for which it received rental payments. Since those office space leases were terminated during the Chapter 11 Restructuring, the underlying sublease agreements were also terminated. The Successor
Denbury Inc.
Notes to Consolidated Financial Statements
Company subsequently entered into an operating lease for a new corporate office space which commenced in October 2020. The following table summarizes the components of lease costs and sublease income:
| | | | | | | | | | | | | | | | | | | | | | | | | | | | | | | | | | | |
| | | | Successor | | | Predecessor |
| | | | Year Ended
Dec. 31, 2021 | | Period from Sept. 19, 2020 through
Dec. 31, 2020 | | | Period from Jan. 1, 2020 through
Sept. 18, 2020 | | Year Ended
Dec. 31, 2019 |
| In thousands | | Income Statement | | | | | |
| Operating lease cost | | General and administrative expenses | | $ | 4,102 | | | $ | 872 | | | | $ | 5,683 | | | $ | 8,924 | |
| | Lease operating expenses | | 655 | | | 158 | | | | 214 | | | 58 | |
| | CO2 operating and discovery expenses | | 50 | | | 14 | | | | 37 | | | 5 | |
| | | | $ | 4,807 | | | $ | 1,044 | | | | $ | 5,934 | | | $ | 8,987 | |
| Finance lease cost | | | | | | | | | | | |
| Amortization of right-of-use assets | | Depletion, depreciation, and amortization | | $ | — | | | $ | 3 | | | | $ | 9 | | | $ | 1,188 | |
| Interest on lease liabilities | | Interest expense | | — | | | 1 | | | | 3 | | | 40 | |
| Total finance lease cost | | | | $ | — | | | $ | 4 | | | | $ | 12 | | | $ | 1,228 | |
| | | | | | | | | | | |
| Variable lease cost | | | | $ | 670 | | | $ | 258 | | | | $ | 3,688 | | | $ | 4,852 | |
| | | | | | | | | | | |
| Sublease income | | General and administrative expenses | | $ | — | | | $ | 100 | | | | $ | 2,584 | | | $ | 4,127 | |
Our statement of cash flows included the following activity related to our operating and finance leases:
| | | | | | | | | | | | | | | | | | | | | | | | | | | | | |
| | Successor | | | Predecessor |
| | Year Ended
Dec. 31, 2021 | | Period from Sept. 19, 2020 through
Dec. 31, 2020 | | | Period from Jan. 1, 2020 through
Sept. 18, 2020 | | Year Ended
Dec. 31, 2019 |
| In thousands | | | | | |
| Cash paid for amounts included in the measurement of lease liabilities | | | | | | | | | |
| Operating cash flows from operating leases | | $ | 2,830 | | | $ | 341 | | | | $ | 7,341 | | | $ | 10,995 | |
| Operating cash flows from interest on finance leases | | — | | | 1 | | | | 3 | | | 40 | |
| Financing cash flows from finance leases | | — | | | 78 | | | | 10 | | | 1,275 | |
| | | | | | | | | |
| Right-of-use assets obtained in exchange for lease obligations | | | | | | | | | |
| Operating leases | | 2,683 | | | 19,902 | | | | 1,049 | | | 415 | |
| Finance leases | | — | | | — | | | | 162 | | | — | |
Denbury Inc.
Notes to Consolidated Financial Statements
The following table summarizes by year the maturities of our lease liabilities as of December 31, 2021:
| | | | | | | | | | |
| | Operating | | |
| In thousands | | Leases | | |
| 2022 | | $ | 5,705 | | | |
| 2023 | | 4,712 | | | |
| 2024 | | 4,138 | | | |
| 2025 | | 4,177 | | | |
| 2026 | | 4,203 | | | |
| Thereafter | | 2,326 | | | |
| Total minimum lease payments | | 25,261 | | | |
| Less: Amount representing interest | | (3,490) | | | |
| Present value of minimum lease liabilities | | $ | 21,771 | | | |
Note 6. Asset Retirement Obligations
The following table summarizes the changes in our asset retirement obligations:
| | | | | | | | | | | | | | | | | | | | | | | |
| | Successor | | | Predecessor |
| | | Year Ended
Dec. 31, 2021 | | Period from Sept. 19, 2020 through
Dec. 31, 2020 | | | Period from Jan. 1, 2020 through
Sept. 18, 2020 |
| In thousands | | | | |
| Beginning asset retirement obligations | | $ | 186,281 | | | $ | 163,368 | | | | $ | 181,760 | |
| Liabilities incurred and assumed during period | | 43,701 | | | 738 | | | | 736 | |
| Revisions in estimated retirement obligations | | 69,059 | | | 22,660 | | | | 3,592 | |
| Liabilities settled and sold during period | | (10,783) | | | (3,439) | | | | (10,041) | |
| Accretion expense | | 14,353 | | | 2,954 | | | | 11,329 | |
| Fresh start accounting adjustment | | — | | | — | | | | (24,008) | |
| Ending asset retirement obligations | | 302,611 | | | 186,281 | | | | 163,368 | |
Less: current asset retirement obligations(1) | | (18,373) | | | (6,943) | | | | (4,930) | |
| Long-term asset retirement obligations | | $ | 284,238 | | | $ | 179,338 | | | | $ | 158,438 | |
(1)Included in “Accounts payable and accrued liabilities” in our Consolidated Balance Sheets.
Liabilities assumed relate to our March 2021 acquisition of Wyoming property interests (see Note 3, Acquisition and Divestitures), with liabilities incurred generally relating to wells and facilities. Revisions during 2021 primarily related to increased well abandonment cost estimates at certain of these fields and an acceleration in the estimated timing of certain future abandonment activities.
We have escrow accounts that are legally restricted for certain of our asset retirement obligations. The balances of these escrow accounts were $55.6 million and $55.2 million as of December 31, 2021 and 2020, respectively. These balances are primarily invested in U.S. Treasury bonds, recorded at amortized cost, and money market accounts, which investments are included in “Other assets” in our Consolidated Balance Sheets. A portion of these investments are included in cash, cash equivalents, and restricted cash balances on our Consolidated Statements of Cash Flows (see Note 1, Nature of Operations and Summary of Significant Accounting Policies – Cash, Cash Equivalents, and Restricted Cash). The carrying values of these investments approximate their estimated fair market value as of December 31, 2021 and 2020.
Denbury Inc.
Notes to Consolidated Financial Statements
Note 7. Unevaluated Property
A summary of the unevaluated property costs excluded from oil and natural gas properties being amortized at December 31, 2021, and the year in which the costs were incurred follows:
| | | | | | | | | | | | | | | | | | | | | | | | | | |
| | | December 31, 2021 |
| | | Costs Incurred During: | | |
| In thousands | | 2021 | | Successor 2020 | | Fresh Start Adjustments (Sept. 18, 2020)(1) | | Total |
| Property acquisition costs | | $ | — | | | $ | — | | | $ | 68,103 | | | $ | 68,103 | |
| Exploration and development | | 39,481 | | | 46 | | | — | | | 39,527 | |
| Capitalized interest | | 3,576 | | | 963 | | | — | | | 4,539 | |
| Total | | $ | 43,057 | | | $ | 1,009 | | | $ | 68,103 | | | $ | 112,169 | |
(1)Reflects the carrying values of our unevaluated properties as a result of the application of fresh start accounting upon emergence from bankruptcy (see Note 2, Fresh Start Accounting, for additional information) that remain in unevaluated properties as of December 31, 2021.
Our property acquisition costs reflected in the table above relate to fair values assigned during fresh start accounting and are primarily associated with our Cedar Creek Anticline fields and CO2 tertiary potential at Tinsley and Salt Creek fields. Exploration and development costs shown as unevaluated properties are primarily associated with our tertiary oil field projects at Cedar Creek Anticline that are under development but did not have associated proved reserves at December 31, 2021.
Costs are transferred into the amortization base on an ongoing basis as projects are evaluated and proved reserves established or impairment determined. We review the excluded properties for impairment at least annually. We currently estimate that evaluation of the majority of these properties and the inclusion of their costs in the amortization base is expected to be completed within five to ten years. Until we are able to determine whether there are any proved reserves attributable to the above costs, we are not able to assess the future impact on the amortization rate of the full cost pool.
Note 8. Long-Term Debt
The table below reflects long-term debt outstanding as of December 31, 2021 and 2020:
| | | | | | | | | | | | | | |
| | | Successor |
| In thousands | | December 31, 2021 | | December 31, 2020 |
| Senior Secured Bank Credit Agreement | | $ | 35,000 | | | $ | 70,000 | |
| Pipeline financings | | — | | | 68,008 | |
| Total debt principal balance | | 35,000 | | | 138,008 | |
| Less: current maturities of long-term debt | | — | | | (68,008) | |
| Long-term debt | | $ | 35,000 | | | $ | 70,000 | |
The ultimate parent company in our corporate structure, Denbury Inc., is the sole issuer of all our outstanding obligations under our Successor Bank Credit Agreement. Denbury Inc. has no independent assets or operations. Each of the subsidiary guarantors of such obligations is 100% owned, directly or indirectly, by Denbury Inc, and the guarantees of such obligations are full and unconditional and joint and several.
Prior to our emergence from bankruptcy, our debt consisted of the Predecessor’s Bank Credit Agreement, senior secured second lien notes, convertible senior notes, senior subordinated notes, pipeline financings, and capital lease obligations. On the Emergence Date, pursuant to the terms of the Plan, all outstanding obligations under the senior secured second lien notes, convertible senior notes, and senior subordinated notes were fully extinguished, relieving approximately $2.1 billion of debt by issuing equity and/or warrants in the Successor to the holders of that debt. See Note 1, Nature of Operations and Summary of Significant Accounting Policies – Emergence from Voluntary Reorganization Under Chapter 11 of the Bankruptcy Code, for additional information.
Denbury Inc.
Notes to Consolidated Financial Statements
Senior Secured Bank Credit Facility
In connection with our emergence from Chapter 11 proceedings on September 18, 2020, we entered into a new credit agreement with JPMorgan Chase Bank, N.A., as administrative agent, and other lenders party thereto. The Successor Bank Credit Agreement is a senior secured revolving credit facility with an initial borrowing base and lender commitments of $575 million. Additionally, under the Successor Bank Credit Agreement, letters of credit are available in an aggregate amount not to exceed $100 million, and short-term swingline loans are available in an aggregate amount not to exceed $25 million, each subject to the available commitments under the Successor Bank Credit Agreement. Availability under the Successor Bank Credit Agreement is subject to a borrowing base, which is redetermined semiannually on or around May 1 and November 1 of each year, with our next scheduled redetermination around May 1, 2022. The borrowing base is adjusted at the lenders’ discretion and is based, in part, upon external factors over which we have no control. The borrowing base is subject to a reduction by twenty-five percent (25%) of the principal amount of any unsecured or subordinated debt issued or incurred. The borrowing base may also be reduced if we sell borrowing base properties and/or cancel commodity derivative positions with an aggregate value in excess of 5% of the then-effective borrowing base between redeterminations. If our outstanding debt under the Successor Bank Credit Agreement exceeds the then-effective borrowing base, we would be required to repay the excess amount over a period not to exceed six months. The Successor Bank Credit Agreement matures on January 30, 2024.
The Successor Bank Credit Agreement limits our ability to pay dividends on our common stock or make other restricted payments in an amount not to exceed Distributable Free Cash Flow (as defined in the Successor Bank Credit Agreement), but only if (1) no event of default or borrowing base deficiency exists; (2) our total leverage ratio is 2 to 1 or lower; and (3) availability under the Successor Bank Credit Agreement is at least 20%. The Successor Bank Credit Agreement also limits our ability to, among other things, incur and repay other indebtedness; grant liens; engage in certain mergers, consolidations, liquidations and dissolutions; engage in sales of assets; make acquisitions and investments; make other restricted payments (including redeeming, repurchasing or retiring our common stock); and enter into commodity derivative agreements, in each case subject to customary exceptions.
The Successor Bank Credit Agreement is secured by (1) our proved oil and natural gas properties, which are held through our restricted subsidiaries; (2) the pledge of equity interests of such subsidiaries; (3) a pledge of our commodity derivative agreements; (4) a pledge of deposit accounts, securities accounts and commodity accounts of Denbury Inc. and such subsidiaries (as applicable); and (5) a security interest in substantially all other collateral that may be perfected by a Uniform Commercial Code filing, subject to certain exceptions.
The Successor Bank Credit Agreement contains certain financial performance covenants including the following:
•A Consolidated Total Debt to Consolidated EBITDAX covenant, with such ratio not to exceed 3.5 times; and
•A requirement to maintain a current ratio (i.e., Consolidated Current Assets to Consolidated Current Liabilities) of 1.0.
For purposes of computing the current ratio per the Successor Bank Credit Agreement, Consolidated Current Assets exclude the current portion of derivative assets but include available borrowing capacity under the Successor Bank Credit Agreement, and Consolidated Current Liabilities exclude the current portion of derivative liabilities as well as the current portions of long-term indebtedness outstanding.
Loans under the Successor Bank Credit Agreement are subject to varying rates of interest based on either (1) for alternate base rate loans, a base rate determined under the Successor Bank Credit Agreement plus an applicable margin ranging from 2% to 3% per annum, or (b) for LIBOR Loans, the LIBOR rate (subject to a 1% floor) plus an applicable margin ranging from 3% to 4% per annum (capitalized terms as defined in the Successor Bank Credit Agreement). The weighted average interest rate on borrowings outstanding as of December 31, 2021 under the Successor Bank Credit Agreement was 4.0%. The undrawn portion of the aggregate lender commitments under the Successor Bank Credit Agreement is subject to a commitment fee of 0.5%. As of December 31, 2021, we were in compliance with all debt covenants under the Successor Bank Credit Agreement.
The above description of our Successor Bank Credit Agreement and defined terms are contained in the Successor Bank Credit Agreement.
Denbury Inc.
Notes to Consolidated Financial Statements
Restructuring of Pipeline Financing Transactions
In May 2008, we closed two transactions with Genesis Energy, L.P. (“Genesis”) involving two of our pipelines. The NEJD pipeline system included a 20-year secured financing lease, and the Free State Pipeline included a long-term transportation service agreement. In late October 2020, we restructured our CO2 pipeline financing arrangements with Genesis, whereby (1) Denbury reacquired the NEJD pipeline system from Genesis in exchange for $70 million which was paid in four equal payments during 2021, representing full settlement of all remaining obligations under the NEJD secured financing lease; and (2) Denbury reacquired the Free State Pipeline from Genesis in exchange for a one-time payment of $22.5 million on October 30, 2020.
Predecessor Senior Secured Bank Credit Facility
From December 2014 through September 18, 2020, the Company maintained a senior secured revolving credit facility with JPMorgan Chase Bank, N.A., as administrative agent, and other lenders party thereto (the “Predecessor Bank Credit Agreement”). All but a minor portion of the Predecessor Bank Credit Agreement was refinanced through the DIP Facility from August 4, 2020 through September 18, 2020, which was in turn refinanced by the Successor Bank Credit Agreement upon emergence from the Chapter 11 Restructuring.
Extinguishment of Predecessor Senior Secured Second Lien Notes, Convertible Senior Notes, and Senior Subordinated Notes
Upon emergence from the Chapter 11 Restructuring on September 18, 2020, the Predecessor’s 9% Senior Secured Second Lien Notes due 2021 (the “2021 Notes”), 9¼% Senior Secured Second Lien Notes due 2022, 7¾% Senior Secured Second Lien Notes due 2024, 7½% Senior Secured Second Lien Notes due 2024, 6⅜% Convertible Senior Notes due 2024 (the “2024 Convertible Notes”), 6⅜% Senior Subordinated Notes due 2021, 5½% Senior Subordinated Notes due 2022, and 4⅝% Senior Subordinated Notes due 2023 were fully extinguished by issuing equity and/or warrants in the Successor to the holders of that debt. The Predecessor debt discussions that follow are included to provide context on the impact of these transactions on the Predecessor’s financial statements.
Second Quarter 2020 Conversion of 2024 Convertible Notes
During the second quarter of 2020, holders of $19.9 million aggregate principal amount outstanding of the Predecessor’s 2024 Convertible Notes converted their notes into shares of the Predecessor’s common stock, at the rates specified in the indenture for the notes, resulting in the issuance of 7.4 million shares of Predecessor common stock upon conversion. The debt principal balance, net of debt discounts, totaling $13.9 million, was reclassified to “Paid-in capital in excess of par” and “Common stock” in the Consolidated Balance Sheet of the Predecessor upon the conversion of the notes into shares of Predecessor common stock.
First Quarter 2020 Repurchases of Senior Secured Notes
During March 2020, the Predecessor repurchased a total of $30.2 million aggregate principal amount of its 2021 Notes in open-market transactions for a total purchase price of $14.2 million, excluding accrued interest. In connection with these transactions, the Predecessor recognized a $19.0 million gain on debt extinguishment, net of unamortized debt issuance costs and future interest payable written off.
2019 Predecessor Debt Reduction Transactions
With a focus on reducing the amount of outstanding debt principal, the Predecessor engaged in a series of debt exchanges and repurchase transactions, resulting in total gains on extinguishments of $156.0 million for the year ended December 31, 2019, in its Consolidated Statements of Operations.
Debt Issuance Costs
In connection with the issuance of our outstanding long-term debt, we have incurred debt issuance costs, which are being amortized to interest expense using the straight line or effective interest method over the term of each related facility or
Denbury Inc.
Notes to Consolidated Financial Statements
borrowing. Remaining unamortized debt issuance costs were $5.7 million and $8.4 million at December 31, 2021 and 2020, respectively. Issuance costs associated with our Successor Bank Credit Agreement are included in “Other assets” in the Consolidated Balance Sheets.
Indebtedness Repayment Schedule
At December 31, 2021, our indebtedness is payable over the next five years and thereafter as follows:
| | | | | | | | |
| In thousands | | |
| 2022 | | $ | — | |
| 2023 | | — | |
| 2024 | | 35,000 | |
| 2025 | | — | |
| 2026 | | — | |
| Thereafter | | — | |
| Total indebtedness | | $ | 35,000 | |
Note 9. Income Taxes
Our income tax provision (benefit) is as follows:
| | | | | | | | | | | | | | | | | | | | | | | | | | | | | |
| | Successor | | | Predecessor |
| | | Year Ended
Dec. 31, 2021 | | Period from Sept. 19, 2020 through
Dec. 31, 2020 | | | Period from Jan. 1, 2020 through
Sept. 18, 2020 | | Year Ended
Dec. 31, 2019 |
| In thousands | | | | | |
| Current income tax expense (benefit) | | | | | | | | | |
| Federal | | $ | — | | | $ | — | | | | $ | (6,407) | | | $ | 2,645 | |
| State | | 403 | | | 30 | | | | (853) | | | 1,236 | |
| Total current income tax expense (benefit) | | 403 | | | 30 | | | | (7,260) | | | 3,881 | |
| | | | | | | | | |
| Deferred income tax expense (benefit) | | | | | | | | | |
| Federal | | — | | | — | | | | (319,011) | | | 89,950 | |
| State | | 364 | | | (2,556) | | | | (89,858) | | | 10,521 | |
| Total deferred income tax expense (benefit) | | 364 | | | (2,556) | | | | (408,869) | | | 100,471 | |
| Total income tax expense (benefit) | | $ | 767 | | | $ | (2,526) | | | | $ | (416,129) | | | $ | 104,352 | |
At December 31, 2021, we had federal net operating loss carryforwards (“NOLs”) and business credit carryforwards (before provision for valuation allowance) totaling $10.3 million and $18.1 million, respectively. Our federal NOLs may be carried forward indefinitely and our credit carryforwards begin to expire in 2041. NOL, enhanced oil recovery credit and research and development credit carryforwards generated prior to January 1, 2021 were fully reduced in accordance with the attribute reduction and ordering rules of Section 108 of the Internal Revenue Code of 1986 pertaining to discharge of indebtedness. At December 31, 2021, we had $0.6 million of alternative minimum tax credits, which under the Tax Cut and Jobs Act passed in 2017 will be fully refundable by 2022, and are recorded as a receivable on the balance sheet, and state NOLs and tax credits totaling $54.9 million (before provision for valuation allowance) related to all our state operations, which continue as carryforwards for the Successor. Our state NOLs expire in various years, starting in 2025.
Deferred income taxes reflect the available tax carryforwards and the temporary differences based on tax laws and statutory rates in effect at the December 31, 2021 and 2020 balance sheet dates. As of December 31, 2021, we had $74.1 million of net state deferred tax assets associated with operations in Louisiana, Mississippi, Montana, North Dakota and Alabama, which were
Denbury Inc.
Notes to Consolidated Financial Statements
fully offset with valuation allowances. The valuation allowances will remain until the realization of future deferred tax benefits are more likely than not to become utilized. The changes in our valuation allowance are detailed below:
| | | | | | | | | | | | | | | | | | | | | | | | | | | | | |
| | Successor | | | Predecessor |
| | Year Ended
Dec. 31, 2021 | | Period from Sept. 19, 2020 through
Dec. 31, 2020 | | | Period from Jan. 1, 2020 through
Sept. 18, 2020 | | Year Ended
Dec. 31, 2019 |
| In thousands | | | | | |
| Beginning balance | | $ | 129,408 | | | $ | 129,840 | | | | $ | 77,215 | | | $ | 51,093 | |
| Charges | | 29,345 | | | 2,269 | | | | 77,138 | | | 26,122 | |
| Deductions | | (33,291) | | | (2,701) | | | | (24,513) | | | — | |
| Ending balance | | $ | 125,462 | | | $ | 129,408 | | | | $ | 129,840 | | | $ | 77,215 | |
| | | | | | | | | |
| | | | | | | | | |
| | | |
| | | | | | | | | |
| | | | | | | | | |
| | | | | | | | | |
| | | | | | | | | |
| | | | | | | | | |
| | | | | | | | | |
| | | |
| | | | | | | | | |
| | | | | | | | | |
| | | | | | | | | |
| | | | | | | | | |
| | | | | | | | | |
| | | |
| | | | | | | | | |
| | | | | | | | | |
| | | | | | | | | |
| | | | | | | | | |
| | | | | | | | | |
As of December 31, 2021, we had no unrecognized tax benefits recorded related to an uncertain tax position.
Significant components of our deferred tax assets and liabilities as of December 31, 2021 and 2020 are as follows:
| | | | | | | | | | | | | | |
| | | Successor |
| In thousands | | December 31, 2021 | | December 31, 2020 |
| Deferred tax assets | | | | |
| Loss and tax credit carryforwards – state | | $ | 54,943 | | | $ | 55,979 | |
| Derivative contracts | | 30,892 | | | 13,090 | |
| Accrued liabilities and other reserves | | 19,567 | | | 15,632 | |
| Business credit carryforwards | | 18,066 | | | — | |
| Loss carryforwards – federal | | 10,310 | | | — | |
| Lease liabilities | | 4,523 | | | 6,354 | |
| Property and equipment | | 2,613 | | | 59,207 | |
| Other | | 4,206 | | | 4,092 | |
| Valuation allowances | | (125,462) | | | (129,408) | |
| Total deferred tax assets | | 19,658 | | | 24,946 | |
| | | | |
| Deferred tax liabilities | | | | |
CO2 and other contracts | | (17,208) | | | (20,030) | |
| Operating lease right-of-use assets | | (4,088) | | | (6,190) | |
| Total deferred tax liabilities | | (21,296) | | | (26,220) | |
| Total net deferred tax liability | | $ | (1,638) | | | $ | (1,274) | |
Denbury Inc.
Notes to Consolidated Financial Statements
Our reconciliation of income tax expense computed by applying the U.S. federal statutory rate and the reported effective tax rate on income from continuing operations is as follows:
| | | | | | | | | | | | | | | | | | | | | | | | | | | | | |
| | Successor | | | Predecessor |
| | | Year Ended
Dec. 31, 2021 | | Period from Sept. 19, 2020 through
Dec. 31, 2020 | | | Period from Jan. 1, 2020 through
Sept. 18, 2020 | | Year Ended
Dec. 31, 2019 |
| In thousands | | | | | |
| Income tax provision calculated using the federal statutory income tax rate | | $ | 11,921 | | | $ | (11,169) | | | | $ | (388,228) | | | $ | 67,475 | |
| State income taxes, net of federal income tax benefit | | 450 | | | (2,532) | | | | (86,937) | | | 7,435 | |
| Tax shortfall (windfall) on stock-based compensation deduction | | (267) | | | — | | | | (1,502) | | | 1,912 | |
| Nondeductible compensation | | 5,057 | | | — | | | | — | | | — | |
| Change in valuation allowance | | (2,928) | | | 9,653 | | | | 19,344 | | | 26,122 | |
| Enhanced oil recovery credits generated | | (14,272) | | | — | | | | — | | | — | |
| Tax attributes reduction – net of CODI exclusion | | — | | | — | | | | 31,667 | | | — | |
| Other | | 806 | | | 1,522 | | | | 9,527 | | | 1,408 | |
| Total income tax expense (benefit) | | $ | 767 | | | $ | (2,526) | | | | $ | (416,129) | | | $ | 104,352 | |
We file consolidated and separate income tax returns in the U.S. federal jurisdiction and in many state jurisdictions. The statutes of limitation for our income tax returns for tax years ending prior to 2018 have lapsed and therefore are not subject to examination by respective taxing authorities. We have not paid any significant interest or penalties associated with our income taxes.
Note 10. Stockholders’ Equity
Registration Rights Agreement
On September 18, 2020, in connection with the Company’s emergence from Chapter 11 proceedings, the Company entered into a registration rights agreement (the “Registration Rights Agreement”) with certain former beneficial holders of second lien notes of the Predecessor that entered into the restructuring support agreement leading to the restructuring of the Company pursuant to a prepackaged plan of reorganization and pursuant to which the Company included these holders’ shares of common stock of the Successor in an automatically effective resale registration statement filed with the SEC in April 2021 for their use in connection with resale of these shares. Under the Registration Rights Agreement, these security holders have customary demand and piggyback registration rights, subject to the limitations set forth in the Registration Rights Agreement. These registration rights are subject to certain conditions and limitations, including the right of the underwriters to limit the number of shares to be included in an offering and the Company’s right to delay or withdraw a registration statement under certain circumstances.
401(k) Plan
We offer a 401(k) plan to which employees may contribute earnings subject to IRS limitations. We match 100% of an employee’s contribution, up to 6% of compensation, as defined by the plan, which is vested immediately. Matching contributions to the 401(k) plan totaled $5.1 million during 2021 (Successor), $1.1 million for the period September 19, 2020 through December 31, 2020 (Successor), $4.4 million for the period January 1, 2020 through September 18, 2020 (Predecessor), and $6.3 million during 2019 (Predecessor).
Note 11. Stock Compensation
Below is a description of stock compensation relating to both the Predecessor periods (2019 and January 1, 2020 through September 18, 2020), and the Successor periods (September 19, 2020 through December 31, 2020 and 2021). All stock compensation plans and awards in effect during the Predecessor periods were cancelled upon emergence of the Company from its Chapter 11 Restructuring on September 18, 2020. The plans and awards described below which are designated as Successor
Denbury Inc.
Notes to Consolidated Financial Statements
plans or awards are the only such plans and awards in effect as of December 31, 2021. Each of the plans and awards described below are designated as either Predecessor or Successor, with the exception of the section labeled “Stock-Based Compensation – Predecessor and Successor” which pertains to both Predecessor and Successor periods.
Stock-based Compensation – Predecessor and Successor
Stock-based compensation expense is included in “General and administrative expenses” in the Consolidated Statements of Operations. Stock-based compensation associated with our employees involved in exploration and drilling activities is capitalized as part of “Oil and natural gas properties” in the Consolidated Balance Sheets. Our accounting policy is to account for forfeitures as they occur.
The following table sets forth stock-based compensation costs for the periods indicated:
| | | | | | | | | | | | | | | | | | | | | | | | | | | | | |
| | Successor | | | Predecessor |
| | | Year Ended
Dec. 31, 2021 | | Period from Sept. 19, 2020 through
Dec. 31, 2020 | | | Period from Jan. 1, 2020 through
Sept. 18, 2020 | | Year Ended
Dec. 31, 2019 |
| In thousands | | | | | |
| Stock-based compensation expense included in G&A | | $ | 25,322 | | | $ | 8,212 | | | | $ | 4,111 | | | $ | 12,470 | |
| Stock-based compensation capitalized | | 1,883 | | | 695 | | | | 1,660 | | | 4,018 | |
| Total cost of stock-based compensation arrangements | | $ | 27,205 | | | $ | 8,907 | | | | $ | 5,771 | | | $ | 16,488 | |
| | | | | | | | | |
| Income tax benefit recognized for stock-based compensation arrangements | | $ | 6,331 | | | $ | 2,053 | | | | $ | 1,028 | | | $ | 3,118 | |
Management Incentive Plan – Successor
In connection with our emergence from bankruptcy, the Plan provided for the adoption of a management incentive plan, the Denbury Inc. 2020 Omnibus Stock and Incentive Plan (the “LTIP”), effective as of the Emergence Date, through an amendment and restatement of the Denbury Resources Inc. Amended and Restated 2004 Omnibus Stock and Incentive Plan, as amended and restated as of March 26, 2020. The LTIP reserved 6.2 million shares of Denbury’s common stock for awards to officers, other employees, directors and other service providers. The LTIP provides for, among other things, the grant of incentive stock options, nonstatutory stock options, restricted stock, restricted stock units, stock appreciation rights, dividend equivalents, other stock-based awards, cash awards, or any combination of the foregoing. On December 2, 2020, Denbury’s board of directors approved and ratified the LTIP, with initial awards covering 2.2 million shares of common stock granted on December 4, 2020. As of December 31, 2021, 3.9 million shares were available for future grants under the LTIP, all of which could be issued in the form of restricted stock units or performance stock units. Our incentive compensation program is administered by the Compensation Committee of our Board of Directors. The LTIP will expire September 2030.
Restricted Stock Units – Successor
In December 2020, non-performance-based restricted stock unit (“RSU”) awards were granted to directors and a limited number of employees under the Successor’s LTIP. Holders of non-performance-based RSUs will receive shares of Successor common stock equal to the number of RSUs that have vested upon settlement. Non-performance-based RSUs generally vest ratably over a three-year period with delivery of the shares occurring at the end of the three-year period. Vested non-performance-based RSU awards provide the holders with dividend equivalent rights payable upon settlement of the underlying RSU awards. Shares to be delivered to participants are expected to be made available from authorized but unissued shares reserved under the LTIP. The grant-date fair value of the RSUs is based on the fair market value of our common stock on the date of grant.
As of December 31, 2021, there was $19.9 million of unrecognized compensation expense related to the Successor’s nonvested non-performance-based restricted stock unit grants. This unrecognized compensation cost is expected to be
Denbury Inc.
Notes to Consolidated Financial Statements
recognized over a weighted-average period of 1.9 years. The following is a summary of the total vesting date fair value of non-performance-based restricted stock units:
| | | | | | | | |
| | Year Ended
Dec. 31, 2021 |
In thousands | |
Fair value of restricted stock units vested | | $ | 31,073 | |
A summary of the status of our nonvested non-performance-based RSUs issued and the changes during the Successor period is presented below:
| | | | | | | | | | | | | | |
| | Number
of Awards | | Weighted
Average
Grant-Date
Fair Value |
| Nonvested at December 31, 2020 | | 1,219,867 | | | $ | 24.67 | |
| Granted | | 56,236 | | | 31.87 | |
| Vested | | (405,311) | | | 24.80 | |
| Forfeited | | (20,885) | | | 24.67 | |
| Nonvested at December 31, 2021 | | 849,907 | | | 25.08 | |
Performance-Based Stock Units – Successor
In December 2020, the Successor Board of Directors granted performance stock unit (“PSU”) awards to a limited number of employees. The PSU awards had vesting parameters tied to the Company’s common stock trading prices and became fully vested on March 3, 2021. Although the performance measures for vesting of these awards have been achieved, delivery of the shares will not occur until the conclusion of the three-year performance period, December 4, 2023. Vested performance-based PSU awards provide the holders with dividend equivalent rights payable upon settlement of the underlying PSU awards. Shares to be delivered to participants are expected to be made available from authorized but unissued shares reserved under the LTIP.
PSU awards are valued using a Monte Carlo simulation. Expected volatilities utilized in the model were estimated using historical volatility of the Predecessor stock over a look-back term generally equivalent to the expected life of the award from the grant date.
As of December 31, 2021, there was no remaining unrecognized compensation expense related to the Successor’s PSU awards. The range of assumptions used in the Monte Carlo simulation valuation approach is as follows:
| | | | | | | | |
| | Successor |
| | Period from Sept. 19, 2020 through
Dec. 31, 2020 |
| | |
| Weighted average fair value of PSU awards granted | | $ | 24.19 | |
| Risk-free interest rate | | 0.21 | % |
| Expected life | | 0.23 years |
| Expected volatility | | 110.0 | % |
| Dividend yield | | — | % |
Denbury Inc.
Notes to Consolidated Financial Statements
A summary of the PSU awards activity during the Successor period is as follows:
| | | | | | | | | | | | | | |
| | Number
of Awards | | Weighted
Average
Grant-Date Fair Value |
| Nonvested at December 31, 2020 | | 1,021,222 | | | $ | 24.19 | |
| Granted | | — | | | — | |
| Vested | | (1,021,222) | | | 24.19 | |
| Forfeited | | — | | | — | |
| Nonvested at December 31, 2021 | | — | | | — | |
The following is a summary of the total vesting date fair value of PSU awards:
| | | | | | | | |
| | Year Ended
Dec. 31, 2021 |
In thousands | |
Vesting date fair value of PSU awards | | $ | 45,077 | |
June 2020 Compensation Adjustments – Predecessor
In response to the then ongoing significant economic and market uncertainty affecting the oil and gas industry, in June 2020 the Predecessor and its Board of Directors and Compensation Committee implemented a revised compensation structure under which for 21 of the Company’s executives (including our named executive officers) and senior managers, all outstanding equity awards and 2020 targeted variable cash-based compensation were canceled and replaced with a cash retention incentive. In total, $15.2 million in cash retention incentives were prepaid to those employees in June 2020, with an obligation of the executives to repay up to 100% of the compensation (on an after-tax basis) if specified conditions were not satisfied. The Predecessor’s named executive officers’ cash retention incentives were earned 50% based on their continued employment for a period of up to 12 months and 50% based on achieving certain specified incentive metrics.
In accordance with FASC Topic 718, Compensation – Stock Compensation, we accounted for the transaction involving equity compensation as an award modification and reclassified the awards from equity to liability awards. As a result of the modification of the awards, unrecognized compensation at the time of modification was determined to be $18.7 million ($4.1 million of incremental compensation expense), which was higher than the $15.2 million cash payment, and was calculated as the greater of (i) grant date fair value of the previously-outstanding awards plus incremental compensation (defined as cash paid related to the cash retention incentive in excess of the modification date fair value of the previously-existing awards) or (ii) cash paid for the cash retention incentive for each award. The value was recognized as total compensation expense for each award over the service period. The compensation expense was recognized in “General and administrative expenses” in the Consolidated Statements of Operations during the period January 1, 2020 through September 18, 2020 (Predecessor). The accounting for the Predecessor’s remaining share-based compensation awards continued throughout the period covered by the Chapter 11 Restructuring, and upon cancellation of the awards, an additional $4.6 million of compensation expense was recognized during the Predecessor period ended September 18, 2020.
2004 Omnibus Stock and Incentive Plan – Predecessor
The Amended and Restated 2004 Omnibus Stock and Incentive Plan, amended and restated as of March 26, 2020 (the “2004 Plan”), was an incentive plan that provided for the issuance of incentive and non-qualified stock options, restricted stock awards, restricted stock units, stock appreciation rights settled in stock, and performance-based awards to officers, employees and directors. Since the 2004 Plan’s inception, awards covering a total of 61.4 million shares of common stock were authorized for issuance pursuant to the 2004 Plan. In connection with our emergence from bankruptcy, all outstanding equity as of September 18, 2020 was cancelled.
Restricted Stock – Predecessor
During the Predecessor period, we granted non-performance-based restricted stock to employees and directors as part of our long-term compensation program. Holders of non-performance-based restricted stock awards had the rights of owning non-restricted stock (including voting rights) except that the holders were not entitled to delivery of a portion thereof until certain
Denbury Inc.
Notes to Consolidated Financial Statements
requirements were met. Beginning in 2014, non-performance-based restricted stock awards provided the holders with forfeitable dividend equivalent rights which vested with the underlying shares. Non-performance-based restricted stock vested over a three-year vesting period, with the specific terms of vesting determined at the time of grant.
The following is a summary of the total vesting date fair value of non-performance-based restricted stock:
| | | | | | | | | | | | | | |
| | Predecessor |
| | Period from Jan. 1, 2020 through
Sept. 18, 2020 | | Year Ended
Dec. 31, 2019 |
| In thousands | | |
| Fair value of restricted stock vested | | $ | 707 | | | $ | 5,743 | |
In connection with our emergence from bankruptcy, all restricted stock outstanding as of September 18, 2020 was cancelled and there was no remaining compensation cost to be recognized in future periods related to nonvested non-performance-based restricted stock arrangements.
Performance-Based Equity Awards – Predecessor
The Predecessor’s Compensation Committee of the Board of Directors annually granted performance-based equity awards to Denbury’s officers. Performance-based awards generally vested over 3.25 years for awards granted in 2019 and 2020. The number of performance-based shares earned (and eligible to vest) during the performance period was dependent upon: (1) the level of success in achieving specifically identified performance targets (“Performance-Based Operational Awards”) and (2) performance of the Predecessor’s stock relative to that of a designated peer group (“Performance-Based TSR Awards”).
Performance-Based Operational Awards were valued using the fair market value of the Predecessor’s stock, and Performance-Based TSR Awards were valued using a Monte Carlo simulation. Expected volatilities utilized in the model were estimated using historical volatility of the Predecessor stock over a look-back term generally equivalent to the expected life of the award from the grant date. The range of assumptions used in the Monte Carlo simulation valuation approach for Performance-Based TSR Awards (presented at the target level) is as follows:
| | | | | | | | | | | | | | |
| | Predecessor |
| | Period from Jan. 1, 2020 through
Sept. 18, 2020 | | Year Ended
Dec. 31, 2019 |
| | | |
| Weighted average fair value of Performance-Based TSR Awards granted | | $ | 0.15 | | | $ | 1.95 | |
| Risk-free interest rate | | 0.27 | % | | 2.27 | % |
| Expected life | | 3.0 years | | 3.0 years |
| Expected volatility | | 89.6 | % | | 77.2 | % |
| Dividend yield | | — | % | | — | % |
The following is a summary of the total vesting date fair value of performance-based equity awards for the Predecessor:
| | | | | | | | | | | | | | | | | |
| | | | | Predecessor |
| | | | | Period from Jan. 1, 2020 through
Sept. 18, 2020 | | Year Ended
Dec. 31, 2019 |
| In thousands | | | | |
| Vesting date fair value of Performance-Based Operational Awards | | | | | $ | — | | | $ | — | |
| Vesting date fair value of Performance-Based TSR Awards | | | | | 79 | | | 2,783 | |
In June 2020, all outstanding performance-based equity awards were cancelled and replaced with a cash retention incentive (see June 2020 Compensation Adjustments – Predecessor); there was no remaining compensation cost as of September 18, 2020 to be recognized in future periods related to performance-based equity awards.
Denbury Inc.
Notes to Consolidated Financial Statements
Note 12. Commodity Derivative Contracts
We do not apply hedge accounting treatment to our oil and natural gas derivative contracts; therefore, the changes in the fair values of these instruments are recognized in income in the period of change. These fair value changes, along with the settlements of expired contracts, are shown under “Commodity derivatives expense (income)” in our Consolidated Statements of Operations.
Historically, we have entered into various oil and natural gas derivative contracts to provide an economic hedge of our exposure to commodity price risk associated with anticipated future oil and natural gas production and to provide more certainty to our future cash flows. We do not hold or issue derivative financial instruments for trading purposes. Generally, these contracts have consisted of various combinations of price floors, collars, three-way collars, fixed-price swaps, fixed-price swaps enhanced with a sold put, and basis swaps. The production that we hedge has varied from year to year depending on our levels of debt, financial strength, expectation of future commodity prices, and occasionally requirements under our bank credit facility. As of December 31, 2020, we were in compliance with the hedging requirements under our Successor Bank Credit Agreement requiring certain minimum commodity hedge levels through July 31, 2022, and we have no further hedging requirements under the Successor Bank Credit Agreement.
We manage and control market and counterparty credit risk through established internal control procedures that are reviewed on an ongoing basis. We attempt to minimize credit risk exposure to counterparties through formal credit policies, monitoring procedures and diversification, and all of our commodity derivative contracts are with parties that are lenders under our Successor Bank Credit Agreement (or affiliates of such lenders). As of December 31, 2021, all of our outstanding derivative contracts were subject to enforceable master netting arrangements whereby payables on those contracts can be offset against receivables from separate derivative contracts with the same counterparty. It is our policy to classify derivative assets and liabilities on a gross basis on our balance sheets, even if the contracts are subject to enforceable master netting arrangements.
The following table summarizes our commodity derivative contracts as of December 31, 2021, none of which are classified as hedging instruments in accordance with the FASC Derivatives and Hedging topic:
| | | | | | | | | | | | | | | | | | | | | | | | | | | | | | | | | | | | | | | | | | | | | | | | | |
| Months | | Index Price | | Volume (Barrels per day) | | Contract Prices ($/Bbl) |
Range(1) | | Weighted Average Price |
| Swap | | | | Floor | | Ceiling |
| Oil Contracts: | | | | | | | | | | | | | | | |
| 2022 Fixed-Price Swaps | | | | | | | | | | | | | | | |
| Jan – Jun | | NYMEX | | 15,500 | | $ | 42.65 | | – | 58.15 | | | $ | 49.01 | | | | | $ | — | | | $ | — | |
| July – Dec | | NYMEX | | 9,000 | | | 50.13 | | – | 60.35 | | | 56.35 | | | | | — | | | — | |
| 2022 Collars | | | | | | | | | | | | | | | |
| Jan – Jun | | NYMEX | | 11,000 | | $ | 47.50 | | – | 70.75 | | | $ | — | | | | | $ | 49.77 | | | $ | 64.31 | |
| July – Dec | | NYMEX | | 10,000 | | | 47.50 | | – | 70.75 | | | — | | | | | 49.75 | | | 64.18 | |
(1)Ranges presented for fixed-price swaps represent the lowest and highest fixed prices of all open contracts for the period presented. For collars, ranges represent the lowest floor price and the highest ceiling price for all open contracts for the period presented.
Note 13. Fair Value Measurements
The FASC Fair Value Measurement topic defines fair value as the price that would be received to sell an asset or paid to transfer a liability in an orderly transaction between market participants at the measurement date (often referred to as the “exit price”). We utilize market data or assumptions that market participants would use in pricing the asset or liability, including assumptions about risk and the risks inherent in the inputs to the valuation technique. These inputs can be readily observable, market corroborated or generally unobservable. We primarily apply the income approach for recurring fair value measurements and endeavor to utilize the best available information. Accordingly, we utilize valuation techniques that maximize the use of
Denbury Inc.
Notes to Consolidated Financial Statements
observable inputs and minimize the use of unobservable inputs. We are able to classify fair value balances based on the observability of those inputs. The FASC establishes a fair value hierarchy that prioritizes the inputs used to measure fair value. The hierarchy gives the highest priority to unadjusted quoted prices in active markets for identical assets or liabilities (Level 1 measurement) and the lowest priority to unobservable inputs (Level 3 measurement). The three levels of the fair value hierarchy are as follows:
•Level 1 – Quoted prices in active markets for identical assets or liabilities as of the reporting date.
•Level 2 – Pricing inputs are other than quoted prices in active markets included in Level 1, which are either directly or indirectly observable as of the reported date. Level 2 includes those financial instruments that are valued using models or other valuation methodologies. Instruments in this category include non-exchange-traded oil derivatives that are based on NYMEX and regional pricing other than NYMEX (e.g., Light Louisiana Sweet). Our costless collars and the sold put features of our three-way collars are valued using the Black-Scholes model, an industry standard option valuation model that takes into account inputs such as contractual prices for the underlying instruments, maturity, quoted forward prices for commodities, interest rates, volatility factors and credit worthiness, as well as other relevant economic measures. Substantially all of these assumptions are observable in the marketplace throughout the full term of the instrument, can be derived from observable data or are supported by observable levels at which transactions are executed in the marketplace.
•Level 3 – Pricing inputs include significant inputs that are generally less observable. These inputs may be used with internally developed methodologies that result in management’s best estimate of fair value.
We adjust the valuations from the valuation model for nonperformance risk, using our estimate of the counterparty’s credit quality for asset positions and our credit quality for liability positions. We use multiple sources of third-party credit data in determining counterparty nonperformance risk, including credit default swaps.
The following table sets forth, by level within the fair value hierarchy, our financial assets and liabilities that were accounted for at fair value on a recurring basis as of December 31, 2021 and 2020:
| | | | | | | | | | | | | | | | | | | | | | | | | | |
| | | Fair Value Measurements Using: |
| | Quoted Prices
in Active
Markets | | Significant
Other
Observable
Inputs | | Significant
Unobservable
Inputs | | |
| In thousands | | (Level 1) | | (Level 2) | | (Level 3) | | Total |
| December 31, 2021 | | | | | | | | |
| | | | | | | | |
| | | | | | | | |
| | | | | | | | |
| | | | | | | | |
| | | | | | | | |
| Liabilities | | | | | | | | |
| Oil derivative contracts – current | | $ | — | | | $ | (134,509) | | | $ | — | | | $ | (134,509) | |
| Oil derivative contracts – long-term | | — | | | — | | | — | | | — | |
| Total Liabilities | | $ | — | | | $ | (134,509) | | | $ | — | | | $ | (134,509) | |
| | | | | | | | |
| December 31, 2020 | | | | | | | | |
| Assets | | | | | | | | |
| Oil derivative contracts – current | | $ | — | | | $ | 187 | | | $ | — | | | $ | 187 | |
| | | | | | | | |
| Total Assets | | $ | — | | | $ | 187 | | | $ | — | | | $ | 187 | |
| | | | | | | | |
| Liabilities | | | | | | | | |
| Oil derivative contracts – current | | $ | — | | | $ | (53,865) | | | $ | — | | | $ | (53,865) | |
| Oil derivative contracts – long-term | | — | | | (5,087) | | | — | | | (5,087) | |
| Total Liabilities | | $ | — | | | $ | (58,952) | | | $ | — | | | $ | (58,952) | |
Denbury Inc.
Notes to Consolidated Financial Statements
Since we do not apply hedge accounting for our commodity derivative contracts, any gains and losses on our assets and liabilities are included in “Commodity derivatives expense (income)” in the accompanying Consolidated Statements of Operations.
Other Fair Value Measurements
The carrying value of our loans under our Successor Bank Credit Agreement approximate fair value, as they are subject to short-term floating interest rates that approximate the rates available to us for those periods. The estimated fair value of the principal amount of our debt as of December 31, 2021 and 2020, excluding pipeline financing obligations, was $35.0 million and $70.0 million, respectively. We have other financial instruments consisting primarily of cash, cash equivalents, U.S. Treasury notes, short-term receivables and payables that approximate fair value due to the nature of the instrument and the relatively short maturities.
Note 14. Commitments and Contingencies
Commitments
We have entered into long-term commitments to purchase CO2 that are either non-cancelable or cancelable only upon the occurrence of specified future events. The commitments continue for up to 7 years. The price we will pay for CO2 generally varies depending on the amount of CO2 delivered and the price of oil. In addition, we have a processing fee contract related to our overriding royalty interest in the CO2 at LaBarge Field. Our annual commitment under these contracts could range from $39 million to $46 million in 2022, assuming a $70 per Bbl NYMEX oil price and declines in future years as the CO2 purchase contract commitments expire.
We are party to long-term contracts that require us to deliver CO2 to our customers who are industrial end-users of CO2 or EOR customers at various contracted prices. Based upon the maximum daily contract quantities as stated in the industrial contracts, total amounts deliverable to these customers could be up to 572 Bcf of CO2 over the next 13 years.
Litigation
We are involved in various lawsuits, claims and regulatory proceedings incidental to our businesses. While we currently believe that the ultimate outcome of these proceedings, individually and in the aggregate, will not have a material adverse effect on our financial position, results of operations or cash flows, litigation is subject to inherent uncertainties. We accrue for losses from litigation and claims if we determine that a loss is probable and the amount can be reasonably estimated.
Other Contingencies
We are subject to audits for various taxes (income, sales and use, and severance) in the various states in which we operate, and from time to time receive assessments for potential taxes that we may owe. In the past, settlement of these matters has not had a material adverse financial impact on us, and currently we have no material assessments for potential taxes.
We are subject to various possible contingencies that arise primarily from interpretation of federal and state laws and regulations affecting the oil and natural gas industry. Such contingencies include differing interpretations as to the prices at which oil and natural gas sales may be made, the prices at which royalty owners may be paid for production from their leases, environmental issues and other matters. Although we believe that we have complied with the various laws and regulations, administrative rulings and interpretations thereof, adjustments could be required as new interpretations and regulations are issued. In addition, production rates, marketing and environmental matters are subject to regulation by various federal and state agencies.
Denbury Inc.
Notes to Consolidated Financial Statements
Note 15. Additional Balance Sheet Details
Rollforward of Allowance for Doubtful Accounts
| | | | | | | | | | | | | | | | | | | | | | | | | | | | | |
| | Successor | | | Predecessor |
| | | Year Ended
Dec. 31, 2021 | | Period from
Sept. 19, 2020 through
Dec. 31, 2020 | | | Period from
Jan. 1, 2020 through
Sept. 18, 2020 | | Year Ended
Dec. 31, 2019 |
| In thousands | | | | | |
| Beginning balance | | $ | 23,206 | | | $ | 22,146 | | | | $ | 17,137 | | | $ | 17,070 | |
| Provision for doubtful accounts | | 826 | | | 1,060 | | | | 5,297 | | | 68 | |
| Write-offs | | (5,085) | | | — | | | | (288) | | | (1) | |
| Ending balance | | $ | 18,947 | | | $ | 23,206 | | | | $ | 22,146 | | | $ | 17,137 | |
Accounts Payable and Accrued Liabilities
| | | | | | | | | | | | | | |
| | Successor |
| In thousands | | December 31, 2021 | | December 31, 2020 |
| Accrued lease operating expenses | | $ | 27,901 | | | $ | 21,294 | |
| Accrued derivative settlements | | 27,336 | | | 3,908 | |
| Accounts payable | | 25,700 | | | 18,629 | |
| Accrued compensation | | 23,735 | | | 7,512 | |
| Accrued exploration and development costs | | 18,936 | | | 1,861 | |
| Accrued asset retirement obligations – current | | 18,373 | | | 6,943 | |
| Taxes payable | | 14,453 | | | 17,221 | |
| Accrued general and administrative expenses | | 2,250 | | | 21,825 | |
| Other | | 32,914 | | | 13,478 | |
| Total | | $ | 191,598 | | | $ | 112,671 | |
Note 16. Supplemental Cash Flow Information
Supplemental Cash Flow Information
| | | | | | | | | | | | | | | | | | | | | | | | | | | | | |
| | Successor | | | Predecessor |
| | | Year Ended
Dec. 31, 2021 | | Period from Sept. 19, 2020 through
Dec. 31, 2020 | | | Period from Jan. 1, 2020 through
Sept. 18, 2020 | | Year Ended
Dec. 31, 2019 |
| In thousands | | | | | |
| Supplemental cash flow information | | | | | | | | | |
| Cash paid for interest, expensed | | $ | 4,227 | | | $ | 813 | | | | $ | 29,357 | | | $ | 72,842 | |
| Cash paid for interest, capitalized | | 4,585 | | | 1,261 | | | | 22,885 | | | 36,671 | |
| Cash paid for interest, treated as a reduction of debt | | — | | | — | | | | 46,417 | | | 85,303 | |
| Cash paid for income taxes | | 184 | | | — | | | | 453 | | | 2,361 | |
| Cash received from income tax refunds | | 3 | | | 10,457 | | | | 1,932 | | | 9,820 | |
| Noncash investing and financing activities | | | | | | | | | |
| Increase in asset retirement obligations | | 112,760 | | | 23,398 | | | | 4,328 | | | 13,560 | |
| Increase (decrease) in liabilities for capital expenditures | | 35,679 | | | 1,867 | | | | (12,809) | | | (17,740) | |
| | | | | | | | | |
| Conversion of convertible senior notes into common stock | | — | | | — | | | | 11,501 | | | — | |
Denbury Inc.
Unaudited Supplementary Information
SUPPLEMENTAL OIL AND NATURAL GAS DISCLOSURES (UNAUDITED)
Costs Incurred
The following table summarizes costs incurred and capitalized in oil and natural gas property acquisition, exploration and development activities. Property acquisition costs are those costs incurred to purchase, lease or otherwise acquire property, including both undeveloped leasehold and the purchase of reserves in place. Exploration costs include costs of identifying areas that may warrant examination and examining specific areas that are considered to have prospects containing oil and natural gas reserves, including costs of drilling exploratory wells, geological and geophysical costs, and carrying costs on undeveloped properties. Development costs are incurred to obtain access to proved reserves, including the cost of drilling development wells, and to provide facilities for extracting, treating, gathering and storing the oil and natural gas, and the cost of improved recovery systems.
We capitalize interest on unevaluated oil and natural gas properties that have ongoing development activities. Included in costs incurred in the table below is capitalized interest of $4.3 million for the year ended December 31, 2021 (Successor), $1.2 million for the period September 19, 2020 through December 31, 2020 (Successor), $22.0 million for the period January 1, 2020 through September 18, 2020 (Predecessor), and $34.1 million during the year ended December 31, 2019 (Predecessor). Costs incurred also include new asset retirement obligations established, as well as changes to asset retirement obligations resulting from revisions in cost estimates or abandonment dates. Asset retirement obligations included in the table below were $10.1 million for the year ended December 31, 2021 (Successor), $3.4 million for the period September 19, 2020 through December 31, 2020 (Successor), $2.5 million for the period January 1, 2020 through September 18, 2020 (Predecessor), and $15.2 million for the year ended December 31, 2019 (Predecessor). See Note 6, Asset Retirement Obligations, for additional information.
Costs incurred in oil and natural gas activities were as follows:
| | | | | | | | | | | | | | | | | | | | | | | | | | | | | |
| | Successor | | | Predecessor |
| | | Year Ended
Dec. 31, 2021 | | Period from Sept. 19, 2020 through
Dec. 31, 2020 | | | Period from Jan. 1, 2020 through
Sept. 18, 2020 | | Year Ended
Dec. 31, 2019 |
| In thousands | | | | | |
| Property acquisitions | | | | | | | | | |
| Proved | | $ | 11,141 | | | $ | 130 | | | | $ | 278 | | | $ | 1,542 | |
| Unevaluated | | — | | | — | | | | — | | | — | |
| Exploration | | 79 | | | 60 | | | | 260 | | | 2,575 | |
| Development | | 178,411 | | | 23,741 | | | | 92,212 | | | 259,641 | |
Total costs incurred(1) | | $ | 189,631 | | | $ | 23,931 | | | | $ | 92,750 | | | $ | 263,758 | |
(1)Capitalized general and administrative costs that directly relate to exploration and development activities were $24.9 million for the year ended December 31, 2021 (Successor), $5.6 million for the period September 19, 2020 through December 31, 2020 (Successor), $19.5 million for the period January 1, 2020 through September 18, 2020 (Predecessor), and $39.5 million for the year ended December 31, 2019 (Predecessor).
Denbury Inc.
Unaudited Supplementary Information
Oil and Natural Gas Operating Results
Results of operations from oil and natural gas producing activities, excluding corporate overhead and interest costs, were as follows:
| | | | | | | | | | | | | | | | | | | | | | | | | | | | | |
| | Successor | | | Predecessor |
| | | Year Ended
Dec. 31, 2021 | | Period from Sept. 19, 2020 through
Dec. 31, 2020 | | | Period from Jan. 1, 2020 through
Sept. 18, 2020 | | Year Ended
Dec. 31, 2019 |
| In thousands, except per-BOE data | | | | | |
| Oil, natural gas, and related product sales | | $ | 1,159,955 | | | $ | 201,108 | | | | $ | 492,101 | | | $ | 1,212,020 | |
| Lease operating expenses | | 424,550 | | | 101,234 | | | | 250,271 | | | 477,220 | |
| Transportation and marketing expenses | | 28,817 | | | 10,595 | | | | 27,164 | | | 41,810 | |
| Production and ad valorem taxes | | 88,468 | | | 15,061 | | | | 38,647 | | | 86,820 | |
| Depletion, depreciation, and amortization | | 119,997 | | | 37,549 | | | | 104,504 | | | 161,400 | |
CO2 properties and pipelines depletion and depreciation(1) | | 7,180 | | | 1,744 | | | | 33,839 | | | 53,120 | |
| Write-down of oil and natural gas properties | | 14,377 | | | 1,006 | | | | 996,658 | | | — | |
| Commodity derivatives expense (income) | | 352,984 | | | 61,902 | | | | (102,032) | | | 70,078 | |
| Net operating income (loss) | | 123,582 | | | (27,983) | | | | (856,950) | | | 321,572 | |
| Income tax provision (benefit) | | — | | | — | | | | (214,238) | | | 80,393 | |
| Results of operations from oil and natural gas producing activities | | $ | 123,582 | | | $ | (27,983) | | | | $ | (642,712) | | | $ | 241,179 | |
| | | | | | | | | |
| Depletion, depreciation, and amortization per BOE | | $ | 7.14 | | | $ | 7.72 | | | | $ | 10.15 | | | $ | 10.10 | |
(1)Represents an allocation of the depletion and depreciation of our CO2 properties and pipelines associated with our tertiary oil producing activities.
Oil and Natural Gas Reserves
Net proved oil and natural gas reserve estimates for all years presented were prepared by DeGolyer and MacNaughton, independent petroleum engineers located in Dallas, Texas. These oil and natural gas reserve estimates do not include any value for probable or possible reserves that may exist, nor do they include any value for undeveloped acreage. The reserve estimates represent our net revenue interest in our properties. See Standardized Measure of Discounted Future Net Cash Flows and Changes Therein Relating to Proved Oil and Natural Gas Reserves below for a discussion of the effect of the different prices on reserve quantities and values. Operating costs, production and ad valorem taxes, and future development costs were based on current costs as of December 31, 2021.
There are numerous uncertainties inherent in estimating quantities of proved reserves and in projecting the future rates of production and timing of development expenditures. The following reserve data represents estimates only and should not be construed as being exact. Moreover, the present values should not be construed as the current market value of our oil and natural gas reserves or the costs that would be incurred to obtain equivalent reserves. Estimates of reserves as of year-end 2021, 2020 and 2019 were prepared using an average price equal to the unweighted arithmetic average of hydrocarbon prices received on a field-by-field basis on the first day of each month within the applicable fiscal 12-month period. All of our reserves are located in the United States.
Denbury Inc.
Unaudited Supplementary Information
Estimated Quantities of Proved Reserves
| | | | | | | | | | | | | | | | | | | | | | | | | | | | | | | | | | | | | | | | | | | | | | | | | | | | | | | | |
| | | Year Ended December 31, |
| | | 2021 | | 2020 | | 2019 |
| | Oil
(MBbl) | | Gas
(MMcf) | | Total
(MBOE) | | Oil
(MBbl) | | Gas
(MMcf) | | Total
(MBOE) | | Oil
(MBbl) | | Gas
(MMcf) | | Total
(MBOE) |
| Balance at beginning of year | | 140,499 | | | 15,604 | | | 143,100 | | | 226,133 | | | 24,334 | | | 230,189 | | | 255,042 | | | 43,008 | | | 262,210 | |
| Revisions of previous estimates | | 55,998 | | | (615) | | | 55,895 | | | (63,359) | | | (5,822) | | | (64,329) | | | (6,799) | | | (15,299) | | | (9,348) | |
Improved recovery(1) | | — | | | — | | | — | | | — | | | — | | | — | | | 977 | | | — | | | 977 | |
| Production | | (17,258) | | | (3,261) | | | (17,801) | | | (18,237) | | | (2,905) | | | (18,721) | | | (20,685) | | | (3,375) | | | (21,248) | |
| Acquisition of minerals in place | | 9,765 | | | 5,764 | | | 10,725 | | | — | | | — | | | — | | | — | | | — | | | — | |
| Sales of minerals in place | | (66) | | | (986) | | | (230) | | | (4,038) | | | (3) | | | (4,039) | | | (2,402) | | | — | | | (2,402) | |
| Balance at end of year | | 188,938 | | | 16,506 | | | 191,689 | | | 140,499 | | | 15,604 | | | 143,100 | | | 226,133 | | | 24,334 | | | 230,189 | |
| | | | | | | | | | | | | | | | | | |
| Proved Developed Reserves – end of year | | 179,147 | | | 16,506 | | | 181,898 | | | 136,402 | | | 15,604 | | | 139,003 | | | 202,816 | | | 24,333 | | | 206,872 | |
| Proved Undeveloped Reserves – end of year | | 9,791 | | | — | | | 9,791 | | | 4,097 | | | — | | | 4,097 | | | 23,317 | | | 1 | | | 23,317 | |
(1)Improved recovery reflects reserve additions that result from the application of secondary recovery methods such as water flooding or tertiary recovery methods such as CO2 flooding. In order to recognize proved tertiary oil reserves, we must either have an oil production response to CO2 injections or the field must be analogous to an existing tertiary flood. The magnitude of proved reserves that we can book in any given year will depend on our progress with new floods and the timing of the production response.
Revisions of previous estimates reflect changes in commodity prices resulting in upward revisions of 50.1 MMBOE during 2021 and downward revisions of 75.7 MMBOE and 13.7 MMBOE during 2020 and 2019, respectively.
There were no significant additions, excluding acquisitions of minerals in place in 2021, to our oil and natural gas reserves, as the magnitude of proved reserves that we can book in any given year depends on our progress with new floods and the timing of the production response, and we initiated no new floods in 2021, 2020, or 2019. Acquisition of minerals in place during 2021 were related to our Wind River Basin acquisition.
Standardized Measure of Discounted Future Net Cash Flows and Changes Therein Relating to Proved Oil and Natural Gas Reserves
The Standardized Measure of Discounted Future Net Cash Flows and Changes Therein Relating to Proved Oil and Natural Gas Reserves (“Standardized Measure”) does not purport to present the fair market value of our oil and natural gas properties. An estimate of such value should consider, among other factors, anticipated future prices of oil and natural gas, the probability of recoveries in excess of existing proved reserves, the value of probable reserves and acreage prospects, and perhaps different discount rates. It should be noted that estimates of reserve quantities, especially from new discoveries, are inherently imprecise and subject to substantial revision.
Under the Standardized Measure, future cash inflows were estimated by applying a first-day-of-the-month 12-month average price (as shown in the table below) to the estimated future production of year-end proved reserves. These prices have a significant impact on both the quantities and value of the proved reserves, as reductions in oil and natural gas prices can cause
Denbury Inc.
Unaudited Supplementary Information
wells to reach the end of their economic life much sooner and can make certain proved undeveloped locations uneconomical, both of which reduce the reserves. These prices were further adjusted by field to arrive at the appropriate corporate net price.
| | | | | | | | | | | | | | | | | | | | |
| | | December 31, |
| | | 2021 | | 2020 | | 2019 |
| Oil (NYMEX price per Bbl) | | $ | 66.56 | | | $ | 39.57 | | | $ | 55.69 | |
| Natural Gas (Henry Hub price per MMBtu) | | 3.60 | | | 1.99 | | | 2.58 | |
The changes in the Standardized Measure of discounted future net cash flows in the tables that follow were significantly impacted by the movement in first-day-of-the-month average NYMEX oil prices between 2019 and 2021. The weighted average oil prices we receive relative to NYMEX oil prices (our NYMEX oil price differential) utilized were $2.70 per Bbl below representative NYMEX oil prices as of December 31, 2021, compared to $3.73 per Bbl below representative NYMEX oil prices as of December 31, 2020, and $0.14 per Bbl below representative NYMEX oil prices as of December 31, 2019.
Future cash inflows were reduced by estimated future production, development and abandonment costs based on current cost, with no escalation to determine pre-tax cash inflows. Our future net inflows do not include a reduction for cash previously expended on our capitalized CO2 assets that will be consumed in the production of proved tertiary reserves. Future income taxes were computed by applying the statutory tax rate to the excess of net cash inflows over our tax basis in the associated proved oil and natural gas properties. Tax credits and net operating loss carryforwards were also considered in the future income tax calculation. Future net cash inflows after income taxes were discounted using a 10% annual discount rate to arrive at the Standardized Measure.
| | | | | | | | | | | | | | | | | | | | |
| | | December 31, |
| In thousands | | 2021 | | 2020 | | 2019 |
| Future cash inflows | | $ | 12,020,943 | | | $ | 5,010,288 | | | $ | 12,494,358 | |
| Future production costs | | (6,652,315) | | | (3,300,890) | | | (6,813,610) | |
| Future development costs | | (1,116,998) | | | (962,224) | | | (1,434,934) | |
| Future income taxes | | (776,337) | | | (59,600) | | | (586,441) | |
| Future net cash flows | | 3,475,293 | | | 687,574 | | | 3,659,373 | |
| 10% annual discount for estimated timing of cash flows | | (1,288,242) | | | (32,840) | | | (1,398,334) | |
| Standardized measure of discounted future net cash flows | | $ | 2,187,051 | | | $ | 654,734 | | | $ | 2,261,039 | |
The following table sets forth an analysis of changes in the Standardized Measure of Discounted Future Net Cash Flows from proved oil and natural gas reserves:
| | | | | | | | | | | | | | | | | | | | |
| | | Year Ended December 31, |
| In thousands | | 2021 | | 2020 | | 2019 |
| Beginning of year | | $ | 654,734 | | | $ | 2,261,039 | | | $ | 3,351,385 | |
| Sales of oil and natural gas produced, net of production costs | | (618,119) | | | (250,237) | | | (608,060) | |
| Net changes in prices and production costs | | 2,360,251 | | | (1,753,248) | | | (1,244,859) | |
Improved recovery(1) | | — | | | — | | | 5,785 | |
| Previously estimated development costs incurred | | 36,074 | | | 28,182 | | | 81,024 | |
| Change in future development costs | | (15,623) | | | 11,200 | | | (35,624) | |
| Revisions due to timing and other | | 35,887 | | | (127,046) | | | 41,841 | |
| Accretion of discount | | 68,119 | | | 233,663 | | | 367,313 | |
| Acquisition of minerals in place | | 105,610 | | | — | | | — | |
| Sales of minerals in place | | (1,454) | | | (55,102) | | | (16,892) | |
| Net change in income taxes | | (438,428) | | | 306,283 | | | 319,126 | |
| End of year | | $ | 2,187,051 | | | $ | 654,734 | | | $ | 2,261,039 | |
Denbury Inc.
Unaudited Supplementary Information
(1)Improved recovery additions result from the application of secondary recovery methods such as water flooding or tertiary recovery methods such as CO2 flooding.
SUPPLEMENTAL CO2 DISCLOSURES (UNAUDITED)
Based on engineering reports prepared by DeGolyer and MacNaughton, proved CO2 reserves were estimated as follows:
| | | | | | | | | | | | | | | | | | | | |
| | | Year Ended December 31, |
| In MMcf | | 2021 | | 2020 | | 2019 |
CO2 reserves | | | | | | |
Gulf Coast region(1) | | 4,474,313 | | | 4,641,812 | | | 4,786,881 | |
Rocky Mountain region(2) | | 1,046,139 | | | 1,089,101 | | | 1,120,060 | |
(1)Proved CO2 reserves in the Gulf Coast region consist of reserves from our reservoirs at Jackson Dome and are presented on a gross (8/8ths) basis, of which our net revenue interest was approximately 3.6 Tcf, 3.7 Tcf and 3.8 Tcf at December 31, 2021, 2020 and 2019, respectively.
(2)Proved CO2 reserves in the Rocky Mountain region consist of our overriding royalty interest in LaBarge Field, of which our net revenue interest was approximately 1.0 Tcf, 1.1 Tcf and 1.1 Tcf at December 31, 2021, 2020 and 2019, respectively.
Item 9. Changes in and Disagreements with Accountants on Accounting and Financial Disclosure
None.
Item 9A. Controls and Procedures
Evaluation of Disclosure Controls and Procedures
As of the end of the period covered by this report, an evaluation of the effectiveness of the design and operation of our disclosure controls and procedures (as defined in Rule 13a-15(e) under the Exchange Act) was performed under the supervision and with the participation of management, including our Chief Executive Officer and our Chief Financial Officer. Based on that evaluation, our Chief Executive Officer and Chief Financial Officer concluded that our disclosure controls and procedures were effective as of December 31, 2021, to ensure that information that is required to be disclosed in the reports the Company files and submits under the Securities Exchange Act of 1934 is recorded; that it is processed, summarized and reported within the time periods specified in the SEC’s rules and forms; and that information that is required to be disclosed under the Exchange Act is accumulated and communicated to management, including our Chief Executive Officer and our Chief Financial Officer, as appropriate to allow timely decisions regarding required disclosure.
Evaluation of Changes in Internal Control over Financial Reporting
Under the supervision and with the participation of our management, including our Chief Executive Officer and our Chief Financial Officer, we have determined that, during the fourth quarter of fiscal 2021, there were no changes in our internal control over financial reporting that have materially affected, or are reasonably likely to materially affect, our internal control over financial reporting.
Management’s Report on Internal Control over Financial Reporting
Our management is responsible for establishing and maintaining adequate internal control over financial reporting as defined in Rules 13a-15(f) and 15d-15(f) of the Securities Exchange Act of 1934, as amended. Under the supervision and with the participation of our management, including our Chief Executive Officer and our Chief Financial Officer, we assessed the effectiveness of our internal control over financial reporting as of the end of the period covered by this report based on the framework in “Internal Control – Integrated Framework” (2013) issued by the Committee of Sponsoring Organizations of the Treadway Commission. Based on that assessment, our Chief Executive Officer and our Chief Financial Officer concluded that our internal control over financial reporting was effective to provide reasonable assurance regarding the reliability of our financial reporting and the preparation of our financial statements for external purposes in accordance with U.S. generally accepted accounting principles.
The effectiveness of our internal control over financial reporting as of December 31, 2021, has been audited by PricewaterhouseCoopers LLP, an independent registered public accounting firm, as stated in the report that appears herein.
Important Considerations
The effectiveness of our disclosure controls and procedures and our internal control over financial reporting is subject to various inherent limitations, including cost limitations, judgments used in decision making, assumptions about the likelihood of future events, the soundness of our systems, the possibility of human error, and the risk of fraud. Moreover, projections of any evaluation of effectiveness to future periods are subject to the risk that controls may become inadequate because of changes in conditions and the risk that the degree of compliance with policies or procedures may deteriorate over time. Because of these limitations, there can be no assurance that any system of disclosure controls and procedures or internal control over financial reporting will be successful in preventing all errors or fraud or in making all material information known in a timely manner to the appropriate levels of management.
Item 9B. Other Information
None.
Item 9C. Disclosure Regarding Foreign Jurisdictions that Prevent Inspections
None.
PART III
Item 10. Directors, Executive Officers and Corporate Governance
Except as disclosed below, information as to Item 10 will be set forth in the Proxy Statement (“Proxy Statement”) for the 2022 Annual Meeting of Shareholders to be held May 26, 2022 (“Annual Meeting”) and is incorporated herein by reference.
Code of Ethics
We have adopted a Code of Ethics for Senior Financial Officers. This Code of Ethics, including any amendments or waivers, is posted on our website at www.denbury.com.
Item 11. Executive Compensation
Information as to Item 11 will be set forth in the Proxy Statement for the Annual Meeting and is incorporated herein by reference.
Item 12. Security Ownership of Certain Beneficial Owners and Management and Related Stockholder Matters
Information as to Item 12 will be set forth in the Proxy Statement for the Annual Meeting and is incorporated herein by reference.
Item 13. Certain Relationships and Related Transactions, and Director Independence
Information as to Item 13 will be set forth in the Proxy Statement for the Annual Meeting and is incorporated herein by reference.
Item 14. Principal Accountant Fees and Services
Our independent registered public accounting firm is PricewaterhouseCoopers LLP, Dallas, TX, Auditor ID: 238.
Information as to Item 14 will be set forth in the Proxy Statement for the Annual Meeting and is incorporated herein by reference.
PART IV
Item 15. Exhibits and Financial Statement Schedules
| | |
Financial Statements and Schedules. Financial statements and schedules filed as a part of this report are presented on page 63. All financial statement schedules have been omitted because they are not applicable, or the required information is presented in the financial statements or the notes to consolidated financial statements. |
Exhibits. The following exhibits are included as part of this report.
| | | | | | | | |
| Exhibit No. | | Exhibit |
| 2(a) | |
|
| 3(a) | |
|
| 3(b) | |
|
| | |
| | |
| | |
| 4(a) | |
|
| 4(b) | |
|
| 4(c) | |
|
| | |
| | |
| | |
| | |
| | |
| | |
| | |
| | |
| | |
| | |
| | |
| | |
| | |
| | |
| | |
| | |
| | |
| | |
| 10(a) | | Credit Agreement, dated as of September 18, 2020, by and among Denbury Inc., as borrower, the lenders party thereto, and JPMorgan Chase Bank, N.A., as administrative agent, swingline lender, and letter of credit issuer (incorporated by reference to Exhibit 10.1 of Form 8-K filed by the Company on September 18, 2020, File No. 001-12935).
|
| 10(b) | | First Amendment to Credit Agreement, dated as of November 3, 2021, by and among Denbury Inc., as Borrower, JPMorgan Chase Bank, N.A., as Administrative Agent, and the Lenders party thereto (incorporated by reference to Exhibit 10(a) of Form 10-Q filed by the Company on November 4, 2021, File No. 001-12935).
|
| 10(c) ** | |
|
| | |
| | |
| | |
| | |
| | |
| | |
| | |
| | |
| | |
| | |
| | |
| | |
| | |
| | |
| | |
| | |
| | |
| | |
| | |
| | |
| | |
| | |
| | |
| | |
| | |
| | |
| | |
| | |
| | |
| | |
| | |
| | |
| | |
| | |
| | |
| | |
| | |
| | |
| | |
| | |
| | |
| | |
| | |
| | |
| | |
| | |
| | |
| | |
| | |
| | |
| | |
| | |
| | |
| | |
| | |
| | |
| 10(d) | |
|
| 10(e) ** | |
|
| 10(f) ** | |
|
| | | | | | | | |
| Exhibit No. | | Exhibit |
| 10(g) ** | |
|
| 10(h) ** | |
|
| 10(i) ** | |
|
| 21* | |
|
| 23(a)* | |
|
| 23(b)* | |
|
| 23(c)* | |
|
| 31(a)* | |
|
| 31(b)* | |
|
| 32* | |
|
| 99* | |
|
| 101.INS* | | Inline XBRL Instance Document - the instance document does not appear in the Interactive Data File because its XBRL tags are embedded within the Inline XBRL document
|
| 101.SCH* | | Inline XBRL Taxonomy Extension Schema Document
|
| 101.CAL* | | Inline XBRL Taxonomy Extension Calculation Linkbase Document
|
| 101.DEF* | | Inline XBRL Taxonomy Extension Definition Linkbase Document
|
| 101.LAB* | | Inline XBRL Document Label Linkbase Document
|
| 101.PRE* | | Inline XBRL Taxonomy Extension Presentation Linkbase Document
|
| 104 | | Cover Page Interactive Data File (formatted as Inline XBRL and contained in Exhibit 101).
|
* Included herewith.
** Compensation arrangements.
Item 16. Form 10-K Summary
None.
SIGNATURES
Pursuant to the requirements of Section 13 or 15(d) of the Securities Exchange Act of 1934, Denbury Inc. has duly caused this report to be signed on its behalf by the undersigned, thereunto duly authorized.
| | | | | | | | |
| | DENBURY INC. |
| | |
| February 24, 2022 | | /s/ Mark C. Allen |
| | | Mark C. Allen
Executive Vice President and Chief Financial Officer |
| | |
| February 24, 2022 | | /s/ Nicole Jennings |
| | Nicole Jennings
Vice President and Chief Accounting Officer |
Pursuant to the requirements of the Securities Exchange Act of 1934, this report has been signed below by the following persons on behalf of Denbury Inc. and in the capacities and on the dates indicated.
| | | | | | | | |
| February 24, 2022 | | /s/ Christian S. Kendall |
| | | Christian S. Kendall
Director, President and Chief Executive Officer
(Principal Executive Officer) |
| | |
| February 24, 2022 | | /s/ Mark C. Allen |
| | | Mark C. Allen
Executive Vice President and Chief Financial Officer
(Principal Financial Officer) |
| | |
| February 24, 2022 | | /s/ Nicole Jennings |
| | | Nicole Jennings
Vice President and Chief Accounting Officer
(Principal Accounting Officer) |
| | |
| February 24, 2022 | | /s/ Kevin O. Meyers |
| | Kevin O. Meyers
Director |
| | |
| February 24, 2022 | | /s/ Anthony Abate |
| | Anthony Abate
Director |
| | |
| February 24, 2022 | | /s/ Caroline Angoorly |
| | Caroline Angoorly
Director |
| | |
| February 24, 2022 | | /s/ James Chapman |
| | James Chapman
Director |
| | |
| February 24, 2022 | | /s/ Lynn A. Peterson |
| | Lynn A. Peterson
Director |
| | | | | | | | |
| February 24, 2022 | | /s/ Brett Wiggs |
| | Brett Wiggs
Director |
| | |
| February 24, 2022 | | /s/ Cindy A. Yeilding |
| | Cindy A. Yeilding
Director |