UNITED STATES
SECURITIES AND EXCHANGE COMMISSION
WASHINGTON, D.C. 20549
FORM 8-K
CURRENT REPORT
Pursuant to Section 13 or 15(d)
of the Securities Exchange Act of 1934
Date of Report (Date of earliest event reported) February 4, 2016
OUTERWALL INC.
(Exact name of registrant as specified in its charter)
Delaware | 000-22555 | 94-3156448 | ||
(State or other jurisdiction of incorporation) |
(Commission File Number) |
(I.R.S. Employer Identification No.) |
1800 114th Avenue SE
BELLEVUE, WA 98004
(Address of Principal Executive Offices and Zip Code)
Registrants telephone number, including area code: (425) 943-8000
Check the appropriate box below if the Form 8-K filing is intended to simultaneously satisfy the filing obligation of the registrant under any of the following provisions:
¨ | Written communications pursuant to Rule 425 under the Securities Act (17 CFR 230.425) |
¨ | Soliciting material pursuant to Rule 14a-12 under the Exchange Act (17 CFR 240.14a-12) |
¨ | Pre-commencement communications pursuant to Rule 14d-2(b) under the Exchange Act (17 CFR 240.14d-2(b)) |
¨ | Pre-commencement communications pursuant to Rule 13e-4(c) under the Exchange Act (17 CFR 240.13e-4(c)) |
Item 2.02 | Results of Operations and Financial Condition. |
On February 4, 2016, Outerwall Inc. (the Company) issued an earnings release announcing its financial results for the quarter and full year ended December 31, 2015, and separate prepared remarks from its Chief Executive Officer and Chief Financial Officer. Copies of the earnings release and prepared remarks are attached hereto as Exhibits 99.1 and 99.2.
Item 8.01 | Other Events. |
On February 4, 2016, the Company issued a press release announcing a quarterly cash dividend. A copy of the press release is attached hereto as Exhibit 99.3 and incorporated by reference.
Item 9.01 | Financial Statements and Exhibits. |
(d) Exhibits
Exhibit |
Description | |
99.1 | Earnings release for the quarter and full year ended December 31, 2015. | |
99.2 | Prepared remarks from the Chief Executive Officer and Chief Financial Officer. | |
99.3 | Press release dated February 4, 2016. |
SIGNATURE
Pursuant to the requirements of the Securities Exchange Act of 1934, the registrant has duly caused this report to be signed on its behalf by the undersigned hereunto duly authorized.
OUTERWALL INC. | ||||||
By: | /s/ Galen C. Smith | |||||
Date: February 4, 2016 | Galen C. Smith | |||||
Chief Financial Officer |
Exhibit 99.1
OUTERWALL INC. ANNOUNCES 2015 FOURTH QUARTER AND FULL-YEAR RESULTS
Reported $2.2 Billion in Revenue for Full-Year 2015 and $527.2 Million for Fourth Quarter;
Generated Operating Cash Flow of $326.1 Million and Free Cash Flow of $248.5 Million in 2015;
Closed Acquisition of Gazelle to Drive ecoATM Toward Profitability;
Provided Initial Guidance for 2016
BELLEVUE, Wash.February 4, 2016Outerwall Inc. (Nasdaq: OUTR) today reported financial results for the fourth quarter and full year ended December 31, 2015.
Due to our unrivaled network of retail partners and millions of loyal customers who value our products and services, Outerwall delivered solid 2015 results with strong free cash flow and core diluted EPS from continuing operations, despite challenging headwinds that continued to impact Redbox, said Erik E. Prusch, Outerwalls chief executive officer and interim Redbox president. We remain focused on strengthening our businesses, while continuing to return significant free cash flow to investors.
Prusch continued, Redbox is a compelling business, providing new movie releases to millions of loyal consumers at a great value. We will manage the business for profitability and cash flow, and we will continue our focus on expense management, operational efficiencies and network optimization. We are confident that millions of consumers will continue renting from Redbox for many years to come, as a majority of our customers use Redbox to complement digital alternatives. We fully intend to continue meeting the entertainment needs of our customers as we maintain our focus on providing value for all of our stakeholders.
Three Months Ended December 31, |
Change | Year Ended December 31, |
Change | |||||||||||||||||||||
Dollars in millions, except per share data | 2015 | 2014 | % | 2015 | 2014 | % | ||||||||||||||||||
GAAP Results |
||||||||||||||||||||||||
Consolidated revenue |
$ | 527.2 | $ | 597.4 | (11.8 | )% | $ | 2,193.2 | $ | 2,291.6 | (4.3 | )% | ||||||||||||
Income from continuing operations |
$ | 17.1 | $ | 51.1 | (66.6 | )% | $ | 49.4 | $ | 124.7 | (60.3 | )% | ||||||||||||
Net income |
$ | 17.0 | $ | 43.8 | (61.1 | )% | $ | 44.3 | $ | 106.6 | (58.4 | )% | ||||||||||||
Diluted earnings from continuing operations per common share* |
$ | 1.00 | $ | 2.68 | (62.7 | )% | $ | 2.75 | $ | 5.89 | (53.3 | )% | ||||||||||||
Net cash provided by operating activities |
$ | 59.3 | $ | 131.3 | (54.8 | )% | $ | 326.1 | $ | 338.4 | (3.6 | )% | ||||||||||||
Core Results** |
||||||||||||||||||||||||
Core adjusted EBITDA from continuing operations |
$ | 95.8 | $ | 147.7 | (35.2 | )% | $ | 485.3 | $ | 496.8 | (2.3 | )% | ||||||||||||
Core diluted EPS from continuing operations |
$ | 1.43 | $ | 2.83 | (49.5 | )% | $ | 8.77 | $ | 7.26 | 20.8 | % | ||||||||||||
Free cash flow |
$ | 41.9 | $ | 105.7 | (60.4 | )% | $ | 248.5 | $ | 240.4 | 3.4 | % |
* | Beginning in the first quarter of 2015, the company applied the two-class method of calculating earnings per share for its GAAP results because the impact of unvested restricted shares as a percentage of total common shares outstanding became more dilutive given the level of stock repurchases over the prior year. Core diluted EPS from continuing operations continues to be reported under the treasury stock method. |
** | Refer to Appendix A for a discussion of Use of Non-GAAP Financial Measures and Core and Non-Core Results. |
2015 highlights include:
| Generated $248.5 million in free cash flow, an increase of 3.4% from 2014, despite a 4.3% decline in revenue as the company maintained focus on operational excellence and expense management |
| Delivered $485.3 million in core adjusted EBITDA from continuing operations, which was down $11.5 million from 2014, despite $98.4 million less in revenue |
| Repurchased approximately 2.5 million shares for $159.8 million and paid $21.3 million in cash quarterly dividends, returning approximately 73% of free cash flow to shareholders |
| Opportunistically repurchased $41.1 million in face value of the companys 5.875% Senior Notes due 2021 in the fourth quarter |
Overall our 2015 performance reflects our ability to manage our businesses for profitability and drive year-over-year growth in core adjusted EPS and free cash flow through expense management, said Galen C. Smith, Outerwalls chief financial officer. At the same time, we continued to return capital to shareholders, repurchasing 2.5 million shares and paying $21 million in quarterly dividends. In addition in December, we opportunistically repurchased $41 million of our outstanding senior notes for $35 million in cash.
Smith continued, In 2016 we will continue to align costs with revenue, optimize our kiosk networks and create operational efficiencies to manage Redbox and Coinstar for profitability and cash flow and move ecoATM to profitability. In 2016, we plan to return 75% to 100% of annual free cash flow to investors through share repurchases, dividends and senior note repurchases.
CONSOLIDATED RESULTS
GAAP Results
The companys full-year 2015 GAAP results include a non-cash, non-tax deductible goodwill impairment charge of $85.9 million recorded in the second quarter of 2015 related to the ecoATM segment and $27.2 million in one-time restructuring and related costs from continuing operations recorded over the year, as the company continued to align costs with revenue across the enterprise. The restructuring and related costs in 2015 reflect $11.3 million recorded in the fourth quarter of 2015, including costs associated with organizational changes in the Redbox and ecoATM segments and an $8.5 million cash payment to settle the $15.4 million outstanding under the $25.0 million purchase commitment entered into as a part of the NCR asset acquisition in 2012. These costs were allocated to the lines of business and are included in segment operating results for the fourth quarter of 2015.
For the fourth quarter of 2015, consolidated revenue was $527.2 million, a decrease of 11.8%, compared with $597.4 million in the fourth quarter of 2014, primarily reflecting an $83.7 million decrease in revenue from Redbox, partially offset by an increase in revenue of $12.1 million from ecoATM and $1.4 million from Coinstar. Consolidated revenue was $2.2 billion for the full-year 2015, a decrease of 4.3% compared with full-year 2014.
Income from continuing operations for the fourth quarter of 2015 was $17.1 million, or $1.00 of diluted earnings from continuing operations per common share, compared with income from continuing operations of $51.1 million, or $2.68 of diluted earnings from continuing operations per common share, in the fourth quarter of 2014. The decreases were primarily due to the lower consolidated revenue and the impact of the one-time restructuring and related costs in the fourth quarter of 2015. For the full-year 2015, income from continuing operations was $49.4 million, or $2.75 of diluted earnings from continuing operations per common share, compared with $124.7 million and $5.89, respectively, for the full-year 2014.
Net cash provided by operating activities was $59.3 million in the fourth quarter of 2015, a decline of 54.8% compared with $131.3 million in the fourth quarter of 2014. The decline was primarily due to the decrease in net income and an increase in net cash outflows from changes in working capital. For the full-year 2015, net cash provided by operating activities was $326.1 million, compared with $338.4 million for the full-year 2014.
2
Cash capital expenditures for the fourth quarter of 2015 decreased 32.0% to $17.4 million compared with $25.6 million in the fourth quarter of 2014, due to lower purchases of property and equipment for kiosks and corporate infrastructure. For the full-year 2015, cash capital expenditures decreased 20.8% to $77.6 million compared with $97.9 million for the full-year 2014.
Core Results
Core adjusted EBITDA from continuing operations for the fourth quarter of 2015 was $95.8 million, compared with $147.7 million for the fourth quarter of 2014. The $51.9 million decrease was primarily due to lower segment operating income in the Redbox segment. For the full-year 2015, core adjusted EBITDA from continuing operations was $485.3 million, a $11.5 million or 2.3% decrease compared with $496.8 million for the full-year 2014.
Core diluted EPS from continuing operations for the fourth quarter of 2015 was $1.43, a decrease from $2.83 for the fourth quarter of 2014. For the full-year 2015, core diluted EPS from continuing operations was $8.77 compared with $7.26 per diluted share for 2014. Non-core adjustments in the fourth quarter and the full-year 2015 netted to $0.41 and $5.97, respectively, compared with $0.09 and $1.24 for the same periods in 2014. The fourth quarter 2015 adjustments include $0.42 in one-time restructuring and related costs, while the full-year 2015 adjustments include $0.94 in one-time restructuring and related costs and $4.87 in goodwill impairment related to the ecoATM segment.
Free cash flow for the fourth quarter of 2015 was $41.9 million, a decrease of $63.8 million, compared with $105.7 million in the fourth quarter of 2014, primarily due to lower net operating cash flow in the fourth quarter of 2015, partially offset by lower capital expenditures. For the full-year 2015, free cash flow increased $8.1 million to $248.5 million, compared with $240.4 million for the full-year 2014.
SEGMENT RESULTS
Redbox
Redbox segment revenue for the fourth quarter of 2015 was $407.0 million compared with $490.7 million in the fourth quarter of 2014. The decrease of $83.7 million reflects the impact of a 24.3% decline in movie rentals year-over-year.
Redbox generated 135.8 million rentals in the fourth quarter of 2015, down from 179.5 million rentals in the fourth quarter of 2014. The decline in rentals reflects the impact of several factors, including an accelerated secular decline in the physical market, high frequency renters returning more slowly to their normal rental patterns following successive quarters of weak content, fewer titles available to rent in the quarter compared with the fourth quarter of 2014, lower demand from price-sensitive customers following the price increase, and the impact of fewer kiosks as the company continued efforts to optimize the network by removing underperforming kiosks. Net revenue per rental was $2.98 in the fourth quarter of 2015, compared with $2.73 in the fourth quarter of 2014, primarily due to the price increase for movies and video games.
Redbox segment operating income in the fourth quarter of 2015 was $62.6 million, a decrease of 50.2%, compared with $125.8 million in the fourth quarter of 2014. Segment operating margin was 15.4% in the fourth quarter of 2015, compared with 25.6% in the fourth quarter of 2014. The lower margin was the result of higher content purchases and promotions intended to bring consumers back to the kiosk after an extended period of weak content, as well as $8.4 million, or 210 basis points of segment operating margin, in restructuring and related costs allocated to the segment in the fourth quarter of 2015.
3
Coinstar
Coinstar segment revenue increased $1.4 million, or 1.7%, to $83.3 million in the fourth quarter of 2015, compared with $81.9 million in the fourth quarter of 2014, and same store sales increased 2.3 percentage points to 5.6% compared with the fourth quarter of 2014.
Coinstar segment operating income was $31.2 million in the fourth quarter of 2015, a decrease of $2.3 million compared with $33.6 million in the fourth quarter of 2014, primarily due to a $2.0 million increase in general and administrative expenses due in part to higher technology costs and $1.5 million in one-time restructuring and related costs, partially offset by lower costs as a result of ongoing cost containment initiatives. As a result, Coinstar segment operating margin decreased 350 basis points to 37.5% for the fourth quarter of 2015, compared with 41.0% in the fourth quarter of 2014.
ecoATM
On November 10, 2015, the company acquired certain assets and liabilities of Gazelle, Inc. for $18.0 million in cash. The purchase is accounted for as a business combination and the results of operations from Gazelle are included in ecoATM segment results from the acquisition date.
Revenue in the ecoATM segment was $36.8 million in the fourth quarter of 2015, an increase of $12.1 million or 48.9%, compared with $24.7 million in the fourth quarter of 2014, due primarily to the revenue contribution from Gazelle following the close of the acquisition.
There were 2,250 ecoATM kiosks installed at the end of the fourth quarter of 2015, an increase of 360 kiosks from the end of the fourth quarter of 2014. The number of value devices sold and percentage of value devices to overall devices sold increased in the fourth quarter compared with the fourth quarter of 2014. The average selling price of value devices sold increased $1.93 to $61.70 in the fourth quarter of 2015, compared with $59.77 in the fourth quarter of 2014.
Segment operating loss decreased approximately $1.3 million to $6.8 million in the fourth quarter of 2015, compared with $8.1 million in the fourth quarter of 2014, reflecting the companys focus on controlling expenses and creating efficiencies. The segment operating results include $0.6 million in one-time restructuring and related costs and $0.3 million in fees related to the Gazelle acquisition included in general and administrative expense.
CAPITAL ALLOCATION
In the first quarter of 2015, the companys board of directors initiated a quarterly cash dividend of $0.30 per outstanding share of our common stock and paid a total of $21.3 million in cash dividends in 2015. On February 3, 2016, the companys board of directors declared a quarterly cash dividend of $0.30 per share expected to be paid on March 29, 2016, to all stockholders of record as of the close of business on March 15, 2016.
During the fourth quarter of 2015, the company repurchased 673,821 shares of common stock at an average price per share of $53.89. For the year, the company repurchased 2.5 million shares at an average price per share of $63.56 for a total of $159.8 million. As of December 31, 2015, there was approximately $256.4 million remaining under the companys stock repurchase authorization.
In December, the company repurchased $41.1 million in face value of its 5.875% Senior Notes due 2021 for $34.6 million in cash. The gain from early extinguishment of these notes was approximately $5.9 million and is included in net interest expense.
4
2016 ANNUAL GUIDANCE
Outerwall provides annual guidance only and expects to update its annual guidance as appropriate each quarter when reporting its financial results. Due to the difficulty in forecasting as a result of the content release schedule, accelerating secular decline, and the companys focus on profitability and cash flow, Outerwall will not provide revenue guidance for 2016. The company will continue to provide guidance for core adjusted EBITDA from continuing operations, core diluted EPS from continuing operations and free cash flow.
There are several factors that influence the companys 2016 expectations, including the new release schedule and strength of content for movies and video games, Redboxs success in re-engaging consumers to rent movies, the integration of Gazelle, the redeployment of previously manufactured ecoATM kiosks, and the companys ability to further align costs with revenue.
Outerwalls 2016 annual guidance reflects:
| A continued focus on expense management, operational efficiencies and network optimization across the enterprise |
| Managing the Redbox business for profitability and cash flow in the face of an estimated 15% to 20% decline in rentals from secular decline |
| Moving ecoATM to segment operating profit breakeven in 2016 |
Outerwalls guidance for weighted-average diluted shares outstanding does not include the impact from any potential share repurchases in 2016.
The following table presents the companys full-year 2016 guidance:
2016 FULL-YEAR GUIDANCE
As of | ||
Dollars in millions, except per share data | February 4, 2016 | |
Consolidated results |
||
Core adjusted EBITDA from continuing operations(1) |
$340 $380 | |
Core diluted EPS from continuing operations(1)(2) |
$5.00 $6.30 | |
Free cash flow(1) |
$140 $190 | |
Weighted average diluted shares outstanding(2) (in millions) |
16.29 16.35 | |
Core effective tax rate |
34.5% 35.5% | |
Capital expenditures |
||
Redbox |
$15 $19 | |
Coinstar |
$7 $9 | |
ecoATM |
$5 $6 | |
Corporate |
$18 $21 | |
| ||
Total CAPEX |
$45 $55 | |
| ||
Net kiosk installations |
||
Redbox |
(1,000) (2,000) | |
Coinstar |
(150) (200) | |
ecoATM |
50 100 |
1 | Refer to Appendix A for a discussion of Use of Non-GAAP Financial Measures and Core and Non-Core Results |
2 | Excludes the impact of any potential share repurchases in 2016 |
5
ADDITIONAL INFORMATION
Additional information regarding the companys 2015 fourth quarter and full-year operating and financial results and 2016 guidance are included in the companys prepared remarks, which are posted on the Investor Relations section of the corporate website at ir.outerwall.com.
CONFERENCE CALL
The company will host a conference call today at 2:30 p.m. PST (5:30 p.m. EST) to discuss fourth quarter and full-year 2015 earnings results and 2016 annual guidance. The conference call will be webcast live and archived on the Investor Relations section of Outerwalls website at ir.outerwall.com. A recording of the call will be available approximately two hours after the call ends through February 18, 2016, at 1-855-859-2056 or 1-404-537-3406, using conference ID 17508536.
ABOUT OUTERWALL
Outerwall Inc. (Nasdaq: OUTR) has more than 20 years of experience creating some of the most profitable spaces for their retail partners. The company delivers breakthrough kiosk experiences that delight consumers and generate revenue for retailers. As the company that brought consumers Redbox® entertainment, Coinstar® money services, and ecoATM® electronics recycling kiosks, Outerwall is leading the next generation of automated retail and paving the way for inventive, scalable businesses. Outerwall kiosks are in neighborhood grocery stores, drug stores, mass merchants, malls, and other retail locations in the United States, Canada, Puerto Rico, the United Kingdom, and Ireland. Learn more at www.outerwall.com.
SAFE HARBOR FOR FORWARD-LOOKING STATEMENTS
Certain statements in this press release are forward-looking statements within the meaning of the Private Securities Litigation Reform Act of 1995. The words believe, estimate, expect, intend, will, anticipate, goals, variations of such words, and similar expressions identify forward-looking statements, but their absence does not mean that the statement is not forward-looking. The forward-looking statements in this release include statements regarding Outerwall Inc.s anticipated growth and future operating results, including 2016 full year results. Forward-looking statements are not guarantees of future performance and actual results may vary materially from the results expressed or implied in such statements. Differences may result from actions taken by Outerwall Inc. or its subsidiaries, as well as from risks and uncertainties beyond Outerwall Inc.s control. Such risks and uncertainties include, but are not limited to,
| competition from other entertainment providers, |
| the ability to achieve the strategic and financial objectives for our entry into new businesses, including ecoATM and Gazelle, |
| the timing of the release slate and the relative attractiveness of titles in a particular quarter or year, |
| our ability to repurchase stock and the availability of an open trading window, |
| our declaration and payment of dividends, including our boards discretion to change the dividend policy, |
| the termination, non-renewal or renegotiation on materially adverse terms of our contracts with our significant retailers and suppliers, |
| payment of increased fees to retailers, suppliers and other third-party providers, including financial service providers, |
| the timing of new DVD releases and the inability to receive delivery of DVDs on the date of their initial release to the general public, or shortly thereafter, or in sufficient quantity, for home entertainment viewing, |
| the effective management of our content library, |
| the ability to attract new retailers, penetrate new markets and distribution channels and react to changing consumer demands, |
| loss of key personnel or the inability of replacements to quickly and successfully perform in those new roles, |
| the ability to generate sufficient cash flow to timely and fully service indebtedness and adhere to certain covenants and restrictions, |
6
| the ability to adequately protect our intellectual property, and |
| the application of substantial federal, state, local and foreign laws and regulations specific to our business. |
The foregoing list of risks and uncertainties is illustrative, but by no means exhaustive. For more information on factors that may affect future performance, please review Risk Factors described in our most recent Annual Report on Form 10-K and any subsequent Quarterly Reports on Form 10-Q filed with the Securities and Exchange Commission. These forward-looking statements reflect Outerwall Inc.s expectations as of the date of this press release. Outerwall Inc. undertakes no obligation to update the information provided herein.
# # #
(Consolidated Financial Statements, Business Segment Information and Appendix A Follow)
Investor Contact:
Rosemary Moothart
Director, Investor Relations
425-943-8140
rosemary.moothart@outerwall.com
Media Contact:
Susan Johnston
Vice President, Corporate Communications & Public Affairs
425-943-8993
Susan.Johnston@outerwall.com
7
OUTERWALL INC.
CONSOLIDATED STATEMENTS OF COMPREHENSIVE INCOME
(in thousands, except per share data)
Three Months Ended December 31, |
Year Ended December 31, |
|||||||||||||||
2015 | 2014 | 2015 | 2014 | |||||||||||||
Revenue |
$ | 527,151 | $ | 597,398 | $ | 2,193,211 | $ | 2,291,586 | ||||||||
Expenses: |
||||||||||||||||
Direct operating(1) |
378,086 | 400,493 | 1,493,088 | 1,581,311 | ||||||||||||
Marketing |
12,076 | 10,021 | 35,674 | 35,293 | ||||||||||||
Research and development |
1,561 | 3,162 | 7,198 | 13,047 | ||||||||||||
General and administrative |
45,236 | 41,706 | 190,393 | 190,496 | ||||||||||||
Restructuring and related costs |
11,302 | | 27,153 | 557 | ||||||||||||
Depreciation and other |
43,650 | 45,690 | 171,390 | 187,824 | ||||||||||||
Amortization of intangible assets |
3,624 | 3,307 | 13,550 | 14,654 | ||||||||||||
Goodwill impairment |
| | 85,890 | | ||||||||||||
|
|
|
|
|
|
|
|
|||||||||
Total expenses |
495,535 | 504,379 | 2,024,336 | 2,023,182 | ||||||||||||
|
|
|
|
|
|
|
|
|||||||||
Operating income |
31,616 | 93,019 | 168,875 | 268,404 | ||||||||||||
Other income (expense), net: |
||||||||||||||||
Income (loss) from equity method investments, net |
(207 | ) | 2,527 | (800 | ) | (28,734 | ) | |||||||||
Interest expense, net |
(6,126 | ) | (12,599 | ) | (42,353 | ) | (47,644 | ) | ||||||||
Other, net |
431 | (799 | ) | (2,657 | ) | (1,185 | ) | |||||||||
|
|
|
|
|
|
|
|
|||||||||
Total other expense, net |
(5,902 | ) | (10,871 | ) | (45,810 | ) | (77,563 | ) | ||||||||
|
|
|
|
|
|
|
|
|||||||||
Income from continuing operations before income taxes |
25,714 | 82,148 | 123,065 | 190,841 | ||||||||||||
Income tax expense |
(8,664 | ) | (31,033 | ) | (73,619 | ) | (66,164 | ) | ||||||||
|
|
|
|
|
|
|
|
|||||||||
Income from continuing operations |
17,050 | 51,115 | 49,446 | 124,677 | ||||||||||||
Loss from discontinued operations, net of tax |
(32 | ) | (7,315 | ) | (5,109 | ) | (18,059 | ) | ||||||||
|
|
|
|
|
|
|
|
|||||||||
Net income |
17,018 | 43,800 | 44,337 | 106,618 | ||||||||||||
Foreign currency translation adjustment(2) |
(992 | ) | 613 | 684 | 457 | |||||||||||
|
|
|
|
|
|
|
|
|||||||||
Comprehensive income |
$ | 16,026 | $ | 44,413 | $ | 45,021 | $ | 107,075 | ||||||||
|
|
|
|
|
|
|
|
|||||||||
Income from continuing operations attributable to common shares: |
||||||||||||||||
Basic |
$ | 16,602 | $ | 49,462 | $ | 48,117 | $ | 120,748 | ||||||||
Diluted |
$ | 16,602 | $ | 49,468 | $ | 48,118 | $ | 120,806 | ||||||||
Basic earnings (loss) per common share: |
||||||||||||||||
Continuing operations |
$ | 1.00 | $ | 2.69 | $ | 2.75 | $ | 5.98 | ||||||||
Discontinued operations |
| (0.40 | ) | (0.29 | ) | (0.89 | ) | |||||||||
|
|
|
|
|
|
|
|
|||||||||
Basic earnings per common share |
$ | 1.00 | $ | 2.29 | $ | 2.46 | $ | 5.09 | ||||||||
|
|
|
|
|
|
|
|
|||||||||
Diluted earnings (loss) per common share: |
||||||||||||||||
Continuing operations |
$ | 1.00 | $ | 2.68 | $ | 2.75 | $ | 5.89 | ||||||||
Discontinued operations |
| (0.40 | ) | (0.29 | ) | (0.88 | ) | |||||||||
|
|
|
|
|
|
|
|
|||||||||
Diluted earnings per common share |
$ | 1.00 | $ | 2.28 | $ | 2.46 | $ | 5.01 | ||||||||
|
|
|
|
|
|
|
|
|||||||||
Weighted average common shares used in basic and diluted per share calculations: |
||||||||||||||||
Basic |
16,552 | 18,412 | 17,467 | 20,192 | ||||||||||||
Diluted |
16,575 | 18,473 | 17,487 | 20,503 | ||||||||||||
Dividends declared per common share |
$ | 0.30 | $ | | $ | 1.20 | $ | |
(1) | Direct operating excludes depreciation and other of $32.0 million and $118.7 million for the three months and year ended December 31, 2015, respectively, and $31.4 million and $125.7 million for the three months and year ended December 31, 2014, respectively |
(2) | Foreign currency translation adjustment had no tax effect in 2015 and 2014. |
8
OUTERWALL INC.
CONSOLIDATED BALANCE SHEETS
(in thousands, except share data)
December 31, | ||||||||
2015 | 2014 | |||||||
Assets |
||||||||
Current Assets: |
||||||||
Cash and cash equivalents |
$ | 222,549 | $ | 242,696 | ||||
Accounts receivable, net of allowances of $1,272 and $2,223 |
38,464 | 48,590 | ||||||
Content library |
188,490 | 180,121 | ||||||
Prepaid expenses and other current assets |
51,368 | 39,819 | ||||||
|
|
|
|
|||||
Total current assets |
500,871 | 511,226 | ||||||
Property and equipment, net |
316,013 | 428,468 | ||||||
Deferred income taxes |
2,606 | 11,363 | ||||||
Goodwill and other intangible assets, net |
540,514 | 623,998 | ||||||
Other long-term assets |
6,056 | 8,231 | ||||||
|
|
|
|
|||||
Total assets |
$ | 1,366,060 | $ | 1,583,286 | ||||
|
|
|
|
|||||
Liabilities and Stockholders Equity (Deficit) |
||||||||
Current Liabilities: |
||||||||
Accounts payable |
$ | 184,010 | $ | 168,633 | ||||
Accrued payable to retailers |
115,098 | 126,290 | ||||||
Other accrued liabilities |
141,437 | 137,126 | ||||||
Current portion of long-term debt and other long-term liabilities |
17,131 | 20,416 | ||||||
|
|
|
|
|||||
Total current liabilities |
457,676 | 452,465 | ||||||
Long-term debt and other long-term liabilities |
897,366 | 973,669 | ||||||
Deferred income taxes |
33,092 | 59,774 | ||||||
|
|
|
|
|||||
Total liabilities |
1,388,134 | 1,485,908 | ||||||
Commitments and contingencies |
||||||||
Stockholders Equity (Deficit): |
||||||||
Preferred stock, $0.001 par value - 5,000,000 shares authorized; no shares issued or outstanding |
| | ||||||
Common stock, $0.001 par value - 60,000,000 authorized; |
||||||||
36,720,579 and 36,600,166 shares issued; |
||||||||
16,607,516 and 18,926,242 shares outstanding; |
485,163 | 473,592 | ||||||
Treasury stock |
(1,151,063 | ) | (996,293 | ) | ||||
Retained earnings |
643,452 | 620,389 | ||||||
Accumulated other comprehensive income (loss) |
374 | (310 | ) | |||||
|
|
|
|
|||||
Total stockholders equity (deficit) |
(22,074 | ) | 97,378 | |||||
|
|
|
|
|||||
Total liabilities and stockholders equity (deficit) |
$ | 1,366,060 | $ | 1,583,286 | ||||
|
|
|
|
9
OUTERWALL INC.
CONSOLIDATED STATEMENTS OF CASH FLOWS
(in thousands)
Three Months Ended December 31, |
Year Ended December 31, |
|||||||||||||||
2015 | 2014 | 2015 | 2014 | |||||||||||||
Operating Activities: |
||||||||||||||||
Net income |
$ | 17,018 | $ | 43,800 | $ | 44,337 | $ | 106,618 | ||||||||
Adjustments to reconcile net income to net cash flows from operating activities: |
||||||||||||||||
Depreciation and other |
43,649 | 49,006 | 177,247 | 195,162 | ||||||||||||
Amortization of intangible assets |
3,624 | 3,326 | 13,594 | 14,692 | ||||||||||||
Share-based payments expense |
5,219 | 3,291 | 17,240 | 13,384 | ||||||||||||
Windfall excess tax benefits related to share-based payments |
(24 | ) | 24 | (739 | ) | (1,964 | ) | |||||||||
Deferred income taxes |
6,061 | (5,203 | ) | (19,619 | ) | (22,611 | ) | |||||||||
Restructuring, impairment and related costs(2) |
374 | | 2,054 | | ||||||||||||
(Income) loss from equity method investments, net |
207 | (2,527 | ) | 800 | 28,734 | |||||||||||
Amortization of deferred financing fees and debt discount |
683 | 693 | 2,761 | 4,116 | ||||||||||||
(Gain) loss from early extinguishment of debt |
(5,854 | ) | | (5,854 | ) | 2,018 | ||||||||||
Gain on purchase of Gazelle |
(989 | ) | | (989 | ) | | ||||||||||
Goodwill impairment |
| | 85,890 | | ||||||||||||
Other |
(471 | ) | (273 | ) | (972 | ) | (1,750 | ) | ||||||||
Cash flows from changes in operating assets and liabilities: |
||||||||||||||||
Accounts receivable, net |
(14,721 | ) | (8,793 | ) | 10,011 | 8,671 | ||||||||||
Content library |
(61,525 | ) | (29,053 | ) | (8,320 | ) | 19,747 | |||||||||
Prepaid expenses and other current assets |
(5,171 | ) | 21,235 | (10,065 | ) | 44,282 | ||||||||||
Other assets |
(244 | ) | 55 | 162 | 1,702 | |||||||||||
Accounts payable |
64,023 | 28,094 | 17,943 | (68,912 | ) | |||||||||||
Accrued payable to retailers |
14,319 | 20,975 | (9,968 | ) | (6,847 | ) | ||||||||||
Other accrued liabilities |
(6,867 | ) | 6,654 | 10,572 | 1,309 | |||||||||||
|
|
|
|
|
|
|
|
|||||||||
Net cash flows from operating activities(1) |
59,311 | 131,304 | 326,085 | 338,351 | ||||||||||||
Investing Activities: |
||||||||||||||||
Purchases of property and equipment |
(17,427 | ) | (25,613 | ) | (77,591 | ) | (97,924 | ) | ||||||||
Proceeds from sale of property and equipment |
157 | 142 | 3,225 | 1,977 | ||||||||||||
Acquisitions, net of cash acquired |
(17,980 | ) | | (17,980 | ) | | ||||||||||
Cash paid for equity investments |
| | | (24,500 | ) | |||||||||||
Extinguishment payment received from equity investment |
| 5,000 | | 5,000 | ||||||||||||
|
|
|
|
|
|
|
|
|||||||||
Net cash flows used in investing activities(1) |
(35,250 | ) | (20,471 | ) | (92,346 | ) | (115,447 | ) | ||||||||
Financing Activities: |
||||||||||||||||
Proceeds from issuance of senior unsecured notes |
| | | 295,500 | ||||||||||||
Proceeds from new borrowing on Credit Facility |
163,500 | 7,000 | 310,500 | 642,000 | ||||||||||||
Principal payments on Credit Facility |
(80,812 | ) | (58,875 | ) | (339,375 | ) | (680,125 | ) | ||||||||
Financing costs associated with Credit Facility and senior unsecured notes(3) |
| (5 | ) | (9 | ) | (2,911 | ) | |||||||||
Settlement and conversion of convertible debt |
| | | (51,149 | ) | |||||||||||
Repurchase of Notes |
(34,589 | ) | | (34,589 | ) | | ||||||||||
Repurchases of common stock(4) |
(36,311 | ) | (13 | ) | (159,800 | ) | (545,091 | ) | ||||||||
Dividends paid |
(5,052 | ) | | (21,210 | ) | | ||||||||||
Principal payments on capital lease obligations and other debt |
(2,572 | ) | (3,399 | ) | (11,510 | ) | (13,996 | ) | ||||||||
Windfall excess tax benefits related to share-based payments |
24 | (24 | ) | 739 | 1,964 | |||||||||||
Withholding tax paid on vesting of restricted stock net of proceeds from exercise of stock options |
(215 | ) | 564 | (1,461 | ) | (520 | ) | |||||||||
|
|
|
|
|
|
|
|
|||||||||
Net cash flows from (used in) financing activities(1) |
$ | 3,973 | $ | (54,752 | ) | $ | (256,715 | ) | $ | (354,328 | ) |
10
Three Months Ended December 31, |
Year Ended December 31, |
|||||||||||||||
2015 | 2014 | 2015 | 2014 | |||||||||||||
Effect of exchange rate changes on cash |
$ | (1,088 | ) | $ | 1,714 | $ | 2,829 | $ | 2,683 | |||||||
|
|
|
|
|
|
|
|
|||||||||
Increase (decrease) in cash and cash equivalents |
26,946 | 57,795 | (20,147 | ) | (128,741 | ) | ||||||||||
Cash and cash equivalents: |
||||||||||||||||
Beginning of period |
195,603 | 184,901 | 242,696 | 371,437 | ||||||||||||
|
|
|
|
|
|
|
|
|||||||||
End of period |
$ | 222,549 | $ | 242,696 | $ | 222,549 | $ | 242,696 | ||||||||
|
|
|
|
|
|
|
|
(1) | During 2015 we discontinued our Redbox operations in Canada. 2014 also includes the wind-down process of certain new ventures that were discontinued during 2013. Cash flows from these discontinued operations are not segregated from cash flows from continuing operations in all periods presented. |
(2) | The non-cash restructuring, impairment and related costs in 2015 of $2.1 million is composed of $7.4 million in impairments of lease related assets partially offset by a $5.3 million benefit resulting from the lease termination. The 2013 non-cash charge represents asset impairments of $32.7 million related to our four ventures previously included in our former New Ventures segment, Orango, Rubi, Crisp Market, and Star Studio, which were discontinued during 2013. |
(3) | Total financing costs associated with the Credit Facility and senior unsecured notes issued in 2014 were $8.2 million composed of non-cash debt issue costs of $4.5 million recorded as debt discount associated with our issuance of $300.0 million senior unsecured notes due 2021, $1.5 million in deferred financing fees associated with the senior unsecured notes, and $2.2 million in deferred financing fees associated with the refinancing of our Credit Facility. The cash payments for financing costs associated with the Credit Facility and senior unsecured notes in 2014 were $2.9 million. |
(4) | The total cost of repurchases of common stock in 2014 was $545.1 million, which includes $3.7 million in fees and expenses relating to the tender offer recorded as part of the cost of treasury stock in our Consolidated Balance Sheets. The cash payments for the tender offer fees in 2014 were $3.7 million. |
11
OUTERWALL INC.
BUSINESS SEGMENTS AND ENTERPRISEWIDE INFORMATION
(unaudited)
Changes in our Organizational Structure
We regularly assess the performance of our concepts to determine whether continued funding or other alternatives are appropriate and as a result, we discontinued operating SAMPLEit in the fourth quarter of 2015. As SAMPLEit did not represent a major component of our operations or financial results, the results of SAMPLEit did not qualify to be reported as a discontinued operation and remain in our All Other reporting category.
During the first quarter of 2015, we added ecoATM, our electronic device recycling business, as a separate reportable segment. Previously, the results of ecoATM along with those of other self-service concepts were included in our former New Ventures segment. The combined results of the other self-service concepts are now included in our All Other reporting category in the reconciliation below, as they do not meet quantitative thresholds to be reported as a separate segment. All goodwill previously allocated to the New Ventures segment has been allocated to the ecoATM segment.
Results of operations for Gazelle from the acquisition date, November 10, 2015, are included in our ecoATM segment.
Comparability of Segment Results
We have recast prior period results for the following:
| Discontinued operations, consisting of our Redbox operations in Canada which we shut down during the first quarter of 2015; and |
| The addition of our ecoATM segment and our All Other reporting category, which we added during the first quarter of 2015. |
Our analysis and reconciliation of our segment information to the consolidated financial statements that follows covers our results of operations, which consists of our Redbox, Coinstar and ecoATM segments, Corporate Unallocated expenses and our All Other reporting category. All Other includes the results of other self-service concepts, which we regularly assess to determine whether continued funding or other alternatives are appropriate.
12
OUTERWALL INC.
BUSINESS SEGMENTS AND ENTERPRISEWIDE INFORMATION
(unaudited)
Dollars in thousands | ||||||||||||||||||||||||
Three Months Ended December 31, 2015 | Redbox | Coinstar | ecoATM | All Other | Corporate Unallocated |
Total | ||||||||||||||||||
Revenue |
$ | 407,018 | $ | 83,325 | $ | 36,782 | $ | 26 | $ | | $ | 527,151 | ||||||||||||
Expenses: |
||||||||||||||||||||||||
Direct operating |
300,343 | 41,341 | 34,525 | 1,376 | 501 | 378,086 | ||||||||||||||||||
Marketing |
6,533 | 1,717 | 3,468 | 288 | 70 | 12,076 | ||||||||||||||||||
Research and development |
| | 1,339 | | 222 | 1,561 | ||||||||||||||||||
General and administrative |
29,154 | 7,496 | 3,708 | 1,104 | 3,774 | 45,236 | ||||||||||||||||||
Restructuring and related costs |
8,366 | 1,526 | 560 | 850 | | 11,302 | ||||||||||||||||||
|
|
|
|
|
|
|
|
|
|
|
|
|||||||||||||
Segment operating income (loss) |
62,622 | 31,245 | (6,818 | ) | (3,592 | ) | (4,567 | ) | 78,890 | |||||||||||||||
Less: depreciation and amortization |
(26,478 | ) | (7,674 | ) | (7,387 | ) | (5,735 | ) | | (47,274 | ) | |||||||||||||
|
|
|
|
|
|
|
|
|
|
|
|
|||||||||||||
Operating income (loss) |
36,144 | 23,571 | (14,205 | ) | (9,327 | ) | (4,567 | ) | 31,616 | |||||||||||||||
Loss from equity method investments, net |
| | | | (207 | ) | (207 | ) | ||||||||||||||||
Interest expense, net |
| | | | (6,126 | ) | (6,126 | ) | ||||||||||||||||
Other, net |
| | | | 431 | 431 | ||||||||||||||||||
|
|
|
|
|
|
|
|
|
|
|
|
|||||||||||||
Income (loss) from continuing operations before income taxes |
$ | 36,144 | $ | 23,571 | $ | (14,205 | ) | $ | (9,327 | ) | $ | (10,469 | ) | $ | 25,714 | |||||||||
|
|
|
|
|
|
|
|
|
|
|
|
Dollars in thousands | ||||||||||||||||||||||||
Three Months Ended December 31, 2014 | Redbox | Coinstar | ecoATM | All Other | Corporate Unallocated |
Total | ||||||||||||||||||
Revenue |
$ | 490,748 | $ | 81,921 | $ | 24,709 | $ | 20 | $ | | $ | 597,398 | ||||||||||||
Expenses: |
||||||||||||||||||||||||
Direct operating |
329,409 | 40,860 | 27,453 | 1,400 | 1,371 | 400,493 | ||||||||||||||||||
Marketing |
5,557 | 1,949 | 945 | 652 | 918 | 10,021 | ||||||||||||||||||
Research and development |
79 | 45 | 1,156 | 819 | 1,063 | 3,162 | ||||||||||||||||||
General and administrative |
29,912 | 5,510 | 3,303 | 1,170 | 1,811 | 41,706 | ||||||||||||||||||
|
|
|
|
|
|
|
|
|
|
|
|
|||||||||||||
Segment operating income (loss) |
125,791 | 33,557 | (8,148 | ) | (4,021 | ) | (5,163 | ) | 142,016 | |||||||||||||||
Less: depreciation and amortization |
(34,364 | ) | (8,998 | ) | (5,210 | ) | (425 | ) | | (48,997 | ) | |||||||||||||
|
|
|
|
|
|
|
|
|
|
|
|
|||||||||||||
Operating income (loss) |
91,427 | 24,559 | (13,358 | ) | (4,446 | ) | (5,163 | ) | 93,019 | |||||||||||||||
Loss from equity method investments, net |
| | | | 2,527 | 2,527 | ||||||||||||||||||
Interest expense, net |
| | | | (12,599 | ) | (12,599 | ) | ||||||||||||||||
Other, net |
| | | | (799 | ) | (799 | ) | ||||||||||||||||
|
|
|
|
|
|
|
|
|
|
|
|
|||||||||||||
Income (loss) from continuing operations before income taxes |
$ | 91,427 | $ | 24,559 | $ | (13,358 | ) | $ | (4,446 | ) | $ | (16,034 | ) | $ | 82,148 | |||||||||
|
|
|
|
|
|
|
|
|
|
|
|
13
OUTERWALL INC.
BUSINESS SEGMENTS AND ENTERPRISEWIDE INFORMATION
(unaudited)
Dollars in thousands | ||||||||||||||||||||||||
Year Ended December 31, 2015 | Redbox | Coinstar | ecoATM | All Other | Corporate Unallocated |
Total | ||||||||||||||||||
Revenue |
$ | 1,760,899 | $ | 318,611 | $ | 113,558 | $ | 143 | $ | | $ | 2,193,211 | ||||||||||||
Expenses: |
||||||||||||||||||||||||
Direct operating |
1,213,744 | 159,211 | 113,141 | 4,431 | 2,561 | 1,493,088 | ||||||||||||||||||
Marketing |
19,804 | 5,566 | 8,481 | 1,128 | 695 | 35,674 | ||||||||||||||||||
Research and development |
| | 5,545 | (84 | ) | 1,737 | 7,198 | |||||||||||||||||
General and administrative |
129,013 | 31,561 | 10,875 | 7,188 | 11,756 | 190,393 | ||||||||||||||||||
Restructuring and related costs |
23,540 | 2,076 | 687 | 850 | | 27,153 | ||||||||||||||||||
Goodwill impairment |
| | 85,890 | | | 85,890 | ||||||||||||||||||
|
|
|
|
|
|
|
|
|
|
|
|
|||||||||||||
Segment operating income (loss) |
374,798 | 120,197 | (111,061 | ) | (13,370 | ) | (16,749 | ) | 353,815 | |||||||||||||||
Less: depreciation and amortization |
(118,902 | ) | (31,871 | ) | (26,382 | ) | (7,785 | ) | | (184,940 | ) | |||||||||||||
|
|
|
|
|
|
|
|
|
|
|
|
|||||||||||||
Operating income (loss) |
255,896 | 88,326 | (137,443 | ) | (21,155 | ) | (16,749 | ) | 168,875 | |||||||||||||||
Loss from equity method investments, net |
| | | | (800 | ) | (800 | ) | ||||||||||||||||
Interest expense, net |
| | | | (42,353 | ) | (42,353 | ) | ||||||||||||||||
Other, net |
| | | | (2,657 | ) | (2,657 | ) | ||||||||||||||||
|
|
|
|
|
|
|
|
|
|
|
|
|||||||||||||
Income (loss) from continuing operations before income taxes |
$ | 255,896 | $ | 88,326 | $ | (137,443 | ) | $ | (21,155 | ) | $ | (62,559 | ) | $ | 123,065 | |||||||||
|
|
|
|
|
|
|
|
|
|
|
|
Dollars in thousands | ||||||||||||||||||||||||
Year Ended December 31, 2014 | Redbox | Coinstar | ecoATM | All Other | Corporate Unallocated |
Total | ||||||||||||||||||
Revenue |
$ | 1,881,718 | $ | 315,628 | $ | 94,187 | $ | 53 | $ | | $ | 2,291,586 | ||||||||||||
Expenses: |
||||||||||||||||||||||||
Direct operating |
1,318,509 | 161,214 | 92,182 | 2,821 | 6,585 | 1,581,311 | ||||||||||||||||||
Marketing |
20,969 | 6,346 | 3,513 | 1,272 | 3,193 | 35,293 | ||||||||||||||||||
Research and development |
120 | 531 | 5,691 | 2,854 | 3,851 | 13,047 | ||||||||||||||||||
General and administrative |
135,554 | 26,989 | 12,773 | 3,522 | 11,658 | 190,496 | ||||||||||||||||||
Restructuring and related costs |
534 | 23 | | | | 557 | ||||||||||||||||||
|
|
|
|
|
|
|
|
|
|
|
|
|||||||||||||
Segment operating income (loss) |
406,032 | 120,525 | (19,972 | ) | (10,416 | ) | (25,287 | ) | 470,882 | |||||||||||||||
Less: depreciation and amortization |
(149,236 | ) | (35,471 | ) | (17,031 | ) | (740 | ) | | (202,478 | ) | |||||||||||||
|
|
|
|
|
|
|
|
|
|
|
|
|||||||||||||
Operating income (loss) |
256,796 | 85,054 | (37,003 | ) | (11,156 | ) | (25,287 | ) | 268,404 | |||||||||||||||
Loss from equity method investments, net |
| | | | (28,734 | ) | (28,734 | ) | ||||||||||||||||
Interest expense, net |
| | | | (47,644 | ) | (47,644 | ) | ||||||||||||||||
Other, net |
| | | | (1,185 | ) | (1,185 | ) | ||||||||||||||||
|
|
|
|
|
|
|
|
|
|
|
|
|||||||||||||
Income (loss) from continuing operations before income taxes |
$ | 256,796 | $ | 85,054 | $ | (37,003 | ) | $ | (11,156 | ) | $ | (102,850 | ) | $ | 190,841 | |||||||||
|
|
|
|
|
|
|
|
|
|
|
|
14
APPENDIX A
Non-GAAP Financial Measures
Non-GAAP measures may be provided as a complement to results provided in accordance with United States generally accepted accounting principles (GAAP).
We use the following non-GAAP financial measures to evaluate our financial results:
| Core adjusted EBITDA from continuing operations; |
| Core diluted earnings per share (EPS) from continuing operations; |
| Free cash flow; and |
| Net debt and net leverage ratio. |
These measures, the definitions of which are presented below, are non-GAAP because they exclude certain amounts which are included in the most directly comparable measure calculated and presented in accordance with GAAP. Our non-GAAP financial measures are not meant to be considered in isolation or as a substitute for our GAAP financial measures and may not be comparable with similarly titled measures of other companies.
Core and Non-Core Results
We distinguish our core activities, those associated with our primary operations which we directly control, from non-core activities. Non-core activities are primarily nonrecurring events or events we do not directly control. Our non-core adjustments for the periods presented include i) goodwill impairment, ii) restructuring costs (including severance and contract termination costs, that include early lease terminations and the related asset impairments) associated with actions to reduce costs in our continuing operations across the Company, iii) acquisition costs related to the acquisition of Gazelle, iv) compensation expense for rights to receive cash issued in conjunction with our acquisition of ecoATM and attributable to post-combination services as they are fixed amount acquisition related awards and not indicative of the directly controllable future business results, v) income or loss from equity method investments, which represents our share of income or loss from entities we do not consolidate or control, vi) gain on bargain purchase of Gazelle, vii) tax benefits related to a net operating loss adjustment and a worthless stock deduction (Non-Core Adjustments).
We believe investors should consider our core results because they are more indicative of our ongoing performance and trends, are more consistent with how management evaluates our operational results and trends, provide meaningful supplemental information to investors through the exclusion of certain expenses which are either nonrecurring or may not be indicative of our directly controllable business operating results, allow for greater transparency in assessing our performance, help investors better analyze the results of our business and assist in forecasting future periods.
15
Core Adjusted EBITDA from continuing operations
Our non-GAAP financial measure core adjusted EBITDA from continuing operations is defined as earnings from continuing operations before depreciation, amortization and other; interest expense, net; income taxes; share-based payments expense; and Non-Core Adjustments.
A reconciliation of core adjusted EBITDA from continuing operations to net income from continuing operations, the most comparable GAAP financial measure, is presented in the following table:
Three Months Ended | Year Ended | |||||||||||||||
December 31, | December 31, | |||||||||||||||
Dollars in thousands | 2015 | 2014 | 2015 | 2014 | ||||||||||||
Net income from continuing operations |
$ | 17,050 | $ | 51,115 | $ | 49,446 | $ | 124,677 | ||||||||
Depreciation, amortization and other |
47,274 | 48,997 | 184,940 | 202,478 | ||||||||||||
Interest expense, net |
6,126 | 12,599 | 42,353 | 47,644 | ||||||||||||
Income tax expense |
8,664 | 31,033 | 73,619 | 66,164 | ||||||||||||
Share-based payments expense(1) |
5,252 | 3,291 | 17,377 | 13,384 | ||||||||||||
|
|
|
|
|
|
|
|
|||||||||
Adjusted EBITDA from continuing operations |
84,366 | 147,035 | 367,735 | 454,347 | ||||||||||||
Non-Core Adjustments: |
||||||||||||||||
Goodwill impairment |
| | 85,890 | | ||||||||||||
Restructuring and related costs |
11,302 | | 27,153 | 469 | ||||||||||||
Acquisition costs |
342 | | 342 | | ||||||||||||
Rights to receive cash issued in connection with the acquisition of ecoATM |
575 | 3,237 | 4,354 | 13,270 | ||||||||||||
(Income) loss from equity method investments, net |
207 | (2,527 | ) | 800 | 28,734 | |||||||||||
Gain on purchase of Gazelle |
(989 | ) | | (989 | ) | | ||||||||||
|
|
|
|
|
|
|
|
|||||||||
Core adjusted EBITDA from continuing operations |
$ | 95,803 | $ | 147,745 | $ | 485,285 | $ | 496,820 | ||||||||
|
|
|
|
|
|
|
|
(1) | Includes both non-cash share-based compensation for executives, non-employee directors and employees as well as share-based payments for content arrangements. |
16
Core Diluted EPS from continuing operations
Our non-GAAP financial measure core diluted EPS from continuing operations is defined as diluted earnings per share from continuing operations utilizing the treasury stock method excluding non-core adjustments, net of applicable taxes.
A reconciliation of core diluted EPS from continuing operations to diluted EPS from continuing operations, the most comparable GAAP financial measure, is presented in the following table:
Three Months Ended | Year Ended | |||||||||||||||
December 31, | December 31, | |||||||||||||||
2015 | 2014 | 2015 | 2014 | |||||||||||||
Diluted EPS from continuing operations per common share (two-class method) |
$ | 1.00 | $ | 2.68 | $ | 2.75 | $ | 5.89 | ||||||||
Adjustment from participating securities allocation and share differential to treasury stock method(1) |
0.02 | 0.06 | 0.05 | 0.13 | ||||||||||||
|
|
|
|
|
|
|
|
|||||||||
Diluted EPS from continuing operations (treasury stock method) |
1.02 | 2.74 | 2.80 | 6.02 | ||||||||||||
Non-Core Adjustments, net of tax:(1) |
||||||||||||||||
Goodwill impairment |
| | 4.87 | | ||||||||||||
Restructuring and related costs |
0.42 | | 0.94 | 0.01 | ||||||||||||
Acquisition costs |
0.01 | | 0.01 | | ||||||||||||
Rights to receive cash issued in connection with the acquisition of ecoATM |
0.03 | 0.17 | 0.17 | 0.53 | ||||||||||||
(Income) loss from equity method investments, net |
0.01 | (0.08 | ) | 0.03 | 0.85 | |||||||||||
Gain on purchase of Gazelle |
(0.06 | ) | | (0.05 | ) | | ||||||||||
Tax benefits from net operating loss adjustment and worthless stock deduction |
| | | (0.15 | ) | |||||||||||
|
|
|
|
|
|
|
|
|||||||||
Core diluted EPS from continuing operations |
$ | 1.43 | $ | 2.83 | $ | 8.77 | $ | 7.26 | ||||||||
|
|
|
|
|
|
|
|
(1) | Non-Core Adjustments are presented after-tax using the applicable effective tax rate for the respective periods. |
A reconciliation of amounts used in calculating core diluted EPS from continuing operations in the table above is presented in the following table:
Three Months Ended | Year Ended | |||||||||||||||
December 31, | December 31, | |||||||||||||||
In thousands | 2015 | 2014 | 2015 | 2014 | ||||||||||||
Income from continuing operations attributable to common shares |
$ | 16,602 | $ | 49,462 | $ | 48,117 | $ | 120,748 | ||||||||
Add: income from continuing operations allocated to participating securities |
448 | 1,653 | 1,329 | 3,929 | ||||||||||||
|
|
|
|
|
|
|
|
|||||||||
Income from continuing operations |
$ | 17,050 | $ | 51,115 | $ | 49,446 | $ | 124,677 | ||||||||
|
|
|
|
|
|
|
|
|||||||||
Weighted average diluted common shares |
16,575 | 18,473 | 17,487 | 20,503 | ||||||||||||
Add: diluted common equivalent shares of participating securities |
106 | 187 | 155 | 196 | ||||||||||||
|
|
|
|
|
|
|
|
|||||||||
Weighted average diluted shares (treasury stock method) |
16,681 | 18,660 | 17,642 | 20,699 | ||||||||||||
|
|
|
|
|
|
|
|
17
Free Cash Flow
Our non-GAAP financial measure free cash flow is defined as net cash provided by operating activities after capital expenditures. We believe free cash flow is an important non-GAAP measure as it provides additional information to users of the financial statements regarding our ability to service, incur or pay down indebtedness and repurchase our securities. A reconciliation of free cash flow to net cash provided by operating activities, the most comparable GAAP financial measure, is presented in the following table:
Three Months Ended | Year Ended | |||||||||||||||
December 31, | December 31, | |||||||||||||||
Dollars in thousands | 2015 | 2014 | 2015 | 2014 | ||||||||||||
Net cash provided by operating activities |
$ | 59,311 | $ | 131,304 | $ | 326,085 | $ | 338,351 | ||||||||
Purchase of property and equipment |
(17,427 | ) | (25,613 | ) | (77,591 | ) | (97,924 | ) | ||||||||
|
|
|
|
|
|
|
|
|||||||||
Free cash flow |
$ | 41,884 | $ | 105,691 | $ | 248,494 | $ | 240,427 | ||||||||
|
|
|
|
|
|
|
|
Net Debt and Net Leverage Ratio
Our non-GAAP financial measure net debt is defined as the total face value of outstanding debt, including capital leases, less cash and cash equivalents held in financial institutions domestically. Our non-GAAP financial measure net leverage ratio is defined as net debt divided by core adjusted EBITDA from continuing operations for the last twelve months (LTM). We believe net debt and net leverage ratio are important non-GAAP measures because they:
| are used to assess the degree of leverage by management; |
| provide additional information to users of the financial statements regarding our ability to service, incur or pay down indebtedness and repurchase our securities as well as additional information about our capital structure; and |
| are reported quarterly to support covenant compliance under our credit agreement. |
A reconciliation of net debt to total outstanding debt including capital leases, the most comparable GAAP financial measure, is presented in the following table:
December 31, | ||||||||
Dollars in thousands | 2015 | 2014 | ||||||
Senior unsecured notes(1) |
$ | 608,908 | $ | 650,000 | ||||
Term loans(1) |
136,875 | 146,250 | ||||||
Revolving line of credit |
140,500 | 160,000 | ||||||
Capital leases |
5,889 | 15,391 | ||||||
|
|
|
|
|||||
Total principal value of outstanding debt including capital leases |
892,172 | 971,641 | ||||||
Less domestic cash and cash equivalents held in financial institutions |
(46,192 | ) | (66,546 | ) | ||||
|
|
|
|
|||||
Net debt |
845,980 | 905,095 | ||||||
LTM Core adjusted EBITDA from continuing operations |
$ | 485,285 | $ | 496,820 | ||||
|
|
|
|
|||||
Net leverage ratio |
1.74 | 1.82 |
(1) | The senior unsecured notes on our Consolidated Balance Sheets as of December 31, 2015 and December 31, 2014 included $6.3 million and $8.4 million in associated debt discount, respectively. The Term loan on our Consolidated Balance Sheets as of December 31, 2015 and December 31, 2014 included $0.3 million and $0.3 million in associated debt discount, respectively. |
18
Exhibit 99.2
Outerwall Inc. 2015 Fourth Quarter and Full Year Earnings
Prepared Remarks
February 4, 2016
Today, February 4, 2016, Outerwall Inc. issued a press release announcing financial results for the 2015 fourth quarter and full year. The following prepared remarks provide additional information related to the companys operating and financial performance as well as full year 2016 guidance.
The company will host a conference call today at 2:30 p.m. PST to discuss 2015 fourth quarter and full year results and full year 2016 guidance.
The earnings press release, prepared remarks and conference call webcast are available on the Investor Relations section of Outerwalls website at ir.outerwall.com.
Safe Harbor for Forward-Looking Statements
Certain statements in these prepared remarks are forward-looking statements within the meaning of the Private Securities Litigation Reform Act of 1995. The words believe, estimate, expect, intend, will, anticipate, goals, variations of such words, and similar expressions identify forward-looking statements, but their absence does not mean that the statement is not forward-looking. The forward-looking statements in this release include statements regarding Outerwall Inc.s anticipated growth and future operating results, including 2016 full year results. Forward-looking statements are not guarantees of future performance and actual results may vary materially from the results expressed or implied in such statements. Differences may result from actions taken by Outerwall Inc. or its subsidiaries, as well as from risks and uncertainties beyond Outerwall Inc.s control. Such risks and uncertainties include, but are not limited to,
| competition from other entertainment providers, |
| the ability to achieve the strategic and financial objectives for our entry into new businesses, including ecoATM and Gazelle, |
| the timing of the release slate and the relative attractiveness of titles in a particular quarter or year, |
| our ability to repurchase stock and the availability of an open trading window, |
| our declaration and payment of dividends, including our boards discretion to change the dividend policy, |
| the termination, non-renewal or renegotiation on materially adverse terms of our contracts with our significant retailers and suppliers, |
| payment of increased fees to retailers, suppliers and other third-party providers, including financial service providers, |
| the timing of new DVD releases and the inability to receive delivery of DVDs on the date of their initial release to the general public, or shortly thereafter, or in sufficient quantity, for home entertainment viewing, |
| the effective management of our content library, |
| the ability to attract new retailers, penetrate new markets and distribution channels and react to changing consumer demands, |
| loss of key personnel or the inability of replacements to quickly and successfully perform in those new roles, |
| the ability to generate sufficient cash flow to timely and fully service indebtedness and adhere to certain covenants and restrictions, |
| the ability to adequately protect our intellectual property, and |
| the application of substantial federal, state, local and foreign laws and regulations specific to our business. |
The foregoing list of risks and uncertainties is illustrative, but by no means exhaustive. For more information on factors that may affect future performance, please review Risk Factors described in our most recent Annual Report on Form 10-K and any subsequent Quarterly Reports on Form 10-Q filed with the Securities and Exchange Commission. These forward-looking statements reflect Outerwall Inc.s expectations as of the date of these prepared remarks. Outerwall Inc. undertakes no obligation to update the information provided herein.
©2016 Outerwall Inc. All Rights Reserved. These materials may not be reproduced, altered or distributed without the express written consent of Outerwall Inc.
Outerwall Inc. 2015 Fourth Quarter and Full Year Earnings
Prepared Remarks
February 4, 2016
Non-GAAP Financial Measures
Non-GAAP measures may be provided as a complement to results provided in accordance with United States generally accepted accounting principles (GAAP).
We use the following non-GAAP financial measures to evaluate our financial results:
| Core adjusted EBITDA from continuing operations; |
| Core diluted earnings per share (EPS) from continuing operations; |
| Free cash flow; and |
| Net debt and net leverage ratio. |
These measures, the definitions of which are presented in Appendix A, are non-GAAP because they exclude certain amounts which are included in the most directly comparable measure calculated and presented in accordance with GAAP. Our non-GAAP financial measures are not meant to be considered in isolation or as a substitute for our GAAP financial measures and may not be comparable with similarly titled measures of other companies.
Core and Non-Core Results
We distinguish our core activities, those associated with our primary operations which we directly control, from non-core activities. Non-core activities are primarily nonrecurring events or events we do not directly control. Our non-core adjustments for the periods presented include i) goodwill impairment, ii) restructuring costs (including severance and contract termination costs, that include early lease terminations and the related asset impairments) associated with actions to reduce costs in our continuing operations across the Company, iii) acquisition costs related to the acquisition of Gazelle, iv) compensation expense for rights to receive cash issued in conjunction with our acquisition of ecoATM and attributable to post-combination services as they are fixed amount acquisition related awards and not indicative of the directly controllable future business results, v) income or loss from equity method investments, which represents our share of income or loss from entities we do not consolidate or control, vi) gain on bargain purchase of Gazelle, vii) tax benefits related to a net operating loss adjustment and a worthless stock deduction (Non-Core Adjustments).
We believe investors should consider our core results because they are more indicative of our ongoing performance and trends, are more consistent with how management evaluates our operational results and trends, provide meaningful supplemental information to investors through the exclusion of certain expenses which are either nonrecurring or may not be indicative of our directly controllable business operating results, allow for greater transparency in assessing our performance, help investors better analyze the results of our business and assist in forecasting future periods.
Page 2
©2016 Outerwall Inc. All Rights Reserved. These materials may not be reproduced, altered or distributed without the express written consent of Outerwall Inc.
Outerwall Inc. 2015 Fourth Quarter and Full Year Earnings
Prepared Remarks
February 4, 2016
Overview
Outerwall remains one of the largest U.S. retailers with more than 60,000 kiosks, and, in addition, has more than 35 million active customers and a digital distribution network of more than 50 million touchpoints. During 2015, we delivered strong financial results despite the impact of a challenging fourth quarter for Redbox. Coinstar continued to generate solid profitability and cash flow and during the year we refocused ecoATM from scaling to moving toward profitability. As a result, we managed margins and drove profitability and free cash flow for the year. At the same time, we continued our balanced approach to capital allocation through the introduction of a quarterly cash dividend and repurchasing both shares and bonds.
2015 Consolidated Results
The year-over-year comparisons we make in these prepared remarks will be 2015 versus 2014 and the quarter-over-quarter comparisons will be Q4 2015 versus Q4 2014 unless otherwise noted.
Our 2015 GAAP results include a non-cash, non-tax deductible goodwill impairment charge of $85.9 million taken in Q2 related to our ecoATM business and $27.2 million of one-time restructuring and related costs recorded over the year, as we continued to align costs with revenue across the enterprise.
Year Ended December 31, |
Change | |||||||||||
(In millions, except per share data) |
2015 | 2014 | % | |||||||||
GAAP Results |
||||||||||||
Consolidated revenue |
$ | 2,193.2 | $ | 2,291.6 | (4.3 | )% | ||||||
Income from continuing operations |
$ | 49.4 | $ | 124.7 | (60.3 | )% | ||||||
Net income |
$ | 44.3 | $ | 106.6 | (58.4 | )% | ||||||
Diluted earnings from continuing operations per common share* |
$ | 2.75 | $ | 5.89 | (53.3 | )% | ||||||
Net cash provided by operating activities |
$ | 326.1 | $ | 338.4 | (3.6 | )% | ||||||
Core Results** |
||||||||||||
Core adjusted EBITDA from continuing operations |
$ | 485.3 | $ | 496.8 | (2.3 | )% | ||||||
Core diluted EPS from continuing operations* |
$ | 8.77 | $ | 7.26 | 20.8 | % | ||||||
Free cash flow (FCF) |
$ | 248.5 | $ | 240.4 | 3.4 | % |
* | Beginning in Q1 2015, we applied the two-class method of calculating earnings per share for our GAAP results because the impact of unvested restricted shares as a percentage of total common shares outstanding became more dilutive given the level of stock repurchases over the prior year. Core diluted EPS from continuing operations continues to be reported under the treasury stock method |
** | Refer to Appendix A for a discussion of the Use of Non-GAAP Financial Measures and Core and Non-Core Results |
Highlights for 2015 include:
| We generated $248.5 million in free cash flow, 3.4% higher than 2014 despite a 4.3% decline in revenue as we maintained our focus on operational excellence and expense management |
| We delivered $485.3 million in core adjusted EBITDA from continuing operations, which was down $11.5 million from the prior year, despite $98.4 million less in revenue |
| We acquired certain assets and liabilities of Gazelle, Inc. and closed the transaction in Q4 |
| We repurchased approximately 2.5 million shares for $159.8 million and paid $21.3 million in cash quarterly dividends returning approximately 73% of FCF to shareholders |
| We opportunistically repurchased $41 million in face value of bonds in Q4 |
Page 3
©2016 Outerwall Inc. All Rights Reserved. These materials may not be reproduced, altered or distributed without the express written consent of Outerwall Inc.
Outerwall Inc. 2015 Fourth Quarter and Full Year Earnings
Prepared Remarks
February 4, 2016
Q4 Consolidated Results
During Q4 we had approximately $11.3 million in one-time restructuring and related costs, including costs associated with organizational changes at Redbox and ecoATM, and an $8.5 million one-time payment to settle an outstanding purchase commitment with NCR. These costs have been allocated to the lines of business and are included in Q4 segment operating results.
Three Months Ended December 31, |
Change | |||||||||||
(In millions, except per share data) |
2015 | 2014 | % | |||||||||
GAAP Results |
||||||||||||
Consolidated revenue |
$ | 527.2 | $ | 597.4 | (11.8 | )% | ||||||
Income from continuing operations |
$ | 17.1 | $ | 51.1 | (66.6 | )% | ||||||
Net income |
$ | 17.0 | $ | 43.8 | (61.1 | )% | ||||||
Diluted earnings from continuing operations per common share* |
$ | 1.00 | $ | 2.68 | (62.7 | )% | ||||||
Net cash provided by operating activities |
$ | 59.3 | $ | 131.3 | (54.8 | )% | ||||||
Core Results** |
||||||||||||
Core adjusted EBITDA from continuing operations |
$ | 95.8 | $ | 147.7 | (35.2 | )% | ||||||
Core diluted EPS from continuing operations* |
$ | 1.43 | $ | 2.83 | (49.5 | )% | ||||||
Free cash flow |
$ | 41.9 | $ | 105.7 | (60.4 | )% |
* | Beginning in Q1 2015, we applied the two-class method of calculating earnings per share for our GAAP results because the impact of unvested restricted shares as a percentage of total common shares outstanding became more dilutive given the level of stock repurchases over the prior year. Core diluted EPS from continuing operations continues to be reported under the treasury stock method |
** | Refer to Appendix A for a discussion of the Use of Non-GAAP Financial Measures and Core and Non-Core Results |
Capital Allocation
During 2015, we took a balanced approach to managing our capital structure that included returning capital to shareholders through repurchasing shares and paying a quarterly cash dividend, acquiring the assets of Gazelle to help move ecoATM to profitability, and repurchasing bonds, while lowering our net leverage ratio1 to 1.74x through a reduction in total debt.
For the year, we repurchased approximately 2.5 million shares of our common stock, which represented 13.3% of total shares outstanding at the beginning of 2015. The shares were purchased at an average price of $63.56 per share for $159.8 million. This includes 673,821 shares repurchased in Q4 at an average price of $53.89 per share. As of December 31, 2015, there was approximately $256.4 million in authority remaining under our current stock repurchase program.
During Q4 we also repurchased 41,092 of our 5.875% Senior Notes due 2021 for $34.6 million. The outstanding principal balance has been reduced to $258.9 million. The gain from the early extinguishment of these notes was $5.9 million and is included in net interest expense.
In the first quarter of 2015, we initiated a quarterly dividend of $0.30 per share and during the year paid a total of $21.3 million in cash dividends. Today we announced that we will pay another quarterly dividend of $0.30 per share, reflecting our ongoing confidence in the prospects of the company and our continued ability to generate profitability and cash flow.
1 | Refer to Appendix A for a discussion of the Use of Non-GAAP Financial Measures and Core and Non-Core Results |
Page 4
©2016 Outerwall Inc. All Rights Reserved. These materials may not be reproduced, altered or distributed without the express written consent of Outerwall Inc.
Outerwall Inc. 2015 Fourth Quarter and Full Year Earnings
Prepared Remarks
February 4, 2016
In 2016, we plan to return 75% to 100% of annual free cash flow to investors through share repurchases, dividends and senior note repurchases.
Capital Expenditures
In Q4 our total investment in capital expenditures (CAPEX) on an accrual basis was $18.3 million, primarily reflecting investments to optimize and support our Redbox, Coinstar and ecoATM kiosk networks and corporate investments in technology, equipment and facilities, bringing the total for 2015 to $75.0 million. The following is a breakdown of CAPEX by category for Q4:
Q4 2015 CAPEX (Accrual Basis) |
||||||||||||||||
(In millions) | New | Maintenance | Other | Total | ||||||||||||
Redbox |
$ | 1.5 | $ | 2.0 | $ | 2.2 | $ | 5.7 | ||||||||
Coinstar |
1.4 | 2.6 | | 4.0 | ||||||||||||
ecoATM |
1.4 | | | 1.4 | ||||||||||||
All Other |
0.3 | | | 0.3 | ||||||||||||
Corporate |
| | 6.9 | 6.9 | ||||||||||||
|
|
|
|
|
|
|
|
|||||||||
TOTAL |
$ | 4.6 | $ | 4.6 | $ | 9.1 | $ | 18.3 |
Additional Q4 Consolidated Metrics
Metric |
Amount | Comment | ||||
Total net interest expense |
$ | 6.1 | MM | Includes $0.7MM in noncash interest expense and a $5.9MM gain on early extinguishment of debt | ||
Core effective tax rate |
35.8 | % | ||||
Cash and cash equivalents |
$ | 222.5 | MM | Includes $83.3MM payable to retailer partners; additionally, $46.2MM of total cash was held in financial institutions domestically | ||
Total principal value of outstanding debt, including capital leases |
$ | 892.2 | MM | |||
Net leverage ratio* |
1.74 | x |
* | Refer to Appendix A for a discussion of Use of Non-GAAP Financial Measures and Core and Non-Core Results |
Page 5
©2016 Outerwall Inc. All Rights Reserved. These materials may not be reproduced, altered or distributed without the express written consent of Outerwall Inc.
Outerwall Inc. 2015 Fourth Quarter and Full Year Earnings
Prepared Remarks
February 4, 2016
Q4 2015 SEGMENT OPERATING RESULTS Redbox
Key Metrics
Category |
Q4 2015 | Q4 2014 | ||||||
Revenue |
$ | 407.0 | MM | $ | 490.7 | MM | ||
Rentals |
135.8 | MM | 179.5 | MM | ||||
Net revenue per rental |
$ | 2.98 | $ | 2.73 | ||||
Same store sales growth (decline) |
(16.0 | ) % | (1.3 | ) % | ||||
Gross margin |
52.1 | % | 58.3 | % | ||||
Segment operating income |
$ | 62.6 | MM | $ | 125.8 | MM | ||
Segment operating margin |
15.4 | % | 25.6 | % | ||||
Unique credit cards renting in quarter |
32.4 | MM | 39.1 | MM | ||||
Total kiosks (at quarter end) |
40,480 | 42,280 | ||||||
Total locations (at quarter end) |
33,060 | 34,740 | ||||||
Blu-ray |
||||||||
Blu-ray as percentage of rentals |
15.2 | % | 15.3 | % | ||||
Blu-ray as percentage of Redbox revenue |
18.5 | % | 18.3 | % |
In December, we lowered full year revenue and profitability guidance based on preliminary November results and expectations for December, as customers did not return to their normal rental patterns as quickly as anticipated following successive quarters of weak content. Profitability was impacted by the lower level of rentals as well as increased promotional spend and additional content purchases for Q4, which were implemented to encourage consumers to return to normal rental patterns. We believe that Redbox continues to offer a compelling value proposition, providing new releases to consumers at a great value. We are committed to taking the necessary actions to position the business for continued success by managing it to drive profitability and generate cash flow, with disciplined expense management and targeted, strategic investments to extend the Redbox brand.
Q4 Redbox revenue was down $83.7 million or 17.1%, reflecting the impact of a 24.3% year-over-year decline in rentals driven by several factors, including:
| higher impact from secular decline in the physical market, which we believe was low double digits and was evidenced by a slower recovery in high frequency renters than expected; |
| historically low Q3 box office negatively impacting Q4 and 8 fewer titles in Q4 2015 versus a year ago; |
| lower demand from price-sensitive customers in the first two months of the quarter and a greater impact in December relative to last year when we took the price increase; |
| consumer transition to new generation platforms in our video games rental business; and |
| the removal of underperforming kiosks. |
Due to the poor content in Q3 2015, unique customers were at the lowest point of the year coming into Q4. Although box office was 8.5% higher in Q4 2015 compared with Q4 2014, it was not enough to generate the heightened level of rentals we expected since nearly half the total box office for the quarter, or $1.8 billion, was driven by four major releases, Jurassic World, Avengers: Age of Ultron, Inside Out, and Furious 7. Historically, blockbuster titles have not rented as well at Redbox as they perform in theaters since many customers have already seen the movies in theaters or purchased them. Excluding those four titles, Q4 box office was down 42.7% year-over-year.
Page 6
©2016 Outerwall Inc. All Rights Reserved. These materials may not be reproduced, altered or distributed without the express written consent of Outerwall Inc.
Outerwall Inc. 2015 Fourth Quarter and Full Year Earnings
Prepared Remarks
February 4, 2016
As a result, unique credit cards renting decreased 17.1% year-over-year and 1.7% from Q3 2015 to 32.4 million, in line with the lower rental demand. Further, high frequency renters (HFR), customers that rent four or more titles per quarter, represented 47.3% of revenue in Q4 2015, a decline from 54.0% last year, but up from 46.0% sequentially. Although HFRs have been declining, new cards renting represented 23.0% of all cards, which is similar to Q4 2014, as Redbox continues to acquire new customers and reactivate lapsed customers. Further, our Play Pass loyalty program grew 15.7% to 3.2 million customers or 10.0% of our unique cards. Play Pass has been a successful program for Redbox with Play Pass customers renting more frequently than the average customer. Redbox will continue to leverage customer relationships and make targeted investments in technology to grow the Play Pass program and attract more customers.
Q4 net revenue per rental, or average check, increased 9.2% year-over-year to $2.98, driven primarily by the price increases. On a full year basis, the price increases drove an 11.4% net revenue lift. The higher price points were partially offset by the expected increase in single-night rentals, which represented 61.3% of total rentals in Q4, an increase of approximately 320 basis points year-over-year. Q4 average check for movies was lower relative to the rest of the year due to increased promotions. We increased our investment in customer-specific promotions to re-engage customers following several quarters of weak content and to lessen the impact of the decline in demand from the price increase and increased competition. While we did not experience the benefit to rentals that we expected, promotions helped increase consumer engagement. As a result, our customer touchpoints continue to grow, with our marketable email addresses reaching 41.5 million, up 5.4% from Q4 2014 and 1.5% sequentially.
Despite 3 fewer Blu-ray titles, year-over-year Blu-ray increased approximately 20 basis points as a percentage of revenue due to the price increase. As a percentage of overall rentals, Blu-ray comprised 15.2% in Q4 2015, in line with last year.
In Q4 Redbox segment operating income decreased 50.2% to $62.6 million and segment operating margin declined 10.2 percentage points to 15.4% driven primarily by lower gross margin and higher marketing expenses, as well as $8.4 million in one-time restructuring and related costs, which include the NCR purchase commitment settlement costs. Without the restructuring costs, Q4 Redbox segment operating margin would have been 210 basis points higher. Gross margin decreased 620 basis points year-over-year to 52.1%, reflecting higher content purchases exacerbated by lower than expected rentals. While some of the product cost from Q4 will impact Q1 2016 gross margin, we will continue to refine our purchases to optimize margins.
Video Games Rentals and Revenue
Video Games Performance |
Q4 2015 | Q4 2014 | ||||||
Percentage of rentals |
2.8 | % | 2.6 | % | ||||
Percentage of Redbox revenue |
5.9 | % | 5.8 | % |
Although the video game market continues its transition to new generation consoles, Redbox game rentals and revenues improved as a percentage of overall rentals and revenue on a year-over-year basis. The improvement shows positive momentum despite 3 fewer unique game titles released at Redbox in Q4 2015 compared with Q4 2014, partially driven by growing interest in new generation video games as well as the
Page 7
©2016 Outerwall Inc. All Rights Reserved. These materials may not be reproduced, altered or distributed without the express written consent of Outerwall Inc.
Outerwall Inc. 2015 Fourth Quarter and Full Year Earnings
Prepared Remarks
February 4, 2016
price increase implemented in January 2015. New generation rentals represented 77.8% of all game rentals in Q4 2015, up from only 7.0% in Q4 2014. During the week of Christmas, Redbox video game rentals were 83.7% above same week rentals in 2014. Approximately 60% of Redbox video game renters in November and December were new customers compared with 54% during the same period in 2014. As the new generation console base continues to grow, Redbox can play a critical role in increasing mainstream consumer adoption of the new formats, providing value to both our industry partners and customers. Video games remain a key component of the Redbox strategy and we will continue to focus on growing demand while maintaining profitability.
Q4 2015 SEGMENT OPERATING RESULTS Coinstar
Key Metrics
Category |
Q4 2015 | Q4 2014 | ||||||
Revenue |
$ | 83.3 | MM | $ | 81.9 | MM | ||
Average transaction |
$ | 46.02 | $ | 44.45 | ||||
Transactions |
17.5 | MM | 17.9 | MM | ||||
Same store sales (SSS) growth |
5.6 | % | 3.3 | % | ||||
Segment operating income |
$ | 31.2 | MM | $ | 33.6 | MM | ||
Segment operating margin |
37.5 | % | 41.0 | % | ||||
Kiosks (at quarter end) |
20,930 | 21,340 | ||||||
Locations (at quarter end) |
19,660 | 20,250 |
Coinstar segment revenue increased $1.4 million, or 1.7%, and same store sales increased 2.3 percentage points compared with Q4 2014, reflecting higher U.S. volume. Average transaction size increased $1.57, or 3.5%, consistent with recent trends of larger pours and less frequent visits.
While Coinstar continues to manage costs and create efficiencies, segment operating income decreased $2.3 million, or 6.9%, resulting in lower segment operating margin of 37.5%, which was down 350 basis points. The year-over-year decrease reflects higher shared services allocations, including a $1.5 million increase in one-time restructuring and related costs that reflect actions to further align costs with revenue.
Q4 2015 SEGMENT OPERATING RESULTS ecoATM
Gazelle Acquisition
ecoATMs Q4 segment results reflect the acquisition of certain assets and liabilities of Gazelle, Inc., which was finalized in November. Gazelle is an online solution for the sale and purchase of used mobile phones, computers and tablets for cash through www.gazelle.com. The business combination provides ecoATM with a direct-to-consumer channel for collected devices and enhanced capabilities, such as refurbishment. We believe the combination will provide margin and revenue uplift opportunities enabling ecoATM to get to profitability quicker. Gazelle is focused on collections of higher value devices, offering a delayed cash option for less time-sensitive consumers. Initial testing has shown there is incremental revenue and margin by selling certain devices collected at the kiosk through the direct-to-consumer storefront. As the two businesses become fully integrated, we expect to increase the number of devices sold directly to consumers.
Page 8
©2016 Outerwall Inc. All Rights Reserved. These materials may not be reproduced, altered or distributed without the express written consent of Outerwall Inc.
Outerwall Inc. 2015 Fourth Quarter and Full Year Earnings
Prepared Remarks
February 4, 2016
The assets we acquired include the rights to the Gazelle brand, device inventory on hand at the time of acquisition and the infrastructure developed for device acquisition and sales through the direct-to-consumer and online marketplace channels such as eBay and Amazon.
The purchase price was approximately $18.0 million in cash. A summary of the purchase price allocation follows:
Dollars in thousands |
November 10, 2015 |
|||
Total consideration transferred |
$ | 17,980 | ||
Assets acquired: |
||||
Accounts receivable |
$ | 67 | ||
Prepaid expenses and other current assets |
3,963 | |||
Property and equipment |
252 | |||
Intangible assets |
16,000 | |||
|
|
|||
Total assets acquired |
20,282 | |||
|
|
|||
Liabilities assumed: |
||||
Deferred revenue |
(750 | ) | ||
Deferred tax liabilities |
(563 | ) | ||
|
|
|||
Total liabilities assumed |
(1,313 | ) | ||
|
|
|||
Total net assets acquired |
$ | 18,969 | ||
|
|
|||
Bargain purchase gain |
$ | 989 | ||
|
|
The $16.0 million for intangible assets includes $14.0 million for the Gazelle trade name and $2.0 million for developed technology that will be amortized over 10 years and 3 years, respectively.
Key Metrics
Category |
Q4 2015 | Q4 2014 | ||||||
Revenue |
$ | 36.8 | MM | $ | 24.7 | MM | ||
Segment operating loss |
$ | (6.8 | ) MM | $ | (8.1 | ) MM | ||
ASP of value devices sold |
$ | 61.70 | $ | 59.77 | ||||
Number of value devices sold |
625,756 | 404,138 | ||||||
Number of overall devices sold |
797,055 | 598,980 | ||||||
Kiosks (at quarter end) |
2,250 | 1,890 | ||||||
Locations (at quarter end) |
2,020 | 1,660 |
During Q4 we continued to focus on managing the business for profitability and, based on what we experienced, believe we will accelerate our progress as we integrate Gazelle into the business. The team, which includes experienced leaders from Gazelle, is focused on improving performance, reducing operating costs and consolidating overhead expenses.
In Q4 we installed 40 net new ecoATM kiosks, with the majority in the mass merchant channel, as we continued to optimize our kiosk network and redeploy kiosks to more productive locations. In 2015 we redeployed a total of 320 kiosks.
Overall wholesale pricing recovered several months sooner than we expected following the iPhone launch in September compared with last year, which we believe was due to the lower iPhone 6s and 6s Plus sales.
Page 9
©2016 Outerwall Inc. All Rights Reserved. These materials may not be reproduced, altered or distributed without the express written consent of Outerwall Inc.
Outerwall Inc. 2015 Fourth Quarter and Full Year Earnings
Prepared Remarks
February 4, 2016
In Q4 ecoATM segment revenue increased 48.9% compared with Q4 2014, primarily due to revenue generated from Gazelle following the close of the acquisition. Higher value device collections were down year-over-year, which is consistent with what we had seen throughout 2015 due to the lower foot traffic at our kiosks. However, since Gazelle focuses on fewer SKUs and high value devices, we expect collections of higher value devices to increase as we integrate the businesses.
ecoATMs Q4 segment operating results reflect approximately $560,000 in one-time restructuring and related costs, including severance costs, as well as $342,000 in Gazelle deal fees included in G&A.
Q4 segment operating loss decreased year-over-year reflecting our focus on controlling expenses and creating efficiencies. We continue to see improvements in per kiosk fixed expenses as we negotiate new contracts and look for alternative servicing models.
For 2016, our focus is on moving toward segment operating profitability. To accomplish that, we are focused on several key strategies. In terms of kiosks, we plan to continue to remove and redeploy underperforming kiosks to select mass and mall locations. In addition, we expect to complete the integration of Gazelle in the first half of the year, generating operational synergies between the two businesses. Revenue is expected to increase significantly due to having the Gazelle assets for a full year and we expect margin enhancement from selling devices collected at kiosks through the more profitable direct-to-consumer channel.
Guidance
We provide annual guidance only and expect to update our annual guidance as appropriate when we report financial results each quarter. Due to the difficulty in forecasting as a result of the content release schedule, accelerating secular decline and our focus on profitability and cash flow, we are not providing revenue guidance for 2016. We will continue to provide guidance for core adjusted EBITDA from continuing operations, earnings per share from continuing operations and free cash flow. (Exhibit 1)
There are several factors that influence our 2016 expectations, including expected rental decline at Redbox from secular decline, the new release schedule and strength of content for movies and video games, Redboxs success in re-engaging consumers to rent movies, the integration of Gazelle, the redeployment of previously manufactured ecoATM kiosks, and our ability to further align costs with revenue.
For the full-year 2016, we expect:
| core adjusted EBITDA from continuing operations between $340 million and $380 million reflecting the impact of rental decline on Redbox revenue and profitability and flow through into 2016 from the product overbuy in Q4 2015; |
| core diluted earnings per share between $5.00 and $6.30, impacted by the lower expected EBITDA partially offset by lower depreciation from fully depreciated kiosks, which does not reflect any share repurchases we may complete during the year; and |
| free cash flow between $140 million and $190 million driven by lower EBITDA and a negative impact to working capital, partially offset by lower capital expenses. |
Page 10
©2016 Outerwall Inc. All Rights Reserved. These materials may not be reproduced, altered or distributed without the express written consent of Outerwall Inc.
Outerwall Inc. 2015 Fourth Quarter and Full Year Earnings
Prepared Remarks
February 4, 2016
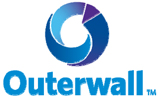
Based on our current view of the upcoming box office releases at Redbox, 2016 box office is expected to be $10.2 billion, up 2.8% from 2015, with 8 more titles released than in 2015, including 11 more in the first half of the year and 3 fewer in the second half of the year. Redbox expects 9 more day and date titles, which generally drive higher rentals but are lower margin percentage titles. In Q3 2016, we expect the lowest box office and number of releases during the year due to the Rio Olympic Games in August. Typically, studios have not released new titles during the summer games, which impacts both rental volume and momentum. Theatrical releases, as well as the release schedule for Redbox titles, will evolve throughout the year and the performance of titles in theaters remains difficult to predict.
Q1 2016 box office is expected to be $3.0 billion, 22.7% below Q4 2015 with 8 more titles, 7 of which are delay titles. (Exhibit 2) Year-over-year, Q1 2016 box office is up 15.8% or $405.7 million from Q1 last year, with 8 more titles. For the year, Q4 2016 is expected to have the highest box office followed by Q1 2016, Q2 2016, and Q3 2016. Consistent with historical patterns, we expect stronger seasonality in the first and fourth quarters of 2016.
We plan to manage the Redbox business for profitability and cash flow in 2016 with disciplined expense management and targeted, strategic investments to extend the Redbox brand. We expect that our continued focus on expense management, operational efficiencies and network optimization will help offset a portion of the expected rental decline. We continue to collaborate with our retail partners to improve kiosk productivity at existing locations and remove unproductive kiosks. We expect to remove between 1,000 and 2,000 Redbox kiosks in 2016, helping to improve revenue per kiosk, while lowering content and servicing costs due to a smaller installed base.
We estimate a 15% to 20% decline in rentals from the secular decline in 2016, which is an increase from what the business experienced in 2015, as consumers shift to other forms of entertainment. Nevertheless, we believe there is a core group of millions of consumers that will continue to rent from Redbox for many years to come.
The new generation console base grew during the 2015 holiday period and Redbox plans to offer greater depth of new generation content in 2016; as a result, we expect video games revenue and rentals to improve year-over-year.
With our focus on moving ecoATM to operating profit breakeven in 2016, we will continue to redeploy underperforming kiosks and expect to install between 50 and 100 kiosks in the mall and mass channels. Since these kiosks were manufactured in previous years, we expect a significant reduction in capital expenditures for ecoATM.
Summary
In 2015 we generated substantial free cash flow despite challenges Redbox faced in the fourth quarter that impacted our consolidated results. In 2016 we are working to optimize Redboxs performance in an environment of secular decline while working to extend the life of this well-known brand for years to come. We will continue to manage expenses, increase productivity and create efficiencies across the enterprise as we focus on generating profitability and cash flow in our Redbox and Coinstar businesses and move the ecoATM business to profitability. We are committed to create additional value for our stakeholders and will continue to balance the needs of our business for prudent investment with our commitment to return capital to investors.
Page 11
©2016 Outerwall Inc. All Rights Reserved. These materials may not be reproduced, altered or distributed without the express written consent of Outerwall Inc.
Appendix A
Non-GAAP Financial Measures
Non-GAAP measures may be provided as a complement to results provided in accordance with United States generally accepted accounting principles (GAAP).
We use the following non-GAAP financial measures to evaluate our financial results:
| Core adjusted EBITDA from continuing operations; |
| Core diluted earnings per share (EPS) from continuing operations; |
| Free cash flow; and |
| Net debt and net leverage ratio. |
These measures, the definitions of which are presented below, are non-GAAP because they exclude certain amounts which are included in the most directly comparable measure calculated and presented in accordance with GAAP. Our non-GAAP financial measures are not meant to be considered in isolation or as a substitute for our GAAP financial measures and may not be comparable with similarly titled measures of other companies.
Core and Non-Core Results
We distinguish our core activities, those associated with our primary operations which we directly control, from non-core activities. Non-core activities are primarily nonrecurring events or events we do not directly control. Our non-core adjustments for the periods presented include i) goodwill impairment, ii) restructuring costs (including severance and contract termination costs, that include early lease terminations and the related asset impairments) associated with actions to reduce costs in our continuing operations across the Company, iii) acquisition costs related to the acquisition of Gazelle, iv) compensation expense for rights to receive cash issued in conjunction with our acquisition of ecoATM and attributable to post-combination services as they are fixed amount acquisition related awards and not indicative of the directly controllable future business results, v) income or loss from equity method investments, which represents our share of income or loss from entities we do not consolidate or control, vi) gain on bargain purchase of Gazelle, vii) tax benefits related to a net operating loss adjustment and a worthless stock deduction (Non-Core Adjustments).
We believe investors should consider our core results because they are more indicative of our ongoing performance and trends, are more consistent with how management evaluates our operational results and trends, provide meaningful supplemental information to investors through the exclusion of certain expenses which are either nonrecurring or may not be indicative of our directly controllable business operating results, allow for greater transparency in assessing our performance, help investors better analyze the results of our business and assist in forecasting future periods.
Page 12
©2016 Outerwall Inc. All Rights Reserved. These materials may not be reproduced, altered or distributed without the express written consent of Outerwall Inc.
Core Adjusted EBITDA from continuing operations
Our non-GAAP financial measure core adjusted EBITDA from continuing operations is defined as earnings from continuing operations before depreciation, amortization and other; interest expense, net; income taxes; share-based payments expense; and Non-Core Adjustments.
A reconciliation of core adjusted EBITDA from continuing operations to net income from continuing operations, the most comparable GAAP financial measure, is presented in the following table:
Three Months Ended | Year Ended | |||||||||||||||
December 31, | December 31, | |||||||||||||||
Dollars in thousands | 2015 | 2014 | 2015 | 2014 | ||||||||||||
Net income from continuing operations |
$ | 17,050 | $ | 51,115 | $ | 49,446 | $ | 124,677 | ||||||||
Depreciation, amortization and other |
47,274 | 48,997 | 184,940 | 202,478 | ||||||||||||
Interest expense, net |
6,126 | 12,599 | 42,353 | 47,644 | ||||||||||||
Income tax expense |
8,664 | 31,033 | 73,619 | 66,164 | ||||||||||||
Share-based payments expense(1) |
5,252 | 3,291 | 17,377 | 13,384 | ||||||||||||
|
|
|
|
|
|
|
|
|||||||||
Adjusted EBITDA from continuing operations |
84,366 | 147,035 | 367,735 | 454,347 | ||||||||||||
Non-Core Adjustments: |
||||||||||||||||
Goodwill impairment |
| | 85,890 | | ||||||||||||
Restructuring and related costs |
11,302 | | 27,153 | 469 | ||||||||||||
Acquisition costs |
342 | | 342 | | ||||||||||||
Rights to receive cash issued in connection with the acquisition of ecoATM |
575 | 3,237 | 4,354 | 13,270 | ||||||||||||
(Income) loss from equity method investments, net |
207 | (2,527 | ) | 800 | 28,734 | |||||||||||
Gain on purchase of Gazelle |
(989 | ) | | (989 | ) | | ||||||||||
|
|
|
|
|
|
|
|
|||||||||
Core adjusted EBITDA from continuing operations |
$ | 95,803 | $ | 147,745 | $ | 485,285 | $ | 496,820 | ||||||||
|
|
|
|
|
|
|
|
(1) | Includes both non-cash share-based compensation for executives, non-employee directors and employees as well as share-based payments for content arrangements. |
Page 13
©2016 Outerwall Inc. All Rights Reserved. These materials may not be reproduced, altered or distributed without the express written consent of Outerwall Inc.
Core Diluted EPS from continuing operations
Our non-GAAP financial measure core diluted EPS from continuing operations is defined as diluted earnings per share from continuing operations excluding Non-Core Adjustments, net of applicable taxes.
A reconciliation of core diluted EPS from continuing operations to diluted EPS from continuing operations, the most comparable GAAP financial measure, is presented in the following table:
Three Months Ended | Year Ended | |||||||||||||||
December 31, | December 31, | |||||||||||||||
2015 | 2014 | 2015 | 2014 | |||||||||||||
Diluted EPS from continuing operations per common share (two-class method) |
$ | 1.00 | $ | 2.68 | $ | 2.75 | $ | 5.89 | ||||||||
Adjustment from participating securities allocation and share differential to treasury stock method(1) |
0.02 | 0.06 | 0.05 | 0.13 | ||||||||||||
|
|
|
|
|
|
|
|
|||||||||
Diluted EPS from continuing operations (treasury stock method) |
1.02 | 2.74 | 2.80 | 6.02 | ||||||||||||
Non-Core Adjustments, net of tax:(1) |
||||||||||||||||
Goodwill impairment |
| | 4.87 | | ||||||||||||
Restructuring and related costs |
0.42 | | 0.94 | 0.01 | ||||||||||||
Acquisition costs |
0.01 | | 0.01 | | ||||||||||||
Rights to receive cash issued in connection with the acquisition of ecoATM |
0.03 | 0.17 | 0.17 | 0.53 | ||||||||||||
(Income) loss from equity method investments, net |
0.01 | (0.08 | ) | 0.03 | 0.85 | |||||||||||
Gain on purchase of Gazelle |
(0.06 | ) | | (0.05 | ) | | ||||||||||
Tax benefits from net operating loss adjustment and worthless stock deduction |
| | | (0.15 | ) | |||||||||||
|
|
|
|
|
|
|
|
|||||||||
Core diluted EPS from continuing operations |
$ | 1.43 | $ | 2.83 | $ | 8.77 | $ | 7.26 | ||||||||
|
|
|
|
|
|
|
|
(1) | Non-Core Adjustments are presented after-tax using the applicable effective tax rate for the respective periods. |
A reconciliation of amounts used in calculating core diluted EPS from continuing operations in the table above is presented in the following table:
Three Months Ended | Year Ended | |||||||||||||||
December 31, | December 31, | |||||||||||||||
In thousands | 2015 | 2014 | 2015 | 2014 | ||||||||||||
Income from continuing operations attributable to common shares |
$ | 16,602 | $ | 49,462 | $ | 48,117 | $ | 120,748 | ||||||||
Add: income from continuing operations allocated to participating securities |
448 | 1,653 | 1,329 | 3,929 | ||||||||||||
|
|
|
|
|
|
|
|
|||||||||
Income from continuing operations |
$ | 17,050 | $ | 51,115 | $ | 49,446 | $ | 124,677 | ||||||||
|
|
|
|
|
|
|
|
|||||||||
Weighted average diluted common shares |
16,575 | 18,473 | 17,487 | 20,503 | ||||||||||||
Add: diluted common equivalent shares of participating securities |
106 | 187 | 155 | 196 | ||||||||||||
|
|
|
|
|
|
|
|
|||||||||
Weighted average diluted shares (treasury stock method) |
16,681 | 18,660 | 17,642 | 20,699 | ||||||||||||
|
|
|
|
|
|
|
|
Page 14
©2016 Outerwall Inc. All Rights Reserved. These materials may not be reproduced, altered or distributed without the express written consent of Outerwall Inc.
Free Cash Flow
Our non-GAAP financial measure free cash flow is defined as net cash provided by operating activities after capital expenditures. We believe free cash flow is an important non-GAAP measure as it provides additional information to users of the financial statements regarding our ability to service, incur or pay down indebtedness and repurchase our securities.
A reconciliation of free cash flow to net cash provided by operating activities, the most comparable GAAP financial measure, is presented in the following table:
Three Months Ended | Year Ended | |||||||||||||||
December 31, | December 31, | |||||||||||||||
Dollars in thousands | 2015 | 2014 | 2015 | 2014 | ||||||||||||
Net cash provided by operating activities |
$ | 59,311 | $ | 131,304 | $ | 326,085 | $ | 338,351 | ||||||||
Purchase of property and equipment |
(17,427 | ) | (25,613 | ) | (77,591 | ) | (97,924 | ) | ||||||||
|
|
|
|
|
|
|
|
|||||||||
Free cash flow |
$ | 41,884 | $ | 105,691 | $ | 248,494 | $ | 240,427 | ||||||||
|
|
|
|
|
|
|
|
Net Debt and Net Leverage Ratio
Our non-GAAP financial measure net debt is defined as the total face value of outstanding debt, including capital leases, less cash and cash equivalents held in financial institutions domestically. Our non-GAAP financial measure net leverage ratio is defined as net debt divided by core adjusted EBITDA from continuing operations for the last twelve months (LTM).
We believe net debt and net leverage ratio are important non-GAAP measures because they:
| are used to assess the degree of leverage by management; |
| provide additional information to users of the financial statements regarding our ability to service, incur or pay down indebtedness and repurchase our securities as well as additional information about our capital structure; and |
| are reported quarterly to support covenant compliance under our credit agreement. |
A reconciliation of net debt to total outstanding debt including capital leases, the most comparable GAAP financial measure, is presented in the following table:
December 31, | ||||||||
Dollars in thousands | 2015 | 2014 | ||||||
Senior unsecured notes(1) |
$ | 608,908 | $ | 650,000 | ||||
Term loans(1) |
136,875 | 146,250 | ||||||
Revolving line of credit |
140,500 | 160,000 | ||||||
Capital leases |
5,889 | 15,391 | ||||||
|
|
|
|
|||||
Total principal value of outstanding debt including capital leases |
892,172 | 971,641 | ||||||
Less domestic cash and cash equivalents held in financial institutions |
(46,192 | ) | (66,546 | ) | ||||
|
|
|
|
|||||
Net debt |
845,980 | 905,095 | ||||||
LTM Core adjusted EBITDA from continuing operations |
$ | 485,285 | $ | 496,820 | ||||
|
|
|
|
|||||
Net leverage ratio |
1.74 | 1.82 |
(1) | The senior unsecured notes on our Consolidated Balance Sheets as of December 31, 2015, and December 31, 2014, included $6.3 million and $8.4 million in associated debt discount, respectively. The Term loan on our Consolidated Balance Sheets as of December 31, 2015, and December 31, 2014, included $0.3 million and $0.3 million in associated debt discount, respectively. |
Page 15
©2016 Outerwall Inc. All Rights Reserved. These materials may not be reproduced, altered or distributed without the express written consent of Outerwall Inc.
Exhibit 1: 2016 Full-Year Guidance 1 See Appendix A for a discussion of Non-GAAP Financial Measures and Core and Non-Core Results 2 Excludes the impact of potential share repurchases in 2016 As of February 4, 2016 NET KIOSK INSTALLATIONS BY SEGMENT Redbox (1,000) – (2,000) Coinstar (150) – (200) ecoATM 50 − 100 CONSOLIDATED Core adjusted EBITDA from continuing operations1 ($MM) $340 − $380 Core diluted EPS from continuing operations1,2 $5.00 − $6.30 Average diluted shares outstanding2 (MM) 16.29 – 16.35 Estimated effective tax rate 34.5% − 35.5% Free cash flow1 ($MM) $140 − $190 CAPITAL EXPENDITURES ($MM) TOTAL $45 − $55 Redbox $15 − $19 Coinstar $7 − $9 ecoATM $5 − $6 Corporate $18 − $21
Exhibit 2: 2016 Q1 Redbox Release Schedule (4) $409 (5) $406 $0 (3) $114 (4) $170 (4) $290 (5) $301 (1) $110 (2) $46 (2) $241 (7) $202 (5) $491 (3) $201 Box Office2 ($MM) = # of new releases Q1 20161 Q1 2015 Box Office2 Titles Box Office2 Titles Total $2.98Bn 45 $2.57Bn 37 January $928.5MM 12 $411.0MM 7 February $870.9MM 14 $896.9MM 14 March $1.18Bn 19 $1.27Bn 16 As of February 4, 2016 NOTE: Colors in chart show box office for the individual titles that make up the total new releases for the week 1 Q1 2016 data subject to change 2 Includes titles with total North American box office greater than $5MM
Exhibit 99.3
![]() |
![]() |
OUTERWALL INC. DECLARES QUARTERLY DIVIDEND
BELLEVUE, Wash. February 4, 2016 Outerwall Inc. (Nasdaq: OUTR) today announced that on February 3, 2016, its board of directors declared a quarterly dividend of $0.30 per share of common stock. The dividend is expected to be paid on March 29, 2016, to stockholders of record at the close of business on March 15, 2016. The declaration and payment of future dividends will be subject to the boards approval.
ABOUT OUTERWALL INC.
Outerwall Inc. (Nasdaq: OUTR) has more than 20 years of experience creating some of the most profitable spaces for their retail partners. The company delivers breakthrough kiosk experiences that delight consumers and generate revenue for retailers. As the company that brought consumers Redbox® entertainment, Coinstar® money services, and ecoATM® electronics recycling kiosks, Outerwall is leading the next generation of automated retail and paving the way for inventive, scalable businesses. Outerwall kiosks are in neighborhood grocery stores, drug stores, mass merchants, malls, and other retail locations in the United States, Canada, Puerto Rico, the United Kingdom, and Ireland. Learn more at www.outerwall.com.
SAFE HARBOR FOR FORWARD-LOOKING STATEMENTS
Certain statements in this press release are forward-looking statements within the meaning of the Private Securities Litigation Reform Act of 1995. The words believe, estimate, expect, intend, will, anticipate, goals, variations of such words, and similar expressions identify forward-looking statements, but their absence does not mean that the statement is not forward-looking. The forward-looking statements in this release include statements regarding Outerwall Inc.s anticipated growth and future operating results, including 2016 full year results. Forward-looking statements are not guarantees of future performance and actual results may vary materially from the results expressed or implied in such statements. Differences may result from actions taken by Outerwall Inc. or its subsidiaries, as well as from risks and uncertainties beyond Outerwall Inc.s control. Such risks and uncertainties include, but are not limited to,
| competition from other entertainment providers, |
| the ability to achieve the strategic and financial objectives for our entry into new businesses, including ecoATM and Gazelle, |
| the timing of the release slate and the relative attractiveness of titles in a particular quarter or year, |
| our ability to repurchase stock and the availability of an open trading window, |
| our declaration and payment of dividends, including our boards discretion to change the dividend policy, |
| the termination, non-renewal or renegotiation on materially adverse terms of our contracts with our significant retailers and suppliers, |
| payment of increased fees to retailers, suppliers and other third-party providers, including financial service providers, |
| the timing of new DVD releases and the inability to receive delivery of DVDs on the date of their initial release to the general public, or shortly thereafter, or in sufficient quantity, for home entertainment viewing, |
| the effective management of our content library, |
| the ability to attract new retailers, penetrate new markets and distribution channels and react to changing consumer demands, |
| loss of key personnel or the inability of replacements to quickly and successfully perform in those new roles, |
| the ability to generate sufficient cash flow to timely and fully service indebtedness and adhere to certain covenants and restrictions, |
| the ability to adequately protect our intellectual property, and |
| the application of substantial federal, state, local and foreign laws and regulations specific to our business. |
The foregoing list of risks and uncertainties is illustrative, but by no means exhaustive. For more information on factors that may affect future performance, please review Risk Factors described in our most recent Annual Report on Form 10-K and any subsequent Quarterly Reports on Form 10-Q filed with the Securities and Exchange Commission. These forward-looking statements reflect Outerwall Inc.s expectations as of the date of this press release. Outerwall Inc. undertakes no obligation to update the information provided herein.
# # #
Investor Contact:
Rosemary Moothart
Director, Investor Relations
425-943-8140
rosemary.moothart@outerwall.com
2
IYHN5PX.W33T_(!C<72EEHZK].LH9%J6[QI9J
$]4\"_$'P]8
M>*_"&MMI[:OX>U59)--U(:7J=EK-C%>PQR1&X@BU+3[.Y>WD8P7'D"&YCF@>
M2)^QHH XKQU\.O!'Q,TS3-&\>>'-/\3:;HWB;PSXSTFVU!9?^);XK\':Q:Z_
MX8U^QF@DAGM=2T;5[.WO+2X@E1@RM%()+>6:)_,_A[^RM^SW\*?%TWCKX>_"
MWP]X7\3O!K-K9WUB^IRVOA^T\17L>H^(+/PAHUY?W.B>";/7+V*.?5[3PCIV
MB6^HM&BW< C^+M-^)/PQ\!^+/&O@3PKXIT_4/@S?6^G:5I
M%GX(U;3M4TWQ8_@B30?#SZ%XFU+7;;4/#NG?;O\ 2/AG]E2#XT^%?AS^RG\/
M/A=\3_"_A#7/VG/'G[5_C;XK?$ZZ^#W@S5?%5X/AUX@N)[662*.33H/$GB35
M=72\CG\0>*I]7N;/1];GL+>$V^AZ-# ?L+_ ,(%X_\ ^BX^-_\ PEOA3_\
M,+1_P@7C_P#Z+CXW_P#"6^%/_P PM? 7@_\ :,^/=_H?P=_:%U?QSX2NO ?Q
MC_:Z3XZAOY?$^I_$[PQ=^&H_%WCFS
MU.!_#4VFKXGTO3]"T7^R;76'X+X2_%[]LCXF0_LFR7OQ\\(:.G[6'@7XJZQJ
M[:9\&?#EQ-\,/^%90:9JVD:EX(:]U&6'6=<\26MXFG>)AXRAU;0+9Y[B]\/Z
M-I[0002 'Z=?\(%X_P#^BX^-_P#PEOA3_P#,+1_P@7C_ /Z+CXW_ /"6^%/_
M ,PM?(5G^U/\3-/_ ."> _:2UPIJ'Q5M/#\^D3WLVGW>G>"V\3P_$R3X4)
MXUU;1[>_:ZL?#UK.J>-=>T>UU1!;V,%_I]MJ,$*QW4>+X_\ B%^T;\)_$_@K
MX%W/[17PT\;>+OC'\3/AMX3TKQ_J?P]T'1O'?PBT/Q)X6^*OB'Q%JNM> ]'U
M2/PEK$'BR[^%TGAKX,7>IVUNO_"0ZAK-GX@B\6C0HOMH!]K_ /"!^/\ _HN/
MC?\ \);X4_\ S"TC>!/'J*SM\69W -[_ (6W??\ 1'_C%_X3WAW_ .:VC_A;=]_T1_XQ?^$]X=_^:VO)/%O[
M;/P*T&Q^&'B/0?'7@?QCX$\??%:Z^%6O^.]+\WGC) )CFAD21"0"5
M89 Z4 6J*** "BBB@ HHHH **** "BBB@ HHHH **** "BBB@ HHHH ****
M"BBB@!!T'T'\J6D'0?0?RI: "BBB@ HHHH Y_7_%OA7PI';3>*?$OA_PU#>R
M/#9RZ_K.G:-'=S1())(K9]1N;99Y(XR'=(B[(A#, O-