UNITED STATES
SECURITIES AND EXCHANGE COMMISSION
Washington, D.C. 20549
FORM 6-K
REPORT OF FOREIGN PRIVATE ISSUER PURSUANT TO RULE 13a-16 OR 15d-16 UNDER THE SECURITIES EXCHANGE ACT OF 1934
For the month of November, 2014
Commission File Number: 001-13742
ISRAEL CHEMICALS LTD.
(Exact name of registrant as specified in its charter)
Israel Chemicals Ltd.
Millennium Tower
23 Aranha Street
P.O. Box 20245
Tel Aviv, 61202 Israel
(972-3) 684-4400
(Address of principal executive office)
Indicate by check mark whether the registrant files or will file annual reports under cover of Form 20-F or Form 40-F:
|
Form 20-F
|
X
|
Form 40-F
|
Indicate by check mark if the registrant is submitting the Form 6-K in paper as permitted by Regulation S-T Rule 101(b)(1):
|
Yes
|
No
|
X
|
Indicate by check mark if the registrant is submitting the Form 6-K in paper as permitted by Regulation S-T Rule 101(b)(7):
|
Yes
|
No
|
X
|
ISRAEL CHEMICALS LTD.
|
1.
|
Description of the Business Environment, Analysis of the Business Results and Financial Statements for the Period Ended September 30, 2014.
|
Item 1

Description of the Business Environment, Analysis of the Business Results and the Financial Statements for the Period Ended September 30, 2014
Contents:
|
Description of the Company and the Business Environment
|
2
|
|
Results of Operations
|
10
|
|
Financial Position, Sources of Financing of ICL, Cash Flows and Investments
|
21
|
|
Additional Events
|
22
|
|
Financial Statements
|
29
|
SPECIAL NOTE REGARDING FORWARD-LOOKING STATEMENTS
This Quarterly Report contains statements that constitute “forward-looking statements,” many of which can be identified by the use of forward-looking words such as “anticipate,” “believe,” “could,” “expect,” “should,” “plan,” “intend,” “estimate” and “potential,” among others.
Forward-looking statements appear in a number of places in this Quarterly Report and include, but are not limited to, statements regarding our intent, belief or current expectations. Forward-looking statements are based on our management’s beliefs and assumptions and on information currently available to our management. Such statements are subject to risks and uncertainties, and actual results may differ materially from those expressed or implied in the forward- looking statements due to various factors, including, but not limited to, those identified in the. “Risk factors” in the F-1. These risks and uncertainties include factors relating to:
|
•
|
loss or impairment of business licenses or mining permits or concessions;
|
|
•
|
natural disasters;
|
|
•
|
failure to raise the water level in evaporation Pond 5 in the Dead Sea;
|
|
•
|
accidents or disruptions at our seaport shipping facilities or regulatory restrictions affecting our ability to export our products overseas;
|
|
•
|
labor disputes, slowdowns and strikes involving our employees;
|
|
•
|
currency rate fluctuations;
|
|
•
|
rising interest rates;
|
|
•
|
general market, political or economic conditions in the countries in which we operate;
|
|
•
|
pension and health insurance liabilities;
|
|
•
|
price increases or shortages with respect to our principal raw materials;
|
|
•
|
volatility of supply and demand and the impact of competition;
|
|
•
|
changes to laws or regulations (including environmental protection and safety and tax laws or regulations), or the application or interpretation of such laws or regulations;
|
|
•
|
government examinations or investigations;
|
|
•
|
the difference between actual reserves and our reserve estimates;
|
|
•
|
failure to integrate or realize expected benefits from acquisitions and joint ventures;
|
|
•
|
volatility or crises in the financial markets;
|
|
•
|
cyclicality of our businesses;
|
|
•
|
changes in demand for our fertilizer products due to a decline in agricultural product prices, lack of available credit, weather conditions, government policies or other factors beyond our control;
|
|
•
|
decreases in demand for bromine-based products and other industrial products;
|
|
•
|
litigation, arbitration and regulatory proceedings;
|
|
•
|
war or acts of terror; and
|
|
•
|
other risk factors discussed under “Risk factors” in the F-1.
|
Forward-looking statements speak only as of the date they are made, and we do not undertake any obligation to update them in light of new information or future developments or to release publicly any revisions to these statements in order to reflect later events or circumstances or to reflect the occurrence of unanticipated events.
1. Description of the Company and its Business Environment
|
1.1
|
Description of ICL
|
We are a leading specialty minerals company that operates a unique, integrated business model. We extract and process raw materials and utilize sophisticated processing and product formulation technologies to add value to customers in three attractive end-markets: agriculture, food and engineered materials. These three end markets constitute over 90% of our revenues today. Our operations are organized into three segments: (1) Fertilizers, which operates the raw material extraction for us and produces and markets potash, phosphates and specialty fertilizers; (2) Industrial Products, which primarily extracts bromine from the Dead Sea and produces and markets bromine and phosphorus compounds for the electronics, construction, oil and gas drilling and automotive industries and (3) Performance Products, which mainly produces, markets and sells a broad range of downstream phosphate-based food additives and industrial intermediates.
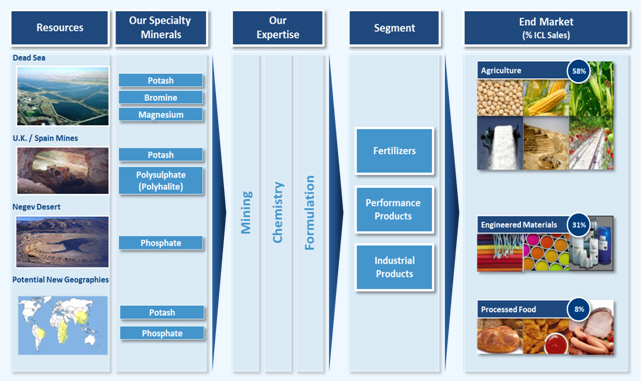
* The percentages are with respect to the 2013 Financial results
Our principal assets include: Access to one of the world’s richest, longest-life and lowest-cost sources of potash and bromine (the Dead Sea). Access to potash mines in the United Kingdom and Spain. Bromine compounds processing facilities located in Israel, the Netherlands and China. A unique integrated phosphate value chain, from phosphate rock mines in the Negev Desert in Israel to our value-added products in Israel, Europe, US, Brazil and China. An extensive global logistics and distribution network with operations in over 30 countries and a focused and highly experienced group of technical experts developing production processes, new applications, formulations and products for our three key end markets agriculture, food and engineered materials.
2
Fertilizers
Fertilizers serve an important role in global agriculture by providing vital nutrients that help increase both the yield and the quality of crops. We supply two of the three essential nutrients potassium, phosphorous and nitrogen required for plant growth. There are no known substitutes for these nutrients. Although these nutrients are naturally found in soil, they are depleted over time by farming, which leads to declining crop yields and land productivity. To replenish these nutrients, farmers must apply fertilizers. The demand for fertilizers is volatile and seasonal, and pricing decreased in 2013, however since the beginning of 2014 there have been price increases in some of the fertilizer products, particularly the phosphate fertilizers. In the Company's estimation, the policy of most countries is to ensure an orderly supply of high-quality food to their residents, including by encouraging agricultural production, which should preserve the long-term growth trend of fertilizer consumption.
Potash – Potash, the salt form of potassium, helps regulate a plant’s physiological functions and improves plant durability, providing crops with protection from drought, disease, parasites and cold weather. Unlike phosphate and nitrogen, potash does not require additional chemical conversion to be used as a fertilizer and is mined either from conventional underground mines or, less frequently, from surface or sub-surface brines, such as our operations in the Dead Sea.
Worldwide sales of potash recovered in 2013, as compared to 2012, although at a lower rate than expected at the beginning of 2013, due to a number of principal reasons: an erosion of 18% in the exchange rate of the Indian rupee against the U.S. dollar between January and November 2013, a fall in the prices of agricultural commodities in the fourth quarter of 2013 and the announcement of Uralkali, the Russian potash producer, in July 2013 of its exit from the joint potash marketing company with Belaruskali and of a change in its selling strategy and transition to a policy favoring quantity over price while taking advantage of the company’s full production capacity. This announcement triggered a fall in potash prices in the markets and also caused a postponement in potash purchases by customers due to their expectation of further price declines. In the fourth quarter of 2013, the demand for potash stabilized and in the first nine months of 2014 there was a moderate increase in the price, mainly in the United States and in Brazil. Global potash demand for agricultural uses is projected to grow at an average annual rate of 3% from 2013 through 2018 according to the IFA.
Phosphate – Phosphate, a salt of phosphoric acid, is essential to plant root development and is required for photosynthesis, seed germination and efficient usage of water. Phosphate fertilizers are produced from phosphate rock, sulfuric acid and ammonia. The principal phosphate-fertilizer producing regions are those with plentiful supplies of high quality, low-cost phosphate rock. Global phosphoric acid demand for all uses is forecast to grow at an annual rate of 2% through 2018 according to the IFA. Worldwide demand and prices for phosphate fertilizers were weak during all of 2013, mainly as a result of low demand in India and postponement of purchases throughout the world. Towards the end of 2013, the prices started to rise moderately.
The Specialty fertilizers market is growing faster than the conventional fertilizers’ market. Specialty fertilizers are often used for specialty crops (such as greenhouses and horticulture) but are rapidly expanding into usage for larger specialty field crops. Farmers are looking for fertilizers that are customized to meet the needs of specific crops and climates, to maximize yield and quality. Specialty fertilizers, such as controlled release fertilizers (which allow for the release of nutrients over time), slow release fertilizers (which allow for a very slow release of nutrients), liquid fertilizers (integrated in irrigation systems) and soluble fertilizers (integrated in drip irrigation systems and foliar spraying), ensure the timely and proportionate release of nutrients, thus not only significantly reducing their environmental impact but also providing highly efficient
3
fertilization for a wide range of agricultural crops, including fruits, vegetables and high-value perennial crops. Increasing consumer demand for healthier food is expected to drive the growth of the specialty agriculture end-market, including specialty fertilizers.
Specialty phosphates
Phosphate is also used in a broad range of downstream products in the food, electronics, energy and construction industries. These phosphate derivatives deliver additional and attractive margins. Main usage areas are: (1) food additives for improved texture and stability of processed foods such as meat, bakery, dairy and beverage products and (2) technical phosphates for usage in road surfaces, oil and paint additives, flame retardants and fire extinguishing demand for phosphate-based products is driven by global economic growth and improved living conditions. As global population grows, living standards improve and consumers demand more sophisticated food products, demand for phosphate-based products increases.
Bromine
The largest commercial use of bromine is brominated flame retardants, which accounts for approximately 40% of current quantitative demand for bromine. Flame retardants help materials such as plastic enclosures for consumer electronics, printed circuit boards, insulation materials for construction, furniture, automobiles, and textiles meet fire-safety requirements. The flame retardant market has contracted in the past few years. On the other hand, alternative uses of bromine have grown considerably, with bromine now used in a number of newer applications, including water purification, shale gas facking, oil and gas drilling and other industrial uses. Many new applications are under development by us and among our competitors.
Over 90% of our revenue is derived from three highly attractive end-markets, agriculture, food and engineered materials
ICL’s production facilities are based in Israel and throughout the world. ICL’s operations outside of Israel are primarily in the production of products that are complementary to or are based on ICL’s operations in Israel or related fields. The activities of ICL’s facilities are integrated with one another to a significant extent, in terms of both supply of raw materials and such that one facility frequently utilizes the by-products of another facility to produce additional products. This synergistic value chain allows us to efficiently convert raw materials into downstream high value-added products in a cost-efficient manner.
Approximately 5% of ICL’s total sales are made in Israel. Regarding these sales, for some specific products, ICL and some of the ICL companies have been declared a monopoly in Israel. Approximately 53% of ICL’s sales' revenues were derived from production activities taking place outside of Israel. Approximately 9% of the cost of sales of the products produced outside of Israel is attributable to raw materials supplied from Israel. ICL is examining various possibilities in connection with activities that do not constitute the core businesses and is preparing to divest activities that are not synergetic with the Company's activities.
Accordingly, on October 26, 2014, the Company and its subsidiary, BK Giulini GmbH entered into an agreement with Kurita Water Industries Ltd. (Kurita) for sale of business units in ICL’s Performance Products segment, in a number of areas: solutions for treatment of water and chemicals for paper, as well as aluminum compounds. The said business units are primarily located in Germany, and in other locations elsewhere in Europe and in China. The acquiring company is a leading Japanese company active in the water treatment field, and its shares are traded on the Tokyo Stock Exchange. The transaction will be for a consideration of approximately €250 million. Closing of the transaction is expected to take place towards the end of 2014, subject to the completion of certain preconditions set forth in the purchase agreement, including receipt of
4
approvals from competent authorities, as well as approval of a minimum number of employees for transfer to the employment by the purchasing company.
In addition, the Company is examining growth possibilities as part of the implementation of its strategic plan by means of participation in and acquisition of activities that are in line with the Company's value chain – starting from specialty minerals and running up to the end markets. On September 12, 2014, the Company disclosed that it is carrying on negotiations with a third party in connection with a joint venture relating to existing and future activities involving the mining and sale of phosphate rock in developing markets, as well as production, marketing and distribution of phosphate-rock products in these markets. As at the date of the report, these negotiations had not yet ripened into in-principle commercial agreements, and the parties had not reached agreement regarding the structure of the transaction and the consideration to be paid by the Company. Accordingly, binding agreements have not yet been signed, and there is no certainty that these negotiations will ultimately mature into binding agreements and/or that a transaction as referred to will be completed. To the extent the negotiations do finally ripen into binding agreements, the Company estimates the consideration at several hundred million dollars.
Regarding the plan for efficiency and integration of the global processes into the Company, as well as the plan for reducing the production cost of ICL's specialty minerals pursuant to the strategic plan, ICL expects that these activities, the execution of which the Company has already commenced, will give rise to savings, in 2016 (year end run-rate), in the amount of about $350 million, in annual terms, compared with 2013.
5
|
1.2
|
ICL business environment and profitability
|
There is a relationship among the amount of available arable land, the amount of food needed for the population, and the use of fertilizers. The natural population growth, change in food consumption habits (a shift to richer nutrition, largely based on animal protein, which increases grain consumption) resulting from the rising standard of living, mainly in the developing countries, and environmental-quality considerations along with the aspiration of western countries to reduce dependence on oil imports, which have strengthened the trend of shifting to production of fuel from agricultural products (bio-fuels), affect the increase in global consumption of grains (cereals, rice, soya, corn, etc.). These trends already led to significantly lower grain inventories a few years ago, and consequently, higher prices of agricultural produce, increased planting of grain crops worldwide, and also a trend of higher yield per unit of agricultural land, mainly by increased application of fertilizers.
One of the main considerations with respect to the purchase of fertilizers by the farmers is the selling price of the agricultural produce. Following the stability in the first half of 2014, prices of crop commodities in the third quarter of the year dropped sharply in response to expectations for record harvest as a result of an increase in the planted areas along with favorable weather conditions in the primary growing areas. In October 2014, the grain prices dropped to their lowest level in the past four years.
Based on the new report published by the US Department of Agriculture (USDA) in October 2014, an increase is expected in the grain stock-to-use ratio, to a level of 21.47% at the end of the 2014/2015 agricultural year, compared with 20.97% at the end of the 2013/2014 agricultural year, and 19.91% in the 2012/2013 agricultural year. Most of the increase in the 2014/2015 agricultural year stems mainly from an increase in the inventory of corn. In addition, the inventory of soybean, which is not included in the grains' inventory index, is also rising.
Production of ethanol from corn in the U.S. in 2013 was somewhat higher than in the prior year and an additional increase is expected in 2014 as well. Nonetheless, the sharp rise that had continued up to 2010 came to a halt due to moderation of the fuel prices, the decision not to increase the percentage of ethanol in gasoline (the blending rate) from 10% to 15%, and the decline in fuel consumption in the United States.
As part of framework agreements with customers in China, in January–February 2014 ICL Fertilizers signed contracts for the supply of a comparable amount of potash in the first half of 2014 as compared to contracts signed with its customers for the first half of 2013. The contracts were signed at a price of $305 per ton CFR, constituting a price reduction of about $95 per ton CFR compared with the contracts signed in 2013. In the third quarter, the potash shipments to the Company's customers in China continued at the current sale prices (spot prices). The imports into China in the first nine months of 2014 were 5.6 million tons, an increase of about 17.4% compared with the corresponding period last year. In the Company's estimation, the trend of increasing imports in 2015 is expected to continue to grow due to an increase in consumption, as well as logistics problems of the local producers.
In the Indian market, a change in the subsidy policies for fertilizers and the devaluation of the local currency against the U.S dollar, led to a significant increase in the retail price of potash and
6
phosphates for the farmer and a drop in demand. Imports of potash into India fell from 4.5 million tons in 2011 to 3.4 million tons in 2012 and to 3.1 million tons in 2013. In the first quarter of 2014, the potash manufacturers signed contracts for the agricultural year beginning on April 1, 2014 and ending on March 31, 2015 at a price that reflects a decline of $105 per ton compared with the price in the annual supply contracts in India which was signed in the beginning of 2013. Even though there were no changes in the market conditions, there was a recovery in the consumption of potash in the first nine months of 2014, and the imports into India increased by 43% compared with the corresponding period last year and totaled about 3.07 million tons. The demand for potash increased mainly as a result of an understanding on the part of the farmers that under-fertilization in the past two years unfavorably impacted the crop production. In April and up to the date of the report, ICL also agreed with its customers in India to supply potash for the 2014/2015 year in an aggregate quantity of about 825 thousand tons (including optional quantities). The selling price agreed to is about the same as the price set in transactions with other producers supplying potash to the Indian market. In the Company's estimation, the improvement in the demand for potash in India is expected to continue in 2015 as the farmers have adapted to the higher level of prices, which is expected to support the increased demand in the upcoming years as well.
The strong demand for potash in Brazil continued in the first nine months of 2014, where the total imports in the first nine months of 2014 were about 6.9 million tons reflecting an increase of about 16% compared with the corresponding period last year. Nonetheless, imports into Brazil in the fourth quarter of the year are expected to be lower than they were in prior quarters due to the seasonal factor along with the sharp drop in the grain prices, as noted.
The recovery of the demand for phosphate fertilizers that started at the end of 2013 and the resulting price recovery came to a halt in the beginning of the fourth quarter of 2014. The end of the fertilizing season in India coupled with a weaker demand in South America, where the fertilizing season has not yet commenced, are exerting pressure on the fertilizer prices. In addition, the high ammonia prices, which unfavorably impact the profits of the fertilizer producers, caused the U.S. fertilizer producer Mosaic, to announce a curtailment of the production. In addition OCP, the Moroccan phosphate producer, has also given notice of its intention to concentrate on production of phosphoric acid and TSP (phosphoric fertilizers that do not conrain ammonia). The producers of the phosphate fertilizers are awaiting the start of the fertilizing season in Brazil, which together with the conclusion of the period of tax preferences on exports from China should support the trend of increasing demand for phosphate fertilizers.
The operations of ICL-IP are largely affected by the level of activities in the electronics, construction, automotive, oil drilling, furniture, pharmaceuticals, agriculture, textile and water treatment markets. Pressure is increasingly being exerted by "green" organizations in the area of environmental protection to reduce the use of bromine-based flame retardants. On the other hand, additional and new uses for bromine and its related compounds are being developed, along with regulation in additional countries leading to increased use of bromine and bromine compounds. The economic slowdown in the world over the past several years, triggered a slowdown in the demand for electronic products and in the construction area. This trend, along with the decline in sales of personal computers due to increased use of tablets and smart phones, led to a decline in the demand for flame retardants, mainly bromine-based, in these markets. Nonetheless, during the period of the report, and particularly in the third quarter of 2014, there
7
was a certain improvement in demand for bromine-based flame retardants for some of the uses in the electronics’ sector. Subsequent to the period of the report, there has been a trend of stability in demand and mild pressure on prices. In the area of bromine-based flame retardants in the market for printed circuits, there was no change in the demand in 2014. In the period of the report, the elemental bromine prices were relatively stable in the United States, whereas there were price declines in Europe, China and India.
Despite the decline in the price of fuel in the period of the report, demand for clear brine fluids for oil and gas drilling, continued to be strong in the period of the report, due to a relatively high number of drillings in the Gulf of Mexico.
In 2013, the market for biocides used in swimming pools was impacted by falling prices as a result competitors’ strategy to increase their market share. In the beginning of 2013, the U.S. Department of Commerce decided to impose an anti-dumping tax on manufacturers of chlorine-based biocides from China, at the rate of about 30%–38%. In the beginning of 2014, the anti-dumping tax on the Chinese was increased by a further 20%, and at the beginning of April 2014 the authorities in the United States gave notice of imposition of anti-dumping taxes on the Japanese manufacturers, at the rate of 59%-109%, However, in the beginning of October 2014, taxation of the Japanese producers in 2015 was cancelled. The Company estimates that the anti-dumping tax on the biocide prices in the U.S. market will permit the Company a better position in the market, even though this impact had not yet been expressed due to the fact that most of the transactions in this market are based on annual contracts. In the field of bromine-based biocides used for water treatment, the trend of an increase in demand continued in the period of the report. After stability in 2013, the market for in-organic bromides for neutralizing mercury (Merquel® products) showed an increase in demand in the period of the report due to the cold weather conditions and high gas prices. In addition, the increase also stems from the entry of new customers as part of the preparations for the entry into effect of a new regulatory system in the United States which requires the reduction of mercury emissions in 2015. The technological development that permits production of shale gas and application thereof in the United States creates additional business opportunities for the Company, and among other things, an increase in demand for bromine-based biocides.
ICL-PP is affected by the global economic situation, competition in the target markets, volatility of prices in the fertilizers' market, which affect the prices of ICL-PP’s principal raw materials and availability of the raw materials, as well as by fluctuations in the energy prices. These market conditions create a competitive market for ICL-PP's products.
In addition, some of ICL-PP's target markets are characterized by a seasonal factor, mainly in the area of wildfire flame retardants (fire safety). In the third quarter, the demand for the Company's downstream phosphate-based products in the European and U.S. markets declined compared with the corresponding period last year mainly as a result of competition with the exporters of phosphoric acid to the United States, along with a decline in the demand for phosphate salt deriving from the continuing economic slowdown in Europe. Furthermore, the behavior of the competitors who implemented a sales' strategy that gives preference to market share over prices, continued to have an impact in the third quarter. Nonetheless, in the period of the report, there was a moderate increase in prices and quantities sold of the P2S5 products as well as in the area of products for the prevention and retarding of fires, as a result of multi-sector seasonal demand
8
with respect to the said products for the prevention and retarding of fires in the western part of the United States and in Canada compared with a low level of activities in this area in the corresponding quarter last year, and as a result of the acquisition of Auxquimia in Spain and the acquisition of the German company Hagesued, which also contributed to the segment's results. Reduction of the impact of the crisis in the Ukraine during the third quarter restored the demand in the Commonwealth of Independent States (CIS) to a normal level. The fourth quarter is usually weaker in the phosphate-based downstream product lines due to, among other things, performance of annual maintenance work at the customers' sites, and customer preference to end the year with low inventory levels.
Marine transportation expenses amount to about 7% of ICL’s total operating costs in the period of the report. The marine transportation expenses of the Company in the period of the report totaled about $283 million. After several years of falling marine bulk transportation prices, commencing from mid-2013, there has been increase in the shipping prices, which reached a record high of the last 3 years, and stood at 2,337 points in the middle of last December (the BDI (Baltic Dry Index) marine shipping index). Commencing from the first quarter of 2014, the prices fell to their level prior to the increase and the average index for the third quarter was 950 points, about 27% less than the average index for the third quarter of 2013. The energy costs account for approximately 6% of ICL's total operating costs in the period of the report. The energy costs in the quarter decreased compared with the corresponding quarter last year due to supply of gas from the Tamar field, which led to a savings as a result of the switch from use of expensive fuels, and from the undertaking to purchase electricity from the OPC company, at low costs compared with the price of the electricity purchased from Israeli Electric Company.
9
2. Results of Operations
|
2.1
|
Principal financial results
|
Set forth below are the condensed results of operations for the reviewed, compared with the results for the corresponding period last year, in millions of dollars.
|
|
(*)
|
The adjusted operating income is the operating income after elimination of non-recurring effects (In 2013, mainly, a provision for early retirement in Rotem and a provision for removing waste in Bromine. In the first half of 2014, the amount is about $23 million, as a result of an increase in costs due to a strike at Rotem and the amount of about $149 million in respect of a provision relating to prior periods due to the arbitration decision regarding the royalties' issue).
The adjusted net income is the net income net of non-recurring impacts (the impacts detailed above in the adjusted operating income and the financing expenses, net of tax. In addition, in the third quarter of 2013, tax in respect of trapped earnings and in the first half of 2014 the amount of about $51 million in respect of a non-recurring tax expenses stemming from assessment agreements in subsidiaries in Europe).
|
|
(**)
|
The EBITDA is calculated as follows, in millions of dollars:
|
| 1-9/2014 | 1-9/2013 | 7-9/2014 | 7-9/2013 | 2013 | ||||||||||||||||
| 378 | 699 | 180 | 78 | 819 | ||||||||||||||||
| 264 | 246 | 87 | 82 | 348 | ||||||||||||||||
| 90 | 21 | 21 | 3 | 27 | ||||||||||||||||
| 131 | 275 | 67 | 152 | 280 | ||||||||||||||||
| 174 | - | - | - | 95 | ||||||||||||||||
| 1,037 | 1,241 | 355 | 315 | 1,569 | ||||||||||||||||
10
|
2.2
|
Results of operations for the period January-September 2014
|
Sales
ICL's sales in the period of the report amounted to about USD 4,708 million, compared with USD 4,855 million in the corresponding period last year. This decrease stems mainly from a decrease in the selling prices, which led to a decrease in the sales of about USD 456 million. This decrease was partly offset by an increase in the quantities sold, including the first-time consolidation of companies acquired during the period of the report, which contributed about USD 246 million, and from the impact of the change in the currency exchange rates, in the amount of about USD 63 million.
Below is a geographical breakdown of the sales:
The sales' breakdown indicates an increase in sales in North America, primarily as a result of an increase in the quantities of potash sold, along with an increase in bromine-based and phosphorous-based flame retardants, bromine-based clear brine fluids, bromine-based and chlorine-based biocides for treatment of water, and magnesium chloride, as well as an increase in sales in Europe deriving from an increase in sales in the Performance Products segment, mainly as a result of the acquisition of Hagesued and an increase in the sales of P2S5. On the other hand, there was a decrease in the sales in Asia mainly due to a decrease in the prices of potash and a decrease in the quantities of potash sold in Asia, except for China. The decline in South America stems mainly from a decline in the quantities sold and selling prices of fertilizers and potash sold, compared with the corresponding period last year. The decline in the fertilizer quantities in South America, derives, mainly, from the impact of the strike in Rotem.
Cost of sales
The cost of sales in the period of the report amounted to about USD 3,025 million compared with about USD 2,972 million in the corresponding period last year – an increase of about USD 53 million. The increase in the cost of sales derives, primarily, from an increase in the quantities manufactured and sold, including the first-time consolidation of companies acquired during the period of the report, in the amount of about USD 111 million, the impact of the change in the currency exchange rates, in the amount of about USD 76 million, from the impact of the strike in Rotem, in the amount of about USD 26 million and an increase in the royalties expense in the current period due to the arbitration decision regarding this matter, in the amount of about USD 8 million. This increase was partly offset by a decline in the raw-material and energy prices, in the amount of about USD 72 million, a decrease in royalties, mainly due to the drop in sales, in the amount of about USD 39 million, and a decrease in other operating expenses, in the amount of about USD 57 million, stemming mostly from the decrease in the salaries' expenses, including the impact of retirement of Rotem employees.
11
Gross profit
The gross profit amounted to USD 1,683 million, compared with gross profit of USD 1,883 million in the corresponding period last year, a decrease of about USD 200 million. The gross profit margin as a percentage of sales was about 35.7%, compared with about 38.8% in the corresponding period last year.
Selling and marketing expenses
The selling and marketing expenses amounted to about USD 645 million, compared with about USD 630 million in the corresponding period last year. The selling and marketing expenses include, mainly, costs in respect of marine shipping, overland shipping, selling commissions and employee salaries. The increase in the expenses stems mainly from an increase in the quantities sold as stated above, the first-time consolidation of companies acquired during the period of the report, and the impact of the changes in the exchange rates.
General and administrative expenses
The general and administrative expenses amounted to about USD 225 million, compared with about USD 207 million in the corresponding period last year.
Research and development expenses
R&D expenses amounted to about USD 67 million, an increase of about USD 6 million compared with the corresponding period last year.
Other expenses
The other expenses, net, amounted to about USD 162 million – an increase of about USD 156 million compared with the corresponding period last year. The increase in the other expenses stems mainly from a non-recurring expense, in the amount of about USD 149 million (before interest expenses and the tax impact) relating to prior periods, due to the arbitration decision regarding the royalties' issue. For additional details – see Note 6.
Operating income
The operating income amounted to approximately USD 583 million, a decrease of about USD 395 million compared with the corresponding period last year. The rate of the operating income out of the total sales was about 12.4%, compared with 20.1% in the corresponding period last year. The operating income after eliminating non-recurring impacts, primarily a provision in respect of prior periods stemming from the arbitration decision regarding the royalties and costs in connection with the strike at Rotem, amounted to about USD 757 million, a decrease of USD 221 million compared with the corresponding period last year. The rate of the adjusted operating income out of the total sales is about 16.1%, compared with about 20.1% in the corresponding period last year.
Financing expenses
The net financing expenses amounted to about USD 90 million, compared with net financing expenses of about USD 21 million in the corresponding period last year. The financing expenses include non-recurring expenses, in the amount of about USD 32 million, mainly in connection with the arbitration decision dated May 19, 2014 regarding the royalties issue (for additional details – see Note 6), where after elimination of non-recurring expenses, the financing expenses amounted to about USD 58 million – an increase of about USD 37 million, compared with the corresponding period last year. The increase derives mainly from an increase in the interest expenses, in the amount of about USD 15 million, expenses in the period due to a change in the fair value of financial derivatives and revaluation of net short-term financial liabilities, in the amount of about USD 11 million, compared with revenues of about USD 42 million in the corresponding period last year, and an increase in the interest expenses in respect of provisions for employee benefits, in the amount of about USD 3 million. On the other hand, there was a decrease in the financing expenses in respect of the impact of exchange rate differences on provisions for employee
12
benefits, in the amount of about USD 37 million, as a result of devaluation of the shekel against the dollar, at the rate of about 6.5%, compared with an appreciation, at the rate of about 5.3%, in the corresponding period last year.
Tax expenses
The tax expenses amounted to about USD 131 million, compared with tax expenses of about USD 275 million in the corresponding period last year. The tax rate on the pre-tax income is about 25.5% compared to about 28.2% last year. The high rate of the tax expenses in the period of the report stems, mainly, from a non-recurring tax expense as a result of an assessment agreement in subsidiaries in Europe, after offsetting a tax income derived from an additional deduction for tax purposes in respect of investments made by a subsidiary in Europe, in the amount of about USD 27 million, a change in the shekel/dollar exchange rate that gave rise to an increase in the tax rate of the companies operating in Israel the source of which is differences in the measurement basis, and an increase in the Companies Tax rate in Israel to 26.5%. On the other hand, the difference in the tax rates in connection with recognition of a deferred tax asset with respect to the provision for the arbitration reduced the tax rate. In the corresponding period last year, the tax expenses included non-recurring tax expenses recognized in respect of the release of trapped earnings, in the amount of about USD 107 million.
Net profit
The net profit for the Company's shareholders amounted to about USD 378 million, compared with USD 699 million in the corresponding period last year – a decrease of about USD 321 million.
|
2.3
|
Results of operations for the period July-September 2014
|
Sales
ICL's sales in the third quarter amounted to about USD 1,559 million, compared with USD 1,445 million in the corresponding period last year. This increase stems mainly from an increase in the quantities sold, including due to the first-time consolidation of companies acquired during the period of the report, which led to an increase in sales of about USD 186 million, and from the impact of the change in the rate of exchange, in the amount of about USD 4 million. This increase was partly offset by a decrease in the selling prices, which led to a decrease in the sales of about USD 76 million.
Below is a geographical breakdown of the sales:
|
7-9/2014
|
7-9/2013
|
|||||||||||||||
| CIF sales |
USD millions
|
%
|
USD millions
|
%
|
||||||||||||
| 72 | 4.6 | 66 | 4.6 | |||||||||||||
| 415 | 26.6 | 338 | 23.4 | |||||||||||||
| 131 | 8.4 | 218 | 15.1 | |||||||||||||
| 561 | 36.0 | 545 | 37.7 | |||||||||||||
| 333 | 21.4 | 235 | 16.3 | |||||||||||||
| 47 | 3.0 | 43 | 3.0 | |||||||||||||
| 1,559 | 100.0 | 1,445 | 100.0 | |||||||||||||
The sales' breakdown indicates an increase in sales in Asia, mainly as a result of an increase in the quantities of potash sold to China and India, an increase in sales in North America, as a result of an increase in the quantities of potash sold and an increase in the quantities sold of bromine-based and phosphorous-based flame retardants, bromine-based clear brine fluids,
13
bromine-based and chlorine-based biocides for treating water and magnesium chloride, as well as an increase in sales in Europe, stemming from an increase in sales in the Performance Products segment, mainly as a result of acquisition of Hagesud and an increase in the sales of P2S5. On the other hand, there was a decline in sales in South America stemming mainly from a decline in the quantities of potash sold due to a lack of availability of granulated potash and a drop in its price.
Cost of sales
The cost of sales in the third quarter amounted to about USD 982 million compared with about USD 939 million in the corresponding period last year – an increase of about USD 43 million. The increase in the cost of sales derives, primarily, from an increase in the quantities produced and sold, including due to the first-time consolidation of companies acquired during the period of the report, in the amount of about USD 73 million, the impact of the change in currency exchange rate, in the amount of about USD 12 million, an increase in the royalties expenses in the current period as a result of the arbitration decision, in the amount of about USD 2 million and an increase in the cost of raw materials due to the impact of the strike in Rotem, in the amount of about USD 3 million. This increase was partly offset by a decline in the raw-material and energy prices, in the amount of about USD 16 million, and a decrease in other operating expenses, in the amount of about USD 31 million, which stems mainly from a decrease in the salaries' expenses, including as a result of the retirement of Rotem employees.
Gross profit
The gross profit amounted to USD 577 million, compared with gross profit of USD 506 million in the corresponding period last year, an increase of about USD 71 million. The gross profit margin as a percentage of sales was about 37.0%, compared with about 35.0% in the corresponding period last year.
Selling and marketing expenses
The selling and marketing expenses amounted to about USD 216 million, compared with about USD 197 million in the corresponding period last year. The selling and marketing expenses include, mainly, costs in respect of marine shipping, overland shipping, selling commissions and employee salaries. The increase in the expenses is mainly the result of an increase in the quantities sold, as stated above, and the first-time consolidation of companies acquired during the period of the report.
General and administrative expenses
The general and administrative expenses amounted to about USD 77 million, compared with about USD 68 million in the corresponding period last year.
Research and development expenses
The R&D expenses amounted to about USD 22 million, an increase of about USD 2 million compared with the corresponding period last year.
Operating income
The operating income amounted to approximately USD 262 million, an increase of about USD 40 million compared with the corresponding period last year. The rate of the operating income out of the total sales was about 16.8%, compared with 15.4% in the corresponding period last year.
14
Financing expenses
The net financing expenses in the third quarter amounted to about USD 21 million, compared with net financing expenses of about USD 3 million in the corresponding period last year, an increase of about USD 18 million compared with the corresponding period last year. The increase in the financing expenses in the quarter compared with the corresponding period last year stems mainly from an increase in the interest expenses, in the amount of about USD 6 million, expenses in the period due to a change in the fair value of financial derivatives and revaluation of net, short-term financial liabilities, in the amount of about USD 22 million, compared with revenues of about USD 20 million in the corresponding period last year, and an increase in the interest expenses in respect of provisions for employee benefits, in the amount of about USD 1 million. On the other hand, there was a decrease in the financing expenses due to the impact of the exchange rates on provisions for employee benefits, in the amount of about USD 32 million, as a result of devaluation of the shekel against the dollar at the rate of about 7.5%, compared with an appreciation at the rate of about 2.2% in the corresponding period last year.
Tax expenses
The tax expenses in the quarter amounted to about USD 67 million, compared with tax expenses of about USD 152 million in the corresponding quarter last year. The tax rate on the pre-tax income is about 27.1%, compared with about 66.0% in the corresponding period last year. In the corresponding period last year non-recurring tax expenses were recognized in connection with the release of trapped earnings, in the amount of about USD 107 million. The rate of the tax expenses in the period of the report derives mainly from the change in the exchange rate of the dollar against the shekel, which caused an increase in the tax rate of the companies operating in Israel, the source of which is differences in respect of the measurement basis along with an increase in the Companies Tax rate in Israel to 26.5%.
Net profit
The net profit for the Company's shareholders amounted to about USD 180 million, compared with USD 78 million in the corresponding period last year – an increase of about USD 102 million.
15
3. Operating Segments
|
3.1
|
ICL Fertilizers
|
Below is a percentage breakdown of the segment's sales and operating income in the period of the report, by areas of operation (before setoffs of inter-segment sales):
| 1-9/2014 | 1-9/2013 | 7-9/2014 | 7-9/2013 | 2013 | ||||||||||||||||
| 52 | % | 53 | % | 51 | % | 49 | % | 54 | % | |||||||||||
| 48 | % | 47 | % | 49 | % | 51 | % | 46 | % | |||||||||||
| 82 | % | 82 | % | 78 | % | 83 | % | 90 | % | |||||||||||
| 18 | % | 18 | % | 22 | % | 17 | % | 10 | % |
Potash
The revenues in this segment include sales of potash from Israel, Spain (Iberpotash) and the United Kingdom (Cleveland Potash).
Potash – Revenues and Profit
| $ millions | 1-9/2014 | 1-9/2013 | 7-9/2014 | 7-9/2013 | 2013 | |||||||||||||||
| 1,386 | 1,561 | 450 | 397 | 2,027 | ||||||||||||||||
| 408 | 601 | 131 | 112 | 740 | ||||||||||||||||
| 416 | 601 | 131 | 112 | 740 |
* Including revenues from inter-segment sales
The decrease in revenues in the period of the report, compared with the corresponding period last year stems from a decrease in the selling prices, which led to a decrease in the sales, in the amount of about USD 337 million. In contrast, this decrease was partly offset by an increase in the quantities sold, which led to an increase in revenues, in the amount of about USD 139 million and from the impact of the change in the currency exchange rates, in the amount of about USD 23 million.
The increase in revenues in the third quarter compared with the corresponding quarter last year stems from an increase in the quantities sold, which led to an increase in revenues, in the amount of about USD 105 million, and the impact of the change in the exchange rates, in the amount of about USD 5 million. In contrast, this increase was partly offset by a decrease in the selling prices, which led to a decrease in the sales, in the amount of about USD 57 million.
The decrease in the operating income in the period of the report stems mainly from a decrease in the selling prices of potash, which led to a decline in the operating income, in the amount of about USD 337 million, an increase in the cost of sales due to an increase in the quantities sold, in the amount of about USD 48 million, and from a one-time expense in connection with a provision for arbitration relating to royalties in respect of prior periods, in the amount of about USD 8 million. On the other hand, this decrease was partly offset by the impact of the increase in the quantities of potash sold, in the amount of about USD 139 million, a decline, in the amount of about USD 27 million, stemming from a decrease in the royalties' expenses and selling commissions, mainly as a result of the drop in sales, a decrease in the energy costs, in the amount of about USD 25 million, and from a decline in other operating expenses, in the amount of about USD 9 million.
16
The increase in the operating income in the quarter stems mainly from the impact of the increase in the quantities of potash sold, in the amount of about USD 105 million, a decline, in the amount of about USD 4 million, stemming from a decrease in the royalties' expenses and selling commissions, mainly as a result of the decrease in the potash prices, a decrease in the energy costs, in the amount of about USD 6 million, and a decline in other operating expenses, in the amount of about USD 6 million. In the other direction, this increase was partly offset by a decline in the selling prices of potash, which led to a decrease in the operating income, in the amount of about USD 57 million, an increase in the cost of sales resulting from an increase in the quantities sold in the amount of about USD 39 million, and from an increase in the shipping expenses, mainly as a result of an increase in the quantities sold, in the amount of USD 6 million.
Potash – Production, Sales and Closing Inventories
| Thousands of tons | 1-9/2014 | 1-9/2013 | 7-9/2014 | 7-9/2013 | 2013 | |||||||||||||||
| 3,825 | 3,804 | 1,305 | 1,272 | 5,155 | ||||||||||||||||
| 3,884 | 3,468 | 1,234 | 918 | 4,712 | ||||||||||||||||
| 253 | 236 | 84 | 97 | 323 | ||||||||||||||||
| 4,137 | 3,704 | 1,318 | 1,015 | 5,035 | ||||||||||||||||
| 814 | 1,106 | 814 | 1,106 | 1,126 |
The quantity of potash sold to external customers in the period of the report is about 416 thousand tons higher than in the corresponding period last year, mainly due to an increase in the quantities sold to China, the United States and Europe, which was partly offset by a decline in the quantities sold to India and to South America. The quantity of potash sold to external customers in the third quarter was about 316 thousand tons higher than in the corresponding period last year, mainly as a result of the decline in the Company’s sales in the third quarter of last year after the announcement of Uralkali, the Russian potash producer, of its exit from its joint potash marketing company with Belaruskali (BPC) and a change of its sales’ strategy. This announcement triggered a decline in the price of potash in the markets and also caused a postponement of potash purchases by customers expecting further price declines. In addition, strong demand for granulated potash in the United States gave rise to an increase in the quantities of potash sold in the current quarter. Production of potash in the period of the report was about 21 thousand tons higher than in the corresponding period last year, as a result of an increase in the production in Israel and the United Kingdom. Production of the potash in the quarter was about 33 thousand tons higher compared with the corresponding quarter last year, due to an increase in the production in the United Kingdom and Spain, which was partially offset by a decline in the production in Israel.
Fertilizers and Phosphates
Fertilizers and Phosphates – Revenues and Profit
| $ millions | 1-9/2014 | 1-9/2013 | 7-9/2014 | 7-9/2013 | 2013 | |||||||||||||||
| 1,293 | 1,398 | 424 | 421 | 1,754 | ||||||||||||||||
| 88 | 131 | 37 | 22 | 79 | ||||||||||||||||
| 104 | 131 | 37 | 22 | 139 |
* Including revenues from inter-segment sales.
17
The decrease in sales in the period of the report stems from a decrease in the selling prices of phosphate fertilizers, which caused a decrease in the sales of about USD 102 million and a decline in the quantities sold, which led to a decrease in the sales of about USD 30 million. This decrease was partly offset as a result of the change in the currency exchange rates, in the amount of about USD 27 million.
The increase in sales in the quarter stems from an increase in the quantities sold, which led to an increase in the sales of about USD 10 million and changes in the currency exchange rates, in the amount of about USD 1 million. This increase was partly offset by a decline in the selling prices of phosphate fertilizers, which caused a decrease in the sales of about USD 8 million.
The decrease in the operating income in the period of the report derives mainly from a decrease in the selling prices, in the amount of about USD 102 million, a decline in the quantities sold, in the amount of about USD 30 million, from the impact of the strike in Rotem, in the amount of about USD 16 million, and from the impact of the changes in the currency exchange rate, in the amount of about USD 4 million. On the other hand, this decrease was partly offset as a result of a decrease in the raw-material prices, in the amount of about USD 41 million, a decrease in the cost of sales, in the amount of about USD 27 million, as a result of the fall in the quantities sold, a decrease in the royalties and selling commissions in the amount of about USD 7 million, a drop in the shipping expenses due to a fall in the quantities sold in the amount of about USD 2 million, and a decline in other operating costs, in the amount of about USD 32 million, mainly due to a decrease in salary expenses due to retirement of employees in Rotem.
The increase in the operating income in the quarter derives mainly from an increase in the quantities sold, in the amount of about USD 10 million, a decrease in the raw-material prices, in the amount of about USD 5 million, and a decline in other operating costs in the amount of about USD 11 million, mainly as a result of a decrease in the salary expenses due to retirement of employees in Rotem. On the other hand, this increase was partly offset by a decrease in the selling prices, in the amount of about USD 8 million, and by an increase in the cost of sales due to an increase in the quantities produced and sold, in the amount of about USD 3 million.
Fertilizers and Phosphates – Production and Sales
| Thousands of tons | 1-9/2014 | 1-9/2013 | 7-9/2014 | 7-9/2013 | 2013 | |||||||||||||||
| 2,486 | 2,675 | 975 | 951 | 3,578 | ||||||||||||||||
| 666 | 681 | 194 | 220 | 879 | ||||||||||||||||
| 1,683 | 1,956 | 744 | 675 | 2,577 | ||||||||||||||||
| 1,199 | 1,331 | 447 | 441 | 1,747 | ||||||||||||||||
| 1,342 | 1,379 | 440 | 424 | 1,695 |
* To external customers.
The quantity of the fertilizers sold in the period of the report was lower than in the corresponding period last year, mainly due to a decrease in the quantities sold to Brazil. Production of fertilizers and phosphate rock was 132 thousand tons and 189 thousand tons lower, respectively, compared with the corresponding period last year, as a result of the strike at Rotem that took place in the first half of the year and the damage caused to Rotem's sulfuric acid production facility.
18
|
3.2
|
ICL Industrial Products
|
Sales
The sales of ICL-IP in the period of the report were about USD 1,024 million – an increase of about USD 32 million compared with the corresponding period last year. This increase stems from an increase in the quantities sold, mainly of bromine-based flame retardants, bromine-based and chlorine-based biocides used for water treatment and magnesium and magnesium-chloride products, in the amount of about USD 47 million, as well as the impact of the currency exchange rates, in the amount of about USD 6 million. The said increase was partly offset by a decline in the selling prices, mainly of bromine-based flame retardants, non-organic bromine products and chlorine-based biocides for treatment of water, which reduced the sales by about USD 21 million.
The sales of ICL-IP in the third quarter were about USD 328 million, an increase of about USD 27 million compared with the corresponding quarter last year. This increase stems from an increase in the quantities sold, mainly of bromine-based flame retardants, bromine-based and chlorine-based biocides used for water treatment, and inorganic bromine products, in the amount of about USD 33 million. The said increase was partly offset by a decline in the selling prices, mainly of bromine-based flame retardants and inorganic bromine products, which reduced the sales by about USD 6 million.
Profitability
The operating loss in the period of the report totaled about USD 43 million, compared with operating income of about USD 124 million in the corresponding period last year. The operating income after eliminating non-recurring impacts, as detailed below, in the period of the report amounted to about USD 98 million. The adjusted margin of the operating income out of the sales amounted to about 9.6% compared with an operating income margin of about 12.5% last year.
The decrease in the operating income is primarily as a result of a non-recurring expense in connection with a provision for royalties relating to prior periods due to the arbitration decision, in the amount of about USD 141 million, a decrease in the selling prices, which led to a decline in profitability of about USD 21 million, an increase in royalties' expenses relating to current period as a result of the arbitration decision, in the amount of about USD 8 million, the impact of the changes in the currency exchange rates, in the amount of about USD 12 million, an increase in the shipping expenses due to an increase in the quantities sold, in the amount of about USD 7 million, and an increase in other operating expenses, in the amount of about USD 2 million. This decrease was partly offset by a decrease in the raw-material and energy prices, which contributed about USD 14 million to income, and an increase in the quantities sold and a change in the mix of the quantities sold of various products, which led to an increase in income of about USD 10 million.
The operating income in the third quarter totaled about USD 36 million, compared with operating income of about USD 27 million in the corresponding quarter last year. The adjusted margin of the operating income out of the sales amounted to about 11% compared with an operating income margin of about 8.8% last year.
The increase in the operating income is primarily as a result of an increase in the quantities sold and a change in the mix of the quantities sold of various products, which led to an increase in income of about USD 20 million, a decrease in the raw-material and energy prices, which contributed about USD 5 million to income and a decline in other operating expenses, in the amount of about USD 3 million. This increase was partly offset by a decline in the selling prices, which had negative affect of USD 6 million, an increase in the royalties' expenses in the third quarter due to the arbitration decision, in the amount of about USD 2 million, the impact of the
19
changes in the currency exchange rates, in the amount of about USD 4 million, and an increase in the shipping expenses owing to an increase in the quantities sold, in the amount of about USD 7 million.
|
3.3
|
ICL Performance Products
|
Sales
The total sales in the period of the report amounted to about USD 1,251 million, an increase of about USD 52 million compared with the corresponding period last year. This increase stems from an increase in the quantities sold of about USD 35 million, including the first-time consolidation of companies acquired during the period of the report, the impact of changes in exchange rates of about USD 9 million and from the increase in the selling prices changes in price of about USD 8 million.
Sales in the third quarter amounted to about USD 451 million, an increase of USD 15 million compared with the corresponding quarter last year. This increase stems from the first-time consolidation of companies acquired during the period of the report of about USD 13 million and from the increase in selling prices which contributed additional increase of about USD 4 million. These increases were lowered by a reduction in quantities sold of about USD 2 million.
Profitability
The segment's operating income in the period of the report amounted to about USD 156 million, a decrease of about USD 5 million compared with the corresponding period last year. This decrease stems mainly from an increase in raw material prices in the amount of USD 4 million, an increase in operating costs due to the strike in Rotem in the amount of about USD 10 million and an increase in other operating expenses in the amount of USD 2 million. The decrease was partially offset by an increase in the selling prices, in the amount of about USD 8 million, and an increase in the quantities sold including the first-time consolidation of companies acquired during the period of the report, in the amount of about USD 3 million.
The segment's operating income in the third quarter amounted to about USD 66 million, a decrease of about USD 7 million compared with the corresponding quarter last year. This decrease was primarily caused by an increase in raw-material costs of about USD 4 million, other operating expenses in the amount of about USD 4 million and an increase in costs due to the strike in Rotem in the amount of about USD 3 million. These impacts were partially offset by an increase in the selling prices, in the amount of about USD 4 million.
20
4. The Financial Position and Sources of Financing of ICL
As at September 30, 2014, an increase of about USD 872 million was recorded in ICL's net interest-bearing financial liabilities, compared with the balance at the end of 2013, bringing the total to approximately USD 2,612 million.
ICL's sources of financing are short-term and long-term bank loans, mostly from international banks and Israeli institutions, debentures issued to the public in Israel and to institutional investors in Israel and the USA, and securitization of customer receivables, whereby some of the Group companies sell customer receivables in return for provision of a credit facility. The total amount of the securitization framework and credit facility deriving therefrom amounts to USD 350 million. As at September 30, 2014, ICL had used about USD 343 million of the securitization facility.
ICL also has long-term credit facilities of USD 1,425 million and Euro 177 million, of which about USD 354 million have not been used.
5. Cash Flows
The cash flows generated by operating activities in the period of the report amounted to about USD 582 million, compared with about USD 1,011 million in the corresponding period last year. Most of the decline in the cash flows from current operating activities derives from the decrease in income and changes in the working capital in the "receivables" category (net of the impact of the change in the "payables" category), mainly as a result of longer credit periods granted to customers of ICL Fertilizers in China. In the corresponding period last year, part of the working capital was utilized as a result of the decline in the Company’s sales in the third quarter (after the announcement of Uralkali, the Russian potash producer, of its exit from its joint potash marketing company with Belaruskali (BPC) and a change of its sales’ strategy. This announcent triggered a decline in the price of potash in the markets and also caused a postponement of potash purchases by customers expecting further price declines). The cash flows from current operating activities together with the increase in the financial liabilities were the main source for financing payment of the dividend, in the amount of about USD 720 million, financing the net investments in property, plant and equipment, in the amount of USD 590 million and acquisition of activities, in the amount of about USD 88 million.
The cash flows generated by operating activities in the third quarter amounted to about USD 295 million, compared with about USD 394 million in the corresponding period last year. The cash flows in the corresponding period last year were positively impacted by utilization of part of the working capital, as stated above. In addition, in the corresponding period last year a one-time provision for tax was recognized, in the amount of about USD 107 million, in respect of release of trapped earnings, which was paid during the fourth quarter of 2013.
6. Investments
In the period of the report, the investments in property, plant and equipment declined mainly due to completion of most of the construction work with respect to the partition in the dykes demarking Pond No. 5 at the Dead Sea in 2013. Nonetheless, the cash used for investments in property, plant and equipment was the same as in the corresponding period last year (about USD 590 million) mainly as a result of the timing of the payments made to suppliers of property, plant and equipment in the period of the report. The cash flows used for investing activities increased in the period of the report mainly as a result of an increase in the payments made in connection with business combinations, investments in intangible assets and investments in equity-accounted investees.
21
7. Additional Disclosures
|
7.1
|
On November 11, 2014, the Company’s Board of Directors decided to distribute a dividend, in the amount of $125 million, about $0.10 per share. The dividend will be distributed on December 17, 2014 with a record date of December 3, 2014.
|
|
7.2
|
For additional details regarding decisions of the Company's Board of Directors on August 27, 2014, in connection with Bromine Compounds and the magnesium plant – see Note 6 to the financial statements.
|
|
7.3
|
On September 12, 2014, the Company gave notice that it is carrying on negotiations with a third party in connection with entering into joint ventures relating to existing and future mining activities of phosphate rock and the sale thereof in developing markets, as well as the manufacture, marketing and distribution of downstream phosphate-rock products in the said markets.
|
|
|
As at the date of the report, the negotiations had not yet ripened into in-principle commercial agreements, the parties had not yet reached essential agreement with respect to the structure of the transaction and/or the consideration to be paid by the Company. Accordingly, binding agreements have not yet been signed and there is no certainty that the negotiations will mature into binding agreements and/or that a transaction, as stated, will ultimately be closed. To the extent the negotiations reach the stage of binding agreements, the Company estimates that the consideration will amount to several hundred million dollars.
|
|
7.4
|
On September 21, 2014, the Company received a request that was filed in the District Court for certification of a class action against the subsidiary, Dead Sea Works Ltd. ("DSW"), in the amount of about $26 million. In the request for certification of the class action claim it is contended that DSW prejudicially exploited its monopolistic power while violating the Restrictive Business Practices Law, 1988 (hereinafter – the "Restrictive Business Practices Law"), in that it collected an inflated and unfair price for potash, contrary to the Restrictive Business Practices Law.
|
|
7.5
|
On September 23, 2014, the Company submitted a final prospectus for registration for trading (F-1) on the NYSE in New York (hereinafter – the “Prospectus”). On September 24, 2014, Israel Corporation Ltd. (hereinafter – “Israel Corporation”) published an Immediate Report on transactions made in connection with shares of ICL by means of a tender offer and a financial transaction, in the aggregate scope of 78.4 million shares, completion of a "pricing" process with respect to sale of ICL shares pursuant to ICL's prospectus in the United States and the entering of an underwriting agreement. On the same date, ICL signed an underwriting agreement with Israel Corporation and the underwriters that accompanied the transactions which are the subject of Israel Corporation's Immediate Report, including, among other things, representations and indemnity arrangements between the underwriters, Israel Corporation and ICL, as well as a commitment of ICL's officers to refrain from selling shares of ICL during a period of 180 days, subject to the agreed terms. On this date trading in ICL's shares commenced. On October 12, 2014, Israel Corporation published an Immediate Report with respect to the notification of the underwriters, as stated, that they had exercised the option they were granted as part of the underwriting agreement, to acquire 6,015,814 ordinary shares of ICL at the price in the public offering. After exercise of the option, the rate of Israel Corporation's holdings of the issued shares of ICL is about 46.18%. It is noted that the rate of Israel Corporation's holdings of the voting power was determined taking into account the shares that are the subject of the financial transaction. The shares that are the subject of the
|
22
financial transaction (36,207,128) are borrowed shares and Israel Corporation has equity rights in respect of these shares. On November 1, 2014, the Company commenced reporting in accordance with the provisions of Part E3 of the Securities Law, 1968, which govern the reporting applicable to dual-listed companies. Pursuant to Part E3, the Company's reporting requirements in Israel will be satisfied by compliance with the reporting requirements in the United States.
|
7.6
|
On September 28, 2014, 927,467 restricted shares and 4,017,246 options not registered for trading were issued to officers and other senior employees of the Company, not including the Company's CEO, Mr. Stefan Borgas, under a plan announced by the Company on August 20, 2014.
|
|
7.7
|
Further to the statement on page 180 of the Company's Registration Statement (F-1), on September 29, 2014 the Israeli Supreme Court rejected the appeal filed by the plaintiffs in the proceedings against the State of Israel, the Local Industrial Council of Neot Hovav and the factories of ICL Industrial Products, contending that various pollutions in the area of Neot Hovav had caused a number of diseases from which the plaintiffs suffered.
|
|
7.8
|
Further to the statement on page 177 of the Registration Statement (F-1), on September 30, 2014, the District Court in Jerusalem rejected the request filed by DSW for appointment of an arbitrator on behalf of the State for the purpose of conducting arbitration proceedings between DSW and the Government of Israel, pursuant to the binding arbitration clause included in the Concession Agreement between the parties, and determined that after completion of the legislative processes for adoption of the recommendations of the Sheshinski Committee, the Company may raise its contentions before the High Court of Justice and challenge the constitutional validity of the law.
|
|
7.9
|
Further to the statement on pages 180-181 of the Registration Statement (F-1) in connection with the planned closing of the potash production site in Sallent, in Spain, the Company has decided to continue the operations of the site until mid 2016. The decision was taken, among others, following the new provisions that were published on October 2, 2014, by the competent authorities in Spain which permit to continue operating the site until June 2017.
|
|
7.10
|
On October 4, 2014, Mr. Yaakov Dior ceased serving as an external director of the Company. The Company intends to act to nominate Mr. Dior for election at the General Meeting to be convened in the near future.
|
|
7.11
|
On October 6, 2014, the rating company, Standard & Poor's Maalot, downgraded ICL's credit rating to 'ilAA' from a rating of 'ilAA+', with a stable rating outlook.
|
|
7.12
|
Further to the statement on page 181 of the Registration Statement (F-1), on October 7, 2014, Haifa Chemicals Ltd. (“Haifa Chemicals”) filed a motion to start an examination process, in accordance with Section 292(2) of the arbitrator's decision rendered in the arbitration proceedings between DSW and Haifa Chemicals, to determine the "examined price", within the meaning of this term in Section 292(6) of the decision, for 2011, 2012 and 2013. The Company has filed a request for the debt payment of Haifa Chemicals for 2009 to 2010. On November 4, 2014, Haifa Chemicals submitted to DSW an offset notice with respect to the amount of Haifa Chemicals' debt, in such a manner that the above-mentioned amount will be deducted from the amounts it contends are due to Haifa Chemicals from DSW.
|
23
|
7.13
|
Further to the statement on page 177 of the Registration Statement (F-1), on October 20, 2014, the Sheshinski Committee published the final conclusions "regarding the government take to be received from use of national resources by private bodies" on the Internet site of the Ministry of Finance (the "Committee's Recommendations").
|
The main Committee Recommendations, as described in the Executive Summary chapter, are as follows:
|
The mix of taxes on natural resources in Israel will include three taxation elements: royalties, natural resources tax and corporate tax.
|
|
|
The royalty rate for all minerals will be 5% for any extracted amount (currently, the royalty rate for potash is 5% on annual sales of up to 1.5 million tons, and 10% for any sales above that amount. The royalty rate for phosphates is 2%); the calculation of the royalties for phosphates which is made in accordance with the Mines Ordinance, will be changed such that the recognition of refining and processing costs of the mined raw material will be in accordance with normative costs to be established in the law.
|
A new natural resources tax will be imposed. The following are the main aspects of the proposed tax:
|
–›
|
The natural resources tax base will be the amount from which the natural resources tax will be collected every year.
|
|
–›
|
The tax base will be the Company’s operating profit, according to accounting profit and loss statements, after certain adjustments (such as adjusting the consolidated profit and loss statements to the solo statement, adjusting the sale price in transactions with related parties according with the transfer price, adjustments according to the Income Tax Ordinance) less financing expenses in the rate of 5% of the Company’s working capital, and less an amount that will represent the yield on the remaining depreciated cost of the fixed property used in the production and sale of the mineral.
|
|
|
–›
|
A progressive tax will be imposed on the tax base, as described above, at a rate that will be determined in accordance with the level of the yield on the remaining depreciated cost of the fixed property used in the production and sale of the mineral in that year. The first tax bracket for the natural resource tax will be 25% and the second tax bracket will be 42%, based on the range of the yields on the remaining depreciated cost of the fixed property, as follows:
For operating profit in a yield level of 14%, the tax will be 0%.
For operating profit in a yield level between 14%-20%, the tax rate will be 25%.
For operating profit in a yield level beyond 20%, the tax rate will be 42%.
|
|
–›
|
For the years in which the natural resources tax base is negative, the negative amount will be carried over from year to year, and will serve as a tax shield in the following tax year.
|
The limits of the natural resources tax – the natural resources tax will only be imposed on the profits derived from the production and the sale of minerals, such as potash and phosphates, and not on profits derived from downstream industrial activity. In addition, the natural resources tax will be calculated separately for each mineral. However, to the extent that there is a synergy between the different resources, and that a particular mineral produces a benefit
24
in the production of a different mineral, the Committee believes that such benefit should be reflected in the calculation of the natural resources tax.
Consequently, the benefit produced by the magnesium plant for the potash plant in the production of sylvinite will be recognized as an expense for the potash plant, and accordingly will be recognized as income for the magnesium plant. Clear rules will be established for this purpose with regard to the calculation of the said savings, with respect to potash and other minerals, if applicable. A mechanism will be established for determining the market price for natural resources transactions between related parties in Israel, as well as a mechanism for calculating the manner in which expenses will be attributed to the production and sale of the natural resource and to the downstream activities.
Regarding bromine, a natural resources tax will be imposed in the same way it is imposed on other natural resources, other than that the transfer price will be calculated separately for transfers to related parties in Israel, and separately for sales to related parties abroad. The transfer price for elemental bromine to related parties will be the higher of the following:
|
|
–›
|
The actual price – the actual sale price for elemental bromine to related parties in Israel or abroad, whichever is relevant;
|
|
|
–›
|
The price to a third party – the weighted average of the sale price to unrelated parties, which are manufacturers of bromine compounds, while adjusting the shipping and marketing costs, as needed;
|
|
|
–›
|
A normative price – the normative price will be linked to the bromine compounds index and determined based on the Netback method, relying on the data from the five previous years for the Bromine Compounds Company in Israel or abroad, as relevant. In each of those years, all bromine compounds production costs will be deducted from the sales turnover for the Bromine Composite Company, except for the cost of purchasing the raw bromine. The operating profit, before the deduction of the cost of purchasing the raw bromine, will also be deducted of a normative profit in the rate of 12% of the sales turnover of the Bromine Compounds Company in Israel or abroad, as the case may be. The amount reached through this calculation, for each of the years that is examined, will be divided by the amount of the bromine that the Bromine Compounds Company has purchased in each of the years, and will be weighted into the stated normative price. The mechanism will be examined every 5 years and will be updated if necessary.
|
|
|
The government take to be received from minerals when a natural resources tax is imposed is expected according to the Committee to range from 46%-55%.
|
|
|
The Committee’s Recommendations, if they are anchored into legislation, will apply to DSW, as of January 1, 2017.
|
|
|
The end of the Dead Sea concession period – a designated team will be established, to be appointed by the Accountant General at the Ministry of Finance, which will work to establish certainty regarding the manner in which the value of the DSW assets will be calculated at the end of the concession period, in accordance with the Deed of Concession. This team will submit its recommendations to the Minister of Finance by the end of the first quarter of 2015. Additionally, the Minister of Finance will appoint a second team which will submit recommendations regarding the government actions that are needed in anticipation of the end of the concession period and will examine the manner in which the concession will be
|
25
granted in the future. This team will submit its recommendations by the end of the first quarter of 2016.
|
|
The Encouragement of Capital Investments Law – the law will be amended, to clarify that with regard to any tax benefits pursuant to that law, the definition of a “mineral extraction plant” will include all the plant’s activity through the production of the first sellable natural resources, such as potash, bromine and magnesium. Therefore, any activity in the production of the mineral will be subjected to the excess profit tax, and will not be entitled to tax benefits pursuant to the Encouragement of Capital Investments Law. Downstream product activity such as bromine compounds and fertilizers will not be a part of the base used for calculating the excess profits tax and will not be excluded from the application of the Law.
|
|
|
It should be noted, that attached to the Committee’s Recommendation’s, were, among others, a minority statement of the Accountant General at the Ministry of Finance as well as a reservation from the Committee’s Recommendations of the representatives of the Ministry of Economy and the Ministry of National Infrastructures, Energy and Water Resources.
|
|
|
The Company, with the assistance of its economic and legal advisors, is reviewing the Committee’s Recommendations, including the changes between the final recommendations in comparison to the interim recommendations, and their impact, inter alia, on the Company’s business results.
|
The Board of Directors has determined that the Recommendations will not change the decisions reached by the Board of Directors in August 2014 (see section 7.2 above) that were based on the Interim Recommendations. On November 10, 2014, the Ministry of Finance issued a press released according to which on November 10, 2014, the Social-Economic Cabinet unanimously approved the Committee Recommendations. According to the press release, the final recommendations will be enacted into law and brought for the approval of the Knesset. There is no certainty that the Knesset will approve the Committee's recommendations in their current wording.
|
7.14
|
On October 21, 2014, the Human Resources and Compensations Committee and the Company's Board of Directors approved the renewed purchase of the insurance policy covering the Company's officers, presently serving or who will serve, from time to time, and their liability as part of their service in certain companies wherein they were appointed or will be appointed by the ICL Group or on its behalf, for an additional year, until August 30, 2015. The approved insurance policy includes an initial joint tier with Israel Corporation for insurance of the liability of officers with a cap of $20 million, per event and for the period, as well as a separate second tier for insurance of the liability of officers in the ICL Group, with a cap of $200 million, per event and for the period. According to the terms of the framework transaction, officers in the ICL Group, as stated, will be beneficiaries in both tiers. As part of the said approvals, a total annual premium was approved, which is to be paid by the Company in respect of the said policy and that does not exceed the maximum premium as determined in the framework transaction as well as that the acquisition terms of policy conform to the framework transaction as approved by the General Meeting of the Company's shareholders on May 8, 2014, and the Compensation Policy for the Company's officers.
|
|
7.15
|
For additional details regarding the Company and its subsidiary, BK Giulini GmbH, with Kurita Water Industries Ltd., in an agreement for the sale of business units of in ICL's Performance Products segment in the areas of solutions for water treatment and chemicals for paper as well as aluminum compounds, see Note 6 to the financial statements.
|
|
7.16
|
On October 27, 2014, Mr. Avi Doitchman, Executive VP, CFO & Strategy, gave notice of his wish to retire from his position. The retirement date has not yet been determined, but it will take place after publication of the financial statements for 2014. A replacement for Mr. Doitchman has not yet been appointed.
|
|
7.17
|
On November 4, 2014, the Company gave notice of its intention to convene an Annual General Meeting, to be held on December 11, 2014, where the following matters will be on its Agenda:
|
|
–›
|
re-election of Nir Gilad, Avisar Paz, Eran Sarig, Ovadia Eli, Victor Medina, Avraham (Baiga) Shochat and Aviad Kaufman as directors;
|
|
–›
|
approval of amendments to the Company's Compensation Policy for Office Holders;
|
|
–›
|
approval of equity compensation grant to the Chief Executive Officer, Mr. Stefan Borgas;
|
|
–›
|
re-appointment of Somekh Chaikin, a member of KPMG International, as the Company's independent auditor;
|
|
–›
|
review of the Company's audited financial statements and Board of Directors’ Report for the year ended December 31, 2013.
|
The date for determination of the eligibility to vote at the General Meeting was set at November 10, 2014.
26
|
7.18
|
On November 11, 2014, Mr. Eli Amit, Senior Vice-President Economics, gave notice of his wish to retire from his position in 2016.
|
|
7.19
|
On November 11, 2014, the Board of Directors authorized the Company's management to launch an offering of notes to institutional investors in the U.S., Europe and Israel pursuant to Rule 144A and Regulation S of the U.S. Securities Act of 1933, as amended. As of the date of this report, the scope and terms of the issuance have not yet been determined. If the offering will be completed, the notes will be rated.
|
The Company intends to use the net proceeds from the offering, if completed, to repay certain short-term loans and debt under its outstanding revolving credit facilities, which will provide it flexibility for future borrowings under the revolving credit facilities for general corporate purposes, potential acquisitions and refinancing of existing debt.
The Company intends to file an application with the Tel Aviv Stock Exchange Ltd. ("TASE") for registration of the debentures on the institutional investors' trading system operated by TASE ("Continuous Trading - Institutional"). Completion of the offering is subject to market conditions and may not occur.
The securities to be offered have not been and will not be registered under the U.S. Securities Act of 1933, as amended, and may not be offered or sold in the United States absent registration or an applicable exemption from registration requirements.
|
7.20
|
Further to the statement on page 111 of the Registration Statement F-1, in connection with expansion of the manufacturing on the Suria site in Spain, on November 11, 2014, the Company's Board of Directors approved investments, in the aggregate amount of about $330 million, with respect to execution of the second stage of the project and construction of logistical facilities on the production site and in the Barcelona port.
|
27
28
Condensed Consolidated Interim Statements of Financial Position
The accompanying notes are an integral part of these condensed consolidated interim financial statements.
29
Condensed Consolidated Unaudited Interim Statements of Financial Position (Cont'd)
The accompanying notes are an integral part of these condensed consolidated interim financial statements.
30
Condensed Consolidated Unaudited Interim Statements of Income
The accompanying notes are an integral part of these condensed consolidated interim financial statements.
31
Condensed Consolidated Unaudited Interim Statements of Comprehensive Income
The accompanying notes are an integral part of these condensed consolidated interim financial statements.
32
Condensed Consolidated Unaudited Interim Statements of Changes in Equity
The accompanying notes are an integral part of these condensed consolidated interim financial statements.
33
Condensed Consolidated Unaudited Interim Statements of Changes in Equity (cont'd)
The accompanying notes are an integral part of these condensed consolidated interim financial statements.
34
Condensed Consolidated Unaudited Interim Statements of Changes in Equity (cont'd)
The accompanying notes are an integral part of these condensed consolidated interim financial statements.
35
Condensed Consolidated Unaudited Interim Statements of Changes in Equity (cont'd)
The accompanying notes are an integral part of these condensed consolidated interim financial statements.
36
Condensed Consolidated Unaudited Interim Statements of Changes in Equity (cont'd)
The accompanying notes are an integral part of these condensed consolidated interim financial statements.
37
Condensed Consolidated Unaudited Interim Statements of Cash Flows
|
For the nine-month
period ended
|
For the three-month
period ended
|
For the
year ended
|
||||||||||||
|
September 30
2014
|
September 30
2013
|
September 30
2014
|
September 30
2013
|
December 31
2013
|
||||||||||
|
US$ thousands
|
US$ thousands
|
US$ thousands
|
US$ thousands
|
US$ thousands
|
||||||||||
| ) | ) | ) | ) | ) | ||||||||||
| ) | ) | ) | ||||||||||||
| ) | ) | |||||||||||||
| ) | ) | ) | ||||||||||||
| ) | ) | |||||||||||||
| ) | ||||||||||||||
| ) | ) | ) | ||||||||||||
| ) | ) | |||||||||||||
| ) | ) | ) | ) | ) | ||||||||||
| ) | ) | ) | ) | ) | ||||||||||
| ) | ) | |||||||||||||
| ) | ) | ) | ) | ) | ||||||||||
| ) | ) | ) | ) | ) | ||||||||||
| ) | ) | ) | ) | ) | ||||||||||
| ) | ||||||||||||||
| ) | ) | ) | ) | ) | ||||||||||
| ) | ) | ) | ) | ) | ||||||||||
| ) | ) | ) | ) | ) | ||||||||||
| ) | ||||||||||||||
| ) | ) | ) | ) | |||||||||||
| ) | ||||||||||||||
| ) | ) | |||||||||||||
| ) | ) | |||||||||||||
The accompanying notes are an integral part of these condensed consolidated interim financial statements.
38
Notes to the condensed consolidated interim financial statements (Continued) as at September 30, 2014 (Unaudited)
Note 1 – The Reporting Entity
Israel Chemicals Ltd. (hereinafter – “the Company” or “ICL”), is a Company domiciled and incorporated in Israel, the shares of which are traded on the Tel-Aviv Stock Exchange and on the NYSE in the United States. The address of the Company’s registered office is 23 Aranha St., Tel-Aviv, Israel. The Company and its subsidiaries, associated companies and joint ventures (hereinafter – “the Group”) are a leading specialty minerals company that operates a unique, integrated business model. We extract raw materials, and utilize sophisticated processing and product formulation technologies to add value to customers in three attractive end markets: agriculture, food and engineered materials. These three end markets constitute over 90% of the Company's present revenues. Our operations are organized into three segments: (1) Fertilizers, which operates the raw material extraction for us and markets potash, phosphates and specialty fertilizers; (2) Industrial Products, which primarily extracts bromine from the Dead Sea and produces and markets bromine and phosphorus compounds for the electronics, construction, oil & gas and automotive industries and (3) Performance Products, which mainly produces, markets and sells a broad range of downstream phosphate-based food additives and industrial intermediates. The Company is a subsidiary of Israel Corporation Ltd.
Our principal assets include: Access to one of the world’s richest, longest-life and lowest-cost sources of potash and bromine (the Dead Sea). Access to potash mines in the United Kingdom and Spain. Bromine compounds processing facilities located in Israel, the Netherlands and China. A unique integrated phosphate value chain, from phosphate rock mines in the Negev Desert in Israel to our value-added products in Israel, Europe, U.S, Brazil and China. An extensive global logistics and distribution network with operations in over 30 countries and a focused and highly experienced group of technical experts developing production processes, new applications, formulations and products for our three key end markets agriculture, food and engineered materials. The Company and some of the Group companies were declared a monopoly with respect to some of the products they manufacture and/or sell in Israel.
ICL operates in the markets for potash, bromine, pure phosphoric acid, special phosphates, bromine-based and phosphorus-based flame retardants and chemicals for the prevention of the spreading of fires. Potash and phosphates are main food prototypes in the areas of fertilizers. Bromine is used in a wide range of applications, primarily as a basic component of flame retardants.
ICL’s products are used mainly in the areas of agriculture, electronics, food, fuel and gas exploration, water purification and desalination, detergents, paper, cosmetics, medicines, vehicles, aluminum and others.
The Group’s overseas operations consist mainly of the production of products that are integrated with or based on the activities of the companies in Israel or in closely related fields. About 95% of the Group’s products are sold to customers outside of Israel.
39
Note 2 - Basis of Preparation of the Financial Statements
A. Statement of compliance with International Financial Reporting Standards (IFRS)
The condensed consolidated interim financial statements were prepared in accordance with IAS 34, “Interim Financial Reporting” and do not include all of the information required in complete, annual financial statements. These statements should be read together with the financial statements as at and for the year ended December 31, 2013 (hereinafter – “the Annual Financial Statements”).
The condensed consolidated interim financial statements were approved for publication by the Company’s Board of Directors on November 11, 2014.
B. Functional currency and presentation currency
Items included in the condensed consolidated interim financial statements of the Company and each of its subsidiaries are measured using the currency of the primary economic environment in which each company operates. The consolidated financial statements are presented in United States Dollars (“US Dollars”; $), which is the functional currency of the Company and the majority of its subsidiaries.
C. Use of estimates
In preparation of the condensed consolidated interim financial statements in accordance with IFRS, Company management is required to use judgment when making estimates and assumptions that affect implementation of the policies and the amounts of assets, liabilities, income and expenses. It is clarified that the actual results are likely to be different from these estimates.
Management’s judgment, at the time of implementing the Group’s accounting policies and the main assumptions used in the estimates involving uncertainty, are consistent with those used in the Annual Financial Statements.
Note 3 - Significant Accounting Policies
A. The Company's accounting policies in these condensed consolidated interim financial statements are the policies that were applied in the Annual Financial Statements as at December 31, 2013, except for that stated in Section B, below.
40
Note 3 - Significant Accounting Policies (Cont'd)
B. Initial application of new accounting standards
IFRIC Interpretation 21 “Levies” (hereinafter – “the Interpretation”). The Interpretation provides guidelines in connection with the accounting treatment of a liability to pay government levies that are within the scope of IAS 37 "Provisions, Contingent Liabilities and Contingent Assets", as well as with respect to government levies that are not within the scope of IAS 37 since the timing of their repayment and the amounts thereof are certain. A "levy" is defined as an outflow of resources imposed on an entity by the government through legislation and/or regulation. The Interpretation provides that a liability for payment of a levy is to be recognized only upon occurrence of the event that creates the payment obligation, even in cases where the entity has no practical possibility of avoiding the event.
The Interpretation applies to reporting periods commencing on January 1, 2014.
The impact of the above-mentioned Interpretation on the condensed consolidated interim financial statements is not material.
Note 4 - Operating Segments
A. General
The basis for the breakdown into segments and the measurement basis for the income (loss) of the segments is the same as that presented in Note 5 "Operating Segments" in the annual financial statements.
41
Note 4 - Operating Segments (Cont'd)
B. Operating segment data
|
Fertilizers
|
Industrial
products
|
Performance
products
|
Other
activities
|
Eliminations | Consolidated | ||||
|
Potash
|
Phosphate
|
Eliminations
|
Total
|
||||||
|
US$ thousands
|
|||||||||
42
Note 4 - Operating Segments (cont'd)
B. Operating segment data (cont'd)
|
Fertilizers
|
Industrial
products
|
Performance
products
|
Other
activities
|
Eliminations
|
Consolidated
|
||||
|
Potash
|
Phosphate
|
Eliminations
|
Total
|
||||||
|
US$ thousands
|
|||||||||
43
Note 4 - Operating Segments (Cont'd)
B. Operating segment data (cont'd)
|
Fertilizers
|
Industrial
products
|
Performance
products
|
Other
activities
|
Eliminations
|
Consolidated
|
||||
|
Potash
|
Phosphate
|
Eliminations
|
Total
|
||||||
|
US$ thousands
|
|||||||||
|
2,088
|
|||||||||
44
Note 4 - Operating Segments (cont'd)
B. Operating segment data (cont'd)
|
Fertilizers
|
Industrial
products
|
Performance
products
|
Other
activities
|
Eliminations
|
Consolidated
|
||||
|
Potash
|
Phosphate
|
Eliminations
|
Total
|
||||||
|
US$ thousands
|
|||||||||
45
Note 4 - Operating Segments (cont'd)
B. Operating segment data (cont'd)
|
Fertilizers
|
Industrial
products
|
Performance
products
|
Other
activities
|
Eliminations
|
Consolidated
|
||||
|
Potash
|
Phosphate
|
Eliminations
|
Total
|
||||||
|
US$ thousands
|
|||||||||
46
Note 5 - Financial Instruments and Risk Management
A. Fair value of financial instruments
The Group’s financial instruments mostly include non-derivative assets: cash and cash equivalents, investments, short-term deposits and loans, receivables and other current-receivable, long-term investments and receivables; non-derivative financial liabilities: short-term credit, payables and other current liabilities, long-term loans and other long-term liabilities; as well as derivative financial instruments.
Due to their nature, the fair value of the financial instruments included in the working capital of the Group is generally identical or approximates their carrying value in the books. The fair value of the long-term deposits and receivables and the long-term liabilities also approximates their carrying value in the books, as these financial instruments bear interest at a rate which approximates the accepted interest market rate.
The following table details the book value and the fair value of financial instrument groups presented in the financial statements not in accordance with their fair value
|
September 30, 2014
|
September 30, 2013
|
December 31, 2013
|
||||
|
Carrying amount
|
Fair value
|
Carrying amount
|
Fair value
|
Carrying amount
|
Fair value
|
|
|
US$ thousands
|
US$ thousands
|
US$ thousands
|
US$ thousands
|
US$ thousands
|
US$ thousands
|
|
B. Hierarchy of fair value
The following table presents an analysis of the financial instruments measured by fair value, using the valuation method.
The following levels were defined:
Level 1: Quoted (unadjusted) prices in an active market for identical instruments
Level 2: Observed data in the market (directly or indirectly) not included in Level 1 above.
|
September 30, 2014
|
|||
|
Level 1
|
Level 2
|
Total
|
|
|
US$ thousands
|
US$ thousands
|
US$ thousands
|
|
47
Note 5 - Financial Instruments and Risk Management (cont'd)
B. Hierarchy of fair value (cont'd)
|
September 30, 2013
|
|||
|
Level 1
|
Level 2
|
Total
|
|
|
US$ thousands
|
US$ thousands
|
US$ thousands
|
|
|
100,074
|
|||
Note 6 - Additional Information
1. On February 11, 2014, the Company’s Board of Directors decided to distribute a one-time dividend in the amount of $500 million (the net dividend, less the share of a subsidiary, amounts to $499.1 million). The dividend was distributed on March 26, 2014.
2. On March 18, 2014, the Company’s Board of Directors decided to distribute a dividend in the amount of $83 million (the net dividend, less the share of a subsidiary, amounts to $82.9 million). The dividend was distributed on May 27, 2014.
3. On May 14, 2014, the Company's Board of Directors decided to distribute a dividend, in the amount of $91.5 million (the net dividend, less the share of a subsidiary, is $91.3 million), about $0.07 per share. The dividend was distributed on June 25, 2014.
4. On August 6, 2014, the Company's Board of Directors decided to distribute a dividend, in the amount of $47 million, about $0.04 per share. The dividend was distributed on September 17, 2014.
5. On November 11, 2014, the Company's Board of Directors decided to distribute a dividend, in the amount of $125 million, about $0.10 per share. The dividend will be distributed on December 17, 2014 with a record date of December 3, 2014.
6. Further to that stated in Note 17 to the annual financial statements, in January 2014, the Company received the proceeds from the private placement in the United States of unregistered debentures. The amount of the issuance is about $275 million, for a period of 7–12 years, as follows: the amount of about $84 million bearing fixed interest at an annual rate of 4.55% for a period of 7 years, the amount of about $145 million bearing fixed interest at an annual rate of 5.16% for a period of 10 years and the amount of about $46 million bearing fixed interest at an annual rate of 5.31% for a period of 12 years.
7. In the first quarter of 2014, the Company included a provision, in the amount of about $51 million, which was based on principles agreed to in assessment hearings between subsidiaries in Europe and the relevant tax authorities. During the second quarter, an assessment agreement was signed, the results of which correspond with the principles used in calculating the said provision.
8. In May 2014, the Company signed an agreement with a European bank whereby the bank provided a credit framework, in the amount of €50 million. This credit framework is for a period of 5 years and is to be repaid in full at the end of the period. This credit framework bears variable interest on the basis of the Euribor plus a margin of 0.95%-1.25%. A non-utilization commission will be charged at the rate of 0.33% per year. As at the date of the report, the credit framework had not been used. The financial covenants in respect of this credit framework are the same as the financial covenants detailed in Note 17 to the annual financial statements.
49
Note 6 - Additional Information (Cont'd)
9. In June 2014, the Company signed loan agreements with a number of international institutional entities, in the aggregate amount of about €57 million and about $45 million. The proceeds of these loans were received during the period of the report, in July 2014. The loans are to be repaid in a period of between five to ten years, where some of the loans bear fixed interest in the range of 2.1%-3.75%, some of them bear variable interest on the basis of Libor + 1.55% and some of them bear variable interest on the basis of the Euribor plus a margin of 1.4%-1.7%. The financial covenants in respect of these loans are the same as the financial covenants detailed in Note 17 to the annual financial statements. As at the date of the report, the Company is in compliance with the financial covenants.
10. In the period of the report, the Company entered into an undertaking with a European bank whereby the bank provided a credit framework in the amount of €100 million and $100 million. This credit framework is for a period of six years and is to be repaid in full at the end of the period. The credit framework in euro replaces the credit framework provided by the bank to the Company in November 2011 which has not yet been utilized. For details – see Note 17 to the annual financial statements. The dollar framework bears variable interest on the basis of Libor + 0.9%-1.4%, the euro framework bears variable interest on the basis of Euribor + 0.9%-1.4%. A non-utilization commission will be charged at the rate of 0.32% per year. As at the date of the report, about $100 million had been utilized out of the dollar credit framework. The financial covenants in respect of this credit framework are the same as the financial covenants detailed in Note 17 to the annual financial statements. As at the date of the report, the Company was in compliance with the financial covenants.
11. Further to that stated in Note 29 to the annual financial statements, during August 2014, the Company repaid a short-term loan received from Israel Corporation (the Company's controlling shareholder), in the amount of $50 million.
12. Further to that stated in Note 23 to the annual financial statements, regarding receipt of phosphate mining permits in the Barir Field, on April 3, 2014, the Company was informed that the Minister of Health, Ms. Yael German, contacted the Head of the Planning Administration in the Ministry of the Interior, Ms. Binat Schwartz, and notified her that after reviewing the opinion of the expert appointed by the Ministry of Health, she had decided to oppose the possibility of mining in the Barir Field, including the test mining. The Company disagrees with the Minister of Health's interpretation of the opinion. In the Company's estimation and based on its understanding of the said opinion, this opinion does not contradict the Company's position that the mining activities in the Barir Field do not involve any risks to the environment or to the population.
13. Further to rejection by the Court of the petition of the Hotels Union for issuance of an Interim Order prohibiting raising of the dykes, and the hearing scheduled to be held on September 15, 2014, as stated in Note 23 to annual financial statements, on May 1, 2014, some of the hotels in the Dead Sea area filed a separate administrative petition and a request for issuance of an Interim Order (in the District Court for Jerusalem) against the Regional Planning Board and the Company for Protection of the Dead Sea (the respondents), instructing with respect to the issuance of Injunctive Orders prohibiting the Regional Planning Board from hearing the request for a building permit for raising the dykes in the area of Nevei Zohar and a prohibition against performance of the work on the Nevei Zohar beaches by the Company for Protection of the Dead Sea.
50
Note 6 - Additional Information (Cont'd)
13. (Cont'd). On June 1, 2014, a hearing was held and the Court gave the force of a court decision to the settlement proposed as part of the separate petition, whereby the Company for Protection of the Dead Sea will be required to provide the petitioners documents and plans in connection with the request for a building permit, and the petitioners are to submit their responses to the plans, as stated, which will be restricted solely to the matter of the timetables and the manner of execution of the plan, and where no objections will be heard regarding the height of the dyke and the height of the water level. No interim order was issued.
14. Further to that stated in Note 23 to the annual financial statements, on May 19, 2014, a partial arbitration decision was received regarding the royalties’ issue (hereinafter – “the Arbitrators’ Decision”). Based on the principles of the decision received, Dead Sea Works Ltd. (‘‘DSW’’) is required to pay the State royalties on the sale of downstream products manufactured by companies that are controlled by ICL that have production plants located both in and outside the Dead Sea area, including outside of Israel. The royalties are to be paid according to the value of the downstream products, which will be set according to the formula described in Section 15(a)(2) of the Concession Deed, based on the selling price of the downstream products to unrelated third parties less the deductions set forth in subsections (I), (II) and (III) of that Section. Regarding metal magnesium, it was decided that the State of Israel and DSW are to exhaust their discussions on the subject of the royalties to be paid by DSW on metal magnesium, and if no agreement is reached the matter is to be returned to arbitration. The Arbitrators’ Decision was issued with respect to fundamental determinations with respect to the obligation to pay royalties on downstream products and does not include reference to the financial calculations arising from the decision. These financial calculations will be discussed in the next phase of the arbitration. In the second quarter of 2014, in accordance with the Company's estimate, based on its legal advisors, a provision was recorded in the amount of about $135 million due to implementation of the partial arbitration award for the years 2000 through 2013. The amount of this provision includes, among other things, interest and is net of the tax effect. In addition, as a result of the Arbitrators’ Decision, the current expense in the period of the report in respect of royalties increased by about $8 million. The Arbitrators’ Decision is partial and the financial calculations with respect to the manner of implementation of the Decision have not yet been provided. Therefore, the Company’s estimation is based on various assumptions regarding the manner of calculating the royalties deriving from the partial Arbitrators’ Decision and reflects the best estimate of the expense that will be required to settle the liability presently, at the end of the period of the report.
51
Note 6 - Additional Information (Cont'd)
14. (Cont'd). The final amount that will be determined by the arbitrators at the end of the second stage of the arbitration after the arbitration panel determines the financial calculations, as noted, may differ, even materially, from the amount of the provision. In the second stage of the arbitration, which will deal with determination of the amounts of the royalties, the Company intends to claim that the correct amount of the royalties is significantly lower than the amount stated. Pursuant to the decision of the arbitrators, the Company is required to present the State a detailed calculation of the royalties owed to the State, according the Company's perception of the correct calculation, by the end of December 2014.
15. On August 6, 2014, the Company’s Board of Directors approved an issuance of up to about 4,384,540 non-marketable options, for no consideration, exercisable for up to about 4,384,540 shares of the Company, and up to about 1,025,449 restricted shares, to about 450 ICL officers and senior employees. The issuance includes a material private offer of 367,294 options and 85,907 restricted shares to the Company’s CEO, which is subject to approval by the General Meeting of the Company’s shareholders.
This grant format of the options' plan includes a “cap” for the value of a share where if as at the exercise date the closing price of a Company share is higher than twice the exercise price (“the Share Value Cap”), the number of the exercise shares will be adjusted so that the product of the exercise shares actually issued to the offeree multiplied by the share closing price will equal the product of the number of exercised options multiplied by the Share Value Cap.
The options and restricted shares will vest in three equal portions: one-third at the end of 24 months from December 1, 2014, one-third at the end of 36 months from December 1, 2014 and one-third at the end of 48 months from December 1, 2014. The expiration date of the options exercisable in the first portion is at the end of 48 months from December 1, 2014, the expiration date of the options exercisable in the second portion is at the end of 60 months from December 1, 2014 and the expiration date of the options exercisable in the third portion is at the end of 72 months from December 1, 2014.
Upon exercise, every option may be converted into one ordinary share of NIS 1 par value of the Company. The ordinary shares issued as a result of exercise of the options have the same rights as the Company’s ordinary shares, immediately upon their issuance. The options issued to the employees in Israel are covered by the provisions of Section 102 of the Income Tax Ordinance (New Version) and the regulations promulgated thereunder. The Company elected that the issuance will be made through a trustee, under the Capital Gains Track.
The exercise premium is about $8.4 for each option, linked to the CPI that is “known” on the date of payment. In a case of distribution of a dividend by the Company, the exercise premium is reduced, on the “ex-dividend” date, by the amount of the dividend per share (gross), based on the amount thereof in shekels on the effective date. The options are not marketable and may not be transferred. The fair value of the options was estimated by means of application of a binomial model for pricing options and is about $8.4 million. The expected volatility for the first, second and third portions is about 29.37%, 31.24% and 40.77%, respectively, which was determined on the basis of the historical volatility in the Company’s share prices.
52
Note 6 - Additional Information (Cont'd)
15. (Cont'd). The life of the options was determined on the basis of Management’s estimate of the period the employees will hold the options, taking into consideration their position with the Company and the Company’s past experience regarding the turnover of employees. The risk-free interest rate was determined on the basis of the yield to maturity of shekel-denominated Government debentures, with a remaining life equal to the anticipated life of the options.
The fair value of the said restricted shares is $8.4 million. The value of the restricted shares offered to the offerees was determined based on the closing price on the stock market on the last trading day prior to the approval date of the Board of Directors.
The cost of the benefit embedded in the above-mentioned plan will be recognized in the statement of income over the vesting period.
In addition, a long-term remuneration plan was approved from about 11,800 non-management Company employees that are not included in the plan for issuance of options and restricted shares, as described above, in the aggregate scope of up to about $17 million.
On September 28, 2014, the Company issued 927,467 shares and 4,017,246 options, pursuant to the plan for the Company's employees.
16. On August 27, 2014, the Company's Board of Directors decided, regarding the matter of examination of the economic profitability of continuing to produce certain products, including metal magnesium, bromine compounds and certain phosphate downstream products, as follows:
Bromine Compounds – the Company's Board of Directors instructed the Company's management team to develop and implement an efficiency plan designed to significantly improve the profitability of Bromine Compounds Company, from the Industrial Products segment. The Board of Directors determined that this plan is required due to the continuing erosion of profits on bromine compounds as a result of a decline in demand for flame retardants, low structural growth in the world market, a drop in prices and strengthening of the shekel, compounded by the significant recent developments related to the partial arbitration decision with respect to royalties on sales of downstream products, including bromine compounds and the possibility that the Sheshinski Committee’s Interim Recommendations will be adopted and enacted into legislation. Company management is making preparations to formulate a plan, as stated, which is expected to include the reduction of labor and other costs in the Bromine Compounds Company. There is no certainty that the Company will be able to formulate such a plan or that such a plan can be implemented successfully, as a result of various factors, including the situation of the market, competition, regulation, labor relations and/or any of the risk factors characterizing the Company's activities, as detailed in the F-1 published on September 23, 2014. In addition, the Company could be adversely affected as a result of such plan, including through potential labor unrest, even reaching the level of strikes in certain facilities.
The Magnesium Plant – the Company's Board of Directors instructed Company management team to make preparations for closure of our magnesium plant at the Dead Sea, commencing January 1, 2017, to the extent the discussions with the State of Israel regarding the tax and royalties issues will not support the continuation of the activities of the magnesium plant.
53
Note 6 - Additional Information (Cont'd)
17. (Cont'd). Company management was instructed to ensure all existing and future customer orders and commitments in order to avoid any interruptions until the final closure of the plant. The main economic justification for continuation of the activities of the magnesium plant at the Dead Sea stems from the plant’s synergies with our other facilities in Sodom, which provide it with, and receive from it, raw materials (the “Synergies”). The net value of the Synergies has declined due to the increase in the tax burden on production from natural resources in Israel that have already been implemented, and will further decline if the Sheshinski Committee’s Interim Recommendations are enacted into law. As noted above, we have halted all investments in the magnesium plant (other than investments required by law). In 2013, our total sales of magnesium were approximately $115 million and the gross profit of the magnesium company in 2013 was approximately $1 million, the net book value of the fixed assets of the magnesium company as of September 30, 2014 was approximately $35 million and the depreciation expense in 2013 was approximately $6 million.
The said decisions did not have a significant impact on the Company's financial results in the period of the report.
18. On October 26, 2014, the Company and its subsidiary, BK Giulini GmbH, entered into an agreement with Kurita Water Industries Ltd. (Kurita), for the sale of business units in ICL's Performance Products segment, which operate in a number of areas: solutions for water treatment, chemicals for paper and aluminum compounds. The said business units operate primarily in Germany, and in other locations elsewhere in Europe and in China. The transaction will be for a consideration of approximately €250 million. Closing of the transaction is expected to take place towards the end of 2014, subject to fulfillment of a number of preconditions set forth in the purchase agreement, including receipt of approvals from competent authorities, as well as approval of a minimum number of employees for transfer to the employment by the purchasing company. There is no certainty that the transaction will be completed and/or that it will be completed in accordance with the conditions detailed in this report above. Accordingly, in its financial statements as at September 30, 2014, the Company classified the relevant business units as "assets held for sale". As at the date of the report, there is no impact on the results stemming from the said transaction.
54
SIGNATURE
Pursuant to the requirements of the Securities Exchange Act of 1934, the registrant has duly caused this report to be signed on its behalf by the undersigned, thereunto duly authorized.
|
Israel Chemicals Ltd.
|
||||||
|
By:
|
/s/ Avi Doitchman
|
|||||
|
Name:
|
Avi Doitchman
|
|||||
|
Title:
|
Executive Vice President, Chief Financial Officer & Strategy
|
|||||
|
Israel Chemicals Ltd.
|
||||||
|
By:
|
/s/ Lisa Haimovitz
|
|||||
|
Name:
|
Lisa Haimovitz
|
|||||
|
Title:
|
Vice President, General Counsel and Corporate Secretary
|
|||||
Date: November 12, 2014