UNITED STATES
SECURITIES AND EXCHANGE COMMISSION
WASHINGTON, D.C. 20549
FORM N-CSR
CERTIFIED SHAREHOLDER REPORT OF REGISTERED
MANAGEMENT INVESTMENT COMPANIES
Investment Company Act file number 811-07255
Oppenheimer International Bond Fund
(Exact name of registrant as specified in charter)
6803 South Tucson Way,
Centennial, Colorado 80112-3924
(Address of principal executive offices) (Zip code)
Arthur S. Gabinet
OFI Global Asset Management, Inc.
Two World Financial Center, New York, New York 10281-1008
(Name and address of agent for service)
Registrant’s telephone number, including area code: (303) 768-3200
Date of fiscal year end: September 30
Date of reporting period: 3/28/2013
Item 1. Reports to Stockholders.
| 3 | 31 | 2013 | ||
SEMIANNUAL REPORT
Oppenheimer International Bond Fund

Class A Shares
AVERAGE ANNUAL TOTAL RETURNS AT 3/28/13
| Class A Shares of the Fund |
Citigroup Non-U.S. Dollar World Government Bond Index |
JPMorgan Government Bond Index- Emerging Markets |
JPMorgan Markets Bond |
Reference Index |
||||||||||||||||||||
| Without Sales Charge |
With Sales Charge |
|||||||||||||||||||||||
| 6-Month | 2.04 | % | –2.81 | % | –6.09 | % | 4.01 | % | 0.48 | % | –1.83 | % | ||||||||||||
| 1-Year | 7.42 | 2.32 | –2.16 | 7.68 | 10.11 | 3.17 | ||||||||||||||||||
| 5-Year | 4.52 | 3.50 | 2.28 | 8.43 | 9.44 | 5.71 | ||||||||||||||||||
| 10-Year | 9.18 | 8.65 | 5.58 | 11.93 | 10.21 | 8.53 | ||||||||||||||||||
The performance data quoted represents past performance, which does not guarantee future results. The investment return and principal value of an investment in the Fund will fluctuate so that an investor’s shares, when redeemed, may be worth more or less than their original cost. Fund returns include changes in share price, reinvested distributions, and a 4.75% maximum applicable sales charge except where “without sales charge” is indicated. Current performance may be lower or higher than the performance quoted. Returns do not consider capital gains or income taxes on an individual’s investment. Returns for periods of less than one year are cumulative and not annualized. For performance data current to the most recent month-end, visit oppenheimerfunds.com or call 1.800.CALL OPP (225.5677).
March 28, 2013 was the last business day of the Fund’s reporting period. See Note 1 of the accompanying Notes to Financial Statements. Index returns are calculated through March 31, 2013.
| 2 | OPPENHEIMER INTERNATIONAL BOND FUND |
The Fund’s Class A shares (without sales charge) produced a return of 2.04% during the six-month reporting period, outperforming its Reference Index, a customized weighted index currently comprised of 50% of the Citigroup Non-U.S. Dollar World Government Bond Index, 30% of the JPMorgan Government Bond Index—Emerging Markets Global Diversified, and 20% of the JPMorgan Emerging Markets Bond Index Global Diversified, which returned -1.83%. We attribute this result largely to the Fund’s continued emphasis on emerging market debt over developed markets.
MARKET OVERVIEW
| OPPENHEIMER INTERNATIONAL BOND FUND | 3 |
| 4 | OPPENHEIMER INTERNATIONAL BOND FUND |


1. Hemant Baijal became a Portfolio Manager on January 28, 2013.
| OPPENHEIMER INTERNATIONAL BOND FUND | 5 |
REGIONAL ALLOCATION
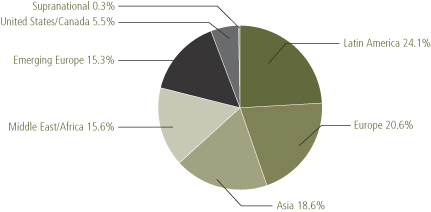
Portfolio holdings and allocations are subject to change. Percentages are as of March 28, 2013, and are based on the total market value of investments.
* March 28, 2013 was the last business day of the Fund’s reporting period. See Note 1 of the accompanying Notes to Financial Statements.
| 6 | OPPENHEIMER INTERNATIONAL BOND FUND |
Share Class Performance
AVERAGE ANNUAL TOTAL RETURNS WITHOUT SALES CHARGE AS OF 3/28/13
| Inception Date | 6-Month | 1-Year | 5-Year | 10-Year | ||||||||||||||||
| CLASS A (OIBAX) | 6/15/95 | 2.04 | % | 7.42 | % | 4.52 | % | 9.18 | % | |||||||||||
| CLASS B (OIBBX) | 6/15/95 | 1.61 | % | 6.52 | % | 3.59 | % | 8.62 | % | |||||||||||
| CLASS C (OIBCX) | 6/15/95 | 1.70 | % | 6.71 | % | 3.76 | % | 8.39 | % | |||||||||||
| CLASS I (OIBIX) | 1/27/12 | 2.30 | % | 7.97 | % | 6.86 | %* | N/A | ||||||||||||
| CLASS N (OIBNX) | 3/1/01 | 1.81 | % | 7.03 | % | 4.10 | % | 8.73 | % | |||||||||||
| CLASS Y (OIBYX) | 9/27/04 | 2.17 | % | 7.55 | % | 4.80 | % | 8.30 | %* | |||||||||||
| AVERAGE ANNUAL TOTAL RETURNS WITH SALES CHARGE AS OF 3/28/13 | ||||||||||||||||||||
| Inception Date | 6-Month | 1-Year | 5-Year | 10-Year | ||||||||||||||||
| CLASS A (OIBAX) | 6/15/95 | -2.81 | % | 2.32 | % | 3.50 | % | 8.65 | % | |||||||||||
| CLASS B (OIBBX) | 6/15/95 | -3.37 | % | 1.52 | % | 3.26 | % | 8.62 | % | |||||||||||
| CLASS C (OIBCX) | 6/15/95 | 0.70 | % | 5.71 | % | 3.76 | % | 8.39 | % | |||||||||||
| CLASS I (OIBIX) | 1/27/12 | 2.30 | % | 7.97 | % | 6.86 | %* | N/A | ||||||||||||
| CLASS N (OIBNX) | 3/1/01 | 0.82 | % | 6.03 | % | 4.10 | % | 8.73 | % | |||||||||||
| CLASS Y (OIBYX) | 9/27/04 | 2.17 | % | 7.55 | % | 4.80 | % | 8.30 | %* | |||||||||||
* Shows performance since inception.
| STANDARDIZED YIELDS | ||||
| For the 30 Days Ended 3/31/13 | ||||
| CLASS A | 2.99 | % | ||
| CLASS B | 2.31 | % | ||
| CLASS C | 2.45 | % | ||
| CLASS I | 3.60 | % | ||
| CLASS N | 2.72 | % | ||
| CLASS Y | 3.42 | % | ||
The performance data quoted represents past performance, which does not guarantee future results. The investment return and principal value of an investment in the Fund will fluctuate so that an investor’s shares, when redeemed, may be worth more or less than their original cost. Current performance may be lower or higher than the performance quoted. Returns do not consider capital gains or income taxes on an individual’s investment. For performance data current to the most recent month-end, visit oppenheimerfunds.com or call 1.800.CALL OPP (225.5677). Fund returns include changes in share price, reinvested distributions, and the applicable sales charge (unless otherwise indicated): for Class A shares, the current maximum initial sales charge of 4.75%; for Class B shares, the contingent deferred sales charge of 5% (1-year) and 2%
| OPPENHEIMER INTERNATIONAL BOND FUND | 7 |
(5-year); and for Class C and N shares, the contingent deferred sales charge of 1% for the 1-year period. There is no sales charge for Class I and Class Y shares. Because Class B shares convert to Class A shares 72 months after purchase, the 10-year return for Class B shares uses Class A performance for the period after conversion.
Standardized yield is based on net investment income for the 30-day period ended 3/31/13 and the maximum offering price at the end of the period for Class A shares and the net asset value for Class B, Class C, Class I, Class N and Class Y shares. Each result is compounded semiannually and then annualized. Falling share prices will tend to artificially raise yields.
March 28, 2013 was the last business day of the Fund’s reporting period. See Note 1 of the accompanying Notes to Financial Statements.
The Fund’s performance is compared to the Citigroup Non-U.S. Dollar World Government Bond Index, JPMorgan Government Bond Index—Emerging Markets Global Diversified, the JPMorgan Emerging Markets Bond Index Global Diversified, and the Fund’s Reference Index. The Citigroup Non-U.S. Dollar World Government Bond Index is an index of fixed rate government bonds with maturities of one year or longer. The JPMorgan Government Bond Index—Emerging Markets Global Diversified is a comprehensive, global local Emerging Markets Index, and consists of regularly traded, liquid fixed-rate, domestic currency government bonds to which international investors can gain exposure. The JPMorgan Emerging Markets Bond Index Global Diversified tracks total returns for U.S. dollar-denominated debt instruments issued by emerging market sovereign and quasi-sovereign entities: Brady bonds, loans, Eurobonds. The Fund’s Reference Index is a customized weighted index currently comprised of 50% of the Citigroup Non-U.S. Dollar World Government Bond Index, 30% of the JPMorgan Government Bond Index—Emerging Markets Global Diversified, and 20% of the JPMorgan Emerging Markets Bond Index Global Diversified. Indices are unmanaged and cannot be purchased by investors. Index performance includes reinvestment of income, but does not reflect transaction costs, fees, expenses or taxes. Index performance is shown for illustrative purposes only as a benchmark for the Fund’s performance, and does not predict or depict performance of the Fund. The Fund’s performance reflects the effects of the Fund’s business and operating expenses.
The Fund’s investment strategy and focus can change over time. The mention of specific fund holdings does not constitute a recommendation by OppenheimerFunds, Inc. or its affiliates.
Before investing in any of the Oppenheimer funds, investors should carefully consider a fund’s investment objectives, risks, charges and expenses. Fund prospectuses and summary prospectuses contain this and other information about the funds, and may be obtained by asking your financial advisor, visiting oppenheimerfunds.com, or calling 1.800.CALL OPP (225.5677). Read prospectuses and summary prospectuses carefully before investing.
Shares of Oppenheimer funds are not deposits or obligations of any bank, are not guaranteed by any bank, are not insured by the FDIC or any other agency, and involve investment risks, including the possible loss of the principal amount invested.
| 8 | OPPENHEIMER INTERNATIONAL BOND FUND |
Fund Expenses. As a shareholder of the Fund, you incur two types of costs: (1) transaction costs, which may include sales charges (loads) on purchase payments, contingent deferred sales charges on redemptions and (2) ongoing costs, including management fees; distribution and service fees; and other Fund expenses. These examples are intended to help you understand your ongoing costs (in dollars) of investing in the Fund and to compare these costs with the ongoing costs of investing in other mutual funds.
The examples are based on an investment of $1,000.00 invested at the beginning of the period and held for the entire 6-month period ended March 28, 2013.
Actual Expenses. The first section of the table provides information about actual account values and actual expenses. You may use the information in this section for the class of shares you hold, together with the amount you invested, to estimate the expense that you paid over the period. Simply divide your account value by $1,000.00 (for example, an $8,600.00 account value divided by $1,000.00 = 8.60), then multiply the result by the number in the first section under the heading entitled “Expenses Paid During Period” to estimate the expenses you paid on your account during this period.
Hypothetical Example for Comparison Purposes. The second section of the table provides information about hypothetical account values and hypothetical expenses based on the Fund’s actual expense ratio for each class of shares, and an assumed rate of return of 5% per year for each class before expenses, which is not the actual return. The hypothetical account values and expenses may not be used to estimate the actual ending account balance or expenses you paid for the period. You may use this information to compare the ongoing costs of investing in the Fund and other funds. To do so, compare this 5% hypothetical example for the class of shares you hold with the 5% hypothetical examples that appear in the shareholder reports of the other funds.
Please note that the expenses shown in the table are meant to highlight your ongoing costs only and do not reflect any transactional costs, such as front-end or contingent deferred sales charges (loads), or a $12.00 fee imposed annually on accounts valued at less than $500.00 (subject to exceptions described in the Statement of Additional Information). Therefore, the “hypothetical” section of the table is useful in comparing ongoing costs only, and will not help you determine the relative total costs of owning different funds. In addition, if these transactional costs were included, your costs would have been higher.
| OPPENHEIMER INTERNATIONAL BOND FUND | 9 |
Fund Expenses Continued
| Actual | Beginning Account Value October 1, 2012 |
Ending Account Value March 28, 2013 |
Expenses Paid During 6 Months Ended March 28, 2013 |
|||||||||
| Class A | $ | 1,000.00 | $ | 1,020.40 | $ | 4.97 | ||||||
| Class B | 1,000.00 | 1,016.10 | 9.19 | |||||||||
| Class C | 1,000.00 | 1,017.00 | 8.34 | |||||||||
| Class I | 1,000.00 | 1,023.00 | 2.78 | |||||||||
| Class N | 1,000.00 | 1,018.10 | 7.20 | |||||||||
| Class Y | 1,000.00 | 1,021.70 | 3.63 | |||||||||
| Hypothetical (5% return before expenses) |
||||||||||||
| Class A | 1,000.00 | 1,019.62 | 4.96 | |||||||||
| Class B | 1,000.00 | 1,015.45 | 9.18 | |||||||||
| Class C | 1,000.00 | 1,016.28 | 8.34 | |||||||||
| Class I | 1,000.00 | 1,021.77 | 2.78 | |||||||||
| Class N | 1,000.00 | 1,017.41 | 7.20 | |||||||||
| Class Y | 1,000.00 | 1,020.94 | 3.62 | |||||||||
Expenses are equal to the Fund’s annualized expense ratio for that class, multiplied by the average account value over the period, multiplied by 179/365 (to reflect the one-half year period). Those annualized expense ratios, excluding indirect expenses from affiliated funds, based on the 6-month period ended March 28, 2013 are as follows:
| Class | Expense Ratios | |||
| Class A | 1.00 | % | ||
| Class B | 1.85 | |||
| Class C | 1.68 | |||
| Class I | 0.56 | |||
| Class N | 1.45 | |||
| Class Y | 0.73 | |||
The expense ratios reflect voluntary waivers and/or reimbursements of expenses by the Fund’s Manager and Transfer Agent. Some of these undertakings may be modified or terminated at any time, as indicated in the Fund’s prospectus. The “Financial Highlights” tables in the Fund’s financial statements, included in this report, also show the gross expense ratios, without such waivers or reimbursements and reduction to custodian expenses, if applicable.
| 10 | OPPENHEIMER INTERNATIONAL BOND FUND |
STATEMENT OF INVESTMENTS March 28, 2013* / (Unaudited)
| Principal Amount |
Value | |||||||
| U.S. Government Obligations—1.0% | ||||||||
| U.S. Treasury Nts., 0.375%, 3/15/161,2 (Cost $132,873,074) | $ | 132,800,000 | $ | 132,914,208 | ||||
| Foreign Government Obligations—66.0% | ||||||||
| Angola—0.2% | ||||||||
| Angola (Republic of) Sr. Unsec. Nts., 7%, 8/16/19 | 25,920,000 | 28,738,800 | ||||||
| Australia—3.9% | ||||||||
| New South Wales Treasury Corp. Sr. Unsec. Nts.: | ||||||||
| Series 19, 6%, 4/1/19 | 15,520,000 | AUD | 18,168,635 | |||||
| Series 20, 6%, 6/1/20 | 21,095,000 | AUD | 25,119,562 | |||||
| Queensland Treasury Corp. Nts.: | ||||||||
| Series 17, 6%, 9/14/17 | 36,260,000 | AUD | 41,698,622 | |||||
| Series 20, 6.25%, 2/21/20 | 21,440,000 | AUD | 25,055,745 | |||||
| Series 21, 6%, 6/14/21 | 102,560,000 | AUD | 121,521,448 | |||||
| Series 22, 6%, 7/21/22 | 7,360,000 | AUD | 8,550,330 | |||||
| Series 33, 6.50%, 3/14/33 | 98,955,000 | AUD | 120,832,598 | |||||
| Queensland Treasury Corp. Sr. Unsec. Nts.: | ||||||||
| Series 19, 6.25%, 6/14/19 | 19,590,000 | AUD | 23,225,270 | |||||
| Series 23, 4.25%, 7/21/23 | 17,595,000 | AUD | 17,808,892 | |||||
| Victoria Treasury Corp. Nts., 5.50%, 11/17/26 | 86,970,000 | AUD | 99,256,342 | |||||
| Western Australia Treasury Corp. Unsec. Nts., 7%, 10/15/19 | 7,500,000 | AUD | |
9,214,291 |
| |||
| 510,451,735 | ||||||||
| Belgium—1.4% | ||||||||
| Belgium (Kingdom of) Bonds, Series 58, 3.75%, 9/28/20 | 90,955,000 | EUR | 134,593,859 | |||||
| Belgium (Kingdom of) Treasury Bills, 0.038%, 5/16/133 | 39,490,000 | EUR | |
50,619,253 |
| |||
| 185,213,112 | ||||||||
| Bolivia—0.1% | ||||||||
| Bolivia (Plurinational State of) Unsec. Bonds, 4.875%, 10/31/22 | 7,800,000 | 7,772,700 | ||||||
| Brazil—5.5% | ||||||||
| Brazil (Federative Republic of) Letra Tesouro Nacional Nts., | ||||||||
| 8.481%, 1/1/153 | 135,010,000 | BRR | 57,802,186 | |||||
| Brazil (Federative Republic of) Nota Do Tesouro Nacional Nts.: | ||||||||
| 9.762%, 1/1/14 | 250,390,000 | BRR | 125,641,520 | |||||
| 9.762%, 1/1/17 | 197,680,000 | BRR | 100,058,566 | |||||
| 9.762%, 1/1/21 | 371,370,000 | BRR | 186,899,791 | |||||
| 12.994%, 5/15/454 | 34,245,000 | BRR | 49,874,355 | |||||
| Series NTNF, 9.762%, 1/1/23 | 115,095,000 | BRR | 57,614,821 | |||||
| Series NTNB, 12.792%, 8/15/504 | 31,760,000 | BRR | 45,951,703 | |||||
| Brazil (Federative Republic of) Nota Do Tesouro Nacional Unsec. Bonds, 9.762%, 1/1/18 | 128,810,000 | BRR | 65,228,833 | |||||
| Brazil Minas SPE via State of Minas Gerais Bonds, 5.333%, 2/15/285 | 20,000,000 | |
22,000,000 |
| ||||
| 711,071,775 | ||||||||
| Canada—1.0% | ||||||||
| Canada (Government of) Nts., 3.75%, 6/1/19 | 66,760,000 | CAD | 74,522,653 | |||||
| Canada (Government of) Treasury Bills, 0.981%, 7/4/133 | 60,075,000 | CAD | |
58,985,388 |
| |||
| 133,508,041 | ||||||||
| OPPENHEIMER INTERNATIONAL BOND FUND | 11 |
STATEMENT OF INVESTMENTS Unaudited / Continued
| Principal Amount |
Value | |||||||
| Croatia—0.3% | ||||||||
| Croatia (Republic of) Unsec. Nts.: | ||||||||
| 5.50%, 4/4/235,6 | $ | 20,080,000 | $ | 19,992,150 | ||||
| 6.25%, 4/27/176 | 10,225,000 | 10,978,071 | ||||||
| 6.375%, 3/24/216 | 4,975,000 | 5,375,488 | ||||||
| 6.75%, 11/5/196 | 4,535,000 | |
4,988,908 |
| ||||
| 41,334,617 | ||||||||
| Denmark—0.3% | ||||||||
| Denmark (Kingdom of) Bonds, 4%, 11/15/19 | 200,885,000 | DKK | 42,003,975 | |||||
| Dominican Republic—0.1% | ||||||||
| Banco De Reservas De La Republica Dominicana Bonds, 7%, 2/1/236 | 7,795,000 | 7,833,975 | ||||||
| Finland—0.2% | ||||||||
| Finland (Repulic of) Unsec. Bonds, 1.625%, 9/15/22 | 18,415,000 | EUR | 23,761,138 | |||||
| France—2.9% | ||||||||
| France (Republic of) Bonds: | ||||||||
| 3.75% 10/25/19 | 81,280,000 | EUR | 120,950,208 | |||||
| 4%, 4/25/60 | 18,705,000 | EUR | 27,974,108 | |||||
| 4.50%, 4/25/41 | 28,910,000 | EUR | 46,481,612 | |||||
| France (Republic of) Treasury Bills, 0.015%, 5/23/133 | 53,930,000 | EUR | 69,126,726 | |||||
| France (Republic of) Treasury Nts., 1%, 7/25/17 | 88,760,000 | EUR | |
115,286,966 |
| |||
| 379,819,620 | ||||||||
| Germany—1.5% | ||||||||
| Germany (Federal Republic of) Bonds, 2.50%, 7/4/44 | 47,330,000 | EUR | 64,608,556 | |||||
| Germany (Federal Republic of) Treasury Bills: | ||||||||
| (0.031)%, 6/12/133 | 19,355,000 | EUR | 24,807,432 | |||||
| (0.03)%, 5/15/133 | 33,610,000 | EUR | 43,079,109 | |||||
| Germany (Federal Republic of) Unsec. Bonds, 1.50%, 9/4/22 | 43,670,000 | EUR | |
57,363,141 |
| |||
| 189,858,238 | ||||||||
| Guatemala—0.1% | ||||||||
| Guatemala (Republic of) Sr. Unsec. Bonds, 4.875%, 2/13/286 | 7,935,000 | 7,796,138 | ||||||
| Hungary—2.5% | ||||||||
| Hungary (Republic of) Bonds: | ||||||||
| 6.75%, 11/24/17 | 9,328,000,000 | HUF | 41,429,986 | |||||
| Series 14/D, 6.75%, 8/22/14 | 7,855,000,000 | HUF | 34,072,270 | |||||
| Series 15/C, 7.75%, 8/24/15 | 14,421,000,000 | HUF | 64,655,510 | |||||
| Series 15/A, 8%, 2/12/15 | 9,336,000,000 | HUF | 41,734,019 | |||||
| Series 16/C, 5.50%, 2/12/16 | 5,340,000,000 | HUF | 22,826,276 | |||||
| Series 17/B, 6.75%, 2/24/17 | 10,471,000,000 | HUF | 46,337,599 | |||||
| Hungary (Republic of) Sr. Unsec. Bonds, 7.625%, 3/29/41 | 925,000 | 948,125 | ||||||
| Hungary (Republic of) Sr. Unsec. Nts., 5.75%, 6/11/18 | 2,435,000 | EUR | 3,163,952 | |||||
| Hungary (Republic of) Sr. Unsec. Unsub. Nts., 6.375%, 3/29/21 | 3,875,000 | 4,010,625 | ||||||
| Hungary (Republic of) Treasury Bills: | ||||||||
| 6.655%, 5/29/133 | 984,000,000 | HUF | 4,124,217 | |||||
| 6.691%, 4/17/133 | 1,313,000,000 | HUF | 5,522,811 | |||||
| 12 | OPPENHEIMER INTERNATIONAL BOND FUND |
| Principal Amount |
Value | |||||||
| Hungary Continued | ||||||||
| Hungary (Republic of) Unsec. Bonds: | ||||||||
| 5.375%, 2/21/23 | $ | 17,550,000 | $ | 16,606,688 | ||||
| 5.50%, 2/12/14 | 10,320,000,000 | HUF | |
43,833,895 |
| |||
| 329,265,973 | ||||||||
| Ireland—0.5% | ||||||||
| Ireland (Republic of) Treasury Bonds, 4.40%, 6/18/19 | 32,895,000 | EUR | 44,477,741 | |||||
| Ireland (Republic of) Unsec. Bonds, 5.50%, 10/18/17 | 10,975,000 | EUR | |
15,670,016 |
| |||
| 60,147,757 | ||||||||
| Italy—2.8% | ||||||||
| Italy (Republic of) Bonds: | ||||||||
| 4%, 9/1/20 | 33,645,000 | EUR | 43,201,729 | |||||
| 4.50%, 3/1/19 | 97,345,000 | EUR | 129,124,501 | |||||
| 5%, 3/1/22 | 17,715,000 | EUR | 23,625,450 | |||||
| 5%, 9/1/40 | 36,870,000 | EUR | 46,086,555 | |||||
| Series EU, 1.216%, 10/15/177 | 22,685,000 | EUR | 26,698,581 | |||||
| Italy (Republic of) Sr. Unsec. Nts., 4.50%, 6/8/15 | 4,391,000,000 | JPY | 48,736,205 | |||||
| Italy (Republic of) Treasury Bonds: | ||||||||
| 3.50%, 11/1/17 | 18,930,000 | EUR | 24,304,953 | |||||
| 5.75%, 2/1/33 | 15,815,000 | EUR | |
21,780,798 |
| |||
| 363,558,772 | ||||||||
| Ivory Coast—0.3% | ||||||||
| Ivory Coast Bonds, 3.75%, 12/31/32 | 43,940,000 | 40,974,050 | ||||||
| Japan—10.4% | ||||||||
| Japan Bonds: 2 yr., 0.10%, 5/15/14 |
5,060,750,000 | JPY | 53,792,329 | |||||
| 5 yr., 0.30%, 3/20/17 | 20,141,000,000 | JPY | 215,557,590 | |||||
| 10 yr., Series 301, 1.50%, 6/20/19 | 20,067,000,000 | JPY | 230,299,922 | |||||
| 10 yr., 1.10%, 3/20/21 | 32,037,000,000 | JPY | 359,810,887 | |||||
| 20 yr., Series 112, 2.10%, 6/20/29 | 12,383,000,000 | JPY | 150,630,871 | |||||
| 20 yr., Series 134, 1.80%, 3/20/32 | 12,268,000,000 | JPY | 140,221,539 | |||||
| 30 yr., 2%, 3/20/42 | 15,372,000,000 | JPY | 178,618,117 | |||||
| Japan Sr. Unsec. Nts., 2.30%, 3/19/18 | 13,205,000 | CAD | |
13,120,065 |
| |||
| 1,342,051,320 | ||||||||
| Kazakhstan—0.1% | ||||||||
| Development Bank of Kazakhstan Sr. Unsec. Bonds, 4.125%, 12/10/226 | 9,845,000 | 9,574,263 | ||||||
| Korea, Republic of South—0.3% | ||||||||
| Korea Housing Finance Corp. Sec. Nts., 1.625%, 9/15/186 | 43,965,000 | 43,283,235 | ||||||
| Malaysia—1.0% | ||||||||
| Central Bank of Malaysia Treasury Bills: | ||||||||
| Series 7712, 2.929%, 4/11/133 | 130,010,000 | MYR | 41,941,356 | |||||
| Series 8012, 2.929%, 4/23/133 | 130,370,000 | MYR | 42,016,190 | |||||
| Malaysia (Government of) Sr. Unsec. Bonds: | ||||||||
| Series 1/06, 4.262%, 9/15/16 | 79,670,000 | MYR | 26,734,412 | |||||
| Series 0210, 4.012%, 9/15/17 | 63,445,000 | MYR | |
21,212,431 |
| |||
| 131,904,389 | ||||||||
| OPPENHEIMER INTERNATIONAL BOND FUND | 13 |
STATEMENT OF INVESTMENTS Unaudited / Continued
| Principal Amount |
Value | |||||||
| Mexico—4.2% | ||||||||
| United Mexican States Bonds: | ||||||||
| Series M, 6.50%, 6/9/227 | 910,000,000 | MXN | $ | 82,382,980 | ||||
| Series M20, 7.50%, 6/3/277 | 933,730,000 | MXN | 91,777,605 | |||||
| Series M10, 7.75%, 12/14/17 | 785,815,000 | MXN | 72,067,636 | |||||
| Series M20, 8.50%, 5/31/297 | 488,360,000 | MXN | 52,122,811 | |||||
| United Mexican States Treasury Bills: | ||||||||
| 4.132%, 5/23/133 | 194,000,000 | MXN | 15,610,690 | |||||
| 4.168%, 6/6/133 | 1,136,981,000 | MXN | 91,350,992 | |||||
| 4.21%, 7/11/133 | 226,300,000 | MXN | 18,112,135 | |||||
| 4.228%, 7/25/133 | 1,000,000,000 | MXN | 79,908,837 | |||||
| 4.552%, 4/4/133 | 516,700,000 | MXN | |
41,800,934 |
| |||
| 545,134,620 | ||||||||
| Nigeria—1.1% | ||||||||
| Nigeria (Federal Republic of) Treasury Bills: | ||||||||
| 10.635%, 7/4/133 | 385,000,000 | NGN | 2,355,326 | |||||
| 11.235%, 1/23/143 | 1,426,000,000 | NGN | 8,248,333 | |||||
| 13.662%, 9/5/133 | 2,956,000,000 | NGN | 17,764,078 | |||||
| 13.779%, 9/26/133 | 1,473,000,000 | NGN | 8,791,771 | |||||
| 14.326%, 6/6/133 | 657,000,000 | NGN | 4,056,037 | |||||
| Series 364, 15.572%, 4/25/133 | 989,000,000 | NGN | 6,185,476 | |||||
| Nigeria (Federal Republic of) Treasury Bonds: | ||||||||
| 7%, 10/23/19 | 2,574,000,000 | NGN | 13,349,733 | |||||
| 16%, 6/29/19 | 2,616,000,000 | NGN | 20,243,270 | |||||
| 16.39%, 1/27/22 | 7,005,000,000 | NGN | |
57,674,721 |
| |||
| 138,668,745 | ||||||||
| Paraguay—0.1% | ||||||||
| Paraguay (Republic of) Sr. Unsec. Bonds, 4.625%, 1/25/236 | 10,755,000 | 10,851,795 | ||||||
| Peru—1.4% | ||||||||
| Peru (Republic of) Sr. Unsec. Bonds: | ||||||||
| 6.95%, 8/12/316 | 139,850,000 | PEN | 67,360,183 | |||||
| 8.20%, 8/12/266 | 90,775,000 | PEN | 49,100,863 | |||||
| Peru (Republic of) Sr. Unsec. Nts., | ||||||||
| 7.84%, 8/12/206 | 137,605,000 | PEN | |
67,070,483 |
| |||
| 183,531,529 | ||||||||
| Poland—1.1% | ||||||||
| Poland (Republic of) Bonds: | ||||||||
| Series WS0922, 5.75%, 9/23/22 | 125,460,000 | PLZ | 44,097,014 | |||||
| Series 0415, 5.50%, 4/25/15 | 78,195,000 | PLZ | 25,105,589 | |||||
| Series 1017, 5.25%, 10/25/17 | 108,310,000 | PLZ | 35,896,834 | |||||
| Poland (Republic of) Unsec. Bonds, | ||||||||
| Series 1023, 4%, 10/25/23 | 121,620,000 | PLZ | |
37,596,226 |
| |||
| 142,695,663 | ||||||||
| Portugal—0.8% | ||||||||
| Portugal (Republic of) Sr. Unsec. Bonds, 4.10%, 4/15/37 | 20,225,000 | EUR | 18,567,038 | |||||
| Portugal (Republic of) Sr. Unsec. Unsub. Bonds., 4.35%, 10/16/17 | 68,925,000 | EUR | |
86,226,931 |
| |||
| 104,793,969 | ||||||||
| 14 | OPPENHEIMER INTERNATIONAL BOND FUND |
| Principal Amount |
Value | |||||||
| Russia—3.2% | ||||||||
| AHML Finance Ltd. Unsec. Nts., 7.75%, 2/13/186 | 539,500,000 | RUR | $ | 17,468,838 | ||||
| Russian Federation Bonds: | ||||||||
| 7.50%, 3/15/187 | 1,753,000,000 | RUR | 59,523,565 | |||||
| 7.50%, 2/27/197 | 2,192,900,000 | RUR | 74,248,947 | |||||
| 7.60%, 4/14/217 | 2,350,200,000 | RUR | 79,529,669 | |||||
| Series 6206, 7.40%, 6/14/177 | 3,912,400,000 | RUR | 131,399,954 | |||||
| Russian Federation Unsec. Bonds, Series 9, 7.90%, 3/18/217 | 398,800,000 | RUR | 12,823,254 | |||||
| Vnesheconombank Sr. Unsec. Bonds, Series 18, 8.693%, 9/17/327 | 420,600,000 | RUR | 13,801,471 | |||||
| Vnesheconombank Via VEB Finance plc Sr. Unsec. Nts., 6.025%, 7/5/226 | 13,355,000 | 14,840,744 | ||||||
| Vnesheconombank Via VEB Finance plc Sr. Unsec. Unsub. Nts., 6.902%, 7/9/206 |
12,535,000 | |
14,618,944 |
| ||||
| 418,255,386 | ||||||||
| Serbia—0.3% | ||||||||
| Serbia (Republic of) Sr. Unsec. Bonds, 4.875%, 2/25/206 | 15,670,000 | 15,528,970 | ||||||
| Serbia (Republic of) Sr. Unsec. Nts., 5.25%, 11/21/176 | 21,845,000 | |
22,609,575 |
| ||||
| 38,138,545 | ||||||||
| South Africa—2.3% | ||||||||
| South Africa (Republic of) Bonds: | ||||||||
| Series R208, 6.75%, 3/31/21 | 1,463,495,000 | ZAR | 161,437,729 | |||||
| Series R207, 7.25%, 1/15/20 | 1,140,430,000 | ZAR | |
129,692,984 |
| |||
| 291,130,713 | ||||||||
| Spain—1.5% | ||||||||
| Comunidad De Madrid Sr. Unsec. Nts., 4.30%, 9/15/26 | 63,100,000 | EUR | 63,865,334 | |||||
| Instituto de Credito Oficial Sr. Unsec. Nts., 5%, 5/15/15 | 75,000,000 | NOK | 12,351,042 | |||||
| Spain (Kingdom of) Bonds: | ||||||||
| 4.25%, 10/31/16 | 14,060,000 | EUR | 18,546,973 | |||||
| 5.50%, 7/30/17 | 48,470,000 | EUR | 66,841,032 | |||||
| Spain (Kingdom of) Sr. Unsec. Bonds, 4.30%, 10/31/19 | 27,205,000 | EUR | |
35,134,386 |
| |||
| 196,738,767 | ||||||||
| Sri Lanka—0.3% | ||||||||
| Sri Lanka (Democratic Socialist Republic of) Sr. Unsec. Bonds, 5.875%, 7/25/226 | 6,390,000 | 6,661,575 | ||||||
| Sri Lanka (Democratic Socialist Republic of) Sr. Unsec. Nts.: | ||||||||
| 6.25%, 10/4/206 | 11,890,000 | 12,722,300 | ||||||
| 6.25% 7/27/216 | 13,720,000 | |
14,594,540 |
| ||||
| 33,978,415 | ||||||||
| Tanzania—0.2% | ||||||||
| Tanzania (United Republic of) Sr. Unsec. Nts., 6.45%, 3/8/207 | 20,010,000 | 21,210,600 | ||||||
| The Netherlands—1.1% | ||||||||
| Netherlands (Kingdom of the) Bonds, 4%, 7/15/19 | 90,315,000 | EUR | 136,955,406 | |||||
| OPPENHEIMER INTERNATIONAL BOND FUND | 15 |
STATEMENT OF INVESTMENTS Unaudited / Continued
| Principal Amount |
Value | |||||||
| Turkey—7.8% | ||||||||
| Turkey (Republic of) Bonds: | ||||||||
| 6.875%, 3/17/36 | $ | 24,390,000 | $ | 30,152,138 | ||||
| 7%, 3/11/19 | 26,325,000 | 31,886,156 | ||||||
| 9%, 3/5/14 | 213,845,000 | TRY | 121,737,882 | |||||
| 9%, 3/8/17 | 398,565,000 | TRY | 240,112,668 | |||||
| 9.50%, 1/12/227 | 77,105,000 | TRY | 49,647,557 | |||||
| 9.791%, 7/17/133 | 195,835,000 | TRY | 106,460,725 | |||||
| 10.50%, 1/15/207 | 235,640,000 | TRY | 157,080,310 | |||||
| 16.519%, 8/14/134 | 21,120,000 | TRY | 16,985,578 | |||||
| Turkey (Republic of) Nts., 7.50%, 7/14/17 | 34,695,000 | 41,503,894 | ||||||
| Turkey (Republic of) Unsec. Bonds: | ||||||||
| 5.621%, 2/11/154 | 20,680,000 | TRY | 15,706,745 | |||||
| 6.25%, 9/26/22 | 44,130,000 | 52,404,375 | ||||||
| 8.50%, 9/14/227 | 148,250,000 | TRY | 90,582,200 | |||||
| Turkey (Republic of) Unsec. Nts.: | ||||||||
| 5.125%, 3/25/22 | 19,535,000 | 21,537,338 | ||||||
| 6%, 1/14/41 | 27,805,000 | |
31,245,869 |
| ||||
| 1,007,043,435 | ||||||||
| Ukraine—0.2% | ||||||||
| Ukraine (Republic of) Bonds, 7.75%, 9/23/206 | 10,895,000 | 11,374,380 | ||||||
| Ukraine (Republic of) Sr. Unsec. Nts., 7.95%, 2/23/216 | 15,180,000 | |
15,878,280 |
| ||||
| 27,252,660 | ||||||||
| United Arab Emirates—0.4% | ||||||||
| Emirates of Dubai Sr. Unsec. International Bonds: | ||||||||
| 5.591%, 6/22/21 | 23,770,000 | 26,444,125 | ||||||
| 7.75%, 10/5/20 | 23,405,000 | |
28,963,688 |
| ||||
| 55,407,813 | ||||||||
| United Kingdom—2.7% | ||||||||
| United Kingdom Treasury Bonds: | ||||||||
| 3.75%, 9/7/21 | 50,735,000 | GBP | 90,751,149 | |||||
| 4%, 9/7/16 | 57,810,000 | GBP | 98,800,701 | |||||
| 4.25%, 12/7/55 | 13,180,000 | GBP | 24,769,520 | |||||
| 4.75%, 12/7/38 | 65,860,000 | GBP | |
131,173,010 |
| |||
| 345,494,380 | ||||||||
| Uruguay—0.3% | ||||||||
| Uruguay (Oriental Republic of) Sr. Unsec. Bonds, 4.702%, 12/15/284 | 523,700,000 | UYU | 38,965,432 | |||||
| Venezuela—1.6% | ||||||||
| Venezuela (Republic of) Bonds: | ||||||||
| 9%, 5/7/23 | 49,525,000 | 47,667,813 | ||||||
| 11.95%, 8/5/31 | 23,805,000 | 26,899,650 | ||||||
| Venezuela (Republic of) Nts., 8.25%, 10/13/24 | 22,105,000 | 20,170,813 | ||||||
| Venezuela (Republic of) Sr. Unsec. Bonds, 11.75%, 10/21/26 | 18,455,000 | 20,512,733 | ||||||
| Venezuela (Republic of) Sr. Unsec. Unsub. Nts., 12.75%, 8/23/22 | 17,095,000 | 20,026,793 | ||||||
| Venezuela (Republic of) Unsec. Bonds: | ||||||||
| 7%, 3/31/38 | 15,685,000 | 12,430,363 | ||||||
| 7.65%, 4/21/25 | 29,600,000 | 26,048,000 | ||||||
| 16 | OPPENHEIMER INTERNATIONAL BOND FUND |
| Principal Amount |
Value | |||||||
| Venezuela Continued | ||||||||
| Venezuela (Republic of) Unsec. Nts., 13.625%, 8/15/186 | $ | 26,255,000 | $ |
29,733,788 |
| |||
| |
203,489,953 |
| ||||||
| Total Foreign Government Obligations (Cost $8,478,925,474) | 8,529,661,449 | |||||||
| Corporate Bonds and Notes—25.9% | ||||||||
| Consumer Discretionary—0.2% | ||||||||
| Automobiles—0.1% | ||||||||
| Jaguar Land Rover plc, 8.25% Sr. Nts., 3/15/206 | 8,855,000 | GBP | 15,171,889 | |||||
| Household Durables—0.1% | ||||||||
| Arcelik AS, 5% Sr. Unsec. Nts., 4/3/235,6 | 11,795,000 | 11,795,000 | ||||||
| Consumer Staples—0.5% | ||||||||
| Beverages—0.1% | ||||||||
| AmBev International Finance Co. Ltd., 9.50% Sr. Unsec. Unsub. Nts., 7/24/177 | 11,985,000 | BRR | 6,660,712 | |||||
| Food Products—0.4% | ||||||||
| Alicorp SA, 3.875% Sr. Unsec. Nts., 3/20/236 | 8,805,000 | 8,805,000 | ||||||
| MHP SA: 8.25% Sr. Unsec. Nts., 4/2/205,8 |
18,595,000 | 18,467,159 | ||||||
| 10.25% Sr. Unsec. Nts., 4/29/156 | 30,695,000 | 33,081,997 | ||||||
| Minerva Luxembourg SA, 7.75% Sr. Unsec. Nts., 1/31/236 | 3,730,000 | |
4,009,750 |
| ||||
| 64,363,906 | ||||||||
| Energy—5.1% | ||||||||
| Energy Equipment & Services—0.0% | ||||||||
| QGOG Constellation SA, 6.25% Sr. Unsec. Nts., 11/9/196 | 3,475,000 | 3,674,813 | ||||||
| Oil, Gas & Consumable Fuels—5.1% | ||||||||
| Alliance Oil Co. Ltd., 9.875% Sr. Unsec. Nts., 3/11/156 | 17,565,000 | 19,211,719 | ||||||
| Cosan Luxembourg SA, 5% Sr. Unsec. Nts., 3/14/236 | 4,300,000 | 4,336,550 | ||||||
| Empresa Nacional del Petroleo, 4.75% Sr. Unsec. Unsub. Nts., 12/6/216 | 12,205,000 | 12,659,514 | ||||||
| Gaz Capital SA: 7.288% Sr. Sec. Nts., 8/16/376 |
28,815,000 | 35,010,225 | ||||||
| 8.146% Sr. Sec. Nts., 4/11/186 | 35,275,000 | 42,815,031 | ||||||
| 8.625% Sr. Sec. Nts., 4/28/346 | 25,785,000 | 35,132,063 | ||||||
| 9.25% Sr. Unsec. Unsub. Nts., 4/23/196 | 39,115,000 | 50,653,925 | ||||||
| Gazprom Neft OAO Via GPN Capital SA, 4.375% Sr. Unsec. Nts., 9/19/226 | 22,000,000 | 21,807,500 | ||||||
| Gazprom OAO Via Gaz Capital SA: 4.95% Sr. Unsec. Nts., 2/6/286 |
20,475,000 | 20,270,250 | ||||||
| 4.95% Sr. Unsec. Nts., 7/19/226 | 54,340,000 | 56,785,300 | ||||||
| KMG Finance Sub BV, 9.125% Sr. Unsec. Unsub. Nts., 7/2/186 | 20,385,000 | 25,759,098 | ||||||
| Lukoil International Finance BV: 6.125% Sr. Unsec. Nts., 11/9/206 |
40,155,000 | 45,776,700 | ||||||
| 6.656% Sr. Unsec. Unsub. Bonds, 6/7/226 | 20,000,000 | 23,800,000 | ||||||
| 7.25% Sr. Unsec. Unsub. Nts., 11/5/196 | 9,980,000 | 11,976,000 | ||||||
| OPPENHEIMER INTERNATIONAL BOND FUND | 17 |
STATEMENT OF INVESTMENTS Unaudited / Continued
| Principal Amount |
Value | |||||||
| Oil, Gas & Consumable Fuels Continued | ||||||||
| Novatek OAO via Novatek Finance Ltd.: 4.422% Sr. Unsec. Nts., 12/13/226 |
$ | 30,375,000 | $ | 30,185,156 | ||||
| 7.75% Unsec. Nts., 2/21/176 | 227,420,000 | RUR | 7,338,193 | |||||
| Odebrecht Drilling Norbe VIII/IX Ltd., 6.35% Sr. Sec. Nts., 6/30/216 | 7,106,950 | 7,853,180 | ||||||
| Pacific Rubiales Energy Corp., 5.125% Sr. Unsec. Nts., 3/28/236 | 8,590,000 | 8,710,260 | ||||||
| Pemex Project Funding Master Trust, 6.625% Unsec. Unsub. Bonds, 6/15/35 | 18,790,000 | 22,594,975 | ||||||
| Pertamina Persero PT, 5.25% Nts., 5/23/216 | 6,160,000 | 6,652,800 | ||||||
| Petroleos de Venezuela SA: 5.125% Sr. Unsec. Nts., 10/28/16 |
7,325,000 | 6,500,938 | ||||||
| 8.50% Sr. Nts., 11/2/176 | 34,170,000 | 33,315,750 | ||||||
| 12.75% Sr. Unsec. Nts., 2/17/226 | 20,375,000 | 23,074,688 | ||||||
| Petroleos Mexicanos, 5.50% Sr. Unsec. Unsub. Nts., 6/27/44 | 15,920,000 | 16,461,280 | ||||||
| Petroleum Co. of Trinidad & Tobago Ltd., 9.75% Sr. Unsec. Nts., 8/14/196 | 13,375,000 | 17,621,563 | ||||||
| Reliance Industries Ltd., 5.875% Sr. Unsec. Perpetual Bonds6,9 | 14,620,000 | 14,345,875 | ||||||
| Rosneft Oil Co. via Rosneft International Finance Ltd., 4.199% Sr. Unsec. Nts., 3/6/226 | 16,295,000 | 16,193,156 | ||||||
| Schahin II Finance Co. SPV Ltd., 5.875% Sr. Sec. Unsub. Nts., 9/25/226 | 20,600,000 | 21,372,500 | ||||||
| Sibur Securities Ltd., 3.914% Sr. Unsec. Nts., 1/31/186 | 11,075,000 | 10,936,563 | ||||||
| Tengizchevroil LLP, 6.124% Nts., 11/15/146 | 3,991,909 | |
4,131,626 |
| ||||
| 653,282,378 | ||||||||
| Financials—11.1% | ||||||||
| Capital Markets—0.5% | ||||||||
| Banco BTG Pactual SA (Cayman): 4% Sr. Unsec. Nts., 1/16/206 |
16,155,000 | 15,629,963 | ||||||
| 5.75% Unsec. Sub. Nts., 9/28/226 | 15,210,000 | 15,305,823 | ||||||
| Deutsche Bank Capital Funding Trust IV, 5.33% Unsec. Sub. Nts., 9/19/497 | 11,000,000 | EUR | 11,667,795 | |||||
| UBS AG (Jersey Branch): 4.28% Unsec. Sub. Nts., 4/29/49 |
6,195,000 | EUR | 7,891,256 | |||||
| 7.152% Unsec. Sub. Perpetual Bonds9 | 4,420,000 | EUR | 6,205,519 | |||||
| UBS Capital Securities Jersey Ltd., 8.836% Sub. Nts., 4/29/49 | 8,840,000 | EUR | |
11,390,922 |
| |||
| 68,091,278 | ||||||||
| Commercial Banks—8.2% | ||||||||
| Akbank TAS, 7.50% Sr. Unsec. Nts., 2/5/186 | 51,700,000 | TRY | 28,003,095 | |||||
| Alfa Bank/Alfa Bond Issuance plc, 7.875% Nts., 9/25/176 | 18,300,000 | 20,700,960 | ||||||
| Banco ABC Brasil SA, 8.50% Sr. Unsec. Nts., 3/28/166 | 12,980,000 | BRR | 6,423,358 | |||||
| Banco BMG SA: 8.875% Unsec. Sub. Nts., 8/5/206 |
3,140,000 | 2,904,500 | ||||||
| 9.15% Nts., 1/15/166 | 6,915,000 | 7,278,038 | ||||||
| 9.95% Unsec. Unsub. Nts., 11/5/196 | 9,060,000 | 9,037,350 | ||||||
| 18 | OPPENHEIMER INTERNATIONAL BOND FUND |
| Principal Amount |
Value | |||||||
| Commercial Banks Continued | ||||||||
| Banco do Brasil SA (Cayman): 3.875% Sr. Unsec. Nts., 10/10/22 |
$ | 2,650,000 | $ | 2,570,500 | ||||
| 6.25% Unsec. Sub. Perpetual Bonds9 | 11,695,000 | 11,548,813 | ||||||
| 9.25% Jr. Sub. Perpetual Bonds6,9 | 62,000,000 | 75,330,000 | ||||||
| Banco do Estado do Rio Grande do Sul SA, 7.375% Sub Nts., 2/2/226 | 32,780,000 | 35,746,590 | ||||||
| Banco Santander Brasil SA (Cayman Islands), 8% Sr. Unsec. Unsub. Nts., 3/18/168 | 22,680,000 | BRR | 11,223,556 | |||||
| Banco Santander Mexico SA, 4.125% Sr. Unsec. Nts., 11/9/226 | 20,555,000 | 20,709,163 | ||||||
| Bancolombia SA, 5.125% Unsec. Sub. Nts., 9/11/22 | 20,280,000 | 20,482,800 | ||||||
| Bank of India (London), 3.625% Sr. Unsec. Unsub. Nts., 9/21/188 | 8,800,000 | 8,848,541 | ||||||
| Bank of Scotland plc: 4.875% Sr. Sec. Nts., 12/20/24 |
7,625,000 | GBP | 13,841,415 | |||||
| 4.875% Sr. Sec. Unsub. Nts., 11/8/16 | 4,535,000 | GBP | 7,825,340 | |||||
| 9.375% Unsec. Sub. Nts., 5/15/21 | 10,550,000 | GBP | 20,414,385 | |||||
| Barclays Bank plc: 4.75% Sub. Nts., 3/15/49 |
12,320,000 | EUR | 11,425,358 | |||||
| 6% Sr. Unsec. Sub. Nts., 1/14/21 | 3,535,000 | EUR | 4,977,321 | |||||
| BBVA Banco Continental SA, 5% Sr. Unsec. Nts., 8/26/226 | 12,550,000 | 13,240,250 | ||||||
| BBVA US Senior SAU, 4.664% Sr. Unsec. Nts., 10/9/15 | 22,010,000 | 22,583,999 | ||||||
| BOM Capital plc, 6.699% Sr. Unsec. Nts., 3/11/156 | 30,635,000 | 32,534,370 | ||||||
| Corp Group Banking SA, 6.75% Sr. Unsec. Nts., 3/15/236 | 11,360,000 | 11,942,200 | ||||||
| DNB Boligkreditt AS, 1.45% Sr. Sec. Nts., 3/21/196 | 17,600,000 | 17,721,194 | ||||||
| DTEK Finance plc, 7.875% Sr. Unsec. Nts., 4/4/185,6 | 8,580,000 | 8,456,705 | ||||||
| EUROFIMA, 6.25% Bonds, 12/28/18 | 31,010,000 | AUD | 35,351,394 | |||||
| Grupo Aval Ltd., 4.75% Sr. Unsec. Nts., 9/26/226 | 17,080,000 | 17,165,400 | ||||||
| Hana Bank, 1.375% Sr. Unsec. Nts., 2/5/166 | 21,974,199 | 21,915,770 | ||||||
| ICICI Bank Ltd., 6.375% Bonds, 4/30/226,7 | 7,120,000 | 7,351,400 | ||||||
| Intesa Sanpaolo SpA: 3.125% Unsec. Nts., 1/16/16 |
17,570,000 | 17,188,098 | ||||||
| 3.875% Unsec. Nts., 1/15/18 | 8,785,000 | 8,507,473 | ||||||
| Lloyds TSB Bank plc: 6% Sr. Sec. Nts., 2/8/29 |
13,525,000 | GBP | 27,223,550 | |||||
| 11.875% Unsec. Sub. Nts., 12/16/21 | 22,105,000 | EUR | 34,978,955 | |||||
| Norddeutsche Landesbank Girozentrale, 0.875% Sec. Nts., 10/16/156 | 17,590,000 | 17,652,058 | ||||||
| Royal Bank of Scotland NV: 3.197% Unsec. Sub. Nts., 5/17/187 |
9,675,000 | AUD | 9,166,420 | |||||
| 6.50% Unsec. Sub. Nts., 5/17/187 | 8,795,000 | AUD | 8,342,348 | |||||
| Royal Bank of Scotland plc (The): 2.375% Sr. Unsec. Sub. Nts., 11/2/15 |
2,650,000 | CHF | 2,746,051 | |||||
| 13.125% Unsec. Sub. Nts., 3/19/22 | 10,550,000 | AUD | 13,299,724 | |||||
| Sberbank of Russia Via SB Capital SA: 5.125% Sub. Nts., 10/29/226 |
32,390,000 | 32,511,463 | ||||||
| 5.40% Sr. Unsec. Nts., 3/24/17 | 8,970,000 | 9,710,025 | ||||||
| 6.125% Sr. Nts., 2/7/226 | 32,070,000 | 35,918,400 | ||||||
| OPPENHEIMER INTERNATIONAL BOND FUND | 19 |
STATEMENT OF INVESTMENTS Unaudited / Continued
| Principal Amount |
Value | |||||||
| Commercial Banks Continued | ||||||||
| Skandinaviska Enskilda Banken AB, 1.75% Sr. Unsec. Nts., 3/19/186 | $ | 13,200,000 | $ | 13,215,259 | ||||
| Societe Generale SA, 2.75% Sr. Unsec. Nts., 10/12/17 | 17,610,000 | 18,063,211 | ||||||
| Stadshypotek AB: 1.875% Sec. Nts., 10/2/196 |
22,010,000 | 22,120,952 | ||||||
| 6% Sec. Unsub. Bonds, 6/21/17 | 169,680,000 | SEK | 30,247,412 | |||||
| Sumitomo Mitsui Banking Corp., 1.80% Sr. Unsec. Nts., 7/18/17 | 13,250,000 | 13,514,417 | ||||||
| Sumitomo Mitsui Trust Bank Ltd., 1.80% Sr. Unsec. Nts., 3/28/186 | 8,795,000 | 8,815,897 | ||||||
| Swedbank Hypotek AB, 1.375% Sec. Nts., 3/28/186 | 17,593,333 | 17,614,463 | ||||||
| Toronto-Dominion Bank (The), 1.50% Sec. Bonds, 3/13/176 | 18,130,000 | 18,593,258 | ||||||
| Turkiye Halk Bankasi AS, 4.875% Sr. Unsec. Nts., 7/19/176 | 10,250,000 | 10,836,095 | ||||||
| Turkiye Is Bankasi: 3.875% Sr. Unsec. Nts., 11/7/176 |
19,500,000 | 19,890,000 | ||||||
| 6% Sub. Nts., 10/24/226 | 26,260,000 | 27,507,350 | ||||||
| VTB Bank OJSC Via VTB Capital SA, 6.95% Sub. Nts., 10/17/226 | 46,440,000 | 49,156,740 | ||||||
| VTB Capital SA: 6.315% Nts., 2/22/186 |
6,560,000 | 7,125,800 | ||||||
| 6.465% Sr. Sec. Unsub. Nts., 3/4/156 | 6,640,000 | 7,121,400 | ||||||
| Westpac Banking Corp.: 1.25% Sec. Nts., 12/15/176 |
17,570,000 | 17,587,447 | ||||||
| 1.60% Sr. Unsec. Unsub. Nts., 1/12/18 | 21,965,000 | 22,248,568 | ||||||
| Yapi ve Kredi Bankasi AS: 5.50% Unsec. Sub. Nts., 12/6/226 |
16,235,000 | 16,153,825 | ||||||
| 6.75% Sr. Unsec. Nts., 2/8/176 | 13,870,000 | |
15,465,050 |
| ||||
| 1,060,075,474 | ||||||||
| Consumer Finance—0.0% | ||||||||
| JSC Astana Finance, 9.16% Nts., 3/14/1210 | 14,000,000 | 1,242,500 | ||||||
| Diversified Financial Services—1.9% | ||||||||
| ABN AMRO Bank NV, 1.375% Sr. Unsec. Nts., 1/22/166 | 13,185,000 | 13,202,154 | ||||||
| Autopistas del Nordeste Cayman Ltd., 9.39% Nts., 1/15/266 | 18,487,974 | 18,855,885 | ||||||
| Banco Invex SA, 31.938% Mtg.-Backed Certificates, Series 062U, 3/13/344,10 | 27,603,725 | MXN | 1,458,513 | |||||
| Caisse Centrale Desjardins du Quebec, 1.60% Sec. Bonds, 3/6/176 | 18,125,000 | 18,611,946 | ||||||
| Export Credit Bank of Turkey, 5.875% Sr. Unsec. Nts., 4/24/196 | 37,110,000 | 41,377,650 | ||||||
| ING Bank NV, 2.625% Sr. Sec. Nts., 12/5/226 | 35,115,000 | 34,992,765 | ||||||
| Instituto de Credito Oficial: 5% Sr. Unsec. Unsub. Nts., 11/14/16 |
18,150,000 | 19,100,280 | ||||||
| 5% Sr. Unsec. Unsub. Nts., 4/10/17 | 31,035,000 | 32,546,280 | ||||||
| JPMorgan Hipotecaria su Casita: 8.397% Sec. Nts., 8/26/354,8 |
34,101,099 | MXN | 245,030 | |||||
| 30.085% Mtg.-Backed Certificates, Series 06U, 9/25/354 | 8,904,443 | MXN | 1,239,318 | |||||
| Korea Development Bank (The), 1.50% Sr. Unsec. Nts., 1/22/18 | 30,760,000 | 30,406,880 | ||||||
| Magyar Export-Import Bank RT, 5.50% Sr. Unsec. Nts., 2/12/188 | 8,755,000 | 8,809,719 | ||||||
| Rabobank Capital Funding Trust IV, 5.556% Unsec. Sub. Perpetual Bonds8,9 | 7,030,000 | GBP | 10,651,764 | |||||
| 20 | OPPENHEIMER INTERNATIONAL BOND FUND |
| Principal Amount |
Value | |||||||
| Diversified Financial Services Continued | ||||||||
| Stanbic IBTC Holding Co., 12.468% Nts., 9/24/133 | 1,297,000,000 | NGN | $ |
7,714,103 |
| |||
| 239,212,287 | ||||||||
| Insurance—0.1% | ||||||||
| Cooperatieve Centrale Raiffeisen-Boerenleenbank BA (Netherlands), 1.70% Sr. Unsec. Nts., 3/19/18 | 4,400,000 | 4,387,500 | ||||||
| Swiss Reinsurance Co. via ELM BV: 4.455% Sr. Sec. Sub. Nts., 5/25/497 |
4,405,000 | AUD | 4,076,790 | |||||
| 7.635% Unsec. Sub. Nts., 12/29/49 | 1,755,000 | AUD | |
1,856,392 |
| |||
| 10,320,682 | ||||||||
| Real Estate Management & Development—0.3% | ||||||||
| BR Malls International Finance Ltd., 8.50% Sr. Unsec. Unsub. Nts., 1/29/496 | 7,455,000 | 8,247,094 | ||||||
| Country Garden Holdings Co. Ltd., 7.50% Sr. Unsec. Unsub. Nts., 12/31/236 | 21,585,000 | 22,152,686 | ||||||
| Kaisa Group Holdings Ltd., 8.875% Sr. Unsec. Nts., 3/19/186 | 8,000,000 | |
8,140,000 |
| ||||
| 38,539,780 | ||||||||
| Thrifts & Mortgage Finance—0.1% | ||||||||
| Credit Mutuel/CIC Home Loan SFH, 1.50% Sec. Nts., 11/16/176 | 13,175,000 | 13,244,366 | ||||||
| Industrials—1.1% | ||||||||
| Aerospace & Defense—0.1% | ||||||||
| Embraer SA, 5.15% Sr. Unsec. Unsub. Nts., 6/15/22 | 11,640,000 | 12,702,150 | ||||||
| Airlines—0.3% | ||||||||
| Emirates Airline, 4.50% Sr. Unsec. Nts., 2/28/256 | 39,865,000 | 39,310,877 | ||||||
| Construction & Engineering—0.5% | ||||||||
| IIRSA Norte Finance Ltd., 8.75% Sr. Nts., 5/30/248 | 13,937,286 | 17,195,824 | ||||||
| OAS Investments GmbH, 8.25% Sr. Nts., 10/19/196 | 2,360,000 | 2,542,900 | ||||||
| Odebrecht Finance Ltd.: 6% Sr. Unsec. Unsub. Nts., 4/5/236 |
9,238,000 | 10,392,750 | ||||||
| 7.125% Sr. Nts., 6/26/426 | 29,260,000 | |
33,283,250 |
| ||||
| 63,414,724 | ||||||||
| Industrial Conglomerates—0.2% | ||||||||
| GE Capital Australia Funding Pty Ltd., 7% Bonds, 10/8/15 | 20,805,000 | AUD | 23,290,886 | |||||
| Materials—2.4% | ||||||||
| Chemicals—0.4% | ||||||||
| Braskem Finance Ltd.: 5.375% Sr. Unsec. Nts., 5/2/226 |
22,275,000 | 23,132,588 | ||||||
| 5.75% Sr. Unsec. Nts., 4/15/216 | 9,000,000 | 9,481,500 | ||||||
| Mexichem SAB de CV: 4.875% Sr. Unsec. Nts., 9/19/226 |
8,345,000 | 8,866,563 | ||||||
| 6.75% Sr. Unsec. Nts., 9/19/426 | 6,530,000 | |
7,256,463 |
| ||||
| 48,737,114 | ||||||||
| OPPENHEIMER INTERNATIONAL BOND FUND | 21 |
STATEMENT OF INVESTMENTS Unaudited / Continued
| Principal Amount |
Value | |||||||
| Construction Materials—0.5% | ||||||||
| CEMEX Espana Luxembourg, 9.875% Sr. Sec. Nts., 4/30/196 | $ | 17,165,000 | $ | 19,846,173 | ||||
| CEMEX Espana SA, 9.25% Sr. Sec. Nts., 5/12/206 | 22,645,000 | 25,249,175 | ||||||
| CEMEX Finance LLC, 9.375% Sr. Sec. Nts., 10/12/226 | 15,115,000 | 17,646,763 | ||||||
| Cemex SAB de CV, 5.875% Sr. Sec. Nts., 3/25/196 | 8,000,000 | |
8,100,000 |
| ||||
| 70,842,111 | ||||||||
| Metals & Mining—1.5% | ||||||||
| Alrosa Finance SA, 7.75% Nts., 11/3/206 | 27,135,000 | 31,909,403 | ||||||
| Consolidated Minerals Ltd., 8.875% Sr. Sec. Nts., 5/1/166 | 9,050,000 | 8,801,125 | ||||||
| CSN Islands XI Corp., 6.875% Sr. Unsec. Nts., 9/21/196 | 8,655,000 | 9,650,325 | ||||||
| CSN Resources SA, 6.50% Sr. Unsec. Unsub. Nts., 7/21/206 | 32,230,000 | 34,631,135 | ||||||
| Ferrexpo Finance plc, 7.875% Sr. Unsec. Bonds, 4/7/166 | 12,720,000 | 12,751,800 | ||||||
| Gerdau Holdings, Inc., 7% Sr. Unsec. Nts., 1/20/206 | 5,000,000 | 5,722,500 | ||||||
| Gerdau Trade, Inc., 5.75% Sr. Unsec. Nts., 1/30/216 | 13,000,000 | 13,942,500 | ||||||
| Mexico Generadora de Energia S de RL, 5.50% Sr. Sec. Nts., 12/6/326 | 9,845,000 | 10,435,700 | ||||||
| Novolipetsk Steel OJSC, 4.95% Nts., 9/26/196 | 5,395,000 | 5,477,274 | ||||||
| OJSC Novolipetsk Steel via Steel Funding Ltd., 4.45% Unsec. Nts., 2/19/186 | 14,665,000 | 14,701,663 | ||||||
| Samarco Mineracao SA, 4.125% Sr. Unsec. Nts., 11/1/226 | 8,935,000 | 8,716,093 | ||||||
| Severstal OAO Via Steel Capital SA: 4.45% Sr. Unsec. Nts., 3/19/186 |
14,340,000 | 14,268,300 | ||||||
| 5.90% Sr. Unsec. Nts., 10/17/226 | 8,790,000 | 8,768,025 | ||||||
| Vale SA, 5.625% Sr. Unsec. Nts., 9/11/42 | 12,500,000 | |
12,448,325 |
| ||||
| 192,224,168 | ||||||||
| Telecommunication Services—2.9% | ||||||||
| Diversified Telecommunication Services—1.0% | ||||||||
| Brasil Telecom SA: 5.75% Sr. Unsec. Nts., 2/10/226 |
25,000,000 | 26,187,500 | ||||||
| 9.75% Sr. Unsec. Nts., 9/15/166 | 30,440,000 | BRR | 15,703,922 | |||||
| Colombia Telecomunicaciones SA ESP, 5.375% Sr. Unsec. Nts., 9/27/226 | 4,270,000 | 4,291,350 | ||||||
| Qtel International Finance Ltd., 3.875% Sr. Unsec. Nts., 1/31/286 | 4,580,000 | 4,533,238 | ||||||
| Telefonica Chile SA, 3.875% Sr. Unsec. Nts., 10/12/226 | 14,400,000 | 14,218,502 | ||||||
| Telemar Norte Leste SA, 5.50% Sr. Unsec. Nts., 10/23/206 | 39,565,000 | 41,444,338 | ||||||
| Wind Acquisition Finance SA, 7.25% Sr. Sec. Nts., 2/15/186 | 20,000,000 | |
20,925,000 |
| ||||
| 127,303,850 | ||||||||
| Wireless Telecommunication Services—1.9% | ||||||||
| America Movil SAB de CV: 6.45% Sr. Unsec. Nts., 12/5/22 |
299,600,000 | MXN | 25,621,646 | |||||
| 8.46% Sr. Unsec. Unsub. Bonds, 12/18/36 | 140,800,000 | MXN | 13,119,971 | |||||
| Digicel Group Ltd., 8.25% Sr. Unsec. Nts., 9/30/206 | 4,610,000 | 4,909,650 | ||||||
| 22 | OPPENHEIMER INTERNATIONAL BOND FUND |
| Principal Amount |
Value | |||||||
| Wireless Telecommunication Services Continued | ||||||||
| Digicel Ltd., 6% Sr. Unsec. Nts., 4/15/216 | $ | 8,800,000 | $ | 8,778,000 | ||||
| MTS International Funding Ltd., 8.625% Sr. Unsec. Nts., 6/22/206 | 20,795,000 | 26,513,625 | ||||||
| Vimpel Communications: 8.85% Sr. Unsec. Nts., 3/8/227 |
199,300,000 | RUR | 6,459,679 | |||||
| 8.85% Sr. Unsec. Nts., 3/8/227 | 229,300,000 | RUR | 7,454,153 | |||||
| Vimpel Communications/VIP Finance Ireland Ltd. OJSC: 7.748% Sec. Nts., 2/2/216 |
14,230,000 | 15,973,175 | ||||||
| 9.125% Sr. Unsec. Nts., 4/30/186 | 29,440,000 | 35,085,120 | ||||||
| VimpelCom, 7.504% Sr. Unsec. Unsub. Nts., 3/1/226 | 32,375,000 | 36,107,838 | ||||||
| VimpelCom Holdings BV: 5.95% Sr. Unsec. Unsub. Nts., 2/13/236 |
25,825,000 | 25,792,719 | ||||||
| 9% Sr. Unsec. Nts., 2/28/18 | 554,700,000 | RUR | 18,353,405 | |||||
| Wind Acquisition Finance SA, 11.75% Sr. Sec. Nts., 7/15/176 | 16,010,000 | |
17,050,650 |
| ||||
| 241,219,631 | ||||||||
| Utilities—2.6% | ||||||||
| Electric Utilities—2.0% | ||||||||
| Electricite de France SA, 5.25% Perpetual Bonds6,7,9 | 21,980,000 | 21,892,256 | ||||||
| Empresa Distribuidora y Comercializadora Norte SA, 9.75% Nts., 10/25/226 | 5,080,000 | 2,438,400 | ||||||
| Empresas Publicas de Medellin ESP: 7.625% Sr. Unsec. Nts., 7/29/196 |
1,955,000 | 2,400,740 | ||||||
| 8.375% Sr. Unsec. Unsub. Nts., 2/1/216 | 25,996,000,000 | COP | 16,625,763 | |||||
| Eskom Holdings Ltd.: 7.85% Sr. Unsec. Unsub. Nts., Series ES26, 4/2/26 |
316,000,000 | ZAR | 34,227,302 | |||||
| 10% Nts., Series ES23, 1/25/23 | 396,000,000 | ZAR | 51,507,088 | |||||
| Israel Electric Corp. Ltd.: 6.70% Sr. Unsec. Nts., 2/10/176 |
12,770,000 | 14,239,648 | ||||||
| 7.25% Nts., 1/15/196 | 71,635,000 | 82,386,984 | ||||||
| 9.375% Sr. Sec. Nts., 1/28/206 | 4,460,000 | 5,607,322 | ||||||
| National Power Corp., 5.875% Unsec. Unsub. Bonds, 12/19/16 | 665,100,000 | PHP | 18,230,618 | |||||
| Perusahaan Listrik Negara PT, 5.50% Sr. Unsec. Nts., 11/22/216 | 15,175,000 | |
16,540,750 |
| ||||
| 266,096,871 | ||||||||
| Energy Traders—0.2% | ||||||||
| Colbun SA, 6% Sr. Unsec. Nts., 1/21/206 | 19,695,000 | 22,241,721 | ||||||
| Gas Utilities—0.3% | ||||||||
| Empresa de Energia de Bogota SA ESP, 6.125% Sr. Unsec. Unsub. Nts., 11/10/216 | 12,535,000 | 14,039,200 | ||||||
| Gas Natural de Lima y Callao SA, 4.375% Sr. Unsec. Nts., 4/1/235,6 | 8,795,000 | 8,816,988 | ||||||
| Transportadora de Gas Internacional SA ESP, 5.70% Sr. Unsec. Nts., 3/20/226 | 12,535,000 | |
13,725,825 |
| ||||
| 36,582,013 | ||||||||
| OPPENHEIMER INTERNATIONAL BOND FUND | 23 |
STATEMENT OF INVESTMENTS Unaudited / Continued
| Principal Amount |
Value | |||||||
| Multi-Utilities—0.1% | ||||||||
| Abu Dhabi National Energy Co., 3.625% Sr. Unsec. Unsub. Nts., 1/12/236 | $ | 12,160,000 | $ |
12,312,000 |
| |||
| Total Corporate Bonds and Notes (Cost $3,249,435,917) | 3,341,953,181 | |||||||
| Corporate Loans—0.1% | ||||||||
| Hallertau SPC, Sr. Sec. Credit Facilities Term Loan, 7.94%, 9/17/1310 (Cost $5,543,125) | 15,837,500 | 5,493,909 | ||||||
| Structured Securities—3.5% | ||||||||
| Citigroup Funding, Inc., Ghana (Republic of) Credit Linked Nts., 13.45%, 2/19/147,8 |
11,800,000 | GHS | 5,967,298 | |||||
| Citigroup Global Markets Holdings, Inc.: Colombia (Republic of) Credit Linked Bonds, 11.25%, 10/25/188 |
11,920,000,000 | COP | 8,688,756 | |||||
| Colombia (Republic of) Credit Linked Nts., Series 2, 10%, 7/25/24 | 53,862,000,000 | COP | 42,335,739 | |||||
| Colombia (Republic of) Credit Linked Nts., Series 2, 10%, 7/25/248 | 6,450,000,000 | COP | 5,069,725 | |||||
| Colombia (Republic of) Total Return Linked Bonds, Series 2, 11%, 7/27/20 |
26,964,000,000 | COP | 20,209,308 | |||||
| Serbia (Republic of) Credit Linked Bonds, 10.933%, 1/5/143,8 | 650,000,000 | RSD | 6,852,558 | |||||
| Credit Suisse First Boston International, Moitk Total Return Linked Nts., 21%, 3/30/1110 | 220,242,600 | RUR | — | |||||
| Credit Suisse First Boston, Inc. (Nassau Branch), Russian Specialized Construction & Installation Administration Total Return Linked Nts., 13%, 5/24/1010 | 64,600,000 | RUR | — | |||||
| Deutsche Bank AG: Coriolanus Ltd. Sec. Credit Linked Bonds, Series 128, 3.006%, 5/6/253,8 |
4,129,672 | 3,008,906 | ||||||
| Coriolanus Ltd. Sec. Credit Linked Bonds, 3.061%, 5/6/253,8 | 5,261,837 | 3,833,809 | ||||||
| Coriolanus Ltd. Sec. Credit Linked Bonds, 3.10%, 5/6/253,8 | 4,542,753 | 3,309,880 | ||||||
| Coriolanus Ltd. Sec. Credit Linked Bonds, 3.134%, 5/6/253,8 | 4,060,649 | 2,958,616 | ||||||
| Coriolanus Ltd. Sec. Credit Linked Bonds, 3.187%, 5/6/253,8 | 5,055,838 | 3,683,717 | ||||||
| Coriolanus Ltd. Sec. Credit Linked Bonds, 3.239%, 5/6/253,8 | 5,770,471 | 4,204,403 | ||||||
| Coriolanus Ltd. Sec. Credit Linked Bonds, 3.266%, 5/6/253,8 | 4,609,931 | 3,358,826 | ||||||
| Coriolanus Ltd. Sec. Credit Linked Bonds, 3.343%, 5/6/253,8 | 4,333,139 | 3,157,154 | ||||||
| Opic Reforma I Credit Linked Nts., Cl. 2A, 7.746%, 5/22/157,8 | 1,273,571 | MXN | 97,141 | |||||
| Opic Reforma I Credit Linked Nts., Cl. 2B, 7.746%, 5/22/157,8 | 2,228,143 | MXN | 169,950 | |||||
| Opic Reforma I Credit Linked Nts., Cl. 2C, 7.746%, 5/22/157,8 | 33,594,990 | MXN | 2,562,439 | |||||
| Opic Reforma I Credit Linked Nts., Cl. 2D, 7.746%, 5/22/157,8 | 2,448,357 | MXN | 186,747 | |||||
| Opic Reforma I Credit Linked Nts., Cl. 2E, 7.746%, 5/22/157,8 | 1,778,777 | MXN | 135,675 | |||||
| Opic Reforma I Credit Linked Nts., Cl. 2F, 7.746%, 5/22/157,8 | 1,136,016 | MXN | 86,649 | |||||
| Opic Reforma I Credit Linked Nts., Cl. 2G, 7.746%, 5/22/157,8 | 209,208 | MXN | 15,957 | |||||
| Goldman Sachs Capital Markets LP, Colombia (Republic of) Credit Linked Nts., Cl. B, 10%, 7/30/248 | 105,210,000,000 | COP | 82,519,681 | |||||
| Goldman Sachs Group, Inc. (The), United Mexican States Credit Linked Nts., 9.05%, 2/8/373,8 | 2,839,000,000 | MXN | 23,283,963 | |||||
| Hallertau SPC Credit Linked Nts.: Series 2007-01, 2.559%, 12/20/177,8 |
42,470,000 | 42,274,638 | ||||||
| Series 2008-01, 9.888%, 8/2/103,8,10 | 63,164,246 | BRR | — | |||||
| HSBC Bank plc: Serbia (Republic of) Credit Linked Nts., 10.909%, 1/27/143,8 |
649,000,000 | RSD | 6,852,784 | |||||
| 24 | OPPENHEIMER INTERNATIONAL BOND FUND |
| Principal Amount |
Value | |||||||
| Structured Securities Continued | ||||||||
| HSBC Bank plc: Continued | ||||||||
| Serbia (Republic of) Credit Linked Nts., 12.168%, 6/16/143,8 | 1,287,000,000 | RSD | $ | 13,051,880 | ||||
| JPMorgan Chase & Co.: Colombia (Republic of) Credit Linked Bonds, 10.19%, 1/5/163,8 |
68,635,000,000 | COP | 33,274,158 | |||||
| Colombia (Republic of) Credit Linked Bonds, 10.218%, 10/31/163,8 | 90,697,000,000 | COP | 42,126,533 | |||||
| Colombia (Republic of) Credit Linked Nts., 11%, 7/28/208 | 12,645,000,000 | COP | 9,476,650 | |||||
| Colombia (Republic of) Credit Linked Nts., Series 2, 11%, 7/28/208 | 45,193,500,000 | COP | 33,869,749 | |||||
| Colombia (Republic of) Credit Linked Nts., Series B, 10%, 7/26/248 | 17,770,000,000 | COP | 13,966,801 | |||||
| LB Peru Trust II Certificates, Series 1998-A, 3.795%, 2/28/163,10 | 1,426,420 | 142,642 | ||||||
| Merrill Lynch, Colombia (Republic of) Credit Linked Nts., 10%, 11/17/168 |
13,289,000,000 | COP | 8,424,738 | |||||
| Morgan Stanley: Peru (Republic of) Credit Linked Nts., 6.25%, 3/23/178 |
26,120,000 | PEN | 10,391,524 | |||||
| Russian Federation Total Return Linked Bonds, Series 007, Cl. VR, 5%, 8/22/34 |
242,972,415 | RUR | 3,829,620 | |||||
| Standard Bank plc: Ghana (Republic of) Credit Linked Nts., 13.45%, 2/19/147,8 |
6,460,000 | GHS | 3,277,846 | |||||
| Serbia (Republic of) Credit Linked Nts., 11.30%, 1/7/143,8 | 318,000,000 | RSD | 3,383,230 | |||||
| Serbia (Republic of) Credit Linked Nts., 12.405%, 2/3/143,8 | 317,000,000 | RSD | 3,349,811 | |||||
| Standard Chartered Bank, Ghana (Republic of) Credit Linked Nts., 13.30%, 10/2/137,8 | 5,820,000 | GHS | |
2,940,395 |
| |||
| Total Structured Securities (Cost $429,910,769) | 456,329,896 | |||||||
| Expiration Date |
Strike Price |
Contracts | ||||||||||||||
| Options Purchased—0.5% | ||||||||||||||||
| Australian Dollar (AUD) Put11 | 4/4/13 |
|
1 AUD per 1.020USD |
|
94,010,000 | 9,513 | ||||||||||
| Australian Dollar (AUD) Put11 | 6/13/13 |
|
1 AUD per 12.685MXN |
|
48,000,000 | 452,157 | ||||||||||
| Australian Dollar (AUD) Put11 | 6/14/13 |
|
1 AUD per 96.220JPY |
|
125,000,000 | 2,216,572 | ||||||||||
| Australian Dollar (AUD) Put11 | 6/14/13 |
|
1 AUD per 96.500JPY |
|
125,000,000 | 2,149,577 | ||||||||||
| Australian Dollar (AUD) Put11 | 6/17/13 |
|
1 AUD per 96.050JPY |
|
100,000,000 | 1,727,261 | ||||||||||
| British Pound Sterling (GBP) Put11 | 6/10/13 |
|
1 GBP per 1.480USD |
|
191,020,000 | 1,375,657 | ||||||||||
| British Pound Sterling (GBP) Put11 | 6/10/13 |
|
1 GBP per 1.480USD |
|
144,020,000 | 1,037,180 | ||||||||||
| Canadian Dollar (CAD) Put11 | 4/29/13 |
|
1 USD per 1.034CAD |
|
24,300,000 | 42,099 | ||||||||||
| Canadian Dollar (CAD) Put11 | 4/29/13 |
|
1 USD per 1.029CAD |
|
980,000 | 217,920 | ||||||||||
| Canadian Dollar (CAD) Put11 | 9/12/13 |
|
1 CAD per 12.000MXN |
|
48,000,000 | 626,736 | ||||||||||
| OPPENHEIMER INTERNATIONAL BOND FUND | 25 |
STATEMENT OF INVESTMENTS Unaudited / Continued
| Expiration Date |
Strike Price |
Contracts | Value | |||||||||||||
| Options Purchased Continued | ||||||||||||||||
| Dual digital option with $1,000,000 payout contingent on: British pound (GBP)/United States Dollar (USD) spot rates, and United States Dollar (USD)/India Rupee (INR) spot rates at expire date11 |
8/28/13 |
|
Spot trades at or below: 1 GBP per 1.492USD; Spot trades at or below: 1 USD per 54.060INR |
|
522,000 | $ | 29,753 | |||||||||
| Euro (EUR) Call11 | 4/15/13 |
|
1 EUR per 1.245CHF |
|
49,000,000 | 12,141 | ||||||||||
| Euro (EUR) Call11 | 4/18/13 |
|
1 EUR per 1.360USD |
|
200,000,000 | 1,584 | ||||||||||
| Euro (EUR) Call11 | 4/18/13 |
|
1 EUR per 1.360USD |
|
200,000,000 | 1,584 | ||||||||||
| Euro (EUR) Call11 | 5/1/13 |
|
1 EUR per 1.296USD |
|
98,000,000 | 712,798 | ||||||||||
| Euro (EUR) Call11 | 5/2/13 |
|
1 EUR per 1.400USD |
|
200,000,000 | 224 | ||||||||||
| Euro (EUR) Call11 | 5/2/13 |
|
1 EUR per 1.375USD |
|
100,000,000 | 1,816 | ||||||||||
| Euro (EUR) Call11 | 5/2/13 |
|
1 EUR per 1.400USD |
|
200,000,000 | 224 | ||||||||||
| Euro (EUR) Call11 | 5/31/13 |
|
1 EUR per 1.315USD |
|
100,000,000 | 618,831 | ||||||||||
| Euro (EUR) Call11 | 5/31/13 |
|
1 EUR per 1.350USD |
|
100,000,000 | 124,311 | ||||||||||
| Euro (EUR) Call11 | 5/31/13 |
|
1 EUR per 1.350USD |
|
100,000,000 | 124,311 | ||||||||||
| Euro (EUR) Call11 | 6/14/13 |
|
1 EUR per 1.340USD |
|
150,000,000 | 440,144 | ||||||||||
| Euro (EUR) Call11 | 6/18/13 |
|
1 EUR per 1.310USD |
|
100,000,000 | 974,029 | ||||||||||
| Euro (EUR) Call11 | 8/19/13 |
|
1 EUR per 1.360USD |
|
200,000,000 | 959,812 | ||||||||||
| Euro (EUR) Call11 | 9/5/13 |
|
1 EUR per 1.320USD |
|
150,000,000 | 2,231,628 | ||||||||||
| Euro (EUR) Call11 | 9/30/13 |
|
1 EUR per 1.314USD |
|
125,000,000 | 2,396,961 | ||||||||||
| Euro (EUR) Put11 | 5/1/13 |
|
1 EUR per 1.296USD |
|
98,000,000 | 2,047,218 | ||||||||||
| Euro (EUR) Put11 | 5/31/13 |
|
1 EUR per 7.479NOK |
|
23,000,000 | 333,095 | ||||||||||
| Euro (EUR) Put11 | 6/3/13 |
|
1 EUR per 1.290USD |
|
300,000,000 | 6,975,015 | ||||||||||
| Euro (EUR) Put11 | 6/3/13 |
|
1 EUR per 1.290USD |
|
200,000,000 | 4,650,010 | ||||||||||
| 26 | OPPENHEIMER INTERNATIONAL BOND FUND |
| Expiration Date |
Strike Price |
Contracts | Value | |||||||||||||
| Options Purchased Continued | ||||||||||||||||
| Euro (EUR) Put11 | 6/3/13 |
|
1 EUR per 1.290USD |
|
100,000,000 | $ | 2,325,005 | |||||||||
| Euro (EUR) Put11 | 6/26/13 |
|
1 EUR per 1.272USD |
|
200,000,000 | 3,601,696 | ||||||||||
| Japanese Yen (JPY) Call11 | 4/25/13 |
|
1 USD per 87.650JPY |
|
8,765,000,000 | 38,391 | ||||||||||
| Japanese Yen (JPY) Call11 | 4/25/13 |
|
1 USD per 88.000JPY |
|
7,736,000,000 | 44,405 | ||||||||||
| Japanese Yen (JPY) Call11 | 4/25/13 |
|
1 USD per 87.000JPY |
|
17,400,000,000 | 44,718 | ||||||||||
| Japanese Yen (JPY) Call11 | 5/1/13 |
|
1 USD per 89.000JPY |
|
15,345,000,000 | 264,241 | ||||||||||
| Japanese Yen (JPY) Call11 | 6/3/13 |
|
1 USD per 91.000JPY |
|
9,100,000,000 | 826,007 | ||||||||||
| Japanese Yen (JPY) Call11 | 6/6/13 |
|
1 USD per 91.000JPY |
|
18,200,000,000 | 1,727,180 | ||||||||||
| Japanese Yen (JPY) Call11 | 6/10/13 |
|
1 USD per 92.000JPY |
|
9,200,000,000 | 1,217,712 | ||||||||||
| Japanese Yen (JPY) Call11 | 6/12/13 |
|
1 USD per 92.300JPY |
|
9,230,000,000 | 1,353,949 | ||||||||||
| Japanese Yen (JPY) Put11 | 5/24/13 |
|
1 USD per 97.000JPY |
|
21,825,000,000 | 1,747,528 | ||||||||||
| Japanese Yen (JPY) Put11 | 5/24/13 |
|
1 USD per 97.100JPY |
|
24,275,000,000 | 1,879,856 | ||||||||||
| Japanese Yen (JPY) Put11 | 5/30/13 |
|
1 USD per 93.000JPY |
|
9,300,000,000 | 2,622,414 | ||||||||||
| Japanese Yen (JPY) Put11 | 6/12/13 |
|
1 USD per 98.000JPY |
|
19,405,000,000 | 1,518,441 | ||||||||||
| Japanese Yen (JPY) Put11 | 8/23/13 |
|
1 USD per 92.000JPY |
|
9,200,000,000 | 4,141,012 | ||||||||||
| Japanese Yen (JPY) Put11 | 8/23/13 |
|
1 USD per 92.000JPY |
|
9,200,000,000 | 4,141,012 | ||||||||||
| Japanese Yen (JPY) Put11 | 1/23/14 |
|
1 USD per 92.500JPY |
|
9,250,000,000 | 4,881,225 | ||||||||||
| South Korean Won (KRW) Put11 | 6/14/13 |
|
1 USD per 1,120.000KRW |
|
108,640,000,000 | 1,350,395 | ||||||||||
| U.S. Treasury Nts., 10 yr. Futures, 6/19/13 Put11 | 5/27/13 | 132.000 | 2,455 | |
2,109,766 |
| ||||||||||
| Total Options Purchased (Cost $94,094,863) | 68,325,114 | |||||||||||||||
| OPPENHEIMER INTERNATIONAL BOND FUND | 27 |
STATEMENT OF INVESTMENTS Unaudited / Continued
| Swaption Expiration Date |
Notional Amount |
Value | ||||||||||||
| Swaptions Purchased—0.6% | ||||||||||||||
| Bank of America NA; Interest Rate Swaption (European); Swap Terms: Paid: 0.87%; Received: Three-Month USD BBA LIBOR; Termination Date: 12/17/1611 | 12/16/14 | $ | 200,000,000 | $ 1,096,561 | ||||||||||
| Bank of America NA; Interest Rate Swaption (European); Swap Terms: Paid: 2.16875%; Received: Three-Month USD BBA LIBOR; Termination Date: 1/17/2411 | 1/16/14 | 93,940,000 | 2,818,732 | |||||||||||
| Bank of America NA; Interest Rate Swaption (European); Swap Terms: Paid: 2.175%; Received: Three-Month USD BBA LIBOR; Termination Date: 5/2/2311 | 5/1/13 | 156,540,000 | 462,626 | |||||||||||
| Bank of America NA; Interest Rate Swaption (European); Swap Terms: Paid: 2.24%; Received: Three-Month USD BBA LIBOR; Termination Date: 6/10/2311 | 6/7/13 | 209,765,000 | 1,141,891 | |||||||||||
| Bank of America NA; Interest Rate Swaption (European); Swap Terms: Paid: 3.124%; Received: Three-Month USD BBA LIBOR; Termination Date: 4/25/4311 | 11/22/13 | 100,000,000 | 4,584,208 | |||||||||||
| Bank of America NA; Credit Default Swaption (European); Swap Terms: Paid: 5.50%; Received: Protection on iTraxx Europe Crossover Series 18 Version 1; Termination Date: 4/17/1311 | 4/18/13 | 65,980,000 | EUR | 33,391 | ||||||||||
| Bank of America NA; Credit Default Swaption (European); Swap Terms: Paid: Protection on iTraxx Europe Senior Financials Series 18 Version 1; Received: 1.40%; Termination Date: 6/19/1311 | 6/20/13 | 87,995,000 | EUR | 199,876 | ||||||||||
| Bank of America NA; Interest Rate Swaption (European); Swap Terms: Paid: Six-Month AUD BBR BBSW; Received: 4.3725%; Termination Date: 12/5/2211 | 12/5/17 | 100,000,000 | AUD | 2,329,567 | ||||||||||
| Barclays Bank plc; Credit Default Swaption (European); Swap Terms: Paid: 1%; Received: Protection on CDX NA HY 19 ; Termination Date: 6/19/1311 | 6/20/13 | 250,000,000 | 370,975 | |||||||||||
| Barclays Bank plc; Credit Default Swaption (European); Swap Terms: Paid: 1.02%; Received: Protection on CDX NA HY 19 ; Termination Date: 4/17/1311 | 4/18/13 | 50,000,000 | 63,350 | |||||||||||
| Barclays Bank plc; Interest Rate Swaption (European); Swap Terms: Paid: 1.055%; Received: Three-Month USD BBA LIBOR; Termination Date: 4/22/1811 | 4/19/13 | 196,945,000 | 177,208 | |||||||||||
| Barclays Bank plc; Credit Default Swaption (European); Swap Terms: Paid: 1.30%; Received: Protection on CDX NA IG 19; Termination Date: 6/19/1311 | 6/20/13 | 250,000,000 | 101,450 | |||||||||||
| Barclays Bank plc; Interest Rate Swaption (European); Swap Terms: Paid: 1.3725%; Received: Three-Month USD BBA LIBOR; Termination Date: 12/16/1711 | 12/15/15 | 234,295,000 | 2,322,901 | |||||||||||
| Barclays Bank plc; Interest Rate Swaption (European); Swap Terms: Paid: 1.505%; Received: Three-Month USD BBA LIBOR; Termination Date: 1/12/1811 | 1/11/16 | 130,115,000 | 1,258,593 | |||||||||||
| Barclays Bank plc; Interest Rate Swaption (European); Swap Terms: Paid: 2.10%; Received: Six-Month GBP BBA LIBOR; Termination Date: 5/28/2311 | 5/29/13 | 150,000,000 | GBP | 1,000,295 | ||||||||||
| 28 | OPPENHEIMER INTERNATIONAL BOND FUND |
| Swaption Expiration Date |
Notional Amount |
Value | ||||||||||||
| Swaptions Purchased Continued | ||||||||||||||
| Barclays Bank plc; Interest Rate Swaption (European); Swap Terms: Paid: 2.1175%; Received: Three-Month USD BBA LIBOR; Termination Date: 7/9/2311 | 7/8/13 | $ | 100,000,000 | $ 1,266,360 | ||||||||||
| Barclays Bank plc; Interest Rate Swaption (European); Swap Terms: Paid: 3.33%; Received: Three-Month USD BBA LIBOR; Termination Date: 6/24/4311 | 6/21/13 | 43,985,000 | 319,965 | |||||||||||
| Barclays Bank plc; Interest Rate Swaption (European); Swap Terms: Paid: 3.48%; Received: Three-Month USD BBA LIBOR; Termination Date: 4/27/4711 | 4/26/17 | 76,880,000 | 9,459,376 | |||||||||||
| Barclays Bank plc; Interest Rate Swaption (European); Swap Terms: Paid: 3.537%; Received: Six-Month GBP BBA LIBOR; Termination Date: 1/25/4611 | 1/26/16 | 43,960,000 | GBP | 5,292,793 | ||||||||||
| Barclays Bank plc; Credit Default Swaption (European); Swap Terms: Paid: Protection on iTraxx Europe Crossover Series 18 Version 1; Received: 4%; Termination Date: 4/17/1311 | 4/18/13 | 43,995,000 | 186,612 | |||||||||||
| Barclays Bank plc; Interest Rate Swaption (European); Swap Terms: Paid: Three-Month USD BBA LIBOR; Received: 0.935%; Termination Date: 2/3/1711 | 1/31/14 | 371,245,000 | 3,051,200 | |||||||||||
| Goldman Sachs Bank USA; Interest Rate Swaption (European); Swap Terms: Paid: 2%; Received: Three-Month USD BBA LIBOR; Termination Date: 6/4/2311 | 6/3/13 | 313,150,000 | 4,300,331 | |||||||||||
| Goldman Sachs Bank USA; Interest Rate Swaption (European); Swap Terms: Paid: 3.06%; Received: Three-Month USD BBA LIBOR; Termination Date: 8/29/4311 | 8/28/13 | 26,155,000 | 1,000,171 | |||||||||||
| Goldman Sachs Bank USA; Interest Rate Swaption (European); Swap Terms: Paid: 3.18%; Received: Three-Month KRW CD KSDA; Termination Date: 11/22/2211 | 11/22/17 | 108,600,000,000 | KRW | 1,446,240 | ||||||||||
| Goldman Sachs Bank USA; Interest Rate Swaption (European); Swap Terms: Paid: 3.275%; Received: Six-Month GBP BBA LIBOR; Termination Date: 12/4/4511 | 12/7/15 | 43,925,000 | GBP | 6,433,401 | ||||||||||
| Goldman Sachs Bank USA; Interest Rate Swaption (European); Swap Terms: Paid: 3.32%; Received: Three-Month KRW CD KSDA; Termination Date: 1/5/2311 | 1/5/18 | 87,860,000,000 | KRW | 1,050,673 | ||||||||||
| Goldman Sachs Bank USA; Interest Rate Swaption (European); Swap Terms: Paid: 3.70%; Received: Three-Month USD BBA LIBOR; Termination Date: 2/21/4411 | 2/20/14 | 104,640,000 | 2,073,792 | |||||||||||
| Goldman Sachs Bank USA; Interest Rate Swaption (European); Swap Terms: Paid: Three-Month USD BBA LIBOR; Received: 1.0425%; Termination Date: 7/29/1611 | 7/26/13 | 260,960,000 | 594,945 | |||||||||||
| JPMorgan Chase Bank NA; Credit Default Swaption (European); Swap Terms: Paid: 1.10%: Received: Protection on CDX NA IG 19 ; Termination Date: 4/17/1311 | 4/18/13 | 250,000,000 | 9,875 | |||||||||||
| JPMorgan Chase Bank NA; Interest Rate Swaption (European); Swap Terms: Paid: 2.13%: Received: Three-Month USD BBA LIBOR; Termination Date: 5/3/2311 | 5/2/13 | 78,355,000 | 329,969 | |||||||||||
| OPPENHEIMER INTERNATIONAL BOND FUND | 29 |
STATEMENT OF INVESTMENTS Unaudited / Continued
| Swaption Expiration Date |
Notional Amount |
Value | ||||||||||||
| Swaptions Purchased Continued | ||||||||||||||
| JPMorgan Chase Bank NA; Interest Rate Swaption (European); Swap Terms: Paid: 2.484%: Received: Three-Month USD BBA LIBOR; Termination Date: 9/24/2311 | 9/23/13 | $ | 187,970,000 | $ | 1,706,789 | |||||||||
| JPMorgan Chase Bank NA; Interest Rate Swaption (European); Swap Terms: Paid: 3.12%: Received: Three-Month KRW CD KSDA; Termination Date: 1/15/1511 | 1/16/15 | 50,000,000,000 | KRW | 661,854 | ||||||||||
| UBS AG; Interest Rate Swaption (European); Swap Terms: Paid: 1.146%; Received: Three-Month USD BBA LIBOR; Termination Date: 5/2/1811 | 5/1/13 | 260,900,000 | 172,974 | |||||||||||
| UBS AG; Interest Rate Swaption (European); Swap Terms: Paid: 3.22%; Received: Six-Month EUR EURIBOR; Termination Date: 9/23/4511 |
9/22/15 | 100,000,000 | EUR | 6,672,956 | ||||||||||
| UBS AG; Interest Rate Swaption (European); Swap Terms: Paid: Six-Month EUR EURIBOR; Received: 2.015%; Termination Date: 1/26/1911 |
1/25/17 | 369,475,000 | EUR | 6,811,398 | ||||||||||
| UBS AG; Interest Rate Swaption (European); Swap Terms: Paid: Six-Month GBP BBA LIBOR; Received: 1.205%; Termination Date: 8/27/1811 | 8/28/13 | 120,465,000 | GBP | 1,828,003 | ||||||||||
| Total Swaptions Purchased (Cost $93,814,317) | 72,631,301 | |||||||||||||
| Shares | ||||||||||||||
| Investment Company—2.6% | ||||||||||||||
| Oppenheimer Institutional Money Market Fund, Cl. E, 0.14%12,13 (Cost $340,194,120) | 340,194,120 | 340,194,120 | ||||||||||||
| Total Investments, at Value (Cost $12,824,791,659) | 100.2 | % | 12,947,503,178 | |||||||||||
| Liabilities in Excess of Other Assets | (0.2 | ) | (26,315,023 | ) | ||||||||||
| Net Assets | 100.0 | % | $ | 12,921,188,155 | ||||||||
Footnotes to Statement of Investments
* March 28 , 2013 represents the last business day of the Fund’s semiannual period. See Note 1 of the accompanying Notes.
Principal amount, notional amount and strike price are reported in U.S. Dollars, except for those denoted in the following currencies:
| 30 | OPPENHEIMER INTERNATIONAL BOND FUND |
1. All or a portion of the security position is held in segregated accounts and pledged to cover margin requirements under certain derivative contracts. The aggregate market value of such securities is $33,598,870. See Note 6 of the accompanying Notes.
2. All or a portion of the security position is held in accounts at a futures clearing merchant and pledged to cover margin requirements on open futures contracts and written options on futures, if applicable. The aggregate market value of such securities is $18,015,480. See Note 6 of the accompanying Notes.
3. Zero coupon bond reflects effective yield on the date of purchase.
4. Denotes an inflation-indexed security: coupon or principal are indexed to a consumer price index.
5. All or a portion of the security position is when-issued or delayed delivery to be delivered and settled after March 28, 2013. See Note 1 of the accompanying Notes.
6. Represents securities sold under Rule 144A, which are exempt from registration under the Securities Act of 1933, as amended. These securities have been determined to be liquid under guidelines established by the Board of Trustees. These securities amount to $2,963,674,321 or 22.94% of the Fund’s net assets as of March 28, 2013.
7. Represents the current interest rate for a variable or increasing rate security.
8. Restricted security. The aggregate value of restricted securities as of March 28, 2013 was $465,254,180, which represents 3.60% of the Fund’s net assets. See Note 7 of the accompanying Notes. Information concerning restricted securities is as follows:
| Security | Acquisition Dates | Cost | Value | Unrealized Appreciation (Depreciation) | ||||||||||||||||
| Banco Santander Brasil SA (Cayman Islands), 8% Sr. Unsec. Unsub. Nts., 3/18/16 | 3/11/13-3/20/13 | $ | 11,585,966 | $ | 11,223,556 | $ | (362,410 | ) | ||||||||||||
| Bank of India (London), 3.625% Sr. Unsec. Unsub. Nts., 9/21/18 | 3/14/13 | 8,767,440 | 8,848,541 | 81,101 | ||||||||||||||||
| Citigroup Funding, Inc., Ghana (Republic of) Credit Linked Nts., 13.45%, 2/19/14 | 2/7/13 | 6,078,046 | 5,967,298 | (110,748 | ) | |||||||||||||||
| Citigroup Global Markets Holdings, Inc., Colombia (Republic of) Credit Linked Bonds, 11.25%, 10/25/18 | 12/9/08 | 5,062,625 | 8,688,756 | 3,626,131 | ||||||||||||||||
| Citigroup Global Markets Holdings, Inc., Colombia (Republic of) Credit Linked Nts., Series 2, 10%, 7/25/24 | 3/28/12 | 4,512,270 | 5,069,725 | 557,455 | ||||||||||||||||
| Citigroup Global Markets Holdings, Inc., Serbia (Republic of) Credit Linked Bonds, 10.933%, 1/5/14 | 1/18/13 | 7,139,803 | 6,852,558 | (287,245 | ) | |||||||||||||||
| Deutsche Bank AG, Coriolanus Ltd. Sec. Credit Linked Bonds, Series 128, 3.006%, 5/6/25 | 10/8/10 | 2,920,465 | 3,008,906 | 88,441 | ||||||||||||||||
| Deutsche Bank AG, Coriolanus Ltd. Sec. Credit Linked Bonds, 3.343%, 5/6/25 | 4/16/09 | 2,985,696 | 3,157,154 | 171,458 | ||||||||||||||||
| Deutsche Bank AG, Coriolanus Ltd. Sec. Credit Linked Bonds, 3.266%, 5/6/25 | 8/18/09 | 3,193,836 | 3,358,826 | 164,990 | ||||||||||||||||
| Deutsche Bank AG, Coriolanus Ltd. Sec. Credit Linked Bonds, 3.239%, 5/6/25 | 9/25/09 | 4,005,518 | 4,204,403 | 198,885 | ||||||||||||||||
| Deutsche Bank AG, Coriolanus Ltd. Sec. Credit Linked Bonds, 3.187%, 5/6/25 | 12/17/09 | 3,523,019 | 3,683,717 | 160,698 | ||||||||||||||||
| Deutsche Bank AG, Coriolanus Ltd. Sec. Credit Linked Bonds, 3.134%, 5/6/25 | 3/30/10 | 2,841,088 | 2,958,616 | 117,528 | ||||||||||||||||
| Deutsche Bank AG, Coriolanus Ltd. Sec. Credit Linked Bonds, 3.10%, 5/6/25 | 5/18/10 | 3,187,805 | 3,309,880 | 122,075 | ||||||||||||||||
| Deutsche Bank AG, Coriolanus Ltd. Sec. Credit Linked Bonds, 3.061%, 5/6/25 | 7/16/10 | 3,703,676 | 3,833,809 | 130,133 | ||||||||||||||||
| Deutsche Bank AG, Opic Reforma I Credit Linked Nts., Cl. 2A, 7.746%, 5/22/15 | 5/21/08 | 122,792 | 97,141 | (25,651 | ) | |||||||||||||||
| Deutsche Bank AG, Opic Reforma I Credit Linked Nts., Cl. 2B, 7.746%, 5/22/15 | 6/12/08 | 214,813 | 169,950 | (44,863 | ) | |||||||||||||||
| Deutsche Bank AG, Opic Reforma I Credit Linked Nts., Cl. 2C, 7.746%, 5/22/15 | 6/18/08 | 3,259,229 | 2,562,439 | (696,790 | ) | |||||||||||||||
| OPPENHEIMER INTERNATIONAL BOND FUND | 31 |
STATEMENT OF INVESTMENTS Unaudited / Continued
Footnotes to Statement of Investments Continued
| Security | Acquisition Dates | Cost | Value | Unrealized Appreciation (Depreciation) | ||||||||||||||||
| Deutsche Bank AG, Opic Reforma I Credit Linked Nts., Cl. 2D, 7.746%, 5/22/15 | 7/8/08 | $ | 237,353 | $ | 186,747 | $ | (50,606 | ) | ||||||||||||
| Deutsche Bank AG, Opic Reforma I Credit Linked Nts., Cl. 2E, 7.746%, 5/22/15 | 7/15/08 | 172,730 | 135,675 | (37,055 | ) | |||||||||||||||
| Deutsche Bank AG, Opic Reforma I Credit Linked Nts., Cl. 2F, 7.746%, 5/22/15 | 8/8/08 | 111,830 | 86,649 | (25,181 | ) | |||||||||||||||
| Deutsche Bank AG, Opic Reforma I Credit Linked Nts., Cl. 2G, 7.746%, 5/22/15 | 8/22/08 | 20,634 | 15,957 | (4,677 | ) | |||||||||||||||
| Goldman Sachs Capital Markets LP, Colombia (Republic of) Credit Linked Nts., Cl. B, 10%, 7/30/24 | 9/12/12 | 74,261,200 | 82,519,681 | 8,258,481 | ||||||||||||||||
| Goldman Sachs Group, Inc. (The), United Mexican States Credit Linked Nts., 9.05%, 2/8/37 | 9/12/12 | 29,228,378 | 23,283,963 | (5,944,415 | ) | |||||||||||||||
| Hallertau SPC Credit Linked Nts., Series 2007-01, 2.559%, 12/20/17 |
12/13/07 | 42,470,000 | 42,274,638 | (195,362 | ) | |||||||||||||||
| Hallertau SPC Credit Linked Nts., Series 2008-01, 9.888%, 8/2/10 |
5/6/08 | 31,666,704 | — | (31,666,704 | ) | |||||||||||||||
| HSBC Bank plc, Serbia (Republic of) Credit Linked Nts., 10.909%, 1/27/14 | 1/15/13 | 7,073,677 | 6,852,784 | (220,893 | ) | |||||||||||||||
| HSBC Bank plc, Serbia (Republic of) Credit Linked Nts., 12.168%, 6/16/14 | 12/11/12 | 12,797,050 | 13,051,880 | 254,830 | ||||||||||||||||
| IIRSA Norte Finance Ltd., 8.75% Sr. Nts., 5/30/24 |
8/3/06-11/18/09 | 14,037,019 | 17,195,824 | 3,158,805 | ||||||||||||||||
| JPMorgan Chase & Co., Colombia (Republic of) Credit Linked Bonds, 10.19%, 1/5/16 | 12/6/05 | 11,167,708 | 33,274,158 | 22,106,450 | ||||||||||||||||
| JPMorgan Chase & Co., Colombia (Republic of) Credit Linked Bonds, 10.218%, 10/31/16 | 10/16/06 | 14,183,697 | 42,126,533 | 27,942,836 | ||||||||||||||||
| JPMorgan Chase & Co., Colombia (Republic of) Credit Linked Nts., 11%, 7/28/20 | 8/24/10 | 8,481,450 | 9,476,650 | 995,200 | ||||||||||||||||
| JPMorgan Chase & Co., Colombia (Republic of) Credit Linked Nts., Series 2, 11%, 7/28/20 |
10/6/10 | 30,739,218 | 33,869,749 | 3,130,531 | ||||||||||||||||
| JPMorgan Chase & Co., Colombia (Republic of) Credit Linked Nts., Series B, 10%, 7/26/24 |
3/13/13 | 14,505,845 | 13,966,801 | (539,044 | ) | |||||||||||||||
| JPMorgan Hipotecaria su Casita, 8.397% Sec. Nts., 8/26/35 | 3/21/07 | 3,092,229 | 245,030 | (2,847,199 | ) | |||||||||||||||
| Magyar Export-Import Bank RT, 5.50% Sr. Unsec. Nts., 2/12/18 |
|
12/05/12- 12/10/12 |
|
8,676,914 | 8,809,719 | 132,805 | ||||||||||||||
| Merrill Lynch, Colombia (Republic of) Credit Linked Nts., 10%, 11/17/16 | 10/20/06 | 5,679,060 | 8,424,738 | 2,745,678 | ||||||||||||||||
| MHP SA, 8.25% Sr. Unsec. Nts., 4/2/20 | 3/21/13 | 18,595,000 | 18,467,159 | (127,841 | ) | |||||||||||||||
| Morgan Stanley, Peru (Republic of) Credit Linked Nts., 6.25%, 3/23/17 | 7/10/07 | 8,172,409 | 10,391,524 | 2,219,115 | ||||||||||||||||
| Rabobank Capital Funding Trust IV, 5.556% Unsec. Sub. Perpetual Bonds | 10/24/12 | 10,691,555 | 10,651,764 | (39,791 | ) | |||||||||||||||
| Standard Bank plc, Ghana (Republic of) Credit Linked Nts., 13.45%, 2/19/14 | 2/7/13 | 3,348,926 | 3,277,846 | (71,080 | ) | |||||||||||||||
| 32 | OPPENHEIMER INTERNATIONAL BOND FUND |
| Security | Acquisition Dates | Cost | Value | Unrealized Appreciation (Depreciation) | ||||||||||||||||||
| Standard Bank plc, Serbia (Republic of) Credit Linked Nts., 11.30%, 1/7/14 | 12/27/12 | $ | 3,410,690 | $ | 3,383,230 | $ | (27,460 | ) | ||||||||||||||
| Standard Bank plc, Serbia (Republic of) Credit Linked Nts., 12.405%, 2/3/14 | 12/5/12 | 3,291,521 | 3,349,811 | 58,290 | ||||||||||||||||||
| Standard Chartered Bank, Ghana (Republic of) Credit Linked Nts., 13.30%, 10/2/13 | 2/7/13 | 3,019,541 | 2,940,395 | (79,146 | ) | |||||||||||||||||
| $ | 432,236,425 | $ | 465,254,180 | $ | 33,017,755 | |||||||||||||||||
9. This bond has no contractual maturity date, is not redeemable and contractually pays an indefinite stream of interest. Rate reported represents the current interest rate for this variable rate security.
10. This security is not accruing income because the issuer has missed an interest payment on it and/or is not anticipated to make future interest and/or principal payments. The rate shown is the original contractual interest rate. See Note 1 of the accompanying Notes.
11. Non-income producing security.
12. Is or was an affiliate, as defined in the Investment Company Act of 1940, at or during the period ended March 28, 2013, by virtue of the Fund owning at least 5% of the voting securities of the issuer or as a result of the Fund and the issuer having the same investment adviser. Transactions during the period in which the issuer was an affiliate are as follows:
| Shares September 28, 2012a |
Gross Additions |
Gross Reductions |
Shares March 28, 2013 |
|||||||||||||
| Oppenheimer Institutional Money Market Fund, Cl. E | 342,147,098 | 1,855,480,401 | 1,857,433,379 | 340,194,120 | ||||||||||||
| Value | Income | |||||||||||||||
| Oppenheimer Institutional Money Market Fund, Cl. E | $340,194,120 | $278,577 | ||||||||||||||
a. September 28, 2012 represents the last business day of the Fund’s 2012 fiscal year. See Note 1 of the accompanying Notes.
13. Rate shown is the 7-day yield as of March 28, 2013.
Distribution of investments representing geographic holdings, as a percentage of total investments at value, is as follows:
| Geographic Holdings | Value | Percent | ||||||||
| Japan | $ | 1,390,829,725 | 10.7 | % | ||||||
| Russia | 1,291,620,324 | 10.0 | ||||||||
| Brazil | 1,225,700,550 | 9.5 | ||||||||
| Turkey | 1,178,071,500 | 9.1 | ||||||||
| Mexico | 770,523,874 | 6.0 | ||||||||
| Australia | 567,973,522 | 4.4 | ||||||||
| United States | 547,844,986 | 4.2 | ||||||||
| United Kingdom | 514,365,697 | 4.0 | ||||||||
| France | 433,019,453 | 3.3 | ||||||||
| Italy | 427,229,993 | 3.3 | ||||||||
| Colombia | 397,403,176 | 3.1 | ||||||||
| South Africa | 376,865,103 | 2.9 | ||||||||
| Hungary | 338,075,692 | 2.6 | ||||||||
| Spain | 270,969,326 | 2.1 | ||||||||
| Peru | 269,639,068 | 2.1 | ||||||||
| Venezuela | 266,381,329 | 2.1 | ||||||||
| Germany | 219,178,091 | 1.7 | ||||||||
| The Netherlands | 207,046,593 | 1.6 | ||||||||
| Belgium | 185,213,112 | 1.4 | ||||||||
| Canada | 171,600,000 | 1.3 | ||||||||
| Nigeria | 146,382,848 | 1.1 | ||||||||
| Poland | 142,695,663 | 1.1 | ||||||||
| OPPENHEIMER INTERNATIONAL BOND FUND | 33 |
STATEMENT OF INVESTMENTS Unaudited / Continued
Footnotes to Statement of Investments Continued
| Geographic Holdings Continued | Value | Percent | ||||||||
| Malaysia | $ | 131,904,389 | 1.0 | % | ||||||
| United Arab Emirates | 107,030,690 | 0.8 | ||||||||
| Portugal | 104,793,969 | 0.8 | ||||||||
| Israel | 102,233,954 | 0.8 | ||||||||
| Korea, Republic of South | 100,115,047 | 0.8 | ||||||||
| Ukraine | 100,010,321 | 0.8 | ||||||||
| Sweden | 83,198,086 | 0.6 | ||||||||
| Serbia | 71,628,808 | 0.6 | ||||||||
| Chile | 61,061,937 | 0.5 | ||||||||
| Philippines | 60,505,256 | 0.5 | ||||||||
| Ireland | 60,147,757 | 0.5 | ||||||||
| European Union | 42,436,670 | 0.3 | ||||||||
| Denmark | 42,003,975 | 0.3 | ||||||||
| Croatia | 41,334,617 | 0.3 | ||||||||
| Ivory Coast | 40,974,050 | 0.3 | ||||||||
| Kazakhstan | 40,707,487 | 0.3 | ||||||||
| Uruguay | 38,965,432 | 0.3 | ||||||||
| Supranational | 35,381,147 | 0.3 | ||||||||
| Sri Lanka | 33,978,415 | 0.3 | ||||||||
| Switzerland | 31,420,879 | 0.2 | ||||||||
| India | 30,545,816 | 0.2 | ||||||||
| China | 30,292,686 | 0.2 | ||||||||
| Angola | 28,738,800 | 0.2 | ||||||||
| Dominican Republic | 26,689,860 | 0.2 | ||||||||
| Finland | 23,761,138 | 0.2 | ||||||||
| Indonesia | 23,193,550 | 0.2 | ||||||||
| Tanzania | 21,210,600 | 0.2 | ||||||||
| Norway | 17,721,194 | 0.1 | ||||||||
| Trinidad & Tobago | 17,621,563 | 0.1 | ||||||||
| Jamaica | 13,687,650 | 0.1 | ||||||||
| Ghana | 12,185,539 | 0.1 | ||||||||
| Paraguay | 10,851,795 | 0.1 | ||||||||
| Guatemala | 7,796,138 | 0.1 | ||||||||
| Bolivia | 7,772,700 | 0.1 | ||||||||
| Qatar | 4,533,238 | — | ||||||||
| Argentina | 2,438,400 | — | ||||||||
| Total | $ | 12,947,503,178 | 100.0 | % | ||||||
| Forward Currency Exchange Contracts as of March 28, 2013 are as follows: | ||||||||||||||||||||||||||||||
| Counterparty/Contract Description |
Buy/Sell | Contract Amount (000’s) |
Expiration Dates |
Value | Unrealized Appreciation |
Unrealized Depreciation | ||||||||||||||||||||||||
| Bank of America NA: | ||||||||||||||||||||||||||||||
| Australian Dollar (AUD) | Sell | 231,000 | AUD | 5/31/13 | $ | 239,387,703 | $ | — | $ | 56,688 | ||||||||||||||||||||
| Brazilian Real (BRR) | Sell | 236,600 | BRR | 5/3/13 | 116,650,107 | — | 1,435,493 | |||||||||||||||||||||||
| Euro (EUR) | Buy | 219,200 | EUR | 4/2/13-5/2/13 | 280,994,155 | 602,013 | 743,026 | |||||||||||||||||||||||
| Euro (EUR) | Sell | 219,480 | EUR | 4/2/13-8/21/13 | 281,523,727 | — | 1,039,344 | |||||||||||||||||||||||
| Hungarian Forint (HUF) | Sell | 1,567,000 | HUF | 9/16/13 | 6,489,478 | 35,290 | — | |||||||||||||||||||||||
| Mexican Nuevo Peso (MXN) | Buy | 210,200 | MXN | 5/6/13 | 16,959,448 | 288,022 | — | |||||||||||||||||||||||
| Mexican Nuevo Peso (MXN) | Sell | 2,868,400 | MXN | 4/4/13-7/25/13 | 230,584,125 | — | 8,582,079 | |||||||||||||||||||||||
| 34 | OPPENHEIMER INTERNATIONAL BOND FUND |
| Forward Currency Exchange Contracts as of March 28, 2013: Continued | ||||||||||||||||||||||||||||||
| Counterparty/Contract Description |
Buy/Sell | Contract Amount (000’s) |
Expiration Dates |
Value | Unrealized Appreciation |
Unrealized Depreciation | ||||||||||||||||||||||||
| Bank of America NA: Continued | ||||||||||||||||||||||||||||||
| New Turkish Lira (TRY) | Sell | 207,385 | TRY | 4/29/13 | $ | 114,206,198 | $ | — | $ | 226,707 | ||||||||||||||||||||
| Peruvian New Sol (PEN) | Sell | 108,090 | PEN | 4/30/13-6/11/13 | 41,678,075 | 113,029 | 79,453 | |||||||||||||||||||||||
| Philippines Peso (PHP) | Sell | 717,000 | PHP | 4/10/13 | 17,568,505 | 41,712 | — | |||||||||||||||||||||||
| South African Rand (ZAR) | Buy | 12,710 | ZAR | 5/31/13 | 1,370,690 | — | 31,251 | |||||||||||||||||||||||
| South African Rand (ZAR) | Sell | 2,038,330 | ZAR | 4/5/13 | 221,521,395 | 12,176,829 | 246,686 | |||||||||||||||||||||||
| South Korean Won (KRW) | Buy | 117,438,000 | KRW | 4/8/13 | 105,478,349 | — | 4,497,771 | |||||||||||||||||||||||
| South Korean Won (KRW) | Sell | 21,378,000 | KRW | 4/15/13 | 19,189,042 | 176,842 | — | |||||||||||||||||||||||
| 13,433,737 | 16,938,498 | |||||||||||||||||||||||||||||
| Barclays Bank plc: | ||||||||||||||||||||||||||||||
| Australian Dollar (AUD) | Buy | 25,000 | AUD | 4/22/13 | 25,986,219 | 490,969 | — | |||||||||||||||||||||||
| Brazilian Real (BRR) | Sell | 380,605 | BRR | 5/3/13 | 187,648,411 | 765,242 | — | |||||||||||||||||||||||
| Euro (EUR) | Buy | 15,680 | EUR | 4/4/13 | 20,099,987 | — | 194,323 | |||||||||||||||||||||||
| Euro (EUR) | Sell | 128,115 | EUR | 4/18/13-8/21/13 | 164,322,818 | 3,680,952 | — | |||||||||||||||||||||||
| Hungarian Forint (HUF) | Sell | 23,019,000 | HUF | 4/25/13 | 96,651,072 | 7,784,257 | — | |||||||||||||||||||||||
| Israeli Shekel (ILS) | Buy | 95,390 | ILS | 4/2/13 | 26,224,415 | 1,337,904 | — | |||||||||||||||||||||||
| Israeli Shekel (ILS) | Sell | 95,390 | ILS | 4/2/13 | 26,224,415 | — | 1,041,596 | |||||||||||||||||||||||
| Japanese Yen (JPY) | Sell | 35,965,000 | JPY | 7/25/13 | 382,399,193 | 24,497,632 | — | |||||||||||||||||||||||
| Mexican Nuevo Peso (MXN) | Buy | 1,540,400 | MXN | 5/6/13 | 124,283,221 | 4,556,811 | — | |||||||||||||||||||||||
| New Zealand Dollar (NZD) | Sell | 30,775 | NZD | 4/22/13 | 25,711,947 | — | 502,298 | |||||||||||||||||||||||
| Peruvian New Sol (PEN) | Sell | 65,410 | PEN | 5/28/13 | 25,209,664 | 162,717 | — | |||||||||||||||||||||||
| Polish Zloty (PLZ) | Buy | 135,090 | PLZ | 4/18/13 | 41,415,310 | — | 868,508 | |||||||||||||||||||||||
| Polish Zloty (PLZ) | Sell | 79,380 | PLZ | 5/31/13 | 24,252,338 | 200,869 | — | |||||||||||||||||||||||
| Russian Ruble (RUR) | Buy | 2,381,860 | RUR | 4/25/13 | 76,255,496 | — | 1,746,207 | |||||||||||||||||||||||
| South African Rand (ZAR) | Buy | 1,390 | ZAR | 4/5/13 | 151,062 | — | 4,619 | |||||||||||||||||||||||
| 43,477,353 | 4,357,551 | |||||||||||||||||||||||||||||
| BNP Paribas: | ||||||||||||||||||||||||||||||
| Euro (EUR) | Buy | 206,065 | EUR | 5/31/13 | 264,259,077 | — | 6,205,024 | |||||||||||||||||||||||
| Euro (EUR) | Sell | 389,510 | EUR | 5/31/13 | 499,510,121 | 4,877,772 | — | |||||||||||||||||||||||
| Malaysian Ringgit (MYR) | Buy | 290,160 | MYR | 4/25/13 | 93,796,688 | — | 1,213,135 | |||||||||||||||||||||||
| 4,877,772 | 7,418,159 | |||||||||||||||||||||||||||||
| Citibank NA: | ||||||||||||||||||||||||||||||
| Australian Dollar (AUD) | Sell | 371,345 | AUD | 5/31/13 | 384,828,687 | 116,537 | 2,440,221 | |||||||||||||||||||||||
| Canadian Dollar (CAD) | Sell | 10,300 | CAD | 5/31/13 | 10,125,016 | — | 104,927 | |||||||||||||||||||||||
| Chilean Peso (CLP) | Buy | 552,000 | CLP | 5/6/13 | 1,164,580 | 3,232 | — | |||||||||||||||||||||||
| Colombian Peso (COP) | Sell | 120,470,000 | COP | 6/17/13-9/26/13 | 65,265,861 | 404,230 | — | |||||||||||||||||||||||
| OPPENHEIMER INTERNATIONAL BOND FUND | 35 |
STATEMENT OF INVESTMENTS Unaudited / Continued
Footnotes to Statement of Investments Continued
| Forward Currency Exchange Contracts as of March 28, 2013: Continued | ||||||||||||||||||||||||||||||
| Counterparty/Contract Description |
Buy/Sell | Contract Amount (000’s) |
Expiration Dates |
Value | Unrealized Appreciation |
Unrealized Depreciation | ||||||||||||||||||||||||
| Citibank NA: Continued | ||||||||||||||||||||||||||||||
| Euro (EUR) | Buy | 52,950 | EUR | 5/31/13 | $ | 67,903,420 | $ | — | $ | 613,881 | ||||||||||||||||||||
| Euro (EUR) | Sell | 2,940 | EUR | 4/2/13-4/3/13 | 3,768,699 | 2,041 | 3,875 | |||||||||||||||||||||||
| Hong Kong Dollar (HKD) | Buy | 103,850 | HKD | 6/20/13 | 13,383,594 | — | 3,186 | |||||||||||||||||||||||
| Japanese Yen (JPY) | Buy | 16,194,000 | JPY | 5/31/13 | 172,103,889 | 2,673,138 | — | |||||||||||||||||||||||
| Japanese Yen (JPY) | Sell | 50,000,000 | JPY | 9/11/13 | 531,874,700 | — | 2,022,847 | |||||||||||||||||||||||
| Malaysian Ringgit (MYR) | Buy | 227,610 | MYR | 4/25/13 | 73,576,869 | 656,843 | — | |||||||||||||||||||||||
| Peruvian New Sol (PEN) | Sell | 94,920 | PEN | 4/30/13 | 36,614,720 | 141,992 | — | |||||||||||||||||||||||
| Philippines Peso (PHP) | Sell | 29,000 | PHP | 4/10/13 | 710,581 | 2,440 | — | |||||||||||||||||||||||
| South African Rand (ZAR) | Sell | 221,850 | ZAR | 4/5/13 | 24,110,189 | — | 173,365 | |||||||||||||||||||||||
| 4,000,453 | 5,362,302 | |||||||||||||||||||||||||||||
| Credit Suisse International: | ||||||||||||||||||||||||||||||
| British Pound Sterling (GBP) | Sell | 29,005 | GBP | 5/31/13 | 44,056,912 | 1,324,753 | 64,768 | |||||||||||||||||||||||
| New Turkish Lira (TRY) | Sell | 152,460 | TRY | 7/17/13 | 83,079,741 | — | 9,210,277 | |||||||||||||||||||||||
| Swiss Franc (CHF) | Buy | 17,245 | CHF | 5/31/13 | 18,180,438 | — | 350,916 | |||||||||||||||||||||||
| 1,324,753 | 9,625,961 | |||||||||||||||||||||||||||||
| Deutsche Bank AG: | ||||||||||||||||||||||||||||||
| Australian Dollar (AUD) | Sell | 2,345 | AUD | 5/31/13 | 2,430,148 | — | 9,639 | |||||||||||||||||||||||
| British Pound Sterling (GBP) | Buy | 12,840 | GBP | 4/2/13 | 19,509,823 | 95,743 | — | |||||||||||||||||||||||
| British Pound Sterling (GBP) | Sell | 12,840 | GBP | 4/2/13 | 19,509,823 | — | 126,559 | |||||||||||||||||||||||
| Euro (EUR) | Buy | 18,530 | EUR | 4/25/13 | 23,756,563 | — | 245,902 | |||||||||||||||||||||||
| Euro (EUR) | Sell | 319,880 | EUR | 4/4/13-4/25/13 | 410,102,320 | 6,666,045 | — | |||||||||||||||||||||||
| Hungarian Forint (HUF) | Sell | 15,296,000 | HUF | 4/17/13-9/16/13 | 63,873,915 | 1,046,143 | — | |||||||||||||||||||||||
| Japanese Yen (JPY) | Buy | 4,309,000 | JPY | 4/1/13 | 45,774,685 | 41,295 | — | |||||||||||||||||||||||
| Japanese Yen (JPY) | Sell | 4,309,000 | JPY | 4/1/13 | 45,774,685 | — | 559,575 | |||||||||||||||||||||||
| Mexican Nuevo Peso (MXN) | Buy | 623,790 | MXN | 5/6/13 | 50,328,896 | 328,695 | — | |||||||||||||||||||||||
| Mexican Nuevo Peso (MXN) | Sell | 246,400 | MXN | 5/31/13 | 19,830,192 | — | 1,257,094 | |||||||||||||||||||||||
| Norwegian Krone (NOK) | Buy | 20,930 | NOK | 5/31/13 | 3,574,749 | — | 17,811 | |||||||||||||||||||||||
| Peruvian New Sol (PEN) | Sell | 41,695 | PEN | 5/13/13 | 16,077,106 | — | 71,347 | |||||||||||||||||||||||
| Polish Zloty (PLZ) | Buy | 519,250 | PLZ | 4/25/13 | 159,097,486 | — | 6,677,334 | |||||||||||||||||||||||
| Swedish Krona (SEK) | Sell | 155,860 | SEK | 4/25/13 | 23,904,390 | 273,873 | — | |||||||||||||||||||||||
| 8,451,794 | 8,965,261 | |||||||||||||||||||||||||||||
| Goldman Sachs Bank USA: | ||||||||||||||||||||||||||||||
| Australian Dollar (AUD) | Buy | 39,745 | AUD | 5/31/13 | 41,188,157 | 896,266 | — | |||||||||||||||||||||||
| Brazilian Real (BRR) | Buy | 228,350 | BRR | 1/20/15 | 101,183,501 | 1,183,501 | — | |||||||||||||||||||||||
| 36 | OPPENHEIMER INTERNATIONAL BOND FUND |
| Forward Currency Exchange Contracts as of March 28, 2013: Continued | ||||||||||||||||||||||||||||||
| Counterparty/ Contract Description |
Buy/Sell | Contract Amount (000’s) |
Expiration Dates |
Value | Unrealized Appreciation |
Unrealized Depreciation | ||||||||||||||||||||||||
| Goldman Sachs Bank USA: Continued | ||||||||||||||||||||||||||||||
| Colombian Peso (COP) | Sell | 134,340,000 | COP | 5/28/13 | $ | 73,212,479 | $ | 722,579 | $ | — | ||||||||||||||||||||
| Euro (EUR) | Buy | 233,065 | EUR | 4/2/13-5/31/13 | 298,834,301 | 85,219 | 9,570,094 | |||||||||||||||||||||||
| Euro (EUR) | Sell | 602,200 | EUR | 4/2/13-8/21/13 | 772,500,470 | 19,056,346 | 90,516 | |||||||||||||||||||||||
| Hungarian Forint (HUF) | Sell | 7,049,000 | HUF | 4/25/13 | 29,597,003 | 176,742 | — | |||||||||||||||||||||||
| Japanese Yen (JPY) | Buy | 54,257,000 | JPY | 5/31/13 | 576,623,484 | — | 46,027,879 | |||||||||||||||||||||||
| Japanese Yen (JPY) | Sell | 48,546,000 | JPY | 7/25/13 | 516,167,141 | 22,255,386 | — | |||||||||||||||||||||||
| Mexican Nuevo Peso (MXN) | Buy | 1,613,900 | MXN | 5/16/13 | 130,081,596 | 4,391,386 | — | |||||||||||||||||||||||
| Mexican Nuevo Peso (MXN) | Sell | 1,024,400 | MXN | 5/16/13 | 82,567,437 | — | 2,787,370 | |||||||||||||||||||||||
| Peruvian New Sol (PEN) | Sell | 49,850 | PEN | 6/25/13 | 19,206,368 | — | 50 | |||||||||||||||||||||||
| Polish Zloty (PLZ) | Sell | 6,000 | PLZ | 4/25/13 | 1,838,392 | 32,642 | — | |||||||||||||||||||||||
| South African Rand (ZAR) | Buy | 107,560 | ZAR | 4/5/13 | 11,689,393 | — | 68,355 | |||||||||||||||||||||||
| South African Rand (ZAR) | Sell | 510 | ZAR | 4/5/13 | 55,426 | 741 | — | |||||||||||||||||||||||
| South Korean Won (KRW) | Sell | 32,042,000 | KRW | 4/15/13 | 28,761,123 | 288,741 | — | |||||||||||||||||||||||
| 49,089,549 | 58,544,264 | |||||||||||||||||||||||||||||
| HSBC Bank USA NA | ||||||||||||||||||||||||||||||
| New Turkish Lira (TRY) | Buy | 152,460 | TRY | 7/17/13 | 83,079,741 | 4,794,760 | — | |||||||||||||||||||||||
| JPMorgan Chase Bank NA: | ||||||||||||||||||||||||||||||
| Chilean Peso (CLP) | Buy | 3,108,000 | CLP | 5/6/13 | 6,557,091 | 86,808 | — | |||||||||||||||||||||||
| Colombian Peso (COP) | Sell | 111,490,000 | COP | 4/9/13 | 61,023,606 | 1,226,534 | — | |||||||||||||||||||||||
| Euro (EUR) | Buy | 99,935 | EUR | 4/3/13 | 128,104,551 | — | 1,136,065 | |||||||||||||||||||||||
| Euro (EUR) | Sell | 173,455 | EUR | 4/3/13-4/25/13 | 222,357,507 | 1,483,465 | — | |||||||||||||||||||||||
| Hungarian Forint (HUF) | Sell | 19,707,000 | HUF | 9/16/13 | 81,613,368 | 770,649 | — | |||||||||||||||||||||||
| Japanese Yen (JPY) | Buy | 4,662,000 | JPY | 6/11/13 | 49,549,950 | 1,009,900 | — | |||||||||||||||||||||||
| Malaysian Ringgit (MYR) | Buy | 479,040 | MYR | 6/27/13 | 154,367,390 | 725,515 | — | |||||||||||||||||||||||
| Mexican Nuevo Peso (MXN) | Buy | 1,024,400 | MXN | 5/16/13 | 82,567,437 | 2,920,112 | — | |||||||||||||||||||||||
| Mexican Nuevo Peso (MXN) | Sell | 216,710 | MXN | 5/6/13-5/23/13 | 17,457,760 | — | 559,770 | |||||||||||||||||||||||
| New Turkish Lira (TRY) | Sell | 78,880 | TRY | 6/17/13 | 43,159,270 | — | 74,280 | |||||||||||||||||||||||
| Peruvian New Sol (PEN) | Sell | 18,820 | PEN | 4/30/13 | 7,259,682 | — | 12,859 | |||||||||||||||||||||||
| Russian Ruble (RUR) | Buy | 1,675,500 | RUR | 6/13/13 | 53,211,062 | — | 420,390 | |||||||||||||||||||||||
| Russian Ruble (RUR) | Sell | 444,500 | RUR | 4/25/13 | 14,230,714 | 287,857 | — | |||||||||||||||||||||||
| South African Rand (ZAR) | Sell | 539,160 | ZAR | 5/15/13 | 58,274,909 | 1,915,321 | — | |||||||||||||||||||||||
| South Korean Won (KRW) | Sell | 18,140,000 | KRW | 4/8/13 | 16,292,659 | — | 1,684 | |||||||||||||||||||||||
| 10,426,161 | 2,205,048 | |||||||||||||||||||||||||||||
| OPPENHEIMER INTERNATIONAL BOND FUND | 37 |
STATEMENT OF INVESTMENTS Unaudited / Continued
Footnotes to Statement of Investments Continued
| Forward Currency Exchange Contracts as of March 28, 2013: Continued | ||||||||||||||||||||||||||||||
| Counterparty/ Contract Description |
Buy/Sell | Contract Amount (000’s) |
Expiration Dates |
Value | Unrealized Appreciation |
Unrealized Depreciation | ||||||||||||||||||||||||
| Morgan Stanley Capital Services, Inc.: | ||||||||||||||||||||||||||||||
| Australian Dollar (AUD) | Buy | 48,855 | AUD | 5/31/13 | $ | 50,628,945 | $ | 910,384 | $ | — | ||||||||||||||||||||
| Australian Dollar (AUD) | Sell | 25,000 | AUD | 4/22/13 | 25,986,219 | — | 240,969 | |||||||||||||||||||||||
| Canadian Dollar (CAD) | Buy | 7,680 | CAD | 5/31/13 | 7,549,527 | — | 114,532 | |||||||||||||||||||||||
| Japanese Yen (JPY) | Sell | 4,800,000 | JPY | 6/11/13 | 51,016,680 | — | 1,050,511 | |||||||||||||||||||||||
| New Zealand Dollar (NZD) | Buy | 30,775 | NZD | 4/22/13 | 25,711,947 | — | 48,636 | |||||||||||||||||||||||
| Peruvian New Sol (PEN) | Sell | 99,950 | PEN | 5/8/13-6/10/13 | 38,532,670 | 169,594 | 8,775 | |||||||||||||||||||||||
| 1,079,978 | 1,463,423 | |||||||||||||||||||||||||||||
| Nomura Global Financial Products, Inc.: | ||||||||||||||||||||||||||||||
| British Pound Sterling (GBP) | Buy | 12,770 | GBP | 4/3/13 | 19,403,137 | — | 878 | |||||||||||||||||||||||
| British Pound Sterling (GBP) | Sell | 12,770 | GBP | 4/3/13 | 19,403,137 | — | 55,310 | |||||||||||||||||||||||
| Euro (EUR) | Buy | 11,305 | EUR | 4/3/13-5/31/13 | 14,493,710 | — | 192,041 | |||||||||||||||||||||||
| Euro (EUR) | Sell | 131,720 | EUR | 4/2/13-8/21/13 | 168,921,971 | 1,069,888 | 386,556 | |||||||||||||||||||||||
| Japanese Yen (JPY) | Buy | 4,287,000 | JPY | 4/1/13 | 45,540,978 | 50,741 | — | |||||||||||||||||||||||
| Japanese Yen (JPY) | Sell | 55,232,000 | JPY | 4/1/13-6/11/13 | 587,006,917 | — | 2,332,399 | |||||||||||||||||||||||
| 1,120,629 | 2,967,184 | |||||||||||||||||||||||||||||
| Nomura International plc | ||||||||||||||||||||||||||||||
| South Korean Won (KRW) | Sell | 175,000 | KRW | 4/8/13 | 157,178 | 2,282 | — | |||||||||||||||||||||||
| The Royal Bank of Scotland plc: | ||||||||||||||||||||||||||||||
| Euro (EUR) | Sell | 63,790 | EUR | 4/25/13 | 81,782,576 | 1,223,855 | — | |||||||||||||||||||||||
| New Turkish Lira (TRY) | Buy | 33,230 | TRY | 4/29/13 | 18,299,645 | — | 42,243 | |||||||||||||||||||||||
| Swedish Krona (SEK) | Buy | 155,860 | SEK | 4/25/13 | 23,904,390 | — | 487,061 | |||||||||||||||||||||||
| 1,223,855 | 529,304 | |||||||||||||||||||||||||||||
| Total unrealized appreciation and depreciation | $ | 143,303,076 | $ | 118,376,955 | ||||||||||||||||||||||||||
| Spot Currency Exchange Contracts as of March 28, 2013 are as follows: | ||||||||||||||||||||||||||||||
| Broker/Contract Description |
Buy/Sell | Contract Amount (000’s) |
Expiration Date |
Value | Unrealized Appreciation |
Unrealized Depreciation | ||||||||||||||||||||||||
| Goldman Sachs & Co. | ||||||||||||||||||||||||||||||
| Australian Dollar (AUD) | Sell | 536 | AUD | 4/3/13 | $ | 557,617 | $ | 284 | $ | — | ||||||||||||||||||||
| JPMorgan Chase | ||||||||||||||||||||||||||||||
| Euro (EUR) | Buy | 1,691 | EUR | 4/2/13 | 2,168,240 | — | 6,197 | |||||||||||||||||||||||
| Morgan Stanley & Co., Inc. | ||||||||||||||||||||||||||||||
| Brazilian Real (BRR) | Sell | 47,487 | BRR | 4/1/13 | 23,499,854 | 71,738 | — | |||||||||||||||||||||||
| Total unrealized appreciation and depreciation | $ | 72,022 | $ | 6,197 | ||||||||||||||||||||||||||
| 38 | OPPENHEIMER INTERNATIONAL BOND FUND |
| Futures Contracts as of March 28, 2013 are as follows: | |||||||||||||||||||||||||
| Contract Description | Buy/Sell | Number of Contracts |
Expiration Date |
Value | Unrealized Appreciation (Depreciation) | ||||||||||||||||||||
| Australian Treasury Bonds, 3 yr. | Sell | 7,388 | 6/17/13 | $ | 838,164,631 | $ | (2,566,530 | ) | |||||||||||||||||
| Australian Treasury Bonds, 10 yr. | Sell | 484 | 6/17/13 | 61,276,598 | (674,321 | ) | |||||||||||||||||||
| CBOE Volatility Index | Sell | 325 | 5/21/13 | 5,070,000 | 4,638 | ||||||||||||||||||||
| U.S. Long Bonds | Sell | 210 | 6/19/13 | 30,338,438 | (253,669 | ) | |||||||||||||||||||
| U.S. Treasury Nts., 5 yr. | Sell | 3,462 | 6/28/13 | 429,477,330 | (1,550,752 | ) | |||||||||||||||||||
| U.S. Treasury Nts., 10 yr. | Sell | 795 | 6/19/13 | 104,927,578 | (1,014,633 | ) | |||||||||||||||||||
| $(6,055,267 | ) | ||||||||||||||||||||||||
| Written Options as of March 28, 2013 are as follows: | |||||||||||||||||||||||||||||||||||
| Description | Type | Number of Contracts |
Exercise Price | Expiration Date |
Premiums Received |
Value | Unrealized Appreciation/ (Depreciation) | ||||||||||||||||||||||||||||
| Australian Dollar (AUD) | Put | 94,010,000 | |
1AUD per 1.005USD |
|
4/4/13 | $ | 270,213 | $ | (84 | ) | $ | 270,129 | ||||||||||||||||||||||
| Australian Dollar (AUD) | Put | 48,000,000 | |
1AUD per 12.450MXN |
|
6/13/13 | 294,412 | (201,684 | ) | 92,728 | |||||||||||||||||||||||||
| Australian Dollar (AUD) | Call | 48,000,000 | |
1AUD per 13.200USD |
|
6/13/13 | 321,626 | (335,515 | ) | (13,889 | ) | ||||||||||||||||||||||||
| British Pound Sterling (GBP) | Call | 33,500,000 | |
1GBP per 1.563USD |
|
5/31/13 | 812,890 | (437,246 | ) | 375,644 | |||||||||||||||||||||||||
| British Pound Sterling (GBP) | Put | 191,020,000 | |
1GBP per 1.440USD |
|
6/10/13 | 1,655,914 | (390,810 | ) | 1,265,104 | |||||||||||||||||||||||||
| British Pound Sterling (GBP) | Put | 144,020,000 | |
1GBP per 1.440USD |
|
6/10/13 | 1,304,476 | (294,652 | ) | 1,009,824 | |||||||||||||||||||||||||
| British Pound Sterling (GBP) | Put | 33,500,000 | |
1GBP per 1.563USD |
|
5/31/13 | 812,890 | (989,022 | ) | (176,132 | ) | ||||||||||||||||||||||||
| Canadian Dollar (CAD) | Put | 48,000,000 | |
1CAD per 11.650MXN |
|
9/12/13 | 271,028 | (251,462 | ) | 19,566 | |||||||||||||||||||||||||
| Canadian Dollar (CAD) | Call | 48,000,000 | |
1CAD per 12.790MXN |
|
9/12/13 | 468,224 | (521,694 | ) | (53,470 | ) | ||||||||||||||||||||||||
| Canadian Dollar (CAD) | Put | 1,015,000 | |
1USD per 1.068CAD |
|
1/29/14 | 184,459 | (210,868 | ) | (26,409 | ) | ||||||||||||||||||||||||
| Euro (EUR) | Put | 200,000,000 | |
1EUR per 1.232USD |
|
6/26/13 | 1,504,026 | (1,499,000 | ) | 5,026 | |||||||||||||||||||||||||
| Euro (EUR)1 | Put | 150,000,000 | |
1EUR per 1.240USD |
|
9/5/13 | 1,460,100 | (2,033,307 | ) | (573,207 | ) | ||||||||||||||||||||||||
| Euro (EUR) | Put | 300,000,000 | |
1EUR per 1.250USD |
|
6/3/13 | 2,475,000 | (2,609,499 | ) | (134,499 | ) | ||||||||||||||||||||||||
| Euro (EUR) | Put | 200,000,000 | |
1EUR per 1.250USD |
|
6/3/13 | 1,680,000 | (1,739,666 | ) | (59,666 | ) | ||||||||||||||||||||||||
| Euro (EUR) | Put | 100,000,000 | |
1EUR per 1.250USD |
|
6/14/13 | 668,750 | (992,684 | ) | (323,934 | ) | ||||||||||||||||||||||||
| Euro (EUR) | Put | 100,000,000 | |
1EUR per 1.250USD |
|
5/31/13 | 745,786 | (904,142 | ) | (158,356 | ) | ||||||||||||||||||||||||
| Euro (EUR) | Put | 100,000,000 | |
1EUR per 1.250USD |
|
6/3/13 | 762,500 | (869,833 | ) | (107,333 | ) | ||||||||||||||||||||||||
| Euro (EUR) | Put | 100,000,000 | |
1EUR per 1.253USD |
|
5/31/13 | 720,475 | (904,142 | ) | (183,667 | ) | ||||||||||||||||||||||||
| Euro (EUR) | Put | 100,000,000 | |
1EUR per 1.270USD |
|
5/31/13 | 942,340 | (1,402,639 | ) | (460,299 | ) | ||||||||||||||||||||||||
| Euro (EUR) | Put | 200,000,000 | |
1EUR per 1.300USD |
|
8/19/13 | 3,520,400 | (7,529,170 | ) | (4,008,770 | ) | ||||||||||||||||||||||||
| OPPENHEIMER INTERNATIONAL BOND FUND | 39 |
STATEMENT OF INVESTMENTS Unaudited / Continued
Footnotes to Statement of Investments Continued
| Written Options as of March 28, 2013: Continued | |||||||||||||||||||||||||||||||||||
| Description | Type | Number of Contracts |
Exercise Price | Expiration Date |
Premiums Received |
Value | Unrealized Appreciation/ (Depreciation) | ||||||||||||||||||||||||||||
| Euro (EUR)2 | Call | 100,000,000 | |
1EUR per 1.340USD |
|
6/18/13 | $ | 448,230 | $ | (292,352 | ) | $ | 155,878 | ||||||||||||||||||||||
| Euro (EUR) | Call | 125,000,000 | |
1EUR per 1.366USD |
|
9/30/13 | 767,351 | (795,810 | ) | (28,459 | ) | ||||||||||||||||||||||||
| Euro (EUR)3 | Call | 150,000,000 | |
1EUR per 1.380USD |
|
9/5/13 | 820,755 | (454,466 | ) | 366,289 | |||||||||||||||||||||||||
| Euro (EUR) | Call | 100,000,000 | |
1EUR per 1.380USD |
|
5/31/13 | 358,800 | (24,041 | ) | 334,759 | |||||||||||||||||||||||||
| Euro (EUR) | Put | 23,000,000 | |
1EUR per 7.328NOK |
|
5/31/13 | 132,198 | (120,879 | ) | 11,319 | |||||||||||||||||||||||||
| France (Republic of) Bonds, 2.75%, 10/25/27 | Put | 43,950,000 | 98.875 | EUR | 10/22/13 | 1,638,855 | (1,013,057 | ) | 625,798 | ||||||||||||||||||||||||||
| Japanese Yen (JPY) | Put | 10,150,000,000 | |
1USD per 101.500JPY |
|
1/23/14 | 695,000 | (1,556,503 | ) | (861,503 | ) | ||||||||||||||||||||||||
| Japanese Yen (JPY) | Put | 20,396,000,000 | |
1USD per 103.000JPY |
|
6/12/13 | 851,484 | (307,164 | ) | 544,320 | |||||||||||||||||||||||||
| Japanese Yen (JPY) | Call | 8,321,000,000 | |
1USD per 83.210JPY |
|
1/23/14 | 1,571,000 | (881,527 | ) | 689,473 | |||||||||||||||||||||||||
| Japanese Yen (JPY) | Call | 8,940,000,000 | |
1USD per 89.400JPY |
|
6/17/13 | 475,000 | (637,064 | ) | (162,064 | ) | ||||||||||||||||||||||||
| Japanese Yen (JPY)4 | Call | 8,900,000,000 | |
1USD per 89.000JPY |
|
5/30/13 | 890,000 | (285,690 | ) | 604,310 | |||||||||||||||||||||||||
| Japanese Yen (JPY) | Call | 11,351,250,000 | |
1USD per 90.810JPY |
|
6/14/13 | 850,000 | (1,142,276 | ) | (292,276 | ) | ||||||||||||||||||||||||
| Japanese Yen (JPY) | Call | 11,362,500,000 | |
1USD per 90.900JPY |
|
6/14/13 | 850,625 | (1,171,815 | ) | (321,190 | ) | ||||||||||||||||||||||||
| Japanese Yen (JPY) | Call | 4,256,000,000 | |
1USD per 94.350JPY |
|
4/4/13 | 289,101 | (404,022 | ) | (114,921 | ) | ||||||||||||||||||||||||
| Japanese Yen (JPY) | Call | 4,256,000,000 | |
1USD per 94.350JPY |
|
4/4/13 | 355,140 | (355,121 | ) | 19 | |||||||||||||||||||||||||
| Japanese Yen (JPY) | Put | 4,256,000,000 | |
1USD per 94.350JPY |
|
4/4/13 | 291,672 | (307,028 | ) | (15,356 | ) | ||||||||||||||||||||||||
| Japanese Yen (JPY) | Put | 4,256,000,000 | |
1USD per 94.350JPY |
|
4/4/13 | 355,140 | (355,121 | ) | 19 | |||||||||||||||||||||||||
| Japanese Yen (JPY)5 | Put | 9,500,000,000 | |
1USD per 95.000JPY |
|
8/23/13 | 1,830,001 | (2,439,695 | ) | (609,694 | ) | ||||||||||||||||||||||||
| Japanese Yen (JPY)5 | Put | 9,500,000,000 | |
1USD per 95.000JPY |
|
8/23/13 | 1,870,001 | (2,544,005 | ) | (674,004 | ) | ||||||||||||||||||||||||
| Japanese Yen (JPY) | Put | 9,600,000,000 | |
1USD per 96.000JPY |
|
5/30/13 | 845,000 | (1,152,672 | ) | (307,672 | ) | ||||||||||||||||||||||||
| Portugal (Republic of) Sr. Unsec. Bonds, 4.95%, 10/25/23 | Put | 17,580,000 | 90.100 | EUR | 4/22/13 | 480,091 | (347,494 | ) | 132,597 | ||||||||||||||||||||||||||
| South Korean Won (KRW)6 | Put | 110,580,000,000 | |
1USD per 1,140.000KRW |
|
6/14/13 | 955,453 | (842,620 | ) | 112,833 | |||||||||||||||||||||||||
| Spain (Kingdom of) Bonds, 5.50%, 7/30/17 | Put | 50,000,000 | 104.430 | EUR | 7/8/13 | 1,059,682 | (387,732 | ) | 671,950 | ||||||||||||||||||||||||||
| 40 | OPPENHEIMER INTERNATIONAL BOND FUND |
| Written Options as of March 28, 2013: Continued | |||||||||||||||||||||||||||||||||||||
| Description | Type | Number of Contracts |
Exercise Price |
Expiration Date |
Premiums Received |
Value | Unrealized Appreciation/ (Depreciation) | ||||||||||||||||||||||||||||||
| Spain (Kingdom of) Sr. Unsec. Bonds, 5.40%, 1/31/23 | Put | 43,985,000 | 97.660 | EUR | 5/21/13 | $ | 397,291 | $ | (76,940 | ) | $ | 320,351 | |||||||||||||||||||||||||
| U.S. Treasury Nts., 10 yr. Futures, 6/19/13 | Put | 1,567 | 130.500 | 5/27/13 | 512,009 | (563,141 | ) | (51,132 | ) | ||||||||||||||||||||||||||||
| $ | 40,465,388 | $ | (42,575,354 | ) | $ | (2,109,966 | ) | ||||||||||||||||||||||||||||||
Exercise price is reported in U.S. Dollars (USD), except for those denoted in the following currency:
| EUR | Euro |
1. Knock-in option becomes eligible for exercise if at expiration spot rates are less than or equal to 1.20 USD per 1 EUR.
2. Knock-in option becomes eligible for exercise if at any time spot rates are equal to or greater than 1.36 USD per 1 EUR.
3. Knock-in option becomes eligible for exercise if at expiration spot rates are equal to or greater than 1.40 USD per 1 EUR.
4. Knock-in option becomes eligible for exercise if at expiration spot rates are less than or equal to 85.50 JPY per 1 USD.
5. Knock-in option becomes eligible for exercise if at any time spot rates are greater than or equal to 97 JPY per 1 USD.
6. Knock-in option becomes eligible for exercise if at any time spot rates are greater than or equal to 1,170 KRW per 1 USD.
| Credit Default Swap Contracts as of March 28, 2013 are as follows: | ||||||||||||||||||||||||||||
| Reference Entity/ Swap Counterparty |
Buy/Sell Credit Protection |
Notional Amount (000’s) |
Pay/ Receive Fixed Rate |
Termination Date |
Upfront Payment Received/ (Paid) |
Value | Unrealized Appreciation (Depreciation) |
|||||||||||||||||||||
| Banco Bilbao Vizcaya Argentaria Senior Finance SAU: | ||||||||||||||||||||||||||||
| UBS AG | Sell | 4,405 | EUR | 3.00 | % | 12/20/17 | $ | 171,759 | $ | (103,593 | ) | $ | 68,166 | |||||||||||||||
| UBS AG | Sell | 4,405 | EUR | 3.00 | 12/20/17 | 176,637 | (103,593 | ) | 73,044 | |||||||||||||||||||
| Total | 8,810 | EUR | 348,396 | (207,186 | ) | 141,210 | ||||||||||||||||||||||
| Banco Santander SA: | ||||||||||||||||||||||||||||
| Barclays Bank plc | Sell | 20,000 | EUR | 3.00 | 9/20/17 | (72,103 | ) | (225,962 | ) | (298,065 | ) | |||||||||||||||||
| UBS AG | Sell | 8,850 | EUR | 3.00 | 9/20/17 | (31,905 | ) | (99,988 | ) | (131,893 | ) | |||||||||||||||||
| Total | 28,850 | EUR | (104,008 | ) | (325,950 | ) | (429,958 | ) | ||||||||||||||||||||
| Belgium (Kingdom of) | ||||||||||||||||||||||||||||
| JPMorgan Chase Bank NA | Buy | 25,000 | 1.00 | 3/20/18 | 214,879 | (202,497 | ) | 12,382 | ||||||||||||||||||||
| Total | 25,000 | 214,879 | (202,497 | ) | 12,382 | |||||||||||||||||||||||
| France (Republic of) | ||||||||||||||||||||||||||||
| JPMorgan Chase Bank NA | Sell | 25,000 | 0.25 | 3/20/18 | 828,486 | (703,137 | ) | 125,349 | ||||||||||||||||||||
| Total | 25,000 | 828,486 | (703,137 | ) | 125,349 | |||||||||||||||||||||||
| Ireland (Republic of): | ||||||||||||||||||||||||||||
| Goldman Sachs Bank USA | Buy | 21,975 | 1.00 | 3/20/18 | (923,121 | ) | 900,701 | (22,420 | ) | |||||||||||||||||||
| Goldman Sachs Bank USA | Buy | 19,335 | EUR | 1.00 | 3/20/18 | (715,358 | ) | 643,751 | (71,607 | ) | ||||||||||||||||||
| Total | 21,975 | (1,638,479 | ) | 1,544,452 | (94,027 | ) | ||||||||||||||||||||||
| Total | 19,335 | EUR | ||||||||||||||||||||||||||
| Italy (Republic of) | ||||||||||||||||||||||||||||
| Goldman Sachs Bank USA | Sell | 22,000 | 1.00 | 3/20/23 | 3,517,301 | (3,765,855 | ) | (248,554 | ) | |||||||||||||||||||
| 22,000 | 3,517,301 | (3,765,855 | ) | (248,554 | ) | |||||||||||||||||||||||
| Portugal (Republic of): | ||||||||||||||||||||||||||||
| JPMorgan Chase Bank NA | Sell | 9,395 | 1.00 | 12/20/22 | 2,399,640 | (2,236,263 | ) | 163,377 | ||||||||||||||||||||
| JPMorgan Chase Bank NA | Sell | 4,395 | 1.00 | 12/20/22 | 1,133,421 | (1,046,128 | ) | 87,293 | ||||||||||||||||||||
| UBS AG | Sell | 4,385 | 1.00 | 12/20/22 | 1,186,386 | (1,043,748 | ) | 142,638 | ||||||||||||||||||||
| OPPENHEIMER INTERNATIONAL BOND FUND | 41 |
STATEMENT OF INVESTMENTS Unaudited / Continued
Footnotes to Statement of Investments Continued
| Credit Default Swap Contracts as of March 28, 2013: Continued | ||||||||||||||||||||||||||||
| Reference Entity/ Swap Counterparty |
Buy/Sell Credit Protection |
Notional Amount (000’s) |
Pay/ Receive Fixed Rate |
Termination Date |
Upfront Payment Received/ (Paid) |
Value | Unrealized Appreciation (Depreciation) |
|||||||||||||||||||||
| Portugal (Republic of): Continued | ||||||||||||||||||||||||||||
| UBS AG | Sell | 13,180 | 1.00 | % | 12/20/22 | $ | 3,430,827 | $ | (3,137,195 | ) | $ | 293,632 | ||||||||||||||||
| UBS AG | Buy | 13,180 | 1.00 | 12/20/17 | (2,013,977 | ) | 1,637,031 | (376,946 | ) | |||||||||||||||||||
| Total | 44,535 | 6,136,297 | (5,826,303 | ) | 309,994 | |||||||||||||||||||||||
| Santander International Debt SAU | ||||||||||||||||||||||||||||
| Bank of America NA | Sell | 5,000 | EUR | 3.00 | 12/20/17 | (106,114 | ) | (75,435 | ) | (181,549 | ) | |||||||||||||||||
| Total | 5,000 | EUR | (106,114 | ) | (75,435 | ) | (181,549 | ) | ||||||||||||||||||||
| Spain (Kingdom of): | ||||||||||||||||||||||||||||
| Barclays Bank plc | Buy | 25,000 | EUR | 1.00 | 3/20/18 | (2,103,569 | ) | 2,200,191 | 96,622 | |||||||||||||||||||
| Goldman Sachs Bank USA | Buy | 50,000 | EUR | 1.00 | 3/20/18 | (4,390,240 | ) | 4,400,382 | 10,142 | |||||||||||||||||||
| Goldman Sachs Bank USA | Buy | 58,705 | EUR | 1.00 | 3/20/23 | (10,127,588 | ) | 9,981,005 | (146,583 | ) | ||||||||||||||||||
| Goldman Sachs Bank USA | Buy | 43,950 | EUR | 1.00 | 3/20/18 | (3,476,446 | ) | 3,867,935 | 391,489 | |||||||||||||||||||
| Goldman Sachs International | Buy | 36,000 | EUR | 1.00 | 3/20/23 | (5,651,642 | ) | 6,120,708 | 469,066 | |||||||||||||||||||
| UBS AG | Buy | 5,000 | EUR | 1.00 | 9/20/17 | (392,044 | ) | 382,477 | (9,567 | ) | ||||||||||||||||||
| UBS AG | Buy | 8,850 | EUR | 1.00 | 9/20/17 | (674,976 | ) | 676,984 | 2,008 | |||||||||||||||||||
| Total | 227,505 | EUR | (26,816,505 | ) | 27,629,682 | 813,177 | ||||||||||||||||||||||
| Telefonica SA | ||||||||||||||||||||||||||||
| UBS AG | Sell | 5,000 | EUR | 1.00 | 9/20/17 | 627,078 | (322,964 | ) | 304,114 | |||||||||||||||||||
| Total | 5,000 | EUR | 627,078 | (322,964 | ) | 304,114 | ||||||||||||||||||||||
| Grand Total Buys | (30,254,082 | ) | 30,608,668 | 354,586 | ||||||||||||||||||||||||
| Grand Total Sells | 13,261,413 | (12,863,861 | ) | 397,552 | ||||||||||||||||||||||||
| Total Credit Default Swaps | $ | (16,992,669 | ) | $ | 17,744,807 | $ | 752,138 | |||||||||||||||||||||
The table that follows shows the undiscounted maximum potential payment by the Fund related to selling credit protection in credit default swaps:
| Type of Reference Asset on which the Fund Sold Protection |
Total Maximum Potential Payments for Selling Credit Protection (Undiscounted) |
Amount Recoverable* | Reference Asset Rating Range** | ||||||||||||
| Investment Grade Single Name Corporate Debt | 47,660,000 | EUR | — | BBB to BBB- | |||||||||||
| Investment Grade Sovereign Debt | $ | 47,000,000 | $ | — | AAA to BBB+ | ||||||||||
| Non-Investment Grade Sovereign Debt | $ | 31,355,000 | $ | 13,180,000 | BB | ||||||||||
| Total EUR | 47,660,000 | EUR | $ | — | |||||||||||
| Total USD | $ | 78,355,000 | $ | 13,180,000 | |||||||||||
*Amounts recoverable includes potential payments from related purchased protection for instances where the Fund is the seller of protection. In addition, the Fund has no recourse provisions under the credit derivatives and holds no collateral which can offset or reduce potential payments under a triggering event.
** The period end reference asset security ratings, as rated by any rating organization, are included in the equivalent Standard & Poor’s rating category. The reference asset rating represents the likelihood of a potential credit event on the reference asset which would result in a related payment by the Fund.
| 42 | OPPENHEIMER INTERNATIONAL BOND FUND |
| Interest Rate Swap Contracts as of March 28, 2013 are as follows: | ||||||||||||||||||||
| Interest Rate/ Swap Counterparty |
Notional Amount (000’s) |
Paid by the Fund |
Received by the Fund |
Termination Date |
Value | |||||||||||||||
| BZDI: | ||||||||||||||||||||
| Bank of America NA | 92,410 | BRR | BZDI | 8.090 | % | 1/2/15 | $ | 1,196 | ||||||||||||
| Bank of America NA | 37,730 | BRR | BZDI | 8.505 | 1/2/15 | 27,964 | ||||||||||||||
| Deutsche Bank AG | 158,480 | BRR | BZDI | 8.080 | 1/2/15 | 31,442 | ||||||||||||||
| Goldman Sachs International | 851,500 | BRR | BZDI | 7.220 | 10/1/13 | (377,114 | ) | |||||||||||||
| Goldman Sachs International | 105,720 | BRR | BZDI | 8.080 | 1/2/15 | (24,487 | ) | |||||||||||||
| Goldman Sachs International | 147,700 | BRR | BZDI | 7.785 | 1/2/15 | (549,970 | ) | |||||||||||||
| JPMorgan Chase Bank NA | 300,000 | BRR | BZDI | 8.700 | 1/2/17 | (581,300 | ) | |||||||||||||
| Total | 1,693,540 | BRR | (1,472,269 | ) | ||||||||||||||||
| MXN TIIE BANXICO: | ||||||||||||||||||||
| Credit Suisse International | 103,400 | MXN | 5.780 | % | MXN TIIE BANXICO | 1/6/23 | (161,317 | ) | ||||||||||||
| Goldman Sachs International | 380,000 | MXN | 5.750 | MXN TIIE BANXICO | 1/9/23 | (515,360 | ) | |||||||||||||
| Goldman Sachs International | 148,700 | MXN | 5.780 | MXN TIIE BANXICO | 1/6/23 | (231,990 | ) | |||||||||||||
| JPMorgan Chase Bank NA | 242,600 | MXN | 5.750 | MXN TIIE BANXICO | 1/9/23 | (329,017 | ) | |||||||||||||
| Total where Fund pays a fixed rate | 874,700 | MXN | (1,237,684 | ) | ||||||||||||||||
| Bank of America NA | 100,000 | MXN | MXN TIIE BANXICO | 6.315 | 3/19/13 | (38,850 | ) | |||||||||||||
| Bank of America NA | 200,000 | MXN | MXN TIIE BANXICO | 6.390 | 2/8/33 | 27,035 | ||||||||||||||
| Credit Suisse International | 71,100 | MXN | MXN TIIE BANXICO | 6.645 | 12/24/32 | 200,175 | ||||||||||||||
| Goldman Sachs International | 93,800 | MXN | MXN TIIE BANXICO | 6.640 | 12/24/32 | 264,084 | ||||||||||||||
| Goldman Sachs International | 200,000 | MXN | MXN TIIE BANXICO | 6.360 | 2/8/33 | 20,367 | ||||||||||||||
| Goldman Sachs International | 245,000 | MXN | MXN TIIE BANXICO | 6.590 | 12/27/32 | 567,284 | ||||||||||||||
| JPMorgan Chase Bank NA | 140,000 | MXN | MXN TIIE BANXICO | 6.590 | 12/27/32 | (47,686 | ) | |||||||||||||
| JPMorgan Chase Bank NA | 155,200 | MXN | MXN TIIE BANXICO | 6.590 | 1/9/23 | 359,357 | ||||||||||||||
| Total where Fund pays a variable rate | 1,205,100 | MXN | 1,351,766 | |||||||||||||||||
| Total | 2,079,800 | MXN | 114,082 | |||||||||||||||||
| Six-Month EUR EURIBOR: | ||||||||||||||||||||
| JPMorgan Chase Bank NA | 250,000 | EUR | Six-Month EUR EURIBOR | 1.406 | 3/26/18 | 60,040 | ||||||||||||||
| UBS AG | 250,000 | EUR | Six-Month EUR EURIBOR | 1.405 | 3/29/18 | 44,394 | ||||||||||||||
| Total | 500,000 | EUR | 104,434 | |||||||||||||||||
| OPPENHEIMER INTERNATIONAL BOND FUND | 43 |
STATEMENT OF INVESTMENTS Unaudited / Continued
Footnotes to Statement of Investments Continued
| Interest Rate Swap Contracts as of March 28, 2013 are as follows: | ||||||||||||||||||||
| Interest Rate/ Swap Counterparty |
Notional Amount (000’s) |
Paid by the Fund |
Received by the Fund |
Termination Date |
Value | |||||||||||||||
| Six-Month PLZ WIBOR WIBO | ||||||||||||||||||||
| JPMorgan Chase Bank NA | 125,000 | PLZ | |
Six-Month PLZ WIBOR WIBO |
|
3.410 | % | 3/23/20 | $ | (53,171 | ) | |||||||||
| Three-Month CAD BA CDOR | ||||||||||||||||||||
| Bank of America NA | 307,975 | CAD | |
Three-Month CAD BA CDOR |
|
1.735 | 3/14/16 | 411,296 | ||||||||||||
| Three-Month KRW CD KSDA | ||||||||||||||||||||
| JPMorgan Chase Bank NA | 25,000,000 | KRW | |
Three-Month KRW CD KSDA |
|
2.960 | 3/15/23 | 333,216 | ||||||||||||
| Three-Month USD BBA LIBOR: | ||||||||||||||||||||
| Bank of America NA | 26,900 | 2.023 | % | |
Three-Month USD BBA LIBOR |
|
3/21/23 | (56,513 | ) | |||||||||||
| Goldman Sachs Bank USA | 26,500 | 2.025 | |
Three-Month USD BBA LIBOR |
|
3/21/23 | (61,843 | ) | ||||||||||||
| Total | 53,400 | (118,356 | ) | |||||||||||||||||
| Total Interest Rate Swaps | $ | (680,768 | ) | |||||||||||||||||
Notional amount is reported in U.S. Dollars (USD), except for those denoted in the following currencies:
| BRR | Brazilian Real | |
| CAD | Canadian Dollar | |
| EUR | Euro | |
| KRW | South Korean Won | |
| MXN | Mexican Nuevo Peso | |
| PLZ | Polish Zloty |
Abbreviations/Definitions are as follows:
| BA CDOR | Canada Bankers Acceptances Deposit Offering Rate | |
| BANXICO | Banco de Mexico | |
| BBA LIBOR | British Bankers’ Association London-Interbank Offered Rate | |
| BZDI | Brazil Interbank Deposit Rate | |
| CD | Certificate of Deposit | |
| EURIBOR | Euro Interbank Offered Rate | |
| KSDA | Korean Securities Dealers Assn. | |
| TIIE | Interbank Equilibrium Interest Rate | |
| WIBOR WIBO | Poland Warsaw Interbank Offer Bid Rate |
| 44 | OPPENHEIMER INTERNATIONAL BOND FUND |
| Volatility Swaps as of March 28, 2013 are as follows: | ||||||||||||||||||
| Reference Entity/ Swap Counterparty |
Notional Amount (000’s) |
Paid by the Fund |
Received by the Fund |
Termination Date |
Value | |||||||||||||
| CAD/JPY spot exchange rate | ||||||||||||||||||
| Credit Suisse International | 77 | CAD | 13.800 | % | The Historic Volatility of the mid CAD/JPY spot exchange rate during the period 3/8/13 to 4/10/13 | 4/12/13 | $ | (215,191 | ) | |||||||||
| CAD/USD spot exchange rate | ||||||||||||||||||
| Royal Bank of Scotland plc (The) | 75 | |
The Historic Volatility of the mid CAD/USD spot exchange rate during the period 3/7/13 to 4/7/13 |
|
6.250 | 4/8/13 | 113,478 | |||||||||||
| CHF/NOK spot exchange rate | ||||||||||||||||||
| Credit Suisse International | 71 | CHF | 7.750 | The Historic Volatility of the mid CHF/NOK spot exchange rate during the period 3/19/13 to 4/18/13 | 4/22/13 | (86,770 | ) | |||||||||||
| JPY/GBP spot exchange rate: | ||||||||||||||||||
| Goldman Sachs Bank USA | 50 | GBP | |
The Historic Volatility of the mid JPY/GBP spot exchange rate during the period 3/26/13 to 4/25/13 |
|
11.700 | 4/30/13 | 21,516 | ||||||||||
| Royal Bank of Scotland plc (The) | 50 | GBP | |
The Historic Volatility of the mid JPY/GBP spot exchange rate during the period 3/27/13 to 4/30/13 |
|
11.850 | 5/2/13 | 9,811 | ||||||||||
| Reference Entity Total | 31,327 | |||||||||||||||||
| JPY/NZD spot exchange rate | ||||||||||||||||||
| JPMorgan Chase Bank NA | 91 | NZD | 15.500 | The Historic Volatility of the mid JPY/NZD spot exchange rate during the period 3/1/13 to 4/3/13 | 4/5/13 | (417,727 | ) | |||||||||||
| NOK/CHF spot exchange rate | ||||||||||||||||||
| JPMorgan Chase Bank NA | 71 | CHF | 6.800 | The Historic Volatility of the mid NOK/CHF spot exchange rate during the period 3/18/13 to 4/18/13 | 4/22/13 | 17,999 | ||||||||||||
| NOK/GBP spot exchange rate | ||||||||||||||||||
| Royal Bank of Scotland plc (The) | 50 | GBP | 10.750 | The Historic Volatility of the mid NOK/GBP spot exchange rate during the period 3/14/13 to 4/16/13 | 4/18/13 | (147,654 | ) | |||||||||||
| OPPENHEIMER INTERNATIONAL BOND FUND | 45 |
STATEMENT OF INVESTMENTS Unaudited / Continued
Footnotes to Statement of Investments Continued
| Volatility Swaps as of March 28, 2013: Continued | ||||||||||||||||||||
| Reference Entity/ Swap Counterparty |
Notional Amount (000’s) |
Paid by the Fund |
Received by the Fund |
Termination Date |
Value | |||||||||||||||
| NZD/AUD spot exchange rate | ||||||||||||||||||||
| Deutsche Bank AG | 72 | AUD | 6.600 | % | |
The Historic Volatility of the mid NZD/AUD spot exchange rate during the period 3/15/13 to 4/17/13 |
|
4/19/13 | $ | (85,374 | ) | |||||||||
| NZD/JPY spot exchange rate: | ||||||||||||||||||||
| Bank of America NA | 90 | NZD | |
The Historic Volatility of the mid NZD/JPY spot exchange rate during the period 3/28/13 to 5/1/13 |
|
13.000 | % | 5/3/13 | — | |||||||||||
| Total where Fund pays a variable rate | — | |||||||||||||||||||
| Citibank NA | 91 | NZD | 15.150 | |
The Historic Volatility of the mid NZD/JPY spot exchange rate during the period 2/28/13 to 4/2/13 |
|
4/4/13 | (404,969 | ) | |||||||||||
| Total where Fund pays a fixed rate | (404,969 | ) | ||||||||||||||||||
| Total | Reference Entity Total | (404,969 | ) | |||||||||||||||||
| USD/CAD spot exchange rate: | ||||||||||||||||||||
| Bank of America NA | 75 | |
The Historic Volatility of the mid USD/CAD spot exchange rate during the period 3/6/13 to 4/5/13 |
|
6.500 | 4/8/13 | 134,234 | |||||||||||||
| Deutsche Bank AG | 75 | |
The Historic Volatility of the mid USD/CAD spot exchange rate during the period 3/5/13 to 4/5/13 |
|
6.575 | 4/8/13 | 126,898 | |||||||||||||
| Morgan Stanley Capital Services, Inc. | 75 | |
The Historic Volatility of the mid USD/CAD spot exchange rate during the period 3/13/13 to 4/12/13 |
|
5.550 | 4/15/13 | 10,826 | |||||||||||||
| Morgan Stanley Capital Services, Inc. | 75 | |
The Historic Volatility of the mid USD/CAD spot exchange rate during the period 3/11/13 to 4/11/13 |
|
5.950 | 4/12/13 | 58,626 | |||||||||||||
| Morgan Stanley Capital Services, Inc. | 75 | |
The Historic Volatility of the mid USD/CAD spot exchange rate during the period 3/4/13 to 4/4/13 |
|
6.700 | 4/5/13 | 148,018 | |||||||||||||
|
|
Reference Entity Total |
|
478,602 | |||||||||||||||||
| Total Volatility Swaps | $ | (716,279 | ) | |||||||||||||||||
| 46 | OPPENHEIMER INTERNATIONAL BOND FUND |
Notional amount is reported in U.S. Dollars (USD), except for those denoted in the following currencies:
| AUD | Australian Dollar | |
| CAD | Canadian Dollar | |
| CHF | Swiss Franc | |
| GBP | British Pounds Sterling | |
| NZD | New Zealand Dollar |
Abbreviations/Definitions are as follows:
| JPY | Japanese Yen | |
| NOK | Norwegian Krone |
The following table aggregates, as of period end, the amount receivable from/(payable to) each counterparty with whom the Fund has entered into a swap agreement. Swaps are individually disclosed in the preceding tables.
| Swap Summary as of March 28, 2013 is as follows: | ||||||||||
| Swap Counterparty | Swap Type from Fund Perspective |
Notional Amount (000’s) |
Value | |||||||
| Bank of America NA: | ||||||||||
| Credit Default Sell Protection | 5,000 | EUR | $ | (75,435 | ) | |||||
| Interest Rate | 130,140 | BRR | 29,160 | |||||||
| Interest Rate | 307,975 | CAD | 411,296 | |||||||
| Interest Rate | 300,000 | MXN | (11,815 | ) | ||||||
| Interest Rate | 26,900 | (56,513 | ) | |||||||
| Volatility | 90 | NZD | — | |||||||
| Volatility | 75 | 134,234 | ||||||||
| 430,927 | ||||||||||
| Barclays Bank plc: | ||||||||||
| Credit Default Buy Protection | 25,000 | EUR | 2,200,191 | |||||||
| Credit Default Sell Protection | 20,000 | EUR | (225,962 | ) | ||||||
| 1,974,229 | ||||||||||
| Citibank NA | Volatility | 91 | NZD | (404,969 | ) | |||||
| Credit Suisse International: | ||||||||||
| Interest Rate | 174,500 | MXN | 38,858 | |||||||
| Volatility | 77 | CAD | (215,191 | ) | ||||||
| Volatility | 71 | CHF | (86,770 | ) | ||||||
| (263,103 | ) | |||||||||
| Deutsche Bank AG: | ||||||||||
| Interest Rate | 158,480 | BRR | 31,442 | |||||||
| Volatility | 72 | AUD | (85,374 | ) | ||||||
| Volatility | 75 | 126,898 | ||||||||
| 72,966 | ||||||||||
| Goldman Sachs Bank USA: | ||||||||||
| Credit Default Buy Protection | 171,990 | EUR | 18,893,073 | |||||||
| Credit Default Buy Protection | 21,975 | 900,701 | ||||||||
| Credit Default Sell Protection | 22,000 | (3,765,855 | ) | |||||||
| Interest Rate | 26,500 | (61,843 | ) | |||||||
| Volatility | 50 | GBP | 21,516 | |||||||
| 15,987,592 | ||||||||||
| Goldman Sachs International: | ||||||||||
| Credit Default Buy Protection | 36,000 | EUR | 6,120,708 | |||||||
| Interest Rate | 1,104,920 | BRR | (951,571 | ) | ||||||
| Interest Rate | 1,067,500 | MXN | 104,385 | |||||||
| 5,273,522 | ||||||||||
| OPPENHEIMER INTERNATIONAL BOND FUND | 47 |
STATEMENT OF INVESTMENTS Unaudited / Continued
Footnotes to Statement of Investments Continued
| Swap Summary as of March 28, 2013: Continued | ||||||||||
| Swap Counterparty | Swap Type from Fund Perspective |
Notional Amount (000’s) |
Value | |||||||
| JPMorgan Chase Bank NA: | ||||||||||
| Credit Default Buy Protection | $ | 25,000 | $ | (202,497 | ) | |||||
| Credit Default Sell Protection | 38,790 | (3,985,528 | ) | |||||||
| Interest Rate | 300,000 | BRR | (581,300 | ) | ||||||
| Interest Rate | 250,000 | EUR | 60,040 | |||||||
| Interest Rate | 25,000,000 | KRW | 333,216 | |||||||
| Interest Rate | 537,800 | MXN | (17,346 | ) | ||||||
| Interest Rate | 125,000 | PLZ | (53,171 | ) | ||||||
| Volatility | 71 | CHF | 17,999 | |||||||
| Volatility | 91 | NZD | (417,727 | ) | ||||||
| (4,846,314 | ) | |||||||||
| Morgan Stanley Capital Services, Inc. | Volatility | 225 | 217,470 | |||||||
| Royal Bank of Scotland plc (The): | ||||||||||
| Volatility | 100 | GBP | (137,843 | ) | ||||||
| Volatility | 75 | 113,478 | ||||||||
| (24,365 | ) | |||||||||
| UBS AG: | ||||||||||
| Credit Default Buy Protection | 13,850 | EUR | 1,059,461 | |||||||
| Credit Default Buy Protection | 13,180 | 1,637,031 | ||||||||
| Credit Default Sell Protection | 22,660 | EUR | (630,138 | ) | ||||||
| Credit Default Sell Protection | 17,565 | (4,180,943 | ) | |||||||
| Interest Rate | 250,000 | EUR | 44,394 | |||||||
| (2,070,195 | ) | |||||||||
| Total Swaps | $ | 16,347,760 | ||||||||
Notional amount is reported in U.S.Dollars (USD), except for those denoted in the following currencies:
| AUD | Australian Dollar | |
| BRR | Brazilian Real | |
| CAD | Canadian Dollar | |
| CHF | Swiss Franc | |
| EUR | Euro | |
| GBP | British Pounds Sterling | |
| KRW | South Korean Won | |
| MXN | Mexican Nuevo Peso | |
| NZD | New Zealand Dollar | |
| PLZ | Polish Zloty |
| 48 | OPPENHEIMER INTERNATIONAL BOND FUND |
| As of March 28, 2013, the Fund had entered into the following written swaption contracts: | ||||||||||||||||||||||||||||||||||
| Reference Entity / Swaption Counterparty |
Swaption Description |
Underlying Swap Type from Fund Perspective |
Notional Amount (000’s) |
Expiration Date |
Premium Received |
Value | Unrealized Appreciation (Depreciation) | |||||||||||||||||||||||||||
| CDX NA HY 19 | ||||||||||||||||||||||||||||||||||
| Barclays Bank plc | Credit Default Index Swaption (European); Swap Terms: Paid: Protection on CDX NA HY 19; Received: 5%; Termination Date: 12/20/17 | Index Credit Default Swap; Pay Floating | $ | 50,000 | 4/18/13 | $ | 445,000 | $ | (27,310 | ) | $ | 417,690 | ||||||||||||||||||||||
| CDX NA IG 19: | ||||||||||||||||||||||||||||||||||
| Barclays Bank plc | Credit Default Index Swaption (European); Swap Terms: Paid: Protection on CDX NA IG 19; Received: 1%; Termination Date: 12/20/17 | Index Credit Default Swap; Pay Floating | 200,000 | 4/18/13 | 235,000 | (25,300 | ) | 209,700 | ||||||||||||||||||||||||||
| Barclays Bank plc | Credit Default Index Swaption (European); Swap Terms: Paid: Protection on CDX NA IG 19; Received: 1%; Termination Date: 12/20/17 | Index Credit Default Swap; Pay Floating | 500,000 | 6/20/13 | 550,000 | (366,450 | ) | 183,550 | ||||||||||||||||||||||||||
| JPMorgan Chase Bank NA | Credit Default Index Swaption (European); Swap Terms: Paid: Protection on CDX NA IG 19; Received: 1%; Termination Date: 12/20/17 | Index Credit Default Swap; Pay Floating | 250,000 | 4/18/13 | 75,000 | (3,925 | ) | 71,075 | ||||||||||||||||||||||||||
| JPMorgan Chase Bank NA | Credit Default Index Swaption (European); Swap Terms: Paid: Protection on CDX NA IG 19; Received: 1%; Termination Date: 12/20/17 | Index Credit Default Swap; Pay Floating | 250,000 | 4/18/13 | 50,000 | (1,950 | ) | 48,050 | ||||||||||||||||||||||||||
| 910,000 | (397,625 | ) | 512,375 | |||||||||||||||||||||||||||||||
| iTraxx Europe Crossover Series 18 Version 1: |
|
|||||||||||||||||||||||||||||||||
| Bank of America NA | Credit Default Index Swaption (European); Swap Terms: Paid: Protection on iTraxx Europe Crossover Series 18 Version 1; Received: 5%; Termination Date: 12/20/17 | Index Credit Default Swap; Pay Floating | 65,980 | EUR | 4/18/13 | 123,690 | (11,976 | ) | 111,714 | |||||||||||||||||||||||||
| Barclays Bank plc | Credit Default Index Swaption (European); Swap Terms: Paid: Protection on iTraxx Europe Crossover Series 18 Version 1; Received: 5%; Termination Date: 12/20/17 | Index Credit Default Swap; Pay Floating | 43,995 | EUR | 6/20/13 | 393,582 | (518,661 | ) | (125,079 | ) | ||||||||||||||||||||||||
| 517,272 | (530,637 | ) | (13,365 | ) | ||||||||||||||||||||||||||||||
| OPPENHEIMER INTERNATIONAL BOND FUND | 49 |
STATEMENT OF INVESTMENTS Unaudited / Continued
Footnotes to Statement of Investments Continued
| As of March 28, 2013, the Fund had entered into the following written swaption contracts: Continued | ||||||||||||||||||||||||||||||||||
| Reference Entity / Swaption Counterparty |
Swaption Description |
Underlying Swap Type from Fund Perspective |
Notional Amount (000’s) |
Expiration Date |
Premium Received |
Value | Unrealized Appreciation (Depreciation) | |||||||||||||||||||||||||||
| iTraxx Europe Senior Financials Series 18 Version 1 |
||||||||||||||||||||||||||||||||||
| Bank of America NA | Credit Default Index Swaption (European); Swap Terms: Paid: 1%; Received: Protection on iTraxx Europe Senior Financials Series 18 Version 1; Termination Date: 12/20/17 | Index Credit Default Swap; Pay Fixed | 87,995 | EUR | 6/20/13 | $ | 350,509 | $ | (113,271 | ) | $ | 237,238 | ||||||||||||||||||||||
| iTraxx Europe Senior Financials Series 19 Version 1: |
||||||||||||||||||||||||||||||||||
| JPMorgan Chase Bank NA | Credit Default Index Swaption (European); Swap Terms: Paid: Protection on iTraxx Europe Senior Financials Series 19 Version 1; Received: 1%; Termination Date: 6/20/18 | Index Credit Default Swap; Pay Floating | 87,970 | EUR | 4/18/13 | 542,725 | (1,505,815 | ) | (963,090 | ) | ||||||||||||||||||||||||
| JPMorgan Chase Bank NA | Credit Default Index Swaption (European); Swap Terms: Paid: Protection on iTraxx Europe Senior Financials Series 19 Version 1; Received: 1%; Termination Date: 6/20/18 | Index Credit Default Swap; Pay Floating | 46,985 | EUR | 4/18/13 | 339,836 | (438,188 | ) | (98,352 | ) | ||||||||||||||||||||||||
| 882,561 | (1,944,003 | ) | (1,061,442 | ) | ||||||||||||||||||||||||||||||
| MXN TIIE BANXICO: | ||||||||||||||||||||||||||||||||||
| Bank of America NA | Interest Rate Swaption (European); Swap Terms: Paid: MXN TIIE BANXICO; Received: 6.06%; Termination Date: 1/2/24 | Interest Rate Swap; Pay Floating | 219,685 | MXN | 1/14/14 | 636,801 | (405,371 | ) | 231,430 | |||||||||||||||||||||||||
| Bank of America NA | Interest Rate Swaption (European); Swap Terms: Paid: MXN TIIE BANXICO; Received: 6.165%; Termination Date: 12/25/23 | Interest Rate Swap; Pay Floating | 250,000 | MXN | 1/6/14 | 761,399 | (384,351 | ) | 377,048 | |||||||||||||||||||||||||
| JPMorgan Chase Bank NA | Interest Rate Swaption (European); Swap Terms: Paid: MXN TIIE BANXICO; Received: 6.105%; Termination Date: 1/1/24 | Interest Rate Swap; Pay Floating | 250,000 | MXN | 1/13/14 | 731,454 | (425,342 | ) | 306,112 | |||||||||||||||||||||||||
| 2,129,654 | (1,215,064 | ) | 914,590 | |||||||||||||||||||||||||||||||
| 50 | OPPENHEIMER INTERNATIONAL BOND FUND |
| As of March 28, 2013, the Fund had entered into the following written swaption contracts: Continued | ||||||||||||||||||||||||||
| Reference Entity / Swaption Counterparty |
Swaption Description |
Underlying Swap Type from Fund Perspective |
Notional Amount (000’s) |
Expiration Date |
Premium Received |
Value | Unrealized Appreciation (Depreciation) |
|||||||||||||||||||
| Six-Month EUR EURIBOR: | ||||||||||||||||||||||||||
| Bank of America NA | Interest Rate Swaption (European); Swap Terms: Paid: 2.86%; Received: Six-Month EUR EURIBOR; Termination Date: 4/18/23 | Interest Rate Swap; Pay Fixed | 78,450 | EUR | 4/19/13 | $ | 1,128,128 | $ | (1,578,477 | ) | $ | (450,349 | ) | |||||||||||||
| Barclays Bank plc | Interest Rate Swaption (European); Swap Terms: Paid: 2.91%; Received: Six-Month EUR EURIBOR; Termination Date: 4/19/23 | Interest Rate Swap; Pay Fixed | 130,750 | EUR | 4/18/13 | 1,818,641 | (2,992,914 | ) | (1,174,273 | ) | ||||||||||||||||
| Goldman Sachs Bank USA | Interest Rate Swaption (European); Swap Terms: Paid: 2.919%; Received: Six-Month EUR EURIBOR; Termination Date: 4/19/43 | Interest Rate Swap; Pay Fixed | 78,450 | EUR | 4/18/13 | 3,361,055 | (1,758,922 | ) | 1,602,133 | |||||||||||||||||
| UBS AG | Interest Rate Swaption (European); Swap Terms: Paid: 2.71%; Received: Six-Month EUR EURIBOR; Termination Date: 2/5/23 | Interest Rate Swap; Pay Fixed | 118,760 | EUR | 1/30/18 | 4,840,695 | (5,624,967 | ) | (784,272 | ) | ||||||||||||||||
| UBS AG | Interest Rate Swaption (European); Swap Terms: Paid: 2.90%; Received: Six-Month EUR EURIBOR; Termination Date: 1/26/27 | Interest Rate Swap; Pay Fixed | 87,970 | EUR | 1/25/17 | 5,886,648 | (7,537,172 | ) | (1,650,524 | ) | ||||||||||||||||
| Total where Fund pays a fixed rate | 17,035,167 | (19,492,452 | ) | (2,457,285 | ) | |||||||||||||||||||||
| Barclays Bank plc | Interest Rate Swaption (European); Swap Terms: Paid: Six-Month EUR EURIBOR; Received: 1.265%; Termination Date: 1/14/17 | Interest Rate Swap; Pay Floating | 98,820 | EUR | 1/13/15 | 563,092 | (504,264 | ) | 58,828 | |||||||||||||||||
| Goldman Sachs International | Interest Rate Swaption (European); Swap Terms: Paid: Six-Month EUR EURIBOR; Received: 2.677%; Termination Date: 8/29/43 | Interest Rate Swap; Pay Floating | 26,145 | EUR | 8/28/13 | 843,585 | (508,998 | ) | 334,587 | |||||||||||||||||
| OPPENHEIMER INTERNATIONAL BOND FUND | 51 |
STATEMENT OF INVESTMENTS Unaudited / Continued
Footnotes to Statement of Investments Continued
| As of March 28, 2013, the Fund had entered into the following written swaption contracts: Continued | ||||||||||||||||||||||||||
| Reference Entity / Swaption Counterparty |
Swaption Description |
Underlying Swap Type from Fund Perspective |
Notional Amount (000’s) |
Expiration Date |
Premium Received |
Value | Unrealized Appreciation (Depreciation) |
|||||||||||||||||||
| Six-Month EUR EURIBOR: Continued | ||||||||||||||||||||||||||
| UBS AG | Interest Rate Swaption (European); Swap Terms: Paid: Six-Month EUR EURIBOR; Received: 2.62%; Termination Date: 9/23/20 | Interest Rate Swap; Pay Floating | 440,000 | EUR | 9/22/15 | $ | 9,898,843 | $ | (5,379,986 | ) | $ | 4,518,857 | ||||||||||||||
| Total where Fund pays a floating rate | 11,305,520 | (6,393,248 | ) | 4,912,272 | ||||||||||||||||||||||
| Total | 28,340,687 | (25,885,700 | ) | 2,454,987 | ||||||||||||||||||||||
| Six-Month GBP BBA LIBOR: | ||||||||||||||||||||||||||
| Barclays Bank plc | Interest Rate Swaption (European); Swap Terms: Paid: 1.85%; Received; Six-Month GBP BBA LIBOR; Termination Date: 8/27/23 | Interest Rate Swap; Pay Fixed | 100,000 | GBP | 8/28/13 | 1,212,875 | (1,322,472 | ) | (109,597 | ) | ||||||||||||||||
| Barclays Bank plc | Interest Rate Swaption (European); Swap Terms: Paid: 1.097%; Received; Six-Month GBP BBA LIBOR; Termination Date: 2/27/17 | Interest Rate Swap; Pay Fixed | 175,885 | GBP | 3/2/15 | 1,919,938 | (2,109,852 | ) | (189,914 | ) | ||||||||||||||||
| Barclays Bank plc | Interest Rate Swaption (European); Swap Terms: Paid: 2.935%; Received; Six-Month GBP BBA LIBOR; Termination Date: 1/14/44 | Interest Rate Swap; Pay Fixed | 141,005 | GBP | 1/15/14 | 4,678,363 | (7,126,415 | ) | (2,448,052 | ) | ||||||||||||||||
| Barclays Bank plc | Interest Rate Swaption (European); Swap Terms: Paid: 3.685%; Received; Six-Month GBP BBA LIBOR; Termination Date: 1/14/44 | Interest Rate Swap; Pay Fixed | 141,005 | GBP | 1/15/14 | 4,487,841 | (3,223,237 | ) | 1,264,604 | |||||||||||||||||
| UBS AG | Interest Rate Swaption (European); Swap Terms: Paid: 3.03%; Received: Six-Month GBP BBA LIBOR; Termination Date: 8/27/33 | Interest Rate Swap; Pay Fixed | 43,995 | GBP | 8/28/13 | 1,886,021 | (3,114,819 | ) | (1,228,798 | ) | ||||||||||||||||
| Total where Fund pays a fixed rate | 14,185,038 | (16,896,795 | ) | (2,711,757 | ) | |||||||||||||||||||||
| 52 | OPPENHEIMER INTERNATIONAL BOND FUND |
| As of March 28, 2013, the Fund had entered into the following written swaption contracts: Continued | ||||||||||||||||||||||||||
| Reference Entity / Swaption Counterparty |
Swaption Description |
Underlying Swap Type from Fund Perspective |
Notional Amount (000’s) |
Expiration Date |
Premium Received |
Value | Unrealized Appreciation (Depreciation) |
|||||||||||||||||||
| Six-Month GBP BBA LIBOR: Continued | ||||||||||||||||||||||||||
| Barclays Bank plc | Interest Rate Swaption (European); Swap Terms: Paid: Six-Month GBP BBA LIBOR; Received: 3.1725%; Termination Date: 5/28/43 | Interest Rate Swap; Pay Floating | 75,000 | GBP | 5/29/13 | $ | 3,063,030 | $ | (999,556 | ) | $ | 2,063,474 | ||||||||||||||
| Barclays Bank plc | Interest Rate Swaption (European); Swap Terms: Paid: Six-Month GBP BBA LIBOR; Received; Received: 2.295%; Termination Date: 1/25/21 | Interest Rate Swap; Pay Floating | 158,255 | GBP | 1/26/16 | 5,917,080 | (4,409,289 | ) | 1,507,791 | |||||||||||||||||
| Goldman Sachs Bank USA | Interest Rate Swaption (European); Swap Terms: Paid: Six-Month GBP BBA LIBOR; Received: 2.055%; Termination Date: 12/4/20 | Interest Rate Swap; Pay Floating | 166,905 | GBP | 12/7/15 | 6,294,832 | (5,135,836 | ) | 1,158,996 | |||||||||||||||||
| Total where Fund pays a floating rate | 15,274,942 | (10,544,681 | ) | 4,730,261 | ||||||||||||||||||||||
| Total | 29,459,980 | (27,441,476 | ) | 2,018,504 | ||||||||||||||||||||||
| Three-Month CAD BA CDOR | ||||||||||||||||||||||||||
| Bank of America NA | Interest Rate Swaption (European); Swap Terms: Paid: Three-Month CAD BA CDOR; Received: 1.7925%; Termination Date: 12/15/16 | Interest Rate Swap; Pay Floating | 200,000 | CAD | 12/16/14 | 1,338,132 | (776,512 | ) | 561,620 | |||||||||||||||||
| Three-Month USD BBA LIBOR: | ||||||||||||||||||||||||||
| Bank of America NA | Interest Rate Swaption (European); Swap Terms: Paid: 2.645%; Received: Three-Month USD BBA LIBOR; Termination Date: 12/6/22 | Interest Rate Swap; Pay Fixed | 100,000 | 12/5/17 | 3,542,500 | (2,530,655 | ) | 1,011,845 | ||||||||||||||||||
| Barclays Bank plc | Interest Rate Swaption (European); Swap Terms: Paid: 2.785%; Received: Three-Month USD BBA LIBOR; Termination Date: 2/3/34 | Interest Rate Swap; Pay Fixed | 70,050 | 1/31/14 | 2,227,590 | (2,137,541 | ) | 90,049 | ||||||||||||||||||
| OPPENHEIMER INTERNATIONAL BOND FUND | 53 |
STATEMENT OF INVESTMENTS Unaudited / Continued
Footnotes to Statement of Investments Continued
| As of March 28, 2013, the Fund had entered into the following written swaption contracts: Continued | ||||||||||||||||||||||||||
| Reference Entity / Swaption Counterparty |
Swaption Description |
Underlying Swap Type from Fund Perspective |
Notional Amount (000’s) |
Expiration Date |
Premium Received |
Value | Unrealized Appreciation (Depreciation) |
|||||||||||||||||||
| Three-Month USD BBA LIBOR: Continued | ||||||||||||||||||||||||||
| Barclays Bank plc | Interest Rate Swaption (European); Swap Terms: Paid: 1.95%; Received; Three-Month USD BBA LIBOR; Termination Date: 4/23/23 | Interest Rate Swap; Pay Fixed | 50,000 | 4/22/13 | $ | 177,500 | $ | (146,315 | ) | $ | 31,185 | |||||||||||||||
| Barclays Bank plc | Interest Rate Swaption (European); Swap Terms: Paid: 2.83%; Received: Three-Month USD BBA LIBOR; Termination Date: 6/24/43 | Interest Rate Swap; Pay Fixed | 43,985 | 6/21/13 | 523,422 | (534,508 | ) | (11,086 | ) | |||||||||||||||||
| Goldman Sachs Bank USA | Interest Rate Swaption (European); Swap Terms: Paid: 0.7925%; Received: Three-Month USD BBA LIBOR; Termination Date: 7/29/16 | Interest Rate Swap; Pay Fixed | 260,960 | 7/26/13 | 156,576 | (211,761 | ) | (55,185 | ) | |||||||||||||||||
| JPMorgan Chase Bank NA | Interest Rate Swaption (European); Swap Terms: Paid: 1.984%; Received: Three-Month USD BBA LIBOR; Termination Date: 9/24/23 | Interest Rate Swap; Pay Fixed | 187,970 | 9/23/13 | 1,851,505 | (1,910,252 | ) | (58,747 | ) | |||||||||||||||||
| UBS AG | Interest Rate Swaption (European); Swap Terms: Paid: 1.955%; Received: Three-Month USD BBA LIBOR; Termination Date: 4/23/23 | Interest Rate Swap; Pay Fixed | 50,000 | 4/22/13 | 172,500 | (167,583 | ) | 4,917 | ||||||||||||||||||
| Total where Fund pays a fixed rate | 8,651,593 | (7,638,615 | ) | 1,012,978 | ||||||||||||||||||||||
| Bank of America NA | Interest Rate Swaption (European); Swap Terms: Paid: Three-Month USD BBA LIBOR; Received: 1.3175%; Termination Date: 11/25/18 | Interest Rate Swap; Pay Floating | 410,000 | 11/22/13 | 4,202,500 | (3,162,119 | ) | 1,040,381 | ||||||||||||||||||
| Bank of America NA | Interest Rate Swaption (European); Swap Terms: Paid: Three-Month USD BBA LIBOR; Received: 3.804%; Termination Date: 11/25/43 | Interest Rate Swap; Pay Floating | 100,000 | 11/22/13 | 1,412,500 | (849,255 | ) | 563,245 | ||||||||||||||||||
| 54 | OPPENHEIMER INTERNATIONAL BOND FUND |
| As of March 28, 2013, the Fund had entered into the following written swaption contracts: Continued | ||||||||||||||||||||||||||||||||||
| Reference Entity / Swaption Counterparty |
Swaption Description |
Underlying Swap Type from Fund Perspective |
Notional Amount (000’s) |
Expiration Date |
Premium Received |
Value | Unrealized Appreciation (Depreciation) | |||||||||||||||||||||||||||
| Three-Month USD BBA LIBOR: Continued | ||||||||||||||||||||||||||||||||||
| Bank of America NA | Interest Rate Swaption (European); Swap Terms: Paid: Three-Month USD BBA LIBOR; Received: 2.51%; Termination Date: 3/10/24 | Interest Rate Swap; Pay Floating | 104,880 | 3/7/14 | $ | 3,044,142 | $ | (2,219,010 | ) | $ | 825,132 | |||||||||||||||||||||||
| Barclays Bank plc | Interest Rate Swaption (European); Swap Terms: Paid: Three-Month USD BBA LIBOR; Received: 2.6775%; Termination Date: 12/16/25 | Interest Rate Swap; Pay Floating | 52,065 | 12/15/15 | 2,673,538 | (3,149,116 | ) | (475,578 | ) | |||||||||||||||||||||||||
| Barclays Bank plc | Interest Rate Swaption (European); Swap Terms: Paid: Three-Month USD BBA LIBOR; Received: 2.005%; Termination Date: 1/12/18 | Interest Rate Swap; Pay Floating | 130,115 | 1/11/16 | 808,339 | (968,004 | ) | (159,665 | ) | |||||||||||||||||||||||||
| Barclays Bank plc | Interest Rate Swaption (European); Swap Terms: Paid: Three-Month USD BBA LIBOR; Received: 2.255%; Termination Date: 4/22/23 | Interest Rate Swap; Pay Floating | 50,000 | 4/19/13 | 195,000 | (33,552 | ) | 161,448 | ||||||||||||||||||||||||||
| Barclays Bank plc | Interest Rate Swaption (European); Swap Terms: Paid: Three- Month USD BBA LIBOR; Received: 3.10%; Termination Date: 4/27/22 | Interest Rate Swap; Pay Floating | 310,270 | 4/26/17 | 8,035,993 | (8,978,168 | ) | (942,175 | ) | |||||||||||||||||||||||||
| Barclays Bank plc | Interest Rate Swaption (European); Swap Terms: Paid: Three-Month USD BBA LIBOR; Received: 3.165%; Termination Date: 11/9/22 | Interest Rate Swap; Pay Floating | 250,000 | 11/8/17 | 6,725,000 | (8,403,749 | ) | (1,678,749 | ) | |||||||||||||||||||||||||
| Goldman Sachs Bank USA | Interest Rate Swaption (European); Swap Terms: Paid: Three-Month USD BBA LIBOR; Received: 2.701%; Termination Date: 11/24/22 | Interest Rate Swap; Pay Floating | 125,000 | 11/22/17 | 4,618,750 | (5,392,225 | ) | (773,475 | ) | |||||||||||||||||||||||||
| OPPENHEIMER INTERNATIONAL BOND FUND | 55 |
STATEMENT OF INVESTMENTS Unaudited / Continued
Footnotes to Statement of Investments Continued
| As of March 28, 2013, the Fund had entered into the following written swaption contracts: Continued | ||||||||||||||||||||||||||
| Reference Entity / Swaption Counterparty |
Swaption Description |
Underlying Swap Type from Fund Perspective |
Notional Amount (000’s) |
Expiration Date |
Premium Received |
Value | Unrealized Appreciation (Depreciation) |
|||||||||||||||||||
| Three-Month USD BBA LIBOR: Continued | ||||||||||||||||||||||||||
| Goldman Sachs Bank USA | Interest Rate Swaption (European); Swap Terms: Paid: Three-Month USD BBA LIBOR; Received: 2.95%; Termination Date: 2/21/24 | Interest Rate Swap; Pay Floating | $ | 209,280 | 2/20/14 | $ | 2,929,920 | $ | (2,001,389 | ) | $ | 928,531 | ||||||||||||||
| JPMorgan Chase Bank NA | Interest Rate Swaption (European); Swap Terms: Paid: Three-Month USD BBA LIBOR; Received: 2.38%; Termination Date: 5/3/23 | Interest Rate Swap; Pay Floating | 78,355 | 5/2/13 | 438,788 | (45,319 | ) | 393,469 | ||||||||||||||||||
| JPMorgan Chase Bank NA | Interest Rate Swaption (European); Swap Terms: Paid: Three-Month USD BBA LIBOR; Received: 1.685%; Termination Date: 8/29/18 | Interest Rate Swap; Pay Floating | 130,780 | 8/28/13 | 308,641 | (193,548 | ) | 115,093 | ||||||||||||||||||
| Total where Fund pays a floating rate | 35,393,111 | (35,395,454 | ) | (2,343 | ) | |||||||||||||||||||||
| Total | 44,044,704 | (43,034,069 | ) | 1,010,635 | ||||||||||||||||||||||
| Total Written Swaptions | $ | 108,418,499 | $ | (101,365,667 | ) | $ | 7,052,832 | |||||||||||||||||||
Notional amount is reported in U.S. Dollars (USD), except for those denoted in the following currencies:
| CAD | Canadian Dollar | |
| EUR | Euro | |
| GBP | British Pound Sterling | |
| MXN | Mexican Peso |
Abbreviations/Definitions are as follows:
| BANXICO | Banco de Mexico | |
| BBA LIBOR | British Bankers’ Association London-Interbank Offered Rate | |
| BA CDOR | Canada Bankers Acceptances Deposit Offering Rate | |
| CDX NA HY 19 | Markit CDX North American High Yield | |
| CDX NA IG 19 | Markit CDX North American Investment Grade High Volatility | |
| EURIBOR | Euro Interbank Offered Rate | |
| iTraxx Europe Crossover Series 18 Version 1 | Credit Default Swap Trading Index for a Specific Basket of Securities | |
| iTraxx Europe Senior Financials Series 18 Version 1 | Credit Default Swap Trading Index for a Specific Basket of Securities | |
| iTraxx Europe Senior Financials Series 19 Version 1 | Credit Default Swap Trading Index for a Specific Basket of Securities | |
| TIIE | Interbank Equilibrium Interest Rate |
See accompanying Notes to Financial Statements.
| 56 | OPPENHEIMER INTERNATIONAL BOND FUND |
STATEMENT OF ASSETS AND LIABILITIES March 28, 20131 (Unaudited)
| Assets | ||||
| Investments, at value—see accompanying statement of investments: | ||||
| Unaffiliated companies (cost $12,484,597,539) | $ | 12,607,309,058 | ||
| Affiliated companies (cost $340,194,120) | |
340,194,120 |
| |
| 12,947,503,178 | ||||
| Cash | 61,558,908 | |||
| Cash—foreign currencies (cost $8,453,718) | 8,459,887 | |||
| Unrealized appreciation on foreign currency exchange contracts | 143,375,098 | |||
| Appreciated swaps, at value (net upfront payments paid $16,296,873) | 20,255,456 | |||
| Depreciated swaps, at value (upfront payments paid $14,172,088) | 13,544,965 | |||
| Receivables and other assets: | ||||
| Interest, dividends and principal paydowns | 170,017,045 | |||
| Investments sold (including $11,410,223 sold on a when-issued or delayed delivery basis) | 84,691,785 | |||
| Shares of beneficial interest sold | 21,986,785 | |||
| Closed foreign currency contracts | 18,053,803 | |||
| Futures margins | 536,101 | |||
| Other | |
3,119,758 |
| |
| Total assets | 13,493,102,769 | |||
| Liabilities | ||||
| Appreciated options written, at value (premiums received $16,427,078) | 8,819,142 | |||
| Depreciated options written, at value (premiums received $24,038,310) | 33,756,212 | |||
| Appreciated swaptions written, at value (premiums received $58,377,924) | 37,948,132 | |||
| Depreciated swaptions written, at value (premiums received $50,040,575) | 63,417,535 | |||
| Unrealized depreciation on foreign currency exchange contracts | 118,383,152 | |||
| Appreciated swaps, at value (upfront payments received $10,169,113) | 8,899,118 | |||
| Depreciated swaps, at value (net upfront payments received $3,307,179) | 8,553,543 | |||
| Payables and other liabilities: | ||||
| Investments purchased (including $100,779,944 purchased on a when-issued or delayed delivery basis) | 182,393,345 | |||
| Closed foreign currency contracts | 48,468,619 | |||
| Shares of beneficial interest redeemed | 41,085,298 | |||
| Dividends | 5,751,597 | |||
| Foreign capital gains tax | 5,622,945 | |||
| Futures margins | 3,067,300 | |||
| Transfer and shareholder servicing agent fees | 2,130,043 | |||
| Distribution and service plan fees | 1,572,860 | |||
| Shareholder communications | 1,228,058 | |||
| Trustees’ compensation | 175,386 | |||
| Other | |
642,329 |
| |
| Total liabilities | 571,914,614 | |||
| Net Assets | $ |
12,921,188,155 |
| |
| OPPENHEIMER INTERNATIONAL BOND FUND | 57 |
STATEMENT OF ASSETS AND LIABILITIES Unaudited / Continued
| Composition of Net Assets | ||||
| Par value of shares of beneficial interest | $ | 1,987,570 | ||
| Additional paid-in capital | 12,546,065,757 | |||
| Accumulated net investment income | 2,908,027 | |||
| Accumulated net realized gain on investments and foreign currency transactions | 226,110,147 | |||
| Net unrealized appreciation on investments and translation of assets and liabilities denominated in foreign currencies | |
144,116,654 |
| |
| Net Assets | $ |
12,921,188,155 |
| |
| Net Asset Value Per Share | ||||
| Class A Shares: | ||||
| Net asset value and redemption price per share (based on net assets of $5,789,023,007 and 889,875,056 shares of beneficial interest outstanding) | $6.51 | |||
| Maximum offering price per share (net asset value plus sales charge of 4.75% of offering price) | $6.83 | |||
| Class B Shares: | ||||
| Net asset value, redemption price (excludes applicable contingent deferred sales charge) and offering price per share (based on net assets of $171,271,161 and 26,427,642 shares of beneficial interest outstanding) | $6.48 | |||
| Class C Shares: | ||||
| Net asset value, redemption price (excludes applicable contingent deferred sales charge) and offering price per share (based on net assets of $1,571,134,268 and 242,398,442 shares of beneficial interest outstanding) | $6.48 | |||
| Class I Shares: | ||||
| Net asset value, redemption price and offering price per share (based on net assets of $73,611,577 and 11,325,722 shares of beneficial interest outstanding) | $6.50 | |||
| Class N Shares: | ||||
| Net asset value, redemption price (excludes applicable contingent deferred sales charge) and offering price per share (based on net assets of $296,001,593 and 45,633,564 shares of beneficial interest outstanding) | $6.49 | |||
| Class Y Shares: | ||||
| Net asset value, redemption price and offering price per share (based on net assets of $5,020,146,549 and 771,909,444 shares of beneficial interest outstanding) | $6.50 | |||
1. March 28, 2013 represents the last business day of the Fund’s semiannual period. See Note 1 of the accompanying Notes.
See accompanying Notes to Financial Statements.
| 58 | OPPENHEIMER INTERNATIONAL BOND FUND |
STATEMENT OF OPERATIONS For the Six Months Ended March 28, 20131 (Unaudited)
| Investment Income | ||||
| Interest | $ | 304,622,204 | ||
| Dividends from affiliated companies | |
278,577 |
| |
| Total investment income | 304,900,781 | |||
| Expenses | ||||
| Management fees | 32,142,696 | |||
| Distribution and service plan fees: | ||||
| Class A | 7,252,674 | |||
| Class B | 913,427 | |||
| Class C | 7,979,788 | |||
| Class N | 763,022 | |||
| Transfer and shareholder servicing agent fees: | ||||
| Class A | 6,150,914 | |||
| Class B | 255,950 | |||
| Class C | 1,125,121 | |||
| Class I | 3,888 | |||
| Class N | 674,096 | |||
| Class Y | 4,642,910 | |||
| Shareholder communications: | ||||
| Class A | 529,091 | |||
| Class B | 37,099 | |||
| Class C | 134,006 | |||
| Class I | 35 | |||
| Class N | 14,801 | |||
| Class Y | 399,134 | |||
| Custodian fees and expenses | 1,110,034 | |||
| Trustees’ compensation | 152,199 | |||
| Other | |
296,166 |
| |
| Total expenses | 64,577,051 | |||
| Less waivers and reimbursements of expenses | |
(215,639 |
) | |
| Net expenses | 64,361,412 | |||
| Net Investment Income | 240,539,369 | |||
| OPPENHEIMER INTERNATIONAL BOND FUND | 59 |
STATEMENT OF OPERATIONS Unaudited / Continued
| Realized and Unrealized Gain (Loss) | ||||
| Net realized gain (loss) on: | ||||
| Investments from unaffiliated companies (including premiums on options and swaptions exercised) | $ | 154,625,666 | ||
| Closing and expiration of option contracts written | 69,280,915 | |||
| Closing and expiration of swaption contracts written | 46,660,920 | |||
| Closing and expiration of futures contracts | 27,631,259 | |||
| Foreign currency transactions | (49,181,277 | ) | ||
| Swap contracts | |
(22,577,948 |
) | |
| Net realized gain | 226,439,535 | |||
| Net change in unrealized appreciation/depreciation on: | ||||
| Investments | 20,617,253 | |||
| Translation of assets and liabilities denominated in foreign currencies | (214,953,558 | ) | ||
| Futures contracts | (1,081,794 | ) | ||
| Option contracts written | (21,929,816 | ) | ||
| Swaption contracts written | (1,276,500 | ) | ||
| Swap contracts | |
8,732,893 |
| |
| Net change in unrealized appreciation/depreciation | (209,891,522 | ) | ||
| Net Increase in Net Assets Resulting from Operations | $ |
257,087,382 |
| |
1. March 28, 2013 represents the last business day of the Fund’s semiannual period. See Note 1 of the accompanying Notes.
See accompanying Notes to Financial Statements.
| 60 | OPPENHEIMER INTERNATIONAL BOND FUND |
STATEMENTS OF CHANGES IN NET ASSETS
| Six Months Ended March 28, 20131 (Unaudited) |
Year Ended September 28, 20121 |
|||||||
| Operations | ||||||||
| Net investment income | $ | 240,539,369 | $ | 489,386,565 | ||||
| Net realized gain | 226,439,535 | 39,823,300 | ||||||
| Net change in unrealized appreciation/depreciation | |
(209,891,522 |
) |
|
601,244,919 |
| ||
| Net increase in net assets resulting from operations | 257,087,382 | 1,130,454,784 | ||||||
| Dividends and/or Distributions to Shareholders | ||||||||
| Dividends from net investment income: | ||||||||
| Class A | (109,769,204 | ) | (319,029,375 | ) | ||||
| Class B | (2,666,985 | ) | (9,346,345 | ) | ||||
| Class C | (24,598,443 | ) | (76,041,583 | ) | ||||
| Class I | (554,223 | ) | (10,813 | ) | ||||
| Class N | (5,057,118 | ) | (15,305,409 | ) | ||||
| Class Y | |
(97,896,905 |
) |
|
(243,652,704 |
) | ||
| (240,542,878 | ) | (663,386,229 | ) | |||||
| Distributions from net realized gain: | ||||||||
| Class A | (35,431,127 | ) | — | |||||
| Class B | (1,125,675 | ) | — | |||||
| Class C | (9,753,509 | ) | — | |||||
| Class I | (202,424 | ) | — | |||||
| Class N | (1,870,287 | ) | — | |||||
| Class Y | |
(29,569,939 |
) |
|
— |
| ||
| (77,952,961 | ) | — | ||||||
| Beneficial Interest Transactions | ||||||||
| Net increase (decrease) in net assets resulting from beneficial interest transactions: | ||||||||
| Class A | (70,515,794 | ) | (714,539,449 | ) | ||||
| Class B | (22,000,931 | ) | (40,258,973 | ) | ||||
| Class C | (35,831,013 | ) | (171,620,269 | ) | ||||
| Class I | 73,591,024 | 824,893 | ||||||
| Class N | (17,506,432 | ) | (18,961,583 | ) | ||||
| Class Y | |
308,542,162 |
|
|
484,085,543 |
| ||
| 236,279,016 | (460,469,838 | ) | ||||||
| Net Assets | ||||||||
| Total increase | 174,870,559 | 6,598,717 | ||||||
| Beginning of period | |
12,746,317,596 |
|
|
12,739,718,879 |
| ||
| End of period (including accumulated net investment income of $2,908,027 and $2,911,536, respectively) |
$ |
12,921,188,155 |
|
$ |
12,746,317,596 |
| ||
1. March 28, 2013 and September 28, 2012 represent the last business days of the Fund’s respective reporting periods. See Note 1 of the accompanying Notes.
See accompanying Notes to Financial Statements.
| OPPENHEIMER INTERNATIONAL BOND FUND | 61 |
| Six Months Ended 20131 |
Year Ended September 28, |
Year Ended September 30, |
Year Ended September 30, |
Year Ended September 30, |
Year Ended September 30, |
|||||||||||||||||||
| Class A | (Unaudited) | 20121 | 2011 | 2010 | 2009 | 2008 | ||||||||||||||||||
| Per Share Operating Data | ||||||||||||||||||||||||
| Net asset value, beginning of period | $ | 6.54 | $ | 6.29 | $ | 6.80 | $ | 6.54 | $ | 5.96 | $ | 6.41 | ||||||||||||
| Income (loss) from investment operations: | ||||||||||||||||||||||||
| Net investment income2 | .12 | .25 | .25 | .26 | .22 | .26 | ||||||||||||||||||
| Net realized and unrealized gain (loss) | |
.01 |
|
|
.33 |
|
|
(.44 |
) |
|
.31 |
|
|
.74 |
|
|
(.23 |
) | ||||||
| Total from investment operations | .13 | .58 | (.19 | ) | .57 | .96 | .03 | |||||||||||||||||
| Dividends and/or distributions to shareholders: | ||||||||||||||||||||||||
| Dividends from net investment income | (.12 | ) | (.33 | ) | (.26 | ) | (.26 | ) | (.33 | ) | (.45 | ) | ||||||||||||
| Distributions from net realized gain | |
(.04 |
) |
|
— |
|
|
(.06 |
) |
|
(.05 |
) |
|
(.05 |
) |
|
(.03 |
) | ||||||
| Total dividends and/or distributions to shareholders | (.16 | ) | (.33 | ) | (.32 | ) | (.31 | ) | (.38 | ) | (.48 | ) | ||||||||||||
| Net asset value, end of period | $ |
6.51 |
|
$ |
6.54 |
|
$ |
6.29 |
|
$ |
6.80 |
|
$ |
6.54 |
|
$ |
5.96 |
| ||||||
| Total Return, at Net Asset Value3 | 2.04 | % | 9.58 | % | (2.88 | )% | 9.04 | % | 16.83 | % | (0.01 | )% | ||||||||||||
| Ratios/Supplemental Data | ||||||||||||||||||||||||
| Net assets, end of period (in thousands) | $5,789,023 | $5,886,327 | $6,382,276 | $7,406,875 | $7,268,308 | $8,241,801 | ||||||||||||||||||
| Average net assets (in thousands) | $5,859,054 | $6,013,740 | $7,004,799 | $7,345,330 | $6,632,191 | $8,331,255 | ||||||||||||||||||
| Ratios to average net assets:4 | ||||||||||||||||||||||||
| Net investment income | 3.76 | % | 3.89 | % | 3.80 | % | 4.04 | % | 3.77 | % | 4.02 | % | ||||||||||||
| Total expenses5 | 1.00 | % | 1.02 | % | 0.98 | % | 0.98 | % | 0.99 | % | 0.92 | % | ||||||||||||
| Expenses after payments, waivers and/or reimbursements and reduction to custodian expenses | 1.00 | % | 1.02 | % | 0.98 | % | 0.98 | % | 0.98 | % | 0.91 | % | ||||||||||||
| Portfolio turnover rate | 46 | % | 111 | % | 80 | % | 146 | % | 112 | % | 105 | % | ||||||||||||
1. March 28, 2013 and September 28, 2012 represent the last business days of the Fund’s respective reporting periods. See Note 1 of the accompanying Notes.
2. Per share amounts calculated based on the average shares outstanding during the period.
3. Assumes an initial investment on the business day before the first day of the fiscal period, with all dividends and distributions reinvested in additional shares on the reinvestment date, and redemption at the net asset value calculated on the last business day of the fiscal period. Sales charges are not reflected in the total returns. Total returns are not annualized for periods less than one full year. Returns do not reflect the deduction of taxes that a shareholder would pay on fund distributions or the redemption of fund shares.
4. Annualized for periods less than one full year.
5. Total expenses including indirect expenses from affiliated fund were as follows:
| Six Months Ended March 28, 2013 | 1.00 | % | ||
| Year Ended September 28, 2012 | 1.02 | % | ||
| Year Ended September 30, 2011 | 0.98 | % | ||
| Year Ended September 30, 2010 | 0.98 | % | ||
| Year Ended September 30, 2009 | 1.00 | % | ||
| Year Ended September 30, 2008 | 0.93 | % |
See accompanying Notes to Financial Statements.
| 62 | OPPENHEIMER INTERNATIONAL BOND FUND |
| Six Months Ended March 28, 20131 |
Year Ended September 28, |
Year Ended September 30, |
Year Ended September 30, |
Year Ended September 30, |
Year Ended September 30, |
|||||||||||||||||||
| Class B | (Unaudited) | 20121 | 2011 | 2010 | 2009 | 2008 | ||||||||||||||||||
| Per Share Operating Data | ||||||||||||||||||||||||
| Net asset value, beginning of period | $ | 6.51 | $ | 6.27 | $ | 6.78 | $ | 6.52 | $ | 5.94 | $ | 6.39 | ||||||||||||
| Income (loss) from investment operations: | ||||||||||||||||||||||||
| Net investment income2 | .10 | .19 | .19 | .20 | .17 | .21 | ||||||||||||||||||
| Net realized and unrealized gain (loss) | |
.01 |
|
|
.33 |
|
|
(.44 |
) |
|
.31 |
|
|
.74 |
|
|
(.24 |
) | ||||||
| Total from investment operations | .11 | .52 | (.25 | ) | .51 | .91 | (.03 | ) | ||||||||||||||||
| Dividends and/or distributions to shareholders: | ||||||||||||||||||||||||
| Dividends from net investment income | (.10 | ) | (.28 | ) | (.20 | ) | (.20 | ) | (.28 | ) | (.39 | ) | ||||||||||||
| Distributions from net realized gain | |
(.04 |
) |
|
— |
|
|
(.06 |
) |
|
(.05 |
) |
|
(.05 |
) |
|
(.03 |
) | ||||||
| Total dividends and/or distributions to shareholders | (.14 | ) | (.28 | ) | (.26 | ) | (.25 | ) | (.33 | ) | (.42 | ) | ||||||||||||
| Net asset value, end of period | $ |
6.48 |
|
$ |
6.51 |
|
$ |
6.27 |
|
$ |
6.78 |
|
$ |
6.52 |
|
$ |
5.94 |
| ||||||
| Total Return, at Net Asset Value3 | 1.61 | % | 8.50 | % | (3.74 | )% | 8.13 | % | 15.87 | % | (0.84 | )% | ||||||||||||
| Ratios/Supplemental Data | ||||||||||||||||||||||||
| Net assets, end of period (in thousands) | $171,271 | $193,955 | $226,660 | $286,029 | $284,424 | $314,676 | ||||||||||||||||||
| Average net assets (in thousands) | $183,323 | $208,830 | $257,491 | $279,115 | $269,970 | $311,097 | ||||||||||||||||||
| Ratios to average net assets:4 | ||||||||||||||||||||||||
| Net investment income | 2.92 | % | 3.02 | % | 2.93 | % | 3.18 | % | 2.89 | % | 3.19 | % | ||||||||||||
| Total expenses5 | 1.85 | % | 1.89 | % | 1.84 | % | 1.85 | % | 1.86 | % | 1.74 | % | ||||||||||||
| Expenses after payments, waivers and/or reimbursements and reduction to custodian expenses | 1.85 | % | 1.89 | % | 1.84 | % | 1.85 | % | 1.85 | % | 1.73 | % | ||||||||||||
| Portfolio turnover rate | 46 | % | 111 | % | 80 | % | 146 | % | 112 | % | 105 | % | ||||||||||||
1. March 28, 2013 and September 28, 2012 represent the last business days of the Fund’s respective reporting periods. See Note 1 of the accompanying Notes.
2. Per share amounts calculated based on the average shares outstanding during the period.
3. Assumes an initial investment on the business day before the first day of the fiscal period, with all dividends and distributions reinvested in additional shares on the reinvestment date, and redemption at the net asset value calculated on the last business day of the fiscal period. Sales charges are not reflected in the total returns. Total returns are not annualized for periods less than one full year. Returns do not reflect the deduction of taxes that a shareholder would pay on fund distributions or the redemption of fund shares.
4. Annualized for periods less than one full year.
5. Total expenses including indirect expenses from affiliated fund were as follows:
| Six Months Ended March 28, 2013 | 1.85 | % | ||
| Year Ended September 28, 2012 | 1.89 | % | ||
| Year Ended September 30, 2011 | 1.84 | % | ||
| Year Ended September 30, 2010 | 1.85 | % | ||
| Year Ended September 30, 2009 | 1.87 | % | ||
| Year Ended September 30, 2008 | 1.75 | % |
See accompanying Notes to Financial Statements.
| OPPENHEIMER INTERNATIONAL BOND FUND | 63 |
FINANCIAL HIGHLIGHTS Continued
| Six Months Ended 20131 |
Year Ended September 28, |
Year Ended September 30, |
Year Ended September 30, |
Year Ended September 30, |
Year Ended September 30, |
|||||||||||||||||||
| Class C | (Unaudited) | 20121 | 2011 | 2010 | 2009 | 2008 | ||||||||||||||||||
| Per Share Operating Data | ||||||||||||||||||||||||
| Net asset value, beginning of period | $ | 6.51 | $ | 6.27 | $ | 6.78 | $ | 6.52 | $ | 5.94 | $ | 6.39 | ||||||||||||
| Income (loss) from investment operations: | ||||||||||||||||||||||||
| Net investment income2 | .10 | .20 | .21 | .21 | .18 | .21 | ||||||||||||||||||
| Net realized and unrealized gain (loss) | |
.01 |
|
|
.33 |
|
|
(.45 |
) |
|
.31 |
|
|
.74 |
|
|
(.23 |
) | ||||||
| Total from investment operations | .11 | .53 | (.24 | ) | .52 | .92 | (.02 | ) | ||||||||||||||||
| Dividends and/or distributions to shareholders: | ||||||||||||||||||||||||
| Dividends from net investment income | (.10 | ) | (.29 | ) | (.21 | ) | (.21 | ) | (.29 | ) | (.40 | ) | ||||||||||||
| Distributions from net realized gain | |
(.04 |
) |
|
— |
|
|
(.06 |
) |
|
(.05 |
) |
|
(.05 |
) |
|
(.03 |
) | ||||||
| Total dividends and/or distributions to shareholders | (.14 | ) | (.29 | ) | (.27 | ) | (.26 | ) | (.34 | ) | (.43 | ) | ||||||||||||
| Net asset value, end of period | $ |
6.48 |
|
$ |
6.51 |
|
$ |
6.27 |
|
$ |
6.78 |
|
$ |
6.52 |
|
$ |
5.94 |
| ||||||
| Total Return, at Net Asset Value3 | 1.70 | % | 8.69 | % | (3.58 | )% | 8.29 | % | 16.04 | % | (0.74 | )% | ||||||||||||
| Ratios/Supplemental Data | ||||||||||||||||||||||||
| Net assets, end of period (in thousands) | $1,571,134 | $1,614,123 | $1,724,712 | $2,029,424 | $1,812,805 | $1,835,312 | ||||||||||||||||||
| Average net assets (in thousands) | $1,602,320 | $1,651,022 | $1,891,414 | $1,965,153 | $1,594,278 | $1,833,929 | ||||||||||||||||||
| Ratios to average net assets:4 | ||||||||||||||||||||||||
| Net investment income | 3.08 | % | 3.21 | % | 3.10 | % | 3.34 | % | 3.05 | % | 3.29 | % | ||||||||||||
| Total expenses5 | 1.68 | % | 1.71 | % | 1.68 | % | 1.69 | % | 1.71 | % | 1.64 | % | ||||||||||||
| Expenses after payments, waivers and/or reimbursements and reduction to custodian expenses | 1.68 | % | 1.71 | % | 1.68 | % | 1.69 | % | 1.70 | % | 1.63 | % | ||||||||||||
| Portfolio turnover rate | 46 | % | 111 | % | 80 | % | 146 | % | 112 | % | 105 | % | ||||||||||||
1. March 28, 2013 and September 28, 2012 represent the last business days of the Fund’s respective reporting periods. See Note 1 of the accompanying Notes.
2. Per share amounts calculated based on the average shares outstanding during the period.
3. Assumes an initial investment on the business day before the first day of the fiscal period, with all dividends and distributions reinvested in additional shares on the reinvestment date, and redemption at the net asset value calculated on the last business day of the fiscal period. Sales charges are not reflected in the total returns. Total returns are not annualized for periods less than one full year. Returns do not reflect the deduction of taxes that a shareholder would pay on fund distributions or the redemption of fund shares.
4. Annualized for periods less than one full year.
5. Total expenses including indirect expenses from affiliated fund were as follows:
| Six Months Ended March 28, 2013 | 1.68 | % | ||
| Year Ended September 28, 2012 | 1.71 | % | ||
| Year Ended September 30, 2011 | 1.68 | % | ||
| Year Ended September 30, 2010 | 1.69 | % | ||
| Year Ended September 30, 2009 | 1.72 | % | ||
| Year Ended September 30, 2008 | 1.65 | % |
See accompanying Notes to Financial Statements.
| 64 | OPPENHEIMER INTERNATIONAL BOND FUND |
| Six Months Ended March 28, 20131 |
Period Ended September 28, |
|||||||
| Class I | (Unaudited) | 20121,2 | ||||||
| Per Share Operating Data | ||||||||
| Net asset value, beginning of period | $6.53 | $6.36 | ||||||
| Income (loss) from investment operations: | ||||||||
| Net investment income3 | .14 | .18 | ||||||
| Net realized and unrealized gain | .01 | .18 | ||||||
| Total from investment operations | .15 | .36 | ||||||
| Dividends and/or distributions to shareholders: | ||||||||
| Dividends from net investment income | (.14 | ) | (.19 | ) | ||||
| Distributions from net realized gain | (.04 | ) | — | |||||
| Total dividends and/or distributions to shareholders | (.18 | ) | (.19 | ) | ||||
| Net asset value, end of period | $6.50 | $6.53 | ||||||
| Total Return, at Net Asset Value4 | 2.30 | % | 5.70 | % | ||||
| Ratios/Supplemental Data | ||||||||
| Net assets, end of period (in thousands) | $73,612 | $855 | ||||||
| Average net assets (in thousands) | $26,397 | $380 | ||||||
| Ratios to average net assets:5 | ||||||||
| Net investment income | 4.21 | % | 4.20 | % | ||||
| Total expenses6 | 0.56 | % | 0.57 | % | ||||
| Expenses after payments, waivers and/or reimbursements and reduction to custodian expenses | 0.56 | % | 0.57 | % | ||||
| Portfolio turnover rate | 46 | % | 111 | % | ||||
1. March 28, 2013 and September 28, 2012 represent the last business days of the Fund’s respective reporting periods. See Note 1 of the accompanying Notes.
2. For the period from January 27, 2012 (inception of offering) to September 28, 2012.
3. Per share amounts calculated based on the average shares outstanding during the period.
4. Assumes an initial investment on the business day before the first day of the fiscal period, with all dividends and distributions reinvested in additional shares on the reinvestment date, and redemption at the net asset value calculated on the last business day of the fiscal period. Sales charges are not reflected in the total returns. Total returns are not annualized for periods less than one full year. Returns do not reflect the deduction of taxes that a shareholder would pay on fund distributions or the redemption of fund shares.
5. Annualized for periods less than one full year.
6. Total expenses including indirect expenses from affiliated fund were as follows:
| Six Months Ended March 28, 2013 | 0.56 | % | ||
| Period Ended September 28, 2012 | 0.57 | % |
See accompanying Notes to Financial Statements.
| OPPENHEIMER INTERNATIONAL BOND FUND | 65 |
FINANCIAL HIGHLIGHTS Continued
| Six Months Ended 20131 |
Year Ended September 28, |
Year Ended September 30, |
Year Ended September 30, |
Year Ended September 30, |
Year Ended September 30, |
|||||||||||||||||||
| Class N | (Unaudited) | 20121 | 2011 | 2010 | 2009 | 2008 | ||||||||||||||||||
| Per Share Operating Data | ||||||||||||||||||||||||
| Net asset value, beginning of period | $ | 6.52 | $ | 6.28 | $ | 6.79 | $ | 6.52 | $ | 5.95 | $ | 6.40 | ||||||||||||
| Income (loss) from investment operations: | ||||||||||||||||||||||||
| Net investment income2 | .11 | .22 | .22 | .23 | .20 | .23 | ||||||||||||||||||
| Net realized and unrealized gain (loss) | |
.01 |
|
|
.33 |
|
|
(.44 |
) |
|
.32 |
|
|
.72 |
|
|
(.23 |
) | ||||||
| Total from investment operations | .12 | .55 | (.22 | ) | .55 | .92 | — | |||||||||||||||||
| Dividends and/or distributions to shareholders: | ||||||||||||||||||||||||
| Dividends from net investment income | (.11 | ) | (.31 | ) | (.23 | ) | (.23 | ) | (.30 | ) | (.42 | ) | ||||||||||||
| Distributions from net realized gain | |
(.04 |
) |
|
— |
|
|
(.06 |
) |
|
(.05 |
) |
|
(.05 |
) |
|
(.03 |
) | ||||||
| Total dividends and/or distributions to shareholders | (.15 | ) | (.31 | ) | (.29 | ) | (.28 | ) | (.35 | ) | (.45 | ) | ||||||||||||
| Net asset value, end of period | $ |
6.49 |
|
$ |
6.52 |
|
$ |
6.28 |
|
$ |
6.79 |
|
$ |
6.52 |
|
$ |
5.95 |
| ||||||
| Total Return, at Net Asset Value3 | 1.81 | % | 9.01 | % | (3.28 | )% | 8.80 | % | 16.23 | % | (0.44 | )% | ||||||||||||
| Ratios/Supplemental Data | ||||||||||||||||||||||||
| Net assets, end of period (in thousands) | $296,002 | $314,773 | $322,070 | $310,338 | $258,219 | $258,223 | ||||||||||||||||||
| Average net assets (in thousands) | $306,371 | $314,673 | $325,834 | $279,336 | $233,767 | $223,531 | ||||||||||||||||||
| Ratios to average net assets:4 | ||||||||||||||||||||||||
| Net investment income | 3.31 | % | 3.50 | % | 3.39 | % | 3.65 | % | 3.37 | % | 3.59 | % | ||||||||||||
| Total expenses5 | 1.48 | % | 1.54 | % | 1.44 | % | 1.65 | % | 1.68 | % | 1.49 | % | ||||||||||||
| Expenses after payments, waivers and/or reimbursements and reduction to custodian expenses | 1.45 | % | 1.41 | % | 1.38 | % | 1.38 | % | 1.38 | % | 1.34 | % | ||||||||||||
| Portfolio turnover rate | 46 | % | 111 | % | 80 | % | 146 | % | 112 | % | 105 | % | ||||||||||||
1. March 28, 2013 and September 28, 2012 represent the last business days of the Fund’s respective reporting periods. See Note 1 of the accompanying Notes.
2. Per share amounts calculated based on the average shares outstanding during the period.
3. Assumes an initial investment on the business day before the first day of the fiscal period, with all dividends and distributions reinvested in additional shares on the reinvestment date, and redemption at the net asset value calculated on the last business day of the fiscal period. Sales charges are not reflected in the total returns. Total returns are not annualized for periods less than one full year. Returns do not reflect the deduction of taxes that a shareholder would pay on fund distributions or the redemption of fund shares.
4. Annualized for periods less than one full year.
5. Total expenses including indirect expenses from affiliated fund were as follows:
| Six Months Ended March 28, 2013 | 1.48 | % | ||
| Year Ended September 28, 2012 | 1.54 | % | ||
| Year Ended September 30, 2011 | 1.44 | % | ||
| Year Ended September 30, 2010 | 1.65 | % | ||
| Year Ended September 30, 2009 | 1.69 | % | ||
| Year Ended September 30, 2008 | 1.50 | % |
See accompanying Notes to Financial Statements.
| 66 | OPPENHEIMER INTERNATIONAL BOND FUND |
| Six Months Ended 20131 |
Year Ended September 28, |
Year Ended September 30, |
Year Ended September 30, |
Year Ended September 30, |
Year Ended September 30, |
|||||||||||||||||||
| Class Y | (Unaudited) | 20121 | 2011 | 2010 | 2009 | 2008 | ||||||||||||||||||
| Per Share Operating Data | ||||||||||||||||||||||||
| Net asset value, beginning of period | $ | 6.53 | $ | 6.29 | $ | 6.80 | $ | 6.54 | $ | 5.96 | $ | 6.41 | ||||||||||||
| Income (loss) from investment operations: | ||||||||||||||||||||||||
| Net investment income2 | .13 | .26 | .27 | .28 | .25 | .28 | ||||||||||||||||||
| Net realized and unrealized gain (loss) | |
.01 |
|
|
.33 |
|
|
(.44 |
) |
|
.31 |
|
|
.73 |
|
|
(.23 |
) | ||||||
| Total from investment operations | .14 | .59 | (.17 | ) | .59 | .98 | .05 | |||||||||||||||||
| Dividends and/or distributions to shareholders: | ||||||||||||||||||||||||
| Dividends from net investment income | (.13 | ) | (.35 | ) | (.28 | ) | (.28 | ) | (.35 | ) | (.47 | ) | ||||||||||||
| Distributions from net realized gain | |
(.04 |
) |
|
— |
|
|
(.06 |
) |
|
(.05 |
) |
|
(.05 |
) |
|
(.03 |
) | ||||||
| Total dividends and/or distributions to shareholders | (.17 | ) | (.35 | ) | (.34 | ) | (.33 | ) | (.40 | ) | (.50 | ) | ||||||||||||
| Net asset value, end of period | $ |
6.50 |
|
$ |
6.53 |
|
$ |
6.29 |
|
$ |
6.80 |
|
$ |
6.54 |
|
$ |
5.96 |
| ||||||
| Total Return, at Net Asset Value3 | 2.17 | % | 9.71 | % | (2.64 | )% | 9.38 | % | 17.26 | % | 0.38 | % | ||||||||||||
| Ratios/Supplemental Data | ||||||||||||||||||||||||
| Net assets, end of period (in thousands) | $5,020,146 | $4,736,285 | $4,084,001 | $3,388,175 | $1,890,729 | $1,372,959 | ||||||||||||||||||
| Average net assets (in thousands) | $4,879,790 | $4,446,720 | $3,861,749 | $2,732,256 | $1,317,017 | $ 932,774 | ||||||||||||||||||
| Ratios to average net assets:4 | ||||||||||||||||||||||||
| Net investment income | 4.02 | % | 4.16 | % | 4.04 | % | 4.38 | % | 4.16 | % | 4.39 | % | ||||||||||||
| Total expenses5 | 0.73 | % | 0.75 | % | 0.74 | % | 0.67 | % | 0.62 | % | 0.55 | % | ||||||||||||
| Expenses after payments, waivers and/or reimbursements and reduction to custodian expenses | 0.73 | % | 0.75 | % | 0.73 | % | 0.67 | % | 0.61 | % | 0.54 | % | ||||||||||||
| Portfolio turnover rate | 46 | % | 111 | % | 80 | % | 146 | % | 112 | % | 105 | % | ||||||||||||
1. March 28, 2013 and September 28, 2012 represent the last business days of the Fund’s respective reporting periods. See Note 1 of the accompanying Notes.
2. Per share amounts calculated based on the average shares outstanding during the period.
3. Assumes an initial investment on the business day before the first day of the fiscal period, with all dividends and distributions reinvested in additional shares on the reinvestment date, and redemption at the net asset value calculated on the last business day of the fiscal period. Sales charges are not reflected in the total returns. Total returns are not annualized for periods less than one full year. Returns do not reflect the deduction of taxes that a shareholder would pay on fund distributions or the redemption of fund shares.
4. Annualized for periods less than one full year.
5. Total expenses including indirect expenses from affiliated fund were as follows:
| Six Months Ended March 28, 2013 | 0.73 | % | ||
| Year Ended September 28, 2012 | 0.75 | % | ||
| Year Ended September 30, 2011 | 0.74 | % | ||
| Year Ended September 30, 2010 | 0.67 | % | ||
| Year Ended September 30, 2009 | 0.63 | % | ||
| Year Ended September 30, 2008 | 0.56 | % |
See accompanying Notes to Financial Statements.
| OPPENHEIMER INTERNATIONAL BOND FUND | 67 |
NOTES TO FINANCIAL STATEMENTS March 28, 2013 / Unaudited
1. Significant Accounting Policies
Oppenheimer International Bond Fund (the “Fund”) is registered under the Investment Company Act of 1940, as amended, as a non-diversified, open-end management investment company. The Fund’s primary objective is to seek total return. The Fund’s investment adviser was OppenheimerFunds, Inc. (“OFI” or the “Sub-Adviser”), through December 31, 2012. Effective January 1, 2013, the Fund’s investment adviser is OFI Global Asset Management, Inc. (“OFI Global” or the “Manager”), a wholly-owned subsidiary of OFI. The Manager has entered into a sub-advisory agreement with OFI, as of the same effective date.
The Fund offers Class A, Class C, Class I, Class N and Class Y shares, and previously offered Class B shares for new purchase through June 29, 2012. Subsequent to that date, no new purchases of Class B shares are permitted, however reinvestment of dividend and/or capital gain distributions and exchanges of Class B shares into and from other Oppenheimer funds will be allowed. Class A shares are sold at their offering price, which is normally net asset value plus a front-end sales charge. Class C and Class N shares are sold, and Class B shares were sold, without a front-end sales charge but may be subject to a contingent deferred sales charge (“CDSC”). Class N shares are sold only through retirement plans. Retirement plans that offer Class N shares may impose charges on those accounts. Class I and Class Y shares are sold to certain institutional investors or intermediaries without either a front-end sales charge or a CDSC, however, the intermediaries may impose charges on their accountholders who beneficially own Class I and Class Y shares. All classes of shares have identical rights and voting privileges with respect to the Fund in general and exclusive voting rights on matters that affect that class alone. Earnings, net assets and net asset value per share may differ due to each class having its own expenses, such as transfer and shareholder servicing agent fees and shareholder communications, directly attributable to that class. Class A, B, C and N shares have separate distribution and/or service plans under which they pay fees. Class I and Class Y shares do not pay such fees. Class B shares will automatically convert to Class A shares 72 months after the date of purchase.
The following is a summary of significant accounting policies consistently followed by the Fund.
Semiannual and Annual Periods. The last day of the Fund’s semiannual period was the last day the New York Stock Exchange was open for trading. The Fund’s financial statements have been presented through that date to maintain consistency with the Fund’s net asset value calculations used for shareholder transactions.
The last day of the Fund’s fiscal year was the last day the New York Stock Exchange was open for trading. The Fund’s financial statements have been presented through that date to maintain consistency with the Fund’s net asset value calculations used for shareholder transactions.
Structured Securities. The Fund invests in structured securities whose market values, interest rates and/or redemption prices are linked to the performance of underlying
| 68 | OPPENHEIMER INTERNATIONAL BOND FUND |
foreign currencies, interest rate spreads, stock market indices, prices of individual securities, commodities or other financial instruments or the occurrence of other specific events. The structured securities are often leveraged, increasing the volatility of each note’s market value relative to the change in the underlying linked financial element or event. Fluctuations in value of these securities are recorded as unrealized gains and losses in the accompanying Statement of Operations. The Fund records a realized gain or loss when a structured security is sold or matures.
Securities on a When-Issued or Delayed Delivery Basis. The Fund may purchase securities on a “when-issued” basis, and may purchase or sell securities on a “delayed delivery” basis. “When-issued” or “delayed delivery” refers to securities whose terms and indenture are available and for which a market exists, but which are not available for immediate delivery. Delivery and payment for securities that have been purchased by the Fund on a when-issued basis normally takes place within six months and possibly as long as two years or more after the trade date. During this period, such securities do not earn interest, are subject to market fluctuation and may increase or decrease in value prior to their delivery. The purchase of securities on a when-issued basis may increase the volatility of the Fund’s net asset value to the extent the Fund executes such transactions while remaining substantially fully invested. When the Fund engages in when-issued or delayed delivery transactions, it relies on the buyer or seller, as the case may be, to complete the transaction. Their failure to do so may cause the Fund to lose the opportunity to obtain or dispose of the security at a price and yield it considers advantageous. The Fund may also sell securities that it purchased on a when-issued basis or forward commitment prior to settlement of the original purchase.
As of March 28, 2013, the Fund had purchased securities issued on a when-issued or delayed delivery basis and sold securities issued on a delayed delivery basis as follows:
| When-Issued or Delayed Delivery Basis Transactions |
||||
| Purchased securities | $ | 100,779,944 | ||
| Sold securities | 11,410,223 | |||
Credit Risk. The Fund invests in high-yield, non-investment-grade bonds, which may be subject to a greater degree of credit risk. Credit risk relates to the ability of the issuer to meet interest or principal payments or both as they become due. The Fund may acquire securities that have missed an interest payment, and is not obligated to dispose of securities whose issuers or underlying obligors subsequently miss an interest payment. Information concerning securities not accruing interest as of March 28, 2013 is as follows:
| Cost | $ | 71,606,973 | ||
| Market Value | $ | 8,337,564 | ||
| Market Value as a % of Net Assets | 0.06 | % |
| OPPENHEIMER INTERNATIONAL BOND FUND | 69 |
NOTES TO FINANCIAL STATEMENTS Unaudited / Continued
1. Significant Accounting Policies Continued
Investment in Oppenheimer Institutional Money Market Fund. The Fund is permitted to invest daily available cash balances in an affiliated money market fund. The Fund may invest the available cash in Class E shares of Oppenheimer Institutional Money Market Fund (“IMMF”) to seek current income while preserving liquidity. IMMF is a registered open-end management investment company, regulated as a money market fund under the Investment Company Act of 1940, as amended. The Manager is the investment adviser of IMMF, and the Sub-Adviser provides investment and related advisory services to IMMF. When applicable, the Fund’s investment in IMMF is included in the Statement of Investments. Shares of IMMF are valued at their net asset value per share. As a shareholder, the Fund is subject to its proportional share of IMMF’s Class E expenses, including its management fee. The Manager will waive fees and/or reimburse Fund expenses in an amount equal to the indirect management fees incurred through the Fund’s investment in IMMF.
Foreign Currency Translation. The Fund’s accounting records are maintained in U.S. dollars. The values of securities denominated in foreign currencies and amounts related to the purchase and sale of foreign securities and foreign investment income are translated into U.S. dollars as of the close of the Exchange, normally 4:00 P.M. Eastern time, on each day the Exchange is open for trading. Foreign exchange rates may be valued primarily using a reliable bank, dealer or service authorized by the Board of Trustees.
Reported net realized gains and losses from foreign currency transactions arise from sales of portfolio securities, sales and maturities of short-term securities, sales of foreign currencies, exchange rate fluctuations between the trade and settlement dates on securities transactions, and the difference between the amounts of dividends, interest, and foreign withholding taxes recorded on the Fund’s books and the U.S. dollar equivalent of the amounts actually received or paid. Net unrealized appreciation and depreciation on the translation of assets and liabilities denominated in foreign currencies arise from changes in the values of assets and liabilities, including investments in securities at fiscal period end, resulting from changes in exchange rates.
The effect of changes in foreign currency exchange rates on investments is separately identified from the fluctuations arising from changes in market values of securities held and reported with all other foreign currency gains and losses in the Fund’s Statement of Operations.
Allocation of Income, Expenses, Gains and Losses. Income, expenses (other than those attributable to a specific class), gains and losses are allocated on a daily basis to each class of shares based upon the relative proportion of net assets represented by such class. Operating expenses directly attributable to a specific class are charged against the operations of that class.
Federal Taxes. The Fund intends to comply with provisions of the Internal Revenue Code applicable to regulated investment companies and to distribute substantially all of its investment company taxable income, including any net realized gain on investments not offset by capital loss carryforwards, if any, to shareholders. Therefore, no federal income or
| 70 | OPPENHEIMER INTERNATIONAL BOND FUND |
excise tax provision is required. The Fund files income tax returns in U.S. federal and applicable state jurisdictions. The statute of limitations on the Fund’s tax return filings generally remain open for the three preceding fiscal reporting period ends.
During the fiscal year ended September 28, 2012, the Fund did not utilize any capital loss carryforward to offset capital gains realized in that fiscal year. The Fund had straddle losses of $109,844.
As of March 28, 2013, it is estimated that the Fund will not have any capital loss carryforward.
Net investment income (loss) and net realized gain (loss) may differ for financial statement and tax purposes. The character of dividends and distributions made during the fiscal year from net investment income or net realized gains may differ from their ultimate characterization for federal income tax purposes. Also, due to timing of dividends and distributions, the fiscal year in which amounts are distributed may differ from the fiscal year in which the income or net realized gain was recorded by the Fund.
The aggregate cost of securities and other investments and the composition of unrealized appreciation and depreciation of securities and other investments for federal income tax purposes as of March 28, 2013 are noted in the following table. The primary difference between book and tax appreciation or depreciation of securities and other investments, if applicable, is attributable to the tax deferral of losses or tax realization of financial statement unrealized gain or loss.
| Federal tax cost of securities | $ | 12,827,332,976 | ||
| Federal tax cost of other investments | (1,593,658,330 | ) | ||
| Total federal tax cost | $ | 11,233,674,646 | ||
| Gross unrealized appreciation | $ | 576,347,826 | ||
| Gross unrealized depreciation | (463,551,711 | ) | ||
| Net unrealized appreciation | $ | 112,796,115 | ||
Certain foreign countries impose a tax on capital gains which is accrued by the Fund based on unrealized appreciation, if any, on affected securities. The tax is paid when the gain is realized.
Trustees’ Compensation. The Board of Trustees has adopted a compensation deferral plan for independent trustees that enables trustees to elect to defer receipt of all or a portion of the annual compensation they are entitled to receive from the Fund. For purposes of determining the amount owed to the Trustee under the plan, deferred amounts are treated as though equal dollar amounts had been invested in shares of the Fund or in other Oppenheimer funds selected by the Trustee. The Fund purchases shares of the funds selected for deferral by the Trustee in amounts equal to his or her deemed investment, resulting in a Fund asset equal to the deferred compensation liability. Such assets are included as a component of “Other” within the asset section of the Statement of Assets and Liabilities. Deferral of trustees’ fees under the plan will not affect the net assets of the Fund, and will not materially affect the Fund’s assets, liabilities or net investment income per share. Amounts will be deferred until distributed in accordance with the compensation deferral plan.
| OPPENHEIMER INTERNATIONAL BOND FUND | 71 |
NOTES TO FINANCIAL STATEMENTS Unaudited / Continued
1. Significant Accounting Policies Continued
Dividends and Distributions to Shareholders. Dividends and distributions to shareholders, which are determined in accordance with income tax regulations and may differ from U.S. generally accepted accounting principles, are recorded on the ex-dividend date. Income distributions, if any, are declared daily and paid monthly. Capital gain distributions, if any, are declared and paid annually. The tax character of distributions is determined as of the Fund’s fiscal year end. Therefore, a portion of the Fund’s distributions made to shareholders prior to the Fund’s fiscal year end may ultimately be categorized as a tax return of capital.
Investment Income. Dividend income is recorded on the ex-dividend date or upon ex-dividend notification in the case of certain foreign dividends where the ex-dividend date may have passed. Non-cash dividends included in dividend income, if any, are recorded at the fair market value of the securities received. Interest income is recognized on an accrual basis. Discount and premium, which are included in interest income on the Statement of Operations, are amortized or accreted daily.
Custodian Fees. “Custodian fees and expenses” in the Statement of Operations may include interest expense incurred by the Fund on any cash overdrafts of its custodian account during the period. Such cash overdrafts may result from the effects of failed trades in portfolio securities and from cash outflows resulting from unanticipated shareholder redemption activity. The Fund pays interest to its custodian on such cash overdrafts, to the extent they are not offset by positive cash balances maintained by the Fund, at a rate equal to the Federal Funds Rate plus 0.50%. The “Reduction to custodian expenses” line item, if applicable, represents earnings on cash balances maintained by the Fund during the period. Such interest expense and other custodian fees may be paid with these earnings.
Security Transactions. Security transactions are recorded on the trade date. Realized gains and losses on securities sold are determined on the basis of identified cost.
Indemnifications. The Fund’s organizational documents provide current and former trustees and officers with a limited indemnification against liabilities arising in connection with the performance of their duties to the Fund. In the normal course of business, the Fund may also enter into contracts that provide general indemnifications. The Fund’s maximum exposure under these arrangements is unknown as this would be dependent on future claims that may be made against the Fund. The risk of material loss from such claims is considered remote.
Other. The preparation of financial statements in conformity with accounting principles generally accepted in the United States of America requires management to make estimates and assumptions that affect the reported amounts of assets and liabilities and disclosure of contingent assets and liabilities at the date of the financial statements and the reported amounts of increases and decreases in net assets from operations during the reporting period. Actual results could differ from those estimates.
| 72 | OPPENHEIMER INTERNATIONAL BOND FUND |
2. Securities Valuation
The Fund calculates the net asset value of its shares as of the close of the New York Stock Exchange (the “Exchange”), normally 4:00 P.M. Eastern time, on each day the Exchange is open for trading.
The Fund’s Board has adopted procedures for the valuation of the Fund’s securities and has delegated the day-to-day responsibility for valuation determinations under those procedures to the Manager. The Manager has established a Valuation Committee which is responsible for determining a “fair valuation” for any security for which market quotations are not “readily available.” The Valuation Committee’s fair valuation determinations are subject to review, approval and ratification by the Fund’s Board at its next regularly scheduled meeting covering the calendar quarter in which the fair valuation was determined.
Valuation Methods and Inputs
Securities are valued using unadjusted quoted market prices, when available, as supplied primarily by third party pricing services or dealers.
The following methodologies are used to determine the market value or the fair value of the types of securities described below:
Securities traded on a registered U.S. securities exchange (including exchange-traded derivatives other than futures and futures options) are valued based on the last sale price of the security reported on the principal exchange on which it is traded, prior to the time when the Fund’s assets are valued. In the absence of a sale, the security is valued at the last sale price on the prior trading day, if it is within the spread of the current day’s closing “bid” and “asked” prices, and if not, at the current day’s closing bid price. A security of a foreign issuer traded on a foreign exchange but not listed on a registered U.S. securities exchange is valued based on the last sale price on the principal exchange on which the security is traded, as identified by the third party pricing service used by the Manager, prior to the time when the Fund’s assets are valued. If the last sale price is unavailable, the security is valued at the most recent official closing price on the principal exchange on which it is traded. If the last sales price or official closing price for a foreign security is not available, the security is valued at the mean between the bid and asked price per the exchange or, if not available from the exchange, obtained from two dealers. If bid and asked prices are not available from either the exchange or two dealers, the security is valued by using one of the following methodologies (listed in order of priority); (1) using a bid from the exchange, (2) the mean between the bid and asked price as provided by a single dealer, or (3) a bid from a single dealer.
Shares of a registered investment company that are not traded on an exchange are valued at that investment company’s net asset value per share.
Corporate and government debt securities (of U.S. or foreign issuers) and municipal debt securities, event-linked bonds, loans, mortgage-backed securities, collateralized mortgage obligations, and asset-backed securities are valued at the mean between the “bid” and “asked” prices utilizing evaluated prices obtained from third party pricing services or broker-dealers who may use matrix pricing methods to determine the evaluated prices.
| OPPENHEIMER INTERNATIONAL BOND FUND | 73 |
NOTES TO FINANCIAL STATEMENTS Unaudited / Continued
2. Securities Valuation Continued
Short-term money market type debt securities with a remaining maturity of sixty days or less are valued at cost adjusted by the amortization of discount or premium to maturity (amortized cost), which approximates market value. Short-term debt securities with a remaining maturity in excess of sixty days are valued at the mean between the “bid” and “asked” prices utilizing evaluated prices obtained from third party pricing services or broker-dealers.
Structured securities, swaps, swaptions, and other over-the-counter derivatives are valued utilizing evaluated prices obtained from third party pricing services or broker-dealers.
Forward foreign currency exchange contracts are valued utilizing current and forward currency rates obtained from third party pricing services. When the settlement date of a contract is an interim date for which a quotation is not available, interpolated values are derived using the nearest dated forward currency rate.
Futures contracts and futures options traded on a commodities or futures exchange will be valued at the final settlement price or official closing price on the principal exchange as reported by such principal exchange at its trading session ending at, or most recently prior to, the time when the Fund’s assets are valued.
A description of the standard inputs that may generally be considered by the third party pricing vendors in determining their evaluated prices is provided below.
| Security Type | Standard inputs generally considered by third-party pricing vendors | |
| Corporate debt, government debt, municipal, mortgage-backed and asset-backed securities | Reported trade data, broker-dealer price quotations, benchmark yields, issuer spreads on comparable securities, the credit quality, yield, maturity, and other appropriate factors. | |
| Loans | Information obtained from market participants regarding reported trade data and broker-dealer price quotations. | |
| Event-linked bonds | Information obtained from market participants regarding reported trade data and broker-dealer price quotations. | |
| Structured securities | Relevant market information such as the price of underlying financial instruments, stock market indices, foreign currencies, interest rate spreads, commodities, or the occurrence of other specific events. | |
| Swaps | Relevant market information, including underlying reference assets such as credit spreads, credit event probabilities, index values, individual security values, forward interest rates, variable interest rates, volatility measures, and forward currency rates. |
If a market value or price cannot be determined for a security using the methodologies described above, or if, in the “good faith” opinion of the Manager, the market value or price obtained does not constitute a “readily available market quotation,” or a significant event has occurred that would materially affect the value of the security the security is fair valued either (i) by a standardized fair valuation methodology applicable to the security type or the significant event as previously approved by the Valuation Committee and the Fund’s Board or (ii) as determined in good faith by the Manager’s Valuation Committee. The Valuation Committee considers all relevant facts that are reasonably available, through either public information or information available to the Manager, when determining the fair value of a security. Fair value determinations by the Manager are subject to review, approval and ratification by the Fund’s Board at its next regularly scheduled meeting
| 74 | OPPENHEIMER INTERNATIONAL BOND FUND |
covering the calendar quarter in which the fair valuation was determined. Those fair valuation standardized methodologies include, but are not limited to, valuing securities at the last sale price or initially at cost and subsequently adjusting the value based on: changes in company specific fundamentals, changes in an appropriate securities index, or changes in the value of similar securities which may be further adjusted for any discounts related to security-specific resale restrictions. When possible, such methodologies use observable market inputs such as unadjusted quoted prices of similar securities, observable interest rates, currency rates and yield curves. The methodologies used for valuing securities are not necessarily an indication of the risks associated with investing in those securities nor can it be assured that the Fund can obtain the fair value assigned to a security if it were to sell the security.
To assess the continuing appropriateness of security valuations, the Manager, or its third party service provider who is subject to oversight by the Manager, regularly compares prior day prices, prices on comparable securities, and sale prices to the current day prices and challenges those prices exceeding certain tolerance levels with the third party pricing service or broker source. For those securities valued by fair valuations, whether through a standardized fair valuation methodology or a fair valuation determination, the Valuation Committee reviews and affirms the reasonableness of the valuations based on such methodologies and fair valuation determinations on a regular basis after considering all relevant information that is reasonably available.
Classifications
Each investment asset or liability of the Fund is assigned a level at measurement date based on the significance and source of the inputs to its valuation. Various data inputs are used in determining the value of each of the Fund’s investments as of the reporting period end. These data inputs are categorized in the following hierarchy under applicable financial accounting standards:
| 1) | Level 1—unadjusted quoted prices in active markets for identical assets or liabilities (including securities actively traded on a securities exchange) |
| 2) | Level 2—inputs other than unadjusted quoted prices that are observable for the asset or liability (such as unadjusted quoted prices for similar assets and market corroborated inputs such as interest rates, prepayment speeds, credit risks, etc.) |
| 3) | Level 3—significant unobservable inputs (including the Manager’s own judgments about assumptions that market participants would use in pricing the asset or liability). |
The inputs used for valuing securities are not necessarily an indication of the risks associated with investing in those securities.
| OPPENHEIMER INTERNATIONAL BOND FUND | 75 |
NOTES TO FINANCIAL STATEMENTS Unaudited / Continued
2. Securities Valuation Continued
The table below categorizes amounts that are included in the Fund’s Statement of Assets and Liabilities as of March 28, 2013 based on valuation input level:
| Level 1— Unadjusted Quoted Prices |
Level 2— Other Significant Observable Inputs |
Level 3— Significant Unobservable Inputs |
Value | |||||||||||||||||||||
| Assets Table | ||||||||||||||||||||||||
| Investments, at Value: | ||||||||||||||||||||||||
| U.S. Government Obligations | $ | — | $ | 132,914,208 | $ | — | $ | 132,914,208 | ||||||||||||||||
| Foreign Government Obligations | — | 8,529,661,449 | — | 8,529,661,449 | ||||||||||||||||||||
| Corporate Bonds and Notes | — | 3,340,710,681 | 1,242,500 | 3,341,953,181 | ||||||||||||||||||||
| Corporate Loans | — | — | 5,493,909 | 5,493,909 | ||||||||||||||||||||
| Structured Securities | — | 379,313,127 | 77,016,769 | 456,329,896 | ||||||||||||||||||||
| Options Purchased | 6,475,915 | 61,849,199 | — | 68,325,114 | ||||||||||||||||||||
| Swaptions Purchased | — | 72,631,301 | — | 72,631,301 | ||||||||||||||||||||
| Investment Company | 340,194,120 | — | — | 340,194,120 | ||||||||||||||||||||
| Total Investments, at Value | 346,670,035 | 12,517,079,965 | 83,753,178 | 12,947,503,178 | ||||||||||||||||||||
| Other Financial Instruments: | ||||||||||||||||||||||||
| Appreciated swaps, at value | — | 20,255,456 | — | 20,255,456 | ||||||||||||||||||||
| Depreciated swaps, at value | — | 13,544,965 | — | 13,544,965 | ||||||||||||||||||||
| Futures margins | 536,101 | — | — | 536,101 | ||||||||||||||||||||
| Foreign currency exchange contracts | — | 143,375,098 | — | 143,375,098 | ||||||||||||||||||||
| Total Assets | $ | 347,206,136 | $ | 12,694,255,484 | $ | 83,753,178 | $ | 13,125,214,798 | ||||||||||||||||
| Liabilities Table | ||||||||||||||||||||||||
| Other Financial Instruments: | ||||||||||||||||||||||||
| Swaps, at value | $ | — | $ | — | $ | — | $ | — | ||||||||||||||||
| Appreciated swaps, at value | — | (8,899,118 | ) | — | (8,899,118 | ) | ||||||||||||||||||
| Depreciated swaps, at value | — | (8,553,543 | ) | — | (8,553,543 | ) | ||||||||||||||||||
| Appreciated options written, at value | (1,044,304 | ) | (7,774,838 | ) | — | (8,819,142 | ) | |||||||||||||||||
| Depreciated options written, at value | (563,141 | ) | (33,193,071 | ) | — | (33,756,212 | ) | |||||||||||||||||
| Appreciated swaptions written, at value | — | (37,948,132 | ) | — | (37,948,132 | ) | ||||||||||||||||||
| Depreciated swaptions Written, at value | — | (63,417,535 | ) | — | (63,417,535 | ) | ||||||||||||||||||
| Futures margins | (3,067,300 | ) | — | — | (3,067,300 | ) | ||||||||||||||||||
| Foreign currency exchange contracts | — | (118,383,152 | ) | — | (118,383,152 | ) | ||||||||||||||||||
| Total Liabilities | $ | (4,674,745 | ) | $ | (278,169,389 | ) | $ | — | $ | (282,844,134 | ) | |||||||||||||
Currency contracts and forwards, if any, are reported at their unrealized appreciation/depreciation at measurement date, which represents the change in the contract’s value from trade date. Futures, if any, are reported at their variation margin at measurement date, which represents the amount due to/from the Fund at that date. All additional assets and liabilities included in the above table are reported at their market value at measurement date.
| 76 | OPPENHEIMER INTERNATIONAL BOND FUND |
The table below shows the transfers between Level 2 and Level 3. The Fund’s policy is to recognize transfers in and transfers out as of the beginning of the reporting period.
| Transfers out of Level 2* |
Transfers into Level 3* | |||||||||
| Assets Table | ||||||||||
| Investments, at Value: | ||||||||||
| Structured Securities | $ | (36,068,653 | ) | $ | 36,068,653 | |||||
| Total Assets | $ | (36,068,653 | ) | $ | 36,068,653 | |||||
*Transferred from Level 2 to Level 3 because of the lack of observable market data.
3. Shares of Beneficial Interest
The Fund has authorized an unlimited number of $0.001 par value shares of beneficial interest of each class. Transactions in shares of beneficial interest were as follows:
| Six Months Ended March 28, 2013 | Year Ended September 28, 20121 | |||||||||||||||
| Shares | Amount | Shares | Amount | |||||||||||||
| Class A | ||||||||||||||||
| Sold | 92,984,481 | $ | 611,120,056 | 171,776,974 | $ | 1,091,554,116 | ||||||||||
| Dividends and/or distributions reinvested | 19,957,762 | 130,989,591 | 44,995,865 | 283,930,046 | ||||||||||||
| Redeemed | (123,727,770 | ) | (812,625,441 | ) | (330,147,419 | ) | (2,090,023,611 | ) | ||||||||
| Net decrease | (10,785,527 | ) | $ | (70,515,794 | ) | (113,374,580 | ) | $ | (714,539,449 | ) | ||||||
| Class B | ||||||||||||||||
| Sold | 545,749 | $ | 3,571,570 | 3,720,749 | $ | 23,495,746 | ||||||||||
| Dividends and/or distributions reinvested |
493,930 | 3,231,443 | 1,241,531 | 7,791,960 | ||||||||||||
| Redeemed | (4,401,382 | ) | (28,803,944 | ) | (11,319,946 | ) | (71,546,679 | ) | ||||||||
| Net decrease | (3,361,703 | ) | $ | (22,000,931 | ) | (6,357,666 | ) | $ | (40,258,973 | ) | ||||||
| Class C | ||||||||||||||||
| Sold | 17,491,606 | $ | 114,516,448 | 25,358,117 | $ | 160,456,837 | ||||||||||
| Dividends and/or distributions reinvested |
4,101,076 | 26,828,395 | 9,136,135 | 57,381,021 | ||||||||||||
| Redeemed | (27,072,769 | ) | (177,175,856 | ) | (61,630,623 | ) | (389,458,127 | ) | ||||||||
| Net decrease | (5,480,087 | ) | $ | (35,831,013 | ) | (27,136,371 | ) | $ | (171,620,269 | ) | ||||||
| Class I | ||||||||||||||||
| Sold | 11,408,283 | $ | 74,990,041 | 140,600 | $ | 887,480 | ||||||||||
| Dividends and/or distributions reinvested |
95,585 | 626,244 | 1,641 | 10,490 | ||||||||||||
| Redeemed | (309,070 | ) | (2,025,261 | ) | (11,317 | ) | (73,077 | ) | ||||||||
| Net increase | 11,194,798 | $ | 73,591,024 | 130,924 | $ | 824,893 | ||||||||||
| OPPENHEIMER INTERNATIONAL BOND FUND | 77 |
NOTES TO FINANCIAL STATEMENTS Unaudited / Continued
3. Shares of Beneficial Interest Continued
| Six Months Ended March 28, 2013 | Year Ended September 28, 20121 | |||||||||||||||
| Shares | Amount | Shares | Amount | |||||||||||||
| Class N | ||||||||||||||||
| Sold | 5,845,593 | $ | 38,258,686 | 12,083,868 | $ | 76,484,026 | ||||||||||
| Dividends and/or distributions reinvested |
985,975 | 6,455,950 | 2,250,133 | 14,151,519 | ||||||||||||
| Redeemed | (9,501,963 | ) | (62,221,068 | ) | (17,347,866 | ) | (109,597,128 | ) | ||||||||
| Net decrease | (2,670,395 | ) | $ | (17,506,432 | ) | (3,013,865 | ) | $ | (18,961,583 | ) | ||||||
| Class Y | ||||||||||||||||
| Sold | 146,524,541 | $ | 962,107,730 | 276,613,105 | $ | 1,755,512,047 | ||||||||||
| Dividends and/or distributions reinvested |
16,344,923 | 107,246,962 | 32,234,890 | 203,553,471 | ||||||||||||
| Redeemed | (115,866,136 | ) | (760,812,530 | ) | (233,014,570 | ) | (1,474,979,975 | ) | ||||||||
| Net increase | 47,003,328 | $ | 308,542,162 | 75,833,425 | $ | 484,085,543 | ||||||||||
1. For the year ended September 28, 2012, for Class A, Class B, Class C, Class N and Class Y shares, and for the period from January 27, 2012 (inception of offering) to September 28, 2012, for Class I shares.
4. Purchases and Sales of Securities
The aggregate cost of purchases and proceeds from sales of securities, other than short-term obligations and investments in IMMF, for the six months ended March 28, 2013, were as follows:
| Purchases | Sales | |||||||
| Investment securities | $ | 4,465,649,169 | $ | 4,585,269,493 | ||||
| U.S. government and government agency obligations | 570,936,269 | 670,388,860 | ||||||
5. Fees and Other Transactions with Affiliates
Management Fees. Under the investment advisory agreement, the Fund pays the Manager a management fee based on the daily net assets of the Fund at an annual rate as shown in the following table:
| Fee Schedule | ||||
| Up to $200 million | 0.75 | % | ||
| Next $200 million | 0.72 | |||
| Next $200 million | 0.69 | |||
| Next $200 million | 0.66 | |||
| Next $200 million | 0.60 | |||
| Next $4 billion | 0.50 | |||
| Next $10 billion | 0.48 | |||
| Over $15 billion | 0.45 | |||
Sub-Adviser Fees. The Manager has retained the Sub-Adviser to provide the day-to-day portfolio management of the Fund. Under the Sub-Advisory Agreement, the Manager pays the Sub-Adviser an annual fee in monthly installments, equal to a percentage of the investment management fee collected by the Manager from the Fund, which shall be calculated after any investment management fee waivers. The fee paid to the Sub-Adviser is paid by the Manager, not by the Fund.
| 78 | OPPENHEIMER INTERNATIONAL BOND FUND |
Transfer Agent Fees. OppenheimerFunds Services (“OFS”), a division of OFI, acted as the transfer and shareholder servicing agent for the Fund through December 31, 2012. Effective January 1, 2013, OFI Global (the “Transfer Agent”) serves as the transfer and shareholder servicing agent for the Fund. The Fund pays the Transfer Agent a per account fee.
Additionally, Class Y shares are subject to minimum fees of $10,000 annually for assets of $10 million or more. The Class Y shares are subject to the minimum fees in the event that the per account fee does not equal or exceed the applicable minimum fees. The Transfer Agent may voluntarily waive the minimum fees.
Sub-Transfer Agent Fees. Effective January 1, 2013, the Transfer Agent has retained Shareholder Services, Inc., a wholly-owned subsidiary of OFI, (the “Sub-Transfer Agent”) to provide the day-to-day transfer agent and shareholder servicing of the Fund. Under the Sub-Transfer Agency Agreement, the Transfer Agent pays the Sub-Transfer Agent an annual fee in monthly installments, equal to a percentage of the transfer agent fee collected by the Transfer Agent from the Fund, which shall be calculated after any applicable fee waivers. The fee paid to the Sub-Transfer Agent is paid by the Transfer Agent, not by the Fund.
Distribution and Service Plan (12b-1) Fees. Under its General Distributor’s Agreement with the Fund, OppenheimerFunds Distributor, Inc. (the “Distributor”) acts as the Fund’s principal underwriter in the continuous public offering of the Fund’s classes of shares.
Service Plan for Class A Shares. The Fund has adopted a Service Plan (the “Plan”) for Class A shares under Rule 12b-1 of the Investment Company Act of 1940. Under the Plan, the Fund reimburses the Distributor for a portion of its costs incurred for services provided to accounts that hold Class A shares. Reimbursement is made periodically at an annual rate of up to 0.25% of the daily net assets of Class A shares of the Fund. The Distributor currently uses all of those fees to pay dealers, brokers, banks and other financial institutions periodically for providing personal service and maintenance of accounts of their customers that hold Class A shares. Any unreimbursed expenses the Distributor incurs with respect to Class A shares in any fiscal year cannot be recovered in subsequent periods. Fees incurred by the Fund under the Plan are detailed in the Statement of Operations.
Distribution and Service Plans for Class B, Class C and Class N Shares. The Fund has adopted Distribution and Service Plans (the “Plans”) for Class B, Class C and Class N shares under Rule 12b-1 of the Investment Company Act of 1940 to compensate the Distributor for its services in connection with the distribution of those shares and servicing accounts. Under the Plans, the Fund pays the Distributor an annual asset-based sales charge of 0.75% on Class B and Class C shares daily net assets and 0.25% on Class N shares daily net assets. The Distributor also receives a service fee of 0.25% per year under each plan. If either the Class B, Class C or Class N plan is terminated by the Fund or by the shareholders of a class, the Board of Trustees and its independent trustees must determine whether the Distributor shall be entitled to payment from the Fund of all or a portion of the service fee
| OPPENHEIMER INTERNATIONAL BOND FUND | 79 |
NOTES TO FINANCIAL STATEMENTS Unaudited / Continued
5. Fees and Other Transactions with Affiliates Continued
and/or asset-based sales charge in respect to shares sold prior to the effective date of such termination. Fees incurred by the Fund under the Plans are detailed in the Statement of Operations. The Distributor determines its uncompensated expenses under the Plans at calendar quarter ends. The Distributor’s aggregate uncompensated expenses under the Plans at March 31, 2013 were as follows:
| Class B | $ | 4,762,812 | ||
| Class C | 37,539,782 | |||
| Class N | 7,194,667 |
Sales Charges. Front-end sales charges and contingent deferred sales charges (“CDSC”) do not represent expenses of the Fund. They are deducted from the proceeds of sales of Fund shares prior to investment or from redemption proceeds prior to remittance, as applicable. The sales charges retained by the Distributor from the sale of shares and the CDSC retained by the Distributor on the redemption of shares is shown in the following table for the period indicated.
| Six Months Ended | Class A Front-End Sales Charges Retained by Distributor |
Class A Contingent Deferred Sales Charges Retained by Distributor |
Class B Contingent Deferred Sales Charges Retained by Distributor |
Class C Contingent Deferred Sales Charges Retained by Distributor |
Class N Contingent Deferred Sales Charges Retained by Distributor |
|||||||||||||||
| March 28, 2013 | $ | 373,797 | $ | 43,504 | $ | 207,740 | $ | 42,096 | $ | 1,608 | ||||||||||
Waivers and Reimbursements of Expenses. The Manager will waive fees and/or reimburse Fund expenses in an amount equal to the indirect management fees incurred through the Fund’s investment in IMMF. During the six months ended March 28, 2013, the Manager waived fees and/or reimbursed the Fund $172,700 for IMMF management fees.
The Transfer Agent has voluntarily agreed to limit transfer and shareholder servicing agent fees for Classes B, C, N and Y shares to 0.35% of average annual net assets per class and for Class A shares to 0.30% of average annual net assets of the class.
During the six months ended March 28, 2013, the Transfer Agent waived transfer and shareholder servicing agent fees as follows:
| Class N | $ | 42,939 |
Some of these undertakings may be modified or terminated at any time; some may not be modified or terminated until after one year from the date of the current prospectus, as indicated therein.
6. Risk Exposures and the Use of Derivative Instruments
The Fund’s investment objectives not only permit the Fund to purchase investment securities, they also allow the Fund to enter into various types of derivatives contracts, including, but not limited to, futures contracts, forward foreign currency exchange contracts, credit default swaps, interest rate swaps, total return swaps, and purchased and written options. In doing so, the Fund will employ strategies in differing combinations to permit it to increase, decrease, or change the level or types of exposure to market risk factors. Central to those strategies are features inherent to derivatives that make them
| 80 | OPPENHEIMER INTERNATIONAL BOND FUND |
more attractive for this purpose than equity and debt securities: they require little or no initial cash investment, they can focus exposure on only certain selected risk factors, and they may not require the ultimate receipt or delivery of the underlying security (or securities) to the contract. This may allow the Fund to pursue its objectives more quickly and efficiently than if it were to make direct purchases or sales of securities capable of effecting a similar response to market factors.
Market Risk Factors. In accordance with its investment objectives, the Fund may use derivatives to increase or decrease its exposure to one or more of the following market risk factors:
Commodity Risk. Commodity risk relates to the change in value of commodities or commodity indexes as they relate to increases or decreases in the commodities market. Commodities are physical assets that have tangible properties. Examples of these types of assets are crude oil, heating oil, metals, livestock, and agricultural products.
Credit Risk. Credit risk relates to the ability of the issuer to meet interest and principal payments, or both, as they come due. In general, lower-grade, higher-yield bonds are subject to credit risk to a greater extent than lower-yield, higher-quality bonds.
Equity Risk. Equity risk relates to the change in value of equity securities as they relate to increases or decreases in the general market.
Foreign Exchange Rate Risk. Foreign exchange rate risk relates to the change in the U.S. dollar value of a security held that is denominated in a foreign currency. The U.S. dollar value of a foreign currency denominated security will decrease as the dollar appreciates against the currency, while the U.S. dollar value will increase as the dollar depreciates against the currency.
Interest Rate Risk. Interest rate risk refers to the fluctuations in value of fixed-income securities resulting from the inverse relationship between price and yield. For example, an increase in general interest rates will tend to reduce the market value of already issued fixed-income investments, and a decline in general interest rates will tend to increase their value. In addition, debt securities with longer maturities, which tend to have higher yields, are subject to potentially greater fluctuations in value from changes in interest rates than obligations with shorter maturities.
Volatility Risk. Volatility risk refers to the magnitude of the movement, but not the direction of the movement, in a financial instrument’s price over a defined time period. Large increases or decreases in a financial instrument’s price over a relative time period typically indicate greater volatility risk, while small increases or decreases in its price typically indicate lower volatility risk.
The Fund’s actual exposures to these market risk factors during the period are discussed in further detail, by derivative type, below.
Risks of Investing in Derivatives. The Fund’s use of derivatives can result in losses due to unanticipated changes in the market risk factors and the overall market. In instances where the Fund is using derivatives to decrease, or hedge, exposures to market risk factors for securities held by the Fund, there are also risks that those derivatives may not perform as expected resulting in losses for the combined or hedged positions.
| OPPENHEIMER INTERNATIONAL BOND FUND | 81 |
NOTES TO FINANCIAL STATEMENTS Unaudited / Continued
6. Risk Exposures and the Use of Derivative Instruments Continued
Derivatives may have little or no initial cash investment relative to their market value exposure and therefore can produce significant gains or losses in excess of their cost. This use of embedded leverage allows the Fund to increase its market value exposure relative to its net assets and can substantially increase the volatility of the Fund’s performance.
Additional associated risks from investing in derivatives also exist and potentially could have significant effects on the valuation of the derivative and the Fund. Typically, the associated risks are not the risks that the Fund is attempting to increase or decrease exposure to, per its investment objectives, but are the additional risks from investing in derivatives. Examples of these associated risks are liquidity risk, which is the risk that the Fund will not be able to sell the derivative in the open market in a timely manner, and counterparty credit risk, which is the risk that the counterparty will not fulfill its obligation to the Fund. Associated risks can be different for each type of derivative and are discussed by each derivative type in the notes that follow.
Counterparty Credit Risk. Certain derivative positions are subject to counterparty credit risk, which is the risk that the counterparty will not fulfill its obligation to the Fund. The Fund’s derivative counterparties are financial institutions who are subject to market conditions that may weaken their financial position. The Fund intends to enter into financial transactions with counterparties that the Manager believes to be creditworthy at the time of the transaction. As of March 28, 2013, the maximum amount of loss that the Fund would incur if the counterparties to its derivative transactions failed to perform would be $334,152,911, which represents gross payments to be received by the Fund on these derivative contracts were they to be unwound as of period end. To reduce this risk the Fund has entered into master netting arrangements, established within the Fund’s International Swap and Derivatives Association, Inc. master agreements, which allow the Fund to net unrealized appreciation and depreciation for certain positions in swaps, over-the-counter options, swaptions, and forward currency exchange contracts for each individual counterparty. The amount of loss that the Fund would incur taking into account these master netting arrangements would be $71,048,630 as of March 28, 2013. In addition, the Fund may require that certain counterparties post cash and/or securities in collateral accounts to cover their net payment obligations for those derivative contracts subject to International Swap and Derivatives Association, Inc. master agreements. If the counterparty fails to perform under these contracts and agreements, the cash and/or securities will be made available to the Fund.
As of March 28, 2013 the Fund has required certain counterparties to post collateral of $62,389,584.
Credit Related Contingent Features. The Fund’s agreements with derivative counterparties have several credit related contingent features that if triggered would allow its derivatives counterparties to close out and demand payment or additional collateral to cover their exposure from the Fund. Credit related contingent features are established between the Fund and its derivatives counterparties to reduce the risk that
| 82 | OPPENHEIMER INTERNATIONAL BOND FUND |
the Fund will not fulfill its payment obligations to its counterparties. These triggering features include, but are not limited to, a percentage decrease in the Fund’s net assets and or a percentage decrease in the Fund’s Net Asset Value or NAV. The contingent features are established within the Fund’s International Swap and Derivatives Association, Inc. master agreements which govern certain positions in swaps, over-the-counter options and swaptions, and forward currency exchange contracts for each individual counterparty.
As of March 28, 2013, the aggregate fair value of derivative instruments with credit related contingent features in a net liability position was $28,803,408 for which the Fund has posted collateral of $33,598,870. If a contingent feature would have been triggered as of March 28, 2013, the Fund could have been required to pay this amount in cash to its counterparties. If the Fund fails to perform under these contracts and agreements, the cash and/or securities posted as collateral will be made available to the counterparty. Cash posted as collateral for these contracts, if any, is reported on the Statement of Assets and Liabilities; securities posted as collateral, if any, are reported on the Statement of Investments.
Valuations of derivative instruments as of March 28, 2013 are as follows:
| Asset Derivatives | Liability Derivatives | |||||||||||
| Derivatives Not Accounted for as Hedging Instruments |
Statement of Assets and Liabilities Location |
Value | Statement of Assets and Liabilities Location |
Value | ||||||||
| Credit contracts | Appreciated swaps, at value |
$ | 17,266,200 | Appreciated swaps, at value |
$ | 8,899,118 | ||||||
| Credit contracts | Depreciated swaps, at value |
13,544,965 | Depreciated swaps, at value |
4,167,240 | ||||||||
| Interest rate contracts | Appreciated swaps, at value |
2,347,850 | Depreciated swaps, at value |
3,028,618 | ||||||||
| Volatility contracts | Appreciated swaps, at value |
641,406 | Depreciated swaps, at value |
1,357,685 | ||||||||
| Volatility contracts | Futures margins | 4,638 | * | |||||||||
| Interest rate contracts | Futures margins | 531,463 | * | Futures margins | 3,067,300 | * | ||||||
| Foreign exchange contracts | Unrealized appreciation on foreign currency exchange contracts |
143,375,098 | Unrealized depreciation on foreign currency exchange contracts |
118,383,152 | ||||||||
| Foreign exchange contracts | Appreciated options written, at value |
6,993,919 | ||||||||||
| Foreign exchange contracts | Depreciated options written, at value |
33,193,071 | ||||||||||
| Interest rate contracts | Appreciated options written, at value |
1,825,223 | ||||||||||
| Interest rate contracts | Depreciated options written, at value |
563,141 | ||||||||||
| Credit contracts | Appreciated swaptions written, at value |
550,182 | ||||||||||
| OPPENHEIMER INTERNATIONAL BOND FUND | 83 |
NOTES TO FINANCIAL STATEMENTS Unaudited / Continued
6. Risk Exposures and the Use of Derivative Instruments Continued
| Asset Derivatives | Liability Derivatives | |||||||||||
| Derivatives Not Accounted for as Hedging Instruments |
Statement of Assets and Liabilities Location |
Value | Statement of Assets and Liabilities Location |
Value | ||||||||
| Credit contracts | Depreciated swaptions written, at value |
$ | 2,462,664 | |||||||||
| Interest rate contracts | Appreciated swaptions written, at value |
37,397,950 | ||||||||||
| Interest rate contracts | Depreciated swaptions written, at value |
60,954,871 | ||||||||||
| Credit contracts | Investments, at value |
965,529 | ** | |||||||||
| Foreign exchange contracts | Investments, at value |
66,215,348 | ** | |||||||||
| Interest rate contracts | Investments, at value |
73,775,538 | ** | |||||||||
| Total | $ | 318,668,035 | $ | 282,844,134 | ||||||||
*Includes only the current day’s variation margin. Prior variation margin movements have been reflected in cash on the Statement of Assets and Liabilities upon receipt or payment.
**Amounts relate to purchased options and swaptions.
The effect of derivative instruments on the Statement of Operations is as follows:
| Amount of Realized Gain or (Loss) Recognized on Derivatives | ||||||||||||||||||||||||||||
| Derivatives Not Accounted for as Hedging Instruments |
Investments from unaffiliated companies (including premiums on options exercised)* |
Closing and expiration of swaption contracts written |
Closing and expiration of option contracts written |
Closing and expiration of futures contracts |
Foreign currency transactions |
Swap contracts |
Total | |||||||||||||||||||||
| Credit contracts | $ | (7,920,544 | ) | $ | 8,255,227 | $ | — | $ | — | $ | — | $ | (10,563,723 | ) | $ | (10,229,040 | ) | |||||||||||
| Foreign exchange contracts | (20,460,101 | ) | — | 55,612,571 | 2,594,162 | 140,015,310 | — | 177,761,942 | ||||||||||||||||||||
| Interest rate contracts | (88,977,582 | ) | 38,405,693 | 13,668,344 | 24,371,729 | — | (10,553,530 | ) | (23,085,346 | ) | ||||||||||||||||||
| Volatility contracts | — | — | — | 665,368 | — | (1,460,695 | ) | (795,327 | ) | |||||||||||||||||||
| Total | $ | (117,358,227 | ) | $ | 46,660,920 | $ | 69,280,915 | $ | 27,631,259 | $ | 140,015,310 | $ | (22,577,948 | ) | $ | 143,652,229 | ||||||||||||
*Includes purchased option contracts, purchased swaption contracts and written option contracts exercised, if any.
| 84 | OPPENHEIMER INTERNATIONAL BOND FUND |
| Amount of Change in Unrealized Gain or (Loss) Recognized on Derivatives | ||||||||||||||||||||||||||||
| Derivatives Not Accounted for as Hedging Instruments |
Investments* | Option contracts written |
Swaption contracts written |
Futures contracts |
Translation of assets and liabilities denominated in foreign currencies |
Swap contracts |
Total | |||||||||||||||||||||
| Credit contracts | $ | (1,810,325 | ) | $ | — | $ | 1,151,025 | $ | — | $ | — | $ | 1,291,040 | $ | 631,740 | |||||||||||||
| Foreign exchange contracts | 50,629,816 | (23,424,990 | ) | — | (119,716 | ) | 62,548,757 | — | 89,633,867 | |||||||||||||||||||
| Interest rate contracts | 42,029,214 | 1,495,174 | (2,427,525 | ) | (1,008,937 | ) | — | 8,118,146 | 48,206,072 | |||||||||||||||||||
| Volatility contracts | — | — | — | 46,859 | — | (676,293 | ) | (629,434 | ) | |||||||||||||||||||
| Total | $ | 90,848,705 | $ | (21,929,816 | ) | $ | (1,276,500 | ) | $ | (1,081,794 | ) | $ | 62,548,757 | $ | 8,732,893 | $ | 137,842,245 | |||||||||||
*Includes purchased option contracts and purchased swaption contracts, if any.
Foreign Currency Exchange Contracts
The Fund may enter into foreign currency exchange contracts (“forward contracts”) for the purchase or sale of a foreign currency at a negotiated rate at a future date.
Forward contracts are reported on a schedule following the Statement of Investments. The unrealized appreciation (depreciation) is reported in the Statement of Assets and Liabilities as a receivable or payable and in the Statement of Operations within the change in unrealized appreciation (depreciation). At contract close, the difference between the original cost of the contract and the value at the close date is recorded as a realized gain (loss) in the Statement of Operations.
The Fund has purchased and sold certain forward foreign currency exchange contracts of different currencies in order to acquire currencies to pay for or sell currencies to acquire related foreign securities purchase and sale transactions, respectively, or to convert foreign currencies to U.S. dollars from related foreign securities transactions. These foreign currency exchange contracts are negotiated at the current spot exchange rate with settlement typically within two business days thereafter.
The Fund has entered into forward foreign currency exchange contracts with the obligation to purchase specified foreign currencies in the future at a currently negotiated forward rate in order to take a positive investment perspective on the related currency. These forward foreign currency exchange contracts seek to increase exposure to foreign exchange rate risk.
The Fund has entered into forward foreign currency exchange contracts with the obligation to purchase specified foreign currencies in the future at a currently negotiated forward rate in order to decrease exposure to foreign exchange rate risk associated with foreign currency denominated securities held by the Fund.
The Fund has entered into forward foreign currency exchange contracts with the obligation to sell specified foreign currencies in the future at a currently negotiated
| OPPENHEIMER INTERNATIONAL BOND FUND | 85 |
NOTES TO FINANCIAL STATEMENTS Unaudited / Continued
6. Risk Exposures and the Use of Derivative Instruments Continued
forward rate in order to take a negative investment perspective on the related currency. These forward foreign currency exchange contracts seek to increase exposure to foreign exchange rate risk.
The Fund has entered into forward foreign currency exchange contracts with the obligation to sell specified foreign currencies in the future at a currently negotiated forward rate in order to decrease exposure to foreign exchange rate risk associated with foreign currency denominated securities held by the Fund.
During the six months ended March 28, 2013, the Fund had daily average contract amounts on forward foreign currency contracts to buy and sell of $4,282,156,721 and $8,877,688,545, respectively.
Additional associated risk to the Fund includes counterparty credit risk. Counterparty credit risk arises from the possibility that the counterparty will default.
Futures Contracts
A futures contract is a commitment to buy or sell a specific amount of a financial instrument, or currency, at a negotiated price on a stipulated future date. The Fund may buy and sell futures contracts and may also buy or write put or call options on these futures contracts.
Futures contracts traded on a commodities or futures exchange will be valued at the final settlement price or official closing price on the principal exchange as reported by such principal exchange at its trading session ending at, or most recently prior to, the time when the Fund’s assets are valued.
Upon entering into a futures contract, the Fund is required to deposit either cash or securities (initial margin) in an amount equal to a certain percentage of the contract value. Subsequent payments (variation margin) are made or received by the Fund each day. The variation margin payments are equal to the daily changes in the contract value and are recorded as unrealized gains and losses.
Futures contracts are reported on a schedule following the Statement of Investments. Securities held in collateralized accounts to cover initial margin requirements on open futures contracts are noted in the Statement of Investments. Cash held by the broker to cover initial margin requirements on open futures contracts and the receivable and/or payable for the daily mark to market for the variation margin are noted in the Statement of Assets and Liabilities. The net change in unrealized appreciation and depreciation is reported in the Statement of Operations. Realized gains (losses) are reported in the Statement of Operations at the closing or expiration of futures contracts.
The Fund has purchased futures contracts on various bonds and notes to increase exposure to interest rate risk.
The Fund has sold futures contracts on various bonds and notes to decrease exposure to interest rate risk.
The Fund has purchased futures contracts on various currencies to increase exposure to foreign exchange rate risk.
| 86 | OPPENHEIMER INTERNATIONAL BOND FUND |
The Fund has sold futures contracts on various currencies to decrease exposure to foreign exchange rate risk.
The Fund has sold futures contracts, which have values that are linked to the price movement of the related volatility indexes, in order to decrease exposure to volatility risk.
During the six months ended March 28, 2013, the Fund had an ending monthly average market value of $15,689,083 and $1,425,663,016 on futures contracts purchased and sold, respectively.
Additional associated risks of entering into futures contracts (and related options) include the possibility that there may be an illiquid market where the Fund is unable to liquidate the contract or enter into an offsetting position and, if used for hedging purposes, the risk that the price of the contract will correlate imperfectly with the prices of the Fund’s securities.
Option Activity
The Fund may buy and sell put and call options, or write put and call options. When an option is written, the Fund receives a premium and becomes obligated to sell or purchase the underlying security at a fixed price, upon exercise of the option.
Options are valued daily based upon the last sale price on the principal exchange on which the option is traded. The difference between the premium received or paid, and market value of the option, is recorded as unrealized appreciation or depreciation. The net change in unrealized appreciation or depreciation is reported in the Statement of Operations. When an option is exercised, the cost of the security purchased or the proceeds of the security sale are adjusted by the amount of premium received or paid. Upon the expiration or closing of the option transaction, a gain or loss is reported in the Statement of Operations.
The Fund has purchased call options on currencies to increase exposure to foreign exchange rate risk. A purchased call option becomes more valuable as the price of the underlying financial instrument appreciates relative to the strike price.
The Fund has purchased put options on currencies to decrease exposure to foreign exchange rate risk. A purchased put option becomes more valuable as the price of the underlying financial instrument depreciates relative to the strike price.
The Fund has purchased call options on treasury and/or euro futures to increase exposure to interest rate risk. A purchased call option becomes more valuable as the price of the underlying financial instrument appreciates relative to the strike price.
The Fund has purchased put options on treasury and/or euro futures to decrease exposure to interest rate risk. A purchased put option becomes more valuable as the price of the underlying financial instrument depreciates relative to the strike price.
During the six months ended March 28, 2013, the Fund had an ending monthly average market value of $25,090,805 and $45,024,480 on purchased call options and purchased put options, respectively.
| OPPENHEIMER INTERNATIONAL BOND FUND | 87 |
NOTES TO FINANCIAL STATEMENTS Unaudited / Continued
6. Risk Exposures and the Use of Derivative Instruments Continued
Options written, if any, are reported in a schedule following the Statement of Investments and as a liability in the Statement of Assets and Liabilities. Securities held in collateralized accounts to cover potential obligations with respect to outstanding written options are noted in the Statement of Investments.
The risk in writing a call option is that the Fund gives up the opportunity for profit if the market price of the security increases and the option is exercised. The risk in writing a put option is that the Fund may incur a loss if the market price of the security decreases and the option is exercised. The risk in buying an option is that the Fund pays a premium whether or not the option is exercised. The Fund also has the additional risk that there may be an illiquid market where the Fund is unable to close the contract.
The Fund has written put options on currencies to increase exposure to foreign exchange rate risk. A written put option becomes more valuable as the price of the underlying financial instrument appreciates relative to the strike price.
The Fund has written call options on currencies to decrease exposure to foreign exchange rate risk. A written call option becomes more valuable as the price of the underlying financial instrument depreciates relative to the strike price.
The Fund has written call options on treasury and/or euro futures to decrease exposure to interest rate risk. A written call option becomes more valuable as the price of the underlying financial instrument depreciates relative to the strike price.
The Fund has written put options on treasury and/or euro futures to increase exposure to interest rate risk. A written put option becomes more valuable as the price of the underlying financial instrument appreciates relative to the strike price.
During the six months ended March 28, 2013, the Fund had an ending monthly average market value of $9,628,164 and $22,646,208 on written call options and written put options, respectively.
Additional associated risks to the Fund include counterparty credit risk for over-the-counter options and liquidity risk.
Written option activity for the six months ended March 28, 2013 was as follows:
| Call Options |
Put Options |
|||||||||||||||
| Number of Contracts |
Amount of Premiums |
Number of Contracts |
Amount of Premiums |
|||||||||||||
| Options outstanding as of | ||||||||||||||||
| September 28, 2012 | 120,025,259,722 | $ | 21,469,321 | 145,504,820,854 | $ | 34,561,577 | ||||||||||
| Options written | 643,405,967,792 | 72,762,410 | 702,657,152,366 | 127,180,164 | ||||||||||||
| Options closed or expired | (632,449,647,514 | ) | (74,102,408 | ) | (513,756,991,653 | ) | (114,436,182 | ) | ||||||||
| Options exercised | (72,990,330,000 | ) | (10,850,581 | ) | (153,878,900,000 | ) | (16,118,913 | ) | ||||||||
| Options outstanding as of March 28, 2013 |
57,991,250,000 | $ | 9,278,742 | 180,526,081,567 | $ | 31,186,646 | ||||||||||
Swap Contracts
The Fund may enter into swap contract agreements with a counterparty to exchange a series of cash flows based on either specified reference rates, or the occurrence of a credit
| 88 | OPPENHEIMER INTERNATIONAL BOND FUND |
event, over a specified period. Such contracts may include interest rate, equity, debt, index, total return, credit and currency swaps.
Swaps are marked to market daily using primarily quotations from pricing services, counterparties and brokers. Swap contracts are reported on a schedule following the Statement of Investments. The values of swap contracts are aggregated by positive and negative values and disclosed separately on the Statement of Assets and Liabilities by contracts in unrealized appreciation and depreciation positions. Upfront payments paid or received, if any, affect the value of the respective swap. Therefore, to determine the unrealized appreciation (depreciation) on swaps, upfront payments paid should be subtracted from, while upfront payments received should be added to, the value of contracts reported as an asset on the Statement of Assets and Liabilities. Conversely, upfront payments paid should be added to, while upfront payments received should be subtracted from the value of contracts reported as a liability. The unrealized appreciation (depreciation) related to the change in the valuation of the notional amount of the swap is combined with the accrued interest due to (owed by) the Fund at termination or settlement. The net change in this amount during the period is included on the Statement of Operations. The Fund also records any periodic payments received from (paid to) the counterparty, including at termination, under such contracts as realized gain (loss) on the Statement of Operations.
Swap contract agreements are exposed to the market risk factor of the specific underlying reference asset. Swap contracts are typically more attractively priced compared to similar investments in related cash securities because they isolate the risk to one market risk factor and eliminate the other market risk factors. Investments in cash securities (for instance bonds) have exposure to multiple risk factors (credit and interest rate risk). Because swaps require little or no initial cash investment, they can expose the Fund to substantial risk in the isolated market risk factor.
Credit Default Swap Contracts. A credit default swap is a bilateral contract that enables an investor to buy or sell protection on a debt security against a defined-issuer credit event, such as the issuer’s failure to make timely payments of interest or principal on the debt security, bankruptcy or restructuring. The Fund may enter into credit default swaps either by buying or selling protection on a single security or a basket of securities (the “reference asset”).
The buyer of protection pays a periodic fee to the seller of protection based on the notional amount of debt securities underlying the swap contract. The seller of protection agrees to compensate the buyer of protection for future potential losses as a result of a credit event on the reference asset. The contract effectively transfers the credit event risk of the reference asset from the buyer of protection to the seller of protection.
The ongoing value of the contract will fluctuate throughout the term of the contract based primarily on the credit risk of the reference asset. If the credit quality of the reference asset improves relative to the credit quality at contract initiation, the buyer of protection may have an unrealized loss greater than the anticipated periodic fee owed. This unrealized loss would be the result of current credit protection being cheaper than
| OPPENHEIMER INTERNATIONAL BOND FUND | 89 |
NOTES TO FINANCIAL STATEMENTS Unaudited / Continued
6. Risk Exposures and the Use of Derivative Instruments Continued
the cost of credit protection at contract initiation. If the buyer elects to terminate the contract prior to its maturity, and there has been no credit event, this unrealized loss will become realized. If the contract is held to maturity, and there has been no credit event, the realized loss will be equal to the periodic fee paid over the life of the contract.
If there is a credit event, the buyer of protection can exercise its rights under the contract and receive a payment from the seller of protection equal to the notional amount of the reference asset less the market value of the reference asset. Upon exercise of the contract the difference between the value of the underlying reference asset and the notional amount is recorded as realized gain (loss) and is included on the Statement of Operations.
The Fund has sold credit protection through credit default swaps to increase exposure to the credit risk of individual securities and/or, indexes that are either unavailable or considered to be less attractive in the bond market.
The Fund has purchased credit protection through credit default swaps to decrease exposure to the credit risk of individual securities and/or, indexes.
The Fund has engaged in spread curve trades by simultaneously purchasing and selling protection through credit default swaps referenced to the same issuer but with different maturities. Spread curve trades attempt to gain exposure to credit risk on a forward basis by realizing gains on the expected differences in spreads.
For the six months ended March 28, 2013, the Fund had ending monthly average notional amounts of $396,122,411 and $129,521,011 on credit default swaps to buy protection and credit default swaps to sell protection, respectively.
Additional associated risks to the Fund include counterparty credit risk and liquidity risk.
Interest Rate Swap Contracts. An interest rate swap is an agreement between counterparties to exchange periodic payments based on interest rates. One cash flow stream will typically be a floating rate payment based upon a specified interest rate while the other is typically a fixed interest rate.
The Fund has entered into interest rate swaps in which it pays a floating interest rate and receives a fixed interest rate in order to increase exposure to interest rate risk. Typically, if relative interest rates rise, payments made by the Fund under a swap agreement will be greater than the payments received by the Fund.
The Fund has entered into interest rate swaps in which it pays a fixed interest rate and receives a floating interest rate in order to decrease exposure to interest rate risk. Typically, if relative interest rates rise, payments received by the Fund under the swap agreement will be greater than the payments made by the Fund.
For the six months ended March 28, 2013, the Fund had ending monthly average notional amounts of $527,668,927 and $1,276,334,859 on interest rate swaps which pay a fixed rate and interest rate swaps which receive a fixed rate, respectively.
Additional associated risks to the Fund include counterparty credit risk and liquidity risk.
| 90 | OPPENHEIMER INTERNATIONAL BOND FUND |
Volatility Swap Contracts. A volatility swap is an agreement between counterparties to exchange periodic payments based on the measured volatility of a reference security, index, currency or other reference investment over a specified time frame. One cash flow is typically based on the volatility of the reference investment as measured by changes in its price or level while the other cash flow is based on an interest rate or the measured volatility of a different reference investment. The appreciation or depreciation on a volatility swap will typically depend on the magnitude of the reference investment’s volatility, or size of the movement, rather than general directional increases or decreases in its price.
Volatility swaps are less standard in structure than other types of swaps and provide pure, or isolated, exposure to volatility risk of the specific underlying reference investment. Volatility swaps are typically used to speculate on future volatility levels, to trade the spread between realized and expected volatility, or to decrease the volatility exposure of investments held by the Fund.
The Fund has entered into volatility swaps to increase exposure to the volatility risk of various reference investments. These types of volatility swaps require the fund to pay the measured volatility and receive a fixed interest payment over the period of the contract. If the measured volatility of the related reference investment increases over the period, the swaps will depreciate in value. Conversely, if the measured volatility of the related reference investment decreases over the period, the swaps will appreciate in value.
The Fund has entered into volatility swaps to decrease exposure to the volatility risk of various reference investments. These types of volatility swaps require the fund to pay a fixed interest payment and receive the measured volatility over the period of the contract. If the measured volatility of the related reference investment increases over the period, the swaps will appreciate in value. Conversely, if the measured volatility of the related reference investment decreases over the period, the swaps will depreciate in value.
For the six months ended March 28, 2013, the Fund had ending monthly average notional amounts of $439,636 and $734,460 on volatility swaps which pay volatility and volatility swaps which receive volatility, respectively.
Additional associated risks to the Fund include counterparty credit risk and liquidity risk.
Swaption Transactions
The Fund may enter into a swaption contract which grants the purchaser the right, but not the obligation, to enter into a swap transaction at preset terms detailed in the underlying agreement within a specified period of time. The purchaser pays a premium to the swaption writer who bears the risk of unfavorable changes in the preset terms on the underlying swap.
Swaptions are marked to market daily using primarily portfolio pricing services or quotations from counterparties and brokers. Purchased swaptions are reported as a component of investments in the Statement of Investments, the Statement of Assets and Liabilities and the Statement of Operations. Written swaptions are reported on a schedule
| OPPENHEIMER INTERNATIONAL BOND FUND | 91 |
NOTES TO FINANCIAL STATEMENTS Unaudited / Continued
6. Risk Exposures and the Use of Derivative Instruments Continued
following the Statement of Investments and their value is reported as a separate asset or liability line item in the Statement of Assets and Liabilities. The net change in unrealized appreciation or depreciation on written swaptions is separately reported in the Statement of Operations. When a swaption is exercised, the cost of the swap is adjusted by the amount of premium paid or received. Upon the expiration or closing of an unexercised swaption contract, a gain or loss is reported in the Statement of Operations for the amount of the premium paid or received.
The Fund generally will incur a greater risk when it writes a swaption than when it purchases a swaption. When the Fund writes a swaption it will become obligated, upon exercise of the swaption, according to the terms of the underlying agreement. Swaption contracts written by the Fund do not give rise to counterparty credit risk as they obligate the Fund, not its counterparty, to perform. When the Fund purchases a swaption it only risks losing the amount of the premium it paid if the swaption expires unexercised. However, when the Fund exercises a purchased swaption there is a risk that the counterparty will fail to perform or otherwise default on its obligations under the swaption contract.
The Fund purchased swaptions which give it the option to enter into an interest rate swap in which it pays a floating interest rate and receives a fixed interest rate in order to increase exposure to interest rate risk. A purchased swaption of this type becomes more valuable as the reference interest rate depreciates relative to the preset interest rate.
The Fund has purchased swaptions which give it the option to enter into an interest rate swap in which it pays a fixed interest rate and receives a floating interest rate in order to decrease exposure to interest rate risk. A purchased swaption of this type becomes more valuable as the reference interest rate appreciates relative to the preset interest rate.
The Fund has purchased swaptions which give it the option to sell credit protection through credit default swaps in order to increase exposure to the credit risk of individual securities and, or, indexes. A purchased swaption of this type becomes more valuable as the likelihood of a credit event on the reference asset decreases.
The Fund has purchased swaptions which give it the option to buy credit protection through credit default swaps in order to decrease exposure to the credit risk of individual securities and, or, indexes. A purchased swaption of this type becomes more valuable as the likelihood of a credit event on the reference asset increases.
The Fund has written swaptions which give it the obligation, if exercised by the purchaser, to enter into an interest rate swap in which it pays a floating interest rate and receives a fixed interest rate in order to increase exposure to interest rate risk. A written swaption of this type becomes more valuable as the reference interest rate depreciates relative to the preset interest rate.
The Fund has written swaptions which give it the obligation, if exercised by the purchaser, to enter into an interest rate swap in which it pays a fixed interest rate and receives a floating interest rate in order to decrease exposure to interest rate risk. A written swaption of this type becomes more valuable as the reference interest rate appreciates relative to the preset interest rate.
The Fund has written swaptions which give it the obligation, if exercised by the purchaser, to sell credit protection through credit default swaps in order to increase exposure to the
| 92 | OPPENHEIMER INTERNATIONAL BOND FUND |
credit risk of individual securities and/or, indexes. A written swaption of this type becomes more valuable as the likelihood of a credit event on the reference asset decreases.
The Fund has written swaptions which give it the obligation, if exercised by the purchaser, to buy credit protection through credit default swaps in order to decrease exposure to the credit risk of individual securities and, or, indexes. A written swaption of this type becomes more valuable as the likelihood of a credit event on the reference asset increases.
During the six months ended March 28, 2013, the Fund had an ending monthly average market value of $80,030,046 and $85,579,084 on purchased and written swaptions, respectively.
Written swaption activity for the six months ended March 28, 2013 was as follows:
| Call Swaptions |
||||||||
| Notional Amount |
Amount of Premiums |
|||||||
| Swaptions outstanding as of | ||||||||
| September 28, 2012 | $ | 4,463,288,346 | $ | 93,319,898 | ||||
| Swaptions written | 14,846,080,000 | 171,629,712 | ||||||
| Swaptions closed or expired | (11,564,938,346 | ) | (153,245,934 | ) | ||||
| Swaptions exercised | (466,715,000 | ) | (3,285,177 | ) | ||||
| Swaptions outstanding as of March 28, 2013 | $ | 7,277,715,000 | $ | 108,418,499 | ||||
7. Restricted Securities
As of March 28, 2013, investments in securities included issues that are restricted. A restricted security may have a contractual restriction on its resale and is valued under methods approved by the Board of Trustees as reflecting fair value. Securities that are restricted are marked with an applicable footnote on the Statement of Investments. Restricted securities are reported on a schedule following the Statement of Investments.
8. Pending Litigation
Since 2009, a number of class action lawsuits have been pending in federal courts against OppenheimerFunds, Inc. (“OFI”), OppenheimerFunds Distributor, Inc., the Fund’s principal underwriter and distributor (the “Distributor”), and certain funds (but not including the Fund) advised by the Manager and distributed by the Distributor (the “Defendant Funds”). Several of these lawsuits also name as defendants certain officers and current and former trustees of the respective Defendant Funds. The lawsuits raise claims under federal securities law and allege, among other things, that the disclosure documents of the respective Defendant Funds contained misrepresentations and omissions and that the respective Defendant Funds’ investment policies were not followed. The plaintiffs in these actions seek unspecified damages, equitable relief and awards of attorneys’ fees and litigation expenses. The Defendant Funds’ Boards of Trustees have also engaged counsel to represent the Funds and the present and former Independent Trustees named in those suits.
Other class action and individual lawsuits have been filed since 2008 in various state and federal courts against OFI and certain of its affiliates by investors seeking to recover
| OPPENHEIMER INTERNATIONAL BOND FUND | 93 |
NOTES TO FINANCIAL STATEMENTS Unaudited / Continued
8. Pending Litigation Continued
investments they allegedly lost as a result of the “Ponzi” scheme run by Bernard L. Madoff and his firm, Bernard L. Madoff Investment Securities, LLC (“BLMIS”). Plaintiffs in these suits allege that they suffered losses as a result of their investments in several funds managed by an affiliate of OFI and assert a variety of claims, including breach of fiduciary duty, fraud, negligent misrepresentation, unjust enrichment, and violation of federal and state securities laws and regulations, among others. They seek unspecified damages, equitable relief and awards of attorneys’ fees and litigation expenses. Neither the Distributor, nor any of the Oppenheimer mutual funds, their independent trustees or directors are named as defendants in these lawsuits. None of the Oppenheimer mutual funds invested in any funds or accounts managed by Madoff or BLMIS. On February 28, 2011, a stipulation of partial settlement of three groups of consolidated putative class action lawsuits relating to these matters was filed in the U.S. District Court for the Southern District of New York. On August 19, 2011, the court entered an order and final judgment approving the settlement as fair, reasonable and adequate. In September 2011, certain parties filed notices of appeal from the court’s order approving the settlement. The settlement does not resolve other outstanding lawsuits against OFI and its affiliates relating to BLMIS.
On April 16, 2010, a lawsuit was filed in New York state court against (i) OFI, (ii) an affiliate of OFI and (iii) AAArdvark IV Funding Limited (“AAArdvark IV”), an entity advised by OFI’s affiliate, in connection with investments made by the plaintiffs in AAArdvark IV. Plaintiffs allege breach of contract and common law fraud claims against the defendants and seek compensatory damages, costs and disbursements, including attorney fees. On April 11, 2013, the court granted defendants’ motion for summary judgment, dismissing plaintiffs’ fraud claim with prejudice and dismissing their contract claim without prejudice, and granted plaintiffs leave to replead their contract claim to assert a cause of action for specific performance within 30 days. The court’s decision is subject to appeal. On July 15, 2011, a lawsuit was filed in New York state court against OFI, an affiliate of OFI and AAArdvark Funding Limited (“AAArdvark I”), an entity advised by OFI’s affiliate, in connection with investments made by the plaintiffs in AAArdvark I. The complaint alleges breach of contract and common law fraud claims against the defendants and seeks compensatory damages, costs and disbursements, including attorney fees. On November 9, 2011, a lawsuit was filed in New York state court against OFI, an affiliate of OFI and AAArdvark XS Funding Limited (“AAArdvark XS”), an entity advised by OFI’s affiliate, in connection with investments made by the plaintiffs in AAArdvark XS. The complaint alleges breach of contract against the defendants and seeks compensatory damages, costs and disbursements, including attorney fees.
OFI believes the lawsuits and appeals described above are without legal merit and, with the exception of actions it has settled, is defending against them vigorously. While it is premature to render any opinion as to the outcome in these lawsuits, or whether any costs that the Defendant Funds may bear in defending the suits might not be reimbursed by insurance, OFI believes that these suits should not impair the ability of OFI or the Distributor to perform their respective duties to the Fund, and that the outcome of all of the suits together should not have any material effect on the operations of any of the Oppenheimer mutual funds.
| 94 | OPPENHEIMER INTERNATIONAL BOND FUND |
PORTFOLIO PROXY VOTING POLICIES AND PROCEDURES;
UPDATES TO STATEMENTS OF INVESTMENTS Unaudited
The Fund has adopted Portfolio Proxy Voting Policies and Procedures under which the Fund votes proxies relating to securities (“portfolio proxies”) held by the Fund. A description of the Fund’s Portfolio Proxy Voting Policies and Procedures is available (i) without charge, upon request, by calling the Fund toll-free at 1.800.CALL OPP (225.5677), (ii) on the Fund’s website at oppenheimerfunds.com, and (iii) on the SEC’s website at www.sec.gov. In addition, the Fund is required to file Form N-PX, with its complete proxy voting record for the 12 months ended June 30th, no later than August 31st of each year. The Fund’s voting record is available (i) without charge, upon request, by calling the Fund toll-free at 1.800.CALL OPP (225.5677), and (ii) in the Form N-PX filing on the SEC’s website at www.sec.gov.
The Fund files its complete schedule of portfolio holdings with the SEC for the first quarter and the third quarter of each fiscal year on Form N-Q. The Fund’s Form N-Q filings are available on the SEC’s website at www.sec.gov. Those forms may be reviewed and copied at the SEC’s Public Reference Room in Washington, D.C. Information on the operation of the Public Reference Room may be obtained by calling 1-800-SEC-0330.
Householding—Delivery of Shareholder Documents
This is to inform you about OppenheimerFunds’ “householding” policy. If more than one member of your household maintains an account in a particular fund, OppenheimerFunds will mail only one copy of the fund’s prospectus (or, if available, the fund’s summary prospectus), annual and semiannual report and privacy policy. The consolidation of these mailings, called householding, benefits your fund through reduced mailing expense, and benefits you by reducing the volume of mail you receive from OppenheimerFunds. Householding does not affect the delivery of your account statements.
Please note that we will continue to household these mailings for as long as you remain an OppenheimerFunds shareholder, unless you request otherwise. If you prefer to receive multiple copies of these materials, please call us at 1.800.CALL-OPP (225-5677). You may also notify us in writing or via email. We will begin sending you individual copies of the prospectus (or, if available, the summary prospectus), reports and privacy policy within 30 days of receiving your request to stop householding.
| OPPENHEIMER INTERNATIONAL BOND FUND | 95 |
OPPENHEIMER INTERNATIONAL BOND FUND
| Trustees and Officers | Sam Freedman, Chairman of the Board of Trustees and Trustee Edward L. Cameron, Trustee Jon S. Fossel, Trustee Richard F. Grabish, Trustee Beverly L. Hamilton, Trustee Victoria J. Herget, Trustee Robert J. Malone, Trustee F. William Marshall, Jr., Trustee Karen L. Stuckey, Trustee James D. Vaughn, Trustee William F. Glavin, Jr., Trustee, President and Principal Executive Officer Arthur Steinmetz, Vice President Sara Zervos, Ph.D., Vice President Hemant Baijal, Vice President Arthur S. Gabinet, Secretary and Chief Legal Officer Christina M. Nasta, Vice President and Chief Business Officer Mark S. Vandehey, Vice President and Chief Compliance Officer Brian W. Wixted, Treasurer and Principal Financial & Accounting Officer | |
| Manager | OFI Global Asset Management, Inc. | |
| Sub-Adviser | OppenheimerFunds, Inc. | |
| Distributor | OppenheimerFunds Distributor, Inc. | |
| Transfer and Shareholder Servicing Agent | OFI Global Asset Management, Inc. | |
| Sub-Transfer Agent | Shareholder Services, Inc. DBA OppenheimerFunds Services | |
| Independent Registered Public Accounting Firm |
KPMG LLP | |
| Counsel | K&L Gates LLP | |
| The financial statements included herein have been taken from the records of the Fund without examination of those records by the independent registered public accounting firm. | ||
©2013 OppenheimerFunds, Inc. All rights reserved.
| 96 | OPPENHEIMER INTERNATIONAL BOND FUND |
As an Oppenheimer fund shareholder, you are entitled to know how we protect your personal information and how we limit its disclosure.
Information Sources
We obtain nonpublic personal information about our shareholders from the following sources:
| l | Applications or other forms |
| l | When you create a user ID and password for online account access |
| l | When you enroll in eDocs Direct, our electronic document delivery service |
| l | Your transactions with us, our affiliates or others |
| l | A software program on our website, often referred to as a “cookie,” which indicates which parts of our site you’ve visited |
| l | When you set up challenge questions to reset your password online |
If you visit oppenheimerfunds.com and do not log on to the secure account information areas, we do not obtain any personal information about you. When you do log on to a secure area, we do obtain your user ID and password to identify you. We also use this information to provide you with products and services you have requested, to inform you about products and services that you may be interested in and assist you in other ways.
We do not collect personal information through our website unless you willingly provide it to us, either directly by email or in those areas of the website that request information. In order to update your personal information (including your mailing address, email address and phone number) you must first log on and visit your user profile.
If you have set your browser to warn you before accepting cookies, you will receive the warning message with each cookie. You can refuse cookies by turning them off in your browser. However, doing so may limit your access to certain sections of our website.
We use cookies to help us improve and manage our website. For example, cookies help us recognize new versus repeat visitors to the site, track the pages visited, and enable some special features on the website. This data helps us provide a better service for our website visitors.
Protection of Information
We do not disclose any non-public personal information (such as names on a customer list) about current or former customers to anyone, except as permitted by law.
Disclosure of Information
We send your financial advisor (as designated by you) copies of confirmations, account statements and other documents reporting activity in your fund accounts. We may also use details about you and your investments to help us, our financial service affiliates, or firms that jointly market their financial products and services with ours, to better serve your investment needs or suggest financial services or educational material that may be of interest to you. If this requires us to provide you with an opportunity to “opt in” or “opt out” of such information sharing with a firm not affiliated with us, you will receive notification on how to do so, before any such sharing takes place.
Right of Refusal
We will not disclose your personal information to unaffiliated third parties (except as permitted by law), unless we first offer you a reasonable opportunity to refuse or “opt out” of such disclosure.
Internet Security and Encryption
In general, the email services provided by our website are encrypted and provide a secure and private means of communication with us. To protect your own privacy, confidential and/or personal information should only be communicated via email when you are advised that you are using a secure website.
| OPPENHEIMER INTERNATIONAL BOND FUND | 97 |
PRIVACY POLICY
As a security measure, we do not include personal or account information in non-secure emails, and we advise you not to send such information to us in non-secure emails. Instead, you may take advantage of the secure features of our website to encrypt your email correspondence. To do this, you will need to use a browser that supports Secure Sockets Layer (SSL) protocol.
We do not guarantee or warrant that any part of our website, including files available for download, are free of viruses or other harmful code. It is your responsibility to take appropriate precautions, such as use of an anti-virus software package, to protect your computer hardware and software.
| l | All transactions, including redemptions, exchanges and purchases, are secured by SSL and 128-bit encryption. SSL is used to establish a secure connection between your PC and OppenheimerFunds’ server. It transmits information in an encrypted and scrambled format. |
| l | Encryption is achieved through an electronic scrambling technology that uses a “key” to code and then decode the data. Encryption acts like the cable converter box you may have on your television set. It scrambles data with a secret code so that no one can make sense of it while it is being transmitted. When the data reaches its destination, the same software unscrambles the data. |
| l | You can exit the secure area by either closing your browser, or for added security, you can use the Log Out button before you close your browser. |
Other Security Measures
We maintain physical, electronic and procedural safeguards to protect your personal account information. Our employees and agents have access to that information only so that they may offer you products or provide services, for example, when responding to your account questions.
How You Can Help
You can also do your part to keep your account information private and to prevent unauthorized transactions. If you obtain a user ID and password for your account, do not allow it to be used by anyone else. Also, take special precautions when accessing your account on a computer used by others.
Who We Are
This joint notice describes the privacy policies of the Oppenheimer funds, OppenheimerFunds, Inc., and each of its financial institution subsidiaries, the trustee of OppenheimerFunds Individual Retirement Accounts (IRAs) and the custodian of the OppenheimerFunds 403(b)(7) tax sheltered custodial accounts. It applies to all Oppenheimer fund accounts you presently have, or may open in the future, using your Social Security number—whether or not you remain a shareholder of our funds. This notice was last updated November 2012. In the event it is updated or changed, we will post an updated notice on our website at oppenheimerfunds.com. If you have any questions about these privacy policies, write to us at P.O. Box 5270, Denver, CO 80217-5270, email us by clicking on the Contact Us section of our website at oppenheimerfunds.com or call us at 1.800.CALL OPP (225.5677).
| 98 | OPPENHEIMER INTERNATIONAL BOND FUND |
Visit us at oppenheimerfunds.com for 24-hr access to account information and transactions or call us at 1.800.CALL OPP (1.800.225.5677) for 24-hr automated information and automated transactions. Representatives also available Mon-Fri 8am-8pm ET.
Oppenheimer funds are distributed by OppenheimerFunds Distributor, Inc.
RS0880.001.0313 May 20, 2013
Item 2. Code of Ethics.
Not applicable to semiannual reports.
Item 3. Audit Committee Financial Expert.
Not applicable to semiannual reports.
Item 4. Principal Accountant Fees and Services.
Not applicable to semiannual reports.
Item 5. Audit Committee of Listed Registrants
Not applicable.
Item 6. Schedule of Investments.
a) Not applicable. The complete schedule of investments is included in Item 1 of this Form N-CSR.
b) Not applicable.
Item 7. Disclosure of Proxy Voting Policies and Procedures for Closed-End Management Investment Companies.
Not applicable.
Item 8. Portfolio Managers of Closed-End Management Investment Companies.
Not applicable.
Item 9. Purchases of Equity Securities by Closed-End Management Investment Company and Affiliated Purchasers.
Not applicable.
Item 10. Submission of Matters to a Vote of Security Holders.
The Fund’s Governance Committee Provisions with Respect to Nominations of Directors/Trustees to the Respective Boards
None
Item 11. Controls and Procedures.
Based on their evaluation of the registrant’s disclosure controls and procedures (as defined in rule 30a-3(c) under the Investment Company Act of 1940 (17 CFR 270.30a-3(c)) as of 3/28/2013, the registrant’s principal executive officer and principal financial officer found the registrant’s disclosure controls and procedures to provide reasonable assurances that information required to be disclosed by the registrant in the reports that it files under the Securities Exchange Act of 1934 (a) is accumulated and communicated to registrant’s management, including its principal executive officer and principal financial officer, to allow timely decisions regarding required disclosure, and (b) is recorded, processed, summarized and reported, within the time periods specified in the rules and forms adopted by the U.S. Securities and Exchange Commission.
There have been no changes in the registrant’s internal controls over financial reporting that occurred during the registrant’s second fiscal quarter of the period covered by this report that have materially affected, or are reasonably likely to materially affect, the registrant’s internal control over financial reporting.
Item 12. Exhibits.
| (a) |
(1) | Not applicable to semiannual reports. |
| (2) | Exhibits attached hereto. |
| (3) | Not applicable. |
| (b) | Exhibit attached hereto. |
SIGNATURES
Pursuant to the requirements of the Securities Exchange Act of 1934 and the Investment Company Act of 1940, the registrant has duly caused this report to be signed on its behalf by the undersigned, thereunto duly authorized.
Oppenheimer International Bond Fund
| By: | /s/ William F. Glavin, Jr. | |
| William F. Glavin, Jr. | ||
| Principal Executive Officer |
Date: 5/8/2013
Pursuant to the requirements of the Securities Exchange Act of 1934 and the Investment Company Act of 1940, this report has been signed below by the following persons on behalf of the registrant and in the capacities and on the dates indicated.
| By: | /s/ William F. Glavin, Jr. | |
| William F. Glavin, Jr. | ||
| Principal Executive Officer |
Date: 5/8/2013
| By: | /s/ Brian W. Wixted | |
| Brian W. Wixted | ||
| Principal Financial Officer |
Date: 5/8/2013