Exhibit 99.5
Exhibit 99.5

ASML Holding N.V.
Statutory Interim Report
for the six-month period ended July 1, 2012
Contents
| 5 |
Interim Management Board Report |
| 10 |
Managing Directors’ Statement |
| 11 |
Consolidated Condensed Interim Financial Statements |
This report comprises
regulated information within the meaning of articles 1:1 and 5:25d of the Dutch Financial Markets Supervision Act (Wet op het Financieel Toezicht).
In this report the name “ASML” is sometimes used for convenience in contexts where reference is made to ASML Holding N.V. and/or any of its subsidiaries in general. The name is also used where
no useful purpose is served by identifying the particular company or companies.
© 2012, ASML Holding N.V. All Rights Reserved
|
|
|
|
|
| ASML Statutory Interim Report 2012 |
|
|
|
|
Introduction
Dear Stakeholder,
ASML Holding N.V. (“ASML”) today published its Statutory Interim
Report for the six-month period ended July 1, 2012. This report includes an Interim Management Board Report, a Managing Directors’ Statement and Consolidated Condensed Interim Financial Statements prepared in accordance with IAS 34.
Today, ASML also published its 2012 second-quarter results in accordance with the United States Generally Accepted Accounting Principles
(“U.S. GAAP”) and International Financial Reporting Standards (“IFRS”) as adopted by the European Union (“EU”).
Veldhoven, July 18, 2012
|
|
|
|
|
| ASML Statutory Interim Report 2012 |
|
4 |
|
|
Interim Management Board Report
About ASML
ASML is one of the world’s leading providers (measured in revenues) of
lithography equipment that is critical to the production of ICs (“Integrated Circuits”) or chips. Headquartered in Veldhoven, the Netherlands, ASML operates globally, with activities in Europe, the United States and Asia. As of
July 1, 2012, we employed 8,010 payroll and 1,860 temporary employees (measured in full-time employees “FTEs”). ASML provides optimal service to its customers via over 60 sales and service organizations in 16 countries.
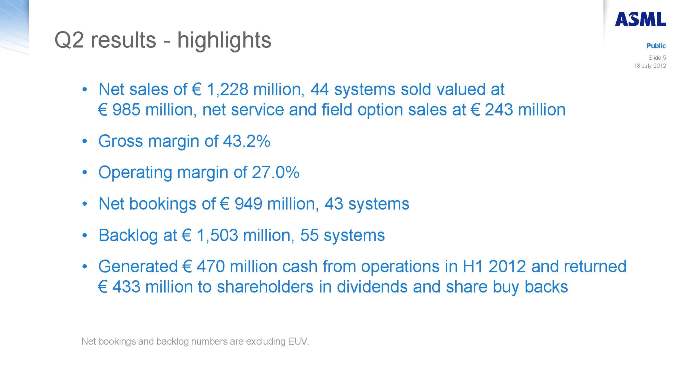
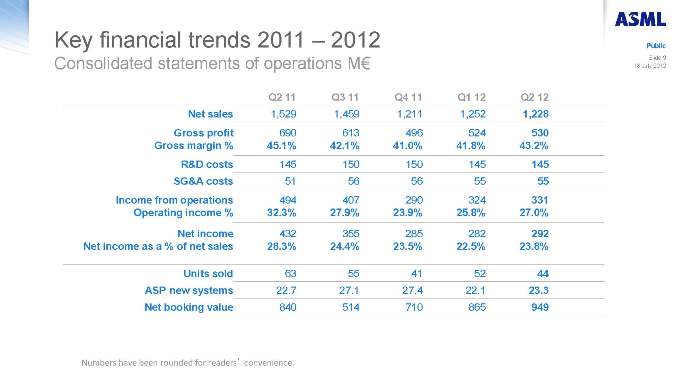
In the first half of 2012, we generated net sales of EUR 2,479.6 million and an operating income of EUR 753.2 million or 30.4 percent of net
sales. Net income for the first half of 2012 amounted to EUR 658.9 million or 26.6 percent of net sales, representing a basic net income per ordinary share of EUR 1.60.
Below we provide an update of the risks and uncertainties the Company faces in the second half of 2012, followed by the ASML operations update and 2012 second half perspectives.
Risk Factors
In conducting our
business, we face many risks that may interfere with our business objectives. Some of these risks relate to our operational processes, while others relate to our business environment. It is important to understand the nature of these risks and the
impact they may have on our business, financial condition and results of operations. Some of the more relevant risks are described below. These risks are not the only ones that ASML faces. Some risks may not yet be known to ASML and certain risks
that ASML does not currently believe to be material could become material in the future. The Company has assessed the risks for the second half of 2012 and believes that the risks identified are in line with those presented in the Statutory Annual
Report 2011. For a detailed description of the risks defined below, we refer to the Statutory Annual Report 2011.
Strategic risks
| |
• |
|
We derive most of our revenues from the sale of a relatively small number of products. |
Risks related to the semiconductor industry
| |
• |
|
The semiconductor industry is highly cyclical and we may be adversely affected by any downturn; |
| |
• |
|
Our business will suffer if we do not respond rapidly to commercial and technological changes in the semiconductor industry; and
|
| |
• |
|
We face intense competition. |
Governmental, legal and compliance risks
| |
• |
|
Failure to adequately protect the intellectual property rights upon which we depend could harm our business; |
| |
• |
|
Defending against intellectual property claims brought by others could harm our business; |
| |
• |
|
We are subject to risks in our international operations; and |
| |
• |
|
Because of labor laws and practices, any workforce reductions that we may seek to implement in order to reduce costs company-wide may be delayed or
suspended. |
Operational risks
| |
• |
|
The number of systems we can produce is limited by our dependence on a limited number of suppliers of key components; |
| |
• |
|
The pace of introduction of our new products is accelerating and is accompanied by potential design and production delays and by significant costs;
|
| |
• |
|
We are dependent on the continued operation of a limited number of manufacturing facilities; |
| |
• |
|
We may be unable to make desirable acquisitions or to integrate successfully any businesses we acquire; and |
| |
• |
|
Our business and future success depend on our ability to attract and retain a sufficient number of adequately educated and skilled employees.
|
|
|
|
|
|
| ASML Statutory Interim Report 2012 |
|
5 |
|
|
Financial risks
| |
• |
|
A high percentage of net sales is derived from a few customers; and |
| |
• |
|
Fluctuations in foreign exchange rates could harm our results of operations. |
Risks related to our ordinary shares
| |
• |
|
We may not declare cash dividends at all or in any particular amounts in any given year; |
| |
• |
|
The price of our ordinary shares is volatile; and |
| |
• |
|
Restrictions on shareholder rights may dilute voting power. |
Risks related to our recently announced customer co-investment program
On July 9,
2012, ASML announced its co-investment program (as described in more detail in Subsequent Events, note 15). The program contemplates amongst others an issuance of new shares, a synthetic share buy-back and NRE funding commitments.
The share issuances are subject to regulatory approvals, and if these approvals are not obtained, certain customers participating in this program
(including Intel) will not be obligated to purchase shares. Funding commitments under the NRE funding agreements are contingent upon the issuance of shares to be purchased by the relevant customer, so if regulatory approvals are not obtained for the
share issuances to a particular customer, then such customer will not be obligated to fund its NRE funding commitments.
In addition, part of
the Share Issuance (“Second Issuance”) and the synthetic buyback are subject to shareholder approval. If shareholder approval is not obtained, there will not be a Second Issuance or a synthetic buyback, and in this case the number of our
shares would increase by 9.99%, and while Intel would remain obligated to fund its 450mm NRE commitments, customers (including Intel) would not be obligated to fund EUV NRE commitments.
There are also risks associated with the NRE funding program, including the risk that we may be unable to hire sufficient numbers of qualified employees to execute the EUV and 450mm R&D programs
associated with the NRE commitments. In addition, there are no assurances that these R&D programs will be successful, and if successful, will result in customer acceptance of these technologies.
|
|
|
|
|
| ASML Statutory Interim Report 2012 |
|
6 |
|
|
ASML Operations Update
For internal and external reporting purposes, ASML follows accounting principles generally accepted in the United States of America (“U.S. GAAP”). U.S. GAAP is ASML’s primary accounting
standard for the Company’s setting of financial and operational performance targets. However the Consolidated Condensed Interim Financial Statements for the six-month period ended July 1, 2012 have been prepared in accordance with
International Accounting Standard 34 (“IAS 34”). Based on US GAAP, net income, as explained in the table below, is measured differently from net income based on IFRS as adopted by the EU.
|
|
|
|
|
|
|
|
|
| For the six-month period ended July 1, 2012 and June, 26, 2011 |
|
Unaudited |
|
|
Unaudited |
|
| |
|
2012 |
|
|
2011 |
|
| (in millions) |
|
EUR |
|
|
EUR |
|
| Net income for management reporting purposes for U.S. GAAP |
|
|
573.9 |
|
|
|
827.1 |
|
| Development expenditures |
|
|
74.7 |
|
|
|
(19.4 |
) |
| Share-based payments |
|
|
0.2 |
|
|
|
(0.2 |
) |
| Reversal of write downs |
|
|
7.2 |
|
|
|
3.0 |
|
| Income taxes |
|
|
2.9 |
|
|
|
16.4 |
|
|
|
|
|
|
|
|
|
|
| Net income for IFRS |
|
|
658.9 |
|
|
|
826.9 |
|
Set forth below are certain extracts of our Consolidated Condensed Income Statement data on a semi-annual basis (based on
IAS 34):
|
|
|
|
|
|
|
|
|
| For the six-month period ended July 1, 2012 and June, 26, 2011 |
|
|
|
|
|
|
| |
|
2012 |
|
|
2011 |
|
| (in millions) |
|
EUR |
|
|
EUR |
|
| Total net sales |
|
|
2,479.6 |
|
|
|
2,981.6 |
|
| Cost of sales |
|
|
1,469.0 |
|
|
|
1,696.2 |
|
| Gross profit on sales |
|
|
1,010.6 |
|
|
|
1,285.4 |
|
| Research and development costs |
|
|
150.2 |
|
|
|
258.4 |
|
| Selling, general and administrative costs |
|
|
107.2 |
|
|
|
104.8 |
|
| Operating income |
|
|
753.2 |
|
|
|
922.2 |
|
| Interest income (expense), net |
|
|
(1.1 |
) |
|
|
0.7 |
|
| Income before income taxes |
|
|
752.1 |
|
|
|
922.9 |
|
| Provision for income taxes |
|
|
(93.2 |
) |
|
|
(96.0 |
) |
| Net income |
|
|
658.9 |
|
|
|
826.9 |
|
The following table shows a summary of key financial figures on a semi-annual basis:
|
|
|
|
|
|
|
|
|
| For the six-month period ended July 1, 2012 and June, 26, 2011 |
|
|
|
|
|
|
| |
|
2012 |
|
|
2011 |
|
| Net sales (EUR million) |
|
|
2,479.6 |
|
|
|
2,981.6 |
|
| Net system sales (EUR million) |
|
|
2,034.8 |
|
|
|
2,618.0 |
|
| Net service and field option sales (EUR million) |
|
|
444.8 |
|
|
|
363.6 |
|
| Sales of systems (in units) |
|
|
96 |
|
|
|
126 |
|
| Sales of new systems (in units) |
|
|
89 |
|
|
|
114 |
|
| Sales of used systems (in units) |
|
|
7 |
|
|
|
12 |
|
| Gross profit on sales as a percentage of net sales |
|
|
40.8 |
|
|
|
43.1 |
|
| Average selling price (ASP) of total system sales (EUR million) |
|
|
21.2 |
|
|
|
20.8 |
|
| Average selling price (ASP) of new system sales (EUR million) |
|
|
22.7 |
|
|
|
22.6 |
|
| Average selling price (ASP) of used system sales (EUR million) |
|
|
2.4 |
|
|
|
3.5 |
|
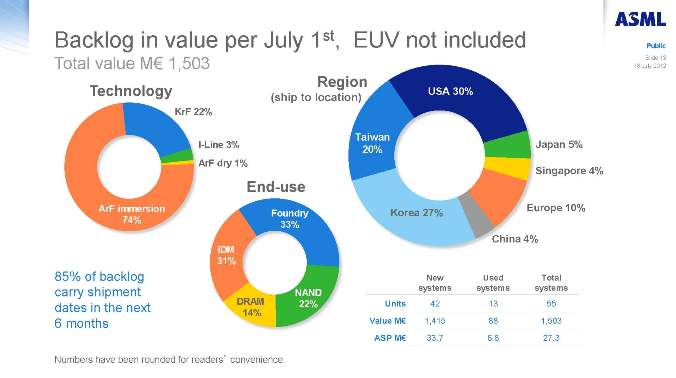
| Value of systems backlog excluding EUV (EUR million)1 |
|
|
1,503.4 |
|
|
|
2,755.5 |
|
| Systems backlog excluding EUV (in units)1 |
|
|
55 |
|
|
|
105 |
|
| Average selling price of systems backlog excluding EUV (EUR million)1 |
|
|
27.3 |
|
|
|
26.2 |
|
| 1 |
Through July 1, 2012 a total of 6 NXE:3100 systems have been shipped (June 26, 2011: 4). Four of these systems were recognized in net system sales (3 systems in
the second half year of 2011 and one in the first half year of 2012) (June 26, 2011: nil), one was shipped under the conditions of an operating lease contract and one was shipped to a research institute. |
Consolidated Sales and Gross Profit
Net
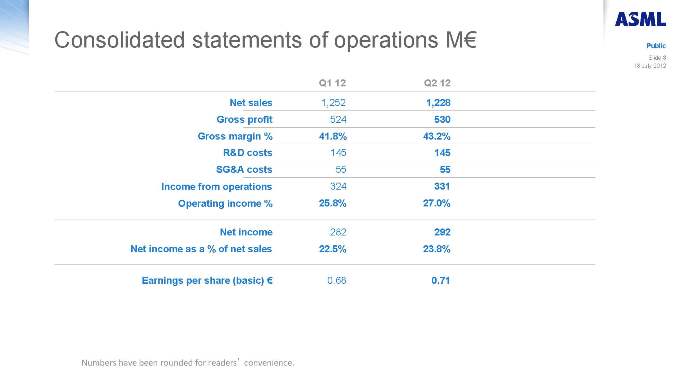
sales decreased by EUR 502.0 million from EUR 2,981.6 million for the first half of 2011 to EUR 2,479.6 million for the first half of 2012 which is mainly caused by a decrease in the number of systems recognized from 126 systems in
the first half of 2011 to 96 systems in the first half of 2012.
|
|
|
|
|
| ASML Statutory Interim Report 2012 |
|
7 |
|
|
Gross profit on sales decreased from EUR 1,285.4 million or 43.1 percent of net sales for the first
half of 2011 to EUR 1,010.6 million or 40.8 percent of net sales for the first half of 2012. The main drivers for the decrease of gross profit in the first half year of 2012 compared to the first half year of 2011 are lower sales levels
(including one EUV system with zero margin) and increased additions to the provision for obsolete inventory caused by certain obsolete parts due to technological development and design changes.
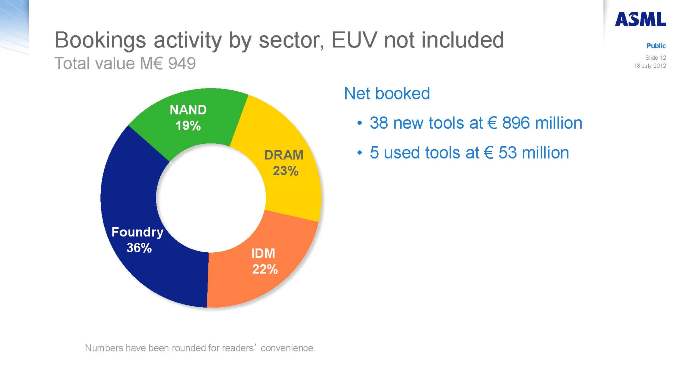
We started 2012 with a backlog of 71 systems. During the first half of 2012, we booked orders for 79 systems and recognized sales for 95 systems
(excluding EUV: 1 system). This resulted in a backlog of 55 systems as of July 1, 2012. The total value of our systems backlog as of July 1, 2012 amounted to EUR 1,503.4 million with an ASP of EUR 27.3 million, reflecting a mix
of systems for all chip layers. The systems backlog as of December 31, 2011 amounted to EUR 1,732.5 million with an ASP of EUR 24.4 million.
Research and Development
Research and development (“R&D”) investments (which
include R&D costs, net of credits and additions to other intangible assets regarding development expenditures) increased by EUR 3.2 million or 1.1 percent from EUR 290.1 million for the first half of 2011 (EUR 258.4 million
R&D costs and EUR 31.7 million addition to other intangible assets regarding development expenditures) to EUR 293.3 million (EUR 150.2 million R&D costs and EUR 143.1 million addition to other intangible assets regarding
development expenditures) for the first half of 2012. The total R&D investments were approximately at the same level as during the first half of 2011. The increase in the additions in intangible assets regarding capitalized development
expenditures mainly relate to EUV (Extreme Ultraviolet lithography) and an enhanced version of the NXT.
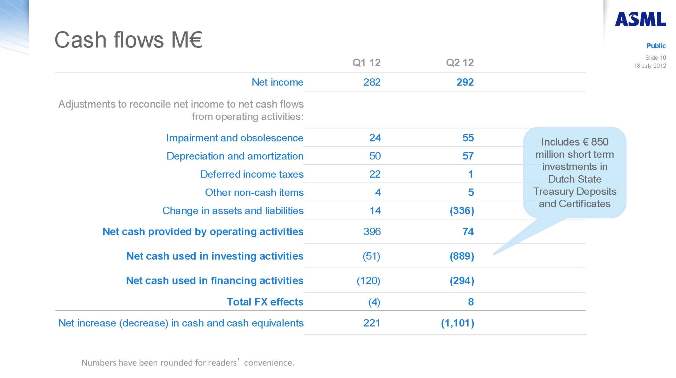
Cash Flows from Operating
Activities
We generated postive net cash by operating activities of EUR 609.6 million and EUR 1,631.6 million in the first half
of 2012 and 2011 respectively. Lower net cash provided by operating activities in the first half of 2012 relates to lower sales levels compared to the first half of 2011. Furthermore operating cash is mainly negatively impacted by increased
inventories in relation to EUV, lower amounts of EUV downpayments received and a decrease in accounts payable due to payments of our largest supplier at quarter end.
Cash Flows from Investing Activities
We used EUR 1,079.1 million for investing
activities in the first half of 2012 and EUR 159.1 million in the first half of 2011. Investing activities in the first half of 2012 significantly increased compared to the first half year of 2011 as a result of purchasing Dutch Treasury
Certificates and deposits with the Dutch Government.
Cash Flows from Financing Activities
Net cash used in financing activities was EUR 414.3 million in the first half of 2012 compared to EUR 666.0 million in the first half of 2011.
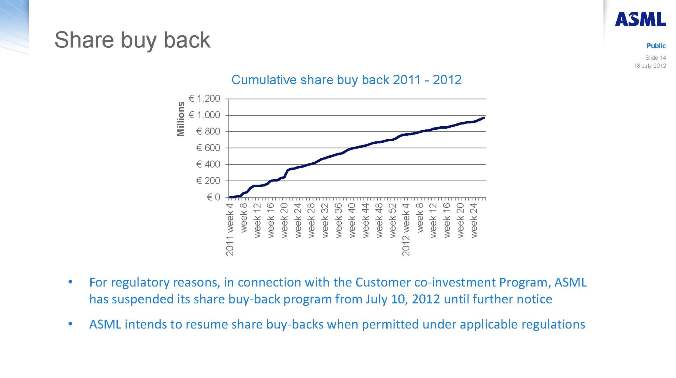
Net cash used in financing activities in the first half of 2012 mainly included EUR 188.9 million dividend payment and EUR 244.5 million share buybacks.
Auditors’ Involvement
This Statutory Interim Report and the Consolidated Condensed
Interim Financial Statements included herein have not been audited or reviewed by an external auditor.
|
|
|
|
|
| ASML Statutory Interim Report 2012 |
|
8 |
|
|
2012 Second Half Year Perspectives
Operational outlook
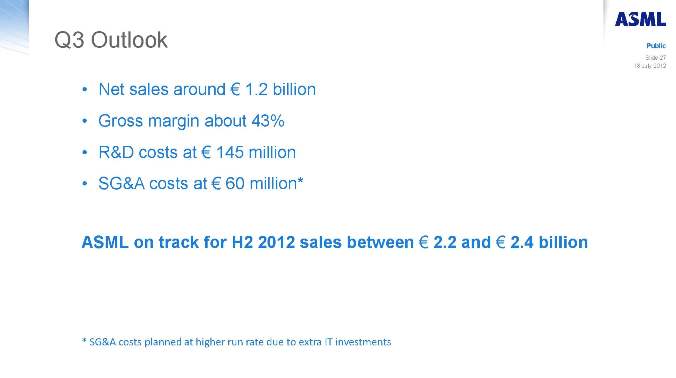
We expect sales to remain steady in the second half of 2012 which
looks sustained by an increase of NAND memory critical layer systems shipments, stability of DRAM memory systems sales, and slower 28/32 nm Logic in the second half compared with the first half. The exact level of sales achieved in the second half
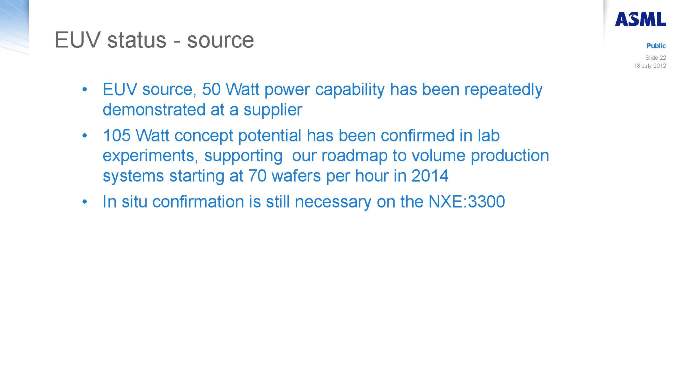
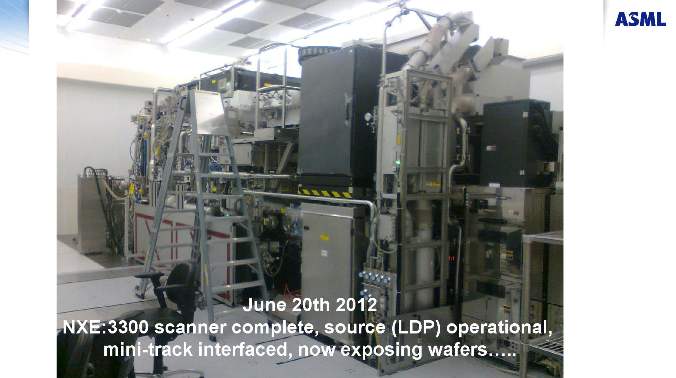
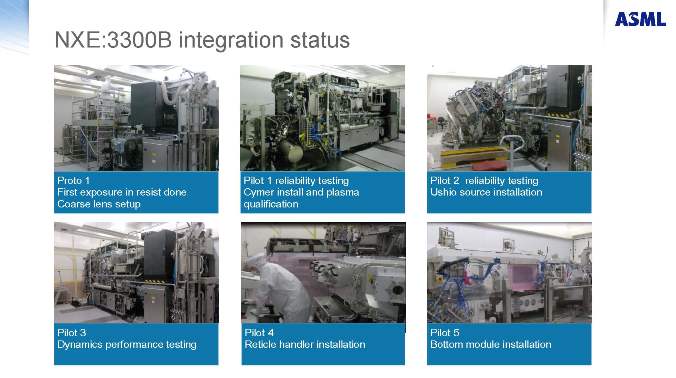
will depend on the strength of NAND pick up, itself fueled by new ultrabook PCs and new smartphone ramps. On the technology front, we expect to ship the first of the NXE:3300, our production-capable Extreme Ultraviolet (EUV) system, by the end of
this year or early next year and the rest of our 11 unit order in 2013. These tools will be used for process development. We are furthermore making progress in preparing EUV lithography for 2014 device production, evidenced by customer commitment to
purchase four additional production systems for delivery in 2014. This commitment is enabled by the data gathered on source power increase and by steady performance of the six units already in the field.
Financial outlook
The following table
sets forth our systems backlog as of July 1, 2012 and December 31, 2011:
|
|
|
|
|
|
|
|
|
| |
|
July 1, 2012 |
|
|
December 31, 2011 |
|
| New systems backlog excluding EUV (in units) |
|
|
42 |
|
|
|
61 |
|
| Used systems backlog excluding EUV (in units) |
|
|
13 |
|
|
|
10 |
|
| Total systems backlog excluding EUV (in units) |
|
|
55 |
|
|
|
71 |
|
| Value of new systems backlog excluding EUV (EUR million) |
|
|
1,414.7 |
|
|
|
1,702.7 |
|
| Value of used systems backlog excluding EUV (EUR million) |
|
|
88.7 |
|
|
|
29.8 |
|
| Value of total systems backlog excluding EUV (EUR million) |
|
|
1,503.4 |
|
|
|
1,732.5 |
|
| Average selling price of new systems backlog excluding EUV (EUR million) |
|
|
33.7 |
|
|
|
27.9 |
|
| Average selling price of used systems backlog excluding EUV (EUR million) |
|
|
6.8 |
|
|
|
3.0 |
|
| Average selling price of total systems backlog excluding EUV (EUR million) |
|
|
27.3 |
|
|
|
24.4 |
|
Our system backlog includes only system orders for which written authorizations have been accepted and shipment dates
within 12 months have been assigned. Historically, orders have been subject to cancellation or delay by customers. Due to possible customer changes in deliver schedules and to cancellation of orders, our system backlog at any particular date is not
necessarily indicative of actual sales for any succeeding period.
The second half revenue level is expected to be between EUR 2.2 billion and
2.4 billion.
The Board of Management,
Veldhoven, July 18, 2012
|
|
|
|
|
| ASML Statutory Interim Report 2012 |
|
9 |
|
|
Managing Directors’ Statement
The Board of Management hereby declares that, to the best of its knowledge, the Consolidated Condensed Interim Financial Statements prepared in accordance with IAS 34, “Interim Financial
Reporting”, provide a true and fair view of the assets, liabilities, financial position and profit or loss of ASML Holding N.V. and the undertakings included in the consolidation taken as a whole and that the Management Board Report includes a
fair review of the information required pursuant to section 5:25d(8)/(9) of the Dutch Act on Financial Supervision (Wet op het Financieel Toezicht).
The Board of Management,
Eric Meurice, President, Chief Executive Officer
Peter T.F.M. Wennink, Executive Vice President, Chief Financial Officer
Martin A. van den Brink, Executive Vice President, Chief Product and Technology Officer
Frits J.
van Hout, Executive Vice President, Chief Marketing Officer
Frédéric J.M. Schneider-Maunoury, Executive Vice President, Chief
Operating Officer
Veldhoven, July 18, 2012
|
|
|
|
|
| ASML Statutory Interim Report 2012 |
|
10 |
|
|
Consolidated Condensed
Interim Financial Statements
Consolidated Condensed Interim Financial Statements
| 13 |
Consolidated Condensed Income Statement |
| 14 |
Consolidated Condensed Statement of Comprehensive Income |
| 15 |
Consolidated Condensed Statement of Financial Position |
| 16 |
Consolidated Condensed Statement of Changes in Equity |
| 17 |
Consolidated Condensed Statement of Cash Flows |
| 18 |
Notes to the Consolidated Condensed Interim Financial Statements |
|
|
|
|
|
| ASML Statutory Interim Report 2012 |
|
12 |
|
|
Consolidated Condensed Income Statement
|
|
|
|
|
|
|
|
|
|
|
| |
|
For the six-month period ended July 1, 2012 and June, 26, 2011 |
|
Unaudited |
|
|
Unaudited |
|
| |
|
|
|
2012 |
|
|
2011 |
|
| Notes |
|
(in thousands, except per share data) |
|
EUR |
|
|
EUR |
|
| 12 |
|
Net system sales |
|
|
2,034,805 |
|
|
|
2,618,045 |
|
| 12 |
|
Net service and field option sales |
|
|
444,860 |
|
|
|
363,538 |
|
|
|
|
|
|
|
|
|
|
|
|
|
|
Total net sales |
|
|
2,479,665 |
|
|
|
2,981,583 |
|
|
|
Cost of system sales |
|
|
1,234,715 |
|
|
|
1,510,062 |
|
|
|
Cost of service and field option sales |
|
|
234,357 |
|
|
|
186,099 |
|
|
|
|
|
|
|
|
|
|
|
|
|
|
Total cost of sales |
|
|
1,469,072 |
|
|
|
1,696,161 |
|
|
|
|
|
|
|
|
|
|
|
|
|
|
Gross profit on sales |
|
|
1,010,593 |
|
|
|
1,285,422 |
|
|
|
Research and development costs |
|
|
150,168 |
|
|
|
258,411 |
|
|
|
Selling, general and administrative costs |
|
|
107,160 |
|
|
|
104,840 |
|
|
|
|
|
|
|
|
|
|
|
|
|
|
Operating income |
|
|
753,265 |
|
|
|
922,171 |
|
|
|
Interest income |
|
|
13,296 |
|
|
|
15,312 |
|
|
|
Interest charges |
|
|
(14,442 |
) |
|
|
(14,575 |
) |
|
|
|
|
|
|
|
|
|
|
|
|
|
Income before income taxes |
|
|
752,119 |
|
|
|
922,908 |
|
| 11 |
|
Provision for income taxes |
|
|
(93,183 |
) |
|
|
(95,958 |
) |
|
|
|
|
|
|
|
|
|
|
|
|
|
Net income |
|
|
658,936 |
|
|
|
826,950 |
|
| 6 |
|
Basic net income per ordinary share |
|
|
1.60 |
|
|
|
1.91 |
|
| 6 |
|
Diluted net income per ordinary share1 |
|
|
1.59 |
|
|
|
1.89 |
|
|
|
Number of ordinary shares used in computing per share amounts (in thousands): |
|
|
|
|
|
|
|
|
|
|
Basic |
|
|
410,618 |
|
|
|
432,928 |
|
|
|
Diluted1 |
|
|
413,837 |
|
|
|
436,461 |
|
| 1 |
The calculation of diluted net income per ordinary share assumes the exercise of options issued under ASML stock option plans and the issuance of shares under ASML
share plans for periods in which exercises or issuances would have a dilutive effect. The calculation of diluted net income per ordinary share does not assume exercise of such options or issuance of shares when such exercises or issuance would be
anti-dilutive. |
|
|
|
|
|
| ASML Statutory Interim Report 2012 |
|
13 |
|
|
Consolidated Condensed Statement of Comprehensive Income
|
|
|
|
|
|
|
|
|
| For the six-month period ended July 1, 2012 and June, 26, 2011 |
|
Unaudited |
|
|
Unaudited |
|
| |
|
2012 |
|
|
2011 |
|
| (in thousands) |
|
EUR |
|
|
EUR |
|
| Net income |
|
|
658,936 |
|
|
|
826,950 |
|
| Other comprehensive income: |
|
|
|
|
|
|
|
|
| Foreign currency translation, net of taxes: |
|
|
|
|
|
|
|
|
| Gain (loss) on translation of foreign operations |
|
|
(1,817 |
) |
|
|
1,769 |
|
| Derivative financial instruments, net of taxes: |
|
|
|
|
|
|
|
|
| Fair value gain (loss) for the six-month period |
|
|
(15,293 |
) |
|
|
53,169 |
|
| Transfers to net income |
|
|
8,215 |
|
|
|
(30,843 |
) |
|
|
|
|
|
|
|
|
|
| Other comprehensive income for the period, net of taxes |
|
|
(8,895 |
) |
|
|
24,095 |
|
|
|
|
|
|
|
|
|
|
| Total comprehensive income for the period, net of taxes |
|
|
650,041 |
|
|
|
851,045 |
|
| Attributable to Equity holders |
|
|
650,041 |
|
|
|
851,045 |
|
|
|
|
|
|
| ASML Statutory Interim Report 2012 |
|
14 |
|
|
Consolidated Condensed Statement of Financial Position
|
|
|
|
|
|
|
|
|
|
|
| |
|
|
|
Unaudited |
|
|
|
|
| |
|
|
|
July 1, 2012 |
|
|
December 31, 2011 |
|
| Notes |
|
(in thousands) |
|
EUR |
|
|
EUR |
|
|
|
Assets |
|
|
|
|
|
|
|
|
|
|
Property, plant and equipment |
|
|
1,169,223 |
|
|
|
1,053,610 |
|
|
|
Goodwill |
|
|
159,507 |
|
|
|
155,124 |
|
|
|
Other intangible assets |
|
|
356,999 |
|
|
|
267,988 |
|
| 11 |
|
Deferred tax assets |
|
|
213,154 |
|
|
|
212,255 |
|
|
|
Derivative financial instruments |
|
|
81,352 |
|
|
|
92,534 |
|
|
|
Other assets |
|
|
205,735 |
|
|
|
211,058 |
|
|
|
|
|
|
|
|
|
|
|
|
|
|
Total non-current assets |
|
|
2,185,970 |
|
|
|
1,992,569 |
|
| 7 |
|
Inventories |
|
|
1,737,520 |
|
|
|
1,632,678 |
|
| 11 |
|
Current tax assets |
|
|
23,636 |
|
|
|
32,105 |
|
|
|
Derivative financial instruments |
|
|
29,985 |
|
|
|
33,817 |
|
|
|
Finance receivables |
|
|
122,291 |
|
|
|
78,853 |
|
| 8 |
|
Accounts receivable |
|
|
631,715 |
|
|
|
880,627 |
|
|
|
Other assets |
|
|
179,379 |
|
|
|
176,732 |
|
| 4 |
|
Short-term investments |
|
|
849,980 |
|
|
|
— |
|
| 4 |
|
Cash and cash equivalents |
|
|
1,851,790 |
|
|
|
2,731,782 |
|
|
|
|
|
|
|
|
|
|
|
|
|
|
Total current assets |
|
|
5,426,296 |
|
|
|
5,566,594 |
|
|
|
|
|
|
|
|
|
|
|
|
|
|
Total assets |
|
|
7,612,266 |
|
|
|
7,559,163 |
|
|
|
Equity and liabilities |
|
|
|
|
|
|
|
|
|
|
Equity |
|
|
3,958,967 |
|
|
|
3,719,805 |
|
|
|
Long-term debt |
|
|
738,510 |
|
|
|
730,122 |
|
|
|
Derivative financial instruments |
|
|
3,381 |
|
|
|
3,210 |
|
| 11 |
|
Deferred and other tax liabilities |
|
|
239,671 |
|
|
|
203,298 |
|
|
|
Provisions |
|
|
9,497 |
|
|
|
10,012 |
|
| 9 |
|
Accrued and other liabilities |
|
|
587,469 |
|
|
|
659,889 |
|
|
|
|
|
|
|
|
|
|
|
|
|
|
Total non-current liabilities |
|
|
1,578,528 |
|
|
|
1,606,531 |
|
|
|
Provisions |
|
|
2,392 |
|
|
|
2,326 |
|
|
|
Derivative financial instruments |
|
|
11,868 |
|
|
|
37,149 |
|
|
|
Current portion of long-term debt |
|
|
2,598 |
|
|
|
2,587 |
|
| 11 |
|
Current and other tax liabilities |
|
|
12,569 |
|
|
|
14,999 |
|
| 9 |
|
Accrued and other liabilities |
|
|
1,699,013 |
|
|
|
1,731,497 |
|
|
|
Accounts payable |
|
|
346,331 |
|
|
|
444,269 |
|
|
|
|
|
|
|
|
|
|
|
|
|
|
Total current liabilities |
|
|
2,074,771 |
|
|
|
2,232,827 |
|
|
|
|
|
|
|
|
|
|
|
|
|
|
Total equity and liabilities |
|
|
7,612,266 |
|
|
|
7,559,163 |
|
|
|
|
|
|
|
|
|
|
|
|
|
|
|
|
|
| ASML Statutory Interim Report 2012 |
|
15 |
|
|
Consolidated Condensed Statement of Changes in Equity
|
|
|
|
|
|
|
|
|
|
|
|
|
|
|
|
|
|
|
|
|
|
|
|
|
|
|
|
|
|
|
|
|
| |
|
Issued and
outstanding shares |
|
|
Share
Premium
EUR |
|
|
Retained
Earnings
EUR |
|
|
Treasury
Shares
at
cost
EUR |
|
|
Other
Reserves2
EUR |
|
|
Net
Income
(Loss)
EUR |
|
|
Total
EUR |
|
| (in thousands) |
|
Number1 |
|
|
Amount
EUR |
|
|
|
|
|
|
|
| Balance at December 31, 2010 |
|
|
436,593 |
|
|
|
40,713 |
|
|
|
922,341 |
|
|
|
1,096,669 |
|
|
|
(153,092 |
) |
|
|
130,378 |
|
|
|
985,453 |
|
|
|
3,022,462 |
|
| Appropriation of net income |
|
|
|
|
|
|
— |
|
|
|
— |
|
|
|
985,453 |
|
|
|
— |
|
|
|
— |
|
|
|
(985,453 |
) |
|
|
— |
|
| Net income |
|
|
|
|
|
|
— |
|
|
|
— |
|
|
|
— |
|
|
|
— |
|
|
|
— |
|
|
|
826,950 |
|
|
|
826,950 |
|
| Foreign currency translation, net of taxes |
|
|
|
|
|
|
— |
|
|
|
— |
|
|
|
— |
|
|
|
— |
|
|
|
1,769 |
|
|
|
— |
|
|
|
1,769 |
|
| Financial instruments, net of taxes |
|
|
|
|
|
|
— |
|
|
|
— |
|
|
|
— |
|
|
|
— |
|
|
|
22,326 |
|
|
|
— |
|
|
|
22,326 |
|
| Total comprehensive income |
|
|
|
|
|
|
— |
|
|
|
— |
|
|
|
— |
|
|
|
— |
|
|
|
24,095 |
|
|
|
826,950 |
|
|
|
851,045 |
|
| Purchases of treasury shares3 |
|
|
(13,185 |
) |
|
|
— |
|
|
|
— |
|
|
|
— |
|
|
|
(373,801 |
) |
|
|
— |
|
|
|
— |
|
|
|
(373,801 |
) |
| Share-based payments |
|
|
|
|
|
|
— |
|
|
|
2,620 |
|
|
|
— |
|
|
|
— |
|
|
|
— |
|
|
|
— |
|
|
|
2,620 |
|
| Dividend paid |
|
|
|
|
|
|
— |
|
|
|
— |
|
|
|
(172,645 |
) |
|
|
— |
|
|
|
— |
|
|
|
— |
|
|
|
(172,645 |
) |
| Issuance of shares |
|
|
1,907 |
|
|
|
— |
|
|
|
(7,076 |
) |
|
|
(12,219 |
) |
|
|
42,918 |
|
|
|
— |
|
|
|
— |
|
|
|
23,623 |
|
| Development expenditures |
|
|
|
|
|
|
— |
|
|
|
— |
|
|
|
25,683 |
|
|
|
— |
|
|
|
(25,683 |
) |
|
|
— |
|
|
|
— |
|
|
|
|
|
|
|
|
|
|
|
|
|
|
|
|
|
|
|
|
|
|
|
|
|
|
|
|
|
|
|
|
|
|
| Balance at June 26, 2011 (unaudited) |
|
|
425,315 |
|
|
|
40,713 |
|
|
|
917,885 |
|
|
|
1,922,941 |
|
|
|
(483,975 |
) |
|
|
128,790 |
|
|
|
826,950 |
|
|
|
3,353,304 |
|
| Net income |
|
|
|
|
|
|
— |
|
|
|
— |
|
|
|
— |
|
|
|
— |
|
|
|
— |
|
|
|
667,121 |
|
|
|
667,121 |
|
| Foreign currency translation, net of taxes |
|
|
|
|
|
|
— |
|
|
|
— |
|
|
|
— |
|
|
|
— |
|
|
|
(15,740 |
) |
|
|
— |
|
|
|
(15,740 |
) |
| Financial instruments, net of taxes |
|
|
|
|
|
|
— |
|
|
|
— |
|
|
|
— |
|
|
|
— |
|
|
|
25,027 |
|
|
|
— |
|
|
|
25,027 |
|
| Total comprehensive income |
|
|
|
|
|
|
— |
|
|
|
— |
|
|
|
— |
|
|
|
— |
|
|
|
9,287 |
|
|
|
667,121 |
|
|
|
676,408 |
|
| Purchases of treasury shares3 |
|
|
(12,490 |
) |
|
|
— |
|
|
|
— |
|
|
|
— |
|
|
|
(326,651 |
) |
|
|
— |
|
|
|
— |
|
|
|
(326,651 |
) |
| Cancellation of treasury shares |
|
|
|
|
|
|
(1,897 |
) |
|
|
710 |
|
|
|
(372,614 |
) |
|
|
373,801 |
|
|
|
— |
|
|
|
— |
|
|
|
— |
|
| Share-based payments |
|
|
|
|
|
|
— |
|
|
|
5,199 |
|
|
|
— |
|
|
|
— |
|
|
|
— |
|
|
|
— |
|
|
|
5,199 |
|
| Issuance of shares |
|
|
844 |
|
|
|
— |
|
|
|
(3,316 |
) |
|
|
(4,127 |
) |
|
|
18,988 |
|
|
|
— |
|
|
|
— |
|
|
|
11,545 |
|
| Development expenditures |
|
|
|
|
|
|
— |
|
|
|
— |
|
|
|
(20,962 |
) |
|
|
— |
|
|
|
20,962 |
|
|
|
— |
|
|
|
— |
|
|
|
|
|
|
|
|
|
|
|
|
|
|
|
|
|
|
|
|
|
|
|
|
|
|
|
|
|
|
|
|
|
|
| Balance at December 31, 2011 |
|
|
413,669 |
|
|
|
38,816 |
|
|
|
920,478 |
|
|
|
1,525,238 |
|
|
|
(417,837 |
) |
|
|
159,039 |
|
|
|
1,494,071 |
|
|
|
3,719,805 |
|
| Appropriation of net income |
|
|
|
|
|
|
— |
|
|
|
— |
|
|
|
1,494,071 |
|
|
|
— |
|
|
|
— |
|
|
|
(1,494,071 |
) |
|
|
— |
|
| Net income |
|
|
|
|
|
|
— |
|
|
|
— |
|
|
|
— |
|
|
|
— |
|
|
|
— |
|
|
|
658,936 |
|
|
|
658,936 |
|
| Foreign currency translation, net of taxes |
|
|
|
|
|
|
— |
|
|
|
— |
|
|
|
— |
|
|
|
— |
|
|
|
(1,817 |
) |
|
|
— |
|
|
|
(1,817 |
) |
| Financial instruments, net of taxes |
|
|
|
|
|
|
— |
|
|
|
— |
|
|
|
— |
|
|
|
— |
|
|
|
(7,078 |
) |
|
|
— |
|
|
|
(7,078 |
) |
| Total comprehensive income |
|
|
|
|
|
|
— |
|
|
|
— |
|
|
|
— |
|
|
|
— |
|
|
|
(8,895 |
) |
|
|
658,936 |
|
|
|
650,041 |
|
| Purchases of treasury shares3 |
|
|
(7,114 |
) |
|
|
— |
|
|
|
— |
|
|
|
— |
|
|
|
(252,396 |
) |
|
|
— |
|
|
|
— |
|
|
|
(252,396 |
) |
| Cancellation of treasury shares |
|
|
|
|
|
|
(1,030 |
) |
|
|
— |
|
|
|
(293,722 |
) |
|
|
294,752 |
|
|
|
|
|
|
|
|
|
|
|
— |
|
| Share-based payments |
|
|
|
|
|
|
— |
|
|
|
9,920 |
|
|
|
— |
|
|
|
— |
|
|
|
— |
|
|
|
— |
|
|
|
9,920 |
|
| Dividend paid |
|
|
|
|
|
|
— |
|
|
|
— |
|
|
|
(188,892 |
) |
|
|
— |
|
|
|
— |
|
|
|
— |
|
|
|
(188,892 |
) |
| Issuance of shares |
|
|
1,635 |
|
|
|
— |
|
|
|
(5,294 |
) |
|
|
(2,850 |
) |
|
|
28,633 |
|
|
|
— |
|
|
|
— |
|
|
|
20,489 |
|
| Development expenditures |
|
|
|
|
|
|
— |
|
|
|
— |
|
|
|
(87,543 |
) |
|
|
— |
|
|
|
87,543 |
|
|
|
— |
|
|
|
— |
|
|
|
|
|
|
|
|
|
|
|
|
|
|
|
|
|
|
|
|
|
|
|
|
|
|
|
|
|
|
|
|
|
|
| Balance at July 1, 2012 (unaudited) |
|
|
408,190 |
|
|
|
37,786 |
|
|
|
925,104 |
|
|
|
2,446,302 |
|
|
|
(346,848 |
) |
|
|
237,687 |
|
|
|
658,936 |
|
|
|
3,958,967 |
|
|
|
|
|
|
|
|
|
|
|
|
|
|
|
|
|
|
|
|
|
|
|
|
|
|
|
|
|
|
|
|
|
|
| 1 |
As of July 1, 2012, the number of issued shares was 419,852,514. This includes the number of issued and outstanding shares of 408,190,137 and the number of
treasury shares of 11,662,377. As of June 26, 2011, the number of issued shares was 444,480,095. This included the number of issued and outstanding shares of 425,315,091 and the number of treasury shares of 19,165,004. |
| 2 |
Other reserves consist of the hedging reserve, the currency translation reserve and the reserve for capitalized development expenditures. |
| 3 |
During the six-month period ended July 1, 2012, ASML repurchased shares for an amount of EUR 252.4 million (December 31, 2011: EUR 700.5 million). As of
July 1, 2012, EUR 7.9 million of the total repurchase amount remained unpaid and is recorded in accrued and other current liabilities (December 31, 2011: nil). |
|
|
|
|
|
| ASML Statutory Interim Report 2012 |
|
16 |
|
|
Consolidated Condensed Statement of Cash Flows
|
|
|
|
|
|
|
|
|
|
|
| |
|
For the six-month period ended July 1, 2012 and June, 26, 2011 |
|
Unaudited |
|
|
Unaudited |
|
| Notes |
|
(in thousands) |
|
2012
EUR |
|
|
2011
EUR |
|
|
|
Cash Flows from Operating Activities |
|
|
|
|
|
|
|
|
|
|
Net income |
|
|
658,936 |
|
|
|
826,950 |
|
|
|
Adjustments to reconcile net income to net cash flows from operating activities: |
|
|
|
|
|
|
|
|
|
|
Depreciation and amortization |
|
|
157,438 |
|
|
|
138,227 |
|
|
|
Impairment |
|
|
1,055 |
|
|
|
551 |
|
|
|
Loss on disposal of property, plant and equipment |
|
|
1,544 |
|
|
|
1,898 |
|
|
|
Share-based payments |
|
|
8,723 |
|
|
|
4,796 |
|
| 8 |
|
Allowance for doubtful receivables |
|
|
276 |
|
|
|
1,173 |
|
| 7 |
|
Allowance for obsolete inventory |
|
|
61,631 |
|
|
|
13,505 |
|
| 11 |
|
Deferred income taxes |
|
|
34,803 |
|
|
|
25,149 |
|
|
|
Changes in assets and liabilities: |
|
|
|
|
|
|
|
|
| 8 |
|
Accounts receivable |
|
|
243,648 |
|
|
|
292,353 |
|
|
|
Finance receivables |
|
|
(43,438 |
) |
|
|
(20,353 |
) |
| 7 |
|
Inventories¹ |
|
|
(314,475 |
) |
|
|
(259,531 |
) |
|
|
Other assets |
|
|
59,569 |
|
|
|
(26,110 |
) |
| 9 |
|
Accrued and other liabilities |
|
|
(143,290 |
) |
|
|
588,404 |
|
|
|
Accounts payable |
|
|
(116,623 |
) |
|
|
40,144 |
|
| 11 |
|
Income taxes payable |
|
|
49,829 |
|
|
|
93,117 |
|
|
|
|
|
|
|
|
|
|
|
|
|
|
Cash generated from operations |
|
|
659,626 |
|
|
|
1,720,273 |
|
|
|
Interest received |
|
|
27,837 |
|
|
|
27,340 |
|
|
|
Interest paid |
|
|
(35,105 |
) |
|
|
(35,115 |
) |
| 11 |
|
Income taxes paid |
|
|
(42,815 |
) |
|
|
(80,934 |
) |
|
|
|
|
|
|
|
|
|
|
|
|
|
Net cash provided by operating activities |
|
|
609,543 |
|
|
|
1,631,564 |
|
|
|
Cash Flows from Investing Activities |
|
|
|
|
|
|
|
|
|
|
Purchase of property, plant and equipment¹ |
|
|
(86,063 |
) |
|
|
(127,321 |
) |
|
|
Purchase of intangible assets |
|
|
(143,054 |
) |
|
|
(31,730 |
) |
| 4 |
|
Purchase of available for sale securities |
|
|
(849,980 |
) |
|
|
— |
|
|
|
|
|
|
|
|
|
|
|
|
|
|
Net cash used in investing activities |
|
|
(1,079,097 |
) |
|
|
(159,051 |
) |
|
|
Cash Flows from Financing Activities |
|
|
|
|
|
|
|
|
| 13 |
|
Dividend paid |
|
|
(188,892 |
) |
|
|
(172,645 |
) |
| 13 |
|
Purchase of shares² |
|
|
(244,562 |
) |
|
|
(365,680 |
) |
|
|
Net proceeds from issuance of shares |
|
|
20,514 |
|
|
|
23,623 |
|
|
|
Deposits from customers |
|
|
— |
|
|
|
(150,000 |
) |
|
|
Repayment of debt |
|
|
(1,327 |
) |
|
|
(1,265 |
) |
|
|
|
|
|
|
|
|
|
|
|
|
|
Net cash used in financing activities |
|
|
(414,267 |
) |
|
|
(665,967 |
) |
|
|
Net cash flows |
|
|
(883,821 |
) |
|
|
806,546 |
|
|
|
Effect of changes in exchange rates on cash |
|
|
3,829 |
|
|
|
(14,272 |
) |
|
|
|
|
|
|
|
|
|
|
|
|
|
Net increase in cash and cash equivalents |
|
|
(879,992 |
) |
|
|
792,274 |
|
|
|
Cash and cash equivalents at beginning of the year |
|
|
2,731,782 |
|
|
|
1,949,834 |
|
|
|
|
|
|
|
|
|
|
|
|
|
|
Cash and cash equivalents at July 1, 2012 and June 26, 2011 |
|
|
1,851,790 |
|
|
|
2,742,108 |
|
|
|
|
|
|
|
|
|
|
|
|
| 1 |
An amount of EUR 149.5 million (2011: EUR 156.2 million) of the additions in property, plant and equipment relates to non-cash transfers from inventory and an
amount of EUR 39.8 million (2011: EUR 7.5 million) of the disposals of property, plant and equipment relates to non-cash transfers to inventory. Since the transfers between inventory and property, plant and equipment are non-cash events, these
are not reflected in this Consolidated Condensed Statement of Cash Flows. |
| 2 |
During the six-month period ended July 1, 2012, ASML repurchased shares for an amount of EUR 252.4 million (June 26, 2011: EUR 373.8 million). As of
July 1, 2012, EUR 7.9 million of the total repurchase amount remained unpaid and is recorded in accrued and other current liabilities (June 26, 2011: 8.1). |
|
|
|
|
|
| ASML Statutory Interim Report 2012 |
|
17 |
|
|
Notes to the Consolidated Condensed Interim Financial Statements
1. General Information
ASML’s
shares are listed for trading in the form of registered shares on the NASDAQ Stock Market LLC (“NASDAQ”) and in the form of registered shares on Euronext Amsterdam by NYSE Euronext (“Euronext Amsterdam”). The principal trading
market of ASML’s ordinary shares is Euronext Amsterdam.
The Consolidated Condensed Interim Financial Statements include the accounts of
ASML Holding N.V., all of its majority owned subsidiaries and the Special Purpose Entities over which ASML has control (together referred to as “ASML” or “the Company”).
The Consolidated Condensed Interim Financial Statements of the Company were authorized for issue by the Board of Management on July 18, 2012.
The Consolidated Condensed Interim Financial Statements have not been audited or reviewed by an external auditor.
2. Basis of Preparation
The Consolidated Condensed Interim Financial Statements for the
six-month period ended July 1, 2012 have been prepared in accordance with International Accounting Standard 34, “Interim Financial Reporting”. The Consolidated Condensed Interim Financial Statements do not include all the information
and disclosures required in the Annual Statutory Financial Statements and should be read in conjunction with the Statutory Financial Statements 2011, which have been prepared in accordance with International Financial Reporting Standards
(“IFRS”) as adopted by the European Union (“EU”).
The Consolidated Condensed Interim Financial Statements are stated in
thousands of euros (“EUR”) unless otherwise indicated.
3. Summary of Significant Accounting Policies
The accounting policies adopted in the preparation of the Consolidated Condensed Interim Financial Statements are consistent with those applied in the
preparation of the Statutory Financial Statements, except for short-term investments and income tax expense.
Short-term investments
Investments with original maturities longer than three months and remaining maturities of less than one year are presented as short-term
investments. The short-term investments are classified as available-for-sale and are stated at fair value. Gains and losses, other than impairments and foreign exchange results are recognized in Other Comprehensive Income until the short-term
investments are derecognized. Upon derecognition the cumulative gain or loss recognized in Other Comprehensive Income is reclassified to the Consolidated Condensed Income Statement.
Our available-for-sale financial instruments consist of Dutch Treasury certificates and deposits with the Dutch Government. Dutch Treasury certificates are traded in an active market and the fair value is
determined based on quoted market prices. The fair values of deposits are determined with reference to quoted market prices of similair instruments or discounted cash flow analyses.
Income tax expense
Income tax expense is recognized based on management’s best
estimate of the annual income tax rate expected for the full financial year.
Adoption of new and revised International Financial Reporting
Standards
No new standards and interpretations became effective as of January 1, 2012 which impact the Consolidated Condensed Interim
Financial Statements.
|
|
|
|
|
| ASML Statutory Interim Report 2012 |
|
18 |
|
|
4. Liquidity
Our principal sources of liquidity as of July 1, 2012 consist of EUR 1,851.8 million cash and cash equivalents (December 31, 2011: cash and cash equivalents EUR 2,731.8 million), EUR
850.0 million of short-term investments (December 31, 2011: EUR nil), EUR 500.0 million of available credit facilities (December 31, 2011: EUR 500.0 million) and expected future cash flows from operations.
Our short-term investments are primarily to facilitate liquidity and capital preservation. During the first half of 2012 ASML invested part of its cash
and cash equivalents in certain short-term investments with maturities longer than 3 months but within one year. The investments are in Euro and consist of Dutch Treasury certificates and deposits with the Dutch Government.
5. Critical Accounting Judgments and Key sources of Estimation uncertainty
In the process of applying the Company’s accounting policies, management has made some judgments that have a significant effect on the amounts recognized in the Consolidated Condensed Interim
Financial Statements. The critical accounting judgments and key sources of estimation uncertainty are consistent with those described in the Statutory Financial Statements 2011.
6. Earnings per Share
The earnings per share (“EPS”) data have been calculated
as follows:
|
|
|
|
|
|
|
|
|
| For the six-month period ended July 1, 2012 and June, 26, 2011 |
|
Unaudited |
|
|
Unaudited |
|
| (in thousands, except per share data) |
|
2012
EUR |
|
|
2011
EUR |
|
| Net income |
|
|
658,936 |
|
|
|
826,950 |
|
| Weighted average number of shares outstanding (after deduction of treasury stock) during the half year |
|
|
410,618 |
|
|
|
432,928 |
|
| Basic net income per ordinary share |
|
|
1.60 |
|
|
|
1.91 |
|
| Weighted average number of shares: |
|
|
410,618 |
|
|
|
432,928 |
|
| Plus shares applicable to: |
|
|
|
|
|
|
|
|
| Stock options / Restricted shares1 |
|
|
3,219 |
|
|
|
3,533 |
|
|
|
|
|
|
|
|
|
|
| Dilutive potential common shares |
|
|
3,219 |
|
|
|
3,533 |
|
|
|
|
|
|
|
|
|
|
| Adjusted weighted average number of shares |
|
|
413,837 |
|
|
|
436,461 |
|
| Diluted earnings per share1 |
|
|
1.59 |
|
|
|
1.89 |
|
|
|
|
|
|
|
|
|
|
| 1 |
The calculation of diluted net income per ordinary share assumes the exercise of options issued under ASML stock option plans and the issue of shares under ASML share
plans for periods in which exercises or issuances would have a dilutive effect. The calculation of diluted net income per ordinary share does not assume exercise of such options or issuance of shares when such exercises or issue would be
anti-dilutive. |
7. Inventories
The increased inventory balance compared to December 31, 2011 mainly consists of inventories regarding NXE and NXT systems.
8. Accounts Receivable
The decrease in the accounts receivables reflects cash inflows from
our customers during the first half of 2012 amongst other regarding receivables that were past due but not impaired as of December 31, 2011.
|
|
|
|
|
| ASML Statutory Interim Report 2012 |
|
19 |
|
|
9. Accrued and other liabilities
Accrued and other liabilities consist of the following:
|
|
|
|
|
|
|
|
|
| |
|
Unaudited |
|
|
|
|
| (in thousands) |
|
July 1,
2012
EUR |
|
|
December 31,
2011
EUR |
|
| Deferred revenue |
|
|
834,404 |
|
|
|
816,045 |
|
| Costs to be paid |
|
|
249,837 |
|
|
|
260,651 |
|
| Down payments from customers¹ |
|
|
1,003,047 |
|
|
|
1,057,046 |
|
| Personnel related items |
|
|
162,869 |
|
|
|
212,059 |
|
| Warranty |
|
|
35,018 |
|
|
|
43,273 |
|
| Other |
|
|
1,307 |
|
|
|
2,312 |
|
|
|
|
|
|
|
|
|
|
| Total accrued and other liabilities |
|
|
2,286,482 |
|
|
|
2,391,386 |
|
| Less: non-current portion of accrued and other liabilities¹ |
|
|
587,469 |
|
|
|
659,889 |
|
|
|
|
|
|
|
|
|
|
| Current portion of accrued and other liabilities |
|
|
1,699,013 |
|
|
|
1,731,497 |
|
|
|
|
|
|
|
|
|
|
| 1 |
The Company receives advances from customers prior to shipment for systems included in ASML’s current product portfolio or systems currently under development in
the form of down payments, mainly relating to EUV. |
10. Commitments, Contingencies and Guarantees
The nature, scale and scope of the commitments, contingencies and guarantees is in line with the commitments, contingencies and guarantees disclosed in
the Statutory Financial Statements 2011.
11. Income Taxes
Income tax expense is recognized based on management’s best estimate of the annual income tax rate for the full financial year. The estimated annual tax rate for the six-month period ended
July 1, 2012 is 12.4 percent compared to 10.4 percent for the six-month period ended June 26, 2011.
Current tax assets have
decreased as a result of taxes repaid by tax authorities. The majority of the deferred and other tax liabilities is classified as non-current because payment of cash is not expected within one year.
|
|
|
|
|
| ASML Statutory Interim Report 2012 |
|
20 |
|
|
12. Segment Disclosure
ASML operates in one reportable segment for the development, manufacturing, marketing and servicing of lithography equipment. ASML’s Chief Executive Officer has been identified as the chief operating
decision-maker, who reviews operating results to make decisions about allocating resources and assessing performance for the entire Company.
Management reporting includes net system sales figures of new and used systems. Net sales for new and used systems were as follows:
|
|
|
|
|
|
|
|
|
| For the six-month period ended July 1, 2012 and June, 26, 2011 |
|
Unaudited |
|
|
Unaudited |
|
| (in thousands) |
|
2012
EUR |
|
|
2011
EUR |
|
| New systems |
|
|
2,018,231 |
|
|
|
2,575,460 |
|
| Used systems |
|
|
16,574 |
|
|
|
42,585 |
|
|
|
|
|
|
|
|
|
|
| Total net system sales |
|
|
2,034,805 |
|
|
|
2,618,045 |
|
|
|
|
|
|
|
|
|
|
Segment performance is evaluated by the Company’s management based on US GAAP net income or loss which in
certain respects, as explained in the table below, is measured differently from net income or loss reported by the Company in its statutory financial statements, which are based on IFRS as adopted by the EU.
|
|
|
|
|
|
|
|
|
| For the six-month period ended July 1, 2012 and June, 26, 2011 |
|
Unaudited |
|
|
Unaudited |
|
| (in thousands) |
|
2012
EUR |
|
|
2011
EUR |
|
| Net system sales |
|
|
2,034,805 |
|
|
|
2,618,045 |
|
| Net service and field option sales |
|
|
444,860 |
|
|
|
363,538 |
|
|
|
|
|
|
|
|
|
|
| Total net sales |
|
|
2,479,665 |
|
|
|
2,981,583 |
|
| Cost of sales |
|
|
1,425,659 |
|
|
|
1,642,012 |
|
|
|
|
|
|
|
|
|
|
| Gross profit on sales |
|
|
1,054,006 |
|
|
|
1,339,571 |
|
| Research and development costs |
|
|
289,952 |
|
|
|
290,106 |
|
| Selling, general and administrative costs |
|
|
110,095 |
|
|
|
105,262 |
|
|
|
|
|
|
|
|
|
|
| Income from operations |
|
|
653,959 |
|
|
|
944,203 |
|
| Interest income (expense), net |
|
|
(243 |
) |
|
|
3,692 |
|
|
|
|
|
|
|
|
|
|
| Income before income taxes |
|
|
653,716 |
|
|
|
947,895 |
|
| Provision for income taxes |
|
|
(79,819 |
) |
|
|
(120,858 |
) |
|
|
|
|
|
|
|
|
|
| Net income for management reporting purposes |
|
|
573,897 |
|
|
|
827,037 |
|
| Differences U.S. GAAP and IFRS |
|
|
85,039 |
|
|
|
(87 |
) |
|
|
|
|
|
|
|
|
|
| Net income for IFRS |
|
|
658,936 |
|
|
|
826,950 |
|
|
|
|
|
|
|
|
|
|
Segment performance is also evaluated by the Company’s management based on US GAAP for total assets. The table
below presents the measurements and the reconciliation to total assets in the Consolidated Condensed Interim Financial Statements:
|
|
|
|
|
|
|
|
|
| |
|
Unaudited |
|
|
|
|
| (in thousands) |
|
July 1,
2012
EUR |
|
|
December 31,
2011
EUR |
|
| Total assets for management reporting purposes |
|
|
7,217,801 |
|
|
|
7,260,815 |
|
| Differences U.S. GAAP and IFRS |
|
|
394,465 |
|
|
|
298,348 |
|
|
|
|
|
|
|
|
|
|
| Total assets for IFRS |
|
|
7,612,266 |
|
|
|
7,559,163 |
|
|
|
|
|
|
|
|
|
|
|
|
|
|
|
| ASML Statutory Interim Report 2012 |
|
21 |
|
|
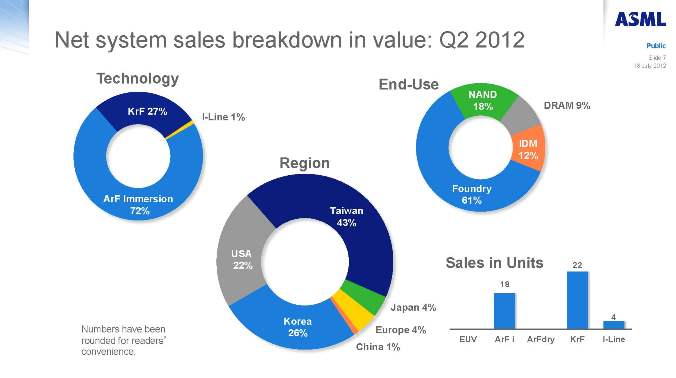
For geographical reporting, net sales are attributed to the geographic location in which the
customers’ facilities are located. Total non-current assets are attributed to the geographic location in which they are located and exclude deferred tax assets and derivative financial instruments. Net sales and non-current assets by geographic
region were as follows:
|
|
|
|
|
|
|
|
|
| |
|
Unaudited |
|
|
Unaudited |
|
| (in thousands) |
|
Net sales
EUR |
|
|
Non-current assets
EUR |
|
| For the six-month period ended July 1, 2012: |
|
|
|
|
|
|
|
|
| Japan |
|
|
168,033 |
|
|
|
79,542 |
|
| Korea |
|
|
757,257 |
|
|
|
18,331 |
|
| Singapore |
|
|
27,939 |
|
|
|
1,021 |
|
| Taiwan |
|
|
744,612 |
|
|
|
45,938 |
|
| Rest of Asia |
|
|
129,092 |
|
|
|
1,738 |
|
| Europe |
|
|
129,525 |
|
|
|
1,462,840 |
|
| United States |
|
|
523,207 |
|
|
|
282,054 |
|
|
|
|
|
|
|
|
|
|
| Total |
|
|
2,479,665 |
|
|
|
1,891,464 |
|
| For the six-month period ended June 26, 2011: |
|
|
|
|
|
|
|
|
| Japan |
|
|
146,092 |
|
|
|
45,693 |
|
| Korea |
|
|
495,141 |
|
|
|
7,799 |
|
| Singapore |
|
|
229,628 |
|
|
|
1,150 |
|
| Taiwan |
|
|
786,148 |
|
|
|
44,672 |
|
| Rest of Asia |
|
|
184,161 |
|
|
|
1,659 |
|
| Europe |
|
|
321,916 |
|
|
|
1,188,266 |
|
| United States |
|
|
818,497 |
|
|
|
219,996 |
|
|
|
|
|
|
|
|
|
|
| Total |
|
|
2,981,583 |
|
|
|
1,509,235 |
|
|
|
|
|
|
|
|
|
|
During the six-month period ended July 1, 2012, sales to the largest customer accounted for EUR 652.9 million
or 26.3 percent of net sales (June 26, 2011: EUR 616.5 million or 20.7 percent).
ASML’s three largest customers (based on net
sales) accounted for 42.5 percent of accounts receivable at July 1, 2012 and 17.8 percent of accounts receivable at June 26, 2011.
Substantially all our sales were export sales during the six-month period ended July 1, 2012 and June 26, 2011.
13. Dividends and Share Buybacks
As
part of our financing policy, we aim to pay an annual dividend that will be stable or growing over time. Annually, the Board of Management will, upon prior approval from the Supervisory Board, submit a proposal to the Annual General Meeting of
Shareholders with respect to the amount of dividend to be declared with respect to prior year.
In the Annual General Meeting of Shareholders
of April 25, 2012, a dividend of EUR 0.46 per ordinary share of EUR 0.09 nominal value was adopted for 2011. As a result, a total dividend amount of EUR 188.9 million was paid to our shareholders on May 15, 2012.
In addition to dividend payments, we intend to return cash to our shareholders on a regular basis through share buy backs or repayment of capital,
subject to our actual and anticipated level of cash generated from operations, the cash requirements for investment in our business, our current share price and other market conditions and relevant factors.
On January 18, 2012, ASML announced to increase the size of its existing share buyback program to a maximum amount of EUR 1,130 million to be
completed in 2012. Since the start of this program in 2011 up to July 1, 2012 ASML has purchased 32.8 million shares for a total amount of EUR 952.2 million. The repurchased shares have been, or will be cancelled.
Furthermore, on January 18, 2012, ASML announced its intention to purchase up to 2.2 million of additional shares during 2012 for the purpose
of covering outstanding employee stock and stock option plans. These shares will be held as treasury shares pending delivery pursuant to such plans. Up to July 1, 2012 no shares had yet been purchased under this program.
|
|
|
|
|
| ASML Statutory Interim Report 2012 |
|
22 |
|
|
As result of the customer co-investment program as further disclosed in the subsequent events section, ASML
has suspended its regular share buyback programs until further notice. ASML intends to resume share buybacks when permitted under applicable regulations.
14. Related Party Transactions
Consistent with the Company’s corporate
responsibilities to its surrounding community and together with several other companies in the region, in prior year ASML entered into a loan agreement with a local sports club PSV N.V.; pursuant to which ASML provided PSV N.V., as of August 1,
2011, a 14 year, interest free, subordinated loan of EUR 5.0 million. As per June 30, 2012 the chairman of the Supervisory Board of ASML, Mr. Arthur van der Poel and Chief Financial Officer of ASML, Mr. Peter Wennink resigned as
members of the Supervisory Board of PSV N.V., therefore the loan agreement with PSV N.V. is concluded to no longer classify as a related party transaction from that date onwards.
During the first half of 2012, there have been no transactions and there are currently no transactions, between ASML or any of its subsidiaries, and any significant shareholder and any director or officer
or any relative or spouse thereof other than ordinary course compensation arrangements. During the first half of 2012, there has been no, and at present there is no, outstanding indebtedness to ASML owed or owing by any director or officer of ASML
or any associate thereof, other than the virtual financing arrangement with respect to shares and stock options.
15. Subsequent Events
Subsequent events have been evaluated by the Company until July 18, 2012 which is the issuance date of this interim report 2012.
On July 9, 2012, ASML entered into an investment agreement with Intel Corporation (the “Investment Agreement”) pursuant to
which Intel Corporation (“Intel”) will invest in ordinary shares of ASML that will be held on Intel’s behalf by a Dutch foundation (Stichting Administratiekantoor) (the “Stichting”) and will be subject to provisions
of a Shareholder Agreement (the “Shareholder Agreement”). Concurrent with the signing of the Investment Agreement, ASML and Intel also entered into (i) two non-recurring research and development engineering (NRE) funding agreements
(the “NRE Funding Agreements”), pursuant to which Intel has agreed to fund a portion of ASML’s research and development expenses, dedicated capital expenditures and non-recurring engineering costs related to the development of 450mm
and extreme ultra-violet (EUV) lithography equipment, and (ii) a commercial agreement, setting forth the terms of sales of EUV and 450mm systems by ASML to Intel (the “Commercial Agreement”). A more detailed description of each of the
Investment Agreement, the Shareholder Agreement, the NRE Funding Agreements and the Commercial Agreement is set forth below.
The
Investment Agreement
Pursuant to the Investment Agreement, ASML has agreed to sell to Intel ordinary shares equal to 15% of its issued
ordinary shares after giving effect to the Synthetic Buyback (as defined below). The purchase price will be €39.91 per share, which was agreed by reference to the average of the volume weighted average price of ASML’s ordinary shares
on Euronext Amsterdam for the twenty trading days up to and including July 6, 2012.
Issuance of ASML Ordinary Shares to Intel
Intel will invest in ASML ordinary shares in two tranches: an issuance of 41,985,250 ordinary shares (the “Initial Shares”) and
an additional issuance of ASML ordinary shares (the “Additional Shares”, and together with the Initial Shares, the “Intel Shares”) such that the number of Intel Shares issued pursuant to the Investment Agreement would equal 15%
of ASML’s issued ordinary shares, subject to certain adjustments, following the Synthetic Buyback. The Intel Shares will not participate in the Synthetic Buyback (described below).
The Intel Shares will be held by the Stichting, which will issue to Intel depositary receipts therefor (the “Depositary Receipts”), subject to the terms of the Shareholder Agreement (described
below).
The issuance of the Initial Shares is subject to customary closing conditions, including the accuracy of the parties’
representations and warranties, the absence of certain material adverse events, and the receipt of regulatory approvals. The issuance of the Additional Shares is subject to these same conditions, as well as to obtaining ASML shareholder approvals
required in connection with the authorization of the issuance of the Intel Shares and the Other Customer Shares (described below) (and the exclusion related preemptive rights) and the authorization of the Synthetic Buyback (“Shareholder
Approval”). ASML has agreed to issue a notice convening an extraordinary general meeting within 15 days of the date of the Investment Agreement.
|
|
|
|
|
| ASML Statutory Interim Report 2012 |
|
23 |
|
|
ASML has agreed to indemnify Intel and its affiliates for certain losses and expenses related to breaches
of representations, warranties, covenants and agreements in the Investment Agreement and with respect to certain legal proceedings related thereto, subject to certain limitations.
Termination
The Investment Agreement may be terminated by either party if the issuance of
either of the Initial Shares or Additional Shares has not occurred by April 15, 2013. In addition, the Investment Agreement may be terminated by either party in the event of a final court order prohibiting the closings contemplated by the
Investment Agreement or certain breaches by the other party of representations, warranties or covenants in the Investment Agreement, or, for the Additional Shares, if Shareholder Approval is not obtained. In addition, Intel may terminate the
Investment Agreement upon the occurrence of certain material adverse events or certain extraordinary corporate events of ASML.
Participation in the Customer Co-Investment Program by Other Customers
Participation in the Customer Co-Investment Program also is being evaluated by other ASML customers (“Other Customers”). In particular, ASML will make available to Other Customers who enter into
NRE funding commitments, up to 10% of ASML’s issued shares on a post-transaction basis (the “Other Customer Shares”) at a price not less than the € 39.91 per share paid by Intel, and the ratio of Other Customer Shares issued
to NRE funding commitments by Other Customers will not exceed the ratio of the number of shares acquired by Intel to the amount of Intel’s NRE funding commitments. Any such issuance of shares to Other Customers will be completed prior to the
Synthetic Buyback (as described below) and the Other Customers will not participate in the Synthetic Buyback.
Use of Proceeds and
Synthetic Share Buyback
If Shareholder Approval is obtained, ASML will use the proceeds of the sale of the Intel Shares and the Other
Customer Shares to conduct a synthetic share buy-back (“Synthetic Buyback”). The Synthetic Buyback will result in a return of capital to shareholders (other than Intel and Other Customers who participate in the Customer Co-Investment
Program) in an amount equal to the proceeds from the share issuances to Intel and Other Customers under the Customer Co-Investment Program, followed by a reverse share-split that will reduce the number of ASML’s issued ordinary shares to
approximately the number of shares that had been issued immediately prior to the issuance to Intel of the Initial Shares.
If Shareholder
Approval is not obtained, ASML will use the proceeds of the issuance of the Initial Shares for research and development and the remainder will be used for general corporate purposes, and no Synthetic Buyback or reverse stock split will occur. There
will be no issuance of Additional Shares or Other Customer Shares if Shareholder Approval is not obtained.
Shareholder Agreement
In connection with the issuance of the Intel Shares, ASML, Intel and the Stichting will enter into a Shareholder Agreement, which will
govern certain matters relating to Intel’s holding of and further investment in ASML ordinary shares, both directly and indirectly through the Stichting, including the matters described below. Other Customers participating in the Customer
Co-Investment Program will enter into shareholder’s agreements substantially similar to the Shareholder Agreement.
Voting Rights
Intel will not be entitled to vote the Intel Shares or any shares otherwise transferred to the Stichting (under the circumstances
described under “—Standstill; Additional Purchases” below), except when a Suspension Event (as defined below) occurs or where the following matters are proposed at any shareholder meeting: (i) an issuance of shares
representing 25% or more of the outstanding share capital of ASML or the exclusion of pre-emption rights relating to such an issuance of shares; (ii) an authorization to repurchase 25% or more of ASML’s outstanding share capital in a
12-month period; (iii) the approval of a significant change in the identity or nature of ASML, including a transfer of all or substantially all of ASML’s business or assets to a third party, establishment or cancellation of a long-lasting
cooperation that is of essential importance to ASML and an acquisition or disposition of assets with a value of at least one third of the assets of ASML; (iv) an amendment to the articles of association that would disproportionately (or
uniquely) and adversely affect the rights or benefits attached to or derived from the Intel Shares; (v) the dissolution of ASML; and (vi) any merger or demerger which would result in a significant change in the identity or nature of ASML.
|
|
|
|
|
| ASML Statutory Interim Report 2012 |
|
24 |
|
|
Standstill; Additional Purchases
Subject to certain exceptions, Intel may not, prior to the six-year anniversary of the date of the Shareholder Agreement, acquire shares in excess of 19.9% of the outstanding share capital of ASML. There
are exceptions from the foregoing restrictions in the case of a “Suspension Event”, which includes certain circumstances where a third party has acquired or made an offer to acquire at least 20% of ASML’s outstanding shares or where
ASML has announced certain change of control transactions, and the foregoing restrictions will terminate upon a “Termination Event” which includes certain change of control transactions, including where the shareholders of ASML prior to
such a transaction are no longer entitled to exercise 50% of the votes in ASML’s general meeting following such a transaction or in the event of a delisting of ASML’s shares on Euronext Amsterdam or a delisting from Nasdaq (except in the
case of a voluntary delisting where the listing is moved to the New York Stock Exchange).
If Intel acquires any additional ASML shares in
excess of 4.99% of the outstanding shares of ASML, Intel is required to deposit such shares with the Stichting in exchange for Depositary Receipts. Shares held by Intel (that are not deposited with the Stichting) will not be subject to the voting
restrictions described above or lock-up provisions described below, but will be subject to the standstill restrictions described above.
The
Stichting will continue to hold ASML shares owned by Intel (notwithstanding termination of the Standstill Period) until the earlier of (i) such time as Intel owns less than 2% of ASML’s shares, (ii) the date when the aggregate amount
of ASML’s shares owned by Intel and Other Customers represents less than 5% of ASML’s issued shares and (iii) a Termination Event, following which time Depositary Receipts will be exchanged for the underlying ASML shares. If after
such an exchange of Depositary Receipts for ASML shares and prior to termination of the Shareholder Agreement (in the circumstances described below) Intel acquires shares in excess of 2% of ASML’s outstanding shares, any shares held by Intel in
excess of 4.99% of ASML’s shares must be transferred to (and held by) the Stichting.
Lock-up; Orderly Sell Down
Intel may not, without prior written consent of ASML, transfer any ASML shares or Depositary Receipts until the earliest of (i) two years and six
months after the date of the Shareholder Agreement, (ii) termination of the NRE Funding Agreements, and (iii) the occurrence of a Termination Event. The foregoing restriction does not apply in certain circumstances where a third party
offers to acquire at least 20% of ASML’s shares. Intel is not permitted to transfer its ASML shares in connection with an offer before the end of the offer (or make any public statement in support of such offer) that is not recommended by the
ASML Supervisory Board or Management Board, except in limited circumstances. The Shareholder Agreement does not restrict hedging, provided that such hedging does not require any transfer of ASML shares by the Stichting or Depositary Receipts by
Intel.
In addition, Intel may not (even after the lock-up period ended), without written consent of ASML, transfer on Euronext Amsterdam,
Nasdaq or any other stock exchange on which ASML’s securities are traded more than 4% of the outstanding shares of ASML in any six-month period (excluding block trades and underwritten offers). There are also restrictions on Intel’s
ability to transfer shares to certain competitors or customers of ASML.
Termination
The Shareholder Agreement will terminate upon a Termination Event or winding up of ASML, or in the event that Depositary Receipts are exchanged for ASML
shares and no ASML shares are required to be re-deposited with the Stichting within 18 months of such exchange (in the circumstances described above).
NRE Funding Agreements
On July 9, 2012, ASML and Intel entered into two NRE Funding
Agreements to help fund ASML’s research and development costs and project expenditures: one agreement relates to the development of 450mm lithography equipment (the “450mm NRE Funding Agreement”) and the other relates to the
development of EUV lithography equipment (the “EUV NRE Funding Agreement”). Intel has committed to provide funding in an aggregate amount of EUR 553 million under the 450mm NRE Funding Agreement and funding in an aggregate amount of
EUR 276 million under the EUV NRE Funding Agreement, payable over the term of the 450mm NRE Funding Agreement and EUV NRE Funding Agreement, respectively. ASML will retain sole control over the development of 450mm lithography equipment and EUV
lithography equipment and will own all intellectual property created by ASML in connection therewith. The agreements provide that if ASML, in its reasonable discretion, determines to abandon either the 450mm or EUV development project, then the
parties may agree on an alternative development project, and if no alternative is agreed, ASML may invoice Intel for funding that has been committed and remaining amounts due under the relevant NRE Funding Agreement to the extent that ASML’s
R&D expense in any year exceeds a minimum threshold.
|
|
|
|
|
| ASML Statutory Interim Report 2012 |
|
25 |
|
|
Intel’s commitment to provide funding under the 450mm NRE Funding Agreement is conditional on the
issuance of the Initial Shares. Intel’s commitment to provide funding under the EUV Funding Agreement is conditional on the issuance of the Additional Shares. If the Initial Closing occurs but the Additional Closing does not occur and as a
result the EUV NRE Funding Agreement does not become effective, the parties will discuss an alternative EUV funding agreement. The NRE Funding Agreements will terminate on December 31, 2017 or upon pre-payment by Intel of the aggregate amount
of funding owed under the NRE Funding Agreements.
Commercial Agreement
On July 9, 2012, ASML and Intel entered into the Commercial Agreement, pursuant to which ASML and Intel established a contractual framework for Intel to purchase equipment related to the 450mm and
EUV lithography equipment. Under this agreement, Intel has committed to purchase specified numbers of 450mm and EUV tools. The agreement sets forth pricing terms for the tools as well as milestones related to product deliveries, and provides for
certain commercial discounts in the form of credits in exchange for Intel’s early purchase commitments and volume purchase commitments and for specified additional credits in the event that certain schedules are not met. In addition, subject to
certain conditions, ASML has agreed to install sufficient capacity to meet Intel’s forecasted 450mm lithography equipment needs through 2022. The Commercial Agreement becomes effective upon the Initial Closing.
Certain Accounting Considerations
In
accordance with IFRS, we expect the following accounting treatment: The agreements as described above are accounted for as a single multiple-element arrangement. As a result, the funding will initially be recorded on the balance sheet and is
expected to be recognized in the income statement when the credits are earned.
Veldhoven, the Netherlands
July 18, 2012
Prepared by
The Board of Management:
Eric Meurice
Peter T.F.M. Wennink
Martin A. van
den Brink
Frits J. van Hout
Frédéric J.M. Schneider-Maunoury
|
|
|
|
|
| ASML Statutory Interim Report 2012 |
|
26 |
|
|
Other Information
|
|
|
|
|
| ASML Statutory Interim Report 2012 |
|
27 |
|
|
Information and Investor Relations
Financial calendar
September 7, 2012
Extraordinary General Meeting of Shareholders
October 17, 2012
Announcement of
Third Quarter Results for 2012
January 17, 2013
Announcement of Fourth Quarter Results for 2012 and Annual Results for 2012
April 24,
2013
General Meeting of Shareholders
Fiscal Year
ASML’s fiscal year ends on December 31, 2012
Listing
The ordinary shares of the
Company are listed on the official market of the Euronext Amsterdam by NYSE Euronext and in the United States on the NASDAQ Stock Market LLC, under the symbol “ASML”. ASML’s ordinary shares may also trade on other stock exchanges from
time to time, although ASML has not applied for listings on those exchanges and does not endorse and may not be notified of such trading.
Investor Relations
ASML Investor
Relations will supply information or copies of the Annual Report on Form 20-F filed with the US Securities and Exchange Commission and the Statutory Annual and Interim Report. These Annual Reports, Interim Reports, quarterly releases and other
information are also available on and can be downloaded from the ASML website (www.asml.com).
|
|
|
|
|
| ASML Statutory Interim Report 2012 |
|
28 |
|
|
ASML Worldwide Contact Information
Corporate Headquarters
De Run 6501
5504 DR Veldhoven
The Netherlands
Mailing address
P.O. Box 324
5500 AH Veldhoven
The Netherlands
United States main offices
8555 South River Parkway
Tempe, AZ 85284
U.S.A.
77 Danbury Road
Wilton, CT 06897
U.S.A.
Asia main office
17th Floor Suite
1702-3
Queen’s road Central 100
Hong Kong
Corporate Communications
phone: +31 40 268 7870
email:
corpcom@asml.com
Investor Relations
phone: +31 40 268 3938
email: investor.relations@asml.com
For more information please visit our
website
www.asml.com
|
|
|
|
|
| ASML Statutory Interim Report 2012 |
|
29 |
|
|