WASHINGTON FEDERAL, INC. AND SUBSIDIARIES
2019 ANNUAL REPORT
Table of Contents
WASHINGTON FEDERAL, INC. AND SUBSIDIARIES
2019 ANNUAL REPORT
BUSINESS DESCRIPTION
Washington Federal Bank, National Association, a federally-insured national bank dba WaFd Bank (the “Bank” or “WaFd Bank”), was founded on April 24, 1917 in Ballard, Washington and is engaged primarily in providing lending, depository, insurance and other banking services to consumers, mid-sized to large businesses, and owners and developers of commercial real estate. Washington Federal, Inc., a Washington corporation (the “Company”), was formed as the Bank’s holding company in November, 1994. As used throughout this document, the terms “Washington Federal” or the “Company” refer to the Company and its consolidated subsidiaries, and the term “Bank” refers to the operating subsidiary, Washington Federal Bank, National Association. The Company is headquartered in Seattle, Washington.
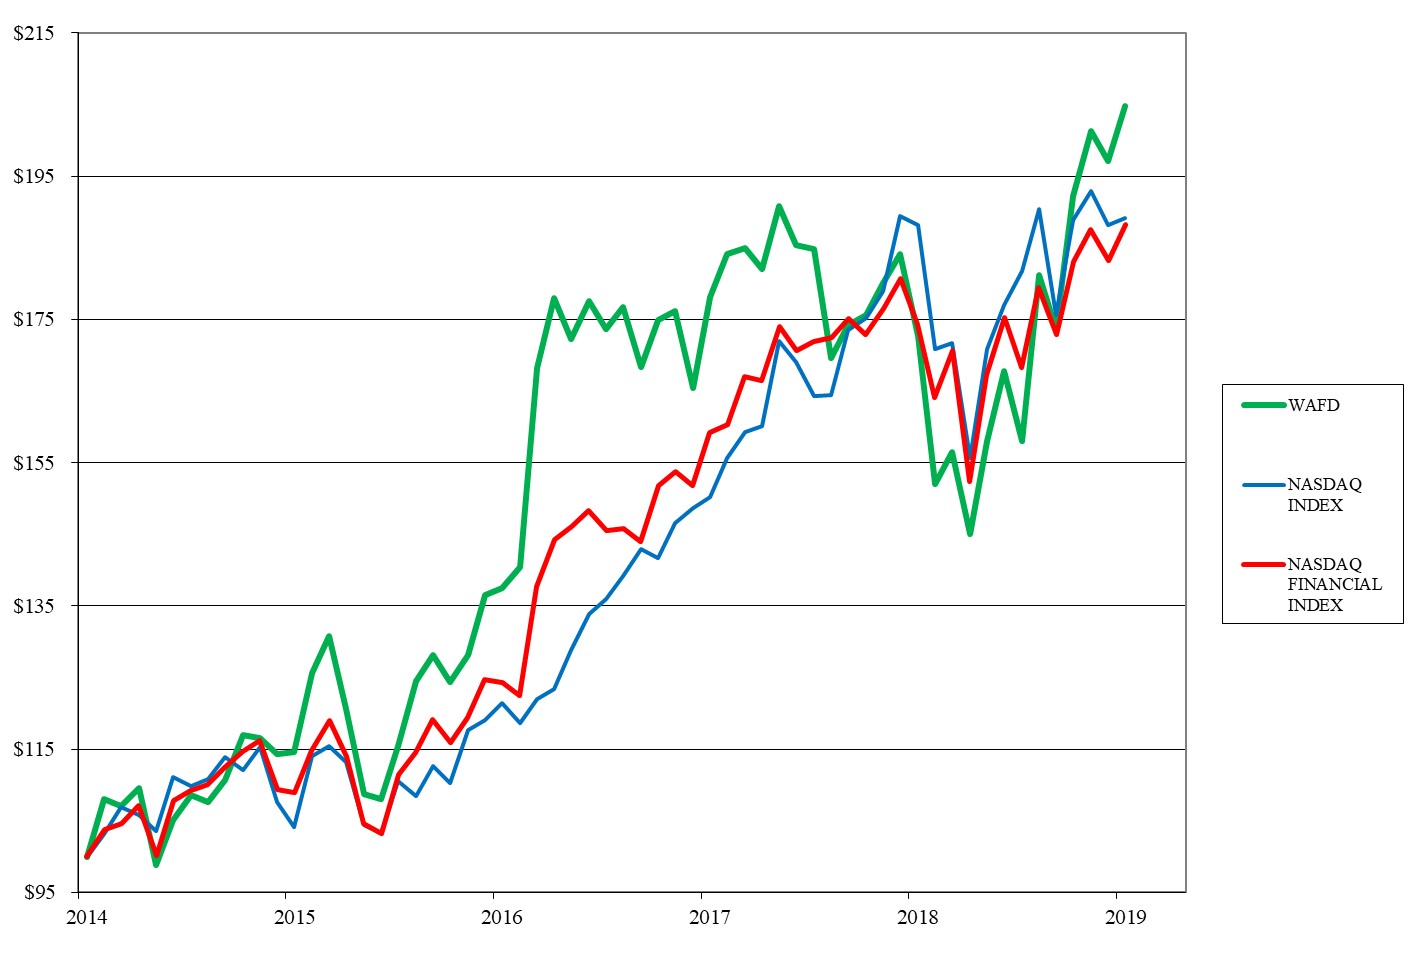
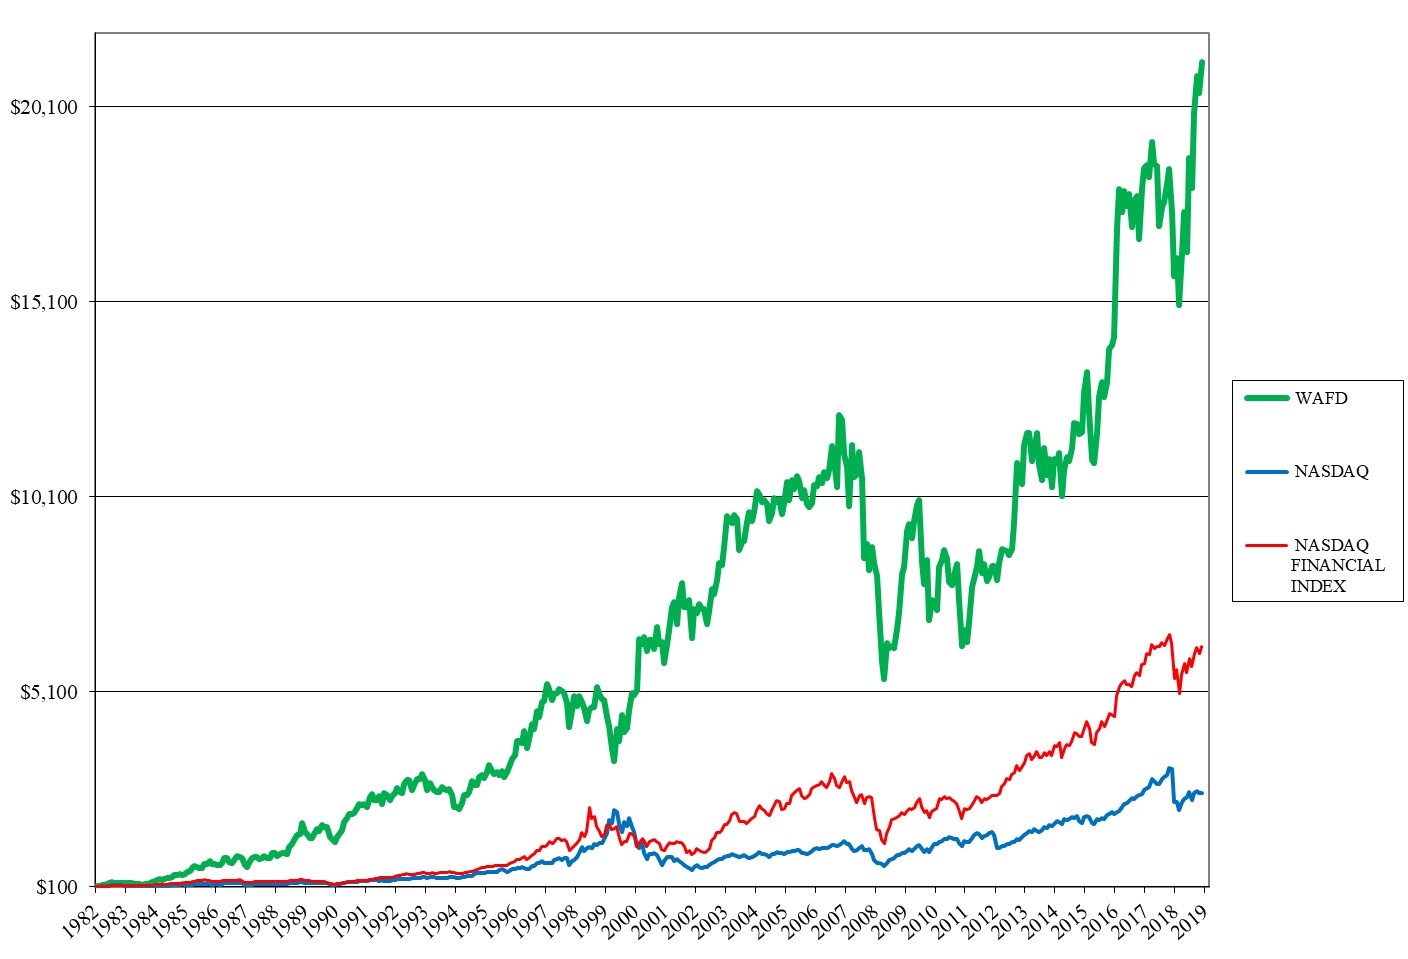
On November 9, 1982 the Company listed and began trading on the NASDAQ. Profitable operations have been recorded every year since and the Company ranks in the top 15% of the 100 largest publicly traded U.S. banks in terms of capital strength. As of September 30, 2019, the stock traded at 100 times its original 1982 offering price, has paid 146 consecutive quarterly cash dividends and has returned 14,234% total shareholder return to those who invested 37 years ago.
Over the years, the Company has expanded to serve banking clients in eight western states. While much has changed since its founding, one constant has been the commitment to doing business with integrity and treating employees, clients and investors fairly. Our tagline “invested here” is intended to reflect our people-first values and express the Company’s dedication to helping our neighborhoods and communities thrive.
FINANCIAL HIGHLIGHTS
|
| | | | | | | |
As of and for the year end September 30, | 2019 | 2018 | % Change |
| (In thousands, except per share and ratio data) |
Assets | $ | 16,474,910 |
| $ | 15,865,724 |
| +3.8% |
Cash and cash equivalents | 419,158 |
| 268,650 |
| +56.0 |
Investment securities | 503,183 |
| 415,454 |
| +21.1 |
Loans receivable, net | 11,930,575 |
| 11,477,081 |
| +4.0 |
Mortgage-backed securities | 2,426,039 |
| 2,524,923 |
| (3.9) |
Customer deposits | 11,990,764 |
| 11,387,146 |
| +5.3 |
FHLB advances and other borrowings | 2,250,000 |
| 2,330,000 |
| (3.4) |
Shareholders’ equity | 2,032,995 |
| 1,996,908 |
| +1.8 |
Net income | 210,256 |
| 203,850 |
| +3.1 |
Diluted earnings per share | 2.61 |
| 2.40 |
| +8.8 |
Dividends per share | 0.79 |
| 0.67 |
| +17.9 |
Shareholders’ equity per share | 25.79 |
| 24.14 |
| +6.8 |
Shares outstanding | 78,841 |
| 82,711 |
| (4.7) |
Return on average shareholders’ equity | 10.46 | % | 10.16 | % | +3.0 |
Return on average assets | 1.28 |
| 1.31 |
| (2.3) |
Efficiency ratio (1) (2) | 52.09 |
| 50.37 |
| +3.4 |
| |
(1) | Calculated as total operating costs divided by net interest income, plus other income (excluding non-operating gains) |
| |
(2) | Efficiency ratio for the year ended September 30, 2018 excludes the impact of $8,550,000 reduction to non-interest income related to FDIC loss share valuation adjustments. |
WASHINGTON FEDERAL, INC. AND SUBSIDIARIES
2019 ANNUAL REPORT
ANNUAL REPORT 2019
Fellow Shareholder,
Fiscal 2019 was another record-breaking year for your Company, Washington Federal. Net income for the year was $210,256,000, a 3.1% increase over the $203,850,000 generated last year. Earnings per share, perhaps the most important measure of performance for shareholders, increased to $2.61 per share, 8.8% higher than the previous record of $2.40 set in 2018. In this letter last year, I spoke of our stock trading below its intrinsic value at the time. It is gratifying to see how our stock appreciated in value since then, generating a total shareholder return of over 18% for the fiscal year.
Banking, if done correctly, should be a boring business. In its simplest form, a bank is a financial intermediary. We take in deposits from those who have worked hard and built a surplus and lend that money out to credit-worthy borrowers. The difference between what we earn on the loans and what we pay to depositors is the main driver of our profitability, known as the net interest margin. This year, we turned our focus to growing organically and found success growing deposits by $604 million or 5%. Even more importantly, we were able to grow transaction accounts by $501 million or 8%. We attribute this growth to significantly improved capabilities in our commercial treasury management system and a cloud-based online and mobile banking solution for our consumer clients. As of June 30, 2019, our weighted average market share of the total deposits in our eight states is only 0.87%, demonstrating the significant opportunity we have to gain additional market share if we’re able to execute on our vision of becoming a digital-first bank that anticipates the needs of our clients and makes banking simple, reliable and FAST.
Net loan growth totaled $453 million or 4% as market interest rates declined causing loan pre-payments to accelerate. The quality of loans originated is perhaps the most important attribute of banks that survive the downturns in economic cycles. Recessions happen, as do economic booms. The key from our perspective is to have a strong enough balance sheet to remain a reliable resource for our clients in both good times and bad. Acknowledging we are experiencing one of the longest economic expansions of our lifetimes, we are preparing for a potential downturn by maintaining:
| |
1) | Strong tangible capital and an allowance for loan losses. Together, these totaled $1.9 billion at year end. |
| |
2) | Client selectivity. We underwrite loans assuming economic stresses will occur and seek borrowers who are fiscally conservative. This type of borrower typically does not maximize leverage and has capital and liquidity buffers to offset future volatility. |
| |
3) | Ample liquidity. At year end, we had on-balance-sheet liquidity of $2.8 billion plus an additional $5.9 billion in borrowing capacity. |
Experience has shown we have historically taken less credit risk than our peers and it is our intent to continue to grant credit judiciously. That said, we understand that we can and likely will make mistakes that will become evident during the next downturn with the benefit of hindsight. Risks may be inherent in our balance sheet and the market today that are different than what we have faced historically. For these reasons, we believe in maintaining a capital level that is larger than most of our peers. The ratio we focus on is tangible common equity plus allowance as a percentage of tangible assets. As of September 30, 2019, this ratio was 11.48% and the bank ranked #15 of the largest 100 publicly traded banks in the United States.
As the saying goes, “beauty is in the eye of the beholder,” and the same can be said of stock valuations. I have increasingly been focused on a measure we refer to as “return on market cap.” It is calculated by taking after-tax earnings for the last four quarters and dividing by our current market capitalization. It is another way of looking at the very common price-to-earnings ratio. The return on market cap is simply the inverse of the P/E ratio. As of the writing of this letter, WAFD stock return on market cap is 7.26%. When compared to other available investments, coupled with our belief in our prospects for growth, we see the stock price still trading below its intrinsic value, and thus have continued to repurchase shares. Currently, the Board has authorized repurchases up to an additional 8 million shares.
As part of our strategic plan, we are intentionally increasing our investments in operations, specifically in the areas of technology and regulatory compliance. For the year, our operating expenses increased by $19 million or 7% and we expect to continue making investments that will improve the banking experience for our clients. One of our core values is that we are disciplined in our actions. In the area of expenses, that means if we make an investment, we expect to see results. What are some of the results of these investments?
| |
1) | Organic growth of loans and deposits as mentioned above. |
WASHINGTON FEDERAL, INC. AND SUBSIDIARIES
2019 ANNUAL REPORT
| |
2) | Significant improvement in our net promoter score from 17 in 2017, to 34 in 2018 and now 48 in 2019. In terms of scale, a score of 50 is thought to be excellent and basically means that our clients are far more likely to recommend us today than they were three years ago. |
| |
3) | Our mobile bank app is now a 4.8-star rating, a significant improvement from the 2.5 stars one year ago. |
Future investments will center on improved mobile and online banking experiences, more efficient loan origination systems, and the automation of back office workflows to better understand our clients and anticipate their needs.
During the year, we announced the evolution of our brand name to WaFd Bank. Through the years, we heard that the name “Washington Federal” caused confusion about what we did. Some told us they weren’t sure if we were a part of the Federal government or perhaps a credit union. We are solving this by re-branding to WaFd Bank. This name pays tribute to our incredible 102-year legacy of doing the right thing for our clients and shareholders, and at the same time confirms to the world we are a “bank.” The early feedback is quite positive, with most clients viewing this as a non-event. Some even tell us, “I thought that was already your name” or that “the new branding is fresh and clean.”
We were fortunate during the past year to attract two well-qualified directors onto our Board. Stephen Graham is a partner with the law firm Fenwick & West LLP with expertise in corporate governance, mergers and acquisitions and securities regulation matters. Linda Brower is a career banking executive, having served in leadership roles at both US Bank and WaFd Bank. She has significant experience in bank operations, human capital, technology and compliance. We welcome both Linda and Steve to our Board of Directors and believe they will both contribute to the long-term success of your company.
At the annual meeting in January, we will bid farewell to Director Anna Johnson, who will be stepping down from the Board after 25 years of dedicated service. Anna has played an integral part in setting the strategic direction for the bank and connecting us firmly to the values that serve as our foundation for all our decisions. A small business owner, she has provided unique perspective on the challenges our clients face and where the bank can add value.
Mr. Mark Schoonover is transitioning into retirement after ten years at the Bank as our Chief Credit Officer. Mark has been instrumental in executing our credit standards and working through the wave of problem assets that came with the Great Recession. Mr. Bob Peters is also transitioning into retirement from his role as the leader of our commercial bank for the last five years. Bob has significantly expanded our skillset in commercial banking and introduced the Bank to many clients that will help drive our growth going forward. Replacing Mark and Bob are Ryan Mauer as Chief Credit Officer and James Endrizzi as the Senior Vice President of Commercial Banking. We are fortunate to have their combined 50 years of banking experience and will benefit from their first-hand knowledge of what differentiates WaFd Bank from others in the industry.
I conclude by saying how thankful I am for the incredible team of employees that make WaFd Bank a special place. In addition to the financial results shown in this report, our team has contributed over 15,400 hours of community service and donated over $1,466,000 dollars to charitable causes. Because of the intelligence and hard work of the nearly 2,000 employees that choose to build their careers here, the record results described above were possible for all of us as shareholders.
I look forward to seeing you at your Company’s Annual Meeting of Shareholders, scheduled for the Washington Athletic Club, 1325 6th Avenue in downtown Seattle, on January 22, 2020 at 2 p.m. In the meantime, we invite you to help our business grow and prosper by referring your friends, neighbors, and the businesses you associate with to WaFd Bank for all their banking needs. We look forward to serving you in the coming new year.
Sincerely,
Brent J. Beardall
President and Chief Executive Officer
WASHINGTON FEDERAL, INC. AND SUBSIDIARIES
2019 ANNUAL REPORT
Back row from left to right: Ryan Mauer, Senior Vice President & Chief Credit Officer; Vince Beatty, Executive Vice President & Chief Financial Officer; Cathy Cooper, Executive Vice President Retail Banking; James Endrizzi, Senior Vice President Commercial Banking
Front row from left to right: Brent Beardall, President & Chief Executive Officer; Kim Robison, Executive Vice President Operations
MANAGEMENT'S DISCUSSION AND ANALYSIS OF FINANCIAL CONDITION AND RESULTS OF OPERATIONS
We make statements in this Annual Report that constitute forward-looking statements. Words such as “expects,” “anticipates,” “believes,” “estimates,” “intends,” “forecasts,” “projects” and other similar expressions, as well as future or conditional verbs such as “will,” “should,” “would” and “could,” are intended to help identify such forward-looking statements. These statements are not historical facts, but instead represent current expectations, plans or forecasts of the Company and are based on the beliefs and assumptions of the management of the Company and the information available to management at the time that these disclosures were prepared. The Company intends for all such forward-looking statements to be covered by the safe harbor provisions for forward-looking statements within the meaning of the Private Securities Litigation Reform Act of 1995 and the provisions of Section 27A of the Securities Act of 1933 and Section 21E of the Securities Exchange Act of 1934. These statements are not guarantees of future results or performance and involve certain risks, uncertainties and assumptions that are difficult to predict and often are beyond the Company's control. Actual outcomes and results may differ materially from those expressed in, or implied by, the Company's forward-looking statements.
You should not place undue reliance on any forward-looking statement and should consider the following uncertainties and risks, as well as the risks and uncertainties discussed elsewhere in this report, and under "Item 1A. Risk Factors” contained in our Form 10-K for the fiscal year ended September 30, 2019, and in any of the Company's other subsequent Securities and Exchange Commission filings, which could cause our future results to differ materially from the plans, objectives, goals, estimates, intentions and expectations expressed in forward-looking statements:
| |
• | a deterioration in economic conditions, including declines in the real estate market and home sale volumes and financial stress on borrowers as a result of the uncertain economic environment; |
| |
• | the effects of a severe economic downturn, including high unemployment rates and declines in housing prices and property values, in the Company's primary market areas; |
| |
• | the effects of and changes in monetary and fiscal policies of the Board of Governors of the Federal Reserve System and the U.S. Government; |
| |
• | fluctuations in interest rate risk and changes in market interest rates, including risk related to LIBOR reform; |
| |
• | the Company's ability to make accurate assumptions and judgments about the collectability of its loan portfolio, including the creditworthiness of its borrowers and the value of the assets securing these loans; |
| |
• | legislative and regulatory limitations, including those arising under the Dodd-Frank Act and potential limitations in the manner in which the Company conducts its business and undertakes new investments and activities; |
| |
• | the ability of the Company to obtain external financing to fund its operations or obtain this financing on favorable terms; |
| |
• | changes in other economic, competitive, governmental, regulatory, and technological factors affecting the Company's markets, operations, pricing, products, services and fees; |
| |
• | the success of the Company at managing the risks involved in the remediation efforts associated with its Bank Secrecy Act program, costs of enhancements to the Bank’s BSA program are greater than anticipated; and governmental authorities undertake enforcement actions or legal proceedings with respect to the Bank’s BSA program beyond those contemplated by the Consent Order, and the potential impact of such matters on the success, timing and ability to pursue the Company’s growth or other business initiatives; |
| |
• | the success of the Company at managing the risks involved in the foregoing and managing its business; and |
| |
• | the timing and occurrence or non-occurrence of events that may be subject to circumstances beyond the Company's control. |
All forward-looking statements speak only as of the date on which such statements are made, and the Company undertakes no obligation to update or revise any forward-looking statements to reflect changed assumptions, the occurrence of unanticipated events, changes to future operating results over time, or the impact of circumstances arising after the date the forward-looking statement was made.
MANAGEMENT'S DISCUSSION AND ANALYSIS OF FINANCIAL CONDITION AND RESULTS OF OPERATIONS
GENERAL
Washington Federal Bank, National Association, a federally-insured national bank dba WaFd Bank (the “Bank” or “WaFd Bank”), was founded on April 24, 1917 in Ballard, Washington and is engaged primarily in providing lending, depository, insurance and other banking services to consumers, mid-sized to large businesses, and owners and developers of commercial real estate. Washington Federal, Inc., a Washington corporation (the “Company”), was formed as the Bank’s holding company in November, 1994. As used throughout this document, the terms “Washington Federal” or the “Company” refer to the Company and its consolidated subsidiaries, and the term “Bank” refers to the operating subsidiary, Washington Federal Bank, National Association. The Company is headquartered in Seattle, Washington.
The Company's fiscal year end is September 30. All references to 2019, 2018 and 2017 represent balances as of September 30, 2019, September 30, 2018, and September 30, 2017, or activity for the fiscal years then ended.
CRITICAL ACCOUNTING POLICIES
Preparation of financial statements in conformity with accounting principles generally accepted in the United States of America requires the use of estimates and assumptions that affect reported amounts of certain assets, liabilities, revenues and expenses in the Company's consolidated financial statements. Accordingly, estimated amounts may fluctuate from one reporting period to another due to changes in assumptions underlying estimated values.
The Company has determined that the only accounting policy critical to an understanding of the consolidated financial statements of Washington Federal relates to the methodology for determining the amount of the allowance for loan losses. The Company maintains an allowance to absorb losses inherent in the loan portfolio. The allowance is based on ongoing, quarterly assessments of the probable and estimable losses inherent in the loan portfolio.
The general loan loss allowance is established by applying a loss percentage factor to the different loan types. For example, residential real estate loans are not individually analyzed for impairment and loss exposure because of the significant number of loans, their relatively small balances and their historically low level of losses. See the "Asset Quality and Allowance for Loan Losses" section below for additional information about establishing the loss factors. Specific allowances may be established for loans that are deemed to be individually impaired.
INTEREST RATE RISK
The primary source of income for the Company is net interest income, which is the difference between the interest income generated by interest-earning assets and the interest expense incurred for interest-bearing liabilities. The level of net interest income is a function of the average balance of interest-earning assets and interest-bearing liabilities and the difference between the yield on earning assets and the cost of interest-bearing liabilities. Both the pricing and mix of the Company's interest-earning assets and interest-bearing liabilities influence these factors. All else being equal, if the interest rates on the Company's interest-bearing liabilities increase at a faster pace than the interest rates on its interest-earning assets, the result would be a reduction in net interest income and with it, a reduction in net earnings.
Based on management's assessment of the current interest rate environment, the Company has taken steps, including growing commercial loans having shorter average lives and transaction deposit accounts, to position itself for changing interest rates.
The Company's balance sheet strategy, in conjunction with low operating costs, has allowed the Company to manage interest rate risk, within guidelines established by the Board of Directors, through all interest rate cycles. It is management's objective to grow the dollar amount of net interest income through the rate cycles, acknowledging that there will be some periods of time when that will not be feasible.
Management relies on various measures of interest rate risk, including modeling of changes in the Company's forecasted net interest income under various rate change scenarios, the impact of interest rate changes on the net portfolio value ("NPV") and an asset/liability maturity gap analysis.
Net Interest Income Sensitivity. We estimate the sensitivity of our net interest income to changes in market interest rates using an interest rate simulation model that includes assumptions related to the level of balance sheet growth, deposit repricing characteristics and the rate of prepayments for multiple interest rate change scenarios. Interest rate sensitivity depends on certain
MANAGEMENT'S DISCUSSION AND ANALYSIS OF FINANCIAL CONDITION AND RESULTS OF OPERATIONS
repricing characteristics in our interest-earning assets and interest-bearing liabilities, including the maturity structure of assets and liabilities and their repricing characteristics during the periods of changes in market interest rates. The analysis assumes a constant balance sheet. Actual results would differ from the assumptions used in this model, as management monitors and adjusts loan and deposit pricing and the size and composition of the balance sheet to respond to changing interest rates.
In the event of an immediate and parallel increase of 200 basis points in both short- and long-term interest rates, the model estimates that net interest income would increase by 1.4% in the next year. This compares to an estimated decrease of 1.9% as of the September 30, 2018, analysis. It is noted that a flattening yield curve where the spread between short-term rates and long-term rates decreases would likely result in lower net interest income. Management estimates that a gradual increase of 300 basis points in short-term rates and 100 basis points in long-term rates over two years would result in no meaningful change in net interest income in the first year and a decrease of 2.1% in the second year, assuming a constant balance sheet and no management intervention.
NPV Sensitivity. The NPV is an estimate of the market value of shareholders' equity at a point in time. It is derived by calculating the difference between the present value of expected cash flows from interest-earning assets and the present value of expected cash flows from interest-paying liabilities and off-balance-sheet contracts. The sensitivity of the NPV to changes in interest rates provides a longer term view of interest rate risk as it incorporates all future expected cash flows. As of September 30, 2019, in the event of an immediate and parallel increase of 200 basis points in interest rates, the NPV is estimated to decline by $258 million, or 10.5%, and the NPV-to-total assets ratio to decline to 13.9% from a base of 14.6%. As of September 30, 2018, in the event of an immediate and parallel increase of 200 basis points in interest rates, the NPV was estimated to decline by $418 million, or 18.2%, and the NPV-to-total assets ratio to decline to 12.9% from a base of 14.7%. The decrease in the sensitivity of the NPV ratio to this assumed change in interest rates is primarily due to the flattening of the yield curve and changes in balance sheet mix year over year.
Interest Rate Spread. The interest rate spread is measured as the difference between the rate on interest-earning assets and the rate on interest-bearing liabilities at the end of each period. The interest rate spread was 2.80% at September 30, 2019 and 2.90% at September 30, 2018. As of September 30, 2019, the weighted average rate on interest-earning assets increased by 3 basis points to 4.10% compared to September 30, 2018. The improved rate on interest-earning assets is due primarily to changes in asset mix as commercial loans comprised a higher proportion of assets. As of September 30, 2019, the weighted average rate on interest-bearing liabilities increased by 13 basis points to 1.30% compared to September 30, 2018. The higher rate on interest-bearing liabilities is due primarily to rising interest rates on customer deposits, partially offset by a lower rate on FHLB borrowings due to lower rates on new FHLB advances and maturing advances with higher rates.
|
| | | | | | | | | | | | | | | | | | | | | | | |
| SEP 2019 | | JUN 2019 | | MAR 2019 | | DEC 2018 | | SEP 2018 | | JUN 2018 | | MAR 2018 | | DEC 2017 |
Interest rate on loans and mortgage-backed securities | 4.25 | % | | 4.32 | % | | 4.32 | % | | 4.28 | % | | 4.19 | % | | 4.13 | % | | 4.06 | % | | 3.99 | % |
Interest rate on other interest-earning assets | 2.10 |
| | 2.37 |
| | 2.33 |
| | 2.25 |
| | 2.13 |
| | 2.18 |
| | 1.87 |
| | 1.59 |
|
Combined, all interest-earning assets | 4.10 |
| | 4.21 |
| | 4.20 |
| | 4.17 |
| | 4.07 |
| | 4.01 |
| | 3.94 |
| | 3.85 |
|
Interest rate on customer accounts | 1.08 |
| | 1.13 |
| | 1.09 |
| | 0.99 |
| | 0.87 |
| | 0.75 |
| | 0.65 |
| | 0.57 |
|
Interest rate on borrowings | 2.49 |
| | 2.58 |
| | 2.77 |
| | 2.75 |
| | 2.66 |
| | 2.64 |
| | 2.62 |
| | 2.56 |
|
Combined cost of funds | 1.30 |
| | 1.39 |
| | 1.39 |
| | 1.31 |
| | 1.17 |
| | 1.08 |
| | 0.99 |
| | 0.93 |
|
Interest rate spread | 2.80 | % | | 2.82 | % | | 2.81 | % | | 2.86 | % | | 2.90 | % | | 2.93 | % | | 2.95 | % | | 2.92 | % |
MANAGEMENT'S DISCUSSION AND ANALYSIS OF FINANCIAL CONDITION AND RESULTS OF OPERATIONS
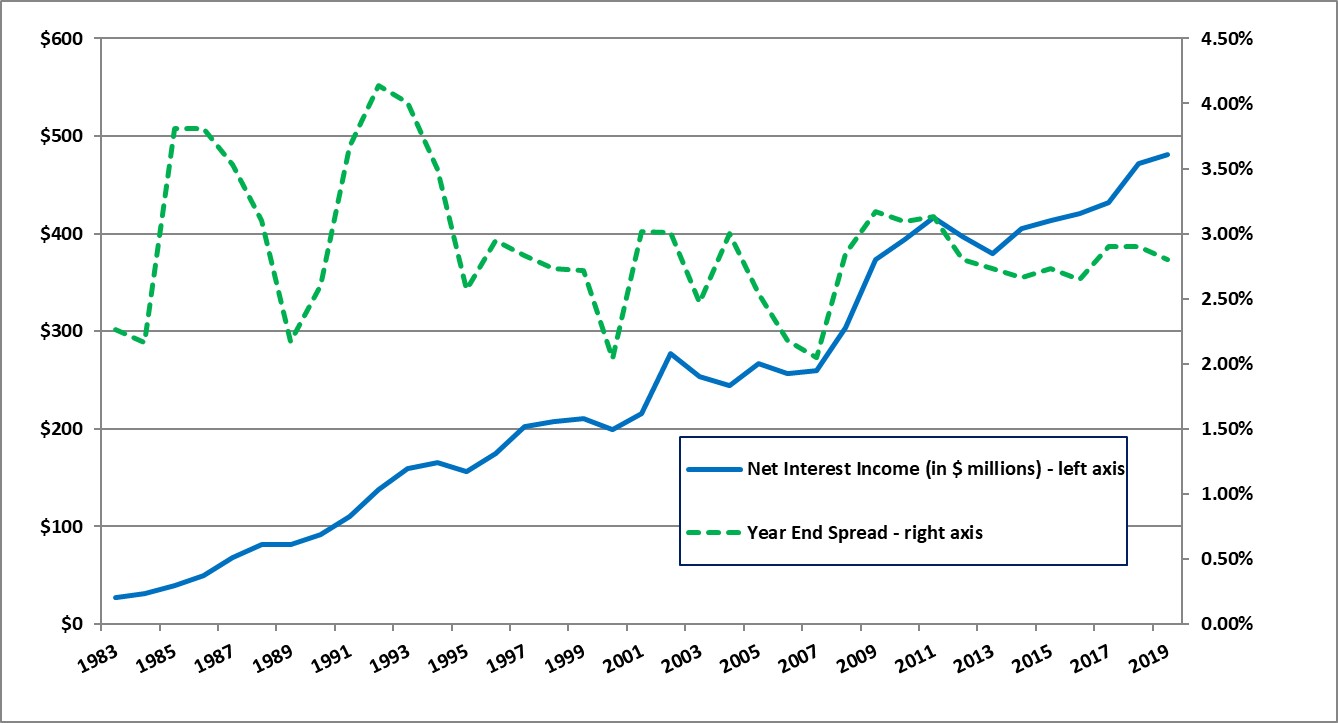
The chart below shows the volatility of our period end net interest spread (dashed line measured against the right axis) compared to the relatively consistent growth in net interest income (solid line measured against the left axis). The relative consistency of net interest income is accomplished by actively managing the size and composition of the balance sheet through different rate cycles.
Net Interest Margin. The net interest margin is measured using the net interest income divided by average interest-earning assets for the period. The net interest margin decreased to 3.16% for the year ended September 30, 2019, from 3.27% for the year ended September 30, 2018. The yield on interest-earning assets increased 22 basis points to 4.42% and the cost of interest-bearing liabilities increased by 34 basis points to 1.34%. The higher yield on interest-earning assets is primarily the result of changes in asset mix as commercial loans comprised a higher proportion of assets. The higher cost on interest-bearing liabilities is due primarily to rising interest rates on customer deposits, partially offset by a lower rate on FHLB borrowings due to lower rates on new FHLB advances and maturing advances with higher rates.
For the year ended September 30, 2019, average interest-earning assets increased by 5.1% to $15,203,819,000, up from $14,459,452,000 for the year ended September 30, 2018. During 2019, average loans receivable increased $612,351,000, or 5.5%, while the combined average balances of mortgage-backed securities, other investment securities and cash increased by $126,052,000 or 4.0%. Management views organic loan growth as the highest and best use of capital; thus the focus on primarily growing loans receivable.
During 2019, average customer deposit accounts increased $594,681,000 or 5.4% and the average balance of FHLB borrowings increased by $149,095,000, or 6.3%, from 2018.
MANAGEMENT'S DISCUSSION AND ANALYSIS OF FINANCIAL CONDITION AND RESULTS OF OPERATIONS
The following table sets forth the information explaining the changes in the net interest income and net interest margin for 2019 compared to the prior year.
|
| | | | | | | | | | | | | | | | | | | | | |
| Twelve Months Ended September 30, 2019 | | Twelve Months Ended September 30, 2018 |
| Average Balance | | Interest | | Average Rate | | Average Balance | | Interest | | Average Rate |
| (In thousands) | | (In thousands) |
Assets | | | | | | | | | | | |
Loans receivable | $ | 11,814,480 |
| | $ | 568,096 |
| | 4.81 | % | | $ | 11,202,129 |
| | $ | 515,807 |
| | 4.60 | % |
Mortgaged-backed securities | 2,554,653 |
| | 74,485 |
| | 2.92 |
| | 2,543,796 |
| | 70,407 |
| | 2.77 |
|
Cash & investments | 699,340 |
| | 22,290 |
| | 3.19 |
| | 584,145 |
| | 15,456 |
| | 2.65 |
|
FHLB & FRB stock | 135,346 |
| | 6,595 |
| | 4.87 |
| | 129,382 |
| | 5,413 |
| | 4.18 |
|
| | |
|
| |
|
| |
|
| |
|
| |
|
|
Total interest-earning assets | 15,203,819 |
| | 671,466 |
| | 4.42 | % | | 14,459,452 |
| | 607,083 |
| | 4.20 | % |
Other assets | 1,160,302 |
| | | | | | 1,155,819 |
| |
|
| |
|
|
Total assets | $ | 16,364,121 |
| | | | | | $ | 15,615,271 |
| |
| |
|
| | | | | | | | | | | |
Liabilities and Equity | | | | | | | | | | | |
Customer accounts | $ | 11,663,142 |
| | $ | 122,216 |
| | 1.05 | % | | $ | 11,068,461 |
| | $ | 72,492 |
| | 0.65 | % |
FHLB advances | 2,533,890 |
| | 68,190 |
| | 2.69 |
| | 2,384,795 |
| | 62,452 |
| | 2.62 |
|
|
| |
| |
|
| |
| |
| |
|
|
Total interest-bearing liabilities | 14,197,032 |
| | 190,406 |
| | 1.34 | % | | 13,453,256 |
| | 134,944 |
| | 1.00 | % |
Other liabilities | 156,557 |
| | | | | | 155,950 |
| | | | |
Total liabilities | 14,353,589 |
| | | | | | 13,609,206 |
| | | | |
Shareholders' equity | 2,010,532 |
| | | | | | 2,006,065 |
| | | | |
Total liabilities and equity | $ | 16,364,121 |
| | | | | | $ | 15,615,271 |
| | | | |
Net interest income | | | $ | 481,060 |
| | | | | | $ | 472,139 |
| | |
Net interest margin | | | | | 3.16 | % | | | | | | 3.27 | % |
MANAGEMENT'S DISCUSSION AND ANALYSIS OF FINANCIAL CONDITION AND RESULTS OF OPERATIONS
ASSET QUALITY & ALLOWANCE FOR LOAN LOSSES
The Company maintains an allowance to absorb losses inherent in the loan portfolio. The amount of the allowance is based on ongoing, quarterly assessments of the probable and estimable losses inherent in the loan portfolio. The Company's methodology for determining the appropriateness of the allowance is primarily based on a general allowance methodology and also includes specific reserves. The Company also has a reserve for unfunded commitments.
The loan loss allowance is primarily established by applying a loss percentage factor to the different loan types. Management believes loan types are the most relevant factor in the allowance calculation for groups of homogeneous loans as the risk characteristics within these groups are similar. The loss percentage factor is made up of two parts - the historical loss factor (“HLF”) and the qualitative loss factor (“QLF”).
The HLF takes into account historical charge-offs by loan type. The Company estimates a loss rate for each loan category by using charge-off data over a historical period that encompasses a full credit cycle. These rates are then multiplied by an estimated loss emergence period. The loss emergence period is the likely period of time during which a consumer or commercial loan borrower experiencing financial difficulty might be utilizing their cash reserves prior to becoming delinquent on their loan.
The QLF is based on management's continuing evaluation of the pertinent factors underlying the quality of the loan portfolio, including changes in the size and composition of the loan portfolio, actual loan loss experience, delinquency trends, current economic conditions, collateral values, geographic concentrations, seasoning of the loan portfolio, specific industry conditions and the duration of the current business cycle. These factors are considered by loan type. Single-family residential loan sub-types are evaluated in groups by loan size, loan to value, as well as non-owner or owner occupied. In addition, loan growth or declines for each loan category are taken into consideration.
The total allowance for loan losses increased by $2,277,000, or 1.76%, from $129,257,000 as of September 30, 2018, to $131,534,000 at September 30, 2019. As of September 30, 2019, the Company had $439,000 of specific reserves for loans deemed to be individually impaired and the remaining balance of $131,095,000 is general allowance, which was comprised of $78,280,000 related to HLF and $52,815,000 related to QLF. The Company released $1,650,000 of allowance for loan losses in 2019 due primarily to net recoveries of $3,577,000, comprised of $15,053,000 in recoveries and $11,476,000 in charge offs, partially offset by reserving for overall growth in the loan portfolio.
Unfunded commitments tend to vary depending on the Company's loan mix and the proportionate share of commercial loans. The reserve for unfunded loan commitments was $6,900,000 as of September 30, 2019, compared to $7,250,000 as of September 30, 2018.
The ratio of the allowance for loan losses and reserves for unfunded loan commitments to total gross loans was 1.04% as of September 30, 2019, and 1.06% as of September 30, 2018. Management believes the allowance for loan losses and reserves for unfunded loan commitments is sufficient to absorb estimated losses inherent in the portfolio of loans and unfunded commitments.
The recovery of the carrying value of loans is susceptible to future market conditions beyond the Company's control, which may result in losses or recoveries differing from those estimated.
Restructured loans. Restructured single-family residential loans are reserved for under the Company's loan loss reserve methodology. Most troubled debt restructured ("TDR") loans are performing and accruing loans where the borrower has proactively approached the Company about modifications due to temporary financial difficulties. Each request is individually evaluated for merit and likelihood of success. The concession for these loans is typically a payment reduction through a rate reduction of 100 to 200 basis points for a specific term, usually six to twelve months. Interest-only payments may also be approved during the modification period.
The balance of outstanding TDRs decreased to $121,677,000 as of September 30, 2019, from $156,858,000 as of September 30, 2018. As of September 30, 2019, 95.9% of the restructured loans were performing. During 2019, there were additions of $1,265,000 and reductions of $36,445,000 due to prepayments and transfers to real estate owned ("REO"). As of September 30, 2019, 92.0% of restructured loans are comprised of single-family residential loans.
MANAGEMENT'S DISCUSSION AND ANALYSIS OF FINANCIAL CONDITION AND RESULTS OF OPERATIONS
Concessions for construction, land A&D and multi-family loans are typically an extension of maturity combined with a rate reduction of normally 100 basis points. Before granting approval to modify a loan in a TDR, a borrower’s ability to repay is considered by evaluating current income levels, debt-to-income ratio, credit score, loan payment history and an updated evaluation of the secondary repayment source.
If a loan is on non-accrual status before becoming a TDR, it will stay on non-accrual status following restructuring until it has been performing for at least six months, at which point it may be moved to accrual status. If a loan is on accrual status before it becomes a TDR, and it is concluded that a full repayment is highly probable, it will remain on accrual status following restructuring. If the homogeneous restructured loan does not perform, it is placed in non-accrual status when it is 90 days delinquent. For commercial loans, six consecutive payments on newly restructured loan terms are required prior to returning the loan to accrual status. After the required six consecutive payments are made, a management assessment may conclude that collection of the entire principal and interest due is still in doubt. In those instances, the loan will remain on non-accrual. A loan that defaults and is subsequently modified would impact the Company's delinquency trend, which is part of the QLF component of the general reserve calculation. Any modified loan that re-defaults and is charged-off would impact the HLF component of our general reserve calculation.
Non-performing assets. Non-performing assets were $43,826,000, or 0.27% of total assets, at September 30, 2019, compared to $70,093,000, or 0.44% of total assets, at September 30, 2018.
The following table provides detail related to the Company's non-performing assets.
|
| | | | | | | | | | | | | | | |
| | September 30, | | | | |
Non-Performing Assets | | 2019 | | 2018 | | $ Change | | % Change |
| | (In thousands) | | |
Non-accrual loans: | | | | | | | | |
Single-family residential | | $ | 25,271 |
| | $ | 27,643 |
| | $ | (2,372 | ) | | (8.6 | )% |
Construction | | — |
| | 2,427 |
| | (2,427 | ) | | (100.0 | ) |
Land – acquisition & development (A&D) | | 169 |
| | 920 |
| | (751 | ) | | (81.6 | ) |
Land – consumer lot loans | | 246 |
| | 787 |
| | (541 | ) | | (68.7 | ) |
Commercial real estate | | 5,835 |
| | 8,971 |
| | (3,136 | ) | | (35.0 | ) |
Commercial & industrial | | 1,292 |
| | 14,394 |
| | (13,102 | ) | | (91.0 | ) |
HELOC | | 907 |
| | 523 |
| | 384 |
| | 73.4 |
|
Consumer | | 11 |
| | 21 |
| | (10 | ) | | (47.6 | ) |
Total non-accrual loans | | 33,731 |
| | 55,686 |
| | (21,955 | ) | | (39.4 | ) |
Real estate owned | | 6,781 |
| | 11,298 |
| | (4,517 | ) | | (40.0 | ) |
Other property owned | | 3,314 |
| | 3,109 |
| | 205 |
| | 6.6 |
|
Total non-performing assets | | $ | 43,826 |
| | $ | 70,093 |
| | $ | (26,267 | ) | | (37.5 | )% |
The ratio of the allowance for loan losses to non-accrual loans increased to 390% as of September 30, 2019, from 232% as of September 30, 2018.
LIQUIDITY AND CAPITAL RESOURCES
The principal sources of funds for the Company's activities are loan repayments (including prepayments), net deposit inflows, repayments and sales of investments, borrowings and retained earnings. The Company's principal sources of revenue are interest on loans and interest and dividends on investments.
The Company's shareholders' equity at September 30, 2019, was $2,032,995,000, or 12.34% of total assets, as compared to $1,996,908,000, or 12.59% of total assets, at September 30, 2018. The Company's shareholders' equity was impacted in the year by net income of $210,256,000, the payment of $63,318,000 in cash dividends, $123,854,000 of treasury stock purchases, as well as other comprehensive income of $6,998,000. The Company paid out 30.1% of its 2019 earnings in cash dividends to common shareholders, compared with 27.5% last year. For the year ended September 30, 2019, the Company returned 89.0% of net income to shareholders in the form of cash dividends and share repurchases as compared to 108.0% for the year ended September 30, 2018. Management believes the Company's strong net worth position allows it to manage balance sheet risk and provide the capital support needed for controlled growth in a regulated environment.
The Bank has a credit line with the Federal Home Loan Bank of Des Moines ("FHLB") up to 45% of total assets depending on specific collateral eligibility. This line provides a substantial source of additional liquidity if needed. As of September 30, 2019, the Bank had $2,340,944,000 of additional borrowing capacity at the FHLB.
The Bank has entered into borrowing agreements with the FHLB to borrow funds under a short-term floating rate cash management advance program and fixed-rate term advance agreements. All borrowings are secured by stock of the FHLB, deposits with the FHLB, and a blanket pledge of qualifying loans receivable as provided in the agreements with the FHLB. The Bank is also eligible to borrow under the Federal Reserve Bank's primary credit program.
The Company's cash and cash equivalents were $419,158,000 at September 30, 2019, which is a 56.0% increase from the balance of $268,650,000 as of September 30, 2018. See “Interest Rate Risk” above and the “Statement of Cash Flows” included in the financial statements for details regarding this change.
MANAGEMENT'S DISCUSSION AND ANALYSIS OF FINANCIAL CONDITION AND RESULTS OF OPERATIONS
CHANGES IN FINANCIAL CONDITION
Cash and cash equivalents: Cash and cash equivalents increased to $419,158,000 at September 30, 2019, as compared to $268,650,000 at September 30, 2018. The change was primarily due to normal liquidity management activities.
Available-for-sale investment securities: Available-for-sale securities increased $170,785,000, or 13.0%, during the year ended September 30, 2019, to $1,485,742,000, primarily due to purchases of $358,709,000 partially offset by principal repayments of $224,118,000 and a change in net unrealized gain (loss) of $39,195,000. Sales of available-for-sale securities totaled $491,000 during the year ended September 30, 2019. As of September 30, 2019, the Company had a net unrealized gain on available-for-sale securities of $27,671,000, which is recorded net of tax as part of shareholders' equity.
Held-to-maturity investment securities: Held-to-maturity securities decreased by $181,940,000, or 11.2%, during the year ended September 30, 2019, to $1,443,480,000 primarily due to principal repayments and maturities of $178,147,000. There were no held-to-maturity securities purchased or sold during the year ended September 30, 2019. Rising interest rates may cause these securities to be subject to unrealized losses. As of September 30, 2019, the net unrealized gain on held-to-maturity securities was $19,615,000, which management attributes to the change of interest rates since acquisition.
Loans receivable: Loans receivable, net of related contra accounts, increased $453,494,000, or 4.0%, to $11,930,575,000 at September 30, 2019, from $11,477,081,000 one year earlier. This increase resulted primarily from originations of $4,120,471,000 and loan repayments of $3,638,622,000 during the year ended September 30, 2019. Commercial loan originations accounted for 72.1% of total originations and consumer originations were 27.9% as the Company continues to focus on commercial lending, coupled with growing economies in all major markets in which we operate.
The following table presents the gross loan balances by category and the year-over-year change.
|
| | | | | | | | | | | | | | | | |
| September 30, 2019 | | September 30, 2018 | | Change |
| (In thousands) | | (In thousands) | | $ | % |
Gross loans by category | | | | | | | | |
Single-family residential | $ | 5,835,194 |
| 43.8 | % | | $ | 5,798,966 |
| 45.1 | % | | $ | 36,228 |
| 0.6% |
Construction | 2,038,052 |
| 15.3 |
| | 1,890,668 |
| 14.7 |
| | 147,384 |
| 7.8 |
Construction - custom | 540,741 |
| 4.1 |
| | 624,479 |
| 4.9 |
| | (83,738 | ) | (13.4) |
Land - acquisition & development | 204,107 |
| 1.5 |
| | 155,204 |
| 1.2 |
| | 48,903 |
| 31.5 |
Land - consumer lot loans | 99,694 |
| 0.7 |
| | 102,036 |
| 0.8 |
| | (2,342 | ) | (2.3) |
Multi-family | 1,422,674 |
| 10.7 |
| | 1,385,125 |
| 10.8 |
| | 37,549 |
| 2.7 |
Commercial real estate | 1,631,170 |
| 12.3 |
| | 1,452,168 |
| 11.3 |
| | 179,002 |
| 12.3 |
Commercial & industrial | 1,268,695 |
| 9.5 |
| | 1,140,874 |
| 8.9 |
| | 127,821 |
| 11.2 |
HELOC | 142,178 |
| 1.1 |
| | 130,852 |
| 1.0 |
| | 11,326 |
| 8.7 |
Consumer | 129,883 |
| 1.0 |
| | 173,306 |
| 1.3 |
| | (43,423 | ) | (25.1) |
Total gross loans | 13,312,388 |
| 100 | % | | 12,853,678 |
| 100 | % | | 458,710 |
| 3.6% |
Less: | | | | | | | | |
Allowance for probable losses | 131,534 |
| | | 129,257 |
| | | 2,277 |
| 1.8 |
Loans in process | 1,201,341 |
| | | 1,195,506 |
| | | 5,835 |
| 0.5 |
Net deferred fees, costs and discounts | 48,938 |
| | | 51,834 |
| | | (2,896 | ) | (5.6) |
Total loan contra accounts | 1,381,813 |
| | | 1,376,597 |
| | | 5,216 |
| 0.4 |
Net loans | $ | 11,930,575 |
| | | $ | 11,477,081 |
| | | $ | 453,494 |
| 4.0% |
MANAGEMENT'S DISCUSSION AND ANALYSIS OF FINANCIAL CONDITION AND RESULTS OF OPERATIONS
The following table shows the change in the geographic distribution by state of the gross loan portfolio.
|
| | | | | | |
September 30, | 2019 | 2018 | Change |
Washington | 42.7 | % | 43.6 | % | (0.9 | ) |
Oregon | 16.6 |
| 16.3 |
| 0.3 |
|
Arizona | 11.9 |
| 12.4 |
| (0.5 | ) |
Utah | 7.5 |
| 7.8 |
| (0.3 | ) |
Texas | 7.4 |
| 6.0 |
| 1.4 |
|
New Mexico | 5.3 |
| 5.1 |
| 0.2 |
|
Idaho | 4.8 |
| 4.5 |
| 0.3 |
|
Nevada | 2.1 |
| 2.1 |
| — |
|
Other (1) | 1.7 |
| 2.2 |
| (0.5 | ) |
| 100 | % | 100 | % | |
(1) Includes loans in other states and purchased loan pools.
Non-performing assets: NPAs decreased to $43,826,000 as of September 30, 2019, from $70,093,000 at September 30, 2018, a 37.5% decrease. The decrease was primarily a result of a $21,955,000 decrease in non-accrual loans and real estate owned declining by $4,517,000. Other property owned of $3,314,000 as of September 30, 2019 is comprised of $1,116,000 of equipment acquired through foreclosure on a commercial loan and a $2,198,000 government guarantee related to that same loan. Non-performing assets as a percentage of total assets was 0.27% at September 30, 2019, compared to 0.44% at September 30, 2018.
Restructured Loans: Total restructured loans declined to $121,677,000 as of September 30, 2019, from $156,858,000 as of September 30, 2018. As of September 30, 2019, $116,659,000 or 95.9% of the restructured loans were performing. Non-performing restructured loans of $5,018,000 are included in NPAs. Total non-performing assets and restructured loans as a percent of total assets has declined to 0.97% as of September 30, 2019, from 1.39% as of September 30, 2018.
Real estate owned: As of September 30, 2019, real estate owned totaled $6,781,000, a decrease of $4,517,000, or 40.0%, from $11,298,000 as of September 30, 2018, as the Company continued to liquidate foreclosed properties. During 2019, the Company sold real estate owned properties for total net proceeds of $8,659,000.
Interest Receivable: Interest receivable was $48,857,000 as of September 30, 2019, an increase of $1,562,000, or 3.3%, since September 30, 2018. The increase was primarily a result of the 4.0% rise in loans receivable partially offset by a slight decrease in interest rates.
Bank Owned Life Insurance: Bank-owned life insurance increased to $222,076,000 as of September 30, 2019 from $216,254,000 as of September 30, 2018, primarily as a result of increases in the cash surrender value of the policies. The investments in bank-owned life insurance serve to assist in funding the growth of employee benefit costs.
Intangible assets: The Company's intangible assets totaled $309,247,000 at September 30, 2019 compared to $311,286,000 as of September 30, 2018. The balance at September 30, 2019 is comprised of $301,368,000 of goodwill and the unamortized balance of the core deposit and other intangibles of $7,879,000.
Customer accounts: As of September 30, 2019, customer deposits totaled $11,990,764,000 compared with $11,387,146,000 at September 30, 2018, a $603,618,000, or 5.3%, increase. During 2019, the Company was able to increase transaction accounts by $501,458,000 or 7.6% and time deposits increased by $102,160,000 or 2.1%.
MANAGEMENT'S DISCUSSION AND ANALYSIS OF FINANCIAL CONDITION AND RESULTS OF OPERATIONS
|
| | | | | | | | | | | | | | | | | | | |
($ in thousands) | September 30, 2019 | | September 30, 2018 |
| Deposit Account Balance | | As a % of Total Deposits | | Weighted
Average Rate | | Deposit Account Balance | | As a % of Total Deposits | | Weighted
Average Rate |
Non-interest checking | $ | 1,621,343 |
| | 13.5 | % | | — | % | | $ | 1,401,226 |
| | 12.4 | % | | — | % |
Interest checking | 1,984,576 |
| | 16.6 |
| | 0.61 |
| | 1,778,520 |
| | 15.6 |
| | 0.50 |
|
Savings | 753,574 |
| | 6.3 |
| | 0.13 |
| | 836,501 |
| | 7.3 |
| | 0.11 |
|
Money market | 2,724,308 |
| | 22.7 |
| | 0.82 |
| | 2,566,096 |
| | 22.5 |
| | 0.65 |
|
Time deposits | 4,906,963 |
| | 40.9 |
| | 1.91 |
| | 4,804,803 |
| | 42.2 |
| | 1.50 |
|
Total | $ | 11,990,764 |
| | 100 | % | | 1.08 | % | | $ | 11,387,146 |
| | 100 | % | | 0.87 | % |
The following table shows the geographic distribution by state for customer deposits.
|
| | | | | | | | | | | | | |
(In thousands) (1) | September 30, 2019 | September 30, 2018 | $ Change |
Washington | $ | 5,502,418 |
| 45.9 | % | $ | 5,420,674 |
| 47.6 | % | $ | 81,744 |
|
Oregon | 2,337,401 |
| 19.5 |
| 2,176,713 |
| 19.1 |
| 160,688 |
|
Arizona | 1,352,365 |
| 11.3 |
| 1,262,122 |
| 11.1 |
| 90,243 |
|
New Mexico | 1,023,479 |
| 8.5 |
| 893,521 |
| 7.8 |
| 129,958 |
|
Idaho | 867,250 |
| 7.2 |
| 822,497 |
| 7.2 |
| 44,753 |
|
Nevada | 384,491 |
| 3.2 |
| 366,838 |
| 3.2 |
| 17,653 |
|
Utah | 345,208 |
| 2.9 |
| 307,778 |
| 2.7 |
| 37,430 |
|
Texas | 178,152 |
| 1.5 |
| 137,003 |
| 1.2 |
| 41,149 |
|
| $ | 11,990,764 |
| 100 | % | $ | 11,387,146 |
| 100 | % | $ | 603,618 |
|
(1) During 2019, commercial account deposits that were previously serviced in and assigned to Washington were reassigned to their respective geographical region. September 30, 2018 amounts have been reclassified to align with the new assignments.
FHLB advances: Total FHLB advances were $2,250,000,000 at September 30, 2019, as compared to $2,330,000,000 at September 30, 2018. The weighted average rate for FHLB borrowings was 2.49% as of September 30, 2019 and 2.66% at September 30, 2018. The decrease is primarily due to lower rates on new FHLB advances and maturing advances with higher rates. The Company has entered into interest rate swaps to hedge interest rate risk and convert certain FHLB advances to fixed rate payments. Taking into account these hedges, the weighted average effective maturity of FHLB advances at September 30, 2019 is 2.8 years.
Contractual obligations: The following table presents the Company's significant fixed and determinable contractual obligations, within the categories described below, by contractual maturity or payment amount.
|
| | | | | | | | | | | | | | | | |
September 30, 2019 | | Total | | Less than
1 Year | | 1 to 5
Years | | Over 5
Years |
| | (In thousands) |
Customer accounts (1) | | $ | 11,990,764 |
| | $ | 10,573,640 |
| | $ | 1,415,088 |
| | $ | 2,036 |
|
Debt obligations (2) | | 2,250,000 |
| | 950,000 |
| | 1,150,000 |
| | 150,000 |
|
Operating lease obligations | | 34,211 |
| | 5,838 |
| | 17,842 |
| | 10,531 |
|
| | $ | 14,274,975 |
| | $ | 11,529,478 |
| | $ | 2,582,930 |
| | $ | 162,567 |
|
(1) Includes non-maturing customer transaction accounts.
(2) Represents final maturities of debt obligations.
MANAGEMENT'S DISCUSSION AND ANALYSIS OF FINANCIAL CONDITION AND RESULTS OF OPERATIONS
These obligations, except for the operating leases, are included in the Consolidated Statements of Financial Condition. The payment amounts of the operating lease obligations represent those amounts contractually due.
MANAGEMENT'S DISCUSSION AND ANALYSIS OF FINANCIAL CONDITION AND RESULTS OF OPERATIONS
RESULTS OF OPERATIONS
For highlights of the quarter-by-quarter results for the years ended September 30, 2019, and 2018, see Note R, “Selected Quarterly Financial Data (Unaudited)”.
COMPARISON OF 2019 RESULTS WITH 2018
Net Income: Net income increased $6,406,000, or 3.1%, to $210,256,000 for the year ended September 30, 2019, as compared to $203,850,000 for the year ended September 30, 2018.
Net Interest Income: For the year ended September 30, 2019, net interest income was $481,060,000, an increase of $8,921,000 or 1.9% from the year ended September 30, 2018. The increase was primarily driven by a higher average balance on interest-earning assets partially offset by a decrease in net interest margin. For the year ended September 30, 2019, average earning assets increased 5.1% to $15,203,819,000, up from $14,459,452,000 for the year ended September 30, 2018. During 2019, the average balance of loans receivable increased $612,351,000 or 5.5%, while the combined average balances of mortgage backed securities, other investment securities and cash increased by $126,052,000 or 4.0%. The net interest margin decreased to 3.16% for the year ended September 30, 2019, from 3.27% for the year ended September 30, 2018. The yield on interest-earning assets increased 22 basis points to 4.42% and the cost of interest-bearing liabilities increased by 34 basis points to 1.34%. The higher yield on interest-earning assets is primarily the result of changes in mix as loans receivable comprised a greater proportion of interest-earning assets and commercial loans comprised a higher percentage of the loan portfolio. The higher cost on interest-bearing liabilities is due primarily to rising interest rates on customer deposits, partially offset by lower rates on new FHLB advances and maturing advances with higher rates.
The following table sets forth certain information explaining changes in interest income and interest expense for the period indicated compared to the same period one year ago. For each category of interest-earning asset and interest-bearing liability, information is provided on changes attributable to (1) changes in volume (changes in volume multiplied by old rate) and (2) changes in rate (changes in rate multiplied by old volume). The change in interest income and interest expense attributable to changes in both volume and rate has been allocated proportionately to the change due to volume and the change due to rate.
Rate / Volume Analysis:
|
| | | | | | | | | |
| Comparison of Year Ended September 30, 2019 and
September 30, 2018 |
($ in thousands) | Volume | Rate | Total |
Interest income: | | | |
Loans receivable | $ | 28,489 |
| $ | 23,800 |
| $ | 52,289 |
|
Mortgaged-backed securities | 298 |
| 3,780 |
| 4,078 |
|
Investments (1) | 3,878 |
| 4,138 |
| 8,016 |
|
| | | |
All interest-earning assets | 32,665 |
| 31,718 |
| 64,383 |
|
| | | |
Interest expense: | | | |
Customer accounts | 3,992 |
| 45,732 |
| 49,724 |
|
FHLB advances and other borrowings | 4,020 |
| 1,718 |
| 5,738 |
|
| | | |
All interest-bearing liabilities | 8,012 |
| 47,450 |
| 55,462 |
|
| | | |
Change in net interest income | $ | 24,653 |
| $ | (15,732 | ) | $ | 8,921 |
|
(1) Includes interest on cash equivalents and dividends on FHLB & FRB stock.
Provision (Release) for Loan Losses: The Company recorded a release of allowance for loan losses of $1,650,000 for the year ended September 30, 2019, as compared to a release of $5,450,000 for the year ended September 30, 2018. The releases recorded for both periods were a result of strong net recoveries and the overall quality of the loan portfolio as a result of a continued strong
MANAGEMENT'S DISCUSSION AND ANALYSIS OF FINANCIAL CONDITION AND RESULTS OF OPERATIONS
economy, offset by reserving for net growth in the loan portfolio. The Company had recoveries, net of charge-offs, of $3,577,000 for the year ended September 30, 2019, compared with $11,050,000 of net recoveries for the year ended September 30, 2018.
Unfunded commitments tend to vary depending on our loan mix and the proportional share of commercial loans. The reserve for unfunded commitments was $6,900,000 as of September 30, 2019, which is a decrease from $7,250,000 at September 30, 2018. Management believes the allowance for loan losses plus the reserve for unfunded commitments, totaling $138,434,000, or 1.04% of gross loans, is sufficient to absorb estimated losses inherent in the portfolio. See Note E for further discussion and analysis of the allowance for loan losses as of and for the year ended September 30, 2019.
Other Income: Other income was $62,318,000 for the year ended September 30, 2019, an increase of $18,240,000, or 41.4%, from $44,078,000 for the year ended September 30, 2018. The increase is primarily due to a net gain of $10,200,000 recognized in 2019 from sales of fixed assets and $8,550,000 of expense recognized in 2018 related to termination of all remaining FDIC loss-share agreements. Deposit fee income was $24,882,000 for the year ended September 30, 2019, compared to $25,904,000 for the year ended September 30, 2018.
Other Expense: Operating expense was $283,063,000 for the year ended September 30, 2019, an increase of $18,741,000, or 7.1%, from the $264,322,000 for the year ended September 30, 2018. The Company has continued to make strategic investments in people, process and technology with the objectives of enhancing compliance, growing market share and ultimate earnings. These investments have led to higher operating expenses. Compensation and benefits costs increased $10,034,000 year-over-year. Information technology costs increased by $4,312,000 and other expenses increased by $4,491,000 as both were elevated primarily due to Bank Secrecy Act ("BSA") program enhancements and other technology platform improvements. The Company’s efficiency ratio of 52.1% for 2019 is higher than the 50.4% for 2018, the increase being due to higher expenses noted above partially offset by higher revenue in 2019. The number of staff, including part-time employees on a full-time equivalent basis, was 1,971 and 1,877 at September 30, 2019 and 2018, respectively. Total operating expense for the years ended September 30, 2019, and 2018 equaled 1.73% and 1.69%, respectively, of average assets.
Gain (Loss) on Real Estate Owned: Net gain on real estate owned was $810,000 for the year ended September 30, 2019, compared to a net loss of $102,000 for the year ended September 30, 2018. This amount includes ongoing maintenance expense, periodic valuation adjustments, and gains (losses) on sales of REO.
Income Tax Expense: Income tax expense was $52,519,000 for the year ended September 30, 2019, a decrease of $874,000, or 1.64%, from the $53,393,000 for the year ended September 30, 2018. The effective tax rate for 2019 was 19.99% as compared to 20.76% for the year ended September 30, 2018. On December 22, 2017, a new tax law was enacted that provides for significant changes to the U.S. Internal Revenue Code of 1986 (as amended), such as a reduction in the federal corporate tax rate from 35% to 21% effective from January 1, 2018 forward and changes or limitations to certain tax deductions. The Company has a fiscal year end of September 30, resulting in a blended federal statutory tax rate of 24.53% for its fiscal year 2018 and a rate of 21.00% for 2019. The effective tax rate of 19.99% for 2019 is lower than the statutory rate mainly due to the effect of state taxes, bank-owned life insurance, investments in low income housing tax credit partnerships and tax-exempt loans to municipal entities and other qualified borrowers as well as the resolution of a previously unrecognized tax benefit.
MANAGEMENT'S DISCUSSION AND ANALYSIS OF FINANCIAL CONDITION AND RESULTS OF OPERATIONS
COMPARISON OF 2018 RESULTS WITH 2017
Net Income: Net income increased $30,318,000, or 17.5%, to $203,850,000 for the year ended September 30, 2018, as compared to $173,532,000 for the year ended September 30, 2017.
Net Interest Income: For the year ended September 30, 2018, net interest income was $472,139,000, an increase of $40,213,000 or 9.3% from the year ended September 30, 2017. The increase was primarily driven by a higher average balance on loans receivable. For the year ended September 30, 2018, average earning assets increased 4.8% to $14,459,452,000, up from $13,803,646,000 for the year ended September 30, 2017. During 2018, the average balance of loans receivable increased $799,783,000 or 7.7%, while the combined average balances of mortgage backed securities, other investment securities and cash decreased by $152,634,000 or 4.7%. The net interest margin increased to 3.27% for the year ended September 30, 2018, from 3.13% for the year ended September 30, 2017. The yield on earning assets increased 22 basis points to 4.20% and the cost of interest-bearing liabilities increased by 8 basis points to 1.00%. The higher yield on earning assets is primarily the result of rising short-term interest rates, which causes the yield on adjustable-rate loans and investments as well as cash to increase, but also due to changes in mix as loans receivable comprised a greater proportion of earning assets. The higher cost on interest-bearing liabilities is due primarily to rising interest rates on customer deposits, partially offset by a lower rate on FHLB borrowings due to the maturity of some higher cost long-term FHLB advances.
The following table sets forth certain information explaining changes in interest income and interest expense for the period indicated compared to the same period one year ago. For each category of interest-earning asset and interest-bearing liability, information is provided on changes attributable to (1) changes in volume (changes in volume multiplied by old rate) and (2) changes in rate (changes in rate multiplied by old volume). The change in interest income and interest expense attributable to changes in both volume and rate has been allocated proportionately to the change due to volume and the change due to rate.
Rate / Volume Analysis:
|
| | | | | | | | | |
| Comparison of Year Ended September 30, 2018 and
September 30, 2017 |
($ in thousands) | Volume | Rate | Total |
Interest income: | | | |
Loans receivable | $ | 36,820 |
| $ | 8,464 |
| $ | 45,284 |
|
Mortgaged-backed securities | (418 | ) | 10,213 |
| 9,795 |
|
Investments (1) | (2,970 | ) | 6,056 |
| 3,086 |
|
| | | |
All interest-earning assets | 33,432 |
| 24,733 |
| 58,165 |
|
| | | |
Interest expense: | | | |
Customer accounts | 2,371 |
| 18,098 |
| 20,469 |
|
FHLB advances and other borrowings | 6,160 |
| (8,677 | ) | (2,517 | ) |
| | | |
All interest-bearing liabilities | 8,531 |
| 9,421 |
| 17,952 |
|
| | | |
Change in net interest income | $ | 24,901 |
| $ | 15,312 |
| $ | 40,213 |
|
(1) Includes interest on cash equivalents and dividends on FHLB & FRB stock.
Provision (Release) for Loan Losses: The Company recorded a release of allowance for loan losses of $5,450,000 for the year ended September 30, 2018, as compared to a release of $2,100,000 for the year ended September 30, 2017. The releases recorded for both periods were a result of strong net recoveries and the overall quality of the loan portfolio as a result of a continued strong economy, offset by reserving for net growth in the loan portfolio. The Company had recoveries, net of charge-offs, of $11,050,000 for the year ended September 30, 2018, compared with $14,307,000 of net recoveries for the year ended September 30, 2017.
MANAGEMENT'S DISCUSSION AND ANALYSIS OF FINANCIAL CONDITION AND RESULTS OF OPERATIONS
Unfunded commitments tend to vary depending on our loan mix and the proportional share of commercial loans. The reserve for unfunded commitments was $7,250,000 as of September 30, 2018, which is a decrease from $7,750,000 at September 30, 2017. Management believes the allowance for loan losses plus the reserve for unfunded commitments, totaling $136,507,000, or 1.06% of gross loans, is sufficient to absorb estimated losses inherent in the portfolio. See Note E for further discussion and analysis of the allowance for loan losses as of and for the year ended September 30, 2018.
Other Income: Other income was $44,078,000 for the year ended September 30, 2018, a decrease of $8,137,000, or 15.6%, from $52,215,000 for the year ended September 30, 2017. The decrease is primarily due to an $8,550,000 charge recorded in 2018 for asset and liability valuation adjustments associated with FDIC loss-share agreements. The Bank initiated discussions with the FDIC in December 2017 regarding early termination of its remaining FDIC loss-share agreements, which related to the Horizon Bank and Home Valley Bank acquisitions. In May 2018, the Bank finalized the early termination agreement and paid $39,906,000 to settle the FDIC clawback liability. Under the termination agreement, all rights and obligations of the Bank and the FDIC have been resolved and completed. As such, future recoveries, gains, losses and expenses related to the previously covered assets will now be recognized entirely by the Bank and the FDIC will no longer share in such gains or losses. During 2017, the Company recorded a gain of $3,499,000 on the sale of available-for-sale investment securities while there were no such sales during 2018. Deposit fee income was $25,904,000 for the year ended September 30, 2018, compared to $22,643,000 for the year ended September 30, 2017 as 2018 included the impact of a full year of fee income related to the Company's "Green Checking" product.
Other Expense: Operating expense was $264,322,000 for the year ended September 30, 2018, an increase of $32,803,000, or 14.2%, from the $231,519,000 for the year ended September 30, 2017. The Company initiated several strategic investments in 2018 that resulted in higher operating expenses. Those investments included a 5% salary increase for all employees earning less than $100,000 annually; the establishment of a second technology team located in Boise, Idaho; the creation of an internal training team; and several new processes and systems. Compensation and benefits costs increased $11,297,000 year-over-year primarily due to the 5% salary increase noted above, headcount increases and cost-of-living adjustments. Information technology costs increased by $5,784,000 and other expenses increased by $11,947,000 as both were elevated primarily due to Bank Secrecy Act ("BSA") program enhancements and other technology platform improvements. The Company had approximately $4,100,000 of non-recurring BSA related costs in the 4th fiscal quarter of 2018 and estimates that it will incur an additional $6,000,000 of non-recurring costs for BSA program improvements spread over the next three quarters. Additionally, charitable contributions increased $551,000 from the prior year as the Company fulfilled the first year of its previously announced commitment to fund its foundation by $1,000,000 annually for the next five years. Product delivery costs increased by $2,400,000 primarily due to enhanced features provided with the "Green Checking" product. The Company’s efficiency ratio of 50.4% for 2018 is higher than the 47.8% for 2017. The increase in the efficiency ratio is due to higher expenses noted above partially offset by higher revenue in 2018. The number of staff, including part-time employees on a full-time equivalent basis, was 1,877 and 1,818 at September 30, 2018 and 2017, respectively. Total operating expense for the years ended September 30, 2018, and 2017 equaled 1.69% and 1.55%, respectively, of average assets.
Gain (Loss) on Real Estate Owned: Net loss on real estate owned was $102,000 for the year ended September 30, 2018, compared to a net gain of $1,494,000 for the year ended September 30, 2017. This amount includes ongoing maintenance expense, periodic valuation adjustments, and gains (losses) on sales of REO.
Income Tax Expense: Income tax expense was $53,393,000 for the year ended September 30, 2018, a decrease of $29,291,000, or 35.43%, from the $82,684,000 for the year ended September 30, 2017. The effective tax rate for 2018 was 20.76% as compared to 32.27% for the year ended September 30, 2017. On December 22, 2017, a new tax law was enacted that provides for significant changes to the U.S. Internal Revenue Code of 1986 (as amended), such as a reduction in the federal corporate tax rate from 35% to 21% effective from January 1, 2018 forward and changes or limitations to certain tax deductions. The Company has a fiscal year end of September 30, resulting in a blended federal statutory tax rate of 24.53% for its fiscal year 2018. Tax expense for fiscal year 2018 includes a number of discrete items, the largest of which is a discrete tax benefit of $5.4 million related to the revaluation of deferred tax assets and liabilities to reflect the change in statutory tax rate. The effective tax rate of 20.76% for 2018 is lower than the statutory rate due to the effect of bank-owned life insurance, investments in low income housing tax credit partnerships and tax-exempt loans to municipal entities and other qualified borrowers.
SELECTED FINANCIAL DATA
|
| | | | | | | | | | | | | | | |
Year ended September 30, | 2019 | 2018 | 2017 | 2016 | 2015 |
| | (In thousands, except per share data) |
Interest income | $ | 671,466 |
| $ | 607,083 |
| $ | 548,918 |
| $ | 536,793 |
| $ | 530,553 |
|
Interest expense | 190,406 |
| 134,944 |
| 116,992 |
| 116,544 |
| 117,072 |
|
Net interest income | 481,060 |
| 472,139 |
| 431,926 |
| 420,249 |
| 413,481 |
|
Provision (reversal) for loan losses | (1,650 | ) | (5,450 | ) | (2,100 | ) | (6,250 | ) | (11,162 | ) |
Other income | 63,128 |
| 43,976 |
| 53,709 |
| 57,082 |
| 49,727 |
|
Other expense | 283,063 |
| 264,322 |
| 231,519 |
| 235,447 |
| 224,851 |
|
Income before income taxes | 262,775 |
| 257,243 |
| 256,216 |
| 248,134 |
| 249,519 |
|
Income taxes | 52,519 |
| 53,393 |
| 82,684 |
| 84,085 |
| 89,203 |
|
Net income | $ | 210,256 |
| $ | 203,850 |
| $ | 173,532 |
| $ | 164,049 |
| $ | 160,316 |
|
Per share data | | | | | |
Basic earnings | $ | 2.61 |
| $ | 2.40 |
| $ | 1.95 |
| $ | 1.79 |
| $ | 1.68 |
|
Diluted earnings | 2.61 |
| 2.40 |
| 1.94 |
| 1.78 |
| 1.67 |
|
Cash dividends | 0.79 |
| 0.67 |
| 0.84 |
| 0.55 |
| 0.54 |
|
| | | | | |
September 30, | 2019 | 2018 | 2017 | 2016 | 2015 |
Total assets | $ | 16,474,910 |
| $ | 15,865,724 |
| $ | 15,253,580 |
| $ | 14,888,063 |
| $ | 14,568,324 |
|
Loans receivable, net | 11,930,575 |
| 11,477,081 |
| 10,882,622 |
| 9,910,920 |
| 9,170,634 |
|
Mortgage-backed securities | 2,426,039 |
| 2,524,923 |
| 2,489,544 |
| 2,490,510 |
| 2,906,440 |
|
Investment securities | 503,183 |
| 415,454 |
| 423,521 |
| 849,983 |
| 1,117,339 |
|
Cash and cash equivalents | 419,158 |
| 268,650 |
| 313,070 |
| 450,368 |
| 284,049 |
|
Customer accounts | 11,990,764 |
| 11,387,146 |
| 10,835,008 |
| 10,600,852 |
| 10,631,703 |
|
FHLB advances | 2,250,000 |
| 2,330,000 |
| 2,225,000 |
| 2,080,000 |
| 1,830,000 |
|
Shareholders’ equity | 2,032,995 |
| 1,996,908 |
| 2,005,688 |
| 1,975,731 |
| 1,955,679 |
|
Number of | | | | | |
Customer accounts | 450,375 |
| 449,339 |
| 449,793 |
| 491,098 |
| 517,871 |
|
Loans | 37,551 |
| 37,992 |
| 39,688 |
| 41,418 |
| 41,036 |
|
Offices | 238 |
| 235 |
| 237 |
| 238 |
| 247 |
|
WASHINGTON FEDERAL, INC. AND SUBSIDIARIES
CONSOLIDATED STATEMENTS OF FINANCIAL CONDITION
|
| | | | | | | |
| September 30, 2019 | | September 30, 2018 |
| (In thousands, except share data) |
ASSETS | | | |
Cash and cash equivalents | $ | 419,158 |
| | $ | 268,650 |
|
Available-for-sale securities, at fair value | 1,485,742 |
| | 1,314,957 |
|
Held-to-maturity securities, at amortized cost | 1,443,480 |
| | 1,625,420 |
|
Loans receivable, net of allowance for loan losses of $131,534 and $129,257 | 11,930,575 |
| | 11,477,081 |
|
Interest receivable | 48,857 |
| | 47,295 |
|
Premises and equipment, net | 274,015 |
| | 267,995 |
|
Real estate owned | 6,781 |
| | 11,298 |
|
FHLB & FRB stock | 123,990 |
| | 127,190 |
|
Bank owned life insurance | 222,076 |
| | 216,254 |
|
Intangible assets, including goodwill of $301,368 and $301,368 | 309,247 |
| | 311,286 |
|
Federal and state income tax assets, net | — |
| | 1,804 |
|
Other assets | 210,989 |
| | 196,494 |
|
| $ | 16,474,910 |
| | $ | 15,865,724 |
|
LIABILITIES AND SHAREHOLDERS’ EQUITY | | | |
Liabilities | | | |
Customer accounts | | | |
Transaction deposit accounts | $ | 7,083,801 |
| | $ | 6,582,343 |
|
Time deposit accounts | 4,906,963 |
| | 4,804,803 |
|
| 11,990,764 |
| | 11,387,146 |
|
FHLB advances | 2,250,000 |
| | 2,330,000 |
|
Advance payments by borrowers for taxes and insurance | 57,830 |
| | 57,417 |
|
Federal and state income tax liabilities, net | 5,104 |
| | — |
|
Accrued expenses and other liabilities | 138,217 |
| | 94,253 |
|
| 14,441,915 |
| | 13,868,816 |
|
Shareholders’ equity | | | |
Common stock, $1.00 par value, 300,000,000 shares authorized; 135,539,806 and 135,343,417 shares issued; 78,841,463 and 82,710,911 shares outstanding | 135,540 |
| | 135,343 |
|
Paid-in capital | 1,672,417 |
| | 1,666,609 |
|
Accumulated other comprehensive income (loss), net of taxes | 15,292 |
| | 8,294 |
|
Treasury stock, at cost; 56,698,343 and 52,632,506 shares | (1,126,163 | ) | | (1,002,309 | ) |
Retained earnings | 1,335,909 |
| | 1,188,971 |
|
| 2,032,995 |
| | 1,996,908 |
|
| $ | 16,474,910 |
| | $ | 15,865,724 |
|
SEE NOTES TO CONSOLIDATED FINANCIAL STATEMENTS
23
WASHINGTON FEDERAL, INC. AND SUBSIDIARIES
CONSOLIDATED STATEMENTS OF OPERATIONS
|
| | | | | | | | | |
Year ended September 30, | 2019 | 2018 | 2017 |
| (In thousands, except share data) |
INTEREST INCOME | | | |
Loans receivable | $ | 568,096 |
| $ | 515,807 |
| $ | 470,523 |
|
Mortgage-backed securities | 74,485 |
| 70,407 |
| 60,612 |
|
Investment securities and cash equivalents | 28,885 |
| 20,869 |
| 17,783 |
|
| 671,466 |
| 607,083 |
| 548,918 |
|
INTEREST EXPENSE | | | |
Customer accounts | 122,216 |
| 72,492 |
| 52,023 |
|
FHLB advances | 68,190 |
| 62,452 |
| 64,969 |
|
| 190,406 |
| 134,944 |
| 116,992 |
|
Net interest income | 481,060 |
| 472,139 |
| 431,926 |
|
Provision (release) for loan losses | (1,650 | ) | (5,450 | ) | (2,100 | ) |
Net interest income after provision (release) | 482,710 |
| 477,589 |
| 434,026 |
|
| | | |
OTHER INCOME | | | |
Gain (loss) on sale of investment securities | (9 | ) | — |
| 3,499 |
|
FDIC loss share termination valuation adjustments | — |
| (8,550 | ) | — |
|
Loan fee income | 3,941 |
| 3,804 |
| 4,290 |
|
Deposit fee income | 24,882 |
| 25,904 |
| 22,643 |
|
Other income | 33,504 |
| 22,920 |
| 21,783 |
|
| 62,318 |
| 44,078 |
| 52,215 |
|
OTHER EXPENSE | | | |
Compensation and benefits | 133,588 |
| 123,554 |
| 112,257 |
|
Occupancy | 38,579 |
| 36,453 |
| 35,260 |
|
FDIC insurance premiums | 9,808 |
| 11,592 |
| 11,410 |
|
Product delivery | 15,934 |
| 16,372 |
| 13,972 |
|
Information technology | 38,955 |
| 34,643 |
| 28,859 |
|
Other expense | 46,199 |
| 41,708 |
| 29,761 |
|
| 283,063 |
| 264,322 |
| 231,519 |
|
Gain (loss) on real estate owned, net | 810 |
| (102 | ) | 1,494 |
|
Income before income taxes | 262,775 |
| 257,243 |
| 256,216 |
|
Income tax expense (benefit) | | | |
Current | 50,933 |
| 44,557 |
| 92,795 |
|
Deferred | 1,586 |
| 8,836 |
| (10,111 | ) |
| 52,519 |
| 53,393 |
| 82,684 |
|
NET INCOME | $ | 210,256 |
| $ | 203,850 |
| $ | 173,532 |
|
| | | |
PER SHARE DATA | | | |
Basic earnings per share | $ | 2.61 |
| $ | 2.40 |
| $ | 1.95 |
|
Diluted earnings per share | 2.61 |
| 2.40 |
| 1.94 |
|
Dividends paid on common stock per share | 0.79 |
| 0.67 |
| 0.84 |
|
Basic weighted average number of shares outstanding | 80,471,316 |
| 85,008,040 |
| 88,905,457 |
|
Diluted weighted average number of shares outstanding | 80,495,163 |
| 85,109,843 |
| 89,224,207 |
|
SEE NOTES TO CONSOLIDATED FINANCIAL STATEMENTS
24
WASHINGTON FEDERAL, INC. AND SUBSIDIARIES
CONSOLIDATED STATEMENTS OF COMPREHENSIVE INCOME
|
| | | | | | | | | | | |
Year ended September 30, | 2019 | | 2018 | | 2017 |
| (In thousands) |
Net income | $ | 210,256 |
| | $ | 203,850 |
| | $ | 173,532 |
|
Other comprehensive income (loss) net of tax: | | | | | |
Net unrealized gains (losses) on available-for-sale securities | 39,195 |
| | (21,136 | ) | | (7,587 | ) |
Reclassification adjustment of net gain (loss) from sale
of available-for-sale securities included in net income | (9 | ) | | — |
| | 3,499 |
|
Related tax benefit (expense) | (8,915 | ) | | 6,156 |
| | 1,503 |
|
| 30,271 |
| | (14,980 | ) | | (2,585 | ) |
| | | | | |
Net unrealized gain (loss) on long-term borrowing hedges | (30,127 | ) | | 23,943 |
| | 29,653 |
|
Related tax benefit (expense) | 6,854 |
| | (5,684 | ) | | (10,897 | ) |
| (23,273 | ) | | 18,259 |
| | 18,756 |
|
| | | | | |
Other comprehensive income (loss) | 6,998 |
| | 3,279 |
| | 16,171 |
|
Comprehensive income | $ | 217,254 |
| | $ | 207,129 |
| | $ | 189,703 |
|
SEE NOTES TO CONSOLIDATED FINANCIAL STATEMENTS
25
WASHINGTON FEDERAL, INC. AND SUBSIDIARIES
CONSOLIDATED STATEMENTS OF SHAREHOLDERS' EQUITY
|
| | | | | | | | | | | | | | | | | | |
(In thousands) | Common
Stock | Paid-in
Capital | Retained
Earnings | Accumulated
Other
Comprehensive
Income (Loss) | Treasury
Stock | Total |
| | | | | | |
Balance at September 30, 2016 | $ | 134,308 |
| $ | 1,648,388 |
| $ | 943,877 |
| $ | (11,156 | ) | $ | (739,686 | ) | $ | 1,975,731 |
|
| | | | | | |
Net income | | | 173,532 |
| | | 173,532 |
|
Other comprehensive income (loss) | | | | 16,171 |
| | 16,171 |
|
Dividends on common stock | | | (74,519 | ) | | | (74,519 | ) |
Proceeds from stock-based awards | 317 |
| 6,921 |
| | | | 7,238 |
|
Stock-based compensation expense | 105 |
| 5,804 |
| | | | 5,909 |
|
Repurchase of stock warrants | 228 |
| (228 | ) | | | | — |
|
Treasury stock purchased | | | | | (98,374 | ) | (98,374 | ) |
Balance at September 30, 2017 | 134,958 |
| 1,660,885 |
| 1,042,890 |
| 5,015 |
| (838,060 | ) | 2,005,688 |
|
| | | | | | |
Adjustment pursuant to adoption of ASU 2018-02 | | | (1,772 | ) | 1,772 |
| | — |
|
Net income | | | 203,850 |
| | | 203,850 |
|
Other comprehensive income (loss) | | | | 1,507 |
| | 1,507 |
|
Dividends on common stock | | | (55,997 | ) | | | (55,997 | ) |
Proceeds from stock-based awards | 63 |
| 1,275 |
| | | | 1,338 |
|
Stock-based compensation expense | 209 |
| 4,562 |
| | | | 4,771 |
|
Repurchase of stock warrants | 113 |
| (113 | ) | | | | — |
|
Treasury stock purchased | | | | | (164,249 | ) | (164,249 | ) |
Balance at September 30, 2018 | 135,343 |
| 1,666,609 |
| 1,188,971 |
| 8,294 |
| (1,002,309 | ) | 1,996,908 |
|
| | | | | | |
Net income | | | 210,256 |
| | | 210,256 |
|
Other comprehensive income (loss) | | | | 6,998 |
| | 6,998 |
|
Dividends on common stock | | | (63,318 | ) | | | (63,318 | ) |
Proceeds from stock-based awards | 39 |
| 701 |
| | | | 740 |
|
Stock-based compensation expense | 119 |
| 5,146 |
| | | | 5,265 |
|
Repurchase of stock warrants | 39 |
| (39 | ) | | | | — |
|
Treasury stock purchased | | | | | (123,854 | ) | (123,854 | ) |
Balance at September 30, 2019 | $ | 135,540 |
| $ | 1,672,417 |
| $ | 1,335,909 |
| $ | 15,292 |
| $ | (1,126,163 | ) | $ | 2,032,995 |
|
SEE NOTES TO CONSOLIDATED FINANCIAL STATEMENTS
26
WASHINGTON FEDERAL, INC. AND SUBSIDIARIES
CONSOLIDATED STATEMENTS OF CASH FLOWS
|
| | | | | | | | | | | |
Year ended September 30, | 2019 | | 2018 | | 2017 |
| (In thousands) |
CASH FLOWS FROM OPERATING ACTIVITIES | | | |
Net income | $ | 210,256 |
| | $ | 203,850 |
| | $ | 173,532 |
|
Adjustments to reconcile net income to net cash provided by operating activities: | | | | | |
Depreciation, amortization and accretion expense | 31,058 |
| | 46,735 |
| | 41,680 |
|
Cash received from (paid to) FDIC under loss share | — |
| | 1,595 |
| | 584 |
|
Stock compensation expense | 5,265 |
| | 4,771 |
| | 5,909 |
|
Provision (release) for loan losses | (1,650 | ) | | (5,450 | ) | | (2,100 | ) |
Loss (gain) on sale of investment securities | 9 |
| | — |
| | (3,499 | ) |
Decrease (increase) in accrued interest receivable | (1,562 | ) | | (5,652 | ) | | (3,974 | ) |
Decrease (increase) in federal and state income tax assets | 1,804 |
| | (1,804 | ) | | 16,047 |
|
Decrease (increase) in cash surrender value of bank owned life insurance | (5,822 | ) | | (5,992 | ) | | (6,498 | ) |
Gain on bank owned life insurance | — |
| | (2,416 | ) | | (6,805 | ) |
Net realized (gain) loss on sales of premises and equipment and real estate owned | (12,484 | ) | | (1,450 | ) | | (1,673 | ) |
Decrease (increase) in other assets | (17,416 | ) | | (6,876 | ) | | 7,974 |
|
Increase (decrease) in income tax liabilities | 3,043 |
| | — |
| | — |
|
Increase (decrease) in accrued expenses and other liabilities | 21,553 |
| | (36,609 | ) | | (41,477 | ) |
Net cash provided (used) by operating activities | 234,054 |
| | 190,702 |
| | 179,700 |
|
| | | | | |
CASH FLOWS FROM INVESTING ACTIVITIES | | | | | |
Origination of loans and principal repayments, net | (452,334 | ) | | (459,183 | ) | | (896,450 | ) |
Loans purchased | — |
| | (143,605 | ) | | (72,856 | ) |
FHLB & FRB stock purchase | (532,600 | ) | | (530,000 | ) | | (183,609 | ) |
FHLB & FRB stock redeemed | 535,800 |
| | 525,800 |
| | 177,824 |
|
Available-for-sale securities purchased | (358,709 | ) | | (272,780 | ) | | (76,367 | ) |
Principal payments and maturities of available-for-sale securities | 224,118 |
| | 199,008 |
| | 367,713 |
|
Proceeds from sales of available-for-sale investment securities | 491 |
| | — |
| | 362,829 |
|
Held-to-maturity securities purchased | — |
| | (170,836 | ) | | (466,058 | ) |
Principal payments and maturities of held-to-maturity securities | 178,147 |
| | 187,812 |
| | 229,716 |
|
Proceeds from sales of real estate owned | 8,659 |
| | 15,192 |
| | 16,248 |
|
Proceeds from settlements of bank owned life insurance | — |
| | 3,484 |
| | 10,096 |
|
Purchase of strategic investments | (5,000 | ) | | — |
| | — |
|
Net cash received (paid) in business combinations | — |
| | (2,211 | ) | | (3,370 | ) |
Proceeds from sales of premises and equipment | 15,585 |
| | 1 |
| | 5,209 |
|
Premises and equipment purchased and REO improvements | (35,530 | ) | | (27,127 | ) | | (15,461 | ) |
Net cash provided (used) by investing activities | (421,373 | ) | | (674,445 | ) | | (544,536 | ) |
| | | | | |
CASH FLOWS FROM FINANCING ACTIVITIES | | | | | |
Net increase (decrease) in customer accounts | 603,846 |
| | 552,445 |
| | 234,460 |
|
Proceeds from borrowings | 13,315,000 |
| | 13,250,000 |
| | 4,590,000 |
|
Repayments of borrowings | (13,395,000 | ) | | (13,145,000 | ) | | (4,445,000 | ) |
Proceeds from stock-based awards and related tax benefit | 740 |
| | 1,338 |
| | 7,238 |
|
Dividends paid on common stock | (63,318 | ) | | (55,997 | ) | | (74,519 | ) |
Treasury stock purchased | (123,854 | ) | | (164,249 | ) | | (98,374 | ) |
Increase (decrease) in advance payments by borrowers for taxes and insurance | 413 |
| | 786 |
| | 13,733 |
|
Net cash provided (used) by financing activities | 337,827 |
| | 439,323 |
| | 227,538 |
|
Increase (decrease) in cash and cash equivalents | 150,508 |
| | (44,420 | ) | | (137,298 | ) |
Cash and cash equivalents at beginning of year | 268,650 |
| | 313,070 |
| | 450,368 |
|
Cash and cash equivalents at end of year | $ | 419,158 |
| | $ | 268,650 |
| | $ | 313,070 |
|
SEE NOTES TO CONSOLIDATED FINANCIAL STATEMENTS
27
WASHINGTON FEDERAL, INC. AND SUBSIDIARIES
CONSOLIDATED STATEMENTS OF CASH FLOWS
|
| | | | | | | | | | | |
Year ended September 30, | 2019 | | 2018 | | 2017 |
| (In thousands) |
SUPPLEMENTAL DISCLOSURES OF CASH FLOW INFORMATION | | | | | |
Non-cash investing activities | | | | | |
Real estate acquired through foreclosure | $ | 1,839 |
| | $ | 4,032 |
| | $ | 3,266 |
|
Other personal property acquired through foreclosure | 205 |
| | 3,109 |
| | — |
|
Non-cash financing activities | | | | | |
Stock issued upon exercise of warrants | 1,082 |
| | 3,914 |
| | 7,632 |
|
Cash paid during the year for | | | | | |
Interest | 194,277 |
| | 133,722 |
| | 111,333 |
|
Income taxes | 33,545 |
| | 44,260 |
| | 54,078 |
|
SEE NOTES TO CONSOLIDATED FINANCIAL STATEMENTS
28
WASHINGTON FEDERAL, INC. AND SUBSIDIARIES
NOTES TO THE CONSOLIDATED FINANCIAL STATEMENTS
YEARS ENDED SEPTEMBER 30, 2019, 2018 AND 2017
NOTE A - SUMMARY OF SIGNIFICANT ACCOUNTING POLICIES
Company and nature of operations. Washington Federal Bank, National Association, a federally-insured national bank dba WaFd Bank (the “Bank” or “WaFd Bank”), was founded on April 24, 1917 in Ballard, Washington and is engaged primarily in providing lending, depository, insurance and other banking services to consumers, mid-sized to large businesses, and owners and developers of commercial real estate. Washington Federal, Inc., a Washington corporation (the “Company”), was formed as the Bank’s holding company in November, 1994. As used throughout this document, the terms “Washington Federal” or the “Company” refer to the Company and its consolidated subsidiaries, and the term “Bank” refers to the operating subsidiary, Washington Federal Bank, National Association. The Company is headquartered in Seattle, Washington. The Bank conducts its activities through a network of 234 bank branches located in Washington, Oregon, Idaho, Utah, Arizona, Nevada, New Mexico and Texas.
Basis of presentation and use of estimates. The Company’s accounting and financial reporting policies conform to accounting principles generally accepted in the United States of America (U.S. GAAP). Inter-company balances and transactions have been eliminated in consolidation. In preparing the consolidated financial statements, the Company makes estimates and assumptions that affect the reported amounts of assets and liabilities as of the date of the financial statements and revenues and expenses during the reporting periods and related disclosures. The areas that require application of significant management judgments often result in the need to make estimates about the effect of matters that are inherently uncertain and may change in future periods. Actual results could differ materially from those estimates. Certain amounts in the financial statements from prior periods have been reclassified to conform to the current financial statement presentation. In certain instances, amounts in text are presented by rounding to the nearest thousand.
The Company's fiscal year end is September 30. All references to 2019, 2018 and 2017 represent balances as of September 30, 2019, September 30, 2018, and September 30, 2017, or activity for the fiscal years then ended.
Cash and cash equivalents. Cash and cash equivalents include cash on hand, amounts due from banks, overnight investments and repurchase agreements with an initial maturity of three months or less.
Restricted cash balances - Based on the level of vault cash on hand, the Company was not required to maintain cash reserve balances with the Federal Reserve Bank as of September 30, 2019. As of September 30, 2019 and September 30, 2018, the Company pledged cash collateral related to derivative contracts of $31,850,000 and $18,000,000, respectively.
Equity securities - The Company records equity securities within Other assets in its Consolidated Statements of Financial Condition. Investments in equity securities with readily determinable fair values (marketable) are measured at fair value, with changes in the fair value recognized as a component of Other income in the Consolidated Statements of Operations. Investments in equity investments that do not have readily determinable fair values (non-marketable) are accounted for at cost minus impairment, if any, plus or minus changes resulting from observable price changes in orderly transactions for the identical or similar investment of the same issuer, also referred to as the measurement alternative. Any adjustments to the carrying value of these investments are recorded in Other income in the Consolidated Statements of Operations.
Debt securities, including mortgage-backed securities. The Company accounts for debt securities in two categories: held-to-maturity and available-for-sale. Premiums and discounts on debt securities are deferred and recognized into income over the contractual life of the asset using the effective interest method.
Held-to-maturity securities are accounted for at amortized cost, but the Company must have both the positive intent and the ability to hold those securities to maturity. There are very limited circumstances under which securities in the held-to-maturity category can be sold without jeopardizing the cost basis of accounting for the remainder of the securities in this category.
Available-for-sale securities are accounted for at fair value. Gains and losses realized on the sale of these securities are accounted for based on the specific identification method. Unrealized gains and losses for available-for-sale securities are excluded from earnings and reported net of the related tax effect in the accumulated other comprehensive income component of shareholders' equity.
Realized gains and losses on securities sold as well as other-than-temporary impairment charges, if any, are shown on the Consolidated Statements of Operations under the Other income heading. Management evaluates debt securities for other-than-
WASHINGTON FEDERAL, INC. AND SUBSIDIARIES
NOTES TO THE CONSOLIDATED FINANCIAL STATEMENTS
YEARS ENDED SEPTEMBER 30, 2019, 2018 AND 2017
temporary impairment on a quarterly basis based on the securities' current credit quality, market interest rates, term to maturity and management's intent to sell the securities.
Off-balance-sheet credit exposures - The only material off-balance-sheet credit exposures are loans in process and unused lines of credit, which had a combined balance of $2,379,089,000 and $2,180,162,000 at September 30, 2019 and September 30, 2018, respectively. The Company estimates losses on off-balance-sheet credit exposures by allocating a loss percentage derived from historical loss factors for each asset class.
Loans receivable. Loans that are performing in accordance with their contractual terms are carried at the unpaid principal balance, net of premiums, discounts and net deferred loan fees. Net deferred loan fees include nonrefundable loan origination fees less direct loan origination costs. Net deferred loan fees, premiums and discounts are amortized into interest income using either the interest method or straight-line method over the terms of the loans, adjusted for actual prepayments. In addition to fees and costs for originating loans, various other fees and charges related to existing loans may occur, including prepayment charges, late charges and assumption fees.
When a borrower fails to make a required payment on a loan, the Bank attempts to cure the deficiency by contacting the borrower. Contact is made after a payment is 30 days past its grace period. In most cases, deficiencies are cured promptly. If the delinquency is not cured within 90 days, the Bank may institute appropriate action to foreclose on the property. If foreclosed, the property is sold at a public sale and may be purchased by the Bank.
Restructured loans. The Bank will consider modifying the interest rates and terms of a loan if it determines that a modification is a better alternative to foreclosure. Most troubled debt restructured ("TDR") loans are accruing and performing loans where the borrower has proactively approached the Bank about modifications due to temporary financial difficulties. Each request is individually evaluated for merit and likelihood of success. The concession for these loans is typically a payment reduction through a rate reduction of 100 to 200 bps for a specific term, usually six to 12 months. Interest-only payments may also be approved during the modification period. Principal forgiveness is generally not an available option for restructured loans. Before granting approval to modify a loan in a TDR, the borrower’s ability to repay is evaluated, including: current income levels and debt to income ratio, borrower’s credit score, payment history of the loan and updated evaluation of the secondary repayment source. The Bank also modifies some loans that are not classified as TDRs as the modification is due to a restructuring where the effective interest rate on the debt is reduced to reflect a decrease in market interest rates.
Non-accrual loans. Loans are placed on nonaccrual status when, in the judgment of management, the probability of collection of interest is deemed to be insufficient to warrant further accrual. When a loan is placed on nonaccrual status, previously accrued but unpaid interest is deducted from interest income. The Bank does not accrue interest on loans 90 days or more past due. If payment is made on a loan so that the loan becomes less than 90 days past due, and the Bank expects full collection of principal and interest, the loan is returned to full accrual status. Any interest ultimately collected is credited to income in the period of recovery. A loan is charged-off when the loss is estimable and it is confirmed that the borrower is not expected to be able to meet contractual obligations.
If a consumer loan is on non-accrual status before becoming a TDR it will stay on non-accrual status following restructuring until it has been performing for at least six months, at which point it may be moved to accrual status. If a loan is on accrual status before it becomes a TDR, and management concludes that full repayment is probable based on internal evaluation, it will remain on accrual status following restructuring. If the restructured consumer loan does not perform, it is placed on non-accrual status when it is 90 days delinquent. For commercial loans, six consecutive payments on newly restructured loan terms are required prior to returning the loan to accrual status. In some instances, after the required six consecutive payments are made, management will conclude that collection of the entire principal and interest due is still in doubt. In those instances, the loan will remain on non-accrual status.
Impaired loans. Impaired loans consist of loans receivable that are not expected to have their principal and interest repaid in accordance with their contractual terms. Collateral-dependent impaired loans are measured using the fair value of the collateral less selling costs. Non-collateral dependent loans are measured at the present value of expected future cash flows.
Allowance for loan losses. The Bank maintains an allowance for loan losses to absorb losses inherent in the loan portfolio. The allowance is based on ongoing, quarterly assessments of the probable and estimable losses inherent in the loan portfolio. The Bank's general methodology for assessing the appropriateness of the allowance is to apply a loss percentage factor to the different
WASHINGTON FEDERAL, INC. AND SUBSIDIARIES
NOTES TO THE CONSOLIDATED FINANCIAL STATEMENTS
YEARS ENDED SEPTEMBER 30, 2019, 2018 AND 2017
loan types. The loss percentage factor is made up of two parts - the historical loss factor (“HLF”) and the qualitative loss factor (“QLF”). The HLF takes into account historical charge-offs by loan type. The Bank uses an average of historical loss rates for each loan category multiplied by a loss emergence period. This is the likely period of time during which a residential or commercial loan borrower experiencing financial difficulties might deplete their cash prior to becoming delinquent on their loan, plus the period of time that it takes the Bank to work out the loans. The QLFs are based on management's continuing evaluation of the pertinent factors underlying the quality of the loan portfolio, including changes in the size and composition of the loan portfolio, actual loan loss experience, current economic conditions, collateral values, geographic concentrations, seasoning of the loan portfolio, specific industry conditions and the duration of the current business cycle. These factors are considered by loan type.
Specific allowances are established for loans which are individually evaluated, in cases where management has identified significant conditions or circumstances related to a loan that management believes indicate the probability that a loss has been incurred. The Bank has also established a reserve for unfunded commitments.
The recovery of the carrying value of loans is susceptible to future market conditions beyond the Bank's control, which may result in losses or recoveries differing from those estimated.
Client derivatives. Interest rate swap agreements are provided to certain clients who desire to convert their obligations from variable to fixed interest rates. Under these agreements, the Bank enters into a variable-rate loan agreement with a customer in addition to a swap agreement, and then enters into a corresponding swap agreement with a third party in order to offset its exposure on the customer swap agreement. As the interest rate swap agreements with the customers and third parties are not designated as accounting hedges under FASB ASC 815, the instruments are marked to market in earnings. The change in fair value of the offsetting swaps are included in interest income and interest expense and there is no impact on net income. There is fee income earned on the swaps that is included in loan fee income.
Borrowing hedges. The Company has entered into interest rate swaps to convert a series of future short-term borrowings to fixed-rate payments. These interest rate swaps qualify as cash flow hedging instruments under ASC 815 so gains and losses are recorded in Other Comprehensive Income to the extent the hedge is effective. Gains and losses on the interest rate swaps are reclassified from OCI to earnings in the period the hedged transaction affects earnings and are included in the same income statement line item that the hedged transaction is recorded.
Last-of-layer loan portfolio hedges. The Company has entered into interest rate swaps to hedge the portion of the respective closed portfolios of prepayable mortgage loans that are expected to remain at the end of the hedge term. These hedges qualify as last-of-layer hedges under ASC 815 and provide for matching of the recognition of the gains and losses on the interest rate swap and the related hedged item.
Commercial loan hedges. The Company has entered into interest rate swaps to hedge long term fixed rate commercial loans. These hedges qualify as fair value hedges under ASC 815 and provide for matching of the recognition of the gains and losses on the interest rate swap and the related hedged loan.
Premises and equipment. Premises and equipment are stated at cost, less accumulated depreciation. Depreciation is computed on the straight-line method over the estimated useful lives of the respective assets. Costs for improvements are capitalized. Charges for ordinary maintenance and repairs are expensed to operations as incurred.
Real estate owned. Real estate properties acquired through foreclosure of loans or through acquisitions are recorded initially at fair value less selling costs and are subsequently recorded at lower of cost or fair value. Costs for improvements are capitalized. Any gains (losses) and maintenance costs are recorded in Gain (loss) on real estate owned, net.
Intangible assets. Goodwill represents the excess of the cost of businesses acquired over the fair value of the net assets acquired. Other intangibles, including core deposit intangibles, are acquired assets that lack physical substance but can be distinguished from goodwill. Goodwill is evaluated for impairment on an annual basis during the fourth quarter. Other intangible assets are amortized over their estimated lives and are subject to impairment testing when events or circumstances change. If circumstances indicate that the carrying value of the assets may not be recoverable, an impairment charge could be recorded. The Bank amortizes the core deposit intangibles over their estimated lives using an accelerated method.
The table below provides detail regarding the Company's intangible assets.
WASHINGTON FEDERAL, INC. AND SUBSIDIARIES
NOTES TO THE CONSOLIDATED FINANCIAL STATEMENTS
YEARS ENDED SEPTEMBER 30, 2019, 2018 AND 2017
|
| | | | | | | | | | | |
| Goodwill | | Core Deposit and Other Intangibles | | Total |
| (In thousands) |
Balance at September 30, 2017 | $ | 293,153 |
| | $ | 5,529 |
| | $ | 298,682 |
|
Additions (1) | 8,215 |
| | 6,595 |
| | 14,810 |
|
Amortization (2) | — |
| | (2,206 | ) | | (2,206 | ) |
Balance at September 30, 2018 | 301,368 |
| | 9,918 |
| | 311,286 |
|
Additions | — |
| | — |
| | — |
|
Amortization | — |
| | (2,039 | ) | | (2,039 | ) |
Balance at September 30, 2019 | $ | 301,368 |
| | $ | 7,879 |
| | $ | 309,247 |
|
(1) During 2018, an immaterial correction was recorded related to acquisitions of insurance agency businesses in prior years. The balance sheet classification correction resulted in an increase in goodwill of $7,135,000 and finite-lived intangible assets of $5,106,000 and a corresponding decrease in other assets of $12,241,000.
(2) During 2018, an immaterial correction of $1,500,000 was recorded to amortization expense for intangible assets stemming from acquisitions of insurance agency businesses in prior years.
The table below presents the estimated future amortization expense of core deposit and other intangibles for the next five years.
|
| | | | |
Fiscal Year | | Expense |
| | (In thousands) |
2020 | | $ | 1,984 |
|
2021 | | 1,140 |
|
2022 | | 804 |
|
2023 | | 775 |
|
2024 | | 755 |
|
Income taxes. Income taxes are accounted for using the asset and liability method, which requires the recognition of deferred tax assets and liabilities for the expected future tax consequences of events that have been included in the financial statements. Under this method, a deferred tax asset or liability is determined based on the temporary differences between the financial statement and corresponding tax treatment of income, gains, losses, deductions or credits using enacted tax rates in effect for the year in which the differences are expected to reverse. The provision for income taxes includes current and deferred income tax expense based on net income adjusted for temporary and permanent differences such as depreciation, loan loss reserve, tax-exempt interest, and affordable housing tax credits. Reserves for uncertain tax positions, together with any related interest and penalties, if applicable, and amortization of affordable housing tax credit investments are recorded within income tax expense.
Accounting for stock-based compensation. We recognize in the statement of operations the grant-date fair value of stock options and other equity-based forms of compensation issued to employees over the employees' requisite service period (generally the vesting period). The requisite service period may be subject to performance conditions. Stock options and restricted stock awards generally vest ratably over two to five years and are recognized as expense over that same period of time. The exercise price of each option equals the market price of the Company's common stock on the date of the grant, and the maximum term is ten years.
Certain grants of restricted stock are subject to performance-based and market-based vesting as well as other approved vesting conditions and cliff vest based on those conditions. Compensation expense is recognized over the service period to the extent restricted stock awards are expected to vest. See Note O for additional information.
Business segments. As the Company manages its business and operations on a consolidated basis, management has determined that there is one reportable business segment.
WASHINGTON FEDERAL, INC. AND SUBSIDIARIES
NOTES TO THE CONSOLIDATED FINANCIAL STATEMENTS
YEARS ENDED SEPTEMBER 30, 2019, 2018 AND 2017
Regulatory matters. On February 28, 2018, pursuant to a Stipulation and Consent to the Issuance of a Consent Order (the “Consent Order”), the Office of the Comptroller of the Currency issued a Consent Order relating to the Bank, the terms of which are intended to further enhance its BSA program. The Consent Order requires the Bank to create a BSA-focused action plan, supplement existing customer due diligence policies and procedures, perform a BSA risk assessment, perform a transaction activity look-back, enhance training, and complete independent testing. The Bank has not been informed that this action includes the assessment of a civil money penalty. The Bank is working cooperatively with the OCC to implement the necessary changes to comply with the provisions of the Consent Order.
Subsequent events. The Company has evaluated subsequent events for adjustment to or disclosure in the Company’s consolidated financial statements through the date of this report, and the Company has not identified any recordable or disclosable events, not otherwise reported in these consolidated financial statements or the notes thereto, except for the following.
On October 29, 2019, the Company issued a press release announcing a quarterly cash dividend of 21 cents per share to be paid on November 22, 2019, to common shareholders of record as of November 8, 2019. This is Washington Federal’s 147th consecutive quarterly cash dividend.
NOTE B - NEW ACCOUNTING PRONOUNCEMENTS
In April 2019, the Financial Accounting Standards Board (“FASB”) issued Accounting Standards Update (“ASU”) 2019-04, Codification Improvements to Topic 326, Financial Instruments-Credit Losses, Topic 815, Derivatives and Hedging, and Topic 825, Financial Instruments, that clarifies and improves areas of guidance related to the recently issued standards on credit losses (ASU 2016-13), hedging (ASU 2017-12), and recognition and measurement of financial instruments (ASU 2016-01). The amendments generally have the same effective dates as their related standards. If already adopted, the amendments of ASU 2016-01 and ASU 2016-13 are effective for fiscal years beginning after December 15, 2019 and the amendments of ASU 2017-12 are effective as of the beginning of the Company’s next annual reporting period; early adoption is permitted. The Company previously adopted both ASU 2017-12 and ASU 2016-01 and does not expect the amendments of ASU 2019-04 will have a material impact on its consolidated financial statements. The Company is continuing to evaluate the impact of ASU 2016-13 and will consider the amendments of ASU 2019-04 as part of that process.
In August 2018, the FASB issued ASU 2018-15, Customer’s Accounting for Implementation Costs Incurred in a Cloud Computing Arrangement That is a Service Contract. The amendments in this ASU align the requirements for capitalizing implementation costs incurred in a hosting arrangement that is a service contract with the requirements for capitalizing implementation costs incurred to develop or obtain internal-use software. The amendments also require the entity to expense the capitalized implementation costs of a hosting arrangement that is a service contract over the term of the hosting arrangement, including reasonably certain renewal periods. The amendments in the ASU are effective for fiscal years beginning after December 15, 2019 and interim periods within those fiscal years. Early adoption is permitted, including adoption in any interim period. The Company is assessing the impact that this guidance will have on its consolidated financial statements.
In August 2018, the FASB issued ASU 2018-13, Fair Value Measurement (Topic 820): Disclosure Framework - Changes to the Disclosure Requirements for Fair Value Measurement. This ASU adds, eliminates, and modifies certain disclosure requirements for fair value measurements. Among the changes, entities will no longer be required to disclose the amount of and reasons for transfers between Level 1 and Level 2 of the fair value hierarchy, but will be required to disclose the range and weighted average used to develop significant unobservable inputs for Level 3 fair value measurements. The ASU is effective for interim and annual reporting periods beginning after December 15, 2019; early adoption is permitted. Entities are also allowed to elect early adoption of the eliminated or modified disclosure requirements and delay adoption of the added disclosure requirements until their effective date. As the ASU only revises disclosure requirements, this guidance will not have a material impact on the Company's consolidated financial statements.
In June 2016, the FASB issued ASU 2016-13, Financial Instruments - Credit Losses. The ASU, as amended, is intended to provide financial statement users with more decision-useful information about the expected credit losses on financial instruments that are not accounted for at fair value through net income, including loans held for investment, held-to-maturity debt securities, trade and other receivables, net investments in leases and other commitments to extend credit held by a reporting entity at each reporting date. The amendments require that financial assets measured at amortized cost be presented at the net amount expected to be collected, through an allowance for credit losses that is deducted from the amortized cost basis. The ASU eliminates the current
WASHINGTON FEDERAL, INC. AND SUBSIDIARIES
NOTES TO THE CONSOLIDATED FINANCIAL STATEMENTS
YEARS ENDED SEPTEMBER 30, 2019, 2018 AND 2017
framework of recognizing probable incurred losses and instead requires an entity to use its current estimate of all expected credit losses over the contractual life. The measurement of expected credit losses is based upon historical experience, current conditions, and reasonable and supportable forecasts that affect the collectability of the financial assets.
For purchased financial assets with a more-than-insignificant amount of credit deterioration since origination (“PCD assets”) that are measured at amortized cost, an allowance for expected credit losses is recorded as an adjustment to the cost basis of the asset. Subsequent changes in estimated cash flows would be recorded as an adjustment to the allowance and through the statement of income.
Credit losses relating to available-for-sale debt securities will be recorded through an allowance for credit losses rather than as a direct write-down to the security's cost basis.
The amendments in this ASU are effective for fiscal years beginning after December 15, 2019, including interim periods within those fiscal years. For most debt securities, the transition approach requires a cumulative-effect adjustment to the statement of financial position as of the beginning of the first reporting period the guidance is effective. For other-than-temporarily impaired debt securities and PCD assets, the guidance will be applied prospectively. The Company is currently in the process of evaluating the impact of the amended guidance on its consolidated financial statements and the reserve for credit losses may increase upon adoption given that the allowance will be required to cover the full remaining expected life of the portfolio upon adoption, rather than the incurred loss model under current U.S. GAAP. The extent of this increase is still being evaluated and will depend on economic conditions and the composition of the Company’s loan, lease and held-to-maturity securities portfolios at the time of adoption.
In February 2016, the FASB issued ASU 2016-02, Leases. The ASU, as amended, requires lessees to recognize a lease liability, which is a lessee's obligation to make lease payments arising from a lease, and a right-of-use asset, which is an asset that represents the lessee's right to use, or control the use of, a specified asset for the lease term. The guidance also simplifies the accounting for sale and leaseback transactions and introduces new disclosure requirements for leasing arrangements. Accounting by lessors is largely unchanged. The amendments are effective for fiscal years beginning after December 15, 2018, including interim periods within those fiscal years. The Company has adopted the standard effective October 1, 2019 utilizing the transition method allowed under ASU 2018-11 and will not restate comparative periods. The Company leases a number of properties under non-cancelable operating leases which will be subject to this ASU. We have elected the package of practical expedients permitted under the transition guidance, which allows us to carryforward our historical lease classification and our assessment on whether a contract is or contains a lease. We have also elected to keep leases with an initial term of 12 months or less off the balance sheet. The adoption of the new standard has resulted in an increase in other assets and an increase in other liabilities on October 1, 2019 that is not material. The Company has recognized no cumulative effect adjustment to the beginning balance of retained earnings upon adoption and there will be no material impact to our Consolidated Statement of Income as a result of this ASU.
NOTE C - INVESTMENT SECURITIES
The tables below provide detail regarding the amortized cost and fair value of available-for-sale and held-to-maturity investment securities.
WASHINGTON FEDERAL, INC. AND SUBSIDIARIES
NOTES TO THE CONSOLIDATED FINANCIAL STATEMENTS
YEARS ENDED SEPTEMBER 30, 2019, 2018 AND 2017
|
| | | | | | | | | | | | | | | | | | |
September 30, 2019 | Amortized Cost | | Gross Unrealized | | Fair Value | | Yield |
Gains | | Losses | |
| (In thousands) |
Available-for-sale securities | | | | | | | | | |
U.S. government and agency securities due | | | | | | | | | |
5 to 10 years | $ | 65,287 |
| | $ | 39 |
| | $ | (629 | ) | | $ | 64,697 |
| | 2.43 | % |
Over 10 years | 207,067 |
| | 1 |
| | (987 | ) | | 206,081 |
| | 3.02 |
|
Corporate debt securities due | | | | | | | | | |
Within 1 year | 43,903 |
| | 411 |
| | — |
| | 44,314 |
| | 3.65 |
|
1 to 5 years | 70,000 |
| | 689 |
| | (50 | ) | | 70,639 |
| | 3.29 |
|
5 to 10 years | 92,931 |
| | 1,879 |
| | — |
| | 94,810 |
| | 3.27 |
|
Municipal bonds due | | | | | | | | | |
1 to 5 years | 1,430 |
| | 14 |
| | — |
| | 1,444 |
| | 1.94 |
|
Over 10 years | 20,303 |
| | 895 |
| | — |
| | 21,198 |
| | 6.45 |
|
Mortgage-backed securities | | | | | | | | | |
Agency pass-through certificates | 957,150 |
| | 26,533 |
| | (1,124 | ) | | 982,559 |
| | 3.29 |
|
| 1,458,071 |
| | 30,461 |
| | (2,790 | ) | | 1,485,742 |
| | 3.27 |
|
Held-to-maturity securities | | | | | | | | | |
Mortgage-backed securities | | | | | | | | | |
Agency pass-through certificates | 1,428,480 |
| | 19,945 |
| | (337 | ) | | 1,448,088 |
| | 3.15 |
|
Commercial MBS | 15,000 |
| | 7 |
| | — |
| | 15,007 |
| | 2.89 |
|
| 1,443,480 |
| | 19,952 |
| | (337 | ) | | 1,463,095 |
| | 3.15 |
|
| $ | 2,901,551 |
| | $ | 50,413 |
| | $ | (3,127 | ) | | $ | 2,948,837 |
| | 3.21 | % |
WASHINGTON FEDERAL, INC. AND SUBSIDIARIES
NOTES TO THE CONSOLIDATED FINANCIAL STATEMENTS
YEARS ENDED SEPTEMBER 30, 2019, 2018 AND 2017
|
| | | | | | | | | | | | | | | | | | |
September 30, 2018 | Amortized Cost | | Gross Unrealized | | Fair Value | | Yield |
Gains | | Losses | |
| (In thousands) |
Available-for-sale securities | | | | | | | | | |
U.S. government and agency securities due | | | | | | | | | |
5 to 10 years | $ | 60,872 |
| | $ | — |
| | $ | (1,473 | ) | | $ | 59,399 |
| | 2.55 | % |
Over 10 years | 148,099 |
| | 109 |
| | (314 | ) | | 147,894 |
| | 3.05 |
|
Equity securities | | | | | | | | | |
1 to 5 years | 500 |
| | — |
| | (12 | ) | | 488 |
| | 1.80 |
|
Corporate debt securities due | | | | | | | | | |
1 to 5 years | 113,762 |
| | 1,875 |
| | (13 | ) | | 115,624 |
| | 3.59 |
|
5 to 10 years | 69,965 |
| | 35 |
| | (929 | ) | | 69,071 |
| | 3.23 |
|
Municipal bonds due | | | | | | | | | |
1 to 5 years | 1,398 |
| | — |
| | (24 | ) | | 1,374 |
| | 2.05 |
|
Over 10 years | 20,323 |
| | 1,281 |
| | — |
| | 21,604 |
| | 6.45 |
|
Mortgage-backed securities | | | | | | | | | |
Agency pass-through certificates | 908,092 |
| | 1,383 |
| | (13,434 | ) | | 896,041 |
| | 3.29 |
|
Commercial MBS | 3,460 |
| | 2 |
| | — |
| | 3,462 |
| | 4.36 |
|
| 1,326,471 |
| | 4,685 |
| | (16,199 | ) | | 1,314,957 |
| | 3.30 |
|
Held-to-maturity securities | | | | | | | | | |
Mortgage-backed securities | | | | | | | | | |
Agency pass-through certificates | 1,610,420 |
| | 305 |
| | (76,983 | ) | | 1,533,742 |
| | 3.16 |
|
Commercial MBS | 15,000 |
| | 28 |
| | — |
| | 15,028 |
| | 3.03 |
|
| 1,625,420 |
| | 333 |
| | (76,983 | ) | | 1,548,770 |
| | 3.16 |
|
| $ | 2,951,891 |
| | $ | 5,018 |
| | $ | (93,182 | ) | | $ | 2,863,727 |
| | 3.22 | % |
The Company purchased $358,709,000 of available-for-sale investment securities and no held-to-maturity investment securities during 2019. Sales of available-for-sale securities totaled $491,000 and there were no sales of held-to-maturity investment securities in 2019. Substantially all mortgage-backed securities have contractual due dates that exceed 25 years.
The following table shows the gross unrealized losses and fair value of securities at September 30, 2019, and September 30, 2018, by length of time that individual securities in each category have been in a continuous loss position. Management believes that the declines in fair value of these investments are not an other-than-temporary impairment as these losses are due to a change in interest rates rather than any credit deterioration. The impairment is also deemed to be temporary because: 1) the Company does not intend to sell the security, and 2) it is not more likely than not that it will be required to sell the security before recovery of the entire amortized cost basis of the security.
|
| | | | | | | | | | | | | | | | | | |
| September 30, 2019 |
| Less than 12 months | 12 months or more | Total |
| Unrealized Gross Losses | Fair Value | Unrealized Gross Losses | Fair Value | Unrealized Gross Losses | Fair Value |
| (In thousands) |
Corporate debt securities | $ | — |
| $ | — |
| $ | (50 | ) | $ | 24,950 |
| $ | (50 | ) | $ | 24,950 |
|
U.S. government and agency securities | (656 | ) | 152,715 |
| (960 | ) | 77,391 |
| (1,616 | ) | 230,106 |
|
Mortgage-backed securities | (148 | ) | 87,895 |
| (1,313 | ) | 270,802 |
| (1,461 | ) | 358,697 |
|
| $ | (804 | ) | $ | 240,610 |
| $ | (2,323 | ) | $ | 373,143 |
| $ | (3,127 | ) | $ | 613,753 |
|
WASHINGTON FEDERAL, INC. AND SUBSIDIARIES
NOTES TO THE CONSOLIDATED FINANCIAL STATEMENTS
YEARS ENDED SEPTEMBER 30, 2019, 2018 AND 2017
|
| | | | | | | | | | | | | | | | | | |
| September 30, 2018 |
| Less than 12 months | 12 months or more | Total |
| Unrealized Gross Losses | Fair Value | Unrealized Gross Losses | Fair Value | Unrealized Gross Losses | Fair Value |
| (In thousands) |
Corporate debt securities | $ | (929 | ) | $ | 49,072 |
| $ | (14 | ) | $ | 24,988 |
| $ | (943 | ) | $ | 74,060 |
|
Municipal bonds | (24 | ) | 1,374 |
| — |
| — |
| (24 | ) | 1,374 |
|
U.S. government and agency securities | (141 | ) | 37,565 |
| (1,645 | ) | 76,499 |
| (1,786 | ) | 114,064 |
|
Equity securities | (12 | ) | 488 |
| — |
| — |
| (12 | ) | 488 |
|
Mortgage-backed securities | (28,748 | ) | 1,035,754 |
| (61,669 | ) | 1,183,017 |
| (90,417 | ) | 2,218,771 |
|
| $ | (29,854 | ) | $ | 1,124,253 |
| $ | (63,328 | ) | $ | 1,284,504 |
| $ | (93,182 | ) | $ | 2,408,757 |
|
NOTE D - LOANS RECEIVABLE
The following table is a summary of loans receivable.
|
| | | | | | | | | | | |
| September 30, 2019 | | September 30, 2018 |
| (In thousands) | | (In thousands) |
Gross loans by category | | | | | |
Single-family residential | $ | 5,835,194 |
| 43.8 | % | | $ | 5,798,966 |
| 45.1 | % |
Construction | 2,038,052 |
| 15.3 |
| | 1,890,668 |
| 14.7 |
|
Construction - custom | 540,741 |
| 4.1 |
| | 624,479 |
| 4.9 |
|
Land - acquisition & development | 204,107 |
| 1.5 |
| | 155,204 |
| 1.2 |
|
Land - consumer lot loans | 99,694 |
| 0.7 |
| | 102,036 |
| 0.8 |
|
Multi-family | 1,422,674 |
| 10.7 |
| | 1,385,125 |
| 10.8 |
|
Commercial real estate | 1,631,170 |
| 12.3 |
| | 1,452,168 |
| 11.3 |
|
Commercial & industrial | 1,268,695 |
| 9.5 |
| | 1,140,874 |
| 8.9 |
|
HELOC | 142,178 |
| 1.1 |
| | 130,852 |
| 1.0 |
|
Consumer | 129,883 |
| 1.0 |
| | 173,306 |
| 1.3 |
|
Total gross loans | 13,312,388 |
| 100 | % | | 12,853,678 |
| 100 | % |
Less: | | | | | |
Allowance for probable losses | 131,534 |
| | | 129,257 |
| |
Loans in process | 1,201,341 |
| | | 1,195,506 |
| |
Net deferred fees, costs and discounts | 48,938 |
| | | 51,834 |
| |
Total loan contra accounts | 1,381,813 |
| | | 1,376,597 |
| |
Net loans | $ | 11,930,575 |
| | | $ | 11,477,081 |
| |
WASHINGTON FEDERAL, INC. AND SUBSIDIARIES
NOTES TO THE CONSOLIDATED FINANCIAL STATEMENTS
YEARS ENDED SEPTEMBER 30, 2019, 2018 AND 2017
The following summary breaks down the Company's fixed rate and adjustable rate loans by time to maturity or to rate adjustment.
|
| | | | | | | | | | | | |
September 30, 2019 |
Fixed-Rate | | Adjustable-Rate |
Term To Maturity | Gross Loans | % of Gross Loans | | Term To Rate Adjustment | Gross Loans | % of Gross Loans |
| (In thousands) | | | | (In thousands) | |
Within 1 year | $ | 135,426 |
| 1.0 | % | | Less than 1 year | $ | 4,056,238 |
| 30.5 | % |
1 to 3 years | 416,285 |
| 3.1 |
| | 1 to 3 years | 558,197 |
| 4.2 |
|
3 to 5 years | 341,838 |
| 2.6 |
| | 3 to 5 years | 489,151 |
| 3.7 |
|
5 to 10 years | 993,685 |
| 7.5 |
| | 5 to 10 years | 110,934 |
| 0.8 |
|
10 to 20 years | 1,059,127 |
| 8.0 |
| | 10 to 20 years | 32,242 |
| 0.2 |
|
Over 20 years | 5,101,241 |
| 38.3 |
| | Over 20 years | 18,024 |
| 0.1 |
|
| $ | 8,047,602 |
| 60.5 | % | | | $ | 5,264,786 |
| 39.5 | % |
The following tables provide information regarding loans receivable by loan category and geography.
|
| | | | | | | | | | | | | | | | | | | | | | | | | | | | | | | | | |
September 30, 2019 | Single -
family
residential | Multi-
family | Land -
A & D | Land -
lot loans | Construction - custom | Construction | Commercial
real estate | Commercial
and industrial | Consumer | HELOC | Total |
| (In thousands) |
Washington | $ | 3,125,058 |
| $ | 351,771 |
| $ | 82,891 |
| $ | 61,534 |
| $ | 315,615 |
| $ | 482,453 |
| $ | 530,165 |
| $ | 521,049 |
| $ | 90,263 |
| $ | 83,818 |
| $ | 5,644,617 |
|
Oregon | 694,577 |
| 353,388 |
| 50,195 |
| 13,228 |
| 61,699 |
| 430,749 |
| 294,574 |
| 287,922 |
| 1,376 |
| 14,780 |
| 2,202,488 |
|
Arizona | 575,256 |
| 331,088 |
| 18,871 |
| 10,990 |
| 58,550 |
| 262,400 |
| 246,041 |
| 78,590 |
| 1,642 |
| 12,570 |
| 1,595,998 |
|
Utah | 527,142 |
| 58,865 |
| — |
| 4,116 |
| 45,277 |
| 246,097 |
| 74,454 |
| 40,368 |
| 127 |
| 7,458 |
| 1,003,904 |
|
Texas | 161,616 |
| 82,598 |
| 2,936 |
| 416 |
| 1,889 |
| 420,627 |
| 165,692 |
| 165,646 |
| 467 |
| — |
| 1,001,887 |
|
New Mexico | 205,559 |
| 174,485 |
| 32,443 |
| 2,049 |
| 17,775 |
| 68,120 |
| 194,621 |
| 15,379 |
| 1,162 |
| 11,474 |
| 723,067 |
|
Idaho | 321,184 |
| 43,446 |
| 16,771 |
| 4,658 |
| 27,499 |
| 88,956 |
| 91,725 |
| 34,125 |
| 84 |
| 8,932 |
| 637,380 |
|
Nevada | 190,941 |
| 26,837 |
| — |
| 2,694 |
| 12,437 |
| — |
| 32,094 |
| 20,426 |
| 95 |
| 3,129 |
| 288,653 |
|
Other | 33,861 |
| 196 |
| — |
| 9 |
| — |
| 38,650 |
| 1,804 |
| 105,190 |
| 34,667 |
| 17 |
| 214,394 |
|
| $ | 5,835,194 |
| $ | 1,422,674 |
| $ | 204,107 |
| $ | 99,694 |
| $ | 540,741 |
| $ | 2,038,052 |
| $ | 1,631,170 |
| $ | 1,268,695 |
| $ | 129,883 |
| $ | 142,178 |
| $ | 13,312,388 |
|
|
| | | | | | | | | | | | | | | | | | | | | | |
Percentage by geographic area |
September 30, 2019 | Single -
family
residential | Multi-
family | Land -
A & D | Land -
lot loans | Construction - custom | Construction | Commercial
real estate | Commercial
and industrial | Consumer | HELOC | Total |
| As % of total gross loans |
Washington | 23.5 | % | 2.7 | % | 0.7 | % | 0.5 | % | 2.5 | % | 3.6 | % | 4.1 | % | 3.8 | % | 0.7 | % | 0.6 | % | 42.7 | % |
Oregon | 5.2 |
| 2.7 |
| 0.4 |
| 0.1 |
| 0.5 |
| 3.2 |
| 2.2 |
| 2.2 |
| — |
| 0.1 |
| 16.6 |
|
Arizona | 4.3 |
| 2.5 |
| 0.1 |
| 0.1 |
| 0.4 |
| 2.0 |
| 1.8 |
| 0.6 |
| — |
| 0.1 |
| 11.9 |
|
Utah | 4.0 |
| 0.4 |
| — |
| — |
| 0.3 |
| 1.8 |
| 0.6 |
| 0.3 |
| — |
| 0.1 |
| 7.5 |
|
Texas | 1.2 |
| 0.6 |
| — |
| — |
| — |
| 3.2 |
| 1.2 |
| 1.2 |
| — |
| — |
| 7.4 |
|
New Mexico | 1.5 |
| 1.3 |
| 0.2 |
| — |
| 0.1 |
| 0.5 |
| 1.5 |
| 0.1 |
| — |
| 0.1 |
| 5.3 |
|
Idaho | 2.4 |
| 0.3 |
| 0.1 |
| — |
| 0.2 |
| 0.7 |
| 0.7 |
| 0.3 |
| — |
| 0.1 |
| 4.8 |
|
Nevada | 1.4 |
| 0.2 |
| — |
| — |
| 0.1 |
| — |
| 0.2 |
| 0.2 |
| — |
| — |
| 2.1 |
|
Other | 0.3 |
| — |
| — |
| — |
| — |
| 0.3 |
| — |
| 0.8 |
| 0.3 |
| — |
| 1.7 |
|
| 43.8 | % | 10.7 | % | 1.5 | % | 0.7 | % | 4.1 | % | 15.3 | % | 12.3 | % | 9.5 | % | 1.0 | % | 1.1 | % | 100 | % |
WASHINGTON FEDERAL, INC. AND SUBSIDIARIES
NOTES TO THE CONSOLIDATED FINANCIAL STATEMENTS
YEARS ENDED SEPTEMBER 30, 2019, 2018 AND 2017
|
| | | | | | | | | | | | | | | | | | | | |
Percentage by geographic area as a % of each loan type |
September 30, 2019 | Single -
family
residential | Multi-
family | Land -
A & D | Land -
lot loans | Construction - custom | Construction | Commercial
real estate | Commercial
and industrial | Consumer | HELOC |
| As % of total gross loans |
Washington | 53.6 | % | 24.7 | % | 40.6 | % | 61.7 | % | 58.4 | % | 23.7 | % | 32.5 | % | 41.1 | % | 69.5 | % | 59.0 | % |
Oregon | 11.9 |
| 24.8 |
| 24.6 |
| 13.3 |
| 11.4 |
| 21.1 |
| 18.1 |
| 22.7 |
| 1.1 |
| 10.4 |
|
Arizona | 9.9 |
| 23.3 |
| 9.2 |
| 11.0 |
| 10.8 |
| 12.9 |
| 15.1 |
| 6.2 |
| 1.3 |
| 8.8 |
|
Utah | 9.0 |
| 4.1 |
| — |
| 4.1 |
| 8.4 |
| 12.1 |
| 4.6 |
| 3.2 |
| 0.1 |
| 5.2 |
|
Texas | 2.8 |
| 5.8 |
| 1.4 |
| 0.4 |
| 0.3 |
| 20.6 |
| 10.2 |
| 13.1 |
| 0.4 |
| — |
|
New Mexico | 3.5 |
| 12.3 |
| 15.9 |
| 2.1 |
| 3.3 |
| 3.3 |
| 11.9 |
| 1.2 |
| 0.9 |
| 8.1 |
|
Idaho | 5.5 |
| 3.1 |
| 8.2 |
| 4.7 |
| 5.1 |
| 4.4 |
| 5.6 |
| 2.7 |
| 0.1 |
| 6.3 |
|
Nevada | 3.3 |
| 1.9 |
| — |
| 2.7 |
| 2.3 |
| — |
| 2.0 |
| 1.6 |
| 0.1 |
| 2.2 |
|
Other | 0.6 |
| — |
| — |
| — |
| — |
| 1.9 |
| 0.1 |
| 8.3 |
| 26.7 |
| — |
|
| 100 | % | 100 | % | 100 | % | 100 | % | 100 | % | 100 | % | 100 | % | 100 | % | 100 | % | 100 | % |
The Company has granted loans to officers and directors of the Company and related interests. These loans are made on the same terms,
including interest rates and collateral, as those prevailing at the time for comparable transactions with unrelated persons and do not involve more than the normal risk of collectability. The aggregate dollar amount of these loans, including unfunded commitments to lend, was $76,288,000 and $70,012,000 at September 30, 2019 and 2018, respectively. As of September 30, 2019, all of these loans were performing in accordance with contractual terms.
The following table provides additional information on impaired loans, loan commitments and loans serviced for others.
|
| | | | | | | |
| September 30, 2019 | | September 30, 2018 |
| (In thousands) |
Recorded investment in impaired loans | $ | 149,546 |
| | $ | 199,545 |
|
TDRs included in impaired loans | 121,677 |
| | 156,858 |
|
Specific reserves on impaired loans | 439 |
| | 517 |
|
Average balance of impaired loans for year ended | 175,187 |
| | 228,398 |
|
Interest income from impaired loans for year ended | 7,918 |
| | 10,232 |
|
Outstanding fixed-rate origination commitments | 357,247 |
| | 400,426 |
|
Gross loans serviced for others | 102,282 |
| | 77,958 |
|
WASHINGTON FEDERAL, INC. AND SUBSIDIARIES
NOTES TO THE CONSOLIDATED FINANCIAL STATEMENTS
YEARS ENDED SEPTEMBER 30, 2019, 2018 AND 2017
The following table sets forth information regarding non-accrual loans.
|
| | | | | | | | | | | | | |
| September 30, 2019 | | September 30, 2018 |
| (In thousands) | | (In thousands) |
Non-accrual loans: | | | | | | | |
Single-family residential | $ | 25,271 |
| | 74.9 | % | | $ | 27,643 |
| | 49.6 | % |
Construction | — |
| | — |
| | 2,427 |
| | 4.4 |
|
Land - acquisition & development | 169 |
| | 0.5 |
| | 920 |
| | 1.7 |
|
Land - consumer lot loans | 246 |
| | 0.7 |
| | 787 |
| | 1.4 |
|
Commercial real estate | 5,835 |
| | 17.3 |
| | 8,971 |
| | 16.1 |
|
Commercial & industrial | 1,292 |
| | 3.8 |
| | 14,394 |
| | 25.8 |
|
HELOC | 907 |
| | 2.7 |
| | 523 |
| | 0.9 |
|
Consumer | 11 |
| | — |
| | 21 |
| | — |
|
Total non-accrual loans | $ | 33,731 |
| | 100 | % | | $ | 55,686 |
| | 100 | % |
Non-accrual loans as % of total loans | 0.28 | % | | | | 0.49 | % | | |
The following tables break down delinquent loans by loan category and delinquency bucket.
|
| | | | | | | | | | | | | | | | | | | | | | | | | | |
September 30, 2019 | Amount of Loans | | Days Delinquent Based on $ Amount of Loans | | % based on $ |
Loan type | Net of Loans in Process | | Current | | 30 | | 60 | | 90 | | Total | |
| (In thousands) | | |
Single-family residential | $ | 5,835,186 |
| | $ | 5,809,239 |
| | $ | 3,672 |
| | $ | 3,211 |
| | $ | 19,064 |
| | $ | 25,947 |
| | 0.44 | % |
Construction | 1,164,889 |
| | 1,164,889 |
| | — |
| | — |
| | — |
| | — |
| | — |
|
Construction - custom | 255,505 |
| | 255,505 |
| | — |
| | — |
| | — |
| | — |
| | — |
|
Land - acquisition & development | 161,194 |
| | 161,194 |
| | — |
| | — |
| | — |
| | — |
| | — |
|
Land - consumer lot loans | 99,694 |
| | 98,916 |
| | 112 |
| | 619 |
| | 47 |
| | 778 |
| | 0.78 |
|
Multi-family | 1,422,652 |
| | 1,422,652 |
| | — |
| | — |
| | — |
| | — |
| | — |
|
Commercial real estate | 1,631,171 |
| | 1,625,509 |
| | 1,614 |
| | 285 |
| | 3,763 |
| | 5,662 |
| | 0.35 |
|
Commercial & industrial | 1,268,695 |
| | 1,267,828 |
| | — |
| | — |
| | 867 |
| | 867 |
| | 0.07 |
|
HELOC | 142,178 |
| | 140,718 |
| | 580 |
| | 183 |
| | 697 |
| | 1,460 |
| | 1.03 |
|
Consumer | 129,883 |
| | 129,227 |
| | 295 |
| | 117 |
| | 244 |
| | 656 |
| | 0.51 |
|
Total Loans | $ | 12,111,047 |
| | $ | 12,075,677 |
| | $ | 6,273 |
| | $ | 4,415 |
| | $ | 24,682 |
| | $ | 35,370 |
| | 0.29 | % |
Delinquency % | | | 99.71% | | 0.05% | | 0.04% | | 0.20% | | 0.29% | | |
WASHINGTON FEDERAL, INC. AND SUBSIDIARIES
NOTES TO THE CONSOLIDATED FINANCIAL STATEMENTS
YEARS ENDED SEPTEMBER 30, 2019, 2018 AND 2017
|
| | | | | | | | | | | | | | | | | | | | | | | | | | |
September 30, 2018 | Amount of Loans | | Days Delinquent Based on $ Amount of Loans | | % based on $ |
Loan type | Net of Loans in Process | | Current | | 30 | | 60 | | 90 | | Total | |
| (In thousands) | | |
Single-family residential | $ | 5,798,353 |
| | $ | 5,768,253 |
| | $ | 7,983 |
| | $ | 3,562 |
| | $ | 18,555 |
| | $ | 30,100 |
| | 0.52 | % |
Construction | 1,062,855 |
| | 1,060,428 |
| | — |
| | — |
| | 2,427 |
| | 2,427 |
| | 0.23 |
|
Construction - custom | 289,192 |
| | 289,192 |
| | — |
| | — |
| | — |
| | — |
| | — |
|
Land - acquisition & development | 123,560 |
| | 122,620 |
| | — |
| | 270 |
| | 670 |
| | 940 |
| | 0.76 |
|
Land - consumer lot loans | 101,908 |
| | 101,294 |
| | 144 |
| | 117 |
| | 353 |
| | 614 |
| | 0.60 |
|
Multi-family | 1,385,103 |
| | 1,385,103 |
| | — |
| | — |
| | — |
| | — |
| | — |
|
Commercial real estate | 1,452,169 |
| | 1,448,946 |
| | 316 |
| | 1,767 |
| | 1,140 |
| | 3,223 |
| | 0.22 |
|
Commercial & industrial | 1,140,874 |
| | 1,130,836 |
| | — |
| | — |
| | 10,038 |
| | 10,038 |
| | 0.88 |
|
HELOC | 130,852 |
| | 129,510 |
| | 567 |
| | 469 |
| | 306 |
| | 1,342 |
| | 1.03 |
|
Consumer | 173,306 |
| | 172,777 |
| | 172 |
| | 328 |
| | 29 |
| | 529 |
| | 0.31 |
|
Total Loans | $ | 11,658,172 |
| | $ | 11,608,959 |
| | $ | 9,182 |
| | $ | 6,513 |
| | $ | 33,518 |
| | $ | 49,213 |
| | 0.42 | % |
Delinquency % | | | 99.58% | | 0.08% | | 0.06% | | 0.29% | | 0.42% | | |
Most loans restructured in troubled debt restructurings ("TDRs") are accruing and performing loans where the borrower has proactively approached the Company about modifications due to temporary financial difficulties. Each request is individually evaluated for merit and likelihood of success. The concession for these loans is typically a payment reduction through a rate reduction of 100 to 200 bps for a specific term, usually six to 12 months. Interest-only payments may also be approved during the modification period. Principal forgiveness is not an available option for restructured loans. As of September 30, 2019, the outstanding balance of TDR's was $121,677,000 as compared to $156,858,000 as of September 30, 2018. As of September 30, 2019, 95.9% of the restructured loans were performing. Single-family residential loans comprised 92.0% of TDR loans as of September 30, 2019. The Company reserves for restructured loans within its allowance for loan loss methodology by taking into account the following performance indicators: 1) time since modification; 2) current payment status and 3) geographic area.
The following table provides information related to loans that were modified in a TDR during the periods presented. |
| | | | | | | | | | | | | | | | | | | | | |
| Twelve Months Ended September 30, 2019 | | Twelve Months Ended September 30, 2018 |
| | | Pre-Modification | | Post-Modification | | | | Pre-Modification | | Post-Modification |
| | | Outstanding | | Outstanding | | | | Outstanding | | Outstanding |
| Number of | | Recorded | | Recorded | | Number of | | Recorded | | Recorded |
Troubled Debt Restructurings: | Contracts | | Investment | | Investment | | Contracts | | Investment | | Investment |
| | | (In thousands) | | | | (In thousands) |
Single-family residential | 8 |
| | $ | 1,225 |
| | $ | 1,225 |
| | 27 |
| | $ | 5,070 |
| | $ | 5,070 |
|
Land - acquisition & development | — |
| | — |
| | — |
| | 1 |
| | 107 |
| | 107 |
|
Land - consumer lot loans | 1 |
| | 40 |
| | 40 |
| | — |
| | — |
| | — |
|
Commercial real estate | — |
| | — |
| | — |
| | 1 |
| | 120 |
| | 120 |
|
Commercial & industrial | — |
| | — |
| | — |
| | 4 |
| | 7,739 |
| | 7,739 |
|
HELOC | — |
| | — |
| | — |
| | 2 |
| | 95 |
| | 95 |
|
Consumer | — |
| | — |
| | — |
| | 1 |
| | — |
| | — |
|
| 9 |
| | $ | 1,265 |
| | $ | 1,265 |
| | 36 |
| | $ | 13,131 |
| | $ | 13,131 |
|
The following table provides information on payment defaults occurring during the periods presented where the loan had been modified in a TDR within 12 months of the payment default.
WASHINGTON FEDERAL, INC. AND SUBSIDIARIES
NOTES TO THE CONSOLIDATED FINANCIAL STATEMENTS
YEARS ENDED SEPTEMBER 30, 2019, 2018 AND 2017
|
| | | | | | | | | | | | | |
| Twelve Months Ended September 30, 2019 | | Twelve Months Ended September 30, 2018 |
| Number of | | Recorded | | Number of | | Recorded |
TDRs That Subsequently Defaulted: | Contracts | | Investment | | Contracts | | Investment |
| (In thousands) | | (In thousands) |
Single-family residential | 7 |
| | $ | 1,546 |
| | 4 |
| | $ | 433 |
|
HELOC | — |
| | — |
| | 1 |
| | 77 |
|
| 7 |
| | $ | 1,546 |
| | 5 |
| | $ | 510 |
|
NOTE E - ALLOWANCE FOR LOAN LOSSES
The following tables summarize the activity in the allowance for loan losses.
|
| | | | | | | | | | | | | | | | | | | |
Twelve Months Ended September 30, 2019 | Beginning Allowance | | Charge-offs | | Recoveries | | Provision & Transfers | | Ending Allowance |
| (In thousands) |
Single-family residential | $ | 33,033 |
| | $ | (268 | ) | | $ | 1,020 |
| | $ | (2,797 | ) | | $ | 30,988 |
|
Construction | 31,317 |
| | — |
| | 99 |
| | 888 |
| | 32,304 |
|
Construction - custom | 1,842 |
| | (1,973 | ) | | — |
| | 1,500 |
| | 1,369 |
|
Land - acquisition & development | 7,978 |
| | (107 | ) | | 7,457 |
| | (6,173 | ) | | 9,155 |
|
Land - consumer lot loans | 2,164 |
| | (804 | ) | | 719 |
| | 64 |
| | 2,143 |
|
Multi-family | 8,329 |
| | — |
| | — |
| | (938 | ) | | 7,391 |
|
Commercial real estate | 11,852 |
| | (428 | ) | | 1,102 |
| | 644 |
| | 13,170 |
|
Commercial & industrial | 28,702 |
| | (5,782 | ) | | 3,443 |
| | 5,087 |
| | 31,450 |
|
HELOC | 781 |
| | (1,086 | ) | | 46 |
| | 1,362 |
| | 1,103 |
|
Consumer | 3,259 |
| | (1,028 | ) | | 1,167 |
| | (937 | ) | | 2,461 |
|
| $ | 129,257 |
| | $ | (11,476 | ) | | $ | 15,053 |
| | $ | (1,300 | ) | | $ | 131,534 |
|
|
| | | | | | | | | | | | | | | | | | | |
Twelve Months Ended September 30, 2018 | Beginning Allowance | | Charge-offs | | Recoveries | | Provision & Transfers | | Ending Allowance |
| (In thousands) |
Single-family residential | $ | 36,892 |
| | $ | (1,142 | ) | | $ | 757 |
| | $ | (3,474 | ) | | $ | 33,033 |
|
Construction | 24,556 |
| | — |
| | — |
| | 6,761 |
| | 31,317 |
|
Construction - custom | 1,944 |
| | (50 | ) | | — |
| | (52 | ) | | 1,842 |
|
Land - acquisition & development | 6,829 |
| | (13 | ) | | 14,223 |
| | (13,061 | ) | | 7,978 |
|
Land - consumer lot loans | 2,649 |
| | (67 | ) | | 35 |
| | (453 | ) | | 2,164 |
|
Multi-family | 7,862 |
| | — |
| | — |
| | 467 |
| | 8,329 |
|
Commercial real estate | 11,818 |
| | (36 | ) | | 189 |
| | (119 | ) | | 11,852 |
|
Commercial & industrial | 28,524 |
| | (3,574 | ) | | 714 |
| | 3,038 |
| | 28,702 |
|
HELOC | 855 |
| | (668 | ) | | 71 |
| | 523 |
| | 781 |
|
Consumer | 1,144 |
| | (382 | ) | | 993 |
| | 1,504 |
| | 3,259 |
|
| $ | 123,073 |
| | $ | (5,932 | ) | | $ | 16,982 |
| | $ | (4,866 | ) | | $ | 129,257 |
|
The Company recorded a release of allowance for loan losses of $1,650,000 during the year ended September 30, 2019, as compared to a release of $5,450,000 for the year ended September 30, 2018. The credit quality of the portfolio has remained strong and economic conditions remain relatively stable.
WASHINGTON FEDERAL, INC. AND SUBSIDIARIES
NOTES TO THE CONSOLIDATED FINANCIAL STATEMENTS
YEARS ENDED SEPTEMBER 30, 2019, 2018 AND 2017
The Company had recoveries, net of charge-offs, of $3,577,000 for the year ended September 30, 2019, compared with net recoveries of $11,050,000 for the year ended September 30, 2018. A loan is charged-off when the loss is estimable and it is confirmed that the borrower is not expected to be able to meet its contractual obligations.
Non-accrual loans decreased to $33,731,000 as of September 30, 2019, from $55,686,000 as of September 30, 2018. Non-performing assets (“NPAs”) totaled $43,826,000, or 0.27% of total assets, at September 30, 2019, compared to $70,093,000, or 0.44% of total assets, as of September 30, 2018.
At September 30, 2019, $131,095,000 of the allowance was calculated under the Company's general allowance methodology and the remaining $439,000 represents specific reserves on loans deemed to be individually impaired.
The following tables show a summary of loans collectively and individually evaluated for impairment and the related general and specific reserves.
|
| | | | | | | | | | | | | | | | | | | | | |
September 30, 2019 | Loans Collectively Evaluated for Impairment | | Loans Individually Evaluated for Impairment |
| General Reserve Allocation | | Recorded Investment of Loans | | Ratio | | Specific Reserve Allocation | | Recorded Investment of Loans | | Ratio |
| (In thousands) | | | | (In thousands) |
Single-family residential | $ | 30,988 |
| | $ | 5,822,200 |
| | 0.5 | % | | $ | — |
| | $ | 17,978 |
| | — | % |
Construction | 32,304 |
| | 1,164,889 |
| | 2.8 |
| | — |
| | — |
| | — |
|
Construction - custom | 1,369 |
| | 255,505 |
| | 0.5 |
| | — |
| | — |
| | — |
|
Land - acquisition & development | 9,135 |
| | 160,964 |
| | 5.7 |
| | 20 |
| | 230 |
| | 8.7 |
|
Land - consumer lot loans | 2,143 |
| | 95,574 |
| | 2.2 |
| | — |
| | 375 |
| | — |
|
Multi-family | 7,387 |
| | 1,422,266 |
| | 0.5 |
| | 4 |
| | 385 |
| | 1.0 |
|
Commercial real estate | 12,847 |
| | 1,618,406 |
| | 0.8 |
| | 323 |
| | 12,765 |
| | 2.5 |
|
Commercial & industrial | 31,358 |
| | 1,266,913 |
| | 2.5 |
| | 92 |
| | 1,805 |
| | 5.1 |
|
HELOC | 1,103 |
| | 140,378 |
| | 0.8 |
| | — |
| | 837 |
| | — |
|
Consumer | 2,461 |
| | 129,527 |
| | 1.9 |
| | — |
| | 50 |
| | — |
|
| $ | 131,095 |
| | $ | 12,076,622 |
| | 1.1 | % | | $ | 439 |
| | $ | 34,425 |
| | 1.3 | % |
|
| | | | | | | | | | | | | | | | | | | | | |
September 30, 2018 | Loans Collectively Evaluated for Impairment | | Loans Individually Evaluated for Impairment |
| General Reserve Allocation | | Recorded Investment of Loans | | Ratio | | Specific Reserve Allocation | | Recorded Investment of Loans | | Ratio |
| (In thousands) | | | | (In thousands) |
Single-family residential | $ | 33,033 |
| | $ | 5,782,870 |
| | 0.6 | % | | $ | — |
| | $ | 21,345 |
| | — | % |
Construction | 31,317 |
| | 1,060,428 |
| | 3.0 |
| | — |
| | 2,427 |
| | — |
|
Construction - custom | 1,842 |
| | 289,192 |
| | 0.6 |
| | — |
| | — |
| | — |
|
Land - acquisition & development | 7,969 |
| | 122,639 |
| | 6.5 |
| | 9 |
| | 920 |
| | 1.0 |
|
Land - consumer lot loans | 2,164 |
| | 96,583 |
| | 2.2 |
| | — |
| | 507 |
| | — |
|
Multi-family | 8,325 |
| | 1,384,655 |
| | 0.6 |
| | 4 |
| | 448 |
| | 1.0 |
|
Commercial real estate | 11,702 |
| | 1,432,791 |
| | 0.8 |
| | 150 |
| | 19,378 |
| | 0.8 |
|
Commercial & industrial | 28,348 |
| | 1,126,438 |
| | 2.5 |
| | 354 |
| | 14,437 |
| | 2.5 |
|
HELOC | 781 |
| | 128,715 |
| | 0.6 |
| | — |
| | 1,162 |
| | — |
|
Consumer | 3,259 |
| | 173,181 |
| | 1.9 |
| | — |
| | 56 |
| | — |
|
| $ | 128,740 |
| | $ | 11,597,492 |
| | 1.1 | % | | $ | 517 |
| | $ | 60,680 |
| | 0.9 | % |
WASHINGTON FEDERAL, INC. AND SUBSIDIARIES
NOTES TO THE CONSOLIDATED FINANCIAL STATEMENTS
YEARS ENDED SEPTEMBER 30, 2019, 2018 AND 2017
The Company has an asset quality review function that analyzes the loan portfolio and reports the results of the review to the Board of Directors on a quarterly basis. The single-family residential, HELOC and consumer portfolios are evaluated based on their performance as a pool of loans, since no single loan is individually significant or judged by its risk rating, size or potential risk of loss. The construction, land, multi-family, commercial real estate and commercial and industrial loans are risk rated on a loan by loan basis to determine the relative risk inherent in specific borrowers or loans. Based on that risk rating, the loans are assigned a grade and classified as follows:
| |
• | Pass – the credit does not meet one of the definitions defined below. |
| |
• | Special mention – A special mention credit is considered to be currently protected from loss but is potentially weak. No loss of principal or interest is foreseen; however, proper supervision and management attention is required to deter further deterioration in the credit. Assets in this category constitute some undue and unwarranted credit risk but not to the point of justifying a risk rating of substandard. The credit risk may be relatively minor yet constitutes an unwarranted risk in light of the circumstances surrounding a specific asset. |
| |
• | Substandard – A substandard credit is an unacceptable credit. Additionally, repayment in the normal course is in jeopardy due to the existence of one or more well-defined weaknesses. In these situations, loss of principal is likely if the weakness is not corrected. A substandard asset is inadequately protected by the current sound worth and paying capacity of the borrower or of the collateral pledged, if any. Assets so classified will have a well-defined weakness or weaknesses that jeopardize the liquidation of the debt. Loss potential, while existing in the aggregate amount of substandard assets, does not have to exist in individual assets risk rated substandard. |
| |
• | Doubtful – A credit classified doubtful has all the weaknesses inherent in one classified substandard with the added characteristic that the weakness makes collection or liquidation in full, on the basis of currently existing facts, conditions and values, highly questionable and improbable. The probability of loss is high, but because of certain important and reasonably specific pending factors that may work to the advantage and strengthening of the asset, its classification as an estimated loss is deferred until its more exact status may be determined. Pending factors include proposed merger, acquisition, or liquidation procedures, capital injection, perfecting liens on additional collateral and refinancing plans. |
| |
• | Loss – Credits classified loss are considered uncollectible and of such little value that their continuance as a bankable asset is not warranted. This classification does not mean that the asset has absolutely no recovery or salvage value, but rather it is not practical or desirable to defer writing off this asset even though partial recovery may be affected in the future. Losses should be taken in the period in which they are identified as uncollectible. Partial charge-off versus full charge-off may be taken if the collateral offers some identifiable protection. |
WASHINGTON FEDERAL, INC. AND SUBSIDIARIES
NOTES TO THE CONSOLIDATED FINANCIAL STATEMENTS
YEARS ENDED SEPTEMBER 30, 2019, 2018 AND 2017
The following tables provide information on loans based on credit quality indicators (defined above).
|
| | | | | | | | | | | | | | | | | | | | | | | |
September 30, 2019 | Internally Assigned Grade | | Total |
| Pass | | Special mention | | Substandard | | Doubtful | | Loss | | Gross Loans |
| (In thousands) |
Loan type | | | | | | | | | | | |
Single-family residential | $ | 5,808,444 |
| | $ | — |
| | $ | 26,750 |
| | $ | — |
| | $ | — |
| | $ | 5,835,194 |
|
Construction | 2,038,052 |
| | — |
| | — |
| | — |
| | — |
| | 2,038,052 |
|
Construction - custom | 540,741 |
| | — |
| | — |
| | — |
| | — |
| | 540,741 |
|
Land - acquisition & development | 200,283 |
| | — |
| | 3,824 |
| | — |
| | — |
| | 204,107 |
|
Land - consumer lot loans | 98,828 |
| | — |
| | 866 |
| | — |
| | — |
| | 99,694 |
|
Multi-family | 1,418,837 |
| | — |
| | 3,837 |
| | — |
| | — |
| | 1,422,674 |
|
Commercial real estate | 1,602,634 |
| | 2,754 |
| | 25,782 |
| | — |
| | — |
| | 1,631,170 |
|
Commercial & industrial | 1,229,891 |
| | 18,125 |
| | 20,679 |
| | — |
| | — |
| | 1,268,695 |
|
HELOC | 141,271 |
| | — |
| | 907 |
| | — |
| | — |
| | 142,178 |
|
Consumer | 129,872 |
| | — |
| | 11 |
| | — |
| | — |
| | 129,883 |
|
Total gross loans | $ | 13,208,853 |
| | $ | 20,879 |
| | $ | 82,656 |
| | $ | — |
| | $ | — |
| | $ | 13,312,388 |
|
| | | | | | | | | | | |
Total grade as a % of total gross loans | 99.2 | % | | 0.2 | % | | 0.6 | % | | — | % | | — | % | | |
|
| | | | | | | | | | | | | | | | | | | | | | | |
September 30, 2018 | Internally Assigned Grade | | Total |
| Pass | | Special mention | | Substandard | | Doubtful | | Loss | | Gross Loans |
| (In thousands) |
Loan type | | | | | | | | | | | |
Single-family residential | $ | 5,766,096 |
| | $ | — |
| | $ | 32,870 |
| | $ | — |
| | $ | — |
| | $ | 5,798,966 |
|
Construction | 1,886,304 |
| | 1,937 |
| | 2,427 |
| | — |
| | — |
| | 1,890,668 |
|
Construction - custom | 624,479 |
| | — |
| | — |
| | — |
| | — |
| | 624,479 |
|
Land - acquisition & development | 152,984 |
| | — |
| | 2,220 |
| | — |
| | — |
| | 155,204 |
|
Land - consumer lot loans | 101,249 |
| | — |
| | 787 |
| | — |
| | — |
| | 102,036 |
|
Multi-family | 1,378,803 |
| | 1,633 |
| | 4,689 |
| | — |
| | — |
| | 1,385,125 |
|
Commercial real estate | 1,421,602 |
| | 7,114 |
| | 23,452 |
| | — |
| | — |
| | 1,452,168 |
|
Commercial & industrial | 1,093,405 |
| | 16,513 |
| | 30,956 |
| | — |
| | — |
| | 1,140,874 |
|
HELOC | 130,330 |
| | — |
| | 522 |
| | — |
| | — |
| | 130,852 |
|
Consumer | 173,285 |
| | — |
| | 21 |
| | — |
| | — |
| | 173,306 |
|
Total gross loans | $ | 12,728,537 |
| | $ | 27,197 |
|
| $ | 97,944 |
|
| $ | — |
|
| $ | — |
|
| $ | 12,853,678 |
|
| | | | | | | | | | | |
Total grade as a % of total gross loans | 99.0 | % | | 0.2 | % | | 0.8 | % | | — | % | | — | % | | |
WASHINGTON FEDERAL, INC. AND SUBSIDIARIES
NOTES TO THE CONSOLIDATED FINANCIAL STATEMENTS
YEARS ENDED SEPTEMBER 30, 2019, 2018 AND 2017
The following tables provide information on gross loans based on payment activity.
|
| | | | | | | | | | | | | |
September 30, 2019 | Performing Loans | | Non-Performing Loans |
| Amount | | % of Total Gross Loans | | Amount | | % of Total Gross Loans |
| (In thousands) | | (In thousands) |
Single-family residential | $ | 5,809,923 |
| | 99.6 | % | | $ | 25,271 |
| | 0.4 | % |
Construction | 2,038,052 |
| | 100.0 |
| | — |
| | — |
|
Construction - custom | 540,741 |
| | 100.0 |
| | — |
| | — |
|
Land - acquisition & development | 203,938 |
| | 99.9 |
| | 169 |
| | 0.1 |
|
Land - consumer lot loans | 99,448 |
| | 99.8 |
| | 246 |
| | 0.2 |
|
Multi-family | 1,422,674 |
| | 100.0 |
| | — |
| | — |
|
Commercial real estate | 1,625,335 |
| | 99.6 |
| | 5,835 |
| | 0.4 |
|
Commercial & industrial | 1,267,403 |
| | 99.9 |
| | 1,292 |
| | 0.1 |
|
HELOC | 141,271 |
| | 99.4 |
| | 907 |
| | 0.6 |
|
Consumer | 129,872 |
| | 100.0 |
| | 11 |
| | — |
|
| $ | 13,278,657 |
| | 99.7 | % | | $ | 33,731 |
| | 0.3 | % |
|
| | | | | | | | | | | | | |
September 30, 2018 | Performing Loans | | Non-Performing Loans |
| Amount | | % of Total Gross Loans | | Amount | | % of Total Gross Loans |
| (In thousands) | | (In thousands) |
Single-family residential | $ | 5,771,323 |
| | 99.5 | % | | $ | 27,643 |
| | 0.5 | % |
Construction | 1,888,241 |
| | 99.9 |
| | 2,427 |
| | 0.1 |
|
Construction - custom | 624,479 |
| | 100.0 |
| | — |
| | — |
|
Land - acquisition & development | 154,284 |
| | 99.4 |
| | 920 |
| | 0.6 |
|
Land - consumer lot loans | 101,249 |
| | 99.2 |
| | 787 |
| | 0.8 |
|
Multi-family | 1,385,125 |
| | 100.0 |
| | — |
| | — |
|
Commercial real estate | 1,443,197 |
| | 99.4 |
| | 8,971 |
| | 0.6 |
|
Commercial & industrial | 1,126,480 |
| | 98.7 |
| | 14,394 |
| | 1.3 |
|
HELOC | 130,329 |
| | 99.6 |
| | 523 |
| | 0.4 |
|
Consumer | 173,285 |
| | 100.0 |
| | 21 |
| | — |
|
| $ | 12,797,992 |
| | 99.6 | % | | $ | 55,686 |
| | 0.4 | % |
WASHINGTON FEDERAL, INC. AND SUBSIDIARIES
NOTES TO THE CONSOLIDATED FINANCIAL STATEMENTS
YEARS ENDED SEPTEMBER 30, 2019, 2018 AND 2017
The following tables provide information on impaired loans by loan category.
|
| | | | | | | | | | | | | | | |
September 30, 2019 | Recorded Investment | | Unpaid Principal Balance | | Related Allowance | | Average Recorded Investment |
| (In thousands) |
Impaired loans with no related allowance recorded: | | | | | | | |
Single-family residential | $ | 17,979 |
| | $ | 19,252 |
| | $ | — |
| | $ | 16,685 |
|
Construction | — |
| | — |
| | — |
| | 1,172 |
|
Construction - custom | — |
| | — |
| | — |
| | 251 |
|
Land - acquisition & development | 78 |
| | 143 |
| | — |
| | 290 |
|
Land - consumer lot loans | 344 |
| | 848 |
| | — |
| | 287 |
|
Multi-family | — |
| | — |
| | — |
| | 286 |
|
Commercial real estate | 7,467 |
| | 11,881 |
| | — |
| | 8,890 |
|
Commercial & industrial | 1,114 |
| | 5,312 |
| | — |
| | 7,168 |
|
HELOC | 837 |
| | 931 |
| | — |
| | 597 |
|
Consumer | 50 |
| | 119 |
| | — |
| | 23 |
|
| 27,869 |
| | 38,486 |
| | — |
| | 35,649 |
|
Impaired loans with an allowance recorded: | | | | | | | |
Single-family residential | 112,042 |
| | 114,609 |
| | 2,208 |
| | 125,976 |
|
Land - acquisition & development | 91 |
| | 152 |
| | — |
| | 99 |
|
Land - consumer lot loans | 3,556 |
| | 3,695 |
| | 20 |
| | 4,324 |
|
Multi-family | 385 |
| | 385 |
| | 4 |
| | 418 |
|
Commercial real estate | 4,168 |
| | 5,298 |
| | 323 |
| | 5,160 |
|
Commercial & industrial | 426 |
| | 691 |
| | 92 |
| | 2,535 |
|
HELOC | 949 |
| | 963 |
| | — |
| | 961 |
|
Consumer | 60 |
| | 282 |
| | — |
| | 65 |
|
| 121,677 |
| | 126,075 |
| | 2,647 |
| (1) | 139,538 |
|
Total: | | | | | | | |
Single-family residential | 130,021 |
| | 133,861 |
| | 2,208 |
| | 142,661 |
|
Construction | — |
| | — |
| | — |
| | 1,172 |
|
Construction - custom | — |
| | — |
| | — |
| | 251 |
|
Land - acquisition & development | 169 |
| | 295 |
| | — |
| | 389 |
|
Land - consumer lot loans | 3,900 |
| | 4,543 |
| | 20 |
| | 4,611 |
|
Multi-family | 385 |
| | 385 |
| | 4 |
| | 704 |
|
Commercial real estate | 11,635 |
| | 17,179 |
| | 323 |
| | 14,050 |
|
Commercial & industrial | 1,540 |
| | 6,003 |
| | 92 |
| | 9,703 |
|
HELOC | 1,786 |
| | 1,894 |
| | — |
| | 1,558 |
|
Consumer | 110 |
| | 401 |
| | — |
| | 88 |
|
| $ | 149,546 |
| | $ | 164,561 |
| | $ | 2,647 |
| (1) | $ | 175,187 |
|
____________________
| |
(1) | Includes $439,000 of specific reserves and $2,208,000 included in the general reserves. |
WASHINGTON FEDERAL, INC. AND SUBSIDIARIES
NOTES TO THE CONSOLIDATED FINANCIAL STATEMENTS
YEARS ENDED SEPTEMBER 30, 2019, 2018 AND 2017
|
| | | | | | | | | | | | | | | |
September 30, 2018 | Recorded Investment | | Unpaid Principal Balance | | Related Allowance | | Average Recorded Investment |
| (In thousands) |
Impaired loans with no related allowance recorded: | | | | | | | |
Single-family residential | $ | 18,872 |
| | $ | 20,050 |
| | $ | — |
| | $ | 20,097 |
|
Construction | 2,698 |
| | 2,818 |
| | — |
| | 1,349 |
|
Construction - custom | — |
| | — |
| | — |
| | 74 |
|
Land - acquisition & development | 814 |
| | 814 |
| | — |
| | 572 |
|
Land - consumer lot loans | 311 |
| | 336 |
| | — |
| | 260 |
|
Multi-family | — |
| | — |
| | — |
| | 70 |
|
Commercial real estate | 9,425 |
| | 14,035 |
| | — |
| | 11,158 |
|
Commercial & industrial | 10,137 |
| | 10,146 |
| | — |
| | 9,208 |
|
HELOC | 410 |
| | 1,170 |
| | — |
| | 450 |
|
Consumer | 20 |
| | 56 |
| | — |
| | 54 |
|
| 42,687 |
| | 49,425 |
| | — |
| | 43,292 |
|
Impaired loans with an allowance recorded: | | | | | | | |
Single-family residential | 139,796 |
| | 143,099 |
| | 2,871 |
| | 161,729 |
|
Land - acquisition & development | 107 |
| | 157 |
| | — |
| | 39 |
|
Land - consumer lot loans | 4,916 |
| | 5,290 |
| | 9 |
| | 6,449 |
|
Multi-family | 448 |
| | 448 |
| | 4 |
| | 471 |
|
Commercial real estate | 6,254 |
| | 7,733 |
| | 150 |
| | 10,445 |
|
Commercial & industrial | 4,291 |
| | 7,506 |
| | 354 |
| | 4,495 |
|
HELOC | 976 |
| | 984 |
| | — |
| | 1,395 |
|
Consumer | 70 |
| | 70 |
| | — |
| | 83 |
|
| 156,858 |
| | 165,287 |
| | 3,388 |
| (1) | 185,106 |
|
Total: | | | | | | | |
Single-family residential | 158,668 |
| | 163,149 |
| | 2,871 |
| | 181,826 |
|
Construction | 2,698 |
| | 2,818 |
| | — |
| | 1,349 |
|
Construction - custom | — |
| | — |
| | — |
| | 74 |
|
Land - acquisition & development | 921 |
| | 971 |
| | — |
| | 611 |
|
Land - consumer lot loans | 5,227 |
| | 5,626 |
| | 9 |
| | 6,709 |
|
Multi-family | 448 |
| | 448 |
| | 4 |
| | 541 |
|
Commercial real estate | 15,679 |
| | 21,768 |
| | 150 |
| | 21,603 |
|
Commercial & industrial | 14,428 |
| | 17,652 |
| | 354 |
| | 13,703 |
|
HELOC | 1,386 |
| | 2,154 |
| | — |
| | 1,845 |
|
Consumer | 90 |
| | 126 |
| | — |
| | 137 |
|
| $ | 199,545 |
| | $ | 214,712 |
| | $ | 3,388 |
| (1) | $ | 228,398 |
|
____________________
| |
(1) | Includes $517,000 of specific reserves and $2,871,000 included in the general reserves. |
WASHINGTON FEDERAL, INC. AND SUBSIDIARIES
NOTES TO THE CONSOLIDATED FINANCIAL STATEMENTS
YEARS ENDED SEPTEMBER 30, 2019, 2018 AND 2017
NOTE F - FAIR VALUE MEASUREMENTS
FASB ASC 820 defines fair value as the exchange price that would be received for an asset or paid to transfer a liability (an exit price) in the principal or most advantageous market for the asset or liability in an orderly transaction between market participants on the measurement date. ASC 820 also establishes a fair value hierarchy which requires an entity to maximize the use of observable inputs and minimize the use of unobservable inputs when measuring fair value. The standard describes three levels of inputs that may be used to measure fair value:
Level 1: Quoted prices (unadjusted) for identical assets or liabilities in active exchange markets that the entity has the ability to access as of the measurement date.
Level 2: Significant other observable inputs other than Level 1 prices, such as quoted prices for similar assets or liabilities, quoted prices in markets that are not active and other inputs that are observable or can be corroborated by observable market data.
Level 3: Significant unobservable inputs that reflect a company’s own assumptions about the assumptions that market participants would use in pricing an asset or liability.
The Company has established and documented the process for determining the fair values of its assets and liabilities, where applicable. Fair value is based on quoted market prices, when available, for identical or similar assets or liabilities. In the absence of quoted market prices, fair value is determined using valuation models or third-party appraisals. The following is a description of the valuation methodologies used to measure and report the fair value of financial assets and liabilities on a recurring or nonrecurring basis.
Measured on a Recurring Basis
Available-for-sale investment securities and derivative contracts
Securities available for sale are recorded at fair value on a recurring basis. The fair value of debt securities are priced using model pricing based on the securities' relationship to other benchmark quoted prices as provided by an independent third party, and under GAAP are considered a Level 2 input method. Securities that are traded on active exchanges, including the Company's equity securities, are measured using the closing price in an active market and are considered a Level 1 input method.
The Company offers interest rate swaps to its variable rate borrowers who want to manage their interest rate risk. At the same time, the Company enters into the opposite trade with a counter party to offset its interest rate risk. The Company has also entered various forms of fair value hedges and cash flow hedges using interest rate swaps. The fair value of these interest rate swaps are estimated by a third party pricing service using a discounted cash flow technique. These are considered a Level 2 input method.
WASHINGTON FEDERAL, INC. AND SUBSIDIARIES
NOTES TO THE CONSOLIDATED FINANCIAL STATEMENTS
YEARS ENDED SEPTEMBER 30, 2019, 2018 AND 2017
The following table presents the balance and level in the fair value hierarchy for assets and liabilities that are measured at fair value on a recurring basis.
|
| | | | | | | | | | | | | | | |
| September 30, 2019 |
| Level 1 | | Level 2 | | Level 3 | | Total |
| (In thousands) |
Available-for-sale securities | | | | | | | |
U.S. government and agency securities | $ | — |
| | $ | 270,778 |
| | $ | — |
| | $ | 270,778 |
|
Municipal bonds | — |
| | 22,642 |
| | — |
| | 22,642 |
|
Corporate debt securities | — |
| | 209,763 |
| | — |
| | 209,763 |
|
Mortgage-backed securities |
|
| |
|
| |
|
| |
|
|
Agency pass-through certificates | — |
| | 982,559 |
| | — |
| | 982,559 |
|
Total Available-for-sale securities | — |
| | 1,485,742 |
| | — |
| | 1,485,742 |
|
Client swap program hedges | — |
| | 20,381 |
| | — |
| | 20,381 |
|
Mortgage loan fair value hedges | — |
| | 1,608 |
| | — |
| | 1,608 |
|
Total Financial Assets | $ | — |
| | $ | 1,507,731 |
| | $ | — |
| | $ | 1,507,731 |
|
| | | | | | | |
Financial Liabilities | | | | | | | |
Client swap program hedges | $ | — |
| | $ | 20,381 |
| | $ | — |
| | $ | 20,381 |
|
Commercial loan fair value hedges | — |
| | 4,288 |
| | — |
| | 4,288 |
|
Borrowings cash flow hedges | — |
| | 7,877 |
| | — |
| | 7,877 |
|
Total Financial Liabilities | $ | — |
| | $ | 32,546 |
| | $ | — |
| | $ | 32,546 |
|
There were no transfers between, into and/or out of Levels 1, 2 or 3 during the year ended September 30, 2019.
WASHINGTON FEDERAL, INC. AND SUBSIDIARIES
NOTES TO THE CONSOLIDATED FINANCIAL STATEMENTS
YEARS ENDED SEPTEMBER 30, 2019, 2018 AND 2017
|
| | | | | | | | | | | | | | | |
| September 30, 2018 |
| Level 1 | | Level 2 | | Level 3 | | Total |
| (In thousands) |
Available-for-sale securities | | | | | | | |
Equity securities | $ | 488 |
| | $ | — |
| | $ | — |
| | $ | 488 |
|
U.S. government and agency securities | — |
| | 207,293 |
| | — |
| | 207,293 |
|
Municipal bonds | — |
| | 22,978 |
| | — |
| | 22,978 |
|
Corporate debt securities | — |
| | 184,695 |
| | — |
| | 184,695 |
|
Mortgage-backed securities | | | | | | | |
Agency pass-through certificates | — |
| | 896,041 |
| | — |
| | 896,041 |
|
Commercial MBS | — |
| | 3,462 |
| | — |
| | 3,462 |
|
Total Available-for-sale securities | 488 |
| | 1,314,469 |
| | — |
| | 1,314,957 |
|
Client swap program hedges | — |
| | 12,731 |
| | — |
| | 12,731 |
|
Commercial loan fair value hedges | — |
| | 3,857 |
| | — |
| | 3,857 |
|
Borrowings cash flow hedges | — |
| | 22,250 |
| | — |
| | 22,250 |
|
Total Financial Assets | $ | 488 |
| | $ | 1,353,307 |
| | $ | — |
| | $ | 1,353,795 |
|
| | | | | | | |
Financial Liabilities | | | | | | | |
Client swap program hedges | $ | — |
| | $ | 12,731 |
| | $ | — |
| | $ | 12,731 |
|
Total Financial Liabilities | $ | — |
| | $ | 12,731 |
| | $ | — |
| | $ | 12,731 |
|
There were no transfers between, into and/or out of Level 1, 2 or 3 during the year ended September 30, 2018.
Measured on a Nonrecurring Basis
Impaired Loans & Real Estate Owned
Real estate owned ("REO") consists principally of properties acquired through foreclosure. From time to time, and on a nonrecurring basis, adjustments using fair value measurements are recorded to reflect increases or decreases based on the current appraisal or estimated value of the collateral, but only up to the fair value of the real estate owned as of the initial transfer date less selling costs.
When management determines that the fair value of the collateral dependent impaired loans or the real estate owned requires additional adjustments, either as a result of an updated appraised value or when there is no observable market price, the Company classifies the impaired loan or real estate owned as Level 3. Level 3 assets recorded at fair value on a nonrecurring basis represent impaired loans for which a specific reserve is recorded or a partial charge-off was recorded based on the fair value of collateral, as well as real estate owned where the fair value of the property was less than the cost basis.
The following table presents the recorded balance of assets that were measured at estimated fair value on a nonrecurring basis for the periods presented, and the total gains (losses) resulting from those fair value adjustments for the periods presented. The estimated fair values are presented gross of estimated selling costs.
WASHINGTON FEDERAL, INC. AND SUBSIDIARIES
NOTES TO THE CONSOLIDATED FINANCIAL STATEMENTS
YEARS ENDED SEPTEMBER 30, 2019, 2018 AND 2017
|
| | | | | | | | | | | | | | | | | | | | | | | |
| September 30, 2019 | | Three Months Ended September 30, 2019 | | Twelve Months Ended September 30, 2019 |
| Level 1 | | Level 2 | | Level 3 | | Total | | Total Gains (Losses) |
| (In thousands) | | |
Impaired loans (1) | $ | — |
| | $ | — |
| | $ | 6,662 |
| | $ | 6,662 |
| | $ | (2,176 | ) | | $ | (7,796 | ) |
Real estate owned (2) | — |
| | — |
| | 7,307 |
| | 7,307 |
| | (275 | ) | | 119 |
|
Balance at end of period | $ | — |
| | $ | — |
| | $ | 13,969 |
| | $ | 13,969 |
| | $ | (2,451 | ) | | $ | (7,677 | ) |
| |
(1) | The gains (losses) represent remeasurements of collateral-dependent impaired loans. |
| |
(2) | The gains (losses) represent aggregate writedowns and charge-offs on real estate owned. |
|
| | | | | | | | | | | | | | | | | | | | | | | |
| September 30, 2018 | | Three Months Ended September 30, 2018 | | Twelve Months Ended September 30, 2018 |
| Level 1 | | Level 2 | | Level 3 | | Total | | Total Gains (Losses) |
| (In thousands) | | |
Impaired loans (1) | $ | — |
| | $ | — |
| | $ | 16,500 |
| | $ | 16,500 |
| | $ | (707 | ) | | $ | (4,800 | ) |
Real estate owned (2) | — |
| | — |
| | 7,455 |
| | 7,455 |
| | (126 | ) | | (782 | ) |
Balance at end of period | $ | — |
| | $ | — |
| | $ | 23,955 |
| | $ | 23,955 |
| | $ | (833 | ) | | $ | (5,582 | ) |
| |
(1) | The gains (losses) represent remeasurements of collateral-dependent impaired loans. |
| |
(2) | The gains (losses) represent aggregate writedowns and charge-offs on real estate owned. |
The following describes the process used to value Level 3 assets measured on a nonrecurring basis:
Impaired loans - The Company adjusts the carrying amount of impaired loans when there is evidence of probable loss and the expected fair value of the loan is less than its contractual amount. The amount of the impairment may be determined based on the estimated present value of future cash flows or the fair value of the underlying collateral. Impaired loans with a specific reserve allowance based on cash flow analysis or the value of the underlying collateral are classified as Level 3 assets.
The evaluations for impairment are prepared by the Company's Problem Loan Review Committee, which is chaired by the Chief Credit Officer and includes the Loan Review Manager and Special Credits Manager, as well as senior credit officers, division managers and group executives, as applicable. These evaluations are performed in conjunction with the quarterly allowance for loan loss process.
Applicable loans that were included in the previous quarter's review are reevaluated and if their values are materially different from the prior quarter evaluation, the underlying information (loan balance and collateral value) are compared. Material differences are evaluated for reasonableness and discussions are held between the relationship manager and their division manager to understand the difference and determine if any adjustment is necessary.
The inputs are developed and substantiated on a quarterly basis, based on current borrower developments, market conditions and collateral values. The following methods are used to value impaired loans:
| |
• | The fair value of the collateral, which may take the form of real estate or personal property, is based on internal estimates, field observations, assessments provided by third-party appraisers and other valuation models. The Company performs or reaffirms valuations of collateral-dependent impaired loans at least annually. Adjustments are made if management believes that more recent information is available and relevant with respect to the fair value of the collateral. |
| |
• | The present value of the expected future cash flows of the loans is used for measurement of non collateral-dependent loans to test for impairment. The Company estimates the future cash flows and then discounts those using the contractual interest rate. |
WASHINGTON FEDERAL, INC. AND SUBSIDIARIES
NOTES TO THE CONSOLIDATED FINANCIAL STATEMENTS
YEARS ENDED SEPTEMBER 30, 2019, 2018 AND 2017
Real estate owned - When a loan is reclassified from loan status to real estate owned due to the Company taking possession of the collateral, a Special Credits officer, along with the Special Credits Manager, obtains a valuation, which may include appraisals or third-party price options, which is used to establish the fair value of the underlying collateral. The determined fair value, less selling costs, becomes the carrying value of the REO asset.
Fair Values of Financial Instruments
U. S. GAAP requires disclosure of fair value information about financial instruments, whether or not recognized on the statement of financial condition, for which it is practicable to estimate those values. Certain financial instruments and all non-financial instruments are excluded from the disclosure requirements. Accordingly, the aggregate fair value estimates presented do not reflect the underlying fair value of the Company. Although management is not aware of any factors that would materially affect the estimated fair value amounts presented below, such amounts have not been comprehensively revalued for purposes of these financial statements since the dates shown, and therefore, estimates of fair value subsequent to those dates may differ significantly from the amounts presented below.
WASHINGTON FEDERAL, INC. AND SUBSIDIARIES
NOTES TO THE CONSOLIDATED FINANCIAL STATEMENTS
YEARS ENDED SEPTEMBER 30, 2019, 2018 AND 2017
|
| | | | | | | | | | | | | | |
| | September 30, 2019 | | September 30, 2018 |
| Level | Carrying Amount | Estimated Fair Value | | Carrying Amount | Estimated Fair Value |
| | (In thousands) |
Financial assets | | | | | | |
Cash and cash equivalents | 1 | $ | 419,158 |
| $ | 419,158 |
| | $ | 268,650 |
| $ | 268,650 |
|
Available-for-sale securities: | |
|
| |
| |
Equity securities | 1 | — |
| — |
| | 488 |
| 488 |
|
U.S. government and agency securities | 2 | 270,778 |
| 270,778 |
| | 207,293 |
| 207,293 |
|
Municipal bonds | 2 | 22,642 |
| 22,642 |
| | 22,978 |
| 22,978 |
|
Corporate debt securities | 2 | 209,763 |
| 209,763 |
| | 184,695 |
| 184,695 |
|
Mortgage-backed securities | |
|
| |
|
|
Agency pass-through certificates | 2 | 982,559 |
| 982,559 |
| | 896,041 |
| 896,041 |
|
Commercial MBS | 2 | — |
| — |
| | 3,462 |
| 3,462 |
|
Total available-for-sale securities | | 1,485,742 |
| 1,485,742 |
| | 1,314,957 |
| 1,314,957 |
|
Held-to-maturity securities: | | | | | | |
Mortgage-backed securities | | | | | | |
Agency pass-through certificates | 2 | 1,428,480 |
| 1,448,088 |
| | 1,610,420 |
| 1,533,742 |
|
Commercial MBS | | 15,000 |
| 15,007 |
| | 15,000 |
| 15,028 |
|
Total held-to-maturity securities | | 1,443,480 |
| 1,463,095 |
| | 1,625,420 |
| 1,548,770 |
|
| | | | | | |
Loans receivable | 3 | 11,930,575 |
| 12,617,600 |
| | 11,477,081 |
| 11,556,326 |
|
FHLB and FRB stock | 2 | 123,990 |
| 123,990 |
| | 127,190 |
| 127,190 |
|
Other assets - client swap program hedges | 2 | 20,381 |
| 20,381 |
| | 12,731 |
| 12,731 |
|
Other assets - commercial loan fair value hedges | 2 | — |
| — |
| | 3,857 |
| 3,857 |
|
Other assets - mortgage loan fair value hedges | 2 | 1,608 |
| 1,608 |
| | — |
| — |
|
Other assets - borrowings cash flow hedges | 2 | — |
| — |
| | 22,250 |
| 22,250 |
|
| | | | | | |
Financial liabilities | | | | | | |
Time deposits | 2 | 4,906,963 |
| 4,937,847 |
| | 4,804,803 |
| 4,779,040 |
|
FHLB advances and other borrowings | 2 | 2,250,000 |
| 2,282,887 |
| | 2,330,000 |
| 2,316,964 |
|
Other liabilities - client swap program hedges | 2 | 20,381 |
| 20,381 |
| | 12,731 |
| 12,731 |
|
Other liabilities - commercial loan fair value hedges | 2 | 4,288 |
| 4,288 |
| | — |
| — |
|
Other liabilities - borrowings cash flow hedges | 2 | 7,877 |
| 7,877 |
| | — |
| — |
|
The following methods and assumptions were used to estimate the fair value of financial instruments:
Cash and cash equivalents – The carrying amount of these items is a reasonable estimate of their fair value.
Available-for-sale securities and held-to-maturity securities – Securities at fair value are primarily priced using model pricing based on the securities' relationship to other benchmark quoted prices as provided by an independent third party, and are considered a Level 2 input method. Equity securities which are exchange traded are considered a Level 1 input method.
Loans receivable – Fair values are estimated first by stratifying the portfolios of loans with similar financial characteristics. Loans are segregated by type such as multi-family real estate, residential mortgage, construction, commercial, consumer and land loans. Each loan category is further segmented into fixed- and adjustable-rate interest terms. For residential mortgages and multi-family
WASHINGTON FEDERAL, INC. AND SUBSIDIARIES
NOTES TO THE CONSOLIDATED FINANCIAL STATEMENTS
YEARS ENDED SEPTEMBER 30, 2019, 2018 AND 2017
loans, the bank determined that its best exit price was by securitization. MBS benchmark prices are used as a base price, with further loan level pricing adjustments made based on individual loan characteristics such as FICO score, LTV, Property Type and occupancy. For all other loan categories an estimate of fair value is then calculated based on discounted cash flows using a discount rate offered and observed in the market on similar products, plus an adjustment for liquidity to reflect the non-homogeneous nature of the loans, as well as an annual loss rate based on historical losses to arrive at an estimated exit price fair value. Fair value for impaired loans is also based on recent appraisals or estimated cash flows discounted using rates commensurate with risk associated with the estimated cash flows. Assumptions regarding credit risk, cash flows and discount rates are judgmentally determined using available market information and specific borrower information.
FHLB and FRB stock – The fair value is based upon the par value of the stock which equates to its carrying value.
Time deposits – The fair value of fixed-maturity time deposits is estimated by discounting the estimated future cash flows using the rates currently offered for deposits with similar remaining maturities.
FHLB advances – The fair value of FHLB advances and other borrowings is estimated by discounting the estimated future cash flows using rates currently available to the Company for debt with similar remaining maturities.
Interest rate swaps – The Bank offers interest rate swaps to its variable rate borrowers who want to manage their interest rate risk. At the same time, the Bank enters into the opposite trade with a counterparty to offset its interest rate risk. The Bank also uses interest rate swaps for various fair value hedges and cash flow hedges. The fair value of interest rate swaps are estimated by a third-party pricing service using a discounted cash flow technique.
NOTE G - DERIVATIVES AND HEDGING ACTIVITIES
On October 1, 2018, the Company early adopted ASU 2017-12, Targeted Improvements to Accounting for Hedge Activities. This standard primarily impacts the accounting for derivatives designated as fair value and cash flow accounting hedges.
The following tables present the fair value, notional amount and balance sheet classification of derivative assets and liabilities at September 30, 2019 and September 30, 2018.
|
| | | | | | | | | | | | | | | |
September 30, 2019 | Derivative Assets | | Derivative Liabilities |
| Balance Sheet Location | Notional | Fair Value | | Balance Sheet Location | Notional | Fair Value |
| (In thousands) | | (In thousands) |
Client swap program hedges | Other assets | $ | 425,607 |
| $ | 20,381 |
| | Other liabilities | $ | 425,607 |
| $ | 20,381 |
|
Commercial loan fair value hedges | Other assets | — |
| — |
| | Other liabilities | 95,645 |
| 4,288 |
|
Mortgage loan fair value hedges | Other assets | 200,000 |
| 1,608 |
| | Other liabilities | — |
| — |
|
Borrowings cash flow hedges | Other assets | — |
| — |
| | Other liabilities | 700,000 |
| 7,877 |
|
| | $ | 625,607 |
| $ | 21,989 |
| | | $ | 1,221,252 |
| $ | 32,546 |
|
|
| | | | | | | | | | | | | | | |
September 30, 2018 | Derivative Assets | | Derivative Liabilities |
Interest rate contract purpose | Balance Sheet Location | Notional | Fair Value | | Balance Sheet Location | Notional | Fair Value |
| (In thousands) | | (In thousands) |
Client swap program hedges | Other assets | $ | 395,396 |
| $ | 12,731 |
| | Other liabilities | $ | 395,396 |
| $ | 12,731 |
|
Commercial loan fair value hedges | Other assets | 97,927 |
| 3,857 |
| | Other liabilities | — |
| — |
|
Borrowings cash flow hedges | Other assets | 700,000 |
| 22,250 |
| | Other liabilities | — |
| — |
|
| | $ | 1,193,323 |
| $ | 38,838 |
| | | $ | 395,396 |
| $ | 12,731 |
|
WASHINGTON FEDERAL, INC. AND SUBSIDIARIES
NOTES TO THE CONSOLIDATED FINANCIAL STATEMENTS
YEARS ENDED SEPTEMBER 30, 2019, 2018 AND 2017
The Company enters into interest rate swaps to hedge interest rate risk. These arrangements include hedges of individual fixed rate commercial loans and also hedges of a specified portion of pools of prepayable fixed rate mortgage loans under the "last of layer" method. These relationships qualify as fair value hedges under FASB ASC 815, Derivatives and Hedging ("ASC 815"), which provides for offsetting of the recognition of gains and losses of the respective interest rate swap and the hedged items. Gains and losses on interest rate swaps designated in these hedge relationships, along with the offsetting gains and losses on the hedged items attributable to the hedged risk, are recognized in current earnings within the same income statement line item.
Upon electing to apply ASC 815 fair value hedge accounting, the carrying value of the hedged items are adjusted to reflect the cumulative impact of changes in fair value attributable to the hedged risk. The hedge basis adjustment remains with each hedged item until the hedged item is de-recognized from the balance sheet. The following table presents the impact of fair value hedge accounting on the carrying value of the hedged items at September 30, 2019.
|
| | | | | | |
(In thousands) | September 30, 2019 |
Balance sheet line item in which hedged item is recorded | Carrying value of hedged items | Cumulative gain (loss) fair value hedge adjustment included in carrying amount of hedged items |
Loans receivable (1) (2) | $ | 1,612,208 |
| $ | (2,680 | ) |
| $ | 1,612,208 |
| $ | (2,680 | ) |
(1) Includes the amortized cost basis of the closed mortgage loan portfolios used to designate the hedging relationships in which the hedged items are the last layer expected to be remaining at the end of the hedging relationships. At September 30, 2019, the amortized cost basis of the closed loan portfolios used in the hedging relationships was $1,520,647,000, the cumulative basis adjustment associated with the hedging relationships was $1,608,000, and the amount of the designated hedged items was $200,000,000.
(2) Includes the amortized cost basis of commercial loans designated in fair value hedging relationships. At September 30, 2019, the amortized cost basis of the hedged commercial loans was $91,561,000 and the cumulative basis adjustment associated with the hedging relationships was $(4,288,000).
The Company has entered into interest rate swaps to convert certain short-term borrowings to fixed rate payments. The primary purpose of these hedges is to mitigate the risk of changes in future cash flows resulting from increasing interest rates. For qualifying cash flow hedges under ASC 815, gains and losses on the interest rate swaps are recorded in accumulated other comprehensive income ("AOCI") and then reclassified into earnings in the same period the hedged cash flows affect earnings and within the same income statement line item as the hedged cash flows. As of September 30, 2019, the maturities for hedges of adjustable rate borrowings ranged from less than one year to seven years, with the weighted average being 2.6 years.
The following table presents the impact of derivative instruments (cash flow hedges on borrowings) on AOCI for the periods presented.
|
| | | |
(In thousands) | Twelve Months Ended September 30, |
Amount of gain/(loss) recognized in AOCI on derivatives in cash flow hedging relationships | 2019 |
Interest rate contracts: | |
Pay fixed/receive floating swaps on cash flow hedges of borrowings | $ | (28,519 | ) |
Total pre-tax gain/(loss) recognized in AOCI | $ | (28,519 | ) |
WASHINGTON FEDERAL, INC. AND SUBSIDIARIES
NOTES TO THE CONSOLIDATED FINANCIAL STATEMENTS
YEARS ENDED SEPTEMBER 30, 2019, 2018 AND 2017
The following table presents the gains/(losses) on derivative instruments in fair value and cash flow accounting hedging relationships under ASC 815 for the period presented.
|
| | | | | | |
Twelve Months Ended September 30, 2019 | Interest income on loans receivable | Interest expense on FHLB advances |
| (In thousands) |
Interest income/(expense), including the effects of fair value and cash flow hedges | $ | 568,096 |
| $ | (68,190 | ) |
| | |
Gain/(loss) on fair value hedging relationships: | | |
Interest rate contracts | | |
Amounts related to interest settlements on derivatives | $ | 128 |
| |
Recognized on derivatives | (6,504 | ) | |
Recognized on hedged items | 6,479 |
| |
Net income/(expense) recognized on fair value hedges | $ | 103 |
| |
| | |
Gain/(loss) on cash flow hedging relationships: | | |
Interest rate contracts | | |
Amounts related to interest settlements on derivatives | | $ | (2,823 | ) |
Amount of derivative gain/(loss) reclassified from AOCI into interest income/expense | | — |
|
Net income/(expense) recognized on cash flow hedges | | $ | (2,823 | ) |
The Company periodically enters into certain interest rate swap agreements in order to provide commercial loan customers the ability to convert from variable to fixed interest rate payments, while the Company retains a variable rate loan. Under these agreements, the Company enters into a variable rate loan agreement and a swap agreement with the client. The swap agreement effectively converts the client’s variable rate loan into a fixed rate. The Company enters into a corresponding swap agreement with a third party in order to offset its exposure on the variable and fixed components of the client's swap agreement. The interest rate swaps are derivatives under ASC 815, with changes in fair value recorded in earnings. There was no net impact to the statement of operations for the years ended September 30, 2019 and 2018 as the changes in fair value of the receive fixed swap and pay fixed swap offset each other.
The following table presents the impact of derivative instruments (client swap program) that are not designated in accounting hedges under ASC 815 for the periods presented.
|
| | | | |
(In thousands) | | Twelve Months Ended September 30, |
Derivative instruments | Classification of gain/(loss) recognized in income on derivative instrument | 2019 |
Interest rate contracts: | | |
Pay fixed/receive floating swap | Other noninterest income | $ | (33,112 | ) |
Receive fixed/pay floating swap | Other noninterest income | 33,112 |
|
| | $ | — |
|
NOTE H – Revenue from Contracts with Customers
On October 1, 2018, the Company adopted ASU No. 2014-09, Revenue from Contracts with Customers ("ASC 606"). Since net interest income on financial assets and liabilities is excluded from this guidance, a significant majority of our revenues are not subject to the new guidance.
WASHINGTON FEDERAL, INC. AND SUBSIDIARIES
NOTES TO THE CONSOLIDATED FINANCIAL STATEMENTS
YEARS ENDED SEPTEMBER 30, 2019, 2018 AND 2017
Revenue streams that are within the scope of the new guidance are presented within noninterest income and are, in general, recognized as revenue at the same time the Company's obligation to the customer is satisfied. Most of the Company's customer contracts that are within the scope of the new guidance are cancelable by either party without penalty and are short-term in nature. These sources of revenue include depositor and other consumer and business banking fees, commission income, as well as debit and credit card interchange fees. For the year ended 2019, in scope revenue streams represented approximately 5.0% of our total revenues. As this standard is immaterial to our consolidated financial statements, the Company has omitted certain disclosures in ASC 606, including the disaggregation of revenue table. Sources of noninterest income within the scope of the new guidance include the following:
Deposit related and other service charges (recognized in Deposit Fee Income): The Company's deposit accounts are governed by standardized contracts customary in the industry. Revenues are earned at a point in time or over time (monthly) from account maintenance fees and charges for specific transactions such as wire transfers, stop payment orders, overdrafts, debit card replacements, check orders and cashier’s checks. The Company’s performance obligation related to each of these fees is generally satisfied, and the related revenue recognized, at the time the service is provided (point in time or monthly). The Company is principal in each of these contracts.
Debit and credit card interchange fees (recognized in Deposit Fee Income): The Company receives interchange fees from the debit card and credit card payment networks based on transactions involving debit or credit cards issued by the Company, generally measured as a percentage of the underlying transaction. Interchange fees from debit and credit card transactions are recognized as the transaction processing services are provided by the network. The Company acts as an agent in the card payment network arrangement so the interchange fees are recorded net of any expenses paid to the principal (the card payment networks in this case).
Insurance agency commissions (recognized in Other Income): WAFD Insurance Group, Inc. is a wholly-owned subsidiary of Washington Federal, N.A. that operates as an insurance agency, selling and marketing property and casualty insurance policies for a small number of high-quality insurance carriers. WAFD Insurance Group, Inc. earns revenue in the form of commissions paid by the insurance carriers for policies that have been sold. In addition to the origination commission, WAFD Insurance Group, Inc. may also receive contingent incentive fees based on the volume of business generated for the insurance carrier and based on policy renewal rates.
NOTE I - INTEREST RECEIVABLE
The following table provides a summary of interest receivable by interest earning asset type.
|
| | | | | | | |
| September 30, 2019 | | September 30, 2018 |
| (In thousands) |
Loans receivable | $ | 41,429 |
| | $ | 39,176 |
|
Mortgage-backed securities | 6,107 |
| | 6,404 |
|
Investment securities | 1,321 |
| | 1,715 |
|
| $ | 48,857 |
| | $ | 47,295 |
|
NOTE J - PREMISES AND EQUIPMENT
The following table provides a summary of premises and equipment by asset type.
|
| | | | | | | | |
| |
| September 30, 2019 | September 30, 2018 |
| Estimated Useful Life | (In thousands) |
Land | — |
| $ | 117,431 |
| $ | 110,251 |
|
Buildings | 25 - 40 |
| 165,088 |
| 156,803 |
|
Leasehold improvements | 7 - 15 |
| 22,765 |
| 22,887 |
|
Furniture, software and equipment | 2 - 10 |
| 138,553 |
| 126,979 |
|
| | 443,837 |
| 416,920 |
|
Less accumulated depreciation and amortization | | (169,822 | ) | (148,925 | ) |
| | $ | 274,015 |
| $ | 267,995 |
|
The Company has non-cancelable operating leases for certain branch offices. Future minimum net rental commitments for all non-cancelable leases, including maintenance and associated costs, are as follows: $5,838,000 for 2020, $5,246,000 for 2021, $4,698,000 for 2022, $4,302,000 for 2023, $3,596,000 for 2024 and $10,531,000 thereafter.
Rental expense, including amounts paid under month-to-month cancelable leases, amounted to $6,455,000, $6,477,000 and $5,500,000 in 2019, 2018, and 2017, respectively.
NOTE K - CUSTOMER ACCOUNTS
The following tables provide the composition of the Company's customer accounts, including time deposits.
|
| | | | | | | | | | | | | | | | | | | |
| September 30, 2019 | | September 30, 2018 |
| Deposit Account Balance | | As a % of Total Deposits | | Weighted
Average Rate | | Deposit Account Balance | | As a % of Total Deposits | | Weighted
Average Rate |
($ in thousands) | | | | | | | | | | | |
Non-interest checking | $ | 1,621,343 |
| | 13.5 | % | | — | % | | $ | 1,401,226 |
| | 12.4 | % | | — | % |
Interest checking | 1,984,576 |
| | 16.6 |
| | 0.61 |
| | 1,778,520 |
| | 15.6 |
| | 0.50 |
|
Savings | 753,574 |
| | 6.3 |
| | 0.13 |
| | 836,501 |
| | 7.3 |
| | 0.11 |
|
Money market | 2,724,308 |
| | 22.7 |
| | 0.82 |
| | 2,566,096 |
| | 22.5 |
| | 0.65 |
|
Time deposits | 4,906,963 |
| | 40.9 |
| | 1.91 |
| | 4,804,803 |
| | 42.2 |
| | 1.50 |
|
Total | $ | 11,990,764 |
| | 100 | % | | 1.08 | % | | $ | 11,387,146 |
| | 100 | % | | 0.87 | % |
WASHINGTON FEDERAL, INC. AND SUBSIDIARIES
NOTES TO THE CONSOLIDATED FINANCIAL STATEMENTS
YEARS ENDED SEPTEMBER 30, 2019, 2018 AND 2017
|
| | | | | | |
Time deposits by rate band are as follows: | September 30, 2019 | September 30, 2018 |
| (In thousands) |
Time deposit accounts | | |
Less than 1.00% | $ | 21,281 |
| $ | 629,589 |
|
1.00% to 1.99% | 3,588,689 |
| 3,761,543 |
|
2.00% to 2.99% | 1,294,889 |
| 413,671 |
|
3.00% to 3.99% | 2,104 |
| — |
|
Total time deposits | $ | 4,906,963 |
| $ | 4,804,803 |
|
| | |
Time deposits by maturity band are as follows: | September 30, 2019 | September 30, 2018 |
| (In thousands) |
Within 1 year | $ | 3,489,839 |
| $ | 2,800,978 |
|
1 to 2 years | 925,170 |
| 1,335,242 |
|
2 to 3 years | 294,990 |
| 296,238 |
|
Over 3 years | 196,964 |
| 372,345 |
|
| $ | 4,906,963 |
| $ | 4,804,803 |
|
Customer accounts over $250,000 totaled $3,609,961,000 as of September 30, 2019, and $3,088,231,000 as of September 30, 2018.
Interest expense on customer accounts consisted of the following:
|
| | | | | | | | | |
Year ended September 30, | 2019 | 2018 | 2017 |
| (In thousands) |
Checking accounts | $ | 12,499 |
| $ | 6,072 |
| $ | 2,721 |
|
Savings accounts | 980 |
| 920 |
| 978 |
|
Money market accounts | 21,967 |
| 7,788 |
| 3,592 |
|
Time deposit accounts | 87,665 |
| 58,468 |
| 45,256 |
|
| 123,111 |
| 73,248 |
| 52,547 |
|
Less early withdrawal penalties | (895 | ) | (756 | ) | (524 | ) |
| $ | 122,216 |
| $ | 72,492 |
| $ | 52,023 |
|
| | | |
Weighted average interest rate at end of year | 1.08 | % | 0.87 | % | 0.54 | % |
Weighted daily average interest rate during the year | 1.05 | % | 0.65 | % | 0.49 | % |
NOTE L - FHLB ADVANCES AND OTHER BORROWINGS
The table below shows the maturity dates of outstanding FHLB advances.
|
| | | | | | |
| September 30, 2019 | September 30, 2018 |
| (In thousands) |
FHLB advances | | |
Within 1 year | $ | 950,000 |
| $ | 1,680,000 |
|
1 to 3 years | 750,000 |
| 300,000 |
|
3 to 5 years | 400,000 |
| 200,000 |
|
More than 5 years | 150,000 |
| 150,000 |
|
| $ | 2,250,000 |
| $ | 2,330,000 |
|
WASHINGTON FEDERAL, INC. AND SUBSIDIARIES
NOTES TO THE CONSOLIDATED FINANCIAL STATEMENTS
YEARS ENDED SEPTEMBER 30, 2019, 2018 AND 2017
As of September 30, 2019, there is $100,000,000 of FHLB advances that are callable as of August 7, 2020 and quarterly thereafter.
Financial information pertaining to the weighted-average cost and the amount of FHLB advances were as follows.
|
| | | | | | | | | |
| 2019 | 2018 | 2017 |
| (In thousands) |
Weighted average interest rate, including cash flow hedges, at end of year | 2.49 | % | 2.66 | % | 2.80 | % |
Weighted daily average interest rate, including cash flow hedges, during the year | 2.69 | % | 2.62 | % | 3.00 | % |
Daily average of FHLB advances during the year | $ | 2,533,890 |
| $ | 2,384,795 |
| $ | 2,167,986 |
|
Maximum amount of FHLB advances at any month end | $ | 2,665,000 |
| $ | 2,620,000 |
| $ | 2,350,000 |
|
Interest expense during the year (including swap interest income and expense) | $ | 68,190 |
| $ | 62,452 |
| $ | 64,969 |
|
The Bank has a credit line with the Federal Home Loan Bank of Des Moines ("FHLB") equal to 45% of total assets, subject to collateral requirements.
The Bank has entered into borrowing agreements with the FHLB to borrow funds under a short-term floating rate cash management advance program and a fixed-rate term loan agreements. All borrowings are secured by stock of the FHLB, deposits with the FHLB and a blanket pledge of qualifying loans receivable as provided in the agreements with the FHLB.
NOTE M - INCOME TAXES
On December 22, 2017, the U.S. Government enacted significant new tax legislation that reduces the corporate federal income tax rate from a maximum of 35% to a flat 21% rate. The corporate tax rate reduction was effective January 1, 2018. Because the Company has a fiscal year end of September 30, the reduced corporate tax rate resulted in the application of a blended federal statutory tax rate of 24.53% for its fiscal year 2018 and then 21% thereafter.
Under generally accepted accounting principles, the Company uses the asset and liability method of accounting for income taxes. Under this method, deferred tax assets and liabilities are recognized for the future tax consequences attributable to differences between the financial statement carrying amounts of existing assets and liabilities and their respective tax bases. Deferred tax assets and liabilities are measured using enacted tax rates expected to apply to taxable income in the years in which those temporary differences are expected to be recovered or settled.
The table below provides a summary of the Company's tax assets and liabilities, including deferred tax assets and deferred tax liabilities by major source. Deferred tax balances represent temporary differences between the financial statement and corresponding tax treatment of income, gains, losses, deductions or credits.
WASHINGTON FEDERAL, INC. AND SUBSIDIARIES
NOTES TO THE CONSOLIDATED FINANCIAL STATEMENTS
YEARS ENDED SEPTEMBER 30, 2019, 2018 AND 2017
|
| | | | | | |
| September 30, 2019 | September 30, 2018 |
| (In thousands) |
Deferred tax assets | | |
Loan loss reserves | $ | 31,494 |
| $ | 31,055 |
|
REO reserves | 255 |
| 518 |
|
Non-accrual loan interest | 891 |
| 877 |
|
Federal and state tax credits | 537 |
| 1,074 |
|
Deferred compensation | 3,022 |
| 3,165 |
|
Stock based compensation | 1,876 |
| 1,677 |
|
Other | 2,081 |
| 1,747 |
|
Total deferred tax assets | 40,156 |
| 40,113 |
|
Deferred tax liabilities | | |
FHLB stock dividends | 14,478 |
| 14,941 |
|
Valuation adjustment on available-for-sale securities and cash flow hedges | 4,503 |
| 2,442 |
|
Loan origination fees and costs | 8,385 |
| 9,285 |
|
Premises and equipment | 25,399 |
| 23,429 |
|
Other | 2,851 |
| 1,828 |
|
Total deferred tax liabilities | 55,616 |
| 51,925 |
|
Net deferred tax asset (liability) | (15,460 | ) | (11,812 | ) |
Current tax asset (liability) | 10,356 |
| 13,616 |
|
Net tax asset (liability) | $ | (5,104 | ) | $ | 1,804 |
|
The table below presents a reconciliation of the statutory federal income tax rate to the Company's effective income tax rate.
|
| | | | | | |
Year ended September 30, | 2019 | 2018 | 2017 |
Statutory income tax rate | 21 | % | 25 | % | 35 | % |
State income tax | 2 |
| 2 |
| 1 |
|
Impact of change in Federal income tax rate | — |
| (2 | ) | — |
|
Other differences | (3 | ) | (4 | ) | (4 | ) |
Effective income tax rate | 20 | % | 21 | % | 32 | % |
WASHINGTON FEDERAL, INC. AND SUBSIDIARIES
NOTES TO THE CONSOLIDATED FINANCIAL STATEMENTS
YEARS ENDED SEPTEMBER 30, 2019, 2018 AND 2017
The following table summarizes the Company's income tax expense (benefit) for the respective periods.
|
| | | | | | | | | |
Year ended September 30, | 2019 | 2018 | 2017 |
| (In thousands) |
Federal: | | | |
Current | $ | 46,376 |
| $ | 40,314 |
| $ | 87,804 |
|
Deferred | 1,916 |
| 8,952 |
| (10,142 | ) |
| 48,292 |
| 49,266 |
| 77,662 |
|
State: | | | |
Current | $ | 4,557 |
| $ | 4,243 |
| $ | 4,991 |
|
Deferred | (330 | ) | (116 | ) | 31 |
|
| 4,227 |
| 4,127 |
| 5,022 |
|
Total | | | |
Current | 50,933 |
| 44,557 |
| 92,795 |
|
Deferred | 1,586 |
| 8,836 |
| (10,111 | ) |
| $ | 52,519 |
| $ | 53,393 |
| $ | 82,684 |
|
Based on current information, the Company does not expect that changes in the amount of unrecognized tax benefits over the next 12 months will have a significant impact on its results of operations or financial position. The Company's liability for uncertain tax positions was $0 as of September 30, 2019, and $2,679,000 as of September 30, 2018. The reduction in liability for uncertain tax positions is due to the resolution of a previously unrecognized tax benefit. Changes in amounts of uncertain tax positions affect the Company's effective tax rate. The Company records interest and penalties (if applicable) related to uncertain tax positions in income tax expense.
The Company's federal income tax returns are open and subject to potential examination by the IRS for fiscal years 2016 and later. The Company currently has some tax refund claims for earlier years pending before and subject to examination by the IRS, but such examination is only limited to the refund claims and does not cover other matters on the corresponding returns, which are beyond the statutory period of limitation for general IRS audit. State income tax returns are generally subject to examination for a period of three to five years after filing of the respective return. The state impact of any federal changes remains subject to examination by various states for a period of up to two years after formal notification to the states.
NOTE N - 401(k) PLAN
The Company maintains a 401(k) Plan (the "Plan") for the benefit of its employees. Company contributions are made annually as approved by the Board of Directors. Such amounts are not in excess of amounts permitted by the Employee Retirement Income Security Act of 1974.
Plan participants may make voluntary after-tax contributions of their considered earnings as defined by the Plan. In addition, participants may make pre-tax contributions up to the statutory limits through the 401(k) provisions of the Plan. The annual addition from contributions to an individual participant's account in this Plan cannot exceed the lesser of 100% of base salary or $55,000.
Prior to January 1, 2018, new employees were eligible to participate in the Plan upon completion of one year of service. A “year of service” was defined as a 12-month period in which the eligible employee worked at least 1,000 hours of service and the first eligibility service period started on the first day of employment. Effective January 1, 2018, new employees become eligible to participate in the Plan and make employee contributions after completing one month of service.
The Plan provides for a guaranteed safe harbor matching contribution equal to 100% of the first 4% of compensation that employees contribute to their account and this amount is immediately vested. The safe harbor match is not subject to the six year vesting schedule of the profit sharing contribution. This provides plan participants more investment flexibility. The Company anticipates
WASHINGTON FEDERAL, INC. AND SUBSIDIARIES
NOTES TO THE CONSOLIDATED FINANCIAL STATEMENTS
YEARS ENDED SEPTEMBER 30, 2019, 2018 AND 2017
that all eligible employees, regardless of personal plan participation, will continue to receive an annual discretionary profit sharing contribution from the Company, now capped at 7% of eligible compensation with this change.
Effective February 1, 2019, the Plan's third-party administrator was transitioned from The Newport Group to Fidelity Investments. This transition resulted in a change in plan name from Washington Federal 401(k) and Employee Stock Ownership Plan and Trust to Washington Federal 401(k) Plan. As part of this transition, the Plan now provides participants a Roth deferral option and in-plan conversion of participant's existing Roth accounts and eliminates the Plan's ESOP component.
Company contributions to the Plan amounted to $6,920,000, $5,910,000 and $6,433,000 for the years ended 2019, 2018 and 2017, respectively.
NOTE O - STOCK AWARD PLANS
The Company's stock based compensation plan ("2011 Incentive Plan") provides for grants of stock options and restricted stock. Shareholders authorized 5,000,000 shares of common stock to be reserved pursuant to the 2011 Incentive Plan and 2,856,502 shares remain available for issuance as of September 30, 2019.
When applicable, stock options are granted with an exercise price equal to the market price of the Company's stock at the date of grant; those option awards generally vest based on three to five years of continuous service and have 10-year contractual terms. The Company's policy is to issue new shares upon option exercises. The fair value of stock options granted is estimated on the date of grant using the Black-Scholes option-pricing model. Additionally, there may be other factors that would otherwise have a significant effect on the value of employee stock options granted but are not considered by the model. Expected volatility is based on the historical volatility of the Company's stock. The risk-free interest rate is based on the U.S. Treasury yield curve that is in effect at the time of grant with a remaining term equal to the options' expected life. The expected term represents the period of time that options granted are expected to be outstanding.
Stock Option Awards:
There were 356,343 stock options granted under the 2011 Incentive Plan during 2019 and no stock options granted in 2018 and 2017.
A summary of stock option activity and changes during the year are as follows.
|
| | | | | | | | | |
Options | Shares | Weighted
Average
Exercise
Price | Weighted
Average
Remaining
Contractual
Term (Years) | Aggregate
Intrinsic
Value
(In thousands) |
Outstanding at September 30, 2018 | 51,060 |
| $ | 15.25 |
| 2 | $855 |
Granted | 356,343 |
| 28.16 |
| | |
Exercised | (22,975 | ) | 12.99 |
| | |
Forfeited | (64,141 | ) | 27.96 |
| | |
Outstanding at September 30, 2019 | 320,287 |
| $ | 27.21 |
| 8 | $ | 3,136 |
|
Exercisable at at September 30, 2019 | 27,620 |
| $ | 17.17 |
| 1.4 | $ | 547 |
|
The table below presents other information regarding stock options.
WASHINGTON FEDERAL, INC. AND SUBSIDIARIES
NOTES TO THE CONSOLIDATED FINANCIAL STATEMENTS
YEARS ENDED SEPTEMBER 30, 2019, 2018 AND 2017
|
| | | | | | | | | |
Year ended September 30, | 2019 | 2018 | 2017 |
| (In thousands, except grant date fair value per stock option) |
Compensation cost for stock options | $ | 521 |
| $ | — |
| $ | — |
|
Weighted average grant date fair value per stock option | 5.21 |
| 3.15 |
| 3.06 |
|
Total intrinsic value of options exercised | 414 |
| 908 |
| 2,605 |
|
Grant date fair value of options exercised | 51 |
| 285 |
| 1,328 |
|
Cash received from option exercises | 298 |
| 1,338 |
| 7,238 |
|
The following is a summary of activity related to unvested stock options.
|
| | | | | | | | | | | | | | | | | |
Year ended September 30, | 2019 | | 2018 | | 2017 |
Non-vested Stock Options | Options Outstanding | Weighted
Average
Grant Date
Fair Value | | Options Outstanding | Weighted
Average
Grant Date
Fair Value | | Options Outstanding | Weighted
Average
Grant Date
Fair Value |
Outstanding at beginning of period | — |
| $ | — |
| | — |
| $ | — |
| | — |
| $ | — |
|
Granted | 356,343 |
| 5.33 |
| | — |
| — |
| | — |
| — |
|
Vested | — |
| — |
| | — |
| — |
| | — |
| — |
|
Forfeited | (63,176 | ) | 5.33 |
| | — |
| — |
| | — |
| — |
|
Outstanding at end of period | 293,167 |
| $ | 5.33 |
| | — |
| $ | — |
| | — |
| $ | — |
|
As of September 30, 2019, there was $1,042,000 of unrecognized compensation cost related to stock options.
Restricted Stock Awards:
The Company grants shares of restricted stock pursuant to the 2011 Incentive Plan. The restricted stock grants are subject to a service condition and vest over a period of one to seven years.
Certain grants of restricted stock to executive officers are also subject to additional market and performance conditions based upon meeting certain total shareholder return targets pre-established by the Board. The Company had a total of 435,838 shares of restricted stock outstanding as of September 30, 2019, with a total grant date fair value of $10,342,436.
The following table summarizes information about unvested restricted stock activity.
|
| | | | | | | | | | | | | | | | | |
Year ended September 30, | 2019 | | 2018 | | 2017 |
Non-vested Restricted Stock | Outstanding | Weighted
Average
Fair Value | | Outstanding | Weighted
Average
Fair Value | | Outstanding | Weighted
Average
Fair Value |
Outstanding at beginning of period | 460,999 |
| $ | 22.52 |
| | 466,681 |
| $ | 18.56 |
| | 490,363 |
| $ | 16.00 |
|
Granted | 249,272 |
| 21.41 |
| | 205,100 |
| $ | 26.11 |
| | 238,450 |
| 18.89 |
|
Vested | (159,103 | ) | 26.09 |
| | (198,620 | ) | 16.65 |
| | (116,878 | ) | 20.95 |
|
Forfeited | (115,330 | ) | 10.61 |
| | (12,162 | ) | 27.00 |
| | (145,254 | ) | 8.56 |
|
Outstanding at end of period | 435,838 |
| $ | 23.73 |
| | 460,999 |
| $ | 22.52 |
| | 466,681 |
| $ | 18.56 |
|
WASHINGTON FEDERAL, INC. AND SUBSIDIARIES
NOTES TO THE CONSOLIDATED FINANCIAL STATEMENTS
YEARS ENDED SEPTEMBER 30, 2019, 2018 AND 2017
Compensation expense related to restricted stock awards was $4,188,000, $4,259,000, and $3,659,000 for the years ended 2019, 2018 and 2017, respectively.
NOTE P - SHAREHOLDERS' EQUITY
The Company and the Bank are subject to various regulatory capital requirements. Quantitative measures established by regulation to ensure capital adequacy require the Company and the Bank to maintain minimum amounts and ratios (set forth in the following table) of Common Equity Tier 1, Tier 1 and Total capital to risk weighted assets (as defined in the regulations) and Tier 1 capital to average assets (as defined in the regulations). Failure to meet minimum capital requirements can initiate certain mandatory and possibly additional discretionary action by regulators that, if undertaken, could have a direct material effect on the Company's financial statements. The Company and the Bank are also subject to certain restrictions on the amount of dividends that they may declare without prior regulatory approval.
As of September 30, 2019, and 2018, the Company and the Bank met all capital adequacy requirements to which they are subject, and the OCC categorized the Bank as well capitalized under the regulatory framework for prompt corrective action. To be categorized as well capitalized, the Bank must maintain minimum Common Equity Tier 1, Tier 1 risk-based, Total risk-based and Tier 1 leverage ratios as set forth in the following table. The Bank's actual capital amounts and ratios as of these dates are also presented. There are no conditions or events since that management believes have changed the Bank's categorization.
WASHINGTON FEDERAL, INC. AND SUBSIDIARIES
NOTES TO THE CONSOLIDATED FINANCIAL STATEMENTS
YEARS ENDED SEPTEMBER 30, 2019, 2018 AND 2017
|
| | | | | | | | | | |
| Actual | | Capital Adequacy
Guidelines | Categorized as Well Capitalized Under Prompt Corrective Action Provisions |
| Capital | Ratio | | Ratio | Ratio |
September 30, 2019 | (In thousands) |
Common Equity Tier 1 risk-based capital ratio: | | | | | |
The Company | $ | 1,710,147 |
| 14.30 | % | | 4.50 | % | NA |
|
The Bank | 1,666,426 |
| 13.93 |
| | 4.50 |
| 6.50 | % |
Tier 1 risk-based capital ratio: | | | | | |
The Company | 1,710,147 |
| 14.30 |
| | 6.00 |
| NA |
|
The Bank | 1,666,426 |
| 13.93 |
| | 6.00 |
| 8.00 |
|
Total risk-based capital ratio: | | | | | |
The Company | 1,848,581 |
| 15.45 |
| | 8.00 |
| NA |
|
The Bank | 1,804,860 |
| 15.09 |
| | 8.00 |
| 10.00 |
|
Tier 1 leverage ratio: | | | | | |
The Company | 1,710,147 |
| 10.51 |
| | 4.00 |
| NA |
|
The Bank | 1,666,426 |
| 10.24 |
| | 4.00 |
| 5.00 |
|
| | | | | |
September 30, 2018 | | | | | |
Common Equity Tier 1 risk-based capital ratio: | | | | | |
The Company | $ | 1,678,475 |
| 14.71 | % | | 4.50 | % | NA |
|
The Bank | 1,661,628 |
| 14.55 |
| | 4.50 |
| 6.50 | % |
Tier 1 risk-based capital ratio: | | | | | |
The Company | 1,678,475 |
| 14.71 |
| | 6.00 |
| NA |
|
The Bank | 1,661,628 |
| 14.55 |
| | 6.00 |
| 8.00 |
|
Total risk-based capital ratio: | | | | | |
The Company | 1,814,981 |
| 15.91 |
| | 8.00 |
| NA |
|
The Bank | 1,798,135 |
| 15.75 |
| | 8.00 |
| 10.00 |
|
Tier 1 leverage ratio: | | | | | |
The Company | 1,678,475 |
| 10.85 |
| | 4.00 |
| NA |
|
The Bank | 1,661,628 |
| 10.74 |
| | 4.00 |
| 5.00 |
|
At periodic intervals, the Federal Reserve, the OCC and the FDIC routinely examine the Company's and the Bank's financial statements as part of their oversight. Based on their examinations, these regulators can direct that the Company's or Bank's financial statements be adjusted in accordance with their findings.
The Company and the Bank are subject to regulatory restrictions on paying dividends.
The Company has an ongoing share repurchase program and 4,065,837 shares were repurchased during 2019 at a weighted average price of $30.46. In 2018, 4,868,357 shares were repurchased at a weighted average price of $33.74. As of September 30, 2019, management had authorization from the Board of Directors to repurchase up to 7,966,761 additional shares.
In connection with the 2008 Troubled Asset Relief Program ("TARP"), the Company issued 1,707,456 warrants to purchase common stock at an exercise price of $17.36. In 2019, the Company exchanged 102,936 of these warrants with a value of $1,081,704. No such warrants remain outstanding as of September 30, 2019. Outstanding warrants were considered in the calculation of diluted shares outstanding using the treasury stock method.
WASHINGTON FEDERAL, INC. AND SUBSIDIARIES
NOTES TO THE CONSOLIDATED FINANCIAL STATEMENTS
YEARS ENDED SEPTEMBER 30, 2019, 2018 AND 2017
The following table sets forth information regarding earnings per share calculations.
|
| | | | | | | | | | | |
Year ended September 30, | 2019 | | 2018 | | 2017 |
Weighted average shares outstanding | 80,471,316 |
| | 85,008,040 |
| | 88,905,457 |
|
Weighted average dilutive warrants | 4,448 |
| | 63,079 |
| | 242,979 |
|
Weighted average dilutive options | 19,399 |
| | 38,724 |
| | 75,771 |
|
Weighted average diluted shares | 80,495,163 |
| | 85,109,843 |
| | 89,224,207 |
|
| | | | | |
Net income (In thousands) | $ | 210,256 |
| | $ | 203,850 |
| | $ | 173,532 |
|
Basic EPS | $ | 2.61 |
| | $ | 2.40 |
| | $ | 1.95 |
|
Diluted EPS | 2.61 |
| | 2.40 |
| | 1.94 |
|
NOTE Q - FINANCIAL INFORMATION – WASHINGTON FEDERAL, INC.
The following Washington Federal, Inc. (parent company only) financial information should be read in conjunction with the other notes to the Consolidated Financial Statements.
|
| | | | | | |
Condensed Statements of Financial Condition | | |
| September 30, 2019 | September 30, 2018 |
| (In thousands) |
Assets | | |
Cash | $ | 38,721 |
| $ | 20,334 |
|
Other assets | 5,000 |
| — |
|
Investment in subsidiary | 1,989,274 |
| 1,980,062 |
|
Total assets | $ | 2,032,995 |
| $ | 2,000,396 |
|
| | |
Liabilities | | |
Other liabilities | $ | — |
| $ | 3,488 |
|
Total liabilities | — |
| 3,488 |
|
| | |
Shareholders’ equity | | |
Total shareholders’ equity | 2,032,995 |
| 1,996,908 |
|
Total liabilities and shareholders’ equity | $ | 2,032,995 |
| $ | 2,000,396 |
|
WASHINGTON FEDERAL, INC. AND SUBSIDIARIES
NOTES TO THE CONSOLIDATED FINANCIAL STATEMENTS
YEARS ENDED SEPTEMBER 30, 2019, 2018 AND 2017
|
| | | | | | | | | |
Condensed Statements of Operations | | | |
Twelve Months Ended September 30, | 2019 | 2018 | 2017 |
| (In thousands) |
Income | | | |
Dividends from subsidiary | $ | 208,389 |
| $ | 198,294 |
| $ | 171,500 |
|
Total Income | 208,389 |
| 198,294 |
| 171,500 |
|
Expense | | | |
Miscellaneous expense | 448 |
| 439 |
| 435 |
|
Total expense | 448 |
| 439 |
| 435 |
|
| | | |
Net income (loss) before equity in undistributed net income (loss) of subsidiary | 207,941 |
| 197,855 |
| 171,065 |
|
Equity in undistributed net income (loss) of subsidiaries | 2,213 |
| 5,880 |
| 2,326 |
|
Income before income taxes | 210,154 |
| 203,735 |
| 173,391 |
|
Income tax benefit (expense) | 102 |
| 115 |
| 141 |
|
Net income | $ | 210,256 |
| $ | 203,850 |
| $ | 173,532 |
|
|
| | | | | | | | | |
Condensed Statements of Cash Flows | | | |
Twelve Months Ended September 30, | 2019 | 2018 | 2017 |
| (In thousands) |
Cash Flows From Operating Activities | | | |
Net income | $ | 210,256 |
| $ | 203,850 |
| $ | 173,532 |
|
Adjustments to reconcile net income to net cash provided by operating activities: | | | |
Equity in undistributed net income (loss) of subsidiaries | (2,213 | ) | (5,880 | ) | (2,326 | ) |
Stock based compensation expense | 5,265 |
| 4,771 |
| 5,910 |
|
Decrease (increase) in other assets | — |
| — |
| 15 |
|
Increase (decrease) in other liabilities | (3,489 | ) | 3,424 |
| (2,699 | ) |
Net cash provided by (used in) operating activities | 209,819 |
| 206,165 |
| 174,432 |
|
| | | |
Cash Flows From Investing Activities | | | |
Purchase of strategic investments | (5,000 | ) | — |
| — |
|
Net cash provided by (used in) investing activities | (5,000 | ) | — |
| — |
|
| | | |
Cash Flows From Financing Activities | | | |
Proceeds from exercise of common stock options and related tax benefit | 740 |
| 1,338 |
| 7,238 |
|
Treasury stock purchased | (123,854 | ) | (164,249 | ) | (98,374 | ) |
Dividends paid on common stock | (63,318 | ) | (55,997 | ) | (74,519 | ) |
Net cash provided by (used in) financing activities | (186,432 | ) | (218,908 | ) | (165,655 | ) |
| | | |
Increase (decrease) in cash | 18,387 |
| (12,743 | ) | 8,777 |
|
Cash at beginning of year | 20,334 |
| 33,077 |
| 24,300 |
|
Cash at end of year | $ | 38,721 |
| $ | 20,334 |
| $ | 33,077 |
|
NOTE R - SELECTED QUARTERLY FINANCIAL DATA (UNAUDITED)
WASHINGTON FEDERAL, INC. AND SUBSIDIARIES
NOTES TO THE CONSOLIDATED FINANCIAL STATEMENTS
YEARS ENDED SEPTEMBER 30, 2019, 2018 AND 2017
The following is a summary of the unaudited interim results of operations by quarter for the years presented.
|
| | | | | | | | | | | | |
Twelve Months Ended September 30, 2019 | First Quarter | Second Quarter | Third Quarter | Fourth Quarter |
| (In thousands, except per share data) |
Interest income | $ | 162,622 |
| $ | 167,582 |
| $ | 171,826 |
| $ | 169,436 |
|
Interest expense | 43,470 |
| 47,512 |
| 50,160 |
| 49,264 |
|
Net interest income | 119,152 |
| 120,070 |
| 121,666 |
| 120,172 |
|
Provision (release) for loan losses | (500 | ) | 750 |
| — |
| (1,900 | ) |
Other operating income (including REO gain (loss), net) | 19,329 |
| 13,618 |
| 14,395 |
| 15,786 |
|
Other operating expense | 71,672 |
| 67,967 |
| 70,898 |
| 72,526 |
|
Income before income taxes | 67,309 |
| 64,971 |
| 65,163 |
| 65,332 |
|
Income tax expense | 14,367 |
| 13,873 |
| 11,309 |
| 12,970 |
|
Net income | $ | 52,942 |
| $ | 51,098 |
| $ | 53,854 |
| $ | 52,362 |
|
| | | | |
Basic earnings per share | $ | 0.65 |
| $ | 0.63 |
| $ | 0.67 |
| $ | 0.66 |
|
Diluted earnings per share | 0.65 |
| 0.63 |
| 0.67 |
| 0.66 |
|
Cash dividends paid per share | 0.18 |
| 0.20 |
| 0.20 |
| 0.21 |
|
|
| | | | | | | | | | | | |
Twelve Months Ended September 30, 2018 | First Quarter | Second Quarter | Third Quarter | Fourth Quarter |
| (In thousands, except per share data) |
Interest income | $ | 145,780 |
| $ | 149,079 |
| $ | 155,072 |
| $ | 157,152 |
|
Interest expense | 30,045 |
| 31,778 |
| 35,220 |
| 37,901 |
|
Net interest income | 115,735 |
| 117,301 |
| 119,852 |
| 119,251 |
|
Provision (release) for loan losses | — |
| (950 | ) | 1,000 |
| (5,500 | ) |
Other operating income (including REO gain (loss), net) | 6,841 |
| 12,309 |
| 12,619 |
| 12,207 |
|
Other operating expense | 61,941 |
| 65,787 |
| 66,977 |
| 69,617 |
|
Income before income taxes | 60,635 |
| 64,773 |
| 64,494 |
| 67,341 |
|
Income tax expense | 8,965 |
| 15,502 |
| 13,100 |
| 15,826 |
|
Net income | $ | 51,670 |
| $ | 49,271 |
| $ | 51,394 |
| $ | 51,515 |
|
| | | | |
Basic earnings per share | $ | 0.59 |
| $ | 0.58 |
| $ | 0.61 |
| $ | 0.62 |
|
Diluted earnings per share | 0.59 |
| 0.57 |
| 0.61 |
| 0.62 |
|
Cash dividends paid per share | 0.15 |
| 0.17 |
| 0.17 |
| 0.18 |
|
MANAGEMENT'S REPORT ON INTERNAL CONTROL OVER FINANCIAL REPORTING
The management of the Company is responsible for establishing and maintaining adequate internal control over financial reporting. The Company's internal control system was designed to provide reasonable assurance to the Company's management and Board of Directors regarding the preparation and fair presentation of published financial statements.
The Company's management assessed the effectiveness of the Company's internal control over financial reporting as of September 30, 2019. In making this assessment, the Company's management used the criteria set forth by the Committee of Sponsoring Organizations of the Treadway Commission (COSO) in the 2013 version of its Internal Control-Integrated Framework. Based on its assessment, the Company's management believes that as of September 30, 2019, the Company's internal control over financial reporting was effective based on those criteria.
The Company's independent auditors, Deloitte & Touche LLP, an independent registered public accounting firm, have issued an audit report on the Company's internal control over financial reporting and their report follows.
November 19, 2019
Brent J. Beardall
President and Chief Executive Officer
Vincent L. Beatty
Executive Vice President and Chief Financial Officer
REPORT OF INDEPENDENT REGISTERED PUBLIC ACCOUNTING FIRM
To the Board of Directors and Shareholders of
Washington Federal, Inc.
Seattle, Washington
Opinion on the Financial Statements
We have audited the accompanying consolidated statements of financial condition of Washington Federal, Inc. and subsidiaries (the “Company”) as of September 30, 2019 and 2018, and the related consolidated statements of operations, comprehensive income, shareholders' equity, and cash flows for each of the three years in the period ended September 30, 2019, and the related notes (collectively referred to as the "financial statements"). In our opinion, the financial statements present fairly, in all material respects, the financial position of the Company as of September 30, 2019, and 2018, and the results of its operations and its cash flows for each of the three years in the period ended September 30, 2019, in conformity with accounting principles generally accepted in the United States of America.
We have also audited, in accordance with the standards of the Public Company Accounting Oversight Board (United States) (PCAOB), the Company's internal control over financial reporting as of September 30, 2019, based on the criteria established in Internal Control - Integrated Framework (2013) issued by the Committee of Sponsoring Organizations of the Treadway Commission and our report dated November 19, 2019, expressed an unqualified opinion on the Company's internal control over financial reporting.
Basis for Opinion
These financial statements are the responsibility of the Company's management. Our responsibility is to express an opinion on the Company's financial statements based on our audits. We are a public accounting firm registered with the PCAOB and are required to be independent with respect to the Company in accordance with the U.S. federal securities laws and the applicable rules and regulations of the Securities and Exchange Commission and the PCAOB.
We conducted our audits in accordance with the standards of the PCAOB. Those standards require that we plan and perform the audit to obtain reasonable assurance about whether the financial statements are free of material misstatement, whether due to error or fraud. Our audits included performing procedures to assess the risks of material misstatement of the financial statements, whether due to error or fraud, and performing procedures that respond to those risks. Such procedures included examining, on a test basis, evidence regarding the amounts and disclosures in the financial statements. Our audits also included evaluating the accounting principles used and significant estimates made by management, as well as evaluating the overall presentation of the financial statements. We believe that our audits provide a reasonable basis for our opinion.
Critical Audit Matter
The critical audit matter communicated below is a matter arising from the current-period audit of the financial statements that was communicated or required to be communicated to the audit committee and that (1) relates to accounts or disclosures that are material to the financial statements and (2) involved our especially challenging, subjective, or complex judgments. The communication of a critical audit matter does not alter in any way our opinion on the financial statements, taken as a whole, and we are not, by communicating the critical audit matter below, providing a separate opinion on the critical audit matter or on the accounts or disclosures to which it relates.
Allowance for Loan Losses - Qualitative Loss Factors - Refer to Notes A and E to the financial statements
Critical Audit Matter Description
The Company maintains an allowance for loan losses to absorb credit losses inherent in the loan portfolio. The Company's methodology for determining the appropriateness of the allowance is primarily based on a general allowance methodology and also includes specific reserves. The general loan loss allowance is primarily established by applying a loss percentage factor to the different loan types. Management believes loan types are the most relevant factor in the allowance calculation for groups of homogeneous loans as the risk characteristics within these groups are similar.
In determining the general loan loss allowance, the loss percentage factor is made up of two parts - the historical loss factor (‘‘HLF’’), which is based on historical charge-offs by loan type, and the qualitative loss factor (‘‘QLF’’), which is based on management’s continuing evaluation of factors underlying the quality of the loan portfolio that are not inherently captured in the HLFs. Management determines QLFs by loan category, primarily considering the changes in size and composition of the loan portfolio, actual loan loss experience, delinquency trends, current economic conditions, and collateral values. As of September 30, 2019, the total allowance for loan loss was
$131,534,000 of which $131,095,000 relates to the general allowance, comprised of $78,280,000 related to HLF and $52,815,000 related to QLF.
Given the subjective nature and significant amount of judgment applied by management in determining the QLFs, auditing the general loan loss allowance attributable to the QLFs required a high degree of auditor judgment, including the need to involve our credit specialists.
How the Critical Audit Matter Was Addressed in the Audit
Our audit procedures related to the general loan loss allowance attributable to the QLFs included the following, among others:
| |
• | We tested the effectiveness of controls over the Company’s determination of the QLFs, including the classification and segmentation of the loan balances and management’s review of the relevant factors considered. |
| |
• | We tested the mathematical accuracy of the QLFs and the data used as inputs in the determination of QLFs. |
| |
• | With the assistance of credit specialists, we evaluated the appropriateness of the QLF framework. |
| |
• | With the assistance of credit specialists, we performed statistical analysis to determine if the primary factors considered by management in the determination of the QLFs (composition of loan portfolio, actual loan loss experience, delinquency trends, current economic conditions, and collateral values) are appropriate indicators of credit losses. |
| |
• | We evaluated the change and magnitude of the QLFs compared to the prior year, as well as the total amount of the allowance attributable to the QLFs for such loans as of year-end. |
| |
• | We compared previous years’ allowances with subsequent charge offs, compared credit ratios to peer banks, and performed a credit trend analysis. |
Seattle, Washington
November 19, 2019
We have served as the Company’s auditor since at least 1982; however, an earlier year could not be reliably determined.
REPORT OF INDEPENDENT REGISTERED PUBLIC ACCOUNTING FIRM
To the Board of Directors and Shareholders of
Washington Federal, Inc.
Seattle, Washington
Opinion on Internal Control over Financial Reporting
We have audited the internal control over financial reporting of Washington Federal, Inc. and subsidiaries (the “Company”) as of September 30, 2019, based on criteria established in Internal Control - Integrated Framework (2013) issued by the Committee of Sponsoring Organizations of the Treadway Commission ("COSO"). Because management’s assessment and our audit were conducted to meet the reporting requirements of Section 112 of the Federal Deposit Insurance Corporation Improvement Act (FDICIA), management’s assessment and our audit of the Company’s internal control over financial reporting included controls over the preparation of the schedules equivalent to the basic financial statements in accordance with the instructions for the Office of the Comptroller of the Currency Instructions for Call Reports for Balance Sheet on schedule RC, Income Statement on schedule RI, and Changes in Bank Equity Capital on schedule RI-A. In our opinion, the Bank maintained, in all material respects, effective internal control over financial reporting as of September 30, 2019, based on criteria established in Internal Control — Integrated Framework (2013) issued by COSO.
We have not examined and, accordingly, we do not express an opinion or any other form of assurance on management's statement referring to compliance with laws and regulations.
We have also audited, in accordance with the standards of the Public Company Accounting Oversight Board (United States) (PCAOB), the consolidated statements of financial condition as of and for the year ended September 30, 2019, of the Company and our report dated November 19, 2019, expressed an unqualified opinion on those financial statements.
Basis for Opinion
The Company's management is responsible for maintaining effective internal control over financial reporting and for its assessment of the effectiveness of internal control over financial reporting, included in the accompanying Management's Report on Internal Control Over Financial Reporting. Our responsibility is to express an opinion on the Company's internal control over financial reporting based on our audit. We are a public accounting firm registered with the PCAOB and are required to be independent with respect to the Company in accordance with the U.S. federal securities laws and the applicable rules and regulations of the Securities and Exchange Commission and the PCAOB.
We conducted our audit in accordance with the standards of the PCAOB. Those standards require that we plan and perform the audit to obtain reasonable assurance about whether effective internal control over financial reporting was maintained in all material respects. Our audit included obtaining an understanding of internal control over financial reporting, assessing the risk that a material weakness exists, testing and evaluating the design and operating effectiveness of internal control based on the assessed risk, and performing such other procedures as we considered necessary in the circumstances. We believe that our audit provides a reasonable basis for our opinion.
Definition and Limitations of Internal Control over Financial Reporting
A company's internal control over financial reporting is a process designed to provide reasonable assurance regarding the reliability of financial reporting and the preparation of financial statements for external purposes in accordance with generally accepted accounting principles. A company's internal control over financial reporting includes those policies and procedures that (1) pertain to the maintenance of records that, in reasonable detail, accurately and fairly reflect the transactions and dispositions of the assets of the company; (2) provide reasonable assurance that transactions are recorded as necessary to permit preparation of financial statements in accordance with generally accepted accounting principles, and that receipts and expenditures of the company are being made only in accordance with authorizations of management and directors of the company; and (3) provide reasonable assurance regarding prevention or timely detection of unauthorized acquisition, use, or disposition of the company's assets that could have a material effect on the financial statements.
Because of its inherent limitations, internal control over financial reporting may not prevent or detect misstatements. Also, projections of any evaluation of effectiveness to future periods are subject to the risk that controls may become inadequate because of changes in conditions, or that the degree of compliance with the policies or procedures may deteriorate.
Seattle, Washington
November 19, 2019
Performance Graphs
The following graphs compare the cumulative total return to Washington Federal shareholders (stock price appreciation plus reinvested dividends) to the cumulative total return of the Nasdaq Stock Market Index (U.S. Companies) and the Nasdaq Financial Stocks Index for the five year period ended September 30, 2019, and since Washington Federal first became a publicly traded company on November 9, 1982, respectively. The graphs assume that $100 was invested on September 30, 2012, and November 9, 1982, respectively, in Washington Federal Common Stock, the Nasdaq Stock Market Index and the Nasdaq Financial Stocks Index, and that all dividends were reinvested. Management of Washington Federal cautions that the stock price performance shown in the graphs below should not be considered indicative of potential future stock price performance.
GENERAL CORPORATE AND
SHAREHOLDERS' INFORMATION
|
| |
Corporate | 425 Pike Street |
Headquarters | Seattle, Washington 98101 |
| (206) 624-7930 |
| |
Independent | Deloitte & Touche LLP |
Auditors | Seattle, Washington |
| |
Transfer Agent, | Shareholder inquiries regarding transfer |
Registrar and | requirements, cash or stock dividends, lost |
Dividend | certificates, consolidating records, correcting |
Disbursing | a name or changing an address should be |
Agent | directed to the transfer agent: |
| American Stock Transfer & Trust Company |
| 59 Maiden Lane |
| Plaza Level |
| New York, NY 10038 |
| Telephone: 1-888-888-0315 |
| www.amstock.com |
| |
Annual Meeting | The annual meeting of shareholders will be held at the Washington Athletic Club, 1325 6th Avenue, Seattle, Washington 98101 on January 22, 2020, at 2 p.m., Pacific Time. |
| |
Available | |
Information | To find out more about the Company, please visit our website. The Company uses its website to distribute financial and other material information about the Company. Our annual report on Form 10-K, our quarterly reports on Form 10-Q, current reports on Form 8-K, amendments to those reports and other SEC filings of the Company are available through the Company's website: |
| www.wafdbank.com |
| |
Stock | |
Information | Washington Federal, Inc. is traded on the NASDAQ Global Select Market. The common stock symbol is WAFD. At September 30, 2019, there were 1,126 shareholders of record. |
|
| | | | | | | | | |
| Stock Prices | |
Quarter Ended | High | Low | Dividends |
December 31, 2017 | $ | 35.40 |
| $ | 32.95 |
| $ | 0.15 |
|
March 31, 2018 | 37.35 |
| 33.65 |
| 0.17 |
|
June 30, 2018 | 34.55 |
| 31.45 |
| 0.17 |
|
September 30, 2018 | 35.20 |
| 31.85 |
| 0.18 |
|
December 31, 2018 | 32.03 |
| 24.93 |
| 0.18 |
|
March 31, 2019 | 30.96 |
| 26.80 |
| 0.20 |
|
June 30, 2019 | 34.93 |
| 29.13 |
| 0.20 |
|
September 30, 2019 | 38.14 |
| 33.94 |
| 0.21 |
|
Our Board of Directors' dividend policy is to review our financial performance, capital adequacy, regulatory compliance and cash resources on a quarterly basis, and, if such review is favorable, to declare and pay a quarterly cash dividend to shareholders.
DIRECTORS AND EXECUTIVE OFFICERS
|
| | |
BOARD OF DIRECTORS | | EXECUTIVE MANAGEMENT COMMITTEE |
| | |
THOMAS J. KELLEY
Chairman of the Board
Retired Partner, Arthur Andersen LLP | | BRENT J. BEARDALL
President and Chief Executive Officer |
BRENT J. BEARDALL
President and Chief Executive Officer | | VINCENT L. BEATTY
Executive Vice President
Chief Financial Officer |
LINDA S. BROWER Former Executive Officer Washington Federal Bank | | CATHY E. COOPER
Executive Vice President
Retail Banking |
STEPHEN M. GRAHAM Senior Parter Fenwick & West LLP | | JAMES A. ENDRIZZI
Senior Vice President
Commercial Banking |
DAVID K. GRANT
Managing Partner Catalyst Storage Partners | | RYAN M. MAUER
Senior Vice President
Chief Credit Officer
|
ANNA C. JOHNSON
Senior Partner
Scan East West Travel | | KIM E. ROBISON
Executive Vice President
Operations
|
S. STEVEN SINGH
Former Chairman and CEO Docker | | |
BARBARA L. SMITH, PhD.
Owner, B. Smith Consulting Group | | |
MARK N. TABBUTT
Chairman of the Board of Directors Saltchuk Resources
| | |
RANDALL H. TALBOT
Managing Director Talbot Financial, LLC. | | |
| | |
DIRECTOR EMERITUS | | |
W. ALDEN HARRIS | | |