STANDARD MOTOR PRODUCTS, INC.
|
INDEX
|
||
|
PART I.
|
Page No.
|
|
|
Item 1.
|
3
|
|
|
Item 1A.
|
16
|
|
|
Item 1B.
|
26
|
|
|
Item 2.
|
26
|
|
|
Item 3.
|
27
|
|
|
Item 4.
|
27
|
|
|
PART II.
|
||
|
Item 5.
|
27 | |
|
Item 6.
|
29
|
|
|
Item 7.
|
29 | |
|
Item 7A.
|
41
|
|
|
Item 8.
|
43
|
|
|
Item 9.
|
92 | |
|
Item 9A.
|
92
|
|
|
Item 9B.
|
93
|
|
|
Item 9C.
|
93
|
|
|
PART III.
|
||
|
Item 10.
|
93
|
|
|
Item 11.
|
93
|
|
|
Item 12.
|
93 | |
|
Item 13.
|
93
|
|
|
Item 14.
|
93
|
|
|
PART IV.
|
||
|
Item 15.
|
94
|
|
|
Item 16.
|
94
|
|
|
98
|
||
2
PART I
In this Annual Report on Form 10-K, “Standard Motor Products,” “we,” “us,” “our,” “SMP,” and the “Company” refer to Standard Motor Products, Inc. and its subsidiaries, unless the context requires otherwise. This
Report, including the documents incorporated herein by reference, contains forward-looking statements within the meaning of Section 27A of the Securities Act of 1933 and Section 21E of the Securities Exchange Act of 1934. Forward-looking
statements in this Report are indicated by words such as “anticipates,” “expects,” “believes,” “intends,” “plans,” “estimates,” “projects,” “strategies” and similar expressions. These statements represent our expectations based on current
information and assumptions and are inherently subject to risks and uncertainties. Our actual results could differ materially from those which are anticipated or projected as a result of certain risks and uncertainties, including, but not
limited to, changes or loss in business relationships with our major customers and in the timing, size and continuation of our customers’ programs; changes in our supply chain financing arrangements, such as changes in terms, termination of
contracts and/or the impact of rising interest rates; the ability of our customers to achieve their projected sales; competitive product and pricing pressures; increases in production or material costs, including procurement costs resulting from
higher tariffs, and inflationary cost increases in raw materials, labor and transportation, that cannot be recouped in product pricing; the performance of the aftermarket, non-aftermarket, industrial equipment and original equipment markets;
changes in the product mix and distribution channel mix; economic and market conditions; successful integration of acquired businesses; our ability to achieve benefits from our cost savings initiatives; product liability and environmental matters
(including, without limitation, those related to asbestos-related contingent liabilities and remediation costs at certain properties); the effects of widespread public health crises, including the coronavirus (COVID-19) pandemic; the effects of
disruptions in the supply chain caused by the COVID-19 pandemic, Russia’s invasion of the Ukraine and resultant sanctions imposed by the U.S. and other governments; climate-related risks, such as physical risks and transition risks; as well as
other risks and uncertainties, such as those described under Risk Factors, Quantitative and Qualitative Disclosures About Market Risk and those detailed herein and from time to time in the filings of the Company with the SEC. Forward-looking
statements are made only as of the date hereof, and the Company undertakes no obligation to update or revise the forward-looking statements, whether as a result of new information, future events or otherwise. In addition, historical information
should not be considered as an indicator of future performance.
| ITEM 1. |
BUSINESS
|
Overview
We are a leading manufacturer and distributor of premium automotive parts used in the maintenance, service and repair of vehicles in the automotive aftermarket industry. Through organic growth and several recent acquisitions, described
further below, we have strengthened our capabilities as a supplier of custom-engineered products for on-highway (commercial and light vehicles) and off-highway (construction and agriculture, and all other) applications. We sell our products
primarily to automotive aftermarket retailers, warehouse distributors, original equipment manufacturers and original equipment service part operations in the United States, Canada, Europe, Asia, Mexico and other Latin American countries.
As of December 31, 2022, we managed our business pursuant to two operating segments, each focusing on a specific line of parts. Our Engine Management segment generates revenue from the sale of automotive engine parts, including ignition,
emission control, fuel, electrical and safety related system products, and wire and cable parts. Our Temperature Control segment generates revenue from the sale of automotive temperature control systems parts, including air conditioning
compressors and other climate control parts.
Beginning in the first quarter of 2023, our business will be organized into three operating segments – Engineered Solutions, Vehicle Control and Temperature Control.
Engineered Solutions is a new operating segment created by carving out all non-aftermarket business from our existing Engine Management and Temperature Control operating
segments, which will now solely reflect parts sales to aftermarket channels. This will provide clarity regarding the unique dynamics and margin profiles of the markets served by each segment. Our Engineered Solutions segment will supply
custom-engineered solutions to vehicle and equipment manufacturers in non-aftermarket end markets, such as-
| • |
Commercial and Light vehicles
|
| • |
Construction
|
| • |
Agriculture
|
| • |
Power Sports
|
| • |
Marine
|
| • |
Hydraulics
|
| • |
Lawn & Garden
|
The Engineered Solutions segment sells into highly fragmented global end markets and is expected to provide a platform for future growth. Our growth strategy is long-term
and we do not expect growth to be linear given the nature of customized engineering and the period of time between the awarding of new business and start of production. Some of our growth drivers in this segment include:
| • |
Developing new customer relationships
|
| • |
Cross-selling opportunities with existing customers
|
| • |
Introducing new products to both new and existing customers
|
| • |
Increasing content per unit
|
Segment offerings include product categories from both of our legacy operating segments, and offer a broad array of conventional and future-oriented technologies, including those that are specific to vehicle
electrification as well as those that are powertrain-neutral.
Vehicle Control is the new name for our Engine Management operating segment; it will include our core aftermarket business after the carve out of all non-aftermarket business
moved to the new Engineered Solutions operating segment. Within the Vehicle Control segment there will be three new major product groups:
| (1) |
Ignition, Emissions & Fuel, which will include the traditional internal combustion engine (ICE) dependent categories;
|
| (2) |
Wire Sets & Other, which will include spark plug wire sets and other related products, and are product categories we have noted to be in secular decline based upon product life cycle; and
|
| (3) |
Electrical & Safety, which will include powertrain neutral vehicle technologies such as electrical switches/relays, safety related products such as anti-lock brake and vehicle speed sensors,
tire pressure monitoring, park assist sensors, and advanced driver assistance components.
|
Our Temperature Control operating segment remains substantially unchanged, as only a small portion of its business will be moved to Engineered
Solutions, and this legacy aftermarket business segment is poised to benefit from the broader adoption of more complex AC systems. Those systems will provide passenger comfort regardless of the vehicles powertrain propulsion, and are
being developed to cool batteries and other products used on electric vehicles. Segment offerings will continue to provide thermal products in the aftermarket business under two major product groups:
| (1) |
AC System Components, which includes compressors, connecting lines, heat exchangers, and expansion devices
|
| (2) |
Other Thermal Components, which includes parts that provide engine, transmission, electric drive motor, and battery temperature management
|
This change will better align our operating segments with our strategic focus on diversification, and provide greater transparency into how we are positioned to capture growth opportunities of the future. The change will also better reflect
the impact of our recent acquisitions.
The following table summarizes both our reporting structure during 2022 and our planned 2023 reporting structure:
|
Operating Segments as of 2022
|
Planned Operating Segments in 2023
|
|
|
Engine Management:
|
Vehicle Control (Aftermarket):
|
|
|
Ignition, Emissions, Fuel & Safety
|
Ignition, Emissions & Fuel
|
|
|
Wire and Cable
|
Wire Sets and Other
|
|
|
Electrical & Safety
|
||
|
Temperature Control:
|
Temperature Control (Aftermarket):
|
|
|
Compressors
|
AC System Components
|
|
|
Other Climate Control Parts
|
Other Thermal Components
|
|
|
Engineered Solutions (non-Aftermarket):
|
||
|
Commercial Vehicle
|
||
|
Light Vehicle
|
||
|
Construction & Agriculture
|
||
|
All Other
|
Our Business Strategy
The automotive aftermarket is a mature industry with participants that manufacture, distribute and sell vehicle replacement parts to professional technicians and to individual consumers, who perform “do-it-yourself” repairs on their personal
vehicles. While generally a stable industry, the aftermarket tends to be influenced by trends such as the number of vehicles on the road, the average age of vehicles on the road, and the total number of miles driven per year. Weather extremes
like unseasonably hot or cool temperatures in the summer can also have an impact on aftermarket product demand.
Other economic factors such as the level of new vehicle sales and production rates, which more recently have been impacted by global supply chain disruptions, can have a more direct impact on the on-highway and off-highway end markets we
supply, such as commercial and light vehicles, construction, agricultural, power sports and others. Typically, these economic factors have a more indirect impact on the aftermarket.
While approximately 80% of our business is to the automotive aftermarket, we seek to enhance and diversify our business through the following:
| • |
Leveraging our manufacturing and distribution capabilities to secure additional business globally
|
| • |
Supporting the service part operations of vehicle and equipment manufacturers with value-added services and product support for the life of the part
|
| • |
Developing new product lines that complement our existing product offering and that have the potential for high growth
|
| • |
Expanding our product offering in the medium and heavy duty, commercial vehicle, construction and agricultural equipment, power sports, and other end markets
|
| • |
Executing our acquisition strategy
|
In 2021, we completed three acquisitions that expanded our business into specialized non-aftermarket end markets that complement our core aftermarket business. In addition to providing access to product technologies suitable to the
aftermarket, and manufacturing and engineering capabilities to support our operating strategy to bring more product manufacturing in-house, these acquisitions provide geographic expansion in Europe and Asia.
With over 100 years in business, we believe that our success is attributable to our focus on being a key strategic partner to our customers, and in doing so provide:
| • |
Professional grade products and solutions within our areas of expertise.
|
| • |
Comprehensive product coverage for all vehicles on the road through our offering of professional grade engine management and temperature control products.
|
| • |
Supplier and customer focused initiatives designed to improve order fill rate and maintain high levels of product availability
|
| • |
Expanding our product coverage to include a broader product mix in categories such as
|
| o |
Electrification, including electric vehicles (EVs) and hybrid electric vehicles (HEVs),
|
| o |
Connectivity and safety related products, such as
|
| ➢ |
anti-lock brake (ABS)
|
| ➢ |
vehicle speed sensors
|
| ➢ |
tire pressure monitoring
|
| ➢ |
park assist sensors
|
| ➢ |
advanced driver assistance components to meet the needs of our customers
|
In 2022, we introduced approximately 2,400 new products to the aftermarket, of which approximately two-thirds were powertrain neutral. We support our products with superior value-added services provided by our marketing and sales teams that
provides our customers with offerings such as data-driven category management, technical support as well as product selection, assortment and application support for all of our products. In addition, we have a team dedicated to providing
technical training, in-person and virtually, on diagnosing and repairing vehicles equipped with complex systems.
We are committed to expanding our design, engineering and manufacturing capabilities, and vertically integrating production processes to bring more manufacturing in-house. We engineer, tool and manufacture many of the products we offer for
sale and the components used in their assembly. We have found this level of vertical integration, in combination with our manufacturing footprint in low cost regions, provides advantages in terms of the cost, quality and availability of our
products.
|
Examples of vertically integrated processes:
|
|
|
➢ plastic molding operations
|
➢ automated electronics assembly
|
|
➢ stamping and machining operations
|
➢ design and fabrication of processing and test equipment
|
|
➢ wire extrusion
|
➢ teardown, diagnostics and rebuilding of remanufactured air conditioning compressors,
diesel injectors and diesel pumps
|
We also believe that our technical capabilities have afforded us opportunities to expand our product coverage in our core aftermarket business and in the non-aftermarket end markets we supply for on-highway and off-highway applications, and
have better positioned us to satisfy customer demand for both traditional, internal combustion engine (or ICE) applications, and non-ICE (electric or hybrid electric) applications.
Our manufacturing footprint is geographically diverse with a greater presence in North America and Europe compared to many of our peers. We leverage our footprint to improve our cost position by locating labor-intensive processes within our
low-cost plants, and by investing in automation and undertaking continuous improvement initiatives in our domestic facilities.
Our Products & Services
The following describes our business more particularly under our existing operating segments as of December 31, 2022 – Engine Management and Temperature Control.
Our periodic reports for the first quarter of 2023 and reporting periods thereafter will focus on our new reporting structure and operating segments as of the first quarter of 2023 – Engineered Solutions, Vehicle Control and Temperature Control.
Engine Management Segment
Our Engine Management Segment manufactures and distributes a full line of critical components for most years, makes and models of vehicles on the road, including new technologies. Key product categories within our engine management portfolio
include: (i) ignition, such as electronic ignition control modules, camshaft and crankshaft position sensors, ignition wires and coils; (ii) electrical, such as switches and relays; (iii) emissions, such as exhaust gas recirculation valves,
pressure and temperature sensors and variable valve timing (VVT) components; (iv) fuel, such as mass airflow sensors, fuel pressure sensors, electronic throttle bodies and fuel injectors, including diesel injectors and pumps (new and
remanufactured); and (v) safety-related systems, such as various sensors including anti-lock brake (ABS), vehicle speed, tire pressure monitoring (TPMS) and park assist sensors.
We continuously look to expand our product offering. Recently, we have done so by adding late-model coverage for existing product categories, and new product categories in response to new and evolving vehicle technologies, including diesel
control modules, pumps and components, turbochargers, evaporation emission control system components, exhaust gas temperature sensors, active grill shutters, battery current sensors, and Advanced Driver Assistance Systems (ADAS) components,
including blind spot detection sensors, cruise control distance sensors, lane departure sensor cameras and park assist backup cameras. For example, our offering includes more than seventy product categories for one of the first mass-produced
hybrid electric vehicles (HEVs). As more HEVs enter the aftermarket, we intend to expand our product offering to service this important segment.
Ignition, Emission Control, Fuel & Safety Related System Products. Replacement parts for ignition, emission, fuel and safety related systems accounted for $824.7 million, or 60%, of our
consolidated net sales in 2022, $786.5 million, or 61%, of our consolidated net sales in 2021, and $691.7 million, or 61%, of our consolidated net sales in 2020.
As the use and complexity of vehicle systems continue to develop and proliferate, we expect to identify and benefit from new sales opportunities. All new vehicles are factory‑equipped with numerous electronic control modules designed to
monitor and control the internal combustion process and the emissions, transmission, safety and comfort systems of the vehicle. Newer automotive systems include Advanced Driver Assistance Systems and Collision Avoidance Systems to alert the
driver to potential problems, or to avoid collisions by implementing safeguards. Many of these systems use on-board computers to monitor inputs from sensing devices located throughout the vehicle. Our sales of sensors, switches, actuators,
valves, solenoids and related parts have increased as automobile manufacturers continue to equip their cars with these more complex engine management systems.
New sales opportunities have also arisen in the United States as a result of government regulations regarding safety and emissions. Legally, automobiles must now comply with emissions standards from the time they were manufactured and, in
most states, until the last day they are in use. Emissions laws and fuel economy regulations have had a positive impact on sales of our ignition, emissions control and fuel delivery parts since vehicles failing these laws may require repairs
utilizing parts sold by us. Similarly, as government-mandated safety devices, such as anti-lock braking systems and air bags mature, requiring servicing and repair, we anticipate increased sales opportunities for many of our products such as ABS
sensors, TPMS sensors and traction control products.
Wire & Cable Products. Wire and cable parts accounted for $150.6 million, or 11%, of our consolidated net sales in 2022, $151.4 million, or 12%, of our consolidated net sales in 2021, and $144
million, or 13%, of our consolidated net sales in 2020. These products include spark plug wire sets, battery cables, pigtails, sockets and a wide range of electrical wire, terminals, connectors and tools for servicing an automobile’s electrical
system.
Temperature Control Segment
Our Temperature Control Segment manufactures and distributes a full line of critical components for the temperature control (air conditioning and heating) systems, engine cooling systems, power window accessories and windshield washer systems
of motor vehicles. Key product categories within our temperature control portfolio include: air conditioning compressors (new and remanufactured), air conditioning repair kits, clutch assemblies, blower and radiator fan motors (brushless and
brushed), filter dryers, evaporators, accumulators, actuators, hose assemblies, thermal expansion devices, heater valves, heater cores, A/C service tools and chemicals, fan assemblies, fan clutches, oil coolers, window lift motors, window
regulators and assemblies, and windshield washer pumps.
We continuously look to improve our cost position through strategic transactions with manufacturers in low cost regions.
In 2014, we formed Foshan GWOYNG SMP Vehicle Climate Control & Cooling Products Co. Ltd., a China-based joint venture that manufactures light vehicle and heavy duty air conditioning accumulators, filter driers,
hose assemblies, and switches.
In 2017, we formed Foshan FGD SMP Automotive Compressor Co., Ltd., a China-based joint venture that manufactures light vehicle and heavy duty belt driven air conditioning compressors.
In 2019, we acquired a minority interest ownership position in Foshan Che Yijia New Energy Technology Co., Ltd., a China-based manufacturer of electric air conditioning compressors.
We believe these transactions enhance our position as a basic low-cost manufacturer and leading supplier of temperature control products and create opportunity for growth in the China OE market. The joint ventures also provide complementary
manufacturing capabilities and opportunities for synergy with our other manufacturing facilities, which we believe results in a more reliable supply of products, supporting our customers’ needs for consistent and reliable service levels.
In 2022, we acquired Kade Trading GmbH, a supplier of temperature control products throughout Europe. We believe this acquisition provides synergies to our other recent acquisitions in 2021 into specialized end markets, and an entry point
into the European market for our temperature control products with a strong focus on the continuing electrification of thermal systems.
Compressors. Compressors accounted for $222.5 million, or 16%, of our consolidated net sales in 2022, $206.7 million, or 16%, of our consolidated net sales in 2021, and $163.1 million, or 14%, of our
consolidated net sales in 2020. Included in consolidated net sales for the compressor product line is the revenue generated from the sale of kits.
Other Climate Control Parts. Other climate control parts accounted for $159.8 million, or 12%, of our consolidated net sales in 2022, $141.7 million, or 11%, of our consolidated net sales in 2021, and
$118.9 million, or 11%, of our consolidated net sales in 2020.
Our Brands
We believe that our brands are an important component of our value proposition, and serve to distinguish our premium engine management and temperature control products from those of our competitors. We market and distribute our products under
our own brands, such as:
|
Engine
Management
Products
|
 |
|
Temperature
Control Products
|
 |
We also distribute our products to customers for resale under private labels and the following co-labels:
|
Engine
Management
|
|
|
We have also developed our product offering and brand strategies to support our customers’ initiatives to market a tiered product assortment designed to satisfy end-user preferences for quality and value. We believe that this alignment makes
us an invaluable business partner to our customers.
Our Customers
We sell our products primarily to:
| • |
Automotive aftermarket retailers, such as O’Reilly Automotive, Inc. (“O’Reilly”), AutoZone, Inc. (“AutoZone”), and Canadian Tire Corporation, Limited.
|
| • |
Automotive aftermarket distributors, including warehouse distributors and program distribution groups, such as Genuine Parts Co. and National Automotive Parts Association (“NAPA”), Auto Value
and All Pro/Bumper to Bumper (Aftermarket Auto Parts Alliance, Inc.), Automotive Distribution Network LLC, The National Pronto Association (“Pronto”), Federated Auto Parts Distributors, Inc. (“Federated”), Pronto and Federated’s
affiliate, the Automotive Parts Services Group or The Group, and Icahn Automotive Group LLC (doing business as Pep Boys, Auto Plus, AAMCO and Precision Tune Auto Care).
|
| • |
Original equipment manufacturers and original equipment service part operations, such as General Motors Co., Ford Motor Co., Woodward, Inc., Deere & Company, Caterpillar Inc., Daimler Truck
AG, Case/New Holland, Eberspacher, Mobile Climate Control, Volvo/Mack Truck, and Harley.
|
Our three largest individual customers accounted for approximately 59% of our consolidated net sales in 2022. During 2022, O’Reilly, AutoZone and NAPA accounted for 27%, 17%, and 15% of our consolidated net sales, respectively. Net sales from
each of these customers were reported in both our Engine Management and Temperature Control Segments.
Competition
The automotive aftermarket industry is comprised of a large number of diverse manufacturers varying in product specialization and size. In addition to manufacturing, aftermarket companies must allocate resources towards a dynamic distribution
process in order to maintain the flexibility and responsiveness on which their customers depend. Aftermarket manufacturers must be efficient producers of small lot sizes, and must distribute, with rapid turnaround times, products for nearly all
domestic and import vehicles on the road today.
We compete primarily on the basis of product quality, product availability, value-added services, product coverage, order turn‑around time, order fill rate, technical support and price. We believe we differentiate ourselves from our
competitors primarily through:
|
•
|
a value‑added, knowledgeable sales force;
|
|
•
|
continuous product development, engineering & technical advancement;
|
|
•
|
extensive market leading product coverage in conjunction with market leading brands;
|
| • |
knowledgeable category management, including inventory stocking recommendations for our distributors to get the right parts on the shelf for their marketplace;
|
| • |
rigorous product qualification standards to ensure that our parts meet or exceed exacting performance specifications;
|
| • |
sophisticated parts cataloging systems, including catalogs available online through our website and our mobile application;
|
| • |
inventory levels and responsive logistical systems sufficient to meet the critical delivery requirements of customers;
|
| • |
breadth of manufacturing capabilities; and
|
| • |
award-winning marketing programs, sales support and technical training.
|
We offer a variety of strategic customer discounts, allowances and incentives to increase customer purchases of our products. For example, we offer cash discounts for paying invoices in accordance with the specified discounted terms of the
invoice. We also offer rebates and discounts to customers as advertising and sales force allowances, and allowances for warranty and overstock returns are also provided. These discounts, allowances and incentives are a common practice
throughout the automotive aftermarket industry, and we intend to continue to offer them in response to competitive pressures and to strategically support the growth of all our products.
We are one of the leading independent manufacturers and distributors serving North America and other geographic areas in our core businesses of Engine Management and Temperature Control. In the Engine Management Segment, we compete with:
ACDelco, Aptiv Plc, Denso Corporation, Continental AG, Hitachi, Ltd., Motorcraft, Robert Bosch GmbH, Visteon Corporation, NGK Spark Plug Co., Ltd., Dorman Products, Inc. and several privately-owned companies primarily importing products from
Asia. In the Temperature Control Segment, we compete with: ACDelco, MAHLE GmbH, Denso Corporation, Motorcraft, Sanden International (U.S.A.), Inc., Continental AG, Dorman Products, Inc., and several privately-owned companies.
Our business operates in highly competitive markets, and we face substantial competition in all markets that we serve. In addition, in the aftermarket, we face competition from automobile manufacturers who supply many of the replacement parts
sold by us, although these manufacturers generally supply parts only for cars they sell through OE dealerships.
Sales and Distribution
In the traditional aftermarket channel, we sell our products to warehouse distributors and retailers. Our customers buy directly from us and sell directly to jobber stores, professional technicians and to “do-it-yourselfers” who perform
automotive repairs on their personal vehicles. In recent years, warehouse distributors have consolidated with other distributors, and an increasing number of distributors own their jobber stores or sell down channel to professional technicians.
Retailers are also consolidating with other retailers and have begun to increase their efforts to sell to professional technicians adding additional competition in the “do-it-for-me,” or the professional technician segment of our industry. As
automotive parts and systems become more complex, “do-it-yourselfers” are less likely to service their own vehicles and may become more reliant on professional technicians.
In the heavy duty aftermarket, we sell our products to recognized distributors who buy directly from us and sell directly to fleet operators and repair facilities for use in the repair and maintenance of medium to heavy duty vehicles. We also
sell our products to the service parts divisions of heavy duty OEMs for distribution into the independent heavy duty aftermarket.
In the original equipment market we sell our products to manufacturers of automotive, heavy duty truck, construction, agriculture, alternative energy, lawn/garden and powersports/marine vehicles and equipment, as well as their tier suppliers
and system integrators. We also sell and support the service part divisions of each of our customers.
We sell our products primarily in the United States, with additional sales in Canada, Europe, Asia, Mexico and other Latin American countries. Our sales are substantially denominated in U.S. dollars.
For information on revenues and long-lived assets by geographic area, see Note 21 “Industry Segment and Geographic Data” of the Notes to Consolidated Financial Statements in Item 8 of this Report.
Our customers have come to depend on our sales personnel as a reliable source for technical information and to assist with sales to their customers (e.g., jobber stores and professional technicians).
In this manner, we direct a significant portion of our sales efforts to our customers’ customers to generate demand for our products, and we believe that the structure of our sales force facilitates these efforts by enabling us to implement our
sales and marketing programs uniformly throughout the distribution channel.
Another way we generate demand for our products is through our training program, which offers training seminars to professional automotive technicians. Our training program is accredited by the National Institute for Automotive Service
Excellence (ASE) Training Managers Council. Our seminars are taught by ASE certified instructors in real time either in-person or by webinars online and feature more than 30 different topics. We also offer on-demand training webinars online on
more than 150 different topics. Through our training program, we typically teach approximately 60,000 technicians annually how to diagnose and repair vehicles equipped with complex systems related to our products, and we have approximately
16,000 technicians who are registered to participate in such sessions through our online platform.
Seasonality
Historically, our operating results have fluctuated by quarter, with the greatest sales occurring in the second and third quarters of the year and revenues generally being recognized at the time of shipment. It is in these quarters that
demand for our products is typically the highest, specifically in the Temperature Control Segment of our business. In addition to this seasonality, the demand for our Temperature Control products during the second and third quarters of the year
may vary significantly with the summer weather and customer inventories, as evidenced by the strong customer demand in 2022 fueled by the record heat across the country in 2022 and the replenishment of customer inventory levels after very warm
summer conditions in 2021. While the COVID-19 pandemic caused large shifts in sales demand between quarters in 2020, our business returned to a more normalized pattern of seasonality and variability in demand of our Temperature Control products
in 2022 and 2021. As such, our working capital typically peaks near the end of the second quarter, as the inventory build-up of air conditioning products was converted to sales, and payments on the receivables associated with such sales were yet
to be received. During this period, our working capital requirements were funded by borrowing from our revolving credit facility in our Credit Agreement.
Working Capital and Inventory Management
We seek continuous improvements in our inventory management system, which are designed to reduce inventory requirements and enhance our ability to compete on the basis of product availability, product coverage, order turn‑around time and order
fill rate. We have a pack‑to‑order distribution system, which permits us to retain slow moving items in a bulk storage state until a related order is received. This system reduces the volume of a given part in inventory. We also expanded our
inventory management system to improve inventory deployment, enhance our collaboration with customers on forecasts and inventory assortments, and further integrate our supply chain with both our customers and suppliers.
We face inventory management issues as a result of overstock returns. We permit our customers to return new, undamaged products within customer-specific limits (which are generally limited to a specified percentage of their annual purchases
from us) in the event that they have overstocked their inventories. In addition, the seasonality of our Temperature Control Segment requires that we increase our inventory during the winter season in preparation of the summer selling season. We
accrue for overstock returns as a percentage of sales after giving consideration to recent returns history.
Our profitability and working capital requirements are seasonal due to our sales mix of Temperature Control products. Our working capital requirements typically peak near the end of the second quarter, as the inventory build‑up of air
conditioning products is converted to sales and payments on the receivables associated with such sales have yet to be received. These increased working capital requirements are funded by borrowings from our revolving credit facility in our
Credit Agreement. In 2022, we strategically increased inventory levels to help offset potential supply chain risks associated with extended lead times and delays transporting our product.
Suppliers
We source materials through a global network of suppliers to ensure a consistent, high quality and low cost supply of materials and key components for our product lines. As a result of the breadth of our product offering, we are not dependent
on any single raw material.
The principal raw materials purchased by us consist of brass, electronic components, fabricated copper (primarily in the form of magnet and insulated cable), steel magnets, laminations, tubes and shafts, stamped steel parts, copper wire,
stainless steel coils and rods, aluminum coils, fittings, rods, cast aluminum parts, lead, steel roller bearings, rubber molding compound, thermo‑set and thermo plastic molding powders, and chemicals. Additionally, we use components and cores
(used parts) in our remanufacturing processes for air conditioning compressors, diesel injectors, and diesel pumps.
In the case of cores for air conditioning compressors, diesel injectors, and diesel pumps, we obtain them either from exchanges with customers who return cores subsequent to purchasing remanufactured parts or through direct purchases from a
network of core brokers. In addition, we acquire certain materials by purchasing products that are resold into the market, particularly by OEM sources and other domestic and foreign suppliers.
We believe there is an adequate supply of primary raw materials and cores; however, disruptions in the global economy have impeded global supply chains, resulting in longer lead times and delays in procuring component parts and raw materials,
and inflationary cost increases in certain raw materials, labor and transportation. In response to the global supply chain volatility and inflationary cost increases, we have taken, and continue to take, several actions to mitigate the impact by
working closely with our suppliers and customers to minimize any potential adverse impacts on our business, including initiating cost savings initiatives and the pass through of higher costs to our customers, which began in the fourth quarter of
2021. We believe that we have also benefited from our geographically diversified manufacturing footprint and our strategy to bring more product manufacturing in-house, especially with respect to product availability and fill rates.
Environmental, Social and Governance (ESG) and Human Capital
We support and seek continuous improvement in the pursuit of environmental, social and corporate governance (ESG) practices that embody our culture and what we believe it means to be a good corporate citizen.
Our Culture
Our Company was founded in 1919 on the values of integrity, common decency and respect for others. These values are embodied in our Code of Ethics, which has been adopted by the Board of Directors of the Company to serve as a statement of
principles to guide our decision-making and reinforce our commitment to these values in all aspects of our business. These values also serve as the foundation for our continued focus on many important environmental, social and governance issues,
such as environmental stewardship and our efforts to identify and implement practices that reduce our environmental impact while achieving our business goals; our attention to diversity, equity and inclusion, employee development, retention, and
health and safety; and our community engagement initiatives, to name a few.
Environmental Stewardship
We have made significant strides with respect to our ESG initiatives, building awareness of the environmental impact of our operations, and challenging ourselves to reduce our impact by reducing our usage of energy and water, reducing our
generation of waste, increasing our recycling efforts and reducing our Scope 1 and Scope 2 greenhouse gas emissions (“GHG”).
As a leading manufacturer and distributor of premium parts used in the maintenance, service and repair of vehicles, we are proud of the role our parts play in replacing failed components that are necessary for vehicles to operate safely and
efficiently, and in extending the service life of vehicles on the road. We believe our product offering also contributes to a greener car parc through several key product categories that are critical components in automotive systems designed to
improve fuel economy and reduce harmful emissions, such as fuel injectors, exhaust gas recirculation valves, sensors and tubes, and evaporative emission control system components. We also bring to market alternative energy products, which utilize
cleaner burning fuels or are designed for electric or hybrid electric vehicles.
Our remanufacturing processes divert certain types of used automotive products from traditional waste streams and reprocess them for their original purpose. We remanufacture key product categories within our offering, such as air conditioning
compressors, diesel injectors and diesel pumps, resulting in the production of premium automotive products within these categories through processes that we believe save energy and reduce waste.
Human Capital
We believe that our commitment to our employees is critical to our continued success, and has led to high employee satisfaction and low employee turnover. To facilitate talent attraction and retention, we strive to have a diverse, inclusive
and safe workplace, with opportunities for our employees to grow and develop in their careers, supported by strong compensation, benefits and health and wellness programs, and by programs that build connections between our employees and their
communities. Our employees share our corporate values of integrity, common decency and respect of others, values which have been established since our company was founded.
As of December 31, 2022, we employed approximately 4,900 people, with 2,000 people in the United States and 2,900 people in Mexico, Canada, Poland, the U.K., Germany, Hungary, China, Hong Kong and Taiwan. Of the 4,900 people employed,
approximately 2,500 people are production employees. We operate primarily in non‑union facilities and have binding labor agreements with employees at other unionized facilities. We have approximately 75 production employees in Edwardsville,
Kansas who are covered by a contract with The International Union, United Automobile, Aerospace and Agricultural Implement Workers of America (“UAW”) that expires in August 2026. We also have approximately 1,400 employees in Mexico who are
covered under union agreements negotiated at various intervals. For clarification, the employee numbers described above exclude the employees of our joint venture operations.
Although the COVID-19 pandemic has led to some challenges in finding adequate labor, generally we believe that our facilities are in labor markets with ready access to adequate numbers of skilled and unskilled workers, and we believe our
relations with our union and non‑union employees are good.
Diversity, Equity, Inclusion, and Belonging. We believe that a diverse workforce is critical to our success, and we continue to focus on the hiring, retention and advancement of women and
underrepresented populations. Our recent efforts have been focused in three areas: inspiring innovation through an inclusive and diverse culture; expanding our efforts to recruit and hire world-class diverse talent; and identifying strategic
partners to accelerate our inclusion and diversity programs. Over the last 5 years, approximately 50+% of our hires and promotions have been women or racially diverse individuals. To further our commitment to diversity, in 2021, we established
a Diversity, Equity, Inclusion, and Belonging steering committee to develop key structures within our organization to promote equality, inclusion and awareness among our employees.
Health, Safety and Wellness. The success of our business is fundamentally connected to the well-being of our people. Accordingly, we are committed to the
health, safety and wellness of our employees. We provide our employees and their families with access to a variety of innovative, flexible and convenient health and wellness programs, including benefits that provide protection and security so
they can have peace of mind concerning events that may require time away from work, or that impact their financial well-being; that support their physical and mental health by providing tools and resources to help them improve or maintain their
health status and encourage engagement in healthy behaviors; and that offer choice where possible so they can customize their benefits to meet their needs and the needs of their families.
Compensation and Benefits. We provide competitive compensation and benefits programs that meet the needs of our employees. In addition to wages and salaries, these programs include annual cash
bonuses, stock awards, a 401(k) Plan, healthcare and insurance benefits, health savings and flexible spending accounts, paid time off, family leave, family care resources, and employee assistance programs.
Talent Development. We invest significant resources to develop the talent of our high potential employees. We deliver numerous training opportunities, provide rotational assignment opportunities,
offer continuous learning and development, and implement methodologies to manage performance, provide feedback and develop talent opportunities for talent.
Our talent development programs are designed to provide employees with the resources they need to help achieve their career goals, build management skills and lead their organizations. We provide a series of employee workshops and mentoring
programs that support professional growth and development. Our annual review process encourages manager and employee conversations throughout the year to enhance growth and development.
Social Engagement and Community Service
We believe that building connections between our employees, their families and our communities creates a more meaningful, fulfilling and enjoyable workplace. Through our SMP Cares® initiative, we sponsor corporate giving and
volunteering programs to encourage our employees to connect with our local communities and engage in the local causes that they are passionate about.
Our volunteering efforts include organizing blood drives with the American Red Cross, and fundraising for the March of Dimes, United Way, and many others. In 2022, we collaborated with our employees to donate over $135,000 to local community
organizations, schools, shelters, Ukraine, Project Hope, AACF, Habitat for Humanity, Love Independence, local parks, and Toys for Tots. We are a lifetime trustee of the University of the Aftermarket Foundation (“UAF”), and we donate $10,000
annually to fund scholarships to support the next generation of technicians and automotive professionals, which we believe is an important way to sustain and give back to our industry. We are also proud to sponsor annual scholarship contests for
future automotive technicians, including our Women in Auto Care scholarship that aims to empower women entering the automotive industry. Since our first scholarship contest in 2015, we have awarded $275,000 in scholarships. We have continued to
expand our scholarship program, and in 2022, we awarded four students each with a $5,000 scholarship to Women in AutoCare and to Blue Streak Better Then, Better Now Scholarship. We continue to encourage participation in these initiatives as we
believe they are essential in the support of our core values.
Governance
Our commitment to ESG is spearheaded by our Board of Directors. Specifically, our Nominating and Corporate Governance Committee established an ESG steering committee among our executive officers including our Chief Executive Officer &
President, Chief Legal Officer & Secretary, Chief Human Resources Officer, and Senior Vice President of North American Operations. This ESG steering committee is tasked with developing specific strategies to ensure that our operations adhere
to our corporate governance values and advance our ESG objectives. The multidisciplinary approach of our steering committee allows it to leverage our expertise in operations, engineering, supply chain, human capital management, finance, legal
and other fields to push our ESG initiatives ahead from all angles.
Continued Commitment
With each year, we intend to further our commitment to ESG initiatives, improving our environmental stewardship, finding ways to give back to our communities, and enhancing the diversity and inclusion of our workforce while offering
opportunities for development. Information on our ESG initiatives can be found in our most current sustainability report and on our corporate website at ir.smpcorp.com under “Environmental & Social
Responsibility” and at smpcares.smpcorp.com. Information in our sustainability report and on our corporate websites regarding our ESG initiatives are referenced for general information only and are not
incorporated by reference in this Report.
Available Information
We are a New York corporation founded in 1919. Our principal executive offices are located at 37‑18 Northern Boulevard, Long Island City, New York 11101, and our main telephone number at that location is (718) 392‑0200. Our Internet address
is www.smpcorp.com. We provide a link to reports that we have filed with the SEC. However, for those persons that make a request in writing or by e-mail (financial@smpcorp.com), we will provide free of
charge our Annual Report on Form 10-K, our Quarterly Reports on Form 10-Q, our Current Reports on Form 8-K and any amendments to those reports filed or furnished pursuant to Section 13(a) or 15(d) of the Securities Exchange Act of 1934. These
reports and other information are also available, free of charge, at www.sec.gov.
| ITEM 1A. |
RISK FACTORS
|
You should carefully consider the risks described below. These risks and uncertainties are not the only ones we face. Additional risks and uncertainties not presently known to us or other factors not perceived by
us to present significant risks to our business at this time also may impair our business and results of operations. If any of the stated risks actually occur, they could materially and adversely affect our business, financial condition or
operating results.
Risks Related to Our Operations
We depend on a limited number of key customers, and the loss of any such customer, or a significant reduction in purchases by such customer, could have a material adverse effect on our business, financial
condition and results of operations.
Our three largest individual customers accounted for approximately 59% of our consolidated net sales in 2022. During 2022, O’Reilly, AutoZone and NAPA accounted for 27%, 17% and 15% of our consolidated net sales, respectively. The loss of one
or more of these customers or, a significant reduction in purchases of our products from any one of them could have a materially adverse impact on our business, financial condition and results of operations. In addition, any consolidation among
our key customers may further increase our customer concentration risk.
We do not typically enter into long-term agreements with any of our customers. Instead, we enter into a number of purchase order commitments with our customers, based on their current or projected needs. We have in the past, and may in the
future, lose customers or lose a particular product line of a customer due to the highly competitive conditions in the automotive aftermarket industry, including pricing pressures, consolidation of customers, customer initiatives to buy direct
from foreign suppliers and/or to pursue a private brand strategy, or other business considerations. A decision by any significant customer, whether motivated by competitive conditions, financial difficulties or otherwise, to materially decrease
the amount of products purchased from us, to change their manner of doing business with us, or to stop doing business with us, including a decision to source products directly from a low cost region such as Asia, could have a material adverse
effect on our business, financial condition and results of operations. Because our sales are concentrated, and the market in which we operate is very competitive, we are under ongoing pressure from our customers to offer lower prices, extend
payment terms, increase marketing allowances and other terms more favorable to these customers. These customer demands have put continued pressure on our operating margins and profitability, resulted in periodic contract renegotiation to provide
more favorable prices and terms to these customers, and significantly increased our working capital needs.
Our industry is highly competitive, and our success depends on our ability to compete with suppliers of automotive products, some of which may have substantially greater financial, marketing and other resources
than we do.
The automotive industry is highly competitive, and our success depends on our ability to compete with domestic and international suppliers of automotive products. In the Engine Management Segment, we compete with: ACDelco, Aptiv Plc, Denso
Corporation, Continental AG, Hitachi, Ltd., Motorcraft, Robert Bosch GmbH, Visteon Corporation, NGK Spark Plug Co., Ltd., Dorman Products, Inc. and several privately-owned companies primarily importing products from Asia. In the Temperature
Control Segment, we compete with: ACDelco, MAHLE GmbH, Denso Corporation, Motorcraft, Sanden International (U.S.A.), Inc., Continental AG, Dorman Products, Inc., and several privately-owned companies. In addition, automobile manufacturers supply
many of the replacement parts we sell. Some of our competitors may have larger customer bases and significantly greater financial, technical and marketing resources than we do. These factors may allow our competitors to:
| • |
respond more quickly than we can to new or emerging technologies and changes in customer requirements by devoting greater resources than we can to the development, promotion and sale of automotive products and services;
|
| • |
engage in more extensive research and development;
|
| • |
sell products at a lower price than we do;
|
| • |
undertake more extensive marketing campaigns; and
|
| • |
make more attractive offers to existing and potential customers and strategic partners.
|
We cannot assure you that our competitors will not develop products or services that are equal or superior to our products or that achieve greater market acceptance than our products or that in the future other companies involved in the
automotive industry will not expand their operations into product lines produced and sold by us. We also cannot assure you that additional entrants will not enter the automotive industry or that companies in the industry will not consolidate.
Any such competitive pressures could cause us to lose market share or could result in significant price decreases and could have a material adverse effect upon our business, financial condition and results of operations.
There is substantial price competition in our industry, and our success and profitability will depend on our ability to maintain a competitive cost and price structure.
There is substantial price competition in our industry, and our success and profitability will depend on our ability to maintain a competitive cost and price structure. This is the result of a number of industry trends, including the impact
of offshore suppliers in the marketplace (particularly in China) which do not have the same infrastructure costs as we do, the consolidated purchasing power of large customers, and actions taken by some of our competitors in an effort to ‘‘win
over’’ new business. We have in the past reduced prices to remain competitive and may have to do so again in the future. Price reductions have impacted our sales and profit margins and may do so in the future. Our future profitability will
depend in part upon our ability to respond to changes in product and distribution channel mix, to continue to improve our manufacturing efficiencies, to generate cost reductions, including reductions in the cost of components purchased from
outside suppliers, to maintain a cost structure that will enable us to offer competitive prices, and to pass through higher distribution, raw materials and labor costs to our customers. Our inability to maintain a competitive cost structure
could have a material adverse effect on our business, financial condition and results of operations.
Our business is seasonal and is subject to substantial quarterly fluctuations, which impact our quarterly performance and working capital requirements.
Historically, our operating results have fluctuated by quarter, with the greatest sales occurring in the second and third quarters of the year and revenues generally being recognized at the time of shipment. It is in these quarters that demand
for our products is typically the highest, specifically in the Temperature Control Segment of our business.
In addition to this seasonality, the demand for our Temperature Control products during the second and third quarters of the year may vary significantly with the summer weather and customer inventories, as evidenced by the strong customer
demand in 2022 fueled by the record heat across the country in 2022 and the replenishment of customer inventory levels after very warm summer conditions in 2021. While the COVID-19 pandemic caused large shifts in sales demand between quarters in
2020, our business has returned to a more normalized pattern of seasonality and variability in demand of our Temperature Control products in 2022 and 2021. As such, our working capital typically peaks near the end of the second quarter, as the
inventory build‑up of air conditioning products was converted to sales, and payments on the receivables associated with such sales were yet to be received. During this period, our working capital requirements were funded by borrowing from our
revolving credit facility in our Credit Agreement.
Climate-related physical risks, such as changes to weather patterns and conditions may also impact the pattern of seasonality and variability in demand for our Temperature Control products discussed above, which may impact our quarterly
performance and working capital requirements.
We may incur material losses and significant costs as a result of warranty-related returns by our customers in excess of anticipated amounts.
Our products are required to meet rigorous standards imposed by our customers and our industry. Many of our products carry a warranty ranging from a 90-day limited warranty to a lifetime limited warranty, which generally covers defects in
materials or workmanship, failure to meet industry published specifications and/or the result of installation error. In the event that there are material deficiencies or defects in the design and manufacture of our products and/or installation
error, the affected products may be subject to warranty returns and/or product recalls. Although we maintain a comprehensive quality control program, we cannot give any assurance that our products will not suffer from defects or other
deficiencies or that we will not experience material warranty returns or product recalls in the future.
We accrue for warranty returns as a percentage of sales, after giving consideration to recent historical returns. While we believe that we make reasonable estimates for warranty returns in accordance with our revenue recognition policies,
actual returns may differ from our estimates. We have in the past incurred, and may in the future incur, material losses and significant costs as a result of our customers returning products to us for warranty-related issues in excess of
anticipated amounts. Deficiencies or defects in our products in the future may result in warranty returns and product recalls in excess of anticipated amounts and may have a material adverse effect on our business, financial condition and results
of operations.
Our profitability may be materially adversely affected as a result of overstock inventory related returns by our customers in excess of anticipated amounts.
We permit overstock returns of inventory that may be either new or non-defective or non-obsolete but that we believe we can re-sell. Customers are generally limited to returning overstocked inventory according to a specified percentage of
their annual purchases from us. In addition, a customer’s annual allowance cannot be carried forward to the upcoming year.
We accrue for overstock returns as a percentage of sales, after giving consideration to recent historical returns. While we believe that we make reasonable estimates for overstock returns in accordance with our revenue recognition policies,
actual returns may differ from our estimates. To the extent that overstocked returns are materially in excess of our projections, our business, financial condition and results of operations may be materially adversely affected.
We may be materially adversely affected by asbestos claims arising from products sold by our former brake business, as well as by other product liability claims.
In 1986, we acquired a brake business, which we subsequently sold in March 1998. When we originally acquired this brake business, we assumed future liabilities relating to any alleged exposure to asbestos-containing products manufactured by
the seller of the acquired brake business. In accordance with the related purchase agreement, we agreed to assume the liabilities for all new claims filed after September 2001. Our ultimate exposure will depend upon the number of claims filed
against us on or after September 2001, and the amounts paid for settlements, awards of asbestos-related damages, and defense of such claims. We do not have insurance coverage for the indemnity and defense costs associated with the claims we
face.
At December 31, 2022, 1,530 cases were outstanding for which we may be responsible for any related liabilities. Since inception in September 2001 through December 31, 2022, the amounts paid for settled claims and awards of asbestos-related
damages, including interest, were approximately $64.6 million. A substantial increase in the number of new claims, or increased settlement payments, or awards of asbestos-related damages, could have a material adverse effect on our business,
financial condition and results of operations.
In accordance with our policy to perform an annual actuarial evaluation in the third quarter of each year, an actuarial study was performed as of August 31, 2022. Based upon the results of the August 31, 2022 actuarial study, and all other
available information to us, we increased our asbestos liability to the low end of the range, and recorded an incremental pre-tax provision of $18.5 million in earnings (loss) from discontinued operations in the accompanying statement of
operations. The results of the August 31, 2022 study included an estimate of our undiscounted liability for settlement payments and awards of asbestos-related damages, excluding legal costs, ranging from $68.8 million to $111.6 million for the
period through 2065. Future legal costs, which are expensed as incurred and reported in earnings (loss) from discontinued operations in the accompanying statement of operations, are estimated, according to the August 31, 2022 study, to range
from $53.2 million to $105.7 million for the period through 2065.
Given the uncertainties associated with projecting asbestos-related matters into the future and other factors outside our control, we cannot give any assurance that significant increases in the number of claims filed against us will not occur,
that awards of asbestos-related damages or settlement awards will not exceed the amount we have in reserve, or that additional provisions will not be required. Management will continue to monitor the circumstances surrounding these potential
liabilities in determining whether additional reserves and provisions may be necessary. We plan on performing an annual actuarial analysis during the third quarter of each year for the foreseeable future, and whenever events or changes in
circumstances indicate that additional provisions may be necessary.
In addition to asbestos-related claims, our product sales entail the risk of involvement in other product liability actions. We maintain product liability insurance coverage, but we cannot give any assurance that current or future policy
limits will be sufficient to cover all possible liabilities. Further, we can give no assurance that adequate product liability insurance will continue to be available to us in the future or that such insurance may be maintained at a reasonable
cost to us. In the event of a successful product liability claim against us, a lack or insufficiency of insurance coverage could have a material adverse effect on our business, financial condition and results of operations.
We may not be able to achieve the benefits that we expect from our cost savings initiatives.
We expect to realize the continued benefit of discretionary cost reduction measures, along with the continued cost savings anticipated from several ongoing and/or recently completed restructuring and integration initiatives. Due to factors
outside our control, such as the adoption or modification of domestic and foreign laws, regulations or policies, we may not be able to achieve the level of benefits that we expect to realize in these initiatives, or we may not be able to realize
these benefits within the time frames we currently expect. Our ability to achieve any anticipated cost savings could be affected by a number of factors such as changes in the amount, timing and character of charges related to such initiatives,
or a substantial delay in the completion of such initiatives. Failure to achieve the benefits of our cost saving initiatives could have a material adverse effect on us. Our cost savings is also predicated upon maintaining our sales levels.
Severe weather, natural disasters and other disruptions could adversely impact our operations at our manufacturing and distribution facilities.
Severe weather conditions and natural disasters, such as hurricanes, tornados, earthquakes and floods, could damage our properties and effect our operations, particularly our major manufacturing and distribution operations at foreign
facilities in Canada, China, Mexico, Poland, Germany and Hungary and at our domestic facilities in Florida, Indiana, Kansas, South Carolina, Texas, Virginia, and Wisconsin. Moreover, global climate change may cause these natural disasters to
occur more frequently and/or with more intense effects, which could prevent us from, or cause delays in our ability to, manufacture and deliver products to our customers, and/or cause us to incur additional costs.
In addition, our business and operations could be materially adversely affected in the event of other serious disruptions at these facilities due to fire, electrical blackouts, power losses, telecommunications failures, terrorist attack or
similar events. Any of these occurrences could impair our ability to adequately manufacture or supply our customers due to all or a significant portion of our equipment or inventory being damaged. If our existing manufacturing or distribution
facilities become incapable of producing and supplying products for any reason, we may not be able to satisfy our customers’ requirements and we may lose revenue and incur significant costs and expenses that may not be recoverable through our
business interruption insurance.
Disruptions in the supply of raw materials, manufactured components, or equipment could materially and adversely affect our operations and cause us to incur significant cost increases.
We source various types of raw materials, finished goods, equipment, and component parts from suppliers as part of a global supply chain, and we may be materially and adversely affected by the failure of those suppliers to perform as
expected. Although we have had an adequate supply of purchased supplier raw materials, finished goods, equipment and component parts, disruptions in the global economy have impeded global supply chains, resulting in longer lead times and delays
in procuring component parts and raw materials, and inflationary cost increases in certain raw materials, labor and transportation. In response to the global supply chain volatility and inflationary cost increases, we have taken, and continue to
take, several actions to mitigate the impact by working closely with our suppliers and customers to minimize any potential adverse impacts on our business, including initiating cost savings initiatives and the pass through of higher costs to our
customers, which began in the fourth quarter of 2021. We expect these inflationary trends to continue for some time, and while we believe that we will be able to somewhat offset the impact, there can be no assurances that unforeseen future
events in the global supply chain affecting the availability of materials and components, and/or increasing commodity pricing, will not have a material adverse effect on our business, financial condition and results of operations.
Additionally, supplier non-performance may consist of delivery delays or failures caused by production issues or delivery of non-conforming products. Our suppliers’ ability to supply products to us is also subject to a number of risks,
including the availability and cost of raw materials, the destruction of their facilities, work stoppages, cyber attacks on their information technology systems or other limitations on their business operations, which could be caused by any
number of factors, such as labor disruptions, financial distress, severe weather conditions and natural disasters, social unrest, economic and political instability, and public health crises, including the occurrence of a contagious disease or
illness, such as the COVID-19 pandemic, war, terrorism or other catastrophic events. In addition, our failure to promptly pay, or order sufficient quantities of inventory from our suppliers may increase the cost of products we purchase or may
lead to suppliers refusing to sell products to us at all. Our efforts to protect against and to minimize these risks may not always be effective.
Our operations could be adversely affected by interruptions or breaches in the security of our computer and information technology systems.
We rely on information technology systems throughout our organization to conduct day-to-day business operations, including the management of our supply chain and our purchasing, receiving and distribution functions. We also routinely use our
information technology systems to send, receive, store, access and use sensitive data relating to our Company and its employees, customers, suppliers, and business partners, including intellectual property, proprietary business information, and
other sensitive materials. Additionally, we rely on our information technology systems to enable many of our employees to work remotely as a result of new policies and practices enacted by us.
Our information technology systems have been subject to cyber threats, including attempts to hack into our network and computer viruses. Such hacking attempts and computer viruses have not significantly impacted or interrupted our business
operations. While we implement security measures designed to prevent and mitigate the risk of cyber attacks, our information technology systems, and the systems of our customers, suppliers and business partners, may continue to be vulnerable to
computer viruses, attacks by hackers, or unauthorized access caused by employee error or malfeasance. The exploitation of any such vulnerability could unexpectedly compromise our information security, or the security of our customers, suppliers
and other business partners. Furthermore, because the techniques used to carry out cyber attacks change frequently and in many instances are not recognized until after they are used against a target, we may be unable to anticipate these changes
or implement adequate preventative measures. If our information technology systems, or the systems of our customers, suppliers or business partners, are subject to cyber attacks, such as those involving significant or extensive system
interruptions, sabotage, computer viruses or unauthorized access, we could experience disruptions to our business operations and incur substantial remediation costs, which could have a material adverse effect on our business, financial condition
or results of operations.
The transition risks associated with global climate change may cause us to incur significant costs.
In addition to the physical risks described above, global climate change has brought about certain risks associated with the anticipated transition to a lower-carbon economy, such as regulatory changes affecting vehicle emissions and fuel
efficiency requirements, technological changes in vehicle architectures, changes in consumer demand, carbon taxes, greenhouse gas emissions tracking, and regulation of greenhouse gas emissions from certain sources. Any regulatory changes aimed to
reduce or eliminate greenhouse gas emissions may require us to incur increased operating costs, such as to purchase and operate emissions control systems or other such technologies to comply with applicable regulations or reporting requirements.
These regulations, as well as shifts in consumer demand due to public awareness and concern of climate change, could affect the timing and scope of their proliferation and may also adversely impact our sales of products designed for the internal
combustion engines. As we monitor the rapid developments in this area, we may be required to adjust our business strategy to address the various transition risks posed by climate change.
Failure to maintain the value of our brands could have an adverse effect on our reputation, cause us to incur significant costs and negatively impact our business.
Our brands are an important component of our value proposition, and serve to distinguish our premium engine management and temperature control products from those of our competitors. We believe that our success depends, in part, on
maintaining and enhancing the value of our brands and executing our brand strategies, which are designed to drive end-user demand for our products and make us a valued business partner to our customers through the support of their marketing
initiatives. A decline in the reputation of our brands as a result of events, such as deficiencies or defects in the design or manufacture of our products, or from legal proceedings, product recalls or warranty claims resulting from such
deficiencies or defects, may harm our reputation as a manufacturer and distributor of premium automotive parts, reduce demand for our products and adversely affect our business.
Our revenue and results of operations may suffer upon the bankruptcy, insolvency or other credit failure of a significant customer.
Most of our customers buy products from us on credit. We extend credit to customers and offer extended payment terms based upon competitive conditions in the marketplace and our assessment and analysis of creditworthiness. General economic
conditions, competition and other factors may adversely affect the solvency or creditworthiness of our customers. Inflationary cost increases in raw materials, labor and transportation and a general worsening of economic conditions has put
financial pressure on many of our customers and may threaten certain customers’ ability to maintain liquidity sufficient to repay their obligations to us as they become due. The bankruptcy, insolvency or other credit failure of any customer that
has a substantial amount owed to us could have a material adverse effect on our operating revenue and results of operations. In January 2023, one of our customers filed a petition for bankruptcy. In connection with the bankruptcy filing, we
recorded a $7 million charge in 2022 to reduce our outstanding accounts receivable balance from the customer to our estimated recovery amount.
Risks Related to Liquidity
We are exposed to risks related to our receivables supply chain financing arrangements.
We are party to several supply chain financing arrangements, in which we may sell certain of our customers’ trade accounts receivable without recourse to such customers’ financial institutions. To the extent that these arrangements are
terminated, our financial condition, results of operations, cash flows and liquidity could be adversely affected by extended payment terms, delays or failures in collecting trade accounts receivables.
The utility of the supply chain financing arrangements also depends upon a benchmark reference rate for the purpose of determining the discount rate on the sale of the underlying trade accounts receivable. If the benchmark reference rate
increases significantly, we may be negatively impacted as we may not be able to pass these added costs on to our customers, which could have a material and adverse effect upon our financial condition, results of operations and cash flows.
Depending upon the level of sales of receivables pursuant these agreements, a hypothetical, instantaneous and unfavorable change of 100 basis points in the reference rate may have an approximate $8.1 million negative impact on our earnings or
cash flows.
A significant increase in our indebtedness, or in interest rates, could negatively affect our financial condition, results of operations and cash flows.
We have a Credit Agreement with JPMorgan Chase Bank, N.A., as administrative agent, and a syndicate of lenders, which we refer to throughout this Report as our Credit Agreement. The Credit Agreement provides for a $500 million credit facility
comprised of a $100 million term loan facility (the “term loan”) and a $400 million multi-currency revolving credit facility available in U.S. Dollars, Euros, Sterling, Swiss Francs, Canadian Dollars and other currencies as agreed to by the
administrative agent and the lenders (the “revolving facility”). As of December 31, 2022, our total outstanding indebtedness was $239.6 million, including outstanding borrowings under the Credit Agreement of $239.5 million, consisting of
current borrowings of $55 million and long-term borrowings of $184.5 million.
Borrowings under our Credit Agreement bear interest, at the Company’s election, at a rate per annum equal to Term SOFR plus 0.10% plus an applicable margin, or an alternate base rate plus an applicable margin, where the alternate base rate is
the greater of the prime rate, the federal funds effective rate plus 0.50%, and one-month Term SOFR plus 0.10% plus 1.00%. The applicable margin for the term benchmark borrowings ranges from 1.0% to 2.0%, and the applicable margin for alternate
base rate borrowings ranges from 0% to 1.0%, in each case, based on the total net leverage ratio of the Company and its restricted subsidiaries.
The significant increase in our indebtedness could:
| • |
increase our borrowing costs;
|
| • |
limit our ability to obtain additional financing or borrow additional funds;
|
| • |
require that a substantial portion of our cash flow from operations be used to pay principal and interest in our indebtedness, instead of funding working capital, capital expenditures, acquisitions, dividends, stock repurchases, or
other general corporate purposes;
|
| • |
limit our flexibility in planning for, or reacting to, changes in our business and the industry in which we operate; and
|
| • |
increase our vulnerability to general adverse economic and industry conditions.
|
In addition, the Company’s obligations under the Credit Agreement are guaranteed by its material domestic subsidiaries (each, a “Guarantor”), and secured by a first priority perfected security interest in substantially all of the existing and
future personal property of the Company and each Guarantor, subject to certain exceptions. The collateral security described above also secures certain banking services obligations and interest rate swaps and currency or other hedging
obligations of the Company owing to any of the then existing lenders or any affiliates thereof. Concurrently with the Company’s entry into the Credit Agreement, the Company also entered into a seven year interest rate swap agreement with Wells
Fargo Bank, N.A., Co-Syndication Agent and lender under the Credit Agreement, on $100 million of borrowings under the Credit Agreement. The interest rate swap agreement matures in May 2029.
The Credit Agreement contains customary covenants limiting, among other things, the incurrence of additional indebtedness, the creation of liens, mergers, consolidations, liquidations and dissolutions, sales of assets, dividends and other
payments in respect of equity interests, acquisitions, investments, loans and guarantees, subject, in each case, to customary exceptions, thresholds and baskets. The Credit Agreement also contains customary events of default. If we were default
on any of these covenants, or on any of our
indebtedness, if interest rates were to significantly increase, or the financial institution that is a party to our interest rate swap agreement were to default, or if we are unable to obtain necessary liquidity, our business could be
adversely affected.
We may not be able to generate the significant amount of cash needed to satisfy our obligations or maintain sufficient liquidity through borrowing capacities.
Our ability either to make payments on or to refinance our indebtedness, or to fund planned capital expenditures and research and development efforts, will depend on our ability to generate cash in the future. Our ability to generate cash is
in part subject to:
| • |
general economic, financial, competitive, legislative, regulatory and other factors that are beyond our control;
|
| • |
the ability of our customers to pay timely the amounts we have billed; and
|
| • |
our ability to sell receivables under supply chain financing arrangements.
|
The foregoing factors could result in reduced cash flow, which could have a material adverse effect on us. When cash generated by earnings is not sufficient for the Company’s liquidity needs, the Company seeks external financing. Our access to
funding sources in amounts adequate to finance our activities on terms that are beneficial to us could be impaired by factors that affect us specifically or the economy generally. During periods of disruptions in the credit and capital markets,
potential sources of external financing could be reduced, and borrowing costs could increase. A significant downgrade in the company’s credit ratings could increase its borrowing costs and limit access to capital.
Based on our current level of operations, we believe our cash flow from operations, available cash and available borrowings under our Credit Agreement will be adequate to meet our future liquidity needs for at least the next twelve months.
Significant assumptions underlie this belief, including, among other things, that we will be able to mitigate the future impact, if any, of disruptions in the supply chain caused by the COVID-19 pandemic, Russia’s invasion of the Ukraine and the
resultant sanctions imposed by the U.S. and other governments that may lead to a further increase in inventories to support our customers, and significant inflationary cost increases in raw materials, labor and transportation, and that there will
be no material adverse developments in our business, liquidity or capital requirements. If we are unable to fund our operations through earnings or external financing, we will be forced to adopt an alternative strategy that may include actions
such as:
| • |
deferring, reducing or eliminating future cash dividends;
|
| • |
reducing or delaying capital expenditures or restructuring activities;
|
| • |
reducing or delaying research and development efforts;
|
| • |
selling assets;
|
| • |
deferring or refraining from pursuing certain strategic initiatives and acquisitions;
|
| • |
refinancing our indebtedness; and
|
| • |
seeking additional funding.
|
We cannot assure you that, if material adverse developments in our business, liquidity or capital requirements should occur, our business will generate sufficient cash flow from operations, or that future borrowings will be available to us
under our Credit Agreement in amounts sufficient to enable us to pay the principal and interest on our indebtedness, or to fund our other liquidity needs. In addition, if we default on any of our indebtedness, or breach any financial covenant in
our Credit Agreement, our business could be adversely affected.
Risks Related to External Factors
We conduct our manufacturing and distribution operations on a worldwide basis and are subject to risks associated with doing business outside the United States.
We have manufacturing and distribution facilities in many countries, including Canada, Mexico, Poland, Germany and Hungary, as well as a joint-venture in China. Increasing our manufacturing footprint in low cost regions is an important
element of our strategy. There are a number of risks associated with doing business internationally, including: (a) exposure to local economic and political conditions; (b) social unrest such as risks of terrorism or other hostilities; (c)
currency exchange rate fluctuations and currency controls; (d) the effect of potential changes in U.S. trade policy and international trade agreements; and (e) the potential for shortages of trained labor.
In particular, historically there has been social unrest in Hong Kong and Mexico and any recurrence, or increased violence in or around our facilities in such countries could be disruptive to our business operations at such facilities, or
present risks to our employees who may be directly affected by the violence and may result in a decision by them to relocate from the area, or make it difficult for us to recruit or retain talented employees at such facilities.
Furthermore, changes in U.S. trade policy, particularly as it relates to China, have resulted in the assessment of increased tariffs on goods that we import into the United States, and have caused uncertainty about the future of free trade
generally. We benefit from free trade agreements, such as the U.S.-Mexico-Canada Agreement (USMCA). The repeal or modification of the USMCA or further increases to tariffs on goods imported into the United States could increase our costs to
source materials, component parts and finished goods from other countries. The likelihood of such occurrences and their potential effect on us is unpredictable and may vary from country to country. Any such occurrences could be harmful to our
business and our financial results.
We may incur liabilities under government regulations and environmental laws, which may have a material adverse effect on our business, financial condition and results of operations.
Domestic and foreign political developments and government laws and regulations directly affect automotive consumer products in the United States and abroad. In the United States, these laws and regulations include standards relating to
vehicle safety, fuel economy and emissions, among others. Furthermore, increased public awareness and concern regarding climate change may result in new laws and regulations designed to reduce or mitigate the effects of greenhouse gas emissions
or otherwise effect the transition to a lower-carbon economy. The modification of existing laws, regulations or policies, or the adoption of new laws, regulations or policies could have a material adverse effect on our business, financial
condition and results of operations.
Our operations and properties are subject to a wide variety of increasingly complex and stringent federal, state, local and international laws and regulations, including those governing the use, storage, handling, generation, treatment,
emission, release, discharge and disposal of materials, substances and wastes, the remediation of contaminated soil and groundwater and the health and safety of employees. Such environmental laws, including but not limited to those under the
Comprehensive Environmental Response Compensation & Liability Act, may impose joint and several liability and may apply to conditions at properties presently or formerly owned or operated by an entity or its predecessors, as well as to
conditions at properties at which wastes or other contamination attributable to an entity or its predecessors have been sent or otherwise come to be located.
The nature of our operations exposes us to the risk of claims with respect to such matters, and we can give no assurance that violations of such laws have not occurred or will not occur or that material costs or liabilities will not be
incurred in connection with such claims. We are currently monitoring our environmental remediation efforts at one of our facilities and our reserve balance related to the environmental clean-up at this facility is $1.5 million at December 31,
2022. The environmental testing and any remediation costs at such facility may be covered by several insurance policies, although we can give no assurance that our insurance will cover any environmental remediation claims. We also maintain
insurance to cover our existing U.S. and Canadian facilities. We can give no assurance that the future cost of compliance with existing environmental laws and the liability for known environmental claims pursuant to such environmental laws will
not give rise to additional significant expenditures or liabilities that would be material to us. In addition, future events, such as new information, changes in existing environmental laws or their interpretation, and more vigorous enforcement
policies of federal, state or local regulatory agencies, may have a material adverse effect on our business, financial condition and results of operations.
Our future performance may be materially adversely affected by changes in technologies and improvements in the quality of new vehicle parts.
If we do not respond appropriately to changes in automotive technologies, such as the adoption of new technologies and systems to make traditional, ICE vehicles more efficient, or the adoption of electric or hybrid electric vehicle
architectures, we could experience less demand for our products thereby causing a decline in our results of operations or deterioration in our business and financial condition, and we may have a material adverse effect on our long-term
performance.
In addition, the size of the automobile replacement parts market depends, in part, upon the growth in number of vehicles on the road, increase in average vehicle age, change in total miles driven per year, new or modified environmental and
vehicle safety regulations, including fuel economy and emissions reduction standards, increase in pricing of new cars and new car quality and related warranties. The automobile replacement parts market has been negatively impacted by the fact
that the quality of more recent automotive vehicles and their component parts (and related warranties) has improved, thereby lengthening the repair cycle. Generally, if parts last longer, there will be less demand for our products and the
average useful life of automobile parts has been steadily increasing in recent years due to innovations in products and technology. In addition, the introduction by original equipment manufacturers of increased warranty and maintenance
initiatives has the potential to decrease the demand for our products. When proper maintenance and repair procedures are followed, newer air conditioning (A/C) systems in particular are less prone to leak resulting in fewer A/C system repairs.
These factors could have a material adverse effect on our business, financial condition and results of operations.
Our business, results of operations and financial condition could be materially adversely affected by the effects of widespread public health crises, including the novel coronavirus (COVID-19) pandemic, that are
beyond our control.
The global outbreak of the novel coronavirus (COVID-19) pandemic created significant volatility, uncertainty and economic disruption in many countries in which we operate, including the United States, Mexico, Canada, Poland, Germany, Hungary
and China. We believe customer demand for our products and customer preferences regarding product mix and distribution channels were also impacted as a result of the pandemic, and significant uncertainty exists with respect to the general
economic conditions as we emerge from the pandemic, including rising inflation, disruptions in the supply chain and a possible national or global recession. If customer demand were to decrease in future periods, or if customer preferences
regarding product mix and distribution channels were to change, we may be required to adjust and reduce production volumes and implement cost reduction and cash preservation initiatives, including potential reductions in capital expenditures and
employee furloughs, which could have a material adverse impact on our business, results of operations and financial condition.
In certain countries in which we operate, national, state and local governments implemented a variety of measures in response to the COVID-19 pandemic. Many of these restrictions have been eased, however, there can be no guarantee that they
will not be implemented in the future. Any restrictions or limitations on our ability to perform such operations could have a material adverse effect on our business, results of operations and financial condition.
Furthermore, the COVID-19 pandemic and other public health crises could have a material adverse effect on the business, operations and financial condition of our customers, suppliers and other supply chain partners as a result of the
governmental measures described above, disruptions to their business and operations for reasons similar to those described above, and their ability to manage and mitigate the adverse effects of these and other risks unique to their business and
operations that may arise as a result of the pandemic.
| ITEM 1B. |
UNRESOLVED STAFF COMMENTS
|
None.
| ITEM 2. |
PROPERTIES
|
We maintain our executive offices in Long Island City, New York. The table below describes our principal facilities as of December 31, 2022.
|
Location
|
State or
Country
|
Principal Business Activity
|
Approx.
Square
Feet
|
Owned or
Expiration
Date
of Lease¹
|
||||
|
Engine Management
|
||||||||
|
Ft. Lauderdale
|
FL
|
Distribution
|
23,300
|
Owned
|
||||
|
Ft. Lauderdale
|
FL
|
Distribution
|
30,000
|
Owned
|
||||
|
Mishawaka
|
IN
|
Manufacturing
|
153,100
|
Owned
|
||||
|
Edwardsville
|
KS
|
Distribution
|
363,500
|
Owned
|
||||
|
Independence
|
KS
|
Manufacturing
|
337,400
|
Owned
|
||||
|
Long Island City
|
NY
|
Administration
|
75,800
|
2033
|
||||
|
Greenville
|
SC
|
Manufacturing
|
184,500
|
Owned
|
||||
|
Disputanta
|
VA
|
Distribution
|
411,000
|
Owned
|
||||
|
Sheboygan Falls
|
WI
|
Manufacturing
|
22,000
|
2025
|
||||
|
Milwaukee
|
WI
|
Manufacturing
|
84,000
|
2028
|
||||
|
Wuxi
|
China
|
Manufacturing
|
27,600
|
2023
|
||||
|
Kirchheim-Teck
|
Germany
|
Distribution
|
27,500
|
2031
|
||||
|
Pécel
|
Hungary
|
Manufacturing
|
33,500
|
2031
|
||||
|
Reynosa
|
Mexico
|
Manufacturing
|
175,000
|
2025
|
||||
|
Reynosa
|
Mexico
|
Manufacturing
|
153,000
|
2023
|
||||
|
Tijuana
|
Mexico
|
Manufacturing
|
37,500
|
2023
|
||||
|
Tijuana
|
Mexico
|
Distribution
|
13,800
|
2023
|
||||
|
Bialystok
|
Poland
|
Manufacturing
|
142,400
|
2027
|
||||
|
Temperature Control
|
||||||||
|
McAllen
|
TX
|
Distribution
|
120,300
|
2027
|
||||
|
Lewisville
|
TX
|
Administration and Distribution
|
415,000
|
2024
|
||||
|
St. Thomas
|
Canada
|
Manufacturing
|
42,500
|
Owned
|
||||
|
Reynosa
|
Mexico
|
Manufacturing
|
82,000
|
2026
|
||||
|
Reynosa
|
Mexico
|
Manufacturing
|
117,500
|
2026
|
||||
|
Reynosa
|
Mexico
|
Manufacturing
|
111,800
|
2024
|
||||
|
Other
|
||||||||
|
Mississauga
|
Canada
|
Administration and Distribution
|
82,400
|
2028
|
||||
|
Irving
|
TX
|
Training Center
|
13,400
|
2027
|
¹It is our intention to extend the leases that are set to expire in 2023.
| ITEM 3. |
LEGAL PROCEEDINGS
|
The information required by this Item is incorporated herein by reference to the information set forth in Item 8, “Financial Statements and Supplementary Data” of this Report under the captions “Asbestos” and “Other Litigation” appearing in
Note 23, “Commitments and Contingencies” of the Notes to Consolidated Financial Statements in Item 8 of this Report.
| ITEM 4. |
MINE SAFETY DISCLOSURES
|
Not applicable.
PART II
| ITEM 5. |
MARKET FOR THE REGISTRANT’S COMMON EQUITY, RELATED STOCKHOLDER MATTERS AND ISSUER PURCHASES OF EQUITY SECURITIES
|
Our common stock trades publicly on the New York Stock Exchange (“NYSE”) under the trading symbol “SMP.” The last reported sale price of our common stock on the NYSE on February 17, 2023 was $41.17 per share. As of February 17, 2023, there
were 518 holders of record of our common stock.
Dividends are declared and paid on the common stock at the discretion of our Board of Directors (the “Board”) and depend on our profitability, financial condition, capital needs, future prospects, and other factors deemed relevant by our
Board. Our Credit Agreement permits dividends and distributions by us provided specific conditions are met. For information related to our revolving credit facility, see Note 11, “Credit Facilities and Long-Term Debt,” of the Notes to
Consolidated Financial Statements in Item 8 of this Report.
There have been no unregistered offerings of our common stock during the fourth quarter of 2022.
Stock Performance Graph
The following graph compares the five year cumulative total return on the Company’s Common Stock to the total returns on the Standard & Poor’s 500 Stock Index and the S&P 1500 Auto Parts & Equipment Index, which is a combination of
automotive parts and equipment companies within the S&P 400, the S&P 500 and the S&P 600. The graph shows the change in value of a $100 investment in the Company’s Common Stock and each of the above indices on December 31, 2017 and
the reinvestment of all dividends. The comparisons in this table are required by the Securities and Exchange Commission and are not intended to forecast or be indicative of possible future performance of the Company’s Common Stock or the
referenced indices.
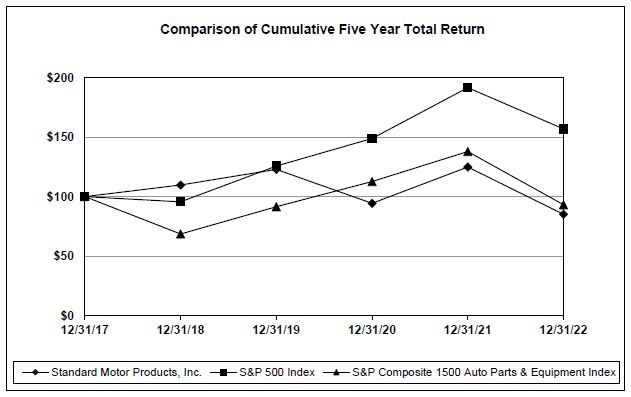
|
SMP
|
S&P 500
|
S&P 1500 Auto
Parts &
Equipment
Index
|
||||||||||
|
2017
|
100
|
100
|
100
|
|||||||||
|
2018
|
110
|
96
|
69
|
|||||||||
|
2019
|
123
|
126
|
92
|
|||||||||
|
2020
|
94
|
149
|
113
|
|||||||||
|
2021
|
125
|
192
|
138
|
|||||||||
|
2022
|
85
|
157
|
93
|
|||||||||
* Source: S&P Capital IQ
| ITEM 6. |
(RESERVED)
|
| ITEM 7. |
MANAGEMENT’S DISCUSSION AND ANALYSIS OF FINANCIAL CONDITION AND RESULTS OF OPERATIONS
|
Overview of Financial Performance
The following discussion should be read in conjunction with our consolidated financial statements and the notes thereto. This discussion summarizes the significant factors affecting our results of operations and the financial condition of our
business during each of the fiscal years in the three-year period ended December 31, 2022.
|
December 31,
|
||||||||||||
|
(In thousands, except per share data)
|
2022
|
2021
|
2020
|
|||||||||
|
Net sales
|
$
|
1,371,815
|
$
|
1,298,816
|
$
|
1,128,588
|
||||||
|
Gross profit
|
382,539
|
376,931
|
336,655
|
|||||||||
|
Gross profit %
|
27.9
|
%
|
29
|
%
|
29.8
|
%
|
||||||
|
Operating income
|
104,135
|
128,999
|
108,895
|
|||||||||
|
Operating income %
|
7.6
|
%
|
9.9
|
%
|
9.6
|
%
|
||||||
|
Earnings from continuing operations before income taxes
|
98,332
|
130,465
|
107,379
|
|||||||||
|
Provision for income taxes
|
25,206
|
31,044
|
26,962
|
|||||||||
|
Earnings from continuing operations
|
73,126
|
99,421
|
80,417
|
|||||||||
|
Loss from discontinued operations, net of income taxes
|
(17,691
|
)
|
(8,467
|
)
|
(23,024
|
)
|
||||||
|
Net earnings
|
55,435
|
90,954
|
57,393
|
|||||||||
|
Net earnings attributable to noncontrolling interest
|
84
|
68
|
—
|
|||||||||
|
Net earnings attributable to SMP
|
55,351
|
90,886
|
57,393
|
|||||||||
|
Per share data attributable to SMP – Diluted:
|
||||||||||||
|
Earnings from continuing operations
|
$
|
3.30
|
$
|
4.39
|
$
|
3.52
|
||||||
|
Discontinued operations
|
(0.80
|
)
|
(0.37
|
)
|
(1.01
|
)
|
||||||
|
Net earnings per common share
|
$
|
2.50
|
$
|
4.02
|
$
|
2.51
|
||||||
Consolidated net sales for 2022 were $1,371.8 million, an increase of $73 million, or 5.6% compared to net sales of $1,298.8 million in 2021, and an increase of $170.2 million, or 15.1%, compared to net sales of $1,128.6 million in 2020.
Consolidated net sales increased in both our Engine Management and Temperature Control Segments.
The increase in net sales in 2022 reflects the favorable impact of multiple factors including:
| • |
the price increases in both our segments, which were implemented to pass through inflationary increases in raw materials, distribution and labor costs,
|
| • |
incremental net sales in our Engine Management Segment from our soot sensor, Trombetta and Stabil acquisitions, and
|
| • |
continued strong customer demand in both our segments, and in particular in our Temperature Control Segment where the elevated customer demand we saw in 2021 held firm in 2022 fueled by record heat across the country and the
replenishment of customer inventory levels after very warm summer conditions in 2021.
|
Gross margins as a percentage of net sales in 2022 was 27.9% as compared to 29% in 2021 and 29.8% in 2020. Although the gross margin percentage decreased in 2022, gross margin dollars increased in 2022 to $382.5 million compared to $376.9
million in 2021 and $336.7 in 2020. The gross margin decrease as a percentage of sales in 2022 reflects the impact of lower fixed cost absorption due to lower and more normalized production, inflationary cost increases in raw materials, labor
and transportation, which were somewhat offset by increased pricing, the higher mix of non-aftermarket parts sales from recent acquisitions, which have a different profile than our aftermarket business with lower gross margins but comparable
operating margin, and higher freight and related expenses resulting from higher inventory levels. While we anticipate continued margin pressure resulting from inflationary cost increases, we believe that our annual cost initiatives and our
ability to pass through higher prices to our customers, will help to mitigate the impact of the inflationary increases on our margins.
Operating margin as a percentage of net sales in 2022 was 7.6% as compared to 9.9% in 2021 and 9.6% in 2020. Included in our operating margin were selling, general and administrative expenses (“SG&A”) of $276.6 million, or 20.2% of net
sales in 2022, $247.5 million, or 19.1% of net sales in 2021, and $224.7 million, or 19.9% of net sales in 2020. The higher SG&A expenses in 2022 is principally due to the impact of (1) higher interest rate related costs of $20.6 million
incurred in our supply chain financing arrangements, (2) the impact of the $7 million charge recorded in 2022 to reduce our outstanding accounts receivable balance from one of our customers that filed a petition for bankruptcy in January 2023 to
our estimated recovery amount, (3) incremental expenses of $7.2 million from our soot sensor, Trombetta and Stabil acquisitions, including amortization of intangible assets acquired, and (4) inflationary cost increases resulting in higher
distribution and freight costs. SG&A expenses in 2022 were favorably impacted by the higher mix of non-aftermarket parts sales from recent acquisitions, which have a different profile than our aftermarket business with lower SG&A
expenses as a percentage of sales.
Overall, our core automotive aftermarket business demand remains strong, and we continue to make major strides into new complementary markets with upside potential.
New $500 Million Credit Facility
In June 2022, we entered into a new Credit Agreement with JPMorgan Chase Bank, N.A., as administrative agent, and a syndicate of lenders (the “Credit Agreement”). The Credit Agreement provides for a $500 million credit facility comprised of a
$100 million term loan facility (the “term loan”) and a $400 million multi-currency revolving credit facility (the “revolving facility”). Concurrently with our entry into the Credit Agreement, we also entered into a seven year interest rate swap
agreement with Wells Fargo Bank, N.A., Co-Syndication Agent and lender under the Credit Agreement on $100 million of borrowings under the Credit Agreement to manage exposure to interest rate changes. The interest rate swap agreement matures in
May 2029.
Borrowings under the Credit Agreement were used to repay all outstanding borrowings under the existing 2015 Credit Agreement, and pay certain fees and expenses incurred in connection with the Credit Agreement, with future borrowings used for
other general corporate purposes of the Company and its subsidiaries. The term loan amortizes in quarterly installments of 1.25% in each of the first four years, and quarterly installments of 2.5% in the fifth year of the Credit Agreement. The
Credit Agreement matures on June 1, 2027. The Company may request up to two one-year extensions of the maturity date.
Impact of Russia’s Invasion of the Ukraine
Russia’s invasion of the Ukraine, and the resultant sanctions imposed by the U.S. and other governments, have created risks, uncertainties and disruptions impacting business continuity, liquidity and asset values not only in the Ukraine and
Russia, but in markets worldwide. Significant price increases have occurred in gas and energy markets, as well as in other commodities. Although we have no facilities or business operations in either the Ukraine or Russia, have historically had
only minor sales to customers in Russia, which we have subsequently discontinued, and have not experienced additional significant disruptions in the supply chain, the inherent risks and uncertainties surrounding the invasion are being closely
monitored. We have manufacturing and distribution facilities in Bialystok, Poland and Pecel, Hungary. Our facility in Bialystok, Poland does not use natural gas in its production process, or for heating, and, as such, is not impacted by Russia’s
decision to halt the export of all natural gas to Poland and Bulgaria. While we have not been impacted by the war to date, there can be no assurances that any escalation of the invasion will not have an adverse impact on our business, financial
condition and results of operations.
Impact of Global Supply Chain Disruption and Inflation
Disruptions in the global economy have impeded global supply chains, resulted in longer lead times and delays in procuring component parts and raw materials, and resulted in inflationary cost increases in certain raw materials, labor and
transportation. In response to the global supply chain volatility and inflationary cost increases, we have taken, and continue to take, several actions to mitigate the impact by working closely with our suppliers and customers to minimize any
potential adverse impacts on our business, including implementing cost savings initiatives and the pass through of higher costs to our customers in the form of price increases, and increasing inventory levels to minimize the obvious disruptions
from out-of-stock raw materials and components to ensure higher fill rates with our customers. We believe that we have also benefited from our geographically diversified manufacturing footprint and our strategy to bring more product
manufacturing in-house, especially with respect to product availability and fill rates. We expect these inflationary trends to continue for some time, and while we believe that we will be able to somewhat offset the impact, there can be no
assurances that unforeseen future events in the global supply chain affecting the availability of materials and components, and/or increasing commodity pricing, will not have an adverse effect on our business, financial condition and results of
operations.
Environmental, Social, & Governance (“ESG”)
Our Company was founded in 1919 on the values of integrity, common decency and respect for others. These values continue to this day and are embodied in our Code of Ethics, which has been adopted by the Board of Directors of the Company to
serve as a statement of principles to guide our decision-making and reinforce our commitment to these values in all aspects of our business. These values also serve as the foundation for our increased focus on many important environmental,
social and governance issues, such as environmental stewardship and our efforts to identify and implement practices that reduce our environmental impact while achieving our business goals; our attention to diversity, equity and inclusion,
employee development, retention, and health and safety; and our community engagement initiatives, to name a few.
We have made significant strides with respect to our ESG initiatives, building awareness of the environmental impact of our operations, and challenging ourselves to reduce our impact by reducing our usage of energy and water, reducing our
generation of waste, increasing our recycling efforts and reducing our greenhouse gas emissions (“GHG”), with the ambition of achieving net-zero GHG emissions by 2050. With each year, we intend to further our commitment to improving our
environmental stewardship and finding ways to give back to our communities. Additional information on our ESG initiatives can be found under the heading, “Environmental, Social and Governance (ESG) and Human Capital,” in Part I, Item 1 of this
Report, and on our corporate website at ir.smpcorp.com under “Environmental & Social Responsibility” and at smpcares.smpcorp.com. Information on our
corporate websites regarding our ESG initiatives are referenced for general information only and are not incorporated by reference in this Report.
Comparison of Results of Operations For Fiscal Years 2022 and 2021
Sales. Consolidated net sales for 2022 were $1,371.8 million, an increase of $73 million, or 5.6%, compared to $1,298.8 million in the same
period of 2021, with the majority of our net sales to customers located in the United States. Consolidated net sales increased in both our Engine Management and Temperature Control Segments.
The following table summarizes consolidated net sales by segment and by major product group within each segment for the years ended December 31, 2022 and 2021 (in thousands):
|
Year Ended December 31,
|
||||||||
|
2022
|
2021
|
|||||||
|
Engine Management:
|
||||||||
|
Ignition, Emission Control, Fuel & Safety Related System Products
|
$
|
824,677
|
$
|
786,514
|
||||
|
Wire and Cable
|
150,566
|
151,422
|
||||||
|
Total Engine Management
|
975,243
|
937,936
|
||||||
|
Temperature Control:
|
||||||||
|
Compressors
|
222,532
|
206,697
|
||||||
|
Other Climate Control Parts
|
159,753
|
141,726
|
||||||
|
Total Temperature Control
|
382,285
|
348,423
|
||||||
|
All Other
|
14,287
|
12,457
|
||||||
|
Total
|
$
|
1,371,815
|
$
|
1,298,816
|
||||
Engine Management’s net sales increased $37.3 million, or 4%, to $975.2 million for the year ended December 31, 2022. Net sales in ignition, emission control, fuel and safety related system products for the year ended December 31, 2022 were
$824.7 million, an increase of $38.2 million, or 4.9%, compared to $786.5 million in the same period of 2021. Net sales in the wire and cable product group for the year ended December 31, 2022 were $150.6 million, an decrease of $0.8 million, or
0.5%, compared to $151.4 million in the same period of 2021. Engine Management’s increase in net sales for the year ended December 31, 2022 compared to the same period in 2021, reflects the impact of the positive contribution of incremental
sales from our soot sensor, Trombetta and Stabil acquisitions, strong customer demand, and price increases implemented in 2022, which were implemented to pass through inflationary increases in raw materials, distribution and labor costs.
Incremental net sales from our soot sensor, Trombetta and Stabil acquisitions of $44.6 million were included in the net sales of the ignition, emission control, fuel and safety related system product group for the year ended December 31,
2022. Compared to the year ended December 31, 2021, excluding the incremental net sales from the acquisitions, net sales in the ignition, emission control, fuel and safety related product group decreased $6.4 million, or 0.8%, and Engine
Management net sales decreased $7.3 million, or 0.8%.
Temperature Control’s net sales increased $33.9 million, or 9.7%, to $382.3 million for the year ended December 31, 2022. Net sales in the compressors product group for the year ended December 31, 2022 were $222.5 million, an increase of
$15.8 million, or 7.6%, compared to $206.7 million in the same period of 2021. Net sales in the other climate control parts group for the year ended December 31, 2022 were $159.8 million, an increase of $18.1 million, or 12.7%, compared to
$141.7 million for the year ended December 31, 2021. Temperature Control’s increase in net sales for the year ended December 31, 2022, when compared to the same period in 2021, reflects the impact of continued strong customer demand, with the
elevated demand we saw in 2021 holding firm, fueled by record heat across the country in 2022 and the replenishment of customer inventory levels after very warm summer conditions in 2021, and the impact of price increases, which were implemented
to pass through inflationary increases in raw materials, distribution and labor costs. Demand for our Temperature Control products may vary significantly with summer weather conditions and customer inventory levels.
Gross Margins. Gross margins, as a percentage of consolidated net sales, decreased to 27.9% for 2022, compared to 29% for 2021. The following table summarizes gross margins by
segment for the years ended December 31, 2022 and 2021, respectively (in thousands):
|
Year Ended
December 31,
|
Engine Management
|
Temperature Control
|
Other
|
Total
|
||||||||||||
|
2022
|
||||||||||||||||
|
Net sales (a)
|
$
|
975,243
|
$
|
382,285
|
$
|
14,287
|
$
|
1,371,815
|
||||||||
|
Gross margins
|
262,954
|
102,640
|
16,945
|
382,539
|
||||||||||||
|
Gross margin percentage
|
27
|
%
|
26.8
|
%
|
—
|
%
|
27.9
|
%
|
||||||||
|
2021
|
||||||||||||||||
|
Net sales (a)
|
$
|
937,936
|
$
|
348,423
|
$
|
12,457
|
$
|
1,298,816
|
||||||||
|
Gross margins
|
266,961
|
95,138
|
14,832
|
376,931
|
||||||||||||
|
Gross margin percentage
|
28.5
|
%
|
27.3
|
%
|
—
|
%
|
29
|
%
|
||||||||
| (a) |
Segment net sales include intersegment sales in our Engine Management and Temperature Control segments.
|
Compared to 2021, gross margins at Engine Management decreased 1.5 percentage points from 28.5% to 27%, while gross margins at Temperature Control decreased 0.5 percentage points from 27.3% to 26.8%. The gross margin percentage decrease in
Engine Management compared to the prior year reflects the impact of lower fixed cost absorption due to lower and more normalized production, inflationary cost increases in raw materials, labor and transportation, which were somewhat offset by
increased pricing, the higher mix of non-aftermarket parts sales from recent acquisitions, which have a different profile than our aftermarket business with lower gross margins but comparable operating margin, and higher freight and related
expenses resulting from higher inventory levels.
The gross margin percentage decrease in Temperature Control compared to the prior year reflects the impact of inflationary cost increases in raw materials, labor and transportation, and higher freight and related expenses resulting from higher
inventory levels, which were somewhat offset by seasonal volume, customer mix and increased pricing. While we anticipate continued margin pressures at both Engine Management and Temperature Control resulting from inflationary cost increases, we
believe that our annual cost initiatives, and our ability to pass through higher prices to our customers, will help to offset the impact of the inflationary increases on our margins.
Selling, General and Administrative Expenses. Selling, general and administrative expenses (“SG&A”) increased to $276.6 million, or 20.2% of consolidated net sales in 2022, as
compared to $247.5 million, or 19.1% of consolidated net sales in 2021. The $29.1 million increase in SG&A expenses as compared to 2021 is principally due to the impact of (1) higher interest related costs of $20.6 million incurred in our
supply chain financing arrangements, (2) the impact of the $7 million charge recorded in 2022 to reduce our outstanding accounts receivable balance from one of our customers that filed a petition for bankruptcy in January 2023 to our estimated
recovery amount, (3) incremental expenses of $7.2 million from our soot sensor, Trombetta and Stabil acquisitions, including amortization of intangible assets acquired, and (4) inflationary cost increases resulting in higher distribution and
freight costs. SG&A expenses in 2022 were favorably impacted by the higher mix of non-aftermarket parts sales from recent acquisitions, which have a different profile than our aftermarket business with lower SG&A expenses as a percentage
of sales.
Restructuring and Integration Expenses. Restructuring and integration expenses were $1.9 million in 2022 compared to restructuring and integration expenses of $0.4 million in 2021.
Restructuring and integration expenses incurred in 2022 of $1.9 million related to (1) severance costs of approximately $0.9 million in connection with a reduction in our sales force, (2) expenses of approximately $0.6 million consisting of
employee severance costs related to our product line relocations from our Independence, Kansas manufacturing facility in our Engine Management Segment and from our St. Thomas, Canada manufacturing facility in our Temperature Control Segment to
our manufacturing facilities in Reynosa, Mexico, (3) relocation expenses of approximately $0.1 million in our Engine Management Segment of certain inventory, machinery, and equipment acquired in our 2021 soot sensor acquisition to our facilities
in Independence, Kansas and Bialystok, Poland, and (4) the $0.2 million increase in environmental cleanup costs for ongoing monitoring and remediation in connection with the prior closure of our manufacturing operations at our Long Island City,
New York location.
Restructuring and integration expenses incurred in 2021 of $0.4 million related to relocation in our Engine Management Segment of certain inventory, machinery, and equipment acquired in our 2021 soot sensor acquisition to our facilities in
Independence, Kansas and Bialystok, Poland. The soot sensor product line relocation has been substantially completed.
Operating Income. Operating income was $104.1 million, or 7.6%, of consolidated net sales in 2022, compared to $129 million, or 9.9%, of consolidated net sales in 2021. The
year-over-year decrease in operating income of $24.9 million is the result of higher SG&A expenses driven primarily by the increased interest rate costs incurred in our supply chain financing arrangements, and to a lesser extent by the impact
of lower gross margins as a percentage of consolidated net sales and higher restructuring and integration costs offset, in part, by higher consolidated net sales.
Other Non-Operating Income (Expense), Net. Other non-operating income, net was $4.8 million in 2022, compared to $3.5 million in 2021. The year-over-year increase in other
non-operating income, net results primarily from the favorable impact of changes in foreign currency exchange rates, and to a lesser extent the increase in year-over-year equity income from our joint ventures.
Interest Expense. Interest expense increased to $10.6 million in 2022, compared to $2 million in 2021. The year-over-year increase in interest expense reflects the impact of higher
average outstanding borrowings in 2022 when compared to 2021, and the impact of higher year-over-year average interest rates on our credit facilities.
Income Tax Provision. The income tax provision for 2022 was $25.2 million at an effective tax rate of 25.6%, compared to $31 million at an
effective tax rate of 23.8% in 2021. The higher effective tax rate in 2022 compared to 2021 results primarily from the income tax provision impact related to the exercise of restricted stock.
Loss From Discontinued Operations. Loss from discontinued operations, net of income tax, reflects information contained in the actuarial studies performed as of August 31, 2022 and
2021, as well as other information available and considered by us, and legal expenses and other costs associated with our asbestos-related liability. During the years ended December 31, 2022 and 2021, we recorded a net loss of $17.7 million and
$8.5 million from discontinued operations, respectively. The loss from discontinued operations for the year ended December 31, 2022 and 2021 includes an $18.5 million and $5.3 million pre-tax provision, respectively, to increase our indemnity
liability in line with the 2022 and 2021 actuarial studies; and legal expenses and other miscellaneous expenses, before taxes, of $5.4 million and $6.1 million for 2022 and 2021, respectively. As discussed more fully in Note 23 “Commitments and
Contingencies” of the Notes to Consolidated Financial Statements in Item 8 of this Report, we are responsible for certain future liabilities relating to alleged exposure to asbestos containing products.
Net Earnings Attributable to Noncontrolling Interest. In May 2021, we acquired the Trombetta business for $111.7 million. As part of the acquisition, we acquired a 70% ownership in a
joint venture in Hong Kong, with operations in Shanghai and Wuxi, China (“Trombetta Asia, Ltd.”). Net earnings attributable to the noncontrolling interest of $84,000 and $68,000 during the years ended December 31, 2022 and 2021, respectively,
represents 30% of the net earnings of Trombetta Asia, Ltd.
Comparison of Results of Operations For Fiscal Years 2021 and 2020
For a detailed discussion on the comparison of fiscal year 2021 to fiscal year 2020, see Item 7 “Management’s Discussion and Analysis of Financial Condition and Results of Operations” in the Company’s Annual Report on Form 10-K for the
fiscal year ended December 31, 2021.
Restructuring and Integration Programs
For a detailed discussion on the restructuring and integration costs, see Note 3, “Restructuring and Integration Expense,” of the Notes Consolidated Financial Statements in Item 8 of this Report.
Liquidity and Capital Resources
Operating Activities. During 2022, cash used in operating activities was $27.5 million compared to cash provided by operating activities of $85.6 million in 2021. The increase in
cash used in operating activities resulted primarily from the decrease in net earnings, the smaller year-over-year decrease in accounts receivable, the decrease in accounts payable compared to a year-over-year increase in accounts payable, the
larger year-over-year increase in prepaid expenses and other current assets, and the decrease in sundry payables and accrued expenses compared to a year-over-year increase in sundry payables and accrued expenses offset, in part, by the smaller
year-over-year increase in inventories.
Net earnings during 2022 were $55.4 million compared to $91 million in 2021. During 2022 (1) the decrease in accounts receivable was $6.9 million compared to the year-over-year decrease in accounts receivable of $28.5 million in 2021; (2) the
increase in inventories was $67.5 million compared to the year-over-year increase in inventories of $107.6 million in 2021; (3) the decrease in accounts payable was $48.6 million compared to the year-over-year increase in accounts payable of $33
million in 2021; (4) the increase in prepaid expenses and other current assets was $5.5 million compared to the year-over-year increase in prepaid expenses and other current assets of $0.8 million in 2021; and (5) the decrease in sundry payables
and accrued expenses was $29.1 million compared to the year-over-year increase in sundry payables and accrued expenses of $13.4 million in 2021. The increase in inventories during 2022 and 2021 reflects actions taken beginning in the fourth
quarter of 2021 to meet ongoing customer demand, the impact of materials inflation, and higher safety stocks of raw materials given the volatility in the supply chain. The decrease in accounts payable in 2022 reflects the timing of payments to
vendors for inventory purchases made in the fourth quarter of 2021, as well as the timing of inventory purchases made in 2022, including the impact of a reduction in inventory purchases in the second half of the year; while the decrease in sundry
payments in 2022 reflects the impact of lower employee compensation accruals. We continue to actively manage our working capital to maximize our operating cash flow.
Investing Activities. Cash used in investing activities was $27.8 million in 2022 compared to $151.2 million in 2021. Investing activities
during 2022 consisted of (1) the cash payment of $1.7 million for our acquisition of 100% of the capital stock of Kade Trading GmbH, a German company, (“Kade”) , net of $1 million of cash acquired and the $0.5 million earn-out; (2) the payment of
$0.2 million for our 3.55% increase in equity ownership in Foshan Che Yijia New Energy Technology Co., Ltd., (“CYJ”), a China-based joint venture that manufactures automotive electric air conditioning compressors; and (3) capital expenditures of
$26 million.
Investing activities in 2021 consisted of (1) the payment of $15.4 million, net of $0.9 million of cash acquired, for our acquisition of 100% of the capital stock of Stabil Operative Group GmbH, a German company, (“Stabil”); (2) the payment of
$107.1 million, net of $4.6 million of cash acquired, for our acquisition of 100% of the capital stock of Trumpet Holdings, Inc., a Delaware corporation, (“Trombetta”); (3) the payment of $2.9 million for our acquisition of certain assets of the
soot sensor product lines from Stoneridge, Inc.; and (4) capital expenditures of $25.9 million.
Financing Activities. Cash provided by financing activities was $55.5 million in 2022 compared to $69 million in 2021. In June 2022, we
entered into a new credit agreement with JPMorgan Chase Bank, N.A., as agent. The new credit agreement provides for a $500 million credit facility comprised of a $100 million term loan facility and a $400 million revolving credit facility.
Borrowings under the new credit facility were used to repay all outstanding borrowings under the then existing revolving credit facility, and certain fees and expenses incurred in connection with the refinancing.
During 2022, we (1) increased our borrowings under our revolving credit facilities by $114.2 million; (2) reduced our borrowings under lease obligations and our Polish overdraft facility by $2.9 million; (3) made cash payments of $2.1 million
for debt issuance costs in connection with our refinancing; (4) made cash payments for the repurchase of shares of our common stock of $29.7 million; and (5) paid dividends of $23.4 million. Cash provided by borrowings under our credit
facilities were used to fund our operating activities, investing activities, reduce our borrowings under lease obligations and our Polish overdraft facility, pay debt issuance costs in connection with the refinancing, purchase shares of our
common stock and pay dividends.
Cash provided by financing activities was $69 million in 2021. During 2021, we (1) increased our borrowings under our revolving credit facility by $115.3 million; (2) increased our borrowings under lease obligations and our Polish overdraft
facility by $3 million; (3) made cash payments for the repurchase of shares of our common stock of $26.8 million; and (4) paid dividends of $22.2 million. Cash provided by operating activities, along with borrowings under our revolving credit
agreement, lease obligations and Polish overdraft facility were used to fund our investing activities, purchase shares of our common stock and pay dividends.
Dividends of $23.4 million and $22.2 million were paid in 2022 and 2021, respectively. Quarterly dividends were paid at a rate of $0.27 in 2022 and $0.25 in 2021. In February 2023, our Board of Directors voted to increase our quarterly
dividend from $0.27 per share in 2022 to $0.29 per share in 2023.
Comparison of Liquidity and Capital Resources For Fiscal Years 2021 and 2020
For a detailed discussion of our Liquidity and Capital Resources comparison of fiscal year 2021 to fiscal year 2020, see Item 7 “Management’s Discussion and Analysis of Financial Condition and Results of Operations” in the Company’s Annual
Report on Form 10-K for the fiscal year ended December 31, 2021.
Liquidity
Our primary cash requirements include working capital, capital expenditures, regular quarterly dividends, stock repurchases, principal and interest payments on indebtedness and acquisitions. Our primary sources of funds are ongoing net cash
flows from operating activities and availability under our Credit Agreement (as detailed below).
In June 2022, we entered into a new Credit Agreement with JPMorgan Chase Bank, N.A., as administrative agent, and a syndicate of lenders (the “Credit Agreement”). The Credit Agreement provides for a $500 million credit facility comprised of a
$100 million term loan facility (the “term loan”) and a $400 million multi-currency revolving credit facility available in U.S. Dollars, Euros, Sterling, Swiss Francs, Canadian Dollars and other currencies as agreed to by the administrative agent
and the lenders (the “revolving facility”). The Credit Agreement replaces and refinances the existing Credit Agreement, dated as of October 28, 2015, among the Company, SMP Motor Products Ltd. and Trumpet Holdings, Inc., as borrowers, JPMorgan
Chase Bank, N.A., as administrative agent and lender, and the other lenders named therein (the “2015 Credit Agreement”).
Borrowings under the Credit Agreement were used to repay all outstanding borrowings under the 2015 Credit Agreement, and pay certain fees and expenses incurred in connection with the Credit Agreement, with future borrowings used for other
general corporate purposes of the Company and its subsidiaries. The term loan amortizes in quarterly installments of 1.25% in each of the first four years, and quarterly installments of 2.5% in the fifth year of the Credit Agreement. The
revolving facility has a $25 million sub-limit for the issuance of letters of credit and a $25 million sub-limit for the borrowing of swingline loans. The maturity date is June 1, 2027. The Company may request up to two one-year extensions of
the maturity date.
The Company may, upon the agreement of one or more of then existing lenders or of additional financial institutions not currently party to the Credit Agreement, increase the revolving facility commitments or obtain incremental term loans by an
aggregate amount not to exceed (x) the greater of (i) $168 million or (ii) 100% of consolidated EBITDA (as defined in the Credit Agreement) for the four fiscal quarters ended most recently before such date, plus (y) the amount of any voluntary
prepayment of term loans, plus (z) an unlimited amount so long as, immediately after giving effect thereto, the pro forma First Lien Net Leverage Ratio (as defined in the Credit Agreement) does not exceed 2.5 to 1.0.
Term loan and revolver facility borrowings in U.S. Dollars bear interest, at the Company’s election, at a rate per annum equal to Term SOFR plus 0.10% plus an applicable margin, or an alternate base rate plus an applicable margin, where the
alternate base rate is the greater of the prime rate, the federal funds effective rate plus 0.50%, and one-month Term SOFR plus 0.10% plus 1.00%. Term loan borrowings are being made at one-month Term SOFR. The applicable margin for the term
benchmark borrowings ranges from 1.0% to 2.0%, and the applicable margin for alternate base rate borrowings ranges from 0% to 1.0%, in each case, based on the total net leverage ratio of the Company and its restricted subsidiaries. The Company
may select interest periods of one, three or six months for Term SOFR borrowings. Interest is payable at the end of the selected interest period, but no less frequently than quarterly.
The Company’s obligations under the Credit Agreement are guaranteed by its material domestic subsidiaries (each, a “Guarantor”), and secured by a first priority perfected security interest in substantially all of the existing and future
personal property of the Company and each Guarantor, subject to certain exceptions. The collateral security described above also secures certain banking services obligations and interest rate swaps and currency or other hedging obligations of
the Company owing to any of the then existing lenders or any affiliates thereof. Concurrently with the Company’s entry into the Credit Agreement, the Company also entered into a seven year interest rate swap agreement with Wells Fargo Bank,
N.A., Co-Syndication Agent and lender under the Credit Agreement, on $100 million of borrowings under the Credit Agreement. The interest rate swap agreement matures in May 2029.
Outstanding borrowings at December 31, 2022 under the Credit Agreement were $239.5 million, consisting of current borrowings of $55 million and long-term debt of $184.5 million; while outstanding borrowings at December 31, 2021 under the 2015
Credit Agreement were $125.3 million, consisting of current borrowings. Letters of credit outstanding under the Credit Agreement were $2.4 million at December 31, 2022, and $2.6 million under the 2015 Credit Agreement at December 31, 2021.
Borrowings at December 31, 2021 under the 2015 Credit Agreement have been classified as current liabilities based upon accounting rules and certain provisions in the agreement.
At December 31, 2022, the weighted average interest rate under our Credit Agreement was 5.2%, which consisted of $237 million in borrowings at 5.2% under Term SOFR, adjusted for the impact of the interest rate swap agreement on $100 million of
borrowings, and an alternative base rate borrowing of $2.5 million at 8%. At December 31, 2021, the weighted average interest rate on our 2015 Credit Agreement was 1.4%, which consisted of $125 million in direct borrowings at 1.4% and
alternative base rate loan of $0.3 million at 3.5%. During the year ended December 31, 2022, our average daily alternative base rate loan balance was $5.6 million, compared to a balance of $1.1 million for the year ended December 31, 2021.
The Credit Agreement contains customary covenants limiting, among other things, the incurrence of additional indebtedness, the creation of liens, mergers, consolidations, liquidations and dissolutions, sales of assets, dividends and other
payments in respect of equity interests, acquisitions, investments, loans and guarantees, subject, in each case, to customary exceptions, thresholds and baskets. The Credit Agreement also contains customary events of default.
In October 2022, our Polish subsidiary, SMP Poland sp. z.o.o., amended its overdraft facility with HSBC Continental Europe (Spolka Akcyjna) Oddzial w Polsce to provide for borrowings under the facility in Euros and U.S. Dollars. Under the
amended terms, the overdraft facility provides for borrowings of up to Zloty 30 million (approximately $6.8 million) if borrowings are solely in Zloty, or up to 85% of the Zloty 30 million limit (approximately $5.8 million) if borrowings are in
Euros and/or U.S. Dollars. The overdraft facility has an initial maturity date in December 2022, with automatic three-month renewals until June 2027, subject to cancellation by either party, at its sole discretion, at least 30 days prior to the
commencement of the three-month renewal period. Borrowings under the amended overdraft facility will bear interest at a rate equal to (1) the one month Warsaw Interbank Offered Rate (“WIBOR”) + 1.5% for borrowings in Polish Zloty, (2) the one
month Euro Interbank Offered Rate (“EURIBOR”) + 1.5% for borrowings in Euros, and (3) the Mid-Point of the Fed Target Range + 1.75% for borrowings in U.S Dollars. Borrowings under the overdraft facility are guaranteed by Standard Motor Products,
Inc., the ultimate parent company. At December 31, 2021, borrowings under the overdraft facility were Zloty 12.3 million (approximately $3 million). There were no borrowings outstanding under the overdraft facility at December 31, 2022.
In order to reduce our accounts receivable balances and improve our cash flow, we are party to several supply chain financing arrangements, in which we may sell certain of our customers’ trade accounts receivable to such customers’ financial
institutions. We sell our undivided interests in certain of these receivables at our discretion when we determine that the cost of these arrangements is less than the cost of servicing our receivables with existing debt. Under the terms of the
agreements, we retain no rights or interest, have no obligations with respect to the sold receivables, and do not service the receivables after the sale. As such, these transactions are being accounted for as a sale.
Pursuant to these agreements, we sold $813.7 million and $818.8 million of receivables for the years ended December 31, 2022 and 2021, respectively. Receivables presented at financial institutions and not yet collected as of December 31, 2021
were $1.3 million and remained in our receivable balance as of that date. There were no receivables presented at financial institutions and not yet collected as of December 31, 2022. All receivables sold were reflected as a reduction of accounts
receivable in the consolidated balance sheet at the time of sale. A charge in the amount of $32 million, $11.5 million and $12.2 million related to the sale of receivables is included in selling, general and administrative expenses in our
consolidated statements of operations for the years ended December 31, 2022, 2021 and 2020, respectively.
To the extent that these arrangements are terminated, our financial condition, results of operations, cash flows and liquidity could be adversely affected by extended payment terms, delays or failures in collecting trade accounts receivables.
The utility of the supply chain financing arrangements also depends upon a benchmark reference rate for the purpose of determining the discount rate applicable to each arrangement. If the benchmark reference rate increases significantly, we may
be negatively impacted as we may not be able to pass these added costs on to our customers, which could have a material and adverse effect upon our financial condition, results of operations and cash flows.
In January 2023, one of our customers filed a petition for bankruptcy. In connection with the bankruptcy filing, we evaluated our potential risk and exposure as related to our outstanding accounts receivable balance from the customer as of
December 31, 2022, and estimated our anticipated recovery. As a result of our evaluation, we recorded a $7 million pre-tax charge during the year ended December 31, 2022 to reduce our accounts receivable balance to our estimated recovery. The
$7 million pre-tax charge is included in selling, general and administrative expenses in our consolidated statement of operations. We will continue to monitor the circumstances surrounding the bankruptcy in determining whether additional
provisions may be necessary.
In March 2020, our Board of Directors authorized the purchase of up to $20 million of our common stock under a stock repurchase program. Stock repurchases under this program, during the years ended December 31, 2021 and 2020, were 150,273 and
323,867 shares of our common stock, respectively, at a total cost of $6.5 million and $13.5 million, respectively, thereby completing the 2020 Board of Directors authorization.
In February 2021, our Board of Directors authorized the purchase of up to an additional $20 million of our common stock under a stock repurchase program. Stock repurchases under this program, during the year ended December 31, 2021, were
464,992 shares of our common stock at a total cost of $20 million, thereby completing the 2021 Board of Directors authorization.
In October 2021, our Board of Directors authorized the purchase of up to $30 million of our common stock under a stock repurchase program. Stock repurchases under this program, during the year ended December 31, 2022 and 2021 were 692,067 and
7,000 shares of our common stock, respectively, at a total cost of $29.7 million and $0.3 million, respectively, thereby completing the October 2021 Board of Directors authorization.
In July 2022, our Board of Directors authorized the purchase of up to an additional $30 million of our common stock under a new stock repurchase program. Stock will be purchased under the program from time to time, in the open market or
through private transactions, as market conditions warrant. To date, there have been no repurchases of our common stock under the program.
Material Cash Commitments
Material cash commitments as of December 31, 2022 consist of required cash payments to service our outstanding borrowings of $239.5 million under our Credit Agreement with JPMorgan Chase Bank, N.A., as agent, the future minimum cash
requirements of $60.2 million through 2033 under operating leases, and future cash payments relating to our restructuring and integration activities of $4.9 million. All of our other cash commitments as of December 31, 2022 are not material.
For additional information related to our material cash commitments, see Note 3, “Restructuring and Integration Expenses”, Note 7, “Leases,” and Note 11, “Credit Facilities and Long-Term Debt,” of the Notes to Consolidated Financial Statements in
Item 8 of this Report.
We anticipate that our cash flow from operations, available cash, and available borrowings under our Credit Agreement will be adequate to meet our future liquidity needs for at least the next twelve months. Significant assumptions underlie
this belief, including, among other things, that we will be able to mitigate the future impact, if any, of disruptions in the supply chain caused by the COVID-19 pandemic, Russia’s invasion of the Ukraine and resultant sanctions imposed by the
U.S. and other governments, future increases in interest rates, and significant inflationary cost increases in raw materials, labor and transportation that we are unable to pass through our customers, macroeconomic uncertainty, and that there
will be no material adverse developments in our business, liquidity or capital requirements. If material adverse developments were to occur in any of these areas, there can be no assurance that our business will generate sufficient cash flow
from operations, or that future borrowings will be available to us under our Credit Agreement in amounts sufficient to enable us to pay the principal and interest on our indebtedness, or to fund our other liquidity needs. In addition, if we
default on any of our indebtedness, or breach any financial covenant in our Credit Agreement, our business could be adversely affected.
For further information regarding the risks in our business, refer to Item 1A, “Risk Factors,” of this Report.
Critical Accounting Policies and Estimates
We have identified the two accounting policies and estimates below as critical to our business operations and the understanding of our results of operations. The impact and any associated risks related to these policies and estimates on our
business operations is discussed throughout “Management’s Discussion and Analysis of Financial Condition and Results of Operations,” where such policies and estimates affect our reported and expected financial results. For a detailed discussion
on the application of these and other accounting policies, see Note 1, “Summary of Significant Accounting Policies,” of the Notes to Consolidated Financial Statements in Item 8 of this Report.
You should be aware that preparation of our consolidated financial statements requires us to make estimates and assumptions that affect the reported amount of assets and liabilities, the disclosure of contingent assets and liabilities at the
date of our consolidated financial statements, and the reported amounts of revenue and expenses during the reporting periods. We can give no assurances that actual results will not differ from those estimates. Although we do not believe that
there is a reasonable likelihood that there will be a material change in the future estimates, or in the assumptions that we use in calculating the estimates, the uncertain future effects, if any, of the disruptions in the supply chain caused by
the COVID-19 pandemic, Russia’s invasion of the Ukraine and resultant sanctions imposed by the U.S. and other governments, future increases in interest rates, inflation, macroeconomic uncertainty, and other unforeseen changes in the industry, or
business, could materially impact the estimates, and may have a material adverse effect on our business, financial condition and results of operations.
Valuation of Long‑Lived and Intangible Assets and Goodwill
At acquisition, we estimate and record the fair value of purchased intangible assets, which primarily consist of customer relationships, trademarks and trade names, patents, developed technology and intellectual property, and non-compete
agreements. Intangible assets acquired through business combinations are subject to potential adjustments within the measurement period, which is up to one year from the acquisition date. Valuing intangible assets requires the use of
significant estimates and assumptions. As related to valuing customer relationships, significant estimates and assumptions used include but are not limited to: (1) forecasted revenues attributable to existing customers; (2) forecasted earnings
before interest and taxes (“EBIT”) margins; (3) customer attrition rates; and (4) the discount rate. Goodwill is the excess of the purchase price over the fair value of identifiable net assets acquired in business combinations. Goodwill and
certain other intangible assets having indefinite lives are not amortized to earnings, but instead are subject to periodic testing for impairment. Intangible assets determined to have definite lives are amortized over their remaining useful
lives. We believe that the fair value of acquired identifiable net assets, including intangible assets, are based upon reasonable estimates and assumptions.
We assess the impairment of long‑lived assets, identifiable intangibles assets and goodwill whenever events or changes in circumstances indicate that the carrying value may not be recoverable. With respect to goodwill and identifiable
intangible assets having indefinite lives, we test for impairment on an annual basis or in interim periods if an event occurs or circumstances change that may indicate the fair value is below its carrying amount. Factors we consider important,
which could trigger an impairment review, include the following: (a) significant underperformance relative to expected historical or projected future operating results; (b) significant changes in the manner of our use of the acquired assets or
the strategy for our overall business; and (c) significant negative industry or economic trends. We review the fair values using the discounted cash flows method and market multiples.
When performing our evaluation of goodwill for impairment, if we conclude qualitatively that it is not more likely than not that the fair value of the reporting unit is less than its carrying amount, then a quantitative impairment test would
not be required. If we are unable to reach this conclusion, then we would perform a goodwill quantitative impairment test. In performing the quantitative test, the fair value of the reporting unit is compared to its carrying amount. A charge
for impairment is recognized by the amount by which the reporting unit’s carrying amount exceeds its fair value, not to exceed the total amount of goodwill allocated to the reporting unit.
Identifiable intangible assets having indefinite lives are reviewed for impairment on an annual basis using a methodology similar with that used to evaluate goodwill. Intangible assets having definite lives and other long-lived assets are
reviewed for impairment whenever events such as product discontinuance, plant closures, product dispositions or other changes in circumstances indicate that the carrying amount may not be recoverable. In reviewing for impairment, we compare the
carrying value of such assets to the estimated undiscounted future cash flows expected from the use of the assets and their eventual disposition. When the estimated undiscounted future cash flows are less than their carrying amount, an
impairment loss is recognized equal to the difference between the assets fair value and their carrying value.
There are inherent assumptions and estimates used in developing future cash flows requiring our judgment in applying these assumptions and estimates to the analysis of identifiable intangibles and long‑lived asset impairment including
projecting revenues, interest rates, tax rates and the cost of capital. Many of the factors used in assessing fair value are outside our control and it is reasonably likely that assumptions and estimates will change in future periods. These
changes can result in future impairments. In the event our planning assumptions were modified resulting in impairment to our assets, we would be required to include an expense in our statement of operations, which could materially impact our
business, financial condition and results of operations.
Asbestos Litigation
In evaluating our potential asbestos-related liability, we have considered various factors including, among other things, an actuarial study of the asbestos related liabilities performed by an independent actuarial firm, our settlement amounts
and whether there are any co-defendants, the jurisdiction in which lawsuits are filed, and the status and results of such claims. As is our accounting policy, we consider the advice of actuarial consultants with experience in assessing
asbestos-related liabilities to estimate our potential claim liability; and perform an actuarial evaluation in the third quarter of each year and whenever events or changes in circumstances indicate that additional provisions may be necessary.
The methodology used to project asbestos-related liabilities and costs in our actuarial study considered: (1) historical data available from publicly available studies; (2) an analysis of our recent claims history to estimate likely filing rates
into the future; (3) an analysis of our currently pending claims; (4) an analysis of our settlements and awards of asbestos-related damages to date; and (5) an analysis of closed claims with pay ratios and lag patterns in order to develop average
future settlement values. Based on the information contained in the actuarial study and all other available information considered by us, we have concluded that no amount within the range of settlement payments and awards of asbestos-related
damages was more likely than any other and, therefore, in assessing our asbestos liability we compare the low end of the range to our recorded liability to determine if an adjustment is required. Future legal costs are expensed as incurred and
reported in earnings (loss) from discontinued operations in the accompanying statement of operations.
We plan to perform an annual actuarial evaluation during the third quarter of each year for the foreseeable future and whenever events or changes in circumstances indicate that additional provisions may be necessary. Given the uncertainties
associated with projecting such matters into the future and other factors outside our control, we can give no assurance that additional provisions will not be required. We will continue to monitor events and changes in circumstances surrounding
these potential liabilities in determining whether to perform additional actuarial evaluations and whether additional provisions may be necessary, which will reported in earnings (loss) from discontinued operations in the accompanying statement
of operations. At the present time, however, we do not believe that any additional provisions would be reasonably likely to have a material adverse effect on our liquidity or consolidated financial position. See Note 23, “Commitments and
Contingencies,” of the Notes to Consolidated Financial Statements in Item 8 of this Report for additional information.
Recently Issued Accounting Pronouncements
For a detailed discussion on recently issued accounting pronouncements and their impact on our consolidated financial statements, see Note 1, “Summary of Significant Accounting Policies” of the Notes to Consolidated Financial Statements in
Item 8 of this Report.
| ITEM 7A. |
QUANTITATIVE AND QUALITATIVE DISCLOSURES ABOUT MARKET RISK
|
Quantitative and Qualitative Disclosures about Market Risk
We are exposed to market risk, primarily related to foreign currency exchange and interest rates. These exposures are actively monitored by management. Our exposure to foreign exchange rate risk is due to certain costs, revenues and borrowings
being denominated in currencies other than one of our subsidiary’s functional currency. Similarly, we are exposed to market risk as the result of changes in interest rates, which may affect the cost of our financing. It is our policy and
practice to use derivative financial instruments only to the extent necessary to manage exposures. We do not hold or issue derivative financial instruments for trading or speculative purposes.
Exchange Rate Risk
We have exchange rate exposure, primarily, with respect to the Canadian Dollar, the Euro, the British Pound, the Polish Zloty, the Hungarian Forint, the Mexican Peso, the Taiwan Dollar, the Chinese Yuan Renminbi and the Hong Kong Dollar. As
of December 31, 2022 and December 31, 2021, our monetary assets and liabilities which are subject to this exposure are immaterial, therefore, the potential immediate loss to us that would result from a hypothetical 10% change in foreign currency
exchange rates would not be expected to have a material impact on our earnings or cash flows. This sensitivity analysis assumes an unfavorable 10% fluctuation in the exchange rates affecting the foreign currencies in which monetary assets and
liabilities are denominated and does not take into account the incremental effect of such a change on our foreign currency denominated revenues.
Interest Rate Risk
We manage our exposure to interest rate risk through the proportion of fixed rate debt and variable rate debt in our debt portfolio. To reduce our market risk for changes in interest rates on our variable rate borrowings, and to manage a
portion of our exposure to changes in interest rates, we occasionally enter into interest rate swap agreements.
In June 2022, we entered into a seven year interest rate swap agreement with a notional amount of $100 million that is to mature in May 2029. The interest rate swap agreement has been designated as a cash flow hedge of interest payments on
$100 million of borrowings under our Credit Agreement. Under the terms of the swap agreement, we will receive monthly variable interest payments based on one month Term SOFR and will pay interest based upon a fixed rate of 2.683% per annum,
adjusted upward for the credit spread adjustment in the Credit Agreement of 0.10% and the loan margin in the Credit Agreement of 1.50% at December 31, 2022.
As of December 31, 2022, we had approximately $239.5 million of outstanding borrowings under our credit facilities, of which approximately $139.5 million bears interest at variable rates of interest and $100 million bears interest at fixed
rates, after consideration of the interest rate swap agreement entered into in June 2022. Additionally, we invest our excess cash in highly liquid short-term investments. Based upon our current level of borrowings under our facilities and our
excess cash, the effect of a hypothetical, instantaneous and unfavorable change of 100 basis points in the interest rate may have an approximate $1.2 million annualized negative impact on our earnings or cash flows.
In addition, we are party to several supply chain financing arrangements, in which we may sell certain of our customers’ trade accounts receivable to such customers’ financial institutions. We sell our undivided interests in certain of these
receivables at our discretion when we determine that the cost of these arrangements is less than the cost of servicing our receivables with existing debt. During the year ended December 31, 2022, we sold $813.7 million of receivables. Depending
upon the level of sales of receivables pursuant these agreements, the effect of a hypothetical, instantaneous and unfavorable change of 100 basis points in the margin rate may have an approximate $8.1 million negative impact on our earnings or
cash flows. The charge related to the sale of receivables is included in selling, general and administrative expenses in our consolidated statements of operations.
| ITEM 8. |
FINANCIAL STATEMENTS AND SUPPLEMENTARY DATA
|
INDEX TO CONSOLIDATED FINANCIAL STATEMENTS
|
Page No.
|
|
|
44
|
|
|
45
|
|
|
47
|
|
|
49
|
|
|
50
|
|
|
51
|
|
|
52
|
|
|
53
|
|
|
54
|