Exhibit 99.1

FOR IMMEDIATE RELEASE
January 28, 2015
Contact:
Daryl G. Byrd, President and CEO (337) 521-4003
John R. Davis, Senior Executive Vice President (337) 521-4005
IBERIABANK Corporation Reports Fourth Quarter Results
LAFAYETTE, LOUISIANA — IBERIABANK Corporation (NASDAQ: IBKC), holding company of the 127-year-old IBERIABANK (www.iberiabank.com), reported operating results for the fourth quarter ended December 31, 2014. For the quarter, the Company reported income available to common shareholders of $35.9 million, or $1.07 per fully diluted earnings per share (“EPS”). In the fourth quarter of 2014, the Company incurred non-operating income net of costs equal to $2.8 million on a pre-tax basis, or $0.02 per share on an after-tax basis. Excluding non-operating items, EPS in the fourth quarter of 2014 was $1.05 per share on a non-GAAP operating basis (refer to press release supplemental table.)
Daryl G. Byrd, President and Chief Executive Officer, commented, “We are pleased with the financial progress we achieved in the fourth quarter and full year of 2014. For the fourth quarter of 2014, we experienced 21% annualized growth in quarter-end legacy loans combined with a net interest margin increase of four basis points, both of which were above our expectations. In fact, our legacy loan growth in the fourth quarter of 2014 was the second strongest in our Company’s history. In addition, our asset quality measures improved, and we beat our tangible operating efficiency target for the quarter. For the full year 2014, we expanded our average assets by $1.6 billion, or 13%, experienced a 13 basis point improvement in net interest margin, enhanced our asset quality and operating efficiency, and increased operating EPS by 20%. We anticipate continued franchise improvement in 2015 as well. Based on the assumptions in our current forecasts, our recent quarterly results, and projected economic conditions, we expect our operating EPS for the full year of 2015 will be in the range of $4.45 to $4.50 per share, or a 19% to 21% increase compared to our 2014 operating EPS. The estimated impact of the forward interest rate curve accounts for approximately 22 cents of the increase in EPS during the year. “
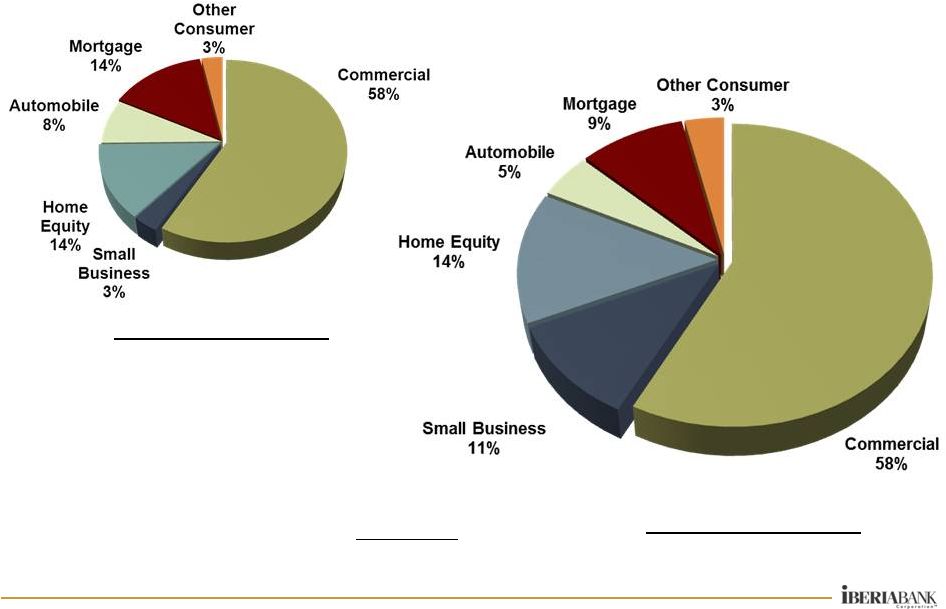
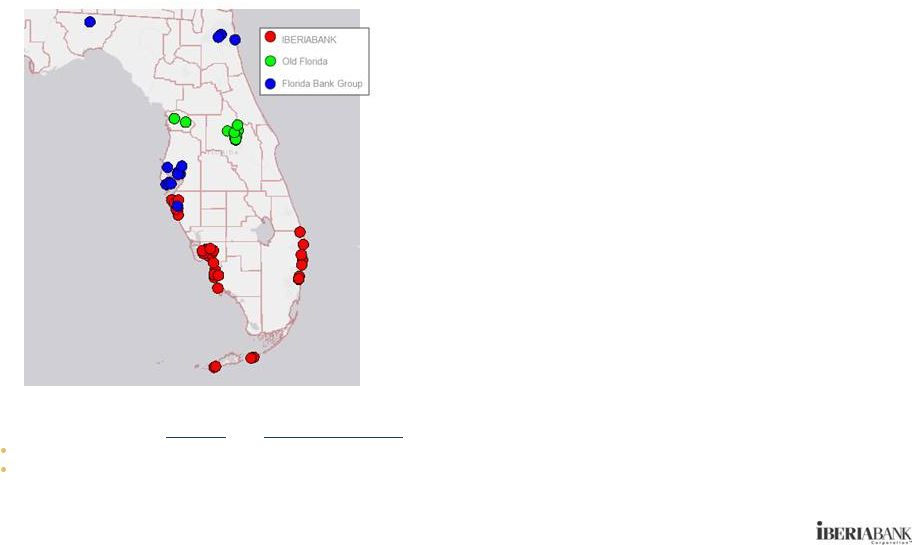
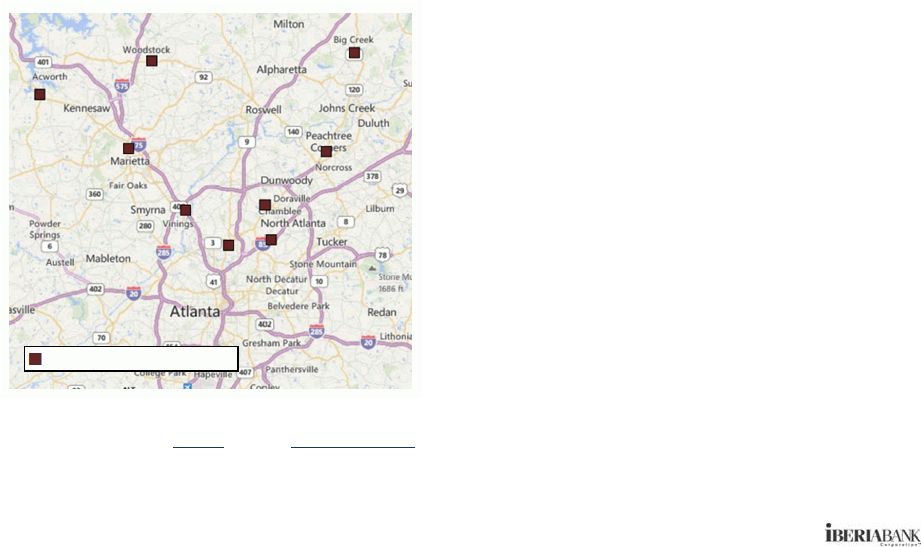
Byrd continued, “Our efforts to expand our client base in a balanced manner and diversify our geographic mix showed great promise as well in the fourth quarter and full year of 2014. Since year-end 2013, our commercial loans grew 14%, consumer loans increased 25%, and mortgage loans climbed 84%. Of the 21 geographic commercial banking markets we serve, we experienced year-end loan growth in 18 markets and deposit growth in 17 markets, so our growth has been broad-based. During 2014, we entered the Dallas market and greatly expanded our presence in the Acadiana region in Louisiana. We also announced agreements to join forces with exceptional partners based in Tampa, Orlando, and Atlanta.”
Highlights for the fourth quarter of 2014 and December 31, 2014:
| • | During the fourth quarter of 2014, the Company announced the signing of definitive agreements to acquire by merger Florida Bank Group, Inc. (“Florida Bank Group”) based in Tampa, Florida, Old Florida Bancshares, Inc. (“Old Florida”) based in Orlando, Florida, and Georgia Commerce Bancshares, Inc. (“Georgia Commerce”) based in Atlanta, Georgia. At December 31, 2014, the three pending acquisitions had total assets of $3.0 billion, gross loans of $2.1 billion, and total deposits of $2.5 billion. The Company anticipates closing the transactions in the first and second quarters of 2015, subject to customary closing conditions, including the receipt of regulatory and shareholder approvals. |
1
| • | The Company’s tangible operating efficiency ratio was 65.9% in the fourth quarter of 2014, up slightly compared to the third quarter of 2014 and better than management’s forecast. |
| • | On a linked quarter basis, operating non-interest income increased $0.2 million, or less than 1%, in the fourth quarter of 2014. Mortgage income decreased $0.6 million, or 4%, capital markets income decreased $1.0 million, or 36%, and credit card income increased $0.8 million, or 30%, on a linked quarter basis. |
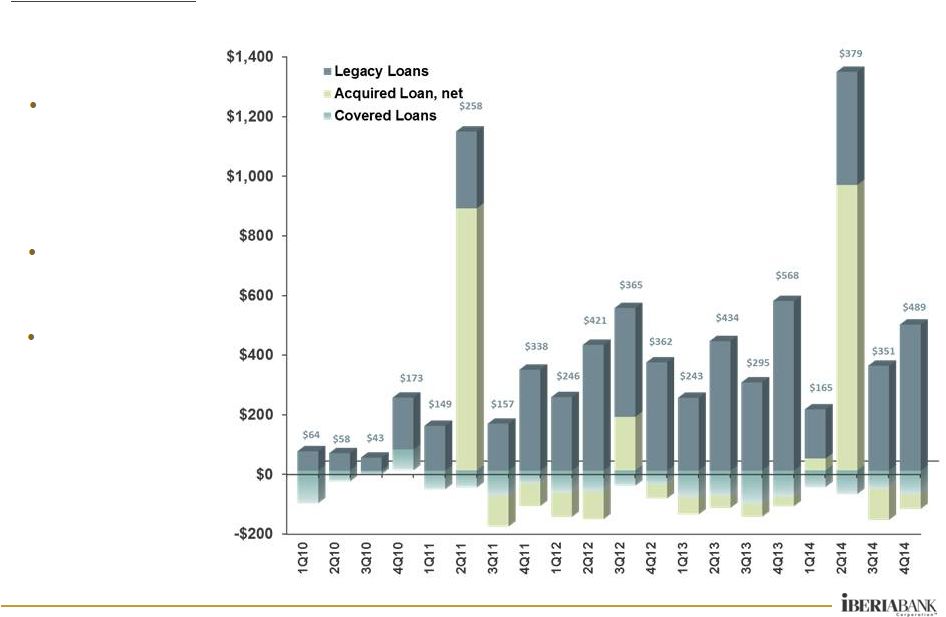
| • | Total loan growth was $360 million, or 3%, between quarter-ends, while legacy loan growth, which excludes all assets covered under FDIC loss share agreements and other non-covered acquired assets (collectively, “Acquired Assets”), increased $489 million, or 5%, between quarter-ends (21% annualized rate). The loan growth was spread between small business (12%), consumer (22%), and commercial (66%). |
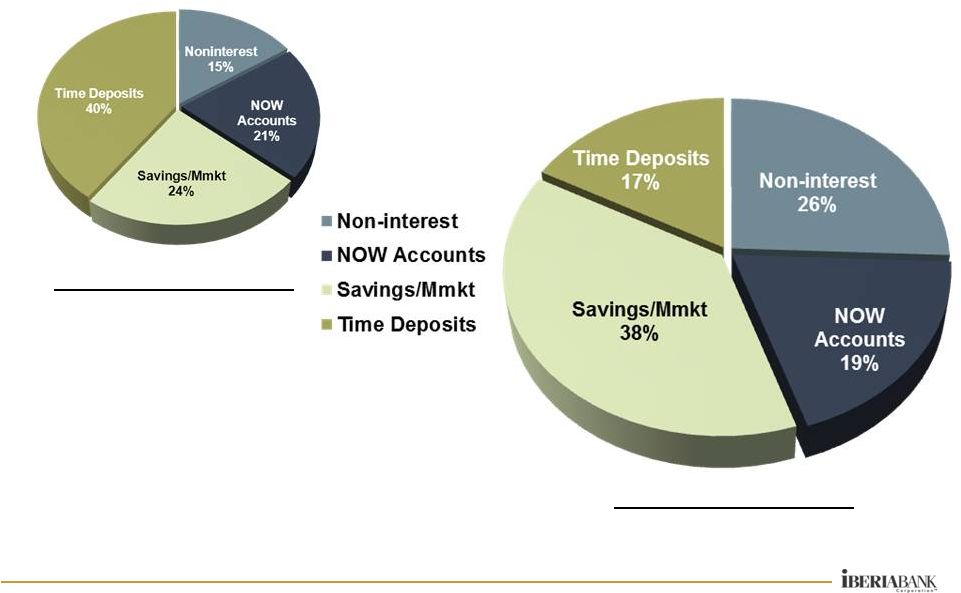
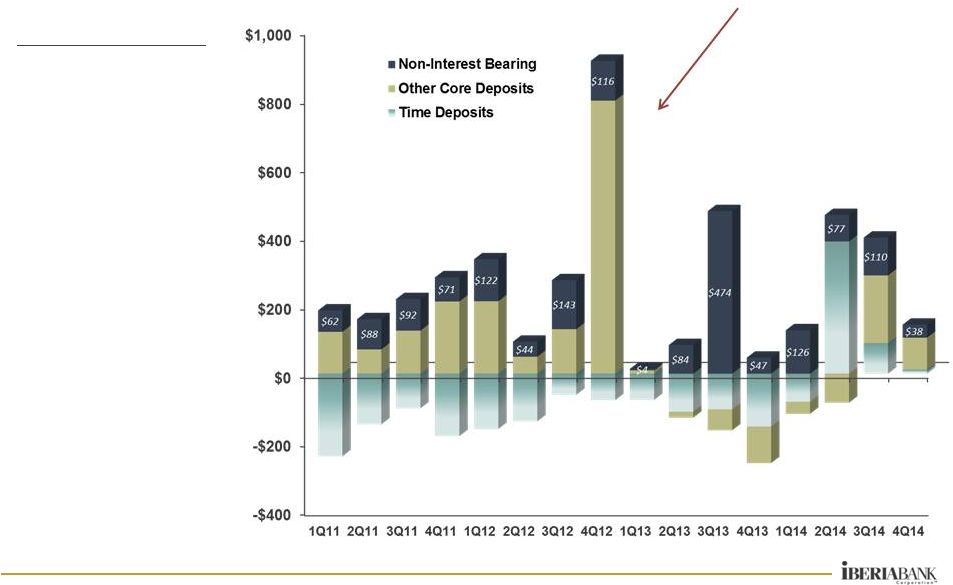
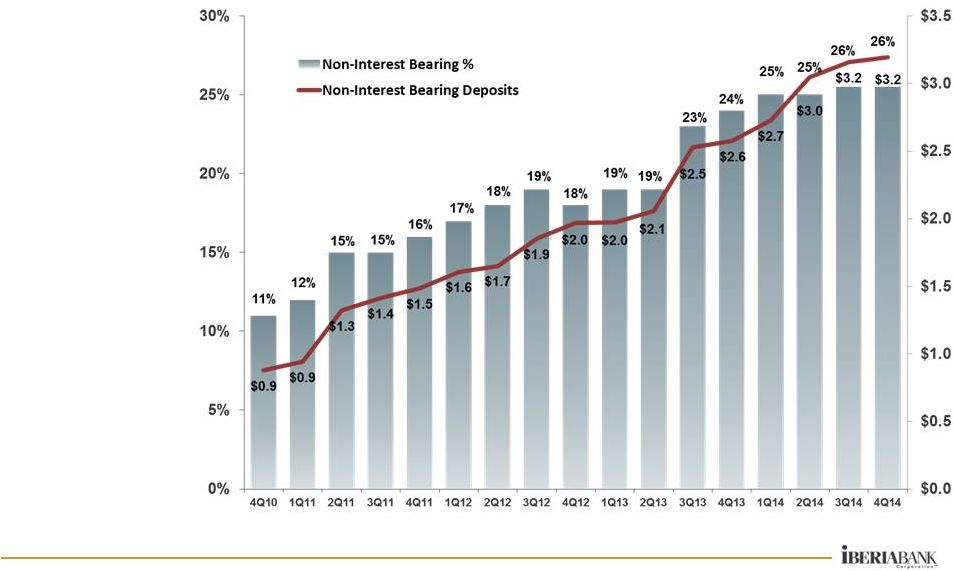
| • | Total deposits increased $143 million, or 1%, between quarter-ends. Core deposits, which excludes time deposits, increased $131 million, or 1% (5% annualized rate). Non-interest-bearing deposits increased $38 million, or 1%, between quarter-ends (5% on an annualized basis). |
| • | The Company’s legacy asset quality remained strong in the fourth quarter of 2014. At December 31, 2014, and excluding Acquired Assets, nonperforming assets (“NPAs”) equated to 0.41% of total assets, loans past due 30 days or more equated to 0.68% of total loans, and classified assets equated to 0.43% of total assets. At year-end 2014, only a single energy-related loan, totaling approximately $30,000, was past due more than 30 days, and the Company experienced no energy-related charge-offs in 2014. |
| • | Net charge-offs totaled $1.8 million in the fourth quarter of 2014, or an annualized 0.06% of average loans. Over the past 12 quarters, net charge-offs averaged 0.05% of average loans. The Company recorded a $6.5 million loan loss provision in the fourth quarter of 2014, compared to $5.7 million in the third quarter of 2014. |
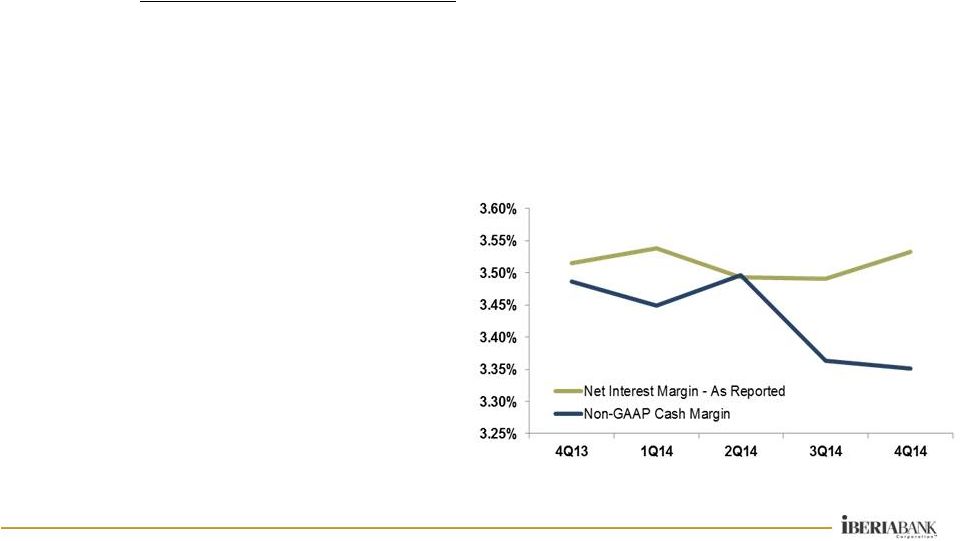
| • | The net interest margin increased four basis points on a linked quarter basis to 3.53%, which was above the previously disclosed guidance range of 3.45%, to 3.50% for the fourth quarter of 2014. |
During the Company’s year-end financial statement close process, certain accounting entries recorded in the second and third quarters of 2014 related to the Company’s mortgage banking operation were determined to be incorrect. The errors reduced the mortgage income line in the income statement by $4.4 million in the second quarter of 2014 and increased mortgage income by $1.5 million in the third quarter of 2014. The Company implemented changes to internal processes to reduce the likelihood of similar errors occurring in future periods. The financial information throughout this press release has been adjusted to reflect the correction of those entries. These adjustments had no impact on the financial results in the fourth quarter of 2014 or the full year 2014.
2
Table A - Summary Financial Results
| For the Quarter Ended: | Linked Quarter | |||||||||||||||
| Selected Financial Data |
12/31/2013 | 9/30/2014 | 12/31/2014 | % Change | ||||||||||||
| Net Income ($ in thousands) |
$ | 25,604 | $ | 30,892 | $ | 35,936 | 16% | |||||||||
| Per Share Data: |
||||||||||||||||
| Fully Diluted Earnings |
$ | 0.86 | $ | 0.92 | $ | 1.07 | 16% | |||||||||
| Operating Earnings (Non-GAAP) |
0.87 | 1.04 | 1.05 | 1% | ||||||||||||
| Pre-provision Operating Earnings (Non-GAAP) |
0.97 | 1.15 | 1.17 | 2% | ||||||||||||
| Tangible Book Value |
37.17 | 37.83 | 39.11 | 3% | ||||||||||||
| As of and for the Quarter Ended: | Linked Quarter | |||||||||||||||
| Basis Point | ||||||||||||||||
| Key Ratios |
12/31/2013 | 9/30/2014 | 12/31/2014 | Change | ||||||||||||
| Return on Average Assets |
0.77 | % | 0.79 | % | 0.91 | % | 12 bps | |||||||||
| Return on Average Common Equity |
6.62 | % | 6.78 | % | 7.78 | % | 100 bps | |||||||||
| Return on Average Tangible Common Equity (Non-GAAP) |
9.43 | % | 10.10 | % | 11.46 | % | 136 bps | |||||||||
| Net Interest Margin (TE) (1) |
3.52 | % | 3.49 | % | 3.53 | % | 4 bps | |||||||||
| Tangible Operating Efficiency Ratio (TE) (Non-GAAP) (1) |
69.9 | % | 65.7 | % | 65.9 | % | 15 bps | |||||||||
| Tangible Common Equity Ratio (Non-GAAP) |
8.55 | % | 8.45 | % | 8.60 | % | 15 bps | |||||||||
| Tier 1 Leverage Ratio |
9.70 | % | 9.21 | % | 9.36 | % | 15 bps | |||||||||
| Tier 1 Common Ratio (Non-GAAP) |
10.55 | % | 10.32 | % | 10.32 | % | (0) bps | |||||||||
| Total Risk Based Capital Ratio |
12.82 | % | 12.40 | % | 12.30 | % | (10) bps | |||||||||
| Net Charge-Offs to Average Loans (2) |
0.07 | % | 0.09 | % | 0.06 | % | (3) bps | |||||||||
| Non-performing Assets to Total Assets (2) |
0.61 | % | 0.46 | % | 0.41 | % | (5) bps | |||||||||
| For the Quarter Ended: | ||||||||||||
| GAAP | Non-GAAP | |||||||||||
| Adjusted Selected Key Ratios |
12/31/2014 | Adjustments (3) | 12/31/2014 | |||||||||
| Return on Average Assets |
0.91 | % | (0.02 | %) | 0.89 | % | ||||||
| Return on Average Common Equity |
7.78 | % | (0.20 | %) | 7.58 | % | ||||||
| Return on Average Tangible Common Equity (Non-GAAP) |
11.46 | % | (0.29 | %) | 11.17 | % | ||||||
| Tangible Efficiency Ratio (TE)(1) (Non-GAAP) |
67.5 | % | (1.6 | %) | 65.9 | % | ||||||
| (1) | Fully taxable equivalent basis. |
| (2) | Excluding FDIC Covered Assets and Acquired Assets. |
| (3) | Adjusted results exclude the income statement impact of the non-operating items included in Table 11, net of tax where applicable, without adjustment to any balance sheet accounts. |
Refer to press release supplemental table for a reconciliation of GAAP and non-GAAP measures.
Operating Results
On a linked quarter basis, average earning assets increased $154 million, or 1%, as average loans increased $262 million, or 2%, average indemnification asset (“IA”) declined $26 million, or 23%, average investment securities increased $97 million, or 5%, and other earning assets decreased $178 million, or 24%. Also on a linked quarter basis, the average earning asset yield increased five basis points, and the cost of interest-bearing liabilities increased two basis points. As a result, the net interest spread increased three basis points, and the net interest margin increased four basis points. Tax-equivalent net interest income increased $3 million, or 2%, as average earning assets and the net interest margin increased on a linked quarter basis.
3
Table B - Quarterly Average Yields/Cost (1)
| For Quarter Ended: | Linked Quarter | |||||||||||||||
| Basis Point | ||||||||||||||||
| 12/31/2013 | 9/30/2014 | 12/31/2014 | Change | |||||||||||||
| Investment Securities |
2.21 | % | 2.20 | % | 2.24 | % | 4 bps | |||||||||
| Covered Loans, net of loss share receivable |
3.43 | % | 3.07 | % | 3.57 | % | 50 bps | |||||||||
| Legacy Loans, net |
4.09 | % | 3.97 | % | 3.94 | % | (3) bps | |||||||||
| Non-Covered Acquired Loans, net |
8.71 | % | 6.63 | % | 6.94 | % | 31 bps | |||||||||
|
|
|
|
|
|
|
|
|
|||||||||
| Loans & Loss Share Receivable |
4.33 | % | 4.31 | % | 4.32 | % | 1 bps | |||||||||
| Mortgage Loans Held For Sale |
4.06 | % | 3.90 | % | 3.95 | % | 5 bps | |||||||||
| Other Earning Assets |
0.94 | % | 0.60 | % | 0.80 | % | 20 bps | |||||||||
|
|
|
|
|
|
|
|
|
|||||||||
| Total Earning Assets |
3.87 | % | 3.83 | % | 3.88 | % | 5 bps | |||||||||
| Interest-bearing Deposits |
0.39 | % | 0.39 | % | 0.41 | % | 2 bps | |||||||||
| Short-Term Borrowings |
0.15 | % | 0.17 | % | 0.19 | % | 2 bps | |||||||||
| Long-Term Borrowings |
3.37 | % | 2.75 | % | 2.73 | % | (2) bps | |||||||||
|
|
|
|
|
|
|
|
|
|||||||||
| Total Interest-bearing Liabilities |
0.47 | % | 0.46 | % | 0.48 | % | 2 bps | |||||||||
|
|
|
|
|
|
|
|
|
|||||||||
| Net Interest Spread |
3.40 | % | 3.38 | % | 3.41 | % | 3 bps | |||||||||
| Net Interest Margin |
3.52 | % | 3.49 | % | 3.53 | % | 4 bps | |||||||||
| (1) | Earning asset yields are shown on a fully taxable-equivalent basis. |
During the fourth quarter, the legacy loan yield declined three basis points, while the non-covered acquired loan yield increased 31 basis points and the net covered loan yield (net of IA amortization) increased 50 basis points. The average covered loan volume declined $96 million, or 17%, average non-covered acquired loans declined $62 million, or 4%, and average legacy loans increased $420 million, or 5%. As a result of changes in volumes and yields, the associated net covered income declined slightly on a linked quarter basis. Changes in volumes and yields were influenced by the transfer from covered to non-covered acquired categories of loans associated with the former CapitalSouth loan portfolio as non-single family residential FDIC loss share coverage expired.
On a period-end basis, the IA declined $25 million, or 26%, from $95 million at September 30, 2014, to $70 million at December 31, 2014. The portion of the IA collectible from the FDIC decreased $9 million, or 30%. The portion of the IA collectible from other real estate owned (“OREO”) and customers declined $16 million, or 25%.
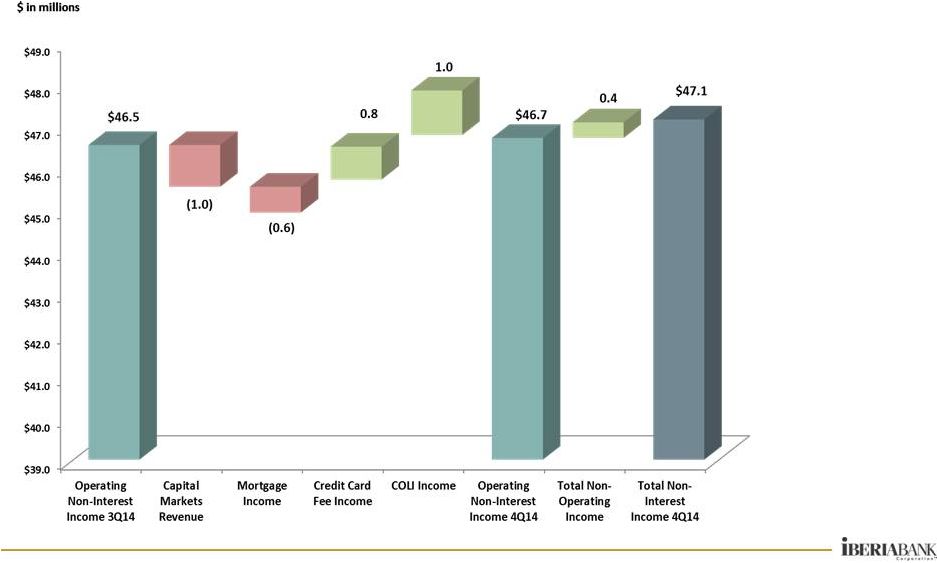
Aggregate non-interest income was stable on a linked quarter basis. Excluding non-operating items, operating non-interest income increased $0.2 million, or less than 1%. The primary changes in operating non-interest income on a linked quarter basis were:
| • | Increased credit card fee income of $0.8 million, or 30%; and |
| • | Increased corporate-owned life insurance income of $1.0 million (most of which was offset by an increase in benefit expense included in non-interest expense); partially offset by |
| • | Decreased capital markets revenue of $1.0 million, or 36%; and |
| • | Decreased mortgage income of $0.6 million, or 4%. |
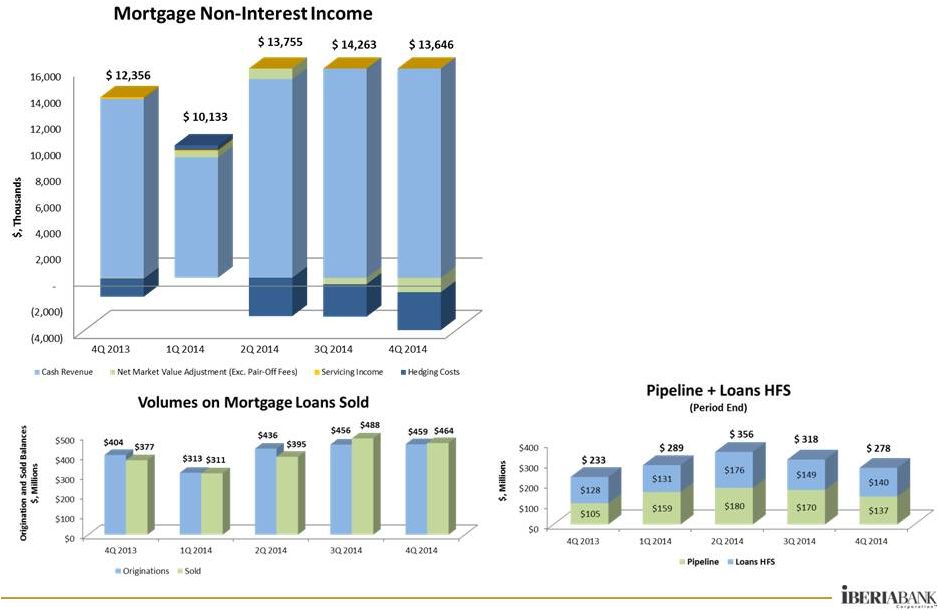
Mortgage income was negatively impacted by $0.6 million lower market value adjustments (a negative $1.1 million adjustment in the fourth quarter of 2014 compared to a $0.5 million negative adjustment in the third quarter of 2014.) The Company experienced unseasonably strong production and sales volumes, as well as favorable pricing dynamics in the fourth quarter of 2014. Mortgage commission and production incentives expense (which is included in non-interest expense) increased $0.1 million, or 3%, on a linked quarter basis.
4
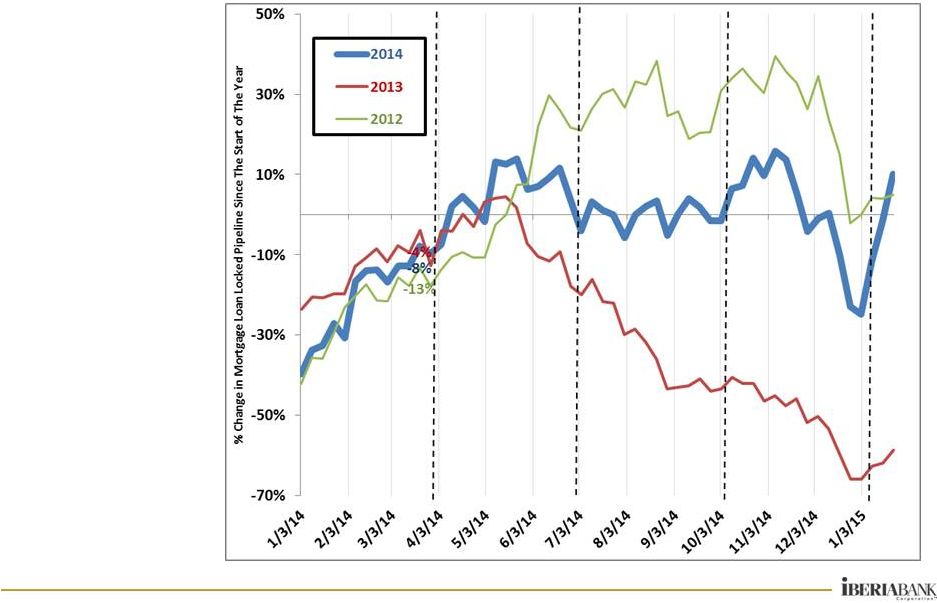
In the fourth quarter of 2014, the Company originated $459 million in residential mortgage loans, up $3 million, or 1%, on a linked quarter basis. Client loan refinancing opportunities accounted for approximately 36% of mortgage loan applications in the fourth quarter of 2014, compared to 25% in the third quarter of 2014. The Company sold $464 million in mortgage loans during the fourth quarter of 2014, down $24 million, or 5%, on a linked quarter basis. The mortgage origination locked pipeline and loans held for sale decreased $33 million, or 19% between September 30, 2014, and December 31, 2014. At January 23, 2015, the locked pipeline was $200 million, up $63 million, or 46%, compared to December 31, 2014. The mortgage loan origination business primarily focuses on retail mortgage loans originated by the Company.
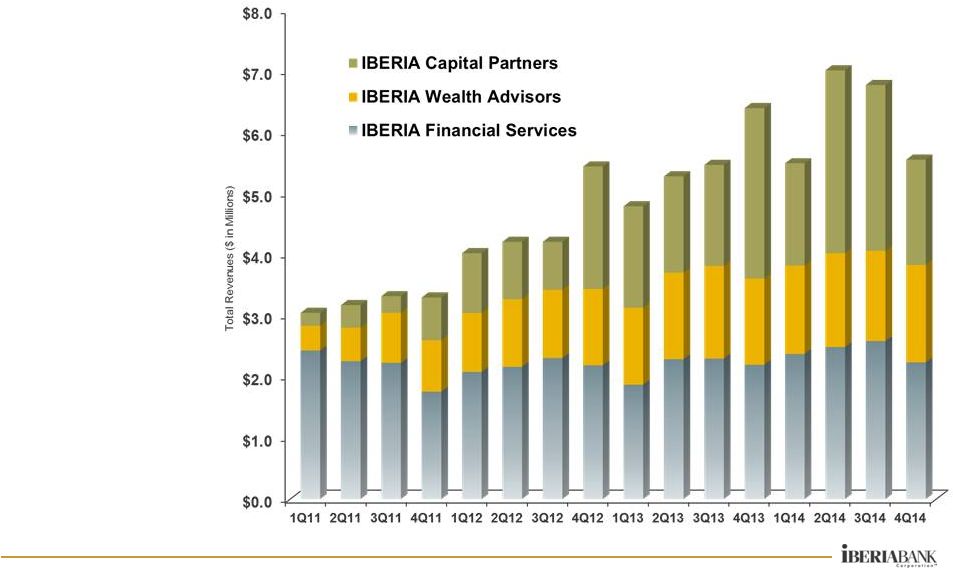
Assets under management at IBERIA Wealth Advisors (“IWA”) were $1.4 billion at December 31, 2014, up 11% compared to September 30, 2014. Revenues for IWA increased 8% on a linked quarter basis, and were up 13% compared to the fourth quarter of 2013. IBERIA Financial Services revenues decreased 13% on a linked quarter basis, and were up 2% compared to the fourth quarter of 2013. The rapid decline in energy prices in the latter half of the fourth quarter of 2014 caused a significant reduction in capital markets activities at IBERIA Capital Partners (“ICP”), partially offset by improved trading and research income. As a result, ICP experienced a $1.0 million, or 36%, decline in revenues on a linked quarter basis.
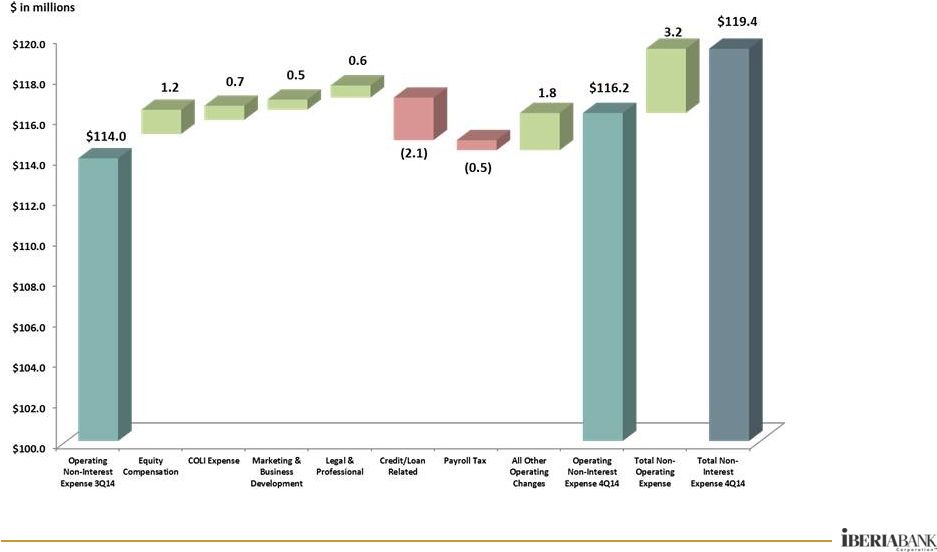
Non-interest expense decreased $1.0 million, or 1%, on a linked quarter basis, while operating expense increased $2.2 million, or 2%. Operating expense changes included the following on a linked-quarter basis:
| • | Increased equity compensation expense of $1.2 million due to share price increase; |
| • | Increased corporate-owned life insurance expense of $0.7 million; |
| • | Increased marketing and business development expense of $0.5 million; and |
| • | Increased legal and professional services expense of $0.6 million; partially offset by |
| • | Decreased provision for unfunded commitments of $1.1 million; |
| • | Decreased other credit/loan related expenses of $1.0 million; and |
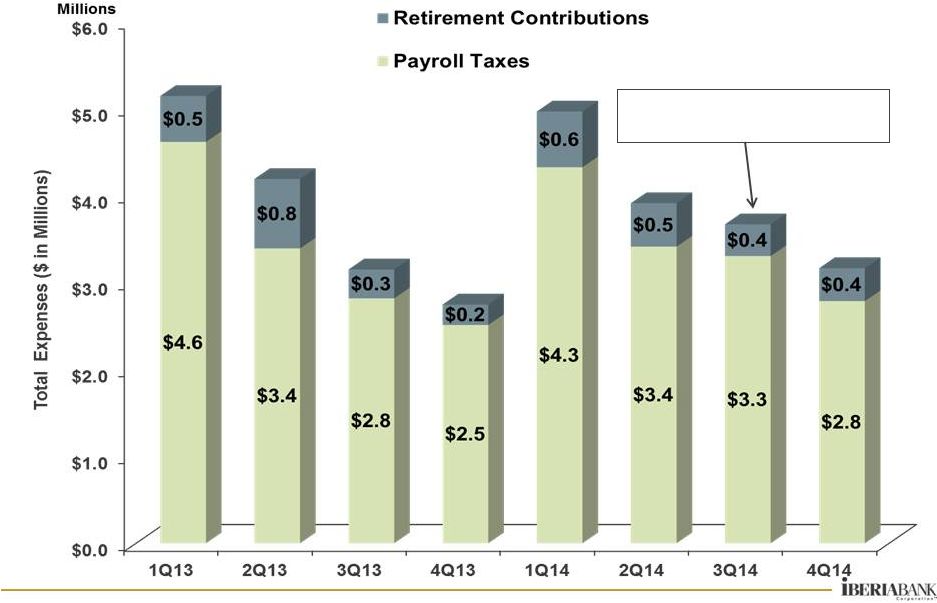
| • | Decreased payroll tax expense of $0.5 million. |
Through the fourth quarter of 2014, the Company essentially completed its targeted run-rate expense savings of $10.7 million. The Company continues to review its operating metrics for future opportunities to improve revenues and reduce expenses.
During the fourth quarter of 2014, the Company realized $2.9 million in tax benefits primarily a result of amending previously filed tax returns for federal and state tax credits not previously claimed. Absent this benefit, the Company’s effective tax rate was 28.1% in the fourth quarter of 2014, a slight increase compared to the third quarter of 2014. The Company considered the tax benefit to be of a non-operating nature.
Loans
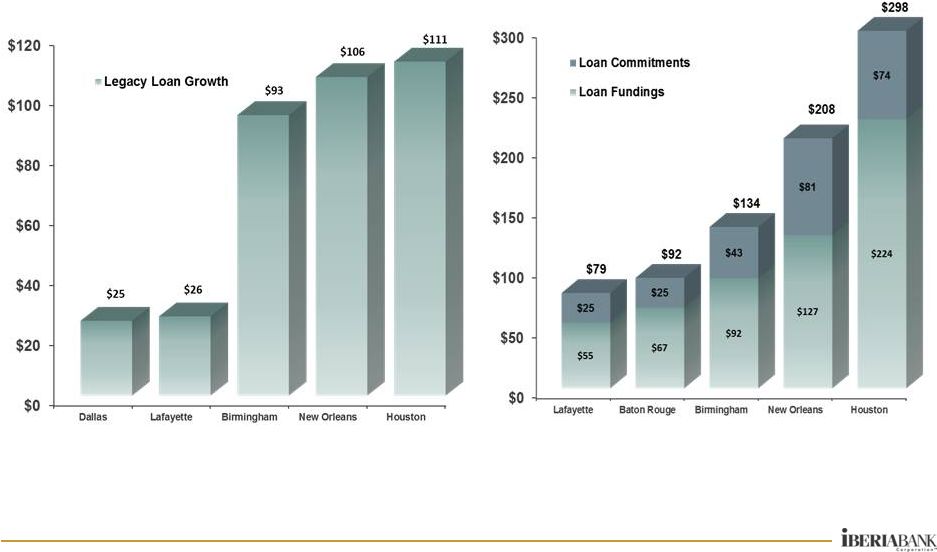
Total loans increased $360 million, or 3%, between September 30, 2014, and December 31, 2014. The loan portfolio covered under FDIC loss share protection at December 31, 2014, decreased $80 million, or 15%, compared to September 30, 2014. Excluding covered and Acquired Assets, total loans increased $489 million, or 5% (21% annualized rate), during the fourth quarter. Legacy commercial loans increased $381 million, or 6% (which included $56 million in business banking loan growth, up 7%, or 28% annualized rate), legacy consumer loans increased $77 million, or 4%, and legacy mortgage loans increased $31 million, or 6%, during the quarter. Period-end legacy loan growth during the fourth quarter of 2014 was strongest in the Houston, New Orleans, Birmingham, Lafayette, and Dallas markets. Funded loan origination and renewal mix in the fourth quarter of 2014 was 36% fixed rate and 64% floating rate, and total loans outstanding (excluding nonaccruals) were 48% fixed and 52% floating. Loans and commitments originated and/or renewed during the fourth quarter of 2014 totaled $1.2 billion (up 1% on a linked quarter basis).
5
Table C - Period-End Loans ($ in Millions)
| Period-End Balances ($ Millions) | ||||||||||||||||||||||||||||||||
| % Change (1) | Mix | |||||||||||||||||||||||||||||||
| 12/31/13 | 9/30/14 | 12/31/14 | Year/Year | Qtr/Qtr | Annualized | 9/30/14 | 12/31/14 | |||||||||||||||||||||||||
| Commercial |
$ | 6,041 | $ | 6,622 | $ | 7,002 | 16 | % | 6 | % | 23 | % | 60 | % | 61 | % | ||||||||||||||||
| Consumer |
1,833 | 2,061 | 2,139 | 17 | % | 4 | % | 15 | % | 19 | % | 19 | % | |||||||||||||||||||
| Mortgage |
414 | 497 | 528 | 27 | % | 6 | % | 25 | % | 4 | % | 4 | % | |||||||||||||||||||
|
|
|
|
|
|
|
|
|
|
|
|
|
|
|
|
|
|||||||||||||||||
| Legacy Loans |
$ | 8,288 | $ | 9,180 | $ | 9,669 | 17 | % | 5 | % | 21 | % | 83 | % | 84 | % | ||||||||||||||||
| Acquired Loans |
484 | 1,377 | 1,328 | 174 | % | -4 | % | -14 | % | 12 | % | 12 | % | |||||||||||||||||||
| Covered Loans |
720 | 524 | 444 | -38 | % | -15 | % | -61 | % | 5 | % | 4 | % | |||||||||||||||||||
|
|
|
|
|
|
|
|
|
|
|
|
|
|
|
|
|
|||||||||||||||||
| Total Loans |
$ | 9,492 | $ | 11,081 | $ | 11,441 | 21 | % | 3 | % | 13 | % | 100 | % | 100 | % | ||||||||||||||||
|
|
|
|
|
|
|
|
|
|
|
|
|
|
|
|
|
|||||||||||||||||
| (1) | Year over Year growth includes the impact of acquisitions. |
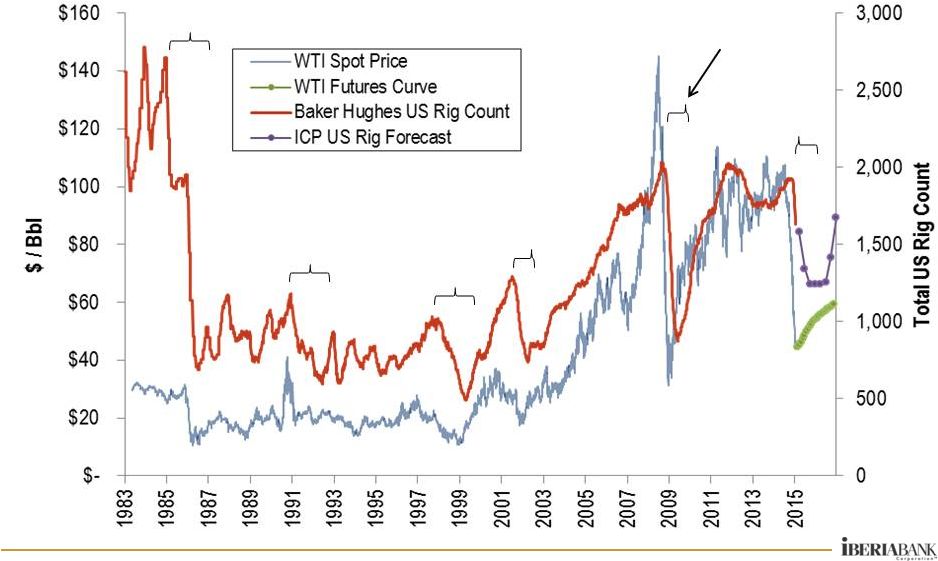
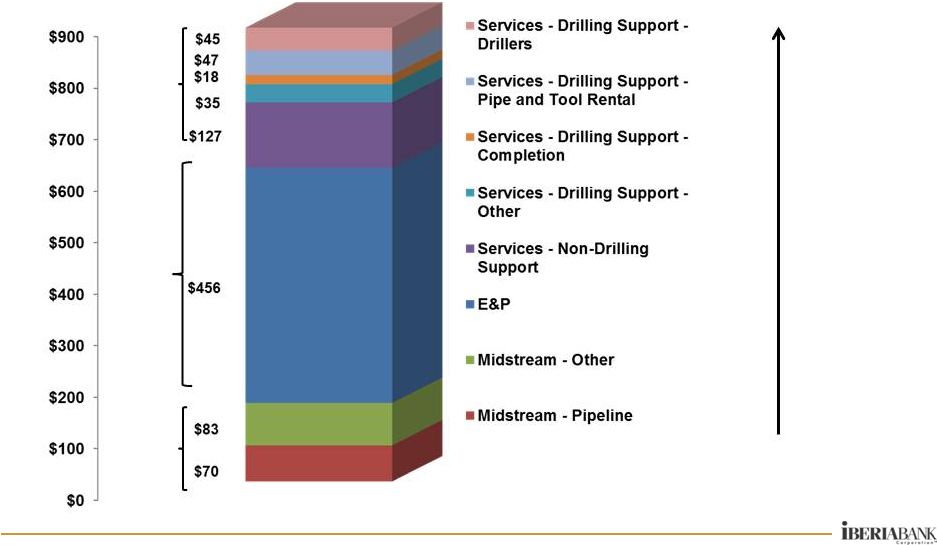
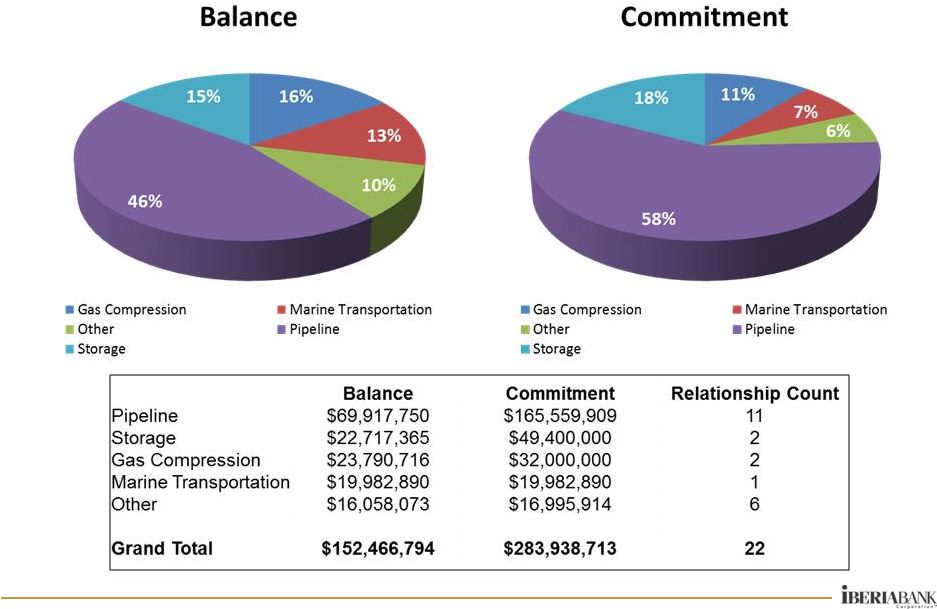
Energy-related loans outstanding totaled $881 million at December 31, 2014, up $41 million, or 5%, compared to September 30, 2014, and equated to approximately 7.7% of total loans. The Company expects energy-related loans to be less than 6.5% of total loans outstanding upon completion of the previously mentioned pending acquisitions. Exploration and production accounted for 52% of energy loans outstanding and 56% of energy commitments at year-end 2014. Midstream companies accounted for 17% of energy loans and commitments, and service company loans accounted for 31% of energy loans and 27% of energy commitments. Additional information regarding the Company’s energy loan and commitment exposure is provided in the supplemental investor presentation.
In January 2015, the Company announced it will exit the indirect automobile lending business, a service the Company has successfully provided to select automobile dealers in the Company’s footprint for 20 years. The Company concluded compliance risk associated with the indirect automobile lending business in general had become unbalanced relative to potential returns generated by the business on a risk-adjusted basis. At December 31, 2014, the Company’s indirect automobile lending business had approximately $397 million in loans outstanding (3.5% of total loans outstanding) with 12 full-time equivalent employees. Based on current amortization rates and expected maturities, the vast majority of loan relationships will be exited within four years.
Deposits
Total deposits increased $143 million, or 1%, from September 30, 2014 to December 31, 2014. Non-interest-bearing deposits increased $38 million, or 1%, and equated to 26% of total deposits at December 31, 2014. NOW accounts increased $268 million, or 12%, while money market and savings account volume decreased $176 million, or 4%, between September 30, 2014 and December 31, 2014. Time deposits increased $12 million, or 1% between quarter-ends. Period-end deposit growth during the fourth quarter of 2014 was strongest in the Lafayette, Northwest Arkansas, Huntsville, Dallas, and Naples markets.
6
Table D - Period-End Deposits ($ in Millions)
| Period-End Balances ($ Millions) | ||||||||||||||||||||||||||||||||
| % Change (1) | Mix | |||||||||||||||||||||||||||||||
| 12/31/13 | 9/30/14 | 12/31/14 | Year/Year | Qtr/Qtr | Annualized | 9/30/14 | 12/31/14 | |||||||||||||||||||||||||
| Non-interest |
$ | 2,576 | $ | 3,157 | $ | 3,195 | 24 | % | 1 | % | 5 | % | 25 | % | 26 | % | ||||||||||||||||
| NOW Accounts |
2,283 | 2,195 | 2,463 | 8 | % | 12 | % | 49 | % | 18 | % | 19 | % | |||||||||||||||||||
| Savings/MMkt |
4,167 | 4,922 | 4,746 | 14 | % | -4 | % | -14 | % | 40 | % | 38 | % | |||||||||||||||||||
| Time Deposits |
1,711 | 2,104 | 2,116 | 24 | % | 1 | % | 2 | % | 17 | % | 17 | % | |||||||||||||||||||
|
|
|
|
|
|
|
|
|
|
|
|
|
|
|
|
|
|||||||||||||||||
| Total Deposits |
$ | 10,737 | $ | 12,378 | $ | 12,521 | 17 | % | 1 | % | 5 | % | 100 | % | 100 | % | ||||||||||||||||
|
|
|
|
|
|
|
|
|
|
|
|
|
|
|
|
|
|||||||||||||||||
| (1) | Year over Year growth includes the impact of acquisitions. |
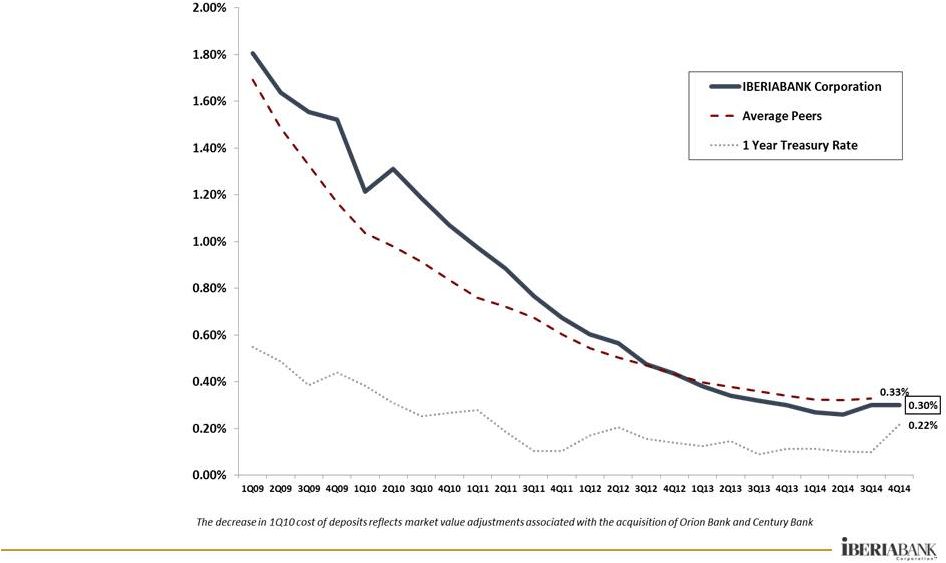
On an average balance and linked quarter basis, non-interest-bearing deposits increased $171 million, or 6%, and interest-bearing deposits increased $120 million, or 1%. The rate on average interest-bearing deposits in the fourth quarter of 2014 was 0.41%, an increase of two basis points on a linked quarter basis.
Other Assets And Funding
Excess liquidity averaged $354 million in the fourth quarter of 2014, down $136 million, or 28%, on a linked quarter basis. The investment portfolio increased $93 million, or 4%, to $2.3 billion on average in the fourth quarter of 2014. On a period-end basis, the investment portfolio equated to $2.3 billion, or 14% of total assets at December 31, 2014, unchanged compared to September 30, 2014. The investment portfolio had an effective duration of 2.9 years at December 31, 2014, compared to 3.2 years at September 30, 2014. The investment portfolio had a $13.3 million unrealized gain at December 31, 2014. The average yield on investment securities increased four basis points on a linked quarter basis to 2.24% in the fourth quarter of 2014. The Company holds in its investment portfolio primarily government agency securities. Municipal securities comprised only 7% of total investments at December 31, 2014. The Company holds for investment no sovereign debt, corporate debt or equity securities, trust preferred securities, or derivative exposure to foreign counterparties.
On a linked quarter basis, average short-term debt decreased $206 million, or 22%, and the cost of short-term debt increased two basis points. Average long-term debt increased $36 million, or 10%, and the cost of debt decreased two basis points to 2.73%. The cost of average interest-bearing liabilities was 0.48% in the fourth quarter of 2014, an increase of two basis points on a linked quarter basis.
Asset Quality
Legacy assets consist of assets originated by the Company and not acquired. To provide additional consistency and transparency for financial reporting of Acquired Assets, the Company divides Acquired Assets into these distinct categories:
| 1) | Acquired Assets that no longer provide FDIC loss share coverage beginning January 1, 2015; |
| 2) | Acquired Assets that are scheduled to lose FDIC loss share coverage over the next 12 months; |
| 3) | Acquired Assets that will continue to be covered under FDIC loss share coverage beyond the next 12 months; |
| 4) | Acquired Assets not covered under FDIC loss share agreements using SOP accounting treatment (in accordance with ASC Topic 310-30); and |
| 5) | Acquired Assets not covered under FDIC loss share agreements not using SOP accounting treatment. |
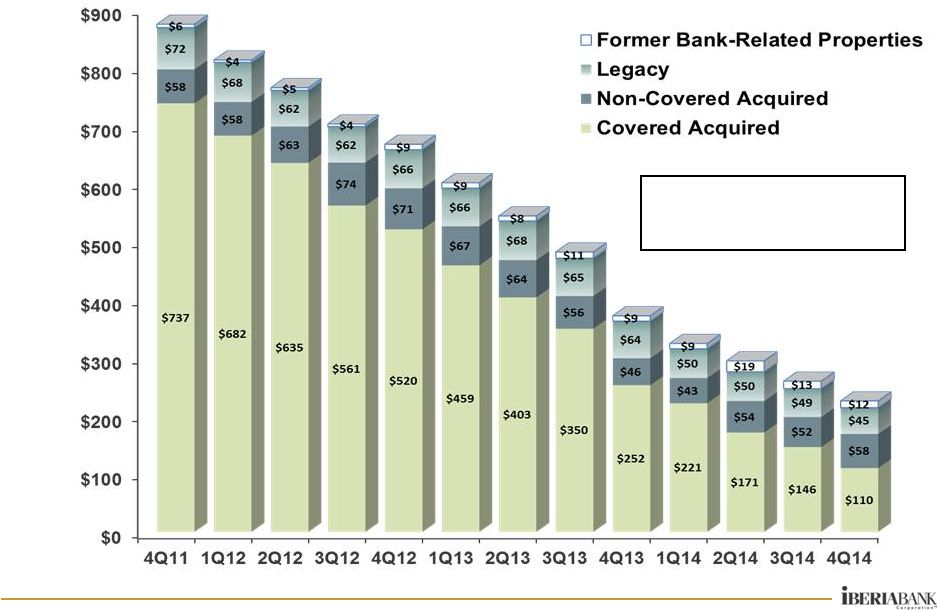
Between September 30, 2014 and December 31, 2014, legacy NPAs decreased $5 million, or 7%, due in part to $1 million in former bank branches and related land that were sold out of OREO during the fourth quarter of 2014. At December 31, 2014, those bank-related properties in OREO totaled $12 million, or 20% of total legacy NPAs. Legacy NPAs equated to 0.41% of total assets at December 31, 2014, and 0.33% of total assets excluding bank-related properties.
7
Loans past due 30 days or more (including non-accruing loans) increased $15 million, or 29%, and represented 0.68% of total loans at December 31, 2014, compared to 0.55% at September 30, 2014. The increase in past due loans was primarily associated with three specific loan relationships that were past due less than 60 days at year-end 2014. The two largest of these three loans were past due as a result of their maturities and were renewed subsequent to year-end. The third largest of these loans was brought current subsequent to year-end. None of the three loan relationships was impacted by the decline in energy commodity prices.
Table E – Legacy Asset Quality Summary
Excludes the impact of all Acquired Assets (FDIC-assisted acquisitions and other acquisitions, impaired and not impaired)
| For Quarter Ended: | % or Basis Point Change | |||||||||||||||||||
| ($ thousands) | 12/31/2013 | 9/30/2014 | 12/31/2014 | Year/Year | Qtr/Qtr | |||||||||||||||
| Non-performing Assets |
$ | 73,034 | $ | 61,542 | $ | 56,967 | -22 | % | -7 | % | ||||||||||
| Note: NPAs excluding Former Bank Properties |
63,828 | 48,808 | 45,411 | -29 | % | -7 | % | |||||||||||||
| Past Due Loans |
66,153 | 50,505 | 65,291 | -1 | % | 29 | % | |||||||||||||
| Classified Assets |
82,199 | 67,462 | 59,663 | -27 | % | -12 | % | |||||||||||||
| Non-performing Assets/Assets |
0.61 | % | 0.46 | % | 0.41 | % | (20 | ) bps | (5 | ) bps | ||||||||||
| NPAs/(Loans + OREO) |
0.88 | % | 0.67 | % | 0.59 | % | (29 | ) bps | (8 | ) bps | ||||||||||
| Classified Assets/Total Assets |
0.69 | % | 0.50 | % | 0.43 | % | (26 | ) bps | (7 | ) bps | ||||||||||
| (Past Dues & Non-accruals)/Loans |
0.80 | % | 0.55 | % | 0.68 | % | (12 | ) bps | 13 | bps | ||||||||||
| Provision For Loan Losses |
$ | 4,621 | $ | 4,022 | $ | 4,021 | -13 | % | 0 | % | ||||||||||
| Net Charge-Offs/(Recoveries) |
1,366 | 2,131 | 1,538 | 13 | % | -28 | % | |||||||||||||
|
|
|
|
|
|
|
|
|
|
|
|||||||||||
| Provision Less Net Charge-Offs |
$ | 3,255 | $ | 1,891 | $ | 2,483 | -24 | % | 31 | % | ||||||||||
| Net Charge-Offs/Average Loans |
0.07 | % | 0.09 | % | 0.06 | % | (1 | ) bps | (3 | ) bps | ||||||||||
| Allowance For Loan Losses/Loans |
0.81 | % | 0.79 | % | 0.79 | % | (2 | ) bps | (0 | ) bps | ||||||||||
| Allowance for Credit Losses to Total Loans |
0.95 | % | 0.92 | % | 0.91 | % | (4 | ) bps | (1 | ) bps | ||||||||||
Table F provides a breakdown of Acquired Assets under the other five categories pertaining to Acquired Assets and the asset quality performance measures associated with Acquired Assets in each category.
8
Table F – Acquired Assets By Portfolio Type (1)
All FDIC-assisted acquisitions and other acquired loans (impaired and not impaired)
| Acquired FDIC Covered Assets | Acquired Non-Covered Assets | Total Acquired Assets |
||||||||||||||||||||||
| Non SFR (Losing Loss Share Coverage as of January 1, 2015) |
Non SFR (Losing Loss Share Coverage within 12 months) |
SFR (Losing Loss Share Coverage 10 years from Acquisition) |
SOP Assets (2) | Non-SOP Assets (2) | ||||||||||||||||||||
| ($ thousands) | ||||||||||||||||||||||||
| Loans, net |
$ | 174,711 | $ | 22,485 | $ | 247,348 | $ | 422,607 | $ | 905,179 | $ | 1,772,330 | ||||||||||||
| Other Real Estate Owned |
9,596 | 3,639 | 10,461 | 9,007 | — | 32,703 | ||||||||||||||||||
| Allowance for Loan Losses |
(29,771 | ) | (1,710 | ) | (13,283 | ) | (8,830 | ) | (363 | ) | (53,957 | ) | ||||||||||||
| Non-accrual loans |
$ | 36,755 | $ | 2,939 | $ | 46,137 | $ | 47,019 | $ | 1,866 | $ | 134,716 | ||||||||||||
| Foreclosed assets |
825 | — | — | 44 | — | 869 | ||||||||||||||||||
| Other real estate owned |
8,771 | 3,639 | 10,462 | 8,963 | — | 31,835 | ||||||||||||||||||
| Accruing Loans More Than 90 Days Past Due |
— | — | 368 | — | 586 | 954 | ||||||||||||||||||
|
|
|
|
|
|
|
|
|
|
|
|
|
|||||||||||||
| Non-performing Assets |
46,351 | 6,578 | 56,967 | 56,026 | 2,452 | 168,374 | ||||||||||||||||||
| Total Past Due Loans |
$ | 40,629 | $ | 2,966 | $ | 48,793 | $ | 58,319 | $ | 6,537 | $ | 157,244 | ||||||||||||
| Non-performing Assets to Total Loans and OREO |
25.15 | % | 25.18 | % | 22.10 | % | 12.98 | % | 0.27 | % | 9.33 | % | ||||||||||||
| Past Due and Non-accrual Loans to Loans |
23.25 | % | 13.19 | % | 19.73 | % | 13.80 | % | 0.72 | % | 8.87 | % | ||||||||||||
| Provision For Loan Losses |
$ | 974 | $ | 450 | $ | 182 | $ | (286 | ) | $ | 1,154 | $ | 2,474 | |||||||||||
| Net Charge-Offs/(Recoveries) |
11 | — | — | (11 | ) | 217 | 217 | |||||||||||||||||
|
|
|
|
|
|
|
|
|
|
|
|
|
|||||||||||||
| Provision Less Net Charge-Offs |
$ | 963 | $ | 450 | $ | 182 | $ | (275 | ) | $ | 937 | $ | 2,257 | |||||||||||
| Net Charge-Offs to Average Loans |
0.08 | % | 0.00 | % | 0.00 | % | -0.03 | % | 0.29 | % | 0.05 | % | ||||||||||||
| Allowance for Loan Losses to Loans |
17.04 | % | 7.61 | % | 5.37 | % | 2.09 | % | 0.04 | % | 3.04 | % | ||||||||||||
| Allowance for Credit Losses to Total Loans |
17.04 | % | 7.61 | % | 5.37 | % | 2.09 | % | 0.04 | % | 3.04 | % | ||||||||||||
| Indemnification asset collectible from the FDIC and OREO |
$ | — | $ | — | $ | 11,007 | $ | — | $ | — | $ | 11,007 | ||||||||||||
| (1) | Amounts in this table are presented gross of discounts unless otherwise noted. |
| (2) | The classification of assets acquired from Teche and First Private as SOP or Non-SOP assets is preliminary and subject to change. At December 31, 2014, Teche loans of $33.9 million and $565.5 million are included in SOP and Non-SOP assets, respectively. First Private loans of $264.2 million have been included as Non-SOP loans at December 31, 2014. |
Capital Position
The Company maintains favorable capital strength. At December 31, 2014, the Company reported a tangible common equity ratio of 8.60%, up 15 basis points compared to September 30, 2014. At December 31, 2014, the Company’s preliminary Tier 1 leverage ratio was 9.36%, up 15 basis points compared to September 30, 2014. The Company’s preliminary total risk-based capital ratio at December 31, 2014, was 12.30%, down 10 basis points compared to September 30, 2014.
Commencing in the first quarter of 2015, the Company will experience a 50% phase-out of Tier 1 capital treatment for its trust preferred securities with no commensurate change in total regulatory capital. At year-end 2014, the Company experienced the expiration of FDIC loss share protection on non-single family loans associated with three FDIC-assisted transactions. The expiration of FDIC loss share coverage on those assets resulted in increased risk weighting associated with those assets. The influence of the phase-out of Tier 1 treatment on trust preferred securities and the scheduled expiration of certain FDIC loss share coverage is estimated to reduce the Company’s Tier 1 leverage ratio, Tier 1 risk based capital ratio, and total risk based capital ratio by approximately 36, 54, and 12 basis points, respectively, beginning in 2015.
At December 31, 2014, book value per share was $55.39, up $1.07 per share, or 2%, compared to September 30, 2014. Tangible book value per share was $39.11, up $1.28 per share, or 3%, compared to September 30, 2014. Based on the closing stock price of the Company’s common stock of $55.36 per share on January 28, 2015, this price equated to 1.00 times December 31, 2014 book value and 1.42 times December 31, 2014 tangible book value per share.
9
On December 15, 2014, the Company declared a quarterly cash dividend of $0.34 per share. This dividend level equated to an annualized dividend rate of $1.36 per share and an indicated dividend yield of 2.46%.
IBERIABANK Corporation
The Company is a financial holding company with 280 combined offices, including 188 bank branch offices and three loan production offices in Louisiana, Arkansas, Tennessee, Alabama, Texas, and Florida, 23 title insurance offices in Arkansas and Louisiana, and mortgage representatives in 57 locations in 10 states. The Company has eight locations with representatives of IBERIA Wealth Advisors in five states, and one IBERIA Capital Partners, L.L.C. office in New Orleans.
The Company’s common stock trades on the NASDAQ Global Select Market under the symbol “IBKC.” The Company’s market capitalization was approximately $1.9 billion, based on the NASDAQ Global Select Market closing stock price on January 28, 2015.
The following 12 investment firms currently provide equity research coverage on the Company:
| • | Bank of America Merrill Lynch |
| • | FIG Partners, LLC |
| • | Hovde Group, LLC |
| • | Jefferies & Co., Inc. |
| • | Keefe, Bruyette & Woods, Inc. |
| • | Raymond James & Associates, Inc. |
| • | Robert W. Baird & Company |
| • | Sandler O’Neill + Partners, L.P. |
| • | Stephens, Inc. |
| • | Sterne, Agee & Leach |
| • | SunTrust Robinson-Humphrey |
| • | Wunderlich Securities |
Conference Call
In association with this earnings release, the Company will host a live conference call to discuss the financial results for the quarter just completed. The telephone conference call will be held on Thursday, January 29, 2015, beginning at 8:30 a.m. Central Time by dialing 1-888-317-6003. The confirmation code for the call is 3712071. A replay of the call will be available until midnight Central Time on February 6, 2015 by dialing 1-877-344-7529. The confirmation code for the replay is 10058635. The Company has prepared a PowerPoint presentation that supplements information contained in this press release. The PowerPoint presentation may be accessed on the Company’s web site, www.iberiabank.com, under “Investor Relations” and then “Presentations.”
Non-GAAP Financial Measures
This press release contains financial information determined by methods other than in accordance with GAAP. The Company’s management uses these non-GAAP financial measures in their analysis of the Company’s performance. These measures typically adjust GAAP performance measures to exclude the effects of the amortization of intangibles and include the tax benefit associated with revenue items that are tax-exempt, as well as adjust income available to common shareholders for certain significant activities or transactions that in management’s opinion can distort period-to-period comparisons of the Company’s performance. Since the presentation of these GAAP performance measures and their impact differ between companies, management believes presentations of
10
these non-GAAP financial measures provide useful supplemental information that is essential to a proper understanding of the operating results of the Company’s core businesses. These non-GAAP disclosures should not be viewed as a substitute for operating results determined in accordance with GAAP, nor are they necessarily comparable to non-GAAP performance measures that may be presented by other companies. Reconciliations of GAAP to non-GAAP disclosures are included as tables at the end of this release. Refer to press release supplemental table for this reconciliation.
Assumptions Regarding Projected Earnings in Future Periods
The Company’s operating EPS guidance for full year 2015 was based on the following significant assumptions:
| • | Recent forward interest rate curve projections; |
| • | Completion of the currently pending acquisitions in the first half of 2015; |
| • | No significant change in credit quality; |
| • | No significant changes to the preliminary purchase accounting marks assumed on the Company’s most recently completed acquisitions; |
| • | No significant cash flow or credit quality changes on Acquired Assets; |
| • | Mortgage, title insurance, and capital markets projections continue to reflect the current environment and expectations. |
Caution About Forward-Looking Statements
This release contains “forward-looking statements” as defined in the Private Securities Litigation Reform Act of 1995. In general, forward-looking statements usually use words such as “may,” “believe,” “expect,” “anticipate,” “intend,” “will,” “should,” “plan,” “estimate,” “predict,” “continue” and “potential” or the negative of these terms or other comparable terminology, including statements related to the expected timing of the closing of the proposed mergers, the expected returns and other benefits of the proposed mergers to shareholders, expected improvement in operating efficiency resulting from the proposed mergers with Georgia Commerce Bancshares, Inc., Old Florida Bancshares, Inc. and Florida Bank Group, Inc., estimated expense reductions resulting from the transactions and the timing of achievement of such reductions, the impact on and timing of the recovery of the impact on tangible book value, and the effect of the mergers on the Company’s capital ratios. Forward-looking statements represent management’s beliefs, based upon information available at the time the statements are made, with regard to the matters addressed; they are not guarantees of future performance. Forward-looking statements are subject to numerous assumptions, risks and uncertainties that change over time and could cause actual results or financial condition to differ materially from those expressed in or implied by such statements, and there can be no assurances that: the proposed mergers will close when expected, the expected returns and other benefits of the proposed mergers to shareholders will be achieved, the expected operating efficiencies will result, estimated expense reductions resulting from the transactions will occur as and when expected, the impact on tangible book value will be recovered or as expected or that the effect on the Company’s capital ratios will be as expected. Factors that could cause or contribute to such differences include, but are not limited to, the possibility that expected benefits may not materialize in the time frames expected or at all, or may be more costly to achieve; that the merger transactions may not be timely completed, if at all; that prior to completion of the merger transactions or thereafter, the parties’ respective businesses may not perform as expected due to transaction-related uncertainties or other factors; that the parties are unable to implement successful integration strategies; that the required regulatory, shareholder, or other closing conditions are not satisfied in a timely manner, or at all; reputational risks and the reaction of the parties’ customers to the merger transactions; diversion of management time to merger-related issues; and other factors and risk influences contained in the cautionary language included under the headings “Management’s Discussion and Analysis of Financial Condition and Results of Operations” and “Risk Factors” in the Company’s Form 10-K for the fiscal year ended December 31, 2013, and Form 10-Qs for the quarters ended March 31, 2014, June 30, 2014, and September 30, 2014, and other documents subsequently filed by the Company with the SEC. Consequently, no forward-looking statement can be guaranteed. Neither the Company, Georgia Commerce Bancshares, Inc., Old Florida Bancshares, Inc., nor Florida Bank Group, Inc. undertakes any obligation to update or revise any forward-looking statements, whether as a result of new
11
information, future events or otherwise. For any forward-looking statements made in this press release or any related documents, the Company, Georgia Commerce Bancshares, Inc., Old Florida Bancshares, Inc. and Florida Bank Group, Inc. claim protection of the safe harbor for forward-looking statements contained in the Private Securities Litigation Reform Act of 1995.
This communication is being made in respect of the proposed merger transactions involving the Company, Georgia Commerce Bancshares, Inc. and Old Florida Bancshares, Inc. This communication does not constitute an offer to sell or the solicitation of an offer to buy any securities or a solicitation of any vote or approval. In connection with the proposed merger with Georgia Commerce Bancshares, Inc., the Company will file with the SEC a registration statement on Form S-4 that will include a proxy statement/prospectus for the shareholders of Georgia Commerce Bancshares, Inc. The Company has filed a registration statement on Form S-4 that includes a proxy statement/prospectus for the shareholders of Old Florida Bancshares, Inc. The Company also plans to file other documents with the SEC regarding the pending merger transactions with Georgia Commerce Bancshares, Inc., Florida Bank Group, Inc. and Old Florida Bancshares, Inc. Georgia Commerce Bancshares, Inc. will mail the final proxy statement/prospectus to its shareholders. Old Florida Bancshares, Inc. has mailed its final proxy statement/prospectus to its shareholders. BEFORE MAKING ANY VOTING OR INVESTMENT DECISION, INVESTORS ARE URGED TO READ THE RELEVANT PROXY STATEMENT/PROSPECTUS REGARDING THE PROPOSED TRANSACTION AND ANY OTHER RELEVANT DOCUMENTS CAREFULLY IN THEIR ENTIRETY WHEN THEY BECOME AVAILABLE BECAUSE THEY WILL CONTAIN IMPORTANT INFORMATION ABOUT THE PROPOSED TRANSACTIONS. The proxy statement/prospectuses, as well as other filings containing information about the Company, Georgia Commerce Bancshares, Inc., Old Florida Bancshares, Inc. and Florida Bank Group, Inc., will be available without charge, at the SEC’s Internet site (http://www.sec.gov). Copies of the proxy statement/prospectuses and the filings with the SEC that will be incorporated by reference in the proxy statement/prospectuses can also be obtained, when available, without charge, from the Company’s website (http://www.iberiabank.com), under the heading “Investor Information.”
The Company, Georgia Commerce Bancshares, Inc. and Old Florida Bancshares, Inc., and certain of their respective directors, executive officers and other members of management and employees may be deemed to be participants in the solicitation of proxies from the shareholders of Georgia Commerce Bancshares, Inc. and Old Florida Bancshares, Inc. in respect of the proposed merger transactions. Information regarding the directors and executive officers of the Company is set forth in the definitive proxy statement for the Company’s 2014 annual meeting of shareholders, as filed with the SEC on April 7, 2014, and in Forms 3, 4 and 5 filed with the SEC by its officers and directors. Information regarding the directors and executive officers of Georgia Commerce Bancshares, Inc. who may be deemed participants in the solicitation of the shareholders of Georgia Commerce Bancshares, Inc. in connection with the proposed transaction will be included in the proxy statement/prospectus for the Georgia Commerce Bancshares, Inc. special meeting of shareholders, which will be filed by the Company with the SEC. Information regarding the directors and executive officers of Old Florida Bancshares, Inc. who may be deemed to be participants in the solicitation of shareholders of Old Florida Bancshares, Inc. in connection with the proposed transaction is included in the proxy statement/prospectus for the Old Florida Bancshares, Inc. special meeting of shareholders, which was filed with the SEC. Additional information regarding the interests of such participants will be included in the proxy statement/prospectuses and other relevant documents regarding the proposed merger transactions filed with the SEC when they become available.
12
Table 1 - IBERIABANK CORPORATION
FINANCIAL HIGHLIGHTS
| For The Quarter Ended December 31, |
For The Quarter Ended September 30, |
|||||||||||||||||||
| 2014 | 2013 | % Change |
2014 | % Change |
||||||||||||||||
| Income Data (in thousands): |
||||||||||||||||||||
| Net Interest Income |
$ | 124,680 | $ | 103,438 | 21 | % | $ | 121,751 | 2 | % | ||||||||||
| Net Interest Income (TE) (1) |
126,735 | 105,709 | 20 | % | 123,885 | 2 | % | |||||||||||||
| Net Income |
35,936 | 25,604 | 40 | % | 30,892 | 16 | % | |||||||||||||
| Earnings Available to Common Shareholders- Basic |
35,936 | 25,604 | 40 | % | 30,892 | 16 | % | |||||||||||||
| Earnings Available to Common Shareholders- Diluted |
35,406 | 25,148 | 41 | % | 30,427 | 16 | % | |||||||||||||
| Per Share Data: |
||||||||||||||||||||
| Earnings Available to Common Shareholders - Basic |
$ | 1.08 | $ | 0.86 | 25 | % | $ | 0.93 | 16 | % | ||||||||||
| Earnings Available to Common Shareholders - Diluted |
1.07 | 0.86 | 25 | % | 0.92 | 16 | % | |||||||||||||
| Operating Earnings (Non-GAAP) |
1.05 | 0.87 | 21 | % | 1.04 | 1 | % | |||||||||||||
| Book Value |
55.39 | 51.40 | 8 | % | 54.32 | 2 | % | |||||||||||||
| Tangible Book Value (2) |
39.11 | 37.17 | 5 | % | 37.83 | 3 | % | |||||||||||||
| Cash Dividends |
0.34 | 0.34 | — | 0.34 | — | |||||||||||||||
| Closing Stock Price |
64.85 | 62.85 | 3 | % | 62.51 | 4 | % | |||||||||||||
| Key Ratios: (3) |
||||||||||||||||||||
| Operating Ratios: |
||||||||||||||||||||
| Return on Average Assets |
0.91 | % | 0.77 | % | 0.79 | % | ||||||||||||||
| Return on Average Common Equity |
7.78 | % | 6.62 | % | 6.78 | % | ||||||||||||||
| Return on Average Tangible Common Equity (2) |
11.46 | % | 9.43 | % | 10.10 | % | ||||||||||||||
| Net Interest Margin (TE) (1) |
3.53 | % | 3.52 | % | 3.49 | % | ||||||||||||||
| Efficiency Ratio |
69.5 | % | 72.2 | % | 71.3 | % | ||||||||||||||
| Tangible Operating Efficiency Ratio (TE) (Non-GAAP) (1) (2) |
65.9 | % | 69.9 | % | 65.7 | % | ||||||||||||||
| Full-time Equivalent Employees |
2,757 | 2,576 | 2,703 | |||||||||||||||||
| Capital Ratios: |
||||||||||||||||||||
| Tangible Common Equity Ratio (Non-GAAP) |
8.60 | % | 8.55 | % | 8.45 | % | ||||||||||||||
| Tangible Common Equity to Risk-Weighted Assets |
10.38 | % | 10.39 | % | 10.32 | % | ||||||||||||||
| Tier 1 Leverage Ratio |
9.36 | % | 9.70 | % | 9.21 | % | ||||||||||||||
| Tier 1 Capital Ratio |
11.18 | % | 11.57 | % | 11.21 | % | ||||||||||||||
| Total Risk Based Capital Ratio |
12.30 | % | 12.82 | % | 12.40 | % | ||||||||||||||
| Common Stock Dividend Payout Ratio |
31.7 | % | 39.6 | % | 36.8 | % | ||||||||||||||
| Asset Quality Ratios: |
||||||||||||||||||||
| Excluding FDIC Covered Assets and Acquired Assets |
||||||||||||||||||||
| Non-performing Assets to Total Assets (4) |
0.41 | % | 0.61 | % | 0.46 | % | ||||||||||||||
| Allowance for Loan Losses to Loans |
0.79 | % | 0.81 | % | 0.79 | % | ||||||||||||||
| Net Charge-offs to Average Loans |
0.06 | % | 0.07 | % | 0.09 | % | ||||||||||||||
| Non-performing Assets to Total Loans and OREO (4) |
0.59 | % | 0.88 | % | 0.67 | % | ||||||||||||||
| For The Quarter Ended | For The Quarter Ended | |||||||||||||||||||
| December 31, | September 30, | June 30, | March 31, | |||||||||||||||||
| 2014 | 2014 | 2014 | 2014 | 2014 | ||||||||||||||||
| Balance Sheet Summary (in thousands): | End of Period | Average | Average | Average | Average | |||||||||||||||
| Excess Liquidity (5) |
$ | 296,101 | $ | 353,716 | $ | 489,221 | $ | 237,712 | $ | 114,621 | ||||||||||
| Total Investment Securities |
2,275,813 | 2,261,569 | 2,168,345 | 2,120,988 | 2,116,166 | |||||||||||||||
| Loans, Net of Unearned Income |
11,441,044 | 11,271,752 | 11,009,833 | 9,998,533 | 9,551,351 | |||||||||||||||
| Loans, Net of Unearned Income, Excluding Covered Assets and Acquired Assets |
9,668,714 | 9,438,869 | 9,019,127 | 8,643,859 | 8,324,676 | |||||||||||||||
| Total Assets |
15,758,605 | 15,615,024 | 15,476,910 | 14,041,848 | 13,362,918 | |||||||||||||||
| Total Deposits |
12,520,525 | 12,514,479 | 12,222,997 | 11,071,698 | 10,816,122 | |||||||||||||||
| Total Shareholders’ Equity |
1,852,849 | 1,831,933 | 1,806,813 | 1,632,330 | 1,557,006 | |||||||||||||||
| (1) | Fully taxable equivalent (TE) calculations include the tax benefit associated with related income sources that are tax-exempt using a marginal tax rate of 35%. |
| (2) | Tangible calculations eliminate the effect of goodwill and acquisition related intangible assets and the corresponding amortization expense on a tax-effected basis where applicable. |
| (3) | All ratios are calculated on an annualized basis for the period indicated. |
| (4) | Nonperforming assets consist of nonaccruing loans, accruing loans 90 days or more past due and other real estate owned, including repossessed assets. |
| (5) | Excess Liquidity includes interest-bearing deposits in banks and fed funds sold, but excludes liquidity sources and uses from off-balance sheet arrangements. |
N/M - Comparison of the information presented is not meaningful given the periods presented.
13
Table 2 - IBERIABANK CORPORATION
CONDENSED CONSOLIDATED FINANCIAL INFORMATION
(dollars in thousands)
| BALANCE SHEET (End of Period) |
December 31, | September 30, | ||||||||||||||||||
| 2014 | 2013 | % Change | 2014 | % Change | ||||||||||||||||
| ASSETS |
||||||||||||||||||||
| Cash and Due From Banks |
$ | 251,994 | $ | 238,672 | 5.6 | % | $ | 257,147 | (2.0 | %) | ||||||||||
| Interest-bearing Deposits in Banks |
296,101 | 152,724 | 93.9 | % | 410,860 | (27.9 | %) | |||||||||||||
|
|
|
|
|
|
|
|
|
|
|
|||||||||||
| Total Cash and Equivalents |
548,095 | 391,396 | 40.0 | % | 668,007 | (18.0 | %) | |||||||||||||
| Investment Securities Available for Sale |
2,158,853 | 1,936,797 | 11.5 | % | 2,103,828 | 2.6 | % | |||||||||||||
| Investment Securities Held to Maturity |
116,960 | 154,109 | (24.1 | %) | 120,520 | (3.0 | %) | |||||||||||||
|
|
|
|
|
|
|
|
|
|
|
|||||||||||
| Total Investment Securities |
2,275,813 | 2,090,906 | 8.8 | % | 2,224,348 | 2.3 | % | |||||||||||||
| Mortgage Loans Held for Sale |
140,072 | 128,442 | 9.1 | % | 148,530 | (5.7 | %) | |||||||||||||
| Loans, Net of Unearned Income |
11,441,044 | 9,492,019 | 20.5 | % | 11,080,887 | 3.3 | % | |||||||||||||
| Allowance for Loan Losses |
(130,131 | ) | (143,074 | ) | (9.0 | %) | (134,540 | ) | (3.3 | %) | ||||||||||
|
|
|
|
|
|
|
|
|
|
|
|||||||||||
| Loans, Net |
11,310,913 | 9,348,945 | 21.0 | % | 10,946,347 | 3.3 | % | |||||||||||||
| Loss Share Receivable |
69,627 | 162,312 | (57.1 | %) | 94,712 | (26.5 | %) | |||||||||||||
| Premises and Equipment |
307,159 | 287,510 | 6.8 | % | 307,868 | (0.2 | %) | |||||||||||||
| Goodwill and Other Intangibles |
548,131 | 425,442 | 28.8 | % | 553,669 | (1.0 | %) | |||||||||||||
| Other Assets |
558,795 | 530,597 | 5.3 | % | 571,670 | (2.3 | %) | |||||||||||||
|
|
|
|
|
|
|
|
|
|
|
|||||||||||
| Total Assets |
$ | 15,758,605 | $ | 13,365,550 | 17.9 | % | $ | 15,515,151 | 1.6 | % | ||||||||||
|
|
|
|
|
|
|
|
|
|
|
|||||||||||
| LIABILITIES AND SHAREHOLDERS’ EQUITY |
||||||||||||||||||||
| Noninterest-bearing Deposits |
$ | 3,195,430 | $ | 2,575,939 | 24.0 | % | $ | 3,157,453 | 1.2 | % | ||||||||||
| NOW Accounts |
2,462,841 | 2,283,490 | 7.9 | % | 2,194,803 | 12.2 | % | |||||||||||||
| Savings and Money Market Accounts |
4,746,017 | 4,166,979 | 13.9 | % | 4,921,510 | (3.6 | %) | |||||||||||||
| Certificates of Deposit |
2,116,237 | 1,710,592 | 23.7 | % | 2,103,925 | 0.6 | % | |||||||||||||
|
|
|
|
|
|
|
|
|
|
|
|||||||||||
| Total Deposits |
12,520,525 | 10,737,000 | 16.6 | % | 12,377,691 | 1.2 | % | |||||||||||||
| Short-term Borrowings |
603,000 | 375,000 | 60.8 | % | 553,000 | 9.0 | % | |||||||||||||
| Securities Sold Under Agreements to Repurchase |
242,742 | 305,344 | (20.5 | %) | 259,783 | (6.6 | %) | |||||||||||||
| Trust Preferred Securities |
111,862 | 111,862 | — | 111,862 | — | |||||||||||||||
| Other Long-term Debt |
291,392 | 168,837 | 72.6 | % | 243,707 | 19.6 | % | |||||||||||||
| Other Liabilities |
136,235 | 136,528 | (0.2 | %) | 152,733 | (10.8 | %) | |||||||||||||
|
|
|
|
|
|
|
|
|
|
|
|||||||||||
| Total Liabilities |
13,905,756 | 11,834,571 | 17.5 | % | 13,698,776 | 1.5 | % | |||||||||||||
| Total Shareholders’ Equity |
1,852,849 | 1,530,979 | 21.0 | % | 1,816,375 | 2.0 | % | |||||||||||||
|
|
|
|
|
|
|
|
|
|
|
|||||||||||
| Total Liabilities and Shareholders’ Equity |
$ | 15,758,605 | $ | 13,365,550 | 17.9 | % | $ | 15,515,151 | 1.6 | % | ||||||||||
|
|
|
|
|
|
|
|
|
|
|
|||||||||||
| BALANCE SHEET (Average) |
December 31, | September 30, | June 30, | March 31, | December 31, | |||||||||||||||
| 2014 | 2014 | 2014 | 2014 | 2013 | ||||||||||||||||
| ASSETS |
||||||||||||||||||||
| Cash and Due From Banks |
$ | 239,377 | $ | 229,556 | $ | 237,631 | $ | 234,924 | $ | 225,527 | ||||||||||
| Interest-bearing Deposits in Banks |
353,716 | 489,221 | 237,712 | 114,621 | 204,970 | |||||||||||||||
| Investment Securities |
2,261,569 | 2,168,345 | 2,120,988 | 2,116,166 | 2,131,804 | |||||||||||||||
| Mortgage Loans Held for Sale |
121,438 | 163,510 | 140,096 | 96,019 | 112,499 | |||||||||||||||
| Loans, Net of Unearned Income |
11,271,752 | 11,009,833 | 9,998,533 | 9,551,351 | 9,172,490 | |||||||||||||||
| Allowance for Loan Losses |
(134,177 | ) | (133,443 | ) | (132,049 | ) | (139,726 | ) | (148,030 | ) | ||||||||||
| Loss Share Receivable |
85,733 | 111,383 | 131,375 | 154,634 | 188,932 | |||||||||||||||
| Other Assets |
1,415,616 | 1,438,505 | 1,307,562 | 1,234,930 | 1,226,979 | |||||||||||||||
|
|
|
|
|
|
|
|
|
|
|
|||||||||||
| Total Assets |
$ | 15,615,024 | $ | 15,476,910 | $ | 14,041,848 | $ | 13,362,918 | $ | 13,115,171 | ||||||||||
|
|
|
|
|
|
|
|
|
|
|
|||||||||||
| LIABILITIES AND SHAREHOLDERS’ EQUITY |
||||||||||||||||||||
| Non-interest-bearing Deposits |
$ | 3,228,773 | $ | 3,057,513 | $ | 2,748,468 | $ | 2,623,075 | $ | 2,572,599 | ||||||||||
| NOW Accounts |
2,271,836 | 2,228,378 | 2,229,264 | 2,230,745 | 2,145,036 | |||||||||||||||
| Savings and Money Market Accounts |
4,908,247 | 4,877,051 | 4,372,855 | 4,296,360 | 4,329,985 | |||||||||||||||
| Certificates of Deposit |
2,105,623 | 2,060,055 | 1,721,111 | 1,665,943 | 1,787,643 | |||||||||||||||
|
|
|
|
|
|
|
|
|
|
|
|||||||||||
| Total Deposits |
12,514,479 | 12,222,997 | 11,071,698 | 10,816,122 | 10,835,263 | |||||||||||||||
| Short-term Borrowings |
449,190 | 627,192 | 632,778 | 285,383 | 49,946 | |||||||||||||||
| Securities Sold Under Agreements to Repurchase |
264,194 | 292,677 | 274,681 | 299,106 | 285,745 | |||||||||||||||
| Trust Preferred Securities |
111,862 | 111,862 | 111,862 | 111,862 | 111,862 | |||||||||||||||
| Long-term Debt |
283,548 | 247,108 | 192,845 | 168,367 | 169,063 | |||||||||||||||
| Other Liabilities |
159,818 | 168,262 | 125,654 | 125,072 | 128,249 | |||||||||||||||
|
|
|
|
|
|
|
|
|
|
|
|||||||||||
| Total Liabilities |
13,783,091 | 13,670,098 | 12,409,518 | 11,805,912 | 11,580,128 | |||||||||||||||
| Total Shareholders’ Equity |
1,831,933 | 1,806,813 | 1,632,330 | 1,557,006 | 1,535,043 | |||||||||||||||
|
|
|
|
|
|
|
|
|
|
|
|||||||||||
| Total Liabilities and Shareholders’ Equity |
$ | 15,615,024 | $ | 15,476,910 | $ | 14,041,848 | $ | 13,362,918 | $ | 13,115,171 | ||||||||||
|
|
|
|
|
|
|
|
|
|
|
|||||||||||
Table 3 - IBERIABANK CORPORATION
CONDENSED CONSOLIDATED FINANCIAL INFORMATION
(dollars in thousands except per share data)
| For The Three Months Ended | ||||||||||||||||||||
| INCOME STATEMENT |
December 31, | September 30, | ||||||||||||||||||
| 2014 | 2013 | % Change | 2014 | % Change | ||||||||||||||||
| Interest Income |
$ | 137,276 | $ | 114,092 | 20.3 | % | $ | 133,793 | 2.6 | % | ||||||||||
| Interest Expense |
12,596 | 10,654 | 18.2 | % | 12,042 | 4.6 | % | |||||||||||||
|
|
|
|
|
|
|
|
|
|
|
|||||||||||
| Net Interest Income |
124,680 | 103,438 | 20.5 | % | 121,751 | 2.4 | % | |||||||||||||
| Provision for Loan Losses |
6,495 | 4,700 | 38.2 | % | 5,714 | 13.7 | % | |||||||||||||
|
|
|
|
|
|
|
|
|
|
|
|||||||||||
| Net Interest Income After Provision for Loan Losses |
118,185 | 98,738 | 19.7 | % | 116,037 | 1.9 | % | |||||||||||||
| Service Charges |
10,153 | 7,455 | 36.2 | % | 10,205 | (0.5 | %) | |||||||||||||
| ATM / Debit Card Fee Income |
3,331 | 2,493 | 33.6 | % | 3,287 | 1.3 | % | |||||||||||||
| BOLI Proceeds and Cash Surrender Value Income |
1,050 | 900 | 16.7 | % | 1,047 | 0.4 | % | |||||||||||||
| Mortgage Income |
13,646 | 12,356 | 10.4 | % | 14,263 | (4.3 | %) | |||||||||||||
| Gain (Loss) on Sale of Investments, Net |
164 | 19 | 778.3 | % | 582 | (71.9 | %) | |||||||||||||
| Title Revenue |
5,486 | 4,327 | 26.8 | % | 5,577 | (1.6 | %) | |||||||||||||
| Broker Commissions |
3,960 | 4,986 | (20.6 | %) | 5,297 | (25.2 | %) | |||||||||||||
| Other Non-interest Income |
9,282 | 6,179 | 50.2 | % | 6,854 | 35.4 | % | |||||||||||||
|
|
|
|
|
|
|
|
|
|
|
|||||||||||
| Total Non-interest Income |
47,072 | 38,715 | 21.6 | % | 47,112 | (0.1 | %) | |||||||||||||
| Salaries and Employee Benefits |
65,445 | 59,403 | 10.2 | % | 64,934 | 0.8 | % | |||||||||||||
| Occupancy and Equipment |
14,594 | 13,986 | 4.3 | % | 14,883 | (1.9 | %) | |||||||||||||
| Amortization of Acquisition Intangibles |
1,618 | 1,177 | 37.5 | % | 1,623 | (0.3 | %) | |||||||||||||
| Other Non-interest Expense |
37,725 | 28,108 | 34.2 | % | 38,920 | (3.1 | %) | |||||||||||||
|
|
|
|
|
|
|
|
|
|
|
|||||||||||
| Total Non-interest Expense |
119,382 | 102,674 | 16.3 | % | 120,360 | (0.8 | %) | |||||||||||||
| Income Before Income Taxes |
45,875 | 34,779 | 31.9 | % | 42,789 | 7.2 | % | |||||||||||||
| Income Tax Expense |
9,939 | 9,175 | 8.3 | % | 11,897 | (16.5 | %) | |||||||||||||
|
|
|
|
|
|
|
|
|
|
|
|||||||||||
| Net Income |
$ | 35,936 | $ | 25,604 | 40.4 | % | $ | 30,892 | 16.3 | % | ||||||||||
|
|
|
|
|
|
|
|
|
|
|
|||||||||||
| Preferred Stock Dividends |
— | — | — | — | — | |||||||||||||||
|
|
|
|
|
|
|
|
|
|
|
|||||||||||
| Earnings Available to Common Shareholders - Basic |
35,936 | 25,604 | 40.4 | % | 30,892 | 16.3 | % | |||||||||||||
|
|
|
|
|
|
|
|
|
|
|
|||||||||||
| Earnings Allocated to Unvested Restricted Stock |
(530 | ) | (456 | ) | 16.3 | % | (465 | ) | 13.9 | % | ||||||||||
|
|
|
|
|
|
|
|
|
|
|
|||||||||||
| Earnings Available to Common Shareholders - Diluted |
$ | 35,406 | $ | 25,148 | 40.8 | % | $ | 30,427 | 16.4 | % | ||||||||||
|
|
|
|
|
|
|
|
|
|
|
|||||||||||
| Earnings Per Share, Diluted |
$ | 1.07 | $ | 0.86 | 24.9 | % | $ | 0.92 | 16.3 | % | ||||||||||
|
|
|
|
|
|
|
|
|
|
|
|||||||||||
| Impact of Non-Operating Items (Non-GAAP) |
$ | (0.02 | ) | $ | 0.01 | (533.0 | %) | $ | 0.12 | (120.8 | %) | |||||||||
|
|
|
|
|
|
|
|
|
|
|
|||||||||||
| Earnings Per Share, Diluted, Excluding Non-operating Items (Non-GAAP) |
$ | 1.05 | $ | 0.87 | 21.0 | % | $ | 1.04 | 0.9 | % | ||||||||||
|
|
|
|
|
|
|
|
|
|
|
|||||||||||
| NUMBER OF SHARES OUTSTANDING |
||||||||||||||||||||
| Basic Shares - All Classes (Average) |
33,332,691 | 29,673,358 | 12.3 | % | 33,309,881 | 0.1 | % | |||||||||||||
| Diluted Shares - Common Shareholders (Average) |
32,947,152 | 29,236,174 | 12.7 | % | 32,926,969 | 0.1 | % | |||||||||||||
| Book Value Shares (Period End) (1) |
33,453,404 | 29,786,544 | 12.3 | % | 33,440,859 | 0.0 | % | |||||||||||||
| 2014 | 2013 | |||||||||||||||||||
| INCOME STATEMENT |
Fourth | Third | Second | First | Fourth | |||||||||||||||
| Quarter | Quarter | Quarter | Quarter | Quarter | ||||||||||||||||
| Interest Income |
$ | 137,276 | $ | 133,793 | $ | 119,514 | $ | 114,232 | $ | 114,092 | ||||||||||
| Interest Expense |
12,596 | 12,042 | 10,241 | 9,824 | 10,654 | |||||||||||||||
|
|
|
|
|
|
|
|
|
|
|
|||||||||||
| Net Interest Income |
124,680 | 121,751 | 109,273 | 104,408 | 103,438 | |||||||||||||||
| Provision for Loan Losses |
6,495 | 5,714 | 4,748 | 2,103 | 4,700 | |||||||||||||||
|
|
|
|
|
|
|
|
|
|
|
|||||||||||
| Net Interest Income After Provision for Loan Losses |
118,185 | 116,037 | 104,525 | 102,305 | 98,738 | |||||||||||||||
| Total Non-interest Income |
47,072 | 47,112 | 43,761 | 35,681 | 38,715 | |||||||||||||||
| Total Non-interest Expense |
119,382 | 120,360 | 127,309 | 107,428 | 102,674 | |||||||||||||||
|
|
|
|
|
|
|
|
|
|
|
|||||||||||
| Income Before Income Taxes |
45,876 | 42,789 | 20,977 | 30,558 | 34,779 | |||||||||||||||
| Income Tax Expense |
9,939 | 11,897 | 4,749 | 8,163 | 9,175 | |||||||||||||||
|
|
|
|
|
|
|
|
|
|
|
|||||||||||
| Net Income |
$ | 35,936 | $ | 30,892 | $ | 16,227 | $ | 22,395 | $ | 25,604 | ||||||||||
|
|
|
|
|
|
|
|
|
|
|
|||||||||||
| Preferred Stock Dividends |
— | — | — | — | — | |||||||||||||||
|
|
|
|
|
|
|
|
|
|
|
|||||||||||
| Earnings Available to Common Shareholders - Basic |
35,936 | 30,892 | 16,227 | 22,395 | 25,604 | |||||||||||||||
|
|
|
|
|
|
|
|
|
|
|
|||||||||||
| Earnings Allocated to Unvested Restricted Stock |
(530 | ) | (465 | ) | (258 | ) | (405 | ) | (456 | ) | ||||||||||
|
|
|
|
|
|
|
|
|
|
|
|||||||||||
| Earnings Available to Common Shareholders - Diluted |
$ | 35,406 | $ | 30,427 | $ | 15,969 | $ | 21,990 | $ | 25,148 | ||||||||||
|
|
|
|
|
|
|
|
|
|
|
|||||||||||
| Earnings Per Share, Basic |
$ | 1.08 | $ | 0.93 | $ | 0.53 | $ | 0.75 | $ | 0.86 | ||||||||||
|
|
|
|
|
|
|
|
|
|
|
|||||||||||
| Earnings Per Share, Diluted |
$ | 1.07 | $ | 0.92 | $ | 0.53 | $ | 0.75 | $ | 0.86 | ||||||||||
|
|
|
|
|
|
|
|
|
|
|
|||||||||||
| Book Value Per Common Share |
$ | 55.39 | $ | 54.32 | $ | 53.79 | $ | 52.04 | $ | 51.40 | ||||||||||
| Tangible Book Value Per Common Share |
$ | 39.11 | $ | 37.83 | $ | 37.30 | $ | 37.59 | $ | 37.17 | ||||||||||
| Return on Average Assets |
0.91 | % | 0.79 | % | 0.46 | % | 0.68 | % | 0.77 | % | ||||||||||
| Return on Average Common Equity |
7.78 | % | 6.78 | % | 3.99 | % | 5.83 | % | 6.62 | % | ||||||||||
| Return on Average Tangible Common Equity |
11.46 | % | 10.10 | % | 5.88 | % | 8.36 | % | 9.43 | % | ||||||||||
| (1) | Shares used for book value purposes exclude shares held in treasury at the end of the period. |
Table 4 - IBERIABANK CORPORATION
CONDENSED CONSOLIDATED FINANCIAL INFORMATION
(dollars in thousands except per share data)
| For The Year Ended | ||||||||||||
| INCOME STATEMENT |
December 31, | |||||||||||
| 2014 | 2013 | % Change | ||||||||||
| Interest Income |
$ | 504,815 | $ | 437,197 | 15.5 | % | ||||||
| Interest Expense |
44,704 | 46,953 | (4.8 | %) | ||||||||
|
|
|
|
|
|
|
|||||||
| Net Interest Income |
460,111 | 390,244 | 17.9 | % | ||||||||
| Provision for Loan Losses |
19,060 | 5,145 | N/M | |||||||||
|
|
|
|
|
|
|
|||||||
| Net Interest Income After Provision for Loan Losses |
441,051 | 385,099 | 14.5 | % | ||||||||
| Service Charges |
35,573 | 28,871 | 23.2 | % | ||||||||
| ATM / Debit Card Fee Income |
12,023 | 9,510 | 26.4 | % | ||||||||
| BOLI Proceeds and Cash Surrender Value Income |
5,473 | 3,647 | 50.1 | % | ||||||||
| Mortgage Income |
51,797 | 64,197 | (19.3 | %) | ||||||||
| Gain on Sale of Investments, net |
773 | 2,334 | (66.9 | %) | ||||||||
| Title Revenue |
20,492 | 20,526 | (0.2 | %) | ||||||||
| Broker Commissions |
18,783 | 16,333 | 15.0 | % | ||||||||
| Other Non-interest Income |
28,714 | 23,540 | 22.0 | % | ||||||||
|
|
|
|
|
|
|
|||||||
| Total Non-interest Income |
173,628 | 168,958 | 2.8 | % | ||||||||
| Salaries and Employee Benefits |
259,086 | 244,981 | 5.8 | % | ||||||||
| Occupancy and Equipment |
59,571 | 58,037 | 2.6 | % | ||||||||
| Amortization of Acquisition Intangibles |
5,807 | 4,720 | 23.0 | % | ||||||||
| Other Non-interest Expense |
150,015 | 165,347 | (9.3 | %) | ||||||||
|
|
|
|
|
|
|
|||||||
| Total Non-interest Expense |
474,479 | 473,085 | 0.3 | % | ||||||||
| Income Before Income Taxes |
140,200 | 80,972 | 73.1 | % | ||||||||
| Income Tax Expense |
34,750 | 15,869 | (119.0 | %) | ||||||||
|
|
|
|
|
|
|
|||||||
| Net Income |
$ | 105,450 | $ | 65,103 | 62.0 | % | ||||||
|
|
|
|
|
|
|
|||||||
| Preferred Stock Dividends |
— | — | — | |||||||||
|
|
|
|
|
|
|
|||||||
| Earnings Available to Common Shareholders - Basic |
$ | 105,450 | $ | 65,103 | 62.0 | % | ||||||
|
|
|
|
|
|
|
|||||||
| Earnings Allocated to Unvested Restricted Stock |
(1,685 | ) | (1,209 | ) | 39.4 | % | ||||||
|
|
|
|
|
|
|
|||||||
| Earnings Available to Common Shareholders - Diluted |
103,765 | 63,894 | 62.4 | % | ||||||||
|
|
|
|
|
|
|
|||||||
| Earnings Per Share, diluted |
$ | 3.30 | $ | 2.20 | 50.2 | % | ||||||
|
|
|
|
|
|
|
|||||||
Table 5 - IBERIABANK CORPORATION
CONDENSED CONSOLIDATED FINANCIAL INFORMATION
(dollars in thousands)
| LOANS |
December 31, | September 30, | ||||||||||||||||||
| 2014 | 2013 | % Change | 2014 | % Change | ||||||||||||||||
| Residential Mortgage Loans |
$ | 1,080,297 | $ | 586,532 | 84.2 | % | $ | 1,062,779 | 1.6 | % | ||||||||||
| Commercial Loans: |
||||||||||||||||||||
| Real Estate |
4,405,133 | 3,867,305 | 13.9 | % | 4,281,704 | 2.9 | % | |||||||||||||
| Business |
3,408,949 | 2,996,113 | 13.8 | % | 3,225,691 | 5.7 | % | |||||||||||||
|
|
|
|
|
|
|
|
|
|
|
|||||||||||
| Total Commercial Loans |
7,814,082 | 6,863,418 | 13.9 | % | 7,507,395 | 4.1 | % | |||||||||||||
| Consumer Loans: |
||||||||||||||||||||
| Indirect Automobile |
397,158 | 375,236 | 5.8 | % | 394,691 | 0.6 | % | |||||||||||||
| Home Equity |
1,601,105 | 1,291,792 | 23.9 | % | 1,567,415 | 2.1 | % | |||||||||||||
| Automobile |
149,901 | 92,784 | 61.6 | % | 140,287 | 6.9 | % | |||||||||||||
| Credit Card Loans |
73,393 | 64,321 | 14.1 | % | 69,352 | 5.8 | % | |||||||||||||
| Other |
325,108 | 217,936 | 49.2 | % | 338,969 | (4.1 | %) | |||||||||||||
|
|
|
|
|
|
|
|
|
|
|
|||||||||||
| Total Consumer Loans |
2,546,665 | 2,042,069 | 24.7 | % | 2,510,713 | 1.4 | % | |||||||||||||
|
|
|
|
|
|
|
|
|
|
|
|||||||||||
| Total Loans |
11,441,044 | 9,492,019 | 20.5 | % | 11,080,887 | 3.3 | % | |||||||||||||
|
|
|
|
|
|||||||||||||||||
| Allowance for Loan Losses |
(130,131 | ) | (143,074 | ) | (134,540 | ) | ||||||||||||||
|
|
|
|
|
|
|
|||||||||||||||
| Loans, Net |
$ | 11,310,913 | $ | 9,348,945 | $ | 10,946,347 | ||||||||||||||
|
|
|
|
|
|
|
|||||||||||||||
| Reserve for Unfunded Commitments |
(11,801 | ) | (11,147 | ) | 5.9 | % | (12,099 | ) | (2.5 | %) | ||||||||||
| Allowance for Credit Losses |
(141,932 | ) | (154,221 | ) | (8.0 | %) | (146,639 | ) | (3.2 | %) | ||||||||||
|
ASSET QUALITY DATA (1) |
December 31, | September 30, | ||||||||||||||||||
| 2014 | 2013 | % Change | 2014 | % Change | ||||||||||||||||
| Non-accrual Loans |
$ | 169,686 | $ | 270,428 | (37.3 | %) | $ | 195,680 | (13.3 | %) | ||||||||||
| Foreclosed Assets |
905 | 1,421 | (36.3 | %) | 1,035 | (12.5 | %) | |||||||||||||
| Other Real Estate Owned |
53,042 | 97,752 | (45.7 | %) | 62,351 | (14.9 | %) | |||||||||||||
| Accruing Loans More Than 90 Days Past Due |
1,708 | 2,194 | (22.2 | %) | 190 | N/M | ||||||||||||||
|
|
|
|
|
|
|
|
|
|
|
|||||||||||
| Total Non-performing Assets |
$ | 225,341 | $ | 371,795 | (39.4 | %) | $ | 259,256 | (13.1 | %) | ||||||||||
|
|
|
|
|
|
|
|
|
|
|
|||||||||||
| Loans 30-89 Days Past Due |
$ | 51,141 | $ | 40,918 | 25.0 | % | $ | 23,784 | 115.0 | % | ||||||||||
| Non-performing Assets to Total Assets |
1.43 | % | 2.78 | % | (48.6 | %) | 1.67 | % | (14.3 | %) | ||||||||||
| Non-performing Assets to Total Loans and OREO |
1.96 | % | 3.88 | % | (49.4 | %) | 2.32 | % | (15.7 | %) | ||||||||||
| Allowance for Loan Losses to Non-performing Loans (2) |
75.9 | % | 52.5 | % | 44.7 | % | 68.8 | % | 10.4 | % | ||||||||||
| Allowance for Loan Losses to Non-performing Assets |
57.7 | % | 38.5 | % | 50.1 | % | 51.9 | % | 11.2 | % | ||||||||||
| Allowance for Loan Losses to Total Loans |
1.14 | % | 1.51 | % | (24.5 | %) | 1.21 | % | (6.3 | %) | ||||||||||
| Allowance for Credit Losses to Non-performing Loans (2) |
82.8 | % | 56.6 | % | 46.4 | % | 74.9 | % | 10.6 | % | ||||||||||
| Allowance for Credit Losses to Non-performing Assets |
63.0 | % | 41.5 | % | 51.8 | % | 56.6 | % | 11.4 | % | ||||||||||
| Allowance for Credit Losses to Total Loans |
1.24 | % | 1.62 | % | (23.6 | %) | 1.32 | % | (6.3 | %) | ||||||||||
| Year to Date Charge-offs |
$ | 11,983 | $ | 10,845 | 10.5 | % | $ | 8,571 | N/M | |||||||||||
| Year to Date Recoveries |
(6,396 | ) | (6,887 | ) | (7.1 | %) | (4,739 | ) | N/M | |||||||||||
|
|
|
|
|
|
|
|
|
|
|
|||||||||||
| Year to Date Net Charge-offs |
$ | 5,587 | $ | 3,958 | 41.1 | % | $ | 3,832 | N/M | |||||||||||
|
|
|
|
|
|
|
|
|
|
|
|||||||||||
| Quarter to Date Net Charge-offs |
$ | 1,755 | $ | 1,373 | 27.8 | % | $ | 2,207 | (20.5 | %) | ||||||||||
|
|
|
|
|
|
|
|
|
|
|
|||||||||||
| Quarter to Date Net Charge-offs to Average Loans (Annualized) |
0.06 | % | 0.06 | % | 3.9 | % | 0.08 | % | (22.4 | %) | ||||||||||
| Year to Date Net Charge-offs to Average Loans |
0.05 | % | 0.04 | % | 19.5 | % | 0.05 | % | 1.9 | % | ||||||||||
| (1) | For purposes of this table, non-performing assets include all loans meeting non-performing asset criteria, including assets acquired in FDIC-assisted transactions. |
| (2) | Non-performing loans consist of non-accruing loans and accruing loans 90 days or more past due. |
N/M - Comparison of the information presented is not meaningful given the periods presented.
Table 6 - IBERIABANK CORPORATION
CONDENSED CONSOLIDATED FINANCIAL INFORMATION
(dollars in thousands)
| LOANS (Excluding Covered Assets and Acquired Assets) (1) |
December 31, | September 30, | ||||||||||||||||||
| 2014 | 2013 | % Change | 2014 | % Change | ||||||||||||||||
| Residential Mortgage Loans |
$ | 527,694 | $ | 414,372 | 27.3 | % | $ | 497,075 | 6.2 | % | ||||||||||
| Commercial Loans: |
||||||||||||||||||||
| Real Estate |
3,718,058 | 3,134,904 | 18.6 | % | 3,527,612 | 5.4 | % | |||||||||||||
| Business |
3,284,140 | 2,906,051 | 13.0 | % | 3,093,873 | 6.1 | % | |||||||||||||
|
|
|
|
|
|
|
|
|
|
|
|||||||||||
| Total Commercial Loans |
7,002,198 | 6,040,955 | 15.9 | % | 6,621,485 | 5.7 | % | |||||||||||||
| Consumer Loans: |
||||||||||||||||||||
| Indirect Automobile |
396,766 | 373,383 | 6.3 | % | 394,078 | 0.7 | % | |||||||||||||
| Home Equity |
1,290,976 | 1,101,227 | 17.2 | % | 1,229,998 | 5.0 | % | |||||||||||||
| Automobile |
134,014 | 92,171 | 45.4 | % | 123,446 | 8.6 | % | |||||||||||||
| Credit Card Loans |
72,745 | 63,642 | 14.3 | % | 68,731 | 5.8 | % | |||||||||||||
| Other |
244,321 | 202,571 | 20.6 | % | 245,129 | (0.3 | %) | |||||||||||||
|
|
|
|
|
|
|
|
|
|
|
|||||||||||
| Total Consumer Loans |
2,138,822 | 1,832,994 | 16.7 | % | 2,061,382 | 3.8 | % | |||||||||||||
|
|
|
|
|
|
|
|
|
|
|
|||||||||||
| Total Loans |
9,668,714 | 8,288,321 | 16.7 | % | 9,179,942 | 5.3 | % | |||||||||||||
|
|
|
|
|
|||||||||||||||||
| Allowance for Loan Losses |
(76,174 | ) | (67,343 | ) | (72,537 | ) | ||||||||||||||
|
|
|
|
|
|
|
|||||||||||||||
| Loans, Net |
$ | 9,592,540 | $ | 8,220,978 | $ | 9,107,405 | ||||||||||||||
|
|
|
|
|
|
|
|||||||||||||||
| Reserve for Unfunded Commitments |
(11,801 | ) | (11,147 | ) | 5.9 | % | (12,099 | ) | (2.5 | %) | ||||||||||
| Allowance for Credit Losses |
(87,975 | ) | (78,490 | ) | 12.1 | % | (84,636 | ) | 3.9 | % | ||||||||||
| ASSET QUALITY DATA (Excluding Covered Assets and Acquired Assets)(1) |
December 31, | September 30, | ||||||||||||||||||
| 2014 | 2013 | % Change | 2014 | % Change | ||||||||||||||||
| Non-accrual Loans |
$ | 34,970 | $ | 43,687 | (20.0 | %) | $ | 38,060 | (8.1 | %) | ||||||||||
| Foreclosed Assets |
36 | 48 | (25.1 | %) | 19 | 89.6 | % | |||||||||||||
| Other Real Estate Owned |
21,207 | 28,224 | (24.9 | %) | 23,459 | (9.6 | %) | |||||||||||||
| Accruing Loans More Than 90 Days Past Due |
754 | 1,075 | (29.9 | %) | 4 | N/M | ||||||||||||||
|
|
|
|
|
|
|
|
|
|
|
|||||||||||
| Total Non-performing Assets |
$ | 56,967 | $ | 73,034 | (22.0 | %) | $ | 61,542 | (7.4 | %) | ||||||||||
|
|
|
|
|
|
|
|
|
|
|
|||||||||||
| Loans 30-89 Days Past Due |
$ | 29,567 | $ | 21,391 | 38.2 | % | $ | 12,441 | 137.7 | % | ||||||||||
| Troubled Debt Restructurings (2) |
3,639 | 19,877 | (81.7 | %) | 3,421 | 6.3 | % | |||||||||||||
| Current Troubled Debt Restructurings (3) |
1,430 | 1,376 | 3.9 | % | 1,093 | 30.8 | % | |||||||||||||
| Non-performing Assets to Total Assets |
0.41 | % | 0.61 | % | (32.9 | %) | 0.46 | % | (10.1 | %) | ||||||||||
| Non-performing Assets to Total Loans and OREO |
0.59 | % | 0.88 | % | (33.1 | %) | 0.67 | % | (12.1 | %) | ||||||||||
| Allowance for Loan Losses to Non-performing Loans (4) |
213.2 | % | 150.4 | % | 41.7 | % | 190.6 | % | 11.9 | % | ||||||||||
| Allowance for Loan Losses to Non-performing Assets |
133.7 | % | 92.2 | % | 45.0 | % | 117.9 | % | 13.4 | % | ||||||||||
| Allowance for Loan Losses to Total Loans |
0.79 | % | 0.81 | % | (3.0 | %) | 0.79 | % | (0.3 | %) | ||||||||||
| Allowance for Credit Losses to Non-performing Loans (1) (4) |
246.3 | % | 175.3 | % | 40.4 | % | 222.3 | % | 10.8 | % | ||||||||||
| Allowance for Credit Losses to Non-performing Assets (1) |
154.4 | % | 107.5 | % | 43.7 | % | 137.5 | % | 12.3 | % | ||||||||||
| Allowance for Credit Losses to Total Loans (1) |
0.91 | % | 0.95 | % | (3.9 | %) | 0.92 | % | (1.3 | %) | ||||||||||
| Year to Date Charge-offs |
$ | 11,312 | $ | 10,687 | 5.8 | % | $ | 8,242 | N/M | |||||||||||
| Year to Date Recoveries |
(5,870 | ) | (6,819 | ) | (13.9 | %) | (4,338 | ) | N/M | |||||||||||
|
|
|
|
|
|
|
|
|
|
|
|||||||||||
| Year to Date Net Charge-offs (Recoveries) |
$ | 5,442 | $ | 3,868 | 40.7 | % | $ | 3,904 | N/M | |||||||||||
|
|
|
|
|
|
|
|
|
|
|
|||||||||||
| Quarter to Date Net Charge-offs (Recoveries) |
$ | 1,538 | $ | 1,366 | 12.6 | % | $ | 2,131 | (27.9 | %) | ||||||||||
|
|
|
|
|
|
|
|
|
|
|
|||||||||||
| Quarter to Date Net Charge-offs to Average Loans (Annualized) |
0.06 | % | 0.07 | % | (6.7 | %) | 0.09 | % | (31.1 | %) | ||||||||||
| Year to Date Net Charge-offs to Average Loans |
0.06 | % | 0.05 | % | 19.2 | % | 0.06 | % | (2.0 | %) | ||||||||||
| (1) | For purposes of this table, loans and non-performing assets exclude all assets acquired. |
| (2) | Troubled debt restructurings meeting past due and non-accruing criteria are included in loans past due and non-accrual loans above. |
| (3) | Current troubled debt restructurings are defined as troubled debt restructurings not past due or on non-accrual status for the respective periods. |
| (4) | Non-performing loans consist of nonaccruing loans and accruing loans 90 days or more past due. |
N/M - Comparison of the information presented is not meaningful given the periods presented.
Table 6A - IBERIABANK CORPORATION
CONDENSED CONSOLIDATED FINANCIAL INFORMATION
(dollars in thousands)
| LOANS (Covered Assets and Acquired Assets Only) (1) |
December 31, | September 30, | ||||||||||||||||||
| 2014 | 2013 | % Change | 2014 | % Change | ||||||||||||||||
| Residential Mortgage Loans |
$ | 552,603 | $ | 172,160 | 221.0 | % | $ | 565,704 | (2.3 | %) | ||||||||||
| Commercial Loans: |
||||||||||||||||||||
| Real Estate |
687,075 | 732,401 | (6.2 | %) | 754,092 | (8.9 | %) | |||||||||||||
| Business |
124,809 | 90,062 | 38.6 | % | 131,818 | (5.3 | %) | |||||||||||||
|
|
|
|
|
|
|
|
|
|
|
|||||||||||
| Total Commercial Loans |
811,884 | 822,463 | (1.3 | %) | 885,910 | (8.4 | %) | |||||||||||||
| Consumer Loans: |
||||||||||||||||||||
| Indirect Automobile |
392 | 1,853 | (78.8 | %) | 613 | (36.0 | %) | |||||||||||||
| Home Equity |
310,129 | 190,565 | 62.7 | % | 337,417 | (8.1 | %) | |||||||||||||
| Automobile |
15,887 | 613 | 2491.5 | % | 16,841 | (5.7 | %) | |||||||||||||
| Credit Card Loans |
648 | 679 | (4.5 | %) | 621 | 4.4 | % | |||||||||||||
| Other |
80,787 | 15,365 | 425.8 | % | 93,840 | (13.9 | %) | |||||||||||||
|
|
|
|
|
|
|
|
|
|
|
|||||||||||
| Total Consumer Loans |
407,843 | 209,075 | 95.1 | % | 449,331 | (9.2 | %) | |||||||||||||
|
|
|
|
|
|
|
|
|
|
|
|||||||||||
| Total Loans Receivable |
1,772,330 | 1,203,698 | 47.2 | % | 1,900,945 | (6.8 | %) | |||||||||||||
|
|
|
|
|
|||||||||||||||||
| Allowance for Loan Losses |
(53,957 | ) | (75,731 | ) | (62,003 | ) | ||||||||||||||
|
|
|
|
|
|
|
|||||||||||||||
| Loans, Net |
$ | 1,718,373 | $ | 1,127,967 | $ | 1,838,941 | ||||||||||||||
|
|
|
|
|
|
|
|||||||||||||||
| ASSET QUALITY DATA (Covered Assets and Acquired Assets Only) (1) |
December 31, | September 30, | ||||||||||||||||||
| 2014 | 2013 | % Change | 2014 | % Change | ||||||||||||||||
| Non-accrual Loans |
$ | 134,716 | $ | 226,741 | (40.6 | %) | $ | 157,620 | (14.5 | %) | ||||||||||
| Foreclosed Assets |
869 | 1,372 | (36.7 | %) | 1,016 | (14.5 | %) | |||||||||||||
| Other Real Estate Owned |
31,835 | 69,528 | (54.2 | %) | 38,892 | (18.1 | %) | |||||||||||||
| Accruing Loans More Than 90 Days Past Due |
954 | 1,119 | (14.8 | %) | 186 | 413.1 | % | |||||||||||||
|
|
|
|
|
|
|
|
|
|
|
|||||||||||
| Total Non-performing Assets |
$ | 168,374 | $ | 298,760 | (43.6 | %) | $ | 197,714 | (14.8 | %) | ||||||||||
|
|
|
|
|
|
|
|
|
|
|
|||||||||||
| Loans 30-89 Days Past Due |
$ | 21,574 | $ | 19,527 | 10.5 | % | $ | 11,343 | 90.2 | % | ||||||||||
| Non-performing Assets to Total Assets |
9.11 | % | 21.27 | % | (57.2 | %) | 9.84 | % | (7.4 | %) | ||||||||||
| Non-performing Assets to Total Loans and OREO |
9.33 | % | 23.44 | % | (60.2 | %) | 10.19 | % | (8.4 | %) | ||||||||||
| Allowance for Loan Losses to Non-performing Loans (2) |
39.8 | % | 33.2 | % | 19.7 | % | 39.3 | % | 1.2 | % | ||||||||||
| Allowance for Loan Losses to Non-performing Assets |
32.0 | % | 25.3 | % | 26.4 | % | 31.4 | % | 2.2 | % | ||||||||||
| Allowance for Loan Losses to Total Loans |
3.04 | % | 6.29 | % | (51.6 | %) | 3.26 | % | (6.7 | %) | ||||||||||
| Year to Date Charge-offs |
$ | 671 | $ | 158 | N/M | $ | 329 | N/M | ||||||||||||
| Year to Date Recoveries |
(526 | ) | (68 | ) | N/M | (401 | ) | N/M | ||||||||||||
|
|
|
|
|
|
|
|
|
|||||||||||||
| Year to Date Net Charge-offs (Recoveries) |
145 | 90 | 60.6 | % | (72 | ) | N/M | |||||||||||||
|
|
|
|
|
|
|
|
|
|
|
|||||||||||
| Quarter to Date Net Charge-offs (Recoveries) |
217 | 7 | N/M | 76 | N/M | |||||||||||||||
|
|
|
|
|
|
|
|||||||||||||||
| Quarter to Date Net Charge-offs to Average Loans (Annualized) |
0.05 | % | 0.00 | % | N/M | 0.02 | % | N/M | ||||||||||||
| Year to Date Net Charge-offs to Average Loans |
0.01 | % | 0.01 | % | (39.4 | %) | -0.01 | % | N/M | |||||||||||
| (1) | For purposes of this table, acquired loans and non-performing assets are presented only. Non-performing assets include all loans meeting nonperforming asset criteria. |
| (2) | Non-performing loans consist of non-accruing loans and accruing loans 90 days or more past due. |
N/M - Comparison of the information presented is not meaningful given the periods presented
19
Table 7 - Non-Covered and Net Covered Loan Portfolio Volumes And Yields ($ in Millions)
As Reported (US GAAP)
| 4Q 2013 | 1Q 2014 | 2Q 2014 | 3Q 2014 | 4Q 2014 | ||||||||||||||||||||||||||||||||||||||||||||||||||||||||
| Income | Average Balance |
Yield | Income | Average Balance |
Yield | Income | Average Balance |
Yield | Income | Average Balance |
Yield | Income | Average Balance |
Yield | ||||||||||||||||||||||||||||||||||||||||||||||
| Legacy Loans, net |
$ | 82.3 | $ | 7,923 | 4.09 | % | $ | 84.2 | $ | 8,325 | 4.06 | % | $ | 87.9 | $ | 8,644 | 4.04 | % | $ | 91.1 | $ | 9,019 | 3.97 | % | $ | 94.5 | $ | 9,439 | 3.94 | % | ||||||||||||||||||||||||||||||
| Acquired Loans, net |
11.1 | 498 | 8.71 | % | 11.0 | 535 | 8.23 | % | 12.6 | 730 | 6.86 | % | 24.1 | 1,432 | 6.63 | % | 24.1 | 1,370 | 6.94 | % | ||||||||||||||||||||||||||||||||||||||||
| Covered Loans, net |
37.2 | 751 | 19.46 | % | 25.9 | 691 | 15.00 | % | 23.0 | 625 | 14.70 | % | 30.2 | 559 | 21.64 | % | 18.1 | 463 | 15.29 | % | ||||||||||||||||||||||||||||||||||||||||
|
|
|
|
|
|
|
|
|
|
|
|
|
|
|
|
|
|
|
|
|
|
|
|
|
|
|
|
|
|
|
|||||||||||||||||||||||||||||||
| FDIC Indemnification Asset |
(29.1 | ) | 189 | -60.36 | % | (19.3 | ) | 155 | -49.83 | % | (17.0 | ) | 131 | -51.22 | % | (25.1 | ) | 111 | -88.25 | % | (13.2 | ) | 86 | -60.36 | % | |||||||||||||||||||||||||||||||||||
|
|
|
|
|
|
|
|
|
|
|
|
|
|
|
|
|
|
|
|
|
|
|
|
|
|
|
|
|
|
|
|||||||||||||||||||||||||||||||
| Covered Loans, net of Indemnification Asset Amortization |
$ | 8.0 | $ | 940 | 3.43 | % | $ | 6.7 | $ | 846 | 3.18 | % | $ | 6.0 | $ | 756 | 3.16 | % | $ | 5.1 | $ | 670 | 3.07 | % | $ | 4.9 | $ | 549 | 3.57 | % | ||||||||||||||||||||||||||||||
|
|
|
|
|
|
|
|
|
|
|
|
|
|
|
|
|
|
|
|
|
|
|
|
|
|
|
|
|
|
|
|||||||||||||||||||||||||||||||
| Adjustments |
|
|||||||||||||||||||||||||||||||||||||||||||||||||||||||||||
| 4Q 2013 | 1Q 2014 | 2Q 2014 | 3Q 2014 | 4Q 2014 | ||||||||||||||||||||||||||||||||||||||||||||||||||||||||
| Income | Average Balance |
Yield | Income | Average Balance |
Yield | Income | Average Balance |
Yield | Income | Average Balance |
Yield | Income | Average Balance |
Yield | ||||||||||||||||||||||||||||||||||||||||||||||
| Legacy Loans, net |
$ | — | $ | — | 0.00 | % | $ | — | $ | — | 0.00 | % | $ | — | $ | — | 0.00 | % | $ | — | $ | — | 0.00 | % | $ | — | $ | — | 0.00 | % | ||||||||||||||||||||||||||||||
| Acquired Loans, net |
(3.7 | ) | 70 | -3.59 | % | (4.2 | ) | 65 | -3.79 | % | (2.9 | ) | 67 | -2.03 | % | (6.4 | ) | 72 | -1.97 | % | (6.5 | ) | 67 | -2.06 | % | |||||||||||||||||||||||||||||||||||
|
|
|
|
|
|
|
|
|
|
|
|
|
|
|
|
|
|
|
|
|
|
|
|
|
|
|
|
|
|
|
|||||||||||||||||||||||||||||||
| Covered Loans, net |
(27.5 | ) | 123 | -15.20 | % | (17.5 | ) | 106 | -10.82 | % | (13.7 | ) | 95 | -9.58 | % | (22.8 | ) | 84 | -17.07 | % | (12.8 | ) | 74 | -10.72 | % | |||||||||||||||||||||||||||||||||||
|
|
|
|
|
|
|
|
|
|
|
|
|
|
|
|
|
|
|
|
|
|
|
|
|
|
|
|
|
|
|
|||||||||||||||||||||||||||||||
| FDIC Indemnification Asset |
29.1 | (189 | ) | 60.36 | % | 19.3 | (155 | ) | 49.83 | % | 17.0 | (131 | ) | 51.22 | % | 25.1 | (111 | ) | 88.25 | % | 13.2 | (86 | ) | 60.36 | % | |||||||||||||||||||||||||||||||||||
|
|
|
|
|
|
|
|
|
|
|
|
|
|
|
|
|
|
|
|
|
|
|
|
|
|
|
|
|
|
|
|||||||||||||||||||||||||||||||
| Covered Loans, net of Indemnification Asset Amortization |
$ | 1.6 | $ | (66 | ) | 0.83 | % | $ | 1.7 | $ | (48 | ) | 1.01 | % | $ | 3.3 | $ | (37 | ) | 1.96 | % | $ | 2.3 | $ | (27 | ) | 1.50 | % | $ | 0.4 | $ | (12 | ) | 1.00 | % | |||||||||||||||||||||||||
|
|
|
|
|
|
|
|
|
|
|
|
|
|
|
|
|
|
|
|
|
|
|
|
|
|
|
|
|
|
|
|||||||||||||||||||||||||||||||
| As Adjusted (Cash Yield, Non-GAAP) | ||||||||||||||||||||||||||||||||||||||||||||||||||||||||||||
| 4Q 2013 | 1Q 2014 | 2Q 2014 | 3Q 2014 | 4Q 2014 | ||||||||||||||||||||||||||||||||||||||||||||||||||||||||
| Income | Average Balance |
Yield | Income | Average Balance |
Yield | Income | Average Balance |
Yield | Income | Average Balance |
Yield | Income | Average Balance |
Yield | ||||||||||||||||||||||||||||||||||||||||||||||
| Legacy Loans, net |
$ | 82.3 | $ | 7,923 | 4.09 | % | $ | 84.2 | $ | 8,325 | 4.06 | % | $ | 87.9 | $ | 8,644 | 4.04 | % | $ | 91.1 | $ | 9,019 | 3.97 | % | $ | 94.5 | $ | 9,439 | 3.94 | % | ||||||||||||||||||||||||||||||
| Acquired Loans, net |
7.4 | 568 | 5.12 | % | 6.7 | 600 | 4.45 | % | 9.7 | 797 | 4.83 | % | 17.6 | 1,504 | 4.66 | % | 17.6 | 1,436 | 4.88 | % | ||||||||||||||||||||||||||||||||||||||||
|
|
|
|
|
|
|
|
|
|
|
|
|
|
|
|
|
|
|
|
|
|
|
|
|
|
|
|
|
|
|
|||||||||||||||||||||||||||||||
| Covered Loans, net |
9.7 | 874 | 4.26 | % | 8.4 | 798 | 4.18 | % | 9.3 | 719 | 5.13 | % | 7.4 | 642 | 4.57 | % | 5.3 | 537 | 4.57 | % | ||||||||||||||||||||||||||||||||||||||||
|
|
|
|
|
|
|
|
|
|
|
|
|
|
|
|
|
|
|
|
|
|
|
|
|
|
|
|
|
|
|
|||||||||||||||||||||||||||||||
| FDIC Indemnification Asset |
— | — | 0.00 | % | 0.0 | — | 0.00 | % | 0.0 | — | 0.00 | % | — | (0 | ) | 0.00 | % | — | — | 0.00 | % | |||||||||||||||||||||||||||||||||||||||
|
|
|
|
|
|
|
|
|
|
|
|
|
|
|
|
|
|
|
|
|
|
|
|
|
|
|
|
|
|
|
|||||||||||||||||||||||||||||||
| Covered Loans, net of Indemnification Asset Amortization |
$ | 9.7 | $ | 874 | 4.26 | % | $ | 8.4 | $ | 798 | 4.18 | % | $ | 9.3 | $ | 719 | 5.13 | % | $ | 7.4 | $ | 642 | 4.57 | % | $ | 5.3 | $ | 537 | 4.57 | % | ||||||||||||||||||||||||||||||
|
|
|
|
|
|
|
|
|
|
|
|
|
|
|
|
|
|
|
|
|
|
|
|
|
|
|
|
|
|
|
|||||||||||||||||||||||||||||||
Table 8 - IBERIABANK CORPORATION
CONDENSED CONSOLIDATED FINANCIAL INFORMATION
Taxable Equivalent Basis
(dollars in thousands)
| For The Quarter Ended | ||||||||||||||||||||||||||||
| December 31, 2014 | September 30, 2014 | December 31, 2013 | ||||||||||||||||||||||||||
| Interest | Average Balance |
Average Yield/Rate (%) |
Average Balance |
Average Yield/Rate (%) |
Average Balance |
Average Yield/Rate (%) |
||||||||||||||||||||||
| ASSETS |
||||||||||||||||||||||||||||
| Earning Assets: |
||||||||||||||||||||||||||||
| Loans Receivable: |
||||||||||||||||||||||||||||
| Mortgage Loans |
$ | 13,094 | $ | 1,069,555 | 4.90 | % | $ | 1,104,692 | 4.82 | % | $ | 570,480 | 6.12 | % | ||||||||||||||
| Commercial Loans (TE) (1) |
89,574 | 7,656,992 | 4.65 | % | 7,467,598 | 5.24 | % | 6,570,033 | 5.57 | % | ||||||||||||||||||
| Consumer and Other Loans |
33,994 | 2,545,205 | 5.30 | % | 2,437,544 | 5.47 | % | 2,031,977 | 5.82 | % | ||||||||||||||||||
|
|
|
|
|
|
|
|
|
|
|
|
|
|
|
|||||||||||||||
| Total Loans |
136,662 | 11,271,752 | 4.82 | % | 11,009,834 | 5.25 | % | 9,172,490 | 5.66 | % | ||||||||||||||||||
| Loss Share Receivable |
(13,224 | ) | 85,733 | -60.36 | % | 111,383 | -88.25 | % | 188,932 | -60.36 | % | |||||||||||||||||
|
|
|
|
|
|
|
|
|
|
|
|
|
|
|
|||||||||||||||
| Total Loans and Loss Share Receivable |
123,438 | 11,357,485 | 4.32 | % | 11,121,217 | 4.31 | % | 9,361,422 | 4.33 | % | ||||||||||||||||||
| Mortgage Loans Held for Sale |
1,200 | 121,438 | 3.95 | % | 163,510 | 3.90 | % | 112,499 | 4.06 | % | ||||||||||||||||||
| Investment Securities (TE) (1)(2) |
11,766 | 2,234,236 | 2.24 | % | 2,137,736 | 2.20 | % | 2,129,679 | 2.21 | % | ||||||||||||||||||
| Other Earning Assets |
872 | 431,603 | 0.80 | % | 567,895 | 0.60 | % | 250,295 | 0.94 | % | ||||||||||||||||||
|
|
|
|
|
|
|
|
|
|
|
|
|
|
|
|||||||||||||||
| Total Earning Assets |
137,276 | 14,144,762 | 3.88 | % | 13,990,358 | 3.83 | % | 11,853,895 | 3.87 | % | ||||||||||||||||||
| Allowance for Loan Losses |
(134,177 | ) | (133,443 | ) | (148,030 | ) | ||||||||||||||||||||||
| Non-earning Assets |
1,604,439 | 1,619,995 | 1,409,306 | |||||||||||||||||||||||||
|
|
|
|
|
|
|
|||||||||||||||||||||||
| Total Assets |
$ | 15,615,024 | $ | 15,476,910 | $ | 13,115,171 | ||||||||||||||||||||||
|
|
|
|
|
|
|
|||||||||||||||||||||||
| LIABILITIES AND SHAREHOLDERS’ EQUITY |
||||||||||||||||||||||||||||
| Interest-bearing liabilities |
||||||||||||||||||||||||||||
| Deposits: |
||||||||||||||||||||||||||||
| NOW Accounts |
$ | 1,526 | $ | 2,271,836 | 0.27 | % | $ | 2,228,378 | 0.28 | % | $ | 2,145,036 | 0.32 | % | ||||||||||||||
| Savings and Money Market Accounts |
3,695 | 4,908,247 | 0.30 | % | 4,877,051 | 0.29 | % | 4,329,985 | 0.26 | % | ||||||||||||||||||
| Certificates of Deposit |
4,272 | 2,105,623 | 0.80 | % | 2,060,055 | 0.77 | % | 1,787,643 | 0.79 | % | ||||||||||||||||||
|
|
|
|
|
|
|
|
|
|
|
|
|
|
|
|||||||||||||||
| Total Interest-bearing Deposits |
9,493 | 9,285,706 | 0.41 | % | 9,165,484 | 0.39 | % | 8,262,664 | 0.39 | % | ||||||||||||||||||
| Short-term Borrowings |
342 | 713,384 | 0.19 | % | 919,869 | 0.17 | % | 335,691 | 0.15 | % | ||||||||||||||||||
| Long-term Debt |
2,761 | 395,410 | 2.73 | % | 358,970 | 2.75 | % | 280,925 | 3.37 | % | ||||||||||||||||||
|
|
|
|
|
|
|
|
|
|
|
|
|
|
|
|||||||||||||||
| Total Interest-bearing Liabilities |
12,596 | 10,394,500 | 0.48 | % | 10,444,323 | 0.46 | % | 8,879,280 | 0.47 | % | ||||||||||||||||||
| Non-interest-bearing Demand Deposits |
3,228,773 | 3,057,513 | 2,572,599 | |||||||||||||||||||||||||
| Non-interest-bearing Liabilities |
159,818 | 168,261 | 128,249 | |||||||||||||||||||||||||
|
|
|
|
|
|
|
|||||||||||||||||||||||
| Total Liabilities |
13,783,091 | 13,670,097 | 11,580,128 | |||||||||||||||||||||||||
| Shareholders’ Equity |
1,831,933 | 1,806,813 | 1,535,043 | |||||||||||||||||||||||||
|
|
|
|
|
|
|
|||||||||||||||||||||||
| Total Liabilities and Shareholders’ Equity |
$ | 15,615,024 | $ | 15,476,910 | $ | 13,115,171 | ||||||||||||||||||||||
|
|
|
|
|
|
|
|||||||||||||||||||||||
| Net Interest Spread |
$ | 124,680 | 3.41 | % | $ | 121,751 | 3.38 | % | $ | 103,438 | 3.40 | % | ||||||||||||||||
| Tax-equivalent Benefit |
2,055 | 0.06 | % | 2,134 | 0.06 | % | 2,271 | 0.08 | % | |||||||||||||||||||
| Net Interest Income (TE) / Net Interest Margin (TE) (1) |
$ | 126,735 | 3.53 | % | $ | 123,885 | 3.49 | % | $ | 105,709 | 3.52 | % | ||||||||||||||||
| (1) | Fully taxable equivalent (TE) calculations include the tax benefit associated with related income sources that are tax-exempt using a marginal tax rate of 35%. |
| (2) | Balances exclude unrealized gain or loss on securities available for sale and impact of trade date accounting. |
Table 9 - IBERIABANK CORPORATION
CONDENSED CONSOLIDATED FINANCIAL INFORMATION
Taxable Equivalent Basis
(dollars in thousands)
| For The Year Ended | ||||||||||||||||||||||||
| December 31, 2014 | December 31, 2013 | |||||||||||||||||||||||
| Average | Average | Average | Average | |||||||||||||||||||||
| Interest | Balance | Yield/Rate (%) | Interest | Balance | Yield/Rate (%) | |||||||||||||||||||
| ASSETS |
||||||||||||||||||||||||
| Earning Assets: |
||||||||||||||||||||||||
| Loans Receivable: |
||||||||||||||||||||||||
| Mortgage Loans |
$ | 44,563 | $ | 869,510 | 5.13 | % | $ | 30,598 | $ | 520,872 | 5.87 | % | ||||||||||||
| Commercial Loans (TE) (1) |
359,801 | 7,284,247 | 4.95 | % | 350,451 | 6,386,364 | 5.50 | % | ||||||||||||||||
| Consumer and Other Loans |
122,342 | 2,310,339 | 5.30 | % | 107,887 | 1,954,766 | 5.52 | % | ||||||||||||||||
|
|
|
|
|
|
|
|
|
|
|
|
|
|||||||||||||
| Total Loans |
526,706 | 10,464,096 | 5.04 | % | 488,936 | 8,862,002 | 5.53 | % | ||||||||||||||||
| Loss Share Receivable |
(74,617 | ) | 120,567 | -61.04 | % | (97,849 | ) | 266,856 | -36.16 | % | ||||||||||||||
|
|
|
|
|
|
|
|
|
|
|
|
|
|||||||||||||
| Total Loans and Loss Share Receivable |
452,089 | 10,584,663 | 4.29 | % | 391,087 | 9,128,858 | 4.31 | % | ||||||||||||||||
| Mortgage Loans Held for Sale |
5,153 | 130,425 | 3.95 | % | 5,108 | 144,961 | 3.52 | % | ||||||||||||||||
| Investment Securities (TE) (1)(2) |
44,677 | 2,148,963 | 2.23 | % | 38,230 | 2,081,523 | 2.01 | % | ||||||||||||||||
| Other Earning Assets |
2,896 | 371,490 | 0.78 | % | 2,772 | 380,050 | 0.73 | % | ||||||||||||||||
|
|
|
|
|
|
|
|
|
|
|
|
|
|||||||||||||
| Total Earning Assets |
504,815 | 13,235,541 | 3.85 | % | 437,197 | 11,735,392 | 3.78 | % | ||||||||||||||||
| Allowance for Loan Losses |
(134,830 | ) | (184,217 | ) | ||||||||||||||||||||
| Non-earning Assets |
1,531,974 | 1,452,813 | ||||||||||||||||||||||
|
|
|
|
|
|||||||||||||||||||||
| Total Assets |
$ | 14,632,685 | $ | 13,003,988 | ||||||||||||||||||||
|
|
|
|
|
|||||||||||||||||||||
| LIABILITIES AND SHAREHOLDERS’ EQUITY |
||||||||||||||||||||||||
| Interest-bearing liabilities |
||||||||||||||||||||||||
| Deposits: |
||||||||||||||||||||||||
| NOW Accounts |
$ | 6,006 | $ | 2,240,137 | 0.27 | % | $ | 7,557 | $ | 2,337,831 | 0.32 | % | ||||||||||||
| Savings and Money Market Accounts |
12,803 | 4,616,026 | 0.28 | % | 11,685 | 4,207,343 | 0.28 | % | ||||||||||||||||
| Certificates of Deposit |
14,281 | 1,889,858 | 0.76 | % | 16,604 | 1,964,702 | 0.85 | % | ||||||||||||||||
|
|
|
|
|
|
|
|
|
|
|
|
|
|||||||||||||
| Total Interest-bearing Deposits |
33,090 | 8,746,021 | 0.38 | % | 35,846 | 8,509,876 | 0.42 | % | ||||||||||||||||
| Short-term Borrowings |
1,364 | 782,033 | 0.17 | % | 490 | 303,352 | 0.16 | % | ||||||||||||||||
| Long-term Debt |
10,250 | 335,211 | 3.02 | % | 10,617 | 316,775 | 3.31 | % | ||||||||||||||||
|
|
|
|
|
|
|
|
|
|
|
|
|
|||||||||||||
| Total Interest-bearing Liabilities |
44,704 | 9,863,265 | 0.45 | % | 46,953 | 9,130,003 | 0.51 | % | ||||||||||||||||
| Non-interest-bearing Demand Deposits |
2,916,509 | 2,216,959 | ||||||||||||||||||||||
| Non-interest-bearing Liabilities |
144,861 | 129,833 | ||||||||||||||||||||||
|
|
|
|
|
|||||||||||||||||||||
| Total Liabilities |
12,924,635 | 11,476,795 | ||||||||||||||||||||||
| Shareholders’ Equity |
1,708,050 | 1,527,193 | ||||||||||||||||||||||
|
|
|
|
|
|||||||||||||||||||||
| Total Liabilities and Shareholders’ Equity |
$ | 14,632,685 | $ | 13,003,988 | ||||||||||||||||||||
|
|
|
|
|
|||||||||||||||||||||
| Net Interest Spread |
$ | 460,111 | 3.40 | % | $ | 390,244 | 3.26 | % | ||||||||||||||||
| Tax-equivalent Benefit |
8,609 | 0.06 | % | 9,452 | 0.08 | % | ||||||||||||||||||
| Net Interest Income (TE) / Net Interest Margin (TE) (1) |
$ | 468,720 | 3.51 | % | $ | 399,696 | 3.38 | % | ||||||||||||||||
| (1) | Fully taxable equivalent (TE) calculations include the tax benefit associated with related income sources that are tax-exempt using a marginal tax rate of 35%. |
| (2) | Balances exclude unrealized gain or loss on securities available for sale and impact of trade date accounting. |
Table 10 - IBERIABANK CORPORATION
RECONCILIATION OF NON-GAAP FINANCIAL MEASURES
(dollars in thousands)
| For The Quarter Ended | ||||||||||||
| December 31, 2014 | September 30, 2014 | December 31, 2013 | ||||||||||
| Net Interest Income (GAAP) |
$ | 124,680 | $ | 121,751 | $ | 103,438 | ||||||
| Effect of Tax Benefit on Interest Income |
2,055 | 2,134 | 2,271 | |||||||||
|
|
|
|
|
|
|
|||||||
| Net Interest Income (TE) (Non-GAAP) (1) |
126,735 | 123,885 | 105,709 | |||||||||
|
|
|
|
|
|
|
|||||||
| Non-interest Income (GAAP) |
47,072 | 47,112 | 38,715 | |||||||||
| Effect of Tax Benefit on Non-interest Income |
566 | 564 | 485 | |||||||||
|
|
|
|
|
|
|
|||||||
| Non-interest Income (TE) (Non-GAAP) (1) |
47,638 | 47,676 | 39,200 | |||||||||
|
|
|
|
|
|
|
|||||||
| Taxable Equivalent Revenues (Non-GAAP) (1) |
174,373 | 171,561 | 144,909 | |||||||||
|
|
|
|
|
|
|
|||||||
| Securities Gains and other non-interest income |
(374 | ) | (582 | ) | (19 | ) | ||||||
|
|
|
|
|
|
|
|||||||
| Taxable Equivalent Operating Revenues (Non-GAAP) (1) |
$ | 173,999 | $ | 170,979 | $ | 144,890 | ||||||
|
|
|
|
|
|
|
|||||||
| Total Non-interest Expense (GAAP) |
$ | 119,382 | $ | 120,360 | $ | 102,674 | ||||||
| Less Intangible Amortization Expense |
(1,618 | ) | (1,623 | ) | (1,177 | ) | ||||||
|
|
|
|
|
|
|
|||||||
| Tangible Non-interest Expense (Non-GAAP) (2) |
117,764 | 118,737 | 101,497 | |||||||||
|
|
|
|
|
|
|
|||||||
| Merger-related expenses |
1,955 | 1,752 | 566 | |||||||||
| Severance expenses |
139 | 1,226 | 216 | |||||||||
| (Gain) Loss on sale of long-lived assets, net of impairment |
1,078 | 4,213 | (225 | ) | ||||||||
| (Reversal of) Provision for FDIC clawback liability |
— | (797 | ) | — | ||||||||
| Other non-operating non-interest expense |
2 | 1 | (311 | ) | ||||||||
|
|
|
|
|
|
|
|||||||
| Tangible Operating Non-interest Expense (Non-GAAP) (2) |
$ | 114,590 | $ | 112,342 | $ | 101,251 | ||||||
|
|
|
|
|
|
|
|||||||
| Return on Average Common Equity (GAAP) |
7.78 | % | 6.78 | % | 6.62 | % | ||||||
| Effect of Intangibles (2) |
3.68 | % | 3.32 | % | 2.81 | % | ||||||
| Effect of Non Operating Revenues and Expenses |
(0.29 | %) | 1.19 | % | 0.05 | % | ||||||
|
|
|
|
|
|
|
|||||||
| Operating Return on Average Tangible Common Equity (Non-GAAP) (2) |
11.17 | % | 11.29 | % | 9.47 | % | ||||||
|
|
|
|
|
|
|
|||||||
| Efficiency Ratio (GAAP) |
69.5 | % | 71.3 | % | 72.2 | % | ||||||
| Effect of Tax Benefit Related to Tax-exempt Income |
(1.0 | %) | (1.1 | %) | (1.3 | %) | ||||||
|
|
|
|
|
|
|
|||||||
| Efficiency Ratio (TE) (Non-GAAP) (1) |
68.5 | % | 70.2 | % | 70.9 | % | ||||||
| Effect of Amortization of Intangibles |
(0.9 | %) | (0.9 | %) | (0.8 | %) | ||||||
| Effect of Non-operating Items |
(1.7 | %) | (3.6 | %) | (0.2 | %) | ||||||
|
|
|
|
|
|
|
|||||||
| Tangible Operating Efficiency Ratio (TE)(Non-GAAP) (1) (2) |
65.9 | % | 65.7 | % | 69.9 | % | ||||||
|
|
|
|
|
|
|
|||||||
| (1) | Fully taxable equivalent (TE) calculations include the tax benefit associated with related income sources that are tax-exempt using a marginal tax rate of 35%. |
| (2) | Tangible calculations eliminate the effect of goodwill and acquisition related intangible assets and the corresponding amortization expense on a tax-effected basis where applicable. |
Table 11 - IBERIABANK CORPORATION
RECONCILIATION OF NON-GAAP FINANCIAL MEASURES (1)
(dollars in thousands)
| For The Quarter Ended | ||||||||||||||||||||||||||||||||||||
| December 31, 2014 | September 30, 2014 | December 31, 2013 | ||||||||||||||||||||||||||||||||||
| Dollar Amount | Dollar Amount | Dollar Amount | ||||||||||||||||||||||||||||||||||
| Pre-tax | After-tax (2) | Per share | Pre-tax | After-tax (2) | Per share | Pre-tax | After-tax (2) | Per share | ||||||||||||||||||||||||||||
| Net Income (Loss) (GAAP) |
$ | 45,875 | $ | 35,936 | $ | 1.07 | $ | 42,789 | $ | 30,892 | $ | 0.92 | $ | 34,779 | $ | 25,604 | $ | 0.86 | ||||||||||||||||||
| Non-interest income adjustments |
||||||||||||||||||||||||||||||||||||
| Gain on sale of investments and other non-interest income |
(374 | ) | (243 | ) | (0.01 | ) | (582 | ) | (378 | ) | (0.01 | ) | (19 | ) | (12 | ) | (0.00 | ) | ||||||||||||||||||
| Non-interest expense adjustments |
||||||||||||||||||||||||||||||||||||
| Merger-related expenses |
1,955 | 1,496 | 0.04 | 1,752 | 1,139 | 0.04 | 566 | 368 | 0.01 | |||||||||||||||||||||||||||
| Severance expenses |
139 | 91 | 0.00 | 1,226 | 797 | 0.02 | 216 | 141 | 0.00 | |||||||||||||||||||||||||||
| (Gain) Loss on sale of long-lived assets, net of impairment |
1,078 | 701 | 0.02 | 4,213 | 2,738 | 0.08 | (225 | ) | (146 | ) | (0.00 | ) | ||||||||||||||||||||||||
| (Reversal of) Provision for FDIC clawback liability |
— | — | — | (797 | ) | (518 | ) | (0.02 | ) | — | — | — | ||||||||||||||||||||||||
| Other non-operating non-interest expense |
2 | 1 | (0.00 | ) | 1 | 1 | (0.00 | ) | (311 | ) | (202 | ) | (0.01 | ) | ||||||||||||||||||||||
|
|
|
|
|
|
|
|
|
|
|
|
|
|
|
|
|
|
|
|||||||||||||||||||
| Total non-interest expense adjustments |
3,174 | 2,289 | 0.07 | 6,394 | 4,156 | 0.12 | 246 | 161 | 0.01 | |||||||||||||||||||||||||||
| Income tax benefits |
— | (2,959 | ) | (0.09 | ) | — | — | — | — | — | — | |||||||||||||||||||||||||
|
|
|
|
|
|
|
|
|
|
|
|
|
|
|
|
|
|
|
|||||||||||||||||||
| Operating earnings (Non-GAAP) |
48,675 | 35,023 | 1.05 | 48,602 | 34,671 | 1.04 | 35,006 | 25,753 | 0.87 | |||||||||||||||||||||||||||
| Covered and acquired (reversal of) provision for loan losses |
2,474 | 1,608 | 0.05 | 1,692 | 1,100 | 0.03 | 79 | 51 | 0.00 | |||||||||||||||||||||||||||
| Other provision for loan losses |
4,021 | 2,614 | 0.08 | 4,022 | 2,614 | 0.08 | 4,621 | 3,004 | 0.10 | |||||||||||||||||||||||||||
|
|
|
|
|
|
|
|
|
|
|
|
|
|
|
|
|
|
|
|||||||||||||||||||
| Pre-provision operating earnings (Non-GAAP) |
$ | 55,170 | $ | 39,245 | $ | 1.17 | $ | 54,316 | $ | 38,385 | $ | 1.15 | $ | 39,706 | $ | 28,808 | $ | 0.97 | ||||||||||||||||||
|
|
|
|
|
|
|
|
|
|
|
|
|
|
|
|
|
|
|
|||||||||||||||||||
| (1) | Per share amounts may not appear to foot due to rounding. |
| (2) | After-tax amounts estimated based on a 35% marginal tax rate. |
Table 12 - IBERIABANK CORPORATION
RECONCILIATION OF NON-GAAP FINANCIAL MEASURES (1)
(dollars in thousands)
| For The Year Ended | ||||||||||||||||||||||||
| December 31, 2014 | December 31, 2013 | |||||||||||||||||||||||
| Dollar Amount | Dollar Amount | |||||||||||||||||||||||
| Pre-tax | After-tax (2) | Per share | Pre-tax | After-tax (2) | Per share | |||||||||||||||||||
| Net Income (Loss) (GAAP) |
$ | 140,200 | $ | 105,450 | $ | 3.30 | $ | 80,972 | $ | 65,103 | $ | 2.20 | ||||||||||||
| Non-interest income adjustments |
||||||||||||||||||||||||
| Gain on sale of investments and other non-interest income |
(2,757 | ) | (2,319 | ) | (0.07 | ) | (2,334 | ) | (1,517 | ) | (0.05 | ) | ||||||||||||
| Non-interest expense adjustments |
||||||||||||||||||||||||
| Merger-related expenses |
15,093 | 10,104 | 0.32 | 783 | 509 | 0.02 | ||||||||||||||||||
| Severance expenses |
6,951 | 4,518 | 0.14 | 2,538 | 1,649 | 0.05 | ||||||||||||||||||
| (Gain) Loss on sale of long-lived assets, net of impairment |
7,073 | 4,597 | 0.14 | 37,183 | 24,169 | 0.81 | ||||||||||||||||||
| (Reversal of) Provision for FDIC clawback liability |
(797 | ) | (518 | ) | (0.02 | ) | 797 | 518 | 0.02 | |||||||||||||||
| Debt prepayment |
— | — | — | 2,307 | 1,500 | 0.05 | ||||||||||||||||||
| Other non-operating non-interest expense |
200 | 130 | 0.01 | 934 | 608 | 0.03 | ||||||||||||||||||
|
|
|
|
|
|
|
|
|
|
|
|
|
|||||||||||||
| Total non-interest expense adjustments |
28,520 | 18,831 | 0.59 | 44,542 | 28,952 | 0.97 | ||||||||||||||||||
| Income tax benefits |
— | (2,959 | ) | (0.09 | ) | — | — | — | ||||||||||||||||
|
|
|
|
|
|
|
|
|
|
|
|
|
|||||||||||||
| Operating earnings (Non-GAAP) |
165,963 | 119,004 | 3.73 | 123,180 | 92,538 | 3.12 | ||||||||||||||||||
| Covered and acquired (reversal of) provision for loan losses |
6,018 | 3,912 | 0.12 | (786 | ) | (511 | ) | (0.02 | ) | |||||||||||||||
| Other (reversal of) provision for loan losses |
13,042 | 8,477 | 0.27 | 5,932 | 3,856 | 0.13 | ||||||||||||||||||
|
|
|
|
|
|
|
|
|
|
|
|
|
|||||||||||||
| Pre-provision operating earnings (Non-GAAP) |
$ | 185,023 | $ | 131,392 | $ | 4.12 | $ | 128,326 | $ | 95,883 | $ | 3.23 | ||||||||||||
|
|
|
|
|
|
|
|
|
|
|
|
|
|||||||||||||
| (1) | Per share amounts may not appear to foot due to rounding. |
| (2) | After-tax amounts estimated based on a 35% marginal tax rate. |