Exhibit 99.1

FOR IMMEDIATE RELEASE
July 23, 2013
Contact:
Daryl G. Byrd, President and CEO (337) 521-4003
John R. Davis, Senior Executive Vice President (337) 521-4005
IBERIABANK Corporation Reports Second Quarter Results
LAFAYETTE, LOUISIANA — IBERIABANK Corporation (NASDAQ: IBKC), holding company of the 126-year-old IBERIABANK (www.iberiabank.com), reported operating results for the second quarter ended June 30, 2013. For the quarter, the Company reported income available to common shareholders of $16 million, or $0.53 fully diluted earnings per share. The Company incurred costs to implement previously disclosed earnings improvement initiatives in the second quarter of 2013 equal to $0.16 per share on an after-tax basis. In addition, as announced on April 15, 2013, the results for the second quarter of 2013 were materially affected by increased costs related to the adoption of a new accounting standard ($0.11 per share after-tax). The negative impact of these items on the second quarter of 2013 totaled $7 million on a pre-tax basis, or $0.27 per share on an after-tax basis. Excluding those items, EPS in the second quarter of 2013 was $0.80 per share on a non-GAAP operating basis excluding the adoption of the new accounting standard (refer to press release supplemental table).
Daryl G. Byrd, President and Chief Executive Officer, commented, “The results for the second quarter were generally consistent with our expectations. We experienced the strongest quarterly organic loan growth in our Company’s history. Noninterest bearing deposit volumes continued to climb. Our net interest margin in the second quarter showed significant improvement as expected. Our asset quality and capital position remained stellar. Targeted cost savings are being achieved, though results this quarter were masked by $4 million in one-time branch closure costs that were beyond our expectations. While we originated the third highest quarterly mortgage loan production in our Company’s history, mortgage income was negatively affected by the rapid rise in interest rates and reduced pipeline valuations. Overall, we believe we remain on track to achieve the guidance we projected for the investment community last quarter.”
Highlights for the Second Quarter of 2013 and June 30, 2013:
| • | The net interest margin improved 16 basis points on a linked quarter basis to 3.39%. The primary drivers of the margin improvement were yield stability in the investment securities portfolio and loans net of the loss share receivable combined with an improved earning asset mix and a five basis point reduction in the cost of interest bearing deposits. Management stated continued comfort with the previously disclosed net interest margin guidance range of 3.30% to 3.35% through the fourth quarter of 2013. |
| • | The Company’s profitability improvement initiatives are currently expected to achieve aggregate annual run-rate benefits of approximately $21 million, of which 92% are targeted expense reductions. In the second quarter of 2013, implementation costs were $7 million, approximately $4 million greater than initially projected, due primarily to higher branch closing costs than initially forecasted. Implementation costs for the remainder of 2013 are projected to total less than $1 million, with approximately $9 million in aggregate pre-tax earnings improvements in the second half of 2013. Full run-rate benefits are expected to be achieved by the first quarter of 2014, resulting in approximately $21 million of annual pre-tax earnings improvements in 2014 and beyond. |
1
| • | Gross loan growth was $394 million, or 5%, between quarter-ends (21% annualized rate), excluding loans and other assets covered under FDIC loss share agreements (“Covered Assets”). |
| • | Total deposits decreased $45 million, or less than 1%, between quarter-ends. Noninterest bearing deposits increased $84 million, or 4% (17% annualized rate), and time deposits decreased $110 million, or 5%, over the period. |
| • | The Company’s legacy asset quality continued to be strong in the second quarter of 2013. Nonperforming assets (“NPAs”), excluding Covered Assets and impaired loans acquired in acquisitions, equated to 0.86% of total assets at June 30, 2013, compared to 0.83% at March 31, 2013. On that basis, loans past due 30 days or more equated to 1.18% of total loans at June 30, 2013, compared to 1.13% at March 31, 2013. Classified assets excluding Covered Assets decreased $30 million, or 14%, during the second quarter, and decreased from 1.84% of total assets at March 31, 2013, to 1.59% at June 30, 2013. |
| • | The Company recorded a $2 million loan loss provision in the second quarter of 2013, compared to a $3 million negative loan loss provision in the first quarter of 2013. The provision increase was driven primarily by solid loan growth. Net charge-offs totaled $1.1 million in the second quarter of 2013, or an annualized 0.05% of average loans, compared to 0.06% of average loans in the first quarter of 2013, and 0.07% of average loans over the past six quarters. |
| • | Capital ratios remained strong. At June 30, 2013, the Company’s tangible common equity ratio was 8.69%, tier 1 common ratio was 11.08%, and total risk based capital ratio was 13.45%. |
2
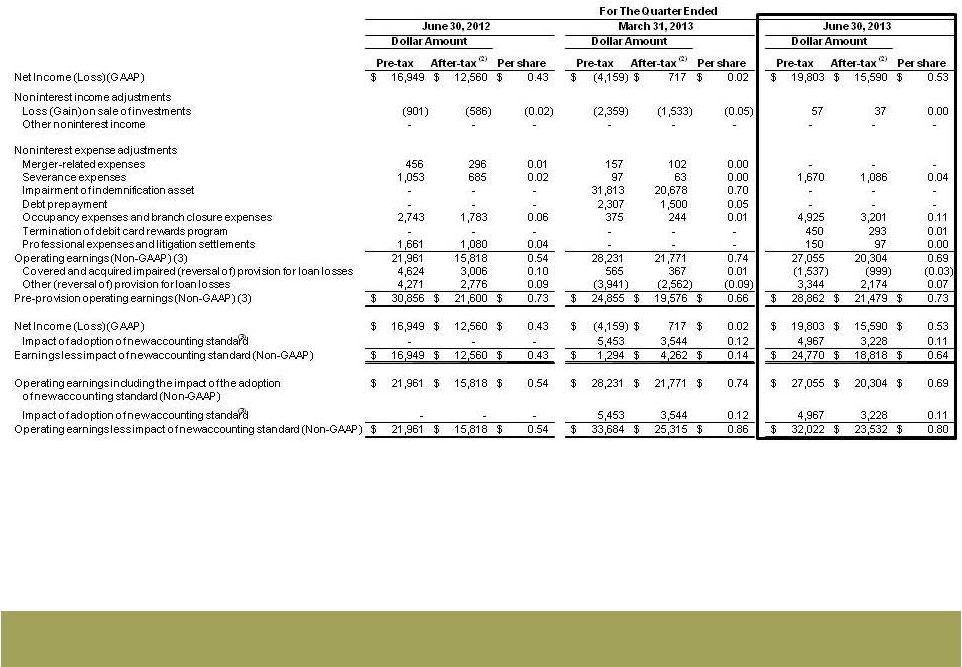
Table A—Summary Financial Results
| For the Quarter Ended: | ||||||||||||||||
| Selected Financial Data |
6/30/2012 | 3/31/2013 | 6/30/2013 | % Change | ||||||||||||
| Net Income ($ in thousands) |
$ | 12,560 | $ | 717 | $ | 15,590 | 2074 | % | ||||||||
| Per Share Data: |
||||||||||||||||
| Fully Diluted Earnings |
$ | 0.43 | $ | 0.02 | $ | 0.53 | 2011 | % | ||||||||
| Operating Earnings (Non-GAAP) (1) |
0.54 | 0.86 | 0.80 | -7 | % | |||||||||||
| Pre-provision Operating Earnings (Non-GAAP) |
0.73 | 0.66 | 0.73 | 10 | % | |||||||||||
| Tangible Book Value |
37.28 | 36.93 | 36.30 | -2 | % | |||||||||||
| As of and for the Quarter Ended: |
Basis Point | |||||||||||||||
| Key Ratios |
6/30/2012 | 3/31/2013 | 6/30/2013 | Change | ||||||||||||
| Return on Average Assets |
0.43 | % | 0.02 | % | 0.49 | % | 47 bps | |||||||||
| Return on Average Common Equity |
3.36 | % | 0.19 | % | 4.09 | % | 390 bps | |||||||||
| Return on Average Tangible Common Equity |
4.86 | % | 0.55 | % | 5.96 | % | 541 bps | |||||||||
| Net Interest Margin (TE) (2) |
3.59 | % | 3.23 | % | 3.39 | % | 16 bps | |||||||||
| Tangible Efficiency Ratio (TE) (2) (Non-GAAP) |
78.2 | % | 102.4 | % | 81.9 | % | (2,051) bps | |||||||||
| Tangible Common Equity Ratio (Non-GAAP) |
9.37 | % | 8.75 | % | 8.69 | % | (6) bps | |||||||||
| Tier 1 Leverage Ratio |
10.42 | % | 9.37 | % | 9.59 | % | 22 bps | |||||||||
| Tier 1 Common Ratio (Non-GAAP) |
12.97 | % | 11.39 | % | 11.08 | % | (31) bps | |||||||||
| Total Risk Based Capital Ratio |
15.54 | % | 13.80 | % | 13.45 | % | (35) bps | |||||||||
| Net Charge-Offs to Average Loans (3) |
0.07 | % | 0.06 | % | 0.05 | % | (1) bps | |||||||||
| Nonperforming Assets to Total Assets (3) |
0.84 | % | 0.83 | % | 0.86 | % | 3 bps | |||||||||
| For the Quarter Ended: | ||||||||||||
| Adjusted Selected Key Ratios |
GAAP 6/30/2013 |
Adjustments (4) | Non GAAP 6/30/2013 |
|||||||||
| Return on Average Assets |
0.49 | % | 0.12 | % | 0.61 | % | ||||||
| Return on Average Common Equity |
4.09 | % | 0.85 | % | 4.94 | % | ||||||
| Return on Average Tangible Common Equity (Non-GAAP) |
5.96 | % | 1.18 | % | 7.14 | % | ||||||
| Net Interest Margin (TE) (2) |
3.39 | % | 0.17 | % | 3.56 | % | ||||||
| Tangible Efficiency Ratio (TE)(2) (Non-GAAP) |
81.9 | % | (2.8 | %) | 79.1 | % | ||||||
| (1) | Excludes the impact of the adoption of the new accounting standard. |
| (2) | Fully taxable equivalent basis. |
| (3) | Excluding FDIC Covered Assets and acquired impaired loans. |
| (4) | Adjusted results exclude the income statement impact of the additional amortization of the Company’s indemnification asset, net of tax where applicable, without adjustment to any balance sheet accounts |
Refer to press release supplemental table for a reconciliation of GAAP and non-GAAP measures.
Operating Results
On a linked quarter basis, average earning assets decreased $241 million, or 2%, as average loans and the FDIC receivable increased $89 million, or 1%, average investment securities increased $17 million, or 1%, and other earning assets declined $340 million, or 50%. Also on a linked quarter basis, the average earning asset yield increased 10 basis points, and the cost of interest bearing liabilities decreased seven basis points. As a result, the tax-equivalent net interest margin improved 16 basis points. Tax-equivalent net interest income increased $3.5 million, or 4%, as the improvement in deposit costs and earning asset yields more than offset the decline in average earning assets on a linked quarter basis.
3
Table B—Quarterly Average Yields/Cost (1)
| For Quarter Ended: | Basis Point | |||||||||||||||
| 6/30/2012 | 3/31/2013 | 6/30/2013 | Change | |||||||||||||
| Investment Securities |
2.40 | % | 1.92 | % | 1.92 | % | (0) bps | |||||||||
| Covered Loans, net of loss share receivable |
7.44 | % | 5.35 | % | 5.11 | % | (24) bps | |||||||||
| Noncovered Loans |
4.68 | % | 4.44 | % | 4.40 | % | (4) bps | |||||||||
|
|
|
|
|
|
|
|
|
|||||||||
| Loans & Loss Share Receivable |
4.80 | % | 4.36 | % | 4.35 | % | (1) bps | |||||||||
| Mortgage Loans Held For Sale |
3.64 | % | 2.97 | % | 3.17 | % | 20 bps | |||||||||
| Other Earning Assets |
0.84 | % | 0.52 | % | 0.87 | % | 35 bps | |||||||||
|
|
|
|
|
|
|
|
|
|||||||||
| Total Earning Assets |
4.20 | % | 3.70 | % | 3.80 | % | 10 bps | |||||||||
| Interest Bearing Deposits |
0.65 | % | 0.47 | % | 0.42 | % | (5) bps | |||||||||
| Short-Term Borrowings |
0.24 | % | 0.19 | % | 0.16 | % | (3) bps | |||||||||
| Long-Term Borrowings |
3.07 | % | 3.16 | % | 3.39 | % | 23 bps | |||||||||
|
|
|
|
|
|
|
|
|
|||||||||
| Total Interest Bearing Liabilities |
0.76 | % | 0.58 | % | 0.51 | % | (7) bps | |||||||||
|
|
|
|
|
|
|
|
|
|||||||||
| Net Interest Spread |
3.45 | % | 3.12 | % | 3.29 | % | 17 bps | |||||||||
| Net Interest Margin |
3.59 | % | 3.23 | % | 3.39 | % | 16 bps | |||||||||
| (1) | Earning asset yields are shown on a fully taxable equivalent basis. |
The average investment yield was unchanged during the second quarter of 2013 as cash flows from maturing investments were reinvested at higher market rates. During the second quarter of 2013, the Company deployed, on average, approximately $335 million in excess liquidity to fund loan growth.
The covered loan yield (net of loss share receivable amortization) decreased 24 basis points due primarily to lower income and higher balances on the covered loan portfolio. The non-covered loan yield declined four basis points primarily due to four and eight basis point declines in the commercial and consumer loan portfolio yields, respectively.
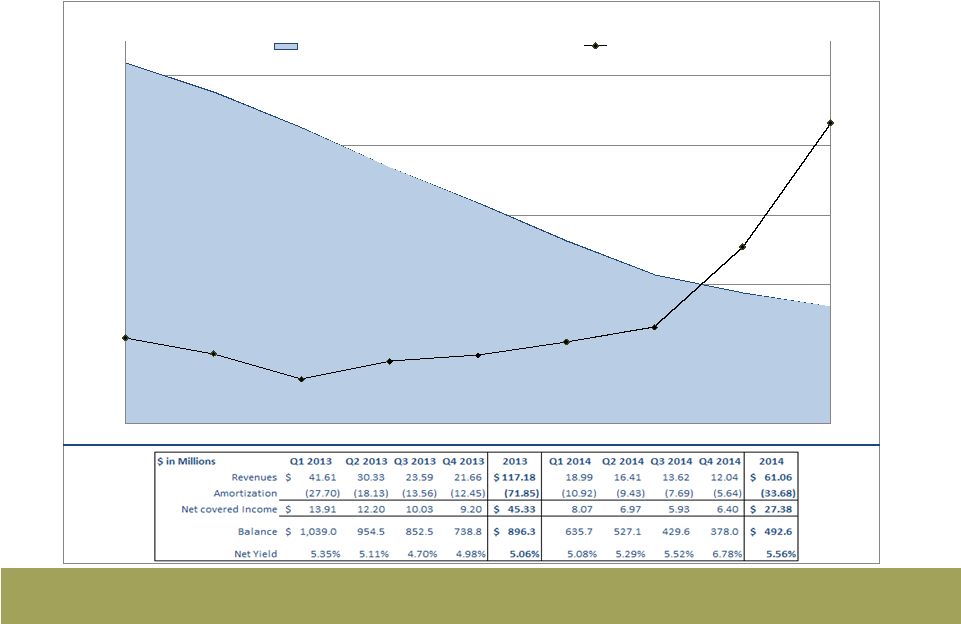
For the third quarter of 2013, the Company projects the prospective yield on the covered loan portfolio net of the FDIC Indemnification Asset (“IA”) to approximate 4.70% and 5.06% for the full year 2013. The average balance of the net covered loan portfolio is projected to decline approximately $102 million, based on current FDIC loss share accounting assumptions and estimates. Net income on the covered loan portfolio is projected to decline from approximately $12 million in the second quarter of 2013 to approximately $10 million in the third quarter of 2013.
The IA declined $43 million, or 15%, from $284 million at March 31, 2013 to $241 million at June 30, 2013. The portion of the IA collectible from the FDIC decreased $39 million, or 31%, while the collectible portion from OREO and customers declined $3 million, or 2%.
The Company recorded a $2 million loan loss provision in the second quarter of 2013, with net charge-offs of $1 million, or 0.05% of average loans on an annualized basis.
Aggregate noninterest income decreased $2 million, or 5%, on a linked quarter basis. The primary changes in noninterest income on a linked quarter basis were:
| • | Decreased gains on the sale of investment securities equal to $2.4 million; |
4
| • | Decreased mortgage income of $1.2 million, or 6%; partially offset by |
| • | Increased title revenue of $0.7 million, or 13%; |
| • | Increased brokerage commissions of $0.3 million, or 9%; and |
| • | Increased deposit service charge income of $0.3 million, or 5%. |
The $1.2 million decline in mortgage income was the result of lower net valuations of derivatives and mortgage loans held for sale due primarily to the changing interest rate environment. Assets under management at IBERIA Wealth Advisors were $1.1 billion at June 30, 2013.
In the second quarter of 2013, the Company originated $672 million in residential mortgage loans, up $126 million, or 23%, on a linked quarter basis (up $81 million, or 14%, compared to the same quarter last year). The increase in origination volume was consistent with historical seasonal trends. Client loan refinancing opportunities accounted for approximately 31% of mortgage loan applications in the second quarter of 2013, compared to 40% in the first quarter of 2013, and approximately 17% between June 30, 2013, and July 12, 2013. The Company sold $684 million in mortgage loans during the second quarter of 2013, up $68 million, or 11%, on a linked quarter basis. Margins on the sale of mortgage loans declined slightly on a linked quarter basis. The mortgage origination pipeline was approximately $265 million at June 30, 2013, compared to $281 million at March 31, 2013, and was approximately $270 million at July 12, 2013. Mortgage loan repurchases and make-whole payments were approximately $0.3 million in the second quarter of 2013, up slightly compared to the first quarter of 2013.
Noninterest expense decreased $27.5 million, or 19%, on a linked quarter basis. Non-operating expenses declined $28.0 million on a linked quarter basis, comprised of the following changes:
| • | Decreased IA impairment of $31.8 million; |
| • | Decreased FHLB debt extinguishment of $2.3 million; and |
| • | Decreased merger and conversion-related expense of $0.2 million; partially offset by |
| • | Increased branch closure cost of $4.6 million; |
| • | Increased severance expense of $1.6 million; and |
| • | Increased litigation expenses of $0.2 million. |
Excluding the aforementioned non-operating expenses, total expenses were essentially unchanged at $110 million in the second quarter of 2013. Operating expense changes on a linked quarter basis included:
| • | Increased mortgage commissions of $1.8 million, or 42%, due to higher mortgage loan production; |
| • | Decreased occupancy and equipment expense of $0.5 million, or 3%, due to branch closures; and |
| • | Decreased OREO expenses of $0.6 million, or 62%; |
On a linked quarter basis, total headcount at the Company declined by 107 associates on a full-time equivalent basis, or 4%.
Loans
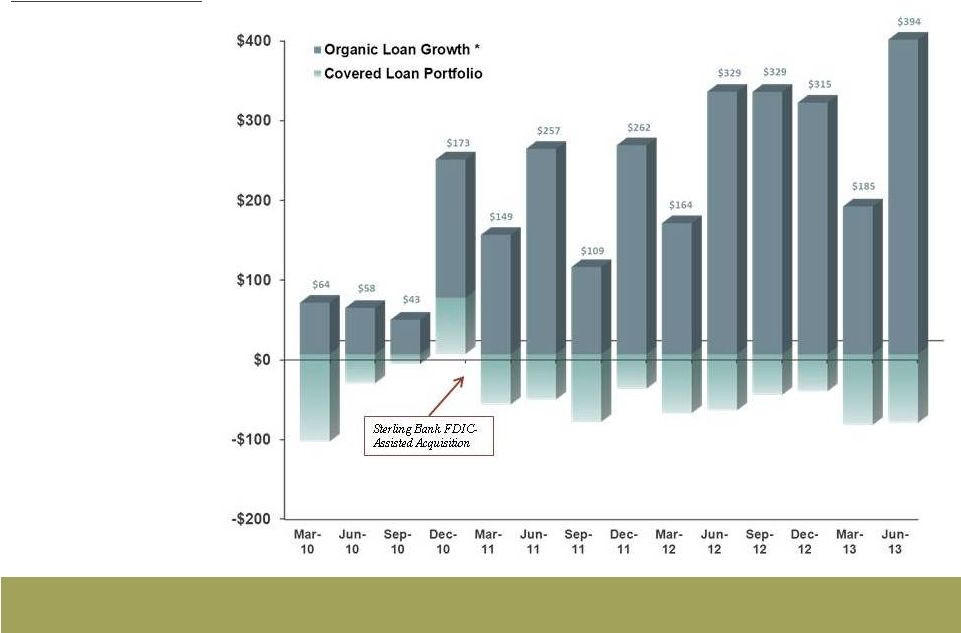
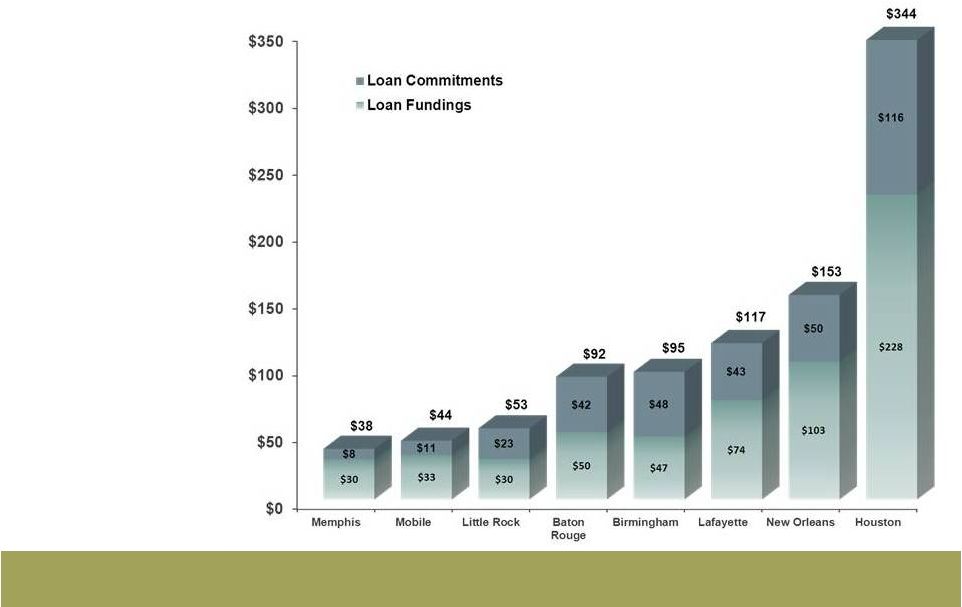
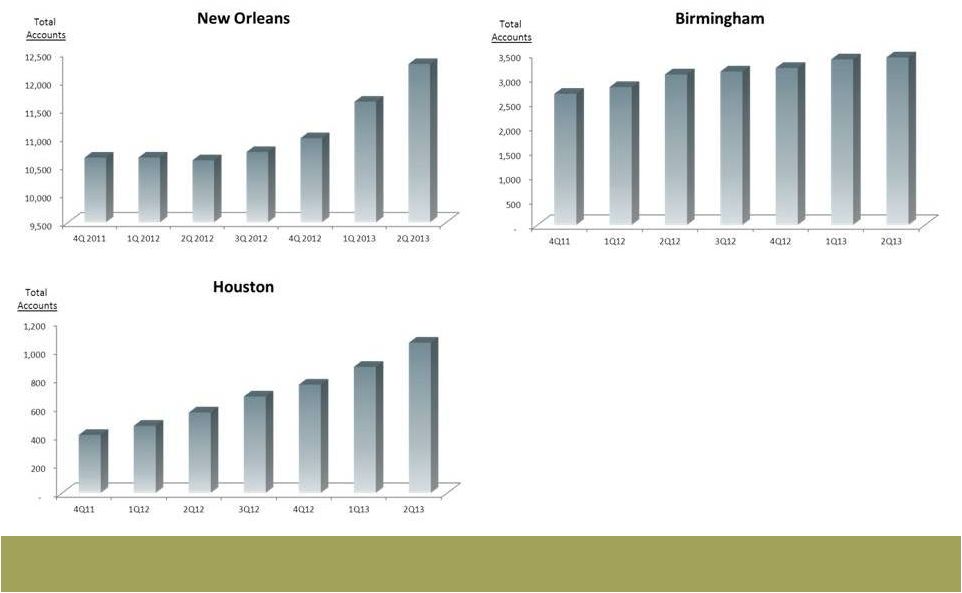
Total loans increased $308 million, or 4%, between March 31, 2013 and June 30, 2013. The loan portfolio associated with FDIC-assisted acquisitions decreased $86 million, or 9%, compared to March 31, 2013. Excluding loans associated with FDIC-assisted transactions, total loans increased $394 million, or 5% (21% annualized rate). Legacy commercial loans increased $288 million, or 5% (which includes $61 million in business banking loan growth, up 9%, or 36% annualized rate), legacy consumer loans increased $56 million, or 3%, and legacy mortgage loans increased $50 million, or 16%, during the quarter. Loan origination and renewal growth during the second quarter of 2013 were strongest in the Houston, New Orleans, Lafayette, Birmingham, and Baton Rouge markets. Loan origination mix in the second quarter of 2013 was 50% fixed rate and 50% floating rate. Loans and commitments originated and/or renewed during the second quarter of 2013 totaled $1.2 billion (up 41% on a linked quarter basis). Energy-related loans outstanding totaled $662 million at June 30, 2013, up $30 million, or 5% compared to March 31, 2013, and equal to approximately 7% of total loans. The Company had no student loans outstanding at June 30, 2013.
5
Table C—Period-End Loans ($ in Millions)
| Period-End Balances ($ Millions) | % Change | Mix | ||||||||||||||||||||||||||||||
| 6/30/12 | 3/31/13 | 6/30/13 | Year/Year | Qtr/Qtr | Annualized | 3/31/13 | 6/30/13 | |||||||||||||||||||||||||
| Commercial |
$ | 4,841 | $ | 5,555 | $ | 5,843 | 21 | % | 5 | % | 21 | % | 64 | % | 66 | % | ||||||||||||||||
| Consumer |
1,470 | 1,735 | 1,791 | 22 | % | 3 | % | 13 | % | 20 | % | 20 | % | |||||||||||||||||||
| Mortgage |
236 | 301 | 351 | 49 | % | 16 | % | 66 | % | 3 | % | 4 | % | |||||||||||||||||||
|
|
|
|
|
|
|
|
|
|
|
|
|
|
|
|
|
|||||||||||||||||
| Non-FDIC Loans |
$ | 6,547 | $ | 7,591 | $ | 7,985 | 22 | % | 5 | % | 21 | % | 87 | % | 90 | % | ||||||||||||||||
| Covered Assets |
1,190 | 1,004 | 918 | -23 | % | -9 | % | -34 | % | 13 | % | 10 | % | |||||||||||||||||||
|
|
|
|
|
|
|
|
|
|
|
|
|
|
|
|
|
|||||||||||||||||
| Total Loans |
$ | 7,737 | $ | 8,595 | $ | 8,903 | 15 | % | 4 | % | 14 | % | 100 | % | 100 | % | ||||||||||||||||
|
|
|
|
|
|
|
|
|
|
|
|
|
|
|
|
|
|||||||||||||||||
Deposits
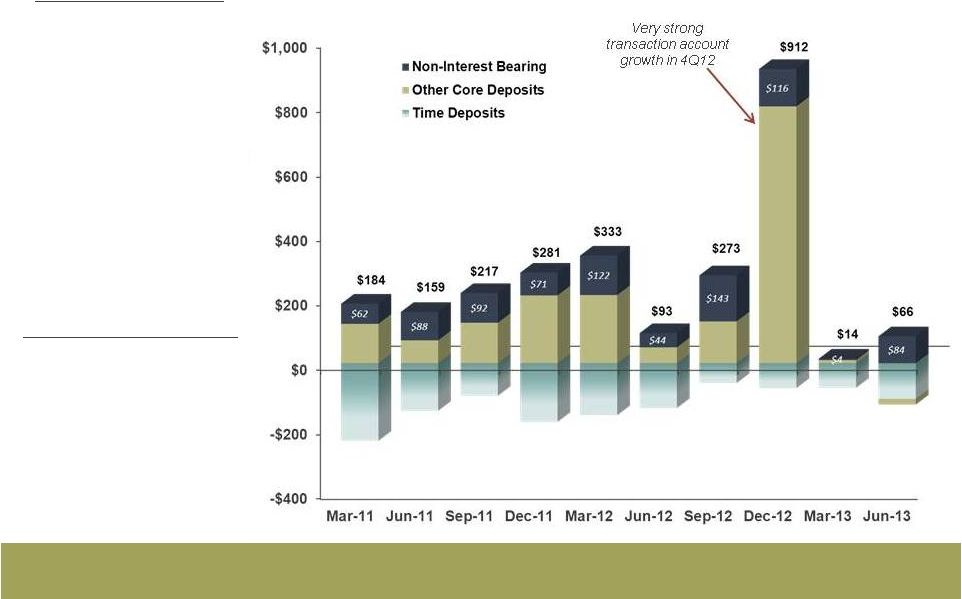
Total deposits decreased $45 million, or less than 1%, from March 31, 2013 to June 30, 2013. Noninterest bearing deposits increased $84 million, or 4%, and equated to 19% of total deposits at June 30, 2013. NOW accounts increased $5 million, or less than 1%, and money market and savings account volume decreased $22 million, or 1%, at June 30, 2013. Time deposits declined $110 million, or 5% between quarter-ends, including $13 million of wholesale time deposits. Period-end deposit growth during the second quarter of 2013 was strongest in the Houston, Birmingham, and Memphis markets.
Table D—Period-End Deposits ($ in Millions)
| Period-End Balances ($ Millions) | % Change | Mix | ||||||||||||||||||||||||||||||
| 6/30/12 | 3/31/13 | 6/30/13 | Year/Year | Qtr/Qtr | Annualized | 3/31/13 | 6/30/13 | |||||||||||||||||||||||||
| Noninterest |
$ | 1,651 | $ | 1,972 | $ | 2,055 | 24 | % | 4 | % | 17 | % | 19 | % | 19 | % | ||||||||||||||||
| NOW Accounts |
1,990 | 2,480 | 2,485 | 25 | % | 0 | % | 1 | % | 23 | % | 23 | % | |||||||||||||||||||
| Savings/MMkt |
3,529 | 4,156 | 4,134 | 17 | % | -1 | % | -2 | % | 39 | % | 39 | % | |||||||||||||||||||
| Time Deposits |
2,246 | 2,078 | 1,968 | -12 | % | -5 | % | -21 | % | 19 | % | 19 | % | |||||||||||||||||||
|
|
|
|
|
|
|
|
|
|
|
|
|
|
|
|
|
|||||||||||||||||
| Total Deposits |
$ | 9,416 | $ | 10,686 | $ | 10,642 | 13 | % | 0 | % | -2 | % | 100 | % | 100 | % | ||||||||||||||||
|
|
|
|
|
|
|
|
|
|
|
|
|
|
|
|
|
|||||||||||||||||
On an average balance and linked quarter basis, noninterest-bearing deposits increased $72 million, or 4% (15% annualized rate), and interest-bearing deposits decreased $138 million, or 2%. The rate on average interest-bearing deposits in the second quarter of 2013 was 0.42%, a decrease of five basis points on a linked quarter basis. Approximately $1.7 billion in time deposits are scheduled to re-price over the next 12 months at a weighted average cost of 0.68%. An additional $0.2 billion in time deposits are scheduled to re-price the following 12 months at a weighted average cost of 1.04%. During the second quarter of 2013, new and re-priced time deposits were booked at an average cost of 0.32%. The Company experienced a time deposit retention rate of 83% in the second quarter of 2013 with an average 25 basis point reduction in rate.
Other Assets And Funding
The Company reduced its excess liquidity position in the second quarter of 2013. Excess liquidity averaged $295 million in the second quarter of 2013, down $335 million, or 53%, on a linked quarter basis. The excess liquidity was used to fund strong loan growth while the investment portfolio remained stable at $2.1 billion on average in the second quarter of 2013. On a period-end basis, the investment portfolio equated to $2.1 billion, or 16% of total assets
6
at June 30, 2013, down slightly compared to 17% at March 31, 2013. The investment portfolio had a modified duration of 3.9 years at June 30, 2013, up compared to 3.1 years at March 31, 2013. The lengthening duration of the investment portfolio was the result of anticipated slowing prepayment speeds as interest rates increased near the end of the second quarter of 2013. At current prepayment speeds, the investment portfolio is projected to cash flow approximately $537 million over the next 18 months, or 26% of the total investment portfolio. The Company estimates that a potential increase in interest rates of 100 and 200 basis points at June 30, 2013 would extend the duration of the investment portfolio by 0.6 and 0.7 years, respectively. The unrealized gain in the portfolio decreased from a $40 million unrealized gain at March 31, 2013, to an $8 million unrealized loss at June 30, 2013. The average yield on investment securities held steady on a linked quarter basis at 1.92% in the second quarter of 2013. The Company holds in its investment portfolio primarily government agency securities. Municipal securities comprised only 10% of total investments at June 30, 2013. The Company holds no sovereign debt or derivative exposure to foreign counterparties.
The Company paid off $90 million in long-term FHLB borrowings near the end of the first quarter of 2013. On a linked quarter basis, average long-term debt decreased $118 million, or 29%, and the cost of debt increased 23 basis points to 3.39%. The cost of average interest bearing liabilities was 0.51% in the second quarter of 2013, a decrease of seven basis points on a linked quarter basis. For the month of June 2013, the average cost of interest bearing liabilities was 0.49%.
Asset Quality
Excluding $444 million in NPAs which were Covered Assets or acquired impaired loans, NPAs at June 30, 2013 were $100 million, up $4 million, or 4%, compared to March 31, 2013. NPAs equated to 0.86% of total assets at June 30, 2013, compared to 0.83% of total assets at March 31, 2013. Loans past due 30 days or more (including nonaccruing loans) increased $8 million, or 10%, and represented 1.18% of total loans at June 30, 2013, up compared to 1.13% at March 31, 2013. Classified assets declined $30 million, or 14%, during the second quarter of 2013.
Table E - Asset Quality Summary
Excludes the impact of all FDIC-assisted acquisitions and acquired impaired loans
| For Quarter Ended: | % or Basis Point Change | |||||||||||||||||||
| ($ thousands) | 6/30/2012 | 3/31/2013 | 6/30/2013 | Year/Year | Qtr/Qtr | |||||||||||||||
| Nonperforming Assets |
$ | 86,501 | $ | 96,001 | $ | 99,567 | 15 | % | 4 | % | ||||||||||
| Past Due Loans |
84,653 | 85,399 | 93,872 | 11 | % | 10 | % | |||||||||||||
| Classified Assets |
200,872 | 213,589 | 183,414 | -9 | % | -14 | % | |||||||||||||
| Nonperforming Assets/Assets |
0.84 | % | 0.83 | % | 0.86 | % | 2 | bps | 3 | bps | ||||||||||
| NPAs/(Loans + OREO) |
1.33 | % | 1.27 | % | 1.25 | % | (8) | bps | (2) | bps | ||||||||||
| Classified Assets/Total Assets |
1.94 | % | 1.84 | % | 1.59 | % | (35) | bps | (25) | bps | ||||||||||
| (Past Dues & Nonaccruals)/Loans |
1.30 | % | 1.13 | % | 1.18 | % | (12) | bps | 5 | bps | ||||||||||
| Provision For Loan Losses |
$ | 4,271 | $ | (3,941) | $ | 3,344 | -22 | % | -185 | % | ||||||||||
| Net Charge-Offs/(Recoveries) |
1,102 | 1,170 | 1,029 | -7 | % | -12 | % | |||||||||||||
|
|
|
|
|
|
|
|
|
|
|
|||||||||||
| Provision Less Net Charge-Offs |
$ | 3,169 | $ | (5,111) | $ | 2,315 | 27 | % | -145 | % | ||||||||||
| Net Charge-Offs/Average Loans |
0.07 | % | 0.06 | % | 0.05 | % | (2) | (1) | ||||||||||||
| Allowance For Loan Losses/Loans |
1.23 | % | 0.99 | % | 0.84 | % | (39) | (15) | ||||||||||||
| Allowance for Credit Losses to Total Loans |
1.23 | % | 0.99 | % | 0.97 | % | (26) | (2) | ||||||||||||
|
|
|
|
|
|
|
|
|
|
|
|||||||||||
Excluding Covered Assets and acquired impaired loans, troubled debt restructurings at June 30, 2013, totaled $10 million, or 0.13% of total loans (compared to 0.25% of total loans at March 31, 2013). All but $2 million of the Company’s troubled debt restructurings were included in NPAs at June 30, 2013.
7
Capital Position
The Company maintains favorable capital strength. At June 30, 2013, the Company reported a tangible common equity ratio of 8.69%, down six basis points compared to March 31, 2013. At June 30, 2013, the Company’s preliminary Tier 1 leverage ratio was 9.59%, up 22 basis points compared to March 31, 2013. The Company’s preliminary total risk-based capital ratio at June 30, 2013 was 13.45%, down 35 basis points compared to March 31, 2013. The decline in the risk-based capital ratio was due in part to the deployment of excess liquidity that carried a 0% risk weighting into loans that carried a higher risk weighting.
On October 26, 2011, the Company announced a share repurchase program totaling 900,000 shares of common stock. No shares were repurchased under this program during the second quarter of 2013. A total of 46,692 shares remain under the currently authorized share repurchase program.
At June 30, 2013, book value per share was $50.65, down $0.68 per share compared to March 31, 2013. Tangible book value per share was $36.30, down $0.63 per share compared to March 31, 2013. Based on the closing stock price of the Company’s common stock of $58.73 per share on July 23, 2013, this price equated to 1.16 times June 30, 2013 book value and 1.62 times June 30, 2013 tangible book value per share.
On June 3, 2013, the Company declared a quarterly cash dividend of $0.34 per share. This dividend level equated to an annualized dividend rate of $1.36 per share and an indicated dividend yield of 2.32%.
IBERIABANK Corporation
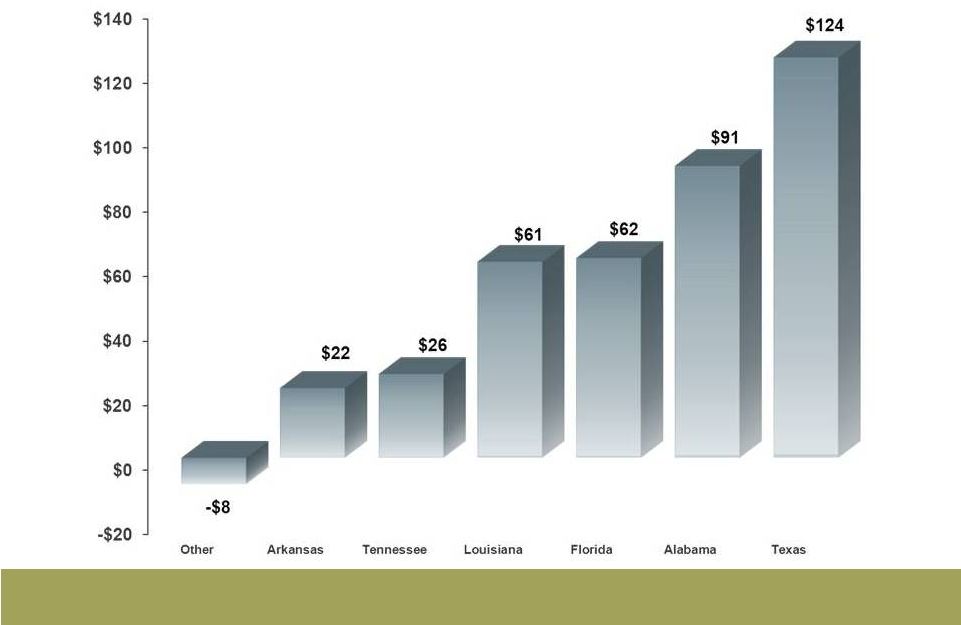
IBERIABANK Corporation is a financial holding company with 278 combined offices, including 180 bank branch offices and three LPOs in Louisiana, Arkansas, Tennessee, Alabama, Texas, and Florida, 21 title insurance offices in Arkansas and Louisiana, mortgage representatives in 65 locations in 12 states, eight locations with representatives of IBERIA Wealth Advisors in four states, and one IBERIA Capital Partners, L.L.C. office in New Orleans.
The Company’s common stock trades on the NASDAQ Global Select Market under the symbol “IBKC.” The Company’s market capitalization was approximately $1.7 billion, based on the NASDAQ closing stock price on July 23, 2013.
The following 11 investment firms currently provide equity research coverage on IBERIABANK Corporation:
| • | FIG Partners, LLC |
| • | Jefferies & Co., Inc. |
| • | Keefe, Bruyette & Woods |
| • | Merion Capital Group |
| • | Oppenheimer & Co., Inc. |
| • | Raymond James & Associates, Inc. |
| • | Robert W. Baird & Company |
| • | Stephens, Inc. |
| • | Sterne, Agee & Leach |
| • | SunTrust Robinson-Humphrey |
| • | Wunderlich Securities |
Conference Call
In association with this earnings release, the Company will host a live conference call to discuss the financial results for the quarter just completed. The telephone conference call will be held on Wednesday, July 24, 2013, beginning at 8:00 a.m. Central Time by dialing 1-800-762-4758. The confirmation code for the call is 297018. A replay of the call will be available until midnight Central Time on July 31, 2013 by dialing 1-800-475-6701.
8
The confirmation code for the replay is 297018. The Company has prepared a PowerPoint presentation that supplements information contained in this press release. The PowerPoint presentation may be accessed on the Company’s web site, www.iberiabank.com, under “Investor Relations” and then “Presentations.”
Non-GAAP Financial Measures
This press release contains financial information determined by methods other than in accordance with GAAP. The Company’s management uses these non-GAAP financial measures in their analysis of the Company’s performance. These measures typically adjust GAAP performance measures to exclude the effects of the amortization of intangibles and include the tax benefit associated with revenue items that are tax-exempt, as well as adjust income available to common shareholders for certain significant activities or transactions that are infrequent in nature. Since the presentation of these GAAP performance measures and their impact differ between companies, management believes presentations of these non-GAAP financial measures provide useful supplemental information that is essential to a proper understanding of the operating results of the Company’s core businesses. These non-GAAP disclosures should not be viewed as a substitute for operating results determined in accordance with GAAP, nor are they necessarily comparable to non-GAAP performance measures that may be presented by other companies. Reconciliations of GAAP to non-GAAP disclosures are included as tables at the end of this release. Refer to press release supplemental table for this reconciliation.
Forward Looking Statements
To the extent that statements in this press release and the accompanying PowerPoint presentation relate to future plans, objectives, financial results or performance of IBERIABANK Corporation, these statements are deemed to be forward-looking statements within the meaning of the Private Securities Litigation Reform Act of 1995. Such statements, which are based on management’s current information, estimates and assumptions and the current economic environment, are generally identified by the use of the words “plan”, “believe”, “expect”, “intend”, “anticipate”, “estimate”, “project” or similar expressions. IBERIABANK Corporation’s actual strategies and results in future periods may differ materially from those currently expected due to various risks and uncertainties.
Actual results could differ materially because of factors such as the level of market volatility, our ability to execute our growth strategy, including the availability of future FDIC-assisted failed bank opportunities, unanticipated losses related to the integration of, and refinements to purchase accounting adjustments for, acquired businesses and assets and assumed liabilities in these transactions, adjustments of fair values of acquired assets and assumed liabilities and of deferred taxes in acquisitions, actual results deviating from the Company’s current estimates and assumptions of timing and amounts of cash flows, credit risk of our customers, effects of the on-going correction in residential real estate prices and reduced levels of home sales, sufficiency of our allowance for loan losses, changes in interest rates, access to funding sources, reliance on the services of executive management, competition for loans, deposits and investment dollars, reputational risk and social factors, changes in government regulations and legislation, increases in FDIC insurance assessments, geographic concentration of our markets and economic conditions in these markets, rapid changes in the financial services industry, dependence on our operational, technological, and organizational systems or infrastructure and those of third-party providers of those services, hurricanes and other adverse weather events, the modest trading volume of our common stock, and valuation of intangible assets. These and other factors that may cause actual results to differ materially from these forward-looking statements are discussed in the Company’s Annual Report on Form 10-K, subsequent Quarterly Reports on Form 10-Q, and other filings with the Securities and Exchange Commission (the “SEC”), available at the SEC’s website, http://www.sec.gov, and at the Company’s website, http://www.iberiabank.com, under the heading “Investor Information.” All information in this release and the accompanying PowerPoint presentation is as of the date of this release. The Company undertakes no duty to update any forward-looking statement to conform the statement to actual results or changes in the Company’s expectations. Certain tabular presentations may not reconcile because of rounding.
9
Table 1—IBERIABANK CORPORATION
FINANCIAL HIGHLIGHTS
| For The Quarter Ended June 30, |
For The Quarter
Ended March 31, |
|||||||||||||||||||
| 2013 | 2012 | % Change | 2013 | % Change | ||||||||||||||||
| Income Data (in thousands): |
||||||||||||||||||||
| Net Interest Income |
$ | 96,482 | $ | 93,172 | 4 | % | $ | 92,871 | 4 | % | ||||||||||
| Net Interest Income (TE) (1) |
98,878 | 95,593 | 3 | % | 95,335 | 4 | % | |||||||||||||
| Net Income |
15,590 | 12,560 | 24 | % | 717 | 2074 | % | |||||||||||||
| Earnings Available to Common Shareholders—Basic |
15,590 | 12,560 | 24 | % | 717 | 2074 | % | |||||||||||||
| Earnings Available to Common Shareholders—Diluted |
15,297 | 12,320 | 24 | % | 697 | 2094 | % | |||||||||||||
| Per Share Data: |
||||||||||||||||||||
| Earnings Available to Common Shareholders—Basic |
$ | 0.53 | $ | 0.43 | 24 | % | $ | 0.02 | 2067 | % | ||||||||||
| Earnings Available to Common Shareholders—Diluted |
0.53 | 0.43 | 24 | % | 0.02 | 2088 | % | |||||||||||||
| Operating Earnings (Non-GAAP) (2) |
0.80 | 0.54 | 48 | % | 0.86 | (7 | %) | |||||||||||||
| Book Value |
50.65 | 50.68 | (0 | %) | 51.33 | (1 | %) | |||||||||||||
| Tangible Book Value (3) |
36.30 | 37.28 | (3 | %) | 36.93 | (2 | %) | |||||||||||||
| Cash Dividends |
0.34 | 0.34 | — | 0.34 | — | |||||||||||||||
| Closing Stock Price |
53.61 | 50.45 | 6 | % | 50.02 | 7 | % | |||||||||||||
| Key Ratios: (4) |
||||||||||||||||||||
| Operating Ratios: |
||||||||||||||||||||
| Return on Average Assets |
0.49 | % | 0.43 | % | 0.02 | % | ||||||||||||||
| Return on Average Common Equity |
4.09 | % | 3.36 | % | 0.19 | % | ||||||||||||||
| Return on Average Tangible Common Equity (3) |
5.96 | % | 4.86 | % | 0.55 | % | ||||||||||||||
| Net Interest Margin (TE) (1) |
3.39 | % | 3.59 | % | 3.23 | % | ||||||||||||||
| Efficiency Ratio |
84.4 | % | 80.8 | % | 105.5 | % | ||||||||||||||
| Tangible Efficiency Ratio (TE) (1) (3) |
81.9 | % | 78.2 | % | 102.4 | % | ||||||||||||||
| Full-time Equivalent Employees |
2,611 | 2,574 | 2,718 | |||||||||||||||||
| Capital Ratios: |
||||||||||||||||||||
| Tangible Common Equity Ratio (Non-GAAP) |
8.69 | % | 9.37 | % | 8.75 | % | ||||||||||||||
| Tangible Common Equity to Risk-Weighted Assets |
11.03 | % | 13.24 | % | 11.64 | % | ||||||||||||||
| Tier 1 Leverage Ratio |
9.59 | % | 10.42 | % | 9.37 | % | ||||||||||||||
| Tier 1 Capital Ratio |
12.19 | % | 14.27 | % | 12.54 | % | ||||||||||||||
| Total Risk Based Capital Ratio |
13.45 | % | 15.54 | % | 13.80 | % | ||||||||||||||
| Common Stock Dividend Payout Ratio |
64.8 | % | 79.9 | % | N/M | |||||||||||||||
| Asset Quality Ratios: |
||||||||||||||||||||
| Excluding FDIC Covered Assets and acquired impaired loans |
||||||||||||||||||||
| Nonperforming Assets to Total Assets (5) |
0.86 | % | 0.84 | % | 0.83 | % | ||||||||||||||
| Allowance for Loan Losses to Loans |
0.84 | % | 1.23 | % | 0.99 | % | ||||||||||||||
| Net Charge-offs to Average Loans |
0.05 | % | 0.07 | % | 0.06 | % | ||||||||||||||
| Nonperforming Assets to Total Loans and OREO (5) |
1.25 | % | 1.33 | % | 1.27 | % | ||||||||||||||
| For The Quarter Ended | For The Quarter Ended | |||||||||||||||||||
| June 30, | March 31, | December 31, | September 30, | |||||||||||||||||
| 2013 | 2013 | 2013 | 2012 | 2012 | ||||||||||||||||
| End of Period | Average | Average | Average | Average | ||||||||||||||||
| Balance Sheet Summary (in thousands): |
||||||||||||||||||||
| Excess Liquidity (6) |
$ | 120,451 | $ | 294,544 | $ | 629,406 | $ | 432,752 | $ | 238,203 | ||||||||||
| Total Investment Securities |
2,075,298 | 2,096,166 | 2,096,229 | 1,957,542 | 2,005,975 | |||||||||||||||
| Loans, Net of Unearned Income |
8,903,037 | 8,748,476 | 8,543,538 | 8,384,218 | 8,016,829 | |||||||||||||||
| Loans, Net of Unearned Income, Excluding Covered Loans and SOP 03-3 |
7,938,120 | 7,753,497 | 7,454,309 | 7,212,648 | 6,810,490 | |||||||||||||||
| Total Assets |
12,823,503 | 12,881,551 | 13,075,008 | 12,692,665 | 12,182,554 | |||||||||||||||
| Total Deposits |
10,641,718 | 10,638,478 | 10,703,883 | 10,315,944 | 9,705,957 | |||||||||||||||
| Total Shareholders’ Equity |
1,504,761 | 1,528,606 | 1,531,068 | 1,533,561 | 1,519,338 | |||||||||||||||
| (1) | Fully taxable equivalent (TE) calculations include the tax benefit associated with related income sources that are tax-exempt using a marginal tax rate of 35%. |
| (2) | Excludes the impact of the adoption of the new accounting standard. |
| (3) | Tangible calculations eliminate the effect of goodwill and acquisition related intangible assets and the corresponding amortization expense on a tax-effected basis where applicable. |
| (4) | All ratios are calculated on an annualized basis for the period indicated. |
| (5) | Nonperforming assets consist of nonaccruing loans, accruing loans 90 days or more past due and other real estate owned, including repossessed assets. |
| (6) | Excess Liquidity includes interest-bearing deposits in banks and fed funds sold, but excludes liquidity sources and uses from off-balance sheet arrangements. |
| N/M | - Comparison of the information presented is not meaningful given the periods presented. |
Table 2—IBERIABANK CORPORATION
CONDENSED CONSOLIDATED FINANCIAL INFORMATION
(dollars in thousands except per share data)
| June 30, | March 31, | |||||||||||||||||||
| BALANCE SHEET (End of Period) |
2013 | 2012 | % Change | 2013 | % Change | |||||||||||||||
| ASSETS |
||||||||||||||||||||
| Cash and Due From Banks |
$ | 227,114 | $ | 195,719 | 16.0 | % | $ | 183,158 | 24.0 | % | ||||||||||
| Interest-bearing Deposits in Banks |
120,451 | 404,327 | (70.2 | %) | 443,358 | (72.8 | %) | |||||||||||||
|
|
|
|
|
|
|
|
|
|
|
|||||||||||
| Total Cash and Equivalents |
347,565 | 600,046 | (42.1 | %) | 626,516 | (44.5 | %) | |||||||||||||
| Investment Securities Available for Sale |
1,912,058 | 1,812,746 | 5.5 | % | 1,951,548 | (2.0 | %) | |||||||||||||
| Investment Securities Held to Maturity |
163,240 | 188,399 | (13.4 | %) | 198,442 | (17.7 | %) | |||||||||||||
|
|
|
|
|
|
|
|
|
|
|
|||||||||||
| Total Investment Securities |
2,075,298 | 2,001,145 | 3.7 | % | 2,149,990 | (3.5 | %) | |||||||||||||
| Mortgage Loans Held for Sale |
162,031 | 180,569 | (10.3 | %) | 188,037 | (13.8 | %) | |||||||||||||
| Loans, Net of Unearned Income |
8,903,037 | 7,736,512 | 15.1 | % | 8,594,975 | 3.6 | % | |||||||||||||
| Allowance for Loan Losses |
(162,903 | ) | (187,285 | ) | (13.0 | %) | (189,725 | ) | (14.1 | %) | ||||||||||
|
|
|
|
|
|
|
|
|
|
|
|||||||||||
| Loans, Net |
8,740,134 | 7,549,227 | 15.8 | % | 8,405,250 | 4.0 | % | |||||||||||||
| Loss Share Receivable |
241,040 | 469,923 | (48.7 | %) | 284,471 | (15.3 | %) | |||||||||||||
| Premises and Equipment |
296,988 | 291,718 | 1.8 | % | 304,353 | (2.4 | %) | |||||||||||||
| Goodwill and Other Intangibles |
427,581 | 395,919 | 8.0 | % | 428,522 | (0.2 | %) | |||||||||||||
| Other Assets |
532,866 | 632,571 | (15.8 | %) | 564,060 | (5.5 | %) | |||||||||||||
|
|
|
|
|
|
|
|
|
|
|
|||||||||||
| Total Assets |
$ | 12,823,503 | $ | 12,121,118 | 5.8 | % | $ | 12,951,199 | (1.0 | %) | ||||||||||
|
|
|
|
|
|
|
|
|
|
|
|||||||||||
| LIABILITIES AND SHAREHOLDERS’ EQUITY |
||||||||||||||||||||
| Noninterest-bearing Deposits |
$ | 2,055,333 | $ | 1,651,154 | 24.5 | % | $ | 1,971,809 | 4.2 | % | ||||||||||
| NOW Accounts |
2,484,824 | 1,989,876 | 24.9 | % | 2,480,305 | 0.2 | % | |||||||||||||
| Savings and Money Market Accounts |
4,133,770 | 3,529,060 | 17.1 | % | 4,155,973 | (0.5 | %) | |||||||||||||
| Certificates of Deposit |
1,967,791 | 2,245,830 | (12.4 | %) | 2,078,180 | (5.3 | %) | |||||||||||||
|
|
|
|
|
|
|
|
|
|
|
|||||||||||
| Total Deposits |
10,641,718 | 9,415,920 | 13.0 | % | 10,686,267 | (0.4 | %) | |||||||||||||
| Short-term Borrowings |
— | 405,000 | (1 | ) | — | — | ||||||||||||||
| Securities Sold Under Agreements to Repurchase |
289,377 | 235,768 | 22.7 | % | 294,156 | (1.6 | %) | |||||||||||||
| Trust Preferred Securities |
111,862 | 111,862 | 0.0 | % | 111,862 | 0.0 | % | |||||||||||||
| Other Long-term Debt |
171,623 | 306,036 | (43.9 | %) | 211,184 | (18.7 | %) | |||||||||||||
| Other Liabilities |
104,162 | 151,492 | (31.2 | %) | 123,660 | (15.8 | %) | |||||||||||||
|
|
|
|
|
|
|
|
|
|
|
|||||||||||
| Total Liabilities |
11,318,742 | 10,626,078 | 6.5 | % | 11,427,129 | (0.9 | %) | |||||||||||||
| Total Shareholders’ Equity |
1,504,761 | 1,495,040 | 0.7 | % | 1,524,070 | (1.3 | %) | |||||||||||||
|
|
|
|
|
|
|
|
|
|
|
|||||||||||
| Total Liabilities and Shareholders’ Equity |
$ | 12,823,503 | $ | 12,121,118 | 5.8 | % | $ | 12,951,199 | (1.0 | %) | ||||||||||
|
|
|
|
|
|
|
|
|
|
|
|||||||||||
| BALANCE SHEET (Average) |
June 30, 2013 |
March 31, 2013 |
December 31, 2012 |
September 30, 2012 |
June 30, 2012 |
|||||||||||||||
| ASSETS |
||||||||||||||||||||
| Cash and Due From Banks |
$ | 219,344 | $ | 220,746 | $ | 212,404 | $ | 192,891 | $ | 188,260 | ||||||||||
| Interest-bearing Deposits in Banks |
294,544 | 629,406 | 432,752 | 236,653 | 294,171 | |||||||||||||||
| Investment Securities |
2,096,166 | 2,096,229 | 1,957,542 | 2,005,975 | 2,048,001 | |||||||||||||||
| Mortgage Loans Held for Sale |
170,620 | 178,387 | 212,432 | 182,543 | 135,273 | |||||||||||||||
| Loans, Net of Unearned Income |
8,748,476 | 8,543,538 | 8,384,218 | 8,016,829 | 7,592,677 | |||||||||||||||
| Allowance for Loan Losses |
(183,783 | ) | (245,384 | ) | (196,634 | ) | (180,798 | ) | (173,023 | ) | ||||||||||
| Loss Share Receivable |
268,700 | 384,319 | 411,328 | 448,746 | 508,443 | |||||||||||||||
| Other Assets |
1,267,484 | 1,267,767 | 1,278,623 | 1,279,715 | 1,223,299 | |||||||||||||||
|
|
|
|
|
|
|
|
|
|
|
|||||||||||
| Total Assets |
$ | 12,881,551 | $ | 13,075,008 | $ | 12,692,665 | $ | 12,182,554 | $ | 11,817,101 | ||||||||||
|
|
|
|
|
|
|
|
|
|
|
|||||||||||
| LIABILITIES AND SHAREHOLDERS’ EQUITY |
||||||||||||||||||||
| Noninterest-bearing Deposits |
$ | 2,010,263 | $ | 1,937,890 | $ | 1,928,361 | $ | 1,773,302 | $ | 1,640,327 | ||||||||||
| NOW Accounts |
2,488,721 | 2,464,922 | 2,207,032 | 2,023,769 | 1,985,248 | |||||||||||||||
| Savings and Money Market Accounts |
4,113,671 | 4,170,123 | 3,935,675 | 3,701,947 | 3,524,641 | |||||||||||||||
| Certificates of Deposit |
2,025,823 | 2,130,948 | 2,244,876 | 2,206,939 | 2,313,176 | |||||||||||||||
|
|
|
|
|
|
|
|
|
|
|
|||||||||||
| Total Deposits |
10,638,478 | 10,703,883 | 10,315,944 | 9,705,957 | 9,463,392 | |||||||||||||||
| Short-term Borrowings |
77 | 500 | 9,239 | 121,957 | 27,857 | |||||||||||||||
| Securities Sold Under Agreements to Repurchase |
294,712 | 292,448 | 262,027 | 245,486 | 245,401 | |||||||||||||||
| Trust Preferred Securities |
111,862 | 111,862 | 111,862 | 113,905 | 111,862 | |||||||||||||||
| Long-term Debt |
181,884 | 300,071 | 312,190 | 324,923 | 313,451 | |||||||||||||||
| Other Liabilities |
125,932 | 135,176 | 147,842 | 150,988 | 151,036 | |||||||||||||||
|
|
|
|
|
|
|
|
|
|
|
|||||||||||
| Total Liabilities |
11,352,945 | 11,543,940 | 11,159,104 | 10,663,216 | 10,312,999 | |||||||||||||||
| Total Shareholders’ Equity |
1,528,606 | 1,531,068 | 1,533,561 | 1,519,338 | 1,504,102 | |||||||||||||||
|
|
|
|
|
|
|
|
|
|
|
|||||||||||
| Total Liabilities and Shareholders’ Equity |
$ | 12,881,551 | $ | 13,075,008 | $ | 12,692,665 | $ | 12,182,554 | $ | 11,817,101 | ||||||||||
|
|
|
|
|
|
|
|
|
|
|
|||||||||||
Table 3—IBERIABANK CORPORATION
CONDENSED CONSOLIDATED FINANCIAL INFORMATION
(dollars in thousands except per share data)
| For The Three Months Ended | ||||||||||||||||||||
| June 30, | March 31, | |||||||||||||||||||
| INCOME STATEMENT |
2013 | 2012 | % Change | 2013 | % Change | |||||||||||||||
| Interest Income |
$ | 108,177 | $ | 109,283 | (1.0 | %) | $ | 106,416 | 1.7 | % | ||||||||||
| Interest Expense |
11,695 | 16,111 | (27.4 | %) | 13,545 | (13.7 | %) | |||||||||||||
|
|
|
|
|
|
|
|
|
|
|
|||||||||||
| Net Interest Income |
96,482 | 93,172 | 3.6 | % | 92,871 | 3.9 | % | |||||||||||||
| (Reversal of) Provision for Loan Losses |
1,807 | 8,895 | (79.7 | %) | (3,377 | ) | (153.5 | %) | ||||||||||||
|
|
|
|
|
|
|
|
|
|
|
|||||||||||
| Net Interest Income After (Reversal of ) Provision for Loan Losses |
94,675 | 84,277 | 12.3 | % | 96,248 | (1.6 | %) | |||||||||||||
| Service Charges |
7,106 | 6,625 | 7.3 | % | 6,797 | 4.5 | % | |||||||||||||
| ATM / Debit Card Fee Income |
2,357 | 2,166 | 8.8 | % | 2,183 | 8.0 | % | |||||||||||||
| BOLI Proceeds and Cash Surrender Value Income |
901 | 905 | (0.4 | %) | 939 | (4.1 | %) | |||||||||||||
| Mortgage Income |
17,708 | 18,185 | (2.6 | %) | 18,931 | (6.5 | %) | |||||||||||||
| Gain (Loss) on Sale of Investments, Net |
(57 | ) | 901 | (106.4 | %) | 2,359 | (102.4 | %) | ||||||||||||
| Title Revenue |
5,696 | 5,339 | 6.7 | % | 5,021 | 13.4 | % | |||||||||||||
| Broker Commissions |
3,863 | 3,102 | 24.5 | % | 3,534 | 9.3 | % | |||||||||||||
| Other Noninterest Income |
4,915 | 4,471 | 10.0 | % | 4,727 | 4.0 | % | |||||||||||||
|
|
|
|
|
|
|
|
|
|
|
|||||||||||
| Total Noninterest Income |
42,489 | 41,694 | 1.9 | % | 44,491 | (4.5 | %) | |||||||||||||
| Salaries and Employee Benefits |
63,815 | 58,121 | 9.8 | % | 62,529 | 2.1 | % | |||||||||||||
| Occupancy and Equipment |
14,283 | 12,908 | 10.7 | % | 15,195 | (6.0 | %) | |||||||||||||
| Amortization of Acquisition Intangibles |
1,181 | 1,289 | (8.3 | %) | 1,183 | (0.2 | %) | |||||||||||||
| Other Noninterest Expense |
38,082 | 36,704 | 3.8 | % | 65,991 | (42.3 | %) | |||||||||||||
|
|
|
|
|
|
|
|
|
|
|
|||||||||||
| Total Noninterest Expense |
117,361 | 109,022 | 7.6 | % | 144,898 | (19.0 | %) | |||||||||||||
| Income (Loss) Before Income Taxes |
19,803 | 16,949 | 16.8 | % | (4,159 | ) | (576.2 | %) | ||||||||||||
| Income Taxes |
4,213 | 4,389 | (4.0 | %) | (4,876 | ) | (186.4 | %) | ||||||||||||
|
|
|
|
|
|
|
|
|
|
|
|||||||||||
| Net Income |
$ | 15,590 | $ | 12,560 | 24.1 | % | $ | 717 | 2073.1 | % | ||||||||||
|
|
|
|
|
|
|
|
|
|
|
|||||||||||
| Preferred Stock Dividends |
— | — | — | — | — | |||||||||||||||
|
|
|
|
|
|
|
|
|
|
|
|||||||||||
| Earnings Available to Common Shareholders—Basic |
15,590 | 12,560 | 24.1 | % | 717 | 2073.8 | % | |||||||||||||
|
|
|
|
|
|
|
|
|
|
|
|||||||||||
| Earnings Allocated to Unvested Restricted Stock |
(293 | ) | (240 | ) | 21.9 | % | (20 | ) | 1378.8 | % | ||||||||||
|
|
|
|
|
|
|
|
|
|
|
|||||||||||
| Earnings Available to Common Shareholders—Diluted |
15,297 | 12,320 | 24.2 | % | 697 | 2093.5 | % | |||||||||||||
|
|
|
|
|
|
|
|
|
|
|
|||||||||||
| Earnings Per Share, Diluted |
$ | 0.53 | $ | 0.43 | 23.7 | % | $ | 0.02 | 2086.9 | % | ||||||||||
|
|
|
|
|
|
|
|
|
|
|
|||||||||||
| Impact of Non-Operating Expenses and New Accounting Standard (Non-GAAP) |
$ | 0.27 | $ | 0.11 | 147.9 | % | $ | 0.84 | (67.8 | %) | ||||||||||
|
|
|
|
|
|
|
|
|
|
|
|||||||||||
| Earnings Per Share, Diluted, Excluding Non-operating Expenses (Non-GAAP) |
$ | 0.80 | $ | 0.54 | 48.4 | % | $ | 0.86 | (7.1 | %) | ||||||||||
|
|
|
|
|
|
|
|
|
|
|
|||||||||||
| NUMBER OF SHARES OUTSTANDING |
||||||||||||||||||||
| Basic Shares—All Classes (Average) |
29,610,315 | 29,463,811 | 0.5 | % | 29,502,711 | 0.4 | % | |||||||||||||
| Diluted Shares—Common Shareholders (Average) |
29,066,906 | 28,950,806 | 0.4 | % | 28,979,168 | 0.3 | % | |||||||||||||
| Book Value Shares (Period End) (1) |
29,710,058 | 29,497,008 | 0.7 | % | 29,691,781 | 0.1 | % | |||||||||||||
| 2013 | 2012 | |||||||||||||||||||
| INCOME STATEMENT |
Second Quarter |
First Quarter |
Fourth Quarter |
Third Quarter |
Second Quarter |
|||||||||||||||
| Interest Income |
$ | 108,177 | $ | 106,416 | $ | 114,779 | $ | 111,951 | $ | 109,283 | ||||||||||
| Interest Expense |
11,695 | 13,545 | 14,789 | 15,225 | 16,111 | |||||||||||||||
|
|
|
|
|
|
|
|
|
|
|
|||||||||||
| Net Interest Income |
96,482 | 92,871 | 99,990 | 96,726 | 93,172 | |||||||||||||||
| (Reversal of) Provision for Credit Losses |
1,807 | (3,377 | ) | 4,866 | 4,053 | 8,895 | ||||||||||||||
|
|
|
|
|
|
|
|
|
|
|
|||||||||||
| Net Interest Income After (Reversal of) Provision for Loan Losses |
94,675 | 96,248 | 95,124 | 92,673 | 84,277 | |||||||||||||||
| Total Noninterest Income |
42,489 | 44,491 | 50,354 | 46,553 | 41,694 | |||||||||||||||
| Total Noninterest Expense |
117,361 | 144,898 | 113,441 | 109,848 | 109,022 | |||||||||||||||
|
|
|
|
|
|
|
|
|
|
|
|||||||||||
| Income (Loss) Before Income Taxes |
19,803 | (4,159 | ) | 32,037 | 29,378 | 16,949 | ||||||||||||||
| Income Taxes |
4,213 | (4,876 | ) | 8,829 | 8,144 | 4,389 | ||||||||||||||
|
|
|
|
|
|
|
|
|
|
|
|||||||||||
| Net Income |
$ | 15,590 | $ | 717 | $ | 23,208 | $ | 21,234 | $ | 12,560 | ||||||||||
|
|
|
|
|
|
|
|
|
|
|
|||||||||||
| Preferred Stock Dividends |
— | — | — | — | — | |||||||||||||||
|
|
|
|
|
|
|
|
|
|
|
|||||||||||
| Earnings Available to Common Shareholders—Basic |
15,590 | 717 | 23,208 | 21,234 | 12,560 | |||||||||||||||
|
|
|
|
|
|
|
|
|
|
|
|||||||||||
| Earnings Allocated to Unvested Restricted Stock |
(293 | ) | (20 | ) | (428 | ) | (406 | ) | (240 | ) | ||||||||||
|
|
|
|
|
|
|
|
|
|
|
|||||||||||
| Earnings Available to Common Shareholders—Diluted |
$ | 15,297 | $ | 697 | $ | 22,780 | $ | 20,828 | $ | 12,320 | ||||||||||
|
|
|
|
|
|
|
|
|
|
|
|||||||||||
| Earnings Per Share, Basic |
$ | 0.53 | $ | 0.02 | $ | 0.79 | $ | 0.73 | $ | 0.43 | ||||||||||
|
|
|
|
|
|
|
|
|
|
|
|||||||||||
| Earnings Per Share, Diluted |
$ | 0.53 | $ | 0.02 | $ | 0.79 | $ | 0.73 | $ | 0.43 | ||||||||||
|
|
|
|
|
|
|
|
|
|
|
|||||||||||
| Book Value Per Common Share |
$ | 50.65 | $ | 51.33 | $ | 51.88 | $ | 51.44 | $ | 50.68 | ||||||||||
| Tangible Book Value Per Common Share |
$ | 36.30 | $ | 36.93 | $ | 37.34 | $ | 37.07 | $ | 37.28 | ||||||||||
| Return on Average Assets |
0.49 | % | 0.02 | % | 0.73 | % | 0.69 | % | 0.43 | % | ||||||||||
| Return on Average Common Equity |
4.09 | % | 0.19 | % | 6.02 | % | 5.56 | % | 3.36 | % | ||||||||||
| Return on Average Tangible Common Equity |
5.96 | % | 0.55 | % | 8.62 | % | 7.91 | % | 4.86 | % | ||||||||||
| (1) | Shares used for book value purposes exclude shares held in treasury at the end of the period. |
Table 4—IBERIABANK CORPORATION
CONDENSED CONSOLIDATED FINANCIAL INFORMATION
(dollars in thousands except per share data)
| For The Six Months Ended | ||||||||||||
| June 30, | ||||||||||||
| INCOME STATEMENT |
2013 | 2012 | % Change | |||||||||
| Interest Income |
$ | 214,593 | $ | 218,470 | (1.8 | %) | ||||||
| Interest Expense |
25,239 | 33,436 | (24.5 | %) | ||||||||
|
|
|
|
|
|
|
|||||||
| Net Interest Income |
189,354 | 185,034 | 2.3 | % | ||||||||
| (Reversal of) Provision for Loan Losses |
(1,569 | ) | 11,752 | (113.4 | %) | |||||||
|
|
|
|
|
|
|
|||||||
| Net Interest Income After Provision for Loan Losses |
190,923 | 173,282 | 10.2 | % | ||||||||
| Service Charges |
13,903 | 12,606 | 10.3 | % | ||||||||
| ATM / Debit Card Fee Income |
4,541 | 4,189 | 8.4 | % | ||||||||
| BOLI Proceeds and Cash Surrender Value Income |
1,840 | 1,855 | (0.8 | %) | ||||||||
| Mortgage Income |
36,639 | 31,903 | 14.8 | % | ||||||||
| Gain on Sale of Investments, net |
2,302 | 3,737 | (38.4 | %) | ||||||||
| Title Revenue |
10,717 | 9,872 | 8.6 | % | ||||||||
| Broker Commissions |
7,397 | 6,162 | 20.0 | % | ||||||||
| Other Noninterest Income |
9,641 | 8,766 | 10.0 | % | ||||||||
|
|
|
|
|
|
|
|||||||
| Total Noninterest Income |
86,980 | 79,090 | 10.0 | % | ||||||||
| Salaries and Employee Benefits |
126,344 | 112,940 | 11.9 | % | ||||||||
| Occupancy and Equipment |
29,478 | 25,627 | 15.0 | % | ||||||||
| Amortization of Acquisition Intangibles |
2,364 | 2,579 | (8.3 | %) | ||||||||
| Other Noninterest Expense |
104,073 | 67,750 | 53.6 | % | ||||||||
|
|
|
|
|
|
|
|||||||
| Total Noninterest Expense |
262,259 | 208,896 | 25.5 | % | ||||||||
| Income Before Income Taxes |
15,644 | 43,477 | (64.0 | %) | ||||||||
| Income Taxes |
(663 | ) | 11,523 | (105.8 | %) | |||||||
|
|
|
|
|
|
|
|||||||
| Net Income |
$ | 16,307 | $ | 31,953 | (49.0 | %) | ||||||
|
|
|
|
|
|
|
|||||||
| Preferred Stock Dividends |
— | — | — | |||||||||
|
|
|
|
|
|
|
|||||||
| Earnings Available to Common Shareholders—Basic |
16,307 | 31,953 | (49.0 | %) | ||||||||
|
|
|
|
|
|
|
|||||||
| Earnings Allocated to Unvested Restricted Stock |
(313 | ) | (607 | ) | (48.5 | %) | ||||||
|
|
|
|
|
|
|
|||||||
| Earnings Available to Common Shareholders—Diluted |
15,994 | 31,346 | (49.0 | %) | ||||||||
|
|
|
|
|
|
|
|||||||
| Earnings Per Share, diluted |
$ | 0.55 | $ | 1.08 | (49.1 | %) | ||||||
|
|
|
|
|
|
|
|||||||
Table 5—IBERIABANK CORPORATION
CONDENSED CONSOLIDATED FINANCIAL INFORMATION
(dollars in thousands)
| June 30, | March 31, | |||||||||||||||||||
| LOANS |
2013 | 2012 | % Change | 2013 | % Change | |||||||||||||||
| Residential Mortgage Loans: |
518,496 | 418,789 | 23.8 | % | 478,617 | 8.3 | % | |||||||||||||
| Commercial Loans: |
||||||||||||||||||||
| Real Estate |
3,744,238 | 3,313,863 | 13.0 | % | 3,587,692 | 4.4 | % | |||||||||||||
| Business |
2,687,920 | 2,306,160 | 16.6 | % | 2,621,644 | 2.5 | % | |||||||||||||
|
|
|
|
|
|
|
|
|
|
|
|||||||||||
| Total Commercial Loans |
6,432,158 | 5,620,023 | 14.5 | % | 6,209,336 | 3.6 | % | |||||||||||||
| Consumer Loans: |
||||||||||||||||||||
| Indirect Automobile |
351,631 | 309,855 | 13.5 | % | 342,117 | 2.8 | % | |||||||||||||
| Home Equity |
1,278,823 | 1,159,899 | 10.3 | % | 1,261,171 | 1.4 | % | |||||||||||||
| Automobile |
76,427 | 49,411 | 54.7 | % | 66,240 | 15.4 | % | |||||||||||||
| Credit Card Loans |
53,026 | 46,519 | 14.0 | % | 51,642 | 2.7 | % | |||||||||||||
| Other |
192,476 | 132,016 | 45.8 | % | 185,852 | 3.6 | % | |||||||||||||
|
|
|
|
|
|
|
|
|
|
|
|||||||||||
| Total Consumer Loans |
1,952,383 | 1,697,700 | 15.0 | % | 1,907,022 | 2.4 | % | |||||||||||||
|
|
|
|
|
|
|
|
|
|
|
|||||||||||
| Total Loans |
8,903,037 | 7,736,512 | 15.1 | % | 8,594,975 | 3.6 | % | |||||||||||||
|
|
|
|
|
|||||||||||||||||
| Allowance for Loan Losses |
(162,903 | ) | (187,285 | ) | (189,725 | ) | ||||||||||||||
|
|
|
|
|
|
|
|||||||||||||||
| Loans, Net |
$ | 8,740,134 | $ | 7,549,227 | $ | 8,405,250 | ||||||||||||||
|
|
|
|
|
|
|
|||||||||||||||
| Reserve for Unfunded Commitments (1) |
(10,342 | ) | — | 100.0 | % | — | 100.0 | % | ||||||||||||
| Allowance for Credit Losses |
(173,246 | ) | (187,285 | ) | (7.5 | %) | (189,725 | ) | (8.7 | %) | ||||||||||
| June 30, | March 31, | |||||||||||||||||||
| ASSET QUALITY DATA (2) |
2013 | 2012 | % Change | 2013 | % Change | |||||||||||||||
| Nonaccrual Loans |
$ | 409,775 | $ | 625,938 | (34.5 | %) | $ | 463,075 | (11.5 | %) | ||||||||||
| Foreclosed Assets |
1,647 | 455 | 262.2 | % | 1,375 | 19.8 | % | |||||||||||||
| Other Real Estate Owned |
127,960 | 129,463 | (1.2 | %) | 130,461 | (1.9 | %) | |||||||||||||
| Accruing Loans More Than 90 Days Past Due |
4,126 | 8,270 | (50.1 | %) | 5,697 | (27.6 | %) | |||||||||||||
|
|
|
|
|
|
|
|
|
|
|
|||||||||||
| Total Nonperforming Assets |
$ | 543,508 | $ | 764,126 | (28.9 | %) | $ | 600,608 | (9.5 | %) | ||||||||||
|
|
|
|
|
|
|
|
|
|
|
|||||||||||
| Loans 30-89 Days Past Due |
$ | 35,204 | $ | 46,391 | (24.1 | %) | $ | 33,227 | 5.9 | % | ||||||||||
| Nonperforming Assets to Total Assets |
4.24 | % | 6.30 | % | (32.8 | %) | 4.63 | % | (8.5 | %) | ||||||||||
| Nonperforming Assets to Total Loans and OREO |
6.02 | % | 9.71 | % | (38.1 | %) | 6.87 | % | (12.4 | %) | ||||||||||
| Allowance for Loan Losses to Nonperforming Loans (3) |
39.4 | % | 29.5 | % | 33.3 | % | 40.6 | % | (2.9 | %) | ||||||||||
| Allowance for Loan Losses to Nonperforming Assets |
30.0 | % | 24.5 | % | 22.3 | % | 31.6 | % | (5.3 | %) | ||||||||||
| Allowance for Loan Losses to Total Loans |
1.83 | % | 2.42 | % | (24.4 | %) | 2.21 | % | (17.1 | %) | ||||||||||
| Allowance for Credit Losses to Nonperforming Loans (1) (3) |
41.9 | % | 29.5 | % | 41.7 | % | 40.6 | % | 3.2 | % | ||||||||||
| Allowance for Credit Losses to Nonperforming Assets (1) |
31.9 | % | 24.5 | % | 30.1 | % | 31.6 | % | 0.9 | % | ||||||||||
| Allowance for Credit Losses to Total Loans (1) |
1.95 | % | 2.42 | % | (19.6 | %) | 2.21 | % | (11.8 | %) | ||||||||||
| Year to Date Charge-offs |
$ | 4,375 | $ | 4,627 | (5.5 | %) | $ | 2,103 | N/M | |||||||||||
| Year to Date Recoveries |
(2,029 | ) | (1,815 | ) | 11.7 | % | (893 | ) | N/M | |||||||||||
|
|
|
|
|
|
|
|
|
|
|
|||||||||||
| Year to Date Net Charge-offs (Recoveries) |
$ | 2,346 | $ | 2,812 | (16.6 | %) | $ | 1,210 | N/M | |||||||||||
|
|
|
|
|
|
|
|
|
|
|
|||||||||||
| Quarter to Date Net Charge-offs (Recoveries) |
$ | 1,136 | $ | 1,118 | 1.7 | % | $ | 1,210 | (6.1 | %) | ||||||||||
|
|
|
|
|
|
|
|
|
|
|
|||||||||||
| Quarter to Date Net Charge-offs to Average Loans (Annualized) |
0.05 | % | 0.06 | % | (12.0 | %) | 0.06 | % | (9.3 | %) | ||||||||||
| (1) | During the second quarter of 2013, the Company segregated its allowance for credit losses into an allowance for loan losses and a reserve for unfunded commitments, which is included in other liabilities on its balance sheet. |
| (2) | For purposes of this table, nonperforming assets include all loans meeting nonperforming asset criteria, including assets acquired in FDIC-assisted transactions. |
| (3) | Nonperforming loans consist of nonaccruing loans and accruing loans 90 days or more past due. |
| N/M | - Comparison of the information presented is not meaningful given the periods presented. |
Table 6—IBERIABANK CORPORATION
CONDENSED CONSOLIDATED FINANCIAL INFORMATION
(dollars in thousands)
| June 30, | March 31, | |||||||||||||||||||
| LOANS (Ex-Covered Assets and Acquired Impaired Loans) (1) |
2013 | 2012 | % Change | 2013 | % Change | |||||||||||||||
| Residential Mortgage Loans: |
350,458 | 235,221 | 49.0 | % | 300,555 | 16.6 | % | |||||||||||||
| Commercial Loans: |
||||||||||||||||||||
| Real Estate |
3,184,515 | 2,626,391 | 21.3 | % | 2,970,535 | 7.2 | % | |||||||||||||
| Business |
2,615,495 | 2,179,919 | 20.0 | % | 2,531,272 | 3.3 | % | |||||||||||||
|
|
|
|
|
|
|
|
|
|
|
|||||||||||
| Total Commercial Loans |
5,800,010 | 4,806,310 | 20.7 | % | 5,501,807 | 5.4 | % | |||||||||||||
| Consumer Loans: |
||||||||||||||||||||
| Indirect Automobile |
351,586 | 309,757 | 13.5 | % | 342,067 | 2.8 | % | |||||||||||||
| Home Equity |
1,118,594 | 937,299 | 19.3 | % | 1,088,685 | 2.7 | % | |||||||||||||
| Automobile |
76,269 | 49,402 | 54.4 | % | 66,237 | 15.1 | % | |||||||||||||
| Credit Card Loans |
52,243 | 45,693 | 14.3 | % | 50,823 | 2.8 | % | |||||||||||||
| Other |
188,960 | 123,034 | 53.6 | % | 182,600 | 3.5 | % | |||||||||||||
|
|
|
|
|
|
|
|
|
|
|
|||||||||||
| Total Consumer Loans |
1,787,652 | 1,465,185 | 22.0 | % | 1,730,412 | 3.3 | % | |||||||||||||
|
|
|
|
|
|
|
|
|
|
|
|||||||||||
| Total Loans |
7,938,120 | 6,506,716 | 22.0 | % | 7,532,774 | 5.4 | % | |||||||||||||
|
|
|
|
|
|||||||||||||||||
| Allowance for Loan Losses |
(66,481 | ) | (79,999 | ) | (74,217 | ) | ||||||||||||||
|
|
|
|
|
|
|
|||||||||||||||
| Loans, Net |
$ | 7,871,639 | $ | 6,426,717 | $ | 7,458,557 | ||||||||||||||
|
|
|
|
|
|
|
|||||||||||||||
| Reserve for Unfunded Commitments (2) |
(10,342 | ) | — | 100.0 | % | — | 100.0 | % | ||||||||||||
| Allowance for Credit Losses |
(76,823 | ) | (79,999 | ) | (4.0 | %) | (74,217 | ) | 3.5 | % | ||||||||||
| ASSET QUALITY DATA (Ex-Covered Assets and Acquired Impaired Loans) (1) |
June 30, | March 31, | ||||||||||||||||||
| 2013 | 2012 | % Change | 2013 | % Change | ||||||||||||||||
| Nonaccrual Loans |
$ | 71,556 | $ | 66,545 | 7.5 | % | $ | 66,659 | 7.3 | % | ||||||||||
| Foreclosed Assets |
32 | — | 100.0 | % | 48 | (32.5 | %) | |||||||||||||
| Other Real Estate Owned |
25,861 | 18,681 | 38.4 | % | 26,467 | (2.3 | %) | |||||||||||||
| Accruing Loans More Than 90 Days Past Due |
2,118 | 1,275 | 66.2 | % | 2,827 | (25.1 | %) | |||||||||||||
|
|
|
|
|
|
|
|
|
|
|
|||||||||||
| Total Nonperforming Assets |
$ | 99,567 | $ | 86,501 | 15.1 | % | $ | 96,001 | 3.7 | % | ||||||||||
|
|
|
|
|
|
|
|
|
|
|
|||||||||||
| Loans 30-89 Days Past Due |
$ | 20,198 | $ | 16,833 | 20.0 | % | $ | 15,912 | 26.9 | % | ||||||||||
| Troubled Debt Restructurings (3) |
10,425 | 22,630 | (53.9 | %) | 18,508 | (43.7 | %) | |||||||||||||
| Current Troubled Debt Restructurings (4) |
1,813 | 669 | 171.0 | % | 2,124 | (14.6 | %) | |||||||||||||
| Nonperforming Assets to Total Assets |
0.86 | % | 0.84 | % | 2.9 | % | 0.83 | % | 3.8 | % | ||||||||||
| Nonperforming Assets to Total Loans and OREO |
1.25 | % | 1.33 | % | (5.7 | %) | 1.27 | % | (1.6 | %) | ||||||||||
| Allowance for Loan Losses to Nonperforming Loans (5) |
90.2 | % | 118.0 | % | (23.5 | %) | 106.8 | % | (15.5 | %) | ||||||||||
| Allowance for Loan Losses to Nonperforming Assets |
66.8 | % | 92.5 | % | (27.8 | %) | 77.3 | % | (13.6 | %) | ||||||||||
| Allowance for Loan Losses to Total Loans |
0.84 | % | 1.23 | % | (31.9 | %) | 0.99 | % | (15.0 | %) | ||||||||||
| Allowance for Credit Losses to Nonperforming Loans (2) (5) |
104.3 | % | 118.0 | % | (11.6 | %) | 106.8 | % | (2.4 | %) | ||||||||||
| Allowance for Credit Losses to Nonperforming Assets (2) (5) |
77.2 | % | 92.5 | % | (16.6 | %) | 77.3 | % | (0.2 | %) | ||||||||||
| Allowance for Credit Losses to Total Loans (2) (5) |
0.97 | % | 1.23 | % | (21.3 | %) | 0.99 | % | (1.8 | %) | ||||||||||
| Year to Date Charge-offs |
$ | 4,227 | $ | 4,237 | (0.2 | %) | $ | 2,063 | N/M | |||||||||||
| Year to Date Recoveries |
(2,028 | ) | (1,796 | ) | 13.0 | % | (893 | ) | N/M | |||||||||||
|
|
|
|
|
|
|
|
|
|
|
|||||||||||
| Year to Date Net Charge-offs (Recoveries) |
$ | 2,199 | $ | 2,441 | (9.9 | %) | $ | 1,170 | N/M | |||||||||||
|
|
|
|
|
|
|
|
|
|
|
|||||||||||
| Quarter to Date Net Charge-offs (Recoveries) |
$ | 1,029 | $ | 1,102 | (6.7 | %) | $ | 1,170 | (12.1 | %) | ||||||||||
|
|
|
|
|
|
|
|
|
|
|
|||||||||||
| Quarter to Date Net Charge-offs to Average Loans (Annualized) |
0.05 | % | 0.07 | % | (23.1 | %) | 0.06 | % | (16.4 | %) | ||||||||||
| (1) | For purposes of this table, nonperforming assets include all loans meeting nonperforming asset criteria, excluding assets acquired in FDIC-assisted transactions and acquired impaired loans. |
| (2) | During the second quarter of 2013, the Company segregated its allowance for credit losses into an allowance for loan losses and a reserve for unfunded commitments, which is included in other liabilities on its balance sheet. |
| (3) | Troubled debt restructurings meeting past due and nonaccruing criteria are included in loans past due and nonaccrual loans above. |
| (4) | Current troubled debt restructurings are defined as troubled debt restructurings not past due or on nonaccrual status for the respective periods. |
| (5) | Nonperforming loans consist of nonaccruing loans and accruing loans 90 days or more past due. |
N/M—Comparison of the information presented is not meaningful given the periods presented.
Table 7—Non-Covered and Net Covered Loan Portfolio Volumes And Yields ($ in Millions)
| 2Q 2012 | 3Q 2012 | 4Q 2012 | 1Q 2013 | 2Q 2013 | ||||||||||||||||||||||||||||||||||||
| Average Balance |
Yield | Average Balance |
Yield | Average Balance |
Yield | Average Balance |
Yield | Average Balance |
Yield | |||||||||||||||||||||||||||||||
| Non Covered Loans |
$ | 6,374 | 4.68 | % | $ | 6,863 | 4.55 | % | $ | 7,272 | 4.52 | % | $ | 7,504 | 4.44 | % | $ | 7,794 | 4.40 | % | ||||||||||||||||||||
| FDIC Covered Loans |
$ | 1,219 | 16.66 | % | $ | 1,154 | 18.88 | % | $ | 1,112 | 17.53 | % | $ | 1,039 | 16.05 | % | $ | 955 | 12.62 | % | ||||||||||||||||||||
|
|
|
|
|
|
|
|
|
|
|
|
|
|
|
|
|
|
|
|
|
|||||||||||||||||||||
| Covered Loans, net of Indemnification Asset Amortization |
$ | 1,727 | 7.44 | % | $ | 1,603 | 7.60 | % | $ | 1,523 | 7.68 | % | $ | 1,424 | 5.35 | % | $ | 1,223 | 5.11 | % | ||||||||||||||||||||
|
|
|
|
|
|
|
|
|
|
|
|
|
|
|
|
|
|
|
|
|
|||||||||||||||||||||
Table 8—IBERIABANK CORPORATION
CONDENSED CONSOLIDATED FINANCIAL INFORMATION
Taxable Equivalent Basis
(dollars in thousands)
| For The Quarter Ended | ||||||||||||||||||||||||||||
| June 30, 2013 | March 31, 2013 | June 30, 2012 | ||||||||||||||||||||||||||
| Interest | Average Balance |
Average Yield/Rate (%) |
Average Balance |
Average Yield/Rate (%) |
Average Balance |
Average Yield/Rate (%) |
||||||||||||||||||||||
| ASSETS |
||||||||||||||||||||||||||||
| Earning Assets: |
||||||||||||||||||||||||||||
| Loans Receivable: |
||||||||||||||||||||||||||||
| Mortgage Loans |
7,526 | $ | 494,531 | 6.09 | % | $ | 472,112 | 6.32 | % | $ | 446,189 | 7.42 | % | |||||||||||||||
| Commercial Loans (TE) (1) |
81,049 | 6,321,599 | 5.17 | % | 6,205,785 | 5.80 | % | 5,510,619 | 6.65 | % | ||||||||||||||||||
| Consumer and Other Loans |
26,667 | 1,932,346 | 5.54 | % | 1,865,641 | 5.91 | % | 1,635,869 | 6.25 | % | ||||||||||||||||||
|
|
|
|
|
|
|
|
|
|
|
|
|
|
|
|||||||||||||||
| Total Loans |
115,242 | 8,748,476 | 5.30 | % | 8,543,538 | 5.85 | % | 7,592,677 | 6.61 | % | ||||||||||||||||||
| Loss Share Receivable |
(18,130 | ) | 268,700 | -26.69 | % | 384,319 | -28.83 | % | 508,443 | -22.16 | % | |||||||||||||||||
|
|
|
|
|
|
|
|
|
|
|
|
|
|
|
|||||||||||||||
| Total Loans and Loss Share Receivable |
97,112 | 9,017,176 | 4.35 | % | 8,927,857 | 4.36 | % | 8,101,120 | 4.80 | % | ||||||||||||||||||
| Mortgage Loans Held for Sale |
1,351 | 170,620 | 3.17 | % | 178,387 | 2.97 | % | 135,273 | 3.64 | % | ||||||||||||||||||
| Investment Securities (TE) (1)(2) |
8,978 | 2,059,502 | 1.92 | % | 2,042,275 | 1.92 | % | 1,992,933 | 2.40 | % | ||||||||||||||||||
| Other Earning Assets |
736 | 338,668 | 0.87 | % | 678,917 | 0.52 | % | 348,267 | 0.84 | % | ||||||||||||||||||
|
|
|
|
|
|
|
|
|
|
|
|
|
|
|
|||||||||||||||
| Total Earning Assets |
108,177 | 11,585,966 | 3.80 | % | 11,827,436 | 3.70 | % | 10,577,593 | 4.20 | % | ||||||||||||||||||
| Allowance for Loan Losses |
(183,783 | ) | (245,384 | ) | (173,023 | ) | ||||||||||||||||||||||
| Nonearning Assets |
1,479,368 | 1,492,956 | 1,412,531 | |||||||||||||||||||||||||
|
|
|
|
|
|
|
|||||||||||||||||||||||
| Total Assets |
$ | 12,881,551 | $ | 13,075,008 | $ | 11,817,101 | ||||||||||||||||||||||
|
|
|
|
|
|
|
|||||||||||||||||||||||
| LIABILITIES AND SHAREHOLDERS’ EQUITY |
||||||||||||||||||||||||||||
| Interest-bearing liabilities |
||||||||||||||||||||||||||||
| Deposits: |
||||||||||||||||||||||||||||
| NOW Accounts |
1,983 | $ | 2,488,721 | 0.32 | % | $ | 2,464,922 | 0.32 | % | $ | 1,985,248 | 0.38 | % | |||||||||||||||
| Savings and Money Market Accounts |
2,705 | 4,113,671 | 0.26 | % | 4,170,123 | 0.35 | % | 3,524,641 | 0.48 | % | ||||||||||||||||||
| Certificates of Deposit |
4,372 | 2,025,823 | 0.87 | % | 2,130,948 | 0.89 | % | 2,313,176 | 1.14 | % | ||||||||||||||||||
|
|
|
|
|
|
|
|
|
|
|
|
|
|
|
|||||||||||||||
| Total Interest-bearing Deposits |
9,060 | 8,628,215 | 0.42 | % | 8,765,993 | 0.47 | % | 7,823,065 | 0.65 | % | ||||||||||||||||||
| Short-term Borrowings |
121 | 294,789 | 0.16 | % | 292,948 | 0.19 | % | 273,258 | 0.24 | % | ||||||||||||||||||
| Long-term Debt |
2,514 | 293,746 | 3.39 | % | 411,933 | 3.16 | % | 425,313 | 3.07 | % | ||||||||||||||||||
|
|
|
|
|
|
|
|
|
|
|
|
|
|
|
|||||||||||||||
| Total Interest-bearing Liabilities |
11,695 | 9,216,750 | 0.51 | % | 9,470,874 | 0.58 | % | 8,521,636 | 0.76 | % | ||||||||||||||||||
| Noninterest-bearing Demand Deposits |
2,010,263 | 1,937,890 | 1,640,327 | |||||||||||||||||||||||||
| Noninterest-bearing Liabilities |
125,932 | 135,176 | 151,036 | |||||||||||||||||||||||||
|
|
|
|
|
|
|
|||||||||||||||||||||||
| Total Liabilities |
11,352,945 | 11,543,940 | 10,312,999 | |||||||||||||||||||||||||
| Shareholders’ Equity |
1,528,606 | 1,531,068 | 1,504,102 | |||||||||||||||||||||||||
|
|
|
|
|
|
|
|||||||||||||||||||||||
| Total Liabilities and Shareholders’ Equity |
$ | 12,881,551 | $ | 13,075,008 | $ | 11,817,101 | ||||||||||||||||||||||
|
|
|
|
|
|
|
|||||||||||||||||||||||
| Net Interest Spread |
$ | 96,482 | 3.29 | % | $ | 92,871 | 3.12 | % | $ | 93,172 | 3.45 | % | ||||||||||||||||
| Tax-equivalent Benefit |
2,396 | 0.08 | % | 2,464 | 0.08 | % | 2,421 | 0.09 | % | |||||||||||||||||||
| Net Interest Income (TE) / Net Interest Margin (TE) (1) |
$ | 98,878 | 3.39 | % | $ | 95,335 | 3.23 | % | $ | 95,593 | 3.59 | % | ||||||||||||||||
| (1) | Fully taxable equivalent (TE) calculations include the tax benefit associated with related income sources that are tax-exempt using a marginal tax rate of 35%. |
| (2) | Balances exclude unrealized gain or loss on securities available for sale and impact of trade date accounting. |
Table 9—IBERIABANK CORPORATION
CONDENSED CONSOLIDATED FINANCIAL INFORMATION
Taxable Equivalent Basis
(dollars in thousands)
| For The Six Months Ended | ||||||||||||||||||||||||
| June 30, 2013 | June 30, 2012 | |||||||||||||||||||||||
| Interest | Average Balance |
Average Yield/Rate (%) |
Interest | Average Balance |
Average Yield/Rate (%) |
|||||||||||||||||||
| ASSETS |
||||||||||||||||||||||||
| Earning Assets: |
||||||||||||||||||||||||
| Loans Receivable: |
||||||||||||||||||||||||
| Mortgage Loans |
14,984 | $ | 483,383 | 6.20 | % | 16,737 | $ | 458,309 | 7.31 | % | ||||||||||||||
| Commercial Loans (TE) (1) |
169,485 | 6,264,012 | 5.48 | % | 182,281 | 5,436,569 | 6.73 | % | ||||||||||||||||
| Consumer and Other Loans |
53,839 | 1,899,178 | 5.72 | % | 49,791 | 1,592,055 | 6.29 | % | ||||||||||||||||
|
|
|
|
|
|
|
|
|
|
|
|
|
|||||||||||||
| Total Loans |
238,308 | 8,646,573 | 5.57 | % | 248,809 | 7,486,933 | 6.67 | % | ||||||||||||||||
| Loss Share Receivable |
(45,831 | ) | 326,190 | -27.95 | % | (56,411 | ) | 541,110 | -20.62 | % | ||||||||||||||
|
|
|
|
|
|
|
|
|
|
|
|
|
|||||||||||||
| Total Loans and Loss Share Receivable |
192,477 | 8,972,763 | 4.35 | % | 192,398 | 8,028,043 | 4.84 | % | ||||||||||||||||
| Mortgage Loans Held for Sale |
2,676 | 174,482 | 3.07 | % | 2,281 | 126,230 | 3.61 | % | ||||||||||||||||
| Investment Securities (TE) (1)(2) |
17,838 | 2,050,935 | 1.92 | % | 22,391 | 1,990,068 | 2.45 | % | ||||||||||||||||
| Other Earning Assets |
1,602 | 507,853 | 0.64 | % | 1,400 | 366,562 | 0.77 | % | ||||||||||||||||
|
|
|
|
|
|
|
|
|
|
|
|
|
|||||||||||||
| Total Earning Assets |
214,593 | 11,706,033 | 3.75 | % | 218,470 | 10,510,903 | 4.23 | % | ||||||||||||||||
| Allowance for Loan Losses |
(214,414 | ) | (179,487 | ) | ||||||||||||||||||||
| Nonearning Assets |
1,486,126 | 1,421,175 | ||||||||||||||||||||||
|
|
|
|
|
|||||||||||||||||||||
| Total Assets |
$ | 12,977,745 | $ | 11,752,591 | ||||||||||||||||||||
|
|
|
|
|
|||||||||||||||||||||
| LIABILITIES AND SHAREHOLDERS’ EQUITY |
||||||||||||||||||||||||
| Interest-bearing liabilities |
||||||||||||||||||||||||
| Deposits: |
||||||||||||||||||||||||
| NOW Accounts |
3,927 | $ | 2,476,888 | 0.32 | % | 3,799 | $ | 1,954,809 | 0.39 | % | ||||||||||||||
| Savings and Money Market Accounts |
6,261 | 4,141,741 | 0.30 | % | 8,585 | 3,502,857 | 0.49 | % | ||||||||||||||||
| Certificates of Deposit |
9,026 | 2,078,095 | 0.88 | % | 14,225 | 2,379,092 | 1.20 | % | ||||||||||||||||
|
|
|
|
|
|
|
|
|
|
|
|
|
|||||||||||||
| Total Interest-bearing Deposits |
19,214 | 8,696,724 | 0.45 | % | 26,609 | 7,836,758 | 0.68 | % | ||||||||||||||||
| Short-term Borrowings |
262 | 293,874 | 0.18 | % | 309 | 248,662 | 0.25 | % | ||||||||||||||||
| Long-term Debt |
5,763 | 352,513 | 3.25 | % | 6,518 | 430,822 | 2.99 | % | ||||||||||||||||
|
|
|
|
|
|
|
|
|
|
|
|
|
|||||||||||||
| Total Interest-bearing Liabilities |
25,239 | 9,343,111 | 0.54 | % | 33,436 | 8,516,242 | 0.79 | % | ||||||||||||||||
| Noninterest-bearing Demand Deposits |
1,974,276 | 1,585,416 | ||||||||||||||||||||||
| Noninterest-bearing Liabilities |
130,528 | 150,491 | ||||||||||||||||||||||
|
|
|
|
|
|||||||||||||||||||||
| Total Liabilities |
11,447,915 | 10,252,149 | ||||||||||||||||||||||
| Shareholders’ Equity |
1,529,830 | 1,500,442 | ||||||||||||||||||||||
|
|
|
|
|
|||||||||||||||||||||
| Total Liabilities and Shareholders’ Equity |
$ | 12,977,745 | $ | 11,752,591 | ||||||||||||||||||||
|
|
|
|
|
|||||||||||||||||||||
| Net Interest Spread |
$ | 189,354 | 3.20 | % | $ | 185,034 | 3.44 | % | ||||||||||||||||
| Tax-equivalent Benefit |
4,860 | 0.08 | % | 4,793 | 0.09 | % | ||||||||||||||||||
| Net Interest Income (TE) / Net Interest Margin (TE) (1) |
$ | 194,214 | 3.31 | % | $ | 189,827 | 3.59 | % | ||||||||||||||||
| (1) | Fully taxable equivalent (TE) calculations include the tax benefit associated with related income sources that are tax-exempt using a marginal tax rate of 35%. |
| (2) | Balances exclude unrealized gain or loss on securities available for sale and impact of trade date accounting. |
Table 10 - IBERIABANK CORPORATION
RECONCILIATION OF NON-GAAP FINANCIAL MEASURES
(dollars in thousands, except per share data)
| For The Quarter Ended | ||||||||||||
| June 30, 2013 | March 31, 2013 | June 30, 2012 | ||||||||||
| Net Interest Income (GAAP) |
$ | 96,482 | $ | 92,871 | $ | 93,172 | ||||||
| Effect of Tax Benefit on Interest Income |
2,396 | 2,464 | 2,421 | |||||||||
|
|
|
|
|
|
|
|||||||
| Net Interest Income (TE) (Non-GAAP) (1) |
98,878 | 95,335 | 95,593 | |||||||||
|
|
|
|
|
|
|
|||||||
| Noninterest Income (GAAP) |
42,489 | 44,491 | 41,694 | |||||||||
| Effect of Tax Benefit on Noninterest Income |
485 | 506 | 487 | |||||||||
|
|
|
|
|
|
|
|||||||
| Noninterest Income (TE) (Non-GAAP) (1) |
42,974 | 44,997 | 42,181 | |||||||||
|
|
|
|
|
|
|
|||||||
| Taxable Equivalent Revenues (Non-GAAP) (1) |
141,852 | 140,332 | 137,774 | |||||||||
|
|
|
|
|
|
|
|||||||
| Securities Losses (Gains) |
57 | (2,359 | ) | (901 | ) | |||||||
| Impact of New Accounting Standard |
4,967 | 5,453 | — | |||||||||
| Other noninterest income |
— | — | — | |||||||||
|
|
|
|
|
|
|
|||||||
| Taxable Equivalent Operating Revenues (Non-GAAP) (1) |
$ | 146,876 | $ | 143,426 | $ | 136,873 | ||||||
|
|
|
|
|
|
|
|||||||
| Total Noninterest Expense (GAAP) |
$ | 117,361 | $ | 144,898 | $ | 109,022 | ||||||
| Less Intangible Amortization Expense |
(1,181 | ) | (1,183 | ) | (1,289 | ) | ||||||
|
|
|
|
|
|
|
|||||||
| Tangible Noninterest Expense (Non-GAAP) (2) |
116,180 | 143,715 | 107,733 | |||||||||
|
|
|
|
|
|
|
|||||||
| Merger-related expenses |
— | 157 | 456 | |||||||||
| Severance expenses |
1,670 | 97 | 1,053 | |||||||||
| Occupancy expenses and branch closure expenses |
4,925 | 375 | 2,743 | |||||||||
| Impairment of indemnification asset |
— | 31,813 | — | |||||||||
| Debt prepayment |
— | 2,307 | — | |||||||||
| Termination of debit card rewards program |
450 | — | — | |||||||||
| Professional expenses and litigation settlements |
150 | — | 1,661 | |||||||||
|
|
|
|
|
|
|
|||||||
| Tangible Operating Noninterest Expense (Non-GAAP) (2) |
$ | 108,985 | $ | 108,966 | $ | 101,820 | ||||||
|
|
|
|
|
|
|
|||||||
| Return on Average Common Equity (GAAP) |
4.09 | % | 0.19 | % | 3.36 | % | ||||||
| Effect of Intangibles (2) |
1.87 | % | 0.36 | % | 1.50 | % | ||||||
| Effect of Non Operating Revenues and Expenses |
2.88 | % | 9.04 | % | 1.19 | % | ||||||
|
|
|
|
|
|
|
|||||||
| Operating Return on Average Tangible Common Equity (Non-GAAP) (2) |
8.85 | % | 9.59 | % | 6.05 | % | ||||||
|
|
|
|
|
|
|
|||||||
| Efficiency Ratio (GAAP) |
84.5 | % | 105.5 | % | 80.8 | % | ||||||
| Effect of Tax Benefit Related to Tax Exempt Income |
(1.8 | %) | (2.2 | %) | (1.7 | %) | ||||||
|
|
|
|
|
|
|
|||||||
| Efficiency Ratio (TE) (Non-GAAP) (1) |
82.7 | % | 103.3 | % | 79.1 | % | ||||||
| Effect of Amortization of Intangibles |
(0.8 | %) | (0.8 | %) | (0.9 | %) | ||||||
| Effect of Non-Operating Items and New Accounting Standard |
(7.7 | %) | (26.5 | %) | (3.8 | %) | ||||||
|
|
|
|
|
|
|
|||||||
| Tangible Operating Efficiency Ratio (TE)(Non-GAAP) (1) (2) |
74.2 | % | 76.0 | % | 74.4 | % | ||||||
|
|
|
|
|
|
|
|||||||
| (1) | Fully taxable equivalent (TE) calculations include the tax benefit associated with related income sources that are tax-exempt using a marginal tax rate of 35%. |
| (2) | Tangible calculations eliminate the effect of goodwill and acquisition related intangible assets and the corresponding amortization expense on a tax-effected basis where applicable. |
Table 11—IBERIABANK CORPORATION
RECONCILIATION OF NON-GAAP FINANCIAL MEASURES (1)
(dollars in thousands)
| For The Quarter Ended | ||||||||||||||||||||||||||||||||||||
| June 30, 2013 | March 31, 2013 | June 30, 2012 | ||||||||||||||||||||||||||||||||||
| Dollar Amount | Dollar Amount | Dollar Amount | ||||||||||||||||||||||||||||||||||
| Pre-tax | After-tax (2) | Per share |
Pre-tax | After-tax (2) | Per share |
Pre-tax | After-tax (2) | Per share |
||||||||||||||||||||||||||||
| Net Income (Loss) (GAAP) |
$ | 19,803 | $ | 15,590 | $ | 0.53 | $ | (4,159 | ) | $ | 717 | $ | 0.02 | $ | 16,949 | $ | 12,560 | $ | 0.43 | |||||||||||||||||
| Noninterest income adjustments |
||||||||||||||||||||||||||||||||||||
| Loss (Gain) on sale of investments |
57 | 37 | 0.00 | (2,359 | ) | (1,533 | ) | (0.05 | ) | (901 | ) | (586 | ) | (0.02 | ) | |||||||||||||||||||||
| Other noninterest income |
— | — | — | — | — | — | — | — | — | |||||||||||||||||||||||||||
| Noninterest expense adjustments |
||||||||||||||||||||||||||||||||||||
| Merger-related expenses |
— | — | — | 157 | 102 | 0.00 | 456 | 296 | 0.01 | |||||||||||||||||||||||||||
| Severance expenses |
1,670 | 1,086 | 0.04 | 97 | 63 | 0.00 | 1,053 | 685 | 0.02 | |||||||||||||||||||||||||||
| Impairment of indemnification asset |
— | — | — | 31,813 | 20,678 | 0.70 | — | — | — | |||||||||||||||||||||||||||
| Debt prepayment |
— | — | — | 2,307 | 1,500 | 0.05 | — | — | — | |||||||||||||||||||||||||||
| Occupancy expenses and branch closure expenses |
4,925 | 3,201 | 0.11 | 375 | 244 | 0.01 | 2,743 | 1,783 | 0.06 | |||||||||||||||||||||||||||
| Termination of debit card rewards program |
450 | 293 | 0.01 | — | — | — | — | — | — | |||||||||||||||||||||||||||
| Professional expenses and litigation settlements |
150 | 97 | 0.00 | — | — | — | 1,661 | 1,080 | 0.04 | |||||||||||||||||||||||||||
|
|
|
|
|
|
|
|
|
|
|
|
|
|
|
|
|
|
|
|||||||||||||||||||
| Operating earnings (Non-GAAP) (3) |
27,055 | 20,304 | 0.69 | 28,231 | 21,771 | 0.74 | 21,961 | 15,818 | 0.54 | |||||||||||||||||||||||||||
| Covered and acquired impaired (reversal of) provision for loan losses |
(1,537 | ) | (999 | ) | (0.03 | ) | 565 | 367 | 0.01 | 4,624 | 3,006 | 0.10 | ||||||||||||||||||||||||
| Other (reversal of) provision for loan losses |
3,344 | 2,174 | 0.07 | (3,941 | ) | (2,562 | ) | (0.09 | ) | 4,271 | 2,776 | 0.09 | ||||||||||||||||||||||||
|
|
|
|
|
|
|
|
|
|
|
|
|
|
|
|
|
|
|
|||||||||||||||||||
| Pre-provision operating earnings (Non-GAAP) (3) |
$ | 28,862 | $ | 21,479 | $ | 0.73 | $ | 24,855 | $ | 19,576 | $ | 0.66 | $ | 30,856 | $ | 21,600 | $ | 0.73 | ||||||||||||||||||
|
|
|
|
|
|
|
|
|
|
|
|
|
|
|
|
|
|
|
|||||||||||||||||||
| Net Income (Loss) (GAAP) |
$ | 19,803 | $ | 15,590 | $ | 0.53 | $ | (4,159 | ) | $ | 717 | $ | 0.02 | $ | 16,949 | $ | 12,560 | $ | 0.43 | |||||||||||||||||
| Impact of adoption of new accounting standard (4) |
4,967 | 3,228 | 0.11 | 5,453 | 3,544 | 0.12 | — | — | — | |||||||||||||||||||||||||||
|
|
|
|
|
|
|
|
|
|
|
|
|
|
|
|
|
|
|
|||||||||||||||||||
| Earnings less impact of new accounting standard (Non-GAAP) |
$ | 24,770 | $ | 18,818 | $ | 0.64 | $ | 1,294 | $ | 4,262 | $ | 0.14 | $ | 16,949 | $ | 12,560 | $ | 0.43 | ||||||||||||||||||
|
|
|
|
|
|
|
|
|
|
|
|
|
|
|
|
|
|
|
|||||||||||||||||||
| Operating earnings including the impact of the adoption of new accounting standard (Non-GAAP) |
$ | 27,055 | $ | 20,304 | $ | 0.69 | $ | 28,231 | $ | 21,771 | $ | 0.74 | $ | 21,961 | $ | 15,818 | $ | 0.54 | ||||||||||||||||||
| Impact of adoption of new accounting standard (4) |
4,967 | 3,228 | 0.11 | 5,453 | 3,544 | 0.12 | — | — | — | |||||||||||||||||||||||||||
|
|
|
|
|
|
|
|
|
|
|
|
|
|
|
|
|
|
|
|||||||||||||||||||
| Operating earnings less impact of new accounting standard (Non-GAAP) |
$ | 32,022 | $ | 23,532 | $ | 0.80 | $ | 33,684 | $ | 25,315 | $ | 0.86 | $ | 21,961 | $ | 15,818 | $ | 0.54 | ||||||||||||||||||
|
|
|
|
|
|
|
|
|
|
|
|
|
|
|
|
|
|
|
|||||||||||||||||||
| (1) | Per share amounts may not appear to foot due to rounding |
| (2) | After-tax amounts estimated based on a 35% marginal tax rate |
| (3) | Includes the impact of the adoption of ASU 2012-06 in the three-month periods ending June 30, 2013 and March 31, 2013 |
| (4) | Adjustments represent additonal amortization on the Company’s loss share receivable due to the adoption of ASU 2012-06 for the three month-periods ending June 30, 2013 and March 31, 2013. The amounts included above represents the incremental amortization as calculated using the yield on the covered portfolio for the three month period ending December 31, 2012. The Company expects the additional amortization (calculated on the same basis as the amount above) over the next four quarters to be as follows: |
| Quarter Ended |
Pre-tax Amount | After-tax Amount (2) | Per Share (5) | |||||||||
| 9/30/2013 |
$ | 5,085 | $ | 3,305 | $ | 0.11 | ||||||
| 12/31/2013 |
4,017 | 2,611 | 0.09 | |||||||||
| 3/31/2014 |
3,315 | 2,155 | 0.07 | |||||||||
| 6/30/2014 |
2,541 | 1,652 | 0.06 | |||||||||
| (5) | Per share amounts have been calculated using a sharecount that is consistent with the fully diluted sharecount for the quarter ended June 30, 2013 |