Exhibit 13
Exhibit 13
MANAGEMENT’S DISCUSSION AND ANALYSIS OF FINANCIAL CONDITION AND RESULTS OF OPERATIONS
The following discussion and analysis is intended to assist readers in understanding the consolidated financial condition and results of operations of
IBERIABANK Corporation and its wholly owned subsidiaries (collectively, the “Company”), as of December 31, 2012 and 2011 and for the years ended December 31, 2012 through 2010. This discussion should be read in conjunction with
the audited consolidated financial statements, accompanying footnotes and supplemental financial data included herein.
To the extent that
statements in this Report relate to future plans, objectives, financial results or performance of the Company, these statements are deemed to be forward-looking statements within the meaning of the Private Securities Litigation Reform Act of 1995.
Such statements, which are based on management’s current information, estimates and assumptions and the current economic environment, are generally identified by the use of the words “plan”, “believe”, “expect”,
“intend”, “anticipate”, “estimate”, “project” or similar expressions. The Company’s actual strategies and results in future periods may differ materially from those currently expected due to various risks
and uncertainties.
Factors that may cause actual results to differ materially from these forward-looking statements are discussed in the
Company’s Annual Report on Form 10-K and other filings with the Securities and Exchange Commission (the “SEC”), available at the SEC’s website, http://www.sec.gov, and the Company’s website,
http://www.iberiabank.com, under the heading “Investor Information.” All information in this discussion is as of the date of this Report. The Company undertakes no duty to update any forward-looking statement to conform the
statement to actual results or changes in the Company’s expectations.
Included in this discussion and analysis are descriptions of the
composition, performance, and credit quality of the Company’s loan portfolio. The Company has three descriptions of loans that are used to categorize the portfolio into its distinct risks and rewards to consolidated financial statements.
“Acquired loans” refer to all loans acquired in a business combination. Because of the loss protection provided by the FDIC, the risks of the loans and foreclosed real estate acquired in the CapitalSouth Bank (“CSB”), Orion Bank
(“Orion”), Century Bank (“Century”), and Sterling Bank (“Sterling”) acquisitions, which are covered by loss share agreements with the Federal Deposit Insurance Corporation (the “FDIC”), are significantly
different from those assets not similarly covered. Accordingly, the Company reports loans subject to the loss share agreements as “covered loans” in the information below and loans that are not subject to the loss share agreement as
“non-covered loans.” The subset of acquired loans that is not subject to loss share agreements are referred to as “non-covered acquired loans.” Loans that are neither subject to loss share agreements nor acquired in a business
combination are referred to as “legacy loans” or “organic loans.”
EXECUTIVE OVERVIEW
The Company offers commercial and retail banking products and services to customers in locations in six states through IBERIABANK. The Company also
operates mortgage production offices in 12 states through IBERIABANK’s subsidiary, IBERIABANK Mortgage Company (“IMC”), and offers a full line of title insurance and closing services throughout Arkansas and Louisiana through Lenders
Title Company (“LTC”) and its subsidiaries. IBERIA Capital Partners L.L.C. (“ICP”) provides equity research, institutional sales and trading, and corporate finance services. IB Aircraft Holdings, LLC owns a fractional share of an
aircraft used by management of the Company and its subsidiaries. IBERIA Asset Management Inc. (“IAM”) provides wealth management and trust services for commercial and private banking clients. IBERIA CDE, L.L.C. is engaged in the purchase
of tax credits. Selected financial and other data for the past five years is shown in the following tables.
TABLE 1—SELECTED CONSOLIDATED FINANCIAL AND OTHER
DATA(1)
|
|
|
|
|
|
|
|
|
|
|
|
|
|
|
|
|
|
|
|
|
| |
|
Years Ended December 31, |
|
| (Dollars in thousands, except per share data) |
|
2012 |
|
|
2011 |
|
|
2010 |
|
|
2009 |
|
|
2008 |
|
| Balance Sheet Data |
|
|
|
|
|
|
|
|
|
|
|
|
|
|
|
|
|
|
|
|
| Total assets |
|
$ |
13,129,678 |
|
|
$ |
11,757,928 |
|
|
$ |
10,026,766 |
|
|
$ |
9,695,955 |
|
|
$ |
5,583,226 |
|
| Cash and cash equivalents |
|
|
970,977 |
|
|
|
573,296 |
|
|
|
337,778 |
|
|
|
175,397 |
|
|
|
345,865 |
|
| Loans |
|
|
8,498,580 |
|
|
|
7,388,037 |
|
|
|
6,035,332 |
|
|
|
5,784,365 |
|
|
|
3,744,402 |
|
| Investment securities |
|
|
1,950,066 |
|
|
|
1,997,969 |
|
|
|
2,019,814 |
|
|
|
1,580,837 |
|
|
|
889,476 |
|
| Goodwill and other intangibles |
|
|
428,654 |
|
|
|
401,743 |
|
|
|
263,925 |
|
|
|
260,144 |
|
|
|
259,683 |
|
| Deposit accounts |
|
|
10,748,277 |
|
|
|
9,289,013 |
|
|
|
7,915,106 |
|
|
|
7,556,148 |
|
|
|
3,995,816 |
|
| Borrowings |
|
|
726,422 |
|
|
|
848,276 |
|
|
|
652,579 |
|
|
|
1,009,215 |
|
|
|
776,692 |
|
| Shareholders’ equity |
|
|
1,529,868 |
|
|
|
1,482,661 |
|
|
|
1,303,457 |
|
|
|
961,318 |
|
|
|
734,208 |
|
| Book value per share (2) |
|
$ |
51.88 |
|
|
$ |
50.48 |
|
|
$ |
48.50 |
|
|
$ |
46.38 |
|
|
$ |
40.53 |
|
| Tangible book value per share (2) (4) |
|
|
37.34 |
|
|
|
36.80 |
|
|
|
38.68 |
|
|
|
33.88 |
|
|
|
24.20 |
|
|
|
|
|
|
|
|
|
|
|
|
|
|
|
|
|
|
|
|
|
|
|
|
|
|
|
|
|
|
|
|
|
|
|
|
|
|
|
|
|
|
|
| |
|
Years Ended December 31, |
|
| (Dollars in thousands, except per share data) |
|
2012 |
|
|
2011 |
|
|
2010 |
|
|
2009 |
|
|
2008 |
|
| Income Statement Data |
|
|
|
|
|
|
|
|
|
|
|
|
|
|
|
|
|
|
|
|
| Interest income |
|
$ |
445,200 |
|
|
$ |
420,327 |
|
|
$ |
396,371 |
|
|
$ |
270,387 |
|
|
$ |
263,827 |
|
| Interest expense |
|
|
63,450 |
|
|
|
82,069 |
|
|
|
114,744 |
|
|
|
97,602 |
|
|
|
126,183 |
|
|
|
|
|
|
|
|
|
|
|
|
|
|
|
|
|
|
|
|
|
|
| Net interest income |
|
|
381,750 |
|
|
|
338,258 |
|
|
|
281,627 |
|
|
|
172,785 |
|
|
|
137,644 |
|
| Provision for credit losses |
|
|
20,671 |
|
|
|
25,867 |
|
|
|
42,451 |
|
|
|
45,370 |
|
|
|
12,568 |
|
|
|
|
|
|
|
|
|
|
|
|
|
|
|
|
|
|
|
|
|
|
| Net interest income after provision for credit losses |
|
|
361,079 |
|
|
|
312,391 |
|
|
|
239,176 |
|
|
|
127,415 |
|
|
|
125,076 |
|
| Noninterest income |
|
|
175,997 |
|
|
|
131,859 |
|
|
|
133,890 |
|
|
|
344,537 |
|
|
|
91,932 |
|
| Noninterest expense |
|
|
432,185 |
|
|
|
373,731 |
|
|
|
304,249 |
|
|
|
223,260 |
|
|
|
161,226 |
|
|
|
|
|
|
|
|
|
|
|
|
|
|
|
|
|
|
|
|
|
|
| Income before income taxes |
|
|
104,891 |
|
|
|
70,519 |
|
|
|
68,817 |
|
|
|
248,692 |
|
|
|
55,782 |
|
| Income taxes |
|
|
28,496 |
|
|
|
16,981 |
|
|
|
19,991 |
|
|
|
90,338 |
|
|
|
15,870 |
|
|
|
|
|
|
|
|
|
|
|
|
|
|
|
|
|
|
|
|
|
|
| Net income |
|
|
76,395 |
|
|
|
53,538 |
|
|
|
48,826 |
|
|
|
158,354 |
|
|
|
39,912 |
|
| Earnings per share – basic |
|
$ |
2.59 |
|
|
$ |
1.88 |
|
|
$ |
1.90 |
|
|
$ |
8.49 |
|
|
$ |
3.04 |
|
| Earnings per share – diluted |
|
|
2.59 |
|
|
|
1.87 |
|
|
|
1.88 |
|
|
|
8.41 |
|
|
|
2.97 |
|
| Cash earnings per share – diluted |
|
|
2.70 |
|
|
|
1.98 |
|
|
|
2.01 |
|
|
|
8.52 |
|
|
|
3.09 |
|
| Cash dividends per share |
|
|
1.36 |
|
|
|
1.36 |
|
|
|
1.36 |
|
|
|
1.36 |
|
|
|
1.36 |
|
|
|
|
|
|
|
|
|
|
|
|
|
|
|
|
|
|
|
|
|
|
|
|
|
|
|
|
|
|
|
|
|
|
|
|
|
|
|
|
|
|
|
| |
|
At or For the Years Ended December 31, |
|
| |
|
2012 |
|
|
2011 |
|
|
2010 |
|
|
2009 |
|
|
2008 |
|
| Key Ratios (3) |
|
|
|
|
|
|
|
|
|
|
|
|
|
|
|
|
|
|
|
|
| Return on average assets |
|
|
0.63 |
% |
|
|
0.49 |
% |
|
|
0.47 |
% |
|
|
2.48 |
% |
|
|
0.77 |
% |
| Return on average common equity |
|
|
5.05 |
|
|
|
3.77 |
|
|
|
3.91 |
|
|
|
20.08 |
|
|
|
7.59 |
|
| Return on average tangible common equity (4) |
|
|
7.21 |
|
|
|
5.30 |
|
|
|
5.27 |
|
|
|
30.66 |
|
|
|
15.64 |
|
| Equity to assets at end of period |
|
|
11.65 |
|
|
|
12.61 |
|
|
|
13.00 |
|
|
|
9.91 |
|
|
|
13.15 |
|
| Earning assets to interest-bearing liabilities |
|
|
127.62 |
|
|
|
121.74 |
|
|
|
119.27 |
|
|
|
118.34 |
|
|
|
113.14 |
|
| Interest rate spread (5) |
|
|
3.43 |
|
|
|
3.34 |
|
|
|
2.84 |
|
|
|
2.78 |
|
|
|
2.67 |
|
| Net interest margin (TE) (5) (6) |
|
|
3.58 |
|
|
|
3.51 |
|
|
|
3.05 |
|
|
|
3.09 |
|
|
|
3.03 |
|
| Noninterest expense to average assets |
|
|
3.57 |
|
|
|
3.43 |
|
|
|
2.95 |
|
|
|
3.49 |
|
|
|
3.10 |
|
| Efficiency ratio (7) |
|
|
77.49 |
|
|
|
79.50 |
|
|
|
73.22 |
|
|
|
43.16 |
|
|
|
70.23 |
|
| Tangible efficiency ratio (TE) (6) (7) |
|
|
74.91 |
|
|
|
76.71 |
|
|
|
70.43 |
|
|
|
41.96 |
|
|
|
67.27 |
|
| Common stock dividend payout ratio |
|
|
52.50 |
|
|
|
73.61 |
|
|
|
74.75 |
|
|
|
16.13 |
|
|
|
46.98 |
|
| Asset Quality Data |
|
|
|
|
|
|
|
|
|
|
|
|
|
|
|
|
|
|
|
|
| Nonperforming assets to total assets at end of period (8) |
|
|
0.69 |
% |
|
|
0.86 |
% |
|
|
0.91 |
% |
|
|
0.91 |
% |
|
|
0.83 |
% |
| Allowance for credit losses to nonperforming loans at end of period (8) |
|
|
150.57 |
|
|
|
132.98 |
|
|
|
122.59 |
|
|
|
124.14 |
|
|
|
134.87 |
|
| Allowance for credit losses to total loans at end of period |
|
|
1.10 |
|
|
|
1.40 |
|
|
|
1.40 |
|
|
|
1.36 |
|
|
|
1.09 |
|
| Consolidated Capital Ratios |
|
|
|
|
|
|
|
|
|
|
|
|
|
|
|
|
|
|
|
|
| Tier 1 leverage capital ratio |
|
|
9.70 |
% |
|
|
10.45 |
% |
|
|
11.24 |
% |
|
|
9.99 |
% |
|
|
11.27 |
% |
| Tier 1 risk-based capital ratio |
|
|
12.92 |
|
|
|
14.94 |
|
|
|
18.48 |
|
|
|
13.34 |
|
|
|
14.07 |
|
| Total risk-based capital ratio |
|
|
14.19 |
|
|
|
16.20 |
|
|
|
19.74 |
|
|
|
14.71 |
|
|
|
15.69 |
|
|
|
|
|
|
|
|
|
|
|
|
|
|
|
|
|
|
|
|
|
|
| (1) |
2009 Balance Sheet, Income Statement, and Asset Quality Data, as well as Key Ratios and Capital Ratios, are impacted by the Company’s acquisitions of CSB on
August 21, 2009 and Orion and Century on November 13, 2009. 2010 Balance Sheet, Income Statement, and Asset Quality Data, as well as Key Ratios and Capital Ratios, are impacted by the Company’s acquisitions of Sterling on
July 23, 2010. 2011 Balance Sheet, Income Statement, and Asset Quality Data, as well as Key Ratios and Capital Ratios, are impacted by the Company’s acquisitions of OMNI Bancshares, Inc. (“OMNI”) and Cameron Bancshares, Inc.
(“Cameron”) on May 31, 2011 and Florida Trust Company (“FTC”) on June 14, 2011. 2012 Balance Sheet, Income Statement, and Asset Quality Data, as well as Key Ratios and Capital Ratios, are impacted by the Company’s
acquisition of Florida Gulf Bancorp, Inc. (“Florida Gulf”) on July 31, 2012. |
| (2) |
Shares used for book value purposes are net of shares held in treasury at the end of the period. |
| (3) |
With the exception of end-of-period ratios, all ratios are based on average daily balances during the respective periods. |
| (4) |
Tangible calculations eliminate the effect of goodwill and acquisition related intangible assets and the corresponding amortization expense on a tax-effected basis
where applicable. |
| (5) |
Interest rate spread represents the difference between the weighted average yield on earning assets and the weighted average cost of interest-bearing liabilities. Net
interest margin represents net interest income as a percentage of average earning assets. |
| (6) |
Fully taxable equivalent (TE) calculations include the tax benefit associated with related income sources that are tax-exempt using a marginal tax rate of 35%.
|
| (7) |
The efficiency ratio represents noninterest expense as a percentage of total revenues. Total revenues are the sum of net interest income and noninterest income.
|
| (8) |
Nonperforming loans consist of nonaccruing loans and loans 90 days or more past due. Nonperforming assets consist of nonperforming loans and repossessed assets.
|
The Company’s focus is that of a high performing institution. Management believes that improvement in
core earnings drives shareholder value, and the Company has adopted a mission statement that is designed to provide guidance for our management, associates and Board of Directors regarding the sense of purpose and direction of the Company. We are
shareholder- and client-focused, expect high performance from our associates, believe in a strong sense of community and strive to make the Company a great place to work.
During 2012, the Company continued to execute its business model successfully, as evidenced by solid organic loan and deposit growth during the year, despite the challenges of the current operating
environment, which include enhanced regulatory scrutiny and continued interest rate pressure. The Company also continued to develop its noninterest revenue streams, particularly from its wealth management and mortgage production subsidiaries. The
Company believes it remains well positioned for future growth opportunities, as evidenced by the strength in its liquidity, core funding, and capitalization levels.
In the past year, the Company continued to experience substantial growth in both income statement and balance sheet metrics. These areas of growth were driven by investments in markets and business lines.
For the year ended December 31, 2012 these investments contributed to net interest income growth of $43.5 million to $381.8 million and noninterest income growth of $44.1 million to $176.0 million. Legacy loans grew by $1.4 billion, or 26.1%
during 2012 to $6.7 billion at December 31, 2012 and total deposits grew by $1.5 billion, or 15.7%, to $10.7 billion for and as of the same periods, while acquired loans decreased by $45.8 million. The mix of deposits shifted significantly to
noninterest-bearing, which represented 18.3% of total deposits as of December 31, 2012, up from 16.0% from the prior year end. Throughout 2012, the Company’s liquidity, both on balance sheet and off balance sheet, continued to be
favorable, exhibited by liquidity ratios that exceeded peer levels. The Company’s cash position continued to grow in 2012, and the Company has funding availability from the Federal Home Loan Bank (the “FHLB”) and correspondent bank
lines to continue to meet cash flow needs. Additionally, its capital ratios were considerably in excess of “well capitalized” from a regulatory perspective and above peer levels, and its primary risk measures remained favorable. All of
these factors allowed the Company to maintain its strategic positioning within the challenging banking environment and provided a strong base from which to continue to grow its balance sheet and remain positioned to provide anticipated increases in
shareholder value in 2013.
During 2012, the Company’s mortgage origination and title businesses delivered record years for the Company,
and helped to drive noninterest income growth over 2011. Specifically, mortgage origination volume and an improved margin on the sales of these loans led to a 72.8% increase in mortgage income over the previous year. Title income was $2.9 million,
or 16.3%, higher than in 2011. The Company’s trust and wealth management businesses also began to see the Company’s investment in these businesses pay off, as broker commissions increased 31.5% over 2011.
During the past year, noninterest income increased as the Company began realizing better returns on its investments as compared to prior years.
Noninterest expense also increased. On a basis consistent with generally accepted accounting principles (“GAAP”), noninterest expense was $432.2 million for the year ended December 31, 2012, an increase of $58.5 million versus the
prior year. Noninterest expense, excluding non-operating items (“non-GAAP”, see table 4 below) was $418.2 million for the same period, which represented an increase of $65.8 million versus the prior year. The increase in operating
noninterest expense was a result of higher employee-related expenses as the Company increased headcount during 2012, both from the Florida Gulf acquisition and from strategic hires to continue growing its business lines. Noninterest expense was also
driven higher in 2012 by the full weight of the OMNI and Cameron acquisitions, as well as five months of expenses from the branches acquired from Florida Gulf. On a GAAP basis, noninterest expense increased due to the factors contributing to the
increase in non-GAAP noninterest expense, but was offset by a reduction in merger-related expenses of $10.9 million. The reduction in merger-related expenses was a result of an improvement in the efficiency of merger-related activity, including
system conversion costs, but was also the result of one less acquisition than in 2011.
The provision for credit losses decreased $5.2 million
due to an improvement in asset quality in the legacy portfolio over the past 12 months, but was partially offset by additional expected losses in the acquired loan and covered loan portfolios.
All of these factors led net income available to common shareholders for the year ended December 31, 2012 to increase $22.9 million to $76.4 million
or $2.59 per diluted share. Pre-provision operating earnings (non-GAAP) increased $13.1 million to $95.1 million or $3.19 on a per share basis.
During 2011, the Company grew its balance sheet and increased its overall capital position through acquisitions, the opening of new branch locations, and
organic growth at many of the Company’s existing branches. The Company completed the OMNI and Cameron acquisitions on May 31, 2011 and the FTC asset acquisition on June 14, 2011. In addition, the Company increased its small business
lending efforts with the addition of personnel experienced in successfully developing and implementing credit programs focused on
small businesses. The Company also diversified its revenue stream through expansion of its fee-based businesses, primarily IMC, LTC, and ICP.
Acquisition Activity during 2012
Over
the past 13 years, the Company’s growth has included growth from targeted acquisitions the Company determined would provide additional shareholder value to existing shareholders and be a strong strategic fit with the Company.
During the third quarter of 2012, the Company completed the acquisition of Florida Gulf, the holding company of Florida Gulf Bank, headquartered in Fort
Myers, Florida. The acquisition expanded the Company’s presence in southwest Florida. The acquisition was consummated after the close of business on July 31, 2012.
A summary of the major categories of assets acquired and liabilities assumed (all recorded at fair value at the time of acquisition), as well as the goodwill created, in the Florida Gulf acquisition is
shown in the following table.
TABLE 2—SUMMARY OF FLORIDA GULF ACQUISITION
|
|
|
|
|
| (Dollars in thousands) |
|
|
|
| Assets |
|
|
|
|
| Cash |
|
$ |
37,050 |
|
| Investment securities |
|
|
56,841 |
|
| Loans |
|
|
215,751 |
|
| Other real estate owned |
|
|
554 |
|
| Core deposit intangible |
|
|
— |
|
| Goodwill |
|
|
32,420 |
|
| Other assets |
|
|
29,470 |
|
|
|
|
|
|
| Total Assets |
|
$ |
372,086 |
|
| Liabilities |
|
|
|
|
| Interest-bearing deposits |
|
$ |
228,455 |
|
| Noninterest-bearing deposits |
|
|
57,578 |
|
| Borrowings |
|
|
40,227 |
|
| Other liabilities |
|
|
487 |
|
|
|
|
|
|
| Total Liabilities |
|
$ |
326,747 |
|
|
|
|
|
|
As part of the Florida Gulf acquisition, the Company issued 754,334 shares of its common stock during the third quarter
of 2012, resulting in additional equity of $37.2 million. Other equity consideration included the issuance of stock options to purchase 32,863 shares of the Company’s common stock for a fair value of $0.7 million. Non-equity consideration
included in the acquisition totaled $7.5 million, which included cash paid for fractional shares, severance payments under change in control agreements, and contingent consideration. Of the $7.5 million, $4.6 million was paid in cash during the
year, with the difference recorded as an adjustment to net assets acquired. See Note 4 to the consolidated financial statements for additional information on the acquisitions.
Other Acquisition Activity
In addition to the Florida Gulf acquisition completed during 2012, the Company has been an active acquirer over the previous nine years. From 2003 through 2011, the Company completed the following
acquisitions, presented with intangible assets created and selected assets and liabilities acquired for each acquisition:
TABLE 3—SUMMARY OF ACQUISITION ACTIVITY FROM 2003 TO 2011
|
|
|
|
|
|
|
|
|
|
|
|
|
|
|
|
|
|
|
|
|
|
|
|
|
| |
|
|
|
|
|
|
|
|
|
|
|
|
|
|
|
|
|
|
| (Dollars in millions)
Acquisition |
|
Acquisition
Date |
|
|
Total
Assets
Acquired |
|
|
Total
Loans
Acquired |
|
|
Total
Deposits
Acquired |
|
|
Goodwill |
|
|
Other
Intangible
Assets |
|
| Acadiana Bancshares, Inc. |
|
|
2003 |
|
|
$ |
308.1 |
|
|
$ |
189.6 |
|
|
$ |
210.0 |
|
|
$ |
24.1 |
|
|
$ |
4.4 |
|
| Alliance Bank of Baton Rouge |
|
|
2004 |
|
|
|
71.7 |
|
|
|
53.1 |
|
|
|
61.8 |
|
|
|
5.2 |
|
|
|
1.2 |
|
| American Horizons Bancorp, Inc. |
|
|
2005 |
|
|
|
243.8 |
|
|
|
194.7 |
|
|
|
192.7 |
|
|
|
28.1 |
|
|
|
5.0 |
|
| Pulaski Investment Corporation |
|
|
2007 |
|
|
|
477.2 |
|
|
|
367.7 |
|
|
|
422.6 |
|
|
|
92.4 |
|
|
|
10.9 |
|
| Pocahontas Bancorp, Inc. |
|
|
2007 |
|
|
|
700.2 |
|
|
|
409.9 |
|
|
|
582.4 |
|
|
|
42.0 |
|
|
|
7.0 |
|
| United Title of Louisiana, Inc. |
|
|
2007 |
|
|
|
0.4 |
|
|
|
— |
|
|
|
— |
|
|
|
4.2 |
|
|
|
1.2 |
|
| Kingdom Capital Management, Inc. |
|
|
2008 |
|
|
|
0.7 |
|
|
|
— |
|
|
|
— |
|
|
|
0.6 |
|
|
|
— |
|
| American Abstract and Title Company |
|
|
2008 |
|
|
|
5.1 |
|
|
|
— |
|
|
|
— |
|
|
|
5.0 |
|
|
|
— |
|
| ANB Financial, N.A. |
|
|
2008 |
|
|
|
239.9 |
|
|
|
1.9 |
|
|
|
189.7 |
|
|
|
— |
|
|
|
1.9 |
|
| CapitalSouth Bank |
|
|
2009 |
|
|
|
610.7 |
|
|
|
363.1 |
|
|
|
517.9 |
|
|
|
— |
|
|
|
0.4 |
|
| Orion Bank |
|
|
2009 |
|
|
|
2,377.3 |
|
|
|
961.1 |
|
|
|
1,883.1 |
|
|
|
— |
|
|
|
10.4 |
|
| Century Bank, FSB |
|
|
2009 |
|
|
|
812.0 |
|
|
|
417.6 |
|
|
|
615.8 |
|
|
|
— |
|
|
|
2.2 |
|
| Sterling Bank |
|
|
2010 |
|
|
|
314.2 |
|
|
|
151.3 |
|
|
|
287.0 |
|
|
|
7.1 |
|
|
|
1.6 |
|
| OMNI BANCSHARES, Inc. |
|
|
2011 |
|
|
|
745.3 |
|
|
|
441.4 |
|
|
|
635.6 |
|
|
|
63.8 |
|
|
|
0.8 |
|
| Cameron Bancshares, Inc. |
|
|
2011 |
|
|
|
761.6 |
|
|
|
382.1 |
|
|
|
567.3 |
|
|
|
71.4 |
|
|
|
5.2 |
|
| Florida Trust Company |
|
|
2011 |
|
|
|
1.4 |
|
|
|
— |
|
|
|
— |
|
|
|
0.1 |
|
|
|
1.3 |
|
|
|
|
|
|
|
|
|
|
|
|
|
|
|
|
|
|
|
|
|
|
|
|
|
|
| Total Acquisitions, 2003-2011 |
|
|
|
|
|
$ |
7,669.6 |
|
|
$ |
3,933.5 |
|
|
$ |
6,165.9 |
|
|
$ |
344.0 |
|
|
$ |
53.5 |
|
|
|
|
|
|
|
|
|
|
|
|
|
|
|
|
|
|
|
|
|
|
|
|
|
|
Balance Sheet Position and Results of Operations
During 2012, the Company’s income available to common shareholders totaled $76.4 million, or $2.59 per share on a diluted basis, a 42.7% increase compared to the $53.5 million earned in 2011. On a
per share basis, this represents an increase of 38.5% from the $1.87 per diluted share earned in 2011. On an operating basis (non-GAAP), per share earnings increased $0.47 to $2.74 in 2012. Primary drivers of the increase in earnings over the prior
year include the earnings from the net assets acquired from Florida Gulf and a decrease in merger-related noninterest expenses. Key components of the Company’s 2012 performance are summarized below.
| |
• |
|
Total assets at December 31, 2012 were $13.1 billion, up $1.4 million, or 11.7%, from December 31, 2011. The increase was primarily the
result of the Florida Gulf acquisition, which added $372.1 million in assets. Excluding the acquired assets, growth in the Company’s loan portfolio was a result of organic growth in many of the Company’s markets. The Company’s balance
sheet growth was affected by a decrease in both the Company’s loan portfolio covered by FDIC reimbursement agreements and the related receipt of funds from the FDIC. |
| |
• |
|
Total loans at December 31, 2012 were $8.5 billion, an increase of $1.1 billion, or 15.0%, from $7.4 billion at December 31, 2011. Loan
growth during 2012 was driven by an increase in non-covered loans. Total non-covered loans increased $1.4 billion, or 22.3%, during 2012. $215.8 million, or 16.0%, of that growth was from the Florida Gulf acquisition. Covered loans decreased $241.7
million, or 18.1%, from December 31, 2011, as covered loans were paid down or charged off and submitted for reimbursement. |
| |
• |
|
Total customer deposits increased $1.5 billion, or 15.7%, from $9.3 billion at December 31, 2011 to $10.7 billion at December 31, 2012. By
product type, the Company’s noninterest-bearing deposits increased $482.6 million, or 32.5%, while interest-bearing deposits increased $976.7 million, or 12.5%. Acquired deposits from Florida Gulf accounted for 19.6% of the total growth. The
increase in the Company’s interest-bearing demand deposits was partially offset by the decrease in time deposits of 15.4% from December 31, 2011. The decline in time deposits is the result of the Company’s effort to prudently manage
the profitability of the deposit base with liquidity needs. Although deposit competition remained intense throughout 2012, the Company was able to generate strong growth across its many other deposit products. Organic deposit growth was driven by
growth in the Company’s Houston, Texas, New Orleans, Louisiana, Lafayette, Louisiana, and Baton Rouge, Louisiana markets. |
| |
• |
|
Shareholders’ equity increased $47.2 million, or 3.2%, to $1.5 billion at December 31, 2012. The increase was the result of net income of
$76.4 million and additional common stock issued in the Florida Gulf acquisition of $39.2 million. Growth in shareholders’ equity was offset partially by $40.1 million in dividends paid on the Company’s common stock during the period and
treasury share repurchases of $40.4 million. |
| |
• |
|
Net interest income increased $43.5 million, or 12.9%, in 2012 when compared to 2011. This increase was attributable to a $24.9 million increase in
interest income and an $18.6 million, or 22.7%, decrease in interest expense. Interest income was positively affected by a $1.1 billion increase in average earning assets, due to both the inclusion of Florida Gulf earning assets in the current year
and the organic growth in loans since December 2011. The increase in income due to growth in the Company’s earning asset base was offset by a 19 basis point decline in the yield earned on these assets. Compared to 2011, the Company’s net
interest margin ratio on a tax-equivalent basis increased to 3.58% from 3.51% due to changes in the volume and mix of the Company’s assets and liabilities and rate decreases driven by federal funds, Treasury, and other Company borrowing rate
decreases during 2012. |
| |
• |
|
Noninterest income increased $44.1 million, or 33.5%, in 2012 when compared to the same 2011 period. The increase was primarily driven by a $32.9
million increase in mortgage income. Increases of $2.9 million in title insurance income and $3.2 million in broker commissions also contributed to the total increase from 2011. |
| |
• |
|
Additional expenses incurred due to the expanded size of the Company drove the increase in noninterest expenses in 2012 over 2011. Noninterest expense
in 2012 was also higher as a result of various projects designed to enhance the Company’s operational efficiency and improve profitability that led to elevated levels of professional fees. Noninterest expense increased $58.5 million, or 15.6%,
when compared to 2011. The increase in total noninterest expense was attributable to higher salary and employee benefit costs of $40.0 million, as well as increased occupancy, equipment, and other branch expenses resulting from the Company’s
expanded footprint. In addition to personnel and other costs related to the expanding size of the Company, noninterest expenses were driven higher in 2012 by professional services expenses, as well as increased data processing expenses as the
Company expands its business operations. |
| |
• |
|
During the second, third, and fourth quarters of 2012, the Company incurred costs associated with the acquisition of Florida Gulf, conversions, branch
closures, severance, and process improvements that affected the Company’s net income and per-share earnings for the year ended December 31, 2012. The Company incurred these costs to improve its long-term operating efficiency, risk-adjusted
profitability, and long-term growth prospects. The Company also announced plans to consolidate and enhance underperforming branches, elevate sales effectiveness and improve efficiency. The total cost of these initiatives affected total noninterest
expense and is discussed in further detail in the “Noninterest expense” section below. |
| |
• |
|
The Company recorded a provision for credit losses of $20.7 million during 2012, 20.1% lower than the $25.9 million provision recorded in 2011. The
provision in 2012 was primarily the result of loan growth from December 31, 2011 and provisions recorded on the Company’s covered and acquired loan portfolios, as the Company had legacy net charge-offs of only $4.5 million during 2012. The
improvement in asset quality from December 31, 2011 has offset the need for a higher allowance for credit losses as a result of loan growth in 2012. As of December 31, 2012, the allowance for credit losses as a percent of total loans was
2.96%, compared to 2.62% at December 31, 2011. |
| |
• |
|
The Company paid a quarterly cash dividend of $0.34 per common share in each quarter of 2012, consistent with the dividends paid in 2011. The
Company’s dividend payout ratio to common shareholders was 52.5% and 73.6% for the years ended December 31, 2012 and 2011, respectively. |
This discussion and analysis contains financial information determined by methods other than in accordance
with GAAP. The Company’s management uses these non-GAAP financial measures in their analysis of the Company’s performance. These measures typically adjust GAAP performance measures to exclude the effects of the amortization of intangibles
and include the tax benefit associated with revenue items that are tax-exempt, as well as adjust income available to common shareholders for certain significant activities or transactions that, in management’s opinion, distort period-to-period
comparisons of the Company’s performance. Since the presentation of these GAAP performance measures and their impact differ between companies, management believes presentations of these non-GAAP financial measures provide useful supplemental
information that is essential to a proper understanding of the operating results of the Company’s core businesses. These non-GAAP disclosures should not be viewed as a substitute for operating results determined in accordance with GAAP, nor are
they necessarily comparable to non-GAAP performance measures that may be presented by other companies. Reconciliations of GAAP to non-GAAP disclosures are included in the table below.
TABLE 4—RECONCILIATION OF NON-GAAP FINANCIAL MEASURES
|
|
|
|
|
|
|
|
|
|
|
|
|
|
|
|
|
|
|
|
|
|
|
|
|
|
|
|
|
|
|
|
|
|
|
|
|
| |
|
2012 |
|
|
2011 |
|
|
2010 |
|
| |
|
Dollar Amount |
|
|
|
|
|
Dollar Amount |
|
|
|
|
|
Dollar Amount |
|
|
|
|
| (In thousands, except
per share amounts) |
|
Pre-tax |
|
|
After-tax |
|
|
Per
share
(1) |
|
|
Pre-tax |
|
|
After-tax |
|
|
Per
share
(1) |
|
|
Pre-tax |
|
|
After-tax |
|
|
Per
share
(1) |
|
| Net income (GAAP) |
|
$ |
104,891 |
|
|
$ |
76,395 |
|
|
$ |
2.59 |
|
|
$ |
70,519 |
|
|
$ |
53,538 |
|
|
$ |
1.87 |
|
|
$ |
68,817 |
|
|
$ |
48,826 |
|
|
$ |
1.88 |
|
| Merger-related expenses |
|
|
5,123 |
|
|
|
3,330 |
|
|
|
0.10 |
|
|
|
15,975 |
|
|
|
10,383 |
|
|
|
0.36 |
|
|
|
8,626 |
|
|
|
5,607 |
|
|
|
0.22 |
|
| Severance expenses |
|
|
2,355 |
|
|
|
1,530 |
|
|
|
0.05 |
|
|
|
2,332 |
|
|
|
1,516 |
|
|
|
0.05 |
|
|
|
330 |
|
|
|
214 |
|
|
|
0.01 |
|
| Occupancy and branch closure expenses |
|
|
3,738 |
|
|
|
2,430 |
|
|
|
0.07 |
|
|
|
— |
|
|
|
— |
|
|
|
— |
|
|
|
— |
|
|
|
— |
|
|
|
— |
|
| Professional expenses and litigation settlement |
|
|
2,795 |
|
|
|
1,816 |
|
|
|
0.06 |
|
|
|
3,090 |
|
|
|
2,009 |
|
|
|
0.07 |
|
|
|
— |
|
|
|
— |
|
|
|
— |
|
| Other noninterest income |
|
|
(2,196 |
) |
|
|
(1,427 |
) |
|
|
(0.05 |
) |
|
|
— |
|
|
|
— |
|
|
|
— |
|
|
|
— |
|
|
|
— |
|
|
|
— |
|
| (Gain) loss on sale of investments |
|
|
(3,775 |
) |
|
|
(2,453 |
) |
|
|
(0.08 |
) |
|
|
(3,475 |
) |
|
|
(2,259 |
) |
|
|
(0.08 |
) |
|
|
(5,251 |
) |
|
|
(3,413 |
) |
|
|
(0.13 |
) |
|
|
|
|
|
|
|
|
|
|
|
|
|
|
|
|
|
|
|
|
|
|
|
|
|
|
|
|
|
|
|
|
|
|
|
|
|
| Operating earnings (non-GAAP) |
|
|
112,931 |
|
|
|
81,621 |
|
|
|
2.74 |
|
|
|
88,441 |
|
|
|
65,187 |
|
|
|
2.27 |
|
|
|
72,522 |
|
|
|
51,234 |
|
|
|
1.98 |
|
| Covered loan provision for credit losses |
|
|
7,068 |
|
|
|
4,594 |
|
|
|
0.15 |
|
|
|
5,893 |
|
|
|
3,830 |
|
|
|
0.13 |
|
|
|
8,897 |
|
|
|
5,783 |
|
|
|
0.22 |
|
| Acquired loan provision for credit losses |
|
|
9,799 |
|
|
|
6,370 |
|
|
|
0.22 |
|
|
|
— |
|
|
|
— |
|
|
|
— |
|
|
|
— |
|
|
|
— |
|
|
|
— |
|
| Other provision for credit losses |
|
|
3,804 |
|
|
|
2,472 |
|
|
|
0.08 |
|
|
|
19,974 |
|
|
|
12,983 |
|
|
|
0.45 |
|
|
|
33,554 |
|
|
|
21,810 |
|
|
|
0.84 |
|
|
|
|
|
|
|
|
|
|
|
|
|
|
|
|
|
|
|
|
|
|
|
|
|
|
|
|
|
|
|
|
|
|
|
|
|
|
| Pre-provision operating earnings (non-GAAP) |
|
$ |
133,602 |
|
|
$ |
95,057 |
|
|
$ |
3.19 |
|
|
$ |
114,308 |
|
|
$ |
82,000 |
|
|
$ |
2.86 |
|
|
$ |
114,973 |
|
|
$ |
78,827 |
|
|
$ |
3.04 |
|
|
|
|
|
|
|
|
|
|
|
|
|
|
|
|
|
|
|
|
|
|
|
|
|
|
|
|
|
|
|
|
|
|
|
|
|
|
| (1) |
Per share amounts may not appear to foot due to rounding. |
|
|
|
|
|
|
|
|
|
|
|
|
|
| (Dollars in thousands) |
|
2012 |
|
|
2011 |
|
|
2010 |
|
| Net interest income |
|
$ |
381,750 |
|
|
$ |
338,258 |
|
|
$ |
281,627 |
|
| Add: Effect of tax benefit on interest income |
|
|
9,659 |
|
|
|
8,178 |
|
|
|
7,778 |
|
|
|
|
|
|
|
|
|
|
|
|
|
|
| Net interest income (TE) (Non-GAAP) |
|
|
391,409 |
|
|
|
346,436 |
|
|
|
289,405 |
|
| Noninterest income |
|
|
175,997 |
|
|
|
131,859 |
|
|
|
133,890 |
|
| Add: Effect of tax benefit on noninterest income |
|
|
1,981 |
|
|
|
1,775 |
|
|
|
1,669 |
|
|
|
|
|
|
|
|
|
|
|
|
|
|
| Noninterest income (TE) (Non-GAAP) |
|
|
177,978 |
|
|
|
133,634 |
|
|
|
135,559 |
|
| Noninterest expense |
|
|
432,185 |
|
|
|
373,731 |
|
|
|
304,249 |
|
| Add: Intangible amortization expense |
|
|
5,150 |
|
|
|
5,121 |
|
|
|
4,935 |
|
|
|
|
|
|
|
|
|
|
|
|
|
|
| Tangible noninterest expense (Non-GAAP) |
|
|
427,035 |
|
|
|
368,610 |
|
|
|
299,314 |
|
| Net income |
|
|
76,395 |
|
|
|
53,538 |
|
|
|
48,826 |
|
| Add: Effect of intangible amortization, net of tax |
|
|
3,348 |
|
|
|
3,328 |
|
|
|
3,208 |
|
|
|
|
|
|
|
|
|
|
|
|
|
|
| Cash earnings (Non-GAAP) |
|
|
79,743 |
|
|
|
56,866 |
|
|
|
52,034 |
|
| Total assets |
|
|
13,129,678 |
|
|
|
11,757,928 |
|
|
|
10,026,766 |
|
| Less: Intangible assets |
|
|
429,584 |
|
|
|
401,889 |
|
|
|
264,100 |
|
|
|
|
|
|
|
|
|
|
|
|
|
|
| Total tangible assets (Non-GAAP) |
|
|
12,700,094 |
|
|
|
11,356,039 |
|
|
|
9,762,666 |
|
| Average assets |
|
|
12,096,972 |
|
|
|
10,890,190 |
|
|
|
10,303,142 |
|
| Less: Average intangible assets |
|
|
407,672 |
|
|
|
348,927 |
|
|
|
261,889 |
|
|
|
|
|
|
|
|
|
|
|
|
|
|
| Total average tangible assets (Non-GAAP) |
|
|
11,689,300 |
|
|
|
10,541,263 |
|
|
|
10,041,253 |
|
| Total shareholders’ equity |
|
|
1,529,868 |
|
|
|
1,482,661 |
|
|
|
1,303,457 |
|
| Less: Intangible assets |
|
|
429,584 |
|
|
|
401,889 |
|
|
|
264,100 |
|
|
|
|
|
|
|
|
|
|
|
|
|
|
| Total tangible shareholders’ equity (Non-GAAP) |
|
|
1,100,284 |
|
|
|
1,080,772 |
|
|
|
1,039,357 |
|
| Average shareholders’ equity |
|
|
1,513,517 |
|
|
|
1,422,256 |
|
|
|
1,249,765 |
|
| Less: Average intangible assets |
|
|
407,672 |
|
|
|
348,927 |
|
|
|
261,889 |
|
|
|
|
|
|
|
|
|
|
|
|
|
|
| Average tangible shareholders’ equity (Non-GAAP) |
|
|
1,105,845 |
|
|
|
1,073,329 |
|
|
|
987,876 |
|
| Net income per common share – diluted |
|
$ |
2.59 |
|
|
$ |
1.87 |
|
|
$ |
1.88 |
|
| Add: Effect of intangible amortization, net of tax |
|
|
0.11 |
|
|
|
0.11 |
|
|
|
0.13 |
|
|
|
|
|
|
|
|
|
|
|
|
|
|
| Cash earnings per share – diluted (Non-GAAP) |
|
$ |
2.70 |
|
|
$ |
1.98 |
|
|
$ |
2.01 |
|
| Return on average common equity |
|
|
5.05 |
% |
|
|
3.77 |
% |
|
|
3.91 |
% |
| Add: Effect of intangibles |
|
|
2.16 |
|
|
|
1.53 |
|
|
|
1.36 |
|
|
|
|
|
|
|
|
|
|
|
|
|
|
| Return on average tangible common equity (Non-GAAP) |
|
|
7.21 |
|
|
|
5.30 |
|
|
|
5.27 |
|
| Efficiency ratio |
|
|
77.5 |
% |
|
|
79.5 |
% |
|
|
73.2 |
% |
| Less: Effect of tax benefit related to tax-exempt income |
|
|
(1.6 |
) |
|
|
(1.7 |
) |
|
|
(1.6 |
) |
|
|
|
|
|
|
|
|
|
|
|
|
|
| Efficiency ratio (TE) (Non-GAAP) |
|
|
75.9 |
|
|
|
77.8 |
|
|
|
71.6 |
|
| Less: Effect of amortization of intangibles |
|
|
(1.0 |
) |
|
|
(1.1 |
) |
|
|
(1.2 |
) |
|
|
|
|
|
|
|
|
|
|
|
|
|
| Tangible efficiency ratio (TE) (Non-GAAP) |
|
|
74.9 |
% |
|
|
76.7 |
% |
|
|
70.4 |
% |
|
|
|
|
|
|
|
|
|
|
|
|
|
APPLICATION OF CRITICAL ACCOUNTING POLICIES AND ESTIMATES
In preparing financial reports, management is required to apply significant judgment to various accounting, reporting and disclosure matters. Management
must use assumptions and estimates to apply these principles where actual measurement is not possible or practical. The accounting principles and methods used by the Company conform with accounting principles generally accepted in the United States
and general bank accounting practices. Estimates and assumptions most significant to the Company relate primarily to the calculation of the allowance for credit losses, the accounting for acquired loans and the related FDIC loss share receivable on
covered loans, the valuation of goodwill, intangible assets and other purchase accounting adjustments, and the valuation of share-based compensation. These significant estimates and assumptions are summarized in the following discussion and are
further analyzed in the footnotes to the consolidated financial statements.
Allowance for Credit Losses
The determination of the allowance for credit losses has two components, the allowance for legacy credit losses and the allowance for acquired credit
losses. The allowance for acquired credit losses is calculated as described in the Accounting for Acquired Loans and Related FDIC Loss Share Receivable section below. The allowance for legacy credit losses, which represents management’s
estimate of probable losses inherent in the Company’s loan portfolio, involves a high degree of judgment and complexity. The Company’s policy is to establish reserves through provisions for credit losses on the consolidated statements of
comprehensive income for estimated losses on delinquent and other problem loans when it is determined that losses are expected to be incurred on such loans. Management’s determination of the appropriateness of the allowance is based on various
factors requiring judgments and estimates, including management’s evaluation of the credit quality of the portfolio (determined through the assignment risk ratings and assessments of past due status), past loss experience, current economic
conditions, the volume and type of lending conducted by the Company, composition of the portfolio, the amount of the Company’s classified assets, seasoning of the loan portfolio, the status of past due principal and interest payments, and other
relevant factors. Two areas in which management exercises judgment are the assessment of risk ratings on the Company’s commercial loan portfolio and the application of qualitative adjustments to the quantitative measurements across all
portfolios. A one risk rating, instantaneous shift upwards (improvement) and downwards (degradation) would decrease the allowance for credit losses by $19.0 million and increase the allowance for credit losses by $29.0 million, respectively.
Similarly, a 10% change in the qualitative adjustments estimated by management would result in a $1.6 million change in the allowance for credit losses. Other changes in estimates may also have a significant impact on the consolidated financial
statements. For further discussion of the allowance for credit losses, see the Asset Quality and Allowance for Credit Losses sections of this analysis and Note 1 and Note 7 of the footnotes to the consolidated financial statements.
Accounting for Acquired Loans, the Allowance for Acquired Credit Losses, and Related FDIC Loss Share Receivable
The Company accounts for its acquisitions under ASC Topic No. 805, Business Combinations, which requires the use of the purchase method of
accounting. All identifiable assets acquired, including loans, are recorded at fair value. No allowance for credit losses related to the acquired loans is recorded on the acquisition date as the fair value of the loans acquired incorporates
assumptions regarding credit risk. Loans acquired are recorded on the date of acquisition at fair value in accordance with the fair value methodology prescribed in ASC Topic No. 820, exclusive of the shared-loss agreements with the FDIC. These
fair value estimates associated with acquired loans include estimates related to market interest rates and undiscounted projections of future cash flows that incorporate expectations of prepayments and the amount and timing of principal, interest
and other cash flows, as well as any shortfalls thereof.
Over the life of the acquired loans, the Company continues to estimate the amount
and timing of cash flows expected to be collected on individual loans or on pools of loans sharing common risk characteristics. These expected cash flow estimates are updated for new information on a quarterly basis. The Company performs a detailed
credit review on a semi-annual basis. The Company evaluates quarterly whether the present value of estimated future cash flows of its loans determined using effective interest rates have decreased and if so, recognizes provisions for credit losses
in its consolidated statement of comprehensive income. For any increases in cash flows expected to be collected, the Company adjusts the amount of accretable yield recognized on a prospective basis over the respective loan’s or pool’s
remaining life.
Because the FDIC will reimburse the Company for certain loans acquired from CSB, Orion, Century, and Sterling should the
Company experience a loss, an indemnification asset, the FDIC loss share receivable, is recorded at fair value at the acquisition date. The indemnification asset is recognized at the same time as the indemnified loans, and measured on the same
basis, subject to collectability or contractual limitations. The shared loss agreements on the acquisition date reflect the reimbursements expected to be received from the FDIC, using an appropriate discount rate, which reflects counterparty credit
risk and other uncertainties.
The shared loss agreements continue to be re-measured on the same basis as the related indemnified loans.
Because the acquired loans are subject to the accounting prescribed by ASC Topic 310, subsequent changes in estimates underlying the basis of the shared loss agreements also follow that model. Deterioration in actual results from prior estimates of
the credit quality of the loans is immediately recorded as an adjustment to the allowance for credit losses and would immediately increase the basis of the shared loss agreements, with the offset recorded through the consolidated statement of
comprehensive income. Improvements in the credit quality or cash flows of loans (reflected as an adjustment to yield and accreted into income over the remaining life of the loans) decrease the basis of the shared loss agreements, with such decrease
being amortized into income. Loss assumptions used in the basis of the indemnified loans
are consistent with the loss assumptions used to measure the indemnification asset. Fair value accounting incorporates into the fair value of the indemnification asset an element of the time
value of money, which is accreted back into income over the life of the shared loss agreements.
Upon the determination of an incurred loss
the indemnification asset will be reduced by the amount owed by the FDIC. A corresponding claim receivable is recorded until cash is received from the FDIC.
If expected loss severities for all acquired loans were to increase by 10% and 20%, the Company would recognize a gross expense to the provision for credit losses of $21.7 million and $43.3 million,
respectively, which would be offset by an increase of $15.4 million and $31.4 million, respectively in the FDIC loss share receivable, respectively.
For further discussion of the Company’s acquisition and loan accounting, see Note 4 and Note 6 of the footnotes to the consolidated financial statements.
Valuation of Goodwill, Intangible Assets and Other Purchase Accounting Adjustments
The Company accounts for acquisitions in accordance with ASC Topic No. 805, which requires the use of the purchase method of accounting. For purchase acquisitions, the Company is required to record
the assets acquired, including identified intangible assets, and liabilities assumed, at their fair value, which in many instances involves estimates based on third party valuations, such as appraisals, or internal valuations based on discounted
cash flow analyses or other valuation techniques. The determination of the useful lives of intangible assets is subjective, as is the appropriate amortization period for such intangible assets. In addition, purchase acquisitions typically result in
recording goodwill.
The Company performs a goodwill evaluation at least annually. As part of its testing, the Company first assesses
qualitative factors to determine whether it is more likely than not that the fair value of a reporting unit is less than its carrying amount. If the Company determines the fair value of a reporting unit is less than its carrying amount using these
qualitative factors, the Company then compares the fair value of goodwill with its carrying amount, and then measures impairment loss by comparing the implied fair value of goodwill with the carrying amount of that goodwill. Based on
management’s assessment of the qualitative factors in its goodwill impairment tests, the Company concluded that the fair value of the Company’s reporting unit was more likely than not above its carrying amount and accordingly did not
recognize impairment in its tests of goodwill at October 1, 2012 or 2011. For additional information on goodwill and intangible assets, see Note 1 and Note 10 of the footnotes to the consolidated financial statements.
FINANCIAL CONDITION
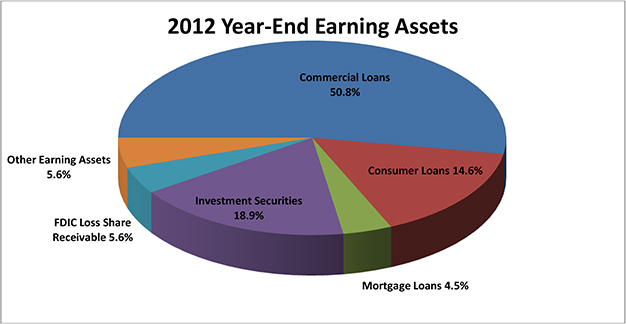
EARNING ASSETS
Interest income associated with earning assets is the Company’s primary source of income. Earning assets are composed of interest or
dividend-earning assets, including loans, securities, short-term investments and loans held for sale. Earning assets averaged $10.8 billion during 2012, a $1.1 billion, or 10.8%, increase when compared to 2011. The increase from the prior year was
primarily the result of earning assets acquired during 2012. The following discussion highlights the Company’s major categories of earning assets.
The year-end mix of earning assets is shown in the following chart.
Loans and Leases
The Company’s total loan portfolio increased $1.1 billion, or 15.0%, to $8.5 billion at December 31, 2012, compared to $7.4 billion at December 31, 2011. The increase was driven by
non-covered loan growth of $1.4 billion during the year, but was tempered by a decrease in loans covered by loss share agreements of $241.7 million, or 18.1%. Non-covered loan growth included loans acquired from Florida Gulf of $215.7 million and
organic growth of $1.1 billion, or 18.8%. By loan type, the increase was primarily from commercial loan growth of $800.6 million and consumer loan growth of $371.6 million during 2012, 14.9% and 25.1% higher, respectively, than at the end of 2011.
The major categories of loans outstanding at December 31, 2012 and 2011 are presented in the following
tables, segregated into covered loans and non-covered loans, including non-covered loans acquired from OMNI, Cameron, and Florida Gulf. The carrying amount of the covered loans and loans acquired from OMNI, Cameron, and Florida Gulf consisted of
loans accounted for in accordance with ASC Topic 310-30 (i.e., loans impaired at the time of acquisition) and loans subject to ASC Topic 310-30 by analogy only (i.e., loans performing at the time of acquisition) as detailed in the following table.
TABLE 5—SUMMARY OF LOANS
|
|
|
|
|
|
|
|
|
|
|
|
|
|
|
|
|
|
|
|
|
|
|
|
|
|
|
|
|
|
|
|
|
|
|
|
|
| |
|
Commercial |
|
|
Mortgage |
|
|
Consumer and Other |
|
| (In thousands)
December 31, 2012 |
|
Real Estate |
|
|
Business |
|
|
1-4
Family |
|
|
Construction |
|
|
Indirect |
|
|
Home
Equity |
|
|
Credit
Card |
|
|
Other |
|
|
Total |
|
| Covered loans |
|
|
|
|
|
|
|
|
|
|
|
|
|
|
|
|
|
|
|
|
|
|
|
|
|
|
|
|
|
|
|
|
|
|
|
|
| Impaired (1) |
|
$ |
167,742 |
|
|
$ |
2,757 |
|
|
$ |
20,232 |
|
|
$ |
— |
|
|
$ |
— |
|
|
$ |
22,094 |
|
|
$ |
— |
|
|
$ |
820 |
|
|
$ |
213,645 |
|
| Performing (1) |
|
|
473,101 |
|
|
|
84,294 |
|
|
|
166,932 |
|
|
|
— |
|
|
|
— |
|
|
|
152,117 |
|
|
|
906 |
|
|
|
1,761 |
|
|
|
879,111 |
|
|
|
|
|
|
|
|
|
|
|
|
|
|
|
|
|
|
|
|
|
|
|
|
|
|
|
|
|
|
|
|
|
|
|
|
|
|
| Total covered loans |
|
|
640,843 |
|
|
|
87,051 |
|
|
|
187,164 |
|
|
|
— |
|
|
|
— |
|
|
|
174,211 |
|
|
|
906 |
|
|
|
2,581 |
|
|
|
1,092,756 |
|
| Non-covered loans |
|
|
|
|
|
|
|
|
|
|
|
|
|
|
|
|
|
|
|
|
|
|
|
|
|
|
|
|
|
|
|
|
|
|
|
|
| Acquired loans |
|
|
|
|
|
|
|
|
|
|
|
|
|
|
|
|
|
|
|
|
|
|
|
|
|
|
|
|
|
|
|
|
|
|
|
|
| Impaired (1) |
|
|
55,363 |
|
|
|
3,470 |
|
|
|
330 |
|
|
|
— |
|
|
|
68 |
|
|
|
4,649 |
|
|
|
— |
|
|
|
318 |
|
|
|
64,198 |
|
| Performing (1) |
|
|
390,017 |
|
|
|
79,763 |
|
|
|
32,427 |
|
|
|
— |
|
|
|
4,951 |
|
|
|
71,626 |
|
|
|
— |
|
|
|
15,337 |
|
|
|
594,121 |
|
|
|
|
|
|
|
|
|
|
|
|
|
|
|
|
|
|
|
|
|
|
|
|
|
|
|
|
|
|
|
|
|
|
|
|
|
|
| Total non-covered acquired loans |
|
|
445,380 |
|
|
|
83,233 |
|
|
|
32,757 |
|
|
|
— |
|
|
|
5,019 |
|
|
|
76,275 |
|
|
|
— |
|
|
|
15,655 |
|
|
|
658,319 |
|
| Other non-covered loans (Legacy loans) |
|
|
2,545,320 |
|
|
|
2,367,434 |
|
|
|
251,262 |
|
|
|
6,021 |
|
|
|
322,966 |
|
|
|
1,000,638 |
|
|
|
51,722 |
|
|
|
202,142 |
|
|
|
6,747,505 |
|
|
|
|
|
|
|
|
|
|
|
|
|
|
|
|
|
|
|
|
|
|
|
|
|
|
|
|
|
|
|
|
|
|
|
|
|
|
| Total non-covered loans |
|
|
2,990,700 |
|
|
|
2,450,667 |
|
|
|
284,019 |
|
|
|
6,021 |
|
|
|
327,985 |
|
|
|
1,076,913 |
|
|
|
51,722 |
|
|
|
217,797 |
|
|
|
7,405,824 |
|
|
|
|
|
|
|
|
|
|
|
|
|
|
|
|
|
|
|
|
|
|
|
|
|
|
|
|
|
|
|
|
|
|
|
|
|
|
| Total |
|
$ |
3,631,543 |
|
|
$ |
2,537,718 |
|
|
$ |
471,183 |
|
|
$ |
6,021 |
|
|
$ |
327,985 |
|
|
$ |
1,251,125 |
|
|
$ |
52,628 |
|
|
$ |
220,377 |
|
|
$ |
8,498,580 |
|
|
|
|
|
|
|
|
|
|
|
|
|
|
|
|
|
|
|
|
|
|
|
|
|
|
|
|
|
|
|
|
|
|
|
|
|
|
|
|
|
|
|
|
|
|
|
|
|
|
|
|
|
|
|
|
|
|
|
|
|
|
|
|
|
|
|
|
|
|
|
|
|
|
|
| |
|
Commercial |
|
|
Mortgage |
|
|
Consumer and Other |
|
|
|
|
| (In thousands) December 31, 2011 |
|
Real Estate |
|
|
Business |
|
|
1-4
Family |
|
|
Construction |
|
|
Indirect |
|
|
Home
Equity |
|
|
Credit
Card |
|
|
Other |
|
|
Total |
|
| Covered loans |
|
|
|
|
|
|
|
|
|
|
|
|
|
|
|
|
|
|
|
|
|
|
|
|
|
|
|
|
|
|
|
|
|
|
|
|
| Impaired (1) |
|
$ |
54,691 |
|
|
$ |
4,169 |
|
|
$ |
35,794 |
|
|
$ |
— |
|
|
$ |
— |
|
|
$ |
29,473 |
|
|
$ |
— |
|
|
$ |
— |
|
|
$ |
124,127 |
|
| Performing (1) |
|
|
718,186 |
|
|
|
104,569 |
|
|
|
219,593 |
|
|
|
— |
|
|
|
— |
|
|
|
163,174 |
|
|
|
969 |
|
|
|
3,831 |
|
|
|
1,210,322 |
|
|
|
|
|
|
|
|
|
|
|
|
|
|
|
|
|
|
|
|
|
|
|
|
|
|
|
|
|
|
|
|
|
|
|
|
|
|
| Total covered loans |
|
|
772,877 |
|
|
|
108,738 |
|
|
|
255,387 |
|
|
|
— |
|
|
|
— |
|
|
|
192,647 |
|
|
|
969 |
|
|
|
3,831 |
|
|
|
1,334,449 |
|
| Non-covered loans |
|
|
|
|
|
|
|
|
|
|
|
|
|
|
|
|
|
|
|
|
|
|
|
|
|
|
|
|
|
|
|
|
|
|
|
|
| Acquired loans |
|
|
|
|
|
|
|
|
|
|
|
|
|
|
|
|
|
|
|
|
|
|
|
|
|
|
|
|
|
|
|
|
|
|
|
|
| Impaired (1) |
|
|
4,320 |
|
|
|
26,531 |
|
|
|
— |
|
|
|
— |
|
|
|
17 |
|
|
|
1,247 |
|
|
|
— |
|
|
|
2,865 |
|
|
|
34,980 |
|
| Performing (1) |
|
|
496,766 |
|
|
|
68,785 |
|
|
|
4,514 |
|
|
|
— |
|
|
|
11,424 |
|
|
|
74,474 |
|
|
|
— |
|
|
|
13,219 |
|
|
|
669,182 |
|
|
|
|
|
|
|
|
|
|
|
|
|
|
|
|
|
|
|
|
|
|
|
|
|
|
|
|
|
|
|
|
|
|
|
|
|
|
| Total non-covered acquired loans |
|
|
501,086 |
|
|
|
95,316 |
|
|
|
4,514 |
|
|
|
— |
|
|
|
11,441 |
|
|
|
75,721 |
|
|
|
— |
|
|
|
16,084 |
|
|
|
704,162 |
|
| Other non-covered loans (Legacy loans) |
|
|
2,089,928 |
|
|
|
1,801,180 |
|
|
|
262,456 |
|
|
|
16,143 |
|
|
|
250,455 |
|
|
|
750,742 |
|
|
|
47,763 |
|
|
|
130,759 |
|
|
|
5,349,426 |
|
|
|
|
|
|
|
|
|
|
|
|
|
|
|
|
|
|
|
|
|
|
|
|
|
|
|
|
|
|
|
|
|
|
|
|
|
|
| Total non-covered loans |
|
|
2,591,014 |
|
|
|
1,896,496 |
|
|
|
266,970 |
|
|
|
16,143 |
|
|
|
261,896 |
|
|
|
826,463 |
|
|
|
47,763 |
|
|
|
146,843 |
|
|
|
6,053,588 |
|
|
|
|
|
|
|
|
|
|
|
|
|
|
|
|
|
|
|
|
|
|
|
|
|
|
|
|
|
|
|
|
|
|
|
|
|
|
| Total |
|
$ |
3,363,891 |
|
|
$ |
2,005,234 |
|
|
$ |
522,357 |
|
|
$ |
16,143 |
|
|
$ |
261,896 |
|
|
$ |
1,019,110 |
|
|
$ |
48,732 |
|
|
$ |
150,674 |
|
|
$ |
7,388,037 |
|
|
|
|
|
|
|
|
|
|
|
|
|
|
|
|
|
|
|
|
|
|
|
|
|
|
|
|
|
|
|
|
|
|
|
|
|
|
| (1) |
Loans in these categories were acquired with evidence of credit deterioration since origination. Accordingly, assumed credit losses at the purchase
date were included in the balance acquired. |
Loan Portfolio Components
The Company’s year-end loan portfolio is segregated into various components and markets in the following charts.
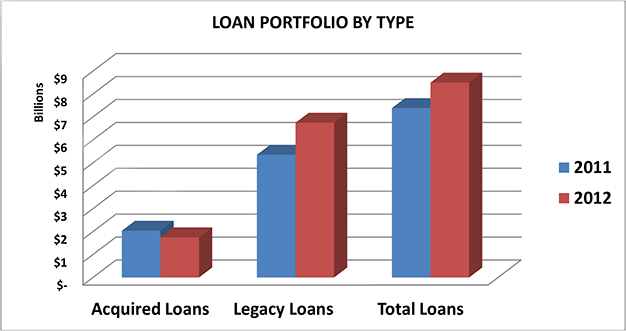
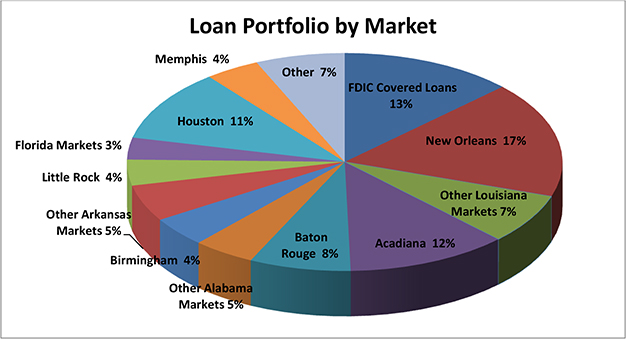
The Company’s loan to deposit ratio at December 31, 2012 and 2011 was 79.1% and 79.5%,
respectively. The percentage of fixed rate loans to total loans increased from 49.1% at the end of 2011 to 50.7% as of December 31, 2012. The table below sets forth the composition of the Company’s loan portfolio as of December 31 for
the years indicated, with a discussion of activity by major loan types following.
TABLE 6—TOTAL LOANS BY LOAN TYPE
|
|
|
|
|
|
|
|
|
|
|
|
|
|
|
|
|
|
|
|
|
|
|
|
|
|
|
|
|
|
|
|
|
|
|
|
|
|
|
|
|
| (Dollars in thousands) |
|
2012 |
|
|
2011 |
|
|
2010 |
|
|
2009 |
|
|
2008 |
|
| Commercial loans: |
|
|
|
|
|
|
|
|
|
|
|
|
|
|
|
|
|
|
|
|
|
|
|
|
|
|
|
|
|
|
|
|
|
|
|
|
|
|
|
|
| Real estate |
|
$ |
3,631,543 |
|
|
|
43 |
% |
|
$ |
3,363,891 |
|
|
|
46 |
% |
|
$ |
2,647,107 |
|
|
|
44 |
% |
|
$ |
2,500,433 |
|
|
|
43 |
% |
|
$ |
1,522,965 |
|
|
|
41 |
% |
| Business |
|
|
2,537,718 |
|
|
|
30 |
|
|
|
2,005,234 |
|
|
|
27 |
|
|
|
1,515,856 |
|
|
|
25 |
|
|
|
1,217,326 |
|
|
|
21 |
|
|
|
775,625 |
|
|
|
21 |
|
|
|
|
|
|
|
|
|
|
|
|
|
|
|
|
|
|
|
|
|
|
|
|
|
|
|
|
|
|
|
|
|
|
|
|
|
|
|
|
|
|
| Total commercial loans |
|
|
6,169,261 |
|
|
|
73 |
|
|
|
5,369,125 |
|
|
|
73 |
|
|
|
4,162,963 |
|
|
|
69 |
|
|
|
3,717,759 |
|
|
|
64 |
|
|
|
2,298,590 |
|
|
|
62 |
|
| Mortgage loans: |
|
|
|
|
|
|
|
|
|
|
|
|
|
|
|
|
|
|
|
|
|
|
|
|
|
|
|
|
|
|
|
|
|
|
|
|
|
|
|
|
| Residential 1-4 family |
|
|
471,183 |
|
|
|
5 |
|
|
|
522,357 |
|
|
|
7 |
|
|
|
616,550 |
|
|
|
10 |
|
|
|
975,395 |
|
|
|
17 |
|
|
|
498,740 |
|
|
|
13 |
|
| Construction/Owner- occupied |
|
|
6,021 |
|
|
|
— |
|
|
|
16,143 |
|
|
|
— |
|
|
|
14,822 |
|
|
|
— |
|
|
|
32,857 |
|
|
|
1 |
|
|
|
36,693 |
|
|
|
1 |
|
|
|
|
|
|
|
|
|
|
|
|
|
|
|
|
|
|
|
|
|
|
|
|
|
|
|
|
|
|
|
|
|
|
|
|
|
|
|
|
|
|
| Total mortgage loans |
|
|
477,204 |
|
|
|
5 |
|
|
|
538,500 |
|
|
|
7 |
|
|
|
631,372 |
|
|
|
10 |
|
|
|
1,008,252 |
|
|
|
18 |
|
|
|
535,433 |
|
|
|
14 |
|
| Loans to individuals: |
|
|
|
|
|
|
|
|
|
|
|
|
|
|
|
|
|
|
|
|
|
|
|
|
|
|
|
|
|
|
|
|
|
|
|
|
|
|
|
|
| Indirect automobile |
|
|
327,985 |
|
|
|
4 |
|
|
|
261,896 |
|
|
|
3 |
|
|
|
255,322 |
|
|
|
4 |
|
|
|
259,339 |
|
|
|
4 |
|
|
|
265,722 |
|
|
|
7 |
|
| Home equity |
|
|
1,251,125 |
|
|
|
15 |
|
|
|
1,019,110 |
|
|
|
14 |
|
|
|
834,840 |
|
|
|
14 |
|
|
|
649,821 |
|
|
|
11 |
|
|
|
501,036 |
|
|
|
13 |
|
| Other |
|
|
273,005 |
|
|
|
3 |
|
|
|
199,406 |
|
|
|
3 |
|
|
|
150,835 |
|
|
|
3 |
|
|
|
149,194 |
|
|
|
3 |
|
|
|
143,621 |
|
|
|
4 |
|
|
|
|
|
|
|
|
|
|
|
|
|
|
|
|
|
|
|
|
|
|
|
|
|
|
|
|
|
|
|
|
|
|
|
|
|
|
|
|
|
|
| Total consumer loans |
|
|
1,852,115 |
|
|
|
22 |
|
|
|
1,480,412 |
|
|
|
20 |
|
|
|
1,240,997 |
|
|
|
21 |
|
|
|
1,058,354 |
|
|
|
18 |
|
|
|
910,379 |
|
|
|
24 |
|
|
|
|
|
|
|
|
|
|
|
|
|
|
|
|
|
|
|
|
|
|
|
|
|
|
|
|
|
|
|
|
|
|
|
|
|
|
|
|
|
|
| Total loans receivable |
|
$ |
8,498,580 |
|
|
|
100 |
% |
|
$ |
7,388,037 |
|
|
|
100 |
% |
|
$ |
6,035,332 |
|
|
|
100 |
% |
|
$ |
5,784,365 |
|
|
|
100 |
% |
|
$ |
3,744,402 |
|
|
|
100 |
% |
|
|
|
|
|
|
|
|
|
|
|
|
|
|
|
|
|
|
|
|
|
|
|
|
|
|
|
|
|
|
|
|
|
|
|
|
|
|
|
|
|
Commercial Loans
Commercial real estate and commercial business loans generally have shorter repayment periods and more frequent repricing opportunities than consumer and mortgage loans. Total commercial loans increased
$800.1 million, or 14.9%, during 2012, with $953.8 million in non-covered loan growth and a decrease in covered commercial loans of $153.7 million, or 17.4%. The Company continued to attract and retain commercial customers in 2012 as commercial
loans were 73% of the total loan portfolio at December 31, 2012. Unfunded commitments on commercial loans were $1.8 billion at December 31, 2012, an increase of $404.5 million when compared to the prior year.
The Company’s investment in commercial real estate loans increased by $267.7 million during 2012, and was primarily the result of acquired
commercial loans of $144.5 million. Growth, however, was tempered by a decrease in covered commercial real estate loans of $132.0 million. At December 31, 2012, commercial real estate loans totaled $3.6 billion, or 42.7% of the total loan
portfolio, compared to 45.5% at December 31, 2011. The Company’s underwriting standards generally provide for loan terms of three to five years, with amortization schedules of generally no more than twenty years. Low loan-to-value ratios
are maintained and usually limited to no more than 80% at the time of origination. In addition, the Company obtains personal guarantees of the principals as additional security for most commercial real estate loans.
As of December 31, 2012, the Company’s commercial business loans totaled $2.5 billion, or 29.9% of the Company’s total loan portfolio.
This represents a $532.5 million, or 26.6%, increase from December 31, 2011, and is the result of loans acquired in 2012, but also the Company’s focused efforts to grow its small business loan portfolio. The Company originates commercial
business loans on a secured and, to a lesser extent, unsecured basis. The Company’s commercial business loans may be term loans or revolving lines of credit. Term loans are generally structured with terms of no more than three to five years,
with amortization schedules of generally no more than seven years. The Company’s commercial business term loans are generally secured by equipment, machinery or other corporate assets. The Company also provides for revolving lines of credit
generally structured as advances upon perfected security interests in accounts receivable and inventory. Revolving lines of credit generally have an annual maturity. The Company obtains personal guarantees of the principals as additional security
for most commercial business loans.
Non-covered commercial loans increased $809.4 million, or 18.0%, excluding the loans acquired from
Florida Gulf. The Lafayette, Louisiana, Birmingham, Alabama, and Houston, Texas markets experienced the largest growth in their commercial loan portfolios, but that growth was partially offset by a decrease in balances in some of the Company’s
other markets, the result primarily of payments on existing loans. On a market basis, growth in the non-covered portfolio was driven by the Company’s newer markets, including Mobile, Alabama, which grew its commercial loan portfolio $46.1
million, or 32.8%, since the end of 2011, and Houston, Texas, which increased its commercial loan portfolio 62.1%, or $328.8 million, in 2012. Birmingham, Alabama’s commercial loans grew $102.1 million, or
47.9%, while the Huntsville, Alabama market contributed loan growth of $50.4 million since December 31, 2011. In the Company’s more mature markets, New Orleans, Louisiana’s
commercial loans grew $84.1 million, or 7.7%, during 2012. Offsetting these increases were decreases in the Northeast Arkansas and Southwest Louisiana markets, due primarily to loan payments.
Mortgage Loans
Residential 1-4 family loans comprise most of the Company’s
mortgage loans. The vast majority of the Company’s residential 1-4 family mortgage loan portfolio is secured by properties located in its market areas and originated under terms and documentation which permit their sale in the secondary market.
Larger mortgage loans of private banking clients and prospects are generally retained to enhance relationships, and also due to the expected shorter durations and relatively lower servicing costs associated with loans of this size. The Company does
not originate or hold high loan to value, negative amortization, option ARM, or other exotic mortgage loans in its portfolio. Beginning in the third quarter of 2012, the Company began to invest in loans that would be considered subprime (e.g. loans
with a FICO score of less than 620) in order to ensure compliance with relevant regulations. The Company expects to continue to invest in subprime loans through additional secondary market purchases, as well as direct originations, in 2013, albeit
up to a limited amount. The total amount of subprime loans purchased or originated in the last six months of 2012 was $60.5 million, of which $44.9 million is either directly or indirectly guaranteed by a United States Government Agency.
The Company continues to sell the majority of conforming mortgage loan originations in the secondary market on a servicing-released basis and recognize
the associated fee income rather than assume the interest rate risk associated with these longer term assets. The Company retains servicing on a limited portion of these loans upon sale. Total residential mortgage loans decreased $61.3 million, or
11.4%, compared to December 31, 2011. Of the total mortgage loan decrease since December 31, 2011, $68.2 million was a result of a decrease in covered mortgage loans and $21.3 million was a result of a decrease in non-acquired mortgage
loans as existing loans were paid down and most of the new mortgage loan originations were sold. Acquired mortgage loans from Florida Gulf offset the decreases in the current year. The total decrease in mortgage loans was also offset partially by
the $60.5 million in subprime loans the Company purchased from the secondary market during the third and fourth quarters of 2012.
Consumer and Credit Card Loans
The Company offers consumer loans in order to provide a full range of retail financial services to its customers. The Company originates substantially all
of such loans in its primary market areas. At December 31, 2012, $1.9 billion, or 21.8%, of the Company’s total loan portfolio was comprised of consumer loans, compared to $1.5 billion, or 20.0%, at the end of 2011. The $371.7 million
increase in total consumer loans compared to December 31, 2011 was primarily driven by home equity loan growth of $232.0 million and indirect automobile loan growth of $66.1 million.
Consistent with 2011, home equity loans comprised the largest component of the Company’s consumer loan portfolio at December 31, 2012. The balance of home equity loans increased 22.8% during
2012 to $1.3 billion at December 31, 2012. Non-covered home equity loans increased $250.5 million during 2012, a result of acquired loans from Florida Gulf, but also a result of the Company’s continued focus on expanding its total consumer
portfolio through its additional investment in its consumer business, as well as increased activity from its existing clients. The Company’s sales and marketing efforts in 2012 have contributed to the growth in non-covered home equity loans
since December 31, 2011. Unfunded commitments related to home equity loans and lines were $341.2 million at December 31, 2012, an increase of $105.0 million versus the prior year. The Company has approximately $384.7 million of loans with
junior liens where the Company does not hold or service the respective loan holding senior lien. The Company believes it has addressed the risks associated with these loans in its allowance for credit losses, which is discussed below.
Indirect automobile loans comprised the second largest component of the Company’s consumer loan portfolio. Independent automobile dealerships
originate these loans based upon the Company’s credit decisioning. The Company relies on the dealerships, in part, for loan qualifying information. To that extent, there is risk inherent in indirect automobile loans associated with fraud or
negligence by the automobile dealership. To limit this risk, an emphasis is placed on established dealerships that have demonstrated reputable behavior, both within the communities we serve and through long-term relationships with the Company. The
balance of indirect automobile loans increased 25.2% during the year, from $261.9 million at December 31, 2011 to $328.0 million at December 31, 2012, as the Company retained its focus on prime or low risk paper. The indirect portfolio
increased to 3.9% of the total loan portfolio. The organic growth in the Company’s indirect automobile portfolio can be attributed to a couple of primary factors. During the latter part of 2011 and into 2012, the Company began to sign new
dealers after limiting new business during the previous years due to a weakened economy. In addition, the Company has adjusted its interest rates on these loans to be more aligned with its competitors, which has provided the Company an opportunity
to recapture some market share.
The Company’s credit card loans totaled $52.6 million at December 31, 2012, an 8.0% increase from
December 31, 2011. The increase in credit card loans was a result of an increase in usage by customers during the year. Quarter-to-date average credit card balances have increased from $47.5 million in the fourth quarter of 2011 to $50.1
million in the fourth quarter of 2012.
The remainder of the consumer loan portfolio at December 31, 2012 was composed of direct
automobile loans and other personal loans, and comprised 2.6% of the overall loan portfolio. At the end of 2012, the Company’s direct automobile loans totaled $60.2 million, a $21.6 million increase over December 31, 2011, and the
Company’s other personal consumer loans were $160.1 million, a 42.9% increase from December 31, 2011, primarily a result of acquired Florida Gulf loans.
Loan Maturities
The following table sets forth the scheduled contractual maturities of the Company’s loan portfolio at December 31, 2011, unadjusted for scheduled principal reductions, prepayments or repricing
opportunities. Demand loans, loans having no stated schedule of repayments and no stated maturity and overdraft loans are reported as due in one year or less. The average life of a loan may be substantially less than the contractual terms because of
prepayments. As a result, scheduled contractual amortization of loans is not reflective of the expected term of the Company’s loan portfolio. Of the loans with maturities greater than one year, approximately 77.8% of the balance of these loans
bears a fixed rate of interest.
TABLE 7—LOAN MATURITIES BY LOAN TYPE
|
|
|
|
|
|
|
|
|
|
|
|
|
|
|
|
|
| (Dollars in thousands) |
|
One Year
Or Less |
|
|
One Through
Five
Years |
|
|
After
Five Years |
|
|
Total |
|
| Commercial real estate |
|
$ |
1,715,933 |
|
|
$ |
1,361,372 |
|
|
$ |
554,238 |
|
|
$ |
3,631,543 |
|
| Commercial business |
|
|
1,215,311 |
|
|
|
922,088 |
|
|
|
400,319 |
|
|
|
2,537,718 |
|
| Mortgage |
|
|
148,121 |
|
|
|
86,715 |
|
|
|
242,368 |
|
|
|
477,204 |
|
| Consumer |
|
|
764,346 |
|
|
|
440,696 |
|
|
|
647,073 |
|
|
|
1,852,115 |
|
|
|
|
|
|
|
|
|
|
|
|
|
|
|
|
|
|
| Total loans |
|
$ |
3,843,711 |
|
|
$ |
2,810,871 |
|
|
$ |
1,843,998 |
|
|
$ |
8,498,580 |
|
|
|
|
|
|
|
|
|
|
|
|
|
|
|
|
|
|
Mortgage Loans Held for Sale
Loans held for sale increased $114.5 million, or 74.8%, to $267.5 million at December 31, 2012, compared to $153.0 million at December 31, 2011. The increase in the balance during 2012 was a
result of an increase in origination activity during the year. The Company has originated $2.4 billion in mortgage loans during 2012.
Loans
held for sale have primarily been fixed-rate single-family residential mortgage loans under contracts to be sold in the secondary market. In most cases, loans in this category are sold within thirty days of closing. Buyers generally have recourse to
return a purchased loan to the Company under limited circumstances. Recourse conditions may include fraud in the origination, breach of representations or warranties, and documentation deficiencies. At December 31, 2012, the Company had $5.1
million in loans that have recourse conditions for which buyers have notified the Company of potential recourse action. The Company has recorded a reserve of $2.4 million for potential repurchases at December 31, 2012. During 2012, an
insignificant number of loans were returned to the Company.
Asset Quality
The Company’s loan portfolio has gradually transitioned from that of a thrift to resemble portfolios held by commercial banks. This transition brings
the potential for increased risks in the form of potentially higher levels of charge-offs and nonperforming assets, and increase rewards in the form of potentially increased levels of shareholder returns. Management has responded, as the risks
present within the Company’s loan portfolio have evolved by tightening underwriting guidelines and procedures, implementing more conservative loan charge-off and nonaccrual guidelines, revising loan policies and developing an internal loan
review function. As a result of management’s enhancements to underwriting loan risk/return dynamics, the credit quality of the Company’s loan portfolio has remained favorable when compared to peers. Management believes that it has
demonstrated proficiency in managing credit risk through timely identification of significant problem loans, prompt corrective action, and transparent disclosure. Overall asset quality improved during 2012, primarily as a result of decreases in the
number and amount of past due loans and nonperforming assets. Consistent with prior years, the assets and liabilities purchased and assumed through the Company’s four failed bank acquisitions continue to have a disproportionate impact on
overall asset quality. The Company continues to closely monitor the risk-adjusted level of return within the loan portfolio.
Written
underwriting standards established by the Board of Directors and management govern the lending activities of the Company. The commercial credit department, in conjunction with senior lending personnel, underwrites all commercial business and
commercial real estate loans. The Company provides centralized underwriting of all residential mortgage, construction and consumer loans. Established loan origination procedures require appropriate documentation, including financial data and credit
reports. For loans secured by real property, the Company generally requires property appraisals, title insurance or a title opinion, hazard insurance, and flood insurance, where appropriate.
Loan payment performance is monitored and late charges are assessed on past due accounts. A centralized department administers delinquent loans. Every effort is made to minimize any potential loss,
including instituting legal proceedings as necessary. Commercial loans of the Company are periodically reviewed through a loan review process to provide an independent assessment of a loan’s risks. All other loans are also subject to loan
review through a periodic sampling process. The Company exercises significant judgment in determining the risk classification of its commercial loans.
The Company utilizes an asset risk classification system in accordance with guidelines established by the
Federal Reserve Board as part of its efforts to monitor commercial asset quality. In connection with examinations of insured institutions, both federal and state examiners also have the authority to identify problem assets and, if appropriate,
classify them. There are three classifications for problem assets: “substandard,” “doubtful” and “loss”, all of which are considered adverse classifications. Substandard assets have one or more defined weaknesses and
are characterized by the distinct possibility that the Company will sustain some loss if the deficiencies are not corrected. Doubtful assets have the weaknesses of substandard assets with the additional characteristic that the weaknesses make
collection or liquidation in full questionable, and there is a high probability of loss based on currently existing facts, conditions and values. An asset classified as loss is considered not collectable and of such little value that continuance as
an asset of the Company is not warranted. Commercial loans with adverse classifications are reviewed by the Board Risk Committee of the Board of Directors at least monthly. Loans are placed on nonaccrual status when they are 90 days or more past due
unless, in the judgment of management, the probability of timely collection of interest is deemed to be sufficient to warrant further accrual. When a loan is placed on nonaccrual status, the accrual of interest income ceases and accrued but unpaid
interest attributable to the current year is reversed against interest income. Accrued interest receivable attributable to the prior year is recorded as a charge-off to the allowance for credit losses.
Real estate acquired by the Company through foreclosure or by deed-in-lieu of foreclosure is classified as other real estate owned (“OREO”),
and is recorded at the lesser of the related loan balance (the pro-rata carrying value for acquired loans) or estimated fair value less estimated costs to sell.
Under generally accepted accounting principles, certain loan modifications or restructurings are designated as troubled debt restructurings (“TDRs”). In general, the modification or
restructuring of a debt constitutes a TDR if the Company, for economic or legal reasons related to the borrower’s financial difficulties, grants a concession to the borrower that the Company would not otherwise consider under current market
conditions.
Nonperforming Assets
The Company defines nonperforming assets as nonaccrual loans, accruing loans more than 90 days past due, OREO and foreclosed property. Management continually monitors loans and transfers loans to
nonaccrual status when warranted.
Loans acquired through failed bank acquisitions, referred to as covered loans, are covered by loss sharing
agreements with the FDIC, whereby the FDIC reimburses the Company for the majority of the losses incurred during the loss share claim period. Acquisition date fair values of loans covered by loss sharing agreements were determined without regard to
the loss sharing agreements. In addition to covered loans, the Company also accounts for other loans acquired with deteriorated credit quality, as well as all loans acquired with significant discounts that did not exhibit deteriorated credit quality
at acquisition, in accordance with ASC 310-30. Collectively, all loans accounted for under ASC 310-30 are referred to as purchased impaired loans. Application of ASC 310-30 results in significant accounting differences, compared to loans originated
or acquired by the Company that are not accounted for under ASC 310-30. At acquisition, purchased impaired loans were individually evaluated and assigned to loan pools based on common risk characteristics, which included loan performance at the time
of acquisition, loan type based on regulatory reporting guidelines, and/or the nature of collateral. The acquisition date fair values of each pool were estimated based on the expected cash flows of the underlying loans. Certain loan level
information, including outstanding principal balance, maturity, term to re-price (if a variable rate loan), and interest rate were used to estimate the expected cash flows for each loan pool. ASC 310-30 does not permit carry over or recognition of
an allowance for credit losses at acquisition. Credit quality deterioration, also referred to as credit losses, evident at acquisition with individual loans was reflected in the acquisition date fair value through the reduction of cash flows
expected to be received over the life of loans. A provision for credit losses is recognized and an allowance for credit losses is recorded subsequent to acquisition to the event that re-estimated expected losses exceed losses estimated at
acquisition. Purchased impaired loans were considered to be performing as of the acquisition date regardless of their past due status based on their contractual terms. In accordance with regulatory reporting guidelines, purchased impaired loans that
are contractually past due are reported as past due and accruing based on the number of days past due.
Due to the significant difference in
the accounting for covered loans and the related FDIC loss sharing agreements, as well as non-covered acquired loans accounted for as purchased impaired loans, and given the significant amount of acquired impaired loans that are past due but still
accruing, the Company believes inclusion of these loans in certain asset quality ratios that reflect nonperforming assets in the numerator or denominator (or both) results in significant distortion to these ratios. In addition, because loan level
charge-offs related to purchased impaired loans are not recognized in the financial statements until the cumulative amounts exceed the original loss projections on a pool basis, the net charge-off ratio for acquired loans is not consistent with the
net charge-off ratio for other loan portfolios. The inclusion of these loans in certain asset quality ratios could result in a lack of comparability across quarters or years, and could impact comparability with other portfolios that were not
impacted by purchased impaired loan accounting. The Company believes that the presentation of certain asset quality measures excluding either covered loans or all purchased impaired loans, as indicated below, and related amounts from both the
numerator and denominator provides better perspective into underlying trends related to the quality of its loan portfolio. Accordingly, the asset quality measures in the tables below present asset quality information excluding either covered loans
or all purchased impaired loans, as indicated within each table, and related amounts.
Nonperforming assets excluding purchased impaired loans
decreased $2.0 million, or 2.6%, as compared to December 31, 2011. The decrease resulted from a $7.0 million decrease in nonperforming loans, primarily attributable to a decrease in nonaccrual loans, which
was partially offset by a $5.0 million increase in OREO. The Company’s ongoing business strategy of maximizing shareholder return includes periodic review of the branch network. This
periodic review resulted in the closure of ten branches during 2012, resulting in $4.2 million of the total $5.0 million increase in OREO. The remaining $0.8 million increase represents real estate acquired through foreclosure.
The following table sets forth the composition of the Company’s non-covered nonperforming assets, including accruing loans past due 90 or more days
and TDRs, as of December 31, 2012 and December 31, 2011.
TABLE 8—NONPERFORMING ASSETS AND TROUBLED DEBT
RESTRUCTURINGS
(EXCLUDING ACQUIRED LOANS)
|
|
|
|
|
|
|
|
|
|
|
|
|
|
|
|
|
| (Dollars in thousands) |
|
December 31, 2012 |
|
|
December 31, 2011 |
|
|
Increase/ (Decrease) |
|
| Nonaccrual loans: |
|
|
|
|
|
|
|
|
|
|
|
|
|
|
|
|
| Commercial and business banking |
|
$ |
32,312 |
|
|
$ |
42,655 |
|
|
$ |
(10,343 |
) |
|
|
(24.2 |
)% |
| Mortgage |
|
|
8,367 |
|
|
|
4,910 |
|
|
|
3,457 |
|
|
|
70.4 |
|
| Consumer and credit card |
|
|
7,237 |
|
|
|
6,889 |
|
|
|
348 |
|
|
|
5.1 |
|
|
|
|
|
|
|
|
|
|
|
|
|
|
|
|
|
|
| Total nonaccrual loans |
|
|
47,916 |
|
|
|
54,454 |
|
|
|
(6,538 |
) |
|
|
(12.0 |
) |
| Accruing loans 90 days or more past due |
|
|
1,371 |
|
|
|
1,841 |
|
|
|
(470 |
) |
|
|
(25.5 |
) |
|
|
|
|
|
|
|
|
|
|
|
|
|
|
|
|
|
| Total nonperforming loans (1) |
|
|
49,287 |
|
|
|
56,295 |
|
|
|
(7,008 |
) |
|
|
(12.4 |
) |
| OREO and foreclosed property(2) |
|
|
26,380 |
|
|
|
21,382 |
|
|
|
4,998 |
|
|
|
23.4 |
|
|
|
|
|
|
|
|
|
|
|
|
|
|
|
|
|
|
| Total nonperforming assets (1) |
|
|
75,667 |
|
|
|
77,677 |
|
|
|
(2,010 |
) |
|
|
(2.6 |
) |
| Troubled debt restructurings in compliance with modified terms(3) |
|
|
2,354 |
|
|
|
55 |
|
|
|
2,299 |
|
|
|
4,211.9 |
|
|
|
|
|
|
|
|
|
|
|
|
|
|
|
|
|
|
| Total nonperforming assets and troubled debt restructurings (1) |
|
$ |
78,021 |
|
|
$ |
77,732 |
|
|
$ |
289 |
|
|
|
0.4 |
% |
|
|
|
|
|
|
|
|
|
|
|
|
|
|
|
|
|
| Nonperforming loans to total loans (1)(4) |
|
|
0.73 |
% |
|
|
1.05 |
% |
|
|
|
|
|
|
|
|
| Nonperforming assets to total assets (1)(4) |
|
|
0.69 |
% |
|
|
0.86 |
% |
|
|
|
|
|
|
|
|
| Nonperforming assets and troubled debt restructurings to total assets (1)(4) |
|
|
0.71 |
% |
|
|
0.86 |
% |
|
|
|
|
|
|
|
|
| Allowance for credit losses to nonperforming loans (4)(5) |
|
|
150.57 |
% |
|
|
132.98 |
% |
|
|
|
|
|
|
|
|
| Allowance for credit losses to total loans(4)(5) |
|
|
1.10 |
% |
|
|
1.40 |
% |
|
|
|
|
|
|
|
|
|
|
|
|
|
|
|
|
|
|
|
|
|
|
|
|
|
| (1) |
Nonperforming loans and assets include accruing loans 90 days or more past due. |
| (2) |
OREO and foreclosed property at December 31, 2012 and 2011 include $9,199,000 and $5,722,000, respectively, of former bank properties held for
development or resale. |
| (3) |
Troubled debt restructurings in compliance with modified terms for December 31, 2012 and December 31, 2011 above do not include $15,356,000
and $23,898,000 in troubled debt restructurings included in total nonaccrual loans above. |
| (4) |
Total loans and
total assets exclude loans and assets covered by FDIC loss share agreements and acquired loans discussed below. |
| (5) |
The allowance for
credit losses excludes the portion of the allowance related to covered loans and acquired non-covered loans discussed below. |
|
|
|
|
|
|
|
|
|
|
|
|
|
|
|
|
|
|
|
|
|
| (Dollars in thousands) |
|
2012 |
|
|
2011 |
|
|
2010 |
|
|
2009 |
|
|
2008 |
|
| Nonaccrual loans: |
|
|
|
|
|
|
|
|
|
|
|
|
|
|
|
|
|
|
|
|
| Commercial and business banking |
|
$ |
32,312 |
|
|
$ |
42,655 |
|
|
$ |
35,457 |
|
|
$ |
31,029 |
|
|
$ |
21,433 |
|
| Mortgage |
|
|
8,367 |
|
|
|
4,910 |
|
|
|
5,917 |
|
|
|
3,314 |
|
|
|
2,423 |
|
| Consumer |
|
|
7,237 |
|
|
|
6,889 |
|
|
|
8,122 |
|
|
|
5,504 |
|
|
|
3,969 |
|
|
|
|
|
|
|
|
|
|
|
|
|
|
|
|
|
|
|
|
|
|
| Total nonaccrual loans |
|
|
47,916 |
|
|
|
54,454 |
|
|
|
49,496 |
|
|
|
39,847 |
|
|
|
27,825 |
|
| Accruing loans 90 days or more past due |
|
|
1,371 |
|
|
|
1,841 |
|
|
|
1,455 |
|
|
|
4,960 |
|
|
|
2,481 |
|
|
|
|
|
|
|
|
|
|
|
|
|
|
|
|
|
|
|
|
|
|
| Total nonperforming loans |
|
|
49,287 |
|
|
|
56,295 |
|
|
|
50,951 |
|
|
|
44,807 |
|
|
|
30,306 |
|
| Foreclosed property |
|
|
26,380 |
|
|
|
21,382 |
|
|
|
18,496 |
|
|
|
15,281 |
|
|
|
16,312 |
|
|
|
|
|
|
|
|
|
|
|
|
|
|
|
|
|
|
|
|
|
|
| Total nonperforming assets |
|
|
75,667 |
|
|
|
77,677 |
|
|
|
69,447 |
|
|
|
60,088 |
|
|
|
46,618 |
|
| Troubled debt restructurings in compliance with modified terms |
|
|
2,354 |
|
|
|
55 |
|
|
|
14,968 |
|
|
|
— |
|
|
|
— |
|
|
|
|
|
|
|
|
|
|
|
|
|
|
|
|
|
|
|
|
|
|
| Total nonperforming assets and troubled debt restructurings |
|
$ |
78,021 |
|
|
$ |
77,732 |
|
|
$ |
84,415 |
|
|
$ |
60,088 |
|
|
$ |
46,618 |
|
|
|
|
|
|
|
|
|
|
|
|
|
|
|
|
|
|
|
|
|
|
| Nonperforming loans to total loans |
|
|
0.73 |
% |
|
|
1.05 |
% |
|
|
1.14 |
% |
|
|
1.09 |
% |
|
|
0.81 |
% |
| Nonperforming assets to total assets |
|
|
0.69 |
% |
|
|
0.86 |
% |
|
|
0.91 |
% |
|
|
0.91 |
% |
|
|
0.83 |
% |
| Nonperforming assets and troubled debt restructurings to total assets |
|
|
0.71 |
% |
|
|
0.86 |
% |
|
|
1.10 |
% |
|
|
0.91 |
% |
|
|
0.83 |
% |
| Allowance for credit losses to nonperforming loans |
|
|
150.57 |
% |
|
|
132.98 |
% |
|
|
122.59 |
% |
|
|
124.14 |
% |
|
|
134.87 |
% |
| Allowance for credit losses to total loans |
|
|
1.10 |
% |
|
|
1.40 |
% |
|
|
1.40 |
% |
|
|
1.36 |
% |
|
|
1.09 |
% |
|
|
|
|
|
|
|
|
|
|
|
|
|
|
|
|
|
|
|
|
|
Nonperforming loans were 0.73% of total legacy loans at December 31, 2012, 32 basis points lower than at
December 31, 2011. If covered loans and acquired loans accounted for in pools that meet nonperforming criteria are included, nonperforming loans were 6.42% of total loans at December 31, 2012 and 10.13% at December 31, 2011. The
allowance for credit losses as a percentage of nonperforming loans was 150.6% at December 31, 2012 and 133.0% at December 31, 2011. Including covered loans and pooled loans, the allowance coverage of total loans was 2.96% at
December 31, 2012 and 2.62% at December 31, 2011.
Nonperforming asset balances as a percentage of total assets have remained at
relatively low levels. Total nonperforming assets were 0.69% of non-covered assets at December 31, 2012, 17 basis points below December 31, 2011. Consistent with the improvement in asset quality, the Company’s reserve for credit
losses as a percentage of loans excluding reserves for acquired loans decreased 30 basis points to 1.10% at December 31, 2012.
Loans
defined as TDRs not included in nonperforming assets increased to $2.4 million at the end of 2012. Total TDRs not covered by loss share agreements totaled $17.7 million at December 31, 2012, $6.2 million, or 26.1%, lower than December 31,
2011. 20 credits totaling $4.6 million were added as TDRs in 2012, but these additions were offset by loan payments and charge-offs in 2012.
The Company had gross charge-offs on non-covered loans of $9.9 million during the twelve months ended December 31, 2012. Offsetting these
charge-offs were recoveries of $5.3 million. As a result, net charge-offs on non-covered loans during the year were $4.6 million, or 0.07% of average loans, as compared to net charge-offs of $7.6 million, or 0.13%, in 2011.
At December 31, 2012, excluding loans covered by the FDIC loss share agreements, the Company had $228.7 million of assets classified as substandard,
$2.9 million of assets classified as doubtful, and no assets classified as loss (before the application of loan discounts to acquired loans). At such date, the aggregate of the Company’s classified assets was 1.98% of total assets, 2.72% of
total loans, and 3.13% of non-covered loans. At December 31, 2011, the aggregate of the Company’s classified assets, $199.9 million, was 1.75% of total assets, 2.79% of total loans, and 3.40% of non-covered loans. The increase in total
classified assets was a result of Florida Gulf loans acquired during the current year. A reserve for credit losses has been recorded for all substandard loans at December 31, 2012 according to the Company’s allowance policy. Excluding
purchased impaired loans, the Company’s classified assets totaled $176.0 million, compared to $157.0 million at December 31, 2011. The $19.0 million increase was a result primarily of eight credits added during the current year for $29.5
million and was not an indicator of overall asset quality deterioration.
In addition to the problem loans described above, excluding covered
loans, there were $122.1 million of loans classified special mention at December 31, 2012, which in management’s opinion were subject to potential future rating downgrades. Special mention loans are defined as loans where known information
about possible credit problems of the borrowers cause management to have some doubt as to the ability of these borrowers to comply with the present loan repayment terms and which may result in future disclosure of these loans
as nonperforming. Special mention loans decreased $84.3 million, or 40.8%, from December 31, 2011, many of which moved to substandard status noted above.
Past Due Loans
Past due status
is based on the contractual terms of loans. The majority of the Company’s non-covered portfolio exhibited an improvement in past due status from the end of the previous year.
At December 31, 2012, total past due loans excluding covered loans were 1.71% of total loans, a decrease of 26 basis points from December 31, 2011. Including covered loans, loans past due 30
days or more were 6.76% of total loans before discount adjustments at December 31, 2012 and 10.57% at December 31, 2011. Past due non-covered loans (including nonaccrual loans) increased $7.1 million, or 5.9%, from December 31, 2011,
and can be attributed to the $13.3 million in past due loans acquired from Florida Gulf during 2012. Additional information on the Company’s non-covered past due loans is presented in the following table.
TABLE 9—PAST DUE NON-COVERED LOAN SEGREGATION
|
|
|
|
|
|
|
|
|
|
|
|
|
|
|
|
|
|
|
|
|
|
|
|
|
| (Dollars in thousands) |
|
December 31, 2012 |
|
| |
|
Non-acquired |
|
|
Acquired |
|
|
Total |
|
| |
|
Amount |
|
|
% of
Outstanding
Balance |
|
|
Amount |
|
|
% of
Outstanding
Balance |
|
|
Amount |
|
|
% of
Outstanding
Balance |
|
| Accruing loans |
|
|
|
|
|
|
|
|
|
|
|
|
|
|
|
|
|
|
|
|
|
|
|
|
| 30-59 days past due |
|
$ |
10,349 |
|
|
|
0.15 |
% |
|
$ |
10,502 |
|
|
|
1.42 |
% |
|
$ |
20,851 |
|
|
|
0.28 |
% |
| 60-89 days past due |
|
|
2,447 |
|
|
|
0.04 |
|
|
|
2,499 |
|
|
|
0.34 |
|
|
|
4,946 |
|
|
|
0.07 |
|
| 90-119 days past due |
|
|
489 |
|
|
|
0.01 |
|
|
|
82 |
|
|
|
0.01 |
|
|
|
571 |
|
|
|
0.01 |
|
| 120 days past due or more |
|
|
882 |
|
|
|
0.01 |
|
|
|
323 |
|
|
|
0.04 |
|
|
|
1,205 |
|
|
|
0.02 |
|
|
|
|
|
|
|
|
|
|
|
|
|
|
|
|
|
|
|
|
|
|
|
|
|
|
| Total Accruing Loans |
|
|
14,167 |
|
|
|
0.21 |
|
|
|
13,406 |
|
|
|
1.81 |
|
|
|
27,573 |
|
|
|
0.37 |
|
| Nonaccrual loans (1) |
|
|
47,917 |
|
|
|
0.71 |
|
|
|
52,376 |
|
|
|
7.06 |
|
|
|
100,293 |
|
|
|
1.34 |
|
|
|
|
|
|
|
|
|
|
|
|
|
|
|
|
|
|
|
|
|
|
|
|
|
|
| Total past due loans |
|
$ |
62,084 |
|
|
|
0.92 |
% |
|
$ |
65,782 |
|
|
|
8.87 |
% |
|
$ |
127,866 |
|
|
|
1.71 |
% |
|
|
|
|
|
|
|
|
|
|
|
|
|
|
|
|
|
|
|
|
|
|
|
|
|
|
|
|
|
|
|
|
|
|
|
|
|
|
|
|
|
|
|
|
|
|
|
|
|
|
| (Dollars in thousands) |
|
December 31, 2011 |
|
| |
|
Non-acquired |
|
|
Acquired |
|
|
Total |
|
| |
|
Amount |
|
|
% of
Outstanding
Balance |
|
|
Amount |
|
|
% of
Outstanding
Balance |
|
|
Amount |
|
|
% of
Outstanding
Balance |
|
| Accruing loans |
|
|
|
|
|
|
|
|
|
|
|
|
|
|
|
|
|
|
|
|
|
|
|
|
| 30-59 days past due |
|
$ |
7,329 |
|
|
|
0.14 |
% |
|
$ |
11,242 |
|
|
|
1.45 |
% |
|
$ |
18,571 |
|
|
|
0.30 |
% |
| 60-89 days past due |
|
|
1,786 |
|
|
|
0.03 |
|
|
|
4,844 |
|
|
|
0.62 |
|
|
|
6,630 |
|
|
|
0.11 |
|
| 90-119 days past due |
|
|
1,017 |
|
|
|
0.02 |
|
|
|
1,270 |
|
|
|
0.17 |
|
|
|
2,287 |
|
|
|
0.04 |
|
| 120 days past due or more |
|
|
824 |
|
|
|
0.01 |
|
|
|
644 |
|
|
|
0.08 |
|
|
|
1,468 |
|
|
|
0.02 |
|
|
|
|
|
|
|
|
|
|
|
|
|
|
|
|
|
|
|
|
|
|
|
|
|
|
| Total Accruing Loans |
|
|
10,956 |
|
|
|
0.20 |
|
|
|
18,000 |
|
|
|
2.32 |
|
|
|
28,956 |
|
|
|
0.47 |
|
| Nonaccrual loans (1) |
|
|
54,454 |
|
|
|
1.02 |
|
|
|
37,323 |
|
|
|
4.81 |
|
|
|
91,777 |
|
|
|
1.50 |
|
|
|
|
|
|
|
|
|
|
|
|
|
|
|
|
|
|
|
|
|
|
|
|
|
|
| Total past due loans |
|
$ |
65,410 |
|
|
|
1.22 |
% |
|
$ |
55,323 |
|
|
|
7.13 |
% |
|
$ |
120,733 |
|
|
|
1.97 |
% |
|
|
|
|
|
|
|
|
|
|
|
|
|
|
|
|
|
|
|
|
|
|
|
|
|
| (1) |
For acquired
loans, balance represents the outstanding balance of loans that would otherwise meet the Company’s definition of nonaccrual loans. |
The $7.1 million increase in non-covered past due loans was the result of an $8.5 million increase in nonaccrual loans, offset by a $1.4 million decrease in accruing loans past due from 2011. Loans past
due at December 31, 2012 that were acquired from Florida Gulf totaled $13.3 million. Excluding these acquired loans, non-covered loans past due were $114.6 million, a decrease of $6.2 million, or 5.1% from December 31, 2011.
Commercial nonaccrual loans increased $3.3 million, or 4.3%, and mortgage nonaccrual loans increased $4.2 million, while consumer nonaccrual loans
increased $1.0 million since December 31, 2011. The increase in consumer nonaccrual loans was a result of the placement of past due consumer loans on nonaccrual status during 2012 in response to their continued past due status. The movement of
these loans to nonaccrual status in the current year helped to drive the decrease in accruing consumer loans past due (excluding past due loans acquired from OMNI, Cameron, and Florida Gulf) from December 31, 2011, from $6.4 million to $6.0
million, a 5.1% decrease.
In the Company’s non-covered commercial loan portfolio, total accruing loans past due increased $0.1 million,
or 0.3%, from December 31, 2011. The total increase was a result of a limited number of past due loans in the Company’s legacy portfolio, as past due commercial loans acquired in 2011 and 2012 decreased $3.0 million, or 22.8%. The $3.1
million increase in legacy commercial loans was driven by a $3.3 million increase in commercial loans past due less than 60 days, which the Company does not consider a significant indicator of a decline in overall commercial loan credit quality.
Total commercial loans past due less than 60 days were 0.10% of non-acquired commercial loans at December 31, 2012.
Total non-covered mortgage loans past due increased $0.1 million, or 3.8%, during 2012. Although asset
quality has declined in the mortgage portfolio, 69.4% of the past due loans were past due less than 90 days, including 25.3% past due less than 60 days. At December 31, 2011, those percentages were 49.1% and 33.9%, respectively. Management is
continually monitoring the past due status of these mortgage loans for indicators of overall asset quality issues. Past due loans in the acquired mortgage loan portfolio decreased $0.4 million from December 31, 2011.
Covered Loans
The loans and
foreclosed real estate that were acquired in the CSB, Orion, Century, and Sterling acquisitions in 2009 and 2010 are covered by loss share agreements between the FDIC and IBERIABANK, which afford IBERIABANK significant loss protection. As a result
of the loss protection provided by the FDIC, the risk of loss on the acquired loans and foreclosed real estate is significantly different from those assets not covered under the loss share agreements.
As described above, covered assets were recorded at their acquisition date fair values.
Although covered loans are not included in the Company’s nonperforming assets, in accordance with bank regulatory reporting standards, both acquired loans considered impaired at the time of
acquisition and those performing at the time of acquisition that meet the Company’s definition of a nonperforming loan at each balance sheet date are discussed below. Included in the discussion are all covered loans that are contractually past
due based on the number of days past due. Certain measures of the asset quality of covered loans are discussed below. Loan balances are reported before consideration of applied loan discounts, as these discounts were recorded based on the estimated
cash flow of the total loan pool and not on a specific loan basis. The loss share agreements with the FDIC limit the Company’s exposure to loss during the loss claim period to no more than 20% of incurred losses for all covered loans and as
little as 5% of incurred losses for certain loans. Therefore, balances discussed below are for general comparative purposes only and do not represent the Company’s risk of loss on covered assets.
TABLE 10—PAST DUE COVERED LOAN SEGREGATION
|
|
|
|
|
|
|
|
|
|
|
|
|
|
|
|
|
| (Dollars in thousands) |
|
December 31, 2012 |
|
|
December 31, 2011 |
|
| |
|
Amount |
|
|
% of
Outstanding
Balance |
|
|
Amount |
|
|
% of
Outstanding
Balance |
|
| Accruing loans |
|
|
|
|
|
|
|
|
|
|
|
|
|
|
|
|
| 30-59 days past due |
|
$ |
14,799 |
|
|
|
1.16 |
% |
|
$ |
48,903 |
|
|
|
2.76 |
% |
| 60-89 days past due |
|
|
7,303 |
|
|
|
0.57 |
|
|
|
12,362 |
|
|
|
0.70 |
|
| 90-119 days past due |
|
|
2,376 |
|
|
|
0.18 |
|
|
|
9,306 |
|
|
|
0.52 |
|
| 120 days past due or more |
|
|
252 |
|
|
|
0.02 |
|
|
|
15,942 |
|
|
|
0.90 |
|
|
|
|
|
|
|
|
|
|
|
|
|
|
|
|
|
|
| Total Accruing Loans |
|
|
24,730 |
|
|
|
1.93 |
|
|
|
86,513 |
|
|
|
4.88 |
|
| Nonaccrual loans (1) |
|
|
440,575 |
|
|
|
34.40 |
|
|
|
627,459 |
|
|
|
35.37 |
|
|
|
|
|
|
|
|
|
|
|
|
|
|
|
|
|
|
| Total past due loans |
|
$ |
465,305 |
|
|
|
36.33 |
% |
|
$ |
713,972 |
|
|
|
40.25 |
% |
|
|
|
|
|
|
|
|
|
|
|
|
|
|
|
|
|
| (1) |
For covered loans,
balance represents the outstanding balance of loans that would otherwise meet the Company’s definition of nonaccrual loans. |
Total covered loans past due at December 31, 2012 totaled $465.3 million before discounts, a decrease of $248.7 million, or 34.8%, from December 31, 2011. Past due loans at the end of 2012
included $440.6 million in loans that would otherwise meet the Company’s definition of nonaccrual loans and $24.7 million in accruing loans past due greater than 30 days. Of the $24.7 million in accruing loans past due, $22.1 million, or 89.4%,
were past due less than 90 days. The indemnification agreements on covered assets include a provision for recapture of a portion of interest if the interest is included in total losses on the covered asset.
Of the $248.7 million decrease in covered loans past due, loans past due 30 to 89 days decreased $39.2 million, or 63.9%, while nonperforming loans
(defined as accruing loans greater than 90 days past due and loans that meet the definition of nonaccrual loans) decreased $209.5 million, or 32.1%. These decreases were a result primarily of payments on the loan balances during the current year.
Allowance for Credit Losses
The allowance for credit losses represents management’s best estimate of probable credit losses inherent at the balance sheet date. Determination of the allowance for credit losses involves a high
degree of complexity and requires significant judgment. Several factors are taken into consideration in the determination of the overall allowance for credit losses, including a qualitative component. These factors include, but are not limited to,
the overall risk profiles of the loan portfolios, net charge-off experience, the extent of impaired loans, the level of nonaccrual loans, the level of 90 days past due loans and the overall percentage level of the allowance. The Company also
considers overall asset quality trends, changes in lending and risk management practices and procedures, trends in the nature and volume of the loan portfolio, including the existence and effect of any portfolio concentrations, changes in experience
and depth of lending staff, legal, regulatory and competitive environment, national and regional economic trends, and data availability and
applicability that might impact the portfolio. See the “Application of Critical Account Policies and Estimates” section for more information.
During 2012, the Company did not substantively change any material aspect of its overall approach in the determination of the allowance for credit losses
and there have been no material changes in assumptions or estimation techniques as compared to prior periods that impacted the determination of the current period allowance.
Certain inherent, but unconfirmed losses are probable within the loan portfolio. The Company’s current methodology for determining the level of losses is based on historical loss rates, current
credit grades, specific allocation and other qualitative adjustments. In a stable or deteriorating credit environment, heavy reliance on historical loss rates and the credit grade rating process, results in model-derived required reserves that tend
to slightly lag behind portfolio deterioration. Similar lags can occur in an improving credit environment whereby required reserves can lag slightly behind portfolio improvement. Given these model limitations, qualitative adjustment factors may be
incremental or decremental to the quantitative model results.
The manner in which the allowance for credit losses is determined is based on
the accounting method applied to the underlying loans. The Company delineates between loans accounted for under the contractual yield method, primarily legacy loans, and loans accounted for as purchased impaired loans, primarily acquired loans.
Legacy Loans
Legacy
loans represent loans accounted for under the contractual yield method. The Company’s legacy loans include loans originated by the Company and acquired loans that are not accounted for as acquired credit impaired loans. See the
“Application of Critical Account Policies and Estimates” for more information.
Acquired Loans
Acquired loans, which include covered loans and certain non-covered loans, represent loans acquired by the Company that are accounted for in accordance
with ASC 310-30. See discussion above, as well as the “Application of Critical Account Policies and Estimates” section for more information.
Loans acquired in business combinations were recorded at their acquisition date fair values, which were based on expected cash flows and included estimates of expected future credit losses. Under current
accounting principles, information regarding the Company’s estimates of loan fair values may be adjusted for a period of up to one year as the Company continues to refine its estimate of expected future cash flows in the acquired portfolio.
Within a one-year period, if the Company discovers that it has materially underestimated the credit losses expected in the loan portfolio based on information available at the acquisition date, it will retroactively reduce or eliminate the gain
and/or increase goodwill recorded on the acquisition. If the Company determines that losses arose after the acquisition date, the additional losses will be reflected as a provision for credit losses.
At December 31, 2012, the Company had an allowance for credit losses of $168.6 million to reserve for probable losses currently in the covered loan
portfolio arising after the losses estimated at the respective acquisition dates. In addition, during the year ended December 31, 2012, the Company recorded an allowance for credit losses of $8.8 million to reserve for expected losses currently
in the non-covered acquired loan portfolios that have arisen after the losses estimated at the respective acquisition dates.
Based on facts
and circumstances available, management of the Company believes that the allowance for credit losses was appropriate at December 31, 2012 to cover probable losses in the Company’s loan portfolio. However, future adjustments to the
allowance may be necessary, and the Company’s results of operations could be adversely affected, if circumstances differ substantially from the assumptions used by management in determining the allowance for credit losses.
The following tables set forth the activity in the Company’s allowance for credit losses for the periods indicated.
TABLE 11—SUMMARY OF ACTIVITY IN THE ALLOWANCE FOR CREDIT LOSSES
|
|
|
|
|
|
|
|
|
|
|
|
|
|
|
|
|
|
|
|
|
| (Dollars in thousands) |
|
2012 |
|
|
2011 |
|
|
2010 |
|
|
2009 |
|
|
2008 |
|
| Balance, beginning of year |
|
$ |
193,761 |
|
|
$ |
136,100 |
|
|
$ |
55,768 |
|
|
$ |
40,872 |
|
|
$ |
38,285 |
|
| Transfer of balance to OREO |
|
|
(27,169 |
) |
|
|
(17,143 |
) |
|
|
— |
|
|
|
— |
|
|
|
— |
|
| Provision charged to operations |
|
|
20,671 |
|
|
|
25,867 |
|
|
|
42,451 |
|
|
|
45,370 |
|
|
|
12,568 |
|
| Provision recorded through the FDIC loss share receivable |
|
|
84,085 |
|
|
|
57,121 |
|
|
|
64,922 |
|
|
|
147 |
|
|
|
— |
|
| Charge-offs: |
|
|
|
|
|
|
|
|
|
|
|
|
|
|
|
|
|
|
|
|
| Commercial and business banking |
|
|
16,747 |
|
|
|
9,200 |
|
|
|
23,634 |
|
|
|
25,204 |
|
|
|
7,696 |
|
| Mortgage |
|
|
2,376 |
|
|
|
244 |
|
|
|
1,068 |
|
|
|
311 |
|
|
|
128 |
|
| Consumer |
|
|
5,937 |
|
|
|
6,715 |
|
|
|
9,156 |
|
|
|
7,752 |
|
|
|
5,057 |
|
|
|
|
|
|
|
|
|
|
|
|
|
|
|
|
|
|
|
|
|
|
| Total charge-offs |
|
|
25,060 |
|
|
|
16,159 |
|
|
|
33,858 |
|
|
|
33,267 |
|
|
|
12,881 |
|
| Recoveries: |
|
|
|
|
|
|
|
|
|
|
|
|
|
|
|
|
|
|
|
|
| Commercial and business banking |
|
|
3,293 |
|
|
|
5,516 |
|
|
|
4,863 |
|
|
|
1,016 |
|
|
|
1,164 |
|
| Mortgage |
|
|
38 |
|
|
|
170 |
|
|
|
77 |
|
|
|
67 |
|
|
|
56 |
|
| Consumer |
|
|
1,984 |
|
|
|
2,289 |
|
|
|
1,877 |
|
|
|
1,563 |
|
|
|
1,680 |
|
|
|
|
|
|
|
|
|
|
|
|
|
|
|
|
|
|
|
|
|
|
| Total recoveries |
|
|
5,315 |
|
|
|
7,975 |
|
|
|
6,817 |
|
|
|
2,646 |
|
|
|
2,900 |
|
|
|
|
|
|
|
|
|
|
|
|
|
|
|
|
|
|
|
|
|
|
| Net charge-offs |
|
|
19,745 |
|
|
|
8,184 |
|
|
|
27,041 |
|
|
|
30,621 |
|
|
|
9,981 |
|
|
|
|
|
|
|
|
|
|
|
|
|
|
|
|
|
|
|
|
|
|
| Balance, end of year |
|
$ |
251,603 |
|
|
$ |
193,761 |
|
|
$ |
136,100 |
|
|
$ |
55,768 |
|
|
$ |
40,872 |
|
| Allowance for credit losses to nonperforming assets (1) (2) |
|
|
88.3 |
% |
|
|
96.4 |
% |
|
|
89.9 |
% |
|
|
92.6 |
% |
|
|
87.7 |
% |
| Allowance for credit losses to total loans at end of period(2) |
|
|
1.12 |
% |
|
|
1.24 |
% |
|
|
1.40 |
% |
|
|
0.96 |
% |
|
|
1.09 |
% |
| Net charge-offs to average loans (3) |
|
|
0.07 |
% |
|
|
0.13 |
% |
|
|
0.47 |
% |
|
|
0.73 |
% |
|
|
0.28 |
% |
|
|
|
|
|
|
|
|
|
|
|
|
|
|
|
|
|
|
|
|
|
| (1) |
Nonperforming
assets include accruing loans 90 days or more past due. |
| (2) |
For
December 31, 2012, 2011, 2010 and 2009, the allowance for credit losses in the calculation does not include the allowance allocated to covered assets. |
| (3) |
Net charge-offs
exclude charge-offs and recoveries on covered loans. |
TABLE 12—SUMMARY OF ACTIVITY BY LOAN TYPE
|
|
|
|
|
|
|
|
|
|
|
|
|
|
|
|
|
| (In thousands) |
|
December 31, 2012 |
|
| |
|
|
|
|
Non-covered loans |
|
|
|
|
| |
|
Covered
Loans |
|
|
Legacy
Loans |
|
|
Acquired
Loans |
|
|
Total |
|
| Balance, beginning of year |
|
$ |
118,900 |
|
|
$ |
74,861 |
|
|
$ |
— |
|
|
$ |
193,761 |
|
| Provision for credit losses before benefit attributable to FDIC loss share agreements |
|
|
91,153 |
|
|
|
3,804 |
|
|
|
9,799 |
|
|
|
104,756 |
|
| Benefit attributable to FDIC loss share agreements |
|
|
(84,085 |
) |
|
|
— |
|
|
|
— |
|
|
|
(84,085 |
) |
|
|
|
|
|
|
|
|
|
|
|
|
|
|
|
|
|
| Net provision for credit losses |
|
|
7,068 |
|
|
|
3,804 |
|
|
|
9,799 |
|
|
|
20,671 |
|
| Increase in FDIC loss share receivable |
|
|
84,085 |
|
|
|
— |
|
|
|
— |
|
|
|
84,085 |
|
| Transfer of balance to OREO |
|
|
(26,343 |
) |
|
|
— |
|
|
|
(826 |
) |
|
|
(27,169 |
) |
| Loan charge-offs |
|
|
(15,153 |
) |
|
|
(9,728 |
) |
|
|
(179 |
) |
|
|
(25,060 |
) |
| Recoveries |
|
|
19 |
|
|
|
5,274 |
|
|
|
22 |
|
|
|
5,315 |
|
|
|
|
|
|
|
|
|
|
|
|
|
|
|
|
|
|
| Balance, end of year |
|
$ |
168,576 |
|
|
$ |
74,211 |
|
|
$ |
8,816 |
|
|
$ |
251,603 |
|
|
|
|
|
|
|
|
|
|
|
|
|
|
|
|
|
|
|
|
|
|
|
|
|
|
|
|
|
|
|
|
|
|
|
| (In thousands) |
|
December 31, 2011 |
|
| |
|
|
|
|
Non-covered loans |
|
|
|
|
| |
|
Covered
Loans |
|
|
Legacy
Loans |
|
|
Acquired
Loans |
|
|
Total |
|
| Balance, beginning of year |
|
$ |
73,640 |
|
|
$ |
62,460 |
|
|
$ |
— |
|
|
$ |
136,100 |
|
| Provision for credit losses before benefit attributable to FDIC loss share agreements |
|
|
63,014 |
|
|
|
19,974 |
|
|
|
— |
|
|
|
82,988 |
|
| Benefit attributable to FDIC loss share agreements |
|
|
(57,121 |
) |
|
|
— |
|
|
|
— |
|
|
|
(57,121 |
) |
|
|
|
|
|
|
|
|
|
|
|
|
|
|
|
|
|
| Net provision for credit losses |
|
|
5,893 |
|
|
|
19,974 |
|
|
|
— |
|
|
|
25,867 |
|
| Increase in FDIC loss share receivable |
|
|
57,121 |
|
|
|
|
|
|
|
— |
|
|
|
57,121 |
|
| Transfer of balance to OREO |
|
|
(17,143 |
) |
|
|
— |
|
|
|
— |
|
|
|
(17,143 |
) |
| Loan charge-offs |
|
|
(1,137 |
) |
|
|
(15,022 |
) |
|
|
— |
|
|
|
(16,159 |
) |
| Recoveries |
|
|
526 |
|
|
|
7,449 |
|
|
|
— |
|
|
|
7,975 |
|
|
|
|
|
|
|
|
|
|
|
|
|
|
|
|
|
|
| Balance, end of year |
|
$ |
118,900 |
|
|
$ |
74,861 |
|
|
$ |
— |
|
|
$ |
193,761 |
|
|
|
|
|
|
|
|
|
|
|
|
|
|
|
|
|
|
The following table presents the allocation of the allowance for credit losses and the percentage of the
total amount of loans in each loan category listed as of the year indicated.
TABLE 13—ALLOCATION OF THE ALLOWANCE FOR
CREDIT LOSSES
|
|
|
|
|
|
|
|
|
|
|
|
|
|
|
|
|
|
|
|
|
|
|
|
|
|
|
|
|
|
|
|
|
|
|
|
|
|
|
|
|
| |
|
2012 |
|
|
2011 |
|
|
2010 |
|
|
2009 |
|
|
2008 |
|
| |
|
Reserve
% |
|
|
% of
Loans |
|
|
Reserve
% |
|
|
% of
Loans |
|
|
Reserve
% |
|
|
% of
Loans |
|
|
Reserve
% |
|
|
% of
Loans |
|
|
Reserve
% |
|
|
% of
Loans |
|
| Commercial |
|
|
71 |
% |
|
|
73 |
% |
|
|
73 |
% |
|
|
73 |
% |
|
|
59 |
% |
|
|
69 |
% |
|
|
78 |
% |
|
|
65 |
% |
|
|
78 |
% |
|
|
63 |
% |
| Mortgage |
|
|
10 |
|
|
|
5 |
|
|
|
11 |
|
|
|
7 |
|
|
|
22 |
|
|
|
10 |
|
|
|
3 |
|
|
|
17 |
|
|
|
3 |
|
|
|
13 |
|
| Consumer |
|
|
19 |
|
|
|
22 |
|
|
|
16 |
|
|
|
20 |
|
|
|
19 |
|
|
|
21 |
|
|
|
19 |
|
|
|
18 |
|
|
|
19 |
|
|
|
24 |
|
| Unallocated |
|
|
— |
|
|
|
— |
|
|
|
— |
|
|
|
— |
|
|
|
— |
|
|
|
— |
|
|
|
— |
|
|
|
— |
|
|
|
— |
|
|
|
— |
|
|
|
|
|
|
|
|
|
|
|
|
|
|
|
|
|
|
|
|
|
|
|
|
|
|
|
|
|
|
|
|
|
|
|
|
|
|
|
|
|
|
| Total allowance for credit losses |
|
|
100 |
% |
|
|
100 |
% |
|
|
100 |
% |
|
|
100 |
% |
|
|
100 |
% |
|
|
100 |
% |
|
|
100 |
% |
|
|
100 |
% |
|
|
100 |
% |
|
|
100 |
% |
|
|
|
|
|
|
|
|
|
|
|
|
|
|
|
|
|
|
|
|
|
|
|
|
|
|
|
|
|
|
|
|
|
|
|
|
|
|
|
|
|
The allowance for credit losses was $251.6 million at December 31, 2012, or 2.96% of total loans, $57.8 million
higher than at December 31, 2011. The allowance as a percentage of loans was 34 basis points above the 2.62% at December 31, 2011.
The increase in the allowance was primarily related to increased reserves on the covered and acquired loan portfolios, but was also a result of reserves
on loan growth for non-acquired loans at December 31, 2012. The allowance for credit losses on the non-covered portion of the Company’s loan portfolio increased primarily due to loan growth during 2012, as asset quality improved over the
prior year as evidenced by continued lower levels of net charge-offs and past due loans. The non-covered allowance for credit losses also includes a reserve of $8.8 million on the Company’s non-covered acquired loans to reserve for losses
probable in those portfolios at December 31, 2012 above estimated expected credit losses at acquisition.
The allowance for credit losses
on covered loans increased $49.7 million, or 41.8%, from December 31, 2011 and was primarily the result of a change in expected cash flows on certain of the Company’s acquired loan pools during 2012. The reserve was adjusted during the
year to cover the additional expected losses in these pools. The increase in the allowance on covered loans was tempered partially by the closure of a limited number of commercial and mortgage loan pools. With the closure of the loan pools, the
remaining recorded investment in the loan pools was charged off against the allowance recorded for the loan pools and certain previously established reserves were reversed. On a gross basis, the Company recorded an additional $91.2 million in the
current year to reserve for these estimated cash flow changes. The allowance on covered loans was reduced, however, by $26.3 million when loan collateral was moved to OREO during 2012 and by $15.1 million for net charge-off activity.
At December 31, 2012, excluding the acquired loan portfolios, the allowance for credit losses covers nonperforming loans 1.5 times. On that same
basis, the allowance for credit losses on non-covered loans covers total past due loans 1.2 times at December 31, 2012. Including acquired loans, the allowance for credit losses covers 64.9% of total past due and nonaccrual loans, an increase
compared to the December 31, 2011 coverage of 62.0%.
FDIC Loss Share Receivable
As part of the FDIC-assisted acquisitions in 2009 and 2010, the Company recorded a $1.0 billion receivable from the FDIC, which represents the fair value
of the expected reimbursable losses covered by the loss share agreements. The FDIC loss share receivable decreased $168.8 million, or 28.5%, during 2012 as the Company claimed reimbursements from the FDIC resulting from loan charge-offs, OREO sales,
and OREO write-downs, included in other assets discussed below. The loss share receivable also decreased as a result of amortization during the year. Offsetting the decreases was an $84.1 million increase to account for either a decrease in expected
cash flows from original loss estimates or additional losses on revised estimates on some of the Company’s covered loan pools.
The following table sets forth the activity in the FDIC loss share receivable asset for the periods
indicated.
TABLE 14—FDIC LOSS SHARE RECEIVABLE ACTIVITY
|
|
|
|
|
|
|
|
|
| |
|
For the Year Ended December 31, |
|
| (In thousands) |
|
2012 |
|
|
2011 |
|
| Balance, beginning of period |
|
$ |
591,844 |
|
|
$ |
726,871 |
|
| Increase due to credit loss provision recorded on FDIC covered loans |
|
|
84,085 |
|
|
|
57,121 |
|
| Amortization |
|
|
(118,100 |
) |
|
|
(72,086 |
) |
| Submission of reimbursable losses to the FDIC |
|
|
(123,986 |
) |
|
|
(117,939 |
) |
| Other |
|
|
(10,774 |
) |
|
|
(2,123 |
) |
|
|
|
|
|
|
|
|
|
| Balance, end of period |
|
$ |
423,069 |
|
|
$ |
591,844 |
|
|
|
|
|
|
|
|
|
|
The Company does not anticipate owing any consideration previously received under indemnification agreements to the FDIC
under the “clawback” provisions of these agreements. Of the three agreements with the FDIC that contain clawback provisions, cumulative losses to date under two of these agreements have exceeded the calculated loss amounts which would
result in clawback if not incurred. The sum of the historical and remaining projected losses under the remaining agreement is in excess of the clawback amount stated in that agreement.
Refer to the “Other Assets” discussion below for additional amounts due from the FDIC related to loss share agreements.
Investment Securities
Investment securities decreased by $47.9 million to $2.0
billion at December 31, 2012. The decrease was due to sales of available for sale investments and maturities and calls of both available for sale and held to maturity investments during the year. These sales and maturities were offset partially
by purchases of investment securities during 2012 and acquired securities of $56.8 million from Florida Gulf. As a percentage of total assets, investment securities decreased to 14.9% of total assets at December 31, 2012, from 17.0% at
December 31, 2011. Investment securities were 18.1% of average earnings assets in the current year and 20.8% in 2011.
The following table shows the carrying values of securities by category as of
December 31st for the years indicated.
TABLE 15—CARRYING VALUE OF SECURITIES
|
|
|
|
|
|
|
|
|
|
|
|
|
|
|
|
|
|
|
|
|
|
|
|
|
|
|
|
|
|
|
|
|
|
|
|
|
|
|
|
|
| (In thousands) |
|
2012 |
|
|
2011 |
|
|
2010 |
|
|
2009 |
|
|
2008 |
|
| Securities available for sale: |
|
|
|
|
|
|
|
|
|
|
|
|
|
|
|
|
|
|
|
|
|
|
|
|
|
|
|
|
|
|
|
|
|
|
|
|
|
|
|
|
| U.S. Government-
sponsored enterprise obligations |
|
$ |
285,724 |
|
|
|
15 |
% |
|
$ |
342,488 |
|
|
|
17 |
% |
|
$ |
422,800 |
|
|
|
21 |
% |
|
$ |
241,168 |
|
|
|
15 |
% |
|
$ |
76,617 |
|
|
|
9 |
% |
| Obligations of state and
political subdivisions |
|
|
127,075 |
|
|
|
7 |
|
|
|
143,805 |
|
|
|
7 |
|
|
|
40,169 |
|
|
|
2 |
|
|
|
50,460 |
|
|
|
3 |
|
|
|
44,681 |
|
|
|
5 |
|
| Mortgage backed securities |
|
|
1,330,656 |
|
|
|
68 |
|
|
|
1,317,374 |
|
|
|
66 |
|
|
|
1,263,869 |
|
|
|
63 |
|
|
|
1,020,939 |
|
|
|
65 |
|
|
|
706,472 |
|
|
|
79 |
|
| Other securities |
|
|
1,549 |
|
|
|
— |
|
|
|
1,538 |
|
|
|
— |
|
|
|
2,956 |
|
|
|
— |
|
|
|
7,909 |
|
|
|
— |
|
|
|
973 |
|
|
|
— |
|
|
|
|
|
|
|
|
|
|
|
|
|
|
|
|
|
|
|
|
|
|
|
|
|
|
|
|
|
|
|
|
|
|
|
|
|
|
|
|
|
|
| Total securities available for sale |
|
|
1,745,004 |
|
|
|
90 |
|
|
|
1,805,205 |
|
|
|
90 |
|
|
|
1,729,794 |
|
|
|
86 |
|
|
|
1,320,476 |
|
|
|
83 |
|
|
|
828,743 |
|
|
|
93 |
|
| Securities held to maturity: |
|
|
|
|
|
|
|
|
|
|
|
|
|
|
|
|
|
|
|
|
|
|
|
|
|
|
|
|
|
|
|
|
|
|
|
|
|
|
|
|
| U.S. Government-
sponsored enterprise obligations |
|
|
69,949 |
|
|
|
4 |
|
|
|
85,172 |
|
|
|
4 |
|
|
|
180,479 |
|
|
|
9 |
|
|
|
155,713 |
|
|
|
10 |
|
|
|
5,031 |
|
|
|
1 |
|
| Obligations of state and
political subdivisions |
|
|
88,909 |
|
|
|
4 |
|
|
|
81,053 |
|
|
|
4 |
|
|
|
75,768 |
|
|
|
4 |
|
|
|
65,540 |
|
|
|
4 |
|
|
|
52,745 |
|
|
|
6 |
|
| Mortgage backed securities |
|
|
46,204 |
|
|
|
2 |
|
|
|
26,539 |
|
|
|
2 |
|
|
|
33,773 |
|
|
|
1 |
|
|
|
39,108 |
|
|
|
3 |
|
|
|
2,957 |
|
|
|
— |
|
|
|
|
|
|
|
|
|
|
|
|
|
|
|
|
|
|
|
|
|
|
|
|
|
|
|
|
|
|
|
|
|
|
|
|
|
|
|
|
|
|
| Total securities held to maturity |
|
|
205,062 |
|
|
|
10 |
|
|
|
192,764 |
|
|
|
10 |
|
|
|
290,020 |
|
|
|
14 |
|
|
|
260,361 |
|
|
|
17 |
|
|
|
60,733 |
|
|
|
7 |
|
|
|
|
|
|
|
|
|
|
|
|
|
|
|
|
|
|
|
|
|
|
|
|
|
|
|
|
|
|
|
|
|
|
|
|
|
|
|
|
|
|
| Total investment securities |
|
$ |
1,950,066 |
|
|
|
100 |
% |
|
$ |
1,997,969 |
|
|
|
100 |
% |
|
$ |
2,019,814 |
|
|
|
100 |
% |
|
$ |
1,580,837 |
|
|
|
100 |
% |
|
$ |
889,476 |
|
|
|
100 |
% |
|
|
|
|
|
|
|
|
|
|
|
|
|
|
|
|
|
|
|
|
|
|
|
|
|
|
|
|
|
|
|
|
|
|
|
|
|
|
|
|
|
All of the Company’s mortgage-backed securities are agency securities. The Company does not hold any Fannie Mae or
Freddie Mac preferred stock, corporate equity, collateralized debt obligations, collateralized loan obligations, or structured investment vehicles, nor does it hold any private label collateralized mortgage obligations, sub-prime, Alt-A, or second
lien elements in its investment portfolio. At December 31, 2012, the Company’s investment portfolio did not contain any securities that are directly backed by subprime or Alt-A mortgages.
The following table summarizes activity in the Company’s investment securities portfolio during 2012. There were no transfers of securities between
investment categories during the year.
TABLE 16—INVESTMENT PORTFOLIO ACTIVITY
|
|
|
|
|
|
|
|
|
| (In thousands) |
|
Available for
Sale |
|
|
Held to
Maturity |
|
| Balance, beginning of year |
|
$ |
1,805,205 |
|
|
$ |
192,764 |
|
| Purchases |
|
|
935,164 |
|
|
|
57,075 |
|
| Acquisitions |
|
|
56,841 |
|
|
|
— |
|
| Sales, net of gains |
|
|
(150,483 |
) |
|
|
— |
|
| Principal maturities, prepayments and calls, net of gains |
|
|
(880,425 |
) |
|
|
(43,500 |
) |
| Amortization of premiums and accretion of discounts |
|
|
(19,736 |
) |
|
|
(1,277 |
) |
| Change in market value |
|
|
(1,562 |
) |
|
|
— |
|
| Other-than-temporary impairment |
|
|
— |
|
|
|
— |
|
|
|
|
|
|
|
|
|
|
| Balance, end of year |
|
$ |
1,745,004 |
|
|
$ |
205,062 |
|
|
|
|
|
|
|
|
|
|
Funds generated as a result of sales and prepayments are used to fund loan growth and purchase other securities. The
Company continues to monitor market conditions and take advantage of market opportunities with appropriate risk and return elements.
The
Company assesses the nature of the losses in its investment portfolio periodically to determine if there are losses that are deemed other-than-temporary. In its analysis of these securities, management considers numerous factors to determine whether
there are instances where the amortized cost basis of the debt securities would not be fully recoverable, including, but not limited to:
| |
• |
the length of time and extent to which the fair value of the securities was less than their amortized cost, |
| |
• |
whether adverse conditions were present in the operations, geographic area, or industry of the issuer, |
| |
• |
the payment structure of the security, including scheduled interest and principal payments, including the issuer’s failures to make scheduled payments, if any, and
the likelihood of failure to make scheduled payments in the future, |
| |
• |
changes to the rating of the security by a rating agency, and |
| |
• |
subsequent recoveries or additional declines in fair value after the balance sheet date. |
Management believes it has considered these factors, as well as all relevant information available, when determining the expected future cash flows of the securities in question. Based on its analysis at
December 31, 2011, the Company recorded an other-than-temporary impairment charge of $0.5 million during the fourth quarter of 2011 on one unrated municipal revenue bond. During the year, management assessed the operating environment of the
bond issuer as adverse and thus concluded the other-than-temporary impairment charge was warranted. The specific impairment was related to the loss of the contracted revenue source required for bond repayment. The additional charge in 2011 brought
the total impairment to 50% of the par value of the bond and provided a fair value of the bonds that was consistent with current market pricing. Because adverse conditions were noted in the operations of the bond issuer, the Company recorded the
other-than-temporary impairment, but noted no further deterioration in the operating environment of the bond issuer. No other declines in the market value of the Company’s investment securities are deemed to be other-than-temporary at
December 31, 2012 and December 31, 2011.
Note 5 of the footnotes to the consolidated financial statements provides further
information on the Company’s investment securities.
Short-term Investments
Short-term investments result from excess funds that fluctuate daily depending on the funding needs of the Company and are currently invested overnight in
interest-bearing deposit accounts at the FHLB of Dallas and Atlanta, the total balance of which earns interest at the current FHLB discount rate. The balance in interest-bearing deposits at other institutions increased $343.7 million, or 90.6%, from
$379.1 million at December 31, 2011 to $722.8 million at December 31, 2012. The primary cause of the increase was deposit growth during 2012 providing available funds to the Company to fund loan growth and pay down its long-term debt, all
in an attempt to improve its net interest margin. The Company’s cash activity is further discussed in the “Liquidity” section below.
Other Assets
The following table details the changes in other
asset balances as of December 31st for the year
indicated.
TABLE 17—OTHER ASSETS COMPOSITION
|
|
|
|
|
|
|
|
|
|
|
|
|
|
|
|
|
|
|
|
|
| (In thousands) |
|
2012 |
|
|
2011 |
|
|
2010 |
|
|
2009 |
|
|
2008 |
|
| Other earning assets |
|
|
|
|
|
|
|
|
|
|
|
|
|
|
|
|
|
|
|
|
| FHLB and FRB stock |
|
$ |
46,216 |
|
|
$ |
60,155 |
|
|
$ |
57,280 |
|
|
$ |
61,716 |
|
|
$ |
29,673 |
|
| Fed funds sold and financing transactions |
|
|
4,875 |
|
|
|
— |
|
|
|
9,038 |
|
|
|
261,421 |
|
|
|
9,866 |
|
| Other interest-bearing assets (1) |
|
|
3,412 |
|
|
|
3,412 |
|
|
|
3,358 |
|
|
|
3,358 |
|
|
|
3,358 |
|
|
|
|
|
|
|
|
|
|
|
|
|
|
|
|
|
|
|
|
|
|
| Total earning assets |
|
|
54,503 |
|
|
|
63,567 |
|
|
|
69,676 |
|
|
|
326,495 |
|
|
|
42,897 |
|
| Non-earning assets |
|
|
|
|
|
|
|
|
|
|
|
|
|
|
|
|
|
|
|
|
| Premises and equipment |
|
|
303,523 |
|
|
|
285,607 |
|
|
|
208,403 |
|
|
|
137,426 |
|
|
|
131,404 |
|
| Bank-owned life insurance |
|
|
100,556 |
|
|
|
96,876 |
|
|
|
72,536 |
|
|
|
70,813 |
|
|
|
67,921 |
|
| Goodwill |
|
|
401,872 |
|
|
|
369,811 |
|
|
|
234,228 |
|
|
|
227,080 |
|
|
|
236,761 |
|
| Core deposit intangibles |
|
|
19,122 |
|
|
|
24,021 |
|
|
|
22,975 |
|
|
|
26,342 |
|
|
|
16,193 |
|
| Title plant and other intangible assets |
|
|
7,660 |
|
|
|
7,911 |
|
|
|
6,722 |
|
|
|
6,722 |
|
|
|
6,729 |
|
| Accrued interest receivable |
|
|
32,183 |
|
|
|
36,006 |
|
|
|
34,250 |
|
|
|
32,869 |
|
|
|
19,633 |
|
| Other real estate owned |
|
|
121,536 |
|
|
|
125,046 |
|
|
|
69,218 |
|
|
|
74,092 |
|
|
|
16,312 |
|
| Derivative assets |
|
|
42,119 |
|
|
|
33,026 |
|
|
|
37,320 |
|
|
|
32,697 |
|
|
|
20,559 |
|
| Receivable due from the FDIC |
|
|
3,259 |
|
|
|
11,363 |
|
|
|
42,494 |
|
|
|
6,817 |
|
|
|
— |
|
| Investment in new market tax credit entities |
|
|
135,793 |
|
|
|
118,247 |
|
|
|
112,296 |
|
|
|
104,200 |
|
|
|
— |
|
| Other |
|
|
48,988 |
|
|
|
76,049 |
|
|
|
49,049 |
|
|
|
68,836 |
|
|
|
22,153 |
|
|
|
|
|
|
|
|
|
|
|
|
|
|
|
|
|
|
|
|
|
|
| Total other assets |
|
$ |
1,271,114 |
|
|
$ |
1,247,530 |
|
|
$ |
959,167 |
|
|
$ |
1,114,389 |
|
|
$ |
580,562 |
|
|
|
|
|
|
|
|
|
|
|
|
|
|
|
|
|
|
|
|
|
|
| (1) |
Other
interest-bearing assets are composed primarily of trust preferred common securities. |
The $13.9 million decrease in FHLB and
FRB stock was the result of $35.4 million in stock repurchases in 2012. The repurchases are mandatory for eligible stock based on FHLB regulations. The repurchases were partially offset by $19.8 million in purchases of stock and $1.6 million of
acquired stock from Florida Gulf during 2012.
Fed funds sold and financing transactions represent short-term excess liquidity, and the balance varies
based on the daily requirements of short-term liquidity needed by the Company and its subsidiaries for loan growth and other operating activities. The Company had $4.9 million in financing transactions outstanding at the end of 2012, whereas there
were no fed funds sold or financing transactions at December 31, 2011. There was no change to the balance of other interest-bearing assets from 2011.
The $17.9 million increase in premises and equipment in 2012 was a result of acquired assets of $13.6 million from Florida Gulf, as well as additional capitalized expenditures at the Company’s
branches during the current year. The investment in additional branch property is part of the Company’s growth strategy and expansion into new markets. Total additions from the acquisition and new branch assets were offset by movement of
branches closed during 2012 to OREO and the current year depreciation taken on the assets in service.
The $3.7 million increase in the
Company’s bank-owned life insurance balance was a result of the income earned on policies during 2012.
The $32.1 million increase in
goodwill was a result of $32.4 million in goodwill resulting from the Florida Gulf acquisition during the third quarter of 2012, but was offset partially by adjustments recorded to the acquired goodwill from the OMNI and Cameron acquisitions during
the second quarter of 2011. The goodwill adjustment was recorded to offset the fair value adjustments recorded on the acquired deferred tax asset and property balances. See Note 10 to these consolidated financial statements for additional
information on the changes in goodwill.
The $4.9 million decrease in core deposit intangibles was due to amortization expense during the
current year. There was no core deposit intangible asset created in the Florida Gulf acquisition in the current year due to the current and projected low interest rate environment.
The $3.8 million decrease in accrued interest receivable from December 31, 2011 was attributable to both the timing of interest payments during the year and the decrease in the yields on
variable-rate earning assets. Partially offsetting these decreases was an increase in accrued interest from the growth of the Company’s interest-earning assets during 2012.
Other real estate includes all real estate, other than bank premises used in bank operations, that is owned or controlled by the Company, including real estate acquired in settlement of loans and former
bank premises no longer used. The $3.5 million decrease in the Company’s OREO balance from December 31, 2011 was a result of the sale of numerous OREO properties during 2012, but was offset partially by the movement of $4.2 million in
former bank properties to OREO. Covered OREO properties were $77.2 million and $84.6 million at December 31, 2012 and 2011, respectively, which represented a decrease of $7.3 million, or 8.8%, during the current year. Non-covered OREO increased
$3.8 million, or 9.4%, and was primarily a result of the former bank properties noted above.
The $9.1 million increase in the market value of
the Company’s derivatives was primarily attributable to additional derivatives from the Company’s interest rate lock commitments and forward sales contracts during the current year. The total change in market value was also a result of
additional customer derivative and equity-indexed CD derivative product agreements.
The balance due to the Company from the FDIC from claims
associated with the loss share agreements decreased $8.1 million during the current year. The decrease in the balance was a result of the timing of repayment from the FDIC of losses submitted and timing of losses incurred. The Company’s
submission of losses has remained steady compared to 2011 as the Company continues to manage the covered assets to ultimate disposition in a manner that is least loss to the FDIC. The balance due from the FDIC includes the reimbursable portion of
incurred losses, net of recoveries (as those terms are defined in the respective loss share agreements) and reimbursable expenses, which were approximately $3.3 million and $5.8 million at December 31, 2012 and 2011, respectively.
The $17.5 million increase in the Company’s investments in new market tax credits is a result of additional investments in tax credit entities of
$21.4 million during the third and fourth quarters of 2012, but was offset partially by the amortization of the tax credits as they are recognized in the Company’s income tax provision calculation.
The $27.1 million decrease in other assets since December 31, 2011 was primarily the result of a decrease of $29.2 million in the Company’s
current income tax receivable as a result of the income earned during the year. Increases in the Company’s other assets since December 31, 2011 were driven by the assets acquired from Florida Gulf, as the Company’s prepaid assets
decreased $9.3 million, with the largest decrease coming in the Company’s prepaid FDIC insurance assessment of $7.9 million as the Company incurred additional insurance expense during the year.
There was no significant change in the Company’s title plant balance since December 31, 2011.
FUNDING SOURCES
Deposits obtained from clients in its primary market areas are the Company’s principal source of funds for use in lending and other business purposes. The Company attracts local deposit accounts by
offering a wide variety of accounts, competitive interest rates and convenient branch office locations and service hours. Increasing core deposits through acquisitions and the development of client relationships is a continuing focus of the Company.
Borrowings have become an important funding source as the Company has grown. Other funding sources include short-term and long-term borrowings, subordinated debt and shareholders’ equity. Refer to the “Liquidity” section below for
further discussion of the Company’s sources and uses of funding sources. The following discussion highlights the major changes in the mix of deposits and other funding sources during 2012.
Deposits
The Company’s
ability to attract and retain customer deposits is critical to the Company’s continued success. During 2012, total deposits increased $1.5 billion, or 15.7%, totaling $10.7 billion at December 31, 2012, as total noninterest-bearing
deposits increased $482.6 million and interest-bearing deposits increased $976.7 million, or 12.5%, from December 31, 2011. Acquired Florida Gulf deposits of $286.0 million accounted for 19.6% of the total growth since the end of 2011.
Increases in the Company’s core deposit products were offset by a continued decline in total time deposits, as higher-priced certificates of deposit (“CDs”) matured and were not renewed due to continued rate reductions.
The following table and chart sets forth the composition of the Company’s deposits as of December 31st of the years indicated.
TABLE 18—DEPOSIT COMPOSITION BY PRODUCT
|
|
|
|
|
|
|
|
|
|
|
|
|
|
|
|
|
|
|
|
|
|
|
|
|
|
|
|
|
|
|
|
|
|
|
|
|
|
|
|
|
| (Dollars in thousands) |
|
2012 |
|
|
2011 |
|
|
2010 |
|
|
2009 |
|
|
2008 |
|
| Noninterest-bearing deposits |
|
$ |
1,967,662 |
|
|
|
18 |
% |
|
$ |
1,485,058 |
|
|
|
16 |
% |
|
$ |
878,768 |
|
|
|
11 |
% |
|
$ |
874,885 |
|
|
|
11 |
% |
|
$ |
620,637 |
|
|
|
16 |
% |
| NOW accounts |
|
|
2,523,252 |
|
|
|
24 |
|
|
|
1,876,797 |
|
|
|
20 |
|
|
|
1,281,825 |
|
|
|
16 |
|
|
|
1,351,609 |
|
|
|
18 |
|
|
|
821,649 |
|
|
|
20 |
|
| Money market accounts |
|
|
3,738,480 |
|
|
|
35 |
|
|
|
3,049,151 |
|
|
|
33 |
|
|
|
2,660,702 |
|
|
|
34 |
|
|
|
1,954,155 |
|
|
|
26 |
|
|
|
671,129 |
|
|
|
17 |
|
| Savings accounts |
|
|
364,703 |
|
|
|
3 |
|
|
|
332,351 |
|
|
|
3 |
|
|
|
249,412 |
|
|
|
3 |
|
|
|
298,910 |
|
|
|
4 |
|
|
|
283,279 |
|
|
|
7 |
|
| Certificates of deposit |
|
|
2,154,180 |
|
|
|
20 |
|
|
|
2,545,656 |
|
|
|
28 |
|
|
|
2,844,399 |
|
|
|
36 |
|
|
|
3,076,589 |
|
|
|
41 |
|
|
|
1,599,122 |
|
|
|
40 |
|
|
|
|
|
|
|
|
|
|
|
|
|
|
|
|
|
|
|
|
|
|
|
|
|
|
|
|
|
|
|
|
|
|
|
|
|
|
|
|
|
|
| Total deposits |
|
$ |
10,748,277 |
|
|
|
100 |
% |
|
$ |
9,289,013 |
|
|
|
100 |
% |
|
$ |
7,915,106 |
|
|
|
100 |
% |
|
$ |
7,556,148 |
|
|
|
100 |
% |
|
$ |
3,995,816 |
|
|
|
100 |
% |
|
|
|
|
|
|
|
|
|
|
|
|
|
|
|
|
|
|
|
|
|
|
|
|
|
|
|
|
|
|
|
|
|
|
|
|
|
|
|
|
|
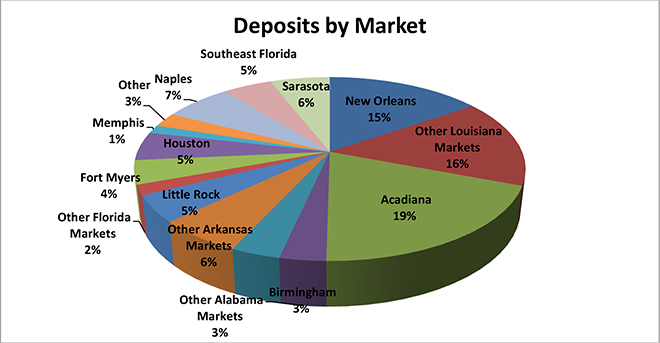
From a product perspective, interest-bearing deposits increased $976.7 million, or 12.5%, driven by acquired
Florida Gulf deposits of $228.5 million. Excluding these acquired deposits, interest-bearing deposits increased $748.2 million, or 9.6%. Growth of $1.4 billion, or 26.0%, in transaction and limited transaction accounts more than offset the deposit
losses from time deposits of $391.5 million. The decrease was seen in many of the Company’s markets, including the New Orleans, Lafayette, and Southwest Louisiana markets, as well as Southeast Florida, where higher-priced certificates of
deposit matured and were either not renewed or renewed at lower interest rates. The 32.5% increase in noninterest-bearing deposits provided the Company with a good source of available funds for continued asset growth. Noninterest-bearing deposits
increased $482.6 million from December 31, 2011. $57.6 million, or only 11.9%, of the year-to-date growth was a result of acquired deposits from Florida Gulf.
Total time deposits decreased $391.5 million, or 15.4%, during the current year. Certificates of deposit in denominations of $100,000 and over decreased $231.1 million, or 16.8%, from $1.4 billion at
December 31, 2011 to $1.1 billion at December 31, 2012. The following table details large-denomination certificates of deposit by remaining maturities at December 31st of the years indicated.
TABLE 19—REMAINING MATURITY OF CDS $100,000 AND OVER
|
|
|
|
|
|
|
|
|
|
|
|
|
| (In thousands) |
|
2012 |
|
|
2011 |
|
|
2010 |
|
| 3 months or less |
|
$ |
265,558 |
|
|
$ |
316,771 |
|
|
$ |
361,761 |
|
| Over 3 – 12 months |
|
|
572,734 |
|
|
|
731,996 |
|
|
|
764,771 |
|
| Over 12 – 36 months |
|
|
227,072 |
|
|
|
213,865 |
|
|
|
305,257 |
|
| More than 36 months |
|
|
81,151 |
|
|
|
114,999 |
|
|
|
82,245 |
|
|
|
|
|
|
|
|
|
|
|
|
|
|
| Total |
|
$ |
1,146,515 |
|
|
$ |
1,377,631 |
|
|
$ |
1,514,034 |
|
|
|
|
|
|
|
|
|
|
|
|
|
|
Additional information regarding deposits is provided in Note 12 of the footnotes to the consolidated financial
statements.
From a market perspective, total deposit growth was seen primarily in the Company’s newer Houston, Texas and Mobile, Alabama
markets, as well as the New Orleans, Lafayette, and Baton Rouge, Louisiana markets. Houston experienced growth of $277.8 million, 106.6% above December 31, 2011 deposit levels. Mobile’s total deposits increased $45.7 million, or 36.0%. The
New Orleans market increased total deposits 12.5%, or $182.3 million, during the current year. The Lafayette and Baton Rouge, Louisiana markets contributed total deposit growth of $164.9 million and $108.8 million, respectively, during 2012. Total
deposit growth was offset by deposit runoff in two of the five primary Florida markets, Sarasota ($29.6 million, or 4.5%) and Southeast Florida ($11.7 million, or 2.2%). Deposit runoff was also noted in the Northeast and Southwest Louisiana markets,
as total deposits decreased 5.2% and 12.6%, respectively, also a result of time deposit runoff.
Short-term Borrowings
The Company may obtain advances from the FHLB of Dallas based upon the common stock it owns in the FHLB of Dallas and certain of its
real estate loans and investment securities, provided certain standards related to the Company’s creditworthiness have been met. These advances are made pursuant to several credit programs, each of which has its own interest rate and range of
maturities. The level of short-term borrowings can fluctuate significantly on a daily basis depending on funding needs and the source of funds chosen to satisfy those needs.
The Company also enters into repurchase agreements to facilitate customer transactions that are accounted for as secured borrowings. These transactions typically involve the receipt of deposits from
customers that the Company collateralizes with its investment portfolio and have rates ranging from 0.09% to 0.80%. The following table details the average and ending balances of repurchase transactions as of and for the years ending
December 31:
TABLE 20—REPURCHASE TRANSACTIONS
|
|
|
|
|
|
|
|
|
|
|
|
|
| (In thousands) |
|
2012 |
|
|
2011 |
|
|
2010 |
|
| Average balance |
|
$ |
243,248 |
|
|
$ |
213,588 |
|
|
$ |
198,355 |
|
| Ending balance |
|
|
303,045 |
|
|
|
203,543 |
|
|
|
220,328 |
|
|
|
|
|
|
|
|
|
|
|
|
|
|
Since December 31, 2011, total short-term borrowings decreased $92.5 million, or 23.4%, to $303.0 million at
December 31, 2012. The decrease was a result of the payoff of $192.0 million in short-term FHLB advances during the year, but was partially offset by an increase of $99.5 million in the Company’s securities sold under agreements to
repurchase ($9.8 million of which was acquired from Florida Gulf). On an average basis, short-term borrowings increased 29.1% from 2011. The increase in the average outstanding balance was largely due to management’s decision to take advantage
of lower-cost funding sources during the current year. Short-term FHLB advances averaged $40.8 million in 2012, an increase of $34.5 million from 2011.
Total short-term debt was 2.6% of total liabilities and 41.7% of total borrowings at December 31, 2012
compared to 3.8% and 46.6%, respectively, at December 31, 2011. On an average basis, short-term borrowings were 2.7% of total liabilities and 39.7% of total borrowings in the current year, compared to 2.3% and 33.3%, respectively, during 2011.
The weighted average rate paid on short-term borrowings was 0.22% for 2012, compared to 0.26% for 2011. For additional information regarding
short-term borrowings, see Note 13 of the consolidated financial statements.
Long-term Debt
The Company’s long-term borrowings decreased $29.4 million, or 6.5%, to $423.4 million at December 31, 2012, compared to $452.7 million at
December 31, 2011. The decrease in borrowings from December 31, 2011 is a result of the scheduled repayment of a portion of the Company’s long-term advances from the FHLB during 2012.
On average, the Company’s long-term debt decreased to $431.1 million for 2012. Average long-term debt was 4.1% of total liabilities during 2012,
lower than the year-to-date average during 2011 of 4.6%. On a period-end basis, long-term debt was 3.6% of total liabilities at December 31, 2012, also a decrease from 4.4% at December 31, 2011.
The Company’s long-term borrowings at December 31, 2012 included $233.8 million in fixed-rate advances from the FHLB of Dallas and Atlanta
which cannot be paid off without incurring substantial prepayment penalties. The Company’s remaining debt consists of $111.9 million of junior subordinated deferrable interest debentures of the Company and $77.7 million in notes payable
on investments in the Company’s new market tax credit entities. The debentures are issued to statutory trusts that were funded by the issuance of floating rate capital securities of the trusts and qualify as Tier 1 Capital for regulatory
purposes. Interest is payable quarterly and may be deferred at any time at the election of the Company for up to 20 consecutive quarterly periods. During any deferral period, the Company is subject to certain restrictions, including being prohibited
from declaring dividends to its common shareholders. The securities are redeemable by the Company in whole or in part after five years, or earlier under certain circumstances.
The following table summarizes each outstanding issue of junior subordinated debt. For additional information, see Note 14 of the footnotes to the consolidated financial statements.
TABLE 21—JUNIOR SUBORDINATED DEBT COMPOSITION
(Dollars in thousands)
|
|
|
|
|
|
|
|
|
|
|
| Date Issued |
|
Term |
|
Callable After(3) |
|
Interest Rate(4) |
|
Amount |
|
| Junior subordinated debt |
|
|
|
|
|
|
|
|
|
|
| July 2001(1) |
|
30 years |
|
10 years |
|
LIBOR plus 3.300% |
|
$ |
8,248 |
|
| November 2002 |
|
30 years |
|
5 years |
|
LIBOR plus 3.250% |
|
|
10,310 |
|
| June 2003 |
|
30 years |
|
5 years |
|
LIBOR plus 3.150% |
|
|
10,310 |
|
| March 2003 (2) |
|
30 years |
|
5 years |
|
LIBOR plus 3.150% |
|
|
6,186 |
|
| March 2004(1) |
|
30 years |
|
10 years |
|
LIBOR plus 2.790% |
|
|
7,732 |
|
| September 2004 |
|
30 years |
|
5 years |
|
LIBOR plus 2.000% |
|
|
10,310 |
|
| October 2006 |
|
30 years |
|
5 years |
|
LIBOR plus 1.600% |
|
|
15,464 |
|
| June 2007 |
|
30 years |
|
5 years |
|
LIBOR plus 1.435% |
|
|
10,310 |
|
| November 2007 |
|
30 years |
|
5 years |
|
LIBOR plus 2.750% |
|
|
12,372 |
|
| November 2007 |
|
30 years |
|
5 years |
|
LIBOR plus 2.540% |
|
|
13,403 |
|
| March 2008 |
|
30 years |
|
5 years |
|
LIBOR plus 3.500% |
|
|
7,217 |
|
|
|
|
|
|
|
|
|
|
|
|
| Balance, December 31, 2012 |
|
|
|
|
|
|
|
$ |
111,862 |
|
|
|
|
|
|
|
|
|
|
|
|
| (1) |
Obtained via the
OMNI acquisition. |
| (2) |
Obtained via the
American Horizons acquisition. |
| (3) |
Subject to regulatory requirements. |
| (4) |
The interest rate
on the Company’s junior subordinated debt is indexed to LIBOR and is based on the 3-month LIBOR rate. At December 31, 2012, the 3-month LIBOR rate was 0.31%. |
Shareholders’ Equity
Shareholders’ equity provides a source of permanent funding, allows for future growth and provides the Company with a cushion to withstand unforeseen adverse developments. At December 31, 2012,
shareholders’ equity totaled $1.5 billion, an increase of $47.2 million, or 3.2%, compared to December 31, 2011. The following table details the changes in shareholders’ equity during the twelve months ended December 31, 2012.
TABLE 22—CHANGES IN SHAREHOLDERS’ EQUITY
|
|
|
|
|
| (In thousands) |
|
Amount |
|
| Balance, beginning of period |
|
$ |
1,482,661 |
|
| Net income |
|
|
76,395 |
|
| Other comprehensive income |
|
|
20 |
|
| Common stock issued |
|
|
39,203 |
|
| Treasury stock repurchased |
|
|
(40,433 |
) |
| Reissuance of treasury stock under management incentive plans, net of shares surrendered |
|
|
2,222 |
|
| Cash dividends declared |
|
|
(40,107 |
) |
| Share-based compensation cost |
|
|
9,907 |
|
|
|
|
|
|
| Balance, end of period |
|
$ |
1,529,868 |
|
|
|
|
|
|
In addition to the total comprehensive income earned during 2012 of $76.4 million, the increase in total
shareholders’ equity was a result of the issuance of 754,334 shares of the Company’s common stock on July 31, 2012 to acquire all of the outstanding common stock of the former Florida Gulf shareholders. The increases were partially
offset by dividend payments to common shareholders of $40.1 million in the current period, or $1.36 per common share. The Company paid dividends in all four quarters of 2012 that resulted in a payout to shareholders of over 52% of net income earned
during the year.
In October 2011, the Board of Directors authorized the repurchase of up to 900,000 shares of common stock. The following
table details these purchases during 2012 and is based on the settlement date of the transactions. The average price paid per share includes commissions paid. No shares were repurchased during the months not presented in the table.
TABLE 23—TREASURY SHARE REPURCHASES DURING 2012
|
|
|
|
|
|
|
|
|
|
|
|
|
|
|
|
|
| Period |
|
Total Number
of
Shares
Purchased |
|
|
Average Price
Paid
Per Share |
|
|
Total Number of
Shares
Purchased as
Part of Publicly
Announced Plan |
|
|
Maximum
Number of Shares
Available for Purchase
Pursuant to Publicly
Announced Plan |
|
| June 1-30 |
|
|
48,188 |
|
|
$ |
47.93 |
|
|
|
48,188 |
|
|
|
851,812 |
|
| August 1-31 |
|
|
748,488 |
|
|
|
47.38 |
|
|
|
796,676 |
|
|
|
103,324 |
|
| September 1-30 |
|
|
56,632 |
|
|
|
46.97 |
|
|
|
853,308 |
|
|
|
46,692 |
|
|
|
|
|
|
|
|
|
|
|
|
|
|
|
|
|
|
| Total |
|
|
853,308 |
|
|
$ |
47.38 |
|
|
|
853,308 |
|
|
|
46,692 |
|
|
|
|
|
|
|
|
|
|
|
|
|
|
|
|
|
|
CAPITAL RESOURCES
Federal regulations impose minimum regulatory capital requirements on all institutions with deposits insured by the Federal Deposit Insurance Corporation. The Federal Reserve Board (“FRB”)
imposes similar capital regulations on bank holding companies. Compliance with bank and bank holding company regulatory capital requirements, which include leverage and risk-based capital guidelines, are monitored by the Company on an ongoing basis.
Under the risk-based capital method, a risk weight is assigned to balance sheet and off-balance sheet items based on regulatory guidelines. At December 31, 2012, the Company exceeded all regulatory capital ratios.
At the end of 2012, the Company’s regulatory capital ratios and those of IBERIABANK were in excess of
the levels established for “well-capitalized” institutions as well, as shown in the following table and chart.
TABLE 24—REGULATORY CAPITAL RATIOS
|
|
|
|
|
|
|
|
|
|
|
|
|
|
|
| (Dollars in thousands) |
|
Entity |
|
“Well-
Capitalized”
Minimums |
|
|
At December 31, 2012 |
|
| |
|
|
Actual |
|
|
Excess Capital |
|
| Ratio |
|
|
|
|
|
|
|
|
|
|
|
|
|
|
| Tier 1 Leverage Ratio |
|
Consolidated |
|
|
5.00 |
% |
|
|
9.70 |
% |
|
$ |
574,140 |
|
|
|
IBERIABANK |
|
|
5.00 |
|
|
|
8.57 |
|
|
|
433,657 |
|
| Tier 1 risk-based capital ratio |
|
Consolidated |
|
|
6.00 |
|
|
|
12.92 |
|
|
|
634,956 |
|
|
|
IBERIABANK |
|
|
6.00 |
|
|
|
11.41 |
|
|
|
493,695 |
|
| Total risk-based capital ratio |
|
Consolidated |
|
|
10.00 |
|
|
|
14.19 |
|
|
|
384,518 |
|
|
|
IBERIABANK |
|
|
10.00 |
|
|
|
12.68 |
|
|
|
244,337 |
|
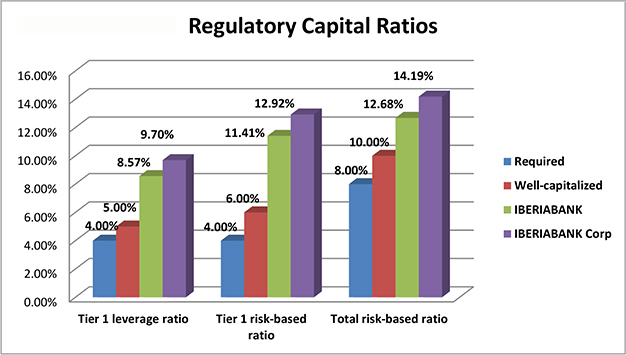
In June 2012, the FRB approved three related notices of proposed rulemaking (the “NPRs”) relating to
implementation of minimum capital requirements and a capital conservation buffer reflecting requirements of the Dodd-Frank Wall Street Reform and Consumer Protection Act (“Dodd-Frank Act”) and the Basel III international capital standards.
The three NPRs are expected to be published jointly by the Federal Reserve, the FDIC, and the Office of the Comptroller of Currency after each agency has completed its approval process. If approved as proposed, the NPRs would be effective over a
phased-in period from 2013 to 2019. The Company is in the process of evaluating the impact of the proposed rules on the Company and IBERIABANK.
For additional information on the Company’s capital ratios, see Note 18 to the consolidated financial statements.
RESULTS OF OPERATIONS
The Company
reported income available to common shareholders of $76.4 million, $53.5 million, and $48.8 million for the years ended December 31, 2012, 2011, and 2010, respectively. Earnings per share (“EPS”) on a diluted basis were $2.59 for
2012, $1.87 for 2011, and $1.88 for 2010. During 2012, net interest income increased $43.5 million, or 12.9%, over 2011, as interest income increased $24.9 million or 5.9%, and interest expense decreased $18.6 million, or 22.7%. Net interest income
increased as a result of additional customer loan volume in 2012, resulting from both acquisition and organic growth. Income available to common shareholders was also positively
impacted by a $5.2 million decrease in the Company’s provision for credit losses, but was negatively impacted by a $58.5 million increase in noninterest expenses, the drivers of which are
discussed below in the “Noninterest Expense” section of the discussion.
The increase in income before income taxes contributed to
an increase in income tax expense of $11.5 million in 2012 over 2011. Cash earnings, defined as net income before the net of tax amortization of acquisition intangibles, amounted to $79.7 million, $56.9 million, and $52.0 million for the years ended
December 31, 2012, 2011, and 2010, respectively.
The following discussion provides additional information on the Company’s
operating results for the years ended December 31, 2012, 2011, and 2010, segregated by major income statement caption.
Net
Interest Income
Net interest income is the difference between interest realized on earning assets and interest paid on
interest-bearing liabilities and is also the driver of core earnings. As such, it is subject to constant scrutiny by management. The rate of return and relative risk associated with earning assets are weighed to determine the appropriateness and mix
of earning assets. Additionally, the need for lower cost funding sources is weighed against relationships with clients and future growth requirements. The Company’s net interest spread, which is the difference between the yields earned on
average earning assets and the rates paid on average interest-bearing liabilities, was 3.43%, 3.34%, and 2.84% during the years ended December 31, 2012, 2011, and 2010, respectively. The Company’s net interest margin on a taxable
equivalent (“TE”) basis, which is net interest income (TE) as a percentage of average earning assets, was 3.58%, 3.51%, and 3.05% for the same periods.
Net interest income increased $43.5 million, or 12.9%, in 2012 when compared to 2011, to $381.8 million from $338.3 million. The improvement in net interest income was the result of a $1.1 billion
increase in average earning assets and a decrease in the average cost of interest-bearing liabilities of 28 basis points, but was offset by a 7.6% increase in the average balance of interest-bearing liabilities and a 19 basis point decrease in
earning asset yield. The average balance sheet growth over the past twelve months is primarily a result of growth in both the Company’s earning assets and noninterest-bearing deposits, due to both acquisition-related growth from Florida Gulf in
the third quarter of 2012 and organic growth in the Company’s balance sheet.
Net interest income increased $56.6 million, or 20.1%, in
2011 to $338.3 million from $281.6 million in 2010. The improvement in net interest income was the result of a $403.9 million increase in average earning assets, an eight basis point increase in the yield on average earning assets, and a decrease in
the average rate paid on interest-bearing liabilities of 42 basis points. Balance sheet growth in 2011 was primarily a result of the Company’s OMNI and Cameron acquisitions.
Average loans made up 72.4% and 68.9% of average earning assets in 2012 and 2011, respectively. Average loans increased $1.1 billion, or 16.4%, since December 31, 2011, and was the result of loan
growth in the Company’s non-covered loan portfolio. Investment securities made up 18.1% of average earning assets during 2012, compared to 20.8% during 2011. Over the past year, management has focused efforts to reduce its lower-yielding excess
liquidity (defined as fed funds sold and interest-bearing cash) by investing in higher-yielding loans and investment securities, as well as paying down its short- and long-term debt in efforts to improve net interest income. Other significant
components of earning assets during 2012 included the Company’s FDIC loss share receivable (4.5% of average earning assets) and excess liquidity (3.0% of average earning assets). During 2011, the Company’s FDIC loss share receivable was
6.6% of average earning assets, with excess liquidity accounting for 2.2% of average earning assets.
Average interest-bearing deposits made
up 91.8% of average interest-bearing liabilities during 2012, down from 91.9% during 2011. Average short- and long-term borrowings made up 3.3% and 4.9% of average interest-bearing liabilities in 2012, respectively, compared to 2.7% and 5.4% during
the year ended December 31, 2011.
The following table sets forth, for the periods indicated, information regarding (i) the total
dollar amount of interest income of the Company from earning assets and the resultant average yields; (ii) the total dollar amount of interest expense on interest-bearing liabilities and the resultant average rates; (iii) net interest
income; (iv) net interest spread; and (v) net interest margin. Information is based on average daily balances during the indicated periods. Investment security market value adjustments and trade-date accounting adjustments are not
considered to be earning assets and, as such, the net effect is included in nonearning assets. Taxable equivalent yields are calculated using a marginal tax rate of 35%.
TABLE 25—AVERAGE BALANCES, NET INTEREST INCOME AND INTEREST YIELDS / RATES
|
|
|
|
|
|
|
|
|
|
|
|
|
|
|
|
|
|
|
|
|
|
|
|
|
|
|
|
|
|
|
|
|
|
|
|
|
| |
|
2012 |
|
|
2011 |
|
|
2010 |
|
| |
|
|
|
|
|
|
|
Average |
|
|
|
|
|
|
|
|
Average |
|
|
|
|
|
|
|
|
Average |
|
| |
|
Average |
|
|
|
|
|
Yield/ |
|
|
Average |
|
|
|
|
|
Yield/ |
|
|
Average |
|
|
|
|
|
Yield/ |
|
| (Dollars in thousands) |
|
Balance |
|
|
Interest |
|
|
Rate |
|
|
Balance |
|
|
Interest |
|
|
Rate |
|
|
Balance |
|
|
Interest |
|
|
Rate |
|
| Earning assets: |
|
|
|
|
|
|
|
|
|
|
|
|
|
|
|
|
|
|
|
|
|
|
|
|
|
|
|
|
|
|
|
|
|
|
|
|
| Loans receivable: |
|
|
|
|
|
|
|
|
|
|
|
|
|
|
|
|
|
|
|
|
|
|
|
|
|
|
|
|
|
|
|
|
|
|
|
|
| Mortgage loans |
|
$ |
442,088 |
|
|
$ |
33,247 |
|
|
|
7.52 |
% |
|
$ |
550,361 |
|
|
$ |
38,379 |
|
|
|
6.97 |
% |
|
$ |
809,515 |
|
|
$ |
55,267 |
|
|
|
6.83 |
% |
| Commercial loans (TE) |
|
|
5,703,163 |
|
|
|
373,497 |
|
|
|
6.54 |
|
|
|
4,787,680 |
|
|
|
306,089 |
|
|
|
6.41 |
|
|
|
3,798,264 |
|
|
|
222,151 |
|
|
|
5.93 |
|
| Consumer and other loans |
|
|
1,700,427 |
|
|
|
107,192 |
|
|
|
6.30 |
|
|
|
1,399,953 |
|
|
|
91,704 |
|
|
|
6.55 |
|
|
|
1,139,275 |
|
|
|
75,810 |
|
|
|
6.65 |
|
|
|
|
|
|
|
|
|
|
|
|
|
|
|
|
|
|
|
|
|
|
|
|
|
|
|
|
|
|
|
|
|
|
|
|
|
|
| Total loans |
|
|
7,845,678 |
|
|
|
513,936 |
|
|
|
6.54 |
|
|
|
6,737,994 |
|
|
|
436,172 |
|
|
|
6.49 |
|
|
|
5,747,054 |
|
|
|
352,228 |
|
|
|
6.20 |
|
| Loans held for sale |
|
|
162,053 |
|
|
|
5,318 |
|
|
|
3.28 |
|
|
|
81,304 |
|
|
|
3,479 |
|
|
|
4.28 |
|
|
|
98,548 |
|
|
|
3,945 |
|
|
|
4.00 |
|
| Investment securities (TE) |
|
|
1,959,754 |
|
|
|
41,265 |
|
|
|
2.31 |
|
|
|
2,036,071 |
|
|
|
50,716 |
|
|
|
2.65 |
|
|
|
1,727,531 |
|
|
|
49,407 |
|
|
|
3.00 |
|
| FDIC loss share receivable |
|
|
485,270 |
|
|
|
(118,100 |
) |
|
|
(23.94 |
) |
|
|
648,248 |
|
|
|
(72,086 |
) |
|
|
(10.97 |
) |
|
|
927,758 |
|
|
|
(13,024 |
) |
|
|
(1.38 |
) |
| Other earning assets |
|
|
379,660 |
|
|
|
2,781 |
|
|
|
0.73 |
|
|
|
277,152 |
|
|
|
2,046 |
|
|
|
0.74 |
|
|
|
875,937 |
|
|
|
2,815 |
|
|
|
0.32 |
|
|
|
|
|
|
|
|
|
|
|
|
|
|
|
|
|
|
|
|
|
|
|
|
|
|
|
|
|
|
|
|
|
|
|
|
|
|
| Total earning assets |
|
|
10,832,415 |
|
|
|
445,200 |
|
|
|
4.16 |
|
|
|
9,780,769 |
|
|
|
420,327 |
|
|
|
4.35 |
|
|
|
9,376,828 |
|
|
|
396,371 |
|
|
|
4.27 |
|
| Allowance for credit losses |
|
|
(184,127 |
) |
|
|
|
|
|
|
|
|
|
|
(155,851 |
) |
|
|
|
|
|
|
|
|
|
|
(85,231 |
) |
|
|
|
|
|
|
|
|
| Nonearning assets |
|
|
1,448,684 |
|
|
|
|
|
|
|
|
|
|
|
1,265,272 |
|
|
|
|
|
|
|
|
|
|
|
1,011,545 |
|
|
|
|
|
|
|
|
|
|
|
|
|
|
|
|
|
|
|
|
|
|
|
|
|
|
|
|
|
|
|
|
|
|
|
|
|
|
|
|
|
|
|
|
|
|
| Total assets |
|
$ |
12,096,972 |
|
|
|
|
|
|
|
|
|
|
$ |
10,890,190 |
|
|
|
|
|
|
|
|
|
|
$ |
10,303,142 |
|
|
|
|
|
|
|
|
|
| Interest-bearing liabilities: |
|
|
|
|
|
|
|
|
|
|
|
|
|
|
|
|
|
|
|
|
|
|
|
|
|
|
|
|
|
|
|
|
|
|
|
|
| Deposits: |
|
|
|
|
|
|
|
|
|
|
|
|
|
|
|
|
|
|
|
|
|
|
|
|
|
|
|
|
|
|
|
|
|
|
|
|
| NOW accounts |
|
$ |
2,035,544 |
|
|
$ |
7,475 |
|
|
|
0.37 |
% |
|
$ |
1,554,368 |
|
|
$ |
7,579 |
|
|
|
0.49 |
% |
|
$ |
1,323,367 |
|
|
$ |
9,148 |
|
|
|
0.69 |
% |
| Savings and money market accounts |
|
|
3,661,697 |
|
|
|
17,034 |
|
|
|
0.47 |
|
|
|
3,186,508 |
|
|
|
21,991 |
|
|
|
0.69 |
|
|
|
2,759,442 |
|
|
|
35,641 |
|
|
|
1.29 |
|
| Certificates of deposit |
|
|
2,302,081 |
|
|
|
24,855 |
|
|
|
1.08 |
|
|
|
2,699,279 |
|
|
|
40,984 |
|
|
|
1.52 |
|
|
|
3,096,524 |
|
|
|
50,968 |
|
|
|
1.65 |
|
|
|
|
|
|
|
|
|
|
|
|
|
|
|
|
|
|
|
|
|
|
|
|
|
|
|
|
|
|
|
|
|
|
|
|
|
|
| Total interest-bearing deposits |
|
|
7,999,322 |
|
|
|
49,364 |
|
|
|
0.62 |
|
|
|
7,440,155 |
|
|
|
70,554 |
|
|
|
0.95 |
|
|
|
7,179,333 |
|
|
|
95,757 |
|
|
|
1.33 |
|
| Short-term borrowings |
|
|
284,201 |
|
|
|
650 |
|
|
|
0.22 |
|
|
|
220,146 |
|
|
|
577 |
|
|
|
0.26 |
|
|
|
216,116 |
|
|
|
814 |
|
|
|
0.37 |
|
| Long-term debt |
|
|
431,133 |
|
|
|
13,436 |
|
|
|
3.07 |
|
|
|
440,077 |
|
|
|
10,938 |
|
|
|
2.45 |
|
|
|
593,942 |
|
|
|
18,173 |
|
|
|
3.02 |
|
|
|
|
|
|
|
|
|
|
|
|
|
|
|
|
|
|
|
|
|
|
|
|
|
|
|
|
|
|
|
|
|
|
|
|
|
|
| Total interest-bearing liabilities |
|
|
8,714,656 |
|
|
|
63,450 |
|
|
|
0.73 |
|
|
|
8,100,378 |
|
|
|
82,069 |
|
|
|
1.01 |
|
|
|
7,989,391 |
|
|
|
114,744 |
|
|
|
1.43 |
|
| Noninterest-bearing demand deposits |
|
|
1,718,849 |
|
|
|
|
|
|
|
|
|
|
|
1,205,697 |
|
|
|
|
|
|
|
|
|
|
|
841,739 |
|
|
|
|
|
|
|
|
|
| Noninterest-bearing liabilities |
|
|
149,950 |
|
|
|
|
|
|
|
|
|
|
|
161,859 |
|
|
|
|
|
|
|
|
|
|
|
222,247 |
|
|
|
|
|
|
|
|
|
|
|
|
|
|
|
|
|
|
|
|
|
|
|
|
|
|
|
|
|
|
|
|
|
|
|
|
|
|
|
|
|
|
|
|
|
|
| Total liabilities |
|
|
10,583,455 |
|
|
|
|
|
|
|
|
|
|
|
9,467,934 |
|
|
|
|
|
|
|
|
|
|
|
9,053,377 |
|
|
|
|
|
|
|
|
|
| Shareholders’ equity |
|
|
1,513,517 |
|
|
|
|
|
|
|
|
|
|
|
1,422,256 |
|
|
|
|
|
|
|
|
|
|
|
1,249,765 |
|
|
|
|
|
|
|
|
|
|
|
|
|
|
|
|
|
|
|
|
|
|
|
|
|
|
|
|
|
|
|
|
|
|
|
|
|
|
|
|
|
|
|
|
|
|
| Total liabilities and shareholders’ equity |
|
$ |
12,096,972 |
|
|
|
|
|
|
|
|
|
|
$ |
10,890,190 |
|
|
|
|
|
|
|
|
|
|
$ |
10,303,142 |
|
|
|
|
|
|
|
|
|
| Net earning assets |
|
$ |
2,117,759 |
|
|
|
|
|
|
|
|
|
|
$ |
1,680,391 |
|
|
|
|
|
|
|
|
|
|
$ |
1,387,437 |
|
|
|
|
|
|
|
|
|
| Net interest spread |
|
|
|
|
|
$ |
381,750 |
|
|
|
3.43 |
% |
|
|
|
|
|
$ |
338,258 |
|
|
|
3.34 |
% |
|
|
|
|
|
$ |
281,627 |
|
|
|
2.84 |
% |
| Net interest income (TE) /
Net interest margin (TE) |
|
|
|
|
|
$ |
391,409 |
|
|
|
3.58 |
% |
|
|
|
|
|
$ |
346,436 |
|
|
|
3.51 |
% |
|
|
|
|
|
$ |
289,405 |
|
|
|
3.05 |
% |
|
|
|
|
|
|
|
|
|
|
|
|
|
|
|
|
|
|
|
|
|
|
|
|
|
|
|
|
|
|
|
|
|
|
|
|
|
The following table sets forth, for the periods indicated, information regarding the Company’s average
loan balance and average yields, segregated into the covered and non-covered portfolio. Information on the Company’s covered loan portfolio is presented both with and without the yield on the FDIC loss share receivable.
TABLE 26—AVERAGE LOAN BALANCE AND YIELDS
|
|
|
|
|
|
|
|
|
|
|
|
|
|
|
|
|
|
|
|
|
|
|
|
|
| |
|
Year Ended December 31, |
|
| |
|
2012 |
|
|
2011 |
|
|
2010 |
|
| (Dollars in thousands) |
|
Average
Balance |
|
|
Average
Yield |
|
|
Average
Balance |
|
|
Average
Yield |
|
|
Average
Balance |
|
|
Average
Yield |
|
| Non-covered loans (TE) (1) |
|
$ |
6,651,484 |
|
|
|
4.63 |
% |
|
$ |
5,286,597 |
|
|
|
4.93 |
% |
|
$ |
4,232,013 |
|
|
|
5.05 |
% |
| Covered loans (TE) (1) |
|
|
1,194,194 |
|
|
|
17.22 |
|
|
|
1,451,397 |
|
|
|
12.16 |
|
|
|
1,515,041 |
|
|
|
9.32 |
|
| FDIC loss share receivable |
|
|
485,270 |
|
|
|
-23.94 |
|
|
|
648,248 |
|
|
|
-10.97 |
|
|
|
927,758 |
|
|
|
-1.38 |
|
|
|
|
|
|
|
|
|
|
|
|
|
|
|
|
|
|
|
|
|
|
|
|
|
|
| Net covered loans (TE) (1) |
|
|
1,679,464 |
|
|
|
5.32 |
|
|
|
2,099,645 |
|
|
|
5.02 |
|
|
|
2,442,799 |
|
|
|
5.25 |
|
|
|
|
|
|
|
|
|
|
|
|
|
|
|
|
|
|
|
|
|
|
|
|
|
|
| Total loan portfolio (TE) (1) |
|
$ |
8,330,948 |
|
|
|
4.77 |
% |
|
$ |
7,386,242 |
|
|
|
4.96 |
% |
|
$ |
6,674,812 |
|
|
|
5.13 |
% |
|
|
|
|
|
|
|
|
|
|
|
|
|
|
|
|
|
|
|
|
|
|
|
|
|
| (1) |
Taxable equivalent yields are calculated using a marginal tax rate of
35%. |
The following table displays the dollar amount of
changes in interest income and interest expense for major components of earning assets and interest-bearing liabilities. The table distinguishes between (i) changes attributable to volume (changes in average volume between periods times the
average yield/rate for the two periods), (ii) changes attributable to rate (changes in average rate between periods times the average volume for the two periods), and (iii) total increase (decrease). Changes attributable to both volume and
rate are allocated ratably between the volume and rate categories.
TABLE 27—SUMMARY OF CHANGES IN NET INTEREST INCOME
|
|
|
|
|
|
|
|
|
|
|
|
|
|
|
|
|
|
|
|
|
|
|
|
|
| |
|
2012 / 2011 |
|
|
2011 / 2010 |
|
| |
|
Change Attributable To |
|
|
Change Attributable To |
|
| |
|
|
|
|
|
|
|
Total |
|
|
|
|
|
|
|
|
Total |
|
| |
|
|
|
|
|
|
|
Increase |
|
|
|
|
|
|
|
|
Increase |
|
| (In thousands) |
|
Volume |
|
|
Rate |
|
|
(Decrease) |
|
|
Volume |
|
|
Rate |
|
|
(Decrease) |
|
| Earning assets: |
|
|
|
|
|
|
|
|
|
|
|
|
|
|
|
|
|
|
|
|
|
|
|
|
| Loans receivable: |
|
|
|
|
|
|
|
|
|
|
|
|
|
|
|
|
|
|
|
|
|
|
|
|
| Mortgage loans |
|
$ |
(7,983 |
) |
|
$ |
2,851 |
|
|
$ |
(5,132 |
) |
|
$ |
(18,048 |
) |
|
$ |
1,160 |
|
|
$ |
(16,888 |
) |
| Commercial loans (TE) |
|
|
60,138 |
|
|
|
7,270 |
|
|
|
67,408 |
|
|
|
66,153 |
|
|
|
17,785 |
|
|
|
83,938 |
|
| Consumer and other loans |
|
|
18,386 |
|
|
|
(2,898 |
) |
|
|
15,488 |
|
|
|
18,035 |
|
|
|
(2,141 |
) |
|
|
15,894 |
|
| Loans held for sale |
|
|
2,803 |
|
|
|
(964 |
) |
|
|
1,839 |
|
|
|
(724 |
) |
|
|
258 |
|
|
|
(466 |
) |
| Investment securities (TE) |
|
|
(1,136 |
) |
|
|
(8,315 |
) |
|
|
(9,451 |
) |
|
|
8,527 |
|
|
|
(7,218 |
) |
|
|
1,309 |
|
| FDIC loss share receivable |
|
|
21,881 |
|
|
|
(67,895 |
) |
|
|
(46,014 |
) |
|
|
5,057 |
|
|
|
(64,119 |
) |
|
|
(59,062 |
) |
| Other earning assets |
|
|
181 |
|
|
|
554 |
|
|
|
735 |
|
|
|
(1,471 |
) |
|
|
702 |
|
|
|
(769 |
) |
|
|
|
|
|
|
|
|
|
|
|
|
|
|
|
|
|
|
|
|
|
|
|
|
|
| Total net change in income on earning assets |
|
|
94,270 |
|
|
|
(69,397 |
) |
|
|
24,873 |
|
|
|
77,529 |
|
|
|
(53,573 |
) |
|
|
23,956 |
|
|
|
|
|
|
|
|
|
|
|
|
|
|
|
|
|
|
|
|
|
|
|
|
|
|
| Interest-bearing liabilities: |
|
|
|
|
|
|
|
|
|
|
|
|
|
|
|
|
|
|
|
|
|
|
|
|
| Deposits: |
|
|
|
|
|
|
|
|
|
|
|
|
|
|
|
|
|
|
|
|
|
|
|
|
| NOW accounts |
|
|
2,024 |
|
|
|
(2,128 |
) |
|
|
(104 |
) |
|
|
1,422 |
|
|
|
(2,991 |
) |
|
|
(1,569 |
) |
| Savings and money market accounts |
|
|
2,771 |
|
|
|
(7,728 |
) |
|
|
(4,957 |
) |
|
|
5,645 |
|
|
|
(19,295 |
) |
|
|
(13,650 |
) |
| Certificates of deposit |
|
|
(5,443 |
) |
|
|
(10,686 |
) |
|
|
(16,129 |
) |
|
|
(6,222 |
) |
|
|
(3,762 |
) |
|
|
(9,984 |
) |
| Borrowings |
|
|
(95 |
) |
|
|
2,666 |
|
|
|
2,571 |
|
|
|
(4,172 |
) |
|
|
(3,300 |
) |
|
|
(7,472 |
) |
|
|
|
|
|
|
|
|
|
|
|
|
|
|
|
|
|
|
|
|
|
|
|
|
|
| Total net change in expense on interest- bearing liabilities |
|
|
(743 |
) |
|
|
(17,876 |
) |
|
|
(18,619 |
) |
|
|
(3,327 |
) |
|
|
(29,348 |
) |
|
|
(32,675 |
) |
|
|
|
|
|
|
|
|
|
|
|
|
|
|
|
|
|
|
|
|
|
|
|
|
|
| Change in net interest spread |
|
$ |
95,013 |
|
|
$ |
(51,521 |
) |
|
$ |
43,492 |
|
|
$ |
80,856 |
|
|
$ |
(24,225 |
) |
|
$ |
56,631 |
|
|
|
|
|
|
|
|
|
|
|
|
|
|
|
|
|
|
|
|
|
|
|
|
|
|
Interest income includes interest income earned on earning assets as well as applicable loan fees earned.
Interest income that would have been earned on nonaccrual loans had they been on accrual status is not included in the data reported above.
The decrease in yield on total earning assets between 2012 and 2011 was driven by lower yields on the Company’s consumer loan and investment
security portfolios, as well as a higher amortization of the Company’s FDIC loss share receivable (that results in a negative yield for this asset).
For the year ended December 31, 2012, the increase in the average balance of the Company’s earning assets drove the $24.9 million increase in interest income, as average balance increases in the
largest components of earning assets offset rate decreases. Average loan balances increased $1.1 billion, or 16.4%, over 2011 and can be attributed to the non-covered loan growth since December 31, 2011, both from the Florida Gulf acquisition
and organic non-covered loan growth. Covered loan yields increased 30 basis points and also contributed to the additional income generated during the current year. The amortization of the loss share receivable was $118.1 million in 2012, an increase
of $46.0 million that can be attributed to the related increase in expected cash flow from the covered assets. As expected cash flow on the covered loan and OREO portfolios increases, the carrying value of the FDIC loss share receivable decreases,
with the difference recorded as an adjustment to earnings. Interest income growth, however, was slowed in the current year by a decrease in the yield on the Company’s non-covered loan portfolio of 30 basis points to 4.63%. The total yield of
the loan portfolio when including the loss share receivable was 4.77%, 19 basis points lower than the same period of 2011, and offset the income earned on loan volume increases over 2011.
Interest income growth was also slowed by a 34 basis point decrease in the yield on the Company’s investment securities. Average investment securities also decreased $76.3 million during the years
ended December 31, 2012 when compared to the same period of 2011, as the Company offset the acquired investments from Florida Gulf with sales of investment securities and generally did not invest the funds received from sales and maturities in
additional investment securities. Despite the decrease in yield, investment securities yielded 2.31% during the current year, well above the yield on interest-bearing cash and fed funds sold of 0.25% for the same period.
Driven by a decrease of 28 basis points in the rate paid on interest-bearing liabilities during the current year, interest expense decreased $18.6
million, or 22.7%, from 2011. Despite an increase of $559.2 million in average interest-bearing deposits (mostly a result of acquired Florida Gulf deposits), interest expense on the Company’s deposits decreased 30.0%, or $21.2 million, from
2011, as the average rate paid on these deposits decreased to 0.62% for 2012, a 33 basis point drop. Higher-yielding time deposits across many markets either matured or were repriced during 2012, driving the expense and rate decreases. The $2.5
million increase in interest expense on the Company’s long-term debt was a result of a rate increase of 62 basis points, as average long-term debt decreased $8.9 million, or 2.0%, from 2011.
In 2011, the increase in the Company’s average earning assets drove the increase in interest income over 2010, as average balance increases in the
commercial and consumer loan portfolios, as well as a balance increase in the investment portfolio, offset rate decreases across multiple portfolios. Average loan balances increased 17.2% over 2010 and can be attributed to the non-covered loan
growth, both from the OMNI and Cameron acquisitions and organic non-covered loan growth. Loan yields improved 29 basis points, which also contributed to the increase in interest income over 2010.
Average investment securities increased $308.5 million during 2011 when compared to the same period of 2010, as the Company acquired investments from
OMNI and Cameron and purchased higher-yielding investment securities with available cash to improve earning asset yields.
Driven by a
decrease of 42 basis points in the rate paid on interest-bearing liabilities during 2011, interest expense decreased 28.5% from 2010. Despite an increase of $260.8 million in average interest-bearing deposits, interest expense on the Company’s
deposits decreased $25.2 million from 2010, as the average rate paid on these deposits decreased 38 basis points to 0.95% for the twelve months of 2011. Higher-yielding deposits acquired from the 2009 and 2010 Alabama and Florida acquisitions either
matured or were repriced during 2011, contributing to the basis point decrease. The decrease in interest expense on the Company’s long-term debt was a result of a $153.9 million decrease in average long-term debt from 2010 and a rate decrease
of 57 basis points.
Provision for Credit Losses
Management of the Company assesses the allowance for credit losses monthly and will make provisions for credit losses as deemed appropriate in order to maintain the appropriateness of the allowance for
credit losses. Increases in the allowance for credit losses are achieved through provisions for credit losses that are charged against income. Adjustments to the allowance may also result from credit quality changes associated with loans acquired.
On a consolidated basis, the Company recorded a provision for credit losses of $20.7 million for the year ended December 31, 2012, a
$5.2 million, or 20.1%, decrease from the provision recorded for the same period of 2011. The Company’s provision in 2012 primarily included a provision related to non-acquisition loan growth and provisions for changes in expected cash flows on
the Company’s acquired loan and covered loan portfolios of $9.8 million and $7.1 million, respectively. The Company’s total provision was limited in
2012 by an improvement in legacy portfolio asset quality over the past 12 months, as multi-year net
charge-off trends in this portfolio continue to show signs of improvement.
Non-covered loans past due totaled $127.9 million at
December 31, 2012, an increase of $7.1 million from December 31, 2011. However, excluding the past due loans acquired from Florida Gulf, total non-covered past due loans decreased $6.2 million, or 5.1%. Past due loans, including nonaccrual
loans, were 1.71% of total loans (before acquired loan discount adjustments) at the end of 2012, a 26 basis point decrease from December 31, 2011. Excluding the acquired loans, loans past due were 0.92% of total loans at December 31, 2012,
an improvement of 30 basis points from year-end 2011.
Net charge-offs on the consolidated portfolio were $4.8 million year-to-date excluding
$14.9 million recorded in 2012 on a limited number of loan pool closures, a net charge-off percentage of 0.06%, six basis points lower than the 0.12% in 2011. The net charge-offs were a result of $10.1 million in charge-offs and $5.3 million in
recoveries.
The Company believes the allowance was appropriate at December 31, 2012 and 2011 to cover probable losses in the
Company’s loan portfolio. The allowance for credit losses as a percentage of outstanding loans, net of unearned income, increased 34 basis points from 2.62% at December 31, 2011 to 2.96% at December 31, 2012.
The Company’s allowance for the non-covered portfolio was 1.12% of non-covered loans at December 31, 2012 and 1.40% at December 31, 2011.
On the same basis, the Company’s allowance at December 31, 2012 was 81.3% of total nonperforming loans, which compares favorably to 80.3% of nonperforming loans at the end of 2011. The Company’s provision for credit losses covered net
charge-offs 2.9 times in 2012.
Noninterest Income
The Company’s operating results included noninterest income of $176.0 million in 2012, $131.9 million in 2011, and $133.9 million in 2010. The growth of the Company’s noninterest income has been
a management focus in the current year in response to a challenging interest rate environment. As a result, the Company has continued to increase its investment in these revenue streams, primarily its wealth management, trust, and brokerage
businesses, in order to improve its noninterest income. Noninterest income as a percentage of total gross revenue (defined as total interest and noninterest income) during 2012 increased to 28.3% compared to 23.9% of total gross revenue in 2011 and
25.2% in 2010.
The following table illustrates the primary components of noninterest income for the years indicated.
TABLE 28—NONINTEREST INCOME
|
|
|
|
|
|
|
|
|
|
|
|
|
|
|
|
|
|
|
|
|
| |
|
|
|
|
|
|
|
Percent |
|
|
|
|
|
Percent |
|
| (Dollars in thousands) |
|
2012 |
|
|
2011 |
|
|
Increase
(Decrease) |
|
|
2010 |
|
|
Increase
(Decrease) |
|
| Service charges on deposit accounts |
|
$ |
26,852 |
|
|
$ |
25,915 |
|
|
|
3.6 |
% |
|
$ |
24,375 |
|
|
|
6.3 |
% |
| ATM/debit card fee income |
|
|
8,978 |
|
|
|
11,008 |
|
|
|
(18.4 |
) |
|
|
10,117 |
|
|
|
8.8 |
|
| Income from bank owned life insurance |
|
|
3,680 |
|
|
|
3,296 |
|
|
|
11.6 |
|
|
|
3,100 |
|
|
|
6.3 |
|
| Mortgage income |
|
|
78,053 |
|
|
|
45,177 |
|
|
|
72.8 |
|
|
|
48,007 |
|
|
|
(5.9 |
) |
| Gain (loss) on sale of assets |
|
|
42 |
|
|
|
943 |
|
|
|
(95.6 |
) |
|
|
(76 |
) |
|
|
1,344.3 |
|
| Gain on sale of investments, net (1) |
|
|
3,775 |
|
|
|
3,475 |
|
|
|
8.6 |
|
|
|
5,251 |
|
|
|
(33.8 |
) |
| Gain on acquisitions |
|
|
— |
|
|
|
— |
|
|
|
— |
|
|
|
3,781 |
|
|
|
(100.0 |
) |
| Impairment of investment securities |
|
|
— |
|
|
|
(509 |
) |
|
|
(100.0 |
) |
|
|
(517 |
) |
|
|
(1.5 |
) |
| Title revenue |
|
|
20,987 |
|
|
|
18,048 |
|
|
|
16.3 |
|
|
|
18,083 |
|
|
|
(0.2 |
) |
| Broker commission income |
|
|
13,446 |
|
|
|
10,224 |
|
|
|
31.5 |
|
|
|
7,530 |
|
|
|
35.8 |
|
| Other income |
|
|
20,184 |
|
|
|
14,282 |
|
|
|
41.3 |
|
|
|
14,239 |
|
|
|
2.3 |
|
|
|
|
|
|
|
|
|
|
|
|
|
|
|
|
|
|
|
|
|
|
| Total noninterest income |
|
$ |
175,997 |
|
|
$ |
131,859 |
|
|
|
33.5 |
% |
|
$ |
133,890 |
|
|
|
(1.5 |
)% |
|
|
|
|
|
|
|
|
|
|
|
|
|
|
|
|
|
|
|
|
|
| (1) |
Gain on sale of investments includes gains on the calls of held to maturity securities of $35,000, $53,000, and $80,000 for the years ended
December 31, 2012, 2011, and 2010, respectively. |
Service charges on deposit accounts increased $0.9 million in 2012
from the prior year, and $1.5 million between 2010 and 2011, due primarily to an increase in service charge fees and analysis service charges. Customers increased as a result of the Florida Gulf acquisition and new branch openings since 2011, as
well as the OMNI and Cameron acquisitions in 2011.
ATM/debit card fee income decreased $2.0 million in 2012 from 2011 primarily due to a
decrease in interchange fee income. Card income was negatively impacted in 2012 by the reordering of the posting sequence for electronic debit transactions associated with the settlement of the Company’s class action lawsuit and the
implementation of Durbin amendment provisions of the Dodd-Frank Act.
Offsetting these negative factors were increases in transaction volume from the expanded cardholder base and in usage by customers. ATM/debit card fee income increased $0.9 million in 2011 over
2010 and was also primarily the result of the Company’s expanded cardholder base and customer usage.
Income earned from bank owned life
insurance increased $0.4 million in 2012 when compared to 2011 and increased $0.2 million from 2010 to 2011, consistent with market performance and current yields. The additional policies acquired from OMNI and Cameron in the second quarter of 2011
contributed to higher revenue over 2010.
IMC had its most successful year to-date in terms of production and sales volume, which drove the
$32.9 million increase in mortgage loan income over 2011. Sales proceeds increased $751.3 million, or 45.9%, in the current year. In addition to the volume increase, a higher margin on the sales of mortgage loans led to higher income in 2012.
Average margin on the sale of mortgage loans was 3.05% during 2012, a 28 basis point increase over the average margin in 2011. Gains on the sales of mortgage loans decreased $2.8 million in 2011 from 2010 as a result of a decrease in overall sales
volume. Sales proceeds decreased $165.8 million, or 9.2%, from 2010. Partially offsetting the volume decrease was improved margin on the sales of mortgage loan originations, fueled in part by loan refinancing.
The Company recorded a net gain on the sale of assets during 2012 of less than $0.1 million as a result of the disposal of equipment no longer in use.
The $0.9 million gain on the sale of assets during 2011 was a result of the sale of tax credits and the disposal of former bank property and equipment no longer in use. A $0.1 million loss on sales of assets was recorded in 2010. The loss in 2010
was primarily from the disposal of automobiles at the former Orion branches, as well as the sale of a modular branch building.
Changes in the
sales volume of investment securities primarily drove the change in the gains recorded on these sales. Gains on investment sales increased $0.3 million in 2012 when compared to 2011, but decreased $1.8 million between 2010 and 2011. Gains were
recorded on the sale of $150.5 million in available-for-sale securities and the call of $43.5 million of held-to-maturity investments for the twelve months of 2012, compared to the sale of $126.9 million in securities during 2011 and $243.8 million
during 2010.
Title income increased $2.9 million during 2012 when compared to the prior year and was the result of a favorable mortgage
business environment, fueled by low mortgage interest rates. Title income remained steady between 2011 and 2010.
Similar to IMC, the
Company’s wealth management subsidiaries had very successful revenue growth, as total broker commissions increased $3.2 million compared to 2011, a result of the Company’s expanded client base and service offering. The Company’s other
wealth management income, which includes research income, syndicate deals, and investment banking management and underwriting fees, increased $0.8 million, or 8.4%, over the comparable 2011 period. Sales and trading commissions increased $2.4
million, or 348.3%, from 2011. Broker commissions increased $2.7 million, or 35.8%, from 2010 to 2011, a result of the Company’s expanded client base, including the Company’s expansion in Arkansas and Florida in 2011.
Other noninterest income increased $5.9 million in 2012 when compared to 2011. Other noninterest income in 2012 was positively impacted by higher trust
department income (an increase of $1.9 million, or 75.7%), which can be attributed to the increased customer base and growth of the business. Income was also positively affected by additional earnings on the Company’s deferred compensation
assets and earnings on the Company’s investment in new market tax credits. Deferred compensation earnings increased $0.7 million during 2012, while income from new market tax credits increased $0.5 million, or 18.2%, from 2011. The Company also
recorded a $2.2 million gain on the redemption of a business investment acquired from OMNI in 2011. Other noninterest income remained consistent for the twelve months of 2011 when compared to the same period of 2010. Other noninterest income in 2011
was positively impacted by higher trust department income, also a result of the increased customer base and growth of the business during that year, but was negatively affected by lower earnings on the Company’s deferred compensation assets.
Noninterest Expense
The Company’s results included noninterest expenses of $432.2 million, $373.7 million, and $304.2 million for 2012, 2011, and 2010, respectively.
Ongoing attention to expense control is part of the Company’s corporate culture. However, the Company’s continued focus on growth through new branches, acquisitions, product expansion, and operational investments have caused related
increases in several components of noninterest expense. Since the end of 2011, the Company acquired eight branches in the Florida Gulf acquisition and opened an additional 14 branches. These additions were offset by the closing or consolidation of
11 branches.
Also affecting noninterest expense during the current year were the Company’s expenses incurred as part of merger-related
activities and expenses incurred as part of multiple ongoing process improvement projects that are designed to enhance the operational effectiveness and profitability of the Company. The projects’ costs have been incurred in the current year to
improve overall organizational profitability across multiple markets, product lines, and departments, the benefits of which the Company expects to realize in future periods.
The following table illustrates the primary components of noninterest expense for the years indicated.
TABLE 29—NONINTEREST EXPENSE
|
|
|
|
|
|
|
|
|
|
|
|
|
|
|
|
|
|
|
|
|
| |
|
|
|
|
|
|
|
Percent |
|
|
|
|
|
Percent |
|
| (Dollars in thousands) |
|
2012 |
|
|
2011 |
|
|
Increase
(Decrease) |
|
|
2010 |
|
|
Increase
(Decrease) |
|
| Salaries and employee benefits |
|
$ |
233,777 |
|
|
$ |
193,773 |
|
|
|
20.6 |
% |
|
$ |
161,482 |
|
|
|
20.0 |
% |
| Occupancy and equipment |
|
|
54,672 |
|
|
|
49,600 |
|
|
|
10.2 |
|
|
|
33,837 |
|
|
|
46.6 |
|
| Franchise and shares tax |
|
|
3,809 |
|
|
|
4,243 |
|
|
|
(10.2 |
) |
|
|
2,718 |
|
|
|
56.1 |
|
| Communication and delivery |
|
|
12,671 |
|
|
|
11,510 |
|
|
|
10.1 |
|
|
|
9,643 |
|
|
|
19.4 |
|
| Marketing and business development |
|
|
12,546 |
|
|
|
9,754 |
|
|
|
28.6 |
|
|
|
6,288 |
|
|
|
55.1 |
|
| Data processing |
|
|
15,590 |
|
|
|
14,531 |
|
|
|
7.3 |
|
|
|
12,133 |
|
|
|
19.8 |
|
| Printing, stationery and supplies |
|
|
3,298 |
|
|
|
3,298 |
|
|
|
— |
|
|
|
2,987 |
|
|
|
10.4 |
|
| Amortization of acquisition intangibles |
|
|
5,150 |
|
|
|
5,121 |
|
|
|
0.6 |
|
|
|
4,935 |
|
|
|
3.8 |
|
| Professional services |
|
|
21,095 |
|
|
|
15,085 |
|
|
|
39.8 |
|
|
|
13,473 |
|
|
|
12.0 |
|
| Net costs of OREO |
|
|
6,352 |
|
|
|
10,029 |
|
|
|
(36.7 |
) |
|
|
3,201 |
|
|
|
213.3 |
|
| Credit and other loan related expense |
|
|
18,095 |
|
|
|
15,348 |
|
|
|
17.9 |
|
|
|
12,729 |
|
|
|
20.6 |
|
| Insurance |
|
|
10,771 |
|
|
|
10,022 |
|
|
|
7.5 |
|
|
|
12,469 |
|
|
|
(19.6 |
) |
| Travel and entertainment |
|
|
9,563 |
|
|
|
7,615 |
|
|
|
25.6 |
|
|
|
6,974 |
|
|
|
9.2 |
|
| Other expenses |
|
|
24,796 |
|
|
|
23,802 |
|
|
|
4.2 |
|
|
|
21,380 |
|
|
|
11.3 |
|
|
|
|
|
|
|
|
|
|
|
|
|
|
|
|
|
|
|
|
|
|
| Total noninterest expense |
|
$ |
432,185 |
|
|
$ |
373,731 |
|
|
|
15.6 |
% |
|
$ |
304,249 |
|
|
|
22.8 |
% |
|
|
|
|
|
|
|
|
|
|
|
|
|
|
|
|
|
|
|
|
|
Salaries and employee benefits increased $40.0 million in 2012 when compared to 2011. The increase was primarily the
result of increased staffing due to the growth of the Company. Current year expenses include the full year impact of additional OMNI and Cameron personnel, as well as personnel from Florida Gulf and the Company’s new branches for a portion of
the year. Full-time equivalent employees increased to almost 2,700 at the end of 2012, a 4.5% increase from the end of 2011. The Company added these employees as part of the Florida Gulf acquisition, but the increase includes additional
revenue-producing positions at IBERIABANK and its mortgage origination subsidiary.
Total employee compensation increased $35.5 million, or
20.5%, while related employee benefits increased 20.6% to $29.3 million for the year ended December 31, 2012. The increase in compensation is a result of the increase in headcount due to the growth of the Company, but is also a result of a full
year of compensation expense from OMNI and Cameron employees in 2012. Employee compensation in 2012 included $2.1 million of additional share-based incentive compensation due to additional restricted stock, phantom stock, and option grants in 2012.
Employee compensation also includes commissions and production-related bonuses which increased $2.3 million, or 79.3% from 2011, consistent with the increases in income from these product lines.
Employee benefits include payroll taxes, medical and dental insurance expenses, and retirement contributions. The increase in these benefits was a result
of $2.7 million in additional hospitalization expense during 2012, partially from an increase in headcount and partially from higher claims processed in the current year. Employee benefits also included a $2.1 million, or 20.5%, increase in total
payroll taxes in 2012.
From 2010 to 2011, salaries and employee benefits increased $32.3 million. Similar to the change in the current year,
the increase was primarily the result of increased staffing due to the growth of the Company. Expenses in 2011 included the full impact of additional Sterling personnel, as well as salaries and employee benefits expense and severance expense from
the former OMNI and Cameron employees. Salaries and employee benefits in 2011 also included increased share-based incentive compensation due to additional restricted stock, phantom stock, and option grants in 2011.
Occupancy and equipment expenses were up $5.1 million, or 10.2%, from 2011. These increased costs include repairs and maintenance on branches,
depreciation, utilities, rentals and property taxes. Merger-related expenses from the Florida Gulf acquisition in 2012 were $0.2 million. Excluding the merger-related occupancy and equipment costs, occupancy and equipment expense was $10.0 million,
or 22.5%, higher than in 2011, which is consistent with the increase in the size of the Company. Depreciation expense increased $4.9 million, or 36.1%. The higher depreciation expense is a result of additional branches opened and the Florida Gulf
branches, but also includes accelerated depreciation on the Company’s ten branches that closed in 2012. Equipment rental (mostly ATMs), building rent, and property taxes increased $1.5 million, $0.8 million, and $0.8 million, respectively, and
account for most of the remaining increase over 2011.
Occupancy and equipment expense increased $15.8 million for the twelve months of 2011
over the comparable 2010 period due primarily to the cost of facilities associated with the Company’s expansion. Occupancy expense for 2011 include $5.2 million of
acquisition-related expenses during 2011, which include the full expensing of vacated lease liabilities acquired from OMNI and Cameron. Similar expenses were only $0.5 million in 2010.
Franchise and shares tax expense decreased $0.4 million as a result of a $0.6 million decrease in share tax expense in 2012 based on the
Company’s equity split between the states it operates in. As the Company’s footprint expands, the assessment base for Louisiana shares tax decreases. Franchise and shares tax expense increased $1.5 million during 2011 over 2010, a result
of a higher assessment base for the shares tax calculation for IBERIABANK. The higher assessment resulted from increased equity at IBERIABANK at the end of December.
The Company’s expansion from the OMNI, Cameron, and Florida Gulf acquisitions, as well as new branches opened since the end of 2011, led to a $1.2 million increase in communication and delivery
expenses. The increase was the result of an increase in data line and telephone expenses. The increase was consistent with the expansion of the Company’s footprint.
In 2012, marketing and business development expenses increased $2.8 million over 2011 as a result of additional expenses associated with business development and community relations. The Company continues
to aggressively market itself in its newer markets, including those in Florida, Alabama, and Texas. Advertising and related expenses increased $1.6 million, or 36.4%, from the prior year as a result of additional direct mail, digital media, and
newspaper advertising. In addition to the Company’s general advertising in its core markets, additional advertising expenses during 2012 focused on the Company’s 125th anniversary campaign and included promotional giveaways and focused branch events. In 2012, business development
expenses increased $1.2 million, or 22.6%, with the increase not only the result of the Company’s anniversary campaign, but also its focused efforts in community reinvestment activities. From 2010 to 2011, marketing and business development
expenses increased $3.5 million as a result of additional expenses associated with business development and community relations in the Company’s Florida and Alabama markets. During 2011, the Company incurred acquisition-related costs of $0.8
million related to the Company’s OMNI and Cameron acquisitions. The $0.8 million is an increase of $0.4 million, or 89.3%, from the same twelve months of 2010.
Data processing expenses increased $1.1 million in 2012 as the Company incurred additional processing charges during 2012 as the Company increases its branch network and system capabilities and software
amortization from system enhancements and upgrades. Merger-related data processing expenses, however, decreased $2.7 million, or 66.4%, from 2011. The Company’s merger-related expenses in 2011 included two system conversions (OMNI and Cameron).
Excluding these merger-related expenses, data processing expenses, which include computer maintenance and software amortization, increased $3.8 million, or 36.2% between years.
The core deposit intangible assets created in the OMNI and Cameron acquisitions in 2011 contributed to the minimal increase in the Company’s amortization expense over the prior year. The core deposit
intangible assets created in the Sterling, OMNI, and Cameron acquisitions in 2010 and 2011 contributed to the $0.2 million increase in amortization expense of the Company’s intangible assets in 2011 when compared to 2010.
Due to the growth of the Company over the past 12 months, professional services expense in 2012 was $6.0 million higher than in 2011. The continued
expansion of the size and breadth of Company’s operations requires additional expenditures for legal services, consulting engagements, exam and supervisory review, and audit services. More specifically, legal expenses increased $1.8 million in
the current year. Legal expenses include those around general matters, litigation, settlement, and collection efforts. The Company also incurred merger-related legal expenses of $0.5 million during 2012.
The Company’s efforts to improve various Company and business-line specific processes drove the increase in total consulting expenses of $4.7
million over 2011. The Company expects to see the benefit of these improvements in future periods. Offsetting the increase was a decrease in other merger-related professional services, which include exam, audit, and other professional services, of
$2.4 million in 2012 when compared to 2011.
From 2010 to 2011, professional services expenses increased $1.6 million, the result of legal,
audit and consulting expenses incurred as part of the Company’s OMNI and Cameron acquisitions during 2011. Merger-related professional services were $3.4 million during 2011.
Net costs of OREO properties decreased $3.7 million in 2012 from 2011, as write-downs taken on OREO properties decreased $0.8 million, or 11.6%, the gains on the sale of properties increased $3.5 million,
and property taxes paid on held properties decreased $0.2 million, or 12.9%. Offsetting these changes were additional insurance and other expenses on these properties, driven primarily by the additional properties in the portfolio during the current
year. The increased expenses were offset partially by an increase in the income earned on the properties during 2012. From 2010 to 2011, net costs of OREO properties increased $6.8 million, as write-downs taken on OREO properties increased $4.3
million while gains on the sale of OREO properties for 2011 decreased $1.0 million, or 41.5%, from the comparable twelve months of 2010.
Credit and loan related expenses increased $2.7 million from 2011 to 2012, and $2.6 million between 2010 and 2011. With the expansion of the
Company’s loan portfolio, expenses incurred for appraisal, inspection, underwriting, certification, and collections have also increased. Between 2010 and 2011, the increase was also due to the expanded size of the loan portfolio and the number
of loans
with noted credit issues. The increase in credit-related expenses stemmed primarily from the Company’s covered loan portfolio. The credit quality issues inherent in the portfolio covered by
loss share agreements with the FDIC drove appraisal and inspection, collections, and credit bureau expenses higher.
Insurance expenses
increased $0.7 million in 2012, primarily as a result of additional deposit insurance in the current year. As the Company’s deposit base grows, the Company’s assessment of deposit insurance from the FDIC will also increase. The increase in
the assessment in 2012 stemmed from deposit growth, and was not a result of a change in the Company’s assessment rate used by the FDIC to calculate deposit insurance.
In 2012, travel and entertainment expenses increased $1.9 million from 2011 and $0.6 million between 2010 and 2011. Travel costs have increased steadily as the Company expands its branch network and
number of locations. Travel expenses drove the increase over 2011, as mileage, lodging, and flight costs have increased due to the number of employees traveling, the expanded size of the Company’s footprint, and a general increase in the cost
of travel.
Other noninterest expenses in 2012 increased $1.0 million over the twelve months of 2011 and was primarily the result of an
increase in employee development and credit card expenses for the year. The additional costs were a result of the increased employee and client base. Other noninterest expenses in 2012 include impairment write-downs of $3.5 million on certain branch
buildings and equipment based on updated appraisals on the properties. The branches were reviewed for impairment as part of the Company’s announced branch closures and written down to their estimated fair values during the second and third
quarters of 2012.
In 2011, other noninterest expenses increased $2.4 million over 2010. Outsourced operations increased $1.6 million from
2010 to 2011 at the Company’s wealth management subsidiary as operating activities increased in the latter part of 2010 and into 2011. The most significant reason for the increase in other operating expenses over 2010 was a result of a $2.6
million settlement liability recorded in the Company’s consolidated financial statements for the year ended December 31, 2011, which led to the $1.0 million increase in the total costs of errors, fines, and losses over 2010. The settlement
was related to two class action lawsuits related to overdraft fees for electronic transfers in a high to low processing sequence on the posting of items for processing. Offsetting these increases was a reduction in credit card expenses of $0.8
million.
Income Taxes
For the years ended December 31, 2012, 2011, and 2010, the Company incurred income tax expense of $28.5 million, $17.0 million, and $20.0 million,
respectively. The Company’s effective tax rate for those periods was 27.2%, 24.1%, and 29.1%, respectively. The difference between the effective tax rate and the statutory tax rate primarily relates to variances in items that are non-taxable or
non-deductible, primarily the effect of tax-exempt income, the non-deductibility of part of the amortization of acquisition intangibles, and various tax credits. The Company’s consolidated effective tax rates were also positively impacted by
the Company’s ICP subsidiary, as well as the holding company, as these entities had income tax benefits during the three years from net losses. The effective tax rate on these entities is higher than IBERIABANK’s effective tax rate (which
is affected by the various tax credits).
The consolidated effective tax rate in 2012 has increased when compared to the prior year. The
difference in the effective tax rates for the periods presented is primarily the result of the relative tax-exempt interest income levels during the respective periods for each of the Company’s subsidiaries. The tax rate for the current year is
higher than in 2011 as a result of the effect of the change in IBERIABANK’s effective tax rate. The increase in income before taxes at IBERIABANK in the current year results in a higher effective tax rate, as the effect of nontaxable income and
other temporary tax differences is diluted. In addition, in the current year, a larger percentage of the year-to-date income before taxes was generated in Alabama, Florida, and Arkansas, which have higher effective rates than Louisiana and Texas,
the Company’s other primary states with business operations. IBERIABANK’s effective tax rate was 30.9% and 29.8% for 2012 and 2011, respectively.
For more information on the Company’s income taxes and effective tax rates, see Note 16 of the consolidated financial statements.
LIQUIDITY AND OTHER OFF-BALANCE SHEET ACTIVITIES
The Company’s liquidity, represented
by cash and cash equivalents, as well as available off balance sheet borrowing sources, is a product of its operating, investing and financing activities. The Company manages its liquidity with the objective of maintaining sufficient funds to
respond to the predicted needs of depositors and borrowers and to take advantage of investments in earning assets and other earnings enhancement opportunities. The primary sources of funds for the Company are deposits, borrowings, repayments and
maturities of loans and investment securities, securities sold under agreements to repurchase, as well as funds provided from operations and to a lesser extent off balance sheet borrowing sources. Certificates of deposit scheduled to mature in one
year or less at December 31, 2012 totaled $1.5 billion. Based on past experience, management believes that a significant portion of maturing deposits will remain with the Company. Additionally, the majority of the investment security portfolio
is classified by the Company as available-for-sale which provides the ability to liquidate unencumbered securities as needed. Of the $2.0 billion in the investment securities portfolio, $237.2 million is unencumbered and $1.7 billion has been
pledged to support repurchase transactions, public funds deposits and certain long
term borrowings. Due to the relatively short implied duration of the investment security portfolio, the Company continues to experience significant cash inflows on a regular basis.
Net cash inflows totaled $397.7 million during 2012, an increase of $162.2 million from net cash inflows of $235.5 million during the year ended
December 31, 2011.
The following table summarizes the Company’s cash flows for the years ended
December 31st for the periods indicated. For the 2011
and 2010 periods, cash flows from operations and investing activities have been restated from previously issued amounts to reflect the correction of an error in these line items. For a description of the Company’s determination to correct its
consolidated statements of cash flows for those years, see Note 1 to the consolidated financial statements, which provides more information on the nature of these corrections.
TABLE 30—CASH FLOW ACTIVITY BY TYPE
|
|
|
|
|
|
|
|
|
|
|
|
|
| (Dollars in thousands) |
|
2012 |
|
|
2011 |
|
|
2010 |
|
| Cash flow (used in) provided by operations |
|
$ |
(12,188 |
) |
|
$ |
15,758 |
|
|
$ |
214,646 |
|
| Cash flow (used in) provided by investing activities |
|
|
(527,676 |
) |
|
|
25,732 |
|
|
|
(57,305 |
) |
| Cash flow provided by financing activities |
|
|
937,545 |
|
|
|
194,028 |
|
|
|
5,040 |
|
|
|
|
|
|
|
|
|
|
|
|
|
|
| Net increase in cash and cash equivalents |
|
$ |
397,681 |
|
|
$ |
235,518 |
|
|
$ |
162,381 |
|
|
|
|
|
|
|
|
|
|
|
|
|
|
The Company had operating cash outflow of $12.2 million for the year ended December 31, 2012, $27.9 million more
than cash provided by operations for the same period of 2011. Operating cash flow in the current year was negatively impacted by an increase in mortgage loan origination activity in the current year.
Cash flow from investing activities decreased $553.4 million during 2012 when compared to 2011. Funding loan growth and a decrease in net cash flow
from investment securities drove the decrease in cash flow from 2011. Net cash flow from investment security activity decreased $267.7 million in 2012 as a result of a higher level of security purchases in 2012. Cash flow used to fund loan growth
increased $309.9 million and also had a negative impact on the current period cash flow. Positively affecting cash flow in 2011 was the acquisition of $79.3 million in cash as part of the OMNI and Cameron acquisitions, $46.9 million higher than the
net cash acquired from Florida Gulf in 2012.
Net financing cash flows, however, increased $743.5 million during the current year when
compared to 2011, primarily due to an increase in cash from customer deposits that results in a $1.0 billion difference in net deposit cash flow between the two periods. Net cash outflow of $159.0 million from short-term borrowings and long-term
debt in 2012 offset the cash inflow from deposits in the current year.
From 2010 to 2011, operating cash inflow of $15.8 million was $198.9
million less than for the twelve months of 2010. Operating cash flow in 2010 was negatively impacted by a decrease in net cash provided by mortgage loan sales. The operating cash flow in 2010 was positively affected by a decrease in other assets
(primarily fed funds sold) from the prior year.
Cash flow from investing activities increased $83.0 million during 2011 when compared to
2010. Positively affecting cash flow was net cash received in excess of cash paid for acquisitions of $79.3 million, $55.2 million higher than in 2010, as well as proceeds from the disposition of OREO properties. Operating cash flow in 2011 was also
positively affected by net cash inflow for investment security activity. 2011 net cash inflow from investment security activity was $353.7 million, $757.7 million higher than in 2010. Investing cash flow in 2011 was also negatively impacted by a
decrease in reimbursements from the FDIC on assets covered by loss share agreements. Net cash flow from FDIC reimbursements decreased to $139.9 million in 2011, $299.0 million lower than the same period of 2010.
Net financing cash flows increased $189.0 million during 2011 when compared to 2010, primarily due to an increase in cash from customer deposits
that results in an $87.3 million difference in net deposit cash flow between the two periods. Also contributing to the difference in financing cash flows between 2011 and 2010 was net cash received from short-term borrowings of $136.8 million in the
current year, mostly from $192 million in FHLB advances outstanding at December 31, 2011. During 2010, the Company used available cash to significantly pay down outstanding short- and long-term debt. Total net repayments of debt in 2010 were
$377.8 million, compared to net cash advances of $92.7 million in the twelve months of 2011.
Based on its available cash at December 31,
2012, the Company believes it has adequate liquidity to fund ongoing operations. The Company has adequate availability of funds from deposits, borrowings, repayments and maturities of loans and investment securities to provide the Company additional
working capital if needed.
While scheduled cash flows from the amortization and maturities of loans and securities are relatively
predictable sources of funds, deposit flows, prepayments of loan and investment securities, and draws on customer letters and lines of credit are greatly influenced by general interest rates, economic conditions, competition, and customer demand.
The FHLB of Dallas provides an additional source of liquidity to make funds available for general requirements and also to assist with the variability of less predictable funding sources. At December 31, 2012, the Company had $233.8 million of
outstanding long-term advances from the FHLB. There were no short-term FHLB advances outstanding at December 31, 2012. Additional advances available at December 31, 2012 from the FHLB amounted to $1.4 billion. The Company and IBERIABANK
also have various funding arrangements with commercial banks providing up to $130.0 million in the form of federal funds and other lines of credit, and at December 31, 2012, there were no balances outstanding on these lines, and all of the
funding was available to the Company.
Liquidity management is both a daily and long-term function of business management. Excess liquidity is
generally invested in short-term investments such as overnight deposits. On a longer-term basis, the Company maintains a strategy of investing in various lending and investment security products. The Company uses its sources of funds primarily to
meet its ongoing commitments and fund loan commitments. The Company has been able to generate sufficient cash through its deposits, as well as borrowings, and anticipates it will continue to have sufficient funds to meet its ongoing liquidity
requirements.
In the normal course of business, the Company is a party to a number of activities that contain credit, market and operational
risk that are not reflected in whole or in part in the Company’s consolidated financial statements. Such activities include traditional off-balance sheet credit-related financial instruments, commitments under operating leases and long-term
debt. The Company provides customers with off-balance sheet credit support through loan commitments, lines of credit and standby letters of credit. Many of the unused commitments are expected to expire unused or be only partially used; therefore,
the total amount of unused commitments does not necessarily represent future cash requirements. The Company anticipates it will continue to have sufficient funds together with available borrowings to meet its current commitments. At
December 31, 2012, the Company’s approved loan commitments outstanding totaled $192.3 million. At the same date, commitments under unused lines of credit, including credit card lines, amounted to $2.4 billion. Included in these totals are
commercial commitments amounting to $1.8 billion as shown in the following table.
TABLE 31—COMMERCIAL COMMITMENT
EXPIRATION PER PERIOD
|
|
|
|
|
|
|
|
|
|
|
|
|
|
|
|
|
|
|
|
|
| (Dollars in thousands) |
|
Less Than 1
Year |
|
|
1—3 Years |
|
|
3—5 Years |
|
|
Over 5 Years |
|
|
Total |
|
| Unused commercial lines of credit |
|
$ |
973,791 |
|
|
$ |
417,998 |
|
|
$ |
341,408 |
|
|
$ |
60,804 |
|
|
$ |
1,794,001 |
|
| Unfunded loan commitments |
|
|
192,295 |
|
|
|
— |
|
|
|
— |
|
|
|
— |
|
|
|
192,295 |
|
| Standby letters of credit |
|
|
42,854 |
|
|
|
16,570 |
|
|
|
2,783 |
|
|
|
— |
|
|
|
62,207 |
|
|
|
|
|
|
|
|
|
|
|
|
|
|
|
|
|
|
|
|
|
|
| Total |
|
$ |
1,208,940 |
|
|
$ |
434,568 |
|
|
$ |
344,191 |
|
|
$ |
60,804 |
|
|
$ |
2,048,503 |
|
|
|
|
|
|
|
|
|
|
|
|
|
|
|
|
|
|
|
|
|
|
The Company has entered into a number of long-term leasing arrangements to support the ongoing activities of the Company.
The required payments under such commitments and other debt commitments at December 31, 2012 are shown in the following table.
TABLE 32—CONTRACTUAL OBLIGATIONS AND OTHER DEBT COMMITMENTS
|
|
|
|
|
|
|
|
|
|
|
|
|
|
|
|
|
|
|
|
|
|
|
|
|
|
|
|
|
| (Dollars in thousands) |
|
2013 |
|
|
2014 |
|
|
2015 |
|
|
2016 |
|
|
2017 |
|
|
2018 and
After |
|
|
Total |
|
| Operating leases |
|
$ |
10,830 |
|
|
$ |
9,535 |
|
|
$ |
8,807 |
|
|
$ |
7,601 |
|
|
$ |
6,332 |
|
|
$ |
39,671 |
|
|
$ |
82,776 |
|
| Certificates of deposit |
|
|
1,538,582 |
|
|
|
284,154 |
|
|
|
152,020 |
|
|
|
114,232 |
|
|
|
37,387 |
|
|
|
27,805 |
|
|
|
2,154,180 |
|
| Short-term borrowings |
|
|
303,045 |
|
|
|
— |
|
|
|
— |
|
|
|
— |
|
|
|
— |
|
|
|
— |
|
|
|
303,045 |
|
| Long-term debt |
|
|
30,914 |
|
|
|
111,329 |
|
|
|
1,220 |
|
|
|
26,276 |
|
|
|
50,567 |
|
|
|
203,071 |
|
|
|
423,377 |
|
|
|
|
|
|
|
|
|
|
|
|
|
|
|
|
|
|
|
|
|
|
|
|
|
|
|
|
|
|
| Total |
|
$ |
1,883,371 |
|
|
$ |
405,018 |
|
|
$ |
162,047 |
|
|
$ |
148,109 |
|
|
$ |
94,286 |
|
|
$ |
272,547 |
|
|
$ |
2,963,378 |
|
|
|
|
|
|
|
|
|
|
|
|
|
|
|
|
|
|
|
|
|
|
|
|
|
|
|
|
|
|
ASSET/ LIABILITY MANAGEMENT, MARKET RISK AND COUNTERPARTY CREDIT RISK
The principal objective of the Company’s asset and liability management function is to evaluate the interest rate risk included in certain balance
sheet accounts, determine the appropriate level of risk given the Company’s business focus, operating environment, capital and liquidity requirements and performance objectives, establish prudent asset concentration guidelines and manage the
risk consistent with Board approved guidelines. Through such management, the Company seeks to reduce the vulnerability of its operations to changes in interest rates. The Company’s actions in this regard are taken under the guidance of the
Senior Management Planning Committee. The Senior Management Planning Committee normally meets monthly to review, among other things, the sensitivity of the Company’s assets and liabilities to interest rate changes, local and national market
conditions and interest rates. In connection therewith, the Senior Management Planning Committee generally reviews the Company’s liquidity, cash flow needs, maturities of investments, deposits, borrowings and capital position.
The objective of interest rate risk management is to control the effects that interest rate fluctuations have on net interest income and on the net
present value of the Company’s earning assets and interest-bearing liabilities. Management and the Board are responsible for managing interest rate risk and employing risk management policies that monitor and limit this exposure. Interest rate
risk is measured using net interest income simulation and asset/liability net present value sensitivity analyses. The Company uses financial modeling to measure the impact of changes in interest rates on the net interest margin and predict market
risk. Estimates are based upon numerous assumptions including the nature and timing of interest rate levels including yield curve shape, prepayments on loans and securities, deposit decay rates, pricing decisions on loans and deposits,
reinvestment/replacement of asset and liability cash flows and others. These analyses provide a range of potential impacts on net interest income and portfolio equity caused by interest rate movements.
Included in the modeling are instantaneous parallel rate shift scenarios, which are utilized to establish exposure limits. These scenarios are known as
“rate shocks” because all rates are modeled to change instantaneously by the indicated shock amount, rather than a gradual rate shift over a period of time that has traditionally been more realistic.
The Company’s interest rate risk model indicated that the Company was asset sensitive in terms of interest rate sensitivity. Based on the
Company’s interest rate risk model at December 31, 2012, the table below illustrates the impact of an immediate and sustained 100 and 200 basis point increase or decrease in interest rates on net interest income.
TABLE 33—CHANGE IN NET INTEREST INCOME FROM INTEREST RATE CHANGES
|
|
|
| Shift in Interest Rates
(in bps) |
|
% Change in Projected
Net Interest
Income |
| +200 |
|
7.9% |
| +100 |
|
3.8 |
| - 100 |
|
-0.8 |
| - 200 |
|
-1.7 |
| |
|
|
The influence of using the forward curve as of December 31, 2012 as a basis for projecting the interest rate
environment would approximate a 0.6% increase in net interest income. The computations of interest rate risk shown above do not necessarily include certain actions that management may undertake to manage this risk in response to anticipated changes
in interest rates and other factors.
The interest rate environment is primarily a function of the monetary policy of the FRB. The principal
tools of the FRB for implementing monetary policy are open market operations, or the purchases and sales of U.S. Treasury and federal agency securities. The FRB’s objective for open market operations has varied over the years, but the focus has
gradually shifted toward attaining a specified level of the federal funds rate to achieve the long-run goals of price stability and sustainable economic growth. The federal funds rate is the basis for overnight funding and drives the short end of
the yield curve. Longer maturities are influenced by FRB purchases and sales and also expectations of monetary policy going forward. In response to growing concerns about the banking industry and customer liquidity, the federal funds rate decreased
seven times to a new all-time low of 0.25% at the end of 2008. The federal funds rate remained at 0.25% through 2012 and will remain at that rate through at least late 2014. The Company’s commercial loan portfolio is also impacted by
fluctuations in the level of the London Interbank Borrowing Offered Rate (LIBOR), as a large portion of this portfolio reprices based on this index. The decrease in the federal funds, LIBOR, and U.S. Treasury rates have resulted in compressed net
interest margin for the Company, as assets have repriced more quickly than the Company’s liabilities. Although management believes that the Company is not significantly affected by changes in interest rates over an extended period of time, any
continued flattening of the yield curve will exert downward pressure on the net interest margin and net interest income. The table below presents the Company’s anticipated loan repricing over the next four quarters of 2013.
TABLE 34—LOAN REPRICING BY LOAN TYPE
|
|
|
|
|
|
|
|
|
|
|
|
|
|
|
|
|
|
|
|
|
| (Dollars in thousands) |
|
1Q 2013 |
|
|
2Q 2013 |
|
|
3Q 2013 |
|
|
4Q 2013 |
|
|
Total less than
one year |
|
| Covered loans |
|
$ |
385,323 |
|
|
$ |
90,563 |
|
|
$ |
86,005 |
|
|
$ |
72,134 |
|
|
$ |
634,025 |
|
| Non-covered loans |
|
|
|
|
|
|
|
|
|
|
|
|
|
|
|
|
|
|
|
|
| Commercial loans |
|
|
3,046,750 |
|
|
|
206,349 |
|
|
|
180,066 |
|
|
|
145,899 |
|
|
|
3,579,064 |
|
| Mortgage loans |
|
|
50,574 |
|
|
|
36,786 |
|
|
|
30,021 |
|
|
|
28,609 |
|
|
|
145,990 |
|
| Consumer loans |
|
|
682,019 |
|
|
|
91,932 |
|
|
|
82,111 |
|
|
|
74,711 |
|
|
|
930,773 |
|
|
|
|
|
|
|
|
|
|
|
|
|
|
|
|
|
|
|
|
|
|
| Total non-covered loans |
|
|
3,779,343 |
|
|
|
335,067 |
|
|
|
292,198 |
|
|
|
249,219 |
|
|
|
4,655,827 |
|
|
|
|
|
|
|
|
|
|
|
|
|
|
|
|
|
|
|
|
|
|
| Total loans receivable |
|
$ |
4,164,666 |
|
|
$ |
425,630 |
|
|
$ |
378,203 |
|
|
$ |
321,353 |
|
|
$ |
5,289,852 |
|
|
|
|
|
|
|
|
|
|
|
|
|
|
|
|
|
|
|
|
|
|
As part of its asset/liability management strategy, the Company has emphasized the origination of commercial and consumer
loans, which typically have shorter terms than residential mortgage loans and/or adjustable or variable rates of interest. The majority of fixed-rate, long-term residential loans are sold in the secondary market to avoid assumption of the interest
rate risk associated with longer duration assets in the current low rate environment. As of December 31, 2012, $4.2 billion, or 49.3%, of the Company’s total loan portfolio had adjustable interest rates. IBERIABANK had no significant
concentration to any single loan component or industry segment.
The Company’s strategy with respect to liabilities in recent periods has
been to emphasize transaction accounts, particularly noninterest or low interest-bearing transaction accounts, which are significantly less sensitive to changes in interest rates. At December 31, 2012, 80.0% of the Company’s deposits were
in transaction and limited-transaction accounts, compared to 72.6% at December 31, 2011. Noninterest-bearing transaction accounts totaled 18.3% of total deposits at December 31, 2012, compared to 16.0% of total deposits at
December 31, 2011.
The table below presents the Company’s anticipated time deposit repricing over the next four quarters of 2013.
TABLE 35—TIME DEPOSIT REPRICING
|
|
|
|
|
|
|
|
|
|
|
|
|
|
|
|
|
|
|
|
|
| (Dollars in thousands) |
|
1Q 2013 |
|
|
2Q 2013 |
|
|
3Q 2013 |
|
|
4Q 2013 |
|
|
Total less than
one year |
|
| Certificates of deposit |
|
$ |
343,395 |
|
|
$ |
325,221 |
|
|
$ |
289,992 |
|
|
$ |
245,289 |
|
|
$ |
1,203,897 |
|
| Individual retirement accounts |
|
|
34,723 |
|
|
|
39,416 |
|
|
|
31,273 |
|
|
|
27,581 |
|
|
|
132,993 |
|
| Brokered deposits |
|
|
72,714 |
|
|
|
61,217 |
|
|
|
47,023 |
|
|
|
19,935 |
|
|
|
200,889 |
|
|
|
|
|
|
|
|
|
|
|
|
|
|
|
|
|
|
|
|
|
|
| Total time deposits |
|
$ |
450,832 |
|
|
$ |
425,854 |
|
|
$ |
368,288 |
|
|
$ |
292,805 |
|
|
$ |
1,537,779 |
|
|
|
|
|
|
|
|
|
|
|
|
|
|
|
|
|
|
|
|
|
|
As part of an overall interest rate risk management strategy, derivative instruments may also be used as an efficient way
to modify the repricing or maturity characteristics of on-balance sheet assets and liabilities. Management may from time to time engage in interest rate swaps to effectively manage interest rate risk. The interest rate swaps of the Company were
executed to modify net interest sensitivity to levels deemed appropriate.
IMPACT OF INFLATION AND CHANGING PRICES
The consolidated financial statements and related financial data presented herein have been prepared in accordance with generally accepted accounting
principles, which generally require the measurement of financial position and operating results in terms of historical dollars, without considering changes in relative purchasing power over time due to inflation. Unlike most industrial companies,
the majority of the Company’s assets and liabilities are monetary in nature. As a result, interest rates generally have a more significant impact on the Company’s performance than does the effect of inflation. Although fluctuations in
interest rates are neither completely predictable nor controllable, the Company regularly monitors its interest rate position and oversees its financial risk management by establishing policies and operating limits. Interest rates do not necessarily
move in the same direction or in the same magnitude as the prices of goods and services, since such prices are affected by inflation to a larger extent than interest rates. Although not as critical to the banking industry as to other industries,
inflationary factors may have some impact on the Company’s growth, earnings, total assets and capital levels. Management does not expect inflation to be a significant factor in 2013.
MANAGEMENT REPORT ON INTERNAL CONTROL OVER FINANCIAL REPORTING
To the Board of Directors of
IBERIABANK Corporation
The
management of IBERIABANK Corporation (the “Company”) is responsible for establishing and maintaining adequate internal control over financial reporting. The Company’s internal control system was designed to provide reasonable
assurance to the Company’s management and board of directors regarding the preparation and fair presentation of published financial statements.
All internal control systems, no matter how well designed, have inherent limitations. Therefore, even those systems determined to be effective can provide only reasonable assurance with respect to
financial statement preparation and presentation.
The Company’s management assessed the effectiveness of the Company’s internal
control over financial reporting as of December 31, 2012. In making this assessment, it used the criteria set forth by the Committee of Sponsoring Organizations of the Treadway Commission (COSO) in Internal Control—Integrated Framework.
Based on our assessment, management believes that, as of December 31, 2012, the Company’s internal control over financial reporting is effective based on those criteria.
The Company’s independent registered public accounting firm has also issued an attestation report on the effectiveness of the Company’s internal control over financial reporting as of
December 31, 2012.
|
|
|
|
|
|
|
|
| /s/ Daryl G. Byrd |
|
|
|
/s/ Anthony J. Restel |
| Daryl G. Byrd |
|
|
|
Anthony J. Restel |
| President and Chief Executive Officer |
|
|
|
Senior Executive Vice President and Chief Financial Officer |
REPORT OF INDEPENDENT REGISTERED PUBLIC ACCOUNTING FIRM
The Board of Directors and Shareholders
IBERIABANK Corporation
We have audited
IBERIABANK Corporation’s internal control over financial reporting as of December 31, 2012, based on criteria established in Internal Control—Integrated Framework issued by the Committee of Sponsoring Organizations of the Treadway
Commission (the COSO criteria). IBERIABANK Corporation’s management is responsible for maintaining effective internal control over financial reporting, and for its assessment of the effectiveness of internal control over financial reporting
included in the accompanying Management Report on Internal Control Over Financial Reporting. Our responsibility is to express an opinion on the Company’s internal control over financial reporting based on our audit.
We conducted our audit in accordance with the standards of the Public Company Accounting Oversight Board (United States). Those standards require that we
plan and perform the audit to obtain reasonable assurance about whether effective internal control over financial reporting was maintained in all material respects. Our audit included obtaining an understanding of internal control over financial
reporting, assessing the risk that a material weakness exists, testing and evaluating the design and operating effectiveness of internal control based on the assessed risk, and performing such other procedures as we considered necessary in the
circumstances. We believe that our audit provides a reasonable basis for our opinion.
A company’s internal control over financial
reporting is a process designed to provide reasonable assurance regarding the reliability of financial reporting and the preparation of financial statements for external purposes in accordance with generally accepted accounting principles. A
company’s internal control over financial reporting includes those policies and procedures that (1) pertain to the maintenance of records that, in reasonable detail, accurately and fairly reflect the transactions and dispositions of the
assets of the company; (2) provide reasonable assurance that transactions are recorded as necessary to permit preparation of financial statements in accordance with generally accepted accounting principles, and that receipts and expenditures of
the company are being made only in accordance with authorizations of management and directors of the company; and (3) provide reasonable assurance regarding prevention or timely detection of unauthorized acquisition, use, or disposition of the
company’s assets that could have a material effect on the financial statements.
Because of its inherent limitations, internal control
over financial reporting may not prevent or detect misstatements. Also, projections of any evaluation of effectiveness to future periods are subject to the risk that controls may become inadequate because of changes in conditions, or that the degree
of compliance with the policies or procedures may deteriorate.
In our opinion, IBERIABANK Corporation maintained, in all material respects,
effective internal control over financial reporting as of December 31, 2012, based on the COSO criteria.
We also have audited, in
accordance with the standards of the Public Company Accounting Oversight Board (United States), the consolidated balance sheets of IBERIABANK Corporation as of December 31, 2012 and 2011, and the related consolidated statements of comprehensive
income, shareholders’ equity, and cash flows for each of the three years in the period ended December 31, 2012 and our report dated March 1, 2013, expressed an unqualified opinion thereon.
/s/ Ernst & Young LLP
New Orleans, Louisiana
March 1, 2013
REPORT OF INDEPENDENT REGISTERED PUBLIC ACCOUNTING FIRM
The Board of Directors and Shareholders
IBERIABANK Corporation
We have audited the
accompanying consolidated balance sheets of IBERIABANK Corporation as of December 31, 2012 and 2011, and the related consolidated statements of comprehensive income, shareholders’ equity, and cash flows for each of the three years in the
period ended December 31, 2012. These financial statements are the responsibility of the Company’s management. Our responsibility is to express an opinion on these financial statements based on our audits.
We conducted our audits in accordance with the standards of the Public Company Accounting Oversight Board (United States). Those standards require that
we plan and perform the audit to obtain reasonable assurance about whether the financial statements are free of material misstatement. An audit includes examining, on a test basis, evidence supporting the amounts and disclosures in the financial
statements. An audit also includes assessing the accounting principles used and significant estimates made by management, as well as evaluating the overall financial statement presentation. We believe that our audits provide a reasonable basis for
our opinion.
In our opinion, the financial statements referred to above present fairly, in all material respects, the consolidated financial
position of IBERIABANK Corporation at December 31, 2012 and 2011, and the consolidated results of its operations and its cash flows for each of the three years in the period ended December 31, 2012 in conformity with U.S. generally
accepted accounting principles.
As described in Note 1 to the consolidated financial statements, the 2011 and 2010 financial statements have
been restated to correct an error in the consolidated statement of cash flows.
We also have audited, in accordance with the standards of the
Public Company Accounting Oversight Board (United States), IBERIABANK Corporation’s internal control over financial reporting as of December 31, 2012, based on criteria established in Internal Control-Integrated Framework issued by the
Committee of Sponsoring Organizations of the Treadway Commission and our report dated March 1, 2013, expressed an unqualified opinion thereon.
/s/ Ernst & Young LLP
New Orleans, Louisiana
March 1, 2013
IBERIABANK CORPORATION AND SUBSIDIARIES
Consolidated Balance Sheets
December 31, 2012 and 2011
|
|
|
|
|
|
|
|
|
| (Dollars in thousands, except share data) |
|
2012 |
|
|
2011 |
|
|
|
|
| Assets |
|
|
|
|
|
|
|
|
| Cash and due from banks |
|
$ |
248,214 |
|
|
$ |
194,171 |
|
| Interest-bearing deposits in banks |
|
|
722,763 |
|
|
|
379,125 |
|
|
|
|
|
|
|
|
|
|
| Total cash and cash equivalents |
|
|
970,977 |
|
|
|
573,296 |
|
| Securities available for sale, at fair value |
|
|
1,745,004 |
|
|
|
1,805,205 |
|
| Securities held to maturity, fair values of $211,498 and $199,100, respectively |
|
|
205,062 |
|
|
|
192,764 |
|
| Mortgage loans held for sale |
|
|
267,475 |
|
|
|
153,013 |
|
| Loans covered by loss share agreements |
|
|
1,092,756 |
|
|
|
1,334,449 |
|
| Non-covered loans, net of unearned income |
|
|
7,405,824 |
|
|
|
6,053,588 |
|
|
|
|
|
|
|
|
|
|
| Total loans, net of unearned income |
|
|
8,498,580 |
|
|
|
7,388,037 |
|
| Allowance for credit losses |
|
|
(251,603 |
) |
|
|
(193,761 |
) |
|
|
|
|
|
|
|
|
|
| Loans, net |
|
|
8,246,977 |
|
|
|
7,194,276 |
|
| FDIC loss share receivables |
|
|
423,069 |
|
|
|
591,844 |
|
| Premises and equipment, net |
|
|
303,523 |
|
|
|
285,607 |
|
| Goodwill |
|
|
401,872 |
|
|
|
369,811 |
|
| Other assets |
|
|
565,719 |
|
|
|
592,112 |
|
|
|
|
|
|
|
|
|
|
|
|
|
| Total Assets |
|
$ |
13,129,678 |
|
|
$ |
11,757,928 |
|
|
|
|
|
|
|
|
|
|
|
|
|
| Liabilities |
|
|
|
|
|
|
|
|
| Deposits: |
|
|
|
|
|
|
|
|
| Noninterest-bearing |
|
$ |
1,967,662 |
|
|
$ |
1,485,058 |
|
| Interest-bearing |
|
|
8,780,615 |
|
|
|
7,803,955 |
|
|
|
|
|
|
|
|
|
|
| Total deposits |
|
|
10,748,277 |
|
|
|
9,289,013 |
|
| Short-term borrowings |
|
|
303,045 |
|
|
|
395,543 |
|
| Long-term debt |
|
|
423,377 |
|
|
|
452,733 |
|
| Other liabilities |
|
|
125,111 |
|
|
|
137,978 |
|
|
|
|
|
|
|
|
|
|
|
|
|
| Total Liabilities |
|
|
11,599,810 |
|
|
|
10,275,267 |
|
|
|
|
|
|
|
|
|
|
|
|
|
| Shareholders’ Equity |
|
|
|
|
|
|
|
|
| Common stock, $1 par value - 50,000,000 shares authorized; 31,917,385 and 31,163,070 shares issued, respectively |
|
|
31,917 |
|
|
|
31,163 |
|
| Additional paid-in capital |
|
|
1,176,180 |
|
|
|
1,135,880 |
|
| Retained earnings |
|
|
411,472 |
|
|
|
375,184 |
|
| Accumulated other comprehensive income |
|
|
24,477 |
|
|
|
24,457 |
|
| Treasury stock at cost - 2,427,640 and 1,789,165 shares, respectively |
|
|
(114,178 |
) |
|
|
(84,023 |
) |
|
|
|
|
|
|
|
|
|
|
|
|
| Total Shareholders’ Equity |
|
|
1,529,868 |
|
|
|
1,482,661 |
|
|
|
|
|
|
|
|
|
|
|
|
|
| Total Liabilities and Shareholders’ Equity |
|
$ |
13,129,678 |
|
|
$ |
11,757,928 |
|
|
|
|
|
|
|
|
|
|
The accompanying Notes are an integral part of these Consolidated Financial Statements.
IBERIABANK CORPORATION AND SUBSIDIARIES
Consolidated Statements of Comprehensive Income
Years Ended December 31, 2012, 2011, and 2010
|
|
|
|
|
|
|
|
|
|
|
|
|
| (Dollars in thousands, except per share data) |
|
2012 |
|
|
2011 |
|
|
2010 |
|
|
|
|
|
| Interest and Dividend Income |
|
|
|
|
|
|
|
|
|
|
|
|
| Loans, including fees |
|
$ |
513,936 |
|
|
$ |
436,172 |
|
|
$ |
353,228 |
|
| Mortgage loans held for sale, including fees |
|
|
5,318 |
|
|
|
3,479 |
|
|
|
3,945 |
|
| Investment securities: |
|
|
|
|
|
|
|
|
|
|
|
|
| Taxable interest |
|
|
33,890 |
|
|
|
44,760 |
|
|
|
44,936 |
|
| Tax-exempt interest |
|
|
7,375 |
|
|
|
5,956 |
|
|
|
4,471 |
|
| Accretion (Amortization) of FDIC loss share receivable |
|
|
(118,100 |
) |
|
|
(72,086 |
) |
|
|
(13,024 |
) |
| Other |
|
|
2,781 |
|
|
|
2,046 |
|
|
|
2,815 |
|
|
|
|
|
|
|
|
|
|
|
|
|
|
| Total interest and dividend income |
|
|
445,200 |
|
|
|
420,327 |
|
|
|
396,371 |
|
|
|
|
|
|
|
|
|
|
|
|
|
|
|
|
|
|
| Interest Expense |
|
|
|
|
|
|
|
|
|
|
|
|
| Deposits: |
|
|
|
|
|
|
|
|
|
|
|
|
| NOW and MMDA |
|
|
23,936 |
|
|
|
28,914 |
|
|
|
43,247 |
|
| Savings |
|
|
573 |
|
|
|
656 |
|
|
|
1,542 |
|
| Time deposits |
|
|
24,855 |
|
|
|
40,984 |
|
|
|
50,968 |
|
| Short-term borrowings |
|
|
650 |
|
|
|
577 |
|
|
|
814 |
|
| Long-term debt |
|
|
13,436 |
|
|
|
10,938 |
|
|
|
18,173 |
|
|
|
|
|
|
|
|
|
|
|
|
|
|
| Total interest expense |
|
|
63,450 |
|
|
|
82,069 |
|
|
|
114,744 |
|
|
|
|
|
|
|
|
|
|
|
|
|
|
| Net interest income |
|
|
381,750 |
|
|
|
338,258 |
|
|
|
281,627 |
|
| Provision for credit losses |
|
|
20,671 |
|
|
|
25,867 |
|
|
|
42,451 |
|
|
|
|
|
|
|
|
|
|
|
|
|
|
| Net interest income after provision for credit losses |
|
|
361,079 |
|
|
|
312,391 |
|
|
|
239,176 |
|
|
|
|
|
|
|
|
|
|
|
|
|
|
|
|
|
|
| Noninterest Income |
|
|
|
|
|
|
|
|
|
|
|
|
| Service charges on deposit accounts |
|
|
26,852 |
|
|
|
25,915 |
|
|
|
24,375 |
|
| Mortgage Income |
|
|
78,053 |
|
|
|
45,177 |
|
|
|
48,007 |
|
| Title revenue |
|
|
20,987 |
|
|
|
18,048 |
|
|
|
18,083 |
|
| ATM/debit card fee income |
|
|
8,978 |
|
|
|
11,008 |
|
|
|
10,117 |
|
| Income from bank owned life insurance |
|
|
3,680 |
|
|
|
3,296 |
|
|
|
3,100 |
|
| Gain (loss) on sale of assets |
|
|
42 |
|
|
|
943 |
|
|
|
(76 |
) |
| Gain on acquisition |
|
|
— |
|
|
|
— |
|
|
|
3,781 |
|
| Gain on sale of available for sale investments |
|
|
3,739 |
|
|
|
3,422 |
|
|
|
5,172 |
|
| Derivative losses reclassified from other comprehensive income |
|
|
(1,618 |
) |
|
|
(1,723 |
) |
|
|
(1,643 |
) |
| Broker commissions |
|
|
13,446 |
|
|
|
10,224 |
|
|
|
7,530 |
|
| Other income |
|
|
21,838 |
|
|
|
15,549 |
|
|
|
15,444 |
|
|
|
|
|
|
|
|
|
|
|
|
|
|
| Total noninterest income |
|
|
175,997 |
|
|
|
131,859 |
|
|
|
133,890 |
|
|
|
|
|
|
|
|
|
|
|
|
|
|
|
|
|
|
| Noninterest Expense |
|
|
|
|
|
|
|
|
|
|
|
|
| Salaries and employee benefits |
|
|
233,777 |
|
|
|
193,773 |
|
|
|
161,482 |
|
| Net occupancy and equipment |
|
|
54,672 |
|
|
|
49,600 |
|
|
|
33,837 |
|
| Franchise and shares tax |
|
|
3,809 |
|
|
|
4,243 |
|
|
|
2,718 |
|
| Communication and delivery |
|
|
12,671 |
|
|
|
11,510 |
|
|
|
9,643 |
|
| Marketing and business development |
|
|
12,546 |
|
|
|
9,754 |
|
|
|
6,288 |
|
| Data processing |
|
|
15,590 |
|
|
|
14,531 |
|
|
|
12,133 |
|
| Printing, stationery and supplies |
|
|
3,298 |
|
|
|
3,298 |
|
|
|
2,987 |
|
| Amortization of acquisition intangibles |
|
|
5,150 |
|
|
|
5,121 |
|
|
|
4,935 |
|
| Professional services |
|
|
21,095 |
|
|
|
15,085 |
|
|
|
13,473 |
|
| Net costs of OREO property |
|
|
6,352 |
|
|
|
10,029 |
|
|
|
3,201 |
|
| Credit and other loan related expense |
|
|
18,095 |
|
|
|
15,348 |
|
|
|
12,729 |
|
| Insurance |
|
|
10,771 |
|
|
|
10,022 |
|
|
|
12,469 |
|
| Travel and entertainment |
|
|
9,563 |
|
|
|
7,615 |
|
|
|
6,974 |
|
| Other expenses |
|
|
24,796 |
|
|
|
23,802 |
|
|
|
21,380 |
|
|
|
|
|
|
|
|
|
|
|
|
|
|
| Total noninterest expense |
|
|
432,185 |
|
|
|
373,731 |
|
|
|
304,249 |
|
|
|
|
|
|
|
|
|
|
|
|
|
|
| Income before income tax expense |
|
|
104,891 |
|
|
|
70,519 |
|
|
|
68,817 |
|
| Income tax expense |
|
|
28,496 |
|
|
|
16,981 |
|
|
|
19,991 |
|
|
|
|
|
|
|
|
|
|
|
|
|
|
| Net Income |
|
|
76,395 |
|
|
|
53,538 |
|
|
|
48,826 |
|
|
|
|
|
| Income Available to Common Shareholders - Basic |
|
$ |
76,395 |
|
|
$ |
53,538 |
|
|
$ |
48,826 |
|
| Earnings Allocated to Unvested Restricted Stock |
|
|
(1,437 |
) |
|
|
(967 |
) |
|
|
(971 |
) |
|
|
|
|
|
|
|
|
|
|
|
|
|
| Earnings Available to Common Shareholders - Diluted |
|
|
74,958 |
|
|
|
52,571 |
|
|
|
47,855 |
|
|
|
|
|
| Earnings per common share - Basic |
|
$ |
2.59 |
|
|
$ |
1.88 |
|
|
$ |
1.90 |
|
| Earnings per common share - Diluted |
|
|
2.59 |
|
|
|
1.87 |
|
|
|
1.88 |
|
| Cash dividends declared per common share |
|
|
1.36 |
|
|
|
1.36 |
|
|
|
1.36 |
|
|
|
|
|
| Other comprehensive income |
|
|
|
|
|
|
|
|
|
|
|
|
| Unrealized gains on securities: |
|
|
|
|
|
|
|
|
|
|
|
|
| Unrealized holding gains (losses) arising during the period |
|
$ |
2,174 |
|
|
$ |
36,328 |
|
|
$ |
(2,103 |
) |
| Other than temporary impairment realized in net income |
|
|
— |
|
|
|
(509 |
) |
|
|
(517 |
) |
| Less: reclassification adjustment for gains included in net income |
|
|
(3,739 |
) |
|
|
(3,422 |
) |
|
|
(5,172 |
) |
|
|
|
|
|
|
|
|
|
|
|
|
|
| Unrealized (loss) gain on securities, before tax |
|
|
(1,565 |
) |
|
|
32,397 |
|
|
|
(7,792 |
) |
|
|
|
|
| Fair value of derivative instruments designated as cash flow hedges: |
|
|
|
|
|
|
|
|
|
|
|
|
| Change in fair value of derivative instruments designated as cash flow hedges during the period |
|
|
(22 |
) |
|
|
(19,078 |
) |
|
|
(5,751 |
) |
| Less: reclassification adjustment for losses (gains) included in net income |
|
|
1,618 |
|
|
|
1,723 |
|
|
|
1,643 |
|
|
|
|
|
|
|
|
|
|
|
|
|
|
| Fair value of derivative instruments designated as cash flow hedges, before tax |
|
|
1,596 |
|
|
|
(17,355 |
) |
|
|
(4,108 |
) |
|
|
|
|
|
|
|
|
|
|
|
|
|
| Other comprehensive income (loss), before tax |
|
|
31 |
|
|
|
15,042 |
|
|
|
(11,900 |
) |
| Income tax expense (benefit) related to items of other comprehensive income |
|
|
11 |
|
|
|
5,265 |
|
|
|
(4,164 |
) |
|
|
|
|
|
|
|
|
|
|
|
|
|
| Other comprehensive income (loss), net of tax |
|
|
20 |
|
|
|
9,777 |
|
|
|
(7,736 |
) |
|
|
|
|
| Comprehensive income |
|
$ |
76,415 |
|
|
$ |
63,315 |
|
|
$ |
41,090 |
|
|
|
|
|
|
|
|
|
|
|
|
|
|
The accompanying Notes are an integral part of these Consolidated Financial Statements.
IBERIABANK CORPORATION AND SUBSIDIARIES
Consolidated Statements of Shareholders’ Equity
Years Ended December 31, 2012, 2011, and 2010
|
|
|
|
|
|
|
|
|
|
|
|
|
|
|
|
|
|
|
|
|
|
|
|
|
| |
|
|
|
|
|
|
|
|
|
|
Accumulated |
|
|
|
|
|
|
|
| |
|
|
|
|
Additional |
|
|
|
|
|
Other |
|
|
|
|
|
|
|
| |
|
Common |
|
|
Paid-In |
|
|
Retained |
|
|
Comprehensive |
|
|
Treasury |
|
|
|
|
| (Dollars in thousands, except share and per share data) |
|
Stock |
|
|
Capital |
|
|
Earnings |
|
|
Income |
|
|
Stock |
|
|
Total |
|
|
|
|
|
|
|
|
| Balance, December 31, 2009 |
|
$ |
22,107 |
|
|
$ |
632,086 |
|
|
$ |
348,724 |
|
|
$ |
22,416 |
|
|
$ |
(64,015 |
) |
|
$ |
961,318 |
|
|
|
|
|
|
|
|
| Net income |
|
|
— |
|
|
|
— |
|
|
|
48,826 |
|
|
|
— |
|
|
|
— |
|
|
|
48,826 |
|
| Other comprehensive income (loss) |
|
|
— |
|
|
|
— |
|
|
|
— |
|
|
|
(7,736 |
) |
|
|
— |
|
|
|
(7,736 |
) |
| Cash dividends declared, $1.36 per share |
|
|
— |
|
|
|
— |
|
|
|
(36,495 |
) |
|
|
— |
|
|
|
— |
|
|
|
(36,495 |
) |
| Reissuance of treasury stock under incentive plan, |
|
|
— |
|
|
|
— |
|
|
|
— |
|
|
|
— |
|
|
|
— |
|
|
|
— |
|
| net of shares surrendered in payment, including |
|
|
— |
|
|
|
— |
|
|
|
— |
|
|
|
— |
|
|
|
— |
|
|
|
— |
|
| tax benefit, 154,183 shares |
|
|
— |
|
|
|
(611 |
) |
|
|
— |
|
|
|
— |
|
|
|
1,378 |
|
|
|
767 |
|
| Common stock issued, 5,973,182 shares |
|
|
5,973 |
|
|
|
323,007 |
|
|
|
— |
|
|
|
— |
|
|
|
— |
|
|
|
328,980 |
|
| Common stock issued for recognition and retention plan |
|
|
— |
|
|
|
(5,415 |
) |
|
|
— |
|
|
|
— |
|
|
|
5,415 |
|
|
|
— |
|
| Share-based compensation cost |
|
|
— |
|
|
|
7,797 |
|
|
|
— |
|
|
|
— |
|
|
|
— |
|
|
|
7,797 |
|
|
|
|
|
|
|
|
|
|
|
|
|
|
|
|
|
|
|
|
|
|
|
|
|
|
|
|
|
|
|
|
|
| Balance, December 31, 2010 |
|
$ |
28,080 |
|
|
$ |
956,864 |
|
|
$ |
361,055 |
|
|
$ |
14,680 |
|
|
$ |
(57,222 |
) |
|
$ |
1,303,457 |
|
|
|
|
|
|
|
|
|
|
|
|
|
|
|
|
|
|
|
|
|
|
|
|
|
|
|
|
|
|
|
|
|
| Net income |
|
|
— |
|
|
|
— |
|
|
|
53,538 |
|
|
|
— |
|
|
|
— |
|
|
|
53,538 |
|
| Other comprehensive income (loss) |
|
|
— |
|
|
|
— |
|
|
|
— |
|
|
|
9,777 |
|
|
|
— |
|
|
|
9,777 |
|
| Cash dividends declared, $1.36 per share |
|
|
— |
|
|
|
— |
|
|
|
(39,409 |
) |
|
|
— |
|
|
|
— |
|
|
|
(39,409 |
) |
| Reissuance of treasury stock under incentive plan, |
|
|
— |
|
|
|
— |
|
|
|
— |
|
|
|
— |
|
|
|
— |
|
|
|
— |
|
| net of shares surrendered in payment, including |
|
|
— |
|
|
|
— |
|
|
|
— |
|
|
|
— |
|
|
|
— |
|
|
|
— |
|
| tax benefit, 316,063 shares |
|
|
— |
|
|
|
(2,596 |
) |
|
|
— |
|
|
|
— |
|
|
|
9,026 |
|
|
|
6,430 |
|
| Common stock issued for acquisitions, 3,083,229 shares |
|
|
3,083 |
|
|
|
178,057 |
|
|
|
— |
|
|
|
— |
|
|
|
— |
|
|
|
181,140 |
|
| Common stock issued for recognition and retention plan |
|
|
— |
|
|
|
(5,559 |
) |
|
|
— |
|
|
|
— |
|
|
|
5,559 |
|
|
|
— |
|
| Share-based compensation cost |
|
|
— |
|
|
|
9,114 |
|
|
|
— |
|
|
|
— |
|
|
|
— |
|
|
|
9,114 |
|
| Treasury stock acquired at cost, 900,000 shares |
|
|
— |
|
|
|
— |
|
|
|
— |
|
|
|
— |
|
|
|
(41,386 |
) |
|
|
(41,386 |
) |
|
|
|
|
|
|
|
|
|
|
|
|
|
|
|
|
|
|
|
|
|
|
|
|
|
|
|
|
|
|
|
|
| Balance, December 31, 2011 |
|
$ |
31,163 |
|
|
$ |
1,135,880 |
|
|
$ |
375,184 |
|
|
$ |
24,457 |
|
|
$ |
(84,023 |
) |
|
$ |
1,482,661 |
|
|
|
|
|
|
|
|
|
|
|
|
|
|
|
|
|
|
|
|
|
|
|
|
|
|
|
|
|
|
|
|
|
| Net income |
|
|
— |
|
|
|
— |
|
|
|
76,395 |
|
|
|
— |
|
|
|
— |
|
|
|
76,395 |
|
| Other comprehensive income (loss) |
|
|
— |
|
|
|
— |
|
|
|
— |
|
|
|
20 |
|
|
|
— |
|
|
|
20 |
|
| Cash dividends declared, $1.36 per share |
|
|
— |
|
|
|
— |
|
|
|
(40,107 |
) |
|
|
— |
|
|
|
— |
|
|
|
(40,107 |
) |
| Reissuance of treasury stock under incentive plan, |
|
|
— |
|
|
|
— |
|
|
|
— |
|
|
|
— |
|
|
|
— |
|
|
|
— |
|
| net of shares surrendered in payment, including |
|
|
— |
|
|
|
— |
|
|
|
— |
|
|
|
— |
|
|
|
— |
|
|
|
— |
|
| tax benefit, 214,833 shares |
|
|
— |
|
|
|
(354 |
) |
|
|
— |
|
|
|
— |
|
|
|
2,576 |
|
|
|
2,222 |
|
| Common stock issued for acquisitions, 754,334 shares |
|
|
754 |
|
|
|
38,449 |
|
|
|
— |
|
|
|
— |
|
|
|
— |
|
|
|
39,203 |
|
| Common stock issued for recognition and retention plan |
|
|
— |
|
|
|
(7,702 |
) |
|
|
— |
|
|
|
— |
|
|
|
7,702 |
|
|
|
— |
|
| Share-based compensation cost |
|
|
— |
|
|
|
9,907 |
|
|
|
— |
|
|
|
— |
|
|
|
— |
|
|
|
9,907 |
|
| Treasury stock acquired at cost, 853,308 shares |
|
|
— |
|
|
|
— |
|
|
|
— |
|
|
|
— |
|
|
|
(40,433 |
) |
|
|
(40,433 |
) |
|
|
|
|
|
|
|
|
|
|
|
|
|
|
|
|
|
|
|
|
|
|
|
|
|
|
|
|
|
|
|
|
| Balance, December 31, 2012 |
|
$ |
31,917 |
|
|
$ |
1,176,180 |
|
|
$ |
411,472 |
|
|
$ |
24,477 |
|
|
$ |
(114,178 |
) |
|
$ |
1,529,868 |
|
|
|
|
|
|
|
|
|
|
|
|
|
|
|
|
|
|
|
|
|
|
|
|
|
|
The accompanying Notes are an integral part of these Consolidated Financial Statements.
IBERIABANK CORPORATION AND SUBSIDIARIES
Consolidated Statements of Cash Flows
Years Ended December 31, 2012, 2011, and 2010
|
|
|
|
|
|
|
|
|
|
|
|
|
| |
|
|
|
|
Restated |
|
| (Dollars in thousands) |
|
2012 |
|
|
2011 |
|
|
2010 |
|
| Cash Flows from Operating Activities |
|
|
|
|
|
|
|
|
|
|
|
|
| Net income |
|
$ |
76,395 |
|
|
$ |
53,538 |
|
|
$ |
48,826 |
|
| Adjustments to reconcile net income to net cash provided by operating activities: |
|
|
|
|
|
|
|
|
|
|
|
|
| Depreciation and amortization |
|
|
21,685 |
|
|
|
16,772 |
|
|
|
11,042 |
|
| Amortization of purchase accounting adjustments |
|
|
(47,383 |
) |
|
|
(30,653 |
) |
|
|
(52,850 |
) |
| Provision for credit losses |
|
|
20,671 |
|
|
|
25,867 |
|
|
|
42,451 |
|
| Noncash compensation expense |
|
|
9,907 |
|
|
|
9,114 |
|
|
|
7,797 |
|
| (Gain) loss on sale of assets |
|
|
(42 |
) |
|
|
(943 |
) |
|
|
76 |
|
| Loss on impaired securities |
|
|
— |
|
|
|
509 |
|
|
|
517 |
|
| Gain on sale of available for sale investments |
|
|
(3,739 |
) |
|
|
(3,422 |
) |
|
|
(5,172 |
) |
| Gain on sale of OREO |
|
|
(4,985 |
) |
|
|
(1,476 |
) |
|
|
(2,524 |
) |
| Gain on acquisition |
|
|
— |
|
|
|
— |
|
|
|
(3,781 |
) |
| Loss on abandonment of fixed assets |
|
|
2,743 |
|
|
|
— |
|
|
|
— |
|
| Amortization of premium/discount on investments |
|
|
21,013 |
|
|
|
18,233 |
|
|
|
15,050 |
|
| Derivative losses (gains) on swaps |
|
|
1 |
|
|
|
2 |
|
|
|
(3 |
) |
| (Benefit) provision for deferred income taxes |
|
|
(7,527 |
) |
|
|
(11,750 |
) |
|
|
(3,607 |
) |
| Mortgage loans held for sale |
|
|
|
|
|
|
|
|
|
|
|
|
| Originations |
|
|
(2,432,367 |
) |
|
|
(1,659,226 |
) |
|
|
(1,772,486 |
) |
| Proceeds from sales |
|
|
2,388,716 |
|
|
|
1,637,458 |
|
|
|
1,803,214 |
|
| Gain on sale of loans, net |
|
|
(70,811 |
) |
|
|
(43,955 |
) |
|
|
(47,689 |
) |
| Cash retained from tax benefit associated with share-based payment arrangements |
|
|
(1,221 |
) |
|
|
(1,454 |
) |
|
|
(637 |
) |
| Decrease in other assets |
|
|
7,437 |
|
|
|
5,572 |
|
|
|
228,663 |
|
| Other operating activities, net |
|
|
7,319 |
|
|
|
1,572 |
|
|
|
(54,241 |
) |
|
|
|
|
|
|
|
|
|
|
|
|
|
| Net Cash (Used in) Provided by Operating Activities |
|
|
(12,188 |
) |
|
|
15,758 |
|
|
|
214,646 |
|
|
|
|
|
|
|
|
|
|
|
|
|
|
|
|
|
|
| Cash Flows from Investing Activities |
|
|
|
|
|
|
|
|
|
|
|
|
| Proceeds from sales of securities available for sale |
|
|
154,222 |
|
|
|
130,305 |
|
|
|
249,008 |
|
| Proceeds from maturities, prepayments and calls of securities available for sale |
|
|
880,425 |
|
|
|
626,004 |
|
|
|
576,139 |
|
| Purchases of securities available for sale |
|
|
(935,164 |
) |
|
|
(499,899 |
) |
|
|
(1,198,853 |
) |
| Proceeds from maturities, prepayments and calls of securities held to maturity |
|
|
43,535 |
|
|
|
120,075 |
|
|
|
66,091 |
|
| Purchases of securities held to maturity |
|
|
(57,075 |
) |
|
|
(22,803 |
) |
|
|
(96,375 |
) |
| FDIC reimbursement of recoverable covered asset losses |
|
|
157,694 |
|
|
|
139,852 |
|
|
|
438,870 |
|
| Increase in loans receivable, net, excluding loans acquired |
|
|
(870,577 |
) |
|
|
(560,635 |
) |
|
|
(123,295 |
) |
| Proceeds from sale of premises and equipment |
|
|
1,274 |
|
|
|
3,227 |
|
|
|
1,324 |
|
| Purchases of premises and equipment |
|
|
(32,825 |
) |
|
|
(44,055 |
) |
|
|
(38,063 |
) |
| Proceeds from disposition of real estate owned |
|
|
109,067 |
|
|
|
61,713 |
|
|
|
49,072 |
|
| Investment in new market tax credit entities |
|
|
(21,368 |
) |
|
|
(9,425 |
) |
|
|
(11,875 |
) |
| Cash received in excess of cash paid for acquisition |
|
|
32,425 |
|
|
|
79,288 |
|
|
|
24,134 |
|
| Other investing activities, net |
|
|
10,691 |
|
|
|
2,085 |
|
|
|
6,518 |
|
|
|
|
|
|
|
|
|
|
|
|
|
|
| Net Cash (Used in) Provided by Investing Activities |
|
|
(527,676 |
) |
|
|
25,732 |
|
|
|
(57,305 |
) |
|
|
|
|
|
|
|
|
|
|
|
|
|
|
|
|
|
| Cash Flows from Financing Activities |
|
|
|
|
|
|
|
|
|
|
|
|
| Increase in deposits, net of deposits acquired |
|
|
1,174,829 |
|
|
|
174,809 |
|
|
|
87,498 |
|
| Net change in short-term borrowings, net of borrowings acquired |
|
|
(102,320 |
) |
|
|
136,786 |
|
|
|
(43,023 |
) |
| Proceeds from long-term debt |
|
|
24,086 |
|
|
|
3,176 |
|
|
|
45,233 |
|
| Repayments of long-term debt |
|
|
(80,770 |
) |
|
|
(47,227 |
) |
|
|
(380,004 |
) |
| Dividends paid to shareholders |
|
|
(40,069 |
) |
|
|
(38,558 |
) |
|
|
(34,412 |
) |
| Proceeds from sale of treasury stock for stock options exercised |
|
|
2,813 |
|
|
|
6,807 |
|
|
|
1,631 |
|
| Payments to repurchase common stock |
|
|
(42,245 |
) |
|
|
(43,219 |
) |
|
|
(1,500 |
) |
| Common stock issued |
|
|
— |
|
|
|
— |
|
|
|
328,980 |
|
| Cash retained from tax benefit associated with share-based payment arrangements |
|
|
1,221 |
|
|
|
1,454 |
|
|
|
637 |
|
|
|
|
|
|
|
|
|
|
|
|
|
|
| Net Cash Provided by Financing Activities |
|
|
937,545 |
|
|
|
194,028 |
|
|
|
5,040 |
|
|
|
|
|
|
|
|
|
|
|
|
|
|
|
|
|
|
| Net Increase In Cash and Cash Equivalents |
|
|
397,681 |
|
|
|
235,518 |
|
|
|
162,381 |
|
| Cash and Cash Equivalents at Beginning of Period |
|
|
573,296 |
|
|
|
337,778 |
|
|
|
175,397 |
|
|
|
|
|
|
|
|
|
|
|
|
|
|
| Cash and Cash Equivalents at End of Period |
|
$ |
970,977 |
|
|
$ |
573,296 |
|
|
$ |
337,778 |
|
|
|
|
|
|
|
|
|
|
|
|
|
|
| Supplemental Schedule of Noncash Activities |
|
|
|
|
|
|
|
|
|
|
|
|
| Acquisition of real estate in settlement of loans |
|
$ |
99,134 |
|
|
$ |
104,855 |
|
|
$ |
49,886 |
|
| Common stock issued in acquisition |
|
$ |
39,203 |
|
|
$ |
181,140 |
|
|
$ |
— |
|
| Transfers of property into Other Real Estate |
|
$ |
106,427 |
|
|
$ |
104,855 |
|
|
$ |
49,886 |
|
| Exercise of stock options with payment in company stock |
|
$ |
16 |
|
|
$ |
— |
|
|
$ |
— |
|
| Supplemental Disclosures |
|
|
|
|
|
|
|
|
|
|
|
|
| Cash paid for: |
|
|
|
|
|
|
|
|
|
|
|
|
| Interest on deposits and borrowings |
|
$ |
63,984 |
|
|
$ |
84,452 |
|
|
$ |
117,810 |
|
| Income taxes, net |
|
$ |
15,957 |
|
|
$ |
41,594 |
|
|
$ |
24,494 |
|
|
|
|
|
|
|
|
|
|
|
|
|
|
The accompanying Notes are an integral part of these Consolidated Financial Statements.
IBERIABANK CORPORATION AND SUBSIDIARIES
Notes to Consolidated Financial Statements
NOTE 1 – SUMMARY OF SIGNIFICANT ACCOUNTING POLICIES
PRINCIPLES OF CONSOLIDATION
The consolidated financial statements include the accounts of IBERIABANK Corporation (the “Company”) and its wholly owned subsidiaries, IBERIABANK, Lenders Title Company (“LTC”),
IBERIA Capital Partners LLC (“ICP”), IB Aircraft Holdings, LLC, IBERIA Asset Management Inc. (“IAM”), and IBERIA CDE, LLC (“CDE”). All significant intercompany balances and transactions have been eliminated in
consolidation. All normal, recurring adjustments which, in the opinion of management are necessary for a fair presentation of the financial statements, have been included. Certain amounts reported in prior periods have been reclassified to conform
to the current period presentation.
NATURE OF OPERATIONS
The Company offers commercial and retail banking products and services to customers throughout locations in six states through IBERIABANK. The Company also operates mortgage production offices in twelve
states through IBERIABANK Mortgage Company (“IMC”), and offers a full line of title insurance and closing services throughout Arkansas and Louisiana through LTC and its subsidiaries. ICP provides equity research, institutional sales and
trading, and corporate finance services. IB Aircraft Holdings, LLC owns a fractional share of an aircraft used by management of the Company and its subsidiaries. IAM provides wealth management and trust services for commercial and private banking
clients. CDE is engaged in the purchase of tax credits.
CORRECTION OF AN ERROR IN THE FINANCIAL STATEMENTS
The Company has corrected its historical consolidated statements of cash flows for the years ended December 31, 2011 and 2010 for the miscalculation
of certain activity between its operating and investing cash flows. The correction did not have an effect on the Company’s consolidated balance sheets, statements of comprehensive income, or statements of shareholders’ equity for those
years. The error was identified in 2012 through the operation of the Company’s internal controls over financial reporting. Using accounting guidance provided in Accounting Standards Codification (“ASC”) Topic 250, the Company assessed
these items and determined the error would be considered material to the consolidated statements of cash flows for the years ended December 31, 2011 and 2010. The error also impacts the consolidated statements of cash flows for each quarter in
2012 and 2011 as described in Note 26. As a result, the information included in these consolidated financial statements and footnotes includes the effect this correction has on the previously reported financial statements for those years.
The following table presents the effect this correction has on the Consolidated Statements of Cash Flows for the years ended
December 31, 2011 and 2010.
|
|
|
|
|
|
|
|
|
|
|
|
|
| (Dollars in thousands) |
|
As Previously
Reported |
|
|
Adjustment |
|
|
As Adjusted |
|
| Selected Cash Flow Data |
|
|
|
|
|
|
|
|
|
|
|
|
| 2011 |
|
|
|
|
|
|
|
|
|
|
|
|
| (Increase) decrease in other assets |
|
$ |
(51,549 |
) |
|
$ |
57,121 |
|
|
$ |
5,572 |
|
| Net Cash (Used in) Provided by Operating Activities |
|
|
(41,363 |
) |
|
|
57,121 |
|
|
|
15,758 |
|
|
|
|
|
| Increase in loans receivable, net, excluding loans acquired |
|
|
(503,514 |
) |
|
|
(57,121 |
) |
|
|
(560,635 |
) |
| Net Cash (Used in) Provided by Investing Activities |
|
$ |
82,853 |
|
|
$ |
(57,121 |
) |
|
$ |
25,732 |
|
|
|
|
|
| 2010 |
|
|
|
|
|
|
|
|
|
|
|
|
| (Increase) decrease in other assets |
|
$ |
163,741 |
|
|
$ |
64,922 |
|
|
$ |
228,663 |
|
| Net Cash (Used in) Provided by Operating Activities |
|
|
149,724 |
|
|
|
64,922 |
|
|
|
214,646 |
|
|
|
|
|
| Increase in loans receivable, net, excluding loans acquired |
|
|
(58,373 |
) |
|
|
(64,922 |
) |
|
|
(123,295 |
) |
| Net Cash (Used in) Provided by Investing Activities |
|
$ |
7,617 |
|
|
$ |
(64,922 |
) |
|
$ |
(57,305 |
) |
USE OF ESTIMATES
The preparation of financial statements in conformity with generally accepted accounting principles requires management to make estimates and assumptions that affect the amounts reported in the
consolidated financial statements and accompanying notes. Actual results could differ from those estimates. Material estimates that are susceptible to significant change in the near term are the allowance for credit losses, valuation of and
accounting for loans covered by loss sharing arrangements with the FDIC and the related loss share receivable, valuation of and accounting for acquired loans, valuation of goodwill, intangible assets and other purchase accounting adjustments, and
share-based compensation.
CONCENTRATION OF CREDIT RISKS
Most of the Company’s business activity is with customers located within the States of Louisiana, Florida, Arkansas, Alabama, Texas, and Tennessee. The Company’s lending activity is concentrated
in its market areas in those states. The Company has emphasized originations of commercial loans and private banking loans, defined as loans to larger consumer clients. Repayments on loans are expected to come from cash flows of the borrower and/or
guarantor. Losses on secured loans are limited by the value of the collateral upon default of the borrowers. The Company does not have any significant concentrations to any one industry or customer.
CASH AND CASH EQUIVALENTS
For purposes
of presentation in the consolidated statements of cash flows, cash and cash equivalents are defined as cash, interest-bearing deposits and noninterest-bearing demand deposits at other financial institutions with original maturities less than three
months. IBERIABANK may be required to maintain average balances on hand or with the Federal Reserve Bank to meet regulatory reserve and clearing requirements. At December 31, 2012 and 2011, the required reserve balances were $2,555,000 and
$25,000, respectively. IBERIABANK had enough cash deposited with the Federal Reserve at December 31, 2012 and 2011 to cover the required reserve balance.
INVESTMENT SECURITIES
Debt securities that management has the ability and intent to hold
to maturity are classified as held to maturity and carried at cost, adjusted for amortization of premiums and accretion of discounts using methods approximating the interest method. Securities not classified as held to maturity or trading, including
equity securities with readily determinable fair values, are classified as available for sale and recorded at fair value, with unrealized gains and losses excluded from earnings and reported in other comprehensive income. Declines in the value of
individual held to maturity and available for sale securities below their cost that are other than temporary are included in earnings as realized losses. In estimating other than temporary impairment losses, management considers 1) the length of
time and the extent to which the fair value has been less than cost, 2) the financial condition and near-term prospects of the issuer, 3) the intent and ability of the Company to retain its investment in the issuer for a period of time sufficient to
allow for any anticipated recovery in fair value, and 4) for debt securities, the recovery of contractual principal and interest. Gains or losses on securities sold are recorded on the trade date, using the specific identification method.
LOANS HELD FOR SALE
Mortgage loans originated and intended for sale in the secondary market are carried at the lower of cost or estimated fair value. Net unrealized losses,
if any, are recognized through a valuation allowance that is recorded as a charge to income. Loans held for sale have primarily been fixed rate single-family residential mortgage loans under contract to be sold in the secondary market. In most
cases, loans in this category are sold within thirty days. These loans are generally sold with the mortgage servicing rights released. Buyers generally have recourse to return a purchased loan to the Company under limited circumstances. Recourse
conditions may include early payment default, breach of representations or warranties, and documentation deficiencies. During 2012 and 2011, an insignificant number of loans were returned to the Company.
LOANS (EXCLUDING ACQUIRED LOANS)
The
Company grants mortgage, commercial and consumer loans to customers. Except for loans acquired, loans receivable that management has the intent and ability to hold for the foreseeable future or until maturity or payoff are stated at the unpaid
principal balances, less the allowance for credit losses and net deferred loan origination fees and unearned discounts.
2
Interest income on loans is accrued over the term of the loans based on the principal balance outstanding.
Loan origination fees, net of certain direct origination costs, are deferred and recognized as an adjustment of the related loan yield, using the effective interest method.
The accrual of interest on loans is discontinued at the time the loan is 90 days delinquent unless the credit is well-secured and in process of collection. Mortgage, credit card and other personal loans
are typically charged down to net collateral value, less cost to sell, no later than 180 days past due. Past due status is based on the contractual terms of loans. In all cases, loans are placed on nonaccrual status or charged off at an earlier date
if collection of principal or interest is considered doubtful.
The Company’s covered loan portfolio and non-covered loan portfolio,
which are delineated between a) non-covered loans, excluding acquired loans, and b) acquired loans, are disaggregated into portfolio segments for purposes of determining the allowance for credit losses. The Company’s portfolio segments include
commercial real estate, commercial business, mortgage, and consumer. The Company further disaggregates each commercial real estate, mortgage, and consumer portfolio segment into classes for purposes of monitoring and assessing credit quality based
on certain risk characteristics. Classes within each commercial real estate portfolio segment include commercial real estate construction and commercial real estate – other. Classes within each mortgage portfolio segment include mortgage –
prime and mortgage – subprime. Classes within each consumer portfolio segment include indirect auto, credit card, home equity, and consumer – other. Each commercial business portfolio segment is also considered a class.
Credit Quality
The Company utilizes an
asset risk classification system in accordance with guidelines established by the Federal Reserve Board as part of its efforts to monitor commercial asset quality. “Special mention” loans are defined as loans where known information about
possible credit problems of the borrower cause management to have some doubt as to the ability of these borrowers to comply with the present loan repayment terms and which may result in future disclosure of these loans as nonperforming. For assets
with identified credit issues, the Company has two primary classifications for problem assets: “substandard” and “doubtful.” Substandard assets have one or more defined weaknesses and are characterized by the distinct possibility
that the Company will sustain some loss if the deficiencies are not corrected. Doubtful assets have the weaknesses of substandard assets with the additional characteristic that the weaknesses make collection or liquidation in full satisfaction of
the loan balance outstanding questionable and there is a high probability of loss based on currently existing facts, conditions and values. Loans classified as “Pass” do not meet the criteria set forth for special mention, substandard, or
doubtful classification and are not considered criticized. Asset risk classifications are periodically reviewed and changed if, in the opinion of management, the risk profile of the customer has changed since the last review of the loan
relationship.
A loan is considered impaired when, based on current information and events, it is probable that the Company will be unable to
collect the scheduled payments of principal or interest when due according to the contractual terms of the loan agreement. Factors considered by management in determining impairment include payment status, collateral value, and the probability of
collecting scheduled principal and interest payments when due. Loans that experience insignificant payment delays and payment shortfalls generally are not classified as impaired. The impairment loss is measured on a loan by loan basis for commercial
and construction loans by either the present value of expected future cash flows discounted at the loan’s effective interest rate, the loan’s obtainable market price, or the fair value of the collateral if the loan is collateral dependent.
In general, all interest accrued but not collected for loans that are placed on nonaccrual status or charged off is reversed against interest
income. The interest on these loans is accounted for on the cash-basis method or cost-recovery method, until qualifying for a return to accrual status. Loans are returned to accrual status when all principal and interest amounts contractually due
are brought current and future payments are reasonably assured.
Troubled Debt Restructurings
During the course of its lending operations, the Company periodically grants concessions to its customers in an attempt to protect as much of its
investment as possible and minimize risk of loss. These concessions may include restructuring the terms of a customer loan to alleviate the burden of the customer’s near-term cash requirements. In order to be considered a troubled debt
restructuring (“TDR”), the Company must conclude that the restructuring constitutes a concession and the customer is experiencing financial difficulties. The Company defines a concession to the customer as a modification of existing terms
for economic or legal reasons that it would otherwise not consider. The concession is either granted through an agreement with the customer or is imposed by a court or law. Concessions include modifying original loan terms to reduce or defer cash
payments required as part of the loan agreement, including but not limited to:
| |
• |
|
a reduction of the stated interest rate for the remaining original life of the debt, |
| |
• |
|
extension of the maturity date or dates at a stated interest rate lower than the current market rate for new debt with similar risk characteristics,
|
| |
• |
|
reduction of the face amount or maturity amount of the debt as stated in the agreement, or |
| |
• |
|
reduction of accrued interest receivable on the debt. |
In its determination of whether the customer is experiencing financial difficulties, the Company considers numerous indicators, including, but not limited to:
| |
• |
|
whether the customer is currently in default on its existing loan, or is in an economic position where it is probable the customer will be in default
on its loan in the foreseeable future without a modification, |
| |
• |
|
whether the customer has declared or is in the process of declaring bankruptcy, |
| |
• |
|
whether there is substantial doubt about the customer’s ability to continue as a going concern, |
| |
• |
|
whether, based on its projections of the customer’s current capabilities, the Company believes the customer’s future cash flows will be
insufficient to service the debt, including interest, in accordance with the contractual terms of the existing agreement for the foreseeable future, and |
| |
• |
|
whether, without modification, the customer cannot obtain sufficient funds from other sources at an effective interest rate equal to the current market
rate for similar debt for a nontroubled debtor. |
If the Company concludes that both a concession has been granted and the
concession was granted to a customer experiencing financial difficulties, the Company identifies the loan as a TDR. For purposes of the determination of an allowance for credit losses for TDRs, the Company considers a loss probable on the loan,
which is reviewed for specific impairment in accordance with the Company’s allowance
3
for loan loss methodology. If it is determined that losses are probable on such TDRs, either because of delinquency or other credit quality indicator, the Company establishes specific reserves
for these loans. For additional information on the Company’s allowance for credit losses, see Note 7 to these consolidated financial statements.
ACQUIRED LOANS AND RELATED FDIC LOSS SHARE RECEIVABLE
The Company accounts for its
acquisitions under the purchase method, where all identifiable assets acquired, including loans, are recorded at fair value. No allowance for credit losses related to the acquired loans is recorded on the acquisition date as the fair value of the
loans acquired incorporates assumptions regarding credit risk.
Loans acquired are recorded at fair value in accordance with the fair value
methodology consistent with the exit price concept and exclusive of the shared-loss agreements with the FDIC from certain of the Company’s acquisitions in 2010 and 2009. The fair value estimates associated with the loans include estimates
related to discount rates, expected prepayments and the amount and timing of undiscounted expected principal, interest and other cash flows. Credit discounts are included in the determination of fair value: therefore, an allowance for credit losses
is not recorded at the acquisition date. At the time of acquisition, the Company estimated the fair value of the total acquired loan portfolio by segregating the total portfolio into loan pools with similar characteristics, which included:
| |
• |
|
whether the loan was performing according to contractual terms at the time of acquisition, |
| |
• |
|
the loan type based on regulatory reporting guidelines, namely whether the loan was a mortgage, consumer, or commercial loan
|
| |
• |
|
the nature of collateral, |
| |
• |
|
the interest rate type, whether fixed or variable rate, and |
| |
• |
|
the loan payment type, primarily whether the loan was amortizing or interest-only. |
From these pools, the Company used certain loan information, including outstanding principal balance, estimated expected losses, weighted average
maturity, weighted average term to re-price (if a variable rate loan), weighted average margin, and weighted average interest rate to estimate the expected cash flow for each loan pool.
Acquired loans are evaluated at acquisition and classified as purchase impaired or purchased non-impaired. Purchased impaired loans reflect credit deterioration since origination to the extent that it is
probable at the time of acquisition that the Company will be unable to collect all contractually required payments. For purchased impaired loans, expected cash flows at the acquisition date in excess of the fair value of loans are recorded as
interest income over the life of the loans using a level yield method if the timing and amount of future cash flows is reasonably estimable.
Subsequent to acquisition, the Company performs cash flow re-estimations at least quarterly for each purchased impaired loan and/or loan pool. Increases
in estimated cash flows above those expected at acquisition are recognized on a prospective basis as interest income over the remaining life of the pool. Decreases in expected cash flows subsequent to acquisition result in recognition of a provision
for credit loss.
Acquired loans are placed on nonaccrual status when the Company cannot reasonably estimate cash flows on a loan or loan
pool.
Pursuant to an AICPA letter dated December 18, 2009, the AICPA summarized the SEC staff’s view regarding the accounting in
subsequent periods for discount accretion associated with loan receivables acquired in a business combination or asset purchase. Regarding the accounting for such loan receivables that, in the absence of further standard setting, the AICPA
understands the SEC staff would not object to an accounting policy based on contractual cash flows (ASC Topic 310-20 approach) or an accounting policy based on expected cash flows (ASC 310-30 approach). The Company believes analogizing to ASC Topic
310-30 is the more appropriate option to follow in accounting for the fair value discount. However, in cases where a loan is acquired at a premium or slight discount, the Company believes that the contractual yield approach outlined in ASC Topic
310-20 is the more appropriate approach to apply.
FDIC loss share receivable
Because the FDIC will reimburse the Company for certain loans acquired in 2009 and 2010 should the Company experience a loss, an indemnification asset is recorded at fair value at the acquisition date.
The indemnification asset is recognized at the same time as the indemnified loans, and measured on the same basis, subject to collectability or contractual limitations. The shared loss agreements on the acquisition date reflect the reimbursements
expected to be received from the FDIC, using an appropriate discount rate, which reflects counterparty credit risk and other uncertainties.
The shared loss agreements continue to be measured on the same basis as the related indemnified loans, and the loss share receivable is impacted by
changes in estimated cash flows associated with these loans. Deterioration in the credit quality of the acquired loans and related expected cash flows (immediately recorded as an adjustment to the allowance for credit losses) would immediately
increase the loss share receivable, with the offset recorded through the consolidated statement of income. Increases in the credit quality of the acquired loans and related cash flows (reflected as an adjustment to yield and accreted into income
over the remaining life of the loans) decrease the basis of the shared loss agreements, with such decrease being amortized into income over 1) the life of the loan or 2) the life of the shared loss agreements, whichever is shorter. Loss assumptions
used to measure the basis of the indemnified loans are consistent with the loss assumptions used to measure the indemnification asset. Fair value accounting incorporates into the fair value of the indemnification asset an element of the time value
of money, which is accreted back into income over the life of the shared loss agreements.
Upon the collection from the FDIC of an incurred
loss the indemnification asset will be reduced by the amount owed by the FDIC. A corresponding claim receivable is established when a loss is incurred and recorded in other assets until cash is received from the FDIC.
For further discussion of the Company’s acquisitions and loan accounting, see Note 4 and Note 6 to the consolidated financial statements.
ALLOWANCE FOR CREDIT LOSSES
The allowance for credit losses represents management’s best estimate of probable credit losses inherent in the loan portfolios and off-balance sheet
lending commitments at the balance-sheet date. The allowance for credit losses is maintained at a level the Company considers appropriate and is based on quarterly assessments and evaluations of the collectability and historical loss experience,
including both industry and Company specific considerations. While management uses the best information available to establish the allowance for credit losses, future adjustments may be necessary if economic conditions differ substantially from the
assumptions used in determining the allowance or, if required by regulators, based upon information available to them at the time of their examinations, or if mandated by revisions to, new interpretations of, or issuance of new accounting standards.
See Note 7 for an analysis of the Company’s allowance for credit losses by portfolio and portfolio segment, and credit quality information by class. The entire amount of the allowance for credit losses is available to absorb losses on any
category or lending-related commitment for non-acquired loans. The allowance related to acquired loans represents management’s best estimate of cumulative impairment as described further in “Purchase Impaired Loans (Acquired Loans)”.
The Company’s strategy for credit risk management includes a combination of conservative exposure limits, which are significantly below
legal lending limits and conservative underwriting, documentation and collection standards. The strategy emphasizes geographic, industry, and customer diversification within the Company’s operating footprint, regular credit examinations, and
regular management reviews of large credit exposures and loans experiencing credit quality deterioration.
The Company has not substantively
changed any material aspect in its overall approach of determining the current year allowance for credit losses. There have been no material changes in criteria or estimation techniques as compared to prior periods that impacted the determination of
the current allowance for credit losses.
Allowance for credit losses discussion below includes discussion specific to loans accounted for
under the contractual yield method, referred to as “contractual loans”, and loans accounted for as acquired credit impaired loans.
Contractual Loans (Excluding Acquired Loans)
Contractual loans represent loans accounted for under the contractual yield method. The Company’s contractual loans include loans originated by the Company and acquired loans that are not accounted
for as acquired credit impaired loans, typically referred to as legacy loans. Credit losses on contractual loans are charged and recoveries are credited to the allowance for credit losses. Provisions for loan losses are based on the Company’s
review of historical industry and Company specific loss experience, and factors that management determines should be considered in estimating probable credit losses.
Loans identified as impaired are subject to individual quarterly review for potential loss. The Company considers the current value of collateral, credit quality of any guarantees, the guarantor’s
liquidity and willingness to cooperate, and other factors when evaluating whether an individual loan is impaired. Other factors may include the industry and geographic location of the borrower, size and financial condition of the borrower, cash flow
and leverage of the borrower, and evaluation of the borrower’s management. When individual loans are impaired, allowances are estimated based on management’s assessment of the borrower’s ability to repay the loan given the
availability of collateral and other sources of cash flow, including evaluation of available legal options. Allowances for individually impaired loans are estimated based on the present value of expected future cash flows discounted at the
loan’s effective interest rate, fair value of the underlying collateral or readily observable secondary market values. Collectability of principal and interest is evaluated in assessing the need for a loss accrual.
The Company also estimates reserves for collective impairment that reflect an estimated measurement of losses related to loans not subject to individual
review as of the balance sheet date. Such loans are grouped in homogenous pools or segments, which are consistent with the segments and classes described above. Embedded loss rates are derived from migration analyses, which track net charge-off
experience sustained on loans according to their risk grade, and may be adjusted for Company-specific and/or industry factors. Loss rates are reviewed quarterly and adjusted as management deems necessary based on changing borrower and/or collateral
conditions and actual collections and charge-off experience.
Based on observations made through a qualitative review, management may apply
qualitative adjustments to the quantitatively determined loss estimates at a pool and/or portfolio segment level as deemed appropriate. Primary qualitative and environmental factors that may not be directly reflected in quantitative estimates
include:
| |
• |
|
changes in lending and risk management practices and procedures |
| |
• |
|
trends in the nature and volume of the loan portfolio, including the existence and effect of any portfolio concentrations |
| |
• |
|
changes in experience and depth of lending staff |
| |
• |
|
legal, regulatory and competitive environment |
| |
• |
|
national and regional economic trends |
| |
• |
|
data availability and applicability |
Changes in these factors are considered in determining the directional consistency of changes in the allowance for credit losses. The impact of these factors on the Company’s qualitative assessment
of the allowance for credit losses can change from period to period based on management’s assessment of the extent to which these factors are already reflected in historic loss rates. The uncertainty inherent in the estimation process is also
considered in evaluating the allowance for credit losses.
Purchased Impaired Loans (Acquired Loans)
Purchased impaired loans represent loans acquired by the Company, which are accounted in accordance with ASC 310-30. Credit losses incurred subsequent to
acquisition are charged to the allowance for credit losses. Recoveries are credited to the allowance for credit losses to the extent the losses were incurred subsequent to acquisition. Recoveries related to credit losses incurred prior to
acquisition are reflected as prospective adjustments to yield, which are accreted to income over the remaining life of the associated pool of loans. Provisions for credit losses are based on the Company’s determination of the timing and amount
of expected cash flows. Provisions for credit losses associated with loans covered by loss share agreements with the FDIC are partially offset by increases in the FDIC loss share receivable.
The allowance for credit losses related to loans accounted for as purchased impaired loans is based on management’s re-estimation of expected cash flows for each loan pool. An allowance for credit
losses is established to the extent that the expected cash flows of a loan pool have decreased since acquisition.
4
OFF-BALANCE SHEET CREDIT RELATED FINANCIAL INSTRUMENTS
The Company accounts for its guarantees in accordance with the provisions of ASC Topic 460. In the ordinary course of business, the Company has
entered into commitments to extend credit, including commitments under credit card arrangements, commercial letters of credit and standby letters of credit. Such financial instruments are recorded when they are funded.
DERIVATIVE FINANCIAL INSTRUMENTS
ASC
Topic 815 requires that all derivatives be recognized as assets or liabilities in the balance sheet at fair value. The Company may enter into derivative contracts to manage exposure to interest rate risk or to meet the financing and/or investing
needs of its customers.
In the course of its business operations, the Company is exposed to certain risks, including interest rate,
liquidity, and credit risk. The Company manages its risks through the use of derivative financial instruments, primarily through management of exposure due to the receipt or payment of future cash amounts based on interest rates. The Company’s
derivative financial instruments manage the differences in the timing, amount, and duration of expected cash receipts and payments.
The
primary types of derivatives used by the Company include interest rate swap agreements, forward sales contracts, interest rate lock commitments, and written and purchased options.
Hedging Activities
As part of its activities to manage interest rate risk due to interest
rate movements, the Company has engaged in interest rate swap transactions to manage exposure to interest rate risk through modification of the Company’s net interest sensitivity to levels deemed to be appropriate. The Company utilizes
these interest rate swap agreements to convert a portion of its variable-rate debt to a fixed rate (cash flow hedge). Interest rate swaps are contracts in which a series of interest rate flows are exchanged over a prescribed period. The notional
amount on which the interest payments are based is not exchanged.
Because the swap agreements used to manage interest rate risk have been
designated as hedging exposure to variable cash flows of a forecasted transaction, the effective portion of the derivative’s gain or loss is initially reported as a component of other comprehensive income and subsequently reclassified into
earnings when the forecasted transaction affects earnings or when the hedge is terminated. The ineffective portion of the gain or loss is reported in earnings immediately.
In applying hedge accounting for derivatives, the Company establishes a method for assessing the effectiveness of the hedging derivative and a measurement approach for determining the ineffective aspect
of the hedge upon the inception of the hedge. These methods are consistent with the Company’s approach to managing risk.
Other
Derivative Instruments
Interest rate swap agreements
In addition to using derivative instruments as an interest rate risk management tool, the Company also enters into derivative instruments to help its commercial customers manage their exposure to interest
rate fluctuations. To mitigate the interest rate risk associated with these customer contracts, the Company enters into offsetting derivative contract positions. The Company manages its credit risk, or potential risk of default by its commercial
customers, through credit limit approval and monitoring procedures.
For interest rate swap agreements that are not designated as hedging
instruments, changes in the fair value of the derivatives are recognized in earnings immediately.
5
Rate lock commitments
The Company enters into commitments to originate loans intended for sale whereby the interest rate on the prospective loan is determined prior to funding (“rate lock commitments”). A rate lock
is given to a borrower, subject to conditional performance obligations, for a specified period of time that typically does not exceed 60 days. Simultaneously with the issuance of the rate lock to the borrower, a rate lock is received from an
investor for a best efforts or mandatory delivery of the loan. Under the terms of the best efforts delivery lock, the investor commits to purchase the loan at a specified price, provided the loan is funded and delivered prior to a specified date and
provided that the credit and loan characteristics meet pre-established criteria for such loans. Rate lock commitments on mortgage loans that are intended to be sold are considered to be derivatives. Accordingly, such commitments are recorded at fair
value as derivative assets or liabilities, with changes in fair value recorded in mortgage income.
Equity-indexed certificates of deposit
IBERIABANK offers its customers a certificate of deposit that provides the purchaser a guaranteed return of principal at maturity plus
potential return, which allows IBERIABANK to identify a known cost of funds. The rate of return is based on the performance of a basket of publically traded stocks that represent a variety of industry segments. Because it is based on an equity
index, the rate of return represents an embedded derivative that is not clearly and closely related to the host instrument and is to be accounted for separately. Accordingly, the certificate of deposit is separated into two components: a zero coupon
certificate of deposit (the host instrument) and a written option purchased by the depositor (an embedded derivative). The discount on the zero coupon deposit is amortized over the life of the deposit, and the written option is carried at fair value
on the Company’s consolidated balance sheet, with changes in fair value recorded through earnings. IBERIABANK offsets the risks of the written option by purchasing an option with terms that mirror the written option and that is also carried at
fair value on the Company’s consolidated balance sheet.
PREMISES AND EQUIPMENT
Land is carried at cost. Buildings, furniture, fixtures, and equipment are carried at cost, less accumulated depreciation computed on a straight line
basis over the estimated useful lives of 10 to 40 years for buildings and 3 to 15 years for furniture, fixtures and equipment. Capitalized leasehold improvements are amortized over the length of the initial lease agreement or their useful life,
whichever is shorter.
OTHER REAL ESTATE
Other real estate includes all real estate, other than bank premises used in bank operations, owned or controlled by the Company, including real estate acquired in settlement of loans. Properties are
recorded at the balance of the loan (which is the pro-rata carrying value of loans accounted for in accordance with ASC 310-30) or at estimated fair value less estimated selling costs, whichever is less, at the date acquired. Subsequent to
foreclosure, management periodically performs valuations and the assets are carried at the lower of cost or fair value less estimated selling costs. Revenue and expenses from operations, gain or loss on sale and changes in the valuation allowance
are included in net expenses from foreclosed assets.
For further discussion of the Company’s other real estate owned, see Note 11 to the
consolidated financial statements.
GOODWILL AND OTHER INTANGIBLE ASSETS
Goodwill
Goodwill is accounted for in accordance with ASC Topic 350, and accordingly is
not amortized but is evaluated at least annually for impairment. As part of its testing, the Company first assesses qualitative factors to determine whether it is more likely than not that the fair value of a reporting unit is less than its carrying
amount. If the Company determines the fair value of a reporting unit is less than its carrying amount using these qualitative factors, the Company compares the fair value of goodwill with its carrying amount, and then measures impairment loss by
comparing the implied fair value of goodwill with the carrying amount of that goodwill.
Title Plant
The Company records its title plant assets in accordance with ASC Topic 950. Under ASC Topic 950, costs incurred to construct a title plant, including the
costs incurred to obtain, organize, and summarize historical information, are capitalized until the title plant can be used to perform title searches. Purchased title plant, including a purchased undivided interest in title plant, is recorded at
cost at the date of acquisition. For title plant acquired separately or as part of a company acquisition, cost is measured as the fair value of the consideration given. Capitalized costs of title plant are not depreciated or charged to income unless
circumstances indicate that the carrying amount of the title plant has been impaired. Impairment identifiers include a change in legal requirements or statutory practices, identification of obsolescence, and abandonment of the title plant, among
other identifiers.
Intangible assets subject to amortization
The Company’s acquired intangible assets that are subject to amortization include core deposit intangibles, amortized on a straight
line or accelerated basis over a 10 year average life and a customer relationship intangible asset, amortized on an accelerated basis over a 9.5 year life.
TRANSFERS OF FINANCIAL ASSETS
Transfers of financial assets are accounted for as sales
when control over the assets has been surrendered. Control over transferred assets is deemed to be surrendered when 1) the assets have been isolated from the Company, 2) the transferee obtains the right, free of conditions that constrain it from
taking advantage of that right, to pledge or exchange the transferred assets, and 3) the Company does not maintain effective control over the transferred assets through an agreement to repurchase them before their maturity. Should the transfer not
meet these three criteria, the transaction is treated as a secured financing.
6
INCOME TAXES
The Company and all subsidiaries file a consolidated federal income tax return on a calendar year basis. The Company files income tax returns in the U.S. federal jurisdiction and various state
jurisdictions through IBERIABANK, LTC and their subsidiaries. In lieu of Louisiana state income tax, IBERIABANK is subject to the Louisiana bank shares tax, which is included in noninterest expense or income tax expense in the Company’s
consolidated financial statements. With few exceptions, the Company is no longer subject to U.S. federal, state or local income tax examinations for years before 2009.
Deferred income tax assets and liabilities are determined using the liability (or balance sheet) method. Under this method, the net deferred tax asset or liability is determined based on the tax effects
of the temporary differences between the book and tax bases of the various balance sheet assets and liabilities and gives current recognition to changes in tax rates and laws. The measurement of deferred tax assets is reduced, if necessary, by the
amount of any tax benefits that, based on available evidence, are not expected to be realized.
The Company recognizes interest and penalties
accrued related to unrecognized tax benefits, if applicable, in noninterest expense.
STOCK COMPENSATION PLANS
The Company issues stock options and restricted stock under various plans to directors, officers and other key employees. The Company accounts for its
stock compensation plans in accordance with ASC Topics 718 and 505. Under those provisions, the Company has adopted a fair value based method of accounting for employee stock compensation plans, whereby compensation cost is measured at the grant
date based on the value of the award and is recognized on a straight-line basis over the service period, which is usually the vesting period, taking into account retirement eligibility. As a result, compensation expense relating to stock options and
restricted stock is reflected in net income as part of “Salaries and employee benefits” on the consolidated statements of income. The Company’s practice has been to grant options at no less than the fair market value of the stock at
the grant date.
See Note 19 for additional information on the Company’s share-based compensation plans.
EARNINGS PER COMMON SHARE
Basic
earnings per share represents income available to common shareholders divided by the weighted average number of common shares outstanding during the period. Diluted earnings per share reflect additional common shares that would have been outstanding
if dilutive potential common shares, in the form of stock options, had been issued, as well as any adjustment to income that would result from the assumed issuance. Participating common shares issued by the Company relate to unvested outstanding
restricted stock awards, the earnings allocated to which are used in determining income available to common shareholders under the two-class method.
See Note 3 for additional information on the Company’s calculation of earnings per share.
TREASURY STOCK
The purchase of the
Company’s common stock is recorded at cost. At the date of retirement or subsequent reissuance, treasury stock is reduced by the cost of such stock with differences recorded in additional paid-in capital or retained earnings, as applicable.
COMPREHENSIVE INCOME
Accounting principles generally require that recognized revenue, expenses, gains and losses be included in net income. Although certain changes in assets
and liabilities, such as unrealized gains and losses on available for sale securities and cash flow hedges, are reported as a separate component of the equity section of the balance sheet, such items, along with net income, are components of
comprehensive income.
SEGMENTS
All of the Company’s banking operations are considered by management to be aggregated in one reportable operating segment. Because the overall banking operations comprise substantially all of the
consolidated operations and none of the Company’s other subsidiaries, either individually or in the aggregate, meet quantitative materiality thresholds, no separate segment disclosures are presented in these consolidated financial statements.
The Company has invested in its financial reporting infrastructure to report financial information associated with performance of lines of business within the banking operating segment. The Company anticipates reporting this information
sometime in 2013.
FAIR VALUE MEASUREMENTS
The Company estimates fair value based on the assumptions market participants would use when selling an asset or transferring a liability and
characterizes such measurements within the fair value hierarchy based on the inputs used to develop those assumptions and measure fair value. The hierarchy requires the Company to maximize the use of observable inputs and minimize the use of
unobservable inputs. The three levels of inputs used to measure fair value are as follows:
| |
• |
|
Level 1 – Quoted prices in active markets for identical assets or liabilities. |
| |
• |
|
Level 2 – Observable inputs other than quoted prices included in Level 1, such as quoted prices for similar assets and
liabilities in active markets; quoted prices for identical or similar assets and liabilities in markets that are not active; or other inputs that are observable or can be corroborated by observable market data. |
| |
• |
|
Level 3 – Unobservable inputs that are supported by little or no market activity and that are significant to the fair value of the
assets or liabilities. This includes certain pricing models, discounted cash flow methodologies and similar techniques that use significant unobservable inputs. |
A description of the valuation methodologies used for instruments measured at fair value follows, as well as the classification of such instruments within the valuation hierarchy.
Securities available for sale
Securities are classified within Level 1 where quoted market prices are available in an active market. Inputs include securities that have quoted prices
in active markets for identical assets. If quoted market prices are unavailable, fair value is estimated using quoted prices of securities with similar characteristics, at which point the securities would be classified within Level 2 of the
hierarchy. Examples may include certain collateralized mortgage and debt obligations.
Mortgage loans held for sale
As of December 31, 2012, the Company has $267,475,000 of conforming mortgage loans held for sale. Mortgage loans originated and held for sale are
carried at the lower of cost or estimated fair value. The Company obtains quotes or bids on these loans directly from purchasing financial institutions. Mortgage loans held for sale that were recorded at estimated fair value are included in the
table in Note 22.
Impaired loans
Loans are measured for impairment using the methods permitted by ASC Topic 310. Fair value measurements are used in determining impairment using either the loan’s obtainable market price, if
available (Level 1) or the fair value of the collateral if the loan is collateral dependent (Level 2). Measuring the impairment of loans using the present value of expected future cash flows, discounted at the loan’s effective interest rate, is
not considered a fair value measurement. Fair value of the collateral is determined by appraisals or independent valuation.
Other real
estate owned
Fair values of OREO at December 31, 2012 are determined by sales agreement or appraisal, and costs to sell are based on
estimation per the terms and conditions of the sales agreement or amounts commonly used in real estate transactions. Inputs include appraisal values on the properties or recent sales activity for similar assets in the property’s market, and
thus OREO measured at fair value would be classified within Level 2 of the hierarchy. The Company included property write-downs of $6,409,000, $7,250,000, and $2,943,000 in earnings for the years ended December 31, 2012, 2011, and 2010,
respectively.
Derivative financial instruments
The Company utilizes interest rate swap agreements to convert a portion of its variable-rate debt to a fixed rate (cash flow hedge). The Company also enters into commitments to originate loans whereby the
interest rate on the prospective loan is determined prior to funding (“rate lock commitments”). Rate lock commitments on mortgage loans that are intended to be sold are considered to be derivatives. The Company offers its customers a
certificate of deposit that provides the purchaser a guaranteed return of principal at maturity plus potential return, which allows the Company to identify a known cost of funds. The rate of return is based on an equity index, and as such represents
an embedded derivative. Fair value of interest rate swaps, interest rate lock commitments, and equity-linked written and purchased options are estimated using prices of financial instruments with similar characteristics, and thus are classified
within Level 2 of the fair value hierarchy.
NOTE 2 – RECENT ACCOUNTING PRONOUNCEMENTS
ASU No. 2011-04
In 2012, the Company adopted the provisions of ASU No. 2011-04, Fair Value Measurement (Topic 820): Amendments to Achieve Common Fair Value
Measurement and Disclosure Requirements in US GAAP and IFRSs, which changes the wording used to describe many of the requirements in U.S. GAAP for measuring fair value and for disclosing information about fair value measurements. The
amendments clarify that the Company should disclose quantitative information about the unobservable inputs used in a fair value measurement that is categorized within Level 3 of the fair value hierarchy. Requiring quantitative information does not
change the objective of the requirement but increases the comparability of disclosures between disclosures under U.S. GAAP and IFRSs.
The
disclosures required by this ASU are incorporated in Notes 22 and 23 in these consolidated financial statements.
7
ASU No. 2011-05
In 2012, the Company adopted the provisions of Accounting Standards Update (“ASU”) No. 2011-05, Comprehensive Income (Topic 220): Presentation of Comprehensive Income, which
increases the prominence of items reported in other comprehensive income and eliminates the option to report other comprehensive income as part of the statement of shareholders’ equity. The ASU requires that all nonowner changes in
shareholders’ equity be presented in either a single continuous statement of comprehensive income or in two separate but consecutive statements. The adoption of this ASU did not change the items that are reported in other comprehensive income
or when an item of other comprehensive income must be reclassified to net income. The adoption also did not change the option to present components of other comprehensive income either net of related tax effects or before related tax effects. The
tax effect for each component must be disclosed in the notes to the consolidated financial statements or presented in the statement in which other comprehensive income is presented. The amendments also do not affect how earnings per share is
calculated or presented.
The Company has chosen to present the nonowner changes in shareholders’ equity in a single continuous statement
of comprehensive income in its consolidated financial statements. The adoption of the ASU in the current year affects the format and presentation of its consolidated financial statements but does not represent a departure from currently adopted
accounting principles and thus the adoption did not have an effect on the Company’s operating results, financial position, or liquidity. The financial statements for the comparative prior period have been revised to conform to current period
presentation.
ASU No. 2012-02
In 2012, the Company adopted the provisions of ASU No. 2012-02, Intangibles – Goodwill and Other (Topic 350): Testing Indefinite-Lived Intangible Assets for Impairment, which provides the
Company with the option to make a qualitative assessment about the likelihood that an indefinite-lived intangible asset is impaired to determine whether it should perform a quantitative impairment test. The ASU also enhances the consistency of
impairment testing guidance among long-lived asset categories by permitting the Company to assess qualitative factors to determine whether it is necessary to calculate the asset’s fair value when testing an indefinite-lived intangible asset for
impairment, which is equivalent to the impairment testing requirements for other long-lived assets. In accordance with the amendments in this Update, an entity will have an option not to calculate annually the fair value of an indefinite-lived
intangible asset if the entity determines that it is not more likely than not that the asset is impaired. Permitting the Company to assess qualitative factors when testing indefinite-lived intangible assets for impairment results in guidance that is
similar to the goodwill impairment testing guidance in ASU No. 2011-08. The adoption of the ASU in the current year does not represent a departure from currently adopted accounting principles and thus the adoption did not have an effect on the
Company’s operating results, financial position, or liquidity.
ASU No. 2012-06
In 2012, the Financial Accounting Standards Board (“FASB”) issued ASU No. 2012-06, Business Combinations (Topic 805): Subsequent
Accounting for an Indemnification Asset Recognized at the Acquisition Date as a Result of a Government-Assisted Acquisition of a Financial Institution, which clarifies the applicable guidance for subsequently measuring an indemnification asset
recognized in a government-assisted acquisition of a financial institution that includes a loss-sharing agreement. The ASU addresses the diversity in practice in the interpretation of the terms “on the same basis” and “contractual
limitations” used in accounting guidance. Accounting principles require that an indemnification asset recognized at the acquisition date as a result of a government-assisted acquisition of a financial institution involving an indemnification
agreement shall be subsequently measured on the same basis as the indemnified item. The provisions of ASU No. 2012-06 clarify that, upon subsequent remeasurement of an indemnification asset, the effect of the change in expected cash flows of
the indemnification agreement shall be amortized. Any amortization of changes in value is limited to the lesser of the contractual term of the indemnification agreement and the remaining life of the indemnified assets. The ASU does not affect the
guidance relating to the recognition or initial measurement of an indemnification asset.
The provisions in this ASU are effective beginning
with the Company’s first quarter of 2013, with early adoption permitted. Because the estimated lives of indemnification assets are an accounting estimate, the impact of the adoption of ASU No. 2012-06 will be prospective, meaning that
changes in the estimated life will impact the future earnings of the Company. The rate of amortization of the indemnification assets by the Company has been estimated over the life of the underlying covered loans using a static spread to the rate
earned on the covered loans. The adoption of ASU No. 2012-06 will change how the Company amortizes its indemnification assets. The Company currently expects to have higher future amortization in the near term and does not expect a material impact on
its financial position and liquidity resulting from the adoption of this ASU.
ASU No. 2013-02
In February 2013, the FASB issued ASU No. 2013-06, Comprehensive Income (Topic 220): Reporting of Amounts Reclassified Out of Accumulated Other
Comprehensive Income, which requires the Company to report the effect of significant reclassifications out of accumulated other comprehensive income on the respective line items in net income on the Company’s consolidated statement of
comprehensive income if the amount being reclassified is required under US GAAP to be reclassified in its entirety to net income. The ASU does not change the current requirements for reporting net income or other comprehensive income in the
consolidated financial statements of the Company, but does require the Company to provide information about the amounts reclassified out of accumulated other comprehensive income by component.
The provisions in the ASU are effective prospectively beginning with the Company’s first quarter of 2013, with early adoption permitted. The
adoption of the ASU affects the format and presentation of its consolidated financial statements and the footnotes to the consolidated financial statements, but does not represent a departure from currently adopted accounting principles and thus the
adoption will not have an effect on the Company’s operating results, financial position, or liquidity.
NOTE 3 – EARNINGS PER SHARE
Share-based payment awards that entitle holders to receive non-forfeitable dividends before vesting are considered participating
securities and thus included in the calculation of basic earnings per share. These awards are included in the calculation of basic earnings per share under the two-class method. The two-class method allocates earnings for the period between common
shareholders and other security holders. The participating awards receiving dividends will be allocated the same amount of income as if they were outstanding shares.
8
The following table presents the calculation of basic and diluted earnings per share for the years ended
December 31, 2012, 2011, and 2010.
|
|
|
|
|
|
|
|
|
|
|
|
|
| |
|
For the Years Ended December 31, |
|
| (Dollars in thousands, except per share data) |
|
2012 |
|
|
2011 |
|
|
2010 |
|
|
|
|
|
| Income available to common shareholders |
|
$ |
76,395 |
|
|
$ |
53,538 |
|
|
$ |
48,826 |
|
| Distributed and undistributed earnings to unvested restricted stock |
|
|
(1,443 |
) |
|
|
(988 |
) |
|
|
(981 |
) |
|
|
|
|
|
|
|
|
|
|
|
|
|
| Distributed and undistributed earnings to common shareholders - Basic |
|
|
74,952 |
|
|
|
52,550 |
|
|
|
47,845 |
|
| Undistributed earnings reallocated to unvested restricted stock |
|
|
6 |
|
|
|
21 |
|
|
|
10 |
|
|
|
|
|
|
|
|
|
|
|
|
|
|
| Distributed and undistributed earnings to common shareholders - Diluted |
|
$ |
74,958 |
|
|
$ |
52,571 |
|
|
$ |
47,855 |
|
|
|
|
|
| Weighted average shares outstanding - Basic (1) |
|
|
29,454,084 |
|
|
|
28,500,420 |
|
|
|
25,681,266 |
|
| Weighted average shares outstanding - Diluted |
|
|
28,957,696 |
|
|
|
28,141,300 |
|
|
|
25,394,120 |
|
|
|
|
|
| Earnings per common share - Basic |
|
$ |
2.59 |
|
|
$ |
1.88 |
|
|
$ |
1.90 |
|
|
|
|
|
| Earnings per common share - Diluted |
|
$ |
2.59 |
|
|
$ |
1.87 |
|
|
$ |
1.88 |
|
| Earnings per unvested restricted stock share - Basic |
|
$ |
2.61 |
|
|
$ |
2.04 |
|
|
$ |
1.97 |
|
| Earnings per unvested restricted stock share - Diluted |
|
$ |
2.60 |
|
|
$ |
2.00 |
|
|
$ |
1.95 |
|
| (1) |
Weighted average basic shares outstanding include 552,609, 484,361, and 498,692 shares of unvested restricted stock for the years ended December 31, 2012, 2011,
and 2010, respectively. |
Additional information on the Company’s basic earnings per common share is shown in the following
table.
|
|
|
|
|
|
|
|
|
|
|
|
|
| |
|
For the Years Ended December 31, |
|
| (Dollars in thousands, except per share data) |
|
2012 |
|
|
2011 |
|
|
2010 |
|
|
|
|
|
| Distributed earnings to common shareholders |
|
$ |
39,349 |
|
|
$ |
38,681 |
|
|
$ |
35,772 |
|
| Undistributed earnings to common shareholders |
|
|
35,603 |
|
|
|
13,869 |
|
|
|
12,073 |
|
|
|
|
|
|
|
|
|
|
|
|
|
|
|
|
|
|
| Total earnings to common shareholders |
|
$ |
74,952 |
|
|
$ |
52,550 |
|
|
$ |
47,845 |
|
|
|
|
|
| Distributed earnings to unvested restricted stock |
|
$ |
758 |
|
|
$ |
727 |
|
|
$ |
733 |
|
| Undistributed earnings to unvested restricted stock |
|
|
685 |
|
|
|
261 |
|
|
|
248 |
|
|
|
|
|
|
|
|
|
|
|
|
|
|
|
|
|
|
| Total earnings allocated to restricted stock |
|
$ |
1,443 |
|
|
$ |
988 |
|
|
$ |
981 |
|
|
|
|
|
| Distributed earnings per common share |
|
$ |
1.36 |
|
|
$ |
1.38 |
|
|
$ |
1.42 |
|
| Undistributed earnings per common share |
|
|
1.23 |
|
|
|
.50 |
|
|
|
.48 |
|
|
|
|
|
|
|
|
|
|
|
|
|
|
| Total earnings per common share - Basic |
|
$ |
2.59 |
|
|
$ |
1.88 |
|
|
$ |
1.90 |
|
|
|
|
|
| Distributed earnings per unvested restricted stock share |
|
$ |
1.37 |
|
|
$ |
1.50 |
|
|
$ |
1.47 |
|
| Undistributed earnings per unvested restricted stock share |
|
|
1.24 |
|
|
|
0.54 |
|
|
|
0.50 |
|
|
|
|
|
|
|
|
|
|
|
|
|
|
| Total earnings per unvested restricted stock share - Basic |
|
$ |
2.61 |
|
|
$ |
2.04 |
|
|
$ |
1.97 |
|
|
|
|
|
|
|
|
|
|
|
|
|
|
For the years ended December 31, 2012, 2011, and 2010, the calculations for basic shares outstanding exclude:
(1) the weighted average shares owned by the Recognition and Retention Plan (“RRP”) of 612,097, 571,262 and 560,767, respectively, and (2) the weighted average shares in treasury stock of 1,964,825, 1,300,222, and 1,256,418,
respectively.
9
The effect from the assumed exercise of 752,188, 542,716, and 477,665 stock options was not included in the
computation of diluted earnings per share for years ended December 31, 2012, 2011, and 2010, respectively, because such amounts would have had an antidilutive effect on earnings per share.
NOTE 4 – ACQUISITION AND DISPOSITION ACTIVITY
Acquisition of Florida Gulf Bancorp, Inc.
On July 31, 2012, the Company acquired Florida Gulf Bancorp, Inc. (“Florida Gulf”), the holding company of Florida Gulf Bank, headquartered in Fort Myers, Florida with 8 branches in the
Fort Myers-Cape Coral, FL market. The Company acquired Florida Gulf in order to further expand its banking operations in the Fort Myers Metropolitan area. Under terms of the agreement, for each share of Florida Gulf stock outstanding, Florida Gulf
shareholders received shares of the Company’s common stock equal to $23.00 and a cash payment for any fractional share. In addition, the agreement provides for potential additional cash consideration based on the resolution of certain
identified loans over a three-year period after the acquisition. The Company acquired all of the outstanding common stock of the former Florida Gulf shareholders for total consideration of $45,339,000, which included the fair value of options
granted and non-equity consideration paid, which resulted in goodwill of $32,420,000, as shown in the following table:
|
|
|
|
|
|
|
|
|
| (Dollars in thousands) |
|
Number of Shares |
|
|
Amount |
|
| Equity Consideration |
|
|
|
|
|
|
|
|
| Common Stock issued |
|
|
754,334 |
|
|
$ |
37,210 |
|
| Options issued |
|
|
32,863 |
|
|
|
651 |
|
|
|
|
|
|
|
|
|
|
| Total Equity Consideration |
|
|
|
|
|
|
37,861 |
|
|
|
|
| Non-Equity Consideration |
|
|
|
|
|
|
|
|
| Change in Control Payments |
|
|
|
|
|
|
1,342 |
|
| Cash |
|
|
|
|
|
|
4,625 |
|
| Contingent Consideration |
|
|
|
|
|
|
1,511 |
|
|
|
|
|
|
|
|
|
|
| Total Non-Equity Consideration |
|
|
|
|
|
|
7,478 |
|
|
|
|
| Total Consideration Paid |
|
|
|
|
|
|
45,339 |
|
| Fair Value of Net Assets Assumed including Identifiable Intangible Assets |
|
|
|
|
|
|
(12,919 |
) |
|
|
|
|
|
|
|
|
|
| Goodwill |
|
|
|
|
|
$ |
32,420 |
|
|
|
|
|
|
|
|
|
|
The acquisition was accounted for under the purchase method of accounting in accordance with ASC Topic 805. Both the
purchased assets and liabilities assumed were recorded at their respective acquisition date fair values. Identifiable intangible assets, including core deposit intangible assets, if any, were recorded at fair value. Because the consideration paid
was greater than the net fair value of the acquired assets and liabilities, the Company recorded goodwill as part of the acquisition. The goodwill recognized was the result of the combined Companies’ expanded presence in the Fort Myers, Florida
Metropolitan Statistical Area (“MSA”) through the addition of eight branches and an experienced in-market team that enhances the Company’s ability to compete in that market. Additionally, goodwill was also created by the expected cost
savings that will be recognized in future periods through the elimination of redundant operations. Goodwill created in the acquisition in not deductible for income tax purposes.
In accordance with ASC Topic 805, estimated fair values are subject to change up to one year after the acquisition date. This allows for adjustments to the initial purchase entries if additional
information relative to closing date fair values becomes available. Material adjustments to acquisition date estimated fair values would be recorded in the period in which the acquisition occurred, and as a result, previously reported results are
subject to change. Information regarding the Company’s loan discount and related deferred tax asset, as well as income taxes payable and the related deferred tax balances, recorded in the acquisition may be adjusted as the Company refines its
estimates of the current and deferred tax balances acquired, as well as the fair values of loans acquired and the deferred tax assets created from the acquisition. Determining the fair value of assets and liabilities, particularly illiquid assets
and liabilities, is a complicated process involving significant judgment regarding estimates and assumptions used to calculate estimated fair value. The Company may incur losses on the acquired loans that are materially different from losses the
Company originally projected. Fair value adjustments based on updated estimates could materially affect the goodwill recorded on the acquisition.
10
The acquired assets and liabilities, as well as the adjustments to record the assets and liabilities at
their estimated fair values, are presented in the following table.
|
|
|
|
|
|
|
|
|
|
|
|
|
| (Dollars in thousands) |
|
As Acquired |
|
|
Preliminary
Fair
Value
Adjustments |
|
|
As recorded
by
IBERIABANK |
|
| Assets |
|
|
|
|
|
|
|
|
|
|
|
|
| Cash and cash equivalents |
|
$ |
37,050 |
|
|
$ |
— |
|
|
$ |
37,050 |
|
| Investment securities |
|
|
57,162 |
|
|
|
(321 |
)(1) |
|
|
56,841 |
|
| Loans |
|
|
244,485 |
|
|
|
(28,734 |
)(2) |
|
|
215,751 |
|
| Other real estate owned |
|
|
770 |
|
|
|
(216 |
)(3) |
|
|
554 |
|
| Deferred tax asset |
|
|
1,446 |
|
|
|
11,454 |
(4) |
|
|
12,900 |
|
| Other assets |
|
|
19,871 |
|
|
|
(3,301 |
)(5) |
|
|
16,570 |
|
|
|
|
|
|
|
|
|
|
|
|
|
|
| Total Assets |
|
$ |
360,784 |
|
|
$ |
(21,118 |
) |
|
$ |
339,666 |
|
|
|
|
|
| Liabilities |
|
|
|
|
|
|
|
|
|
|
|
|
| Interest-bearing deposits |
|
|
228,050 |
|
|
|
405 |
(6) |
|
|
228,455 |
|
| Noninterest-bearing deposits |
|
|
57,578 |
|
|
|
— |
|
|
|
57,578 |
|
| Borrowings |
|
|
39,188 |
|
|
|
1,039 |
(7) |
|
|
40,227 |
|
| Other liabilities |
|
|
487 |
|
|
|
— |
|
|
|
487 |
|
|
|
|
|
|
|
|
|
|
|
|
|
|
| Total Liabilities |
|
$ |
325,303 |
|
|
$ |
1,444 |
|
|
$ |
326,747 |
|
|
|
|
|
|
|
|
|
|
|
|
|
|
Explanation of Certain Fair Value Adjustments
| (1) |
The adjustment represents the write down of the book value of Florida Gulf’s investments to their estimated fair value based on fair values on the date of
acquisition. |
| (2) |
The adjustment represents the write down of the book value of Florida Gulf’s loans to their estimated fair value based on current interest rates and expected cash
flows which includes estimates of expected credit losses inherent in the portfolio. |
| (3) |
The adjustment represents the write down of the book value of Florida Gulf’s OREO properties to their estimated fair value at the acquisition date based on their
appraised value, as adjusted for costs to sell. |
| (4) |
The adjustment represents the deferred tax asset recognized on the fair value adjustments of Florida Gulf’s acquired assets and assumed liabilities.
|
| (5) |
The adjustment represents the write down of the book value of Florida Gulf’s property, equipment, and other assets to their estimated fair value at the acquisition
date based on their appraised value. |
| (6) |
The adjustment is necessary because the weighted average interest rate of Florida Gulf’s CDs exceeded the cost of similar funding at the time of acquisition. The
fair value adjustment will be amortized to reduce interest expense over the life of the portfolio, which is estimated at 60 months. |
| (7) |
The adjustment is necessary because the interest rate of Florida Gulf’s fixed rate borrowings exceeded current interest rates on similar borrowings.
|
The Company’s consolidated financial statements as of and for the year ended December 31, 2012 include the operating
results of the acquired assets and assumed liabilities for the 153 days subsequent to the July 31, 2012 acquisition date. Due to the system conversion of the acquired entity in August 2012 and subsequent integration of the operating activities
of the acquired branches into existing Company markets, historical reporting for the former Florida Gulf branches is impracticable and thus disclosure of the revenue from the assets acquired and income before income taxes is impracticable for the
153-day period.
Supplemental pro forma information
The following pro forma information for the years ended December 31, 2012 and 2011 reflects the Company’s estimated consolidated results of operations as if the acquisition of Florida Gulf
occurred at January 1, 2011, unadjusted for potential cost savings.
|
|
|
|
|
|
|
|
|
| (Dollars in thousands, except per share data) |
|
2012 |
|
|
2011 |
|
|
|
|
| Interest and noninterest income |
|
$ |
630,776 |
|
|
$ |
568,689 |
|
| Net income |
|
|
77,372 |
|
|
|
54,800 |
|
| Earnings per share - basic |
|
|
2.59 |
|
|
|
1.87 |
|
| Earnings per share - diluted |
|
|
2.58 |
|
|
|
1.86 |
|
Acquisitions of OMNI BANCSHARES, Inc., Cameron Bancshares, Inc., and certain assets of Florida Trust Company
On May 31, 2011, the Company acquired OMNI BANCSHARES, Inc. (“OMNI”), the holding company of OMNI BANK, headquartered in
Metairie, Louisiana with 14 offices in the New Orleans and Baton Rouge, LA markets. The Company acquired all of the outstanding common stock of the former OMNI shareholders for total consideration of $46,407,000, which resulted in goodwill of
$63,756,000.
Also on May 31, 2011, the Company acquired Cameron Bancshares, Inc. (“Cameron”), the holding company of Cameron
State Bank, headquartered in Lake Charles, Louisiana, with 22 offices and 48 ATMs in the Lake Charles region, in order to expand its banking operations into the Lake Charles, Louisiana area. The Company acquired all of the outstanding common stock
of the former Cameron shareholders for total consideration of $143,241,000, which resulted in goodwill of $71,417,000.
On June 14, 2011,
the Company purchased certain assets of the Florida Trust Company, a wholly-owned subsidiary of the Bank of Florida Corporation. Florida Trust Company operated offices in Naples and Ft. Lauderdale, Florida. Upon acquisition, the Florida Trust
Company became part of the trust and asset management division of IBERIABANK. Under terms of the agreement, IBERIABANK paid the Bank of Florida Corporation $700,000 and a contingent payment of $670,000 for the acquisition of substantially all of the
assets of Florida Trust Company. The acquisition resulted in additional intangible assets of $1,400,000 included in the Company’s consolidated balance sheet as of December 31, 2011, of which $52,000 was goodwill.
The acquisitions were accounted for under the purchase method of accounting in accordance with ASC Topic 805. Both the purchased assets and liabilities
assumed were recorded at their respective acquisition date fair values. Identifiable intangible assets, including core deposit intangible assets, were recorded at fair value. Because the consideration paid was greater than the net fair value of the
acquired assets and liabilities, the Company recorded goodwill as part of the acquisitions.
The acquired assets and liabilities are presented
in the following table at fair value at each entity’s respective acquisition date. The table also includes intangible assets other than goodwill created in the acquisition, namely, core deposit intangible assets and a customer relationship
intangible asset.
|
|
|
|
|
|
|
|
|
|
|
|
|
|
|
|
|
| (Dollars in thousands) |
|
OMNI |
|
|
Cameron |
|
|
Florida
Trust
Company |
|
|
Total |
|
|
|
|
|
|
| Assets |
|
|
|
|
|
|
|
|
|
|
|
|
|
|
|
|
| Cash and cash equivalents |
|
$ |
54,683 |
|
|
$ |
29,191 |
|
|
$ |
— |
|
|
$ |
83,874 |
|
| Investment securities |
|
|
91,019 |
|
|
|
223,685 |
|
|
|
— |
|
|
|
314,704 |
|
| Loans |
|
|
441,447 |
|
|
|
382,074 |
|
|
|
— |
|
|
|
823,521 |
|
| Other real estate owned |
|
|
16,253 |
|
|
|
395 |
|
|
|
— |
|
|
|
16,648 |
|
| Core deposit intangible |
|
|
829 |
|
|
|
5,178 |
|
|
|
— |
|
|
|
6,007 |
|
| Deferred tax asset |
|
|
33,625 |
|
|
|
11,116 |
|
|
|
— |
|
|
|
44,741 |
|
| Other assets |
|
|
43,641 |
|
|
|
38,582 |
|
|
|
1,348 |
|
|
|
83,571 |
|
|
|
|
|
|
|
|
|
|
|
|
|
|
|
|
|
|
| Total Assets |
|
$ |
681,497 |
|
|
$ |
690,221 |
|
|
$ |
1,348 |
|
|
$ |
1,373,066 |
|
|
|
|
|
|
| Liabilities |
|
|
|
|
|
|
|
|
|
|
|
|
|
|
|
|
| Interest-bearing deposits |
|
|
506,427 |
|
|
|
402,908 |
|
|
|
— |
|
|
|
909,335 |
|
| Noninterest-bearing deposits |
|
|
129,181 |
|
|
|
164,363 |
|
|
|
— |
|
|
|
293,544 |
|
| Borrowings |
|
|
58,364 |
|
|
|
49,002 |
|
|
|
— |
|
|
|
107,366 |
|
| Other liabilities |
|
|
4,874 |
|
|
|
2,124 |
|
|
|
— |
|
|
|
6,998 |
|
|
|
|
|
|
|
|
|
|
|
|
|
|
|
|
|
|
| Total Liabilities |
|
$ |
698,846 |
|
|
$ |
618,397 |
|
|
$ |
— |
|
|
$ |
1,317,243 |
|
|
|
|
|
|
|
|
|
|
|
|
|
|
|
|
|
|
Branch Dispositions
During the second quarter of 2012, the Company announced plans to close ten branches during 2012 as part of its ongoing business strategy, which includes a periodic review of its branch network to
maximize shareholder return. The Company closed two branches during the third quarter of 2012, beginning in August 2012, and closed eight branches during the fourth quarter of 2012. In addition, the Company
11
announced during the fourth quarter of 2012 that four additional branches would be closed during the first quarter of 2013. As part of these branch closures, the Company incurred various disposal
costs during the third and fourth quarters of 2012 and expects to incur additional costs in the first quarter of 2013, including personnel termination costs, contract termination costs, and fixed asset disposals. The following table shows the costs
the Company incurred that are included in its statement of comprehensive income for the year ended December 31, 2012.
|
|
|
|
|
| (Dollars in thousands, except per share data) |
|
2012 |
|
|
|
| Employee termination |
|
$ |
477 |
|
| Lease and contract termination |
|
|
20 |
|
| Property and equipment impairment |
|
|
2,743 |
|
| Accelerated depreciation |
|
|
576 |
|
|
|
|
|
|
| Total |
|
$ |
3,816 |
|
|
|
|
|
|
The Company has included former bank properties with a book value of $4,214,000 in OREO as of December 31, 2012. The
Company estimates future exit costs, which would include additional employee termination costs, fixed asset disposals, and lease termination costs, will not be material.
12
NOTE 5 – INVESTMENT SECURITIES
The amortized cost and fair values of investment securities, with gross unrealized gains and losses, consist of the following:
|
|
|
|
|
|
|
|
|
|
|
|
|
|
|
|
|
| (Dollars in thousands) |
|
Amortized
Cost |
|
|
Gross
Unrealized
Gains |
|
|
Gross
Unrealized
Losses |
|
|
Estimated
Fair
Value |
|
| December 31, 2012 |
|
|
|
|
|
|
|
|
|
|
|
|
|
|
|
|
|
|
|
|
|
| Securities available for sale: |
|
|
|
|
|
|
|
|
|
|
|
|
|
|
|
|
| U.S. Government-sponsored enterprise obligations |
|
$ |
281,746 |
|
|
$ |
4,364 |
|
|
$ |
(386 |
) |
|
$ |
285,724 |
|
| Obligations of state and political subdivisions |
|
|
120,680 |
|
|
|
6,573 |
|
|
|
(178 |
) |
|
|
127,075 |
|
| Mortgage backed securities |
|
|
1,303,030 |
|
|
|
29,108 |
|
|
|
(1,482 |
) |
|
|
1,330,656 |
|
| Other securities |
|
|
1,460 |
|
|
|
89 |
|
|
|
— |
|
|
|
1,549 |
|
|
|
|
|
|
|
|
|
|
|
|
|
|
|
|
|
|
| Total securities available for sale |
|
$ |
1,706,916 |
|
|
$ |
40,134 |
|
|
$ |
(2,046 |
) |
|
$ |
1,745,004 |
|
|
|
|
|
|
| Securities held to maturity: |
|
|
|
|
|
|
|
|
|
|
|
|
|
|
|
|
| U.S. Government-sponsored enterprise obligations |
|
$ |
69,949 |
|
|
$ |
1,244 |
|
|
$ |
— |
|
|
$ |
71,193 |
|
| Obligations of state and political subdivisions |
|
|
88,909 |
|
|
|
4,730 |
|
|
|
(113 |
) |
|
|
93,526 |
|
| Mortgage backed securities |
|
|
46,204 |
|
|
|
728 |
|
|
|
(153 |
) |
|
|
46,779 |
|
|
|
|
|
|
|
|
|
|
|
|
|
|
|
|
|
|
| Total securities held to maturity |
|
$ |
205,062 |
|
|
$ |
6,702 |
|
|
$ |
(266 |
) |
|
$ |
211,498 |
|
|
|
|
|
|
| December 31, 2011 |
|
|
|
|
|
|
|
|
|
|
|
|
|
|
|
|
|
|
|
|
|
| Securities available for sale: |
|
|
|
|
|
|
|
|
|
|
|
|
|
|
|
|
| U.S. Government-sponsored enterprise obligations |
|
$ |
336,859 |
|
|
$ |
5,633 |
|
|
$ |
(4 |
) |
|
$ |
342,488 |
|
| Obligations of state and political subdivisions |
|
|
137,503 |
|
|
|
6,500 |
|
|
|
(198 |
) |
|
|
143,805 |
|
| Mortgage backed securities |
|
|
1,289,775 |
|
|
|
28,317 |
|
|
|
(718 |
) |
|
|
1,317,374 |
|
| Other securities |
|
|
1,460 |
|
|
|
78 |
|
|
|
— |
|
|
|
1,538 |
|
|
|
|
|
|
|
|
|
|
|
|
|
|
|
|
|
|
| Total securities available for sale |
|
$ |
1,765,597 |
|
|
$ |
40,528 |
|
|
$ |
(920 |
) |
|
$ |
1,805,205 |
|
|
|
|
|
|
| Securities held to maturity: |
|
|
|
|
|
|
|
|
|
|
|
|
|
|
|
|
| U.S. Government-sponsored enterprise obligations |
|
$ |
85,172 |
|
|
$ |
1,921 |
|
|
$ |
— |
|
|
$ |
87,093 |
|
| Obligations of state and political subdivisions |
|
|
81,053 |
|
|
|
3,682 |
|
|
|
(57 |
) |
|
|
84,678 |
|
| Mortgage backed securities |
|
|
26,539 |
|
|
|
800 |
|
|
|
— |
|
|
|
27,339 |
|
|
|
|
|
|
|
|
|
|
|
|
|
|
|
|
|
|
| Total securities held to maturity |
|
$ |
192,764 |
|
|
$ |
6,403 |
|
|
$ |
(57 |
) |
|
$ |
199,110 |
|
|
|
|
|
|
|
|
|
|
|
|
|
|
|
|
|
|
13
At December 31, 2012, the Company’s exposure to three investment security issuers individually
exceeded 10% of shareholders’ equity:
|
|
|
|
|
|
|
|
|
| (Dollars in thousands) |
|
Amortized Cost |
|
|
Market Value |
|
|
|
|
| Federal National Mortgage Association (Fannie Mae) |
|
$ |
911,752 |
|
|
$ |
930,452 |
|
| Government National Mortgage Association (Ginnie Mae) |
|
|
205,389 |
|
|
|
209,692 |
|
| Federal Home Loan Mortgage Corporation (Freddie Mac) |
|
|
503,417 |
|
|
|
511,348 |
|
|
|
|
|
|
|
|
|
|
|
|
|
| Total |
|
$ |
1,620,558 |
|
|
$ |
1,651,492 |
|
|
|
|
|
|
|
|
|
|
Securities with carrying values of $1,712,860,000 and $1,698,943,000 were pledged to secure public deposits and other
borrowings at December 31, 2012 and December 31, 2011, respectively.
Management evaluates securities for other-than-temporary
impairment at least quarterly, and more frequently when economic or market concerns warrant such evaluation. Consideration is given to 1) the length of time and the extent to which the estimated fair value has been less than amortized cost, 2) the
financial condition and near-term prospects of the issuer, and 3) the intent and ability of the Company to retain its investment in the issuer for a period of time sufficient to allow for any anticipated recovery in estimated fair value above
amortized cost. In analyzing an issuer’s financial condition, management considers whether the securities are issued by the federal government or its agencies and whether downgrades by bond rating agencies have occurred, as well as review of
issuer financial statements and industry analysts’ reports.
Information pertaining to securities with gross unrealized losses at
December 31, 2012 and 2011 aggregated by investment category and length of time that individual securities have been in a continuous loss position, follows:
|
|
|
|
|
|
|
|
|
|
|
|
|
|
|
|
|
|
|
|
|
|
|
|
|
| |
|
Less Than Twelve Months |
|
|
Over Twelve Months |
|
|
Total |
|
| (Dollars in thousands) |
|
Gross
Unrealized
Losses |
|
|
Estimated
Fair
Value |
|
|
Gross
Unrealized
Losses |
|
|
Estimated
Fair
Value |
|
|
Gross
Unrealized
Losses |
|
|
Estimated
Fair
Value |
|
| December 31, 2012 |
|
|
|
|
|
|
|
|
|
|
|
|
|
|
|
|
|
|
|
|
|
|
|
|
| Securities available for sale: |
|
|
|
|
|
|
|
|
|
|
|
|
|
|
|
|
|
|
|
|
|
|
|
|
| U.S. Government-sponsored enterprise obligations |
|
$ |
(386 |
) |
|
$ |
59,741 |
|
|
$ |
— |
|
|
$ |
— |
|
|
$ |
(386 |
) |
|
$ |
59,741 |
|
| Obligations of state and political subdivisions |
|
|
— |
|
|
|
— |
|
|
|
(178 |
) |
|
|
1,094 |
|
|
|
(178 |
) |
|
|
1,094 |
|
| Mortgage backed securities |
|
|
(1,473 |
) |
|
|
180,027 |
|
|
|
(9 |
) |
|
|
3,919 |
|
|
|
(1,482 |
) |
|
|
183,946 |
|
|
|
|
|
|
|
|
|
|
|
|
|
|
|
|
|
|
|
|
|
|
|
|
|
|
| Total securities available for sale |
|
$ |
(1,859 |
) |
|
$ |
239,768 |
|
|
$ |
(187 |
) |
|
$ |
5,013 |
|
|
$ |
(2,046 |
) |
|
$ |
244,781 |
|
|
|
|
|
|
|
|
| Securities held to maturity: |
|
|
|
|
|
|
|
|
|
|
|
|
|
|
|
|
|
|
|
|
|
|
|
|
| U.S. Government-sponsored enterprise obligations |
|
$ |
— |
|
|
$ |
— |
|
|
$ |
— |
|
|
$ |
— |
|
|
$ |
— |
|
|
$ |
— |
|
| Obligations of state and political subdivisions |
|
|
(113 |
) |
|
|
8,242 |
|
|
|
— |
|
|
|
— |
|
|
|
(113 |
) |
|
|
8,242 |
|
| Mortgage backed securities |
|
|
(153 |
) |
|
|
16,262 |
|
|
|
— |
|
|
|
— |
|
|
|
(153 |
) |
|
|
16,262 |
|
|
|
|
|
|
|
|
|
|
|
|
|
|
|
|
|
|
|
|
|
|
|
|
|
|
| Total securities held to maturity |
|
$ |
(266 |
) |
|
$ |
24,504 |
|
|
$ |
— |
|
|
$ |
— |
|
|
$ |
(266 |
) |
|
$ |
24,504 |
|
|
|
|
|
|
|
|
| December 31, 2011 |
|
|
|
|
|
|
|
|
|
|
|
|
|
|
|
|
|
|
|
|
|
|
|
|
| Securities available for sale: |
|
|
|
|
|
|
|
|
|
|
|
|
|
|
|
|
|
|
|
|
|
|
|
|
| U.S. Government-sponsored enterprise obligations |
|
$ |
(4 |
) |
|
$ |
9,996 |
|
|
$ |
— |
|
|
$ |
— |
|
|
$ |
(4 |
) |
|
$ |
9,996 |
|
| Obligations of state and political subdivisions |
|
|
(11 |
) |
|
|
1,104 |
|
|
|
(187 |
) |
|
|
1,085 |
|
|
|
(198 |
) |
|
|
2,189 |
|
| Mortgage backed securities |
|
|
(545 |
) |
|
|
147,803 |
|
|
|
(173 |
) |
|
|
21,679 |
|
|
|
(718 |
) |
|
|
169,482 |
|
|
|
|
|
|
|
|
|
|
|
|
|
|
|
|
|
|
|
|
|
|
|
|
|
|
| Total securities available for sale |
|
$ |
(560 |
) |
|
$ |
158,903 |
|
|
$ |
(360 |
) |
|
$ |
22,764 |
|
|
$ |
(920 |
) |
|
$ |
181,667 |
|
|
|
|
|
|
|
|
| Securities held to maturity: |
|
|
|
|
|
|
|
|
|
|
|
|
|
|
|
|
|
|
|
|
|
|
|
|
| U.S. Government-sponsored enterprise obligations |
|
$ |
— |
|
|
$ |
— |
|
|
$ |
— |
|
|
$ |
— |
|
|
$ |
— |
|
|
$ |
— |
|
| Obligations of state and political subdivisions |
|
|
(26 |
) |
|
|
2,354 |
|
|
|
(31 |
) |
|
|
1,297 |
|
|
|
(57 |
) |
|
|
3,651 |
|
| Mortgage backed securities |
|
|
— |
|
|
|
— |
|
|
|
— |
|
|
|
— |
|
|
|
— |
|
|
|
— |
|
|
|
|
|
|
|
|
|
|
|
|
|
|
|
|
|
|
|
|
|
|
|
|
|
|
| Total securities held to maturity |
|
$ |
(26 |
) |
|
$ |
2,354 |
|
|
$ |
(31 |
) |
|
$ |
1,297 |
|
|
$ |
(57 |
) |
|
$ |
3,651 |
|
|
|
|
|
|
|
|
|
|
|
|
|
|
|
|
|
|
|
|
|
|
|
|
|
|
The Company assessed the nature of the losses in its portfolio as of December 31, 2012 and 2011 to determine if
there are losses that are deemed other-than-temporary. In its analysis of these securities, management considered numerous factors to determine whether there were instances where the amortized cost basis of the debt securities would not be fully
recoverable, including, but not limited to:
| |
• |
|
the length of time and extent to which the estimated fair value of the securities was less than their amortized cost, |
14
| |
• |
|
whether adverse conditions were present in the operations, geographic area, or industry of the issuer, |
| |
• |
|
the payment structure of the security, including scheduled interest and principal payments, including the issuer’s failures to make scheduled
payments, if any, and the likelihood of failure to make scheduled payments in the future, |
| |
• |
|
changes to the rating of the security by a rating agency, and |
| |
• |
|
subsequent recoveries or additional declines in fair value after the balance sheet date. |
Management believes it has considered these factors, as well as all relevant information available, when determining the expected future cash flows of
the securities in question. Except for the bond discussed below, in each instance, management has determined the cost basis of the securities would be fully recoverable. Management also has the intent and ability to hold debt securities until their
maturity or anticipated recovery if the security is classified as available for sale. In addition, management does not believe the Company will be required to sell debt securities before the anticipated recovery of the amortized cost basis of the
security.
At December 31, 2012, 49 debt securities had unrealized losses of 0.85% of the securities’ amortized cost basis and 0.12%
of the Company’s total amortized cost basis. The unrealized losses for each of the 49 securities relate to market interest rate changes. Three of the 49 securities have been in a continuous loss position for over twelve months at
December 31, 2012. These three securities had an aggregate amortized cost basis and unrealized loss of $5,200,000 and $187,000, respectively. Two of the three securities were issued by either the Federal National Mortgage Association (Fannie
Mae), Federal Home Loan Mortgage Corporation (Freddie Mac), or the Government National Mortgage Association (Ginnie Mae). The Fannie Mae, Freddie Mac, and Ginnie Mae securities are rated AA+ by S&P and Aaa by Moodys. One of the securities in a
continuous unrealized loss position for over twelve months was issued by a political subdivision and discussed in further detail below.
At
December 31, 2011, 50 debt securities had unrealized losses of 0.5% of the securities’ amortized cost basis and 0.1% of the Company’s total amortized cost basis. The unrealized losses for each of the 50 securities relate to market
interest rate changes. 12 of the 50 securities had been in a continuous loss position for over twelve months at December 31, 2011. These 12 securities had an aggregate amortized cost basis and unrealized loss of $24,453,000 and $391,000
respectively. The 12 securities were issued by either Federal National Mortgage Association (Fannie Mae), Federal Home Loan Mortgage Corporation (Freddie Mac) or by state and political subdivisions. The Fannie Mae and Freddie Mac securities were
rated AA+ by S&P and Aaa by Moodys.
During 2011, management assessed the operating environment of a bond issuer as adverse and thus
concluded that the Company had one unrated revenue municipal bond that warranted an other-than-temporary impairment charge during the year ended December 31, 2011. The specific impairment was related to the loss of the contracted revenue source
required for bond repayment. The Company determined the impairment charge using observable market data for similar assets, including third party valuation of the security, as well as information from unobservable inputs, including its best estimate
of the recoverability of the amortized cost of the security as outlined above. Changes to the unobservable inputs used by the Company would have resulted in a higher or lower impairment charge, but the unobservable inputs were not highly sensitive
and would not result in a material difference in the impairment charge recorded for the year ended December 31, 2011. The impairment recorded in 2011 brought the total impairment to 50% of the par value of the bond and provided a fair value of
the bonds that was consistent with current market pricing. Because adverse conditions were noted in the operations of the bond issuer, the Company recorded the other-than-temporary impairment. During the year ended December 31, 2012, the
Company continued to analyze the operating environment of the bond as it did in 2011 and noted no further deterioration in the operating environment of the bond issuer.
The following table reflects activity during the years ended December 31, 2012, 2011, and 2010 related to credit losses on the other-than-temporarily impaired investment security where a portion of
the unrealized loss was recognized in other comprehensive income.
|
|
|
|
|
|
|
|
|
|
|
|
|
| (Dollars in thousands) |
|
December 31, |
|
| |
|
2012 |
|
|
2011 |
|
|
2010 |
|
|
|
|
|
| Balance, beginning of period |
|
$ |
(1,273 |
) |
|
$ |
(764 |
) |
|
$ |
(247 |
) |
| Credit losses on securities not previously considered other-than-temporarily impaired |
|
|
— |
|
|
|
— |
|
|
|
(517 |
) |
| Credit losses on securities for which OTTI was previously recognized |
|
|
— |
|
|
|
(509 |
) |
|
|
— |
|
| Reduction for securities sold/settle during the period |
|
|
— |
|
|
|
— |
|
|
|
— |
|
|
|
|
|
|
|
|
|
|
|
|
|
|
|
|
|
|
| Balance, end of period |
|
$ |
(1,273 |
) |
|
$ |
(1,273 |
) |
|
$ |
(764 |
) |
|
|
|
|
|
|
|
|
|
|
|
|
|
As a result of the Company’s analysis, no other declines in the estimated fair value of the Company’s
investment securities were deemed to be other-than-temporary at December 31, 2012 or December 31, 2011 except where noted above.
The amortized cost and estimated fair value by maturity of investment securities at December 31, 2012 are shown in the following table. Securities
are classified according to their contractual maturities without consideration of principal amortization, potential prepayments or call options. Accordingly, actual maturities may differ from contractual maturities.
|
|
|
|
|
|
|
|
|
|
|
|
|
|
|
|
|
|
|
|
|
|
|
|
|
| |
|
Securities |
|
|
Securities |
|
| |
Available for Sale |
|
|
Held to Maturity |
|
| (Dollars in thousands) |
|
Weighted
Average
Yield |
|
|
Amortized
Cost |
|
|
Estimated
Fair
Value |
|
|
Weighted
Average
Yield |
|
|
Amortized
Cost |
|
|
Estimated
Fair
Value |
|
| Within one year or less |
|
|
1.52 |
% |
|
$ |
18,409 |
|
|
$ |
18,541 |
|
|
|
1.61 |
% |
|
$ |
20,797 |
|
|
$ |
20,916 |
|
| One through five years |
|
|
1.85 |
|
|
|
138,725 |
|
|
|
141,448 |
|
|
|
2.04 |
|
|
|
56,358 |
|
|
|
57,708 |
|
| After five through ten years |
|
|
2.14 |
|
|
|
518,218 |
|
|
|
532,684 |
|
|
|
2.50 |
|
|
|
26,215 |
|
|
|
27,500 |
|
| Over ten years |
|
|
1.78 |
|
|
|
1,031,564 |
|
|
|
1,052,331 |
|
|
|
2.98 |
|
|
|
101,692 |
|
|
|
105,374 |
|
|
|
|
|
|
|
|
|
|
|
|
|
|
|
|
|
|
|
|
|
|
|
|
|
|
| Totals |
|
|
1.89 |
% |
|
$ |
1,706,916 |
|
|
$ |
1,745,004 |
|
|
|
2.52 |
% |
|
$ |
205,062 |
|
|
$ |
211,498 |
|
|
|
|
|
|
|
|
|
|
|
|
|
|
|
|
|
|
|
|
|
|
|
|
|
|
15
The following is a summary of realized gains and losses from the sale of securities classified as available
for sale.
|
|
|
|
|
|
|
|
|
|
|
|
|
| |
|
Years Ended December 31, |
|
| (Dollars in thousands) |
|
2012 |
|
|
2011 |
|
|
2010 |
|
|
|
|
|
| Realized gains |
|
$ |
3,754 |
|
|
$ |
3,429 |
|
|
$ |
5,172 |
|
| Realized losses |
|
|
(15 |
) |
|
|
(7 |
) |
|
|
— |
|
|
|
|
|
|
|
|
|
|
|
|
|
|
| Net realized gains |
|
$ |
3,739 |
|
|
$ |
3,422 |
|
|
$ |
5,172 |
|
|
|
|
|
|
|
|
|
|
|
|
|
|
In addition to the gains above, the Company realized certain immaterial gains on the calls of held to maturity
securities.
Other Equity Securities
At December 31, 2012 and 2011, the Company included the following securities in “Other assets” on the Company’s consolidated balance sheets:
|
|
|
|
|
|
|
|
|
| (Dollars in thousands) |
|
2012 |
|
|
2011 |
|
|
|
|
| Federal Home Loan Bank (FHLB) stock |
|
$ |
16,860 |
|
|
$ |
32,145 |
|
| Federal Reserve Bank (FRB) stock |
|
|
28,155 |
|
|
|
26,809 |
|
| First National Bankers Bankshares, Inc. (FNBB) stock |
|
|
899 |
|
|
|
899 |
|
| Other investments |
|
|
302 |
|
|
|
302 |
|
|
|
|
|
|
|
|
|
|
| Total equity securities |
|
$ |
46,216 |
|
|
$ |
60,155 |
|
|
|
|
|
|
|
|
|
|
NOTE 6 – LOANS RECEIVABLE
Loans receivable at December 31, 2012 and December 31, 2011 consist of the following:
|
|
|
|
|
|
|
|
|
| (Dollars in thousands) |
|
2012 |
|
|
2011 |
|
| Residential mortgage loans: |
|
|
|
|
|
|
|
|
| Residential 1-4 family |
|
$ |
471,183 |
|
|
$ |
522,357 |
|
| Construction/ Owner Occupied |
|
|
6,021 |
|
|
|
16,143 |
|
|
|
|
|
|
|
|
|
|
| Total residential mortgage loans |
|
|
477,204 |
|
|
|
538,500 |
|
|
|
|
| Commercial loans: |
|
|
|
|
|
|
|
|
| Real estate |
|
|
3,631,543 |
|
|
|
3,363,891 |
|
| Business |
|
|
2,537,718 |
|
|
|
2,005,234 |
|
|
|
|
|
|
|
|
|
|
| Total commercial loans |
|
|
6,169,261 |
|
|
|
5,369,125 |
|
|
|
|
| Consumer and other loans: |
|
|
|
|
|
|
|
|
| Indirect automobile |
|
|
327,985 |
|
|
|
261,896 |
|
| Home equity |
|
|
1,251,125 |
|
|
|
1,019,110 |
|
| Other |
|
|
273,005 |
|
|
|
199,406 |
|
|
|
|
|
|
|
|
|
|
| Total consumer and other loans |
|
|
1,852,115 |
|
|
|
1,480,412 |
|
|
|
|
|
|
|
|
|
|
| Total loans receivable |
|
$ |
8,498,580 |
|
|
$ |
7,388,037 |
|
|
|
|
|
|
|
|
|
|
In 2009, the Company acquired substantially all of the assets and liabilities of CapitalSouth Bank (“CSB”), and
certain assets and assumed certain deposit and other liabilities of Orion Bank (“Orion”) and Century Bank (“Century”). In 2010, the Company acquired certain assets and assumed certain deposit and other liabilities of Sterling
Bank. The loans and foreclosed real estate that were acquired in these transactions are covered by loss share agreements between the FDIC and IBERIABANK, which afford IBERIABANK significant loss protection. Under the loss share agreements, the FDIC
will cover 80% of covered loan and foreclosed real estate losses up to certain thresholds for all four acquisitions, 80% of losses that exceed the thresholds for Sterling Bank, and 95% of losses that exceed those thresholds for CSB, Orion, and
Century only.
16
Because of the loss protection provided by the FDIC, the risks of the CSB, Orion, Century, and Sterling
loans and foreclosed real estate are significantly different from those assets not covered under the loss share agreement. Accordingly, the Company presents loans subject to the loss share agreements as “covered loans” in the information
below and loans that are not subject to the loss share agreement as “non-covered loans.”
Deferred loan origination fees were
$14,040,000 and $9,422,000 and deferred loan expenses were $5,270,000 and $4,828,000 at December 31, 2012 and 2011, respectively. In addition to loans issued in the normal course of business, the Company considers overdrafts on customer deposit
accounts to be loans and reclassifies these overdrafts as loans in its consolidated balance sheets. At December 31, 2012 and 2011, overdrafts of $3,231,000 and $1,646,000, respectively, have been reclassified to loans receivable.
Loans with carrying values of $1,504,512,000 and $1,112,214,000 were pledged to secure public deposits and other borrowings at December 31, 2012 and
December 31, 2011, respectively.
Non-covered Loans
The following is a summary of the major categories of non-covered loans outstanding as of December 31, 2012 and 2011:
|
|
|
|
|
|
|
|
|
| (Dollars in thousands) |
|
2012 |
|
|
2011 |
|
| Non-covered Loans: |
|
|
|
|
|
|
|
|
| Residential mortgage loans: |
|
|
|
|
|
|
|
|
| Residential 1-4 family |
|
$ |
284,019 |
|
|
$ |
266,970 |
|
| Construction/ Owner Occupied |
|
|
6,021 |
|
|
|
16,143 |
|
|
|
|
|
|
|
|
|
|
| Total residential mortgage loans |
|
|
290,040 |
|
|
|
283,113 |
|
|
|
|
| Commercial loans: |
|
|
|
|
|
|
|
|
| Real estate |
|
|
2,990,700 |
|
|
|
2,591,014 |
|
| Business |
|
|
2,450,667 |
|
|
|
1,896,496 |
|
|
|
|
|
|
|
|
|
|
| Total commercial loans |
|
|
5,441,367 |
|
|
|
4,487,510 |
|
|
|
|
| Consumer and other loans: |
|
|
|
|
|
|
|
|
| Indirect automobile |
|
|
327,985 |
|
|
|
261,896 |
|
| Home equity |
|
|
1,076,913 |
|
|
|
826,463 |
|
| Other |
|
|
269,519 |
|
|
|
194,606 |
|
|
|
|
|
|
|
|
|
|
| Total consumer and other loans |
|
|
1,674,417 |
|
|
|
1,282,965 |
|
|
|
|
|
|
|
|
|
|
| Total non-covered loans receivable |
|
$ |
7,405,824 |
|
|
$ |
6,053,588 |
|
|
|
|
|
|
|
|
|
|
The following tables provide an analysis of the aging of non-covered loans as of December 31, 2012 and 2011. Because
of the difference in the accounting for acquired loans, the tables below further segregate the Company’s non-covered loans receivable between loans acquired from Florida Gulf in 2012, as well as those acquired in 2011, and loans originated by
the Company. For purposes of the following tables, subprime mortgage loans are defined as the Company’s loans that have FICO scores that are less than 620 at the time of origination or were purchased outside of a business combination.
17
|
|
|
|
|
|
|
|
|
|
|
|
|
|
|
|
|
|
|
|
|
|
|
|
|
|
|
|
|
| |
|
Non-covered loans excluding acquired loans |
|
| (Dollars in thousands) |
|
|
|
| |
|
Past Due (1) |
|
|
|
|
|
|
|
|
|
|
|
|
|
| December 31, 2012 |
|
30-59
days |
|
|
60-89
days |
|
|
Greater
than 90
days |
|
|
Total
past due |
|
|
Current |
|
|
Total non-
covered
loans,
net of unearned
income |
|
|
Recorded
investment >
90
days and
accruing |
|
|
|
|
|
|
|
|
|
| Residential |
|
|
|
|
|
|
|
|
|
|
|
|
|
|
|
|
|
|
|
|
|
|
|
|
|
|
|
|
| Prime |
|
$ |
662 |
|
|
$ |
1,156 |
|
|
$ |
9,168 |
|
|
$ |
10,986 |
|
|
$ |
185,843 |
|
|
$ |
196,829 |
|
|
$ |
801 |
|
| Subprime |
|
|
— |
|
|
|
— |
|
|
|
— |
|
|
|
— |
|
|
|
60,454 |
|
|
|
60,454 |
|
|
|
— |
|
| Commercial |
|
|
|
|
|
|
|
|
|
|
|
|
|
|
|
|
|
|
|
|
|
|
|
|
|
|
|
|
| Real Estate - Construction |
|
|
60 |
|
|
|
— |
|
|
|
5,479 |
|
|
|
5,539 |
|
|
|
288,137 |
|
|
|
293,676 |
|
|
|
— |
|
| Real Estate - Other |
|
|
3,590 |
|
|
|
— |
|
|
|
23,559 |
|
|
|
27,149 |
|
|
|
2,224,495 |
|
|
|
2,251,644 |
|
|
|
83 |
|
| Commercial Business |
|
|
1,430 |
|
|
|
13 |
|
|
|
3,687 |
|
|
|
5,130 |
|
|
|
2,362,304 |
|
|
|
2,367,434 |
|
|
|
329 |
|
| Consumer and Other |
|
|
|
|
|
|
|
|
|
|
|
|
|
|
|
|
|
|
|
|
|
|
|
|
|
|
|
|
| Indirect Automobile |
|
|
1,624 |
|
|
|
326 |
|
|
|
868 |
|
|
|
2,818 |
|
|
|
320,148 |
|
|
|
322,966 |
|
|
|
— |
|
| Home Equity |
|
|
2,283 |
|
|
|
796 |
|
|
|
5,793 |
|
|
|
8,872 |
|
|
|
991,766 |
|
|
|
1,000,638 |
|
|
|
158 |
|
| Credit Card |
|
|
130 |
|
|
|
51 |
|
|
|
424 |
|
|
|
605 |
|
|
|
51,117 |
|
|
|
51,722 |
|
|
|
— |
|
| Other |
|
|
566 |
|
|
|
105 |
|
|
|
310 |
|
|
|
981 |
|
|
|
201,161 |
|
|
|
202,142 |
|
|
|
— |
|
|
|
|
|
|
|
|
|
|
|
|
|
|
|
|
|
|
|
|
|
|
|
|
|
|
|
|
|
|
| Total |
|
$ |
10,345 |
|
|
$ |
2,447 |
|
|
$ |
49,288 |
|
|
$ |
62,080 |
|
|
$ |
6,685,425 |
|
|
$ |
6,747,505 |
|
|
$ |
1,371 |
|
|
|
|
|
|
|
|
|
|
|
|
|
|
|
|
|
|
|
|
|
|
|
|
|
|
|
|
|
|
18
|
|
|
|
|
|
|
|
|
|
|
|
|
|
|
|
|
|
|
|
|
|
|
|
|
|
|
|
|
| |
|
Non-covered loans excluding acquired loans |
|
| (Dollars in thousands) |
|
|
|
|
|
|
|
|
|
|
|
|
|
|
|
|
|
|
|
|
|
| |
|
Past Due (1) |
|
|
|
|
|
|
|
|
|
|
|
|
|
| December 31, 2011 |
|
30-59
days |
|
|
60-89
days |
|
|
Greater
than 90
days |
|
|
Total past
due |
|
|
Current |
|
|
Total loans, net
of
unearned
income |
|
|
Recorded
investment
>
90 days and
accruing |
|
|
|
|
|
|
|
|
|
| Residential |
|
|
|
|
|
|
|
|
|
|
|
|
|
|
|
|
|
|
|
|
|
|
|
|
|
|
|
|
| Prime |
|
$ |
731 |
|
|
$ |
325 |
|
|
$ |
6,009 |
|
|
$ |
7,065 |
|
|
$ |
271,534 |
|
|
$ |
278,599 |
|
|
$ |
1,099 |
|
| Subprime |
|
|
— |
|
|
|
— |
|
|
|
— |
|
|
|
— |
|
|
|
— |
|
|
|
— |
|
|
|
— |
|
| Commercial |
|
|
|
|
|
|
|
|
|
|
|
|
|
|
|
|
|
|
|
|
|
|
|
|
|
|
|
|
| Real Estate - Construction |
|
|
266 |
|
|
|
— |
|
|
|
2,582 |
|
|
|
2,848 |
|
|
|
273,824 |
|
|
|
276,672 |
|
|
|
— |
|
| Real Estate - Other |
|
|
880 |
|
|
|
54 |
|
|
|
34,087 |
|
|
|
35,021 |
|
|
|
1,778,235 |
|
|
|
1,813,256 |
|
|
|
636 |
|
| Commercial Business |
|
|
302 |
|
|
|
277 |
|
|
|
6,642 |
|
|
|
7,221 |
|
|
|
1,793,959 |
|
|
|
1,801,180 |
|
|
|
20 |
|
| Consumer and Other |
|
|
|
|
|
|
|
|
|
|
|
|
|
|
|
|
|
|
|
|
|
|
|
|
|
|
|
|
| Indirect Automobile |
|
|
1,232 |
|
|
|
159 |
|
|
|
994 |
|
|
|
2,385 |
|
|
|
248,070 |
|
|
|
250,455 |
|
|
|
— |
|
| Home Equity |
|
|
3,102 |
|
|
|
717 |
|
|
|
4,955 |
|
|
|
8,774 |
|
|
|
741,968 |
|
|
|
750,742 |
|
|
|
82 |
|
| Credit Card |
|
|
467 |
|
|
|
107 |
|
|
|
403 |
|
|
|
977 |
|
|
|
46,786 |
|
|
|
47,763 |
|
|
|
— |
|
| Other |
|
|
349 |
|
|
|
147 |
|
|
|
623 |
|
|
|
1,119 |
|
|
|
129,640 |
|
|
|
130,759 |
|
|
|
4 |
|
|
|
|
|
|
|
|
|
|
|
|
|
|
|
|
|
|
|
|
|
|
|
|
|
|
|
|
|
|
| Total |
|
$ |
7,329 |
|
|
$ |
1,786 |
|
|
$ |
56,295 |
|
|
$ |
65,410 |
|
|
$ |
5,284,016 |
|
|
$ |
5,349,426 |
|
|
$ |
1,841 |
|
|
|
|
|
|
|
|
|
|
|
|
|
|
|
|
|
|
|
|
|
|
|
|
|
|
|
|
|
|
| (1) |
Past due loans include loans on nonaccrual status as of the period indicated. Nonaccrual loans are presented separately in the “Nonaccrual
Loans” section below. |
|
|
|
|
|
|
|
|
|
|
|
|
|
|
|
|
|
|
|
|
|
|
|
|
|
|
|
|
|
|
|
|
|
| (Dollars in thousands) |
|
Non-covered acquired loans |
|
| |
|
Past Due (1) |
|
|
|
|
|
|
|
|
|
|
|
|
|
|
|
|
| December 31, 2012 |
|
30-59
days |
|
|
60-89
days |
|
|
Greater
than 90
days |
|
|
Total
past due |
|
|
Current |
|
|
Discount |
|
|
Total non-
covered
loans,
net of unearned
income |
|
|
Recorded
investment
> 90 days
and
accruing (1) |
|
|
|
|
|
|
|
|
|
|
| Residential |
|
|
|
|
|
|
|
|
|
|
|
|
|
|
|
|
|
|
|
|
|
|
|
|
|
|
|
|
|
|
|
|
| Prime |
|
$ |
— |
|
|
$ |
— |
|
|
$ |
779 |
|
|
$ |
779 |
|
|
$ |
30,663 |
|
|
$ |
1,315 |
|
|
$ |
32,757 |
|
|
$ |
779 |
|
| Subprime |
|
|
— |
|
|
|
— |
|
|
|
— |
|
|
|
— |
|
|
|
— |
|
|
|
— |
|
|
|
— |
|
|
|
— |
|
| Commercial |
|
|
|
|
|
|
|
|
|
|
|
|
|
|
|
|
|
|
|
|
|
|
|
|
|
|
|
|
|
|
|
|
| Real Estate - Construction |
|
|
369 |
|
|
|
— |
|
|
|
4,067 |
|
|
|
4,436 |
|
|
|
29,098 |
|
|
|
(3,968 |
) |
|
|
29,566 |
|
|
|
4,067 |
|
| Real Estate - Other |
|
|
5,971 |
|
|
|
1,572 |
|
|
|
38,987 |
|
|
|
46,530 |
|
|
|
426,339 |
|
|
|
(57,055 |
) |
|
|
415,814 |
|
|
|
38,987 |
|
| Commercial Business |
|
|
1,410 |
|
|
|
524 |
|
|
|
3,953 |
|
|
|
5,887 |
|
|
|
89,490 |
|
|
|
(12,144 |
) |
|
|
83,233 |
|
|
|
3,953 |
|
| Consumer and Other |
|
|
|
|
|
|
|
|
|
|
|
|
|
|
|
|
|
|
|
|
|
|
|
|
|
|
|
|
|
|
|
|
| Indirect Automobile |
|
|
171 |
|
|
|
4 |
|
|
|
146 |
|
|
|
321 |
|
|
|
4,698 |
|
|
|
— |
|
|
|
5,019 |
|
|
|
146 |
|
| Home Equity |
|
|
2,379 |
|
|
|
382 |
|
|
|
4,354 |
|
|
|
7,115 |
|
|
|
73,658 |
|
|
|
(4,498 |
) |
|
|
76,275 |
|
|
|
4,354 |
|
| Credit Card |
|
|
— |
|
|
|
— |
|
|
|
— |
|
|
|
— |
|
|
|
— |
|
|
|
— |
|
|
|
— |
|
|
|
— |
|
| Other |
|
|
202 |
|
|
|
17 |
|
|
|
495 |
|
|
|
714 |
|
|
|
21,746 |
|
|
|
(6,805 |
) |
|
|
15,655 |
|
|
|
495 |
|
|
|
|
|
|
|
|
|
|
|
|
|
|
|
|
|
|
|
|
|
|
|
|
|
|
|
|
|
|
|
|
|
|
| Total |
|
$ |
10,502 |
|
|
$ |
2,499 |
|
|
$ |
52,781 |
|
|
$ |
65,782 |
|
|
$ |
675,692 |
|
|
$ |
(83,155 |
) |
|
$ |
658,319 |
|
|
$ |
52,781 |
|
|
|
|
|
|
|
|
|
|
|
|
|
|
|
|
|
|
|
|
|
|
|
|
|
|
|
|
|
|
|
|
|
|
19
|
|
|
|
|
|
|
|
|
|
|
|
|
|
|
|
|
|
|
|
|
|
|
|
|
|
|
|
|
|
|
|
|
| (Dollars in thousands) |
|
Non-covered acquired loans |
|
| |
|
Past Due (1) |
|
|
|
|
|
|
|
|
|
|
|
|
|
|
|
|
| December 31, 2011 |
|
30-59
days |
|
|
60-89
days |
|
|
Greater
than 90
days |
|
|
Total
past due |
|
|
Current |
|
|
Discount |
|
|
Total non-
covered
loans,
net of unearned
income |
|
|
Recorded
investment
> 90 days
and
accruing (1) |
|
|
|
|
|
|
|
|
|
|
| Residential |
|
|
|
|
|
|
|
|
|
|
|
|
|
|
|
|
|
|
|
|
|
|
|
|
|
|
|
|
|
|
|
|
| Prime |
|
$ |
124 |
|
|
$ |
60 |
|
|
$ |
185 |
|
|
$ |
369 |
|
|
$ |
4,145 |
|
|
$ |
— |
|
|
$ |
4,514 |
|
|
$ |
185 |
|
| Subprime |
|
|
— |
|
|
|
— |
|
|
|
— |
|
|
|
— |
|
|
|
— |
|
|
|
— |
|
|
|
— |
|
|
|
— |
|
| Commercial |
|
|
|
|
|
|
|
|
|
|
|
|
|
|
|
|
|
|
|
|
|
|
|
|
|
|
|
|
|
|
|
|
| Real Estate - Construction |
|
|
629 |
|
|
|
— |
|
|
|
3,755 |
|
|
|
4,384 |
|
|
|
61,705 |
|
|
|
(6,458 |
) |
|
|
59,631 |
|
|
|
3,755 |
|
| Real Estate - Other |
|
|
7,213 |
|
|
|
4,036 |
|
|
|
29,725 |
|
|
|
40,974 |
|
|
|
448,288 |
|
|
|
(47,808 |
) |
|
|
441,454 |
|
|
|
29,725 |
|
| Commercial Business |
|
|
183 |
|
|
|
69 |
|
|
|
639 |
|
|
|
891 |
|
|
|
105,796 |
|
|
|
(11,371 |
) |
|
|
95,316 |
|
|
|
639 |
|
| Consumer and Other |
|
|
|
|
|
|
|
|
|
|
|
|
|
|
|
|
|
|
|
|
|
|
|
|
|
|
|
|
|
|
|
|
| Indirect Automobile |
|
|
171 |
|
|
|
10 |
|
|
|
258 |
|
|
|
439 |
|
|
|
10,813 |
|
|
|
189 |
|
|
|
11,441 |
|
|
|
258 |
|
| Home Equity |
|
|
2,509 |
|
|
|
125 |
|
|
|
4,104 |
|
|
|
6,738 |
|
|
|
73,822 |
|
|
|
(4,839 |
) |
|
|
75,721 |
|
|
|
4,104 |
|
| Credit Card |
|
|
— |
|
|
|
— |
|
|
|
— |
|
|
|
— |
|
|
|
— |
|
|
|
— |
|
|
|
— |
|
|
|
— |
|
| Other |
|
|
413 |
|
|
|
545 |
|
|
|
571 |
|
|
|
1,529 |
|
|
|
16,067 |
|
|
|
(1,511 |
) |
|
|
16,085 |
|
|
|
571 |
|
|
|
|
|
|
|
|
|
|
|
|
|
|
|
|
|
|
|
|
|
|
|
|
|
|
|
|
|
|
|
|
|
|
| Total |
|
$ |
11,242 |
|
|
$ |
4,845 |
|
|
$ |
39,237 |
|
|
$ |
55,324 |
|
|
$ |
720,636 |
|
|
$ |
(71,798 |
) |
|
$ |
704,162 |
|
|
$ |
39,237 |
|
|
|
|
|
|
|
|
|
|
|
|
|
|
|
|
|
|
|
|
|
|
|
|
|
|
|
|
|
|
|
|
|
|
| (1) |
Past due information includes loans acquired from OMNI, Cameron, and Florida Gulf at the gross loan balance, prior to the application of discounts, at
December 31, 2012 and OMNI and Cameron at December 31, 2011. |
Nonaccrual Loans
The following table provides the recorded investment of non-covered loans on nonaccrual status at December 31, 2012 and 2011. Nonaccrual loans in the
table exclude loans acquired.
|
|
|
|
|
|
|
|
|
| (Dollars in thousands) |
|
2012 |
|
|
2011 |
|
|
|
|
| Residential |
|
|
|
|
|
|
|
|
| Prime |
|
$ |
8,367 |
|
|
$ |
4,910 |
|
| Subprime |
|
|
— |
|
|
|
— |
|
| Commercial |
|
|
|
|
|
|
|
|
| Real Estate - Construction |
|
|
5,479 |
|
|
|
2,582 |
|
| Real Estate - Other |
|
|
23,475 |
|
|
|
33,451 |
|
| Business |
|
|
3,358 |
|
|
|
6,622 |
|
| Consumer and Other |
|
|
|
|
|
|
|
|
| Indirect Automobile |
|
|
868 |
|
|
|
994 |
|
| Home Equity |
|
|
5,635 |
|
|
|
4,873 |
|
| Credit Card |
|
|
424 |
|
|
|
403 |
|
| Other |
|
|
310 |
|
|
|
619 |
|
|
|
|
|
|
|
|
|
|
| Total |
|
$ |
47,916 |
|
|
$ |
54,454 |
|
|
|
|
|
|
|
|
|
|
The amount of interest income that would have been recorded in 2012, 2011, and 2010 if total nonaccrual loans had been
current in accordance with their original terms was approximately $3,193,000, $4,113,000, and $2,198,000, respectively.
20
Covered Loans
The carrying amount of the acquired covered loans at December 31, 2012 and 2011 consisted of loans determined to be impaired at the time of acquisition, which are accounted for in accordance with ASC
Topic 310-30, and loans that were considered to be performing at the acquisition date, accounted for by analogy to ASC Topic 310-30, as detailed in the following tables.
|
|
|
|
|
|
|
|
|
|
|
|
|
| (Dollars in thousands) |
|
December 31, 2012 |
|
| Covered loans |
|
Acquired
Impaired
Loans |
|
|
Acquired
Performing
Loans |
|
|
Total Covered
Loans |
|
|
|
|
|
| Residential mortgage loans: |
|
|
|
|
|
|
|
|
|
|
|
|
|
|
|
|
| Residential 1-4 family |
|
$ |
20,232 |
|
|
$ |
166,932 |
|
|
$ |
187,164 |
|
|
|
|
|
|
|
|
|
|
|
|
|
|
| Total residential mortgage loans |
|
|
20,232 |
|
|
|
166,932 |
|
|
|
187,164 |
|
|
|
|
|
| Commercial loans: |
|
|
|
|
|
|
|
|
|
|
|
|
| Real estate |
|
|
167,742 |
|
|
|
473,101 |
|
|
|
640,843 |
|
| Business |
|
|
2,757 |
|
|
|
84,294 |
|
|
|
87,051 |
|
|
|
|
|
|
|
|
|
|
|
|
|
|
| Total commercial loans |
|
|
170,499 |
|
|
|
557,395 |
|
|
|
727,894 |
|
|
|
|
|
| Consumer and other loans: |
|
|
|
|
|
|
|
|
|
|
|
|
| Home equity |
|
|
22,094 |
|
|
|
152,117 |
|
|
|
174,211 |
|
| Other |
|
|
820 |
|
|
|
2,667 |
|
|
|
3,487 |
|
|
|
|
|
|
|
|
|
|
|
|
|
|
| Total consumer and other loans |
|
|
22,914 |
|
|
|
154,784 |
|
|
|
177,698 |
|
|
|
|
|
|
|
|
|
|
|
|
|
|
| Total covered loans receivable |
|
$ |
213,645 |
|
|
$ |
879,111 |
|
|
$ |
1,092,756 |
|
|
|
|
|
|
|
|
|
|
|
|
|
|
The Company has corrected its disclosure of historical covered loan balances by portfolio type for December 31, 2011
for the impact of an error in the allocation of loan discounts in its covered loan portfolio. The correction had no effect on the balance of total covered loans, total loans, total assets, or net income for the periods presented. The error was
identified in 2012 through the operation of the Company’s internal controls over financial reporting as it related to the Company’s loan accounting. Using accounting guidance provided in ASC Topic 250, the Company assessed these items and
determined the error, although immaterial to the consolidated financial statements for the year ended December 31, 2012, and immaterial to the overall financial statement presentation at December 31, 2011, would affect the comparability of
the disclosures provided in these consolidated financial statements. As a result, the information included in these footnotes includes the effect this correction has on the previously reported disclosures for the December 31, 2011 period.
The following table presents the effect of this correction for the December 31, 2011 period.
|
|
|
|
|
|
|
|
|
|
|
|
|
|
|
|
|
|
|
|
|
|
|
|
|
|
|
|
|
| (Dollars in thousands) |
|
December 31, 2011 |
|
| Covered loans |
|
Acquired Impaired Loans |
|
|
Acquired Performing Loans |
|
|
Total Covered
Loans |
|
| |
|
As
Previously
Reported |
|
|
Adjustment |
|
|
As Adjusted |
|
|
As
Previously
Reported |
|
|
Adjustment |
|
|
As Adjusted |
|
|
|
|
|
|
|
|
|
|
|
|
| Residential mortgage loans: |
|
|
|
|
|
|
|
|
|
|
|
|
|
|
|
|
|
|
|
|
|
|
|
|
|
|
|
|
|
|
|
|
|
|
|
|
| Residential 1-4 family |
|
$ |
31,809 |
|
|
$ |
3,985 |
|
|
$ |
35,794 |
|
|
$ |
184,465 |
|
|
|
35,128 |
|
|
$ |
219,593 |
|
|
$ |
255,387 |
|
|
|
|
|
|
|
|
|
|
|
|
|
|
|
|
|
|
|
|
|
|
|
|
|
|
|
|
|
|
| Total residential mortgage loans |
|
|
31,809 |
|
|
|
3,985 |
|
|
|
35,794 |
|
|
|
184,465 |
|
|
|
35,128 |
|
|
|
219,593 |
|
|
|
255,387 |
|
|
|
|
|
|
|
|
|
| Commercial loans: |
|
|
|
|
|
|
|
|
|
|
|
|
|
|
|
|
|
|
|
|
|
|
|
|
|
|
|
|
| Real estate |
|
|
23,127 |
|
|
|
31,564 |
|
|
|
54,691 |
|
|
|
704,841 |
|
|
|
13,345 |
|
|
|
718,186 |
|
|
|
772,877 |
|
| Business |
|
|
4,053 |
|
|
|
116 |
|
|
|
4,169 |
|
|
|
144,825 |
|
|
|
(40,256 |
) |
|
|
104,569 |
|
|
|
108,738 |
|
|
|
|
|
|
|
|
|
|
|
|
|
|
|
|
|
|
|
|
|
|
|
|
|
|
|
|
|
|
| Total commercial loans |
|
|
27,180 |
|
|
|
31,680 |
|
|
|
58,860 |
|
|
|
849,666 |
|
|
|
(26,911 |
) |
|
|
822,755 |
|
|
|
881,615 |
|
|
|
|
|
|
|
|
|
| Consumer and other loans: |
|
|
|
|
|
|
|
|
|
|
|
|
|
|
|
|
|
|
|
|
|
|
|
|
|
|
|
|
| Home equity |
|
|
30,267 |
|
|
|
(794 |
) |
|
|
29,473 |
|
|
|
204,707 |
|
|
|
(41,533 |
) |
|
|
163,174 |
|
|
|
192,647 |
|
| Other |
|
|
116 |
|
|
|
(116 |
) |
|
|
— |
|
|
|
6,239 |
|
|
|
(1,439 |
) |
|
|
4,800 |
|
|
|
4,800 |
|
|
|
|
|
|
|
|
|
|
|
|
|
|
|
|
|
|
|
|
|
|
|
|
|
|
|
|
|
|
| Total consumer and other loans |
|
|
30,383 |
|
|
|
(910 |
) |
|
|
29,473 |
|
|
|
210,946 |
|
|
|
(42,972 |
) |
|
|
167,974 |
|
|
|
197,447 |
|
|
|
|
|
|
|
|
|
|
|
|
|
|
|
|
|
|
|
|
|
|
|
|
|
|
|
|
|
|
| Total covered loans receivable |
|
$ |
89,372 |
|
|
$ |
34,755 |
|
|
$ |
124,127 |
|
|
$ |
1,245,077 |
|
|
|
(34,755 |
) |
|
$ |
1,210,322 |
|
|
$ |
1,334,449 |
|
|
|
|
|
|
|
|
|
|
|
|
|
|
|
|
|
|
|
|
|
|
|
|
|
|
|
|
|
|
21
FDIC loss share receivable
The following is a summary of the year-to-date activity in the FDIC loss share receivable for the periods indicated.
|
|
|
|
|
|
|
|
|
| (Dollars in thousands) |
|
December 31, |
|
| |
|
2012 |
|
|
2011 |
|
|
|
|
| Balance, beginning of period |
|
$ |
591,844 |
|
|
$ |
726,871 |
|
| Increase due to credit loss provision recorded on FDIC covered loans |
|
|
84,085 |
|
|
|
57,121 |
|
|
|
|
| Amortization |
|
|
(118,100 |
) |
|
|
(72,086 |
) |
| Submission of reimbursable losses to the FDIC |
|
|
(123,986 |
) |
|
|
(117,939 |
) |
| Changes due to a change in cash flow assumptions on OREO |
|
|
(10,774 |
) |
|
|
781 |
|
| Other |
|
|
— |
|
|
|
(2,904 |
) |
|
|
|
|
|
|
|
|
|
| Balance, end of period |
|
$ |
423,069 |
|
|
$ |
591,844 |
|
|
|
|
|
|
|
|
|
|
The Company does not anticipate owing any consideration previously received under indemnification agreements to the FDIC
under the “clawback” provisions of these agreements. Of the three agreements with the FDIC that contain clawback provisions, cumulative losses to date under two of these agreements have exceeded the calculated loss amounts which would
result in clawback if not incurred. The sum of the historical and remaining projected losses under the remaining agreement is in excess of the clawback amount stated in that agreement.
ASC 310-30 loans
The Company acquired loans (both covered and non-covered) through
previous acquisitions which are subject to ASC Topic 310-30.
The carrying amounts of the loans acquired from Florida Gulf in 2012 and OMNI
and Cameron during 2011 are detailed in the following tables as of the purchase date.
|
|
|
|
|
|
|
|
|
|
|
|
|
| (Dollars in thousands) |
|
|
|
|
|
|
|
|
|
| 2012 |
|
Acquired
Impaired
Loans |
|
|
Acquired
Performing
Loans |
|
|
Total Acquired
Loan
Portfolio |
|
| Contractually required principal and interest at acquisition |
|
$ |
10,203 |
|
|
$ |
231,695 |
|
|
$ |
241,898 |
|
| Nonaccretable difference (expected losses and foregone interest) |
|
|
(5,239 |
) |
|
|
(40,431 |
) |
|
|
(45,670 |
) |
|
|
|
|
|
|
|
|
|
|
|
|
|
| Cash flows expected to be collected at acquisition |
|
|
4,964 |
|
|
|
191,264 |
|
|
|
196,228 |
|
| Accretable yield |
|
|
(1,190 |
) |
|
|
(22,899 |
) |
|
|
(24,089 |
) |
|
|
|
|
|
|
|
|
|
|
|
|
|
| Basis in acquired loans at acquisition |
|
$ |
3,774 |
|
|
$ |
168,365 |
|
|
$ |
172,139 |
|
|
|
|
|
|
|
|
|
|
|
|
|
|
|
|
|
|
|
|
|
|
|
|
|
|
|
| (Dollars in thousands) |
|
|
|
|
|
|
|
|
|
| 2011 |
|
Acquired
Impaired
Loans |
|
|
Acquired
Performing
Loans |
|
|
Total Acquired
Loan
Portfolio |
|
| Contractually required principal and interest at acquisition |
|
$ |
88,556 |
|
|
$ |
975,870 |
|
|
$ |
1,064,426 |
|
| Nonaccretable difference (expected losses and foregone interest) |
|
|
(34,824 |
) |
|
|
(72,827 |
) |
|
|
(107,651 |
) |
|
|
|
|
|
|
|
|
|
|
|
|
|
| Cash flows expected to be collected at acquisition |
|
|
53,732 |
|
|
|
903,043 |
|
|
|
956,775 |
|
| Accretable yield |
|
|
(7,346 |
) |
|
|
(139,163 |
) |
|
|
(146,509 |
) |
|
|
|
|
|
|
|
|
|
|
|
|
|
| Basis in acquired loans at acquisition |
|
$ |
46,386 |
|
|
$ |
763,880 |
|
|
$ |
810,226 |
(1) |
|
|
|
|
|
|
|
|
|
|
|
|
|
| (1) |
Excludes overdraft balances, credit card loans, and in-process accounts included in total loans at the acquisition date. |
22
The following is a summary of changes in the accretable yields of acquired loans during the years ended
December 31, 2012 and 2011.
|
|
|
|
|
|
|
|
|
|
|
|
|
| (Dollars in thousands) |
|
|
|
|
|
|
|
|
|
| December 31, 2012 |
|
Acquired
Impaired
Loans |
|
|
Acquired
Performing
Loans |
|
|
Total Acquired
Loan Portfolio |
|
|
|
|
|
| Balance, beginning of period |
|
$ |
83,834 |
|
|
$ |
386,977 |
|
|
$ |
470,811 |
|
|
|
|
|
| Acquisition |
|
|
1,190 |
|
|
|
22,899 |
|
|
|
24,089 |
|
| Net transfers from (to) nonaccretable difference to (from) accretable yield |
|
|
22,016 |
|
|
|
88,786 |
|
|
|
110,802 |
|
| Accretion |
|
|
(30,417 |
) |
|
|
(218,892 |
) |
|
|
(249,309 |
) |
|
|
|
|
|
|
|
|
|
|
|
|
|
| Balance, end of period |
|
$ |
76,623 |
|
|
$ |
279,770 |
|
|
$ |
356,393 |
|
|
|
|
|
|
|
|
|
|
|
|
|
|
|
|
|
|
|
|
|
|
|
|
|
|
|
| (Dollars in thousands) |
|
|
|
|
|
|
|
|
|
| December 31, 2011 |
|
Acquired
Impaired
Loans |
|
|
Acquired
Performing
Loans |
|
|
Total Acquired
Loan
Portfolio |
|
|
|
|
|
| Balance, beginning of period |
|
$ |
82,381 |
|
|
$ |
626,190 |
|
|
$ |
708,571 |
|
|
|
|
|
| Acquisition |
|
|
7,346 |
|
|
|
139,163 |
|
|
|
146,509 |
|
| Net transfers from (to) nonaccretable difference to (from) accretable yield |
|
|
37,687 |
|
|
|
(216,551 |
) |
|
|
(178,864 |
) |
| Accretion |
|
|
(43,580 |
) |
|
|
(161,825 |
) |
|
|
(205,405 |
) |
|
|
|
|
|
|
|
|
|
|
|
|
|
| Balance, end of period |
|
$ |
83,834 |
|
|
$ |
386,977 |
|
|
$ |
470,811 |
|
|
|
|
|
|
|
|
|
|
|
|
|
|
Accretable yield during 2012 decreased primarily as a result of the accretion recognized. Accretable yield during 2011
decreased primarily as a result of a change in expected cash flows on the Company’s covered loans during 2011.
23
Troubled Debt Restructurings
Information about the Company’s TDRs at December 31, 2012 and 2011 is presented in the following tables. The Company excludes as TDRs modifications of loans that are accounted for within a pool
under Subtopic 310-30, which include the covered loans above, as well as the loans acquired in the OMNI and Cameron acquisitions completed during 2011 and those acquired from Florida Gulf in 2012. Accordingly, such modifications do not result in the
removal of those loans from the pool, even if the modification of those loans would otherwise be considered a TDR. As a result, all covered loans and loans acquired from OMNI, Cameron, and Florida Gulf that would otherwise meet the criteria for
classification as a troubled debt restructuring are excluded from the tables below.
|
|
|
|
|
|
|
|
|
|
|
|
|
|
|
|
|
| |
|
Total TDRs |
|
| (Dollars in thousands) |
|
Accruing Loans |
|
|
|
|
|
|
|
| |
|
Current |
|
|
Past Due Greater
than
30 Days |
|
|
Nonaccrual TDRs |
|
|
Total TDRs |
|
| December 31, 2012 |
|
|
|
|
|
|
|
|
|
|
|
|
|
|
|
|
| Residential |
|
|
|
|
|
|
|
|
|
|
|
|
|
|
|
|
| Prime |
|
$ |
— |
|
|
$ |
— |
|
|
$ |
— |
|
|
$ |
— |
|
| Commercial |
|
|
|
|
|
|
|
|
|
|
|
|
|
|
|
|
| Real Estate |
|
|
1,057 |
|
|
|
— |
|
|
|
14,853 |
|
|
|
15,910 |
|
| Business |
|
|
1,204 |
|
|
|
— |
|
|
|
281 |
|
|
|
1,485 |
|
| Consumer and Other |
|
|
|
|
|
|
|
|
|
|
|
|
|
|
|
|
| Indirect Automobile |
|
|
— |
|
|
|
— |
|
|
|
— |
|
|
|
— |
|
| Home Equity |
|
|
93 |
|
|
|
— |
|
|
|
222 |
|
|
|
315 |
|
| Credit Card |
|
|
— |
|
|
|
— |
|
|
|
— |
|
|
|
— |
|
| Other |
|
|
— |
|
|
|
— |
|
|
|
— |
|
|
|
— |
|
|
|
|
|
|
|
|
|
|
|
|
|
|
|
|
|
|
| Total |
|
$ |
2,354 |
|
|
$ |
— |
|
|
$ |
15,356 |
|
|
$ |
17,710 |
|
|
|
|
|
|
| December 31, 2011 |
|
|
|
|
|
|
|
|
|
|
|
|
|
|
|
|
| Residential |
|
|
|
|
|
|
|
|
|
|
|
|
|
|
|
|
| Prime |
|
$ |
— |
|
|
$ |
— |
|
|
$ |
— |
|
|
$ |
— |
|
| Commercial |
|
|
|
|
|
|
|
|
|
|
|
|
|
|
|
|
| Real Estate |
|
|
55 |
|
|
|
— |
|
|
|
21,696 |
|
|
|
21,751 |
|
| Business |
|
|
— |
|
|
|
— |
|
|
|
1,971 |
|
|
|
1,971 |
|
| Consumer and Other |
|
|
|
|
|
|
|
|
|
|
|
|
|
|
|
|
| Indirect Automobile |
|
|
— |
|
|
|
— |
|
|
|
— |
|
|
|
— |
|
| Home Equity |
|
|
— |
|
|
|
— |
|
|
|
231 |
|
|
|
231 |
|
| Credit Card |
|
|
— |
|
|
|
— |
|
|
|
— |
|
|
|
— |
|
| Other |
|
|
— |
|
|
|
— |
|
|
|
— |
|
|
|
— |
|
|
|
|
|
|
|
|
|
|
|
|
|
|
|
|
|
|
| Total |
|
$ |
55 |
|
|
$ |
— |
|
|
$ |
23,898 |
|
|
$ |
23,953 |
|
|
|
|
|
|
|
|
|
|
|
|
|
|
|
|
|
|
24
Of the $17,710,000 in total TDRs, $4,649,000 occurred during the current year through modification of the
original loan terms. Total TDRs of $23,953,000 at December 31, 2011 included $10,567,000 of TDRs that occurred during the year ended December 31, 2011. The following table provides information on how the TDRs were modified during the years
ended December 31, 2012 and 2011.
|
|
|
|
|
|
|
|
|
| (Dollars in thousands) |
|
2012 |
|
|
2011 |
|
|
|
|
| Extended maturities |
|
$ |
412 |
|
|
$ |
— |
|
| Interest rate adjustment |
|
|
277 |
|
|
|
231 |
|
| Maturity and interest rate adjustment |
|
|
1,249 |
|
|
|
— |
|
| Movement to or extension of interest-rate only payments |
|
|
2,543 |
|
|
|
2,955 |
|
| Forbearance |
|
|
168 |
|
|
|
7,381 |
|
| Covenant modifications |
|
|
— |
|
|
|
— |
|
| Other concession(s)(1) |
|
|
— |
|
|
|
— |
|
|
|
|
|
|
|
|
|
|
| Total |
|
$ |
4,649 |
|
|
$ |
10,567 |
|
|
|
|
|
|
|
|
|
|
| (1) |
Other concessions include concessions or a combination of concessions that do not consist of maturity extensions, interest rate adjustments, forbearance, and covenant
modifications. |
25
Information about the Company’s non-covered TDRs occurring in these periods, as well as non-covered
TDRs that subsequently defaulted during the previous twelve months, is presented in the following tables. The Company has defined a default as any loan with a loan payment that is currently past due greater than 30 days, or was past due greater than
30 days at any point during the previous twelve months.
|
|
|
|
|
|
|
|
|
|
|
|
|
|
|
|
|
|
|
|
|
|
|
|
|
| |
|
December 31, 2012 |
|
|
December 31, 2011 |
|
| (In thousands, except number of loans) |
|
Number
of Loans |
|
|
Pre-
modification
Outstanding
Recorded
Investment |
|
|
Post-
modification
Outstanding
Recorded
Investment
(1) |
|
|
Number
of Loans |
|
|
Pre-
modification
Outstanding
Recorded
Investment |
|
|
Post-
modification
Outstanding
Recorded
Investment
(1) |
|
| TDRs occurring during the year |
|
|
|
|
|
|
|
|
|
|
|
|
|
|
|
|
|
|
|
|
|
|
|
|
| Residential |
|
|
|
|
|
|
|
|
|
|
|
|
|
|
|
|
|
|
|
|
|
|
|
|
| Prime |
|
|
— |
|
|
$ |
— |
|
|
$ |
— |
|
|
|
— |
|
|
$ |
— |
|
|
$ |
— |
|
| Commercial |
|
|
|
|
|
|
|
|
|
|
|
|
|
|
|
|
|
|
|
|
|
|
|
|
| Real Estate |
|
|
14 |
|
|
|
3,852 |
|
|
|
3,312 |
|
|
|
7 |
|
|
|
9,265 |
|
|
|
8,365 |
|
| Business |
|
|
4 |
|
|
|
1,215 |
|
|
|
1,188 |
|
|
|
5 |
|
|
|
3,001 |
|
|
|
1,971 |
|
| Consumer and Other |
|
|
|
|
|
|
|
|
|
|
|
|
|
|
|
|
|
|
|
|
|
|
|
|
| Indirect Automobile |
|
|
— |
|
|
|
— |
|
|
|
— |
|
|
|
— |
|
|
|
— |
|
|
|
— |
|
| Home Equity |
|
|
1 |
|
|
|
94 |
|
|
|
51 |
|
|
|
1 |
|
|
|
238 |
|
|
|
231 |
|
| Credit Card |
|
|
— |
|
|
|
— |
|
|
|
— |
|
|
|
— |
|
|
|
— |
|
|
|
— |
|
| Other |
|
|
1 |
|
|
|
— |
|
|
|
— |
|
|
|
— |
|
|
|
— |
|
|
|
— |
|
|
|
|
|
|
|
|
|
|
|
|
|
|
|
|
|
|
|
|
|
|
|
|
|
|
| Total |
|
|
20 |
|
|
$ |
5,161 |
|
|
$ |
4,551 |
|
|
|
13 |
|
|
$ |
12,504 |
|
|
$ |
10,567 |
|
|
|
|
|
|
|
|
|
|
|
|
|
|
|
|
|
|
| |
|
December 31, 2012 |
|
|
December 31, 2011 |
|
| Total TDRs that subsequently defaulted in the past 12 months |
|
Number
of Loans |
|
|
Recorded
Investment |
|
|
Number
of Loans |
|
|
Recorded
Investment |
|
| Residential |
|
|
|
|
|
|
|
|
|
|
|
|
|
|
|
|
| Prime |
|
|
— |
|
|
$ |
— |
|
|
|
— |
|
|
$ |
— |
|
| Commercial |
|
|
|
|
|
|
|
|
|
|
|
|
|
|
|
|
| Real Estate |
|
|
44 |
|
|
|
14,615 |
|
|
|
30 |
|
|
|
21,107 |
|
| Business |
|
|
9 |
|
|
|
1,469 |
|
|
|
6 |
|
|
|
1,877 |
|
| Consumer and Other |
|
|
|
|
|
|
|
|
|
|
|
|
|
|
|
|
| Indirect Automobile |
|
|
— |
|
|
|
— |
|
|
|
— |
|
|
|
— |
|
| Home Equity |
|
|
2 |
|
|
|
273 |
|
|
|
— |
|
|
|
— |
|
| Credit Card |
|
|
— |
|
|
|
— |
|
|
|
— |
|
|
|
— |
|
| Other |
|
|
1 |
|
|
|
— |
|
|
|
— |
|
|
|
— |
|
|
|
|
|
|
|
|
|
|
|
|
|
|
|
|
|
|
| Total |
|
|
56 |
|
|
$ |
16,357 |
|
|
|
36 |
|
|
$ |
22,984 |
|
|
|
|
|
|
|
|
|
|
|
|
|
|
|
|
|
|
| (1) |
Recorded investment includes any allowance for credit losses recorded on the TDRs at the dates indicated. |
26
NOTE 7 – ALLOWANCE FOR CREDIT LOSSES AND CREDIT QUALITY
A summary of changes in the allowance for credit losses for the covered loan and non-covered loan portfolios for the years ended
December 31, 2012, 2011, and 2010 follows.
|
|
|
|
|
|
|
|
|
|
|
|
|
|
|
|
|
| (Dollars in thousands) |
|
December 31, 2012 |
|
| |
|
Non-covered loans |
|
|
|
|
|
|
|
| |
|
Excluding
Acquired
Loans |
|
|
Acquired
Loans |
|
|
Covered
loans |
|
|
Total |
|
|
|
|
|
|
| Balance, beginning of period |
|
$ |
74,861 |
|
|
$ |
— |
|
|
$ |
118,900 |
|
|
$ |
193,761 |
|
|
|
|
|
|
| Provision for credit losses before benefit attributable to FDIC loss share agreements |
|
|
3,804 |
|
|
|
9,799 |
|
|
|
91,153 |
|
|
|
104,756 |
|
|
|
|
|
|
| Benefit attributable to FDIC loss share agreements |
|
|
— |
|
|
|
— |
|
|
|
(84,085 |
) |
|
|
(84,085 |
) |
|
|
|
|
|
|
|
|
|
|
|
|
|
|
|
|
|
| Net provision for credit losses |
|
|
3,804 |
|
|
|
9,799 |
|
|
|
7,068 |
|
|
|
20,671 |
|
|
|
|
|
|
| Increase in FDIC loss share receivable |
|
|
— |
|
|
|
— |
|
|
|
84,085 |
|
|
|
84,085 |
|
|
|
|
|
|
| Transfer of balance to OREO |
|
|
— |
|
|
|
(826 |
) |
|
|
(26,343 |
) |
|
|
(27,169 |
) |
|
|
|
|
|
| Loans charged-off |
|
|
(9,728 |
) |
|
|
(179 |
) |
|
|
(15,153 |
) |
|
|
(25,060 |
) |
|
|
|
|
|
| Recoveries |
|
|
5,274 |
|
|
|
22 |
|
|
|
19 |
|
|
|
5,315 |
|
|
|
|
|
|
|
|
|
|
|
|
|
|
|
|
|
|
|
|
|
|
|
| Balance, end of period |
|
$ |
74,211 |
|
|
$ |
8,816 |
|
|
$ |
168,576 |
|
|
$ |
251,603 |
|
|
|
|
|
|
|
|
|
|
|
|
|
|
|
|
|
|
|
|
|
|
|
|
|
|
|
|
|
|
|
|
|
|
|
| (Dollars in thousands) |
|
December 31, 2011 |
|
| |
|
Non-covered loans |
|
|
|
|
|
|
|
| |
|
Excluding
Acquired
Loans |
|
|
Acquired
Loans |
|
|
Covered
loans |
|
|
Total |
|
|
|
|
|
|
| Balance, beginning of period |
|
$ |
62,460 |
|
|
$ |
— |
|
|
$ |
73,640 |
|
|
$ |
136,100 |
|
|
|
|
|
|
| Provision for credit losses before benefit attributable to FDIC loss share agreements |
|
|
19,974 |
|
|
|
— |
|
|
|
63,014 |
|
|
|
82,988 |
|
|
|
|
|
|
| Benefit attributable to FDIC loss share agreements |
|
|
— |
|
|
|
— |
|
|
|
(57,121 |
) |
|
|
(57,121 |
) |
|
|
|
|
|
|
|
|
|
|
|
|
|
|
|
|
|
| Net provision for credit losses |
|
|
19,974 |
|
|
|
— |
|
|
|
5,893 |
|
|
|
25,867 |
|
|
|
|
|
|
| Increase in FDIC loss share receivable |
|
|
— |
|
|
|
— |
|
|
|
57,121 |
|
|
|
57,121 |
|
| Transfer of balance to OREO |
|
|
— |
|
|
|
— |
|
|
|
(17,143 |
) |
|
|
(17,143 |
) |
|
|
|
|
|
| Loans charged-off |
|
|
(15,022 |
) |
|
|
— |
|
|
|
(1,137 |
) |
|
|
(16,159 |
) |
|
|
|
|
|
| Recoveries |
|
|
7,449 |
|
|
|
— |
|
|
|
526 |
|
|
|
7,975 |
|
|
|
|
|
|
|
|
|
|
|
|
|
|
|
|
|
|
|
|
|
|
|
| Balance, end of period |
|
$ |
74,861 |
|
|
$ |
— |
|
|
$ |
118,900 |
|
|
$ |
193,761 |
|
|
|
|
|
|
|
|
|
|
|
|
|
|
|
|
|
|
27
|
|
|
|
|
|
|
|
|
|
|
|
|
|
|
|
|
| (Dollars in thousands) |
|
December 31, 2010 |
|
| |
|
Non-covered loans |
|
|
|
|
|
|
|
| |
|
Excluding
Acquired
Loans |
|
|
Acquired
Loans |
|
|
Covered
loans |
|
|
Total |
|
|
|
|
|
|
| Balance, beginning of period |
|
$ |
55,623 |
|
|
$ |
— |
|
|
$ |
145 |
|
|
$ |
55,768 |
|
|
|
|
|
|
| Provision for credit losses before benefit attributable to FDIC loss share agreements |
|
|
33,554 |
|
|
|
— |
|
|
|
73,819 |
|
|
|
107,373 |
|
|
|
|
|
|
| Benefit attributable to FDIC loss share agreements |
|
|
— |
|
|
|
— |
|
|
|
(64,922 |
) |
|
|
(64,922 |
) |
|
|
|
|
|
|
|
|
|
|
|
|
|
|
|
|
|
| Net provision for credit losses |
|
|
33,554 |
|
|
|
— |
|
|
|
8,897 |
|
|
|
42,451 |
|
|
|
|
|
|
| Increase in FDIC loss share receivable |
|
|
— |
|
|
|
— |
|
|
|
64,922 |
|
|
|
64,922 |
|
| Transfer of balance to OREO |
|
|
— |
|
|
|
— |
|
|
|
— |
|
|
|
— |
|
|
|
|
|
|
| Loans charged-off |
|
|
(33,533 |
) |
|
|
— |
|
|
|
(325 |
) |
|
|
(33,858 |
) |
|
|
|
|
|
| Recoveries |
|
|
6,816 |
|
|
|
— |
|
|
|
1 |
|
|
|
6,817 |
|
|
|
|
|
|
|
|
|
|
|
|
|
|
|
|
|
|
|
|
|
|
|
| Balance, end of period |
|
$ |
62,460 |
|
|
$ |
— |
|
|
$ |
73,640 |
|
|
$ |
136,100 |
|
|
|
|
|
|
|
|
|
|
|
|
|
|
|
|
|
|
28
A summary of changes in the allowance for credit losses for non-covered loans, by loan portfolio type, for
the years ended December 31, 2012 and 2011 is as follows:
|
|
|
|
|
|
|
|
|
|
|
|
|
|
|
|
|
|
|
|
|
|
|
|
|
| (Dollars in thousands) |
|
Commercial
Real Estate |
|
|
Commercial
Business |
|
|
Consumer |
|
|
Mortgage |
|
|
Unallocated |
|
|
Total |
|
| December 31, 2012 |
|
|
|
|
|
|
|
|
|
|
|
|
|
|
|
|
|
|
|
|
|
|
|
|
| Allowance for credit losses |
|
|
|
|
|
|
|
|
|
|
|
|
|
|
|
|
|
|
|
|
|
|
|
|
| Balance, beginning of period |
|
$ |
35,604 |
|
|
$ |
25,705 |
|
|
$ |
12,655 |
|
|
$ |
897 |
|
|
$ |
— |
|
|
$ |
74,861 |
|
| (Reversal of) Provision for loan losses |
|
|
1,786 |
|
|
|
4,021 |
|
|
|
5,218 |
|
|
|
2,578 |
|
|
|
— |
|
|
|
13,603 |
|
| Transfer of balance to OREO |
|
|
(292 |
) |
|
|
— |
|
|
|
(9 |
) |
|
|
(525 |
) |
|
|
— |
|
|
|
(826 |
) |
| Loans charged off |
|
|
(2,000 |
) |
|
|
(1,116 |
) |
|
|
(5,928 |
) |
|
|
(863 |
) |
|
|
— |
|
|
|
(9,907 |
) |
| Recoveries |
|
|
3,166 |
|
|
|
111 |
|
|
|
1,981 |
|
|
|
38 |
|
|
|
— |
|
|
|
5,296 |
|
|
|
|
|
|
|
|
|
|
|
|
|
|
|
|
|
|
|
|
|
|
|
|
|
|
| Balance, end of period |
|
$ |
38,264 |
|
|
$ |
28,721 |
|
|
$ |
13,917 |
|
|
$ |
2,125 |
|
|
$ |
— |
|
|
$ |
83,027 |
|
|
|
|
|
|
|
|
| Allowance on loans individually evaluated for impairment |
|
$ |
226 |
|
|
$ |
449 |
|
|
$ |
42 |
|
|
$ |
163 |
|
|
$ |
— |
|
|
$ |
880 |
|
| Allowance on loans collectively evaluated for impairment |
|
|
38,038 |
|
|
|
28,272 |
|
|
|
13,875 |
|
|
|
1,962 |
|
|
|
— |
|
|
|
82,147 |
|
|
|
|
|
|
|
|
| Loans, net of unearned income |
|
|
|
|
|
|
|
|
|
|
|
|
|
|
|
|
|
|
|
|
|
|
|
|
| Balance, end of period |
|
$ |
2,990,700 |
|
|
$ |
2,450,667 |
|
|
$ |
1,674,417 |
|
|
$ |
290,040 |
|
|
$ |
— |
|
|
$ |
7,405,824 |
|
| Balance, end of period: Loans individually evaluated for impairment |
|
|
28,052 |
|
|
|
4,401 |
|
|
|
315 |
|
|
|
1,703 |
|
|
|
— |
|
|
|
34,471 |
|
| Balance, end of period: Loans collectively evaluated for impairment |
|
|
2,962,648 |
|
|
|
2,446,266 |
|
|
|
1,674,102 |
|
|
|
288,337 |
|
|
|
— |
|
|
|
7,371,353 |
|
| Balance, end of period: Loans acquired with deteriorated credit quality |
|
|
55,856 |
|
|
|
3,470 |
|
|
|
5,035 |
|
|
|
330 |
|
|
|
— |
|
|
|
64,691 |
|
29
|
|
|
|
|
|
|
|
|
|
|
|
|
|
|
|
|
|
|
|
|
|
|
|
|
| (Dollars in thousands) |
|
Commercial
Real Estate |
|
|
Commercial
Business |
|
|
Consumer |
|
|
Mortgage |
|
|
Unallocated |
|
|
Total |
|
| December 31, 2011 |
|
|
|
|
|
|
|
|
|
|
|
|
|
|
|
|
|
|
|
|
|
|
|
|
| Allowance for credit losses |
|
|
|
|
|
|
|
|
|
|
|
|
|
|
|
|
|
|
|
|
|
|
|
|
| Balance, beginning of period |
|
$ |
31,390 |
|
|
$ |
16,473 |
|
|
$ |
13,332 |
|
|
$ |
1,265 |
|
|
$ |
— |
|
|
$ |
62,460 |
|
| (Reversal of) Provision for credit losses |
|
|
6,809 |
|
|
|
9,533 |
|
|
|
3,847 |
|
|
|
(215 |
) |
|
|
— |
|
|
|
19,974 |
|
| Loans charged off |
|
|
(7,656 |
) |
|
|
(471 |
) |
|
|
(6,673 |
) |
|
|
(222 |
) |
|
|
— |
|
|
|
(15,022 |
) |
| Recoveries |
|
|
5,061 |
|
|
|
170 |
|
|
|
2,149 |
|
|
|
69 |
|
|
|
— |
|
|
|
7,449 |
|
|
|
|
|
|
|
|
|
|
|
|
|
|
|
|
|
|
|
|
|
|
|
|
|
|
| Balance, end of period |
|
$ |
35,604 |
|
|
$ |
25,705 |
|
|
$ |
12,655 |
|
|
$ |
897 |
|
|
$ |
— |
|
|
$ |
74,861 |
|
|
|
|
|
|
|
|
| Allowance on loans individually evaluated for impairment |
|
$ |
1,874 |
|
|
$ |
179 |
|
|
$ |
— |
|
|
$ |
133 |
|
|
$ |
— |
|
|
$ |
2,186 |
|
| Allowance on loans collectively evaluated for impairment |
|
|
33,730 |
|
|
|
25,526 |
|
|
|
12,655 |
|
|
|
764 |
|
|
|
— |
|
|
|
72,675 |
|
|
|
|
|
|
|
|
| Loans, net of unearned income |
|
|
|
|
|
|
|
|
|
|
|
|
|
|
|
|
|
|
|
|
|
|
|
|
| Balance, end of period |
|
$ |
2,591,013 |
|
|
$ |
1,896,496 |
|
|
$ |
1,282,966 |
|
|
$ |
283,113 |
|
|
$ |
— |
|
|
$ |
6,053,588 |
|
| Balance, end of period: Loans individually evaluated for impairment |
|
|
34,541 |
|
|
|
6,530 |
|
|
|
231 |
|
|
|
1,009 |
|
|
|
— |
|
|
|
42,311 |
|
| Balance, end of period: Loans collectively evaluated for impairment |
|
|
2,556,472 |
|
|
|
1,889,966 |
|
|
|
1,282,735 |
|
|
|
282,104 |
|
|
|
— |
|
|
|
6,011,277 |
|
| Balance, end of period: Loans acquired with deteriorated credit quality |
|
|
4,835 |
|
|
|
26,531 |
|
|
|
4,129 |
|
|
|
— |
|
|
|
— |
|
|
|
35,495 |
|
30
A summary of changes in the allowance for credit losses for covered loans, by loan portfolio type, for the
years ended December 31, 2012 and 2011 is as follows:
|
|
|
|
|
|
|
|
|
|
|
|
|
|
|
|
|
|
|
|
|
|
|
|
|
| (Dollars in thousands) |
|
Commercial
Real Estate |
|
|
Commercial
Business |
|
|
Consumer |
|
|
Mortgage |
|
|
Unallocated |
|
|
Total |
|
| December 31, 2012 |
|
|
|
|
|
|
|
|
|
|
|
|
|
|
|
|
|
|
|
|
|
|
|
|
| Allowance for credit losses |
|
|
|
|
|
|
|
|
|
|
|
|
|
|
|
|
|
|
|
|
|
|
|
|
| Balance, beginning of period |
|
$ |
69,175 |
|
|
$ |
9,788 |
|
|
$ |
18,753 |
|
|
$ |
21,184 |
|
|
$ |
— |
|
|
$ |
118,900 |
|
| (Reversal of) Provision for credit losses |
|
|
4,970 |
|
|
|
964 |
|
|
|
811 |
|
|
|
323 |
|
|
|
— |
|
|
|
7,068 |
|
| Increase in FDIC loss share receivable |
|
|
51,543 |
|
|
|
3,616 |
|
|
|
15,031 |
|
|
|
13,895 |
|
|
|
— |
|
|
|
84,085 |
|
| Transfer of balance to OREO |
|
|
(11,202 |
) |
|
|
(2,993 |
) |
|
|
(825 |
) |
|
|
(11,323 |
) |
|
|
— |
|
|
|
(26,343 |
) |
| loans charged off |
|
|
(13,631 |
) |
|
|
— |
|
|
|
(9 |
) |
|
|
(1,513 |
) |
|
|
— |
|
|
|
(15,153 |
) |
| Recoveries |
|
|
16 |
|
|
|
— |
|
|
|
3 |
|
|
|
— |
|
|
|
— |
|
|
|
19 |
|
|
|
|
|
|
|
|
|
|
|
|
|
|
|
|
|
|
|
|
|
|
|
|
|
|
| Balance, end of period |
|
$ |
100,871 |
|
|
$ |
11,375 |
|
|
$ |
33,764 |
|
|
$ |
22,566 |
|
|
$ |
— |
|
|
$ |
168,576 |
|
|
|
|
|
|
|
|
| Allowance on loans individually evaluated for impairment |
|
$ |
— |
|
|
$ |
— |
|
|
$ |
— |
|
|
$ |
— |
|
|
$ |
— |
|
|
$ |
— |
|
| Allowance on loans collectively evaluated for impairment |
|
|
100,871 |
|
|
|
11,375 |
|
|
|
33,764 |
|
|
|
22,566 |
|
|
|
— |
|
|
|
168,576 |
|
|
|
|
|
|
|
|
| Loans, net of unearned income |
|
|
|
|
|
|
|
|
|
|
|
|
|
|
|
|
|
|
|
|
|
|
|
|
| Balance, end of period |
|
$ |
640,843 |
|
|
$ |
87,051 |
|
|
$ |
177,698 |
|
|
$ |
187,164 |
|
|
$ |
— |
|
|
$ |
1,092,756 |
|
| Balance, end of period: Loans individually evaluated for impairment |
|
|
— |
|
|
|
— |
|
|
|
— |
|
|
|
— |
|
|
|
— |
|
|
|
— |
|
| Balance, end of period: Loans collectively evaluated for impairment |
|
|
640,843 |
|
|
|
87,051 |
|
|
|
177,698 |
|
|
|
187,164 |
|
|
|
— |
|
|
|
1,092,756 |
|
| Balance, end of period: Loans acquired with deteriorated credit quality |
|
|
167,742 |
|
|
|
2,757 |
|
|
|
22,914 |
|
|
|
20,232 |
|
|
|
— |
|
|
|
213,645 |
|
31
|
|
|
|
|
|
|
|
|
|
|
|
|
|
|
|
|
|
|
|
|
|
|
|
|
| (Dollars in thousands) |
|
Commercial
Real Estate |
|
|
Commercial
Business |
|
|
Consumer |
|
|
Mortgage |
|
|
Unallocated |
|
|
Total |
|
| December 31, 2011 |
|
|
|
|
|
|
|
|
|
|
|
|
|
|
|
|
|
|
|
|
|
|
|
|
| Allowance for credit losses |
|
|
|
|
|
|
|
|
|
|
|
|
|
|
|
|
|
|
|
|
|
|
|
|
| Balance, beginning of period |
|
$ |
26,439 |
|
|
$ |
6,657 |
|
|
$ |
12,201 |
|
|
$ |
28,343 |
|
|
$ |
— |
|
|
$ |
73,640 |
|
| (Reversal of) Provision for credit losses |
|
|
6,762 |
|
|
|
392 |
|
|
|
971 |
|
|
|
(2,232 |
) |
|
|
— |
|
|
|
5,893 |
|
| Increase (decrease) in FDIC loss share receivable |
|
|
50,079 |
|
|
|
2,899 |
|
|
|
7,188 |
|
|
|
(3,045 |
) |
|
|
— |
|
|
|
57,121 |
|
| Transfer of balance to OREO |
|
|
(13,316 |
) |
|
|
(160 |
) |
|
|
(1,705 |
) |
|
|
(1,962 |
) |
|
|
— |
|
|
|
(17,143 |
) |
| Loans charged off |
|
|
(1,073 |
) |
|
|
— |
|
|
|
(42 |
) |
|
|
(22 |
) |
|
|
— |
|
|
|
(1,137 |
) |
| Recoveries |
|
|
284 |
|
|
|
— |
|
|
|
140 |
|
|
|
102 |
|
|
|
— |
|
|
|
526 |
|
|
|
|
|
|
|
|
|
|
|
|
|
|
|
|
|
|
|
|
|
|
|
|
|
|
| Balance, end of period |
|
$ |
69,175 |
|
|
$ |
9,788 |
|
|
$ |
18,753 |
|
|
$ |
21,184 |
|
|
$ |
— |
|
|
$ |
118,900 |
|
|
|
|
|
|
|
|
| Allowance on loans individually evaluated for impairment |
|
$ |
— |
|
|
$ |
— |
|
|
$ |
— |
|
|
$ |
— |
|
|
$ |
— |
|
|
$ |
— |
|
| Allowance on loans collectively evaluated for impairment |
|
|
69,175 |
|
|
|
9,788 |
|
|
|
18,753 |
|
|
|
21,184 |
|
|
|
— |
|
|
|
118,900 |
|
|
|
|
|
|
|
|
| Loans, net of unearned income |
|
|
|
|
|
|
|
|
|
|
|
|
|
|
|
|
|
|
|
|
|
|
|
|
| Balance, end of period |
|
$ |
772,877 |
|
|
$ |
108,738 |
|
|
$ |
197,447 |
|
|
$ |
255,387 |
|
|
$ |
— |
|
|
$ |
1,334,449 |
|
| Balance, end of period: Loans individually evaluated for impairment |
|
|
— |
|
|
|
— |
|
|
|
— |
|
|
|
— |
|
|
|
— |
|
|
|
— |
|
| Balance, end of period: Loans collectively evaluated for impairment |
|
|
772,877 |
|
|
|
108,738 |
|
|
|
197,447 |
|
|
|
255,387 |
|
|
|
— |
|
|
|
1,334,449 |
|
| Balance, end of period: Loans acquired with deteriorated credit quality |
|
|
54,691 |
|
|
|
4,169 |
|
|
|
29,473 |
|
|
|
35,794 |
|
|
|
— |
|
|
|
124,127 |
|
32
Credit Quality
The Company’s investment in non-covered loans by credit quality indicator as of December 31, 2012 and 2011 is presented in the following tables. Because of the difference in the accounting for
acquired loans, the tables below further segregate the Company’s non-covered loans receivable between loans acquired and loans that were not acquired. Loan discounts in the table below represent the adjustment of non-covered acquired loans to
fair value at the time of acquisition, as adjusted for income accretion and changes in cash flow estimates in subsequent periods. Asset risk classifications for commercial loans reflect the classification as of December 31, 2012 and 2011.
|
|
|
|
|
|
|
|
|
|
|
|
|
|
|
|
|
|
|
|
|
|
|
|
|
| (Dollars in thousands) |
|
Non-covered loans excluding acquired loans |
|
| |
|
Commercial Real Estate Construction |
|
|
Commercial Real Estate- Other |
|
|
Commercial Business |
|
| Credit quality indicator by asset risk classification |
|
2012 |
|
|
2011 |
|
|
2012 |
|
|
2011 |
|
|
2012 |
|
|
2011 |
|
| Pass |
|
$ |
269,842 |
|
|
$ |
249,669 |
|
|
$ |
2,162,989 |
|
|
$ |
1,689,455 |
|
|
$ |
2,295,788 |
|
|
$ |
1,729,279 |
|
| Special Mention |
|
|
16,767 |
|
|
|
18,274 |
|
|
|
40,547 |
|
|
|
62,868 |
|
|
|
21,640 |
|
|
|
46,225 |
|
| Substandard |
|
|
7,067 |
|
|
|
8,559 |
|
|
|
47,710 |
|
|
|
55,236 |
|
|
|
49,958 |
|
|
|
25,477 |
|
| Doubtful |
|
|
— |
|
|
|
170 |
|
|
|
398 |
|
|
|
5,697 |
|
|
|
48 |
|
|
|
199 |
|
|
|
|
|
|
|
|
|
|
|
|
|
|
|
|
|
|
|
|
|
|
|
|
|
|
| Total |
|
|
293,676 |
|
|
|
276,672 |
|
|
|
2,251,644 |
|
|
|
1,813,256 |
|
|
|
2,367,434 |
|
|
|
1,801,180 |
|
| Discount |
|
|
— |
|
|
|
— |
|
|
|
— |
|
|
|
— |
|
|
|
— |
|
|
|
— |
|
|
|
|
|
|
|
|
|
|
|
|
|
|
|
|
|
|
|
|
|
|
|
|
|
|
| Non-covered commercial loans, net |
|
$ |
293,676 |
|
|
$ |
276,672 |
|
|
$ |
2,251,644 |
|
|
$ |
1,813,256 |
|
|
$ |
2,367,434 |
|
|
$ |
1,801,180 |
|
|
|
|
|
|
|
|
|
|
|
|
|
|
|
|
|
|
| |
|
Mortgage – Prime |
|
|
Mortgage- Subprime |
|
| Credit risk by payment status |
|
2012 |
|
|
2011 |
|
|
2012 |
|
|
2011 |
|
| Current |
|
$ |
185,843 |
|
|
$ |
271,534 |
|
|
$ |
60,454 |
|
|
$ |
— |
|
| Past due greater than 30 days |
|
|
10,986 |
|
|
|
7,065 |
|
|
|
— |
|
|
|
— |
|
|
|
|
|
|
|
|
|
|
|
|
|
|
|
|
|
|
| Total |
|
|
196,829 |
|
|
|
278,599 |
|
|
|
60,454 |
|
|
|
— |
|
| Discount |
|
|
— |
|
|
|
— |
|
|
|
— |
|
|
|
— |
|
|
|
|
|
|
|
|
|
|
|
|
|
|
|
|
|
|
| Non-covered mortgage loans, net |
|
$ |
196,829 |
|
|
$ |
278,599 |
|
|
$ |
60,454 |
|
|
$ |
— |
|
|
|
|
|
|
|
|
|
|
|
|
|
|
|
|
|
|
| |
|
Indirect Automobile |
|
|
Credit Card |
|
| Credit risk by payment status |
|
2012 |
|
|
2011 |
|
|
2012 |
|
|
2011 |
|
| Current |
|
$ |
320,148 |
|
|
$ |
248,070 |
|
|
$ |
51,117 |
|
|
$ |
46,786 |
|
| Past due greater than 30 days |
|
|
2,818 |
|
|
|
2,385 |
|
|
|
605 |
|
|
|
977 |
|
|
|
|
|
|
|
|
|
|
|
|
|
|
|
|
|
|
| Total |
|
$ |
322,966 |
|
|
$ |
250,455 |
|
|
$ |
51,722 |
|
|
$ |
47,763 |
|
|
|
|
|
|
|
|
|
|
|
|
|
|
|
|
|
|
| |
|
Home Equity |
|
|
Consumer - Other |
|
| Credit risk by payment status |
|
2012 |
|
|
2011 |
|
|
2012 |
|
|
2011 |
|
| Current |
|
$ |
991,766 |
|
|
$ |
741,968 |
|
|
$ |
201,161 |
|
|
$ |
129,640 |
|
| Past due greater than 30 days |
|
|
8,872 |
|
|
|
8,774 |
|
|
|
981 |
|
|
|
1,119 |
|
|
|
|
|
|
|
|
|
|
|
|
|
|
|
|
|
|
| Total |
|
|
1,000,638 |
|
|
|
750,742 |
|
|
|
202,142 |
|
|
|
130,759 |
|
| Discount |
|
|
— |
|
|
|
— |
|
|
|
— |
|
|
|
— |
|
|
|
|
|
|
|
|
|
|
|
|
|
|
|
|
|
|
| Non-covered consumer loans, net |
|
$ |
1,000,638 |
|
|
$ |
750,742 |
|
|
$ |
202,142 |
|
|
$ |
130,759 |
|
|
|
|
|
|
|
|
|
|
|
|
|
|
|
|
|
|
33
|
|
|
|
|
|
|
|
|
|
|
|
|
|
|
|
|
|
|
|
|
|
|
|
|
| (Dollars in thousands) |
|
Non-covered acquired loans |
|
| |
|
Commercial Real Estate Construction |
|
|
Commercial Real Estate- Other |
|
|
Commercial Business |
|
| Credit quality indicator by asset risk classification |
|
2012 |
|
|
2011 |
|
|
2012 |
|
|
2011 |
|
|
2012 |
|
|
2011 |
|
| Pass |
|
$ |
25,896 |
|
|
$ |
51,510 |
|
|
$ |
359,046 |
|
|
$ |
360,598 |
|
|
$ |
86,201 |
|
|
$ |
94,760 |
|
| Special Mention |
|
|
2,410 |
|
|
|
9,138 |
|
|
|
28,185 |
|
|
|
53,503 |
|
|
|
2,159 |
|
|
|
7,870 |
|
| Substandard |
|
|
5,228 |
|
|
|
5,441 |
|
|
|
85,420 |
|
|
|
75,161 |
|
|
|
4,808 |
|
|
|
4,057 |
|
| Doubtful |
|
|
— |
|
|
|
— |
|
|
|
218 |
|
|
|
— |
|
|
|
2,209 |
|
|
|
— |
|
|
|
|
|
|
|
|
|
|
|
|
|
|
|
|
|
|
|
|
|
|
|
|
|
|
| Total |
|
|
33,534 |
|
|
|
66,089 |
|
|
|
472,869 |
|
|
|
489,262 |
|
|
|
95,377 |
|
|
|
106,687 |
|
| Discount |
|
|
(3,968 |
) |
|
|
(6,458 |
) |
|
|
(57,055 |
) |
|
|
(47,808 |
) |
|
|
(12,144 |
) |
|
|
(11,371 |
) |
|
|
|
|
|
|
|
|
|
|
|
|
|
|
|
|
|
|
|
|
|
|
|
|
|
| Non-covered commercial loans, net |
|
$ |
29,566 |
|
|
$ |
59,631 |
|
|
$ |
415,814 |
|
|
$ |
441,454 |
|
|
$ |
83,233 |
|
|
$ |
95,316 |
|
|
|
|
|
|
|
|
|
|
|
|
|
|
|
|
|
|
| |
|
Mortgage – Prime |
|
|
Mortgage- Subprime |
|
| Credit risk by payment status |
|
2012 |
|
|
2011 |
|
|
2012 |
|
|
2011 |
|
| Current |
|
$ |
30,663 |
|
|
$ |
4,145 |
|
|
$ |
— |
|
|
$ |
— |
|
| Past due greater than 30 days |
|
|
779 |
|
|
|
369 |
|
|
|
— |
|
|
|
— |
|
|
|
|
|
|
|
|
|
|
|
|
|
|
|
|
|
|
| Total |
|
|
31,442 |
|
|
|
4,514 |
|
|
|
— |
|
|
|
— |
|
| Premium (discount) |
|
|
1,315 |
|
|
|
— |
|
|
|
— |
|
|
|
— |
|
|
|
|
|
|
|
|
|
|
|
|
|
|
|
|
|
|
| Non-covered mortgage loans, net |
|
$ |
32,757 |
|
|
$ |
4,514 |
|
|
$ |
— |
|
|
$ |
— |
|
|
|
|
|
|
|
|
|
|
|
|
|
|
|
|
|
|
| |
|
Indirect Automobile |
|
|
Credit Card |
|
| Credit risk by payment status |
|
2012 |
|
|
2011 |
|
|
2012 |
|
|
2011 |
|
| Current |
|
$ |
4,698 |
|
|
$ |
10,813 |
|
|
$ |
— |
|
|
$ |
— |
|
| Past due greater than 30 days |
|
|
321 |
|
|
|
439 |
|
|
|
— |
|
|
|
— |
|
|
|
|
|
|
|
|
|
|
|
|
|
|
|
|
|
|
| Total |
|
|
5,019 |
|
|
|
11,252 |
|
|
|
|
|
|
|
|
|
| Premium (discount) |
|
|
— |
|
|
|
189 |
|
|
|
— |
|
|
|
— |
|
|
|
|
|
|
|
|
|
|
|
|
|
|
|
|
|
|
| Non-covered consumer loans, net |
|
$ |
5,019 |
|
|
$ |
11,441 |
|
|
$ |
— |
|
|
$ |
— |
|
|
|
|
|
|
|
|
|
|
|
|
|
|
|
|
|
|
| |
|
Home Equity |
|
|
Consumer - Other |
|
| Credit risk by payment status |
|
2012 |
|
|
2011 |
|
|
2012 |
|
|
2011 |
|
| Current |
|
$ |
73,658 |
|
|
$ |
73,822 |
|
|
$ |
21,746 |
|
|
$ |
16,067 |
|
| Past due greater than 30 days |
|
|
7,115 |
|
|
|
6,738 |
|
|
|
714 |
|
|
|
1,529 |
|
|
|
|
|
|
|
|
|
|
|
|
|
|
|
|
|
|
| Total |
|
|
80,773 |
|
|
|
80,560 |
|
|
|
22,460 |
|
|
|
17,596 |
|
| Discount |
|
|
(4,498 |
) |
|
|
(4,839 |
) |
|
|
(6,805 |
) |
|
|
(1,511 |
) |
|
|
|
|
|
|
|
|
|
|
|
|
|
|
|
|
|
| Non-covered consumer loans, net |
|
$ |
76,275 |
|
|
$ |
75,721 |
|
|
$ |
15,655 |
|
|
$ |
16,085 |
|
|
|
|
|
|
|
|
|
|
|
|
|
|
|
|
|
|
Credit quality information in the table above includes loans acquired at the gross loan balance, prior to the application
of discounts, at December 31, 2012 and 2011.
34
The Company’s investment in covered loans by credit quality indicator as of December 31, 2012 and
2011 is presented in the following table. Loan discounts in the table below represent the adjustment of covered loans to fair value at the time of acquisition, as adjusted for income accretion and changes in cash flow estimates in subsequent
periods. The discounts for the December 31, 2011 period have been restated below to reflect the correction of the error discussed in Note 6 to these consolidated financial statements.
|
|
|
|
|
|
|
|
|
|
|
|
|
|
|
|
|
| (Dollars in thousands) |
|
Covered loans |
|
| December 31, 2012 |
|
Commercial |
|
| Credit quality indicator by asset risk classification |
|
Real Estate-
Construction |
|
|
Real Estate-
Other |
|
|
Business |
|
|
Total |
|
| Pass |
|
$ |
46,201 |
|
|
$ |
201,261 |
|
|
$ |
38,552 |
|
|
$ |
286,014 |
|
| Special Mention |
|
|
9,888 |
|
|
|
65,498 |
|
|
|
8,600 |
|
|
|
83,986 |
|
| Substandard |
|
|
97,315 |
|
|
|
279,171 |
|
|
|
50,018 |
|
|
|
426,504 |
|
| Doubtful |
|
|
607 |
|
|
|
8,530 |
|
|
|
451 |
|
|
|
9,588 |
|
|
|
|
|
|
|
|
|
|
|
|
|
|
|
|
|
|
| Total |
|
$ |
154,011 |
|
|
$ |
554,460 |
|
|
$ |
97,621 |
|
|
$ |
806,092 |
|
|
|
|
|
|
| Discount |
|
|
|
|
|
|
|
|
|
|
|
|
|
|
(78,198 |
) |
|
|
|
|
|
|
|
|
|
|
|
|
|
|
|
|
|
| Covered commercial loans, net |
|
|
|
|
|
|
|
|
|
|
|
|
|
$ |
727,894 |
|
|
|
|
|
|
|
|
|
|
|
|
|
|
| |
|
Mortgage |
|
| Credit risk by payment status |
|
Prime |
|
|
Subprime |
|
|
Total |
|
| Current |
|
$ |
183,795 |
|
|
$ |
— |
|
|
$ |
183,795 |
|
| Past due greater than 30 days |
|
|
52,379 |
|
|
|
— |
|
|
|
52,379 |
|
|
|
|
|
|
|
|
|
|
|
|
|
|
| Total |
|
$ |
236,174 |
|
|
$ |
— |
|
|
$ |
236,174 |
|
|
|
|
|
| Discount |
|
|
|
|
|
|
|
|
|
|
(49,010 |
) |
|
|
|
|
|
|
|
|
|
|
|
|
|
| Covered mortgage loans, net |
|
|
|
|
|
|
|
|
|
$ |
187,164 |
|
|
|
|
|
|
|
|
|
|
|
|
|
|
|
|
|
|
|
|
|
|
| |
|
Consumer and Other |
|
| Credit risk by payment status |
|
Indirect
Automobile |
|
|
Credit Card |
|
|
Home
Equity |
|
|
Other |
|
|
Total |
|
| Current |
|
$ |
— |
|
|
$ |
841 |
|
|
$ |
168,728 |
|
|
$ |
1,155 |
|
|
$ |
170,724 |
|
| Past due greater than 30 days |
|
|
— |
|
|
|
65 |
|
|
|
65,997 |
|
|
|
1,523 |
|
|
|
67,585 |
|
|
|
|
|
|
|
|
|
|
|
|
|
|
|
|
|
|
|
|
|
|
| Total |
|
$ |
— |
|
|
$ |
906 |
|
|
$ |
234,725 |
|
|
$ |
2,678 |
|
|
$ |
238,309 |
|
|
|
|
|
|
|
| Discount |
|
|
|
|
|
|
|
|
|
|
|
|
|
|
|
|
|
|
(60,611 |
) |
|
|
|
|
|
|
|
|
|
|
|
|
|
|
|
|
|
|
|
|
|
| Covered consumer loans, net |
|
|
|
|
|
|
|
|
|
|
|
|
|
|
|
|
|
$ |
177,698 |
|
|
|
|
|
|
|
|
|
|
|
|
|
|
|
|
|
|
|
|
|
|
35
|
|
|
|
|
|
|
|
|
|
|
|
|
|
|
|
|
| (Dollars in thousands) |
|
Covered loans |
|
| December 31, 2011 |
|
Commercial |
|
| Credit quality indicator by asset risk classification |
|
Real Estate-
Construction |
|
|
Real Estate-
Other |
|
|
Business |
|
|
Total |
|
| Pass |
|
$ |
59,936 |
|
|
$ |
282,974 |
|
|
$ |
72,563 |
|
|
$ |
415,473 |
|
| Special Mention |
|
|
17,336 |
|
|
|
87,409 |
|
|
|
10,965 |
|
|
|
115,710 |
|
| Substandard |
|
|
169,726 |
|
|
|
349,155 |
|
|
|
61,268 |
|
|
|
580,149 |
|
| Doubtful |
|
|
705 |
|
|
|
22,636 |
|
|
|
4,082 |
|
|
|
27,423 |
|
|
|
|
|
|
|
|
|
|
|
|
|
|
|
|
|
|
| Total |
|
$ |
247,703 |
|
|
$ |
742,174 |
|
|
$ |
148,878 |
|
|
$ |
1,138,755 |
|
|
|
|
|
|
| Discount |
|
|
|
|
|
|
|
|
|
|
|
|
|
|
(257,140 |
) |
|
|
|
|
|
|
|
|
|
|
|
|
|
|
|
|
|
| Covered commercial loans, net |
|
|
|
|
|
|
|
|
|
|
|
|
|
$ |
881,615 |
|
|
|
|
|
|
|
|
|
|
|
|
|
|
| |
|
Mortgage |
|
| Credit risk by payment status |
|
Prime |
|
|
Subprime |
|
|
Total |
|
| Current |
|
$ |
233,305 |
|
|
$ |
— |
|
|
$ |
233,305 |
|
| Past Due greater than 30 days |
|
|
94,553 |
|
|
|
— |
|
|
|
94,553 |
|
|
|
|
|
|
|
|
|
|
|
|
|
|
| Total |
|
$ |
327,858 |
|
|
$ |
— |
|
|
$ |
327,858 |
|
|
|
|
|
| Discount |
|
|
|
|
|
|
|
|
|
|
(72,471 |
) |
|
|
|
|
|
|
|
|
|
|
|
|
|
| Covered mortgage loans, net |
|
|
|
|
|
|
|
|
|
$ |
255,387 |
|
|
|
|
|
|
|
|
|
|
|
|
|
|
|
|
|
|
|
|
|
|
| |
|
Consumer and Other |
|
| Credit risk by payment status |
|
Indirect
Automobile |
|
|
Credit Card |
|
|
Home
Equity |
|
|
Other |
|
|
Total |
|
| Current |
|
$ |
— |
|
|
$ |
875 |
|
|
$ |
193,366 |
|
|
$ |
4,880 |
|
|
$ |
199,121 |
|
| Past Due greater than 30 days |
|
|
— |
|
|
|
94 |
|
|
|
107,520 |
|
|
|
534 |
|
|
|
108,148 |
|
|
|
|
|
|
|
|
|
|
|
|
|
|
|
|
|
|
|
|
|
|
| Total |
|
$ |
— |
|
|
$ |
969 |
|
|
$ |
300,886 |
|
|
$ |
5,414 |
|
|
$ |
307,269 |
|
|
|
|
|
|
|
| Discount |
|
|
|
|
|
|
|
|
|
|
|
|
|
|
|
|
|
|
(109,822 |
) |
|
|
|
|
|
|
|
|
|
|
|
|
|
|
|
|
|
|
|
|
|
| Covered consumer loans, net |
|
|
|
|
|
|
|
|
|
|
|
|
|
|
|
|
|
$ |
197,447 |
|
|
|
|
|
|
|
|
|
|
|
|
|
|
|
|
|
|
|
|
|
|
36
Impaired Loans
Information on the Company’s investment in impaired loans is presented in the following tables as of and for the periods indicated.
|
|
|
|
|
|
|
|
|
|
|
|
|
|
|
|
|
|
|
|
|
| (Dollars in thousands) |
|
|
|
|
|
|
|
|
|
|
|
|
|
|
|
| December 31, 2012 |
|
Recorded
Investment |
|
|
Unpaid
Principal
Balance |
|
|
Related
Allowance |
|
|
Average
Recorded
Investment |
|
|
Interest
Income
Recognized |
|
| With no related allowance recorded |
|
|
|
|
|
|
|
|
|
|
|
|
|
|
|
|
|
|
|
|
| Commercial Loans |
|
|
|
|
|
|
|
|
|
|
|
|
|
|
|
|
|
|
|
|
| Real Estate |
|
$ |
26,151 |
|
|
$ |
26,151 |
|
|
$ |
— |
|
|
$ |
34,682 |
|
|
$ |
168 |
|
| Business |
|
|
1,824 |
|
|
|
1,824 |
|
|
|
— |
|
|
|
2,621 |
|
|
|
33 |
|
|
|
|
|
|
|
| With an allowance recorded |
|
|
|
|
|
|
|
|
|
|
|
|
|
|
|
|
|
|
|
|
| Mortgage Loans |
|
|
|
|
|
|
|
|
|
|
|
|
|
|
|
|
|
|
|
|
| Residential – Prime |
|
$ |
9,861 |
|
|
$ |
10,070 |
|
|
$ |
(209 |
) |
|
$ |
7,955 |
|
|
$ |
131 |
|
| Residential – Subprime |
|
|
— |
|
|
|
— |
|
|
|
— |
|
|
|
— |
|
|
|
— |
|
| Commercial Loans |
|
|
|
|
|
|
|
|
|
|
|
|
|
|
|
|
|
|
|
|
| Real Estate |
|
|
3,464 |
|
|
|
3,663 |
|
|
|
(199 |
) |
|
|
3,678 |
|
|
|
123 |
|
| Business |
|
|
1,334 |
|
|
|
1,810 |
|
|
|
(476 |
) |
|
|
1,889 |
|
|
|
47 |
|
| Consumer Loans |
|
|
|
|
|
|
|
|
|
|
|
|
|
|
|
|
|
|
|
|
| Indirect automobile |
|
|
865 |
|
|
|
868 |
|
|
|
(3 |
) |
|
|
1,514 |
|
|
|
28 |
|
| Credit card |
|
|
413 |
|
|
|
424 |
|
|
|
(11 |
) |
|
|
372 |
|
|
|
— |
|
| Home equity |
|
|
5,860 |
|
|
|
5,951 |
|
|
|
(91 |
) |
|
|
6,713 |
|
|
|
51 |
|
| Other |
|
|
307 |
|
|
|
310 |
|
|
|
(3 |
) |
|
|
601 |
|
|
|
5 |
|
|
|
|
|
|
|
| Total |
|
|
|
|
|
|
|
|
|
|
|
|
|
|
|
|
|
|
|
|
| Mortgage Loans |
|
$ |
9,861 |
|
|
$ |
10,070 |
|
|
|
(209 |
) |
|
$ |
7,955 |
|
|
$ |
131 |
|
| Commercial Loans |
|
|
32,773 |
|
|
|
33,448 |
|
|
|
(675 |
) |
|
|
42,870 |
|
|
|
371 |
|
| Consumer Loans |
|
|
7,445 |
|
|
|
7,553 |
|
|
|
(108 |
) |
|
|
9,200 |
|
|
|
84 |
|
|
|
|
|
|
|
|
|
|
|
|
|
|
|
|
|
|
|
|
|
|
| (Dollars in thousands) |
|
|
|
|
|
|
|
|
|
|
|
|
|
|
|
| December 31, 2011 |
|
Recorded
Investment |
|
|
Unpaid
Principal
Balance |
|
|
Related
Allowance |
|
|
Average
Recorded
Investment |
|
|
Interest
Income
Recognized |
|
| With no related allowance recorded |
|
|
|
|
|
|
|
|
|
|
|
|
|
|
|
|
|
|
|
|
| Commercial Loans |
|
|
|
|
|
|
|
|
|
|
|
|
|
|
|
|
|
|
|
|
| Real Estate |
|
$ |
32,267 |
|
|
$ |
32,267 |
|
|
$ |
— |
|
|
$ |
35,673 |
|
|
$ |
173 |
|
| Business |
|
|
6,403 |
|
|
|
6,403 |
|
|
|
— |
|
|
|
8,642 |
|
|
|
144 |
|
|
|
|
|
|
|
| With an allowance recorded |
|
|
|
|
|
|
|
|
|
|
|
|
|
|
|
|
|
|
|
|
| Mortgage Loans |
|
|
|
|
|
|
|
|
|
|
|
|
|
|
|
|
|
|
|
|
| Residential – Prime |
|
$ |
4,763 |
|
|
$ |
4,910 |
|
|
$ |
(147 |
) |
|
$ |
6,163 |
|
|
$ |
30 |
|
| Residential – Subprime |
|
|
— |
|
|
|
— |
|
|
|
— |
|
|
|
— |
|
|
|
— |
|
| Commercial Loans |
|
|
|
|
|
|
|
|
|
|
|
|
|
|
|
|
|
|
|
|
| Real Estate |
|
|
1,430 |
|
|
|
3,304 |
|
|
|
(1,874 |
) |
|
|
3,315 |
|
|
|
26 |
|
| Business |
|
|
40 |
|
|
|
219 |
|
|
|
(179 |
) |
|
|
423 |
|
|
|
5 |
|
| Consumer Loans |
|
|
|
|
|
|
|
|
|
|
|
|
|
|
|
|
|
|
|
|
| Indirect automobile |
|
|
987 |
|
|
|
994 |
|
|
|
(7 |
) |
|
|
1,399 |
|
|
|
40 |
|
| Credit card |
|
|
391 |
|
|
|
403 |
|
|
|
(12 |
) |
|
|
440 |
|
|
|
— |
|
| Home equity |
|
|
4,826 |
|
|
|
4,873 |
|
|
|
(47 |
) |
|
|
5,014 |
|
|
|
59 |
|
| Other |
|
|
608 |
|
|
|
619 |
|
|
|
(11 |
) |
|
|
797 |
|
|
|
8 |
|
|
|
|
|
|
|
| Total |
|
|
|
|
|
|
|
|
|
|
|
|
|
|
|
|
|
|
|
|
| Mortgage Loans |
|
$ |
4,763 |
|
|
$ |
4,910 |
|
|
|
(147 |
) |
|
$ |
6,163 |
|
|
$ |
30 |
|
| Commercial Loans |
|
|
40,140 |
|
|
|
42,193 |
|
|
|
(2,053 |
) |
|
|
48,053 |
|
|
|
348 |
|
| Consumer Loans |
|
|
6,812 |
|
|
|
6,889 |
|
|
|
(77 |
) |
|
|
7,650 |
|
|
|
107 |
|
37
As of December 31, 2012 and 2011, the Company was not committed to lend additional funds to any
customer whose loan was classified as impaired or as a troubled debt restructuring.
NOTE 8 – TRANSFERS AND SERVICING OF FINANCIAL ASSETS (INCLUDING MORTGAGE BANKING ACTIVITIES)
Commercial Banking Activity
Loans serviced for others, consisting primarily of commercial loan participations sold, are not included in the accompanying consolidated balance sheets. The unpaid principal balances of loans serviced
for others were $257,883,000 and $198,860,000 at December 31, 2012 and 2011, respectively. Custodial escrow balances maintained in connection with the foregoing portfolio of loans serviced for others, and included in demand deposits, were
immaterial at December 31, 2012 and 2011.
Mortgage Banking Activity
The Company through its subsidiary, IMC, originates mortgage loans for sale into the secondary market. The loans originated primarily consist of residential first mortgages that conform to standards
established by the GSEs, but can also consist of junior lien loans secured by residential property. These sales are primarily to private companies that are unaffiliated with the GSEs on a servicing released basis. The following table details the
mortgage banking activity as of and for the years ended December 31:
|
|
|
|
|
|
|
|
|
|
|
|
|
| (Dollars in thousands) |
|
|
|
|
|
|
|
| Mortgage loans held for sale |
|
2012 |
|
|
2011 |
|
|
2010 |
|
| Balance, beginning of period |
|
$ |
153,013 |
|
|
$ |
83,905 |
|
|
$ |
66,945 |
|
| Balance acquired during the period |
|
|
— |
|
|
|
3,385 |
|
|
|
— |
|
| Originations |
|
|
2,432,367 |
|
|
|
1,659,226 |
|
|
|
1,772,486 |
|
| Sales |
|
|
(2,317,905 |
) |
|
|
(1,593,503 |
) |
|
|
(1,755,526 |
) |
|
|
|
|
|
|
|
|
|
|
|
|
|
| Balance, end of period |
|
$ |
267,475 |
|
|
$ |
153,013 |
|
|
$ |
83,905 |
|
|
|
|
|
|
|
|
|
|
|
|
|
|
|
|
| (Dollars in thousands) |
|
|
|
|
|
|
|
| Detail of mortgage income |
|
2012 |
|
|
2011 |
|
|
2010 |
|
| Fair value changes of derivatives and mortgage loans held for sale, net |
|
$ |
6,772 |
|
|
$ |
937 |
|
|
$ |
— |
|
| Gains on sales |
|
|
70,811 |
|
|
|
43,955 |
|
|
|
47,689 |
|
| Servicing and other income, net |
|
|
470 |
|
|
|
285 |
|
|
|
318 |
|
|
|
|
|
|
|
|
|
|
|
|
|
|
| Total mortgage income |
|
$ |
78,053 |
|
|
$ |
45,177 |
|
|
$ |
48,007 |
|
|
|
|
|
|
|
|
|
|
|
|
|
|
For the years ended December 31, 2012, 2011 and 2010, the Company did not actively hedge its mortgage banking
activities.
Mortgage Servicing Rights
Mortgage servicing rights are amortized over the remaining servicing life of the loans, with consideration given to prepayment assumptions. Mortgage servicing rights had the following carrying values at
December 31:
|
|
|
|
|
|
|
|
|
|
|
|
|
|
|
|
|
|
|
|
|
|
|
|
|
| |
|
2012 |
|
|
2011 |
|
| (Dollars in thousands) |
|
Gross
Carrying
Amount |
|
|
Accumulated
Amortization |
|
|
Net
Carrying
Amount |
|
|
Gross
Carrying
Amount |
|
|
Accumulated
Amortization |
|
|
Net
Carrying
Amount |
|
| Mortgage servicing rights |
|
|
1,234 |
|
|
|
(304 |
) |
|
|
930 |
|
|
|
340 |
|
|
|
(194 |
) |
|
|
146 |
|
The related amortization expense of mortgage servicing assets is as follows:
|
|
|
|
|
| (Dollars in thousands) |
|
Amount |
|
| Aggregate amortization expense for the year ended December 31: |
|
|
|
|
| 2010 |
|
$ |
125 |
|
| 2011 |
|
|
115 |
|
| 2012 |
|
|
225 |
|
|
|
| Estimated amortization expense for the year ended December 31: |
|
|
|
|
| 2013 |
|
$ |
282 |
|
| 2014 |
|
|
230 |
|
| 2015 |
|
|
180 |
|
| 2016 |
|
|
130 |
|
| 2017 |
|
|
83 |
|
| 2018 and thereafter |
|
|
25 |
|
NOTE 9 – PREMISES AND EQUIPMENT
Premises and equipment at December 31, 2012 and 2011 consists of the following:
|
|
|
|
|
|
|
|
|
| (Dollars in thousands) |
|
2012 |
|
|
2011 |
|
| Land |
|
$ |
81,761 |
|
|
$ |
70,022 |
|
| Buildings |
|
|
221,022 |
|
|
|
211,521 |
|
| Furniture, fixtures and equipment |
|
|
101,907 |
|
|
|
89,283 |
|
|
|
|
|
|
|
|
|
|
| Total premises and equipment |
|
|
404,690 |
|
|
|
370,826 |
|
| Accumulated depreciation |
|
|
(101,167 |
) |
|
|
(85,219 |
) |
|
|
|
|
|
|
|
|
|
| Total premises and equipment, net |
|
$ |
303,523 |
|
|
$ |
285,607 |
|
|
|
|
|
|
|
|
|
|
Depreciation expense was $18,286,000, $13,431,000, and $10,359,000 for the years ended December 31, 2012, 2011, and
2010, respectively.
The Company actively engages in leasing office space available in buildings it owns. Leases have different terms ranging
from monthly rental to five-year leases. At December 31, 2012, income from these leases averaged $131,000 per month. Total lease income for the years ended December 31, 2012, 2011, and 2010 was $1,572,000, $1,542,000, and $1,574,000,
respectively. Income from leases is reported as a reduction in occupancy and equipment expense. The total allocated cost of the portion of the buildings held for lease at December 31, 2012 and 2011 was $9,992,000 and $8,942,000, respectively,
with related accumulated depreciation of $2,497,000 and $2,168,000, respectively.
The Company leases certain branch and corporate offices,
land and ATM facilities through non-cancelable operating leases with terms that
38
range from one to thirty years, with renewal options thereafter. Certain of the leases have escalation clauses and renewal options ranging from monthly renewal to 30 years. Total rent expense for
the years ended December 31, 2012, 2011, and 2010 totaled $10,614,000, $9,803,000, and $7,108,000, respectively.
Minimum future annual
rent commitments under these agreements for the indicated periods follow:
|
|
|
|
|
| (Dollars in thousands) |
|
Amount |
|
| Year ending December 31, |
|
|
|
|
| 2013 |
|
$ |
10,830 |
|
| 2014 |
|
|
9,535 |
|
| 2015 |
|
|
8,807 |
|
| 2016 |
|
|
7,601 |
|
| 2017 |
|
|
6,332 |
|
| 2018 and thereafter |
|
|
39,671 |
|
|
|
|
|
|
| Total |
|
$ |
82,776 |
|
|
|
|
|
|
NOTE 10 – GOODWILL AND OTHER ACQUIRED INTANGIBLE ASSETS
Goodwill
Changes to
the carrying amount of goodwill for the years ended December 31, 2012 and 2011 are provided in the following table.
|
|
|
|
|
| (Dollars in thousands) |
|
Amount |
|
| Balance, December 31, 2010 |
|
$ |
234,228 |
|
| Goodwill acquired during the year |
|
|
135,583 |
|
|
|
|
|
|
| Balance, December 31, 2011 |
|
|
369,811 |
|
| Goodwill acquired during the period |
|
|
32,420 |
|
| Goodwill adjustment to correct an immaterial error |
|
|
(359 |
) |
|
|
|
|
|
| Balance, December 31, 2012 |
|
$ |
401,872 |
|
|
|
|
|
|
The goodwill acquired during the year ended December 31, 2011 was a result of the OMNI, Cameron, and Florida Trust
Company acquisitions, and the goodwill acquired during the year ended December 31, 2012 was a result of the Florida Gulf acquisition discussed further in Note 4.
The goodwill adjustment in 2012 is a result of the Company’s revised goodwill recorded on its OMNI and Cameron acquisitions. The Company has recorded the adjustment to account for the impact of an
immaterial error in accounting for its OMNI and Cameron acquisitions that resulted in a decrease in goodwill of $359,000. The Company revised its valuation of acquired deferred tax assets and property during the first quarter of 2012 as a result of
information that existed at the acquisition date but was not available during the prior period. The error was identified in 2012 through the operation of the Company’s internal controls over financial reporting as it related to the
Company’s acquisition accounting.
The Company performed the required annual impairment test of goodwill as of October 1, 2012. The
Company’s annual impairment test did not indicate impairment at any of the Company’s reporting units as of the testing date, and subsequent to that date, management is not aware of any events or changes in circumstances since the
impairment test that would indicate that goodwill might be impaired.
Prior to 2010, the Company recognized goodwill impairment of $9,681,000
at the Company’s LTC subsidiary based on a decrease in operating revenue and income, which resulted in the conclusion that the fair value of LTC may have been reduced below its carrying amount.
Title plant
The Company had title plant
assets totaling $6,722,000 at December 31, 2012 and 2011, respectively. No events or changes in circumstances occurred during 2012 or 2011 to suggest the carrying value of the title plant was not recoverable.
39
Intangible assets subject to amortization
Definite-lived intangible assets had the following carrying values at December 31:
|
|
|
|
|
|
|
|
|
|
|
|
|
|
|
|
|
|
|
|
|
|
|
|
|
| |
|
2012 |
|
|
2011 |
|
| (Dollars in thousands) |
|
Gross
Carrying
Amount |
|
|
Accumulated
Amortization |
|
|
Net
Carrying
Amount |
|
|
Gross
Carrying
Amount |
|
|
Accumulated
Amortization |
|
|
Net
Carrying
Amount |
|
| Core deposit intangibles |
|
$ |
45,406 |
|
|
$ |
(26,284 |
) |
|
$ |
19,122 |
|
|
$ |
45,406 |
|
|
$ |
(21,385 |
) |
|
$ |
24,021 |
|
| Customer relationship intangible asset |
|
|
1,348 |
|
|
|
(410 |
) |
|
|
938 |
|
|
|
1,348 |
|
|
|
(160 |
) |
|
|
1,188 |
|
|
|
|
|
|
|
|
|
|
|
|
|
|
|
|
|
|
|
|
|
|
|
|
|
|
| Total |
|
$ |
46,754 |
|
|
$ |
(26,694 |
) |
|
$ |
20,060 |
|
|
$ |
46,754 |
|
|
$ |
(21,545 |
) |
|
$ |
25,209 |
|
|
|
|
|
|
|
|
|
|
|
|
|
|
|
|
|
|
|
|
|
|
|
|
|
|
The related amortization expense of purchase accounting intangible assets is as follows:
|
|
|
|
|
| (Dollars in thousands) |
|
Amount |
|
| Aggregate amortization expense for the year ended December 31: |
|
|
|
|
| 2010 |
|
$ |
4,935 |
|
| 2011 |
|
|
5,121 |
|
| 2012 |
|
|
5,150 |
|
|
|
| Estimated amortization expense for the year ended December 31: |
|
|
|
|
| 2013 |
|
$ |
4,721 |
|
| 2014 |
|
|
4,346 |
|
| 2015 |
|
|
3,546 |
|
| 2016 |
|
|
3,177 |
|
| 2017 |
|
|
1,694 |
|
| 2018 and thereafter |
|
|
2,576 |
|
NOTE 11 – OTHER REAL ESTATE OWNED
Other real estate owned consists of the following at December 31:
|
|
|
|
|
|
|
|
|
| (Dollars in thousands) |
|
2012 |
|
|
2011 |
|
| Real estate owned acquired by foreclosure |
|
$ |
110,864 |
|
|
$ |
119,320 |
|
| Real estate acquired for development or resale |
|
|
9,199 |
|
|
|
5,722 |
|
| Other foreclosed property |
|
|
1,473 |
|
|
|
4 |
|
|
|
|
|
|
|
|
|
|
| Total other real estate owned and foreclosed property |
|
$ |
121,536 |
|
|
$ |
125,046 |
|
|
|
|
|
|
|
|
|
|
At December 31, 2012 and 2011, other real estate is segregated into covered and non-covered properties as follows:
|
|
|
|
|
|
|
|
|
|
|
|
|
| (Dollars in thousands) |
|
|
|
| December 31, 2012 |
|
Non-covered
properties |
|
|
Covered
properties |
|
|
Total |
|
| Real estate owned acquired by foreclosure |
|
$ |
35,080 |
|
|
$ |
75,784 |
|
|
$ |
110,864 |
|
| Real estate acquired for development or resale |
|
|
9,199 |
|
|
|
— |
|
|
|
9,199 |
|
| Other foreclosed property |
|
|
14 |
|
|
|
1,459 |
|
|
|
1,473 |
|
|
|
|
|
|
|
|
|
|
|
|
|
|
| Total other real estate owned and foreclosed property |
|
$ |
44,293 |
|
|
$ |
77,243 |
|
|
$ |
121,536 |
|
|
|
|
|
|
|
|
|
|
|
|
|
|
|
|
|
|
|
|
|
|
|
|
|
|
|
| (Dollars in thousands) |
|
|
|
| December 31, 2011 |
|
Non-covered
properties |
|
|
Covered
properties |
|
|
Total |
|
| Real estate owned acquired by foreclosure |
|
$ |
34,770 |
|
|
$ |
84,550 |
|
|
$ |
119,320 |
|
| Real estate acquired for development or resale |
|
|
5,722 |
|
|
|
— |
|
|
|
5,722 |
|
| Other foreclosed property |
|
|
4 |
|
|
|
— |
|
|
|
4 |
|
|
|
|
|
|
|
|
|
|
|
|
|
|
| Total other real estate owned and foreclosed property |
|
$ |
40,496 |
|
|
$ |
84,550 |
|
|
$ |
125,046 |
|
|
|
|
|
|
|
|
|
|
|
|
|
|
40
NOTE 12 – DEPOSITS
Deposits at December 31, 2012 and 2011 are summarized as follows:
|
|
|
|
|
|
|
|
|
| (Dollars in thousands) |
|
2012 |
|
|
2011 |
|
| Negotiable order of withdrawal (NOW) |
|
$ |
4,490,914 |
|
|
$ |
3,361,855 |
|
| Money market deposits accounts (MMDA) |
|
|
3,738,480 |
|
|
|
3,049,151 |
|
| Savings deposits |
|
|
364,703 |
|
|
|
332,351 |
|
| Certificates of deposit and other time deposits |
|
|
2,154,180 |
|
|
|
2,545,656 |
|
|
|
|
|
|
|
|
|
|
| Total deposits |
|
$ |
10,748,277 |
|
|
$ |
9,289,013 |
|
|
|
|
|
|
|
|
|
|
Total time deposits summarized by denomination at December 31, 2012 and 2011 are as follows:
|
|
|
|
|
|
|
|
|
| (Dollars in thousands) |
|
2012 |
|
|
2011 |
|
| Time deposits less than $100,000 |
|
$ |
1,007,665 |
|
|
$ |
1,168,025 |
|
| Time deposits greater than $100,000 |
|
|
1,146,515 |
|
|
|
1,377,631 |
|
|
|
|
|
|
|
|
|
|
| Total certificates of deposit and other time deposits |
|
$ |
2,154,180 |
|
|
$ |
2,545,656 |
|
|
|
|
|
|
|
|
|
|
A schedule of maturities of all certificates of deposit as of December 31, 2012 is as follows:
|
|
|
|
|
| (Dollars in thousands) |
|
Amount |
|
| Year ending December 31, |
|
|
|
|
| 2013 |
|
$ |
1,538,582 |
|
| 2014 |
|
|
284,154 |
|
| 2015 |
|
|
152,020 |
|
| 2016 |
|
|
114,232 |
|
| 2017 |
|
|
37,387 |
|
| 2018 and thereafter |
|
|
27,805 |
|
|
|
|
|
|
| Total certificates of deposit and other time deposits |
|
$ |
2,154,180 |
|
|
|
|
|
|
NOTE 13 – SHORT-TERM BORROWINGS
Short-term borrowings at December 31, 2012 and 2011 are summarized as follows:
|
|
|
|
|
|
|
|
|
| (Dollars in thousands) |
|
2012 |
|
|
2011 |
|
| Federal Home Loan Bank advances |
|
$ |
— |
|
|
$ |
192,000 |
|
| Securities sold under agreements to repurchase |
|
|
303,045 |
|
|
|
203,543 |
|
|
|
|
|
|
|
|
|
|
| Total short-term borrowings |
|
$ |
303,045 |
|
|
$ |
395,543 |
|
|
|
|
|
|
|
|
|
|
Securities sold under agreements to repurchase, which are classified as secured borrowings, generally mature daily.
Securities sold under agreements to repurchase are reflected at the amount of cash received in connection with the transaction. The Company may be required to provide additional collateral based on the fair value of the underlying securities.
The short-term borrowings at December 31, 2011 consisted of one FHLB advance with a maturity of 2 days at a fixed interest rate of
0.140%.
41
Additional information on the Company’s short-term borrowings for the years indicated is as follows:
|
|
|
|
|
|
|
|
|
|
|
|
|
| (Dollars in thousands) |
|
2012 |
|
|
2011 |
|
|
2010 |
|
| Outstanding at December 31st |
|
$ |
303,045 |
|
|
$ |
395,543 |
|
|
$ |
220,328 |
|
| Maximum month-end outstanding balance |
|
|
640,768 |
|
|
|
395,543 |
|
|
|
289,248 |
|
| Average daily outstanding balance |
|
|
284,201 |
|
|
|
220,146 |
|
|
|
216,116 |
|
| Average rate during the year |
|
|
0.22 |
% |
|
|
0.26 |
% |
|
|
0.38 |
% |
| Average rate at year end |
|
|
0.22 |
% |
|
|
0.27 |
% |
|
|
0.24 |
% |
NOTE 14 – LONG-TERM DEBT
Long-term debt at December 31, 2012 and 2011 is summarized as follows:
|
|
|
|
|
|
|
|
|
| (Dollars in thousands) |
|
2012 |
|
|
2011 |
|
| Federal Home Loan Bank notes (IBERIABANK) at: |
|
|
|
|
|
|
|
|
| 2.273 to 7.040% fixed |
|
$ |
233,812 |
|
|
$ |
285,930 |
|
|
|
|
| Notes payable - Investment fund contributions (IBERIABANK): |
|
|
|
|
|
|
|
|
| 7 to 40 year term, 0.50 to 5.00% fixed |
|
|
77,703 |
|
|
|
54,941 |
|
|
|
|
| Junior subordinated debt (IBERIABANK Corporation): |
|
|
|
|
|
|
|
|
| Statutory Trust I, 3 month LIBOR(1) plus 3.25% |
|
|
10,310 |
|
|
|
10,310 |
|
| Statutory Trust II, 3 month LIBOR(1) plus 3.15% |
|
|
10,310 |
|
|
|
10,310 |
|
| Statutory Trust III, 3 month LIBOR(1) plus 2.00% |
|
|
10,310 |
|
|
|
10,310 |
|
| Statutory Trust IV, 3 month LIBOR(1) plus 1.60% |
|
|
15,464 |
|
|
|
15,464 |
|
| American Horizons Statutory Trust I, 3 month LIBOR(1) plus 3.15% |
|
|
6,186 |
|
|
|
6,186 |
|
| Statutory Trust V, 3 month LIBOR(1) plus 1.435% |
|
|
10,310 |
|
|
|
10,310 |
|
| Statutory Trust VI, 3 month LIBOR(1) plus 2.75% |
|
|
12,372 |
|
|
|
12,372 |
|
| Statutory Trust VII, 3 month LIBOR(1) plus 2.54% |
|
|
13,403 |
|
|
|
13,403 |
|
| Statutory Trust VIII, 3 month LIBOR(1) plus 3.50% |
|
|
7,217 |
|
|
|
7,217 |
|
| OMNI Trust I, 3 month LIBOR(1) plus 3.30% |
|
|
8,248 |
|
|
|
8,248 |
|
| OMNI Trust II, 3 month LIBOR(1) plus 2.79% |
|
|
7,732 |
|
|
|
7,732 |
|
|
|
|
|
|
|
|
|
|
| Total long-term debt |
|
$ |
423,377 |
|
|
$ |
452,733 |
|
|
|
|
|
|
|
|
|
|
| (1)
|
The interest rate on the Company’s long-term debt indexed to LIBOR is based on the 3-month LIBOR rate. At December 31, 2012, the 3-month
LIBOR rate was 0.31%. |
FHLB advance repayments are amortized over periods ranging from two to 30 years, and have a balloon
feature at maturity. Advances are collateralized by a blanket pledge of eligible loans, subject to contractual adjustments which reduce the borrowing base, as well as a secondary pledge of FHLB stock and FHLB demand deposits. Total additional
advances available from the FHLB at December 31, 2012 were $1,350,424,000 under the blanket floating lien and an additional $79,539,000 with a pledge of investment securities. The weighted average advance rate at December 31, 2012 was
4.31%.
The Company has various funding arrangements with commercial banks providing up to $130,000,000 in the form of federal funds and other
lines of credit. At December 31, 2012, there were no balances outstanding on these lines and all of the funding was available to the Company.
Junior subordinated debt consists of a total of $111,862,000 in Junior Subordinated Deferrable Interest Debentures of the Company issued to statutory trusts that were funded by the issuance of floating
rate capital securities of the trusts. Issuances of $10,310,000 each were completed in November 2002, June 2003, September 2004, and June 2007 and an issuance of $15,464,000 was completed in October 2006. The issue of $6,186,000
completed in March 2003 was assumed in the American Horizons acquisition. The Company issued $25,775,000 in November 2007 and $7,217,000 in March 2008 to provide funding for various business activities, primarily loan growth. Issuances of $8,248,000
and $7,732,000 were assumed in the OMNI acquisition during 2011.
The term of the securities is 30 years, and they are callable at par by the
Company anytime after 5 years. Interest is payable quarterly and may be deferred at any time at the election of the Company for up to 20 consecutive quarterly periods. During a deferral period, the Company is subject to certain restrictions,
including being prohibited from declaring and paying dividends to its common shareholders.
The debentures qualify as Tier 1 Capital and the
capital note qualifies as Tier 2 capital for regulatory purposes.
42
Advances and long-term debt at December 31, 2012 have maturities or call dates in future years as
follows:
|
|
|
|
|
| (Dollars in thousands) |
|
Amount |
|
| Year ending December 31, |
|
|
|
|
| 2013 |
|
$ |
30,914 |
|
| 2014 |
|
|
111,329 |
|
| 2015 |
|
|
1,220 |
|
| 2016 |
|
|
26,276 |
|
| 2017 |
|
|
50,567 |
|
| 2018 and thereafter |
|
|
203,071 |
|
|
|
|
|
|
| Total |
|
$ |
423,377 |
|
|
|
|
|
|
NOTE 15 – DERIVATIVE INSTRUMENTS AND OTHER HEDGING ACTIVITIES
At December 31, 2012 and 2011, the information pertaining to outstanding derivative instruments is as follows.
|
|
|
|
|
|
|
|
|
|
|
|
|
|
|
|
|
|
|
|
|
| (Dollars in thousands) |
|
Balance Sheet
Location |
|
Asset Derivatives
Fair Value |
|
|
Balance Sheet
Location |
|
Liability Derivatives
Fair Value |
|
| |
|
|
2012 |
|
|
2011 |
|
|
|
2012 |
|
|
2011 |
|
| Derivatives designated as hedging instruments under ASC Topic 815 |
|
|
|
|
|
|
|
|
|
|
|
|
|
|
|
|
|
|
|
|
| Interest rate contracts |
|
Other assets |
|
$ |
499 |
|
|
$ |
71 |
|
|
Other liabilities |
|
$ |
1,843 |
|
|
$ |
3,010 |
|
|
|
|
|
|
|
|
|
|
|
|
|
|
|
|
|
|
|
|
|
|
| Total derivatives designated as hedging instruments under ASC Topic 815 |
|
|
|
$ |
499 |
|
|
$ |
71 |
|
|
|
|
$ |
1,843 |
|
|
$ |
3,010 |
|
|
|
|
|
|
|
|
| Derivatives not designated as hedging instruments under ASC Topic 815 |
|
|
|
|
|
|
|
|
|
|
|
|
|
|
|
|
|
|
|
|
| Interest rate contracts |
|
Other assets |
|
$ |
25,940 |
|
|
$ |
25,391 |
|
|
Other liabilities |
|
$ |
25,940 |
|
|
$ |
25,391 |
|
| Forward sales contracts |
|
Other assets |
|
|
2,774 |
|
|
|
— |
|
|
Other liabilities |
|
|
343 |
|
|
|
— |
|
| Written and purchased options |
|
Other assets |
|
|
12,906 |
|
|
|
7,564 |
|
|
Other liabilities |
|
|
8,764 |
|
|
|
6,609 |
|
|
|
|
|
|
|
|
|
|
|
|
|
|
|
|
|
|
|
|
|
|
| Total derivatives not designated as hedging instruments under ASC Topic 815 |
|
|
|
$ |
41,620 |
|
|
$ |
32,955 |
|
|
|
|
$ |
35,047 |
|
|
$ |
32,000 |
|
|
|
|
|
|
|
|
|
|
|
|
|
|
|
|
|
|
|
|
|
|
|
|
|
|
|
|
|
|
|
|
|
|
|
|
|
|
|
| (Dollars in thousands) |
|
Asset Derivatives
Notional Amount |
|
|
Liability Derivatives
Notional Amount |
|
| |
|
2012 |
|
|
2011 |
|
|
2012 |
|
|
2011 |
|
| Derivatives designated as hedging instruments under ASC Topic 815 |
|
|
|
|
|
|
|
|
|
|
|
|
|
|
|
|
| Interest rate contracts |
|
$ |
35,000 |
|
|
$ |
10,000 |
|
|
$ |
35,000 |
|
|
$ |
60,000 |
|
|
|
|
|
|
|
|
|
|
|
|
|
|
|
|
|
|
| Total derivatives designated as hedging instruments under ASC Topic 815 |
|
$ |
35,000 |
|
|
$ |
10,000 |
|
|
$ |
35,000 |
|
|
$ |
60,000 |
|
|
|
|
|
|
| Derivatives not designated as hedging instruments under ASC Topic 815 |
|
|
|
|
|
|
|
|
|
|
|
|
|
|
|
|
| Interest rate contracts |
|
$ |
374,536 |
|
|
$ |
293,794 |
|
|
$ |
374,536 |
|
|
$ |
293,794 |
|
| Forward sales contracts |
|
|
212,028 |
|
|
|
— |
|
|
|
53,269 |
|
|
|
— |
|
| Written and purchased options |
|
|
388,793 |
|
|
|
158,164 |
|
|
|
185,885 |
|
|
|
158,164 |
|
|
|
|
|
|
|
|
|
|
|
|
|
|
|
|
|
|
| Total derivatives not designated as hedging instruments under ASC Topic 815 |
|
$ |
975,357 |
|
|
$ |
451,958 |
|
|
$ |
613,690 |
|
|
$ |
451,958 |
|
|
|
|
|
|
|
|
|
|
|
|
|
|
|
|
|
|
At December 31, 2012 and 2011, the Company was required to post $2,650,000 and $1,210,000 in cash as collateral for
its derivative transactions, which is included in interest-bearing deposits in banks on the Company’s consolidated balance sheets. The Company does not anticipate additional assets will be required to be posted as collateral, nor does it
believe additional assets would be required to settle its derivative instruments immediately if contingent features were triggered at December 31, 2012. As permitted by generally-accepted accounting principles, the Company does not offset fair
value amounts recognized for the right to reclaim cash collateral or the obligation to return cash collateral against recognized fair value amounts of derivatives executed with the same counterparty under a master netting agreement.
43
During the years ended December 31, 2012 and 2011, the Company has not reclassified into earnings any
gain or loss as a result of the discontinuance of cash flow hedges because it was probable the original forecasted transaction would not occur by the end of the originally specified term.
At December 31, 2012, the fair value of derivatives that will mature within the next twelve months is $788,000. The Company does not expect to reclassify any amount from accumulated other
comprehensive income into interest income over the next twelve months for derivatives that will be settled.
At December 31, 2012 and
2011, and for the years then ended, the information pertaining to the effect of the hedging instruments on the consolidated financial statements is as follows.
|
|
|
|
|
|
|
|
|
|
|
|
|
|
|
|
|
|
|
|
|
|
|
|
|
|
|
|
|
| (Dollars in thousands) |
|
Amount of
Gain (Loss)
Recognized in
OCI, net of
taxes
(Effective Portion) |
|
|
Location of
Gain (Loss)
Reclassified from
Accumulated
OCI into
Income
(Effective Portion) |
|
Amount of
Gain (Loss)
Reclassified from
Accumulated OCI
into
Income (Effective Portion) |
|
|
Location of Gain
(Loss) Recognized in
Income on
Derivative
(Ineffective
Portion
and Amount
Excluded from
Effectiveness
Testing) |
|
Amount of Gain
(Loss) Recognized in
Income on Derivative
(Ineffective
Portion
and Amount Excluded
from Effectiveness
Testing) |
|
| Derivatives in ASC Topic 815 Cash Flow Hedging Relationships |
|
2012 |
|
|
2011 |
|
|
|
|
2012 |
|
|
2011 |
|
|
|
|
2012 |
|
|
2011 |
|
| Interest rate contracts |
|
$ |
(874 |
) |
|
$ |
(1,911 |
) |
|
Other income (expense) |
|
$ |
(1,618 |
) |
|
$ |
(1,723 |
) |
|
Other income (expense) |
|
$ |
— |
|
|
$ |
— |
|
|
|
|
|
|
|
|
|
|
|
|
|
|
|
|
|
|
|
|
|
|
|
|
|
|
|
|
|
|
| Total |
|
$ |
(874 |
) |
|
$ |
(1,911 |
) |
|
|
|
$ |
(1,618 |
) |
|
$ |
(1,723 |
) |
|
|
|
$ |
— |
|
|
$ |
— |
|
|
|
|
|
|
|
|
|
|
|
|
|
|
|
|
|
|
|
|
|
|
|
|
|
|
|
|
|
|
|
|
|
|
|
|
|
|
|
|
|
| (Dollars in thousands) |
|
Location of Gain (Loss)
Recognized in Income
on Derivatives |
|
Amount of Gain (Loss) Recognized
in Income on Derivatives |
|
| Derivatives Not Designated as Hedging Instruments under ASC Topic 815 |
|
|
|
2012 |
|
|
2011 |
|
| Interest rate contracts |
|
Other income (expense) |
|
$ |
(1 |
) |
|
$ |
(2 |
) |
| Forward sales contracts |
|
Mortgage income |
|
|
2,431 |
|
|
|
— |
|
| Written and purchased options |
|
Mortgage income |
|
|
7,119 |
|
|
|
937 |
|
|
|
|
|
|
|
|
|
|
|
|
| Total |
|
|
|
$ |
9,549 |
|
|
$ |
935 |
|
|
|
|
|
|
|
|
|
|
|
|
At December 31, 2012 and 2011, additional information pertaining to outstanding interest rate swap agreements is as
follows:
|
|
|
|
|
|
|
|
|
| (Dollars in thousands) |
|
2012 |
|
|
2011 |
|
| Weighted average pay rate |
|
|
3.3 |
% |
|
|
3.8 |
% |
| Weighted average receive rate |
|
|
0.3 |
% |
|
|
0.3 |
% |
| Weighted average maturity in years |
|
|
7.1 |
|
|
|
6.8 |
|
| Unrealized gain (loss) relating to interest rate swaps |
|
$ |
(1,344 |
) |
|
$ |
(2,939 |
) |
NOTE 16 – INCOME TAXES
The provision for income tax expense consists of the following for the years ended December 31:
|
|
|
|
|
|
|
|
|
|
|
|
|
| (Dollars in thousands) |
|
2012 |
|
|
2011 |
|
|
2010 |
|
| Current expense |
|
$ |
44,125 |
|
|
$ |
33,116 |
|
|
$ |
28,562 |
|
| Deferred benefit |
|
|
(7,527 |
) |
|
|
(11,750 |
) |
|
|
(3,607 |
) |
| Tax credits |
|
|
(8,756 |
) |
|
|
(6,734 |
) |
|
|
(6,214 |
) |
| Tax benefits attributable to items charged to equity and goodwill |
|
|
654 |
|
|
|
2,349 |
|
|
|
1,250 |
|
|
|
|
|
|
|
|
|
|
|
|
|
|
| Total income tax expense |
|
$ |
28,496 |
|
|
$ |
16,981 |
|
|
$ |
19,991 |
|
|
|
|
|
|
|
|
|
|
|
|
|
|
44
There was a balance receivable of $7,830,000 and $21,580,000 for federal and state income taxes at
December 31, 2012 and 2011, respectively. The provision for federal income taxes differs from the amount computed by applying the federal income tax statutory rate of 35 percent on income from operations as indicated in the following analysis
for the years ended December 31:
|
|
|
|
|
|
|
|
|
|
|
|
|
| (Dollars in thousands) |
|
2012 |
|
|
2011 |
|
|
2010 |
|
|
|
|
|
| Federal tax based on statutory rate |
|
$ |
36,712 |
|
|
$ |
24,682 |
|
|
$ |
24,086 |
|
| Increase (decrease) resulting from: |
|
|
|
|
|
|
|
|
|
|
|
|
| Effect of tax-exempt income |
|
|
(7,558 |
) |
|
|
(6,633 |
) |
|
|
(5,935 |
) |
| Interest and other nondeductible expenses |
|
|
1,847 |
|
|
|
1,487 |
|
|
|
1,295 |
|
| State taxes |
|
|
4,938 |
|
|
|
3,034 |
|
|
|
3,615 |
|
| Tax credits |
|
|
(8,756 |
) |
|
|
(6,734 |
) |
|
|
(6,214 |
) |
| Other |
|
|
1,313 |
|
|
|
1,145 |
|
|
|
3,144 |
|
|
|
|
|
|
|
|
|
|
|
|
|
|
| Total income tax expense |
|
$ |
28,496 |
|
|
$ |
16,981 |
|
|
$ |
19,991 |
|
|
|
|
|
| Effective rate |
|
|
27.2 |
% |
|
|
24.1 |
% |
|
|
29.1 |
% |
The net deferred tax liability at December 31, 2012 and 2011 is as follows:
|
|
|
|
|
|
|
|
|
| (Dollars in thousands) |
|
2012 |
|
|
2011 |
|
|
|
|
| Deferred tax asset: |
|
|
|
|
|
|
|
|
| Allowance for credit losses |
|
$ |
78,817 |
|
|
$ |
56,684 |
|
| Discount on purchased loans |
|
|
158 |
|
|
|
153 |
|
| Deferred compensation |
|
|
5,193 |
|
|
|
1,727 |
|
| Investments acquired |
|
|
— |
|
|
|
395 |
|
| Unrealized loss on cash flow hedges |
|
|
471 |
|
|
|
1,029 |
|
| Other |
|
|
38,886 |
|
|
|
25,381 |
|
|
|
|
|
|
|
|
|
|
| Subtotal |
|
|
123,525 |
|
|
|
85,369 |
|
|
|
|
| Deferred tax liability: |
|
|
|
|
|
|
|
|
| Basis difference in acquired assets |
|
|
(82,605 |
) |
|
|
(63,140 |
) |
| FHLB stock |
|
|
(19 |
) |
|
|
(111 |
) |
| Premises and equipment |
|
|
(13,050 |
) |
|
|
(15,580 |
) |
| Acquisition intangibles |
|
|
(11,267 |
) |
|
|
(7,310 |
) |
| Deferred loan costs |
|
|
(3,405 |
) |
|
|
(1,732 |
) |
| Unrealized gain on investments classified as available for sale |
|
|
(13,650 |
) |
|
|
(14,197 |
) |
| Investments acquired |
|
|
(224 |
) |
|
|
— |
|
| Swap gain |
|
|
(2 |
) |
|
|
— |
|
| Other |
|
|
(14,300 |
) |
|
|
(11,584 |
) |
|
|
|
|
|
|
|
|
|
| Subtotal |
|
|
(138,522 |
) |
|
|
(113,654 |
) |
|
|
|
| Deferred tax liability, net |
|
$ |
(14,997 |
) |
|
$ |
(28,285 |
) |
|
|
|
|
|
|
|
|
|
Retained earnings at December 31, 2012 and 2011 included approximately $21,864,000 accumulated prior to
January 1, 1987 for which no provision for federal income taxes has been made. If this portion of retained earnings is used in the future for any purpose other than to absorb bad debts, it will be added to future taxable income.
The Company does not believe it has any unrecognized tax benefits included in its consolidated financial statements. The Company has not had any
settlements in the current period with taxing authorities, nor has it recognized tax benefits as a result of a lapse of the applicable statute of limitations.
During the years ended December 31, 2012, 2011, and 2010, the Company did not recognize any interest or penalties in its consolidated financial statements, nor has it recorded an accrued liability
for interest or penalty payments.
45
NOTE 17 – SHAREHOLDERS’ EQUITY AND OTHER COMPREHENSIVE INCOME
Other Comprehensive income
The following is a summary of the tax effects of each component of other comprehensive income for the years ended December 31 for the periods indicated:
|
|
|
|
|
|
|
|
|
|
|
|
|
| |
|
2012 |
|
| (Dollars in thousands) |
|
Before-Tax
Amount |
|
|
Tax
(Expense)
Benefit |
|
|
Net-of-Tax
Amount |
|
|
|
|
|
| Unrealized gain on securities: |
|
|
|
|
|
|
|
|
|
|
|
|
| Unrealized holding losses arising during the period |
|
$ |
2,174 |
|
|
$ |
(761 |
) |
|
$ |
1,413 |
|
| Other-than-temporary impairment realized in net income |
|
|
— |
|
|
|
— |
|
|
|
— |
|
| Less: reclassification adjustment for gains included in net income |
|
|
(3,739 |
) |
|
|
1,308 |
|
|
|
(2,431 |
) |
|
|
|
|
|
|
|
|
|
|
|
|
|
| Net unrealized losses |
|
|
(1,565 |
) |
|
|
547 |
|
|
|
(1,018 |
) |
|
|
|
|
| Fair value of derivative instruments designated as cash flow hedges |
|
|
|
|
|
|
|
|
|
|
|
|
| Change in fair value of derivative instruments designated as cash flow hedges during the period |
|
$ |
(22 |
) |
|
$ |
8 |
|
|
$ |
(14 |
) |
| Less: reclassification adjustment for losses included in net income |
|
|
1,618 |
|
|
|
(566 |
) |
|
|
1,052 |
|
|
|
|
|
|
|
|
|
|
|
|
|
|
| Fair value of derivative instruments designated as cash flow hedges |
|
|
1,596 |
|
|
|
(558 |
) |
|
|
1,038 |
|
|
|
|
|
|
|
|
|
|
|
|
|
|
| Total other comprehensive income |
|
$ |
31 |
|
|
$ |
(11 |
) |
|
$ |
20 |
|
|
|
|
|
|
|
|
|
|
|
|
|
|
|
|
|
|
|
|
|
|
|
|
|
|
|
| |
|
2011 |
|
| (Dollars in thousands) |
|
Before-Tax
Amount |
|
|
Tax
(Expense)
Benefit |
|
|
Net-of-Tax
Amount |
|
|
|
|
|
| Unrealized gain on securities: |
|
|
|
|
|
|
|
|
|
|
|
|
| Unrealized holding gains arising during the period |
|
$ |
36,328 |
|
|
$ |
(12,714 |
) |
|
$ |
23,613 |
|
| Other-than-temporary impairment realized in net income |
|
|
(509 |
) |
|
|
178 |
|
|
|
(331 |
) |
| Less: reclassification adjustment for gains included in net income |
|
|
(3,422 |
) |
|
|
1,198 |
|
|
|
(2,224 |
) |
|
|
|
|
|
|
|
|
|
|
|
|
|
| Net unrealized gains |
|
|
32,397 |
|
|
|
(11,339 |
) |
|
|
21,058 |
|
|
|
|
|
| Fair value of derivative instruments designated as cash flow hedges |
|
|
|
|
|
|
|
|
|
|
|
|
| Change in fair value of derivative instruments designated as cash flow hedges during the period |
|
$ |
(19,078 |
) |
|
$ |
6,677 |
|
|
$ |
(12,401 |
) |
| Less: reclassification adjustment for losses (gains) included in net income |
|
|
1,723 |
|
|
|
(603 |
) |
|
|
1,120 |
|
|
|
|
|
|
|
|
|
|
|
|
|
|
| Fair value of derivative instruments designated as cash flow hedges |
|
|
(17,355 |
) |
|
|
6,074 |
|
|
|
(11,281 |
) |
|
|
|
|
|
|
|
|
|
|
|
|
|
| Total other comprehensive income |
|
$ |
15,042 |
|
|
$ |
(5,265 |
) |
|
$ |
9,777 |
|
|
|
|
|
|
|
|
|
|
|
|
|
|
46
|
|
|
|
|
|
|
|
|
|
|
|
|
| |
|
2010 |
|
| (Dollars in thousands) |
|
Before-Tax
Amount |
|
|
Tax
(Expense)
Benefit |
|
|
Net-of-Tax
Amount |
|
|
|
|
|
| Unrealized gain on securities: |
|
|
|
|
|
|
|
|
|
|
|
|
| Unrealized holding losses arising during the period |
|
$ |
(2,103 |
) |
|
$ |
736 |
|
|
$ |
(1,367 |
) |
| Other-than-temporary impairment realized in net income |
|
|
(517 |
) |
|
|
180 |
|
|
|
(337 |
) |
| Less: reclassification adjustment for gains included in net income |
|
|
(5,172 |
) |
|
|
1,810 |
|
|
|
(3,362 |
) |
|
|
|
|
|
|
|
|
|
|
|
|
|
| Net unrealized losses |
|
|
(7,792 |
) |
|
|
2,726 |
|
|
|
(5,066 |
) |
|
|
|
|
| Fair value of derivative instruments designated as cash flow hedges |
|
|
|
|
|
|
|
|
|
|
|
|
| Change in fair value of derivative instruments designated as cash flow hedges during the period |
|
$ |
(5,751 |
) |
|
$ |
2,013 |
|
|
$ |
(3,738 |
) |
| Less: reclassification adjustment for losses (gains) included in net income |
|
|
1,643 |
|
|
|
(575 |
) |
|
|
1,068 |
|
|
|
|
|
|
|
|
|
|
|
|
|
|
| Fair value of derivative instruments designated as cash flow hedges |
|
|
(4,108 |
) |
|
|
1,438 |
|
|
|
(2,670 |
) |
|
|
|
|
|
|
|
|
|
|
|
|
|
| Total other comprehensive income |
|
$ |
(11,900 |
) |
|
$ |
4,164 |
|
|
$ |
(7,736 |
) |
|
|
|
|
|
|
|
|
|
|
|
|
|
Treasury share repurchases
Share repurchases may be made from time to time, on the open market or in privately negotiated transactions. Such repurchases are authorized by the Board of Directors through a share repurchase program
and are executed at the discretion of the management of the Company. The approved share repurchase program does not obligate the Company to repurchase any dollar amount or number of shares, and the program may be extended, modified, suspended, or
discontinued at any time. Stock repurchases generally are affected through open market purchases, and may be made through unsolicited negotiated transactions. The timing of these repurchases will depend on market conditions and other requirements.
In October 2011, the Board of Directors authorized the repurchase of up to 900,000 shares of common stock. The following table details these
purchases during 2012 and is based on the settlement date of the transactions. The average price paid per share includes commissions paid. No shares were repurchased during the months not presented in the table.
|
|
|
|
|
|
|
|
|
|
|
|
|
|
|
|
|
| Period |
|
Total Number
of
Shares
Purchased |
|
|
Average Price
Paid
Per
Share |
|
|
Total Number of
Shares Purchased as
Part of Publicly
Announced
Plan |
|
|
Maximum
Number of
Shares
Available for Purchase
Pursuant to Publicly
Announced Plan |
|
|
|
|
|
|
| June 1-30 |
|
|
48,188 |
|
|
$ |
47.93 |
|
|
|
48,188 |
|
|
|
851,812 |
|
| August 1-31 |
|
|
748,488 |
|
|
|
47.38 |
|
|
|
796,676 |
|
|
|
103,324 |
|
| September 1-30 |
|
|
56,632 |
|
|
|
46.97 |
|
|
|
853,308 |
|
|
|
46,692 |
|
|
|
|
|
|
|
|
|
|
|
|
|
|
|
|
|
|
| Total |
|
|
853,308 |
|
|
$ |
47.38 |
|
|
|
853,308 |
|
|
|
46,692 |
|
|
|
|
|
|
|
|
|
|
|
|
|
|
|
|
|
|
NOTE 18 – CAPITAL REQUIREMENTS AND OTHER REGULATORY MATTERS
The Company and IBERIABANK are subject to various regulatory capital requirements administered by the federal and state banking
agencies. Failure to meet minimum capital requirements can initiate certain mandatory and possibly additional discretionary actions by regulators that, if undertaken, could have a direct material effect on the Company’s financial statements.
Under capital adequacy guidelines and the regulatory framework for prompt corrective action, the Company and IBERIABANK must meet specific capital guidelines that involve quantitative measures of their assets, liabilities and certain off-balance
sheet items as calculated under regulatory accounting practices. The capital amounts and classification are also subject to qualitative judgments by the regulators about components, risk weightings and other factors. Prompt corrective action
provisions are not applicable to bank holding companies.
Quantitative measures established by regulation to ensure capital adequacy require
the Company and IBERIABANK to maintain minimum amounts and ratios of total and Tier 1 capital to risk-weighted assets and of Tier 1 capital to average assets. Management believes, as of December 31, 2012 and 2011, that the Company and
IBERIABANK met all capital adequacy requirements to which they are subject.
47
As of December 31, 2012, the most recent notification from the Federal Deposit Insurance Corporation
categorized IBERIABANK as well capitalized under the regulatory framework for prompt corrective action. To be categorized as well capitalized, an institution must maintain minimum total risk-based, Tier 1 risk-based and Tier 1 leverage ratios as set
forth in the following table. There are no conditions or events since the notification that management believes have changed either entity’s category. The Company’s and IBERIABANK’s actual capital amounts and ratios as of
December 31, 2012 and 2011 are presented in the following table.
|
|
|
|
|
|
|
|
|
|
|
|
|
|
|
|
|
|
|
|
|
|
|
|
|
| |
|
Actual |
|
|
Minimum |
|
|
Well Capitalized |
|
| (Dollars in thousands) |
|
Amount |
|
|
Ratio |
|
|
Amount |
|
|
Ratio |
|
|
Amount |
|
|
Ratio |
|
| December 31, 2012 |
|
|
|
|
|
|
|
|
|
|
|
|
|
|
|
|
|
|
| Tier 1 leverage capital: |
|
|
|
|
|
|
|
|
|
|
|
|
|
|
|
|
|
|
|
|
|
|
|
|
| IBERIABANK Corporation |
|
$ |
1,185,144 |
|
|
|
9.70 |
% |
|
$ |
488,803 |
|
|
|
4.00 |
% |
|
|
N/A |
|
|
|
N/A |
% |
| IBERIABANK |
|
|
1,041,540 |
|
|
|
8.57 |
|
|
|
486,307 |
|
|
|
4.00 |
|
|
|
607,884 |
|
|
|
5.00 |
|
|
|
|
|
|
|
|
| Tier 1 risk-based capital: |
|
|
|
|
|
|
|
|
|
|
|
|
|
|
|
|
|
|
|
|
|
|
|
|
| IBERIABANK Corporation |
|
|
1,185,144 |
|
|
|
12.92 |
|
|
|
366,792 |
|
|
|
4.00 |
|
|
|
N/A |
|
|
|
N/A |
|
| IBERIABANK |
|
|
1,041,540 |
|
|
|
11.41 |
|
|
|
365,230 |
|
|
|
4.00 |
|
|
|
547,845 |
|
|
|
6.00 |
|
|
|
|
|
|
|
|
| Total risk-based capital: |
|
|
|
|
|
|
|
|
|
|
|
|
|
|
|
|
|
|
|
|
|
|
|
|
| IBERIABANK Corporation |
|
|
1,301,498 |
|
|
|
14.19 |
|
|
|
733,583 |
|
|
|
8.00 |
|
|
|
N/A |
|
|
|
N/A |
|
| IBERIABANK |
|
|
1,157,412 |
|
|
|
12.68 |
|
|
|
730,461 |
|
|
|
8.00 |
|
|
|
913,076 |
|
|
|
10.00 |
|
|
|
|
|
|
|
|
| December 31, 2011 |
|
|
|
|
|
|
|
|
|
|
|
|
|
|
|
|
|
|
| Tier 1 leverage capital: |
|
|
|
|
|
|
|
|
|
|
|
|
|
|
|
|
|
|
|
|
|
|
|
|
| IBERIABANK Corporation |
|
$ |
1,164,801 |
|
|
|
10.45 |
% |
|
$ |
445,905 |
|
|
|
4.00 |
% |
|
$ |
N/A |
|
|
|
N/A |
% |
| IBERIABANK |
|
|
997,277 |
|
|
|
9.00 |
|
|
|
443,165 |
|
|
|
4.00 |
|
|
|
553,956 |
|
|
|
5.00 |
|
|
|
|
|
|
|
|
| Tier 1 risk-based capital: |
|
|
|
|
|
|
|
|
|
|
|
|
|
|
|
|
|
|
|
|
|
|
|
|
| IBERIABANK Corporation |
|
|
1,164,801 |
|
|
|
14.94 |
|
|
|
311,908 |
|
|
|
4.00 |
|
|
|
N/A |
|
|
|
N/A |
|
| IBERIABANK |
|
|
997,277 |
|
|
|
12.88 |
|
|
|
309,802 |
|
|
|
4.00 |
|
|
|
464,703 |
|
|
|
6.00 |
|
|
|
|
|
|
|
|
| Total risk-based capital: |
|
|
|
|
|
|
|
|
|
|
|
|
|
|
|
|
|
|
|
|
|
|
|
|
| IBERIABANK Corporation |
|
|
1,263,496 |
|
|
|
16.20 |
|
|
|
623,816 |
|
|
|
8.00 |
|
|
|
N/A |
|
|
|
N/A |
|
| IBERIABANK |
|
|
1,095,322 |
|
|
|
14.14 |
|
|
|
619,604 |
|
|
|
8.00 |
|
|
|
774,505 |
|
|
|
10.00 |
|
In June 2012, the Board of Governors of the Federal Reserve System (the “Federal Reserve”) approved three
related notices of proposed rulemaking (the “NPRs”) relating to implementation of minimum capital requirements and a capital conservation buffer reflecting requirements of the Dodd-Frank Wall Street Reform and Consumer Protection Act
(“Dodd-Frank Act”) and the Basel III international capital standards. The three NPRs are expected to be published jointly by the Federal Reserve, the FDIC, and the Office of the Comptroller of Currency after each agency has completed its
approval process. If approved as proposed, the NPRs would be effective over a phased-in period from 2013 to 2019. The Company is in the process of evaluating the impact of the proposed rules on the Company and IBERIABANK.
48
NOTE 19 – SHARE-BASED COMPENSATION
The Company has various types of share-based compensation plans. These plans are administered by the Compensation Committee of the
Board of Directors, which selects persons eligible to receive awards and determines the number of shares and/or options subject to each award, the terms, conditions and other provisions of the awards. During the years ended December 31, 2012, 2011,
and 2010, the Company did not have any equity awards that were settled in cash.
Stock option plans
The Company issues stock options under various plans to directors, officers and other key employees. The option exercise price cannot be less than the
fair value of the underlying common stock as of the date of the option grant and the maximum option term cannot exceed ten years. The stock options granted were issued with vesting periods ranging from one-and-a half to seven years. At
December 31, 2012, future option or restricted stock awards of 688,943 shares could be made under approved incentive compensation plans.
The following table represents the compensation expense that is included in salaries and employee benefits expense and related income tax benefits in the
accompanying consolidated statements of comprehensive income related to stock options for the years indicated below.
|
|
|
|
|
|
|
|
|
|
|
|
|
| (Dollars in thousands, except per share data) |
|
2012 |
|
|
2011 |
|
|
2010 |
|
| Compensation expense related to stock options |
|
$ |
1,873 |
|
|
$ |
1,343 |
|
|
$ |
1,301 |
|
| Income tax benefit related to stock options |
|
|
656 |
|
|
|
470 |
|
|
|
455 |
|
| Impact on basic earnings per share |
|
|
0.04 |
|
|
|
0.03 |
|
|
|
0.03 |
|
| Impact on diluted earnings per share |
|
|
0.04 |
|
|
|
0.03 |
|
|
|
0.03 |
|
The Company reported $1,221,000, $1,454,000 and $637,000 of excess tax benefits as financing cash inflows during the
years ended December 31, 2012, 2011, and 2010, respectively, related to the exercise and vesting of stock options. Net cash proceeds from the exercise of stock options were $2,813,000, $6,807,000 and $1,631,000 for the years ended
December 31, 2012, 2011, and 2010, respectively.
The Company uses the Black-Scholes option pricing model to
estimate the fair value of share-based awards. The following weighted-average assumptions were used for option awards granted during the years ended December 31st of the periods indicated:
|
|
|
|
|
|
|
|
|
|
|
|
|
| |
|
2012 |
|
|
2011 |
|
|
2010 |
|
| Expected dividends |
|
|
2.7 |
% |
|
|
2.4 |
% |
|
|
2.3 |
% |
| Expected volatility |
|
|
40.1 |
% |
|
|
35.5 |
% |
|
|
39.3 |
% |
| Risk-free interest rate |
|
|
0.8 |
% |
|
|
1.5 |
% |
|
|
2.3 |
% |
| Expected term (in years) |
|
|
5.0 |
|
|
|
4.0 |
|
|
|
5.0 |
|
| Weighted-average grant-date fair value |
|
$ |
14.50 |
|
|
$ |
12.83 |
|
|
$ |
18.11 |
|
The assumptions above are based on multiple factors, including historical stock option exercise patterns and post-vesting
employment termination behaviors, expected future exercise patterns and the expected volatility of the Company’s stock price.
At
December 31, 2012, there was $5,174,000 of unrecognized compensation cost related to stock options which is expected to be recognized over a weighted-average period of 4.7 years.
49
The following table represents the activity related to stock options during the periods indicated.
|
|
|
|
|
|
|
|
|
|
|
| |
|
Number of shares |
|
|
Weighted
average
exercise price |
|
|
Weighted average
remaining contract
life |
| Outstanding options, December 31, 2009 |
|
|
1,259,874 |
|
|
$ |
43.05 |
|
|
|
| Granted |
|
|
120,866 |
|
|
|
59.67 |
|
|
|
| Exercised |
|
|
(69,057 |
) |
|
|
23.62 |
|
|
|
| Forfeited or expired |
|
|
(10,144 |
) |
|
|
56.57 |
|
|
|
|
|
|
|
|
|
|
|
|
|
|
| Outstanding options, December 31, 2010 |
|
|
1,301,539 |
|
|
$ |
45.52 |
|
|
|
| Granted |
|
|
55,121 |
|
|
|
55.15 |
|
|
|
| Issued in connection with acquisition |
|
|
41,975 |
|
|
|
72.35 |
|
|
|
| Exercised |
|
|
(264,647 |
) |
|
|
30.99 |
|
|
|
| Forfeited or expired |
|
|
(36,368 |
) |
|
|
57.51 |
|
|
|
|
|
|
|
|
|
|
|
|
|
|
| Outstanding options, December 31, 2011 |
|
|
1,097,620 |
|
|
$ |
50.14 |
|
|
|
| Granted |
|
|
230,665 |
|
|
|
51.69 |
|
|
|
| Issued in connection with acquisition |
|
|
32,863 |
|
|
|
41.30 |
|
|
|
| Exercised |
|
|
(92,092 |
) |
|
|
30.43 |
|
|
|
| Forfeited or expired |
|
|
(32,981 |
) |
|
|
56.79 |
|
|
|
|
|
|
|
|
|
|
|
|
|
|
| Outstanding options, December 31, 2012 |
|
|
1,236,075 |
|
|
$ |
51.48 |
|
|
4.7 Years |
|
|
|
|
| Outstanding exercisable at December 31, 2010 |
|
|
938,532 |
|
|
$ |
41.12 |
|
|
|
|
|
|
|
| Outstanding exercisable at December 31, 2011 |
|
|
789,952 |
|
|
$ |
47.64 |
|
|
|
|
|
|
|
| Outstanding exercisable at December 31, 2012 |
|
|
792,444 |
|
|
$ |
50.05 |
|
|
3.0 Years |
The following table presents weighted average remaining life as of December 31, 2012 for options outstanding within
the stated exercise prices:
|
|
|
|
|
|
|
|
|
|
|
|
|
|
|
|
|
|
|
|
|
| |
|
|
Options Outstanding |
|
Options Exercisable |
|
Exercise Price
Range Per Share |
|
|
Number of
Options |
|
|
Weighted
Average
Exercise Price |
|
|
Weighted
Average
Remaining
Life |
|
Number
of Options |
|
|
Weighted
Average
Exercise Price |
|
| $ |
26.82 to $45.58 |
|
|
|
207,728 |
|
|
$ |
38.74 |
|
|
1.5 years |
|
|
205,871 |
|
|
$ |
38.71 |
|
| $ |
45.59 to $48.35 |
|
|
|
202,608 |
|
|
|
46.85 |
|
|
2.4 years |
|
|
188,217 |
|
|
|
46.85 |
|
| $ |
48.36 to $51.69 |
|
|
|
188,368 |
|
|
|
50.13 |
|
|
6.0 years |
|
|
81,276 |
|
|
|
49.08 |
|
| $ |
51.70 to $55.42 |
|
|
|
212,953 |
|
|
|
53.22 |
|
|
8.2 years |
|
|
51,946 |
|
|
|
54.43 |
|
| $ |
55.43 to $58.34 |
|
|
|
209,705 |
|
|
|
56.97 |
|
|
4.9 years |
|
|
130,710 |
|
|
|
57.28 |
|
| $ |
58.35 to $111.71 |
|
|
|
214,713 |
|
|
|
62.30 |
|
|
5.4 years |
|
|
134,424 |
|
|
|
63.74 |
|
| |
|
|
|
|
|
|
|
|
|
|
|
|
|
|
|
|
|
|
|
|
| |
Total options |
|
|
|
1,236,075 |
|
|
$ |
51.48 |
|
|
4.7 years |
|
|
792,444 |
|
|
$ |
50.05 |
|
| |
|
|
|
|
|
|
|
|
|
|
|
|
|
|
|
|
|
|
|
|
At December 31, 2012, the aggregate intrinsic value of shares underlying outstanding stock options and underlying
exercisable stock options was $2,647,000 and $2,600,000. Total intrinsic value of options exercised was $1,765,000, $6,783,000 and $2,314,000 for the years ended December 31, 2012, 2011, and 2010, respectively.
Restricted stock plans
The Company
issues restricted stock under various plans for certain officers and directors. A supplemental stock benefit plan adopted in 1999 and the 2001, 2005, 2008, and 2010 Incentive Plans allow grants of restricted stock. The plans allow for the issuance
of restricted stock awards that may not be sold or otherwise transferred until certain restrictions have lapsed. The holders of the restricted stock receive dividends and have the right to vote the shares. The fair value of the restricted stock
shares awarded under these plans is recorded as unearned share-based compensation, a contra-equity account. The unearned compensation related to these awards is amortized to compensation expense over the vesting period (generally three to seven
years). The total share-based compensation expense for these awards is determined based on the market price of the Company’s common stock at the date of grant applied to the total number of shares granted and is amortized over the vesting
period. As of December 31, 2012, unearned share-based compensation associated with these awards totaled $22,421,000.
50
The following table represents the compensation expense that was included in salaries and employee benefits
expense in the accompanying consolidated statements of income related to restricted stock grants for the years ended December 31:
|
|
|
|
|
|
|
|
|
|
|
|
|
| (Dollars in thousands) |
|
2012 |
|
|
2011 |
|
|
2010 |
|
| Compensation expense related to restricted stock |
|
$ |
7,582 |
|
|
$ |
6,784 |
|
|
$ |
6,187 |
|
The following table represents unvested restricted stock award activity for the years ended December 31:
|
|
|
|
|
|
|
|
|
|
|
|
|
| |
|
2012 |
|
|
2011 |
|
|
2010 |
|
| Balance, beginning of year |
|
|
512,112 |
|
|
|
539,195 |
|
|
|
550,518 |
|
| Granted |
|
|
176,669 |
|
|
|
139,509 |
|
|
|
122,123 |
|
| Forfeited |
|
|
(13,164 |
) |
|
|
(35,823 |
) |
|
|
(8,933 |
) |
| Earned and issued |
|
|
(137,415 |
) |
|
|
(130,769 |
) |
|
|
(124,513 |
) |
|
|
|
|
|
|
|
|
|
|
|
|
|
| Balance, end of year |
|
|
538,202 |
|
|
|
512,112 |
|
|
|
539,195 |
|
|
|
|
|
|
|
|
|
|
|
|
|
|
Phantom stock awards
As part of the 2008 Incentive Compensation Plan and 2009 Phantom Stock Plan, the Company issues phantom stock awards to certain key officers and employees. The award is subject to a vesting period of five
to seven years and is paid out in cash upon vesting. The amount paid per vesting period is calculated as the number of vested “share equivalents” multiplied by the closing market price of a share of the Company’s common stock on the
vesting date. Share equivalents are calculated on the date of grant as the total award’s dollar value divided by the closing market price of a share of the Company’s common stock on the grant date. Award recipients are also entitled to a
“dividend equivalent” on each unvested share equivalent held by the award recipient. A dividend equivalent is a dollar amount equal to the cash dividends that the participant would have been entitled to receive if the participant’s
share equivalents were issued in shares of common stock. Dividend equivalents will be deemed to be reinvested as share equivalents that will vest and be paid out on the same date as the underlying share equivalents on which the dividend equivalents
were paid. The number of share equivalents acquired with a dividend equivalent is determined by dividing the aggregate of dividend equivalents paid on the unvested share equivalents by the closing price of a share of the Company’s common stock
on the dividend payment date.
The following table represents phantom stock award activity during the periods indicated. During the years
ended December 31, 2012, 2011, and 2010, the Company recorded $2,185,000, $1,368,000 and $381,000, respectively, in compensation expense based on the number of share equivalents vested at the end of the period and the current market price of
the Company’s stock.
|
|
|
|
|
|
|
|
|
|
|
|
|
|
|
|
|
| |
|
Number of share
equivalents |
|
|
Dividend
equivalents |
|
|
Total share
equivalents |
|
|
Value of
share
equivalents(1) |
|
| Balance, December 31, 2009 |
|
|
67,361 |
|
|
|
1,886 |
|
|
|
69,247 |
|
|
|
3,726,000 |
|
| Granted |
|
|
58,124 |
|
|
|
2,847 |
|
|
|
60,971 |
|
|
|
3,605,000 |
|
| Forfeited share equivalents |
|
|
(1,250 |
) |
|
|
(9 |
) |
|
|
(1,259 |
) |
|
|
74,000 |
|
| Vested share equivalents |
|
|
(5,041 |
) |
|
|
(983 |
) |
|
|
(6,024 |
) |
|
|
356,000 |
|
|
|
|
|
|
|
|
|
|
|
|
|
|
|
|
|
|
|
|
|
|
|
| Balance, December 31, 2010 |
|
|
119,194 |
|
|
|
3,741 |
|
|
|
122,935 |
|
|
$ |
7,269,000 |
|
| Granted |
|
|
131,099 |
|
|
|
6,152 |
|
|
|
137,251 |
|
|
|
6,766,000 |
|
| Forfeited share equivalents |
|
|
(5,917 |
) |
|
|
(179 |
) |
|
|
(6,096 |
) |
|
|
301,000 |
|
| Vested share equivalents |
|
|
(11,455 |
) |
|
|
(772 |
) |
|
|
(12,227 |
) |
|
|
622,000 |
|
|
|
|
|
|
|
|
|
|
|
|
|
|
|
|
|
|
|
|
|
|
|
| Balance, December 31, 2011 |
|
|
232,921 |
|
|
|
8,942 |
|
|
|
241,863 |
|
|
$ |
11,924,000 |
|
| Granted |
|
|
119,038 |
|
|
|
9,152 |
|
|
|
128,190 |
|
|
|
6,297,000 |
|
| Forfeited share equivalents |
|
|
(10,949 |
) |
|
|
(367 |
) |
|
|
(11,316 |
) |
|
|
556,000 |
|
| Vested share equivalents |
|
|
(22,281 |
) |
|
|
(1,692 |
) |
|
|
(23,973 |
) |
|
|
1,180,000 |
|
|
|
|
|
|
|
|
|
|
|
|
|
|
|
|
|
|
| Balance, December 31, 2012 |
|
|
318,729 |
|
|
|
16,035 |
|
|
|
334,764 |
|
|
$ |
16,444,000 |
|
|
|
|
|
|
|
|
|
|
|
|
|
|
|
|
|
|
| (1) |
Except for vested share payments, which are based on the cash paid at the time of vesting, the value of share equivalents is calculated based on the market price of the
Company’s stock at the end of the respective periods. The market price of the Company’s stock was $49.12, $49.30, and $59.13 on December 31, 2012, 2011, and 2010, respectively. |
401(k) profit sharing plan
The Company
has a 401(k) Profit Sharing Plan covering substantially all of its employees. Annual employer contributions to the plan are set by the Board of Directors. The Company made contributions of $1,299,000, $1,177,000, and $739,000 for the years ended
December 31, 2012, 2011, and 2010, respectively. The Plan provides, among other things, that participants in the Plan be able to direct the investment of their account balances within the Profit Sharing Plan into alternative investment funds.
Participant deferrals under the salary reduction election may be matched by the employer based on a percentage to be determined annually by the employer.
51
NOTE 20 – COMMITMENTS AND CONTINGENCIES
Off-balance sheet commitments
The Company is a party to financial instruments with off-balance sheet risk in the normal course of business to meet the financing needs of its customers. These financial instruments include commitments
to extend credit and standby letters of credit. Such commitments involve, to varying degrees, elements of credit and interest rate risk in excess of the amount recognized in the consolidated balance sheets. The same credit policies are used in these
commitments as for on-balance sheet instruments. The Company’s exposure to credit loss in the event of nonperformance by the other parties is represented by the contractual amount of the financial instruments. At December 31, 2012, the
fair value of guarantees under commercial and standby letters of credit was $622,000. This amount represents the unamortized fee associated with these guarantees and is included in the consolidated balance sheet of the Company. This fair value will
decrease over time as the existing commercial and standby letters of credit approach their expiration dates.
At December 31, 2012 and
2011, the Company had the following financial instruments outstanding, whose contract amounts represent credit risk:
|
|
|
|
|
|
|
|
|
| |
|
Contract Amount |
|
| (Dollars in thousands) |
|
2012 |
|
|
2011 |
|
| Commitments to grant loans |
|
$ |
192,295 |
|
|
$ |
243,458 |
|
| Unfunded commitments under lines of credit |
|
|
2,372,971 |
|
|
|
1,773,601 |
|
| Commercial and standby letters of credit |
|
|
62,207 |
|
|
|
49,530 |
|
Commitments to extend credit are agreements to lend to a customer as long as there is no violation of any condition
established in the contract. Commitments generally have fixed expiration dates or other termination clauses and may require payment of a fee. Since many of the commitments are expected to be drawn upon, the total commitment amounts generally
represent future cash requirements. The Company evaluates each customer’s creditworthiness on a case-by-case basis. The amount of collateral, if deemed necessary by the Company upon extension of credit, is based on management’s credit
evaluation of the counterparty.
Unfunded commitments under commercial lines-of-credit, revolving credit lines and overdraft protection
agreements are commitments for possible future extensions of credit to existing customers. Many of these types of commitments do not contain a specified maturity date and may not be drawn upon to the total extent to which the Company is committed.
Commercial and standby letters of credit are conditional commitments issued by the Company to guarantee the performance of a customer to a
third party. These guarantees are primarily issued to support public and private borrowing arrangements, including commercial paper issuance, bond financing, and similar transactions. The credit risk involved in issuing letters or credit is
essentially the same as that involved in extending loan facilities to customers and as such, are collateralized when necessary, generally in the form of marketable securities and cash equivalents.
Legal proceedings
The nature of the
business of the Company’s banking and other subsidiaries ordinarily results in a certain amount of claims, litigation, investigations and legal and administrative cases and proceedings, all of which are considered incidental to the normal
conduct of business. Some of these claims are against entities or assets of which the Company is a successor or acquired in business acquisitions, and certain of these claims will be covered by loss sharing agreements with the FDIC. The Company has
asserted defenses to these litigation claims and, with respect to such legal proceedings, intends to continue to defend itself vigorously, litigating or settling cases according to management’s judgment as to what is in the best interest of the
Company and its shareholders.
The Company assesses its liabilities and contingencies in connection with outstanding legal proceedings
utilizing the latest information available. Where it is probable that the Company will incur a loss and the amount of the loss can be reasonably estimated, the Company records a liability in its consolidated financial statements. These legal
reserves may be increased or decreased to reflect any relevant developments on a quarterly basis. Where a loss is not probable or the amount of loss is not estimable, the Company does not accrue legal reserves. While the outcome of legal proceedings
is inherently uncertain, based on information currently available, advice of counsel and available insurance coverage, the Company’s management believes that it has established appropriate legal reserves. Any liabilities arising from pending
legal proceedings are not expected to have a material adverse effect on the Company’s consolidated financial position, consolidated results of operations or consolidated cash flows. However, in the event of unexpected future developments, it is
possible that the ultimate resolution of these matters, if unfavorable, may be material to the Company’s consolidated financial position, consolidated results of operations or consolidated cash flows.
NOTE 21 – RELATED PARTY TRANSACTIONS
In the ordinary course of business, the Company has granted loans to executive officers and directors and their affiliates amounting to
$750,000 and $1,381,000 at December 31, 2012 and 2011, respectively. During the years ended December 31, 2012, 2011, and 2010, total principal additions were $252,000, $931,000, and $67,000, respectively. Total principal payments were
$883,000, $317,000, and $444,000 for the years ended December 31, 2012, 2011, and 2010, respectively. Unfunded commitments to executive officers and directors and their affiliates totaled $390,000 and $131,000 at December 31, 2012 and
2011, respectively. None of the related party loans were classified as nonaccrual, past due, restructured or potential problem loans at December 31, 2012 or 2011.
Deposits from related parties held by the Company through IBERIABANK at December 31, 2012 and 2011 amounted to $6,155,000 and $5,070,000, respectively.
52
NOTE 22 – FAIR VALUE MEASUREMENTS
The Company has segregated all financial assets and liabilities that are measured at fair value on a recurring basis into the most
appropriate level within the fair value hierarchy based on the inputs used to estimate the fair value at the measurement date in the tables below.
|
|
|
|
|
|
|
|
|
|
|
|
|
|
|
|
|
| (Dollars in thousands) |
|
|
|
|
Fair Value Measurements Using |
|
| Recurring Basis |
|
December 31, 2012 |
|
|
Quoted Prices in
Active Markets for
Identical
Assets
(Level 1) |
|
|
Significant
Other Observable
Inputs
(Level 2) |
|
|
Significant
Unobservable
Inputs
(Level 3) |
|
| Description |
|
|
|
|
| Assets |
|
|
|
|
|
|
|
|
|
|
|
|
|
|
|
|
| Available-for-sale securities |
|
$ |
1,745,004 |
|
|
$ |
— |
|
|
$ |
1,745,004 |
|
|
$ |
— |
|
| Derivative instruments |
|
|
42,119 |
|
|
|
— |
|
|
|
42,119 |
|
|
|
— |
|
|
|
|
|
|
|
|
|
|
|
|
|
|
|
|
|
|
| Total |
|
$ |
1,787,123 |
|
|
$ |
— |
|
|
$ |
1,787,123 |
|
|
$ |
— |
|
|
|
|
|
|
|
|
|
|
|
|
|
|
|
|
|
|
|
|
|
|
|
| Liabilities |
|
|
|
|
|
|
|
|
|
|
|
|
|
|
|
|
| Derivative instruments |
|
|
36,890 |
|
|
|
— |
|
|
|
36,890 |
|
|
|
— |
|
|
|
|
|
|
|
|
|
|
|
|
|
|
|
|
|
|
| Total |
|
$ |
36,890 |
|
|
$ |
— |
|
|
$ |
36,890 |
|
|
$ |
— |
|
|
|
|
|
|
|
|
|
|
|
|
|
|
|
|
|
|
|
|
|
|
|
|
|
|
|
|
|
|
|
|
|
|
|
| (Dollars in thousands) |
|
|
|
|
Fair Value Measurements Using |
|
| Recurring Basis |
|
December 31, 2011 |
|
|
Quoted Prices in
Active Markets for
Identical Assets
(Level 1) |
|
|
Significant
Other Observable
Inputs
(Level 2) |
|
|
Significant
Unobservable
Inputs
(Level 3) |
|
| Description |
|
|
|
|
| Assets |
|
|
|
|
|
|
|
|
|
|
|
|
|
|
|
|
| Available-for-sale securities |
|
$ |
1,805,205 |
|
|
$ |
— |
|
|
$ |
1,804,120 |
|
|
$ |
1,085 |
|
| Derivative instruments |
|
|
33,026 |
|
|
|
— |
|
|
|
33,026 |
|
|
|
— |
|
|
|
|
|
|
|
|
|
|
|
|
|
|
|
|
|
|
| Total |
|
$ |
1,838,231 |
|
|
$ |
— |
|
|
$ |
1,837,146 |
|
|
$ |
1,085 |
|
|
|
|
|
|
|
|
|
|
|
|
|
|
|
|
|
|
|
|
|
|
|
| Liabilities |
|
|
|
|
|
|
|
|
|
|
|
|
|
|
|
|
| Derivative instruments |
|
|
35,010 |
|
|
|
— |
|
|
|
35,010 |
|
|
|
— |
|
|
|
|
|
|
|
|
|
|
|
|
|
|
|
|
|
|
| Total |
|
$ |
35,010 |
|
|
$ |
— |
|
|
$ |
35,010 |
|
|
$ |
— |
|
|
|
|
|
|
|
|
|
|
|
|
|
|
|
|
|
|
During 2012, available for sale securities with a market value of $1,085,000 at December 31, 2011 were transferred
into the Level 2 fair value measurement category in the table above from the Level 3 category as disclosed at December 31, 2011. The security was issued by a municipal entity and was included in the Level 3 category at December 31, 2011
because their fair value was based on management’s estimate of the security’s fair value after recording an other-than-temporary impairment during the year ended December 31, 2011. At December 31, 2012, the fair value of this
security was based on a trade price for similar assets, namely a similar security.
53
Gains and losses (realized and unrealized) included in earnings (or changes in net assets) during 2012
related to assets and liabilities measured at fair value on a recurring basis are reported in noninterest income or other comprehensive income as follows:
|
|
|
|
|
|
|
|
|
| (Dollars in thousands) |
|
Noninterest income |
|
|
Other comprehensive
income |
|
| Total gains (losses) included in earnings (or changes in net assets) |
|
$ |
11,670 |
|
|
$ |
— |
|
|
|
|
| Change in unrealized gains (losses) relating to assets still held at December 31, 2012 |
|
|
— |
|
|
|
20 |
|
The Company has segregated all financial assets and liabilities that are measured at fair value on a nonrecurring basis
into the most appropriate level within the fair value hierarchy based on the inputs used to determine the fair value at the measurement date in the tables below.
|
|
|
|
|
|
|
|
|
|
|
|
|
|
|
|
|
| (Dollars in thousands) |
|
|
|
|
Fair Value Measurements Using |
|
| Nonrecurring Basis |
|
December 31, 2012 |
|
|
Quoted Prices in
Active Markets for
Identical Assets
(Level 1) |
|
|
Significant
Other Observable
Inputs
(Level 2) |
|
|
Significant
Unobservable
Inputs
(Level 3) |
|
| Description |
|
|
|
|
| Assets |
|
|
|
|
|
|
|
|
|
|
|
|
|
|
|
|
| Loans |
|
$ |
6,388 |
|
|
$ |
— |
|
|
$ |
6,388 |
|
|
$ |
— |
|
| Mortgage loans held for sale |
|
|
32,753 |
|
|
|
— |
|
|
|
32,753 |
|
|
|
— |
|
| OREO |
|
|
20,427 |
|
|
|
— |
|
|
|
20,427 |
|
|
|
— |
|
|
|
|
|
|
|
|
|
|
|
|
|
|
|
|
|
|
| Total |
|
$ |
59,568 |
|
|
$ |
— |
|
|
$ |
59,568 |
|
|
$ |
— |
|
|
|
|
|
|
|
|
|
|
|
|
|
|
|
|
|
|
|
|
|
|
|
|
|
|
|
|
|
|
|
|
|
|
|
| (Dollars in thousands) |
|
|
|
|
Fair Value Measurements Using |
|
| Nonrecurring Basis |
|
December 31, 2011 |
|
|
Quoted Prices in
Active Markets for
Identical
Assets
(Level 1) |
|
|
Significant
Other Observable
Inputs
(Level 2) |
|
|
Significant
Unobservable
Inputs
(Level 3) |
|
| Description |
|
|
|
|
| Assets |
|
|
|
|
|
|
|
|
|
|
|
|
|
|
|
|
| Loans |
|
$ |
2,346 |
|
|
$ |
— |
|
|
$ |
2,346 |
|
|
$ |
— |
|
| OREO |
|
|
14,930 |
|
|
|
— |
|
|
|
14,930 |
|
|
|
— |
|
|
|
|
|
|
|
|
|
|
|
|
|
|
|
|
|
|
| Total |
|
$ |
17,276 |
|
|
$ |
— |
|
|
$ |
17,276 |
|
|
$ |
— |
|
|
|
|
|
|
|
|
|
|
|
|
|
|
|
|
|
|
The tables above exclude the initial measurement of assets and liabilities that were acquired as part of the Florida
Gulf, OMNI, Cameron, and Florida Trust Company acquisitions completed in 2012 and 2011. These assets and liabilities were recorded at their fair value upon acquisition in accordance with generally-accepted accounting principles and were not
re-measured during the periods presented unless specifically required by generally accepted accounting principles. Acquisition date fair values represent either Level 2 fair value measurements (investment securities, OREO, property, equipment, and
debt) or Level 3 fair value measurements (loans, deposits and core deposit intangible asset).
In accordance with the provisions of ASC Topic
310, the Company records loans considered impaired at their estimated fair value. A loan is considered impaired if it is probable the Company will be unable to collect all amounts due according to the contractual terms of the loan agreement. Fair
value is measured at the estimated fair value of the collateral for collateral-dependent loans. Impaired non-covered loans with an outstanding balance of $7,269,000 were recorded at their fair value at December 31, 2012. These loans include a
reserve of $880,000 included in the Company’s allowance for credit losses at December 31, 2012. Impaired non-covered loans with an outstanding balance of $4,532,000 were recorded at their fair value at December 31, 2011. These loans
include a reserve of $2,186,000 included in the Company’s allowance for credit losses at December 31, 2011.
During the second
quarter of 2012, the Company announced plans to close ten branches during the third and fourth quarters of 2012 as part of its business strategy. The Company has notified customers of these branches and has received the required regulatory approvals
to proceed with closure. Seven of the branches are located in Florida, two in Louisiana, and one in Arkansas. Five of these branches are owned by the Company, and five of the branches are leased under operating lease agreements. The five branches
owned by the Company had a book value of $7,778,000 at the time of the announcement. The Company reviewed the carrying amount of the owned properties and concluded it exceeded the fair value of these branches at that date. As a result, the Company
recorded an impairment loss in other noninterest expense of $2,743,000 in its consolidated statement of comprehensive income for year ended December 31, 2012. After the impairment loss, the carrying value of the branches was $4,214,000 and is
included in other real estate owned (as real estate acquired for development or resale), a component of other assets on the consolidated balance sheet.
54
Fair value of the branches was based on a third-party broker opinion of value using both a comparable sales
and cash flow approach. The Company did not modify the third-party pricing information for unobservable inputs.
The Company did not record
any liabilities at fair value for which measurement of the fair value was made on a nonrecurring basis during the years ended December 31, 2012 and 2011.
The Company may elect the fair value option, which permits the Company to choose to measure eligible financial assets and liabilities at fair value at specified election dates and recognize prospective
changes in unrealized gains and losses on items for which the fair value option has been elected in earnings at each reporting date. The Company has currently chosen not to elect the fair value option for any items that are not already required to
be measured at fair value in accordance with generally accepted accounting principles, and as such has not included any gains or losses in earnings for years ended December 31, 2012 and 2011.
NOTE 23 – FAIR VALUE OF FINANCIAL INSTRUMENTS
The estimated fair value of a financial instrument is the current amount that would be exchanged between willing parties, other than in
a forced liquidation. Fair value is best determined based upon quoted market prices. However, in many instances, there are no quoted market prices for the Company’s various financial instruments. In cases where quoted market prices are not
available, fair values are based on estimates using present value or other valuation techniques. Those techniques are significantly affected by the assumptions used, including the discount rate and estimates of future cash flows. Accordingly, the
fair value estimates may not be realized in an immediate settlement of the instrument. ASC Topic 825 excludes certain financial instruments and all non-financial instruments from its disclosure requirements. Accordingly, the aggregate fair value
amounts presented may not necessarily represent the underlying fair value of the Company.
The following methods and assumptions were used to
estimate the fair value of each class of financial instruments for which it is practicable to estimate that value:
Cash and cash
equivalents
The carrying amounts of cash and cash equivalents approximate their fair value.
Investment securities
Securities are
classified within Level 1 where quoted market prices are available in an active market. If quoted market prices are unavailable, fair value is estimated using pricing models or quoted prices of securities with similar characteristics, at which point
the securities would be classified within Level 2 of the hierarchy. Inputs include securities that have quoted prices in active markets for identical assets.
Loans
The fair values of non-covered mortgage loans receivable are estimated based on
present values using entry-value rates (the interest rate that would be charged for a similar loan to a borrower with similar risk at the indicated balance sheet date) at December 31, 2012 and 2011, weighted for varying maturity dates. Other
non-covered loans receivable are valued based on present values using entry-value interest rates at December 31, 2012 and 2011 applicable to each category of loans, which would be classified within Level 3 of the hierarchy. Fair values of
mortgage loans held for sale are based on commitments on hand from investors or prevailing market prices. Covered loans are measured using projections of expected cash flows, exclusive of the shared-loss agreements with the FDIC. Fair value of the
covered loans included in the table below reflects the current fair value of these loans, which is based on an updated estimate of the projected cash flow as of the dates indicated. The fair value associated with the loans include estimates related
to expected prepayments and the amount and timing of undiscounted expected principal, interest and other cash flows, which also would be classified within Level 3 of the hierarchy.
Accrued Interest Receivable and Accrued Interest Payable: The carrying amount of accrued interest approximates fair value because of the short maturity of these financial instruments.
FDIC Loss Share Receivable: The fair value is determined using projected cash flows from loss sharing agreements based on expected reimbursements
for losses at the applicable loss sharing percentages based on the terms of the loss share agreements. Cash flows are discounted to reflect the timing and receipt of the loss sharing reimbursements from the FDIC. The fair value of the Company’s
FDIC loss share receivable would be categorized within Level 3 of the hierarchy.
Deposits
The fair values of NOW accounts, money market deposits and savings accounts are the amounts payable on demand at the reporting date. Certificates of
deposit were valued using a discounted cash flow model based on the weighted-average rate at December 31, 2012 and 2011 for deposits of similar remaining maturities. The fair value of the Company’s deposits would therefore be categorized
within Level 3 of the fair value hierarchy.
Short-term borrowings
The carrying amounts of short-term borrowings maturing within ninety days approximate their fair values.
55
Long-term debt
The fair values of long-term debt are estimated using discounted cash flow analyses based on the Company’s current incremental borrowing rates for similar types of borrowing arrangements. The fair
value of the Company’s long-term debt would therefore be categorized within Level 3 of the fair value hierarchy.
Derivative
instruments
Fair values for interest rate swap agreements are based upon the amounts required to settle the contracts. Fair values of the
derivative instruments are estimated using prices of financial instruments with similar characteristics, and thus the instruments are classified within Level 2 of the fair value hierarchy.
Off-balance sheet items
The Company has outstanding commitments to extend credit and
standby letters of credit. These off-balance sheet financial instruments are generally exercisable at the market rate prevailing at the date the underlying transaction will be completed. At December 31, 2012 and 2011, the fair value of
guarantees under commercial and standby letters of credit was immaterial.
The estimated fair values and carrying amounts of the
Company’s financial instruments are as follows at December 31:
|
|
|
|
|
|
|
|
|
|
|
|
|
|
|
|
|
| |
|
2012 |
|
|
2011 |
|
| (Dollars in thousands) |
|
Carrying
Amount |
|
|
Fair
Value |
|
|
Carrying
Amount |
|
|
Fair
Value |
|
| Financial Assets |
|
|
|
|
|
|
|
|
|
|
|
|
|
|
|
|
| Cash and cash equivalents |
|
$ |
970,977 |
|
|
$ |
970,977 |
|
|
$ |
573,296 |
|
|
$ |
573,296 |
|
| Investment securities |
|
|
1,950,067 |
|
|
|
1,956,502 |
|
|
|
1,997,969 |
|
|
|
2,004,305 |
|
| Loans and loans held for sale |
|
|
8,766,055 |
|
|
|
8,800,563 |
|
|
|
7,541,050 |
|
|
|
7,916,049 |
|
| FDIC loss share receivable |
|
|
423,069 |
|
|
|
207,222 |
|
|
|
591,844 |
|
|
|
331,946 |
|
| Derivative instruments |
|
|
42,119 |
|
|
|
42,119 |
|
|
|
33,026 |
|
|
|
33,026 |
|
| Accrued interest receivable |
|
|
32,183 |
|
|
|
32,183 |
|
|
|
36,006 |
|
|
|
36,006 |
|
|
|
|
|
|
| Financial Liabilities |
|
|
|
|
|
|
|
|
|
|
|
|
|
|
|
|
| Deposits |
|
$ |
10,748,277 |
|
|
$ |
10,594,885 |
|
|
$ |
9,289,013 |
|
|
$ |
9,262,698 |
|
| Short-term borrowings |
|
|
303,045 |
|
|
|
303,045 |
|
|
|
395,543 |
|
|
|
395,543 |
|
| Long-term debt |
|
|
423,377 |
|
|
|
394,490 |
|
|
|
452,733 |
|
|
|
418,069 |
|
| Derivative instruments |
|
|
36,890 |
|
|
|
36,890 |
|
|
|
35,010 |
|
|
|
35,010 |
|
| Accrued interest payable |
|
|
6,615 |
|
|
|
6,615 |
|
|
|
6,978 |
|
|
|
6,978 |
|
The fair value estimates presented herein are based upon pertinent information available to management as of
December 31, 2012 and 2011. Although management is not aware of any factors that would significantly affect the estimated fair value amounts, such amounts have not been comprehensively revalued for purposes of these financial statements since
that date and, therefore, current estimates of fair value may differ significantly from the amounts presented herein.
NOTE 24 – RESTRICTIONS ON DIVIDENDS, LOANS AND ADVANCES
IBERIABANK is restricted under applicable laws in the payment of dividends to an amount equal to current year earnings plus
undistributed earnings for the immediately preceding year, unless prior permission is received from the Commissioner of Financial Institutions for the State of Louisiana. Dividends payable by IBERIABANK in 2013 without permission will be limited to
2013 earnings plus an additional $28,120,000.
Funds available for loans or advances by IBERIABANK to the Company amounted to $129,318,000. In
addition, any dividends that may be paid by IBERIABANK to the Company would be prohibited if the effect thereof would cause IBERIABANK’s capital to be reduced below applicable minimum capital requirements.
During any deferral period under the Company’s junior subordinated debt, the Company would be prohibited from declaring and paying dividends to
common shareholders. See Note 14 to the consolidated financial statements for additional information.
56
NOTE 25 – CONDENSED PARENT COMPANY ONLY FINANCIAL STATEMENTS
Condensed financial statements of IBERIABANK Corporation (parent company only) are shown below. The parent company has no significant
operating activities.
Condensed Balance Sheets
December 31, 2012 and 2011
|
|
|
|
|
|
|
|
|
| (Dollars in thousands) |
|
2012 |
|
|
2011 |
|
| Assets |
|
|
|
|
|
|
|
|
| Cash in bank |
|
$ |
63,207 |
|
|
$ |
98,390 |
|
| Investment in subsidiaries |
|
|
1,506,671 |
|
|
|
1,434,101 |
|
| Other assets |
|
|
89,966 |
|
|
|
75,061 |
|
|
|
|
|
|
|
|
|
|
| Total assets |
|
$ |
1,659,844 |
|
|
$ |
1,607,552 |
|
|
|
|
| Liabilities and Shareholders’ Equity |
|
|
|
|
|
|
|
|
| Liabilities |
|
$ |
129,976 |
|
|
$ |
124,891 |
|
| Shareholders’ equity |
|
|
1,529,868 |
|
|
|
1,482,661 |
|
|
|
|
|
|
|
|
|
|
| Total liabilities and shareholders’ equity |
|
$ |
1,659,844 |
|
|
$ |
1,607,552 |
|
|
|
|
|
|
|
|
|
|
Condensed Statements of Income
Years Ended December 31, 2012, 2011 and 2010
|
|
|
|
|
|
|
|
|
|
|
|
|
| (Dollars in thousands) |
|
2012 |
|
|
2011 |
|
|
2010 |
|
| Operating income |
|
|
|
|
|
|
|
|
|
|
|
|
| Dividends from bank subsidiary |
|
$ |
70,000 |
|
|
$ |
— |
|
|
$ |
— |
|
| Reimbursement of management expenses |
|
|
94,053 |
|
|
|
74,664 |
|
|
|
41,313 |
|
| Other income |
|
|
(836 |
) |
|
|
(1,176 |
) |
|
|
1,209 |
|
|
|
|
|
|
|
|
|
|
|
|
|
|
| Total operating income |
|
|
163,217 |
|
|
|
73,488 |
|
|
|
42,522 |
|
| Operating expenses |
|
|
|
|
|
|
|
|
|
|
|
|
| Interest expense |
|
|
3,427 |
|
|
|
2,101 |
|
|
|
3,865 |
|
| Salaries and employee benefits expense |
|
|
76,527 |
|
|
|
63,505 |
|
|
|
49,816 |
|
| Other expenses |
|
|
47,309 |
|
|
|
33,546 |
|
|
|
24,744 |
|
|
|
|
|
|
|
|
|
|
|
|
|
|
| Total operating expenses |
|
|
127,263 |
|
|
|
99,152 |
|
|
|
78,425 |
|
|
|
|
|
| Income (loss) before income tax (expense) benefit and increase in equity in undistributed earnings of
subsidiaries |
|
|
35,954 |
|
|
|
(25,664 |
) |
|
|
(35,903 |
) |
|
|
|
|
| Income tax benefit |
|
|
11,842 |
|
|
|
8,219 |
|
|
|
12,113 |
|
|
|
|
|
|
|
|
|
|
|
|
|
|
|
|
|
|
| Income (loss) before equity in undistributed earnings of subsidiaries |
|
|
47,796 |
|
|
|
(17,445 |
) |
|
|
(23,790 |
) |
| Equity in undistributed earnings of subsidiaries |
|
|
28,599 |
|
|
|
70,983 |
|
|
|
72,616 |
|
|
|
|
|
|
|
|
|
|
|
|
|
|
| Net income |
|
|
76,395 |
|
|
|
53,538 |
|
|
|
48,826 |
|
| Preferred stock dividends |
|
|
— |
|
|
|
— |
|
|
|
— |
|
|
|
|
|
|
|
|
|
|
|
|
|
|
| Income available to common shareholders |
|
$ |
76,395 |
|
|
$ |
53,538 |
|
|
$ |
48,826 |
|
|
|
|
|
|
|
|
|
|
|
|
|
|
57
Condensed Statements of Cash Flows
Years Ended December 31, 2012, 2011, and 2010
|
|
|
|
|
|
|
|
|
|
|
|
|
| (Dollars in thousands) |
|
2012 |
|
|
2011 |
|
|
2010 |
|
|
|
|
|
| Cash flows from operating activities |
|
|
|
|
|
|
|
|
|
|
|
|
| Net income |
|
$ |
76,395 |
|
|
$ |
53,538 |
|
|
$ |
48,826 |
|
|
|
|
|
| Adjustments to reconcile net income to net cash provided by operating activities: |
|
|
|
|
|
|
|
|
|
|
|
|
| Depreciation and amortization |
|
|
4,926 |
|
|
|
1,071 |
|
|
|
(892 |
) |
| Net income of subsidiaries |
|
|
(28,599 |
) |
|
|
(70,983 |
) |
|
|
(72,616 |
) |
| Noncash compensation expense |
|
|
9,907 |
|
|
|
9,114 |
|
|
|
7,797 |
|
| Loss (gain) on sale of assets |
|
|
7 |
|
|
|
— |
|
|
|
(3 |
) |
| Derivative (gains) losses on swaps |
|
|
2 |
|
|
|
— |
|
|
|
— |
|
| Cash retained from tax benefit associated with share-based payment arrangements |
|
|
(1,221 |
) |
|
|
(1,454 |
) |
|
|
(637 |
) |
| Other, net |
|
|
(10,557 |
) |
|
|
(23,278 |
) |
|
|
(5,953 |
) |
|
|
|
|
|
|
|
|
|
|
|
|
|
|
|
|
|
| Net cash provided by (used in) operating activities |
|
|
50,860 |
|
|
|
(31,992 |
) |
|
|
(23,478 |
) |
|
|
|
|
| Cash flows from investing activities |
|
|
|
|
|
|
|
|
|
|
|
|
| Cash received in excess of cash paid in acquisition |
|
|
1,272 |
|
|
|
— |
|
|
|
— |
|
| Proceeds from sale of premises and equipment |
|
|
5 |
|
|
|
10 |
|
|
|
3 |
|
| Purchases of premises and equipment |
|
|
(4,173 |
) |
|
|
(3,655 |
) |
|
|
(4,586 |
) |
| Capital contributed to subsidiary |
|
|
(2,000 |
) |
|
|
(12,963 |
) |
|
|
(94,561 |
) |
| Acquisition |
|
|
— |
|
|
|
— |
|
|
|
(733 |
) |
|
|
|
|
|
|
|
|
|
|
|
|
|
|
|
|
|
| Net cash used in investing activities |
|
|
(4,896 |
) |
|
|
(16,608 |
) |
|
|
(99,877 |
) |
|
|
|
|
| Cash flows from financing activities |
|
|
|
|
|
|
|
|
|
|
|
|
| Dividends paid to shareholders |
|
|
(40,069 |
) |
|
|
(38,558 |
) |
|
|
(34,412 |
) |
| Proceeds from long-term debt |
|
|
— |
|
|
|
— |
|
|
|
— |
|
| Common stock issued |
|
|
— |
|
|
|
— |
|
|
|
328,980 |
|
| Repayments of long-term debt |
|
|
(2,867 |
) |
|
|
(13,500 |
) |
|
|
— |
|
| Costs of issuance of common stock |
|
|
— |
|
|
|
— |
|
|
|
— |
|
| Payments to repurchase common stock |
|
|
(42,245 |
) |
|
|
(43,219 |
) |
|
|
(1,500 |
) |
| Proceeds from sale of treasury stock for stock options exercised |
|
|
2,813 |
|
|
|
6,807 |
|
|
|
1,631 |
|
| Cash retained from tax benefit associated with share-based payment arrangements |
|
|
1,221 |
|
|
|
1,454 |
|
|
|
637 |
|
|
|
|
|
|
|
|
|
|
|
|
|
|
|
|
|
|
| Net cash (used in) provided by financing activities |
|
|
(81,147 |
) |
|
|
(87,016 |
) |
|
|
295,336 |
|
|
|
|
|
|
|
|
|
|
|
|
|
|
|
|
|
|
| Net (decrease) increase in cash and cash equivalents |
|
|
(35,183 |
) |
|
|
(135,616 |
) |
|
|
171,981 |
|
|
|
|
|
| Cash and cash equivalents at beginning of period |
|
|
98,390 |
|
|
|
234,006 |
|
|
|
62,025 |
|
|
|
|
|
|
|
|
|
|
|
|
|
|
|
|
|
|
| Cash and cash equivalents at end of period |
|
$ |
63,207 |
|
|
$ |
98,390 |
|
|
$ |
234,006 |
|
|
|
|
|
|
|
|
|
|
|
|
|
|
58
NOTE 26 – QUARTERLY RESULTS OF OPERATIONS (UNAUDITED)
|
|
|
|
|
|
|
|
|
|
|
|
|
|
|
|
|
| (Dollars in thousands, except per share data) |
|
First
Quarter |
|
|
Second
Quarter |
|
|
Third
Quarter |
|
|
Fourth
Quarter |
|
|
|
|
|
|
| Year Ended December 31, 2012 |
|
|
|
|
|
|
|
|
|
|
|
|
|
|
|
|
|
|
|
|
|
| Total interest income |
|
$ |
109,187 |
|
|
$ |
109,283 |
|
|
$ |
111,951 |
|
|
$ |
114,779 |
|
| Total interest expense |
|
|
17,326 |
|
|
|
16,111 |
|
|
|
15,225 |
|
|
|
14,789 |
|
|
|
|
|
|
|
|
|
|
|
|
|
|
|
|
|
|
| Net interest income |
|
|
91,861 |
|
|
|
93,172 |
|
|
|
96,726 |
|
|
|
99,990 |
|
| Provision for credit losses |
|
|
2,857 |
|
|
|
8,895 |
|
|
|
4,053 |
|
|
|
4,866 |
|
|
|
|
|
|
|
|
|
|
|
|
|
|
|
|
|
|
| Net interest income after provision for loan losses |
|
|
89,004 |
|
|
|
84,277 |
|
|
|
92,673 |
|
|
|
95,124 |
|
| Gain (loss) on sale of investments, net |
|
|
2,836 |
|
|
|
901 |
|
|
|
41 |
|
|
|
(4 |
) |
| Other noninterest income |
|
|
34,560 |
|
|
|
40,793 |
|
|
|
46,512 |
|
|
|
50,358 |
|
| Noninterest expense |
|
|
99,873 |
|
|
|
109,022 |
|
|
|
109,848 |
|
|
|
113,441 |
|
|
|
|
|
|
|
|
|
|
|
|
|
|
|
|
|
|
| Income before income taxes |
|
|
26,527 |
|
|
|
16,949 |
|
|
|
29,378 |
|
|
|
32,037 |
|
| Income tax expense |
|
|
7,134 |
|
|
|
4,389 |
|
|
|
8,144 |
|
|
|
8,829 |
|
|
|
|
|
|
|
|
|
|
|
|
|
|
|
|
|
|
| Net income |
|
$ |
19,393 |
|
|
$ |
12,560 |
|
|
|
21,234 |
|
|
$ |
23,208 |
|
| Preferred stock dividends |
|
|
— |
|
|
|
— |
|
|
|
— |
|
|
|
— |
|
|
|
|
|
|
|
|
|
|
|
|
|
|
|
|
|
|
|
|
|
|
|
| Income available to common shareholders |
|
$ |
19,393 |
|
|
$ |
12,560 |
|
|
$ |
21,234 |
|
|
$ |
23,208 |
|
| Earnings allocated to unvested restricted stock |
|
|
(364 |
) |
|
|
(240 |
) |
|
|
(406 |
) |
|
|
(428 |
) |
|
|
|
|
|
|
|
|
|
|
|
|
|
|
|
|
|
| Earnings available to common shareholders - Diluted |
|
$ |
19,029 |
|
|
$ |
12,320 |
|
|
$ |
20,828 |
|
|
$ |
22,780 |
|
|
|
|
|
|
| Earnings per share - basic |
|
$ |
0.66 |
|
|
$ |
0.43 |
|
|
$ |
0.73 |
|
|
$ |
0.79 |
|
| Earnings per share - diluted |
|
|
0.66 |
|
|
|
0.43 |
|
|
|
0.73 |
|
|
|
0.79 |
|
|
|
|
|
|
|
|
|
|
|
|
|
|
|
|
|
|
| (Dollars in thousands, except per share data) |
|
First
Quarter |
|
|
Second
Quarter |
|
|
Third
Quarter |
|
|
Fourth
Quarter |
|
|
|
|
|
|
| Year ended December 31, 2011 |
|
|
|
|
|
|
|
|
|
|
|
|
|
|
|
|
|
|
|
|
|
| Total interest income |
|
$ |
99,434 |
|
|
$ |
97,127 |
|
|
$ |
111,966 |
|
|
$ |
111,799 |
|
| Total interest expense |
|
|
20,686 |
|
|
|
21,162 |
|
|
|
20,995 |
|
|
|
19,226 |
|
|
|
|
|
|
|
|
|
|
|
|
|
|
|
|
|
|
| Net interest income |
|
|
78,748 |
|
|
|
75,965 |
|
|
|
90,971 |
|
|
|
92,573 |
|
| Provision for credit losses |
|
|
5,471 |
|
|
|
9,990 |
|
|
|
6,127 |
|
|
|
4,278 |
|
|
|
|
|
|
|
|
|
|
|
|
|
|
|
|
|
|
| Net interest income after provision for loan losses |
|
|
73,277 |
|
|
|
65,975 |
|
|
|
84,844 |
|
|
|
88,295 |
|
| Gain (Loss) on sale of investments, net |
|
|
47 |
|
|
|
1,428 |
|
|
|
1,206 |
|
|
|
793 |
|
| Other noninterest income |
|
|
28,248 |
|
|
|
29,560 |
|
|
|
35,914 |
|
|
|
34,662 |
|
| Noninterest expense |
|
|
81,732 |
|
|
|
92,706 |
|
|
|
99,566 |
|
|
|
99,726 |
|
|
|
|
|
|
|
|
|
|
|
|
|
|
|
|
|
|
| Income before income taxes |
|
|
19,840 |
|
|
|
4,257 |
|
|
|
22,398 |
|
|
|
24,024 |
|
| Income tax expense |
|
|
5,193 |
|
|
|
(929 |
) |
|
|
6,051 |
|
|
|
6,667 |
|
|
|
|
|
|
|
|
|
|
|
|
|
|
|
|
|
|
| Net income |
|
$ |
14,647 |
|
|
$ |
5,186 |
|
|
|
16,347 |
|
|
$ |
17,357 |
|
| Preferred stock dividends |
|
|
— |
|
|
|
— |
|
|
|
— |
|
|
|
— |
|
|
|
|
|
|
|
|
|
|
|
|
|
|
|
|
|
|
|
|
|
|
|
| Income available to common shareholders |
|
$ |
14,647 |
|
|
$ |
5,186 |
|
|
$ |
16,347 |
|
|
$ |
17,357 |
|
| Earnings allocated to unvested restricted stock |
|
|
(291 |
) |
|
|
(87 |
) |
|
|
(290 |
) |
|
|
(307 |
) |
|
|
|
|
|
|
|
|
|
|
|
|
|
|
|
|
|
| Earnings available to common shareholders - Diluted |
|
$ |
14,356 |
|
|
$ |
5,099 |
|
|
$ |
16,057 |
|
|
$ |
17,050 |
|
|
|
|
|
|
| Earnings per share - basic |
|
$ |
0.54 |
|
|
$ |
0.19 |
|
|
$ |
0.55 |
|
|
$ |
0.59 |
|
| Earnings per share - diluted |
|
|
0.54 |
|
|
|
0.18 |
|
|
|
0.54 |
|
|
|
0.59 |
|
As discussed further in Note 1, the Company has corrected its historical consolidated statements of cash flows for the years ended
December 31, 2011 and 2010 for the impact of an error in reporting certain non-cash activity between its operating and investing cash flows. The following table presents the effect of these corrections on the Company’s Statements of Cash Flows
for the year-to-date periods ended March 31, June 30, and September 30 for the years indicated.
|
|
|
|
|
|
|
|
|
|
|
|
|
| (Dollars in thousands) |
|
As Previously
Reported |
|
|
Adjustment |
|
|
As
Adjusted |
|
|
|
|
|
| Selected Cash Flow Data |
|
|
|
|
|
|
|
|
|
|
|
|
|
|
|
|
| 2012 |
|
|
|
|
|
|
|
|
|
|
|
|
| For the Three Months Ended March 31, 2012 |
|
|
|
|
|
|
|
|
|
|
|
|
| (Increase) decrease in other assets |
|
$ |
4,200 |
|
|
$ |
684 |
|
|
$ |
4,884 |
|
| Net Cash (Used in) Provided by Operating Activities |
|
|
54,243 |
|
|
|
684 |
|
|
|
54,927 |
|
| Increase in loans receivable, net, excluding loans acquired |
|
|
(101,618 |
) |
|
|
(684 |
) |
|
|
(102,302 |
) |
| Net Cash (Used in) Provided by Investing Activities |
|
$ |
(46,994 |
) |
|
$ |
(684 |
) |
|
$ |
(47,678 |
) |
|
|
|
|
| For the Six Months Ended June 30, 2012 |
|
|
|
|
|
|
|
|
|
|
|
|
| (Increase) decrease in other assets |
|
$ |
(11,609 |
) |
|
$ |
10,633 |
|
|
$ |
(976 |
) |
| Net Cash (Used in) Provided by Operating Activities |
|
|
19,303 |
|
|
|
10,633 |
|
|
|
29,936 |
|
| Increase in loans receivable, net, excluding loans acquired |
|
|
(351,982 |
) |
|
|
(10,633 |
) |
|
|
(362,615 |
) |
| Net Cash (Used in) Provided by Investing Activities |
|
$ |
(310,258 |
) |
|
$ |
(10,633 |
) |
|
$ |
(320,891 |
) |
|
|
|
|
| For the Nine Months Ended September 30, 2012 |
|
|
|
|
|
|
|
|
|
|
|
|
| (Increase) decrease in other assets |
|
$ |
(23,963 |
) |
|
$ |
33,786 |
|
|
$ |
9,823 |
|
| Net Cash (Used in) Provided by Operating Activities |
|
|
10,239 |
|
|
|
33,786 |
|
|
|
44,025 |
|
| Increase in loans receivable, net, excluding loans acquired |
|
|
(596,443 |
) |
|
|
(33,786 |
) |
|
|
(630,229 |
) |
| Net Cash (Used in) Provided by Investing Activities |
|
$ |
(304,863 |
) |
|
$ |
(33,786 |
) |
|
$ |
(338,649 |
) |
|
|
|
|
| 2011 |
|
|
|
|
|
|
|
|
|
|
|
|
| For the Three Months Ended March 31, 2011 |
|
|
|
|
|
|
|
|
|
|
|
|
| (Increase) decrease in other assets |
|
$ |
4,918 |
|
|
$ |
6,784 |
|
|
$ |
11,702 |
|
| Net Cash (Used in) Provided by Operating Activities |
|
|
51,884 |
|
|
|
6,784 |
|
|
|
58,668 |
|
| Increase in loans receivable, net, excluding loans acquired |
|
|
(72,086 |
) |
|
|
(6,784 |
) |
|
|
(78,870 |
) |
| Net Cash (Used in) Provided by Investing Activities |
|
$ |
(1,201 |
) |
|
$ |
(6,784 |
) |
|
$ |
(7,985 |
) |
|
|
|
|
| For the Six Months Ended June 30, 2011 |
|
|
|
|
|
|
|
|
|
|
|
|
| (Increase) decrease in other assets |
|
$ |
(23,018 |
) |
|
$ |
26,706 |
|
|
$ |
3,688 |
|
| Net Cash (Used in) Provided by Operating Activities |
|
|
42,598 |
|
|
|
26,706 |
|
|
|
69,304 |
|
| Increase in loans receivable, net, excluding loans acquired |
|
|
(275,961 |
) |
|
|
(26,706 |
) |
|
|
(302,667 |
) |
| Net Cash (Used in) Provided by Investing Activities |
|
$ |
19,338 |
|
|
$ |
(26,706 |
) |
|
$ |
(7,368 |
) |
|
|
|
|
| For the Nine Months Ended September 30, 2011 |
|
|
|
|
|
|
|
|
|
|
|
|
| (Increase) decrease in other assets |
|
$ |
(29,742 |
) |
|
$ |
30,184 |
|
|
$ |
442 |
|
| Net Cash (Used in) Provided by Operating Activities |
|
|
(14,066 |
) |
|
|
30,184 |
|
|
|
16,118 |
|
| Increase in loans receivable, net, excluding loans acquired |
|
|
(322,254 |
) |
|
|
(30,184 |
) |
|
|
(352,438 |
) |
| Net Cash (Used in) Provided by Investing Activities |
|
$ |
215,382 |
|
|
$ |
(30,184 |
) |
|
$ |
185,198 |
|
59
Corporate Information
Corporate Headquarters
IBERIABANK Corporation
200 West Congress Street
Lafayette, LA 70501
337.521.4012
Corporate Mailing
Address
P.O. Box 52747
Lafayette, LA 70505-2747
Annual Meeting
IBERIABANK Corporation Annual Meeting of Shareholders will be held on Monday, May 6, 2013 at 4:00 p.m. at the Hotel Inter-Continental
located at 444 Saint Charles Avenue, New Orleans, Louisiana.
Shareholder Assistance
Shareholders requesting a change of address, records or information about the Dividend Reinvestment Plan, or lost certificates should contact:
Investor Relations
Registrar and Transfer
Company
10 Commerce Drive
Cranford,
NJ 07016
800.368.5948
www.invrelations@RTCO.com
For Information
Copies of the Company’s Annual Report on Form 10-K including financial statements and financial statement schedules, will be
furnished to Shareholders without cost by sending a written request to George J. Becker III, Secretary, IBERIABANK Corporation, 200 West Congress Street, 12th Floor, Lafayette, Louisiana 70501. This and other information regarding IBERIABANK
Corporation and its subsidiaries may be accessed from our web sites. In addition, shareholders may contact:
Daryl G. Byrd, President and CEO
337.521.4003
John R. Davis, Senior
Executive Vice President
337.521.4005
Internet Addresses
www.iberiabank.com
www.iberiabankmortgage.com
www.lenderstitle.com
www.utla.com
www.iberiabankcreditcards.com
Stock Information
|
|
|
|
|
|
|
|
|
|
|
|
|
|
|
|
|
| |
|
MARKET PRICE |
|
|
DIVIDENDS
DECLARED
|
|
| 2011 |
|
HIGH |
|
|
LOW |
|
|
CLOSING |
|
|
| First Quarter |
|
$ |
60.90 |
|
|
$ |
54.82 |
|
|
$ |
60.13 |
|
|
$ |
0.34 |
|
| Second Quarter |
|
$ |
60.96 |
|
|
$ |
54.46 |
|
|
$ |
57.64 |
|
|
$ |
0.34 |
|
| Third Quarter |
|
$ |
59.64 |
|
|
$ |
42.51 |
|
|
$ |
47.06 |
|
|
$ |
0.34 |
|
| Fourth Quarter |
|
$ |
54.06 |
|
|
$ |
45.40 |
|
|
$ |
49.30 |
|
|
$ |
0.34 |
|
|
|
|
| |
|
MARKET PRICE |
|
|
DIVIDENDS
DECLARED
|
|
| 2012 |
|
HIGH |
|
|
LOW |
|
|
CLOSING |
|
|
| First Quarter |
|
$ |
55.67 |
|
|
$ |
49.83 |
|
|
$ |
53.47 |
|
|
$ |
0.34 |
|
| Second Quarter |
|
$ |
54.03 |
|
|
$ |
45.53 |
|
|
$ |
50.45 |
|
|
$ |
0.34 |
|
| Third Quarter |
|
$ |
51.87 |
|
|
$ |
44.46 |
|
|
$ |
45.80 |
|
|
$ |
0.34 |
|
| Fourth Quarter |
|
$ |
50.55 |
|
|
$ |
44.28 |
|
|
$ |
49.12 |
|
|
$ |
0.34 |
|
At February 21, 2013, IBERIABANK Corporation had approximately 2,487 shareholders of record.
Securities Listing
IBERIABANK
Corporation’s common stock trades on the NASDAQ Global Select Market under the symbol “IBKC.” In local and national newspapers, the company is listed under “IBERIABANK.”
Dividend Restrictions
The majority of
the Company’s revenue is from dividends declared and paid to the company by its subsidiary financial institutions, which are subject to laws and regulations that limit the amount of dividends and other distributions they can pay. In addition,
the Company and these subsidiaries are required to maintain capital at or above regulatory minimums and to remain “well-capitalized” under prompt corrective action regulations. The declaration and payment of dividends on the Company’s
capital stock also is subject to contractual restrictions. See Note 14- Long-Term Debt, Note 18- Capital Requirements and Other Regulatory Matters and Note 24- Restrictions on Dividends, Loans and Advances to the Consolidated Financial Statements.
Dividend Investment Plan
IBERIABANK Corporation shareholders may take advantage of our Dividend Reinvestment Plan. This program provides a convenient, economical way for
shareholders to increase their holdings of the Company’s common stock. The shareholder pays no brokerage commissions or service charges while participating in the plan. A nominal fee is charged at the time that an individual terminates plan
participation. This plan does not currently offer participants the ability to purchase additional shares with optional cash payments.
To
enroll in the IBERIABANK Corporation Dividend Reinvestment Plan, shareholders must complete an enrollment form. A summary of the plan and enrollment forms are available from the Register and Transfer Company at the address provided under Shareholder
Assistance.