0001193125-11-283339.txt : 20111027 0001193125-11-283339.hdr.sgml : 20111027 20111027094203 ACCESSION NUMBER: 0001193125-11-283339 CONFORMED SUBMISSION TYPE: 8-K PUBLIC DOCUMENT COUNT: 85 CONFORMED PERIOD OF REPORT: 20111026 ITEM INFORMATION: Results of Operations and Financial Condition ITEM INFORMATION: Regulation FD Disclosure ITEM INFORMATION: Financial Statements and Exhibits FILED AS OF DATE: 20111027 DATE AS OF CHANGE: 20111027 FILER: COMPANY DATA: COMPANY CONFORMED NAME: IBERIABANK CORP CENTRAL INDEX KEY: 0000933141 STANDARD INDUSTRIAL CLASSIFICATION: STATE COMMERCIAL BANKS [6022] IRS NUMBER: 721280718 STATE OF INCORPORATION: LA FISCAL YEAR END: 1231 FILING VALUES: FORM TYPE: 8-K SEC ACT: 1934 Act SEC FILE NUMBER: 000-25756 FILM NUMBER: 111160596 BUSINESS ADDRESS: STREET 1: 200 WEST CONGRESS STREET CITY: LAFAYETTE STATE: LA ZIP: 70505 BUSINESS PHONE: 3375214003 MAIL ADDRESS: STREET 1: 200 WEST CONGRESS STREET CITY: LAFAYETTE STATE: LA ZIP: 70505 FORMER COMPANY: FORMER CONFORMED NAME: ISB FINANCIAL CORP/LA DATE OF NAME CHANGE: 19941123 8-K 1 d248190d8k.htm FORM 8-K Form 8-K


SECURITIES AND EXCHANGE COMMISSION

WASHINGTON, D.C. 20549


FORM 8-K


CURRENT REPORT

Pursuant to Section 13 or 15(d) of the

Securities Exchange Act of 1934

Date of Report (Date of earliest event reported): October 26, 2011


IBERIABANK CORPORATION

(Exact name of Registrant as Specified in Charter)


Louisiana   0-25756   72-1280718

(State or Other Jurisdiction

of Incorporation)


(Commission

File Number)


(I.R.S. Employer

Identification No.)

200 West Congress Street, Lafayette, Louisiana 70501

(Address of Principal Executive Offices)

(337) 521-4003

Registrant’s telephone number, including area code

NOT APPLICABLE

(Former name or former address, if changed since last report)


Check the appropriate box below if the Form 8-K filing is intended to simultaneously satisfy the filing obligation of the registrant under any of the following provisions:


¨ Written communications pursuant to Rule 425 under the Securities Act (17 CFR 230.425)


¨ Soliciting material pursuant to Rule 14a-12 under the Exchange Act (17 CFR 240.14a-12)


¨ Pre-commencement communications pursuant to Rule 14d-2(b) under the Exchange Act (17 CFR 240.14d-2(b))


¨ Pre-commencement communications pursuant to Rule 13e-4(c) under the Exchange Act (17 CFR 240.13e-4(c))


Item 2.02 Results of Operations and Financial Condition

On October 26, 2011, the Registrant announced its results of operations for the three- and nine-month periods ended September 30, 2011. Copies of the related press release and supplemental materials are attached as Exhibits 99.1 and 99.2, respectively, to this Current Report on Form 8-K and are incorporated by reference herein.


Item 7.01 Regulation FD Disclosure

On October 26, 2011, the Registrant announced a new share repurchase program for up to 900,000 shares of the Registrant’s common stock. Under the prior program which was completed during the quarter ended September 30, 2011, the Registrant purchased 900,000 shares of common stock at a weighted average price of $45.98 per share. A copy of the Registrant’s related press release is attached as Exhibit 99.3 to this Current Report on Form 8-K and is incorporated herein by reference.

On October 26, 2011, the Registrant disclosed its strategic goals under its updated strategic plan. Copies of the related press release and the Registrant’s Strategic Overview are attached as Exhibits 99.3 and 99.4, respectively, to this Current Report on Form 8-K and are incorporated herein by reference.


Item 9.01 Financial Statements and Exhibits


  (d) Exhibits. The exhibits listed in the exhibit index are furnished pursuant to Items 2.02 and 7.01 as part of this Current Report on Form 8-K and are not to be deemed “filed” for purposes of Section 18 of the Securities Exchange Act of 1934 or otherwise subject to the liabilities of that Section.


SIGNATURES

Pursuant to the requirements of the Securities Exchange Act of 1934, the Registrant has duly caused this report to be signed on its behalf by the undersigned, hereunto duly authorized.


  IBERIABANK CORPORATION
DATE: October 26, 2011   By:  

/s/ Daryl G. Byrd

    Daryl G. Byrd
    President and Chief Executive Officer


EXHIBIT INDEX


Exhibit
Number

     
99.1    Press Release reporting third quarter results dated October 26, 2011, issued by the Registrant.
99.2    Supplemental Materials to third quarter earnings conference call
99.3    Press Release reporting share repurchase plan and updated strategic plan, dated October 26, 2011, issued by the Registrant
99.4    IBERIABANK Corporation Strategic Overview, dated October 26, 2011
EX-99.1 2 d248190dex991.htm EXHIBIT 99.1 Exhibit 99.1

Exhibit 99.1

LOGO

FOR IMMEDIATE RELEASE

October 26, 2011

Contact:

Daryl G. Byrd, President and CEO (337) 521-4003

John R. Davis, Senior Executive Vice President (337) 521-4005

IBERIABANK Corporation Reports Third Quarter Results

LAFAYETTE, LOUISIANA — IBERIABANK Corporation (NASDAQ: IBKC), holding company of the 124-year-old IBERIABANK (www.iberiabank.com), reported operating results for the third quarter ended September 30, 2011. For the quarter, the Company reported income available to common shareholders of $17 million and fully diluted earnings per share (“EPS”) of $0.58. The Company completed the acquisitions of OMNI BANCSHARES, Inc. (“OMNI”) and Cameron Bancshares, Inc. (“Cameron”) on May 31, 2011. Financial statements reflect the impact of those acquisitions beginning on that date. The conversions of branch and operating systems of OMNI and Cameron were successfully completed over the weekends of June 18-19 and July 9-10, respectively. The Company incurred pre-tax acquisition and conversion costs equal to $6 million, or $0.12 per share on an after-tax basis. Excluding the acquisition and conversion costs, EPS in the third quarter of 2011 was $0.70 per share.

Daryl G. Byrd, President and Chief Executive Officer of the Company commented, “We are pleased with the progress exhibited in our financial results for the third quarter of 2011. We continue to benefit from strong organic loan and core deposit growth and expanded client market share. Our net interest margin improved significantly during the third quarter, asset quality and capital levels remain very favorable compared to peers, and we are on target to achieve projected synergies associated with our recent acquisitions.” Byrd continued, “We remain very well positioned for this very challenging operating environment.”

Highlights for the Third Quarter of 2011 and September 30, 2011:


EPS of $0.70 per share excluding acquisition and conversion costs. The average analyst estimate for EPS for the third quarter of 2011 as reported in First Call was $0.58 per share.


Loan growth of $110 million, or 2%, between quarter-ends (8% annualized rate), excluding loans, OREO, and other assets covered under FDIC loss share agreements (“Covered Assets”).


Core deposit growth (excluding time deposits) of $217 million, or 3% (14% annualized growth), compared to June 30, 2011.


Tax-equivalent net interest margin improved 34 basis points between the second and third quarters of 2011 (“linked quarter basis”) to 3.62%. The yield on FDIC covered loans (net of FDIC indemnification asset yield) was 4.93%, up 85 basis points compared to the second quarter of 2011 and up three basis points compared to management’s initial estimate of 4.90% for the third quarter.
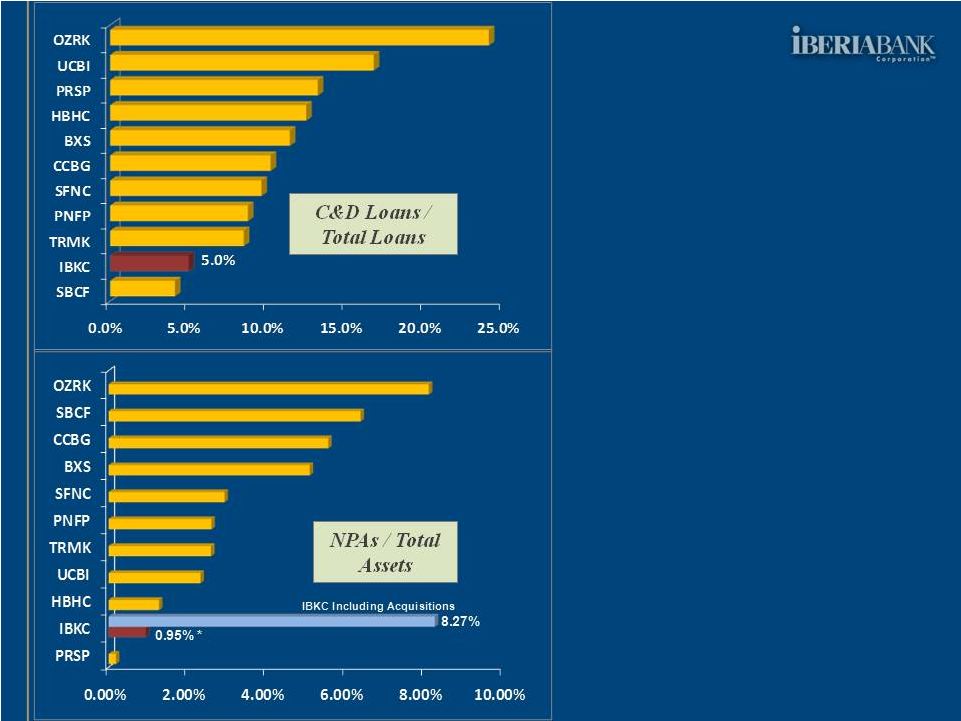


Continued asset quality strength; Nonperforming assets (“NPAs”), excluding Covered Assets and impaired loans marked to fair value that were acquired in the OMNI and Cameron acquisitions, equated to 0.95% of total assets at September 30, 2011, compared to 0.84% at June 30, 2011.


The Company completed the share repurchase program announced on August 2, 2011. Under that program, 900,000 shares of the Company’s common stock were purchased during the third quarter of 2011 at a weighted average price of $45.98 per share. The closing price for the Company’s common stock was $51.30 per share on October 26, 2011.


1


The Company announced today the Board of Directors has authorized a new share repurchase program totaling an additional 900,000 shares of common stock to be completed over a one-year period.


Capital ratios remain strong; At September 30, 2011, the Company’s tangible common equity ratio was 9.77%, tier 1 leverage ratio was 10.55%, and total risk based capital ratio was 16.75%.

Balance Sheet Summary

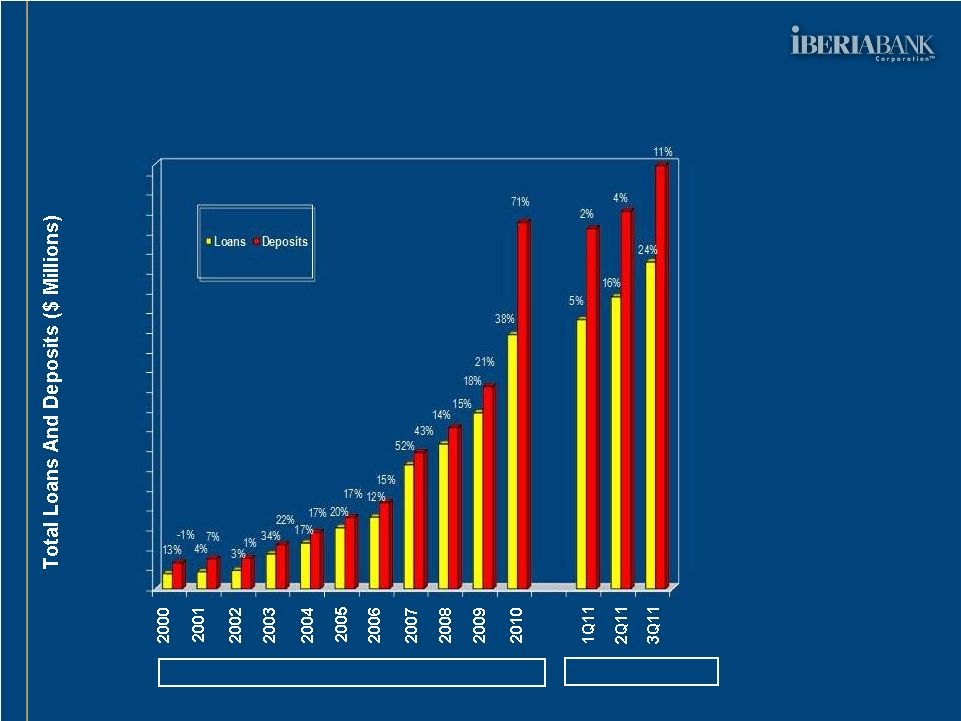
Total assets increased $76 million, or 1%, since June 30, 2011, to $11.5 billion at September 30, 2011. Over this period, total loans increased $26 million, or less than 1%; investment securities decreased $158 million, or 7%; and total deposits increased $117 million, or 1%. Total shareholders’ equity decreased $35 million, or 2%, since June 30, 2011, to $1.5 billion at September 30, 2011. The decrease in shareholders’ equity was primarily due to the recently completed share repurchase program.

Investments

Total investment securities decreased $158 million during the third quarter of 2011, or 7%, to $2.1 billion at September 30, 2011. As a percentage of total assets, the investment portfolio edged down from 19% at June 30, 2011, to 18% at September 30, 2011. The investment portfolio had a modified duration of 2.6 years at September 30, 2011, compared to 2.9 years at June 30, 2011. The unrealized gain in the investment portfolio increased $12 million, from $30 million at June 30, 2011 to $42 million at September 30, 2011. Based on projected prepayment speeds and other assumptions, at September 30, 2011, the portfolio was expected to generate approximately $729 million in cash flows, or about 36% of the portfolio, over the next 15 months. The average yield on investment securities decreased two basis points on a linked quarter basis, to 2.72% in the third quarter of 2011. The Company holds in its investment portfolio primarily government agency and municipal securities. Municipal securities comprised only 10% of the total investment portfolio at September 30, 2011. The Company holds no sovereign debt or foreign derivative exposure and has an immaterial exposure to accelerated bond premium amortization.

Loans

In the third quarter of 2011, total loans increased $26 million, or less than 1%. The loan portfolio associated with the FDIC-assisted acquisitions declined $85 million, or 6%, compared to June 30, 2011. Excluding loans associated with the FDIC-assisted transactions, total loans increased $110 million, or 2%, over that period (8% annualized rate). On that basis, commercial and business banking loans climbed $113 million, or 3% (11% annualized rate), and consumer loans grew $22 million, or 2% (7% annualized rate), while mortgage loans declined $24 million, or 7%, over that period. Between the times at which the acquisitions were completed and September 30, 2011, loans acquired in FDIC-assisted acquisitions decreased by approximately $515 million, or 27%.

Of the $7.2 billion total loan portfolio at September 30, 2011, $1.4 billion (net of discounts), or 19% of total loans, were Covered Assets, which provide considerable protection against credit risk. Approximately $74 million of the impaired loans from Cameron and OMNI at the time of acquisitions were marked to an estimated fair value at the time of acquisition. The remaining $5.8 billion in loans, or 81% of total loans, were associated with the Company’s legacy franchise, or loans that were acquired but required no impairment at acquisition or have no FDIC loss share protection.

Period-End Loan Volumes ($ in Millions)


2


Loans


     9/30/10     12/31/10     3/31/11     6/30/11     9/30/11  

Commercial

   $ 2,947      $ 3,123      $ 3,255      $ 4,197      $ 4,310   

Consumer

     926        960        1,003        1,211        1,233   

Mortgage

     406        370        344        330        305   


Non-FDIC Loans

   $ 4,279      $ 4,453      $ 4,602      $ 5,738      $ 5,848   

Covered Assets

   $ 1,512      $ 1,583      $ 1,520      $ 1,463      $ 1,378   


Total Loans

   $ 5,791      $ 6,035      $ 6,122      $ 7,201      $ 7,226   

Non-FDIC Growth

     1     4     3     25     2

On a linked quarter basis, the yield on average total loans (non-FDIC loans, and FDIC covered loans net of the FDIC indemnification asset) increased 37 basis points to 5.02%. The increase in this yield was primarily driven by the improvement in the yields on each the FDIC covered loans and the FDIC indemnification asset. The loan yield on FDIC covered loans net of the FDIC indemnification asset was 4.93%, an improvement of 85 basis points on a linked quarter basis.

Non-Covered and Net Covered Loan Portfolio Volumes And Yields ($ in Millions)


     3Q 2010     4Q 2010     1Q 2011     2Q 2011     3Q 2011  
     Avg Bal      Yield     Avg Bal      Yield     Avg Bal      Yield     Avg Bal      Yield     Avg Bal      Yield  

Non Covered Loans

   $ 4,260         5.01   $ 4,333         4.94   $ 4,506         4.89   $ 5,022         4.90   $ 5,798         5.04

FDIC Covered Loans

   $ 1,571         9.27   $ 1,466         10.67   $ 1,546         14.20   $ 1,490         10.89   $ 1,422         7.82

FDIC Indemnification Asset

     866         -2.27     900         -3.75     709         -12.37     666         -10.88     627         -1.63


Net Covered Loans

   $ 2,437         5.13   $ 2,366         5.14   $ 2,254         5.74   $ 2,156         4.08   $ 2,048         4.93


The Company projects the prospective yield and average balance on the net covered loan portfolio in the fourth quarter of 2011 to approximate the level reported for the third quarter of 2011, based on current FDIC loss share accounting assumptions and estimates.

Commercial real estate loans totaled $3.3 billion at September 30, 2011, of which approximately $0.8 billion, or 23%, were Covered Assets. In addition, these Covered Assets were purchased at substantial discounts.

At September 30, 2011, approximately 17% of the Company’s direct consumer loan portfolio (net of discounts) was Covered Assets or impaired loans marked to fair value. The remaining legacy consumer portfolio maintained favorable asset quality. The average credit score of the legacy consumer loan portfolio borrower was 723, and consumer loans past due 30 days or more were 0.55% of total consumer loans at September 30, 2011 (compared to 0.42% at June 30, 2011). Legacy home equity loans totaled $487 million, with 0.21% past due 30 days or more (0.34% at June 30, 2011). Legacy home equity lines of credit totaled $310 million, with 0.25% past due 30 days or more (0.17% at June 30, 2011). Annualized net charge-offs in this portfolio were 0.38% of total consumer loans in the third quarter of 2011 (0.02% in the second quarter of 2011). The weighted average loan-to-value at origination for this portfolio over the last three years was 67%.

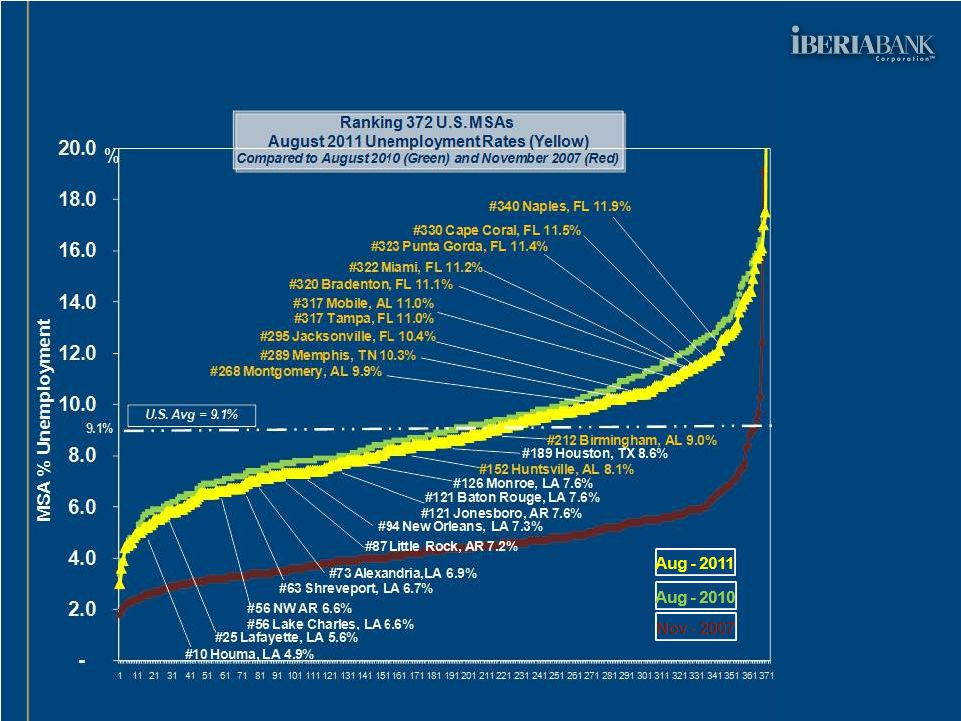
The indirect automobile loan portfolio totaled $260 million at September 30, 2011, up $13 million, or 5%, compared to this portfolio at June 30, 2011. At September 30, 2011, this portfolio equated to 3% of total loans and had 0.96% in loans past due 30 days or more (including nonaccruing loans), compared to 0.78% at June 30, 2011. Annualized net charge-offs in the indirect loan portfolio equated to approximately 0.17% of average loans in the third quarter of 2011, compared to 0.09% in the second quarter of 2011. Approximately 81% of the indirect automobile portfolio was loans to borrowers in the Acadiana region of Louisiana, which currently experiences a relatively


3


favorable unemployment rate (5.6% in August 2011, the 25th lowest unemployment rate of 372 MSAs in the United States).

Asset Quality

The Company’s credit quality statistics are significantly affected by the FDIC-assisted acquisitions. However, the loss share arrangements with the FDIC and acquisition discounts are expected to provide substantial protection against losses on those Covered Assets. Under loss share agreements in connection with the FDIC-assisted acquisitions, the FDIC will cover 80% of the losses on the disposition of loans and OREO up to $1.2 billion, or $965 million (the Company covered the remaining $241 million at acquisition). In addition, the FDIC will cover 95% of losses that exceed a $970 million threshold level. The Company received a discount of approximately $515 million on the purchase of assets in the transactions.

The majority of assets acquired in the four FDIC-assisted transactions completed in 2009 and 2010 are Covered Assets. Total NPAs at September 30, 2011, were $953 million, up $21 million, or 2%, compared to June 30, 2011. Excluding $864 million in NPAs which were Covered Assets or acquired impaired loans marked to fair value, NPAs at September 30, 2011 were $90 million, up $13 million, or 16%, compared to June 30, 2011. On that basis, NPAs were 0.95% of total assets at September 30, 2011, compared to 0.84% of assets at June 30, 2011 and 0.81% one year ago. The dollar increase in legacy NPAs and past dues is not indicative of deterioration in the overall legacy loan portfolio. The primary reason for the increase in NPAs and past dues was three loan relationships, each of which the Company does not expect to incur any material loss upon resolution.

Summary Asset Quality Statistics


($ thousands)    IBERIABANK Corp.  
     3Q10*     4Q10*     1Q11*     2Q11**     3Q11**  

Nonaccruals

   $ 41,081      $ 49,496      $ 60,034      $ 56,434      $ 70,833   

OREO & Foreclosed

     16,968        18,496        17,056        18,461        17,809   

90+ Days Past Due

     6,817        1,455        454        2,191        1,149   


Nonperforming Assets

   $ 64,865      $ 69,447      $ 77,544      $ 77,085      $ 89,791   

NPAs/Assets

     0.81     0.91     1.01     0.84     0.95

NPAs/(Loans + OREO)

     1.51     1.55     1.68     1.36     1.55

LLR/Loans

     1.43     1.40     1.45     1.28     1.36

Net Charge-Offs/Loans

     0.57     0.96     -0.06     0.13     0.12


* Excludes the impact of all FDIC-assisted acquisitions
** Excludes the impact of all FDIC-assisted acquisitions and acquired impaired loans from OMNI and Cameron

Excluding the FDIC-assisted transactions and impaired loans acquired at fair value, loans past due 30 days or more (including nonaccruing loans) increased $18 million, or 22%, and represented 1.68% of total loans at September 30, 2011, compared to 1.40% of total loans at June 30, 2011. On that basis, loans past due 30-89 days at September 30, 2011 totaled $26 million, or 0.44% of total loans (compared to 0.37% of total loans at June 30, 2011), and troubled debt restructurings at September 30, 2011, totaled $29 million, or 0.50% of total loans (compared to 0.40% of loans at June 30, 2011). All but $1 million in troubled debt restructurings were included in the NPAs at September 30, 2011. The Company reported classified assets excluding Covered Assets totaling $197 million at September 30, 2011, or 1.70% of total assets.


4


Loans Past Due 30 Days Or More And Nonaccruing Loans As % Of Loans Outstanding


     9/30/10     12/31/10     3/31/11     6/30/11     9/30/11  

Consolidated (Ex-FDIC Covered Assets and SOP 03-3)


30+ days past due

     0.52     0.33     0.35     0.41     0.46

Non-accrual

     0.96     1.11     1.30     0.99     1.22


Total Past Due

     1.48     1.44     1.65     1.40     1.68


Consolidated (With FDIC Covered Assets)


30+ days past due

     1.98     2.44     2.04     1.41     1.28

Non-accrual

     12.95     12.10     11.89     10.17     10.36


Total Past Due

     14.93     14.54     13.93     11.58     11.64


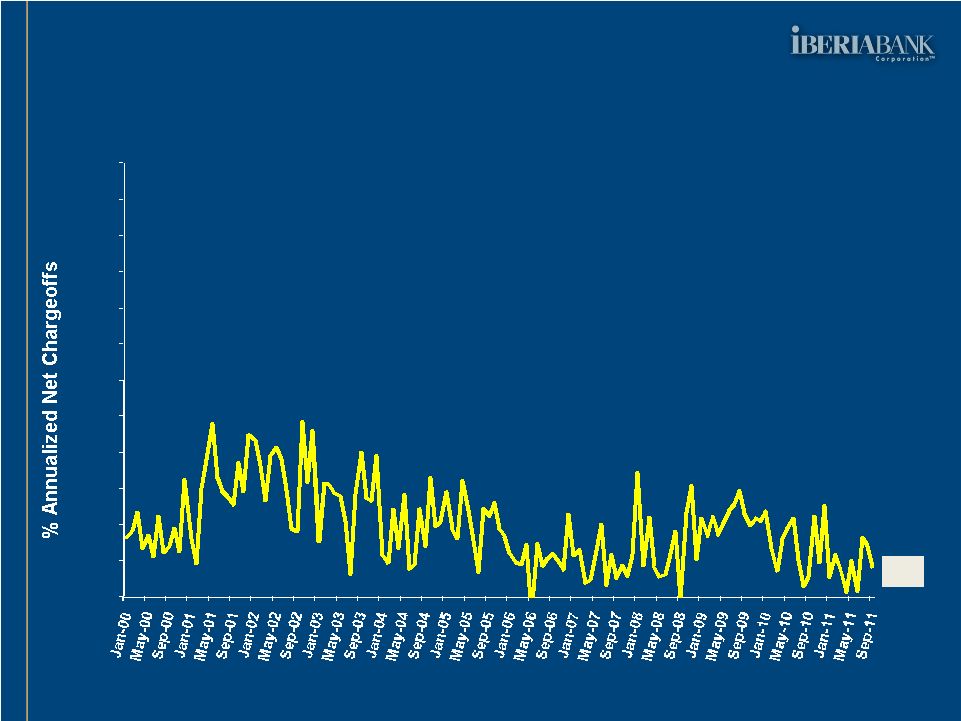
The Company reported net charge-offs of $1.9 million in the third quarter of 2011, compared to $1.7 million on a linked quarter basis. The ratio of net charge-offs to average loans was 0.10% in the third quarter of 2011 (0.12% excluding Covered Assets and impaired loans acquired at fair value), unchanged compared to the second quarter of 2011. The Company recorded a $6 million loan loss provision in the third quarter of 2011, down $4 million, or 39%, on a linked quarter basis. Approximately $1 million in the provision was related to organic loan growth.

At September 30, 2011, the allowance for loan losses was 2.43% of total loans, compared to 2.36% at June 30, 2011. In accordance with generally accepted accounting principles, the Covered Assets and OMNI and Cameron acquired loans were preliminarily marked to market at acquisition, including estimated loan impairments. Excluding FDIC covered loans and impaired loans that were marked to fair value, the Company’s ratio of loan loss reserves to loans increased from 1.28% at June 30, 2011, to 1.33% at September 30, 2011. Excluding the Covered Assets and all other acquired loans, the Company’s ratio of loan loss reserve to loans increased from 1.47% at June 30, 2011 to 1.51% at September 30, 2011. Management considers the loan loss reserve adequate to absorb credit losses inherent in the loan portfolio at September 30, 2011.

Deposits

During the third quarter of 2011, total deposits increased $117 million, or 1%. Noninterest bearing deposits climbed $92 million, or 7% (28% annualized rate); NOW accounts increased $49 million, or 3%; savings and money market deposits expanded $76 million, or 2%; and time deposits decreased $101 million, or 4%.

Period-End Deposit Volumes ($ in Millions)


     9/30/10     12/31/10     3/31/11     6/30/11     9/30/11  

Noninterest

   $ 857      $ 879      $ 941      $ 1,323      $ 1,415   

NOW Accounts

     1,254        1,282        1,395        1,639        1,688   

Savings/MMkt

     3,013        2,910        2,919        3,284        3,360   

Time Deposits

     3,139        2,844        2,604        2,828        2,727   


Total Deposits

   $ 8,264      $ 7,915      $ 7,859      $ 9,074      $ 9,190   

Growth

     2     -4     -1     15     1

Average noninterest bearing deposits increased $278 million, or 25%, and interest-bearing deposits increased $645 million, or 9%, on a linked quarter basis. The growth in average balances was influenced by the acquisitions of OMNI and Cameron which were completed during the second quarter of 2011. The rate on average interest bearing deposits in the third quarter of 2011 was 0.90%, a decrease of 12 basis points on a linked quarter basis.

Other Interest Bearing Liabilities


5


On a linked quarter basis, average long-term debt increased $42 million, or 10%, and the cost of the debt decreased eight basis points to 2.63% (due to the acquisitions). The Company had no short-term borrowings at September 30, 2011. The cost of average interest bearing liabilities was 0.98% in the third quarter of 2011, a decrease of 11 basis points on a linked quarter basis. For the month of September 2011, the average cost of interest bearing liabilities was 0.93%.

Capital Position

The Company maintains strong capital ratios. The equity-to-assets ratio was 12.77% at September 30, 2011, compared to 13.16% at June 30, 2011, and 12.38% one year ago. At September 30, 2011, the Company reported a tangible common equity ratio of 9.77%, a decrease of 38 basis points compared to 10.15% at June 30, 2011. The Company’s Tier 1 leverage ratio was 10.55%, down 146 basis points compared to 12.01% at June 30, 2011. The Company’s total risk-based capital ratio at September 30, 2011 was 16.75%, down 57 basis points compared to 17.32% at June 30, 2011. The decline in the capital ratios was primarily due to the share repurchase program that was completed during the third quarter of 2011.

Regulatory Capital Ratios

At September 30, 2011


Capital Ratio

   Well
Capitalized
    IBERIABANK     IBERIABANK
Corporation
 

Tier 1 Leverage

     5.00     9.00     10.55

Tier 1 Risk Based

     6.00     13.22     15.49

Total Risk Based

     10.00     14.48     16.75

At September 30, 2011, book value per share was $50.19, up $0.31, or 1%, compared to June 30, 2011. Tangible book value per share decreased $0.05, or less than 1%, over that period, to $37.12 at September 30, 2011.

On September 13, 2011, the Company declared a quarterly cash dividend of $0.34 per share. This dividend level equated to an annualized dividend rate of $1.36 per share and an indicated dividend yield of 2.65%, based on the closing stock price of the Company’s common stock of $51.30 per share on October 26, 2011. This price equated to 1.02 times September 30, 2011 book value per share of $50.19 and 1.38 times September 30, 2011 tangible book value per share of $37.12.

Interest Rate Risk Position

The Company’s interest rate risk modeling at September 30, 2011, indicated the Company is fairly balanced over a 12-month time frame. A 100 basis point instantaneous and parallel upward shift in interest rates at September 30, 2011, was estimated to increase net interest income over 12 months by approximately 2.0%. Similarly, a 100 basis point decrease in interest rates was expected to increase net interest income by approximately 0.3%. At September 30, 2011, approximately 51% of the Company’s total loan portfolio had fixed interest rates. Eliminating fixed rate loans that mature within a one-year time frame reduces this percentage to 48%. Approximately 77% of the Company’s time deposit base will re-price within 12 months from September 30, 2011.

Operating Results

On a linked quarter basis, the average earning asset yield increased 25 basis points, while the cost of interest bearing deposits and liabilities decreased 12 and 11 basis points, respectively. As a result, the tax-equivalent net interest spread and margin improved 35 and 34 basis points, respectively. The improvement in the yield on average earning assets was driven by the increase in yields on non-covered loans and FDIC covered loans net of the FDIC indemnification asset (the yield on average investment securities decreased two basis points on a linked quarter


6


basis). Average non-covered total loan yield increased 14 basis points, and the yield on net FDIC covered loans increased by 85 basis points, resulting in an improvement in the total loan yield, net of the FDIC indemnification asset, of 37 basis points. On a linked quarter basis, tax-equivalent net interest income grew $17 million, or 21%, as average earning assets climbed $880 million, or 9%, and the margin improved 34 basis points. On a linked quarter basis, the Company’s balance sheet expanded as a result of the Cameron and OMNI acquisitions and organic loan growth, partially offset by compression of the Covered Assets.

Quarterly Average Yields/Cost (Taxable Equivalent Basis)


     3Q10     4Q10     1Q11     2Q11     3Q11  

Earning Asset Yield

     4.13     4.16     4.47     4.17     4.42

Cost Of Int-Bearing Liabs

     1.44     1.27     1.10     1.09     0.98


Net Interest Spread

     2.70     2.89     3.37     3.09     3.44

Net Interest Margin

     2.91     3.10     3.55     3.28     3.62

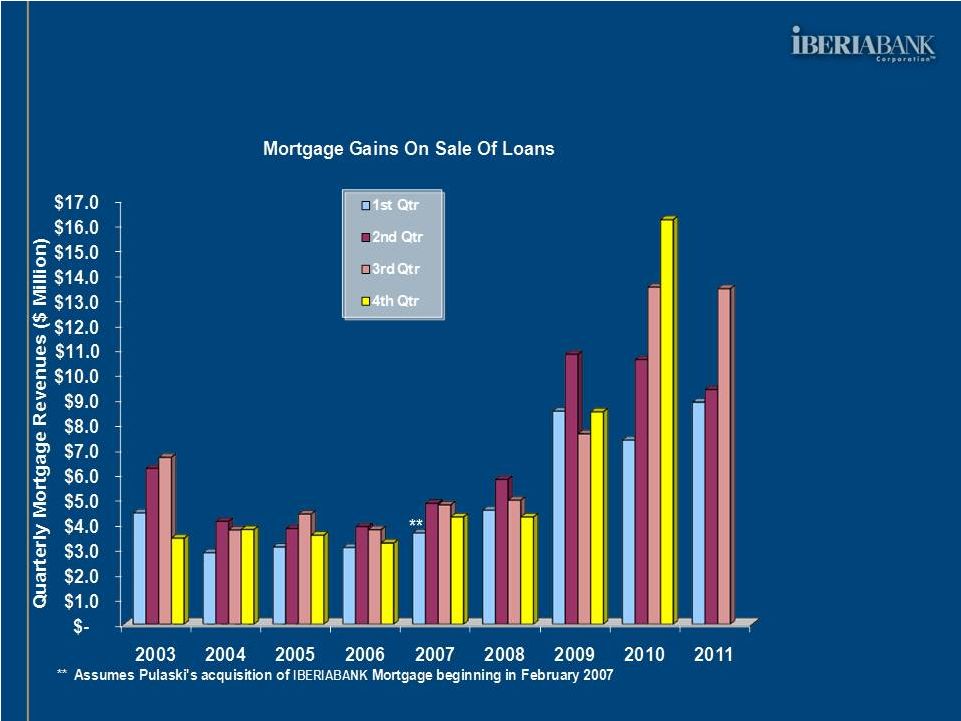
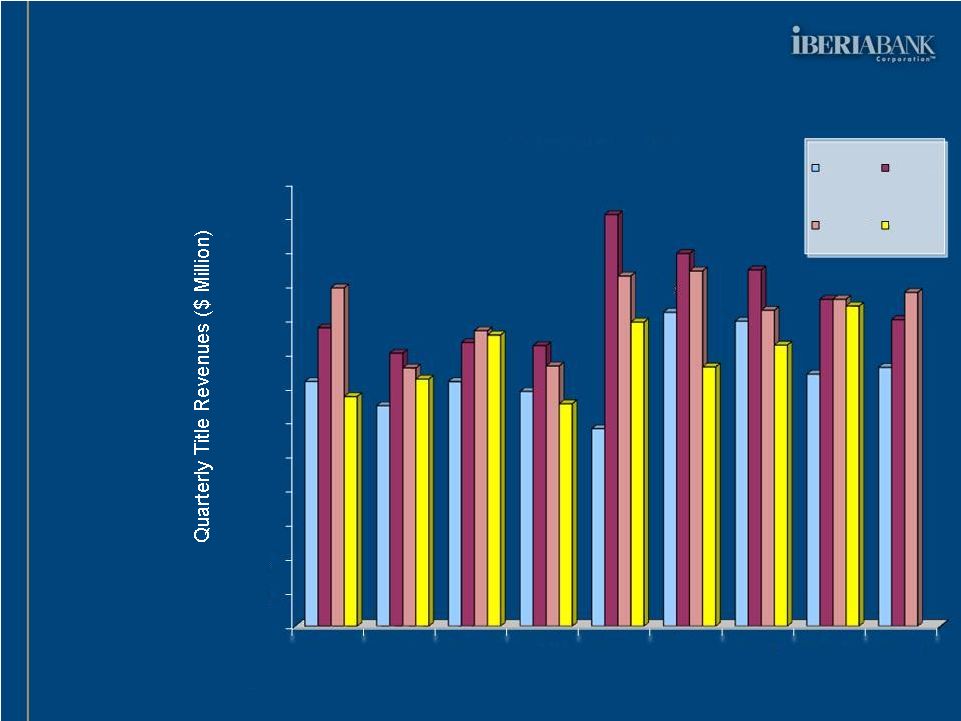
Aggregate noninterest income increased $6 million, or 20%, on a linked quarter basis. Mortgage revenues increased $4 million, or 43%, service charges on deposit accounts increased $1 million, or 17%, title revenue increased $408,000 (an increase of 9%), FDIC reimbursements on Covered Assets increased $452,000, and trust income rose 74% on a linked quarter basis.

The Company originated $504 million in mortgage loans during the third quarter of 2011, up $151 million, or 43%, on a linked quarter basis. Client loan refinancing opportunities accounted for approximately 37% of mortgage loan applications in the third quarter of 2011, compared to 19% in the second quarter of 2011, and approximately 50% between September 30, 2011, and October 21, 2011. The Company sold $447 million in mortgage loans during the third quarter of 2011, up $112 million, or 34%, compared to the second quarter of 2011. Sales margins remained fairly stable on a linked quarter basis. Gains on the sale of mortgage loans increased $4 million, or 43%, on a linked quarter basis. The mortgage origination pipeline was approximately $229 million at September 30, 2011, compared to $154 million at June 30, 2011, and approximately $225 million at October 21, 2011. Mortgage loan repurchases and make-whole payments were less than $0.3 million in each of the three quarters of 2011.

Noninterest expense increased $7 million, or 7%, on a linked quarter basis, excluding acquisition and conversion-related costs that totaled approximately $6 million in each the second and third quarters of 2011. Excluding acquisition and conversion-related costs, compensation and benefit costs increased $6 million on a linked quarter basis (an increase of 13%) and occupancy and equipment expense increased $1 million, or 13%. Influencing those linked quarter comparisons was the impact of increased operating expenses associated with the Cameron and OMNI franchises, which were acquired in May 2011 and the related conversions completed in June and July of 2011. In the second quarter of 2011, the Company incurred costs totaling approximately $3 million in association with a potential settlement on a class action lawsuit and a trust preferred securities prepayment premium; no similar costs were incurred in the third quarter of 2011.

The tangible efficiency ratio of IBERIABANK, excluding acquisition and conversion costs, was approximately 67% in the third quarter of 2011, compared to 75% in the second quarter of 2011.

IBERIABANK Corporation

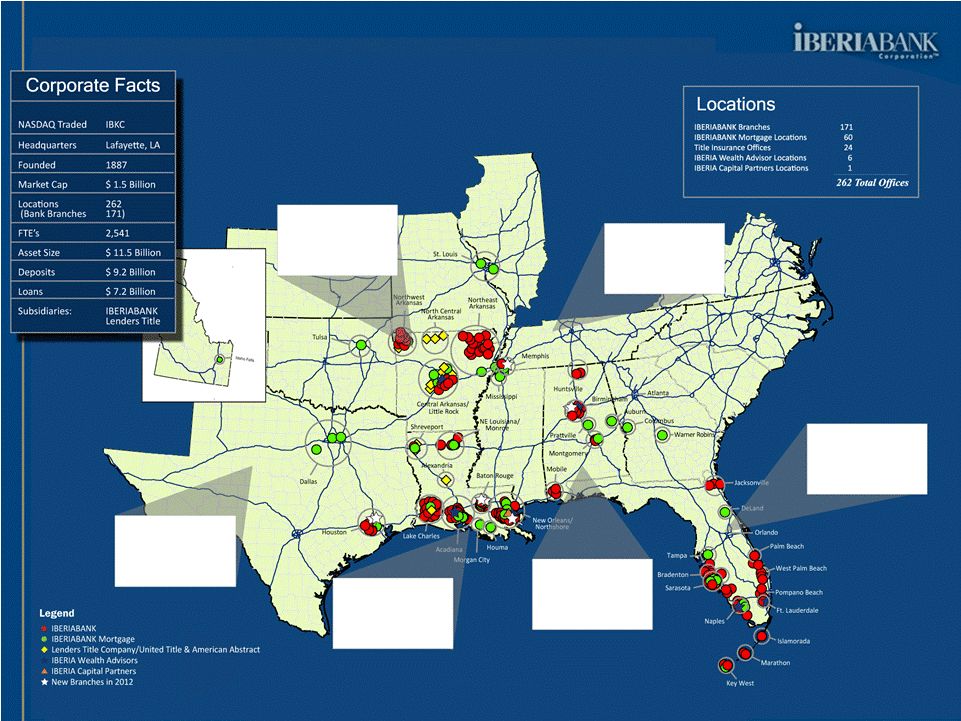
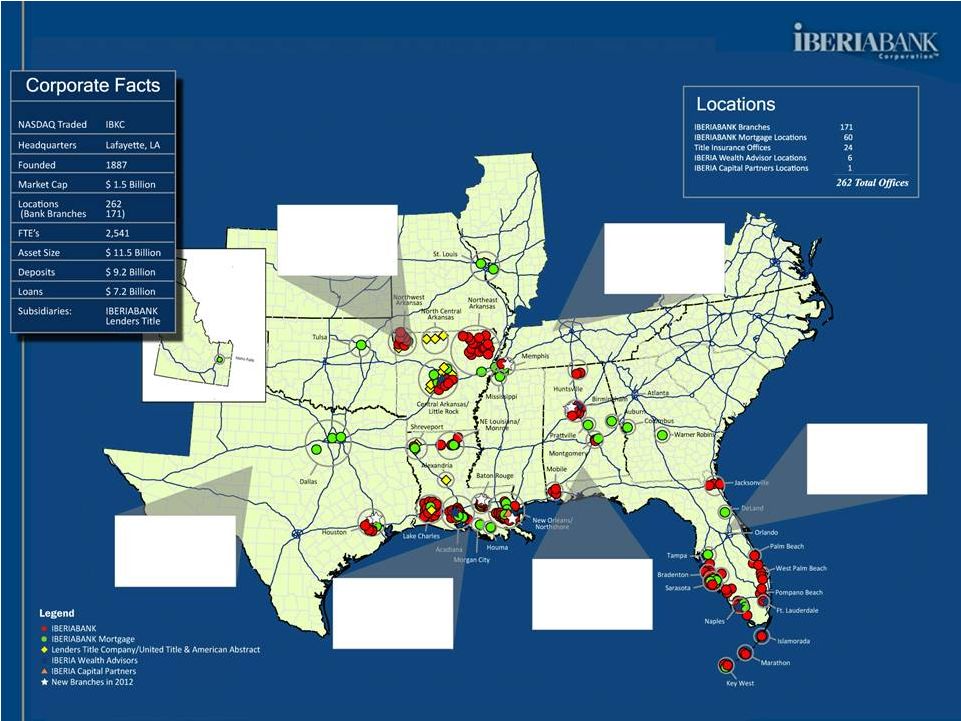
IBERIABANK Corporation is a financial holding company with 262 combined offices, including 171 bank branch offices in Louisiana, Arkansas, Tennessee, Alabama, Texas, and Florida, 24 title insurance offices in Arkansas and Louisiana, mortgage representatives in 60 locations in 12 states, six locations with representatives of IBERIA Wealth Advisors in four states, and one IBERIA Capital Partners, LLC office in New Orleans. The Company opened one new bank branch office since June 30, 2011, in Hoover, Alabama, and a new mortgage office in Slidell, Louisiana.


7


The Company’s common stock trades on the NASDAQ Global Select Market under the symbol “IBKC.” The Company’s market capitalization was approximately $1.5 billion, based on the NASDAQ closing stock price on October 26, 2011.

The following 13 investment firms currently provide equity research coverage on IBERIABANK Corporation:


B. Riley & Company


FIG Partners, LLC


Guggenheim Partners


Keefe, Bruyette & Woods


Morgan Keegan & Company, Inc.


Oppenheimer & Co., Inc.


Raymond James & Associates, Inc.


Robert W. Baird & Company


Stephens, Inc.


Sterne, Agee & Leach


Stifel Nicolaus & Company


SunTrust Robinson-Humphrey


Wunderlich Securities

Conference Call

In association with this earnings release, the Company will host a live conference call to discuss the financial results for the quarter just completed. The telephone conference call will be held on Thursday, October 27, 2011, beginning at 9:00 a.m. Central Time by dialing 1-877-777-1967. The confirmation code for the call is 218719. A replay of the call will be available until midnight Central Time on November 3, 2011 by dialing 1-800-475-6701. The confirmation code for the replay is 218719. The Company has prepared a PowerPoint presentation that supplements information contained in this press release. The PowerPoint presentation may be accessed on the Company’s web site, www.iberiabank.com, under “Investor Relations” and then “Presentations.”

Non-GAAP Financial Measures

This press release contains financial information determined by methods other than in accordance with GAAP. The Company’s management uses these non-GAAP financial measures in their analysis of the Company’s performance. These measures typically adjust GAAP performance measures to exclude the effects of the amortization of intangibles and include the tax benefit associated with revenue items that are tax-exempt, as well as adjust income available to common shareholders for certain significant activities or nonrecurring transactions. Since the presentation of these GAAP performance measures and their impact differ between companies, management believes presentations of these non-GAAP financial measures provide useful supplemental information that is essential to a proper understanding of the operating results of the Company’s core businesses. These non-GAAP disclosures should not be viewed as a substitute for operating results determined in accordance with GAAP, nor are they necessarily comparable to non-GAAP performance measures that may be presented by other companies. Reconciliations of GAAP to non-GAAP disclosures are included as tables at the end of this release.

Forward Looking Statements

To the extent that statements in this press release relate to future plans, objectives, financial results or performance of IBERIABANK Corporation, these statements are deemed to be forward-looking statements within the meaning of the Private Securities Litigation Reform Act of 1995. Such statements, which are based on management’s


8


current information, estimates and assumptions and the current economic environment, are generally identified by the use of the words “plan”, “believe”, “expect”, “intend”, “anticipate”, “estimate”, “project” or similar expressions. IBERIABANK Corporation’s actual strategies and results in future periods may differ materially from those currently expected due to various risks and uncertainties.

Actual results could differ materially because of factors such as the current level of market volatility and our ability to execute our growth strategy, including the availability of future FDIC-assisted failed bank opportunities, unanticipated losses related to the integration of, and accounting for, acquired businesses and assets and assumed liabilities in FDIC-assisted transactions, adjustments of fair values of acquired assets and assumed liabilities and of deferred taxes in FDIC-assisted acquisitions, credit risk of our customers, effects of the on-going correction in residential real estate prices and reduced levels of home sales, sufficiency of our allowance for loan losses, changes in interest rates, access to funding sources, reliance on the services of executive management, competition for loans, deposits and investment dollars, reputational risk and social factors, changes in government regulations and legislation, increases in FDIC insurance assessments, geographic concentration of our markets and economic conditions in these markets, rapid changes in the financial services industry, dependence on our operational, technological, and organizational infrastructure, hurricanes and other adverse weather events, the volatility and low trading volume of our common stock, and valuation of intangible assets. These and other factors that may cause actual results to differ materially from these forward-looking statements are discussed in the Company’s Annual Report on Form 10-K and other filings with the Securities and Exchange Commission (the “SEC”), available at the SEC’s website, http://www.sec.gov, and the Company’s website, http://www.iberiabank.com, under the heading “Investor Information.” All information in this release is as of the date of this release. The Company undertakes no duty to update any forward-looking statement to conform the statement to actual results or changes in the Company’s expectations.


9


IBERIABANK CORPORATION

FINANCIAL HIGHLIGHTS


    For The Quarter Ended     For The Quarter Ended  
    September 30,     June 30,  
    2011     2010     % Change     2011     % Change  

Income Data (in thousands):


Net Interest Income

  $ 92,435      $ 69,933        32   $ 75,965        22

Net Interest Income (TE) (1)

    94,778        71,702        32     78,008        21

Net Income

    17,299        13,940        24     5,186        234

Earnings Available to Common Shareholders - Basic

    17,299        13,940        24     5,186        234

Earnings Available to Common Shareholders - Diluted

    16,992        13,652        24     5,099        233

Per Share Data:


Earnings Available to Common Shareholders - Basic

  $ 0.58      $ 0.52        11   $ 0.19        212

Earnings Available to Common Shareholders - Diluted

    0.58        0.52        12     0.18        213

Book Value Per Common Share

    50.19        48.63        3     49.88        1

Tangible Book Value Per Common Share (2)

    37.12        38.76        (4 %)      37.17        (0 %) 

Cash Dividends

    0.34        0.34        —          0.34        —     

Closing Stock Price

    47.06        49.98        (6 %)      57.64        (18 %) 

Key Ratios: (3)


Operating Ratios:


Return on Average Assets

    0.59     0.52       0.20  

Return on Average Common Equity

    4.56     4.21       1.50  

Return on Average Tangible Common Equity (2)

    6.44     5.60       2.20  

Net Interest Margin (TE) (1)

    3.62     2.91       3.28  

Efficiency Ratio

    76.8     75.3       86.7  

Tangible Efficiency Ratio (TE) (1) (2)

    74.2     72.6       83.6  

Full-time Equivalent Employees

    2,541        2,097          2,560     

Capital Ratios:


Tangible Common Equity Ratio

    9.77     10.12       10.15  

Tangible Common Equity to Risk-Weighted Assets

    14.36     17.36       14.96  

Tier 1 Leverage Ratio

    10.55     10.85       12.01  

Tier 1 Capital Ratio

    15.49     18.77       16.06  

Total Risk Based Capital Ratio

    16.75     20.03       17.32  

Common Stock Dividend Payout Ratio

    57.7     65.5       198.1  

Asset Quality Ratios:


Excluding FDIC Covered Assets and SOP 03-3 acquired loans


Nonperforming Assets to Total Assets (4)

    0.95     0.81       0.84  

Allowance for Loan Losses to Loans

    1.33     1.43       1.28  

Net Charge-offs to Average Loans

    0.12     0.57       0.13  

Nonperforming Assets to Total Loans and OREO (4)

    1.55     1.51       1.36  
    For The Quarter Ended     For The Quarter Ended  
    September 30,     June 30,     March 31,     December 31,  
    2011     2011     2011     2011     2010  
Balance Sheet Summary (in thousands):   End of Period     Average     Average     Average     Average  

Excess Liquidity (5)

  $ 263,924      $ 217,447      $ 104,819      $ 217,017      $ 616,267   

Total Investment Securities

    2,057,359        2,152,993        2,061,814        2,030,287        2,014,934   

Loans, Net of Unearned Income

    7,226,324        7,219,398        6,511,894        6,051,841        5,799,144   

Loans, Net of Unearned Income, Excluding Covered Loans and SOP 03-3

    5,785,769        5,734,824        4,997,159        4,506,308        4,333,046   

Total Assets

    11,528,862        11,548,123        10,439,384        10,005,614        10,369,615   

Total Deposits

    9,190,029        9,169,770        8,246,544        7,893,757        8,134,590   

Total Shareholders’ Equity

    1,472,241        1,505,366        1,387,239        1,313,138        1,314,184   


(1) 

Fully taxable equivalent (TE) calculations include the tax benefit associated with related income sources that are tax-exempt using a marginal tax rate of 35%.

(2) 

Tangible calculations eliminate the effect of goodwill and acquisition related intangible assets and the corresponding amortization expense on a tax-effected basis where applicable.

(3) 

All ratios are calculated on an annualized basis for the period indicated.

(4) 

Nonperforming assets consist of nonaccruing loans, accruing loans 90 days or more past due and other real estate owned, including repossessed assets.

(5) 

Excess Liquidity includes interest-bearing deposits in banks and fed funds sold.


IBERIABANK CORPORATION

CONDENSED CONSOLIDATED FINANCIAL INFORMATION

(dollars in thousands except per share data)


BALANCE SHEET (End of Period)

  September 30,     June 30,  
    2011     2010     % Change     2011     % Change  

ASSETS


Cash and Due From Banks

  $ 206,464      $ 99,670        107.1   $ 193,360        6.8

Interest-bearing Deposits in Banks

    263,924        804,012        (67.2 %)      68,444        285.6


Total Cash and Equivalents

    470,388        903,682        (47.9 %)      261,804        79.7

Investment Securities Available for Sale

    1,776,826        1,587,088        12.0     1,937,169        (8.3 %) 

Investment Securities Held to Maturity

    280,533        320,707        (12.5 %)      278,192        0.8


Total Investment Securities

    2,057,359        1,907,795        7.8     2,215,361        (7.1 %) 

Mortgage Loans Held for Sale

    131,726        171,545        (23.2 %)      75,615        74.2

Loans, Net of Unearned Income

    7,226,324        5,791,378        24.8     7,200,646        0.4

Allowance for Loan Losses

    (175,320     (131,954     32.9     (169,988     3.1


Loans, net

    7,051,004        5,659,424        24.6     7,030,658        0.3

Loss Share Receivable

    601,862        906,014        (33.6 %)      670,465        (10.2 %) 

Premises and Equipment

    280,709        201,626        39.2     275,502        1.9

Goodwill and Other Intangibles

    383,612        265,477        44.5     383,969        (0.1 %) 

Other Assets

    552,202        540,738        2.1     539,046        2.4


Total Assets

  $ 11,528,862      $ 10,556,301        9.2   $ 11,452,420        0.7


LIABILITIES AND SHAREHOLDERS’ EQUITY


Noninterest-bearing Deposits

  $ 1,414,520      $ 856,882        65.1   $ 1,322,546        7.0

NOW Accounts

    1,688,310        1,254,514        34.6     1,638,839        3.0

Savings and Money Market Accounts

    3,359,711        3,013,378        11.5     3,283,793        2.3

Certificates of Deposit

    2,727,488        3,139,381        (13.1 %)      2,828,344        (3.6 %) 


Total Deposits

    9,190,029        8,264,155        11.2     9,073,522        1.3

Short-term Borrowings

    —          30,190        (100.0 %)      10,000        (100.0 %) 

Securities Sold Under Agreements to Repurchase

    214,824        259,058        (17.1 %)      205,778        4.4

Trust Preferred Securities

    111,862        111,337        0.5     111,862        0.0

Other Long-term Debt

    350,120        329,578        6.2     351,154        (0.3 %) 

Other Liabilities

    189,786        255,131        (25.6 %)      193,116        (1.7 %) 


Total Liabilities

    10,056,621        9,249,449        8.7     9,945,432        1.1

Total Shareholders’ Equity

    1,472,241        1,306,852        12.7     1,506,988        (2.3 %) 


Total Liabilities and Shareholders’ Equity

  $ 11,528,862      $ 10,556,301        9.2   $ 11,452,420        0.7


BALANCE SHEET (Average)

  September 30,     June 30,     March 31,     December 31,     September 30,  
    2011     2011     2011     2010     2010  

ASSETS


Cash and Due From Banks

  $ 199,610      $ 157,412      $ 145,062      $ 100,550      $ 95,687   

Interest-bearing Deposits in Banks

    217,423        104,800        211,773        608,927        959,540   

Investment Securities

    2,152,993        2,061,814        2,030,287        2,014,934        1,919,056   

Mortgage Loans Held for Sale

    87,769        56,783        47,883        127,723        131,944   

Loans, Net of Unearned Income

    7,219,398        6,511,894        6,051,841        5,799,144        5,830,711   

Allowance for Loan Losses

    (172,030     (147,889     (135,525     (129,082     (92,941

Loss Share Receivable

    626,551        666,159        708,809        899,558        865,810   

Other Assets

    1,216,409        1,028,411        945,484        947,861        931,381   


Total Assets

  $ 11,548,123      $ 10,439,384      $ 10,005,614      $ 10,369,615      $ 10,641,188   


LIABILITIES AND SHAREHOLDERS’ EQUITY


Noninterest-bearing Deposits

  $ 1,368,014      $ 1,090,281      $ 901,529      $ 881,634      $ 840,765   

NOW Accounts

    1,682,568        1,472,547        1,338,437        1,269,316        1,281,554   

Savings and Money Market Accounts

    3,350,035        3,053,046        2,922,483        2,995,002        2,953,907   

Certificates of Deposit

    2,769,153        2,630,670        2,731,308        2,988,638        3,204,675   


Total Deposits

    9,169,770        8,246,544        7,893,757        8,134,590        8,280,901   

Short-term Borrowings

    —          21,919        —          3,234        17,402   

Securities Sold Under Agreements to Repurchase

    218,290        200,565        216,494        233,116        214,411   

Trust Preferred Securities

    111,862        106,944        109,119        111,292        136,107   

Long-term Debt

    352,610        315,570        307,964        324,528        431,059   

Other Liabilities

    190,225        160,603        165,142        248,671        248,739   


Total Liabilities

    10,042,757        9,052,145        8,692,476        9,055,431        9,328,619   

Total Shareholders’ Equity

    1,505,366        1,387,239        1,313,138        1,314,184        1,312,569   


Total Liabilities and Shareholders’ Equity

  $ 11,548,123      $ 10,439,384      $ 10,005,614      $ 10,369,615      $ 10,641,188   


IBERIABANK CORPORATION

CONDENSED CONSOLIDATED FINANCIAL INFORMATION

(dollars in thousands except per share data)


    For The Three Months Ended  

INCOME STATEMENT

  September 30,     June 30,  
    2011     2010     % Change     2011     % Change  

Interest Income

  $ 113,430      $ 99,818        13.6   $ 97,127        16.8

Interest Expense

    20,995        29,885        (29.7 %)      21,162        (0.8 %) 


Net Interest Income

    92,435        69,933        32.2     75,965        21.7

Provision for Loan Losses

    6,127        5,128        19.5     9,990        (38.7 %) 


Net Interest Income After Provision for Loan Losses

    86,308        64,805        33.2     65,975        30.8

Service Charges

    7,448        6,085        22.4     6,343        17.4

ATM / Debit Card Fee Income

    3,132        2,562        22.2     2,966        5.6

BOLI Proceeds and Cash Surrender Value Income

    924        726        27.2     748        23.6

Gain on Acquisition

    —          —          0.0     —          0.0

Gain on Sale of Loans, net

    13,438        13,518        (0.6 %)      9,389        43.1

Gain (Loss) on Sale of Investments, net

    1,206        4,176        (71.1 %)      1,428        (15.6 %) 

Title Revenue

    4,900        4,852        1.0     4,492        9.1

Broker Commissions

    2,501        2,320        7.8     2,624        (4.7 %) 

Other Noninterest Income

    3,571        2,542        40.5     2,998        19.1


Total Noninterest Income

    37,120        36,781        0.9     30,988        19.8

Salaries and Employee Benefits

    52,679        40,932        28.7     46,048        14.4

Occupancy and Equipment

    14,017        8,779        59.7     12,067        16.2

Amortization of Acquisition Intangibles

    1,385        1,316        5.2     1,183        17.2

Other Noninterest Expense

    31,485        29,343        7.3     33,409        (5.8 %) 


Total Noninterest Expense

    99,566        80,371        23.9     92,706        7.4

Income Before Income Taxes

    23,862        21,215        12.5     4,257        460.6

Income Taxes

    6,563        7,275        (9.8 %)      (929     806.2


Net Income

  $ 17,299      $ 13,940        24.1   $ 5,186        233.6


Preferred Stock Dividends

    —          —          —          —          —     


Earnings Available to Common Shareholders - Basic

    17,299        13,940        24.1     5,186        233.6


Earnings Allocated to Unvested Restricted Stock

    (307     (288     6.6     (87     252.6


Earnings Available to Common Shareholders - Diluted

    16,992        13,652        24.5     5,099        233.2


Earnings Per Share, diluted

  $ 0.58      $ 0.52        11.7   $ 0.18        212.9


Impact of Merger-related Expenses

  $ 0.12      $ 0.04        249.8   $ 0.15        (18.3 %) 


Earnings Per Share, diluted, Excluding Merger-related Expenses

  $ 0.70      $ 0.56        261.6   $ 0.33        114.8


NUMBER OF SHARES OUTSTANDING


Basic Shares (Average)

    29,908,906        26,840,723        11.4     28,015,846        6.8

Diluted Shares (Average)

    29,472,519        26,460,084        11.4     27,677,313        6.5

Book Value Shares (Period End) (1)

    29,332,856        26,872,742        9.2     30,214,550        (2.9 %) 
    2011     2010  

INCOME STATEMENT

  Third     Second     First     Fourth     Third  
    Quarter     Quarter     Quarter     Quarter     Quarter  

Interest Income

  $ 113,430      $ 97,127      $ 99,434      $ 97,716      $ 99,818   

Interest Expense

    20,995        21,162        20,686        25,367        29,885   


Net Interest Income

    92,435        75,965        78,748        72,349        69,933   

Provision for Loan Losses

    6,127        9,990        5,471        11,224        5,128   


Net Interest Income After Provision for Loan Losses

    86,308        65,975        73,277        61,125        64,805   

Total Noninterest Income

    37,120        30,988        28,295        38,052        36,781   

Total Noninterest Expense

    99,566        92,706        81,732        81,102        80,371   


Income Before Income Taxes

    23,862        4,257        19,840        18,075        21,215   

Income Taxes

    6,563        (929     5,193        5,033        7,275   


Net Income

  $ 17,299      $ 5,186      $ 14,647      $ 13,042      $ 13,940   


Preferred Stock Dividends

    —          —          —          —          —     


Earnings Available to Common Shareholders - Basic

    17,299        5,186        14,647        13,042        13,940   


Earnings Allocated to Unvested Restricted Stock

    (307     (87     (291     (261     (288


Earnings Available to Common Shareholders - Diluted

  $ 16,992      $ 5,099      $ 14,356      $ 12,781      $ 13,652   


Earnings Per Share, basic

  $ 0.58      $ 0.19      $ 0.54      $ 0.49      $ 0.52   


Earnings Per Share, diluted

  $ 0.58      $ 0.18      $ 0.54      $ 0.48      $ 0.52   


Book Value Per Common Share

  $ 50.19      $ 49.88      $ 48.68      $ 48.50      $ 48.63   

Tangible Book Value Per Common Share

  $ 37.12      $ 37.17      $ 38.95      $ 38.68      $ 38.76   

Return on Average Assets

    0.59     0.20     0.59     0.50     0.52

Return on Average Common Equity

    4.56     1.50     4.52     3.94     4.21

Return on Average Tangible Common Equity

    6.44     2.20     5.95     5.26     5.60


(1) Shares used for book value purposes exclude shares held in treasury at the end of the period.


IBERIABANK CORPORATION

CONDENSED CONSOLIDATED FINANCIAL INFORMATION

(dollars in thousands except per share data)


     For The Nine Months Ended  

INCOME STATEMENT

   September 30,  
     2011     2010     % Change  

Interest Income

   $ 309,991      $ 298,655        3.8

Interest Expense

     62,842        89,377        (29.7 %) 


Net Interest Income

     247,149        209,278        18.1

Provision for Loan Losses

     21,589        31,227        (30.9 %) 


Net Interest Income After Provision for Loan Losses

     225,560        178,051        26.7

Service Charges

     19,303        18,361        5.1

ATM / Debit Card Fee Income

     9,011        7,444        21.0

BOLI Proceeds and Cash Surrender Value Income

     2,397        2,153        11.4

Gain on Acquisition

     —          3,781        (100.0 %) 

Gain on Sale of Loans, net

     31,719        31,517        0.6

Gain (Loss) on Sale of Investments, net

     2,682        5,158        (48.0 %) 

Title Revenue

     13,202        13,368        (1.2 %) 

Broker Commissions

     7,767        5,204        49.3

Other Noninterest Income

     10,322        8,851        16.6


Total Noninterest Income

     96,403        95,837        0.6

Salaries and Employee Benefits

     142,356        116,323        22.4

Occupancy and Equipment

     35,196        24,493        43.7

Amortization of Acquisition Intangibles

     3,737        3,595        3.9

Other Noninterest Expense

     92,715        78,736        17.8


Total Noninterest Expense

     274,004        223,147        22.8

Income Before Income Taxes

     47,959        50,741        (5.5 %) 

Income Taxes

     10,827        14,958        (27.6 %) 


Net Income

   $ 37,132      $ 35,783        3.8


Preferred Stock Dividends

     —          —          —     


Earnings Available to Common Shareholders - Basic

     37,132        35,783        3.8


Earnings Allocated to Unvested Restricted Stock

     (682     (716     (4.8 %) 


Earnings Available to Common Shareholders - Diluted

     36,450        35,067        3.9


Earnings Per Share, diluted

   $ 1.31      $ 1.40        (6.8 %) 


Impact of Merger-related Expenses

   $ 0.31      $ 0.19        65.3


Earnings Per Share, diluted, Excluding Merger-related Expenses

   $ 1.62      $ 1.59        58.5


IBERIABANK CORPORATION

CONDENSED CONSOLIDATED FINANCIAL INFORMATION

(dollars in thousands)


LOANS RECEIVABLE

   September 30,     June 30,  
     2011     2010     % Change     2011     % Change  

Residential Mortgage Loans:


Residential 1-4 Family

   $ 511,524      $ 647,657        (21.0 %)    $ 546,339        (6.4 %) 

Construction/ Owner Occupied

     17,256        14,564        18.5     17,694        (2.5 %) 


Total Residential Mortgage Loans

     528,780        662,221        (20.2 %)      564,033        (6.3 %) 

Commercial Loans:


Real Estate

     3,335,650        2,483,420        34.3     3,398,830        (1.9 %) 

Business

     1,884,056        1,415,088        33.1     1,762,719        6.9


Total Commercial Loans

     5,219,706        3,898,508        33.9     5,161,549        1.1

Consumer Loans:


Indirect Automobile

     260,002        266,859        (2.6 %)      247,103        5.2

Home Equity

     1,022,134        821,608        24.4     1,006,113        1.6

Automobile

     36,753        30,511        20.5     34,331        7.1

Credit Card Loans

     45,700        42,370        7.9     45,461        0.5

Other

     113,249        69,301        63.4     142,056        (20.3 %) 


Total Consumer Loans

     1,477,838        1,230,649        20.1     1,475,064        0.2


Total Loans Receivable

     7,226,324        5,791,378        24.8     7,200,646        0.4


Allowance for Loan Losses

     (175,320     (131,954       (169,988  


Loans Receivable, Net

   $ 7,051,004      $ 5,659,424        $ 7,030,658     


ASSET QUALITY DATA (1)

   September 30,     June 30,  
     2011     2010     % Change     2011     % Change  

Nonaccrual Loans

   $ 805,247      $ 871,353        (7.6 %)    $ 790,953        1.8

Foreclosed Assets

     32        173        (81.6 %)      18        81.6

Other Real Estate Owned

     123,275        57,322        115.1     117,724        4.7

Accruing Loans More Than 90 Days Past Due

     24,741        43,593        (43.2 %)      23,070        7.2


Total Nonperforming Assets

   $ 953,295      $ 972,441        (2.0 %)    $ 931,765        2.3


Loans 30-89 Days Past Due

     74,604        89,786        (16.9 %)      86,880        (14.1 %) 

Nonperforming Assets to Total Assets

     8.27     9.21     (10.2 %)      8.14     1.6

Nonperforming Assets to Total Loans and OREO

     12.97     16.63     (22.0 %)      12.73     1.9

Allowance for Loan Losses to Nonperforming Loans (4)

     21.1     14.4     46.5     20.9     1.2

Allowance for Loan Losses to Nonperforming Assets

     18.4     13.6     35.5     18.2     0.8

Allowance for Loan Losses to Total Loans

     2.43     2.28     6.5     2.36     2.8

Year to Date Charge-offs

   $ 10,186      $ 22,638        (55.0 %)    $ 5,962        N/M   

Year to Date Recoveries

     (7,352     (6,103     20.5     (5,008     N/M   


Year to Date Net Charge-offs (Recoveries)

   $ 2,834      $ 16,535        (82.9 %)    $ 954        N/M   


Quarter to Date Net Charge-offs (Recoveries)

   $ 1,880      $ 5,330        (64.7 %)    $ 1,718        9.4


(1) 

For purposes of this table, nonperforming assets include all loans meeting nonperforming asset criteria, including assets acquired in FDIC-assisted transactions.

(2) 

Troubled debt restructurings meeting past due and nonaccruing criteria are included in loans past due and nonaccrual loans above.

(3) 

Current troubled debt restructurings are defined as troubled debt restructurings not past due or on nonaccrual status for the respective periods.

(4) 

Nonperforming loans consist of nonaccruing loans and accruing loans 90 days or more past due.


N/M - Comparison of the information presented is not meaningful given the periods presented


IBERIABANK CORPORATION (EXCLUDING COVERED ASSETS AND SOP 03-3)

CONDENSED CONSOLIDATED FINANCIAL INFORMATION

(dollars in thousands)


LOANS RECEIVABLE (Ex-Covered Assets and SOP 03-3) (1)

   September 30,     June 30,  
     2011     2010     % Change     2011     % Change  

Residential Mortgage Loans:


Residential 1-4 Family

   $ 288,009      $ 392,130        (26.6 %)    $ 312,022        (7.7 %) 

Construction/ Owner Occupied

     17,256        14,564        18.5     17,694        (2.5 %) 


Total Residential Mortgage Loans

     305,265        406,694        (24.9 %)      329,716        (7.4 %) 

Commercial Loans:


Real Estate

     2,574,754        1,712,216        50.4     2,577,101        (0.1 %) 

Business

     1,680,612        1,234,636        36.1     1,554,493        8.1


Total Commercial Loans

     4,255,366        2,946,852        44.4     4,131,594        3.0

Consumer Loans:


Indirect Automobile

     259,789        266,859        (2.6 %)      247,103        5.1

Home Equity

     779,925        516,544        51.0     742,560        5.0

Automobile

     36,750        30,511        20.4     34,330        7.0

Credit Card Loans

     44,710        41,242        8.4     44,438        0.6

Other

     103,964        70,685        47.1     133,770        (22.3 %) 


Total Consumer Loans

     1,225,138        925,841        32.3     1,202,201        1.9


Total Loans Receivable

     5,785,769        4,279,386        35.2     5,663,511        2.2


Allowance for Loan Losses

     (76,864     (61,377       (72,273  


Loans Receivable, Net

   $ 5,708,905      $ 4,218,009        $ 5,591,238     


ASSET QUALITY DATA (Ex-Covered Assets) (1)

   September 30,     June 30,  
     2011     2010     % Change     2011     % Change  

Nonaccrual Loans

   $ 70,833      $ 41,081        72.4   $ 56,434        25.5

Foreclosed Assets

     32        20        63.2     17        86.9

Other Real Estate Owned

     17,777        16,948        4.9     18,443        (3.6 %) 

Accruing Loans More Than 90 Days Past Due

     1,149        6,817        (83.1 %)      2,191        (47.5 %) 


Total Nonperforming Assets

   $ 89,791      $ 64,866        38.4   $ 77,085        16.5


Loans 30-89 Days Past Due

     25,677        15,578        64.8     21,234        20.9

Troubled Debt Restructurings (2)

     29,105        17,632        65.1     22,519        29.2

Current Troubled Debt Restructurings (3)

     1,415        13,650        (89.6 %)      94        1402.6

Nonperforming Assets to Total Assets

     0.95     0.81     18.1     0.84     14.1

Nonperforming Assets to Total Loans and OREO

     1.55     1.51     3.0     1.36     14.3

Allowance for Loan Losses to Nonperforming Loans (4)

     106.8     128.1     (16.7 %)      123.3     (13.4 %) 

Allowance for Loan Losses to Nonperforming Assets

     85.6     94.6     (9.5 %)      93.8     (8.7 %) 

Allowance for Loan Losses to Total Loans

     1.33     1.43     (7.4 %)      1.28     3.8

Year to Date Charge-offs

   $ 9,516      $ 22,316        (57.4 %)    $ 5,466        N/M   

Year to Date Recoveries

     (6,562     (6,071     8.1     (4,493     N/M   


Year to Date Net Charge-offs (Recoveries)

   $ 2,954      $ 16,245        (81.8 %)    $ 973        N/M   


Quarter to Date Net Charge-offs (Recoveries)

   $ 1,711      $ 6,123        (72.1 %)    $ 1,628        5.1


(1) 

For purposes of this table, loan balances and nonperforming assets exclude assets acquired in FDIC-assisted transactions and acquired impaired loans from OMNI and Cameron.

(2) 

Troubled debt restructurings meeting past due and nonaccruing criteria are included in loans past due and nonaccrual loans above.

(3) 

Current troubled debt restructurings are defined as troubled debt restructurings not past due for the respective periods.

(4) 

Nonperforming loans consist of nonaccruing loans and accruing loans 90 days or more past due.

N/M - Comparison of the information presented is not meaningful given the periods presented


IBERIABANK CORPORATION

CONDENSED CONSOLIDATED FINANCIAL INFORMATION

Taxable Equivalent Basis

(dollars in thousands)


    For The Quarter Ended  
    September 30, 2011     June 30, 2011     September 30, 2010  
    Average
Balance
    Average
Yield/Rate (%)
    Average
Balance
    Average
Yield/Rate (%)
    Average
Balance
    Average
Yield/Rate (%)
 
ASSETS            

Earning Assets:


Loans Receivable:


Mortgage Loans

  $ 547,458        6.87   $ 580,273        6.15   $ 710,112        7.42

Commercial Loans (TE) (1)

    5,201,711        5.23     4,559,315        6.49     3,918,158        5.88

Consumer and Other Loans

    1,470,229        6.38     1,372,306        5.44     1,202,442        6.21


Total Loans

    7,219,398        5.59     6,511,894        6.24     5,830,712        6.14

Loss Share Receivable

    626,551        -1.63     666,159        -10.88     865,810        -2.27


Total Loans and Loss Share Receivable

    7,845,949        5.02     7,178,053        4.65     6,696,522        5.05

Mortgage Loans Held for Sale

    87,769        4.19     56,783        4.53     131,944        4.26

Investment Securities (TE) (1)(2)

    2,110,070        2.72     2,041,303        2.74     1,843,511        2.90

Other Earning Assets

    278,771        0.78     166,528        1.00     1,032,387        0.36


Total Earning Assets

    10,322,559        4.42     9,442,667        4.17     9,704,364        4.13

Allowance for Loan Losses

    (172,030       (147,889       (92,941  

Nonearning Assets

    1,397,594          1,144,606          1,029,765     


Total Assets

  $ 11,548,123        $ 10,439,384        $ 10,641,188     


LIABILITIES AND SHAREHOLDERS’ EQUITY


Interest-bearing liabilities


Deposits:


NOW Accounts

  $ 1,682,568        0.45   $ 1,472,547        0.54   $ 1,281,554        0.67

Savings and Money Market Accounts

    3,350,035        0.69     3,053,046        0.76     2,953,907        1.18

Certificates of Deposit

    2,769,153        1.43     2,630,670        1.58     3,204,675        1.71


Total Interest-bearing Deposits

    7,801,756        0.90     7,156,263        1.02     7,440,136        1.32

Short-term Borrowings

    218,290        0.28     222,484        0.25     231,813        0.39

Long-term Debt

    464,472        2.63     422,514        2.71     567,166        3.35


Total Interest-bearing Liabilities

    8,484,518        0.98     7,801,261        1.09     8,239,115        1.44

Noninterest-bearing Demand Deposits

    1,368,014          1,090,281          840,765     

Noninterest-bearing Liabilities

    190,225          160,603          248,727     


Total Liabilities

    10,042,757          9,052,145          9,328,607     

Shareholders’ Equity

    1,505,366          1,387,239          1,312,581     


Total Liabilities and Shareholders’ Equity

  $ 11,548,123        $ 10,439,384        $ 10,641,188     


Net Interest Spread

  $ 92,435        3.44   $ 75,965        3.09   $ 69,933        2.70

Tax-equivalent Benefit

    2,343        0.09     2,043        0.08     1,769        0.07

Net Interest Income (TE) / Net Interest Margin (TE) (1)

  $ 94,778        3.62   $ 78,008        3.28   $ 71,702        2.91


(1)

Fully taxable equivalent (TE) calculations include the tax benefit associated with related income sources that are tax-exempt using a marginal tax rate of 35%.

(2)

Balances exclude unrealized gain or loss on securities available for sale and impact of trade date accounting.


IBERIABANK CORPORATION

CONDENSED CONSOLIDATED FINANCIAL INFORMATION

Taxable Equivalent Basis

(dollars in thousands)


     For The Nine Months Ended  
     September 30, 2011     September 30, 2010  
     Average
Balance
    Average
Yield/Rate (%)
    Average
Balance
    Average
Yield/Rate (%)
 

ASSETS


Earning Assets:


Loans Receivable:


Mortgage Loans

   $ 579,197        6.85   $ 867,399        6.75

Commercial Loans (TE) (1)

     4,651,752        6.13     3,754,208        5.85

Consumer and Other Loans

     1,367,705        6.63     1,107,893        6.49


Total Loans

     6,598,654        6.30     5,729,500        6.11

Loss Share Receivable

     666,872        -8.47     937,261        -0.62


Total Loans and Loss Share Receivable

     7,265,526        5.36     6,666,761        5.57

Mortgage Loans Held for Sale

     64,291        5.02     88,716        4.45

Investment Securities (TE) (1)(2)

     2,053,004        2.67     1,653,686        3.16

Other Earning Assets

     240,755        0.77     942,559        0.30


Total Earning Assets

     9,623,576        4.36     9,351,722        4.31

Allowance for Loan Losses

     (151,948       (70,453  

Nonearning Assets

     1,198,396          999,472     


Total Assets

   $ 10,670,024        $ 10,280,741     


LIABILITIES AND SHAREHOLDERS’ EQUITY


Interest-bearing liabilities


Deposits:


NOW Accounts

   $ 1,499,111        0.52   $ 1,341,581        0.72

Savings and Money Market Accounts

     3,110,088        0.74     2,680,060        1.44

Certificates of Deposit

     2,710,515        1.57     3,132,881        1.61


Total Interest-bearing Deposits

     7,319,714        1.00     7,154,522        1.38

Short-term Borrowings

     219,096        0.25     209,297        0.39

Long-term Debt

     434,863        2.32     647,229        3.03


Total Interest-bearing Liabilities

     7,973,673        1.05     8,011,048        1.49

Noninterest-bearing Demand Deposits

     1,121,650          828,294     

Noninterest-bearing Liabilities

     172,082          213,343     


Total Liabilities

     9,267,405          9,052,685     

Shareholders’ Equity

     1,402,619          1,228,056     


Total Liabilities and Shareholders’ Equity

   $ 10,670,024        $ 10,280,741     


Net Interest Spread

   $ 247,149        3.30   $ 209,278        2.82

Tax-equivalent Benefit

     5,832        0.08     6,193        0.08

Net Interest Income (TE) / Net Interest Margin (TE) (1)

   $ 252,981        3.48   $ 215,471        3.04


(1)

Fully taxable equivalent (TE) calculations include the tax benefit associated with related income sources that are tax-exempt using a marginal tax rate of 35%.

(2)

Balances exclude unrealized gain or loss on securities available for sale and impact of trade date accounting.


IBERIABANK CORPORATION

RECONCILIATION OF NON-GAAP FINANCIAL MEASURES

(dollars in thousands)


     For The Quarter Ended  
     9/30/2011     6/30/2011     9/30/2010  

Net Interest Income

   $ 92,435      $ 75,965      $ 69,933   

Effect of Tax Benefit on Interest Income

     2,343        2,043        1,769   


Net Interest Income (TE) (1)

     94,778        78,008        71,702   


Noninterest Income

     37,120        30,988        36,781   

Effect of Tax Benefit on Noninterest Income

     498        403        391   


Noninterest Income (TE) (1)

     37,618        31,391        37,172   


Total Revenues (TE) (1)

   $ 132,396      $ 109,399      $ 108,874   


Total Noninterest Expense

   $ 99,566      $ 92,706      $ 80,371   

Less Intangible Amortization Expense

     (1,385     (1,183     (1,316


Tangible Operating Expense (2)

   $ 98,181      $ 91,523      $ 79,055   


Return on Average Common Equity

     4.56     1.50     4.21

Effect of Intangibles (2)

     1.88     0.70     1.39


Return on Average Tangible Common Equity (2)

     6.44     2.20     5.60


Efficiency Ratio

     76.9     86.7     75.3

Effect of Tax Benefit Related to Tax Exempt Income

     (1.7 %)      (2.0 %)      (1.5 %) 


Efficiency Ratio (TE) (1) 

     75.2     84.7     73.8

Effect of Amortization of Intangibles

     (1.0 %)      (1.1 %)      (1.2 %) 


Tangible Efficiency Ratio (TE) (1) (2)

     74.2     83.6     72.6


(1) 

Fully taxable equivalent (TE) calculations include the tax benefit associated with related income sources that are tax-exempt using a marginal tax rate of 35%.

(2) 

Tangible calculations eliminate the effect of goodwill and acquisition related intangible assets and the corresponding amortization expense on a tax-effected basis where applicable.

EX-99.2 3 d248190dex992.htm EXHIBIT 99.2 Exhibit 99.2
3Q11 Earnings Conference Call
Supplemental Materials
October 26, 2011
October 26, 2011
Exhibit 99.2


2
Safe Harbor Language
Statements contained in this presentation which are not
historical facts and which pertain to future operating
results of IBERIABANK Corporation and its subsidiaries
constitute “forward-looking statements” within the
meaning of the Private Securities Litigation Reform Act of
1995. These forward-looking statements involve
significant risks and uncertainties.  Actual results may
differ materially from the results discussed in these
forward-looking statements.  Factors that might cause
such a difference include, but are not limited to, those
discussed in the Company’s periodic filings with the SEC.


Introductory Comments
3


Introductory Comments
Summary –
Position
Favorable Balance Sheet Composition
Very Balanced; Core Funded; Low C&D Exposure
Continued Good Asset Quality; Extraordinary Capital
Favorable Interest Rate And Credit Risk Positioning
Some of the Highest Capital Ratios of Bank Holding
Companies With More Than $5 Billion in Assets
Legacy Deposit Growth in 3Q11 And Improved Deposit Mix
Future Growth Engines in Multiple Markets
Strategic Recruiting Continued During The 3
rd
Quarter
Fortunately, We Avoided What Ails The Banking Industry
Remain Well Positioned For Future Opportunities
4


IBKC Overview
IBKC Overview
Our Locations
5
Deposit Market Share as of  June 30, 2011. Source: SNL Financial. Map Reflects Locations as of  October 24,2011.
*Other Mortgage Locations not shown = 9
Arkansas
34 Branches
$1.0 bil deposits
#12 Rank
32 Non-bank Offices
Texas
4 Branches
$185 mm deposits
#227 Rank
3 Non-bank Offices
Louisiana
78 Branches
$5.1 bil deposits
#5 Rank
31 Non-bank Offices
Alabama
12 Branches
$500 mm deposits
#20 Rank
5 Non-bank Offices
Florida
42 Branches
$2.3 bil deposits
#24 Rank
10 Non-bank Offices
Tennessee
2 Branches
$155 mm deposits
#113 Rank
1 Non-bank Office


Financial Overview
6


Financial Overview
Summary –
3Q11 and 09/30/11
T/E Net Interest Income Up $17mm (+21%)
Credit Quality Statistics Excluding FDIC Covered Assets And
Acquired Assets Marked To Fair Value:
NPA/Assets = 0.95% (0.84% in 2Q11)
30+ Days Past Due = 1.68% (1.40% in 2Q11)
Loan Loss Reserve/Loans = 1.33% (1.28% in 2Q11)
Net COs/Average Loans = 0.12% (0.13% in 2Q11)
Provision = $6mm ($10mm in 2Q11)
Reported EPS Of $0.58, Up 212% from 2Q11.  Significant
Items Impacting 3Q11 Results Include:
Merger And Conversion Costs = $6mm or $0.12
Gains On Sale of Investments = $1mm or $0.03
7


Financial Overview
Favorable Balance Sheet Growth
3Q11 Results
3Q11 Results
Loans +$26mm, +0.4%
Deposits +$117mm +1.3%
Loan/Deposits = 79%
Equity = -$35mm, -2%
Equity/Assets = 12.77%
Tier 1 Leverage = 10.55%
Div Payout = 57.7%
ROA = 0.59%
ROE = 4.56%
ROTE = 6.44%
Efficiency Ratio = 74%
Tang Eff. Ratio = 75%
BV/Share = $50.19
Tang BV/Share = $37.12
8
$600
$1,000
$1,400
$1,800
$2,200
$2,600
$3,000
$3,400
$3,800
$4,200
$4,600
$5,000
$5,400
$5,800
$6,200
$6,600
$7,000
$7,400
$7,800
$8,200
$8,600
$9,000
Quarterly Averages
Annual Average Balances


Financial Overview
Low Risk Balance Sheet At September 30, 2011
41% Of Balance Sheet In Very Low Risk Components
9
Cash and
Equivalents,
4%
Investment
Securities,
18%
Mortgage
Loans Held
For Sale, 1%
Acquired
Loans -
Fair
Value, 0.3%
Loans -
FDIC
Covered, 12%
FDIC Loss
Share
Receivable,
5%
Loans -
Noncovered,
49%
Other Assets,
10%


Financial Overview
Trends -
Mortgage Interest Rates
Conforming
Rates Have
Bounced Off
Of Lows
Refi Activity
Has
Diminished
Sales Spreads
Remain
Favorable
Improved
Competitive
Dynamics In
Mortgage
Business
Source: Bloomberg
as of October 25, 2011
Mortgage Interest Rate Trend


Financial Overview
Mortgage Quarterly Revenues
In 3Q11 Closed
$504mm (+43%
Vs. 2Q11)
In 3Q11 Sold
$447mm (+34%
Vs. 2Q11)
3Q11 Vs. 2Q11:
43% Increase In
Mtg. Revenues
3Q11 Vs. 3Q10:
1% Decrease In
Mtg. Revenues
$225 mm
Locked Pipeline
on 10/21/11
11


Financial Overview
Title Insurance Quarterly Revenues
Title &
Mortgage
Footprints
Don’t
Necessarily
Overlap
3Q11:
$4.9mm In
Revenues    
(+9% Vs. 
2Q11)
12
$-
$0.5
$1.0
$1.5
$2.0
$2.5
$3.0
$3.5
$4.0
$4.5
$5.0
$5.5
$6.0
$6.5
2003
2004
2005
2006
2007
2008
2009
2010
2011
Title Insurance Revenues
*
* Includes United Title in April 2007
**
** Includes American Abstract in March 2008
1st Qtr
2nd Qtr
3rd Qtr
4th Qtr


Financial Overview
Service Charges/Revenues
Less Reliance On
Service Charge
Income And
Consumer Fees Than
Peers
13
0.0%
2.0%
4.0%
6.0%
8.0%
10.0%
12.0%
14.0%
16.0%
18.0%
EBTX
PBIB
OZRK
CSFL
UCBI
IBKC
SBCF
HOMB
PFBX
FSGI
HBHC
FMFC
BXS
TRMK
TIBB
SFNC
RNST
MSL
SBSI
CCBG
IBKC = 6%
Source: SNL
Data as of most recent quarter
Non-
Interest Income Excludes Gains on Acquisitions and Investment Sales


Financial Overview
Quarterly Repricing Schedule
4Q11
1Q12
2Q12
3Q12
4Q12
Cash Equivalents
319.4
$             
-
$      
-
$      
-
$      
-
$      
0.64%
0.00%
0.00%
0.00%
0.00%
Investments
330.7
$             
211.3
$   
209.1
$   
142.6
$   
93.5
$    
3.05%
3.45%
3.61%
3.79%
3.80%
Loans
3,755.4
$          
386.5
$   
379.6
$   
358.5
$   
232.7
$   
3.65%
5.49%
5.28%
5.08%
5.62%
Time Deposits
728.4
$             
485.8
$   
467.3
$   
405.9
$   
126.7
$   
1.32%
1.51%
1.50%
1.51%
1.49%
Borrowed Funds
344.2
$             
22.3
$    
20.8
$    
1.5
$      
5.8
$      
1.25%
3.01%
2.90%
4.01%
2.19%
14


Financial Overview
Interest Rate Simulations
Source: Bancware
model, as of September 30, 2011
Fairly Balanced From An Interest Rate Risk Position
Degree Is A Function Of The Reaction Of Competitors To Changes
In Deposit Pricing
Forward Curve Has A Small Positive Impact Over 12 Months
Includes Cameron and OMNI acquisitions
Base
Blue
Forward
Change In:
-200 bp
-100 bp
Case
+100 bp
+200 bp
Chip
Curve
Net Interest
Income
0.3%
0.3%
0.0%
2.0%
4.4%
-0.1%
0.8%
Economic
Value of
Equity
2.9%
2.0%
0.0%
5.4%
7.9%
-0.1%
-0.1%
15


Financial Overview
Annual Change In Stock Price
Source: Bloomberg
as of October 25, 2011
16
-60%
-20%
0%
20%
40%
60%
2000
2001
2002
2003
2004
2005
2006
2007
2008
2009
2010
2011
58%
-40%


Financial Overview
3 Years Price Change By Index
Source: SNL Through October 25, 2011
17
-60%
-50%
-40%
-30%
-20%
-10%
0%
10%
20%
30%
40%
50%
60%
70%
80%
+14%
Banks < $250M
Southeast Banks
Micro Cap Banks
Banks < $500M
Banks $1B-$5B
Banks > $10B
Banks $250M-$500M
Banks
Large Cap Banks
Banks $5B-$10B
Mid Cap Banks
TARP Participants
KBW Bank
Banks $500M-$1B
Small Cap Banks
Mid-Atlantic Banks
NASDAQ Bank
Western Banks
S&P Bank
Midwest Banks
Southwest Banks
S&P Financials
All Financial Institutions
NASDAQ Finl
New England Banks
IBERIABANK Corporation
NYSE
S&P 500
Russell 3000
Russell 2000
S&P Small-Cap
NASDAQ
S&P Mid-Cap


Asset Quality
18


Asset Quality
Loan Portfolio Mix
% based on gross portfolio –
excluding discounts on
loans
acquired
in
FDIC-assisted
transactions
$000s
% of CRE
%
Loans
C&D-IBERIABANK
344,926
            
15%
4%
CRE-Owner Occupied
932,169
            
41%
12%
CRE-Non-Owner Occupied
1,006,017
          
44%
13%
Total Commercial RE
2,283,111
$        
100%
29%
Residential
4%
Home Equity
10%
Credit Card
1%
Automobile
0%
Indirect
Automobile
4%
Other Consumer
1%
Business
22%
Commercial RE
29%
All Other Loans
4%
CapitalSouth
Gross Loans = 3%,
Discount = 1%
Orion
Gross Loans = 10%,
Discount = 4%
Century
Gross Loans = 4%,
Discount = 2%
Transparent
slices
indicate
loan
discounts
Sterling
Gross Loans = 2%,
Discount = 1%
19


Asset Quality
IBERIABANK
Builder & Non-Builder
C&D Loan Exposure
Note: Excludes Covered Loans
20


Asset Quality
3Q11 Compared To Prior Quarters
Note: Includes FDIC Assisted Acquisitions
21
     ($thousands)
3Q10
4Q10
1Q11
2Q11
3Q11
Nonaccruals
871,353
$  
816,243
$  
800,265
$  
790,953
$  
805,247
$  
OREO & Foreclosed
57,495
      
69,218
      
83,186
      
117,741
    
123,307
    
90+ Days Past Due
43,593
      
53,112
      
29,279
      
23,070
      
24,741
      
  Nonperforming Assets
972,441
$  
938,573
$  
912,730
$  
931,765
$  
953,295
$  
NPAs/Assets
9.21%
9.36%
9.18%
8.14%
8.27%
NPAs/(Loans + OREO)
16.63%
15.37%
14.71%
12.73%
12.97%
LLR/Loans
2.28%
2.26%
2.44%
2.36%
2.43%
Net Charge-Offs/Loans
0.36%
0.72%
-0.05%
0.10%
0.10%
Past Dues:
30-89 Days Past Due
89,786
$    
111,345
$  
107,725
$  
86,880
$    
74,604
$    
90+ days Past Due
43,593
      
53,112
      
29,279
      
23,070
      
24,741
      
Nonaccual Loans
871,353
    
816,243
    
800,265
    
790,953
    
805,247
    
Total 30+ Past Dues
1,004,732
$
980,700
$  
937,269
$  
900,903
$  
904,592
$  
% Loans
17.35%
16.25%
15.31%
12.51%
12.52%
Loan Mix:
Commercial
66.2%
67.2%
67.5%
60.6%
61.4%
Consumer
15.4%
15.4%
16.0%
16.2%
16.0%
Mortgage
12.4%
11.5%
10.8%
8.9%
8.3%
Business Banking
1.4%
1.4%
1.4%
10.5%
10.3%
Indirect
4.0%
3.8%
3.7%
3.2%
3.4%
Credit Cards
0.6%
0.7%
0.6%
0.6%
0.6%
   Total Loans
100.0%
100.0%
100.0%
100.0%
100.0%
IBERIABANK Corporation


9/30/10
12/31/10
3/31/11
6/30/11
9/30/11
Consolidated (Ex-FDIC Covered Assets and SOP 03-3)
     30+ days past due
0.52%
0.33%
0.35%
0.41%
0.46%
     Non-accrual
0.96%
1.11%
1.30%
0.99%
1.22%
     Total Past Due
1.48%
1.44%
1.65%
1.40%
1.68%
CapitalSouth Only
     30+ days past due
7.94%
7.10%
7.85%
6.57%
6.09%
     Non-accrual
23.38%
21.12%
21.47%
21.05%
21.20%
     Total Past Due
31.32%
28.22%
29.32%
27.62%
27.29%
Orion Only
     30+ days past due
3.59%
6.11%
4.24%
3.31%
2.85%
     Non-accrual
36.26%
34.52%
36.07%
35.16%
37.56%
     Total Past Due
39.85%
40.63%
40.31%
38.47%
40.41%
Century Only
     30+ days past due
3.53%
5.44%
5.18%
3.82%
4.09%
     Non-accrual
40.57%
41.39%
42.15%
42.74%
43.95%
     Total Past Due
44.10%
46.83%
47.33%
46.56%
48.04%
Sterling Only
     30+ days past due
7.31%
10.68%
12.17%
3.83%
2.69%
     Non-accrual
20.08%
26.68%
28.59%
31.97%
34.68%
     Total Past Due
27.39%
37.36%
40.76%
35.80%
37.37%
Consolidated (With FDIC Covered Assets)
     30+ days past due
1.98%
2.44%
2.04%
1.41%
1.28%
     Non-accrual
12.95%
12.10%
11.89%
10.17%
10.36%
     Total Past Due
14.93%
14.54%
13.93%
11.58%
11.64%
Asset Quality
Loans Past Due + Non-Accruals
** Beginning
in
2011,
IBERIABANK
fsb
was
merged
with
IBERIABANK
22


Asset Quality
Trends –
Entity NPAs & Past Dues
Note: Includes FDIC Assisted Acquisitions
23
(Dollars in $000s)
3Q10
4Q10
1Q11*
2Q11
3Q11
$Chg
9/30/10
12/31/10
3/31/11
6/30/11
9/30/11
Last Qtr.
Nonaccrual Loans
871,353
$    
816,244
$    
800,265
$    
790,953
$    
805,247
$    
14,294
$      
OREO & Foreclosed Assets
57,495
$      
69,217
$      
83,186
$      
117,742
$    
123,307
$    
5,564
$        
Accruing 90+ Days Past Due
43,593
$      
53,112
$      
29,279
$      
23,070
$      
24,741
$      
1,671
$        
Total NPAs
972,441
$    
938,573
$    
912,730
$    
931,765
$    
953,295
$    
21,530
$      
NPAs / Total Assets
9.21%
9.36%
9.18%
8.14%
8.27%
30-89 Days Past Due
89,786
$      
111,345
$    
107,725
$    
86,880
$      
74,604
$      
(12,276)
$     
30-89 Days PDs / Loans
1.55%
1.84%
1.76%
1.21%
1.03%


Asset Quality
Trends –
Entity LLR & Net COs
Note: Includes FDIC Assisted Acquisitions
24
(Dollars in $000s)
3Q10
4Q10
1Q11
2Q11
3Q11
$Chg
09/30/10
12/31/2010
3/31/2011
6/30/2011
9/30/2011
Last Qtr.
Loan Loss Reserve*
131,954
$    
136,100
$    
149,119
$    
169,988
$    
175,320
$    
5,332
$       
LLR / Total Loans
2.28%
2.26%
2.44%
2.36%
2.43%
Net Charge-Offs
5,330
$       
10,506
$      
(764)
$         
1,718
$       
1,880
$       
161
$          
Net COs/Avg Loans
0.36%
0.72%
-0.05%
0.10%
0.10%
LLR Coverage Of NPAs
14%
15%
16%
18%
18%
*
Does not include loan discounts associated with acquisitions.


Asset Quality
Loan Mix And 30 Days+ Past Due
25
3Q10
4Q10
1Q11
2Q11
3Q11
3Q11*
9/30/10
12/31/10
3/31/11
6/30/11
9/30/11
9/30/11
% of Outstandings
Commercial
66.2%
67.3%
67.5%
60.6%
61.4%
61.0%
Mortgage
12.4%
11.5%
10.8%
8.9%
8.3%
5.3%
Consumer
15.4%
15.4%
16.0%
16.2%
16.0%
15.8%
Indirect
4.0%
3.8%
3.7%
3.2%
3.4%
4.5%
Business Banking
1.4%
1.4%
1.4%
10.5%
10.3%
12.7%
Credit Cards
0.6%
0.6%
0.6%
0.6%
0.6%
0.7%
Total Loans
100.0%
100.0%
100.0%
100.0%
100.0%
100.0%
Past Due 30+ Days*
Commercial
15.99%
15.55%
14.78%
12.97%
12.80%
1.71%
Mortgage
14.28%
14.94%
15.21%
14.89%
15.84%
2.60%
Consumer
16.22%
14.82%
14.71%
11.33%
10.52%
1.17%
Indirect
0.78%
0.87%
0.74%
0.78%
0.96%
0.89%
Business Banking
2.95%
2.57%
2.82%
4.91%
7.01%
2.07%
Credit Cards
1.50%
1.57%
1.74%
1.56%
1.90%
1.73%
Total Loans
14.93%
14.54%
13.93%
11.58%
11.64%
1.68%
*
Excludes FDIC assisted acquisitions and SOP 03-3 loans acquired from OMNI and Cameron


Asset Quality
Asset Quality
Classified Assets
“Classified Assets”
Are
Loans That Exhibit
Stress And Warrant
Close Watching
At September 30,
2011 Classified Assets
were $197 million
Our Classified Assets
As A Percentage Of
Total Assets Are Very
Low, Particularly 
Compared To Our Local
Peers
26
Source: SNL, Company Filings for  2010
IBKC Data as of September 30, 2011 -Excludes covered
loans related to FDIC-Assisted Acquisitions
0%
1%
2%
3%
4%
5%
6%
7%
8%
9%
10%
SBSI
OZRK
IBERIABANK
SFNC
RNST
EBTX
HOMB
TRMK
MSL
BXS
HBHC
CSFL
FMFC
SBCF
CCBG
WTNY
PFBX
PBIB
UCBI
FSGI
Classified Assets-to-
Total Assets
At December 31, 2010


$1.7 Million In
Net Charge-Offs
In 3Q11
Excluding FDIC
Covered and
SOP 03-3 Loans
(0.12% Of
Average Loans)
Asset Quality
Loan Loss Reserve
Legacy IBERIABANK Credits Performing Very Well
Classified Assets And NPAs Remain Favorable
$6.1 Million Loan Loss Provision In 3Q11 (2Q11 = $10.0
Million)
Acquired Builder Construction Portfolio Was Only $1.9
Million (0.03% of Total Loans)
27
3Q10
4Q10
1Q11
2Q11
3Q11
Net Charge-Offs - legacy
6,123
$     
10,473
$  
(655)
$      
1,895
$    
1,711
$   
Loan Growth
683
         
5,501
      
2,043
      
4,737
      
615
       
Change In Asset Quality
(3,548)
      
(4,418)
     
2,313
      
719
         
3,976
    
Loan Loss Provision - legacy
3,258
$     
11,556
$  
3,701
$    
7,351
$    
6,302
$   
Loan Loss Provision - FDIC Acqs.
1,870
       
(332)
        
1,770
      
2,639
      
(175)
      
Total Loan Loss Provision
5,128
$     
11,224
$  
5,471
$    
9,990
$    
6,127
$   
Net Charge-Offs/Avg. Loans
0.36%
0.72%
-0.05%
0.10%
0.10%
Loan Loss Reserve/Loans
2.28%
2.26%
2.44%
2.36%
2.43%


The Lowest Level Of
C&D Loan Exposure
Compared To Peers
One Of The Lowest
Levels Of NPAs
Compared To Peers
Asset Quality
C&D Loans And NPAs
Compared To Peers
Source: SNL, using most recent quarterly information
* Excludes FDIC Covered Assets and acquired assets marked
to fair value
28


Asset Quality
Commercial Real Estate Loan Portfolio
Excludes covered loans related to FDIC-Assisted Acquisitions
29
-
1,000,000
2,000,000
3,000,000
4,000,000
5,000,000
6,000,000
7,000,000
8,000,000
9,000,000
10,000,000
Non
-Builder Portfolio CRE
CRE Loans Outstanding At September 30, 2011


Asset Quality
Commercial Real Estate Loan Portfolio
Note: Includes commercial construction and land development loans
Excludes covered loans related to FDIC-Assisted Acquisitions
Sep 2010
Dec 2010
Mar 2011
Jun 2011
Sep 2011
Non-Owner Occupied
Current
910.5
$         
895.0
$         
916.1
$         
1,215.2
$      
1,193.0
$      
Past Due
1.5
              
2.5
              
6.8
              
10.8
             
16.2
             
Nonaccrual
18.4
             
22.7
             
31.9
             
50.7
             
57.1
             
Total
930.5
$         
920.2
$         
954.8
$         
1,276.7
$      
1,266.4
$      
   % Nonaccrual
1.98%
2.46%
3.34%
3.97%
4.51%
Owner Occupied
Current
605.2
$         
632.6
$         
691.2
$         
982.7
$         
1,009.0
$      
Past Due
7.3
              
1.7
              
0.8
              
1.2
              
0.5
              
Nonaccrual
5.0
              
5.6
              
5.9
              
7.5
              
7.3
              
Total
617.5
$         
639.9
$         
697.9
$         
991.4
$         
1,016.7
$      
   % Nonaccrual
0.81%
0.88%
0.84%
0.75%
0.72%
Total CRE
1,548.0
$      
1,560.1
$      
1,652.7
$      
2,268.1
$      
2,283.1
$      
   % Nonaccrual
1.52%
1.81%
2.29%
2.56%
2.82%
Non-Owner Occup/Risk Based Cap.
78%
76%
100%
120%
100%
30


Asset Quality
Commercial Loan Composition
Note:
At
September
30,
2011;
Includes
commercial
construction
and
land
development
loans
excludes
Covered
Assets
31
0%
5%
10%
15%
20%
25%
30%
35%
Storage
Agriculture
Governmental
Communications
Energy
Transport
Financial/Insurance
Education
Households
Religious
Heavy/Civil Construction
Wholesalers
Manufacturing
Construction
Retail
Other
Hospitality
RE-Owner Occupied
Medical
% Of Commercial Loan Portfolio At September 30, 2011
RE-Non-Owner Occupied


Consumer Loan
Portfolio
32


Consumer Loan Portfolio
By Product –
Score Distribution
Note: Excludes Credit Cards
Excludes Covered Loans from FDIC Acquisitions
Score
Intervals
HELOC
Home
Equity
Loans
Unsecured
Lines
Unsecured
Other
Secured
Indirect
Auto
800 +
12%
14%
5%
8%
13%
12%
750 - 799
40%
35%
29%
31%
25%
28%
700 - 749
25%
24%
28%
25%
25%
23%
650 - 699
14%
15%
20%
17%
16%
18%
600 - 649
5%
5%
9%
8%
8%
8%
550 - 599
2%
4%
5%
5%
6%
5%
500 - 549
1%
2%
4%
3%
4%
3%
450 - 499
0%
1%
1%
1%
1%
1%
400 - 449
0%
0%
0%
0%
0%
0%
Other
1%
1%
2%
2%
3%
1%
Total
100%
100%
100%
100%
100%
100%
Avg. Score
745
     
725
   
731
           
710
           
700
       
716
     
Consumer Portfolio - Score Distribution By Product
33


Consumer
Loan Portfolio
Past Dues
By Product
Generally Good
And Stable Asset
Quality Across
Consumer
Products
Excludes Covered Loans from FDIC Acquisitions
9/30/10
12/31/10
3/31/11
6/30/11
9/30/11
Home Equity Lines of Credit
30 to 59 Days Past Due
0.24%
0.21%
0.21%
0.13%
0.17%
60 to 89 Days Past Due
0.03%
0.28%
0.01%
0.04%
0.08%
Over 90 Days Past Due
0.15%
0.00%
0.00%
0.00%
0.00%
Total 30+ Days Past Due
0.42%
0.49%
0.22%
0.17%
0.25%
Net Charge-Offs
0.87%
1.28%
0.90%
0.02%
0.38%
Home Equity Term Loans
30 to 59 Days Past Due
0.28%
0.57%
0.29%
0.50%
0.59%
60 to 89 Days Past Due
0.16%
0.17%
0.01%
0.13%
0.21%
Over 90 Days Past Due
0.31%
0.00%
0.00%
0.00%
0.01%
Total 30+ Days Past Due
0.75%
0.75%
0.31%
0.63%
0.81%
Net Charge-Offs
0.21%
0.65%
0.82%
0.34%
0.21%
Indirect Loans
30 to 59 Days Past Due
0.34%
0.40%
0.34%
0.38%
0.46%
60 to 89 Days Past Due
0.09%
0.07%
0.02%
0.09%
0.11%
Over 90 Days Past Due
0.03%
0.00%
0.00%
0.00%
0.00%
Non Accrual
0.35%
0.42%
0.40%
0.33%
0.42%
Total 30+ Days Past Due
0.81%
0.89%
0.76%
0.80%
0.99%
Net Charge-Offs
0.13%
0.39%
0.17%
0.09%
0.30%
Credit Card Loans
30 to 59 Days Past Due
0.35%
0.34%
0.26%
0.29%
0.37%
60 to 89 Days Past Due
0.21%
0.22%
0.32%
0.14%
0.25%
Over 90 Days Past Due
0.00%
0.00%
0.00%
0.00%
0.00%
Non Accrual
0.86%
0.88%
1.02%
1.01%
1.11%
Total 30+ Days Past Due
1.41%
1.44%
1.60%
1.44%
1.73%
Net Charge-Offs
2.16%
1.98%
1.76%
2.05%
1.69%
Other Consumer Loans
30 to 59 Days Past Due
0.48%
0.36%
0.26%
0.30%
0.28%
60 to 89 Days Past Due
0.10%
0.10%
0.09%
0.30%
0.05%
Over 90 Days Past Due
0.04%
0.00%
0.00%
0.00%
0.00%
Total 30+ Days Past Due
0.62%
0.46%
0.35%
0.60%
0.33%
Net Charge-Offs
2.11%
1.86%
0.74%
0.78%
1.81%
Total Consumer Loans
Total 30+ Days Past Due
0.57%
0.58%
0.31%
0.47%
0.56%
Net Charge-Offs
0.60%
0.90%
0.71%
0.31%
0.48%
Consumer Loan Portfolio - Quarterly Credit Statistics
Loans Past Due As A % of Product Loans
34


Consumer Loan Portfolio
By
Product
Origination
Mix
35
0%
10%
20%
30%
40%
50%
60%
70%
80%
90%
100%
1Q07
3Q07
1Q08
3Q08
1Q09
3Q09
1Q10
3Q10
1Q11
3Q11
35%
41%
19%
5%
Quarter
Originations
-
Product Total %


Consumer Loan Portfolio
By Product –
Loan-To-Values
36
54%
77%
68%
79%
0%
10%
20%
30%
40%
50%
60%
70%
80%
90%
100%
Loan-to-Values At Time Of Origination
HELOC 1st
HELOC 2nd
Home Equity 1st
Home Equity 2nd
Quarter


Consumer Loan Portfolio
Indirect –
30+ Days Past Dues
37
Month
.55%


Consumer Loan Portfolio
Indirect –
Net Charge-Offs
0.00%
0.20%
0.40%
0.60%
0.80%
1.00%
1.20%
1.40%
1.60%
1.80%
2.00%
2.20%
2.40%
.17%
38
Month


FDIC Loss Share
Performance
39


Loss Share Performance Covered
Loan Portfolio Rollforward
40
Average
Income /
Expense
Average
Yield
Average
Income /
Expense
Average
Yield
Average
Income /
Expense
Average
Yield
Average
Income /
Expense
Average
Yield
Covered Loans
1,466,627
39,453
10.592%
1,545,551
54,118
14.049%
1,489,782
40,454
10.768%
1,421,784
28,201
7.819%
Mortgage Loans
247,827
6,159
9.941%
253,360
6,865
10.839%
243,303
4,487
7.378%
229,678
5,209
9.072%
Indirect Automobile
-
-
0.000%
-
-
0.000%
-
-
0.000%
-
-
0.000%
Credit Card
1,154
20
6.934%
1,083
19
7.091%
1,026
17
6.721%
972
16
6.693%
Consumer
213,082
3,225
6.005%
196,378
3,926
8.107%
189,022
(234)
-0.497%
172,391
3,780
8.698%
Line Of Credit-Consumer Loans
79,958
4,582
22.733%
79,580
7,391
37.664%
81,575
2,967
14.588%
80,650
2,372
11.669%
Commercial & Business Banking
924,098
25,467
10.792%
1,015,204
35,917
14.155%
975,301
33,217
13.477%
938,554
16,824
7.018%
Loans in Process
508
-
0.000%
(54)
-
0.000%
(445)
-
0.000%
(460)
-
0.000%
Overdrafts
0
-
0.000%
0
-
0.000%
0
-
0.000%
0
-
0.000%
FDIC Loss Share Receivable
899,558
(8,619)
-3.749%
708,809
(21,913)
-12.366%
666,159
(18,315)
-10.877%
626,551
(2,602)
-1.625%
Net Covered Loan Portfolio
2,366,185
30,834
5.143%
2,254,360
32,205
5.744%
2,155,941
22,139
4.080%
2,048,335
25,599
4.930%
Average
Income /
Expense
Average
Yield
Average
Income /
Expense
Average
Yield
Average
Income /
Expense
Average
Yield
Average
Income /
Expense
Average
Yield
Covered Loans
1,466,627
39,453
10.592%
1,545,551
54,118
14.049%
1,489,782
40,454
10.768%
1,421,784
28,201
7.819%
CapitalSouth Bank
250,865
8,355
13.171%
251,762
10,188
16.262%
240,511
5,196
8.536%
227,549
(1,827)
-3.080%
Orion Bank
742,289
24,721
13.046%
823,081
32,651
16.025%
794,202
29,013
14.479%
759,860
24,875
12.861%
Century Bank
332,360
3,878
4.610%
339,135
9,156
10.795%
323,681
4,105
5.072%
303,773
3,024
3.979%
Sterling Bank
141,113
2,499
6.770%
131,574
2,123
6.472%
131,388
2,140
6.464%
130,602
2,130
6.405%
FDIC Loss Share Receivable
899,558
(8,619)
-3.749%
708,809
(21,913)
-12.366%
666,159
(18,315)
-10.877%
626,551
(2,602)
-1.625%
CapitalSouth Bank
79,553
(2,600)
-12.788%
58,914
(1,877)
-12.744%
58,676
(4,456)
-30.041%
57,146
5,754
39.402%
Orion Bank
555,610
(5,568)
-3.921%
418,948
(18,861)
-18.009%
392,880
(13,256)
-13.348%
375,943
(11,021)
-11.472%
Century Bank
197,355
(593)
-1.177%
163,829
(1,385)
-3.383%
157,959
(756)
-1.894%
145,807
2,505
6.723%
Sterling Bank
67,040
142
0.830%
67,119
210
1.253%
56,644
152
1.065%
47,655
159
1.310%
Net Covered Loan Portfolio
2,366,185
30,834
5.143%
2,254,360
32,205
5.744%
2,155,941
22,139
4.080%
2,048,335
25,599
4.930%
CapitalSouth Bank
330,418
5,756
6.921%
310,676
8,311
10.762%
299,187
740
0.954%
284,696
3,927
5.448%
Orion Bank
1,297,899
19,153
5.783%
1,242,029
13,790
4.546%
1,187,083
15,757
5.269%
1,135,803
13,853
4.807%
Century Bank
529,715
3,285
2.457%
502,963
7,770
6.177%
481,639
3,349
2.787%
449,580
5,529
4.869%
Sterling Bank
208,153
2,641
4.854%
198,692
2,333
4.709%
188,032
2,293
4.838%
178,257
2,290
5.043%
4Q2010
1Q2011
2Q2011
3Q2011
4Q2010
1Q2011
2Q2011
3Q2011


Markets
41


Markets –
Local Economies
Unemployment –
vs. U.S. MSAs
Source: U.S. Department of Labor, Bureau of Labor Statistics
Consistently
Low Rates Of
Unemploy-ment
In Our Legacy
MSAs
Many Of Our
Legacy Markets
Not Dependent
On Housing For
Growth
Assets In FDIC-
Assisted
Acquisition
Markets Are
Protected Under
Loss-Share
Agreements
42


Markets –
Local Economies
Freddie Mac –
Regional Prices
Source: Freddie Mac, FMHPI data series for 2Q2011
Last 5-Year
Housing
Price
Last 12
2Q11 vs.
Region
States Included
Change
Months
1Q11
West South Central
LA, AR, TX, OK
-1.8%
-2.3%
10.8%
West North Central
IA, KS, MN, MO, ND, NE, SD
-6.0%
-3.1%
16.0%
East South Central
TN, AL, MS, KY
-9.2%
-3.8%
9.3%
South Atlantic
NC, SC, FL, GA, VA, MD, WV, DC, DE
-16.5%
-4.0%
13.6%
New England
CT, MA, ME, NH, RI, VT
-18.0%
-4.6%
8.8%
East North Central
IL, IN, MI, OH, WI
-20.2%
-4.8%
26.2%
Pacific
CA, OR, WA, HI, AK
-22.1%
-5.8%
8.1%
Middle Atlantic
NY, NJ, PA
-14.6%
-5.9%
3.2%
Mountain
AZ, CO, ID, MT, NM, NV, UT, WY
-25.3%
-9.6%
-0.6%
United States
-25.1%
-7.0%
8.5%
43


Markets –
Local Economies
Housing Price Change Vs. U.S. MSAs
Source: Freddie Mac, FMHPI data series for 2Q2011
44
-40.0%
-35.0%
-30.0%
-25.0%
-20.0%
-15.0%
-10.0%
-5.0%
0.0%
5.0%
10.0%
15.0%
Average of MSAs
-5.4%


-3%
8%
2%
7%
-8%
-60%
-50%
-40%
-30%
-20%
-10%
0%
10%
Louisiana MSAs
Alexandria LA MSA
Baton Rouge LA MSA
Houma-Bayou Cane-Thibodaux LA MSA
Lafayette LA MSA
Lake Charles LA MSA
Monroe LA MSA
New Orleans-Metairie-Kenner LA MSA
Shreveport-Bossier City LA MSA
Markets –
Local Economies
Housing
Price
Trends
IBKC
Markets
45
Source :
Freddie Mac FHMPI Index –
data indexed at 4Q2006


Markets –
Local Economies
Housing
Price
Trends
IBKC
Markets
-26%
0%
-3%
-60%
-50%
-40%
-30%
-20%
-10%
0%
10%
Arkansas MSAs
Fayetteville-Springdale-Rogers AR-MO MSA
Jonesboro AR MSA
Little Rock-North Little Rock-Conway AR MSA
46
Source :
Freddie Mac FHMPI Index –
data indexed at 4Q2006


Markets –
Local Economies
Housing
Price
Trends
IBKC
Markets
-52%
-32%
-53%
-46%
-60%
-50%
-40%
-30%
-20%
-10%
0%
10%
Florida MSAs
Cape Coral-Fort Myers FL MSA
Jacksonville FL MSA
Miami-Fort Lauderdale-Pompano Beach FL MSA
Naples-Marco Island FL MSA
North Port-Bradenton-Sarasota FL MSA
47
Source :
Freddie Mac FHMPI Index –
data indexed at 4Q2006


Markets –
Local Economies
Housing
Price
Trends
IBKC
Markets
-11%
-4%
-19%
6%
-16%
-60%
-50%
-40%
-30%
-20%
-10%
0%
10%
Other MSAs
Birmingham-Hoover AL MSA
Huntsville AL MSA
Mobile AL MSA
Montgomery AL MSA
Houston-Sugar Land-Baytown TX MSA
Memphis TN-MS-AR MSA
48
Source :
Freddie Mac FHMPI Index –
data indexed at 4Q2006


Markets –
Local Economies
House Price Decline Probability
Local Housing
Prices Did Not
Escalate Rapidly,
So Little House
Price “Snap-Back”
According To PMI,
Our Legacy
Markets Have
Some Of The
Lowest
Probabilities To
Exhibit Housing
Price Declines
Over Next 2 Years
Source: PMI Economic Real Estate Trends as of 2Q11
49
Shreveport, LA 17.6%
Jonesboro, AR 17.7%
Lafayette, LA 18.1%
Mobile, AL 39.4%
Baton Rouge, LA 40.9%
New Orleans, LA 45.9%
Memphis, TN 46.0%
Lake Charles, LA 47.8%
Little Rock, AR 23.7%
NW Arkansas, 25.0%
W. Palm Beach, FL 90.0%
Jacksonville, FL 92.6%
Tampa, FL 93.2%
Bradenton, FL 93.5%
Cape Coral, FL 96.0%
Naples, FL 96.8%
Monroe, LA 31.3%
Houston, TX 32.7%
Birmingham, AL 33.3%
Huntsville, AL 36.5%
Montgomery, AL 36.8%


Markets-Local Economies
IBKC Market Demographics
Source: SNL Financial
50
MSA
IBKC
Market
Rank
IBKC
Offices
IBKC
Deposits
IBKC Dep
Mkt. Share
(%)
Percent of
IBKC
Franchise
Market
Population
Population
Change
2000-10
(%)
Projected
Population
Change
2010-15
(%)
Median
HH
Income
2010
($)
HH
Income
Change
2000-10
(%)
Projected
HH Income
Change
2010-15
(%)
FLORIDA
North Port-Bradenton-Sarasota, FL
6
13
706,045
4.30
7.63
712,761
20.82
4.06
51,943
27.68
10.66
Naples-Marco Island, FL
5
7
623,371
6.25
6.74
332,156
32.13
5.99
62,368
28.82
11.33
Miami-Fort Lauderdale-Pompano Beach, FL
34
11
526,968
0.33
5.70
5,513,060
10.09
1.37
51,835
28.66
13.46
Key West, FL
5
5
185,312
8.21
2.00
73,868
(7.19)
(4.68)
53,763
25.83
10.94
Cape Coral-Fort Myers, FL
18
4
158,839
1.39
1.72
628,829
42.63
8.17
51,699
28.21
10.86
Jacksonville, FL
30
3
53,557
0.11
0.58
1,389,042
23.72
7.08
54,392
27.54
11.94
LOUISIANA
New Orleans-Metairie-Kenner, LA
5
24
1,404,895
4.82
15.18
1,187,772
(9.78)
8.77
42,621
20.67
6.36
Lafayette, LA
1
13
1,280,381
23.15
13.84
263,368
10.16
4.27
40,904
15.26
8.20
New Iberia, LA
1
4
786,474
45.05
8.50
75,402
2.92
0.17
35,185
13.27
7.36
Lake Charles, LA
3
17
508,287
15.17
5.49
194,964
0.72
(0.15)
40,423
14.49
9.42
Baton Rouge, LA
5
5
430,652
2.72
4.65
789,682
11.86
4.80
42,872
14.54
7.08
Monroe, LA
3
6
316,612
11.31
3.42
174,353
2.53
1.13
35,606
12.22
10.11
Shreveport-Bossier City, LA
7
2
189,816
2.85
2.05
394,961
5.05
1.61
37,988
14.48
8.83
Ruston, LA
4
2
89,832
7.88
0.97
57,874
(0.06)
(0.30)
30,621
11.16
4.98
Crowley, LA
6
2
52,234
6.52
0.56
60,988
3.61
0.49
29,921
12.20
4.42
Abbeville, LA
9
2
46,760
5.12
0.51
56,867
5.69
1.46
31,930
8.45
6.64
Bastrop, LA
6
2
17,509
6.49
0.19
28,799
(7.16)
(3.98)
27,955
11.26
5.29
Houma-Bayou Cane-Thibodaux, LA
14
1
13,291
0.31
0.14
204,128
4.96
0.46
39,560
12.74
9.36
ARKANSAS
Little Rock-North Little Rock-Conway, AR
9
11
389,999
2.87
4.22
694,164
13.70
5.87
51,146
31.38
13.27
Jonesboro, AR
3
6
213,547
8.31
2.31
119,895
11.26
6.02
39,890
28.23
16.63
Fayetteville-Springdale-Rogers, AR-MO
17
8
118,343
1.44
1.28
461,723
33.04
10.17
48,929
35.01
9.83
Paragould, AR
9
2
7,324
0.98
0.08
41,398
10.89
4.05
39,063
26.62
15.16
TENNESSEE
Memphis, TN-MS-AR
25
2
155,202
0.68
1.68
1,325,833
10.01
4.28
51,618
30.32
11.85
TEXAS
Houston-Sugar Land-Baytown, TX
54
4
185,288
0.13
2.00
6,017,013
27.60
10.46
58,086
30.07
14.35
ALABAMA
Birmingham-Hoover, AL
13
4
245,181
0.84
2.65
1,133,874
7.76
3.39
45,636
20.09
6.12
Montgomery, AL
12
2
104,538
1.45
1.13
372,902
7.61
3.06
44,338
19.12
8.45
Mobile, AL
9
2
99,878
1.65
1.08
410,234
2.60
1.01
39,492
17.15
9.17
Huntsville, AL
19
2
41,820
0.63
0.45
407,958
19.15
9.36
51,241
18.68
7.69
Daphne-Fairhope-Foley, AL
18
1
14,260
0.44
0.15
186,407
32.75
11.05
46,476
15.47
3.91
Aggregate: National
169
9,603,738
96.86
23,310,275
9.60
4.06
45,656
21.40
9.47


Markets –
Local Economies
IBKC Office Optimization
Entered 3 New Markets
Acquired 12 Offices (All)
Closed/Consolidated 18
Offices (All Types)
Opened 10 New Bank Offices
Opened 7 Mortgage Offices
Divested/Sold 1 Office
5 Office Realignments
1999 Through 2005
Since 2005
Entered 27 New Markets
Acquired 180 Offices (All)
Closed/Consolidated 54
Offices (All Types)
Opened 23 New Bank
Offices
Opened 27 Mortgage
Offices
Opened 2 Title Office
13 Office Realignments
51


Markets –
Local Economies
Oil & Gas Impact
Source: Bloomberg
52
Natural Gas
Crude Oil
$3.62
$92.99
$-
$20.00
$40.00
$60.00
$80.00
$100.00
$120.00
$140.00
$160.00
$-
$2.00
$4.00
$6.00
$8.00
$10.00
$12.00
$14.00
$16.00


Summary Of IBKC
Industry Operating Environment--Challenging
Housing
Credit Risk
Interest Rate Risk
Operations Risk
We Tend To Move “Ahead Of The Curve”
Focus On Long-Term Investments & Payback
Organic And External Growth
Expense Controls And Revenue Growth
EPS/Stock
Price
Linkage
-
Shareholder
Focus
Favorable Risk/Return Compared To Peers
53
EX-99.3 4 d248190dex993.htm EXHIBIT 99.3 Exhibit 99.3

Exhibit 99.3

LOGO

FOR IMMEDIATE RELEASE

October 26, 2011

Contact:

Daryl G. Byrd, President and CEO (337) 521-4003

John R. Davis, Senior Executive Vice President (337) 521-4005

IBERIABANK Corporation Updates Share Repurchase Program and Strategic Goals

LAFAYETTE, LOUISIANA — IBERIABANK Corporation (NASDAQ: IBKC), holding company of the 124-year-old IBERIABANK (www.iberiabank.com), announced the completion of its share repurchase program authorized in August 2011 and the commencement of a new share repurchase program. The Company also announced an update to its strategic goals. A presentation regarding a strategic overview and key financial goals for the Company can be found on the Company’s website under “Investor Relations” and then “Presentations.”

Completed Share Repurchase Program

On August 2, 2011, the Company announced a share repurchase program for 900,000 shares of common stock, or approximately 3% of common shares outstanding at the time of announcement. That share repurchase program was completed during the third quarter of 2011. The weighted average price of shares purchased under that program was $45.98 per share, or an aggregate purchase price of approximately $41 million. The Company currently estimates the completed share repurchase program will add $0.07 to $0.09 to fully-diluted earnings per share on an annual basis, based on certain assumptions.

Completed Share Repurchase Programs


Repurchase Program

   Announced      Completed      Months      Shares
Purchased*
     Weighted
Average
Price*
 

February 2000

     2/17/00         12/11/00         10         375,000       $ 14.30   

December 2000

     12/12/00         12/17/01         12         375,000         22.44   

December 2001

     12/18/01         12/2/02         11         375,000         30.22   

November 2002

     11/18/02         9/2/03         9         162,500         35.10   

September 2003

     9/17/03         6/24/04         9         375,000         46.44   

June 2004

     6/25/04         5/4/05         10         218,750         47.23   

May 2005

     5/4/05         5/15/07         24         375,000         51.54   

August 2011

     8/2/11         9/16/11         2         900,000         45.98   


* Adjusted for 5-for-4 stock split paid on August 15, 2005.

Newly Authorized Share Repurchase Program

The Company announced today that the Board of Directors of the Company authorized the repurchase of up to 900,000 shares of the Company’s outstanding common stock. This share repurchase authorization equates to approximately 3% of total shares outstanding. Stock repurchases under this program will be made from time to time, on the open market or in privately negotiated transactions, at the discretion of the management of the Company. The timing of these repurchases will depend on market conditions and other requirements. Consistent with prior share


1


repurchase programs, the Company currently anticipates the share repurchase program will be completed within a one-year time frame.

Daryl G. Byrd, President and Chief Executive Officer, commented, “The recently completed share repurchase program and the newly authorized share repurchase program provide an excellent opportunity to enhance shareholder value, while maintaining superior capital strength at our Company. These share repurchase programs, in concert with our continued organic balance sheet growth and acquisition opportunities, provide a balanced and methodical approach to capital management.”

Strategic Overview

The Company routinely recalibrates its strategic goals every five years and today announced an update to the strategic overview and key financial goals for the organization. The key financial goals are as follows:


Return on average tangible equity of 13%-17%. Measured by the end of the three to five year planning period and excluding acquisition and conversion costs.


Tangible efficiency ratio of 60% or less. Measured by the end of the three to five year planning period and excluding acquisition and conversion costs.


Asset quality measures in the top 10% of our peers. Measured as nonperforming assets as a percent of total assets, excluding FDIC covered assets.


Double-digit earnings per share growth. Measured on an annual basis throughout the three to five year planning period, excluding acquisition and conversion costs.

IBERIABANK Corporation

IBERIABANK Corporation is a financial holding company with $11.5 billion in assets and $1.5 billion in shareholders’ equity at September 30, 2011. The Company has 262 combined offices, including 171 bank branch offices in Louisiana, Arkansas, Tennessee, Alabama, Texas, and Florida, 24 title insurance offices in Arkansas and Louisiana, mortgage representatives in 60 locations in 12 states, six locations with representatives of IBERIA Wealth Advisors in four states, and one IBERIA Capital Partners, LLC office in New Orleans.

The Company’s common stock trades on the NASDAQ Global Select Market under the symbol “IBKC.” The Company’s market capitalization was approximately $1.5 billion, based on the NASDAQ closing stock price on October 26, 2011.

Forward Looking Statements

To the extent that statements in this press release relate to future plans, objectives, financial results or performance of IBERIABANK Corporation, these statements are deemed to be forward-looking statements within the meaning of the Private Securities Litigation Reform Act of 1995. Such statements, which are based on management’s current information, estimates and assumptions and the current economic environment, are generally identified by the use of the words “plan”, “believe”, “expect”, “intend”, “anticipate”, “estimate”, “project” or similar expressions. IBERIABANK Corporation’s actual strategies and results in future periods may differ materially from those currently expected due to various risks and uncertainties.

Actual results could differ materially because of factors such as the current level of market volatility and our ability to execute our growth strategy, including the availability of future FDIC-assisted failed bank opportunities, unanticipated losses related to the integration of, and accounting for, acquired businesses and assets and assumed liabilities in FDIC-assisted transactions, adjustments of fair values of acquired assets and assumed liabilities and of deferred taxes in FDIC-assisted acquisitions, credit risk of our customers, effects of the on-going correction in residential real estate prices and reduced levels of home sales, sufficiency of our allowance for loan losses, changes


2


in interest rates, access to funding sources, reliance on the services of executive management, competition for loans, deposits and investment dollars, reputational risk and social factors, changes in government regulations and legislation, increases in FDIC insurance assessments, geographic concentration of our markets and economic conditions in these markets, rapid changes in the financial services industry, dependence on our operational, technological, and organizational infrastructure, hurricanes and other adverse weather events, the volatility and low trading volume of our common stock, and valuation of intangible assets. These and other factors that may cause actual results to differ materially from these forward-looking statements are discussed in the Company’s Annual Report on Form 10-K and other filings with the Securities and Exchange Commission (the “SEC”), available at the SEC’s website, http://www.sec.gov, and the Company’s website, http://www.iberiabank.com, under the heading “Investor Information.” All information in this release is as of the date of this release. The Company undertakes no duty to update any forward-looking statement to conform the statement to actual results or changes in the Company’s expectations.


3

EX-99.4 5 d248190dex994.htm EXHIBIT 99.4 Exhibit 99.4
IBERIABANK Corporation
Strategic Overview
Strategic Overview
October 26, 2011
October 26, 2011
Exhibit 99.4


Safe Harbor Language
2
To the extent that statements in this presentation relate to future plans, objectives, financial results
or performance of IBERIABANK Corporation, these statements are deemed to be forward-looking statements
within the meaning of the Private Securities Litigation Reform Act of 1995. Such statements, which are based
on
management’s
current
information,
estimates
and
assumptions
and
the
current
economic environment, are
generally identified by the use of the words “plan”, “believe”, “expect”, “intend”, “anticipate”, “estimate”, “project”
or similar expressions. IBERIABANK Corporation’s actual strategies and results in future periods may differ
materially from those currently expected due to various risks and uncertainties.
Actual results could differ materially because of factors such as the current level of market volatility and our
ability to execute our growth strategy, including the availability of future FDIC-assisted failed bank opportunities,
unanticipated losses related to the integration of, and accounting for, acquired businesses and assets and
assumed liabilities in FDIC-assisted transactions, adjustments of fair values of acquired assets and assumed
liabilities and of deferred taxes in FDIC-assisted acquisitions, credit risk of our customers, effects of the on-going
correction in residential real estate prices and reduced levels of home sales, sufficiency of our allowance for loan
losses, changes in interest rates, access to funding sources, reliance on the services of executive management,
competition for loans, deposits and investment dollars, reputational risk and social factors, changes in
government regulations and legislation, increases in FDIC insurance assessments, geographic concentration of
our markets and economic conditions in these markets, rapid changes in the financial services industry,
dependence
on
our
operational,
technological,
and
organizational
infrastructure, hurricanes and other adverse
weather events, the volatility and low trading volume of our common stock, and valuation of intangible assets. 
These and other factors that may cause actual results to differ materially from these forward-looking statements
are discussed in the Company’s Annual Report on Form 10-K and other filings with the Securities and Exchange
Commission
(the
“SEC”),
available
at
the
SEC’s
website,
http://www.sec.gov,
and the Company’s website,
http://www.iberiabank.com,
under the heading “Investor Information.”
All information in this presentation is as
of the date of this presentation.  The Company undertakes no duty to update any forward-looking statement to
conform the statement to actual results or changes in the Company’s expectations.


Every 5-6 Years We Set Strategic Goals
Recently Refreshed Our Strategic Plan
Focus Our Company:
Mission Statement
Philosophies And Culture
Economic And Industry Dynamics
Risks And Opportunities
Strengths And Areas Requiring Improvement
Operating Parameters
Areas Of Future Emphasis And Investment
Strategic/Financial Goals
Overview
Strategic Overview
Strategic Overview
3


Strategic Overview
Strategic Overview
Over The Past Three Years…
Total Revenues Of $1.5 Billion
Earned $280 Million; $14.57 EPS
Paid $105 Million In Dividends, Or
$5.10 Per Share (38% Payout)
Improved Asset Quality And
Capital Strength
Added:
+$6.6 Billion Assets
+120 New Locations
+1,247 Associates
+$18.06 In Tangible BVS
+$0.8 Billion Market Cap.
At The End Of 3Q11:
Total Assets Of $11.5
Billion
2,541 Associates
Operations In 12 States
4
-75%
-25%
25%
75%
125%
175%
Loans
Deposits
Assets
Offices
# FTE
BVS
TBVS
Stock Price
Market Cap
% Change Since 2007


Strategic Overview
Strategic Overview
Our Current Position
5
Little Or No Loan Growth
Real Estate Dependence
Asset Quality Concerns
Unrecognized Collateral Values
Flat & Low Yield Curve Results In
Margin Compression
Durbin Amendment Exposure
Capital Constrained
Dividends Slashed
Costly Access To Fresh Capital
Share Buyback Capability?
M&A Experience/Infrastructure?
Industry Headwinds
Our Positioning
$518mm YTD Organic Growth
41% of Bal. Sheet Is Low Risk
Classified Assets = 1.7%/Assets
FDIC Loss Share Protection
Less Spread Dependent With
Mtg/Title 12% Of Revenues
Service Chg/Revenues of 6%
$300mm+ In Excess Capital
Consistent Quarterly Dividends
Raised $603mm In Capital
Buyback Completed In 3Q11
5 FDIC And 7 Live Bank Deals


Provide Exceptional Value-Based Client Service
Great Place To Work
Growth That Is Consistent With High Performance
Shareholder Focused
Strong Sense Of Community
Mission Statement And Culture
Strategic Overview
Strategic Overview
6
Teamwork
Client Focus
Financial Focus
Attention To Detail
Do What Is Right
High Performance Expectations
Self Starters
Respect For Others
Conservative & Methodical
Continuous Improvement
Mission
Statement
Selected Philosophies And Culture


Time Period: 5-Year Time Frame
Economic Growth Remains Tempered
Near-Term Inflation Is tempered As Well
Current Credit Cycle Is 5-6 Years Long (2/3 Complete)
Assume The Interest Rate Environment Imbedded In The
Current Forward Curves
Low, Flat Interest Rate Curves Initially
Curves Begin to Steepen To More Historic Levels
Impacted More On Short-End Of Curves (<5 Years)
Major Economic Assumptions
Strategic Overview
Strategic Overview
7


Forward Interest Rate Curves
Strategic Overview
Strategic Overview
8
0.00%
0.50%
1.00%
1.50%
2.00%
2.50%
3.00%
3.50%
4.00%
4.50%
5.00%
Sep-07
Sep-08
Sep-09
Sep-10
Sep-11
Sep-12
Sep-13
Sep-14
Sep-15
Overnight
2yr Treasury
5 Year Treasury
10 Year Treasury


Banking Industry Returns Will Remain Challenging
Limited Balance Sheet Growth
Spread Compression (Government & Industry Impacts)
Legislative/Compliance Provide Revenue Pressure
Regulatory Burdens Remain Elevated
Lower Industry Returns On Tangible Equity
New Capital Will Remain Scarce And Fairly Targeted
Banking Industry Will Continue To Consolidate
Up To An Additional 200 Failures in Southeast U.S.
Live Banks -
Board And Management Fatigue
We Will Participate In Situations That Fit
Organic Growth Story & Supplement With Acquisitions
Industry Competitive Dynamics
Strategic Overview
Strategic Overview
9


Market-Focused, Not Size-Focused
Southeastern U.S. –
Texas To Virginia
Focus On Metropolitan, Not Rural, Markets
Interest In Specific MSAs, Based On Opportunity:
Risk/Return Perspective Consistent With Our Culture
Connectivity To Recruits And Target Clients
Competitive Dynamics (Current And Future)
Areas Of Emphasis:
Small Business And Retail
Trust, Wealth Management, Capital Markets
Targeted Market/Branch Expansion
Improve Operating Leverage And Profitability
Strategic Focus
Strategic Overview
Strategic Overview
10


IBKC Overview
IBKC Overview
Our Locations
11
Deposit Market Share as of  June 30, 2011. Source: SNL Financial. Map Reflects Locations as of  October 24,2011.
*Other Mortgage Locations not shown = 9
Arkansas
34 Branches
$1.0 bil deposits
#12 Rank
32 Non-bank Offices
Texas
4 Branches
$185 mm deposits
#227 Rank
3 Non-bank Offices
Louisiana
78 Branches
$5.1 bil deposits
#5 Rank
31 Non-bank Offices
Alabama
12 Branches
$500 mm deposits
#20 Rank
5 Non-bank Offices
Florida
42 Branches
$2.3 bil deposits
#24 Rank
10 Non-bank Offices
Tennessee
2 Branches
$155 mm deposits
#113 Rank
1 Non-bank Office


Indicates cities in which our members of Senior Management (Market Presidents,
Executive Vice Presidents, etc.) have resided/worked.
IBKC Overview
IBKC Overview
Where We Lived & Worked
Greensboro, NC
Indianapolis, IN
Las Vegas, NV
Mansfield, PA
Morris Plains, NJ
New York, NJ
Pittsburgh,  PA
Phoenix, AZ
San Diego, CA
Scottsdale, AZ
Wilmington, DE
Resides in New Orleans, LA
Michael J. Brown, VC
Chief Operating Officer
Jefferson G. Parker, VC
Manager of Brokerage, Trust,
and Wealth and Management
Anthony J. Restel, SEVP
Chief Financial Officer
Robert B. Worley
General Counsel
Daryl G. Byrd
President and CEO
Beth A. Ardoin, EVP
Director of Communications
George J. Becker III, EVP
Director of Corporate Operations
Barry F. Berthelot, EVP
Director of Organizational Development
Resides in Lafayette, LA
Resides in Greensboro, NC
Gregg Strader, EVP
Chief Credit Officer
Broad Experience Throughout
Southeastern U.S.
12
Resides in Annapolis, MD
Robert M. Kottler, EVP
Director of Retail and Small Business
Albuquerque, NM
Annapolis, MD
Boston, MA
Buffalo, NY
Charlotte, NC
Charlottetown,
PE, Canada
Chennai, India
Cleveland, OH
Columbus, OH
Detroit, MI
Flint, MI
Hartford, CT
Resides in Raleigh, NC
John R. Davis, SEVP
Director of Financial Strategy and Mortgage
Resides in Greensboro, GA
James B. Gburek, EVP
Chief Risk Officer
Resides in Gastonia, NC
H. Spurgeon Mackie, EVP
Executive Credit Officer
Experience in Additional Cities:
Indicates cities in which our 11 members of Executive Management have resided/worked


Combination of Organic Growth And Acquisitions
Include Bargain Purchase Gains (Present Value Benefit)
Exclude One-Time Costs
Full Deployment Of Capital During The Planning Period
Organic Loan Growth
Selected Acquisitions
Share Repurchases
Regulatory Capital Limits Subject To Change
Selective Branch Additions And Strategic Recruits
No New Businesses Assumed
Improve Operating Leverage From Prior Investments
Other Assumptions
Strategic Overview
Strategic Overview
13


Return
On
Average
Tangible
Equity
Excludes One-Time Costs
By End Of Planning Period
Tangible Efficiency Ratio
Entire Company, Not Just Bank
By End Of Planning Period
Asset Quality
Nonperforming Assets/Total Assets
Exclude FDIC Covered Assets
Earnings Per Share Growth
Annual Growth Throughout Period
Excludes One-Time Costs
3-5 Year Strategic Goals
Strategic Overview
Strategic Overview
14
13% to 17%
Target 60% or Less
Peer Top 10%
Double-Digit %


Strategic Overview
Strategic Overview
Return On Tangible Equity
15
Source: SNL; US Bank Holding Companies reporting as of June 30, 2011
-30.00%
-25.00%
-20.00%
-15.00%
-10.00%
-5.00%
0.00%
5.00%
10.00%
15.00%
20.00%
25.00%
30.00%
2Q11 Return On Tangible Equity -
US BHCs
ROTEs 13%-17%


Strategic Overview
Strategic Overview
Tangible Efficiency Ratio
16
Source: SNL; US Bank Holding Companies reporting as of June 30, 2011
0%
10%
20%
30%
40%
50%
60%
70%
80%
90%
100%
110%
120%
130%
140%
150%
160%
170%
180%
190%
200%
2Q11 Tangible Efficiency Ratio -
US BHCs
Tangible
Efficiency Ratio
Less Than 60%


Strategic Overview
Strategic Overview
Asset Quality (NPAs/Total Assets)
17
Top 10%
Source: SNL; US Bank Holding Companies reporting as of June 30, 2011
0.00%
2.00%
4.00%
6.00%
8.00%
10.00%
12.00%
14.00%
16.00%


Strategic Overview
Strategic Overview
EPS Growth
18
Double Digit
Growth
Source: SNL; US Bank Holding Companies reporting as of June 30, 2011
-100.0%
-80.0%
-60.0%
-40.0%
-20.0%
0.0%
20.0%
40.0%
60.0%
80.0%
100.0%
EPS Growth 5-Year CAGR -
US BHCs


GRAPHIC 6 g248190ex99_1logo.jpg GRAPHIC begin 644 g248190ex99_1logo.jpg M_]C_X``02D9)1@`!`@``9`!D``#_[``11'5C:WD``0`$````9```_^X`#D%D M;V)E`&3``````?_;`(0``0$!`0$!`0$!`0$!`0$!`0$!`0$!`0$!`0$!`0$! M`0$!`0$!`0$!`0$!`0("`@("`@("`@("`P,#`P,#`P,#`P$!`0$!`0$"`0$" M`@(!`@(#`P,#`P,#`P,#`P,#`P,#`P,#`P,#`P,#`P,#`P,#`P,#`P,#`P,# M`P,#`P,#`P,#_\``$0@`0@$+`P$1``(1`0,1`?_$`)4```("`@,!`0`````` M```````*"0L'"`$"!@4$`0$`````````````````````$```!@$#`@0"`P<, M#@L!```!`@,$!08'``@)$1(A,1,*%!5!(A9183(7-Q@Y<8'!(S,T-3:V=SAX MD;%"@E-C)76U5[3H1`0````````````````````#_ MV@`,`P$``A$#$0`_`)%?=N\B^XO9;M@P=B';A4*\O9?R';L=BV>X7/ MF"LQWN#L0VAE.WR%5LDL_KF5FOQA5I:)R+!/'2\=;DY=N=0@JO4UG"2BGJI' M(H`&`+M7$EZ#)^+,;Y(*Q5BPOU%JEQ^6K%,15@-D@V,N9FQB8]C%1C5%C& MQC-K'Q[)N0$V[-BR0(V:-4$P\$T6Z"92%*'@!0`-!^S0&@-`:`T!H#0&@-`: M`T!H#0&@-`:`T!H#0&@-`:`T!H#0&@-`:`T!H#0)V^X&M&_[C(VWO]V6$.3+ MIM`CMM>]Q1S#9WW)8#PG M8=W+R%@:EX?'./S2\7$W2W1->D'\65U"&;#(-&D@QGF?$>&9&NVJH08?%6,D;) M5RIQ$LQG6,>4RR!#&.@N!#$-VB(#H(+N,+WAN2[5EO'V%N1#'E#&H7:<85<- MP.-6+JM2-7EYMXWCXF1N=05>.8)Q5T72I0=N68MEFJ9S+&*H4@ET&W'N7]_V M_7C)MF`(3ITI\C&9=M9(9Y954 M7:JPC]42FZ>&@T!X+>4[E*Y5MY#2F"H*#'EF(]*AM7#B+4==@+@DH14$A$2&`W3004\$^_'E%W$<@>^? M8[OOS:Z>V#`V*[5`H#%5"JQ+JJ7]G<&]71N4(JA$($D`2:NP=-"N"J-U2BF) MBB'7J$,W+-S6\LO'KO[SSM&QOO3LMYIF)G]2:0UFNV.,:%LTB6?H]8R#Z8433%-,G5(I>H=>N@FYX%,SZR MF8\E-SE)W3X5R15$[QCNQY,PO4(67F(UE)+1-@J]H3J!(E"/FXM\W#]O9*$! M5NLFH!2"(AH)]."OG:I?,#3L@U*RT-KA[,K>W=CC.X-:A3J'C5E&7]&QS4^REJ_:WCFNKR*$8JA$I@ M469T5@[S#W^6@>=T%9USL^X3WWTKD?S7A_9GN-M.'L+804:8H38U1G773*UW M2MF+69Y*14J=5, M>OZ?0LR7+`]C=OHYTWR+1(RM2UBCT&3CUG+!NRML9+PIT))/]K5$Z!CE+^"( M#XZ"O\0&.<7A>1AL8*WE.'D0^,KJ M\0G)27V60^)'TC)AZA^POEH&[\L['^2"%I$_.;=^5;*[[*D1%/7]3K69\-X/ ML..;1,M43+LH2R&A*E"SD8QD52`D9PV6[DN_N$I@`0T$37#%[DN[;LMSKGC] MWYXUJF+]RR4G)"-?I&=0-((T^):MU45T2RG<<`^H;0.S;9\XUO9C_F6X0M&" MW>QC>G;Q92,.W>FXU=8UK*;##61\FLX.%F/LT-D2<24C04V2*[M M9R4GQAC'#H4-!%)[??W#>Y',F[ZX;(.2RYHO+M?9%>"Q#9YJN1%,D*IE.J+2 M#2?Q=9T&B<8W1//E;G(U]5,RY))L5`.GK>`.S9EHEKR5CFQ4RDY3M.%K+,I- MDXW)-+CX"4LE<.@\0 M4ZIHG&*9!"P&%FG\&#9*C9K&6),1.I>1E4+;6JZ6.?_ M`&HKDDS2CP:S:BO5-+U!5(4.H%$=`[AE*P1F`-J=JE,Q;C7]03HV-'S6R[D+ M#'U5E8F\HWC%4"7%&O$CBUE_:W3SM,SC&[-0KQX8B"*!S'*00A_V>X.Y0=R\ M':,O7CD*W$X2P;97+0^W.N6G!V!&>>K52?AP$,CY=AWE*/$T5:TG$%XZ`3;_ M`!C1H8IG2GJ&[`">'[)V;_6'.?Q"^RG\&0?\9>O7\8/[R_ASIX?#?O+_`!>@ M5F]Y/^BXI?\`66H'^A+/H*T?;>(%W$8%,80``S1BT1$1Z``!>((1$1'P``#0 M6O?NZ40\0%#"(@(?3_`/+M!T%7+QV`([^=E@`'41W3X&``#Q$1')M: MZ``:"W9YL<_8OV]<8F\&QY-MD#7`M.$KU0J=&RTFQ92%ON=NA7$'"5RNLG;E M!>7E7+E\4XHH`GAZBP-NX?OCH(X?9R@(\K$V(`(@&W# M)8B(!X`'QE?#J/W/$=`]_N3Y!)?'W*AL+V`X^FZXY-FBJ9KR+G:,%&-E)R'J MU8JR:N.FHG%51[7'$Q.(.EP$2)G<-T>H")/,/5XJXSJYB'E+W$L;_[)*-H&]/98A_]?.X,?H_.8>!U_4H]=Z_V.N@B=]ZMGK&=VW&; M5,'U2Q0E@O.)L?W.;R&UB'[.0<51>X3;-*&KT[\(NJ>-ESM84[H6JP$5(BLF M<0Z'#09=]F1L:SU6LLYVWNWJE6>CX:F,3DQ-C64L,:_A"Y,G9NS05BEY6NMY M!HB:9JU>CH(I#/D1%N=XY*FF8YDE0(&EOO/OTD6'?ZLU=_E;9M!MM['[\K6_ MC^;K#'\I;EH'?M^^X<=L&U#+>4HT!)]D`II"*HI%.)0$0T%>E[H[C`-LZHW'_F*O-@ETOQ-M]OVBM2=PN>-D5F MFD4*YF*JDRQCUB[<`F7[?4CT(ZQ,V(+."IBO+59T13TTR"H<60CY!H+'_05/ MG$<`C[GJ&Z`(_P"^;NV'P\?`'67Q$?U`#06F&:,W8FV[XWM.7,V9`J>-,=TZ M)?3$[:+C/15>BV[=BV5=&;(NY=VS0=23L$O3;-B&%9PL8J:93',`"%:KPI[) M,^R?F2VN4FM;QA1+1>9A551-,IF=:A MW(AH$P^7'C9M&8^!)7-HFX"L(*@DY5G6KFAKPP:_$BJ(]A7P.$@[>T`T&'X+\N M'N1/YOJ#_P`!Z.@3E]I=N%PYM7W3[PL[9ZOE?QQC''^SR>F9^QV&1:,$C`WR M+156\3%).ED3R]AEE2`@Q8H=[EVX.5-,IC"`:!VO:C$M.79Y0=^N:)RMV3:; M"3ZU@V>[6(2WDX_MT M=6D3MH/)V.\M1C*0=8WR@PS1E2V.J=:3(+&B9%>"R#:K?!R\8W?"05VZC?O4 M1`2E.0P@8`0UP3S^WX!M&4H7.^/L+Y-L&/[=B[(]:@PCY5K3K`ZA) M$E9M,1&LK-5EWR+(3-U06]%4`[1"0'W3F\''._7:#Q+;KL6IN6=5RU M"9TF#0CY0BLC6)YI^+Z,LM6DE4P*DJ^KTZS7:J'('8H*?<7P$-!HE[4S!N-M MP')7,4?*45,3%<)@'(DJ1K"7*YTAX5\V7ADD%?G%&GZY,&3(5X)X_MQN!XJZHXYS_2,^UV\M;);+=?TJW?Z703+,E6UBN$ MG/SC=A8(65+VH.'ADTUD#>D``80`&4(O=C@F:W0VG9O%W0CS<)2L8PN8+12$ M8V2'Y/1+#)&BH>3=2_POR@KAXZ+U*V]85_3,4XD[1`=!4\^YD_36;S_\]8W_ M`-DE&T'T=O.VG5DM[DBS5$VTPTG.LZG=%#RD5)GF;(FQ,Q'U2LD%1 M.3H4V@U(YP=ON^[?5QRYUQA>=J>"(#[$Q)MO4(J)>_P`>@A6;;#-SDULSWC[=-S,*LY1/B+*E7LLR M@V.HFH_JQ)!-G;HPQ4_%4'];=.D@(("`G,'AX:"\2H-U@GY"JSQ*0K=X MK,';(%ZB#3C M3S/&),;G@R>4>LU2.H>Q,LR9D^T<#()#W-I*'D9*]R16KQJH`&()DSDZA]8I M@\-`I=N@Y4.0/V\?(NMM3LF69G=_LD,UJUWI=1RZTA%,ALL46<#E6BZ]D",B MXV0;6BI.$7#H!N#D1/? MYE3'EUQ9;]K6T]Y3;_49^D3\>;$S(UVXC>?"6VLY6;I5N'OU\L^U6^1Q9)5Y$-5YR63?XRF6TH\;1ZDL MV3F4&2+9R9%(5DWQC=I>X0`'O^3W^D[PS_\`Z**_\,.?=!)YFO#6.MPN)[_A M/+5:C[?CG)E7E:C;:]*($7:R$3+M3MEP[3@/IN$!."B*@?635(4P>(:"K4@W MV?O:^BATI%F< MH`0KC0.0X2R917MAR>LXB'$IM2D[)C>Y,E%2.J+DV& MR!30JEF%%(0^/CFSIR*;QJ;J5PT44)X"("`;=<4/(+N']O'O^R%L7WJLIIAM MTL5Z2@,DQ*XN5(BF2;URDRK>X''RKA`WQE4E(L2+/BH`!7C$>X0*X0$-!:!5 M6TUV\5J`N-0FHZQU:TQ$?/UV>B'23V+F(:5:IO8Z18.T#'2<-7;58IR&*(@( M#H/OZ!27WDQBFXN:8`&*(AN6H'4`,43!_D2S_1UZZ"M"V\?E_P`&_P`\.,_Y M:PF@M??=PF0)RA5ZI0 MKR2D9)A:;A).(1RLF@D*;!NNR5(JHJN*:211$3F``'03L<^VR>PY.CW&RPK%8IC`NT@Y&:.T*J'U5?1$P>`AH/ MR^SF$`Y6)L1$`Z;<,ECXB`>`.X#KY_6`QD[-BJR.7#RH22:QNH*.6K,!:.@ZB8CEN<#>.@L&O:IGHBJWSD4L]@?MXN!KF(\5 M3TW).E"IMHZ(B)F\2$D_<',(`1NT9-CJ'-Y`4HZ!O3B9A7N0L<9FWV6AH^9W M'?\`Y:DLV1T=*B?YA6L(UUO]@-O=4$BO0[9%GC2#;R!DP`H?$R:QQ*!CFZA* MO(L&4K'OXN2;I.XZ29NH]^T7*!T'3)X@=LZ;K$-X&2704,4P#Y@.@I,N7':> M]V4\BFZC`)XQ6,K\#E&?L%"*8G8BYQ]<7:MEJ:[/R[FB,;(@W*/W4!#Z-!9& M^UAWI*[K>+2@TRS3:,CD/:U//<$SR2KD%)`:O#M6LGCI\X*H85CD5J;]%L"@ M]0,HT.'7PT"9'$?_`/T]0OB'],[=K](=!_[5E_R'R'KH+5^S7.H4N)>3UPM- M=JL''-UG;^7L4U'0T8S:H$,JLX MIP(UO^>7CIN"A1ZG0@4PZF+V]`G[T%;7[PW:K8<";V-OF_K&R!X)KEF%B8B4 ML,60$%8O,V'GJ$A#21C(@':]=5X[)8JANACJ-3>8AH&*Y[=9`[V,=^W2W+0; MY!VKDK>%7GUF3353.>-O$=M2SU$W:'<`4P]KF,L[!TD8!\?JA]W0,T`(&#J4 M0$/N@("'_1H(%O<%<3D1R@;-9A*F1#(-SV"VDM=\%S0E!)U,G20*XLF-W;@@ M=ZK&X,FG:V*?N*E($2,`!W''0+L>US9S\7QJ8T\2L@Z'UFORT6OH@CT`$@)V@``'30:?>RJ_2#;C1^YM5E/I#_670 M?[.@:B]PKPJ5SE$V]JY$Q7#Q\9O'PG!R#_&,T0A&Y\D5ULDX?OL33RW&C^.D&2Y'+-\R=(V-R MYE(C?<`+Y"8%."IH>]Y1RU:H-90INX#.H67O#F-=_6\>BJ1PT&YF!]I.V/:_ M$A"[>L#8LP^P[!3/]A:=#0CY=,Q0**;J60;?-79!`H>"JQPT&I6X'AOXY]U- MXE,B;AMN\;EBURLK)32KVW6^^/VK*0ES(&DU(:*^TQ(R$3>BV3]1-JBDF;TR M^'@&@QI2^`_BAQM,C8\<;48+']A%HXCQGJ7=O44'[!Q M>C-WC0QQZ;/JG;[-*&2 M/*6*S6K($W.21T$$FJ!WTG(6I=VZ.BU0(F43G$0(0I0\`#09JV^\0O'WM5M, M'<-O>"$L52M?GB6=@VJUXR"T@E9Y-J9D23DJZ>T*PDLX*T/Z?5R@J':`!T\` MT'N=WG&-L4WY3]2M6[';K2LPV6C1+R"J\[/#*M)2,AG[H'SB+*\AY&.579"\ MZJE35$Y2',82].HZ#7W&7!-Q7X7M\;?L2[5H#'-RB5$SLK%3[AD&#DBID<(. MA:KK,K4E\6Q57:IF405`Z2G8'<4>F@[9,X*.++,]JD+QEK:S!Y'MDDY?.7,[ M<;CD*=?E^8R#J43C+`KBOEC4;-V:E@N%QR'89I5HT* M)6K963D[6X=J(-BF$$RF.($`?#08L>\9'!CM(GD*@^CL';8[/>`9.&]6>;FI M;$$W;2IJJM8YRE!OLGP3V:*5=0Z2*A4E`]0W84>X>@AD^#X#.):"L[?(-8VG M5J%NI7KF::7F#N>0F-G+(R15C/)9O86EL(_!Y(%=J"HL53N5!4W41[AT&177 M"[QN2SDCFU;=T[T4@@(,;[D?*UPB#=!`>U:&G;L\BG!!$/$JB)@'Z0T&RLIL M6VGOL0A@B(PM4Z%BWXZ,D35K%B+C%WJNX<5ACU'$I0G%?F'0(_$&Z@HN<#@( M`;KT#H&(,.\4^Q[`-DJ=HQ%BJ8I3J/)%THNN"Z"@+*J&,<#"(CH)%-!&)G+ASX[]RUAFK-GG`:>4I">LKZWO6U MNOF1).&1L&@\3"\%W%_6H^MQ%SRH@&@T+MW%1L$R8OD>PKX98LBYVM3W)&375"N=PJ M$;DBP6&!2A'TS.)5*PQS"5:R\+]4Z8%^&5!4Y^T14,80P30^`3BIQ9*.IO&& MVK\74T^8*1;V7I.2X>Q=M;KJLU%T$SBF)A*)R%'IU`-!+/ M0J17L:TRLT&IH.VU:J,.S@H1N_DG\P]1CF"0)-DW,I*N'%(S@Y&UH,[3 M`,XN!CB`FT&2_P`4?#G]C/A?Q\8Y^R'YMW3X_P#.[L'H M?FW_`(_/G/VP^;_C(]3[*_CP_P`F?/O4_?'^3?B.S]HT$UN@-`:`T!H#0&@- M`:`T!H#0&@-`:`T!H#0&@52AXS!^WW>)R!)\DFQW-NYS)^>,_+6?;KF*"VD7 M7=13K[MQE8N`9XRPI2[7!UFQ1%"E<=NT%R/X=^K%-$#G^(%IP"3#EFRWN M-Q+AC`9L!KYHQQB^WYCJU5W*Y7V\XA4S%G?!V$%X&3=&L="QTA5KX471;`U8 MQ[UT$+*#'-%E%"HF$N@XV,9FWA7[C3R?DC-$=DU7-$!';C6^$+!D#%BV.LU9 M(H=293H80O\`=<2DB&1X6_VQ-NBH+!..;BZ$$E`;%,L)-!]_8H3==6^/5[FO M<[FW)N1-P.1<,R&69.)R/0ZUCQ;#-B1Q^X63I$#3HNL5^0CF<7(L0<+$ERN7 MQG)SBH;M$"`$6W"[O,WK[D,T[RB0R;N@G$,78JQ%GU MM.UEEC>%P%D*,Q_3H>Z15W@G,DNN1!_/)N6R";OX@BACI)A]?>_NIY):5OIR M!5L<.=TT`[J5\P)$;0L(8IVOK9*VM[E\<6R09)YIM&?\V_8F;/3):JE6]WC3%EV08FVNY%R5A9KFW.,_1\^Y6Q9CR+R&_QU MCT<86"5"<4=6.L66LU4Z5D:((LI&20*V!PNXK MO6X:NXLLVW_``]^.O/5*QNPH$\[AK/'U"'HEZ09H6_(;!@UEWZ$ M"[*U20= MR,#M;J!V55OV,1N>3S61Q9X5=2LRF,GE34>S#V"CUU$2-G<8L[*B@!U>XY!/ MH-I>33*NZ#%&S+$D]@(F4JX^G'L&SC)8,DW_'&*DZ_ M8"25@@'2#5%3K&/?ES5=58&IQ2^H'XN./,.Z_(NRS.-IS".6+!)U&]9M@=L& M2-%6V;DSKI)$+$L!?H((K?#$,J("&HW& MW?>27\X':,IN8R)N#R/1-Q>R*[Y,S3`Y0PO$4JI86S=5-FW3A\]`GK$`"AT`)%MU7%CM4WD)97:9LA)^6CLSRF/I:]1\;) M-8Y!^OC2IV>H5HB*I(\[I!--I:5G)Q]03_&H(JE$HIAH,#?\B'8#]@OQ=_8N MQ?(?Q+?F\=WS=G\;^)G\Y+\Z7[`>O\K[?D'XR/J>CV]OR_\`:?/Z^@F8T!H# M0&@-`:`T!H#0&@-`:`T!H#0&@-`:`T'4WF7\'S_NO/\`O?OZ#DWX(_@_WWX/ MZ^@Y#R#]CR_6T&.LO?DERA_!?Y.KK_#7\"_Q:D_X6_\`*_\`#_XKNT&G'$W^ MC`_P`1/_;?_=_^KH)"A_"+^#]/G^%Y?W/[.@[?<_5_ M8'R^_H.I_P`$?P?H_#_!\P\]!V#]D?+]7^WH./H^CR_6\O[6@!\A\O(?/R\O ?I^]H`/(/+R#R\O+Z/O:`#Z/+R^C];R^]H.=`:#__V3\_ ` end GRAPHIC 7 g248190ex99_2s10gbgd.jpg GRAPHIC begin 644 g248190ex99_2s10gbgd.jpg M_]C_X``02D9)1@`!`0```0`!``#_VP!#``8$!08%!`8&!08'!P8("A`*"@D) M"A0.#PP0%Q08&!<4%A8:'24?&ALC'!86("P@(R8G*2HI&1\M,"TH,"4H*2C_ MVP!#`0<'!PH("A,*"A,H&A8:*"@H*"@H*"@H*"@H*"@H*"@H*"@H*"@H*"@H M*"@H*"@H*"@H*"@H*"@H*"@H*"@H*"C_P``1"`+1`\$#`2(``A$!`Q$!_\0` M'P```04!`0$!`0$```````````$"`P0%!@<("0H+_\0`M1```@$#`P($`P4% M!`0```%]`0(#``01!1(A,4$&$U%A!R)Q%#*!D:$((T*QP152T?`D,V)R@@D* M%A<8&1HE)B7J#A(6&AXB)BI*3E)66EYB9FJ*CI*6FIZBIJK*SM+6VM[BYNL+#Q,7& MQ\C)RM+3U-76U]C9VN'BX^3EYN?HZ>KQ\O/T]?;W^/GZ_\0`'P$``P$!`0$! M`0$!`0````````$"`P0%!@<("0H+_\0`M1$``@$"!`0#!`<%!`0``0)W``$" M`Q$$!2$Q!A)!40=A<1,B,H$(%$*1H;'!"2,S4O`58G+1"A8D-.$E\1<8&1HF M)R@I*C4V-S@Y.D-$149'2$E*4U155E=865IC9&5F9VAI:G-T=79W>'EZ@H.$ MA8:'B(F*DI.4E9:7F)F:HJ.DI::GJ*FJLK.TM;:WN+FZPL/$Q<;'R,G*TM/4 MU=;7V-G:XN/DY>;GZ.GJ\O/T]?;W^/GZ_]H`#`,!``(1`Q$`/P#F_'OC'Q-: M^.?$5O;>(M9A@BU*Y2...^E5442L```V``.U87_"<>+/^AGUW_P82_\`Q5'Q M&_Y*%XG_`.PI=?\`HUJYVOIZ=./*M#YBI4ES/4Z+_A./%G_0SZ[_`.#"7_XJ MMS5?&/B=/"VA2IXCUE99&N-[B^E#-AEQD[N<5P-=#K'_`"*'AW_?NO\`T):Q MKPBIT]/M?^VR-:,Y>Z@55>*V$L5WO),C8R M.^#N.!^/%8U*RIM)]3:G2=1-KH>245'$V14E:IW,FK!1110`449HH`****`" MBBB@`HHHH`****8!1112`****8!1110(****`.B^(W_)0O$__84NO_1K5SM= M%\1O^2A>)_\`L*77_HUJYVHI_`BZGQ,*Z'6/^10\._[]U_Z$M<]70ZQ_R*'A MW_?NO_0EK"O\=+_%_P"VR-:/P5/3_P!NB<]11174?F"G M!Q[5W6M^!X+;P-_:T>I7C1I`ERELY!12V/\`'K7!3_=KVSQ&,_!YL_\`0-A/ M_CJUQ8J3BU8[<-%-.YQ&F>![:Z\%G7_MTRJMO).8?+!^YNXSGOM].]1:!X,_ MX2/P]+J.CWC>?&[1FVGC`RP`.`X/H1U'7TZUV?AK:?@F_F$A/L%SN*C)QF3H M*R_A[-)/X,O;+P7.%U&.3?,U^FT@L,`IM)'1>,YY!S7/[>:3LS?V,&UH8^C^ M"8-0\'-KK7TT>V&64PB,'_5[LC.>^WTK%\+:;IVO7[69NKBVF,;/'E`X]>:3>7'H/AY_#KW;W MAGNMY";9/,Q'P`">-N._^*I^$/"MOXKLKM["_D@NK;&Z.:(%3NSM^8'/\)SQQ7=?#7:?AB^\D+M MN,D#)`Y[5GV%C_PKOPA21EN>>XZ8J77G=JY2 MHPLG8Y7PAX1_MS5=2TZ[N7M;FQ8J^U0X)!QCJ.X-8?B6RCT?7+K3XI6E%NVP MNPQN/TKM?@G=S7_B+7;NY;=-.@D<@8RQ8DUA>((?,^)6L3,$\NT80%RH M7:#GC!56+_B;P.=&\)P:JL\CW`\LW$1`VQ[A@XQZ,0*Q M_!&B1>)=5>QDN'@81&4.JANA`QC\:]%^'W_$^\!WFC7TT3RIOA9DD60A7R58 MX)Y!)Q_NUQWP:CDM_'%S;SJ4EBMY$=3U#!E!%)5Y*,DWJ@=&-XM+0R_#^CV> MN:L^F0WU:*JTV0Z2LA/&V@KX=O[9()VN;2YA$L00>>`>W8BK^KQ'6?A5:7#/'+=Z M-+Y3LCAOW9P.WL4_[Y-86A:_+XXI*I-QT>J M&Z<5+5:,S=.AM[FUOI9FE#6T0FPN/F!D1,>WW\_A6MXU\/Q^'-6M]/AFFNII MHEE4[`.K,NW`SD_+^M:GC#0H]+.LZCINUM)U&Q6:!D'RJ3<0$K[#G(]CCM79 M^+],L]7\1W-I!(&TU#:.Q^4KODW`>A/0GJ`>.]2\0[I]"E05FNIY-J-O M;6@6))7>Z`_>@$%(V_NY[GU]/>J51O#+:W$EO)_^PI=?^C6K MG:BG\"+J?$PKH=8_Y%#P[_OW7_H2USU=#K'_`"*'AW_?NO\`T):PK_'2_P`7 M_MLC6C\%3T_]NB<]11174B6GP[?0)+ MQC=&UF@WK"^S+[L'.,X^8=JR?`OB32_!ECJ#AIM0O;G;M2)"D:A)O8]&\(> M+M%TCP4=*N[E_M3I)]V)BJE\X!..V:@\`^,]-T[P[]:NF>(O#]A\0;[78KMA M9W41!B$+[PYVY/3&"03U[UP#("*U-'OX;+2]4MG::&:Y0!98D5BP"L#&V2,* MVX9(_N]#2J4-6QTZ^EA='?2;#78M1O+Q[B.&;STBMHCEV!R`2VT`9QZU<\;Z MY'X@9;A)X0Y[M4^V2OBVCC#?NP5.""6X`..NXGIWS4\FO-9E M<^EKE[X?:SI^E0:K;:O.5L;^$PO&B,SYQ@$8&,89N^>E8&J+;&*V^SW<D?V M1J"7-@1?RN6@:,$I&#C`!+<`?-U#9R/2J4;/FLR7*ZMM)2=Q:***W,`HHHH`Z+XC?\E"\3_\`84NO_1K5SM=%\1O^2A>)_P#L*77_ M`*-:N=J*?P(NI\3"NAUC_D4/#O\`OW7_`*$M<]70ZQ_R*'AW_?NO_0EK"O\` M'2_Q?^VR-:/P5/3_`-NB<]11174G_MT3GJ***ZCG"BBB@`HHHH`****`"BBB@`HHHH`****`"BB MB@`HHHH`****`"BBB@`HHHH`****`"BBB@`HHHH`****`"BBB@`HHHH`**** M`"BBB@`HHHH`****`"BBB@`HHHH`****`"BBB@`HHHH`****`"BBB@`HHHH` M****`"BBB@`HHHH`****`"BBB@`HHHH`****`"BBB@`HHHH`****`"BBB@`H MHHH`****`"BBB@`HHHH`****`"BBB@`HHHH`****`"BBB@`HHHH`****`"BB MB@`HHHH`****`"BBB@`HHHH`****`"BBB@#HOB-_R4+Q/_V%+K_T:U<[71?$ M;_DH7B?_`+"EU_Z-:N=J*?P(NI\3"NAUC_D4/#O^_=?^A+7/5T.L?\BAX=_W M[K_T):PK_'2_Q?\`MLC6C\%3T_\`;HG/4445U'.%%%%`!1110`4444`%%%%` M!1110`4444`%%%%`!1110`4444`%%%%`!1110`4444`%%%%`!1110`4444`% M%%%`!1110`4444`%%%%`!1110`4444`%%%%`!1110`4444`%%%%`!1110`44 M44`%%%%`!1110`4444`%%%%`!1110`4444`%%%%`!1110`4444`%%%%`!111 M0`4444`%%%%`!1110`4444`%%%%`!1110`4444`%%%%`!1110`4444`%%%%` M!1110`4444`%%%%`!1110`4444`%%%%`!1110`4444`%%%%`'1?$;_DH7B?_ M`+"EU_Z-:N=KHOB-_P`E"\3_`/84NO\`T:U<[44_@1=3XF%=#K'_`"*'AW_? MNO\`T):YZNAUC_D4/#O^_=?^A+6%?XZ7^+_VV1K1^"IZ?^W1.>HHHKJ.<*** M*`"BBB@`HHHH`****`"BBB@`HHHH`****`"BBB@`HHHH`****`"BBB@`HHHH M`****`"BBB@`HHHH`****`"BBB@`HHHH`****`"BBB@`HHHH`****`"BBB@` MHHHH`****`"BBB@`HHHH`****`"BBB@`HHHH`****`"BBB@`HHHH`****`"B MBB@`HHHH`****`"BBB@`HHHH`****`"BBB@`HHHH`****`"BBB@`HHHH`*** M*`"BBB@`HHHH`****`"BBB@`HHHH`****`"BBB@`HHHH`****`"BBB@`HHHH M`****`.B^(W_`"4+Q/\`]A2Z_P#1K5SM=%\1O^2A>)_^PI=?^C6KG:BG\"+J M?$PKH=8_Y%#P[_OW7_H2USU=#K'_`"*'AW_?NO\`T):PK_'2_P`7_MLC6C\% M3T_]NB<]11174)_^PI=?^C6KG:Z+XC?\E"\3_P#8 M4NO_`$:U<[44_@1=3XF%=#K'_(H>'?\`?NO_`$):YZNAUC_D4/#O^_=?^A+6 M%?XZ7^+_`-MD:T?@J>G_`+=$YZBEI*ZC`**45?T/2;S7=7MM,TR'S;RX;:BY MX]R3V`Y)I-I*[!)MV1GT5U?BWP1J'ANPM[^2[TW4M/ED,/VK3IO-C64?\LV/ M9JJ>$?"M]XHN;A+.2TM;>UC,MS=WDGEPP+VWMSC)&.GK]1FJT''FOH:>RES< MIS]%=D_PZUU/%<.@`6CSRP_:DNTFS;&#_GKOZ[!]._N,Q:YX#U;2M5TJS1[/ M4%U5MME<6,WF0RMD`J&XZ$C/U[XI+$4WU&Z$UT.2HKJ=2\$ZE9ZAI=M;S65^ M-3E>&VEMI&\LNK['4[U4C:Q&>V""":Y_4K3[!J-S:>?#<&"1HS+"Q9'(."5) M`R/0XJHU(SV(E!QW*U%%%:$A1110`4444`%%%%`!1110`4444`%%%%`!1110 M`4444`%%%%`!12T4`)12T4`)12\44"$HI<4<4@$HI:2F,**6C%`A**6B@8E% M+10`E%+10`E%+12"PE%+Q13`2BEHH`2BEQ1@T@$HI:*8"44M&*!"44M%`Q** M6B@!**6BD`E%%%,+!1110`4444`%%%%`!1110`4444`%%%%`!1110`4444`% M%%%`!1110`4444`%%%%`!12\8KH?"O@S7_%8F;0=-DNXX"/,<2(@'MEB!GIQ MS4SG&"O)E1A*6B1SM%6M2L+K3+^>RU&W>VNX&V2Q.,%6]/\`Z_?K56FFFKH3 M33LPHHHIDA1110`4444`%%%%`!1110`4444`%%%%`!1110`4444`%%%%`!11 M10!T7Q&_Y*%XG_["EU_Z-:N=KHOB-_R4+Q/_`-A2Z_\`1K5SM13^!%U/B85T M.L?\BAX=_P!^Z_\`0EKGJZ'6/^10\._[]U_Z$M85_CI?XO\`VV1K1^"IZ?\` MMT3GZ2EI*ZC`4=:['X2WU[I_Q`TJ?2[,7USO9!;^8L9<,I#`,Q`#8Y&2,]*X MX4^.1XI4DB=DD0AE93@J1T(/:HJ1YX.)<),QK9>'F39KC>#98!#R M'WMT3!'#<-Q]?2N$\2/>^%OASX&CGADL]:MKRXNXXY$P\8#\;E/3<<=<=\5Y MJ^I7TFI?VB][-CUC0-6NM4LM/N;N*STR74;F32])2VC?;$T[_P"E M72AF9BP#*H^8#)P,`&N.\>>&].T:ULKS2S=QPW$]S;/#=R*[AH9-N\,JJ-K9 M'&.Q'/6N5FN[B>.!)KB:1(%VPJSDB,9SA1V&23QW-3:GJE_JLR2ZI?W=[*B[ M%>XF:1E7T!8G`]JUAAW&=T]#*5=2C9K4--NH;.9Y+G3;2^#IM$=TTJ!3D<_( MZ']376^++G1M(O[6&U\+:0R364%PWF379(9T#$#$XXR:X4=>.E=3\1/^0IIG M_8*M/_1(JZD4YH4)-195_MW3O^A3T3_O[>?_`"11_;NG?]"GH?\`W]O/_DBL M%L@FDR?6K=*'G]YG[21O_P!NZ=_T*>A_]_;S_P"2*/[=T[_H4]#_`._MY_\` M)%8&3ZT9/K1[.'F/GD;_`/;NG?\`0IZ'_P!_;S_Y(H_MW3O^A3T/_O[>?_)% M8&3ZT9/K1[.'F'/(W_[=T[_H4]#_`._MY_\`)%']NZ=_T*>A_P#?V\_^2*P, MGUHR?6CV1O_`-NZ=_T*>A_]_;S_`.2*/[=T[_H4]#_[^WG_`,D5@9/K M1D^M'LX>8<\C?_MW3O\`H4]#_P"_MY_\D4?V[IW_`$*>A_\`?V\_^2*P,GUH MR?6CV1O_P!NZ=_T*>A_]_;S_P"2*/[=T[_H4]#_`._MY_\`)%8&3ZT9 M/K1[.'F'/(W_`.W=._Z%/0_^_MY_\D4?V[IW_0IZ'_W]O/\`Y(K`R?6C)]:/ M9P\PYY&__;NG?]"GH?\`W]O/_DBC^W=._P"A3T/_`+^WG_R16!D^M&3ZT>SA MYASR-_\`MW3O^A3T/_O[>?\`R11_;NG?]"GH?_?V\_\`DBL#)]:,GUH]E#S# MVDC?_MW3O^A3T/\`[^WG_P`D4?V[IW_0IZ'_`-_;S_Y(K`R?6C)]:/90\P]I M(W_[=T[_`*%/0_\`O[>?_)%']NZ=_P!"GH?_`']O/_DBL#)]:,GUH]G#S#VD MC?\`[=T[_H4]#_[^WG_R11_;NG?]"GH?_?V\_P#DBL#)]:,GUH]E#S#VDC?_ M`+=T[_H4]#_[^WG_`,D4?V[IW_0IZ'_W]O/_`)(K`R?6C)]:/90\P]I(W_[= MT[_H4]#_`._MY_\`)%']NZ=_T*>A_P#?V\_^2*P,GUHR?6CV4/,.>1O_`-NZ M=_T*>A_]_;S_`.2*/[=T[_H4]#_[^WG_`,D5@9/K1D^M'LH>8>TD=!_;NG?] M"GH?_?V\_P#DBD_MW3O^A3T3_O[>?_)%8.3BI["TGU"]M[.T4OAK_P!O:=_T*FA_]_;S_P"2*/[>T[_H5-#_`._M MY_\`)%!\*ZB2<7&B`9X']M6?'_D:C_A%=2_Y^=$_\'=E_P#'JS_<]_S+_>!_ M;VG?]"IH?_?V\_\`DBC^WM._Z%30_P#O[>?_`"11_P`(KJ7_`#\Z)_X.[+_X M]1_PBNI?\_.B?^#NR_\`CU'[GO\`F'[P/[>T[_H5-#_[^WG_`,D4?V]IW_0J M:'_W]O/_`)(H_P"$5U+_`)^=$_\`!W9?_'J/^$5U+_GYT3_P=V7_`,>H_<]_ MS#]X']O:=_T*FA_]_;S_`.2*/[>T[_H5-#_[^WG_`,D4?\(KJ7_/SHG_`(.[ M+_X]1_PBNI?\_.B?^#NR_P#CU'[GO^8?O`_M[3O^A4T/_O[>?_)%']O:=_T* MFA_]_;S_`.2*/^$5U+_GYT3_`,'=E_\`'J/^$5U+_GYT3_P=V7_QZB]+O^86 MJ!_;VG?]"IH?_?V\_P#DBC^WM._Z%30_^_MY_P#)%'_"*ZE_S\Z)_P"#NR_^ M/4?\(KJ7_/SHG_@[LO\`X]1^Y[_F'[P/[>T[_H5-#_[^WG_R11_;VG?]"IH? M_?V\_P#DBC_A%=2_Y^=$_P#!W9?_`!ZC_A%=2_Y^=$_\'=E_\>HO1[_F%J@? MV]IW_0J:'_W]O/\`Y(H_M[3O^A4T/_O[>?\`R11_PBNI?\_.B?\`@[LO_CU' M_"*ZE_S\Z)_X.[+_`./4?N>_YA^\%_M[3O\`H4]#_P"_MY_\D4?V[IW_`$*> MA_\`?V\_^2*1?">I,V!;69J=A=:9>&VNQ&L@57_=R+*I!`8$. MI*G@CH:<8TI:+\Q.52.YJ?V[IW_0IZ'_`-_;S_Y(I/[=T[_H4]#_`._MY_\` M)%8!-&3ZU?LH>9/M)&__`&[IW_0IZ'_W]O/_`)(H_MW3O^A3T/\`[^WG_P`D M5@9/K1D^M'LX>8>TD;_]NZ=_T*>A_P#?V\_^2*/[=T[_`*%/0_\`O[>?_)%8 M&3ZT9/K1[.'F'/(W_P"W=._Z%/0_^_MY_P#)%']NZ=_T*>A_]_;S_P"2*P,G MUHR?6CV1O\`]NZ=_P!"GH?_`']O/_DBC^W=._Z%/0_^_MY_\D5@9/K1 MD^M'LX>8<\C?_MW3O^A3T/\`[^WG_P`D4?V[IW_0IZ'_`-_;S_Y(K`R?6C)] M:/9P\PYY&_\`V[IW_0IZ'_W]O/\`Y(H_MW3O^A3T/_O[>?\`R16!D^M&3ZT> MSAYASR-_^W=._P"A3T/_`+^WG_R11_;NG?\`0IZ'_P!_;S_Y(K`R?6C)]:/9 MP\PYY&__`&[IW_0IZ'_W]O/_`)(H_MW3O^A3T/\`[^WG_P`D5@9/K1D^M'LX M>8<\C?\`[=T[_H4]#_[^WG_R11_;NG?]"GH?_?V\_P#DBL#)]:,GUH]G#S#G MD;_]NZ=_T*>A_P#?V\_^2*/[=T[_`*%/0_\`O[>?_)%8&3ZT9/K1[.'F'/(W M_P"W=._Z%/0_^_MY_P#)%']NZ=_T*>A_]_;S_P"2*P,GUHR?6CV1O\` M]O:=_P!"GH?_`']O/_DBE_MS3CP?"FB?-V$MYGK_`-?&1]1FN?YH.2N#TH=. M'G]X<[;1I>)H(K;Q!?PV\2PPK*VV-2Q"#T&[G`]ZS*V/%W_(RZC_`-=36/5P M^%$S^)CL<5ZY\&/BCIW@G1[S3-6L[J6.6X-S');;6.XH%((8CL@]>M>149., M=JBK2A55I(NE4E2=XLZ'X@^(1XK\8ZEK2P&W2Z=2D9.2%5%5<^Y"@GW-<[11 M5QBHQ45T(E)R;DPHHHJB`HHHH`****`"BBB@`HHHH`****`"BBB@`HHHH`** M**`"BBB@`HHHH`Z+XC?\E"\3_P#84NO_`$:U<[71?$;_`)*%XG_["EU_Z-:N M=J*?P(NI\3"NAUC_`)%#P[_OW7_H2USU=#K'_(H>'?\`?NO_`$):PK_'2_Q? M^VR-:/P5/3_VZ)S])2TE=1@%+24I'&0#VY[9S0,**#P2.1SGT_($*!7I7A;0=-N_@WXCU M2:UCDU&*YV1S'[T8`C(P>V=YS7FO49`('H:\_!9A#%SJPBK.F[?E_F;5:+II M-]0HI**]`Q%HI**`%HI**`%HI**`%HI**`%HI**`%HI**`%HI**`%HI**`%H MI**`%HI**`'"M[X??\C[X<_["5M_Z.2L`5O_``^_Y'[PW_V$[;_T:3=C3_MR]_P"G;_P%C_PH_MN]_P"G;_P%C_PKN]+^"VO:AIMK>1ZA MI:I/&LJ@R.2`1GLI'ZU:_P"%%^(?^@EI7_?)/B+*H2<)54FO7_`".I M83$-743SK^W+W_IV_P#`6/\`PI/[)KCP];:E<6\-Q;BO6C M6I:6U,G2J6.?.N7H_P"?;_P%C_PI/[ M+KI[K3E,R1%H[:Q"E855@#!DC('T_(5QQZ5U7B+_`)!Q_P"O>P_])S6MCQ?_P`C M+J/_`%U-8]$/A14_B8N:2BBJ("BBB@84444$A1110`4444`%%%%`!1110`44 M44`%%%%`!1110`4444`%%%%`!1110!T7Q&_Y*%XG_P"PI=?^C6KG:Z+XC?\` M)0O$_P#V%+K_`-&M7.U%/X$74^)A70ZQ_P`BAX=_W[K_`-"6N>KH=8_Y%#P[ M_OW7_H2UA7^.E_B_]MD:T?@J>G_MT3GZ2EI*ZC`6NN^$L5O/\1M"CNK-KV)K MC!B"[L<'#D=P#@GV!KD3T%;7@[Q!=>%O$%GJUDD4DL!8>7+]UU9=K`].Q]ZS MJ)N+42Z;2DFSUGXP-<7/@".?5KS3M0"@^G2H-"\;6>D7NLV\6@12^'-4"B32I+M_E*@;= MLN-W4'G'IZ"N&%.<:+BT=DZD'4YCTV"SU0^)Y_$>L:G!XCAM-`EU#2+W[(D( M8J>"8P!A@6.`<]0>O`YS7-4AU+P[X!\8>)XX+R[6_>*\9(E5KF-)`1E<`';M M/''!K$'Q.GB\06=S::3!'H5K9G3H]),K,K6[C#J7(SN.!SCL,Y&P!/;&:F%"IS)27]:CE5A:\?ZV/0);G3= M?O=/U)KHZW)H9FEDN%BDS=RR3DVEJ-X#,01G;C`&0,C->9>+]+UNQU$W?B*( M"XOG>7S4E2578,0PW(2N5;@@&K-CXLFTZST.VTZTBB.FW7VZ4L2WVJ<,-K,. MRA<*`/_E:.&6UC8#.ZXN$A7J.A8C-=%\3(S#K=C&2K%=,M1E&# M#_5#H17)GK@__KKJ/B)_R%-,_P"P5:?^B16\OC1E'^&II*4]325L]S(** M**`"BBB@!RCJ30H[G@5TW@+PI?\`BG6K:&WM'EL4E3[3+DHJIN&[YNYVYX'M M6C\4/#]MIGQ`FTG0[;RHI1"(H02?F90,#//)/ZUY,\XPT<6\%S7G9M^25M_O M-_J\_9>UZ-V.S\-6$EI^SOK4DK$8#[6"Y]R4W?_KKY>N8I+>0PSH4D'8]17SO"&+EB9XEU M%9SFY+T>B_(Z\R48\L(]%9^O7\T044OUI*^W/-"BBBF`4444`%%%%`!1110` M4444`%%%%`!1110`4444`%%%%`!1110`HK?^'W_(_>&_^PG;?^CDK`%;_P`/ MO^1^\-_]A.V_]')6=7X&.'Q(HZM_J=-_Z]1_Z&U9W:M'5O\`4Z;_`->H_P#0 MVK.[4Z>PY[B4N32451)(LLBJ%61P!P`&/%+Y\O\`SUD_[Z-145E]7HO["^Y% M<\NY+Y\O_/63_OHTAFE/61S_`,"-1T4OJU'?D7W(.>7]9E`..E7[.-[ASLZB_P#&%\\>D0Z<9K>WTRT>TCCG=;@.KD[]P9`A!SC: M5QM`':HH?&>MP0RQ0SVJ12^8<)8P9`D^^$.SY`V,[1@9&:YSG.:,<8[4O8T^ MPU5EW+&HWEQJ%_<7MW)YES<2-+(X`&YV.2<`#')Z57HI*T2MHB'KJ+FC)I** M8A3TKJO$7_(./_7O8?\`I.:Y4]*ZKQ%_R#C_`->]A_Z3FL:NZ-8?"SE324II M*V9D%%%%`PHHHH`****`"BBB@`HHHH`****`"BBB@`HHHH`****`"BBB@`HH MHH`4T=J#1VJ7U".Z-?Q?_P`C+J/_`%U-8];'B_\`Y&74?^NIK'HA\**G\3"B MBBJ)"BBB@`HHHH)"BBB@`HHHH`****`"BBB@`HHHH`****`"BBB@`HHHH`** M**`"BBB@#HOB-_R4+Q/_`-A2Z_\`1K5SM=%\1O\`DH7B?_L*77_HUJYVHI_` MBZGQ,*Z'6/\`D4/#O^_=?^A+7/5T.L?\BAX=_P!^Z_\`0EK"O\=+_%_[;(UH M_!4]/_;HG/TE+25U&`4H)'2DHH`6DHHH`7-';';TI**!A1VQVHHH`4=:ZKXA M_P#(4TS_`+!5I_Z)%/P_P"*-2TN"5Y8;:8HCN06*X!&<<9P:QAT`[9I MT*\*].->/PR7X6N$H2C+EZ['NWP?GEM/A;>2P,8Y#K,2[AP=K-`I_F:[KQ)X M*L;_`%ZUUR"W9]7AOK:7S3(0%C1EW#;]W&`3ZYZ&O-/&,\O@?X6^'-&M&,6I MW11/.B'<%+`%0.F2`> M?>OR#%97C\9*KFN!LDY2ZZN"M]ZT/HZ5>C3BJ%5=%]_],L>*=06P^+-_<,&( MM[FU?:O&X>2AV@]LX/YUP'Q%A$FH)?VMFL%JR8&S)47,K1PQ75M.Q7)`5(H^H`^OZ5TOV#3O%/@FXLM%UJ*^%K;LKPPJP8L)% ME#!201TV@X/)->_2QW]FT,'C)+W7"*;MHE9+\SEQ^&Q=6HJD_A]ZR5NFGZ'S MP_WS]>U-J:ZB6&X>-'5U4X#*<@CVJ&OT2+4HIK8\-!1115#"BBB@`HHHH`** M**`"BBB@`HHHH`****`"BBB@`HHHH`****`%%;_P^_Y'[PW_`-A.V_\`1R5@ M"M_X??\`(_>&_P#L)VW_`*.2LZOP,H_\`0VK.[5HZM_J= M-_Z]1_Z&U9W:G3V'/<2BBBJ)%QQFCO4B6T\BAHX964]"$)'\JE2RN&95$$@+ M'`+(0*=KNR1K"A4G91BVWY%+O#-YX5NHK;4Y(?M$BEBB1RJ!CT:1%##.>4+`X..U9>TC?EN1[.5KV, M#-&36E'HNJ2W+01:7?/,L@B:,6[E@Q&X*0.A(!.,YP"<8%.70-9\BYF.DZCY M-M(8IY!;,1$P(!5CC"L#US5<\5I<2A)ZV,NDJ[J6G7NF3"'4K&YLYV7<(KB) MHW//HW)'N,53/4U2=Q-6$HHHI@*>E=5XB_Y!Q_Z][#_TG-E=5XB_Y!Q_Z M][#_`-)S6-7=&D/A9RII*4TE;,R"BBB@84444`%%%%`!1110`4444`%%%%`! M1110`4444`%%%%`!1110`4444`*:.U!H[5+ZA'=&OXO_`.1EU'_KJ:QZV/%_ M_(RZC_UU-8]$/A14_B844451(4444`%%%%!(4444`%%%%`!1110`4444`%%% M%`!1110`4444`%%%%`!1110`4444`=%\1O\`DH7B?_L*77_HUJYVNB^(W_)0 MO$__`&%+K_T:U<[44_@1=3XF%=#K'_(H>'?]^Z_]"6N>KH=8_P"10\._[]U_ MZ$M85_CI?XO_`&V1K1^"IZ?^W1.?I*6DKJ,`K?\``V@#Q1XJT[1S<"V6ZD(: M4\X4`L<#U.,#W(Z=\"NK^%UYI6G^/-(N]?8)8P2F0NP8A'`.QCCL&Q6=5M0? M*7"SDKFUXW\(Z%9^%6U[PO/JOD0:@^G3PZFBARX&0R;0/E]B,\]JS?`GAK3M M5L]:U?Q!=74&BZ1&C3"T5?/E9R50+NX`X.2?_KCN_B/J":KX0M-.U[Q/H>M: M[)J?^A7-E*OEVT#``^:R@!1D=QGI][&!@^$(;"WTWQAX+O=;TF"6^2%[;4#< M?Z&[1MNQYF.,@C\C]#PTZLU1U;O^FAVSIQ]IHD2CX;:;+XEMFM]1NO\`A%YM M*.M&9HP;A85^]'_=W=/FQCGIV-#5/!.CW<_A2[\-W]W_`&/KUQ]D#7RIYL#J M^TY*X'.RO)+L7*W9$CVR6\F))2511C;CY<<'CG.:X#4?L@O M[@:;YWV+>?)\]@S[,\;BO!..N*]"TG7H8=.L#XBU:34KS6;B.&_:2=II+:P2 M3F,G)9=S%B0,?*/]H53^*(TK9IXLSI)O_,N?,.E^5Y1M_,_:Z*YKX_C?$3IY9*C!7=1J*_-_@CT\JBG7YW]G4\T\>Z?\`VO\`&*\T\N8U MN[^*WW]=N[8N1[\]#1)X3MM(^+UEX=:5KFU6Z@RSH`64A7P1Z?-BO>]>_L^6 MQ9ZSIMY>?M#12VMM-+%;RV\DDBKA401 MKDD], MVD5_L]LL,"%5)"AD5R<^N9#^595E%!I/B6TU,.%\BYBECB"X7,M'NM,UJ=9HCMV1L74Y4;D4]?QKGSU/UKVCQ[ MH%MIT.N6\L$L[&)1#.S,H01Q(V0!P:\[A_,8X_"QDG>UOR/C*M M&5&7+)6$HHHKVUL9A1113`****`"BBB@`HHHH`****`"BBB@`HHHH`****`" MBBB@!16_\/O^1^\-_P#83MO_`$5&!61P1R#DU'13NT7&K4C\,FOF2R7$TC[GE=F]=QIOF.?XV_.F4478 MY5JDM7)_>;&BZT=,TS5[06WFG4(XT#;RNS9(KG..>=N.V.H-:NM^,/M=NUOI MMB+>VDEGGD-ZR7TC/+MW;'>/(X48Q\W))8UR?I[=*,_Y_6LG1@W=A[5GIU+4S&8OMEP\_EEMQ4,Q(4GO@'%9U%%;I)*R,6[N["BBBF`IZ5U7B+_`)!Q M_P"O>P_])S7*GI75>(O^0P_])S6-7=&D/A9RII*4TE;,R"BBB@84444 M`%%%%`!1110`4444`%%%%`!1110`4444`%%%%`!1110`4444`*:.U!H[5+ZA M'=&OXO\`^1EU'_KJ:QZV/%__`",NH_\`74UCT0^%%3^)A1115$A1110`4444 M$A1110`4444`%%%%`!1110`4444`%%%%`!1110`4444`%%%%`!1110!T7Q&_ MY*%XG_["EU_Z-:N=KHOB-_R4+Q/_`-A2Z_\`1K5SM13^!%U/B85T.L?\BAX= M_P!^Z_\`0EKGJZ'6/^10\._[]U_Z$M85_CI?XO\`VV1K1^"IZ?\`MT3GZ2EI M*ZC`*6DHH&*"1THS_G_/U-)10`=L?A2YI**`%)SUI.U%%*P"CGKSS73_`!!_ MY#5C_P!@VS_]$)7,+73_`!`_Y#5C_P!@VS_]$)6,_C1I'X)'+CH/I10.@^E% M;LS+VB:?-JFK66GVQ437_Z_8O_`$(5[Y\>AE_!"V&I?#R074K'&J_:6=CSNC:.3) M/N5&?QKOM5O_`"+6PN+%XV2[N8$W@9WHS#!S]*\&T[Q?<:3X%UG1-'LF1YKA MD6Y60956"JX`QD'`.#ZM6KI7CR"S^'.C:>,G7K*[C6.UD4C[*I9)=FOB]-#UY)X.U*:=DOB[Z_\.4_BVP3QCKT1P7N)K=4 M&>NZ",9_\=-<9)>?V;=O:F(N9Y#(S@Y^\?0"G>.-9NM4UR6ZNXHXKMR)&D0G M/0``>@'05SOGR"XCEE=F=".7.>!TK]4R*,\!@:=*6DXJ*?R1Q4,Y>$J3<+J; MDM>T;.ZM\S0\1NLFIY0L<(,AE(QR?6KOA+5TTR>!BW^DI<))$"."0>.<^OM6 M/?WDE],99=@*C`V=*BM`IN(1RQWC('>O2J24IRML]/5,R_M:4,TGBL/JI-K; MHSZ5T[Q1'XIFBMKW38AI^Z03QN?,)0(&&>!CD'COTKP_XG0Z?!XSOO[%@6&Q MD2&6&-(]H`:)&X7H,Y/%:GAK4!9>,+:W*7,5OG M>.;'1)?A5K%[I]E`DK10&4L`\B,%BP"QY!V;>GK[U^9U*=+AG.>2C%\E2T8I M;*[5VR\SI.IB*U)62B[_`'+\CYR)R3QBDI325^C;'S;"BBB@`HHHH`****`" MBBB@`HHHH`****`"BBB@`HHHH`****`%%;_P^_Y'[PW_`-A.V_\`1R5@"M_X M??\`(_>&_P#L)VW_`*.2LZOP,H_\`0VK.[5HZM_J=-_Z] M1_Z&U9W:G3V'/<2BBEJB!**7IR3^?2E/_P!;K1S+N`VBE/'!ZG]:7Z=?IGBE M=`)16E:Z)>W.DS:G&L"643F,O+(O\`D''_`*][#_TG-E=5XB_Y! MQ_Z][#_TG-8U=T:P^%G*FDI325LS(****!A1110`4444`%%%%`!1110`4444 M`%%%%`!1110`4444`%%%%`!1110`IH[4&CM4OJ$=T:_B_P#Y&74?^NIK'K8\ M7_\`(RZC_P!=36/1#X45/XF%%%%42%%%%`!11102%%%%`!1110`4444`%%%% M`!1110`4444`%%%%`!1110`4444`%%%%`'1?$;_DH7B?_L*77_HUJYVNB^(W M_)0O$_\`V%+K_P!&M7.U%/X$74^)A70ZQ_R*'AW_`'[K_P!"6N>KH=8_Y%#P M[_OW7_H2UA7^.E_B_P#;9&M'X*GI_P"W1.?I*6DKJ,!3T%:.@:)J'B'4X].T M>W^T7LBEDBWJF0`2>6(';UK.J2&)YI8X85+RRG8B#JQ/&/UQ4R=DVAQ5VD=1 MXA^'?BGPYI*)(84EC\;R[<031RK*^_855E+`L&!!!Z=\=:S M+^SGT^^N+.[55N(',V=C]A6&YDL='6XG\T MM>W+[I)BP486-",?+P2.O;@?&7A=-`@M;RVOGOK2XFG@+R6YA<2Q/M?Y=S#! MR"#D_@>*VIU^:7+/)1D/%#YISD<8W+_,UT'Q)6-?$-JL+%XQI]F%8KM)'D)@XRM9NH_\C+&RL2`Z'IW-67\[4!'/ MY0C$5R%=<\D?2M+4O+@C9R`TLTP2(E1A6Q\I_#'\J^RQ.-:2DMGTWU-,RS/Z MQ3A4IWA3;3L];M:[[62Z'->)I"^JOP0RH!S663FK^N222:I/YN,HY7CVK/S5 MJSV/G<15]K5=1=1>F#3XG*RQN%#%&SBF4N<=*$VFFB(3<)*4=UJ=_P"#KY+O M5[&\EA0".YC0@^S9//IR/UKO-1OUUCPUXGT72;4+<74:721JV1&J6UL=H]SM M8?45Y'H`D73KEXG<2JQ947'S$#('/O7:^`O$<>D>.;3SX)$,SK;L>N48E0WL M`S`GZ^U>#Q7EKKTX9A'6<%>W1VE?7[C[+,JLJ^$H5IO62LW;N[;]-.YY6W4^ M_--KKOBGH4/A_P`;WUG:#%M(5FB7'W%<9V_@ M?&U8.G-Q?02BEI*Z2`HHHI@%%%%`!1110`4444`%%%%`!1110`4444`%%%%` M"BM_X??\C]X;_P"PG;?^CDK`%;_P^_Y'[PW_`-A.V_\`1R5G5^!CA\2*.K?Z MG3?^O4?^AM6=VK1U;_4Z;_UZC_T-JSNU.GL.>XE';T]Z**HDN_VC/]C%L2@B M'/"#-.EU.XF6-7*$1D%<(!S5'BCBLW2B];$*+#3M"-AJ5QJSVY:826,4<;6\PE4* MKL<@AD(W`,&Y"XV.$P2`3P/2N5 M[4N<#%0J$4[FWM96L>@Z5XSTJRTFRT:72V?3/L,]K6EY:26\D$3V5I!#<1VT*7&^%$#QR,,%HFVG.6;&%XX(/G.> M+_\`D9=1_P"NIK'HA\**G\3"BBBJ)"BBB@`HHHH)"BBB M@`HHHH`****`"BBB@`HHHH`****`"BBB@`HHHH`****`"BBB@#HOB-_R4+Q/ M_P!A2Z_]&M7.UT7Q&_Y*%XG_`.PI=?\`HUJYVHI_`BZGQ,*Z'6/^10\._P"_ M=?\`H2USU=#K'_(H>'?]^Z_]"6L*_P`=+_%_[;(UH_!4]/\`VZ)S])2TE=1@ M%3V5W-97<%U:OY=Q`ZRQN%!V,IR#SP?ITJ"EI#-.\US4;O7?[:N+@-J32K-Y MQ51AEQ@XZ<8`Q[5HVGC;Q%9^([C7;74Y(M3NAB658TQ(,8P4V[3V_*N:]?>E M%3*$9*PU)K4Z"?QEXAG\21^(9=5N/[6CX2XRHVC&-H4+MV]>,8Y/K4'B?Q-K M/BB[CN==OI+J9%*)N5450>N`N`/RK&Z'CZ4#CI25*"UL-U)/J:3ZWJ3PZ;&+ MN15TTEK0)A?))?>6&!G<6Y)//`]!3]>U_4M?>)M4N%D:/=L5(HXE!9MSMM0` M%F/4GD]ZR\_SS29JO9QO<7.Q3][)&,'@>E=-\0?^0U8_]@VS_P#1"5S"]_K7 M3_$#_D-6/_8-L_\`T0E9S^-%Q^"1RXZ#Z44#H/I16S,SV?PN?LGP)N6@4!KN M_P#+E/\`>!91CZ8`'XUPFLS2Z=;2+9+Y2><"K(.,;?\`/YUVNE`GX")L&7&I MJ1_W\6N1U4F31IRT:QR*V",=^WZ8KY/(+RKXC_K[._W(]RI&52-.DEHH2?X? M\#\3*TS5HX+1HY_-=VD+EZOF\CN[.>=H&EBCER!@<``$'KBK27=S M#;&!)`(7SD%<_7FOL*-11U:Z6-[E002!]:[/PZMA=:W;RVX8$7$9QD@Y# M`C';K53]["U8O5-/3Y,^PX=J<]"M0ERM/[,F^SU7HR;XV7L.H>.&N[5]\,MM M&5;&,XS_`%%<$W!-=?\`%#[)_P`)%!_9QF-I]DC\LS8WX^;KBN1;[Q^M>1D< M%#`48KHCY6O)RJ.3ZB#K2D5ZK\%/"FE>)]-\0QZG;K)(%CCBFYW0;@_(]^`? MPK#^*?@1O!NH0FTDFN-+N1B*1\;E<=48C\"#Z9%#J*BJZV.$I<4=Z.N>I[<=:]R3?*^C_JYRJ[=D&*.E:OB#P_J?AV[BMM9M7M MYI8EE5<@[@21U[=*RSSR*FG6IU8JK1=XL)1<79B&DHHK1@%%%%`!1110`444 M4`%%%%`!1110`[/%6=*O9M,U.TO[0K]HM9DFCW#Y=ZL"N'_P#H'6O_`(#2_P#Q^N4H MH]E$/:R.K_M3P_\`]`ZU_P#`:7_X_1_:GA__`*!UK_X#2_\`Q^N4HH]D@]K( MZO\`M3P__P!`ZU_\!I?_`(_1_:GA_P#Z!UK_`.`TO_Q^N4HH]D@]K(ZO^U/# M_P#T#K7_`,!I?_C]']J>'_\`H'6O_@-+_P#'ZY2BCV40]K(ZO^U/#_\`T#K7 M_P`!I?\`X_1_:GA__H'6O_@-+_\`'ZY2BCV40]K(ZO\`M3P__P!`ZU_\!I?_ M`(_1_:GA_P#Z!UK_`.`TO_Q^N4HH]E$/:R.K_M3P_P#]`ZU_\!I?_C]']J>' M_P#H'6O_`(#2_P#Q^N4HH]E$/:R.K_M/P^1SIMKR/^?>4<>W[_K5;7]6L[Z" M;R2WFN8MJ"$1(B1H4``WL>F.M<\#QCUI,T*DD)U7:P&DI:2M#(**DBC>0D(` M<#-'EN%)VY`..O>ES1NTWL!'13Y8WB8!UP2,TXV\H*J4Y?I4^VAHV]P(Z*E% MM+DX7TZ;4K>-,I:QS>2KN2`-[`%@ MN-QX'4*.AKM-)\87NHNUMH/PY\,WL<*?+&FD/26,D9026C`20OP0Z@\-]W!!/0DCD5Z?X:LH/#OA[4);74M9U#0) M)4N1J?AF40W,9"L/+N8V.Y%`R1VSCUJ,0XWUO@"U@GC@]:TO$NJ#6?$.HZDL1@6[G>81DY* M@G."?7U]Z;X?U3^QM5CO186&H%`5%O?0^;$Q((Y7C..M;PO"G\7?`S2/M+,O?'7';ZUFL1[G.UJ6Z'OPZCI&B:A?Z==SC26& MF)R6T+RD#@9(7.!^5;WQ*BDMO$5M#-&\U0DOW9RJ\8R,Y'`]?84K(R?>4J3ZC].G6NF^%Z+)\0-`610RFY7(89'0U M[=\?;*;4/"-C!:0F:ZDOXXXP%RV65P,>G.*^3W#@_TKS[Q%.S6L@1VV?:2IQQG"C^N:['QU;2> M$]$L/"TDJ3*J+<%5/^LF9P6.>V,8'J#[UQ&M,[V#%EQNNG..X^45KE%%T8.I M%IJI*4U\]OP1V9M*6&A1P[M=J[:W6C5ON,)\!CCI24&DKZ1JVAX@M)110(** M**!CDP#DUH>'I6AURP>,G=YZ#/U(%9ZG!Z9JUI,YM=3L[E8A(T,Z2!2^`:^'PO%.%C4>76 M<6H]>ZZ+UW/2K9?*WMDM'8]6\,^%-.\-7^HRZ1$(+:Z2$&+)(5TW[B,^H8?C MFN?^(\B:KX8\8V=Y#')'IT<W&:_H+$8NE##2K2E[J6_EZGR$*.KOQ3X6N+=,Z8#/ZV"R&:2Y:M+E?JI--/[G8]BK@XU,4E]F5_O1 MX4>OI25TWQ'T4:%XVU.Q"E(3+YL0QC]V_P`R_EG'X5S-?I.#Q,,70A7I[22? MWGAU8>SFX=@HHHKH("BBB@84444`%%%%`!1110`N:2BB@04M)10`M%)10`M% M)10`M%)10`M%)10`M%)10`M%)10`M%)10`4444#"BBB@"Q:LRB3:4''\7X5/ M>.D:J(-N-Y?`[=JHU.*I7GV?[7-]B$HM=Y\KS?O[>V['& M<=<=ZBK*>"C.WO-?H)K4THI(OWA5D3YR6YSN^E2O/$58J44N.>:R**Q_LVFI M\RDQ`>I^M)2FDKU$K*PPHHHIC"BBB@`HHHH`****`"BBB@`HHHH`****`%-' M:@T=JE]0CNC7\7_\C+J/_74UCUL>+_\`D9=1_P"NIK'HA\**G\3%'6K^EZ/J M6KM(NDZ=>7S1CYQ;6[RE<^NT''Z51&*]O^`7Q!\.>%-"U&PU^9[25[G[0LWD M.X==@&W*@XP5)Y_O5E7J2IPO%7+H0C4G:3L>(S1O#*\4JE)(V*,I&""."#[T MRNI^)^N6?B3QWJ^K::C+9W$B^7N7:6"HJ[L>^W/XURU:0DY13:L1-*,FD%%% M%69A1110`4444`%%%%`!1110`4444`%%%%`!1110`4444`%%%%`!1110!T7Q M&_Y*%XG_`.PI=?\`HUJYVNB^(W_)0O$__84NO_1K5SM13^!%U/B85T.L?\BA MX=_W[K_T):YZNAUC_D4/#O\`OW7_`*$M85_CI?XO_;9&M'X*GI_[=$W/@\LS M>);AK7[1%<):.8[N"S%X]F=Z#S1#R7X)7`!(WYQQ4WCOQ5=6OC:*_P!#U>XD MU2U@6WNM06T-JUS(&8_-#@'`&U"&&#LZ=*X6QO;FPN8[BQN9[6Y3.V6"0QNO M'9AR#]*[-/B[XXC@2,:\Y55"Y:V@+=.Y*DD^^:5:E)U.=:E4YI0Y68'B>PUF M*?\`M37=.FLC?RNR^9!Y`D(`+%5[+\R\@`')]*S=->WBU*U>]1I+9)5:54`) M*@@L!G'4#UI^KZGJ.KW7VC5KVZO9]NT/<2,[!.[K5I$NDTVXEC&P;1*(E"C"@DC=@=,UJ>'/$OA[2[ MCQ%I$\&JS>%=651N#(+N-D.Y6[*3DD?E]#P7K[]:7/&,TG1C**B5&JXNYZI_ MPLK3H_$EL(=.NO\`A%X]+.C&%F7[0T+?>?(^7?TX!_4Y7GO'7B72M0T?1]!\ M-6][#I6F&20/>LIFEDI/`SBN/SZ]?6D''2J]A%2YD3[67+RL0]L]^M=5X^1Y M/$%JB*SR/IUD%"@L2?LT7&/\]ZY8]J]@\*)_Q>GPZ73Y3IT!4G^\+!3D<5QY MIBU@:,\2TKQBWZVU_(UPU+VS4/-&7\,/">H1:GX>\2/Y(L7U$6XCR?-&-PS@ M\8R"#WKV67Q[8#QS;^%X(+@WYFVR.RJ(POE&3*G.<\`=*W+V#3=+TZ2ZNHUC MM+61[YR>BMRS-CUR2?J:^5[SQ??R^-YO$UKB*\,YFC1AD`8VA3ZC;Q7Y?A*4 MN,J]7$U8V4(M1Z6;=UZVZGMU)++:<8QZM77EU-GXCQ7=[XWU5E+R,FHLJM)T M``0*/H`*YK4)))=,\Q]N6NW)V^NT5I/?ZEJD-[J,56A.'VDG\_^&L9A.324II* M](\\****8!1110`HI0?FX)!'0CL>:3M3UV[DSZC-):O7J5!7:\SZP^&MS:KX M.AF_I_`K5ZTUB)+KQ$]],K))5$<44K#<03EU(Q@^ZC\ZY+PEXATNS^%?B/2+R[6/4KR4M M%"58ESM3/.,#D&OQG&<+3KXO%5&VW[11^3:=_DCZJOCU1E[-N_+?YVNBW\?K MUT\=;+2Y;:UC"LBH^`V'=@&P>>"#^-4_AO\`$6;PLE_;S6KW\][+'ME>4Y!' MR_-D'(Q7"6=E-=QRRQ*/W8)?<3FH8F:&XC=U.5(;!&.E?HRXH?M&#_BN+'/7^SH\_7S9,UT7[,Y`L_$#8`Q M)$<_@W^%9?QSL?[=M=(\8:7)YVERVZ6[[>L8+,RD_BQ4^A`IOP6N9+7P+XYN M(3MEBMC*K*?NE8I#U]:^3K_ON%EAXO5.,6NSYDK,Z(7CCG-]=5]QO?`W4#JG MBWQG?'D7$R2CZ%Y,?H!5KP_92>']4^*:PGRV6-;F%E&,;HY9`1Z8R!^%8?[, M_P#Q]:_Z^7!G\WKT+QW]DT?2?$^JW4T<45YIBVJKT9Y1YH&/7/F*/;;7SF;3 M=+-ZV"IK2:II+TY7^5SMPSYL/&J]+7_&YY7^T0%;Q)H\VT"22S#/@=3O:O)! M7M'QGTZ[\0Z=X;\0:/;S7=K)9'S/)0OY0`#Y..G5O^^:\8!&2<8R>GI7Z3PC M6C++(04M8Z/NG=Z,\3,8.->3MN-HHHKZ:UM#A"BBBF`4444`+10,DX`R3T'/ M/OT]Z.O?OV'3_.:CGA>VEPLPQ1BE&21M`R3@#D9-)Z8Y!Z9R"1ZT*#UJ85(S^%W*::W$HHZ'GI3NW/'Y M9^N/2JUUOP=#8R>5"Y2:9Y'3=OVR)L4,^@QWKR\TS*.74XU9JZ;U\M M'_D4HN6VK/)<8)'IQ0.GZ9QQ74:QH8T^[O+.5-L@D@()'*+(H;'X;L?A6