Exhibit 99.E


© South African Reserve Bank
All rights reserved. No part of this publication may be reproduced, stored in a retrieval system, or transmitted in any form or by any means, electronic, mechanical, photocopying, recording or otherwise, without fully acknowledging the Quarterly Bulletin of the South African Reserve Bank as the source. The contents of this publication are intended for general information only and are not intended to serve as financial or other advice. While every precaution is taken to ensure the accuracy of information, the South African Reserve Bank shall not be liable to any person for inaccurate information or opinions contained in this publication.
| Enquiries relating to this Bulletin should be addressed to: | ||||
| Head: Economic Research and Statistics Department |
||||
| South African Reserve Bank |
||||
| P O Box 427 |
||||
| Pretoria 0001 |
||||
| Tel. +27 12 313-3668/3676 |
||||
| http://www.reservebank.co.za |
ISSN 0038-2620 | |||

|
Quarterly Bulletin March 2016 |
Contents
Quarterly Economic Review
| Introduction |
1 | |||
| Domestic economic developments |
4 | |||
| Domestic output |
4 | |||
| Real gross domestic expenditure |
8 | |||
| Factor income |
14 | |||
| Gross saving |
15 | |||
| Employment |
15 | |||
| Labour cost and productivity |
20 | |||
| Prices |
22 | |||
| Foreign trade and payments |
29 | |||
| International economic developments |
29 | |||
| Current account |
32 | |||
| Financial account |
39 | |||
| Foreign debt |
42 | |||
| International investment position |
44 | |||
| International reserves and liquidity |
45 | |||
| Exchange rates |
47 | |||
| Turnover in the South African foreign-exchange market |
50 | |||
| Monetary developments, interest rates and financial markets |
51 | |||
| Structural and regulatory issues in 2015 and early 2016 |
51 | |||
| Money supply |
56 | |||
| Credit extension |
59 | |||
| Interest rates and yields |
62 | |||
| Money market |
67 | |||
| Bond market |
68 | |||
| Share market |
70 | |||
| Market for exchange-traded derivatives |
72 | |||
| Real-estate market |
73 | |||
| Non-bank financial intermediaries |
74 | |||
| Flow of funds |
75 | |||
| Public finance |
78 | |||
| Non-financial public-sector borrowing requirement |
78 | |||
| Budget comparable analysis of national government finance |
81 | |||
| The Budget for the fiscal years 2016/17 to 2018/19 |
88 | |||
| Statement issued by Lesetja Kganyago, Governor of the South African Reserve Bank |
||||
| 28 January 2016 |
94 | |||
| Note |
||||
| Business cycles in South Africa from 2009 to 2013 |
102 | |||
| Arrangements between the South African Reserve Bank and Statistics South Africa regarding the transfer of the compilation of the gross domestic product (expenditure approach) to Statistics South Africa |
113 | |||
| Statistical tables |
||||
| Contents |
S–0 | |||
| Statistical tables |
S–2 | |||
| Key information |
S–146 | |||
| Quarterly Bulletin March 2016 |
|


Quarterly Economic Review
Introduction
The global economic recovery remained modest and uneven in 2015. Following three successive quarters of economic expansion, global output faltered notably in the fourth quarter of 2015 as both the advanced and emerging-market economies recorded slower growth over the period. In 2015 as a whole, output growth accelerated marginally in advanced economies but slowed markedly in emerging-market and developing countries. In its World Economic Outlook Update published in January 2016, the International Monetary Fund (IMF) lowered its projections for global growth by 0,2 percentage points for both 2016 and 2017. The risks to the outlook, however, remained skewed to the downside and would be influenced by, inter alia, the general slowdown in emerging-market economies, the decline in commodity prices, and the gradual tightening of monetary conditions in the United States (US).
Global inflation remained muted in 2015 and has moved broadly sideways in recent months, reinforced by a notable further decline in international oil prices since September 2015. Monetary policy measures are expected to remain accommodative in most advanced economies, but could be tightened in some emerging-market countries faced by the need to adjust to lower commodity prices, declining export earnings, and depreciating exchange rates.
Domestically, the South African Reserve Bank (the Bank or SARB) has officially identified November 2013 as the upper turning point in the business cycle, implying that the South African economy is now officially in a downward phase of the business cycle.
Concurrent with indications of slower quarter-to-quarter global economic growth, real economic growth in South Africa slowed marginally to an annualised rate of only 0,6 per cent in the fourth quarter of 2015, bringing the real growth rate for 2015 as a whole to a disappointing 1,3 per cent. Agricultural output declined further in the final quarter of the year as dry weather conditions adversely affected field crop production in most areas of South Africa; livestock production held up well over the period, although in part reflecting the forced marketing of animals due to the drought. Mining output rose on account of increased production of coal, platinum-group metals and building materials, but more especially diamonds and nickel. Real value added in the manufacturing sector contracted anew in the final quarter of 2015 due to disappointing global and domestic demand conditions coupled with sustained supply-side constraints. Activity in the electricity, gas and water as well as construction sectors, however, strengthened somewhat during the quarter. In the services sector, the real value added expanded at a slower pace despite slightly stronger growth in the commerce sector.
While growth in real production slowed marginally, real gross domestic expenditure growth picked up further to an annualised rate of 4,3 per cent in the fourth quarter of 2015. Growth in real final consumption expenditure by households inched higher, consistent with a slight acceleration in real disposable income and probably reinforced by expectations of higher prices in future arising from exchange rate depreciation. Firm increases were registered in the purchases of durable goods, in particular transport equipment, as well as semi-durable goods. Expenditure on non-durable goods and services, however, increased at more subdued rates over the period. The household-debt-to-disposable-income ratio decreased somewhat while the debt-service-cost ratio rose marginally in the final quarter of 2015. The pace of increase in general government’s real final consumption expenditure accelerated slightly over the period as government stepped up spending on non-wage goods and services.
Growth in total gross fixed capital formation accelerated somewhat in the fourth quarter of 2015, reflecting higher real capital outlays by all three institutional sectors. Real fixed capital formation by the private sector accelerated largely due to increased capital spending on renewable energy projects; real capital outlays in most other sectors contracted over the period given the availability of ample capacity. Over the same period, capital outlays by public corporations accelerated notably, underpinned by increased spending on construction works and transport equipment, whereas capital spending by general government continued at a steady pace to address the infrastructure bottlenecks constraining the economy from the supply side.
| Quarterly Bulletin March 2016 |
|


The sharp decline in real inventory holdings in the middle quarters of 2015 moderated in the final quarter of the year. The slower pace of destocking could largely be explained by a significant increase in the volume of crude oil imports following maintenance work performed at certain oil refineries in the preceding quarters alongside lower export sales. Viewed from the expenditure side, the disappointing performance of the economy was reinforced by weak net exports to the rest of the world.
Against the generally subdued growth in economic activity, enterprise-surveyed employment in the formal non-agricultural sector advanced only marginally in the year to the third quarter of 2015. Household-surveyed employment statistics that extend to the fourth quarter of 2015 suggest more vigorous increases in employment in the informal sector, although roughly a quarter of the workforce remains unemployed. With year-on-year remuneration growth slowing at a slightly faster pace than year-on-year output growth, the pace of increase in nominal unit labour cost in the formal non-agricultural sector moderated marginally to 5,0 per cent in the third quarter – consistent with the inflation target range.
Inflationary pressures have intensified in recent months. Headline consumer price inflation breached the upper limit of the inflation target range in January 2016 and is expected to remain outside the target throughout the year. The acceleration in headline consumer price inflation mainly reflected the delayed response of food price inflation to the severe drought conditions and the sharp depreciation in the exchange rate of the rand towards the end of 2015 when investor confidence retreated. Consumer goods price inflation quickened noticeably over the period, driven mainly by movements in petrol price inflation. Against the background of a steady uptick in most measures of producer and consumer price inflation, the inflation expectations of business and trade union representatives were adjusted upwards towards the end of 2015, exceeding the 6 per cent level by an even bigger margin.
Reflecting the fragile world economy and the concomitant slower growth in world trade volumes, South African export volumes declined in the fourth quarter of 2015, the first contraction since the second quarter of 2014. Though the depreciation in the exchange value of the rand boosted the export earnings of domestic producers, these benefits were more than fully offset by a further fall in international commodity prices. By contrast, import volumes increased further, reflecting firm growth in real domestic expenditure that flowed through to rising imports of capital and consumption goods. South Africa’s trade deficit resultantly widened in the final quarter of 2015 notwithstanding a slight improvement in the country’s terms of trade. Together with a somewhat larger shortfall on the services, income and current transfer account, the deficit on the current account of the balance of payments widened to 5,1 per cent of gross domestic product in the fourth quarter of 2015.
Despite bouts of increased risk awareness towards investment in emerging-market assets, the net inward movement of foreign capital was sufficient to finance the deficit on the current account. Financial inflows mainly took the form of other investment capital, as the domestic banking sector recorded an increase in foreign currency-denominated loans received as well as non-resident deposits while simultaneously repatriating loan finance previously extended to non-resident parties. The portfolio and direct investment categories registered capital outflows on a net basis during the quarter concerned.
In an environment of fairly subdued economic activity, growth in money supply and in total loans and advances to the domestic private sector nevertheless picked up moderately towards the end of 2015. Bank advances to the corporate sector rose firmly on account of increases in mortgage advances underpinning commercial property development and general loans related to projects in areas such as renewable energy. Credit extension to the household sector, however, remained subdued. Under these circumstances, house prices continued to increase, but at a pedestrian pace.
|
|
Quarterly Bulletin March 2016 |
South African bond yields trended slowly higher during most of 2015 as inflation expectations deteriorated, but rose sharply in December as a sudden decline in investor confidence related to political events was reflected in the money and capital markets and the market for foreign exchange. Prompt action taken to restore confidence led to a partial recovery in financial rates and prices in the final weeks of 2015 and early 2016.
The budget for fiscal 2016/17, delivered in February 2016, strengthened measures to narrow the fiscal deficit more rapidly in the next three years and to stabilise government’s gross loan debt. The narrowing of the deficit is envisaged through various adjustments on both the revenue and expenditure side. Responding to the risk of higher inflation but also mindful of the need to protect the fragile economic growth momentum, the Monetary Policy Committee (MPC) of the SARB raised the repurchase rate by 25 basis points in July 2015 and by another 25 basis points in November. Given the subsequent notable deterioration in the inflation outlook, the MPC decided at its January 2016 meeting to raise the policy rate by a further 50 basis points to 6,75 per cent per annum, effective from 29 January 2016.
| Quarterly Bulletin March 2016 |
|

Domestic economic developments
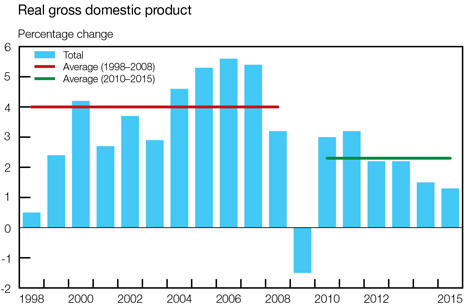
Domestic output1, 2
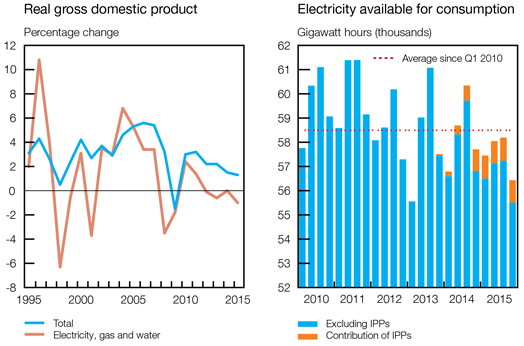
Economic activity in South Africa increased at a slightly slower pace in the fourth quarter of 2015. Following a contraction in the second quarter of 2015, annualised growth in real gross domestic product (GDP) accelerated to 0,7 per cent in the third quarter before slowing marginally to 0,6 per cent in the fourth quarter. The slower growth in the final quarter could be attributed to a decline in the real value added by the secondary sector alongside steady, but slower, growth in the tertiary sector. The real value added by the primary sector declined further over the period albeit at a somewhat slower pace than in the third quarter.
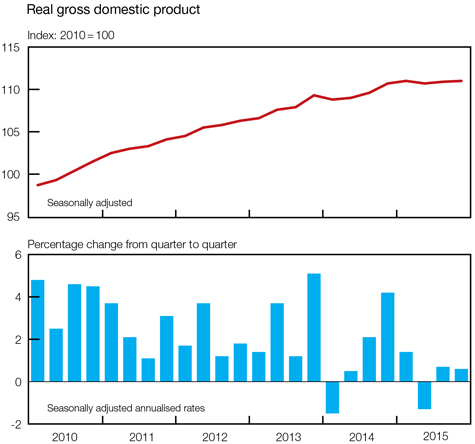
Excluding the contribution of the drought-affected agricultural sector, annualised growth in real GDP decelerated marginally from 1,1 per cent in the third quarter of 2015 to 0,9 per cent in the final quarter.
Consistent with the sluggish quarter-to-quarter growth registered throughout the year, growth in real gross domestic production moderated further from 1,5 per cent in 2014 to a disappointing 1,3 per cent in 2015 – with the exception of 2009, the slowest rate of expansion during the past 17 years. On average, annual growth amounted to 2,3 per cent between 2010 and 2015 compared with an annual average rate of 4,0 per cent in the ten years prior to 2009.
The lacklustre performance of the South African economy in 2015 could, to an important extent, be attributed to subdued business and consumer confidence levels, muted demand conditions, ongoing supply-side constraints, a further decline in the prices of key export commodities, and the knock-on effects of the widespread drought conditions in many parts of the country.
|
|
Quarterly Bulletin March 2016 |
Subsequent to a sharp contraction of 10,4 per cent in the third quarter of 2015, the real value added by the primary sector declined further, albeit at a slower pace in the final quarter of the year. Agricultural output shrank at a faster pace, alongside an increase in the real output of the mining sector.
Real gross domestic product
Percentage change at seasonally adjusted annualised rates
| 2014 | 2015 | |||||||||||||||||||||||
| Sector | Year | 1st qr | 2nd qr | 3rd qr | 4th qr | Year | ||||||||||||||||||
| Primary sector |
0,0 | 2,9 | -9,5 | -10,4 | -2,0 | 0,2 | ||||||||||||||||||
| Agriculture |
5,6 | -18,0 | -19,7 | -12,6 | -14,0 | -8,4 | ||||||||||||||||||
| Mining |
-1,6 | 10,2 | -6,4 | -9,8 | 1,5 | 3,0 | ||||||||||||||||||
| Secondary sector |
0,6 | -1,0 | -5,1 | 3,3 | -1,5 | 0,3 | ||||||||||||||||||
| Manufacturing |
0,0 | -2,4 | -6,3 | 6,2 | -2,6 | 0,1 | ||||||||||||||||||
| Tertiary sector |
2,1 | 1,7 | 1,0 | 1,9 | 1,5 | 1,7 | ||||||||||||||||||
| Non-primary sector |
1,8 | 1,1 | -0,4 | 2,2 | 0,8 | 1,4 | ||||||||||||||||||
| Total |
1,5 | 1,4 | -1,3 | 0,7 | 0,6 | 1,3 | ||||||||||||||||||
Activity in the agricultural sector contracted unabatedly throughout 2015. In addition to the devastating effect of dry weather conditions on field crops as well as animal and horticultural production, the country also experienced record-high temperatures in the final quarter of 2015, further scorching arable land. Livestock production held up well over the period, mitigating the rate of contraction. Negative growth in all four quarters of 2015 accordingly culminated in an annual decline of 8,4 per cent for the year as a whole.
Early indications do not bode well for the 2015/16 planting and production season. According to the February 2016 estimates of the Crop Estimate Committee, South African producers are expected to plant roughly a 26 per cent smaller area than in the preceding year. Preliminary estimates of the commercial maize crop for the 2015/16 season amount to 7,3 million tons as opposed to 9,9 million tons in the 2014/15 season. Taking into account the available stock of white and yellow maize, the country might have to import white and yellow maize to meet annual domestic commercial consumption of roughly 9,6 million tons.
Mining production picked up in the final quarter of 2015; annualised growth in real output accelerated from -9,8 per cent in the third quarter of 2015 to 1,5 per cent in the final quarter, supported by the higher production of especially diamonds and nickel. The production volumes of coal, platinum-group metals and building materials increased at a more moderate pace despite further steps to enhance operational efficiencies, while the production of gold, manganese ore and other metallic minerals contracted over the period.
| Quarterly Bulletin March 2016 |
|


On an annual basis, growth in the real output of the mining sector turned around from -1,6 per cent in 2014 to 3,0 per cent in 2015, adding 0,2 percentage points to growth in aggregate GDP. Mining production in 2015 benefited mainly from the normalisation in platinum production following improved productivity and cost-containment measures introduced at a number of platinum mines after the protracted labour strike in the industry in 2014. In addition, in some of the other domestic mining subsectors work disruptions as a result of wage disputes were less prevalent in 2015. Despite this improved performance, the industry continued to be adversely affected by infrastructural constraints, policy uncertainty, ongoing labour tension, declining commodity prices, rising operational costs, and a global oversupply of certain mining products.
Owing mainly to the disappointing performance of the manufacturing sector, the real value added by the secondary sector switched from an annualised increase of 3,3 per cent in the third quarter of 2015 to a decline of 1,5 per cent in the fourth quarter. Activity in the electricity, gas and water as well as in the construction sectors strengthened over the period.
The quarter-to-quarter pickup in the real value added by the manufacturing sector in the third quarter of 2015 was short-lived as real manufacturing output contracted anew in the fourth quarter. Weighed down by lower production of primarily durable manufactured products, the real value added by the manufacturing sector contracted at an annualised rate of 2,6 per cent over the period – subtracting 0,3 percentage points from overall economic growth in the final quarter of 2015. Production volumes declined in the subsectors supplying basic iron and steel; non-ferrous metal products and machinery; electrical machinery; and motor vehicles, parts and accessories and other transport equipment. The weaker demand for processed metals affected by, among other factors, the slowdown in economic activity in China probably weighed on the production of these products.
By contrast, the production of non-durable goods rose over the period in line with increased consumer demand for these products. Increases were mainly evident in the production of petroleum and chemical products and of food and beverages. Consistent with the somewhat higher production levels in a number of subsectors, the utilisation of production capacity in the manufacturing sector increased from 80,1 per cent in the third quarter of 2015 to 80,5 per cent in the final quarter.
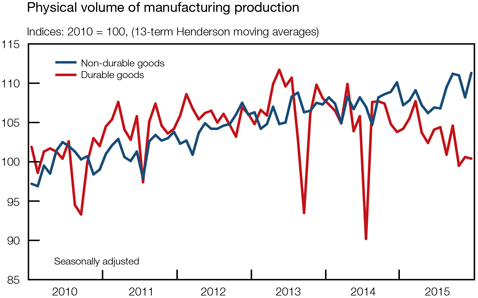
Annual growth in the real output of the manufacturing sector tapered off between 2010 and 2012, and thereafter remained virtually unchanged up to 2015; real output rose by only 0,1 per cent in 2015. Activity in the South African manufacturing sector continued to be negatively affected by weak domestic and global demand, the slowdown in activity in the agricultural sector, declining commodity prices affecting the mining sector, and electricity-supply constraints.
|
|
Quarterly Bulletin March 2016 |
Following two successive quarters of negative growth, the real output of the electricity, gas and water sector advanced at a rate of 0,9 per cent in the fourth quarter of 2015. Scheduled maintenance done in preceding months at various plants together with additional electricity generated by independent power producers (IPPs) contributed to a more steady supply of electricity over the period. Reduced demand, mainly from energy-intensive sectors such as mining and metal processing, as well as the implementation of alternative energy sources by businesses and consumers probably also reduced electricity demand in the final quarter of 2015. Consistent with the overall slowdown in domestic economic activity, the real value added by the electricity, gas and water sector contracted by 1,0 per cent in 2015, the sharpest rate of decline since 2009.
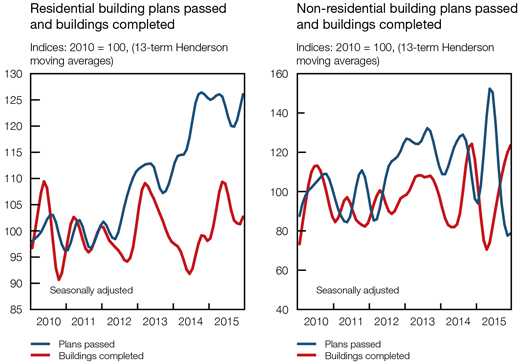
The real value added by the construction sector increased somewhat in the fourth quarter of 2015 as activity ticked up in essentially the non-residential building and civil construction segments. Residential building activity tapered off over the period.
| Quarterly Bulletin March 2016 |
|


In contrast to the usually more volatile goods-producing sectors, the services sector recorded relatively steady quarter-to-quarter growth throughout 2015. The pace of increase in the real value added by the tertiary sector, however, moderated somewhat in the final quarter of 2015, decelerating from 1,9 per cent in the third quarter of 2015 to 1,5 per cent in the fourth quarter. Activity in the finance, insurance, real-estate and business services; and the general government sectors advanced at a slower pace in the final quarter of 2015, while activity in the trade sector increased somewhat over the period. Real value added by the transport sector declined over the period.
Growth in the real value added by the commerce sector increased at a faster pace in the fourth quarter of 2015, accelerating from an annualised rate of 2,5 per cent in the third quarter of 2015 to 2,8 per cent in the fourth quarter. Retail trade activity remained firm notwithstanding the somewhat higher interest rate environment, the depreciation in the exchange value of the rand, and elevated debt levels of consumers. Retailers of non-durable and semi-durable products probably benefited from aggressive price promotions in an effort to boost trade volumes. General dealers; retailers of textile, clothing, footwear and leather goods; specialised food, beverage and tobacco stores; and retailers of pharmaceutical goods, cosmetics and toiletries, in particular, registered increased sales over the period. Consistent with the moderation in the domestic production of durable products, retail sales of household furniture, appliances and equipment decreased at a somewhat faster pace over the period. Activity in the wholesale trade subsector, however, declined in the fourth quarter of 2015.
In the fourth quarter of 2015, domestic sales of new vehicles increased marginally, probably on account of heightened expectations of price increases in the opening months of 2016 following the sustained depreciation in the exchange rate of the rand. By contrast, growth in the sales of used passenger vehicles decelerated in the fourth quarter of 2015. The real value added by the accommodation sector increased over the period.
Owing mainly to a decline in transport activity, the growth in real output of the transport, storage and communication sector receded from 0,1 per cent in the third quarter of 2015 to an annualised rate of -0,2 per cent in the fourth quarter. However, real value added by the sector benefited from uninterrupted growth in the communication subsector over the period.
Activity in the finance, insurance, real-estate and business services sector decelerated from an annualised rate of 2,8 per cent in the third quarter of 2015 to 1,9 per cent in the fourth quarter. This slower pace of increase was, in particular, evident in the real value added by the commercial banking sector coinciding with a marked deceleration in activity in the equity and derivative markets. Overall growth in the real value added by the sector, however, accelerated from 2,2 per cent in 2014 to 2,8 per cent in 2015.
Employment by general government increased at a slower pace in the fourth quarter of 2015, bringing about a deceleration in growth in real value added by general government from 1,2 per cent in the third quarter of 2015 to 1,0 per cent in the final quarter.
Real gross domestic expenditure
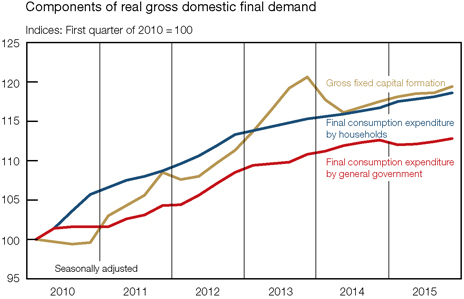
Notwithstanding the marginally slower growth in gross domestic production in the final quarter of 2015, growth in real gross domestic expenditure accelerated from an annualised rate of 1,4 per cent in the third quarter of 2015 to 4,3 per cent in the fourth quarter. Expenditure on all three components of final demand increased at a faster pace over the period alongside a moderation in the pace of destocking in real inventory holdings. For the year 2015 as a whole, real gross domestic expenditure nevertheless advanced by only 0,3 per cent – the slowest annual rate of increase since 2009.
|
|
Quarterly Bulletin March 2016 |
Real gross domestic expenditure
Percentage change at seasonally adjusted annualised rates
| 2014 | 2015 | |||||||||||||||||||||||
| Component | Year | 1st qr | 2nd qr | 3rd qr | 4th qr | Year | ||||||||||||||||||
| Final consumption expenditure |
||||||||||||||||||||||||
| Households |
1,4 | 2,6 | 1,2 | 0,9 | 1,6 | 1,6 | ||||||||||||||||||
| General government |
1,9 | -2,0 | 0,4 | 1,0 | 1,2 | 0,3 | ||||||||||||||||||
| Gross fixed capital formation |
-0,4 | 1,9 | 1,2 | 0,6 | 2,6 | 1,4 | ||||||||||||||||||
| Domestic final demand |
1,1 | 1,5 | 1,1 | 0,8 | 1,7 | 1,3 | ||||||||||||||||||
| Change in inventories (R billions)* |
0,4 | 8,6 | -37,6 | -31,0 | -10,9 | -17,7 | ||||||||||||||||||
| Gross domestic expenditure |
0,6 | 2,2 | -5,9 | 1,4 | 4,3 | 0,3 | ||||||||||||||||||
| * | At constant 2010 prices |
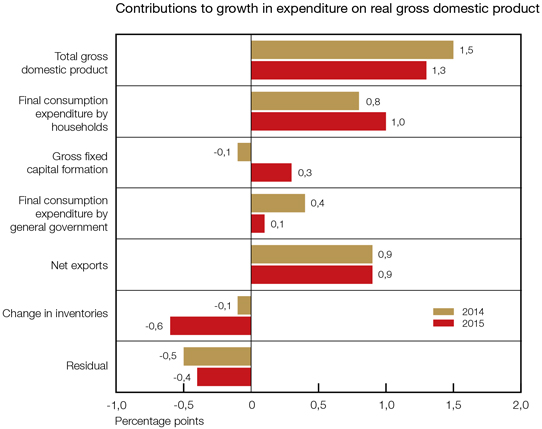
The change in real inventories made the largest contribution to the expansion in real GDP in the fourth quarter of 2015, adding 2,6 percentage points to overall economic growth. For the year 2015 as a whole, however, real net exports and private consumption expenditure by households were the main drivers of growth, contributing 0,9 and 1,0 percentage points respectively to
overall growth.
Contribution of expenditure components to growth in real gross domestic product
Percentage points
| 2014 | 2015 | |||||||||||||||||||||||
| Component | Year | 1st qr | 2nd qr | 3rd qr | 4th qr | Year | ||||||||||||||||||
| Final consumption expenditure |
||||||||||||||||||||||||
| Households |
0,8 | 1,6 | 0,7 | 0,5 | 1,0 | 1,0 | ||||||||||||||||||
| General government |
0,4 | -0,4 | 0,1 | 0,2 | 0,2 | 0,1 | ||||||||||||||||||
| Gross fixed capital formation |
-0,1 | 0,4 | 0,2 | 0,1 | 0,5 | 0,3 | ||||||||||||||||||
| Change in inventories |
-0,1 | 0,6 | -6,0 | 0,9 | 2,6 | -0,6 | ||||||||||||||||||
| Net exports |
0,9 | -0,8 | 4,7 | -0,7 | -3,6 | 0,9 | ||||||||||||||||||
| Residual |
-0,5 | -0,1 | -1,0 | -0,4 | -0,2 | -0,4 | ||||||||||||||||||
| Gross domestic product |
1,5 | 1,4 | -1,3 | 0,7 | 0,6 | 1,3 | ||||||||||||||||||
| Quarterly Bulletin March 2016 |
|


Private consumption expenditure by households
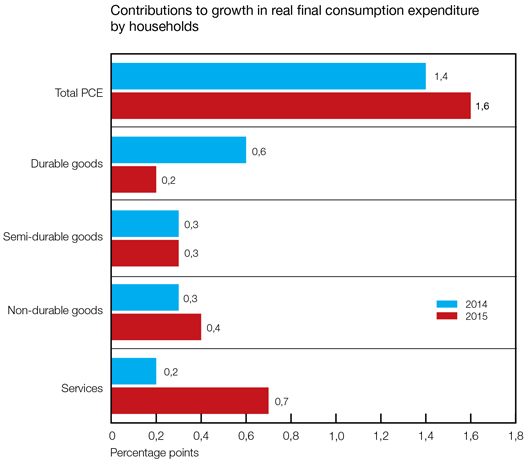
Real final consumption expenditure by households increased at an annualised rate of 1,6 per cent in the fourth quarter of 2015 – that is, at a somewhat faster pace than in the second and third quarters of the year. Spending on durable and non-durable goods switched from negative to positive growth, while real outlays on services increased at a slower pace over the period.
Real final consumption expenditure by households
Percentage change at seasonally adjusted annualised rates
| 2014 | 2015 | |||||||||||||||||||||||
| Category | Year | 1st qr | 2nd qr | 3rd qr | 4th qr | Year | ||||||||||||||||||
| Durable goods |
5,3 | 1,4 | 0,0 | -4,9 | 3,5 | 1,6 | ||||||||||||||||||
| Semi-durable goods |
3,2 | 3,7 | 3,2 | 4,3 | 5,1 | 3,5 | ||||||||||||||||||
| Non-durable goods |
0,8 | 3,6 | -0,7 | -0,2 | 1,3 | 1,1 | ||||||||||||||||||
| Services |
0,5 | 1,9 | 2,9 | 2,6 | 0,7 | 1,6 | ||||||||||||||||||
| Total |
1,4 | 2,6 | 1,2 | 0,9 | 1,6 | 1,6 | ||||||||||||||||||
Mainly underpinned by substantially higher real spending on services, growth in real consumption expenditure by households accelerated from 1,4 per cent in 2014 to 1,6 per cent in 2015. Relative to GDP, final consumption expenditure by households amounted to 60,9 per cent in 2015.
Subsequent to a decline of 4,9 per cent in the third quarter of 2015, real outlays on durable goods increased at an annualised rate of 3,5 per cent in the fourth quarter. Spending on especially passenger vehicles – accounting for roughly 50 per cent of real outlays on durable goods – increased in the final quarter of 2015, having declined in the third quarter of 2015.
|
|
Quarterly Bulletin March 2016 |
Expenditure on this category was probably boosted by pre-emptive buying in anticipation of possible price increases in the first quarter of 2016, a practice which consumers have become accustomed to in recent years. Spending on furniture and household appliances decreased somewhat while the pace of increase in real outlays on computers and related equipment slowed in the final quarter of 2015. On a calendar-year basis, the pace of increase in real spending on durable goods moderated notably from 5,3 per cent in 2014 to 1,6 per cent in 2015. The moderate rise in household indebtedness, amid a somewhat higher interest rate environment and an acceleration in durable goods price inflation following the sharp depreciation in the exchange value of the rand, is expected to hamper spending on this category in future.
Having advanced at a relatively firm pace throughout the first three quarters of 2015, growth in real spending on semi-durable goods accelerated even further to an annualised rate of 5,1 per cent in the fourth quarter. Apart from real outlays on recreational and entertainment goods, spending on all other categories of semi-durable goods increased over the period.
Subsequent to a contraction in the third quarter of 2015, real spending on non-durable goods bounced back in the fourth quarter of the year. Growth in spending on these largely non-discretionary products turned around from -0,2 per cent in the third quarter of 2015 to 1,3 per cent in the fourth quarter, contributing 0,5 percentage points to the increase in total private consumption expenditure over the period. Real outlays on household consumer goods, medical and pharmaceutical products and on petroleum products advanced further in the final quarter of 2015. Firm increases in expenditure on these products were partly countered by lower real spending on household fuel and power alongside a moderation in the pace of spending on food, beverages and tobacco, and recreational and entertainment goods. The slower pace of spending on food, beverages and tobacco probably reflected higher food price inflation following the severe drought conditions; higher prices for bread and cereals were partly countered by a deceleration in consumer meat price inflation over the period.
| Quarterly Bulletin March 2016 |
|


Growth in real expenditure by households on services slowed from an annualised rate of 2,6 per cent in the third quarter of 2015 to 0,7 per cent in the fourth quarter. Increased spending on transportation services was more than offset by lower outlays on miscellaneous services. For the year 2015 as a whole, real spending on services increased by 1,6 per cent, faster than the rate of increase of 0,5 per cent recorded in 2014.
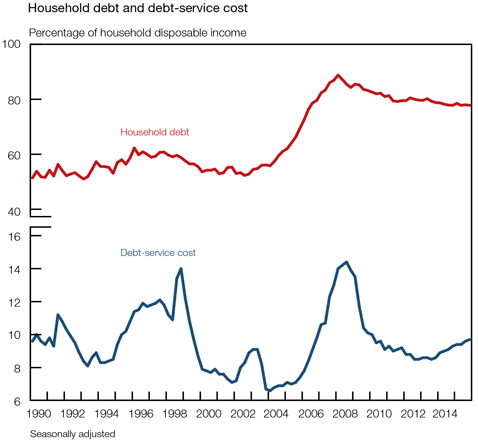
Growth in real disposable income of households accelerated marginally from an annualised rate of 0,8 per cent in the third quarter of 2015 to 1,1 per cent in the fourth quarter. The household sector continued to accumulate debt at a broadly similar pace in the third and fourth quarters of 2015, slower than the pace of increase in nominal disposable income. Consequently, the ratio of household debt to disposable income decreased from 78,0 per cent in the third quarter of 2015 to 77,8 per cent in the fourth quarter. By contrast, the debt-service cost of households rose from 9,6 per cent of disposable income to 9,7 per cent over the same period, largely reflecting the mild increase in lending rates in November 2015.
Final consumption expenditure by government
Quarter-to-quarter growth in real final consumption expenditure by general government remained subdued throughout 2015; government consumption expenditure increased at annualised rates of 1,0 per cent and 1,2 per cent in the third and fourth quarters of 2015 respectively. Consistent with government’s aim to continuously expand and enhance the quality of service delivery, real outlays in the fourth quarter of 2015 mainly reflected increased spending on health and education services. Growth in real government consumption expenditure, however, slowed from 1,9 per cent in 2014 to 0,3 per cent in 2015, largely reflecting a moderation in real expenditure on compensation of employees as government consolidated its spending as part of its effort to contain the budget deficit. Notwithstanding these developments, the ratio of final consumption expenditure by general government to GDP remained at roughly 20 per cent in both 2014 and 2015.
Fixed capital formation
Following relatively muted growth in the first three quarters of 2015, growth in real gross fixed capital formation accelerated to an annualised rate of 2,6 per cent in the fourth quarter of the
|
|
Quarterly Bulletin March 2016 |
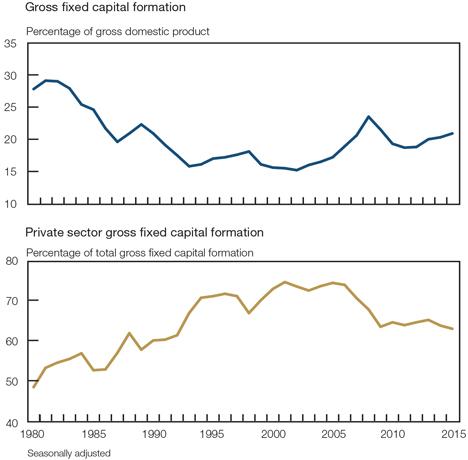
year. Real capital spending by private business enterprises, which had declined in the third quarter of 2015, increased in the final quarter of 2015 along with an acceleration in growth in capital formation by general government and public corporations. Given the low business confidence levels, generally weak demand and ample capacity in most parts of the domestic economy, overall real gross fixed capital formation remained lustreless, registering annual growth rates of -0,4 per cent in 2014 and 1,4 per cent in 2015.
Real gross fixed capital formation
Percentage change at seasonally adjusted annualised rates
| 2014 | 2015 | |||||||||||||||||||||||
| Sector | Year | 1st qr | 2nd qr | 3rd qr | 4th qr | Year | ||||||||||||||||||
| Private business enterprises |
-3,4 | 1,7 | 0,4 | -0,6 | 1,7 | 0,4 | ||||||||||||||||||
| Public corporations |
1,6 | -0,1 | 0,2 | 0,5 | 3,3 | 0,8 | ||||||||||||||||||
| General government |
10,3 | 5,2 | 5,3 | 5,0 | 5,1 | 5,9 | ||||||||||||||||||
| Total |
-0,4 | 1,9 | 1,2 | 0,6 | 2,6 | 1,4 | ||||||||||||||||||
Having declined by 0,6 per cent in the third quarter of 2015, real gross fixed capital formation by private business enterprises increased at a rate of 1,7 per cent in the fourth quarter. Increased capital spending by the private electricity sector was underpinned by noticeable increases in capital outlays on projects being part of the Renewable Energy Independent Power Producer Procurement Programme. Under Bid Windows 1 and 2 of the programme, 41 independent power producers have to date successfully completed construction and are already in operation. Several projects under Bid Window 3 commenced construction during the fourth quarter of 2015. In most other sectors, real capital investment contracted in the fourth quarter of 2015, particularly in agriculture where capital spending on agricultural machinery contracted over the period following the severe drought experienced in many parts of the country.
| Quarterly Bulletin March 2016 |
|


Real fixed capital expenditure by public corporations increased from an annualised rate of 0,5 per cent in the third quarter of 2015 to 3,3 per cent in the fourth quarter, underpinned by increased spending on construction works and transport equipment by the water and transport subsectors in particular. Simultaneously, Transnet and the Passenger Rail Agency of South Africa (PRASA) raised their capital investment related to the acquisition of locomotives.
Real capital spending by general government increased at a fairly steady pace in excess of 5 per cent throughout 2015. Increased capital outlays by local government focused largely on improving the social and economic infrastructure as part of government’s priorities. Growth in real fixed capital expenditure by general government, however, moderated from 10,3 per cent in 2014 to 5,9 per cent in 2015.
Inventory investment
On an annualised basis, real inventories decreased by R31,0 billion in the third quarter of 2015 and by a further R10,9 billion in the fourth quarter. The slower pace of destocking added 2,6 percentage points to the growth in real GDP over the period. For the calendar year 2015 as a whole, real inventories declined by R17,7 billion compared with an increase of R0,4 billion in 2014.
Relatively weak demand coupled with a significant increase in the volume of crude oil imports following scheduled maintenance conducted at some oil refineries in the third quarter of 2015 contributed to a much slower pace of inventory de-accumulation in the manufacturing sector in the fourth quarter of 2015. However, industrial and commercial inventories as a percentage of non-agricultural GDP decreased from 13,5 per cent in the third quarter of 2015 to 13,1 per cent in the fourth quarter.
Factor income
Growth in total nominal factor income, measured over four quarters, accelerated from 4,1 per cent in the third quarter of 2015 to 4,4 per cent in the fourth quarter as the gross operating surpluses of business enterprises picked up at a marginally faster pace. Year-on-year growth in compensation of employees slowed over the same period. For 2015 as a whole, the rate of increase in total nominal factor income decelerated to 4,4 per cent from 7,2 per cent in 2014.
The year-on-year pace of increase in total compensation of employees decelerated from 7,9 per cent in the third quarter of 2015 to 7,8 per cent in the fourth quarter, reflecting a moderation in the remuneration of employees in almost all sectors of the economy with the exception of the general government sector. For 2015 as a whole, the compensation of employees increased by 7,8 per cent compared with a rate of increase of 7,6 per cent in 2014. In contrast, the
|
|
Quarterly Bulletin March 2016 |
Wage Settlement Survey conducted by Andrew Levy Employment Publications indicated that the average wage settlement rate for 2015 came to 7,7 per cent compared with an average settlement rate of 8,1 per cent in 2014.
Growth in the overall gross operating surplus, measured over a year, changed from 0,1 per cent in the third quarter to 0,3 per cent in the fourth quarter of 2015. Overall profitability in the economy continued to be affected by declining international commodity prices, rising production costs, sluggish demand, and subdued export proceeds over the period. The share of gross operating surplus in total factor income consequently declined from 46,0 per cent in the third quarter of 2015 to 45,8 per cent in the fourth quarter. For the year 2015 as a whole, the overall gross operating surplus rose by 0,7 per cent, significantly lower than the 6,8 per cent recorded in 2014 and far below the rate of inflation in the economy.
Gross saving
South Africa’s national saving ratio decreased for the third consecutive quarter in the fourth quarter of 2015. As a percentage of GDP gross saving weakened further from 14,6 per cent in the third quarter of 2015 to 14,2 per cent in the final quarter, reflecting marginally weaker saving by both households and corporate business enterprises alongside an increase in saving by general government. For the year as a whole, the national saving ratio expanded from 14,9 per cent in 2014 to 15,1 per cent in 2015, thereby lowering the portion of total gross capital formation to be financed through a net inflow of foreign capital from 26,7 per cent in 2014 to 22,4 per cent in 2015.
Gross saving by the corporate sector as a percentage of GDP edged lower from 14,1 per cent in the third quarter of 2015 to 13,6 per cent in the fourth quarter. Higher corporate tax payments more than offset the decline in dividend payments over the period. In line with the weaker saving reported by corporate business enterprises in 2015, the saving ratio declined from 14,9 per cent in 2014 to 14,0 per cent in 2015. This decline stemmed primarily from slower growth in gross operating surpluses of business enterprises in 2015 as overall profitability in the economy remained under pressure.
As a ratio of GDP, gross saving by general government rose marginally from 0,4 per cent in the third quarter of 2015 to 0,6 per cent in the fourth quarter. Government revenue was mainly boosted by a higher level of taxes paid by companies, while consumption expenditure by general government increased at a slower pace over the period. For the year as a whole, government’s saving ratio turned around from -0,2 per cent of GDP in 2014 to 1,0 per cent in 2015.
The gross saving ratio of the household sector weakened from 0,2 per cent in the first three quarters of 2015 to 0,1 per cent in the final quarter. A slight increase in household consumption expenditure together with a moderation in compensation earned by the household sector gave rise to the minor deterioration in the saving ratio in the fourth quarter of 2015.
Employment
In an environment characterised by slowing domestic economic growth and heightened global uncertainty, total formal non-agricultural employment advanced only marginally in the third quarter of 2015. According to the Statistics South Africa (Stats SA) Quarterly Employment Statistics (QES) survey, employment increased by 0,2 per cent on a seasonally adjusted and annualised basis in the third quarter of 2015, with the total level of formal non-agricultural employment increasing by 5 100 job opportunities to an estimated 8,95 million.3 Employment levels in the public and private sectors rose by 0,4 per cent and 0,2 per cent respectively over the period.
| Quarterly Bulletin March 2016 |
|


Employment growth in the public sector slowed somewhat from the second to the third quarter of 2015. National departments, and to a lesser extent other public-sector enterprises, continued to increase their staff complement in the third quarter of 2015. Similarly to the second quarter, the increase in employment by national departments resulted largely from the transfer of employees of technical vocational education and training colleges (former further education and training colleges) and community and education training colleges from provincial governments to the national Department of Higher Education and Training.4 These employment gains were partly countered by job-shedding at provincial level, at local government level, and in the public transport, storage and communication sector in the third quarter of 2015. Nevertheless, employment growth at provincial level has outpaced employment gains at national department and local authority level since 2005, as shown in the accompanying graph.
Private-sector employment growth remained sluggish. Following a decrease in the second quarter of 2015, a mere 2 900 private-sector job opportunities were created in the third quarter. Employment gains were registered in the private transport, storage and communication sector; the finance, insurance, real-estate and business services sector; the trade, catering and accommodation services sector; and the private community, social and personal services
|
|
Quarterly Bulletin March 2016 |
sector. Conversely, further job losses were recorded in the goods-producing sectors of the economy, with labour paring continuing in the mining, manufacturing and construction sectors in the third quarter of 2015.
Change in enterprise-surveyed formal non-agricultural employment by sector*
| Change over one quarter 3rd qr 2015 |
Change over four quarters to 3rd qr 2015 |
Cumulative job losses (-) gains (+) |
||||||||||||||||||||||
| Sector | Number | Per cent annualised |
Number | Per cent |
4th qr 2008 to 1st qr 2010 |
2nd qr 2010 to 3rd qr 2015 |
||||||||||||||||||
| Total mining |
-11 400 | -9,0 | -20 500 | -4,1 | -40 700 | -13 500 | ||||||||||||||||||
| Gold mining |
-300 | -1,1 | -4 000 | -3,3 | -9 600 | -45 000 | ||||||||||||||||||
| Other mining |
-11 100 | -11,4 | -16 500 | -4,4 | -31 100 | 31 400 | ||||||||||||||||||
| Manufacturing |
-5 400 | -1,9 | -3 300 | -0,3 | -113 800 | -71 100 | ||||||||||||||||||
| Construction |
-4 700 | -3,8 | -19 700 | -4,0 | -54 500 | -19 800 | ||||||||||||||||||
| Trade, catering and accommodation services |
9 800 | 2,1 | 22 900 | 1,2 | -77 500 | 88 900 | ||||||||||||||||||
| Private transport, storage and communication services |
2 000 | 2,7 | -2 600 | -0,8 | 400 | -5 200 | ||||||||||||||||||
| Finance, insurance, real-estate and business services |
11 700 | 2,4 | 29 400 | 1,5 | -190 900 | 119 900 | ||||||||||||||||||
| Community, social and personal services |
900 | 0,8 | -3 600 | -0,7 | 16 400 | 25 400 | ||||||||||||||||||
| Total private sector |
2 900 | 0,2 | 2 700 | 0,0 | -460 700 | 124 600 | ||||||||||||||||||
| National departments |
13 400 | 11,8 | 32 100 | 7,1 | -2 500 | 76 500 | ||||||||||||||||||
| Provinces |
-5 300 | -1,9 | -39 600 | -3,5 | 51 600 | 73 800 | ||||||||||||||||||
| Local governments |
-4 100 | -5,2 | 3 700 | 1,2 | 15 200 | 68 300 | ||||||||||||||||||
| Public transport, storage and communication services |
-3 500 | -10,4 | -100 | -0,1 | -4 900 | 22 700 | ||||||||||||||||||
| Other public-sector enterprises, including electricity and IEC** |
1 800 | 3,4 | 4 000 | 1,9 | -5 000 | 22 800 | ||||||||||||||||||
| Total public sector |
2 200 | 0,4 | 100 | 0,0 | 54 400 | 264 000 | ||||||||||||||||||
| Grand total |
5 100 | 0,2 | 2 800 | 0,0 | -406 400 | 388 600 | ||||||||||||||||||
| * | Seasonally adjusted. Components may not add to totals due to rounding |
| ** | IEC: Independent Electoral Commission |
Source: Statistics South Africa, Quarterly Employment Statistics (QES) survey
Formal private-sector employment growth has been fairly pedestrian following the 2008-09 economic recession, particularly in the goods-producing sectors of the economy. In fact, the accompanying graph shows that the mining, manufacturing and construction sectors have collectively shed 128 000 jobs between the second quarter of 2012 and the third quarter of 2015 as a hostile labour relations environment, electricity-supply constraints, policy uncertainty, low business confidence, and more recently weak global and domestic demand adversely affected investment and employment in these sectors of the economy. In addition, as output growth in the economy moderated gradually in recent years, employment growth in the tertiary sector slowed concomitantly, having initially grown fairly briskly following the 2008-09 recession. Furthermore, given the most severe drought in decades and the continued unwinding of the commodity supercycle, the private sector is not expected to create meaningful employment opportunities in the short run. The recent sharp depreciation in the exchange rate of the rand will probably intensify upward cost pressures in the economy, particularly in the goods-producing sectors.
| Quarterly Bulletin March 2016 |
|
.


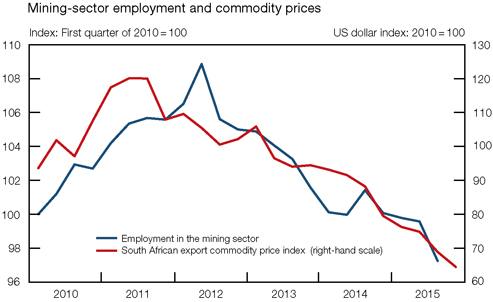
Employment in the domestic mining sector has decreased almost unabatedly from a recent peak in the second quarter of 2012 up to the third quarter of 2015. Throughout this period the domestic mining industry had to operate within an environment characterised by disruptive labour relations, often resulting in protracted labour strikes, as well as an escalation in operating costs. In addition, international commodity prices have declined notably since 2011, as depicted in the accompanying graph. The drop in commodity prices continued in 2015, owing to reduced demand from China and a global oversupply of many commodities. The pace of job-shedding in the mining sector accelerated in the third quarter of 2015, particularly in the non-gold mining sector which was affected by retrenchments in the platinum-mining sector as well as the closure and downscaling of some coal and chrome mines. Employment levels in the gold-mining sector decreased only marginally in the third quarter of 2015, having remained unchanged in the previous quarter. The recent sharp depreciation in the exchange rate of the rand has to some extent compensated for the decline in international commodity prices, at least in the short term, providing a much-needed boost to the profitability of South African mining companies.
Employment levels in the manufacturing sector decreased at a roughly similar pace in both the second and third quarters of 2015, representing a cumulative loss of almost 12 000 job opportunities. Furthermore, the Manufacturing Survey of Stellenbosch University’s Bureau for
|
|
Quarterly Bulletin March 2016 |
Economic Research (BER) indicated that business confidence among manufacturers remained unchanged at 34 index points in the fourth quarter of 2015; the index has remained below the neutral level of 50 since the third quarter of 2011. The pessimistic sentiment was pervasive throughout the manufacturing sector, exacerbated by a renewed deceleration in production volume growth for durable goods in particular. Although the recent sharp depreciation in the exchange rate of the rand could improve the profitability of manufacturing exporters, domestic demand for manufactured goods remained fairly weak, aggravated by the severe drought conditions and the commodity price-driven restructuring in the mining sector. Employment prospects in the manufacturing sector thus remain bleak, as suggested by the sharp drop in the employment sub-index of the Barclays Manufacturing Purchasing Managers’ Index (PMI), from an average of 47,2 index points in the third quarter of 2015 to an average of 43,7 index points in the fourth quarter.
Construction-sector employment contracted at an accelerated pace in the third quarter of 2015, weighed down by disappointing government infrastructure spending on large projects and sluggish private-sector capital investment by the mining sector in particular. In fact, the construction sector has shed a cumulative 27 400 job opportunities in the five quarters up to the third quarter of 2015. Despite improving somewhat in the fourth quarter of 2015, confidence levels in the building and construction sector remained low; the First National Bank (FNB)/BER Building Confidence Index rose by 4 index points to 48 in the fourth quarter of 2015, while the FNB/BER Civil Confidence Index increased by 3 index points to 42 over the same period. In addition, the real value of building plans passed decreased notably from the third to the fourth quarter of 2015.
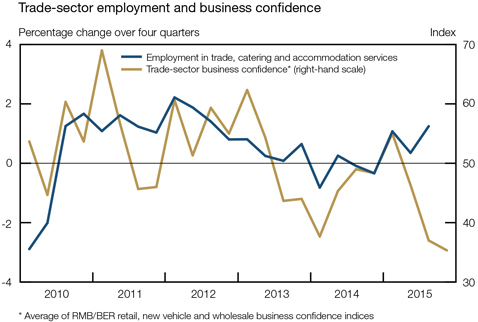
Contrary to developments in the primary and secondary sectors of the economy, employment levels increased in the tertiary sector of the economy in the third quarter of 2015. The finance, insurance, real-estate and business services sector created 11 700 employment opportunities in the third quarter, more than offsetting the losses recorded in the previous quarter. In addition, the trade, catering and accommodation services sector continued to record fairly meaningful employment gains for a third successive quarter, supported by continued growth in household consumption expenditure. However, results from the BER’s Retail Survey for the fourth quarter of 2015 suggest that underlying consumer demand could be deteriorating. Business confidence among retailers, wholesalers and new vehicle dealers remained depressed in the fourth quarter of 2015, owing to low sales volume growth, rising input costs, and generally tough trading conditions. In addition, the FNB/BER Consumer Confidence Index plummeted to -14 in the fourth quarter of 2015 from -5 in the third quarter, suggesting that consumer spending on especially durable goods could come under increased pressure in the first half of 2016.
| Quarterly Bulletin March 2016 |
|

According to the Quarterly Labour Force Survey (QLFS) conducted by Stats SA, the number of persons employed in South Africa increased by 190 000 from the third quarter of 2015 to the fourth quarter, raising the total level of employment to roughly 16,02 million.5 Employment numbers are usually boosted in the fourth quarter of each year by seasonal workers employed in the trade, catering and accommodation services sector in particular. Although QLFS outcomes for 2015 are not strictly comparable to those of 2014, total employment nevertheless increased by 698 000 in the year to the fourth quarter of 2015. Notable employment gains were recorded in all the main QLFS sub-categories, largely due to enhanced coverage following the introduction of the new master sample. Bearing this in mind, the formal non-agricultural sector and the informal sector added 269 000 and 236 000 employment opportunities respectively in the year to the fourth quarter of 2015.
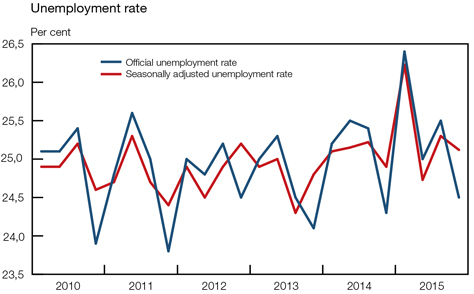
The number of unemployed persons decreased by 225 000 from the third to the fourth quarter of 2015, aided by temporary seasonal job creation, but increased by a notable 284 000 in the year to the fourth quarter of 2015, bringing the total number of unemployed South Africans to around 5,19 million. However, Stats SA cautioned that following the introduction of the new master sample, quarterly unemployment trends have become rather unstable and should be interpreted with circumspection. Encouragingly, the number of discouraged job seekers decreased by 124 000 in the year to the fourth quarter of 2015. As unemployment grew at a slightly faster pace than employment in the year to the fourth quarter of 2015, the official unemployment rate increased marginally to 24,5 per cent from 24,3 per cent a year earlier. The seasonally adjusted unemployment rate decreased from 25,3 per cent in the third quarter of 2015 to 25,1 per cent in the fourth quarter.6 The youth unemployment rate rose to 50,4 per cent in the fourth quarter of 2015, up from 48,8 per cent a year earlier.
Labour cost and productivity
The year-on-year pace of increase in nominal remuneration per worker in the formal non-agricultural sector of the economy decelerated from 8,7 per cent in the second quarter of 2015 to 6,5 per cent in the third quarter, as both public- and private-sector remuneration growth moderated. Likewise, growth in the average real salaries and wages per worker in the formal non-agricultural sector decelerated from 5,1 per cent in the second quarter of 2015 to 3,1 per cent in the third quarter.
Public-sector remuneration growth moderated from 12,1 per cent7 in the second quarter of 2015 – exacerbated by the low base created in the second quarter of 2014 when a large number of low-earning temporary employees were appointed by the Independent Electoral Commission (IEC) to assist with the general elections – to 6,1 per cent in the third quarter. Remuneration growth slowed at national department and local government levels while quickening at provincial level in the third quarter of 2015.
|
|
Quarterly Bulletin March 2016 |
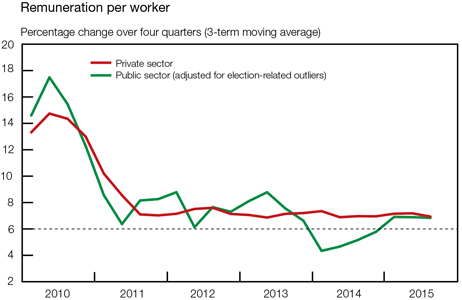
Similarly, the tempo of increase in average private-sector salaries and wages per worker decelerated from a year-on-year rate of 7,7 per cent in the second quarter of 2015 to 6,7 per cent in the third quarter. The highest wage increases per worker were recorded in the mining sector (9,8 per cent), followed by the finance, insurance, real-estate and business services sector (7,8 per cent); the private community, social and personal services sector (7,4 per cent); the manufacturing sector (7,3 per cent); the construction sector (5,1 per cent); the private transport, storage and communication services sector (4,9 per cent); and the trade, catering and accommodation services sector (3,6 per cent).
According to Andrew Levy Employment Publications, the average wage settlement rate in collective bargaining agreements moderated from 8,1 per cent in 2014 to 7,7 per cent in 2015. Encouragingly, the number of working days lost due to strike action fell notably from 11,8 million in 2014 (exacerbated by the prolonged platinum-mining strike in the first half of that year) to 640 000 in 2015, assisted by the avoidance of a public-sector strike in the year. The 2015 number was the lowest since 2000, when only 500 000 working days lost were recorded.
| Quarterly Bulletin March 2016 |
|


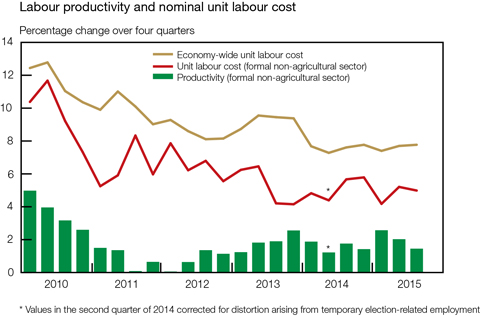
Owing to the moderation in year-on-year output growth and the slight acceleration in year-on-year employment growth in the third quarter of 2015, growth in labour productivity in the formal non-agricultural sector of the economy slowed from 3,5 per cent in the second quarter of 2015 to 1,5 per cent in the third quarter. Conversely, productivity growth in the manufacturing sector accelerated from -1,1 per cent in the second quarter of 2015 to 2,3 per cent in the third quarter, as output growth accelerated more than employment growth. With year-on-year remuneration growth decelerating at a slightly faster pace than year-on-year output growth, the pace of increase in nominal unit labour cost in the formal non-agricultural sector moderated marginally from 5,1 per cent in the second quarter of 2015 to 5,0 per cent in the third quarter – consistent with the inflation target range.
Prices
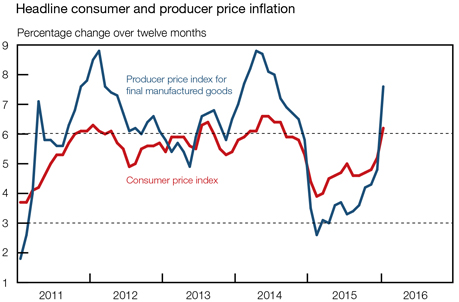
The sharp decline in international commodity prices in 2015 led to a subdued global inflationary environment and contributed meaningfully to a more benign domestic inflation outcome than initially anticipated. In addition, domestic demand and output growth slowed throughout the year, reducing inflationary pressures further. Consequently, headline consumer price inflation moderated from an annual average of 6,1 per cent in 2014 to 4,6 per cent in 2015 – the first moderation in annual average headline consumer price inflation in four years.
Despite the decline in crude oil and other international commodity prices, consumer price inflation accelerated gradually from a recent low of 3,9 per cent in February 2015 to 4,8 per cent in November, affected by the gradual depreciation in the exchange rate of the rand throughout the first eleven months of the year. However, inflationary pressures intensified towards the end of 2015 and in the opening months of 2016 as food price inflation quickened in response to the severe drought conditions and as the exchange rate of the rand depreciated sharply.8 As such, consumer price inflation quickened to 6,2 per cent in January 2016.
Consumer and producer price inflation
Annual average percentage change
| 2013 | 2014 | 2015 | Jan 2016* | |||||||||||||
| Headline consumer prices |
5,7 | 6,1 | 4,6 | 6,2 | ||||||||||||
| Consumer goods |
5,1 | 6,2 | 3,4 | 6,5 | ||||||||||||
| Consumer services |
6,3 | 6,0 | 5,8 | 6,0 | ||||||||||||
| Producer prices |
||||||||||||||||
| Final manufactured goods |
6,0 | 7,5 | 3,6 | 7,6 | ||||||||||||
| Intermediate manufactured goods |
7,9 | 8,2 | 0,8 | 3,8 | ||||||||||||
| Electricity and water |
10,6 | 9,9 | 11,1 | 11,6 | ||||||||||||
| Mining |
5,3 | 4,2 | -4,1 | 2,5 | ||||||||||||
| Agriculture, forestry and fishing |
2,6 | 5,3 | 4,7 | 23,6 | ||||||||||||
| * | Movement in prices from January 2015 to January 2016 |
Driven largely by falling international commodity prices, most measures of domestic producer price inflation moderated markedly in 2015. Producer price inflation for mining products decelerated substantially from an annual average of 4,2 per cent in 2014 to an annual average of -4,1 per cent in 2015. Likewise, producer price inflation for final manufactured goods more than halved from an annual average of 7,5 per cent in 2014 to 3,6 per cent in 2015, while producer price inflation for intermediate manufactured goods moderated from an annual average of 8,2 per cent in 2014 to a mere 0,8 per cent in 2015, as price inflation slowed across a broad range of product categories. When measured as an annual average, producer price inflation for agriculture, forestry and fishing products moderated from 5,3 per cent in 2014 to 4,7 per cent in 2015. However, producer price inflation for electricity and water – both administered prices – remained elevated throughout 2015, accelerating somewhat from an annual average of 9,9 per cent in 2014 to 11,1 per cent in 2015.
|
|
Quarterly Bulletin March 2016 |
Notwithstanding the slowing annual average rates of inflation, most measures of producer price inflation accelerated in recent months; producer price inflation for final manufactured goods and intermediate manufactured goods amounted to 7,6 per cent and 3,8 per cent respectively in January 2016. Driven largely by steep drought-induced agricultural price increases, producer price inflation for agriculture, forestry and fishing products accelerated markedly in the closing months of 2015, amounting to 23,6 per cent in January 2016.
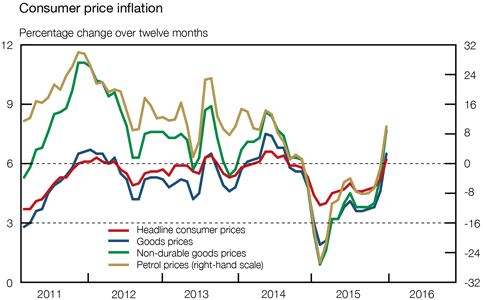
Throughout 2015, headline consumer price inflation outcomes were primarily shaped by movements in consumer goods price inflation, in particular that of non-durable goods. Consumer goods price inflation accelerated from a recent low of 3,6 per cent in September 2015 to 6,5 per cent in January 2016, as non-durable goods price inflation – representing 71 per cent of the total consumer goods price basket – quickened from 3,8 per cent to 7,7 per cent over the same period, in turn driven largely by movements in petrol price inflation and to a lesser extent by food price inflation. The acceleration in petrol price inflation occurred despite falling international crude oil prices and was driven by the depreciation in the exchange rate of the rand as well as the dissipation of favourable base effects in recent months.
| Quarterly Bulletin March 2016 |
|


Suppressed by relatively weak domestic demand conditions, durable and semi-durable goods price inflation has remained fairly subdued in recent months; semi-durable goods price inflation slowed from 4,3 per cent in June 2015 to 3,4 per cent in December, largely due to a slow pace of increase in the prices of clothing and footwear, while durable goods price inflation accelerated marginally from 2,2 per cent to 3,0 per cent over the same period, despite the depreciation in the exchange rate of the rand.
Consumer services price inflation remained steady around the upper limit of the inflation target range of 6,0 per cent for a prolonged period up to the middle of 2015. Thereafter, it slowed somewhat to 5,7 per cent in December 2015, as moderations in transport, restaurant and hotel services price inflation outweighed a quickening in housing and utility services price inflation.
International food prices declined for a fourth consecutive year in 2015, with the international food price index of the United Nations Food and Agriculture Organization (FAO) averaging 19,1 per cent below its level in 2014 on account of abundant global food supplies and an appreciating US dollar. However, when expressed in rand terms, the year-on-year change in the FAO international food price index accelerated notably from July 2015 onwards, amounting to 19,1 per cent in January 2016 following the marked depreciation in the exchange rate of the rand in recent months. Abundant supplies and high inventory levels following, among others, the removal of export taxes in Argentina and continued good crop prospects, resulted in international cereals prices falling further in 2015 with the FAO international cereals price index being 15,4 per cent lower than in 2014. However, despite lower international cereal prices, the dramatically reduced 2015 domestic maize crop following the most severe drought in decades resulted in domestic maize and wheat prices soaring to all-time high levels and occasionally trading above import parity levels.
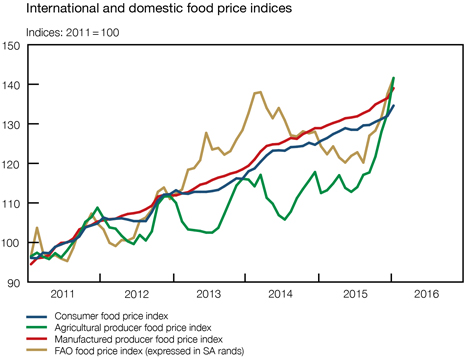
Domestic agricultural producer food price inflation accelerated notably from -3,0 per cent in January 2015 to 25,9 per cent a year later. The quickening in agricultural producer food price inflation resulted almost entirely from a marked acceleration in price inflation for cereals and other crops, from -17,5 per cent in January 2015 to 79,2 per cent in January 2016, as the severe drought conditions ravaged crops in South Africa’s primary maize- and wheat-producing areas. The rise in domestic maize prices was exacerbated by expectations that South Africa might have to import roughly 4 million tons of maize in the wake of the drought. Conversely, producer price inflation for live animals moderated notably from 11,5 per cent in May 2015 to 1,0 per cent in January 2016 due to the increased selling and slaughtering of herds in drought-stricken areas.
|
|
Quarterly Bulletin March 2016 |
Agricultural producer food prices
Percentage change over twelve months
| Weight | Nov 2015 |
Dec 2015 |
Jan 2016 |
|||||||||||||
| Products of crop and horticulture |
50,74 | 18,6 | 22,6 | 48,5 | ||||||||||||
| Cereals and other crops |
25,80 | 42,4 | 53,7 | 79,2 | ||||||||||||
| Fruit and vegetables |
24,93 | 1,4 | 0,6 | 23,7 | ||||||||||||
| Live animals and animal products |
49,26 | 2,3 | 1,5 | 2,3 | ||||||||||||
| Live animals |
35,34 | 2,5 | 1,0 | 1,0 | ||||||||||||
| Milk and eggs |
12,37 | -0,7 | -0,8 | -0,6 | ||||||||||||
| All items |
100,00 | 10,7 | 12,7 | 25,9 | ||||||||||||
Producer food price inflation at the manufactured level has not fully responded to the pickup in agricultural food price inflation, decelerating to 5,0 per cent in July and August 2015 before quickening to 7,8 per cent in January 2016. However, in recent months some pass-through from the notable acceleration in inflation for agricultural crops and cereals became visible in price inflation for grain mill, starch and animal feed products, as well as for bakery products. Nevertheless, similarly to the price movements for live animals, price inflation for manufactured producer meat products slowed markedly to a mere 0,8 per cent in January 2016.
Manufactured producer food prices
Percentage change over twelve months
| Weight | Nov 2015 |
Dec 2015 |
Jan 2016 |
|||||||||||||
| Meat, fish, fruit, vegetables, oils and fats |
37,34 | 3,9 | 3,7 | 5,4 | ||||||||||||
| Meat and meat products |
19,96 | 1,3 | 0,3 | 0,8 | ||||||||||||
| Fish and fish products |
7,42 | 6,7 | 7,4 | 8,4 | ||||||||||||
| Fruit and vegetables |
6,07 | 3,5 | 3,6 | 5,4 | ||||||||||||
| Oils and fats |
3,89 | 14,1 | 16,0 | 26,1 | ||||||||||||
| Dairy products |
8,97 | 0,1 | -0,7 | 0,2 | ||||||||||||
| Grain mill, starch and animal feed products |
12,46 | 10,3 | 10,8 | 15,6 | ||||||||||||
| Grain mill products |
5,24 | 12,8 | 12,0 | 20,1 | ||||||||||||
| Starch and animal feed products |
7,22 | 8,1 | 9,9 | 12,4 | ||||||||||||
| Other food products |
41,23 | 8,1 | 8,2 | 9,7 | ||||||||||||
| Bakery products |
30,24 | 8,2 | 7,8 | 9,6 | ||||||||||||
| Sugar |
5,71 | 9,4 | 12,5 | 11,3 | ||||||||||||
| Other food products |
5,28 | 6,1 | 5,9 | 7,3 | ||||||||||||
| All items |
100,00 | 5,9 | 5,9 | 7,8 | ||||||||||||
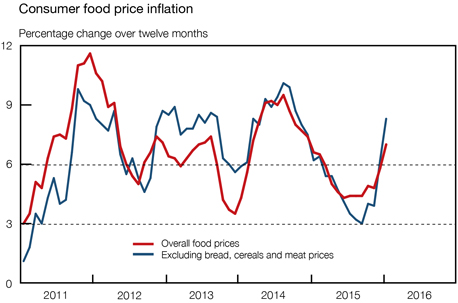
Consumer food price inflation responded to the acceleration in agricultural and manufactured producer food price inflation with a time lag, initially moderating to 4,3 per cent in June 2015 before accelerating to 7,0 per cent in January 2016. Nonetheless, the impact of the prolonged drought was evident in the quickening of price inflation for bread and cereals from 2,4 per cent in April 2015 to 8,4 per cent in January 2016 and a concomitant slowdown in meat price inflation from 6,4 per cent to 4,3 per cent over the same period, offsetting each other to some extent. The acceleration in consumer food price inflation has become more broad-based in recent months, as price inflation for especially vegetables quickened notably in January 2016 due the increased need for irrigation following the extreme temperatures experienced during the month.
| Quarterly Bulletin March 2016 |
|


Consumer food prices
Percentage change over twelve months
| Weight | Nov 2015 |
Dec 2015 |
Jan 2016 |
|||||||||||||
| Bread and cereals |
25,00 | 7,3 | 7,5 | 8,4 | ||||||||||||
| Meat |
32,11 | 4,2 | 4,1 | 4,3 | ||||||||||||
| Fish |
2,6 | 7,0 | 7,6 | 7,4 | ||||||||||||
| Milk, eggs and cheese |
12,25 | 2,0 | 1,9 | 2,5 | ||||||||||||
| Oils and fats |
3,87 | 11,3 | 14,1 | 17,4 | ||||||||||||
| Fruit |
1,62 | -5,9 | -2,4 | 3,8 | ||||||||||||
| Vegetables |
11,34 | 2,3 | 9,4 | 14,1 | ||||||||||||
| Sugar, sweets and desserts |
4,58 | 8,7 | 9,4 | 9,4 | ||||||||||||
| Other food products |
6,62 | 3,7 | 4,7 | 4,8 | ||||||||||||
| All items |
100,00 | 4,8 | 5,8 | 7,0 | ||||||||||||
The accompanying graph shows that when the prices of bread, cereals and meat – together accounting for 57 per cent of the consumer food price basket – are excluded, consumer food price inflation accelerated more briskly, from a low of 3,0 per cent in September 2015 to 8,3 per cent in January 2016.
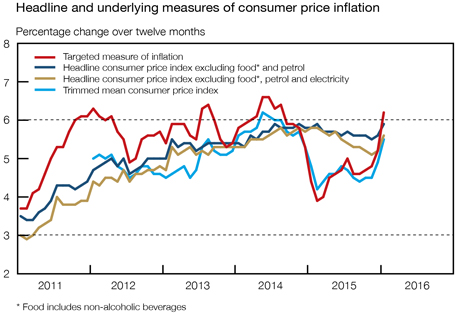
Within an environment of fairly limited pricing power in the domestic economy on account of weak consumer demand, most measures of underlying inflation have moderated throughout 2015 before accelerating in December 2015 and January 2016. Subtracting the impact of the more volatile food, non-alcoholic beverages and petrol prices from the calculation of targeted headline consumer price inflation, underlying inflation slowed from 5,9 per cent in February 2015 to 5,5 per cent in November before accelerating to 5,9 per cent in January 2016. Similarly, when further excluding the impact of electricity prices from the calculation, the resultant underlying measure of inflation moderated from 5,8 per cent to 5,1 per cent before quickening to 5,6 per cent over the same period. However, the sharp depreciation in the exchange rate of the rand in December 2015 and January 2016 is expected to add to underlying inflationary pressures in coming months, irrespective of weak domestic demand.
|
|
Quarterly Bulletin March 2016 |
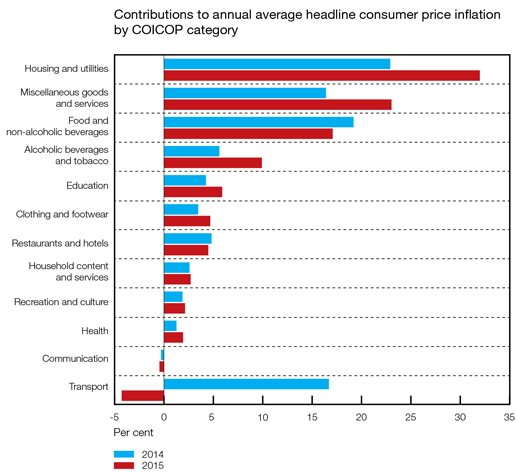
An analysis of price changes based on the classification of individual consumption by purpose (COICOP) categories suggests a slight slackening in inflationary pressures from 2014 to 2015. As such, annual consumer price inflation in 2015 exceeded the upper limit of the inflation target range in four of the twelve COICOP categories (as opposed to six categories in 2014), while four categories recorded price increases within the inflation target range (the same as in 2014) and four categories registered rates of change below the lower limit of the inflation target range (compared to two categories in 2014). The accompanying graph shows that the housing and utilities category remained the main contributor to annual consumer price inflation in 2015 (increasing its contribution notably), followed by the miscellaneous goods and services category, which moved up from fourth position in 2014.
| Quarterly Bulletin March 2016 |
|


Consistent with extremely benign petrol price inflation following the decline in international crude oil prices, coupled with relatively subdued motor vehicle price inflation throughout 2015, the transport category subtracted from annual consumer price inflation in 2015 after contributing meaningfully to consumer price inflation in 2014.
Driven largely by movements in petrol price inflation, administered price inflation accelerated from a recent low of -4,5 per cent in February 2015 to 8,8 per cent in January 2016. Even though domestic petrol prices fell somewhat in the three months to January 2016 – the inland price of unleaded 95-octane petrol decreased by a cumulative 24 cents per litre over the three-month period – the year-on-year rate of change in consumer petrol price inflation accelerated markedly from -8,0 per cent in October 2015 to 10,0 per cent in January 2016, largely due to unfavourable base effects. Furthermore, when excluding the effect of petrol prices from the calculation of administered prices, the rate of increase accelerated from 6,3 per cent in February 2015 to 8,5 per cent in December 2015 and January 2016, driven largely by accelerations in price inflation for electricity, water and assessment rates. When excluding electricity prices from the calculation of administered prices as well, the rate of increase quickened from 6,2 per cent in June 2015 to 7,4 per cent in December, before moderating to 7,1 per cent in January 2016. In early March 2016, the National Energy Regulator of South Africa (NERSA) awarded Eskom a 9,4 per cent increase for 2016/17.
Average inflation expectations, as measured in the Inflation Expectations Survey conducted by the BER in the fourth quarter 2015, shifted higher over the whole forecast period. The average headline inflation expectations of financial analysts, business representatives and trade unions increased marginally by 0,1 percentage points to 5,6 per cent and 6,2 per cent for 2015 and 2016 respectively, but increased by a more substantial 0,3 percentage points to 6,2 per cent for 2017. Analysts and business representatives revised their 2017 forecasts slightly upwards to 5,6 per cent (up by 0,2 percentage points) and 6,6 per cent (up by 0,1 percentage points) respectively. In contrast, trade union officials raised their forecast by a noticeable 0,4 percentage points to 6,3 per cent. Analysts expect inflation to quicken notably to 5,9 per cent in 2016 before moderating to 5,6 per cent in 2017. Business representatives and trade unions, in turn, expect inflation to accelerate in 2016 and 2017, from 6,4 per cent in 2016 to 6,6 per cent in 2017 in the case of business representatives, and from 6,2 per cent to 6,3 per cent over the same period in the case of trade union officials.
Headline consumer price inflation expectations
Per cent, as surveyed in the fourth quarter of 2015
| Average inflation expected for: | Financial analysts |
Business representatives |
Trade union representatives |
All surveyed participants |
||||||||||||
| 2015 |
4,8 | 6,2 | 5,9 | 5,6 | ||||||||||||
| 2016 |
5,9 | 6,4 | 6,2 | 6,2 | ||||||||||||
| 2017 |
5,6 | 6,6 | 6,3 | 6,2 | ||||||||||||
| The next five years |
5,5 | 6,5 | 6,2 | 6,1 | ||||||||||||
Source: Bureau for Economic Research, Stellenbosch University
After edging lower to 5,9 per cent in the third quarter of 2015, average five-year inflation expectations rebounded to 6,1 per cent in the fourth quarter. While business representatives kept their five-year inflation expectations unchanged at 6,5 per cent, those of analysts and trade union officials rose by 0,1 percentage points to 5,5 per cent and by 0,3 percentage points to 6,2 per cent, respectively. Average household inflation expectations for the next twelve months increased somewhat from 6,7 per cent in the third-quarter 2015 survey to 6,9 per cent in the fourth-quarter survey.
|
|
Quarterly Bulletin March 2016 |
Foreign trade and payments
International economic developments
Global economic growth moderated notably from an annualised rate of 3,5 per cent in the third quarter of 2015 to 1,9 per cent in the fourth quarter. The pace of growth almost halved in emerging-market economies, driven primarily by weaker economic conditions in China, India and Russia. In advanced economies, economic activity slowed largely due to a sharp moderation in US economic growth and a contraction of economic activity in Japan.
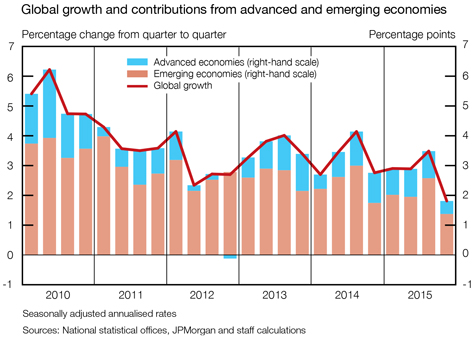
The International Monetary Fund (IMF) lowered its 2016 global growth forecast by 0,2 percentage points to 3,4 per cent in its January 2016 World Economic Outlook Update. In particular, growth projections for emerging-market and developing economies were scaled down by 0,2 percentage points to 4,3 per cent. The recession in Brazil was estimated to be more protracted than previously expected, while growth prospects for major oil- and other commodity-exporting countries such as Nigeria, Russia, Saudi Arabia and South Africa also weakened.
The projection for advanced-economy growth in 2016 was lowered marginally to 2,1 per cent, mainly reflecting slightly weaker prospects for the US economy where growth expectations were pared down by 0,2 percentage points. However, economic activity in the US is still expected to accelerate marginally in 2016 as improvements in the labour and housing markets as well as an accommodative monetary policy stance – even after the recent increase in the federal funds rate – still support economic activity. A moderate recovery was expected to continue in the euro area and Japan, supported by low oil prices and accommodative monetary policies.
Economic growth in the US moderated sharply in the fourth quarter of 2015, slowing to 1,0 per cent from 2,0 per cent in the third quarter. The deceleration in growth resulted primarily from a contraction in business fixed investment, exports, state and local government expenditure as well as a moderation in consumer spending. The much-anticipated normalisation of monetary policy in the US commenced in December 2015, with the Federal Reserve Open Market Committee (FOMC) raising the target range for the federal funds rate by 25 basis points to between 0,25 and 0,50 per cent. This step reflected the FOMC’s confidence in the recovery of the labour market alongside the expectation that inflation would return towards the 2 per cent objective in the medium term.
| Quarterly Bulletin March 2016 |
|


Real growth in selected advanced economies
Percentage change at seasonally adjusted annualised rates
| 2014 | 2015 | |||||||||||||||||||||||||||||||||||||||
| Country/region | 1st qr | 2nd qr | 3rd qr | 4th qr | Year | 1st qr | 2nd qr | 3rd qr | 4th qr | Year | ||||||||||||||||||||||||||||||
| United States |
-0,9 | 4,6 | 4,3 | 2,1 | 2,4 | 0,6 | 3,9 | 2,0 | 1,0 | 2,4 | ||||||||||||||||||||||||||||||
| Japan |
5,0 | -7,9 | -2,6 | 2,5 | 0,0 | 4,2 | -1,4 | 1,3 | -1,4 | 0,5 | ||||||||||||||||||||||||||||||
| Euro area |
0,9 | 0,2 | 1,2 | 1,5 | 0,9 | 2,2 | 1,6 | 1,2 | 1,1 | 1,5 | ||||||||||||||||||||||||||||||
| United Kingdom |
2,6 | 3,2 | 2,6 | 2,7 | 2,9 | 1,7 | 2,4 | 1,7 | 1,9 | 2,2 | ||||||||||||||||||||||||||||||
| Canada |
0,5 | 3,7 | 2,1 | 3,4 | 2,5 | -0,7 | -0,3 | 2,3 | 0,1 | 1,2 | ||||||||||||||||||||||||||||||
|
|
|
|
|
|||||||||||||||||||||||||||||||||||||
| Australia |
3,8 | 1,8 | 1,5 | 1,6 | 2,6 | 3,6 | 1,0 | 3,8 | 2,4 | 2,3 | ||||||||||||||||||||||||||||||
|
|
|
|
|
|||||||||||||||||||||||||||||||||||||
| New Zealand |
5,3 | 3,6 | 3,7 | 3,8 | 3,0 | 0,8 | 1,2 | 3,5 | 1,6 | 2,4 | ||||||||||||||||||||||||||||||
|
|
|
|
|
|||||||||||||||||||||||||||||||||||||
| Advanced economies |
1,0 | 1,6 | 2,3 | 2,0 | 1,8 | 1,8 | 1,9 | 1,8 | 0,9 | 1,9 | ||||||||||||||||||||||||||||||
|
|
|
|
|
|||||||||||||||||||||||||||||||||||||
Underlined numbers indicate projections. Some regional totals include countries with forecasted data.
Sources: Bloomberg, national statistical offices and staff calculations
The FOMC left the policy rate unchanged at its January 2016 meeting, in line with expectations, as it continues to monitor the likely impact of global economic and financial market developments on US economic activity. US consumer price inflation accelerated to 1,4 per cent in January 2016, while the Federal Reserve’s preferred inflation measure, the deflator for personal consumption expenditure, rose by 1,3 per cent over the same period.
Real output growth in the euro area moderated slightly to 1,1 per cent in the final quarter of 2015. Euro area annual consumer prices fell by 0,2 per cent in February 2016, reflecting lower energy prices. The Governing Council of the European Central Bank (ECB) expects inflation to remain very low or negative in 2016, only picking up in the latter part of the year. The ECB assessed the downside risks to the euro area outlook to have increased due to strained conditions in emerging-market economies, ongoing volatility in financial and commodity markets, and increased geopolitical risks. The central bank left its policy rate unchanged at its January 2016 meeting, but indicated that it would review and reconsider its policy stance at the March 2016 meeting in view of the weaker outlook for the economy.
Economic activity in Japan contracted at an annualised rate of 1,4 per cent in the fourth quarter of 2015 mainly due to a decline in household consumption expenditure, private inventory holdings, and exports. The Bank of Japan (BOJ) introduced various measures at its last two meetings to support economic activity. In December 2015 it adopted operational changes to supplement its monetary stimulus programme, including the extension of the duration of government bond purchases and a new programme of exchange-traded fund purchases of ¥300 billion per annum. At its January 2016 meeting, the BOJ adopted a negative interest rate policy and applied a rate of -0,1 per cent to certain excess reserves of financial institutions at the bank. The central bank indicated that it would lower interest rates even further, if necessary, in the quest to reach its inflation target of 2 per cent as quickly as possible.
Real economic growth in the United Kingdom (UK) accelerated from 1,7 per cent in the third quarter of 2015 to 1,9 per cent in the fourth quarter, while consumer price inflation edged marginally higher to 0,3 per cent in January 2016. The Monetary Policy Committee of the Bank of England (BOE) voted unanimously at its February 2016 meeting to keep the bank rate unchanged at 0,5 per cent.
Economic growth in emerging Asia slowed notably to 4,7 per cent in the fourth quarter of 2015, with activity easing in most major economies in the region. Concerns over the underlying strength of economic growth in China increased as the country’s growth moderated to 6,7 per cent in the final quarter of 2015, reflecting the ongoing rebalancing of economic activity away from investment and manufacturing to consumption and services. The People’s Bank of China lowered its benchmark lending rate by 25 basis points in October 2015 and reduced its
|
|
Quarterly Bulletin March 2016 |
reserve requirement ratio by 50 basis points in October 2015 and again in March 2016. Real output in India contracted at a rate of 1,2 per cent in the fourth quarter following double-digit growth in the preceding quarter. At the same time, economic activity in Indonesia improved, with growth accelerating to 6,2 per cent. Inflation in India and Indonesia accelerated in January 2016 to 5,7 per cent and 4,1 per cent respectively. The central bank of Indonesia lowered its policy rate by 25 basis points in February 2016, the second interest rate reduction this year.
Real growth in selected emerging-market economies
Percentage change at seasonally adjusted annualised rates
| 2014 | 2015 | |||||||||||||||||||||||||||||||||||||||
| Country/area | 1st qr | 2nd qr | 3rd qr | 4th qr | Year | 1st qr | 2nd qr | 3rd qr | 4th qr | Year | ||||||||||||||||||||||||||||||
| China |
6,7 | 7,5 | 7,6 | 6,9 | 7,3 | 6,1 | 7,3 | 7,1 | 6,7 | 6,9 | ||||||||||||||||||||||||||||||
| India |
6,8 | 9,3 | 12,5 | -1,8 | 7,2 | 10,9 | 7,4 | 10,4 | -1,2 | 7,4 | ||||||||||||||||||||||||||||||
| Indonesia |
4,3 | 4,9 | 5,5 | 4,8 | 5,0 | 3,2 | 5,0 | 5,4 | 6,2 | 4,8 | ||||||||||||||||||||||||||||||
| Emerging Asia |
6,2 | 7,5 | 8,3 | 4,6 | 6,8 | 6,8 | 6,9 | 7,5 | 4,7 | 4,9 | ||||||||||||||||||||||||||||||
| Russia |
-0,8 | 2,9 | 0,5 | -2,0 | 0,7 | -9,3 | -5,4 | 0,7 | -1,5 | -3,7 | ||||||||||||||||||||||||||||||
| Turkey |
5,3 | -0,3 | 1,3 | 4,2 | 2,9 | 6,3 | 5,5 | 5,2 | 0,0 | 3,3 | ||||||||||||||||||||||||||||||
|
|
|
|
|
|||||||||||||||||||||||||||||||||||||
| Poland |
4,5 | 2,4 | 3,6 | 3,2 | 3,3 | 3,6 | 3,2 | 3,6 | 4,5 | 3,6 | ||||||||||||||||||||||||||||||
| Emerging Europe |
1,6 | 2,0 | 1,5 | 0,6 | 1,8 | -2,6 | -1,1 | 2,5 | 0,3 | -0,3 | ||||||||||||||||||||||||||||||
|
|
|
|
|
|||||||||||||||||||||||||||||||||||||
| Brazil |
2,5 | -5,1 | -0,4 | 0,3 | 0,1 | -3,3 | -8,0 | -6,7 | -4,6 | -3,7 | ||||||||||||||||||||||||||||||
|
|
|
|
|
|||||||||||||||||||||||||||||||||||||
| Mexico |
2,4 | 3,0 | 2,1 | 2,9 | 2,3 | 2,1 | 2,6 | 3,3 | 2,2 | 2,5 | ||||||||||||||||||||||||||||||
| Argentina |
-3,4 | 3,1 | 1,2 | 1,5 | 0,4 | 2,8 | 2,0 | 4,5 | -5,6 | 2,2 | ||||||||||||||||||||||||||||||
|
|
|
|
|
|||||||||||||||||||||||||||||||||||||
| Latin America |
0,6 | -0,3 | 1,4 | 1,5 | 1,0 | -0,5 | -2,7 | -1,0 | -2,0 | -0,5 | ||||||||||||||||||||||||||||||
|
|
|
|
|
|||||||||||||||||||||||||||||||||||||
| Emerging economies |
4,4 | 5,2 | 5,9 | 3,4 | 4,9 | 4,2 | 4,0 | 5,3 | 2,9 | 3,2 | ||||||||||||||||||||||||||||||
|
|
|
|
|
|||||||||||||||||||||||||||||||||||||
Underlined numbers indicate projections. Some regional totals include countries with forecasted data.
Sources: Bloomberg, JPMorgan, national statistical offices and staff calculations
Growth in real output of emerging Europe moderated to 0,3 per cent in the fourth quarter of 2015, largely due to a 1,5 per cent decline in real value added in Russia. Real production in Turkey stagnated, while growth in Poland improved to 4,5 per cent in the fourth quarter of 2015. Poland continued to experience deflation in January 2016, with consumer prices declining by 0,7 per cent. Consumer price inflation remains elevated in Turkey and Russia. However, consumer price inflation in Russia eased to 9,8 per cent in January 2016, following double-digit inflation rates in 13 consecutive months. By contrast, inflation in Turkey accelerated from 7,6 per cent in October 2015 to 9,6 per cent in January 2016.
Real GDP in Latin America contracted by 2,0 per cent in the final quarter of 2015 – the fourth consecutive quarter of negative growth. This poor performance could largely be attributed to the Brazilian economy which has been in recession throughout 2015. Real output in Argentina also declined in the fourth quarter of 2015, while growth in Mexico, Colombia and Chile moderated somewhat over the same period. Currency depreciations across the region have worsened inflation outlooks and prompted the Mexican, Chilean and Colombian central banks to tighten monetary policy in recent months.
According to the CPB Netherlands Bureau for Economic Policy Analysis, world trade volumes (calculated as the three-month average of world exports relative to that in the preceding three months) grew by 1,9 per cent in December 2015, slower than the 4,7 per cent rate of increase in November. Growth in emerging-market export volumes slowed significantly to 2,2 per cent in December from 7,8 per cent in the previous month. Export volume growth of advanced economies also eased marginally to 1,6 per cent in December.
| Quarterly Bulletin March 2016 |
|


Weaker growth in emerging-market economies and increased US shale oil production have put downward pressure on commodity prices, especially energy prices. The price of Brent crude oil receded sharply to a twelve-year low of below US$30 per barrel in January 2016, more than 75 per cent lower than the US$115 per barrel recorded in mid-2014. The lifting of most trade sanctions on Iran as well as reports of elevated crude oil inventory levels added to concerns about an oversupply in the oil market. However, oil prices increased to levels above US$36 per barrel towards the end of February after China lowered the reserve requirements of banks to boost its slowing economy and crude output from the US and OPEC fell. Brent crude oil futures prices for delivery in the second and third quarters of 2016 were trading at around US$37 per barrel and US$39 per barrel respectively.
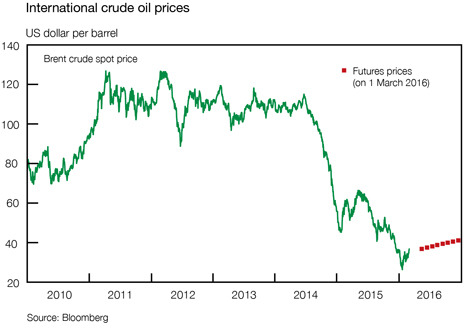
Current account9
South Africa’s annual trade deficit with the rest of the world halved between 2014 and 2015 despite a widening trend in the second half of 2015. The trade balance switched from a surplus in the second quarter of 2015 to deficits of R22 billion and R57 billion in the third and fourth quarters respectively. A contraction in merchandise export volumes alongside increased domestic demand for foreign-produced goods largely shaped developments on the trade account in the final quarter of 2015. Notwithstanding the widening of the trade deficit to 1,4 per cent of GDP in the fourth quarter of 2015, the trade deficit narrowed on an annual basis from 1,8 per cent of GDP in 2014 to 0,9 per cent in 2015.
Balance of payments on current account
R billions, seasonally adjusted and annualised
| 2014 | 2015 | |||||||||||||||||||||||
| Year | 1st qr | 2nd qr | 3rd qr | 4th qr | Year | |||||||||||||||||||
| Merchandise exports |
941 | 938 | 989 | 999 | 969 | 974 | ||||||||||||||||||
| Net gold exports |
63 | 63 | 71 | 65 | 72 | 68 | ||||||||||||||||||
| Merchandise imports |
-1 072 | -1 065 | -1 055 | -1 086 | -1 098 | -1 076 | ||||||||||||||||||
| Trade balance |
-69 | -64 | 6 | -22 | -57 | -34 | ||||||||||||||||||
| Net service, income and current transfer payments |
-138 | -132 | -127 | -150 | -151 | -140 | ||||||||||||||||||
| Balance on current account |
-207 | -196 | -121 | -172 | -208 | -174 | ||||||||||||||||||
| As percentage of gross domestic product |
-5,4 | -5,0 | -3,1 | -4,3 | -5,1 | -4,4 | ||||||||||||||||||
Components may not add up to totals due to rounding
|
|
Quarterly Bulletin March 2016 |
The traditional shortfall on the services, income and current transfer account with the rest of the world broadened slightly from the third to the fourth quarter of 2015, exacerbating the weakening of the trade balance over the period. The deficit on the current account of the balance of payments thus expanded from 4,3 per cent of GDP in the third quarter of 2015 to 5,1 per cent in the fourth quarter. On an annual basis, the deficit narrowed from 5,4 per cent of GDP in 2014 to 4,4 per cent in 2015.
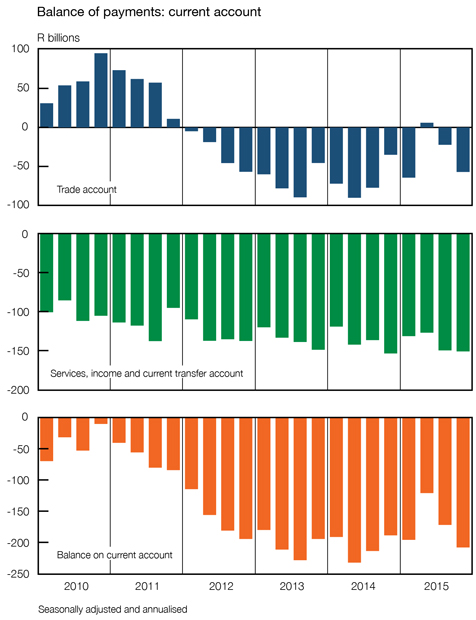
Even though the depreciation in the exchange value of the rand boosted the export earnings of domestic producers, the benefits thereof were more than fully negated by a further decline in the international prices of South African export commodities in the fourth quarter of 2015. The rand price of merchandise exports (excluding gold) consequently fell by 0,4 per cent in the final quarter of 2015. The US dollar price of non-gold export commodities declined by 7,7 per cent in the fourth quarter of 2015 following a drop of 8,5 per cent in the preceding quarter as the prices of copper and nickel decreased further on account of, among other factors, weakening manufacturing output in China. Reflecting prolonged global oversupply, the dollar price of iron ore receded further by 14,9 per cent in the fourth quarter of 2015. At the same time, the dollar prices of coal and platinum also edged lower although the price of coal was expected to increase somewhat during the winter season in the Northern hemisphere. For 2015 as a whole, the US dollar price of a basket of South African-produced non-gold export commodities fell by no less than 21,5 per cent following a decline of 9,4 per cent in 2014.
| Quarterly Bulletin March 2016 |
|


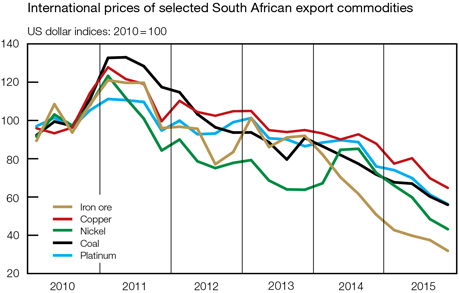
After increasing for five consecutive quarters, the volume of merchandise exports contracted by 2,6 per cent in the fourth quarter of 2015, affected by a decrease in the volume of mining and manufactured exports. Nonetheless, as a ratio of real GDP, the volume of merchandise exports surged from 23,1 per cent in 2014 to 25,2 per cent in 2015, indicative of the somewhat better performance of South African producers in international markets amid a more competitive exchange rate of the rand.
Having advanced in the preceding two quarters, the value of merchandise exports decreased by 3,0 per cent in the fourth quarter of 2015. This decline was mainly evident in exports destined for Europe, with exports to trading-partner countries in Africa moving sideways. By contrast, muted increases were recorded in the value of merchandise exports to the American and Asian continents over the period.
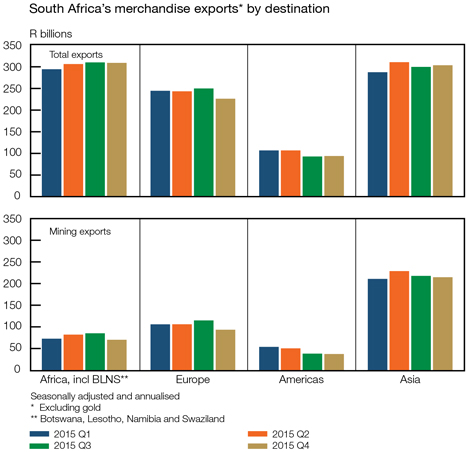
|
|
Quarterly Bulletin March 2016 |
Even though the value of non-gold mining exports to most regions shrank in the final quarter of 2015, non-gold mining exports to Africa and Europe in particular contracted sharply, declining by 18 per cent and 19 per cent respectively in the fourth quarter of the year. Declines were largely noted in the value of manganese and chromium ores and related concentrates as well as in the platinum-group metals over the period. In the category for manufactured exports, a decrease in the value of exported vehicles and transport equipment as well as in machinery and electrical equipment more than offset increases in the value of exported chemical products and processed food, beverages and tobacco.
The value of agricultural exports advanced by 11,7 per cent in the fourth quarter of 2015, supported by increases in the sales of vegetable products as well as live animals and animal products. The impact of the intensifying drought conditions in South Africa on food security and livestock was evident in a significant decline in the value of net maize exports in the first three quarters of 2015; net exports rose somewhat in the fourth quarter.
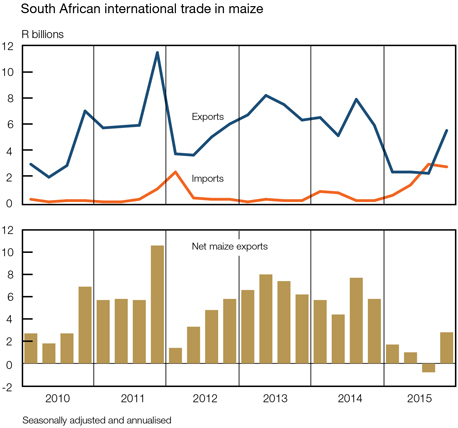
The London fixing price of gold declined from US$1 125 per fine ounce in the third quarter of 2015 to US$1 104 per fine ounce in the fourth quarter, or by 1,8 per cent. Owing to, among other factors, the depreciation in the exchange value of the rand, the average realised rand price of gold rose by 9,7 per cent over the same period. Combined with a 1,5 per cent increase in the physical quantity of net gold exports in the final quarter of 2015, the export proceeds of South African gold producers advanced by 11,3 per cent over the period. On an annual basis, net gold export earnings rose from R63 billion in 2014 to R68 billion in 2015.
| Quarterly Bulletin March 2016 |
|


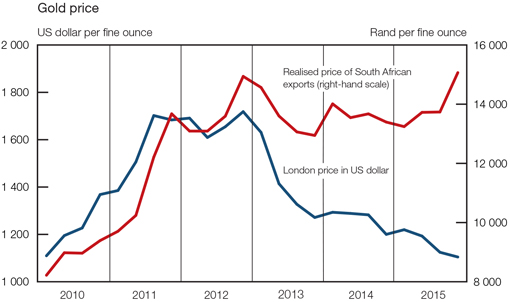
Having increased by 1,4 per cent in the third quarter of 2015, the volume of merchandise imports rose by 1,8 per cent in the fourth quarter as the domestic demand for imported mining products and manufactured goods increased despite a moderation in domestic economic growth and the sustained depreciation in the exchange value of the rand over the period. The rise in the volume of mining imports largely reflected a sharp increase in mineral products, particularly crude oil, amid substantially lower international crude oil prices. At the same time, the physical quantity of imported refined oil products, particularly distillate fuels, and other mining products contracted somewhat in the fourth quarter of 2015.
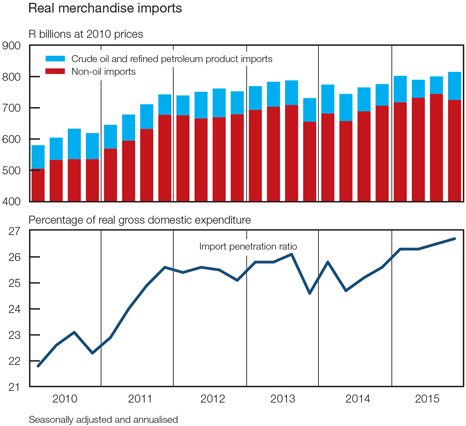
|
|
Quarterly Bulletin March 2016 |
The physical quantity of non-oil imports declined by 2,5 per cent in the fourth quarter of 2015 following an increase of 1,7 per cent in the third quarter. The physical quantity of manufactured imports rose marginally in the fourth quarter despite the importation of fewer railway locomotives compared with the preceding quarter. Over the same period, the volume of agricultural imports declined marginally. As a ratio of real gross domestic expenditure, the volume of total merchandise imports increased from 25,3 per cent in 2014 to 26,5 per cent in 2015.
Despite the substantial weakening in the exchange value of the rand in the fourth quarter of 2015, the rand price of imports fell by 0,7 per cent, pushed lower by the sharp decline in the international price of crude oil over the period. The slightly lower import price, together with the increase in the overall import volume, resulted in a 1,1 per cent increase in the value of merchandise imports in the fourth quarter of 2015.
Box 1 AGOA: trade between South Africa and the United States
The Africa Growth and Opportunity Act (AGOA) was enacted in the United States (US) in 2001 as an extension of the Trade and Development Act of 2000. In terms of the Act, the US unilaterally runs a preferential trade programme allowing 48 sub-Saharan countries, including South Africa, to export duty-free to the US under roughly 6 400 tariff lines. AGOA aims to promote a free-market system, expanding US-Africa trade and investment, stimulating global economic growth, and assisting sub-Saharan countries’ integration into the global economy. The AGOA Extension and Enhancement Act (AEEA) of 2015 was signed on 29 June 2015, extending the benefits in terms of AGOA for a further 10 years. In return, member countries are expected to remove barriers to US trade and investment, allow and promote a market-based economy, protect workers’ rights, and implement economic policies to reduce poverty.
In the case of South Africa, the AEEA came with the condition, as announced on 11 January 2016, that South Africa does away with the trade barriers to allow US chicken exports into the country by 15 March 2016, failing which the country will be excluded from the duty-free programme. On 18 December 2015, South Africa published the rebate provision and guideline for the import of 65 000 tons of US bone-in chicken pieces into the country, exempt from anti-dumping duties. The first shipment of US chicken arrived in South Africa at the end of February 2016.
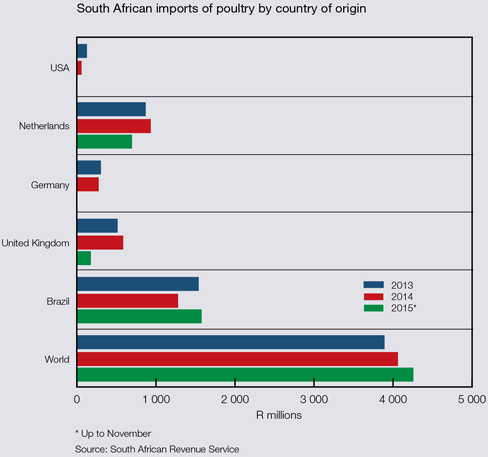
| Quarterly Bulletin March 2016 |
|


The graph depicts South African imports of poultry from various countries. South Africa sources most of its poultry from Brazil, whose share has increased steadily since 2013. The Netherlands have been the second-largest supplier, followed by the United Kingdom (UK). The total value of poultry imports from the US decreased from R127 million in 2013 to R58 million in 2014 and further to only R2 million in 2015.
South African chicken exports to the US amounted to R67,6 billion in 2013, R69,4 billion in 2014 and R77,8 billion in 2015. The total AGOA tariff relief experienced by South African exporters amounted to R508,6 million in 2014, with the primary domestic beneficiary industries being vehicles (R354,6 million), base metals (R65 million), agriculture (R61,8 million), and chemicals (R11,9 million).
In the sub-Saharan region, South Africa is regarded as the main exporter and beneficiary under AGOA, having supplied roughly 40 per cent of AGOA’s total imports in the first ten months of 2015. Angola and Nigeria contributed approximately 23 per cent and 15 per cent respectively over the period.
Selected US imports, 2015
R millions
| World | AGOA* | South Africa under AGOA* |
Share of South Africa in AGOA* |
|||||||||||||
| Edible fruit, nuts, peel of citrus fruit, melons |
158 257 | 21 887 | 1 599 | 7,3 | ||||||||||||
| Vehicles other than railway, tramway |
2 898 138 | 13 593 | 13 575 | 99,9 | ||||||||||||
| Ores, slag and ash |
29 129 | 7 505 | 3 897 | 51,9 | ||||||||||||
| Inorganic chemicals, precious metal compound, isotopes |
139 222 | 2 508 | 2 504 | 99,8 | ||||||||||||
| Organic chemicals |
545 902 | 3 762 | 3 753 | 99,8 | ||||||||||||
| Meat and edible meat offal |
148 993 | 3 128 | 7 | 0,2 | ||||||||||||
| * | The Africa Growth and Opportunity Act (AGOA) |
Source: International Trade Centre (ITC) calculations based on United Nations Commodity Trade Statistics Database (UN COMTRADE) Trade Map January to October.
South Africa’s terms of trade improved marginally in the fourth quarter of 2015 as overall merchandise export prices moved broadly sideways while that of merchandise imports declined. The terms of trade nonetheless deteriorated from 2014 to 2015.
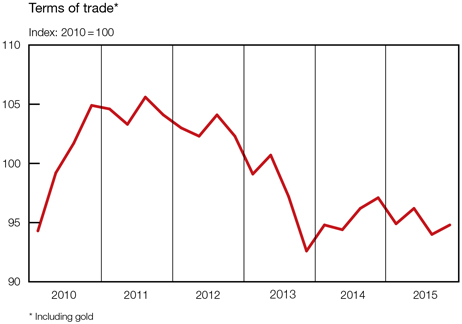
|
|
Quarterly Bulletin March 2016 |
The shortfall on the services, income and current transfer account widened further from R150 billion in the third quarter of 2015 to R151 billion in the fourth quarter. Despite this deterioration, the annual shortfall on the account narrowed marginally from 3,6 per cent of GDP in 2014 to 3,5 per cent of GDP in 2015.
The widening of the deficit in the final quarter of 2015 could largely be attributed to a decrease in gross dividend receipts from abroad; gross dividend payments to non-resident investors also declined, but not to the same extent. Overall, growth in dividend payments to the rest of the world slowed to about 5 per cent in 2015, following robust growth of almost 19 per cent recorded in 2014. In fact, the pace of increase in dividend payments in 2015 was the slowest since 2010. At the same time, dividend receipts from abroad continued to taper off from a recent peak in the first quarter of 2014. For the year 2015 as a whole, gross dividend receipts nevertheless increased by almost 23 per cent following robust annual growth of, on average, almost 46 per cent between 2012 and 2014. As a ratio of total receipts on the services, income and current transfer account, gross dividend receipts advanced from 12,5 per cent in 2012 to 20,6 per cent in 2015. The continued strong growth in dividend receipts has accordingly helped to moderate the deficit in this area over an extended period of time.
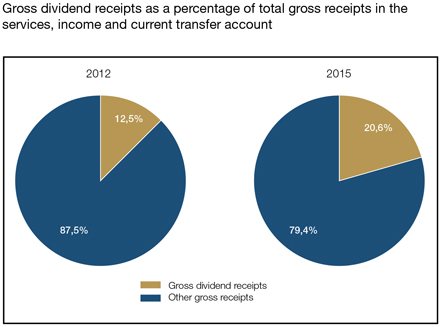
The widening in the shortfall on the income account in the fourth quarter was countered by an increase in net travel receipts. Tourism spending by foreign tourists probably benefited from the abrupt weakening in the exchange value of the rand during the fourth quarter of 2015. However, notwithstanding higher spending during the final quarter of 2015, expenditure by foreign travellers rose by less than 4 per cent during the calendar year 2015 as a whole compared with an increase of almost 14 per cent in 2014.
Net payments in the category ‘other services’ were further elevated by higher gross payments related to intellectual property. Since such payments are made to non-residents on a regular basis, the depreciation in the exchange value of the rand probably inflated these numbers in the final quarter of 2015.
Financial account
The financial account of the balance of payments (including reserve assets but excluding unrecorded transactions) recorded capital inflows of R53,5 billion in the fourth quarter of 2015 compared with a net inward movement of capital of R41,7 billion in the third quarter. On a net basis, the categories for other investment and financial derivatives registered capital inflows in
| Quarterly Bulletin March 2016 |
|


the fourth quarter of 2015 while direct and portfolio investment showed net outflows of capital over the period. On an annual basis, an overall capital inflow to the tune of R142,3 billion was registered in 2015, somewhat less than the R150,1 billion recorded in 2014. Expressed as a ratio of GDP, net capital inflows edged higher to 5,2 per cent in the fourth quarter of 2015, culminating in a ratio of 3,6 per cent for the year compared with a ratio of 4,0 per cent registered in 2014.
The inflow of capital occurred despite bouts of risk aversion among international investors towards emerging-market economies. The uncertainty in the international financial markets continued to be dominated by factors such as the normalisation of US monetary policy, declining international commodity prices, and concerns about the vibrancy of economic growth in China. In addition to the global factors, the domestic dynamics of individual emerging-market economies were also influential. In South Africa, the inflow of capital was further affected by poor economic growth, a widening current-account deficit in the third quarter of 2015 as well as credit rating agencies’ negative outlook for economic growth during the fourth quarter of 2015.
Net financial transactions
R billions
| 2014 | 2015 | |||||||||||||||||||||||
| Year | 1st qr | 2nd qr | 3rd qr | 4th qr | Year | |||||||||||||||||||
| Change in liabilities |
||||||||||||||||||||||||
| Direct investment |
62,6 | -13,9 | 6,9 | 15,9 | 13,7 | 22,6 | ||||||||||||||||||
| Portfolio investment |
73,3 | 39,3 | 54,8 | 11,8 | -0,3 | 105,6 | ||||||||||||||||||
| Financial derivatives |
-194,8 | -72,6 | -74,3 | -71,0 | -103,0 | -320,9 | ||||||||||||||||||
| Other investment |
148,1 | 39,6 | -20,6 | 6,2 | 44,6 | 69,8 | ||||||||||||||||||
| Change in assets |
||||||||||||||||||||||||
| Direct investment |
-83,2 | -11,3 | -4,9 | -14,7 | -37,4 | -68,3 | ||||||||||||||||||
| Portfolio investment |
-24,2 | -5,3 | -10,0 | -24,2 | -10,6 | -50,1 | ||||||||||||||||||
| Financial derivatives |
211,3 | 73,3 | 70,9 | 78,3 | 103,3 | 325,8 | ||||||||||||||||||
| Other investment |
-26,3 | -18,3 | -20,0 | 38,8 | 48,3 | 48,8 | ||||||||||||||||||
| Reserve assets |
-16,6 | 12,3 | 1,4 | 0,5 | -5,1 | 9,1 | ||||||||||||||||||
| Total identified financial transactions* |
150,1 | 43,0 | 4,1 | 41,7 | 53,5 | 142,3 | ||||||||||||||||||
| As percentage of gross domestic product |
4,0 | 4,5 | 0,4 | 4,1 | 5,2 | 3,6 | ||||||||||||||||||
| * | Including reserve assets but excluding unrecorded transactions |
Foreign-owned assets in South Africa
Non-residents increased their foreign direct investment assets in South Africa to the value of R13,7 billion in the fourth quarter of 2015 compared with an inflow of R15,9 billion in the third quarter. The inflow of capital can predominantly be attributed to equity investments into South African companies. While a reverse takeover by a non-resident company of a resident integrated retail group and the subsequent movement of the primary listing of the group from the JSE to the Frankfurt Stock Exchange will result in gross changes to South Africa’s international investment position, the transaction was not recorded in the financial account as the outcome was only a change of domicile of the company. For the calendar year, inward foreign direct investment decreased from R62,6 billion in 2014 to R22,6 billion in 2015.
According to United Nations Conference on Trade and Development (UNCTAD), global foreign direct investment flows increased by 36 per cent in 2015 to an estimated US$1,7 trillion – the highest capital flows since the global economic and financial crisis of 2008. A significant portion of global foreign direct investment capital was destined for developed countries while investment in developing economies increased by only 5 per cent compared with 2014 – still reaching a new high of US$741 billion. Capital flows to Africa, Latin America and the Caribbean (excluding offshore financial centres) abated, reflecting the declining prices of their principal commodity exports. The growth in global foreign direct investment furthermore reflected cross-border mergers and acquisitions, with only a limited contribution from greenfield investment
|
|
Quarterly Bulletin March 2016 |
projects in productive assets. UNCTAD expects foreign direct investment flows to diminish in 2016, reflecting the fragility of the global economy, the volatility of the global financial markets, weak aggregate demand, and a significant deceleration in some large emerging-market economies. Elevated geopolitical risks and regional tensions could further amplify these economic challenges.
Inward portfolio investment into South Africa showed some strain in the second half of 2015 amid the much anticipated tightening of monetary policy in the US. Portfolio investment into the country receded notably in the third quarter of 2015 before recording a marginal outflow of R0,3 billion in the fourth quarter. Cumulatively, inward foreign portfolio investment increased from R73,3 billion in 2014 to R105,6 billion in 2015.
Inward portfolio investment into South African equities, which had amounted to R71,5 billion in the first half of 2015, receded to R18,3 billion in the second half. Inflows related to a share issue of a domestic media company bolstered equity inflows in the fourth quarter of 2015. Equity inflows in 2015 amounted to R89,8 billion. Non-resident investors reduced their stock of domestic debt securities to the tune of R7,4 billion in the fourth quarter of 2015 compared with a small inflow in the third quarter.
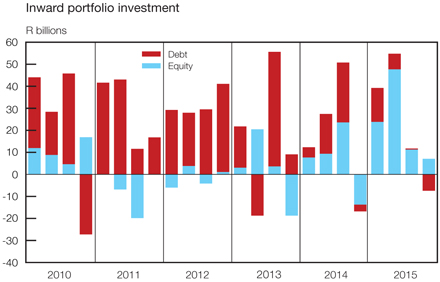
Following an inflow of R6,2 billion in the third quarter of 2015, other investment flows accelerated markedly and recorded an inflow of capital of R44,6 billion in the fourth quarter. While non-resident rand-denominated deposits with domestic banks decreased in the fourth quarter of 2015, the domestic banking sector registered a substantial increase in foreign currency-denominated loans and deposits from non-resident banks. Other inward foreign investment decreased from R148,1 billion in 2014 to R69,8 billion in 2015.
South African-owned assets abroad
During the fourth quarter of 2015, South African entities acquired offshore assets at a noticeably faster pace compared to the third quarter as a domestic media company increased its investment in a foreign subsidiary. Outward direct investment flows amounted to R37,4 billion in the fourth quarter compared with an outflow of R14,7 billion in the third quarter. Outward foreign direct investment flows decreased from R83,2 billion in 2014 to R68,3 billion in 2015.
The acquisition of outward portfolio investment assets by South African residents was accompanied by a capital outflow of R10,6 billion in the fourth quarter of 2015 compared to an outflow of R24,2 billion in the third quarter. The acquisition of foreign portfolio assets mainly resulted from the investment abroad by individual investors. Outward foreign portfolio investment increased considerably from R24,2 billion in 2014 to R50,1 billion in 2015, partly reflecting institutional investors’ confidence in offshore financial markets.
| Quarterly Bulletin March 2016 |
|


Following significant inflows of R38,8 billion recorded in the third quarter of 2015, other investment asset flows increased further by R48,3 billion in the fourth quarter. Repatriation of the domestic banking sector’s loan finance to non-resident borrowers was the major contributing factor to the inflow recorded in the fourth quarter. Outward other portfolio investment changed from an outflow of R26,3 billion in 2014 to an inflow of R48,8 billion in 2015.
Foreign debt
South Africa’s gross external debt decreased from US$141,7 billion at the end of June 2015 to US$134,5 billion at the end of September due to a decline in rand-denominated debt over the period. This decline marks the third consecutive quarterly decrease in South Africa’s gross external debt position, having previously increased steadily from September 2013. However, expressed in rand terms, South Africa’s external debt rose from R1 734 billion at the end of June 2015 to R1 858 billion at the end of September due to the depreciation in the exchange rate of the rand.
Foreign currency-denominated debt increased from US$65,7 billion at the end of the second quarter of 2015 to US$66,6 billion at the end of the third quarter. The accumulation of foreign currency-denominated debt was mainly driven by an increase in the loan obligations of the non-monetary private sector as well as a rise in non-resident deposits and long-term loans extended to South African banks. The latter was partially offset by the repayment of short-term loans by the domestic banking sector in the third quarter of 2015. Relative to total foreign currency-denominated debt, South Africa’s short-term foreign currency-denominated debt (i.e. debt with an original maturity of less than one year and other longer-term foreign currency-denominated debt maturing within the next twelve months) remained broadly unchanged at 46,1 per cent from the end of June 2015 to the end of September 2015.
South Africa’s foreign debt
US$ billions at end of period
| 2014 | 2015 | |||||||||||||||||||||||
| 2nd qr | 3rd qr | 4th qr | 1st qr | 2nd qr | 3rd qr | |||||||||||||||||||
| Foreign currency-denominated debt |
62,2 | 64,7 | 67,5 | 67,0 | 65,7 | 66,6 | ||||||||||||||||||
| Debt securities |
20,1 | 21,9 | 22,7 | 23,6 | 23,9 | 23,8 | ||||||||||||||||||
| Other |
42,2 | 42,8 | 44,7 | 43,3 | 41,8 | 42,8 | ||||||||||||||||||
| Public sector |
9,1 | 8,8 | 8,2 | 7,3 | 7,7 | 7,8 | ||||||||||||||||||
| Deposit-taking institutions |
13,9 | 14,5 | 18,4 | 17,7 | 16,3 | 16,5 | ||||||||||||||||||
| Non-monetary private sector |
19,1 | 19,5 | 18,2 | 18,3 | 17,8 | 18,5 | ||||||||||||||||||
| Rand-denominated debt |
79,6 | 77,6 | 77,6 | 77,4 | 76,0 | 67,9 | ||||||||||||||||||
| Debt securities |
44,1 | 41,6 | 41,1 | 39,4 | 38,8 | 34,5 | ||||||||||||||||||
| Other |
35,5 | 36,0 | 36,4 | 38,0 | 37,2 | 33,4 | ||||||||||||||||||
| Total foreign debt |
141,8 | 142,3 | 145,1 | 144,4 | 141,7 | 134,5 | ||||||||||||||||||
| As percentage of gross domestic product |
40,2 | 40,3 | 41,4 | 41,6 | 41,6 | 41,0 | ||||||||||||||||||
| As percentage of total export earnings |
120,3 | 121,2 | 124,0 | 124,7 | 123,9 | 121,8 | ||||||||||||||||||
The country’s rand-denominated foreign debt, expressed in US dollars, declined markedly from US$76,0 billion at the end of the second quarter of 2015 to US$67,9 billion at the end of the third quarter. This decrease could primarily be attributed to the depreciation in the exchange value of the rand against the US dollar. Relative to the country’s total external debt, rand-denominated debt decreased from 53,6 per cent at the end of the second quarter of 2015 to 50,5 per cent at the end of the third quarter.
|
|
Quarterly Bulletin March 2016 |
As a ratio of gross domestic product, South Africa’s external debt receded to 41,0 per cent at the end of September 2015, having trended higher for eight consecutive quarters. Despite having declined somewhat, the ratio still exceeded the average ratio of 39,7 per cent observed over the past eight quarters. The ratio of external debt to export earnings declined from 123,9 per cent at the end of the second quarter of 2015 to 121,8 per cent at the end of the third quarter.
Box 2 Recent credit ratings for long-term foreign currency-denominated debt in selected emerging-market economies
Fitch ratings agency downgraded South Africa’s long-term foreign currency-denominated debt ratings in December 2015 from BBB to BBB- with a stable outlook, while Standard & Poor’s (S&P) and Moody’s lowered their ratings outlook to negative. The downgrade by Fitch could be attributed to, among other factors, South Africa’s disappointing growth performance alongside a deterioration in the country’s growth potential, further delays in new electricity generation capacity which could constrain growth for another two years, and the sustained deficit on the current account of the balance of payments notwithstanding weak domestic demand and the sharp depreciation in the exchange rate of the rand.
Sovereign credit ratings of South Africa’s long-term foreign currency-denominated debt
| Moody’s | Standard & Poor’s | Fitch | ||||||
|
|
|
Aaa | AAA | AA | ||||
| Aa1 | AA | AA+ | ||||||
| Aa2 | AA | AA | ||||||
| Aa3 | AA- | AA- | ||||||
| A1 | A+ | A | ||||||
| A2 | A | A | ||||||
| A3 | A- | A- | ||||||
| Baa1 | BBB+ | BBB+ | ||||||
| Baa2 | BBB | BBB | ||||||
| Baa3 | BBB- | BBB- | ||||||
|
|
|
Ba1 | BB+ | BB+ | ||||
| Ba2 | BB | BB | ||||||
| Ba3 | BB- | BB- | ||||||
| B1 | B+ | B+ | ||||||
| B2 | B | B | ||||||
| B3 | B- | B- | ||||||
| Caa1 | CCC+ | CCC+ | ||||||
| Caa2 | CCC | CCC | ||||||
| Caa3 | CCC- | CCC- | ||||||
| Ca | CC | CC | ||||||
| C | C | C | ||||||
| D | D |


South Africa’s current credit ratings are highlighted in blue
The downgrade by Fitch could affect the cost of foreign currency-denominated bonds issued by South Africa in the form of higher coupon rates demanded by foreign investors. The South African government’s sovereign debt ratings are also used as benchmarks for other South African entities that need to venture into international financial market for funding.
Despite the recent downgrade by Fitch, all three major rating agencies still place South Africa’s long-term debt securities in the investment grade category. Moody’s rated South Africa two notches above speculative grade, while the other two agencies rated the country one notch above speculative grade. South Africa’s government has consistently been rated as investment grade since the year 2000.
| Quarterly Bulletin March 2016 |
|


| S&P | Moody’s | Fitch | ||||
| Brazil |
BB+ | Ba2 | BB+ | |||
| Chile |
AA- | Aa3 | A+ | |||
| China |
AA- | Aa3 | A+ | |||
| India |
BBB- | Baa3 | BBB- | |||
| Indonesia |
BB+ | Baa3 | BBB- | |||
| Mexico |
BBB+ | A3 | BBB+ | |||
| Poland |
BBB+ | A2 | A- | |||
| Portugal |
BB+ | Ba1 | BB+ | |||
| Russia |
BB+ | Ba1 | BBB- | |||
| South Africa |
BBB- | Baa2 | BBB- | |||
| South Korea |
AA- | Aa2 | AA- | |||
| Thailand |
BBB+ | Baa1 | BBB+ | |||
| Turkey |
BB+ | Baa3 | BBB- | |||
| Uruguay |
BBB | Baa2 | BBB- |
Source: countryeconomy.com
Following the downgrade by Fitch in December 2015, South Africa joined India, Russia, Turkey and Uruguay in the BBB- investment grade while it stood higher than Brazil and Portugal.
International investment position
South Africa’s net international investment position (assets minus liabilities) changed from a negative value of R131 billion at the end of June 2015 to a positive value of R113 billion at the end of September 2015 – marking the first positive net international investment position ever to be recorded since measurement of South Africa’s international investment position started at the end of 1956.
The market value of South Africa’s foreign liabilities (inward investment) declined from R5 174 billion at the end of June 2015 to R5 164 billion at the end of September, while the market value of South Africa’s foreign assets (outward investment) amounted to R5 276 billion at the end of September 2015 compared with R5 043 billion at the end of June. The volatility and decline in domestic and global equity markets as well as the marked depreciation in the exchange rate of the rand resulted in a modest decline in the market value of South Africa’s foreign liabilities and a substantial increase in the market value of the country’s foreign assets at the end of September 2015 compared with the end of June 2015.
As a ratio of South Africa’s GDP, the country’s foreign liabilities decreased from 132,7 per cent at the end of June 2015 to 131,0 per cent at the end of September; the country’s foreign assets rose from 129,4 per cent to 133,8 per cent over the same period. This brought the country’s net international investment position to a positive 2,9 per cent of GDP at the end of September 2015 compared with a negative ratio of 3,4 per cent at the end of June.
|
|
Quarterly Bulletin March 2016 |
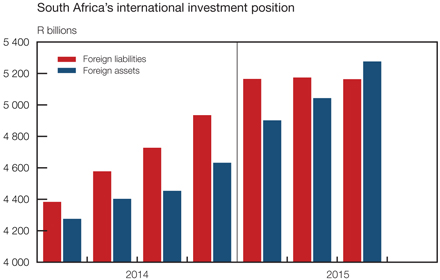
International reserves and liquidity
Despite the volatility in global financial markets, South Africa’s net international reserve position increased by R5,1 billion in the fourth quarter of 2015 – the first quarterly increase since the fourth quarter of 2014. Nonetheless, for 2015 as a whole, South Africa’s net international reserves declined by R9,1 billion compared with an increase of R16,6 billion in 2014. Measured in US dollars, the value of South Africa’s gross gold and other foreign reserves (i.e. the international reserves of the Bank before accounting for reserve-related liabilities) declined from US$46,1 billion at the end of September 2015 to US$45,8 billion at the end of December. The country’s gross reserves decreased further to US$45,1 billion at the end of January 2016. The level of import cover (i.e. the value of gross international reserves relative to the value of imports of goods and services and income payments) increased from 5,2 months at the end of September 2015 to 5,7 months at the end of December, partly reflecting lower import prices.
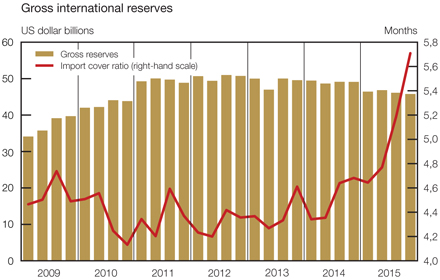
South Africa’s international liquidity position decreased from US$41,2 billion at the end of September 2015 to US$40,7 billion at the end of December before advancing to US$40,8 billion at the end of January 2016.
| Quarterly Bulletin March 2016 |
|


Reserve assets of selected countries
| 31 Dec 2012 US$ billions |
31 Dec 2015 US$ billions |
Percentage change |
||||||||||
| Argentina |
43,2 | 25,6 | -40,7 | |||||||||
| Brazil |
373,1 | 356,5 | -4,4 | |||||||||
| Chile |
41,6 | 38,6 | -7,2 | |||||||||
| China |
3 387,5 | 3 513,0 | 3,7 | |||||||||
| Hungary |
44,7 | 33,0 | -26,2 | |||||||||
| India |
300,4 | 350,4 | 16,6 | |||||||||
| Indonesia |
112,8 | 105,9 | -6,1 | |||||||||
| Malaysia |
139,7 | 95,3 | -31,8 | |||||||||
| Russia |
537,8 | 365,7 | -32,0 | |||||||||
| South Africa |
50,7 | 45,8 | -9,8 | |||||||||
| Turkey |
119,2 | 116,5 | -2,3 | |||||||||
The table above shows the level of reserve assets of selected countries and the percentage change in the levels from end of 2012 to end of 2015. The accumulation of reserve assets by especially emerging-market countries stalled and reversed between 2014 and 2015, weighed down by the sustained decline in commodity prices, the anticipated normalisation of US monetary policy, and the continued restructuring of the Chinese economy. Although South Africa is among the four countries with the lowest level of reserve assets, as depicted in the table above, the relative decline in the country’s reserve assets was not as significant, partly as a result of the Bank’s policy to refrain from intervening in the market for foreign exchange. The reserve assets of Argentina and Hungary decreased by 40,7 per cent and 26,2 per cent respectively while those of South Africa shrank by 9,8 per cent.
Box 3 The SDR basket – composition and size
The Special Drawing Right, or SDR, is an international reserve asset, created by the International Monetary Fund (IMF) in 1969 to supplement member countries’ official reserves. Its value is currently based on a basket of four major currencies: the US dollar, euro, Japanese yen, and pound sterling. A review of the SDR basket is conducted every five years by the IMF’s Executive Board; this could be commissioned earlier if warranted by circumstances. The purpose of the review is to ensure that the SDR basket reflects the relative importance of major currencies in the world’s trading and financial systems, with a view to enhancing the SDR’s attractiveness as a reserve asset.
At its November 2015 review, the IMF Executive Board decided to include the Chinese renminbi in the SDR basket as a fifth currency, effective 1 October 2016, since it considered the renminbi to have met the existing criteria for SDR basket inclusion. As the world’s third-largest exporter (in the past five years), China met the first inclusion criterion. The IMF also determined that, effective 1 October 2016, the renminbi would be freely usable, thus meeting the second criterion for basket inclusion. Despite its recent slowdown, the Chinese economy has grown considerably over the past few decades, increasing the importance of the renminbi in the international financial markets. Certain central banks around the world have already begun to include the renminbi in their portfolios as part of their diversification strategy in the management of their international reserves.
The IMF adopted a new formula for determining currency weights in the SDR basket to address the long-recognised issues with the formula that had been in place since 1978. The new formula assigns equal shares to the currency issuer’s exports and a composite financial indicator. The following weights, based on the new formula, will be used to determine the amounts of each of the five currencies in the new SDR basket that will take effect on 1 October 2016:
| • | US dollar: 41,73 per cent (41,9 per cent in 2010); |
| • | euro: 30,93 per cent (37,4 per cent in 2010); |
| • | Chinese renminbi: 10,92 per cent (new); |
| • | Japanese yen: 8,33 per cent (9,4 per cent in 2010); and |
| • | pound sterling: 8,09 per cent (11,3 per cent in 2010). |
|
|
Quarterly Bulletin March 2016 |
Until the implementation of the new SDR basket on 1 October 2016, the current SDR basket and valuation will continue to consist of four currencies and their respective weights at the time of the 2010 review will still be applicable.
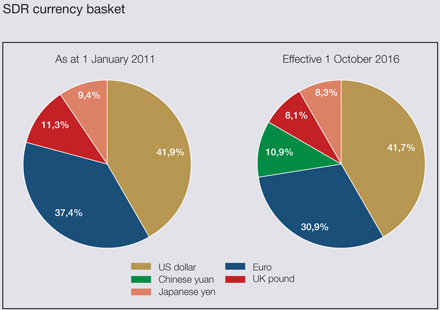
Exchange rates
The South African rand depreciated sharply against most major currencies in the fourth quarter of 2015 as both global and domestic developments negatively affected the currency. Whereas the weighted average exchange rate of the rand increased, on balance, marginally by 0,2 per cent in October 2015, it declined by 2,1 per cent and 8,3 per cent in November and December respectively. On balance, the nominal effective exchange rate of the rand declined by 10,0 per cent in the fourth quarter of 2015 compared with a decline of 9,0 per cent in the third quarter. The weighted exchange rate of the rand declined by no less than 19,7 per cent from 31 December 2014 to 31 December 2015, the sharpest fall since the 23,5 per cent decline in 2008.
Like the currencies of many other emerging-market economies, the performance of the rand was affected by the normalisation of US monetary policy, declining international commodity prices as well as concerns about global economic growth. Domestic factors – such as sluggish economic growth, a widening of the current-account deficit, concerns regarding the sustainability of the fiscal projections as well as multi-year low business and consumer confidence levels – negatively affected the performance of the domestic currency in especially the second half of 2015. The rand was one of the world’s worst-performing currencies in 2015.
| Quarterly Bulletin March 2016 |
|


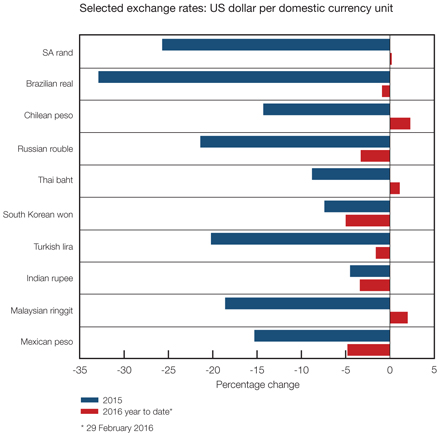
In January 2016, the South African rand continued its downward trend, weighed down by a strong US dollar and lingering concerns about the outlook for the Chinese economy. The US dollar was supported by solid US labour market data, which may justify further tightening of policy rates by the Fed. By contrast, the growth projections for South Africa were revised further downwards by the IMF in its January 2016 World Economic Outlook (WEO), adding to the pressure on the rand. The rand stabilised somewhat in February 2016, depreciating by only 0,3 per cent against the dollar from the end of January.
Exchange rates of the rand
Percentage change
| 31 Mar 2015 to 30 Jun 2015 |
30 Jun 2015 to 30 Sep 2015 |
30 Sep 2015 to 31 Dec 2015 |
31 Dec 2015 to 29 Feb 2016 |
|||||||||||||
| Weighted average* |
-1,8 | -9,0 | -10,0 | -2,9 | ||||||||||||
| Euro |
-4,1 | -11,8 | -8,8 | -3,6 | ||||||||||||
| US dollar |
-0,3 | -11,4 | -11,3 | -3,5 | ||||||||||||
| Chinese yuan |
-0,3 | -9,2 | -9,4 | -2,7 | ||||||||||||
| British pound |
-6,3 | -7,9 | -9,5 | 3,2 | ||||||||||||
| Japanese yen |
1,4 | -12,9 | -11,1 | -9,4 | ||||||||||||
| * | Against a basket of 20 currencies |
|
|
Quarterly Bulletin March 2016 |
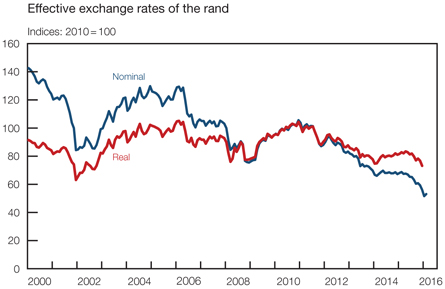
While the rand reached all-time lows against most major currencies on a nominal basis in December 2015, the real effective exchange rate of the rand also edged lower, but without matching the all-time low recorded in 2001. Although the current exchange value of the rand is supportive of domestic-export growth, the probability of higher domestic input costs and slower economic growth in South Africa’s main export trading-partner countries may erode potential gains from the depreciation in the domestic currency.
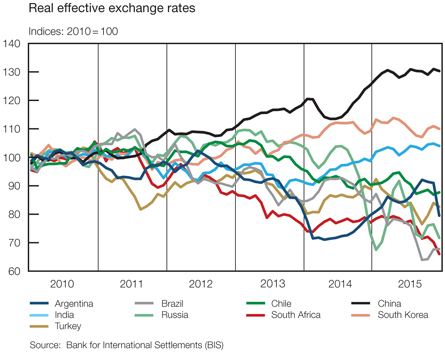
The graph above indicates the significant declines in the real effective exchange rates of a number of emerging-market currencies over the past five years. All the countries – with the exception of China, India and South Korea registered visible increases in their external competiveness since 2010. The rand tracked the Brazilian real for most of 2015 after it had trailed the Argentinian peso in 2014.
| Quarterly Bulletin March 2016 |
|


Turnover in the South African foreign-exchange market
The net average daily turnover in the South African foreign-exchange market decreased by 7,7 per cent from US$21,8 billion in the third quarter of 2015 to US$20,1 billion in the final quarter. The net average daily turnover in the fourth quarter was 16,4 per cent lower compared with the level recorded in the final quarter of 2014.
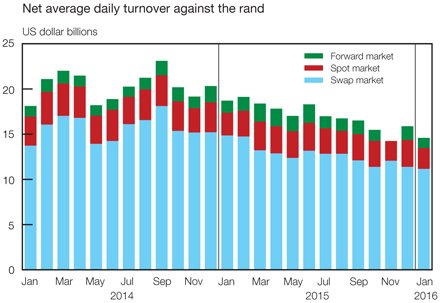
In the rand foreign-exchange market, net average daily turnover declined by 6,8 per cent from US$16,7 billion in the third quarter of 2015 to US$15,6 billion in the fourth quarter, as transactions in the swap market decreased by 7,8 per cent from US$12,6 billion to US$11,6 billion per day. This may be ascribed to the sale of debt securities by non-residents during the fourth quarter of 2015. Over the same period, transactions in the forward market decreased from US$1,4 billion to US$1,3 billion while transactions in the spot market remained steady at US$2,7 billion per day.
|
|
Quarterly Bulletin March 2016 |
Monetary developments, interest rates and financial markets
Structural and regulatory issues in 2015 and early 2016
The banking sector remained sound and profitable in 2015 amid a challenging macroeconomic environment, tighter regulatory conditions, and consumers strained by elevated debt levels. Overall, capital adequacy ratios remained well above the minimum regulatory capital requirements throughout the period. While the quality of bank assets remained healthy, the level of impaired advances started to edge marginally higher in 2015 after a four-year downward trend. Alongside a sovereign rating downgrade of the country, four major South African banks were downgraded by one notch by an international rating agency during the year, potentially impacting on the banking sector’s cost of funding and access to liquidity.
The four largest banks, which collectively account for 83 per cent of the total assets of the domestic banking sector, continued to dominate the South African banking sector. In January 2016 there were 34 banking institutions registered in South Africa, one more than in 2015, while the number of foreign banks with approved representative offices in South Africa declined to 38, down from 40 in January 2015.
Size of the South African private banking sector
| January 2015 | January 2016 | |||||||||||||||
| Number of institutions |
Total assets (R billions) |
Number of institutions |
Total assets (R billions) |
|||||||||||||
| Locally-controlled banks |
10 | 3 154 | 10 | 3 561 | ||||||||||||
| Foreign-controlled banks |
6 | 863 | 6 | 958 | ||||||||||||
| Mutual banks |
3 | 3 | 3 | 3 | ||||||||||||
| South African branches of foreign banks |
14 | 266 | 15 | 331 | ||||||||||||
| Total registered banks |
33 | 4 286 | 34 | 4 855 | ||||||||||||
After having been placed under curatorship in 2014, African Bank Limited subsequently received approval from the South African Reserve Bank and the Financial Services Board (FSB) to set up a new bank with its remaining good assets. African Bank is currently awaiting consent to restructure from the Minister of Finance and plans to commence operations of the new business in April 2016.
After a moderate revival in 2014, the capital market funding activity of the banking sector continued to accelerate in 2015. The total outstanding value of domestic bonds and commercial paper issued by the domestic banking sector increased by R33,1 billion in 2015 to R305,2 billion, compared with an increase of R25,3 billion recorded in 2014. The banking sector continued to gradually reduce its reliance on, and improve the term profile of, institutional funding as banks shifted their focus towards the implementation of the Basel III Net Stable Funding Ratio (NSFR) framework in 2018. The share of institutional funding in total bank funding declined from a high of 40 per cent in 2010 to 35 per cent in 2015, while the share of short-term debt within institutional funding receded from a peak of 63 per cent in 2008 to 57 per cent in 2015.
Following some revisions and updates to the NSFR standard in October 2014, the Basel Committee on Banking Supervision released the NSFR disclosure standards in June 2015. These standards, similar to the Liquidity Coverage Ratio (LCR) disclosure framework, form an essential component of the set of reforms introduced by Basel III and will assist in increasing banks’ resilience to liquidity shocks, promoting a more stable funding profile and enhancing overall liquidity risk management. Banks will have to comply with these disclosure requirements from the date of their first reporting period after 1 January 2018.
| Quarterly Bulletin March 2016 |
|


During the course of 2015, banks continued with the gradual build-up of high-quality liquid assets to ensure compliance with the phasing in of the LCR, which became effective on 1 January 2015. The LCR requires banks to hold an adequate stock of high-quality liquid assets to provide for a 30-calendar-day liquidity stress scenario. Banks were required to meet an LCR requirement of 60 per cent from January 2015; the requirement rose to 70 per cent from January 2016 and will progressively rise to 100 per cent as from 1 January 2019.
Banks continued to grow their customer base by providing competitive and innovative banking products and by expanding their branch networks and automated teller machine (ATM) footprint. The total number of bank branches and ATMs increased significantly since 2004, in line with the Financial Sector Charter commitment to make banking services more accessible to all South Africans. However, the South African banking sector appears to lag behind most of its peers in the upper-middle-income countries when measured in terms of branch network penetration per 100 000 adults, but outperforms most of these countries in terms of the number of ATMs per 100 000 adults.
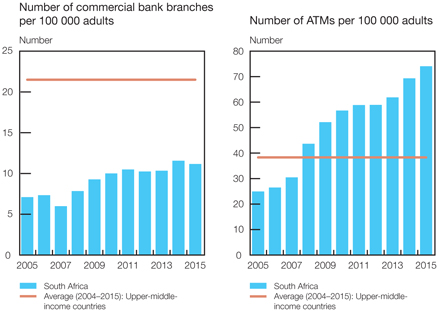
Regulations for Affordability Assessment, as part of the revisions to the National Credit Regulations, were implemented in September 2015. The criteria therein stipulate certain norms for minimum living expenses per income category and are intended to address the underlying weaknesses in affordability assessments and to help combat reckless lending and borrowing. The regulations require credit providers to ensure that the consumer has sufficient income available to fund the proposed credit instalment. Amounts to be deducted from gross income include statutory deductions such as income tax and unemployment insurance contributions, maintenance payments as well as all other committed payment obligations and debt, including such obligations as may appear from the credit applicant’s credit records as held by any credit bureau. After the above-mentioned subtractions, the amount available to the consumer from his/her income must be enough to service the new debt being applied for and he/she must still have enough left to cover the stipulated necessary expense norm.
|
|
Quarterly Bulletin March 2016 |
Necessary expense norms
| Monthly gross income |
Minimum monthly fixed factor for living expenses |
Monthly fixed factor + percentage of income above band minimum |
||||||||||
| Minimum R | Maximum R | R | Per cent | |||||||||
| 0,00 | 800,00 | 0,00 | 100,00 | |||||||||
| 800,01 | 6 250,00 | 800,00 | 6,75 | |||||||||
| 6 250,01 | 25 000,00 | 1 541,67 | 9,00 | |||||||||
| 25 000,01 | 50 000,00 | 3 375,00 | 8,20 | |||||||||
| 50 000,01 | Unlimited | 5 425,00 | 6,75 | |||||||||
On 6 November 2015, the Department of Trade and Industry (DTI) announced the publication of new Regulations on Review of Limitations on Fees and Interest Rates. The revised regulations will come into effect on 6 May 2016 and stipulate revisions to the maximum prescribed interest rate by type of credit. The regulations also include changes to the maximum initiation and service fees for credit agreements. The table below shows the previous maximum prescribed interest rate and the new maximum prescribed interest rate for each sub-sector.
Changes to maximum prescribed interest rates, applicable from 6 May 2016
| Credit type |
Maximum prescribed rate from June 2007 |
At repurchase rate of 6,75% |
Revised maximum prescribed rate from May 2016 |
At repurchase rate of 6,75% |
||||||||
| Mortgage agreements |
[(RRx2,2)+5%] per year |
19,85 | RR + 12% | 18,75 | ||||||||
| Credit facilities |
[(RRx2,2)+10%] per year |
24,85 | RR + 14% | 20,75 | ||||||||
| Unsecured credit transactions |
[(RRx2,2)+20%] per year |
34,85 | RR + 21% | 27,75 | ||||||||
| Developmental credit agreements for the development of small business and low-income housing |
[(RRx2,2)+20%] per year |
34,85 | RR + 27% | 33,75 | ||||||||
| Short-term credit transactions |
5% per month | |||||||||||
| on 1st loan, | ||||||||||||
| 3% on subsequent | 1st = 60,00 | |||||||||||
| 5% per month | 60,00 | loans within calendar year |
2nd = 36,00 | |||||||||
| Other credit agreements |
[(RRx2,2)+10%] per year |
24,85 | RR + 17% | 23,75 | ||||||||
| Incidental credit agreements |
2% per month | 24,00 | 2% per month | 24,00 | ||||||||
RR = repurchase rate
The DTI released the draft credit life insurance regulations on 13 November 2015. The suggested revisions include a reduction in the monthly credit life insurance charges paid by consumers to credit providers to no more than R4,50 per R1 000 on credit facilities and unsecured credit transactions, and no more than R2,00 per R1 000 on mortgage agreements. The proposed caps include the cost of any commission fees and/or expenses incurred, and are to be calculated on the total outstanding obligations as opposed to the original loan amount.
| Quarterly Bulletin March 2016 |
|


On 27 October 2015, the National Treasury tabled the Financial Sector Regulation Bill as part of the final phase towards implementing the Twin Peaks system. The bill is to be considered by Parliament’s Standing Committee on Finance and will invite public comments prior to the enactment of the bill, which is anticipated to be in late 2016. The Twin Peaks structure is aimed at harmonising South Africa’s financial regulatory landscape. Under the Twin Peaks model, two regulators will be established: a Prudential Authority within the South African Reserve Bank and a Financial Sector Conduct Authority (FSCA). The Prudential Authority will oversee the safety and soundness of financial institutions while the FSCA will supervise how financial services firms conduct their business and treat customers. The Bank will oversee financial stability within a policy framework agreed with the Minister of Finance.
In October 2015, the Bank and the FSB unveiled a Draft Code of Conduct for the South African Over-the-Counter Markets with the aim to align the level of compliance with international best practice and to enhance the transparency, efficiency and integrity of the financial markets. The code is applicable to the following over-the-counter financial markets: money and interest rate markets, spot and forward foreign exchange markets, commodities markets, markets for unlisted bonds, and derivative products.
In order to boost liquidity, trade and investment, the Bank on 10 April 2015, signed a three-year bilateral currency swap agreement with the People’s Bank of China for the exchange of local currencies between the two central banks of up to R57 billion, or CNY30 billion. The agreement will ensure greater financial market stability should short-term balance-of-payments pressures be experienced. The bilateral swap line could also be used to provide liquidity to domestic users of foreign currency in cases of liquidity shortages.
According to the Global Competitiveness Report 2015-2016, South Africa’s financial market development remains impressive, ranking first out of 140 economies for financing through the local equity market and second for the regulation of securities exchanges. To maintain a competitive edge, the JSE continued to improve and extend its services during 2015 and early 2016.
In April 2015, the JSE announced a new swap futures licensing partnership with Eris Exchange (Eris), a US-based futures exchange group. Based on the Johannesburg Interbank Average Rate and denominated in South African rand, the JSE Eris Interest Rate Swap futures were launched in August 2015. While based on the Eris methodology, the newly launched product follows the standard South African swap market conventions, offering cash flows of interest rate swaps in a capital-efficient futures form.
The National Treasury, the SARB and the FSB published a second draft of the regulations under the Financial Markets Act 19 of 2012 (FMA) in June 2015. This followed a first-round review in July 2014. The draft regulations support the objectives of the FMA and South Africa’s commitment to the Group of Twenty (G-20) in terms of regulatory reforms for over-the-counter (OTC) derivatives markets. The second set of draft regulations makes provision for, among other things, market arrangements such as central counterparties to be licensed and supervised to perform the functions and duties specified under the FMA. It furthermore provides for external market participants to enter the South African financial markets and in particular proposes a recognition framework for external participants, and makes provision for transitional arrangements to allow market participants to comply with the proposed requirements in the draft regulations. Furthermore, the FSB published the tenth progress report on the implementation of OTC derivatives market reforms in November 2015.
Subsequent to the FSB’s change in policy in relation to the regulation of all providers of OTC share trading platforms, the JSE made amendments to the JSE Listings Requirements in July 2015 to allow trading in Black Economic Empowerment (BEE) securities on the BEE Segment via the use of a verification agent, in addition to the current BEE contract route. Consequently, two companies moved from OTC trading to a listing on the JSE’s BEE Segment in the final months of 2015. These listings will provide shareholders with regulatory certainty, more liquidity, and transparent price discovery.
|
|
Quarterly Bulletin March 2016 |
As announced in the 2015 Budget Review, the National Treasury issued three new bonds in 2015 to broaden funding options. The I2033 inflation-linked bond maturing on 28 February 2033 and the R2035 fixed-rate bond maturing on 28 February 2035 were both issued in July 2015, while the R2040 fixed-rate bond maturing on 31 January 2040 was issued in September.
During August 2015, the JSE announced that there were discussions underway between market participants in Kenya, Nigeria and South Africa to launch the cross-listing of Exchange Traded Funds (ETFs). By cross-listing ETFs on African exchanges, investors will gain exposure to liquid company shares and provide domestic investors with access to opportunities from other markets in the cost-effective form of an ETF. The cross-listing of ETFs will also improve the liquidity of Africa’s largest stock exchanges.
While Share Transactions Totally Electronic (Strate) has been the only central securities depository since its inception in 1999, the FSB in August 2015 granted a financial market infrastructure licence to a second institution to operate as a depository. The licence mandate is for bonds and money-market instruments, and the new entrant plans to be operational during the course of 2016.
In order to strengthen the development of a strategic partnership, the JSE and the Stock Exchange of Mauritius signed a memorandum of understanding (MoU) in September 2015. The MoU serves to promote knowledge sharing and the development of the South African and Mauritian capital markets.
In October 2015, Strate implemented a new solution to process equity corporate action payments via the South African Multiple Options System (SAMOS) of the SARB. The new initiative improves liquidity management, mitigates certain risks in the market, and provides numerous benefits, including improved cash flows, greater stability within the financial market, and better efficiencies within the payment process. Strate was also in the process of modernising the market infrastructure for its money-market, bond and equity depository operations with a software suite streamlining its service across all asset classes as the three systems are consolidated into one. In February 2016 Strate implemented the new system for the settlement of money-market securities.
During October 2015, the JSE, in collaboration with FTSE Russell (a global index provider), launched the FTSE/JSE Responsible Investment Index Series, which replaced the JSE’s Socially Responsible Investment Index that had been developed in 2004. The new index series offers a methodology that encourages transparency by companies on environmental, social and governance (ESG) considerations. Concurrently, the JSE adopted the FTSE ESG ratings methodology. The FTSE/JSE Responsible Investment Index Series comprises all eligible companies that attain an FTSE ESG rating of 2 or above.
The largest prime standard listing in Germany during 2015 occurred when a South African-based international furniture retailer listed on the Frankfurt Stock Exchange in December 2015. The company will henceforth have a secondary listing on the JSE.
The International Finance Corporation (IFC), a member of the World Bank Group, issued a JSE-listed R1 billion nine-year green bond in December 2015. The IFC is the first multilateral organisation to list a green bond on the JSE and the fourth institution to list such a bond with the objective of raising funds for energy efficiency and renewable energy projects.
Major regulatory measures to protect and strengthen the South African financial system and the health of non-bank financial institutions were published in 2015 and early 2016. Although the implementation of these changes is expected to enhance financial stability, support consumer protection, and improve household savings, it is likely they will have a significant influence on the intermediation of funds in the economy.
The economic impact study report released by the FSB in February 2015 showed that the Solvency Assessment and Management (SAM) regime for insurers is likely to lead to better risk management, a more stable financial sector, and improved policyholder protection, although with some cost implications. The implementation timeline of the SAM framework has been revised to January 2017 to accommodate the legislative timelines for the Financial Sector Regulation Bill and Insurance Bill.
| Quarterly Bulletin March 2016 |
|


According to a circular released by the FSB, the business of hedge funds will be regulated under the Collective Investment Schemes Control Act 45 of 2002 (CISCA) from 1 April 2015. The use of this regulation will provide investors in hedge funds with better protection, assist in the monitoring and managing of systemic risk to the financial services industry, enhance the integrity and transparency of the hedge fund industry, and promote the development of financial markets. The guidance note on the implementation and interpretation of the registration of hedge funds under the CISCA was released in September 2015.
In July 2015, the FSB issued a Board Notice on the capital requirements that a manager of a collective investment scheme in participation bonds must comply with under the CISCA. Among other things, the notice states that the capital to be maintained by a manager of a collective investment scheme in participation bonds must be calculated in relation to the financial statements prepared in terms of the International Financial Reporting Standards (IFRS).
Also in July 2015, the National Treasury released draft regulations and a related explanatory memorandum on implementing retirement reforms, with the aim of lowering charges and improving market conduct in the retirement industry. Retirement funds will be required to operate a set of default policies that rebalance the interests of fund members and service provides once the draft regulations are adopted. The draft default regulations were published in terms of section 36(1)(c) of the Pension Funds Act 24 of 1956.
The National Treasury, the SARB and the FSB published a discussion document in August 2015 titled Strengthening South Africa’s Resolution Framework for Financial Institutions. The document outlines how the framework for designated resolution institutions will apply to banks, but emphasises that further work will be undertaken to develop proposals on applying the special resolution framework to non-bank financial institutions.
The Taxation Laws Amendment Act 25 of 2015 (TLAA) was signed into law in January 2016 and took effect on 1 March 2016. It aims to harmonise and simplify the taxation of retirement fund contributions and benefits. For individual taxpayers who contribute towards retirement funds (pension, provident and retirement annuity funds), the legislation allows for a tax deduction of 27,5 per cent of the greater of taxable remuneration or income, subject to a maximum of R350 000 per year. Similarly, the minimum threshold for annuitisation for pension and retirement annuity funds was increased from R75 000 to R247 500. The annuitisation for provident funds was postponed to March 2018.
In January 2016, the Minister of Finance tabled the Insurance Laws Amendment Bill 2015 in Parliament. The Bill provides a framework for the prudential supervision of the insurance sector which is consistent with international standards for insurance supervision and regulation. The Bill also deals with the regulatory gaps identified by the Financial Sector Assessment Programme of the IMF and the World Bank. These gaps include enhancing financial soundness and oversight, increasing access to insurance through a micro-insurance framework, and strengthening governance, risk management and internal controls for insurers. Furthermore, parts of the existing Long-term Insurance Act 52 of 1998 and Short-term Insurance Act 53 of 1998 that relate to the prudential supervision of insurers will be replaced by this Bill. These changes are part of a broader shift towards the Twin Peaks model of financial regulation.
Money supply
Growth in the broadly defined money supply (M3) accelerated in the second half of 2015, registering double-digit increases for the first time since March 2009. After initially trending sideways at around 8 per cent in the early months of 2015, year-on-year growth in M3 rebounded to 10,2 per cent in July and maintained the firm growth to end the year on a post-recession high rate of 10,5 per cent in December. It was especially growth in the deposit holdings of non-financial companies that picked up pace during the course of 2015. Deposits of the household
|
|
Quarterly Bulletin March 2016 |
sector maintained firm growth over the past two years while growth in the deposit holdings of financial companies lagged somewhat. For 2015 as a whole, growth in M3 averaged 8,8 per cent, exceeding the average growth rate of 5,1 per cent in nominal GDP over the same period. In January 2016, growth over twelve months in M3 amounted to 10,3 per cent. Factors that probably contributed to the recent acceleration in deposit growth include:
| • | increased returns on interest-bearing deposits in an environment of rising interest rates; |
| • | a build-up of precautionary and speculative balances in the wake of volatile financial markets; |
| • | the redemption of the R158 government bond during the third quarter of 2015, which temporarily boosted private-sector deposit holdings; |
| • | an increase in tax-free savings accounts initiated by government and marketed by financial intermediaries; and |
| • | the upward revaluation of the relatively small amount of M3 deposits that is denominated in foreign currency, following the depreciation of the rand. |
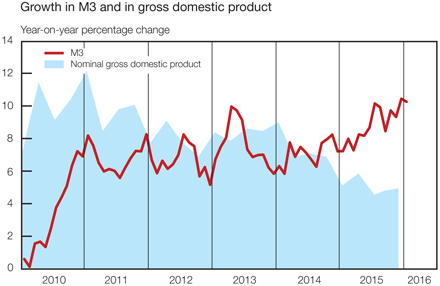
The income velocity of circulation of M3 declined steadily from 1,44 in the fourth quarter of 2014 to 1,38 in the fourth quarter of 2015. Growth in M3 exceeded that of nominal GDP since the fourth quarter of 2014, indicative of the ample supply of money within the relatively constrained economic environment.
Overall, M3 grew by R282 billion in 2015, exceeding growth in 2014 by a healthy margin. The corporate sector accounted for 59 per cent of the total increase, mainly through the strong rise in the deposit holdings of non-financial corporates. Year-on-year growth in the deposit holdings of non-financial companies increased steadily from 7,5 per cent in January 2015 to a recent high of 13,1 per cent in October. It moderated thereafter to 12,6 per cent in January 2016. Growth in the deposit holdings of financial companies also accelerated but did not reach double-digit rates. The pace of increase in their deposit holdings picked up from 3,8 per cent in January 2015 to 7,5 per cent in August before moderating to 6,4 per cent in January 2016. The deposit holdings of the household sector maintained relatively robust twelve-month growth rates in 2015, reaching a high of 14,0 per cent in July 2015, the most rapid increase since January 2009. Growth in the deposits of the household sector remained elevated throughout 2015 but receded somewhat to 12,9 per cent in January 2016. The rising interest rate cycle, coupled with the introduction of tax-free savings accounts championed by the National Treasury to encourage savings by individuals, as well as the current market instability probably contributed to the rise in deposit holdings at the monetary sector in 2015.
| Quarterly Bulletin March 2016 |
|


M3 holdings of households and companies
| Year-on-year change (R billions) |
Percentage of total M3 deposit holdings |
|||||||||||||||||||||||
| 2013 | 2014 | 2015 | 2013 | 2014 | 2015 | |||||||||||||||||||
| Households |
62,0 | 95,1 | 114,6 | 29,7 | 31,2 | 32,1 | ||||||||||||||||||
| Companies |
76,8 | 86,5 | 167,4 | 70,3 | 68,8 | 67,9 | ||||||||||||||||||
| Financial |
29,8 | 36,7 | 75,6 | 40,0 | 38,7 | 37,6 | ||||||||||||||||||
| Non-financial |
47,1 | 49,8 | 91,8 | 30,3 | 30,1 | 30,3 | ||||||||||||||||||
| Total M3 deposits |
138,8 | 181,6 | 282,0 | 100,0 | 100,0 | 100,0 | ||||||||||||||||||
In a statistical sense, growth in claims on the private sector and net foreign assets were the main contributors to growth in M3 during the fourth quarter of 2015. This trend was partly offset by a decline in net other assets and net claims on the government sector. The growth in claims on the private sector occurred mostly on the back of increased loans and advances to especially the corporate sector. The sharp depreciation in the exchange value of the rand in December 2015 contributed to a strong rise in the gold and foreign exchange assets of the monetary sector, which exceeded the rise in the sector’s foreign liabilities. The revaluation effect on foreign assets was balanced through a rise in other domestic liabilities, which contributed to the decline in the net other assets of the monetary sector. The decline in net claims against the government sector was brought about by a rise in government deposits with the banking sector.
Statistical counterparts of change in M3
R billions
| 2015 | ||||||||||||||||||||
| 1st qr | 2nd qr | 3rd qr | 4th qr | Year | ||||||||||||||||
| Net foreign assets |
15,8 | 78,4 | 48,6 | 47,4 | 190,2 | |||||||||||||||
| Net claims on the government sector |
8,0 | -3,3 | 40,9 | -13,1 | 32,4 | |||||||||||||||
| Claims on the private sector |
109,4 | 23,4 | 65,7 | 87,5 | 285,9 | |||||||||||||||
| Net other assets and liabilities |
-47,0 | -16,9 | -85,3 | -77,5 | -226,6 | |||||||||||||||
| Total change in M3 |
86,2 | 81,7 | 69,8 | 44,3 | 282,0 | |||||||||||||||
Conventionally, the focus in South Africa is on M3, which amounted to R2 976 billion at the end of December 2015. Because of the highly liquid nature of investments in money-market unit trusts, it is common practice internationally to regard such funds as part of a wider definition of money supply. To calculate such an expanded monetary aggregate, M4, investments by the public in money-market unit trusts are added to M3 after subtracting the deposits of money-market unit trusts with banks that are already included in M3. In December 2015, this expanded the stock of money by R120 billion (whereas the total market value of the net assets of money-market funds amounted to R257 billion). The global liquidity crunch experienced by money-market mutual funds had a pronounced impact during the 2008 global financial crisis. However, in South Africa the impact of money-market unit trusts is relatively small, with year-on-year growth in M4 fluctuating at rates fairly close to those of M3, as illustrated in the graph on the next page.
|
|
Quarterly Bulletin March 2016 |
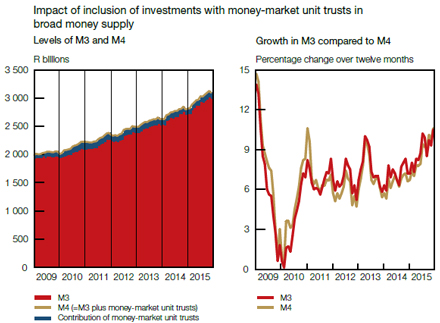
Growth in M4 initially exceeded that of M3 after the global financial crisis but fell back from mid-2011 to 2012 following an outflow of funds which could probably be attributed to:
| • | the low returns offered by money-market instruments; |
| • | the re-allocation of funds to multi-asset allocation portfolios by retail investors; and |
| • | heightened net selling by corporates due to the repositioning of funds previously ring-fenced for developmental projects and other investments. |
Money-market unit trusts also experienced a setback to their asset value and an outflow of funds in late 2014 after the write-down of African Bank Limited debt securities. However, net sales of units recovered somewhat from June 2015. Subsequently, year-on-year growth in M4 amounted to 10,6 per cent in December 2015, marginally exceeding the rate of increase of 10,5 per cent recorded by M3.
Credit extension
Following a gradual recovery from a nadir of -1,6 per cent in November 2009, year-on-year growth in bank credit extended to the private sector rebounded to around 8 per cent in 2012 and hovered around that level during the four-year period up to 2015. Growth accordingly remained well below the double-digit rates recorded in the years preceding the global financial crisis. Despite a challenging business environment over the past two years, credit demand by the corporate sector has been strong, contributing more than 70 per cent to the growth in total loans and advances. By contrast, growth in the uptake of bank credit by households has been lacklustre over the same period as consumers faced rising interest rates and tighter credit conditions.
Apart from rising interest rates, factors impacting on the demand for credit included, among other things, high levels of unemployment, weaker domestic economic growth and prospects, negative wealth effects stemming from weak growth in property and other asset prices, and stricter credit regulations. Following a slight recovery in consumer confidence in the third quarter of 2015, consumer optimism plunged in the fourth quarter on account of, among other things, drought conditions in large parts of the country, rising interest rates, the depreciation of the exchange rate of the rand, and poor job creation. In addition, business confidence declined further in the fourth quarter of 2015 and is now at its lowest level in five years, mainly due to sharp declines in confidence among new vehicle dealers and building contractors.
| Quarterly Bulletin March 2016 |
|


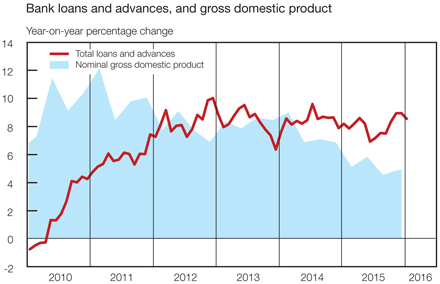
With the growth in nominal GDP trending lower and that of total loans and advances fluctuating sideways, the ratio of credit to GDP rose during 2015. However, the stable and benign trend in growth in total loans and advances masked the marked divergence in growth in credit uptake between households and companies. Growth in credit to households trended lower over the past two years while the healthy credit demand by the corporate sector suggests that corporates in certain subsectors are attracted by domestic long-term growth prospects while also pursuing cross-border investment opportunities.
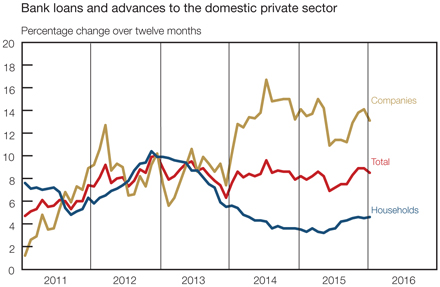
Total loans and advances increased by R235,4 billion in 2015, up from R192,2 billion in 2014. The strongest growth occurred in the first quarter of 2015 when it amounted to R97,6 billion, the highest quarterly increase since 2008. The growth momentum thereafter slowed somewhat in the second quarter of 2015 due to a contraction in general loans to the corporate sector. Corporate demand for general loans, however, rebounded in the second half of 2015 and, together with continued growth in mortgage advances, supported the overall expansion in credit extension. As a result, the quarter-to-quarter seasonally adjusted and annualised growth in total loans and advances to the private sector accelerated from 5,9 per cent in the third quarter of 2015 to 11,2 per cent in the fourth quarter.
|
|
Quarterly Bulletin March 2016 |
Other loans and advances – consisting of general loans, bank overdrafts and credit card advances – maintained the role of dominant driver of credit extension during 2014 and 2015. Growth in the asset-backed credit categories edged higher during the course of 2014 and 2015, mostly dominated by demand for loans on commercial property, while mortgage loans on residential property also started to edge higher during the course of 2015. After the short-lived contraction in the second quarter of 2015, the category of other loans and advances rebounded in the second half of the year, characterised by credit demand from non-financial companies. Subsequently, year-on-year growth in the category of other loans and advances improved from 9,8 per cent in June 2015 to 13,6 per cent in December and 12,7 per cent in January 2016.
After a substantial slowdown in 2014, twelve-month growth in general loans to the household sector gradually started to edge higher from early 2015, rising from 2,9 per cent in April 2015 to 7,7 per cent in January 2016, reflecting a moderate improvement in the demand for credit. Nonetheless, these growth rates remained low when compared to the rates in excess of 30 per cent recorded in 2011 and 2012. Downbeat employment prospects, a high debt stock alongside rising interest rates, tighter lending standards, and stricter credit regulations remain impediments to the uptake of general loans by households.
Mortgage advances recorded an annual increase of R71,3 billion in 2015, nearly 50 per cent up from the increase of R48,0 billion in 2014. This followed an extended period in 2012 and 2013 when twelve-month growth in mortgage advances hovered around 2 per cent. Growth started improving from early 2014 to reach 6,2 per cent in December 2015 and 6,0 per cent in January 2016. The upbeat growth in mortgage advances over the past two years has been skewed towards commercial property, with growth in mortgage advances on residential property gaining pace at a more subdued rate. Rising interest rates and the modest expansion in property prices probably contributed to the slow uptake of residential mortgage advances. The higher cost of funding for banks caused a clean break with the favourable pre-recession loan-to-value settings and the associated predominant pricing of mortgage loans at levels well below the prime lending rate.
The rate of expansion in instalment sale credit and leasing finance, which mainly represents the financing of new and second-hand vehicles, has been slowing rapidly over the past two years, with growth moderating into single-digit territory from the second half of 2014. Growth over twelve months slowed notably from a recent high of 14,2 per cent in October 2013 to 3,4 per cent in December 2015 and 3,5 per cent in January 2016 due to the persistent slowdown in vehicle sales. The declining growth trend is expected to continue over the medium term given the impact of exchange rate depreciation on domestic vehicle prices and high levels of consumer debt which continue to weigh on demand.
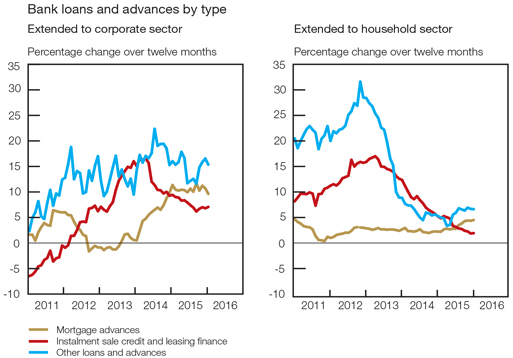
| Quarterly Bulletin March 2016 |
|


After relatively robust growth in 2014, the corporate sector’s reliance on bank-intermediated funding moderated somewhat in 2015. From a recent high of 16,7 per cent in July 2014, year-on-year growth in credit extension to the corporate sector moderated to 10,9 per cent in June 2015 before recovering to 13,1 per cent in January 2016. In 2015, loans and advances to the corporate sector were characterised by an increase in mortgage advances and general loans, while instalment sale credit and bank overdrafts declined.
Credit extension to the household sector remained subdued but its growth rate started to inch higher from mid-2015, picking up from 3,2 per cent in May 2015 to 4,6 per cent in January 2016. For 2015 as a whole, credit extension to households increased by R63,2 billion, up from R49,7 billion recorded a year earlier. The improving growth was mainly related to mortgage advances and general loans, while instalment sale credit retracted.
By economic sector, credit growth in the year to 31 December 2015 was dominated by the real-estate and electricity sectors, followed by manufacturing and the transport and agricultural sectors, as shown in the accompanying table. The expansion of portfolios by property funds and ongoing commercial property development boosted loans to the real-estate sector to outperform growth in loans to the other sectors. The electricity sector used bank funding for part of the financing of the various phases of the renewable energy projects initiated by government.
Growth in bank credit by economic sector over the year to December 2015
| Sector | Percentage change |
Percentage of total credit extension |
||||||
| Real estate |
47 | 9,7 | ||||||
| Electricity, gas and water |
43 | 1,6 | ||||||
| Manufacturing |
21 | 4,6 | ||||||
| Transport, storage and communication |
21 | 3,0 | ||||||
| Agriculture, forestry and fishing |
21 | 2,0 | ||||||
| Finance and insurance |
20 | 19,2 | ||||||
| Wholesale and retail trade |
16 | 5,0 | ||||||
| Business services |
11 | 3,4 | ||||||
| Community, social and personal services |
11 | 8,3 | ||||||
| Construction |
9 | 1,0 | ||||||
| Mining and quarrying |
5 | 2,6 | ||||||
| Households |
-5 | 34,5 | ||||||
| Other |
25 | 5,1 | ||||||
| Total |
11 | 100,0 | ||||||
Interest rates and yields
The Monetary Policy Committee (MPC) followed a path of gradual policy normalisation from January 2014, alongside a build-up in inflation pressures that was largely due to the impact of the depreciating currency. The increase in the repurchase rate by 50 basis points to 6,75 per cent per annum from 29 January 2016 brought the cumulative increase since the start of the tightening cycle in early January 2014 to 175 basis points. At the meeting in January 2016, the MPC noted that the exchange rate of the rand and food price inflation contributed to a significant deterioration of the inflation forecast. The intensity of the drought brought about a sizeable revision
|
|
Quarterly Bulletin March 2016 |
to the Bank’s food price outlook, while the exchange rate depreciated significantly more than previously expected. Faced with the continuing dilemma of a deteriorating inflation environment and a worsening growth outlook, the MPC was of the view that the expected acceleration in inflation was of such magnitude as to warrant a monetary policy response, otherwise higher inflation and inflation expectations would become entrenched, undermining the sustainability of future growth. For the full MPC statement, see page 94 of this Quarterly Bulletin.
Domestic money-market rates increased in the fourth quarter of 2015 and in the first two months of 2016, influenced by the increases in the repurchase rate, the depreciation in the exchange value of the rand, and the decision by the Federal Reserve to increase its policy interest rate in December 2015. The three-month Johannesburg interbank average rate (Jibar) recorded an increase of 33 basis points from 6,30 per cent in early September 2015 to 6,63 per cent on 23 December. The rate thereafter moved broadly sideways before increasing to 6,98 per cent alongside the increase in the repurchase rate from 29 January 2016. On 29 February 2016, the rate amounted to 6,99 per cent. The twelve-month Jibar recorded a more pronounced increase, from 7,36 per cent on 15 October to a high of 8,50 per cent on 11 December 2015. The long-term Jibar then moderated somewhat and fluctuated around 8,4 per cent in the subsequent months, with a recent rise to 8,57 per cent on 29 February 2016.
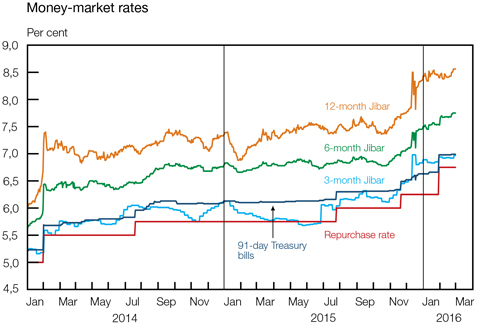
During the fourth quarter of 2015, the demand for 91-day Treasury bills remained low, with the bid-to-cover ratio averaging below 2 times during this period. The low demand probably reflected investors’ preference for higher-yielding instruments. The rate generally trended upwards in tandem with changes in the policy interest rate, rising from 6,11 per cent in late October 2015 to 6,94 per cent from 29 January 2016. On 29 February 2016, the rate on 91-day Treasury bills came to 6,97 per cent.
The South African benchmark overnight rate (Sabor) remained well anchored within the upper and lower standing facility limits. It fluctuated within a fairly narrow range around 6,2 per cent from late November 2015 to January 2016, rising to 6,69 per cent following the increase in the repurchase rate in January 2016. On 29 February 2016, the rate stood at 6,70 per cent.
| Quarterly Bulletin March 2016 |
|


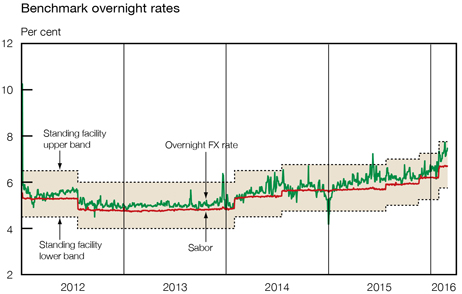
The overnight foreign-exchange (FX) rate displayed heightened volatility amid higher month-and quarter-end demand for liquidity by international banks as well as expectations of higher domestic interest rates in 2016. The rate generally trended above the Sabor rate and increased by a sizeable 103 basis points from 5,89 per cent on 17 September 2015 to 6,92 per cent on 10 December. While the rate moderated to 6,15 per cent on 19 January 2016, it again fluctuated higher after the MPC decision and amounted to 7,47 per cent by late February.
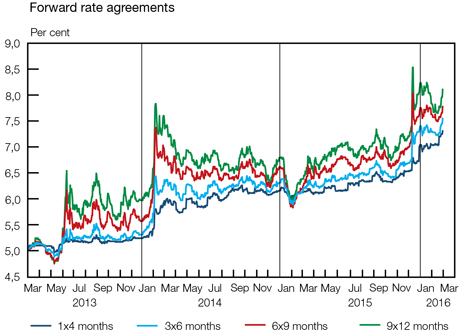
Forward rate agreements (FRAs) reflected downbeat market sentiment during the fourth quarter of 2015 as market participants became progressively more pessimistic about the inflation outlook due to the weakness in the exchange value of the rand and the persistent drought conditions, while turmoil in the Chinese and US share markets also fuelled the negative sentiment in early 2016. The rate on the 9x12 FRA initially recorded a steady increase alongside heightened inflation expectations as it rose by 65 basis points from 6,74 per cent on 15 October to 7,39 per cent on 8 December 2015. It then increased by 114 basis points to 8,53 per cent on 11 December 2015 but moderated fairly quickly to 7,72 per cent by 17 December, affected by appointments to the position of Minister of Finance. However, FRA rates continued to reflect expectations of inflation pressures due to the weaker exchange value of the rand and the expected impact of the continued drought on food prices. As a result, the 9x12 FRA once again rose to 8,24 per cent
|
|
Quarterly Bulletin March 2016 |
by 18 January 2016 but fell back after the announcement of the increase in the repurchase rate. By 29 February 2016, the rate on the 9x12 FRA stood at 8,11 per cent. Forward rates across the different maturity categories displayed similar fluctuations over the period.
The prime lending rate and the predominant rate on mortgage loans increased from 9,50 to 9,75 per cent following the November 2015 increase in the policy rate, and rose further to 10,25 per cent in the wake of the January 2016 policy decision. Rates on the different deposit and loan categories of private-sector banks generally adjusted in line with the movements in the policy rate.
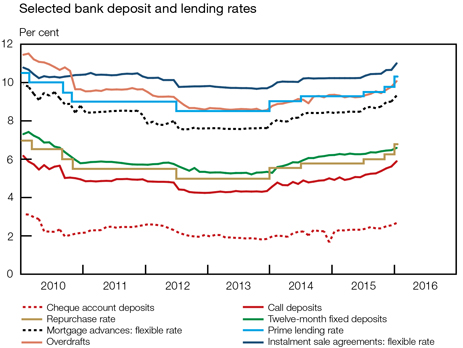
Priced off the yield curve for South African government bonds, interest rates on RSA fixed-rate retail bonds continued on their upward trajectory which started in 2013. In 2015, these rates rose by between 50 and 75 basis points across the different maturities before surging by a further 125 basis points to February 2016. These increases brought the interest rate on the 2-year bond to 9,25 per cent, on the 3-year bond to 9,50 per cent, and on the 5-year bond to 10,00 per cent in February 2016. As expected, the average deposit rate with banks on one-to-three-year fixed deposits also trended upwards since mid-2013 though at a slower pace, as shown in the accompanying graph. The value of all retail bonds in issue decreased from R12 billion in July 2012 to R7 billion in January 2016.
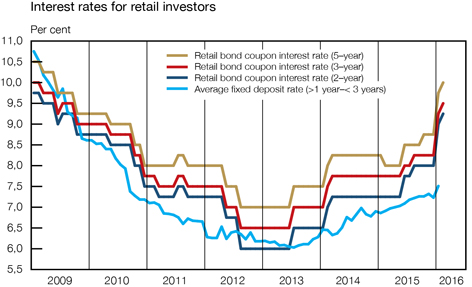
| Quarterly Bulletin March 2016 |
|


South African bond yields declined in the first few weeks of 2015 as expected inflation fell back in the wake of a considerable decline in international oil prices. However, bond yields generally rose from February 2015 with several factors contributing to the upward trend, including:
| • | the depreciation in the exchange value of the rand; |
| • | higher realised and expected inflation; |
| • | the upward cycle in the repurchase rate; |
| • | a slightly wider budget deficit provided for in the 2015 Medium Term Budget Policy Statement; |
| • | tighter financial conditions arising from the decline in the prices of export commodities; |
| • | emerging-market risk aversion, resulting in a reduction in non-resident interest in local bonds; and |
| • | sovereign rating concerns. |
Investor concerns around the replacement of the former Minister of Finance contributed to a further steep increase in bond yields in December 2015. While part of the increase was reversed, the 10-year government bond yield was nevertheless 240 basis points higher at 9,33 per cent at the end of February 2016, from the low of 6,93 per cent recorded on 29 January 2015.
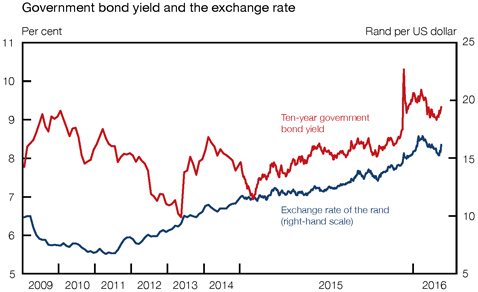
In line with these developments, the yield curve moved generally higher throughout 2015, peaking on 11 December 2015 before contracting slightly to the end of February 2016. With the extreme short end of the curve broadly anchored to the repurchase rate, the shape of the yield curve flattened as the yield gap, measured as the difference between yields at the extreme long and short ends of the curve, narrowed from 500 basis points on 11 December 2015 to 347 basis points on 29 February 2016.
Following the significant depreciation in the exchange value of the rand, an increase in inflation expectations and domestic political woes, the currency risk premium10 on South African government bonds widened from 414 basis points in January 2015 to 469 basis points in February 2016. The yields on rand-denominated bonds rose faster than the yields on dollar-denominated bonds over the period.
Given the lack of liquidity in inflation-linked bonds, the real yield on the R197 inflation-linked government bond increased by only 8 basis points from the end of January 2015 to 29 February 2016, while the nominal yield on the R186 government bond increased by 241 basis points over the same period. This resulted in an upward trend in the break-even inflation rate within the 7-to-10-year maturity range from a low of 5,24 per cent at the end of January 2015 to 7,52 per cent at the end of February 2016. Break-even inflation rates across all other maturities also rose well above the 6 per cent upper limit of the inflation target range. Rising food prices together with the depreciation in the exchange value of the rand contributed to, among other factors, higher inflation expectations.
|
|
Quarterly Bulletin March 2016 |
The risk-averse stance of investors towards emerging-market bonds was reflected in the spread between the yields on the JPMorgan Emerging Markets Bond Index Plus (EMBI+)11 and US government bonds, widening from 377 basis points at the end of April 2015 to 438 basis points at the end of February 2016. Similarly, the EMBI+ spread for South Africa widened by 126 basis points over the same period. The sovereign risk premium12 on South African government dollar-denominated bonds in the ten-year maturity range tracked a continuous upward trend from 209 basis points in May 2015 to 438 basis points at the end of February 2016.
Money market
The daily liquidity requirement of private-sector banks varied between a low of R44,2 billion and a high of R53,9 billion during the fourth quarter of 2015, higher than the range of between R36,6 billion and R50,0 billion recorded in the preceding quarter. The gradual longer-term rise in the daily liquidity requirement of private-sector banks reflected the reforms introduced in recent years to improve the broad alignment of the money-market shortage with underlying conditions in the money market, in order to ultimately improve the effectiveness of the transmission of monetary policy. Since the introduction of a new liquidity management strategy in August 2013, the actual average liquidity requirement has roughly doubled to around R50 billion in recent months.
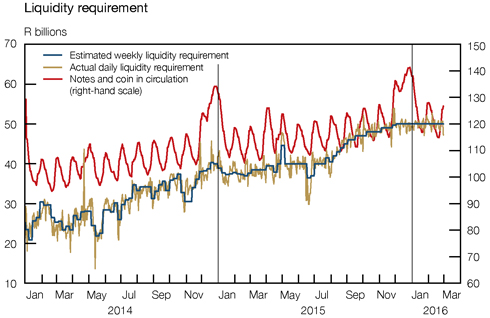
During the fourth quarter of 2015, the money market on balance tightened somewhat further as liquidity to the net amount of R2,7 billion was drained from the money market, following a net drainage of R9,5 billion recorded in the third quarter. The main driver of the tight liquidity conditions was the seasonal increase in notes and coin in circulation outside the Bank, which contracted money-market liquidity by R12,8 billion. The Bank neutralised the contraction by injecting R8,3 billion on a net basis into the market through money-market operations.
This was mainly done through allowing SARB debentures to mature while the Bank also conducted liquidity-adding foreign-exchange swaps. This was partly offset by an increase in call deposits of the Corporation for Public Deposits with the Bank; more deposits with the Bank means less deposits with private-sector banks. Spot foreign exchange transactions by the Bank were minor, amounting to sales of R0,1 billion. In January 2016, liquidity conditions were eased by the seasonal decrease in notes and coin outside the Bank, allowing the Bank to unwind its foreign-exchange swaps and resume issuing SARB debentures.
Capital redemption payments and scheduled coupon interest payments on various government bonds amounting to R14,5 billion were effected from the government tax and loan accounts from October to December 2015, with only R50 million of this amount accruing to the Bank.
| Quarterly Bulletin March 2016 |
|

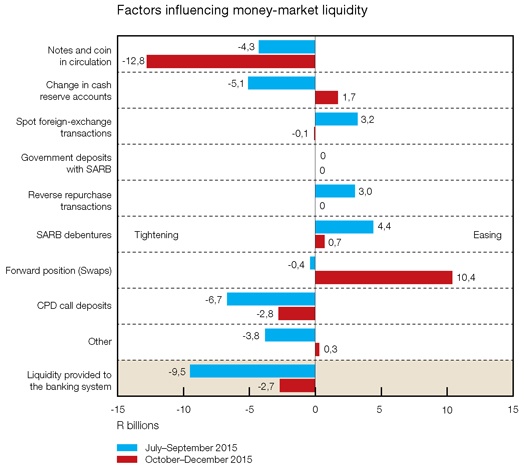
Bond market
Net bond issuances by national government in the domestic primary bond market remained broadly at the same level in 2014 and 2015, dominating the market along with its funding needs. Net nominal debt securities issuances by the public sector of R187 billion in 2015 was R11 billion lower when compared with 2014, reflecting lower net bond issues by public corporations.
Funding activity in the primary bond market by the private sector also continued steadily in 2015, driven mainly by banks. Net issuances by banks, although somehow deterred by a rating agency’s downgrade of local banks in December 2015, accounted for R33 billion of the total of R37 billion raised by the private sector in 2015. This amount raised by the private sector in 2015 was more than double the net issues of R18 billion recorded in 2014. Net bond issuances by non-bank companies remained subdued in 2015 as these companies continued to utilise banking loans rather than the primary bond market to meet their funding needs. Funding through short-term commercial paper picked up in 2015 after registering net redemptions in 2014. Consequently, the total outstanding nominal value of debt securities listed on the JSE increased by R224 billion in 2015 and by a further R1 billion in January 2016 to reach R2,3 trillion. In market value terms, the total market capitalisation of these securities increased by 4 per cent in 2015 with a further 2 per cent in January 2016 to reach R2,6 trillion.
Turnover in the secondary bond market picked up in 2015 after having declined in 2014. The average daily turnover of R96 billion in 2015 was 19 per cent higher than in 2014, mainly on account of higher volumes traded. In the first two months of 2016, the daily average turnover increased further to R107 billion. Bonds were the worst-performing asset class in 2015, with the All-Bond Index (ALBI) recording a nominal loss of 4 per cent compared with a positive return of 10 per cent in 2014. Bond market returns came under pressure during 2015, alongside the depreciation in the exchange value of the rand, the increases in the repurchase rate, negative sovereign rating actions, and political changes.
|
|
Quarterly Bulletin March 2016 |
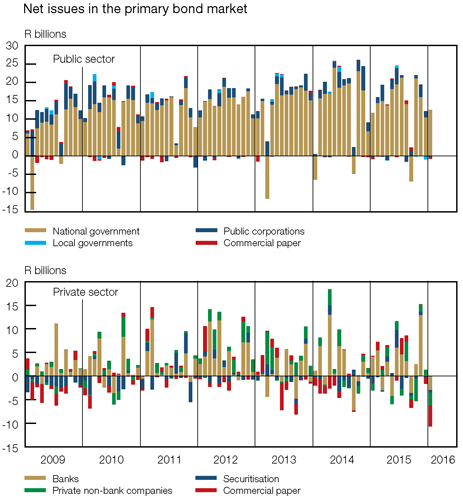
Although rand-denominated bond issuances by non-residents in the European and Japanese bond markets continued at a steady pace in 2015, they were at a lower level than in 2014. The net issuances of rand-denominated bonds in both markets amounted to R8,0 billion in 2015, less than half of the net issuances registered in 2014. The lower issuances of these bonds in 2015 can be attributed to, among other factors, continued concerns over slowing economic growth dominated by growing fear over the health of the Chinese economy, which weighed heavily on commodity prices and pushed up costs of borrowing for many issuers, together with the downgrading of South Africa’s sovereign credit rating and outlook by rating agencies. This was reinforced by the decision of Japan’s large Government Pension Investment Fund (GPIF) to alter its investment policy by significantly reducing its bond allocation in favour of increased equities. In the first two months of 2016, net issues of R3,1 billion were recorded in both markets.
Rand-denominated bonds issued in international bond markets
R millions
| Eurorand | Uridashi | Total | ||||||||||||||||||||||
| 2014 | 2015 | 2014 | 2015 | 2014 | 2015 | |||||||||||||||||||
| Issues |
28 804 | 21 073 | 1 882 | 6 725 | 30 686 | 27 798 | ||||||||||||||||||
| Redemptions |
6 784 | 11 612 | 4 828 | 8 206 | 11 612 | 19 817 | ||||||||||||||||||
| Net |
22 020 | 9 461 | -2 947 | -1 480 | 19 074 | 7 981 | ||||||||||||||||||
Non-residents were net sellers of local debt securities in the third and fourth quarters of 2015, contributing to exchange-reported net sales of R19 billion in 2015 compared with net sales of R69 billion in 2014. Non-residents’ net selling of local bonds can be attributed to the depreciation
| Quarterly Bulletin March 2016 |
|


in the exchange value of the rand, negative sentiment and risk aversion towards emerging-market economies along with economic growth concerns, sovereign credit rating downgrades, and political woes. Non-residents recorded tame net purchases of local bonds to the value of R0,5 billion in the first two months of 2016.
Share market
Notwithstanding the bleak domestic economic outlook and lower share prices in the latter part of 2015, companies listed on the JSE continued to record healthy levels of equity funding during 2015. Equity capital raised in the domestic and international primary share markets by JSE-listed companies reached an all-time high of R250 billion in 2015. A large part of the equity capital funding activity involved companies in the industrial sector, which accounted for 54 per cent of the total capital raised in 2015. Acquisition deals by two companies in the consumer goods and services industries contributed a significant 76 per cent of the industrial sector’s equity funding in 2015. Further equity financing on the JSE amounting to R13 billion was recorded in the first two months of 2016. The increase in new share issuances on the JSE occurred alongside an increased number of companies listed on the JSE; new listings surpassed delistings for the second consecutive year in 2015. Listed companies on the main board came to 328 at the end of February 2016, while 65 companies were listed on AltX and 3 on the development and venture capital boards, as shown in the accompanying table.
Number of listings on the JSE
| AltX | Venture and development capital boards |
Main board |
Total | New listings: Total for the year |
Delistings: Total for the year |
|||||||||||||||||||
| December 2013 |
60 | 5 | 324 | 389 | 13 | 26 | ||||||||||||||||||
| December 2014 |
58 | 3 | 330 | 391 | 24 | 22 | ||||||||||||||||||
| December 2015 |
63 | 3 | 329 | 395 | 23 | 19 | ||||||||||||||||||
| February 2016 |
65 | 3 | 328 | 396 | 4 | 3 | ||||||||||||||||||
Alongside higher average share prices and higher volumes traded, partly as a result of increased financial market turbulence, the daily average turnover of R20 billion in 2015 – the highest daily average turnover in any calendar year – was 23 per cent higher when compared with 2014. The average daily turnover edged higher to R24 billion in the first two months of 2016. In line with movements in share prices, the market capitalisation of the JSE receded in November and December 2015, reaching a level of R11,7 trillion, before rising to its highest level of R14,6 trillion in January 2016 and then marginally lower to R14,5 trillion in February. The market capitalisation was in part boosted by the secondary inward listing on the JSE of a Belgian beer company in January 2016.
In conjunction with the heightened volatility in global financial markets, share markets worldwide recorded losses from around mid-2015. The FTSE/JSE All-Price Index (Alsi) followed the Morgan Stanley Capital International (MSCI) Emerging Markets Index13 and the MSCI World Index14 lower as it declined by 15 per cent from a recent high of 54 609 index points on 4 November 2015 to 46 282 index points on 21 January 2016. Negative investor sentiment spilled over to 2016 as emerging-market risk aversion continued to intensify amid deteriorating economic growth prospects. Subsequently, the Alsi improved slightly to 49 415 index points on 29 February.
The total earnings of companies listed on the JSE decreased by no less than 40 per cent in 2015 and a further 11 per cent in the two months to February 2016, amid volatility in financial markets, lower commodity prices, and subdued economic growth. The decline in earnings outstripped the fall in share prices, thus raising the historical price-earnings ratio for all classes of shares to record high levels in February 2016.
|
|
Quarterly Bulletin March 2016 |
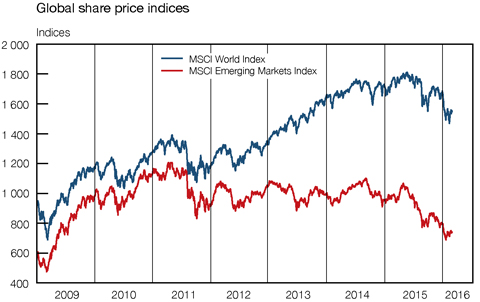
Box 4 Non-residents’ secondary share market trading on the JSE by sector
According to exchange-reported data, non-resident investors were net sellers of domestic shares on the JSE to the value of R40 billion in the fourth quarter of 2015, following the strain in domestic share prices, political woes, and economic growth concerns. These developments contributed to a reduction in the holdings of domestic shares by non-resident investors of R4 billion in 2015, compared with net purchases of R13 billion in 2014. The graph below depicts the sectors where non-resident investors were the largest net purchasers or sellers of listed shares on the JSE in 2015.
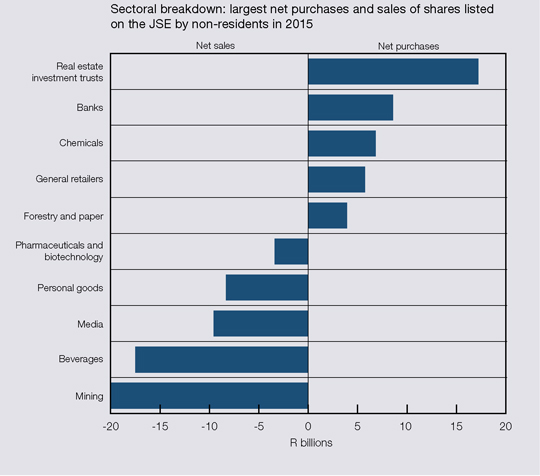
| Quarterly Bulletin March 2016 |
|


As shown in the graph on the previous page, the highest net sales by non-residents were those of mining shares, amounting to R20 billion in 2015. This was on the back of negative returns recorded by the mining sector, in turn mainly attributable to the noticeable downward trajectory in commodity prices. Furthermore, the impact of the slowdown in domestic economic conditions, factors relating to labour unrest, electricity constraints, and recent political woes in South Africa also contributed to a decline in the returns of the mining sector. These difficult conditions were mirrored by the generally declining trend in the JSE Mining Index since mid-2014, as illustrated in the graph below.
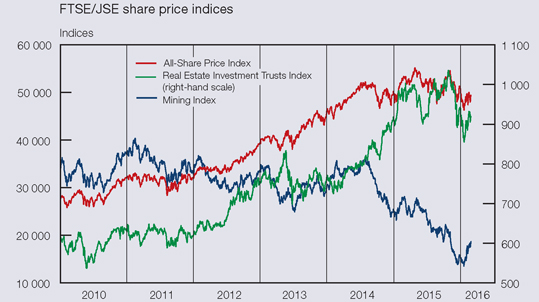
Meanwhile, real-estate investment trusts and banks stood out as the sectors with the largest net purchases of shares by non-residents in 2015, with the net purchases in the first-mentioned sector amounting to no less than R17 billion.
Market for exchange-traded derivatives
The 3,5 million commodity futures and options contracts traded on the Commodity Derivatives Market of the JSE in 2015 were 28 per cent higher than in 2014. Increased trading volumes were accompanied by a surge in prices of domestic agricultural commodities, as South Africa experience one of the worst droughts in decades. The drought conditions gave rise to a maize shortage, which resulted in record-high prices – surpassing import parity levels – and increased maize imports in a bid to bridge the supply-demand gap. The maize shortage is also having an impact on neighbouring countries that frequently rely on South Africa’s maize crop and transport infrastructure to fill shortfalls in their own domestic production. Price effects have been exacerbated by the sharp depreciation in the exchange value of the rand, resulting in inflated prices of agricultural commodity imports and other input costs, eventually raising domestic food prices and the upside risk to the inflation outlook. Over the past year, the international market prices (in US dollars) of maize and wheat displayed a downward trend; most of the increase in rand prices therefore related to exchange-rate and South African supply-demand dynamics.
The domestic wheat import tariff was raised a number of times in 2015, with the latest change from R511 per ton to R911 per ton being recorded in September 2015. Continued increases in domestic wheat import tariffs attempted to incentivise local production and shield domestic farmers against uncompetitive pricing caused by the persistent declines in world wheat prices which benefited from bumper crops.
|
|
Quarterly Bulletin March 2016 |
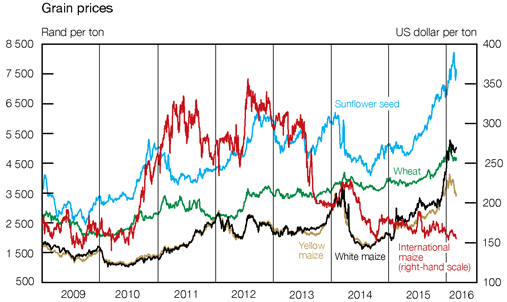
In December 2015, the JSE introduced a cash-settled beef carcass futures contract. The contract aims to facilitate hedging by beef farmers and other sellers and buyers of beef in the face of potentially volatile prices as supply and demand conditions change.
Amid the weaker exchange value of the rand and comparatively large movements in domestic bond yields and commodity prices, trading activity in commodity, currency and interest rate derivatives on the JSE continued briskly in 2015. However, equity derivatives continued to dominate overall derivatives trading on the JSE, as indicated in the table below.
| Derivatives turnover on the JSE | ||||||||||||||||
| Value (R billions) |
Change over one year (Per cent) |
|||||||||||||||
| Type of derivative | 2015 | Jan-Feb 2016 | 2015 | Jan-Feb 2016 | ||||||||||||
| Equity |
6 647 | 876 | 11 | 26 | ||||||||||||
| Warrants |
1 | 0,1 | -13 | -9 | ||||||||||||
| Commodity |
749 | 192 | 53 | 77 | ||||||||||||
| Interest rate |
736 | 199 | 12 | 14 | ||||||||||||
| Currency |
604 | 103 | 17 | 104 | ||||||||||||
Real-estate market
Against a background of macroeconomic developments that squeezed consumer finances and confidence, the average year-on-year rate of increase in nominal house prices across the various house price barometers in the South African residential property market was lower in 2015 when compared with the preceding two years. In 2015, house price increases were reasonably in line with consumer price inflation, with no evidence to suggest an overheated market if read in conjunction with housing affordability indicators such as the level of house prices relative to average income and relative to consumer prices. House price inflation reflected lustreless economic activity, slow growth in household disposable income, and muted employment gains together with mild increases in the repurchase rate.
| Quarterly Bulletin March 2016 |
|


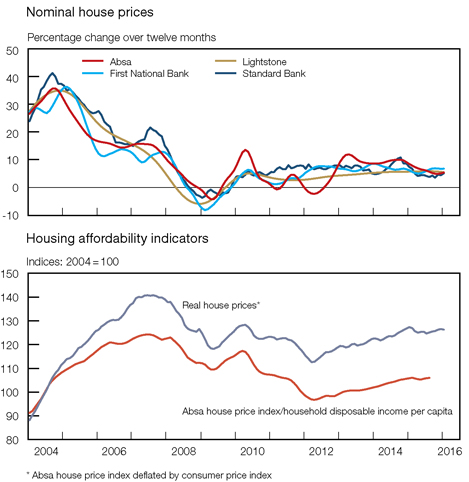
Non-bank financial intermediaries
Higher share prices, on average, boosted the balance sheet of non-bank financial institutions15 in 2015. The consolidated assets of these institutions increased by 6 per cent from R7,6 trillion in 2014 to R8,1 trillion in 2015, somewhat slower than the rate of increase of 10 per cent registered from 2013 to 2014. In real terms, many asset classes recorded negative returns on a year-on-year basis in December 2015, contributing to a decline in financial well-being and in the gross value of household assets in the final months of 2015.
The investment allocation of non-bank financial institutions remained fairly stable, with the proportion of assets held in shares increasing slightly from 56 per cent of total assets in 2014 to 57 per cent in 2015. The uncertain macroeconomic environment, together with increased volatility in the share market and deteriorating company earnings, weighed on equity investment. Holdings of shares were, however, buoyed by an increase in foreign-held shares, which benefited from the depreciation in the exchange value of the rand.
Exposure to fixed-interest securities remained unchanged at 28 per cent of total assets in 2014 and 2015. Demand for fixed-interest securities appears to have been constrained by negative returns in the bond market amid turbulent financial market conditions.
Meanwhile, investment in cash and deposits increased from 6 per cent of total assets in 2014 to 7 per cent in 2015, alongside the resurgence of risk aversion in financial markets. Signs of flight to safety were particularly evident in the unit trust industry, where money-market funds attracted net inflows of R27 billion in 2015 compared with net outflows of R39 billion in 2014.
|
|
Quarterly Bulletin March 2016 |
The value of loans extended by non-bank financial institutions decreased from 6 per cent of total assets in 2014 to 5 per cent in 2015. Loans extended by insurance companies waned in 2015, whereas those of finance companies increased over the same period. Credit extension by finance companies was mainly driven by growth in instalment sale and leasing finance extended by vehicle finance companies.
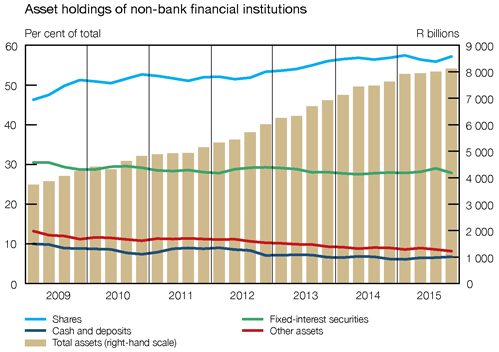
The deterioration in economic conditions appears to have had minimal effect on flows into non-bank financial institutions in 2015. Gross inflows16 to these institutions increased from R631 billion in 2014 to R670 billion in 2015, mostly channelled to equity and bond portfolios. However, growth in the balance sheet of these institutions is likely to be constrained by slow income growth and weaker asset prices.
Flow of funds
Emerging-market risk aversion, global financial market volatility, weak economic activity and the potential effects of the inevitable emergence of the upward interest rate cycle by the US Federal Reserve on global capital flows were among the factors that influenced the outcome of the cross-border financial transactions in South Africa during the third quarter of 2015. Despite these negative global investment sentiments, non-residents extended higher capital inflows than those recorded in the second quarter of 2015, which were sufficient to finance the current account deficit. A net amount of R58 billion was invested in financial assets during the third quarter of 2015, compared with R22 billion a quarter earlier. The inflow of funds from non-residents especially occurred through deposits and the extension of long-term loans. Correspondingly, South African resident units acquired more foreign assets during the third quarter of 2015, in their quest to diversify and hedge their investment positions. A large portion of the outflows acquired shares.
| Quarterly Bulletin March 2016 |
|


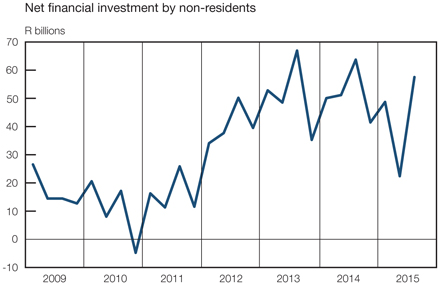
With interest rates on an upward cycle and the R158 government bond redemption during the third quarter of 2015, financial intermediaries continued to attract higher deposits. The intermediaries acquired deposits amounting to R116 billion in the third quarter of 2015, slightly lower than the R120 billion in the second quarter of 2015, but still higher than the quarterly levels recorded in recent years. These deposits were augmented by interest in retirement and life funds receipts amounting to R22 billion over the same period. In turn, financial intermediation through loan disbursements increased, mainly driven by improved household borrowing.
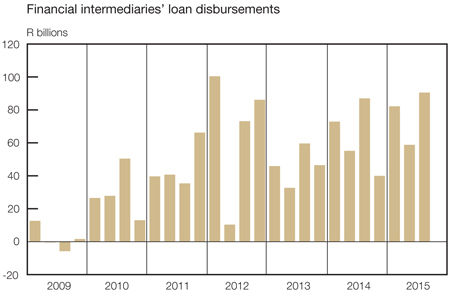
The general government sector’s inflows through tax revenue collection continued to be supplemented by proceeds from long-term government bond issuances in the domestic economy during the third quarter of 2015. Other sources of funds acquired during the third quarter of 2015 included R24 billion from non-marketable bond issuances and R19 billion from bank loans and advances. Most of the funds borrowed came from banks and non-bank financial intermediaries. Over the same period, an outflow of R25 billion was made in government bond redemptions, along with other normal operational costs, including the implementation of pay increases to senior management civil servants, which were backdated to April 2015. Additionally, general government continued to incur capital outlays in the areas of storm water infrastructure and road refurbishment, among other things. In its October 2015 Medium-Term
|
|
Quarterly Bulletin March 2016 |
Budget Policy Statement, National Treasury articulated continuous capital investment in the transport, logistics and energy sectors. If sustained, capital expansion in these areas will help to reduce the long-term binding constraints to economic growth.
The domestic economic trajectory was emulated in the non-financial corporate business enterprises’ flow-of-funds activity in the third quarter of 2015. Flows for capital expansion by private non-financial corporate businesses, the largest contributor of capital spending, grew at a slower pace compared with the second quarter of 2015, as business confidence levels continued to disappoint. By contrast, public non-financial corporate businesses’ capital outlays grew faster during the review period, boosted by spending associated with the New Multi-Product Pipeline and Ingula Power Station projects. Collectively, non-financial corporate business enterprises’ capital formation amounted to R146 billion in the third quarter of 2015 compared with R160 billion in the second quarter of 2015, weighted down by private corporates’ slower pace of contribution. The sector’s level of financial flows displayed a similar trend, as their net incurrence of financial liabilities amounted to R155 billion in the third quarter of 2015. This level was lower than the second-quarter amount of R204 billion, highlighting limited optimism in the domestic economy.
Total flows by the household sector moderated during the third quarter of 2015 due to subdued real income growth, low consumer confidence levels, a tighter interest rate environment and stricter lending criteria. The sector’s net incurrence of financial liabilities was lower than the net acquisition of financial assets, resulting in a net surplus position of R7,0 billion during the review period. In particular, households continued to increase their deposits, taking advantage of the relatively higher money-market return.
| Quarterly Bulletin March 2016 |
|

Public finance17
Non-financial public-sector borrowing requirement18
The non-financial public-sector borrowing requirement amounted to R154 billion in April–December 2015, R22 billion less than in the comparable period of fiscal year 2014/15. As reflected in the accompanying table, the contraction in the non-financial public-sector borrowing requirement was mainly attributable to a turnaround at local government level from a small deficit to a significant cash surplus, although the surpluses of the extra-budgetary institutions and social security funds also widened over the period. Furthermore, the deficits of national government as well as of the non-financial public enterprises and corporations narrowed somewhat compared to the same period in fiscal 2014/15.
Non-financial public-sector borrowing requirement
R billions
| Level of government | Apr–Dec 2014* | Apr–Dec 2015* | ||||||
| Consolidated general government |
108,6 | 88,6 | ||||||
| National government |
134,7 | 130,6 | ||||||
| Extra-budgetary institutions |
-7,8 | -13,7 | ||||||
| Social security funds |
-10,6 | -13,1 | ||||||
| Provincial governments |
-10,1 | -3,6 | ||||||
| Local governments |
2,3 | -11,7 | ||||||
| Non-financial public enterprises and corporations |
67,2 | 64,9 | ||||||
| Total** |
175,9 | ** | 153,5 | ** | ||||
| As percentage of gross domestic product |
6,1 | 5,1 | ||||||
| * | Deficit + surplus – |
| ** | Components may not add up to totals due to rounding |
As percentage of GDP, the non-financial public-sector borrowing requirement amounted to 5,1 per cent in the first nine months of fiscal 2015/16, lower than the ratio of 6,1 per cent recorded in the same period a year earlier.
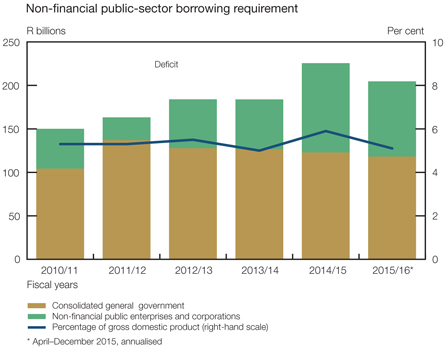
|
|
Quarterly Bulletin March 2016 |
During the period under discussion, the borrowing requirement of the consolidated general government amounted to R88,6 billion – some R20,1 billion less than in the first nine months of fiscal 2014/15. As a ratio of GDP, the consolidated general government borrowing requirement amounted to 2,9 per cent, lower than the 3,8 per cent recorded a year earlier.
The financial activities of non-financial public enterprises and corporations resulted in a preliminary cash deficit of R64,9 billion in the first three quarters of fiscal 2015/16. This is R2,3 billion lower than the cash deficit recorded in the same period of the previous fiscal year. The slight improvement in the cash deficit was on account of higher growth in cash receipts which outpaced growth in total expenditure. Eskom in particular recorded significant increases in revenue in the third quarter of calendar year 2015 as a result of higher electricity demand and higher tariffs in the winter months.
Preliminary estimates indicate that net investment in non-financial assets by non-financial public enterprises and corporations amounted to R84,5 billion during the period under review. This was 14,8 per cent less than in the first three quarters of fiscal 2014/15. The lower level of infrastructure spending may be attributed to various challenges resulting in delays in infrastructure programmes and the continuation of significant maintenance and rehabilitation backlogs in the transport and energy sectors. Notwithstanding the decline in spending on non-financial assets by state-owned companies, their capital expenditure continued to make a meaningful contribution to public-sector infrastructure investment.
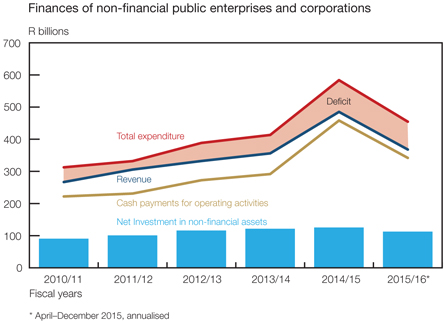
National government cash receipts from operating activities amounted to R808 billion in the first nine months of fiscal 2015/16, representing a year-on-year rate of increase of 11,2 per cent. This growth was boosted by robust increases in taxes on property and taxes on international trade and transactions, alongside a steep rise in non-tax revenue related to the sale of government’s interest in Vodacom.
| Quarterly Bulletin March 2016 |
|


During April–December 2015, cash payments for operating activities totalled R925 billion – some 8,9 per cent more than in the same period a year ago. Compensation of employees amounted to R98,9 billion in the first nine months of fiscal 2015/16, or 10,1 per cent more than in the first nine months of the previous fiscal year. Grants paid by national government to other levels of general government recorded a year-on-year rate of increase of 6,9 per cent and contributed more than 50 per cent to national government’s expenses.
Net cash flow from national government’s operating activities, alongside net investment in non-financial assets, yielded a cash deficit of R131 billion in the first nine months of fiscal 2015/16. This deficit was R4,1 billion lower than the cash deficit recorded in the corresponding period of the previous fiscal year.
In April–December 2015, provincial governments’ financial activities resulted in a cash surplus of R3,6 billion, roughly R6,4 billion lower than the cash surplus recorded in the same period of fiscal 2014/15. Growth in cash payments outperformed the increase in total cash receipts over the period. The Budget Review 2015 estimated that provincial governments would record a cash surplus of R0,2 billion for fiscal 2015/16 as a whole.
Total cash receipts from the operating activities of provincial governments amounted to R365 billion in the first nine months of fiscal 2015/16, representing a year-on-year rate of increase of 4,6 per cent. These higher receipts were mainly attributable to higher inter-governmental transfers from national government. These transfers – equitable share payments and conditional grants earmarked for specific purposes – amounted to R354 billion, representing a year-on-year rate of increase of 4,7 per cent for the period under discussion.
During the period under review, cash payments for operating activities together with net investment in non-financial assets amounted to R362 billion or 6,7 per cent more than in the corresponding period a year earlier. Provincial government expenditure continued to be dominated by spending on compensation of employees, which increased by 5,4 per cent year on year and constituted 59,8 per cent of total provincial expenditure in April–December 2015.
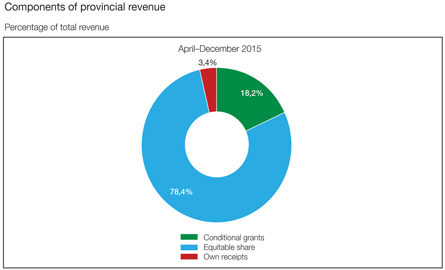
Provincial governments’ deposits with the Corporation for Public Deposits (CPD) decreased from R21,3 billion at the end of March 2015 to R18,6 billion at the end of December 2015. At the same time, their deposits with private banks increased from R10,8 billion to R16,9 billion, while their overall indebtedness to banks increased from R0,4 billion to R0,5 billion.
|
|
Quarterly Bulletin March 2016 |
As presented in the Quarterly Financial Statistics of Stats SA, consolidated data for local government recorded a cash surplus of R11,7 billion in April–December 2015 in contrast to a cash deficit of R2,3 billion in the same period of the preceding fiscal year. Strong increases in cash receipts outpaced cash payments, contributing to the cash surplus of local government.
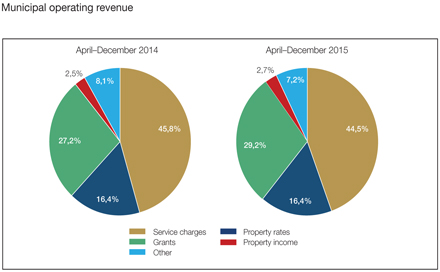
In the first nine months of fiscal 2015/16, cash receipts from operating activities amounted to R252 billion, recording an increase of 12,6 per cent year on year. Inter-governmental transfers from national- and provincial governments contributed the most to the robust rise in total municipal revenue, followed by the sales of water, electricity and gas – the main driver of municipal own revenue. Cash receipts from sales of electricity and gas contributed significantly towards higher revenue.
Cash payments for operating activities recorded a year-on-year rate of increase of 9,3 per cent and amounted to R202 billion in April–December 2015. Robust growth in purchases of goods and services contributed to the increase in cash payments for operating activities. Net investment in non-financial assets declined by 6,9 per cent year on year and amounted to R38,4 billion.
Extra-budgetary institutions recorded a preliminary cash surplus of R13,7 billion in April–December 2015 – significantly higher than the cash surplus of R7,8 billion recorded in the same period a year earlier. The cash surplus could be attributed to a notable rise in cash receipts, which far outpaced increases in total expenditure. Preliminary estimates of social security funds show a cash surplus for the first nine months of fiscal 2015/16 of R13,1 billion. The increase in the cash surplus could partially be attributed to a 5 per cent decrease in social benefits paid in the current fiscal year.
Budget comparable analysis of national government finance
Both national government revenue collections and expenditure were adjusted upwards in the first nine months of fiscal 2015/16 following the sale of national government’s stake in Vodacom, worth R25 billion. Of this amount, R23 billion was assigned to Eskom Holdings and R2 billion to the New Development Bank (or BRICS Bank) as payment of South Africa’s first capital contribution. Eskom received R10 billion in July 2015 and a further R5 billion in December 2015, with the remaining R8 billion set to be transferred to Eskom in the first quarter of 2016. It is important to note that the proceeds of R25 billion have been symmetrical to both revenue and expenditure and thus deficit-neutral.
| Quarterly Bulletin March 2016 |
|


National government finances: key statistics
Year-on-year growth rates
| Budget Review Full 2015/16 |
Medium Term Budget Policy Statement: Full 2015/16 |
Actual Apr–Dec 2015 | ||||
| Per cent | ||||||
| Expenditure |
8,0 | 10,2 | 9,1 | |||
| Revenue |
10,5 | 12,7 | 11,5 | |||
| Deficit |
R173 billion | R176 billion | R142 billion | |||
Note: Medium Term Budget Policy Statement 2015 and actual statistics include Vodacom, Eskom and New Development Bank transactions.
National government expenditure in the first three quarters of fiscal 2015/16 amounted to R905 billion, or 9,1 per cent more than in the corresponding period of fiscal 2014/15. Relative to GDP, national government expenditure came to 29,9 per cent in April–December 2015, somewhat higher than the ratio of 28,8 per cent recorded for the same period a year earlier, with the higher ratio partly due to the once-off Eskom injection and partly due to the compression of nominal GDP by slow real growth and weak export commodity prices. The Budget Review 2015 envisaged that national government expenditure would total R1 222 billion in fiscal 2015/16, or 8 per cent more than in fiscal 2014/15. In the 2015 Medium Term Budget Policy Statement (MTBPS), revised estimates projected expenditure to total R1 247 billion in fiscal 2015/16. These projections include the capital injections for Eskom and the New Development Bank mentioned earlier.
National government expenditure in 2015/16
| Originally budgeted: Full 2015/16 |
Actual Apr–Dec 2015 |
|||||||||||||||
| Expenditure item |
|
|
||||||||||||||
| R billions | Percentage change* |
R billions | Percentage change* |
|||||||||||||
| Voted amounts |
704,5 | 12,5 | 513,8 | 11,1 | ||||||||||||
| Current payments |
194,6 | 9,2 | 141,4 | 8,1 | ||||||||||||
| Transfers and subsidies |
464,8 | 8,5 | 345,9 | 7,5 | ||||||||||||
| Payments for capital assets |
16,7 | 4,6 | 9,3 | 21,0 | ||||||||||||
| Payments for financial assets |
28,4 | 705,1 | 17,2 | 706,8 | ||||||||||||
| Statutory amounts** |
542,8 | 7,3 | 391,3 | 6,5 | ||||||||||||
| Of which: Interest on debt |
126,3 | 10,1 | 83,1 | 8,5 | ||||||||||||
| Total expenditure |
1 247,4 | 10,2 | 905,1 | 9,1 | ||||||||||||
| * | Fiscal 2014/15 to fiscal 2015/16. Note that figures might differ from previous editions of the Quarterly Bulletin, due to the audited outcome of fiscal 2014/15 |
| ** | Including extraordinary payments |
As reflected in the accompanying table, current payments increased by 8,1 per cent in the first nine months of fiscal year 2015/16. The Justice, Crime Prevention and Security cluster accounted for 72,7 per cent of total current payments by national government. The Departments of Police as well as Defence and Military Veterans, in turn, were responsible for 77,3 per cent of current expenditure by this cluster.
Transfers and subsidies increased by 7,5 per cent during April–December 2015. The Departments of Education, Health and Social Development accounted for the bulk of the higher transfers and subsidies. Further contributions to transfers and subsidies came from the Departments of Cooperative Governance and Traditional Affairs, Transport and Human Settlements as well as National Treasury.
|
|
Quarterly Bulletin March 2016 |
Payments for capital assets continued to be characterised by an uneven distribution of such expenditure during the financial year, although effort was made to shift some of the spending earlier rather than effecting it overwhelmingly in the January–March quarter. However, despite this effort, only about 56 per cent of the full fiscal year budget for this spending category had been spent by the end of December, with only three months left in the current fiscal year.
Payments for financial assets rose notably in the first nine months of fiscal 2015/16 when compared with the same period in the previous fiscal year. This notable increase was mainly a consequence of the transfers to Eskom stemming from government’s sale of its stake in Vodacom, as explained above.
Interest paid on national government debt amounted to R83,1 billion in the first nine months of fiscal year 2015/16 – roughly 9 per cent more than in the first nine months of the preceding fiscal year. The Budget Review 2015 projected interest payments to increase by 10,1 per cent to amount to R126 billion in the current fiscal year.
During April–December 2015, equitable share transfers to provinces totalled R287 billion, some 5,6 per cent more than in the same period of fiscal 2014/15. Metropolitan municipalities received a further R3,6 billion as their share of the general fuel levy in December 2015, bringing the total levy share amount received by these municipalities during the current fiscal year to R7,1 billion.
The cash-flow expenditure of national government, after taking into account cash-flow adjustments,19 totalled R893 billion in April–December 2015, or 9,8 per cent more than in the same period of the previous fiscal year. Cash-flow adjustments, comprising surrenders to the value of R10,5 billion and the revaluation of inflation-linked bonds amounting to R19,6 billion, explain the bulk of the difference between the national government’s cash-book and cash-flow expenditure in the fiscal year to December 2015.
National government revenue amounted to R763 billion20 in the first nine months of fiscal year 2015/16, representing a year-on-year increase of 11,5 per cent. Revenue collections were boosted by solid increases in taxes on property and taxes on international trade and transactions, along with a sharp increase in non-tax revenue. Corporate income tax and domestic value-added tax (VAT) continued to grow at a sluggish pace, far below original budgeted expectations. As a ratio of GDP, national government revenue amounted to 25,2 per cent in April–December 2015 – somewhat higher than the ratio of 23,8 per cent recorded in the first nine months of fiscal 2014/15.
National government revenue in fiscal 2015/16
| Originally budgeted Full 2015/16 |
Actual Apr–Dec 2015 |
|||||||||||||||
| Revenue source |
|
|
||||||||||||||
| R billions | Percentage change* |
R billions | Percentage change* |
|||||||||||||
| Taxes on income, profits and capital gains |
620,9 | 10,5 | 433,2 | 7,7 | ||||||||||||
| Income tax on individuals |
394,7 | 11,5 | 273,2 | 10,5 | ||||||||||||
| Income tax on companies |
203,7 | 9,2 | 141,8 | 2,2 | ||||||||||||
| Payroll taxes |
14,7 | 4,7 | 11,1 | 12,5 | ||||||||||||
| Taxes on property |
13,7 | 9,8 | 10,9 | 18,5 | ||||||||||||
| Taxes on goods and services |
389,2 | 9,2 | 273,0 | 6,4 | ||||||||||||
| Value-added tax (VAT) |
283,8 | 8,6 | 197,1 | 4,7 | ||||||||||||
| Domestic VAT |
314,0 | 9,4 | 220,3 | 4,0 | ||||||||||||
| Import VAT |
140,0 | 2,5 | 106,2 | 11,3 | ||||||||||||
| Taxes on international trade and transactions |
42,6 | 2,7 | 32,2 | 12,5 | ||||||||||||
| Import duties |
41,7 | 2,4 | 31,6 | 13,0 | ||||||||||||
| Other revenue** |
44,3 | 183,9 | 41,3 | 145,9 | ||||||||||||
| Less: SACU*** payments |
51,0 | -1,4 | 38,4 | -0,9 | ||||||||||||
| Total revenue |
1 074,3 | 13,1 | 763,3 | 11,5 | ||||||||||||
| * | Fiscal 2014/15 to fiscal 2015/16. Note that figures might differ from previous editions of the Quarterly Bulletin, due to the audited outcome of fiscal 2014/15 |
| ** | Including extraordinary receipts, but excluding premiums of R4,9 billion on debt portfolio restructuring and loan transactions |
| *** | Southern African Customs Union |
| Quarterly Bulletin March 2016 |
|


According to the Budget Review 2015, national government revenue was expected to increase by 10,5 per cent to R1 049 billion in fiscal 2015/16. However, the budgeted amount for national government revenue was revised upwards by R23 billion in July 2015 and by a further R2 billion in December, owing to the sale of government’s stake in Vodacom. Following this revision, revenue was expected to total R1 074 billion in fiscal 2015/16, representing a year-on-year rate of increase of 13,1 per cent. However, in line with the downward revisions in economic growth estimates, the 2015 MTBPS revised the projections for national government revenue downwards to total R1 071 billion in the fiscal year as a whole.
Taxes on income, profits and capital gains increased by 7,7 per cent year on year in the first nine months of fiscal 2015/16. This rate of increase was lower than the rate of increase recorded during the same period in fiscal 2014/15. Personal income tax was the main contributor to total revenue of national government in the first nine months of the current fiscal year and remains one of the most stable sources of revenue. However, in December 2015 personal income tax collections were lower than budgeted for, in part owing to lower bonus payments at year-end. Retrenchments in the mining, manufacturing and retail sectors may also have affected the revenue collection in this category; further retrenchments pose a risk to pay-as-you-earn receipts for the remainder of fiscal 2015/16 and beyond. Despite some improvement in December 2015, corporate income tax recorded sluggish year-on-year growth in the first nine months of the year, owing to lower provisional payments.
The buoyant increase recorded in taxes on property could be attributed to a robust increase of 24,9 per cent recorded in security transfer tax, along with a solid increase of 11,2 per cent in transfer duties. The strong increase in security transfer tax reflected the brisk activity in the financial markets.
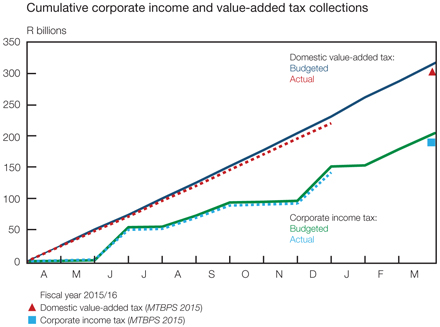
Although taxes on goods and services recorded a firm increase year on year, revenue collections continued to be lower than budgeted projections. Higher proceeds from this tax category stemmed from notable increases in the general fuel levy and excise duties. VAT collections continued to grow at a lacklustre pace, increasing by 4,7 per cent in the period under review, compared with an increase of 11,1 per cent recorded during the same period in fiscal 2014/15. A contraction in the real output of the manufacturing sector and relatively sluggish growth registered by the commerce sector adversely affected domestic VAT receipts. Weak consumer confidence, lacklustre economic growth, and higher interest rates were set to adversely affect VAT receipts in the short to medium term. Growth in VAT on imported goods continued to exceed budgeted expectations, countering to some extent subdued growth in domestic VAT.
|
|
Quarterly Bulletin March 2016 |
Taxes on international trade and transactions increased markedly during April–December 2015. Brisk collections of import duties were boosted in part by the depreciation in the exchange value of the rand as well as higher tariff rates on a number of products. The notable increase in non-tax revenue was due to the sale of Vodacom shares.
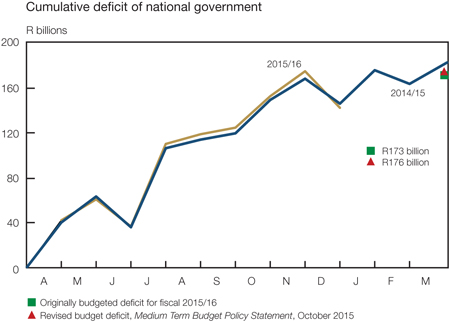
Netting national government revenue and expenditure yielded a cash-book deficit of R142 billion in the first nine months of fiscal 2015/16 – some R3,7 billion less than the cash-book deficit recorded in April–December 2014. The narrowing of the cash-book deficit emanated from a relatively faster rate of increase in revenue collections, which outperformed the rise in spending. As a ratio of GDP, the cash-book deficit amounted to 4,7 per cent in the first three quarters of fiscal 2015/16, slightly lower than the ratio of 5,1 per cent recorded in the same period of fiscal 2014/15. The full-year cash-book deficit was originally budgeted to total R173 billion in fiscal 2015/16 or 4,1 per cent of GDP. The cash-book deficit for fiscal 2015/16 was, however, revised slightly upwards to R176 billion in the 2015 MTBPS.
The primary balance21 reached a deficit of R58,7 billion in April–December 2015, or 1,9 per cent of GDP, compared with a primary deficit of R68,9 billion, or 2,4 per cent of GDP, recorded in the corresponding period of fiscal 2014/15.
In the first nine months of fiscal 2015/16, the cash-flow deficit of national government amounted to R122 billion – some R2 billion less than the deficit recorded a year earlier. The net borrowing requirement of national government narrowed by R6,3 billion to R123 billion during April–December 2015 as no large cost on the revaluation of foreign debt at redemption occurred, as had been the case in June 2014 when revaluation cost amounted to R4,0 billion.
The Budget Review 2015 projected that national government would raise R13 billion from Treasury bills and R145 billion from domestic long-term government bonds in fiscal 2015/16. As indicated in the accompanying table, the borrowing requirement in the first nine months of the fiscal year was predominantly financed through the issuance of government bonds in the domestic market but with Treasury bills also strongly utilised.
In the first nine months of fiscal 2015/16, net issues of inflation-linked bonds amounted to R40,7 billion, bringing the outstanding balance on these instruments to R399 billion at the end of December 2015. Inflation-linked bonds account for 26,2 per cent of total domestic marketable bonds. Net redemptions to the value of R0,5 billion were recorded in RSA Government Retail Savings Bonds in the first three quarters of the current fiscal year. Redemptions of these instruments have surpassed the issuance thereof since August 2012, largely owing to scheduled redemptions of retail bonds.
| Quarterly Bulletin March 2016 |
|


National government financing in fiscal 2015/16
R billions
| Item or instrument | Originally budgeted Full 2015/161 |
Actual Apr–Dec 2015 |
Actual Apr–Dec 2014 |
|||||||||
| Deficit2 |
173,1 | 122,2 | 3 | 124,5 | 3 | |||||||
| Plus: Cost/profit on revaluation of foreign debt at redemption4 |
1,4 | 1,2 | 5,3 | |||||||||
| Net borrowing requirement |
174,4 | 123,5 | 129,7 | |||||||||
| Treasury bills |
13,0 | 29,3 | 44,2 | |||||||||
| Domestic government bonds |
144,8 | 89,9 | 99,6 | |||||||||
| Foreign bonds and loans |
9,2 | -2,1 | 14,2 | |||||||||
| Change in available cash balances5 |
7,4 | 6,5 | -28,2 | |||||||||
| Total net financing6 |
174,4 | 123,5 | 129,7 | |||||||||
| 1 | Budget Review 2015 |
| 2 | Including extraordinary receipts and payments |
| 3 | Cash-flow deficit |
| 4 | Cost + profit - |
| 5 | Increase – decrease + |
| 6 | Components may not add up to totals due to rounding |
In April–December 2015, Treasury bills were issued at an average interest rate of 6,3 per cent. Conventional bonds attracted an average yield of 8,4 per cent and inflation-linked bonds an average real yield of 1,8 per cent per annum. Between March and December 2015, the average outstanding maturity of national government’s domestic marketable bonds increased from 170 months to 179 months.
Net redemptions to the value of R2,1 billion were recorded in foreign bonds and loans in April– December 2015. The average remaining maturity of foreign marketable bonds of national government shortened from 115 months at the end of March 2015 to 105 months at the end of December as no new foreign bonds were issued during the period.
National government’s available cash balances declined by R6,5 billion in the first nine months of the current fiscal year, bringing these balances to R212 billion at the end of December 2015, R153 billion of which were deposits with the Reserve Bank.
Domestic debt of national government increased markedly from R1 632 billion to R1 788 billion between March and December 2015, with domestic government bonds and Treasury bills comprising the largest share. As a ratio of annual GDP, domestic government debt reached 44,8 per cent in December 2015, higher than the ratio of 42,5 per cent recorded at the end of March.
Foreign debt of national government increased from R167 billion at the end of March 2015 to R210 billion on 31 December 2015. The depreciation of the domestic currency against other major currencies was the main reason for this increase in foreign debt. Before taking into account revaluation effects, foreign debt amounted to R114 billion at the end of December 2015. The difference between foreign debt valued at historical exchange rates and foreign debt valued at prevailing exchange rates was R95,6 billion as at 31 December 2015. In the first nine months of fiscal 2015/16, net redemptions to the value of R2,1 billion were recorded in foreign bonds and loans. Total foreign debt of national government as a ratio of GDP amounted to 5,3 per cent in December, notably higher than the ratio of 4,3 per cent recorded at the end of March 2015.
|
|
Quarterly Bulletin March 2016 |
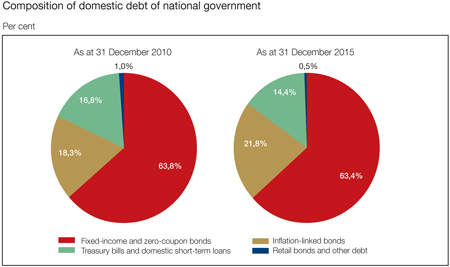
Total gross loan debt of national government increased from R1 799 billion to R1 998 billion between March and December 2015. As a ratio of GDP, total gross loan debt rose from 46,8 per cent to 50,1 per cent during the period under review. The Budget Review 2015 envisaged that total gross loan debt would reach R1 983 billion, representing 47 per cent of GDP at the end of fiscal 2015/16.
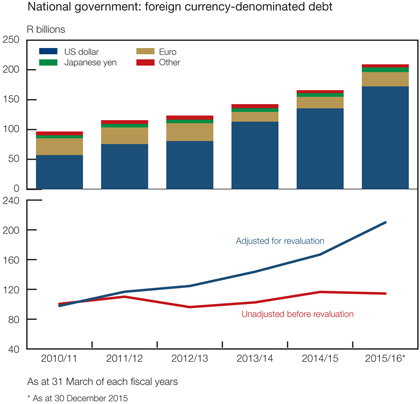
| Quarterly Bulletin March 2016 |
|


The Budget for the fiscal years 2016/17 to 2018/19
Fiscal policy stance
Against the backdrop of an exceptionally challenging global and domestic economic environment, the 2016/17 National Budget was presented on 24 February 2016. High government debt and debt service costs alongside a further downward revision of domestic growth projections reduced the fiscal space necessary to provide further fiscal stimulus. This necessitated an acceleration in the pace of fiscal consolidation.
Consequently, the budget proposes to narrow the deficit more rapidly by setting deficit targets for the next three years which are lower than the 2015 MTBPS projections. The consolidated budget deficit would be reduced to 2,4 per cent of GDP in fiscal 2018/19, with a primary surplus expected in 2016/17. This should stabilise the gross loan debt at around 51 per cent of GDP in the medium term. The proposed narrowing of the deficit is envisaged through various adjustments on both the revenue and the spending sides.
Consolidated government expenditure over the next three years would be driven mainly by spending on economic infrastructure, employment programmes, and education. The expenditure ceiling has been reduced by R25 billion over the next three years compared with the 2015 MTBPS. These reductions – R10 billion in fiscal 2017/18 and R15 billion in 2018/19 – target the compensation budgets of national- and provincial governments. Expenditure amounting to R31,8 billion would also be reprioritised over the next three years to support higher education, drought relief, and South Africa’s contributions to the New Development Bank. Of this amount, about R3 billion would be added to the contingency reserve in 2016/17 in response to elevated macroeconomic risks.
The 2016 tax proposals, in addition to raising revenues, are also aligned with the broader goals of reducing inequality, developing skills, encouraging environmental sustainability, and promoting public health. By increasing some taxes – including fuel levy, excise and capital gains taxes – the proposed tax adjustments would yield gross revenue increases of R18,1 billion in 2016/17 and R15 billion in each of the subsequent two fiscal years. These proposals would increase the tax-to-GDP ratio from 26,3 per cent in 2015/16 to 27,8 per cent in 2018/19, thereby ensuring the sustainability of the fiscal framework over the medium term.
Government’s medium-term borrowing strategy reflects a prudent approach to the management of debt in an uncertain environment. The strategy maintains a broad range of funding options in the domestic and global markets, including measures to manage refinancing risk by adjusting the composition and maturity of the debt portfolio.
Government’s net borrowing requirement – the amount needed to finance the budget deficit – is expected to decrease from R173 billion in fiscal 2015/16 to R151 billion in 2018/19. Gross bond issuances in the domestic market in fiscal 2018/19 are projected to be the lowest since 2011/12, reflecting the outcome of fiscal consolidation. South Africa’s deep and liquid domestic capital markets and access to global financial markets are expected to continue facilitating the financing of government’s shortfall. The domestic capital market will remain the main source of financing, limiting government’s exposure to fluctuations in exchange rates and international investor appetite for emerging-market assets.
The fiscal outlook presented in the National Budget reflects a downward revision of South Africa’s real GDP growth rate to 0,9 per cent in 2016, down from an estimated 1,7 per cent at the time of the 2015 MTBPS. The weaker outlook resulted from, inter alia, lower commodity prices, higher borrowing costs, diminished business and consumer confidence, and drought.
|
|
Quarterly Bulletin March 2016 |
Summary outcome of revised estimates1
| Revised estimate |
Medium-term estimates |
|||||||||||||||||||||||||||||||
| Component |
|
|
||||||||||||||||||||||||||||||
| 2015/16 | 2016/17 | 2017/18 | 2018/19 | |||||||||||||||||||||||||||||
| R bn | Annual change % |
R bn | Annual change % |
R bn | Annual change % |
R bn | Annual change % |
|||||||||||||||||||||||||
| Expenditure |
1 247,3 | 10,2 | 1 318,3 | 5,7 | 1 421,7 | 7,8 | 1 540,0 | 8,3 | ||||||||||||||||||||||||
| State debt cost2 |
129,1 | 12,5 | 147,7 | 14,4 | 161,9 | 9,6 | 178,6 | 10,3 | ||||||||||||||||||||||||
| Current payments |
199,0 | 5,0 | 212,1 | 6,6 | 221,7 | 4,6 | 233,8 | 5,4 | ||||||||||||||||||||||||
| Transfers and subsidies |
874,0 | 8,2 | 933,2 | 6,8 | 1 010,0 | 8,2 | 1 093,9 | 8,3 | ||||||||||||||||||||||||
| Payments for capital assets |
16,4 | 2,0 | 14,4 | -12,2 | 13,0 | -9,7 | 13,8 | 5,8 | ||||||||||||||||||||||||
| Payments for financial assets3 |
28,8 | 666,6 | 4,9 | -83,0 | 5,0 | 2,4 | 5,0 | 0,5 | ||||||||||||||||||||||||
| Contingency reserve and unallocated funds |
— | — | 6,0 | — | 10,0 | — | 15,0 | — | ||||||||||||||||||||||||
| Expenditure as ratio of GDP |
30,6 | % | 30,0 | % | 29,9 | % | 29,8 | % | ||||||||||||||||||||||||
| Revenue |
1 074,5 | 11,3 | 1 162,0 | 8,1 | 1 264,3 | 8,8 | 1 388,7 | 9,8 | ||||||||||||||||||||||||
| Revenue as ratio of GDP |
26,4 | % | 26,5 | % | 26,6 | % | 26,9 | % | ||||||||||||||||||||||||
| Tax revenue (net of SACU4 payments |
1 018,7 | 9,0 | 1 135,3 | 11,5 | 1 245,4 | 9,7 | 1 371,8 | 10,1 | ||||||||||||||||||||||||
| Non-tax revenue5 |
55,8 | 80,7 | 26,7 | -52,3 | 18,9 | 29,1 | 16,9 | -10,3 | ||||||||||||||||||||||||
| Budget balance6 before borrowing and debt repayment |
-172,8 | -156,3 | -157,4 | -151,3 | ||||||||||||||||||||||||||||
| Balance as ratio of GDP |
-4,2 | % | -3,6 | % | -3,3 | % | -2,9 | % | ||||||||||||||||||||||||
| Balance as ratio of GDP: October 2015 MTBPS7 |
-4,3 | % | -3,7 | % | -3,7 | % | -3,5 | % | ||||||||||||||||||||||||
| 1 | Components may not add up to totals due to rounding |
| 2 | Includes interest, management cost and the cost of raising loans |
| 3 | Consists mainly of lending to public corporations or making equity investments in them for policy purposes. Previously included in transfers and subsidies. |
| 4 | SACU |
| 5 | Including extraordinary receipts |
| 6 | Deficit - / surplus + |
| 7 | MTBPS 2015 |
In this environment, fiscal risks remain significant, with the potential to undermine government’s consolidation plans. There is a risk that economic growth may be weaker than expected – which would reduce revenue, thus making it difficult to stabilise debt. Additional risks include further interest rate increases, a weaker exchange rate of the rand, and rising inflation, which would raise the cost of borrowing and increase the stock of debt. Financial developments in state-owned companies and threats of credit rating downgrades also pose risks to fiscal developments.
The tax proposals introduced in the 2016 Budget to increase revenue included:
| • | an increase in the taxes and levies on fuel; |
| • | an increase in tobacco and alcohol excise duties; |
| • | an increase in capital gains taxes; |
| • | an increase in transfer duties on property above R10 million; |
| • | an increase in plastic bag and tyre levies as well as motor vehicle emissions tax; and |
| • | the imposition of a tax on sugar-sweetened beverages. |
| Quarterly Bulletin March 2016 |
|


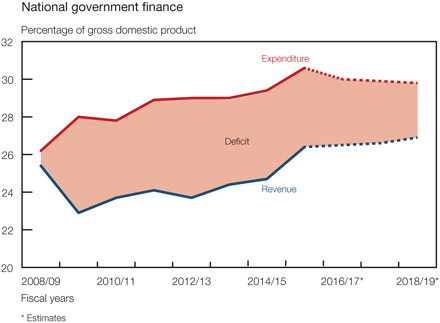
A more subtle mechanism to raise the effective tax rate was to keep the adjustment of tax brackets below the rate of inflation for personal income taxpayers in the higher income categories, thereby depending on fiscal drag to boost tax revenue. The package of measures introduced in the 2016 Budget spread the burden of additional taxation over several revenue sources in a way that would limit the dampening effect on growth in the short term. As a ratio of GDP, the cash-book deficit of national government was projected to narrow from 4,2 per cent in the 2015/16 fiscal year to 2,9 per cent by fiscal 2018/19.
In fiscal year 2015/16, the primary balance was estimated to reach a deficit of 1,1 per cent of GDP. This could be compared with a deficit ratio of 1,3 per cent in fiscal 2014/15. The primary deficit as a ratio of GDP was projected to narrow to, on average, 0,1 per cent over the medium term.
Government’s borrowing plans continue to focus on short- and long-term borrowing in the domestic market. Short-term financing was expected to focus on Treasury bills, bringing the outstanding stock to R235 billion at the end of fiscal 2016/17. In respect of domestic long-term borrowing, government introduced a new 13-year maturity inflation-linked bond which would be introduced in 2016/17.
National government financing
R billions
| Revised Estimate |
Medium-term estimates |
|||||||||||||||
| Item or instrument |
|
|
||||||||||||||
| 2015/16 | 2016/17 | 2017/18 | 2018/19 | |||||||||||||
| Deficit/net borrowing requirement |
172,8 | 156,3 | 157,4 | 151,3 | ||||||||||||
| Treasury bills |
13,0 | 25,0 | 33,0 | 23,0 | ||||||||||||
| Domestic government bonds issued (net)1 |
144,5 | 116,2 | 106,7 | 107,9 | ||||||||||||
| Foreign bonds and loans (net)2 |
12,4 | 7,8 | 17,9 | 19,6 | ||||||||||||
| Changes in cash and other balances3 |
3,0 | 7,3 | -0,2 | 0,9 | ||||||||||||
| Total net financing4 |
172,8 | 156,3 | 157,4 | 151,3 | ||||||||||||
| 1 | Including retail bonds |
| 2 | Including revaluation of foreign bonds and loans |
| 3 | Increase - decrease + |
| 4 | Components may not add up to totals due to rounding |
|
|
Quarterly Bulletin March 2016 |
Domestic short-term borrowing consists of Treasury bill issuances and borrowing from the public sector through the CPD, into which provinces and some state-owned companies are required to invest their surplus cash. Treasury bill issuances were expected to increase from R13 billion in fiscal 2015/16 to R23 billion in fiscal 2018/19.
In fiscal 2015/16, investment in government’s retail bonds amounted to R2,1 billion, of which R1 billion were reinvestments of maturing bonds and capitalised interest. Government indicated that it would consider introducing additional retail bond products to help improve the country’s saving culture.
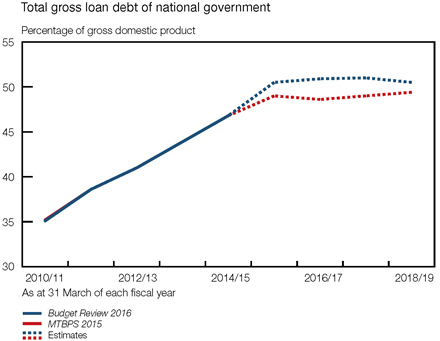
Gross loan debt of national government was projected to amount to R2 056 billion at the end of fiscal 2015/16, or 50,5 per cent of GDP. Relative to GDP, gross loan debt was expected to average 50,8 per cent over the medium term, with the level of debt projected to amount to R2 607 billion at the end of March 2019.
Over the three-year projection period, consolidated government expenditure was expected to increase by 7,1 per cent per annum from R1 381 billion in fiscal 2015/16 to R1 695 billion in 2018/19. The increase in expenditure would be mainly driven by spending on economic infrastructure, employment programmes, and education, even though the provision for debt-service cost would remain the fastest-growing spending category.
During fiscal 2014/15, national government expenditure amounted to R639 billion, an underspending of roughly 1,6 per cent. However, underspending had decreased across national, provincial and local government.
Of the nationally raised funds available after provision for debt service costs and the contingency reserve, 47,7 per cent would be allocated to national government, 43,2 per cent to provincial government, and 9,1 per cent to local government over the medium term. Provincial budgets were expected to grow in both nominal and real terms over the medium term, while local government budgets would face tough fiscal choices amid slowing growth in transfer receipts and increasing cost of providing services.
| Quarterly Bulletin March 2016 |
|


The public-sector borrowing requirement, as envisaged in the 2016 Budget remained broadly unchanged at 6,2 per cent of GDP in fiscal 2015/16 and was forecasted to decline to 3,9 per cent by fiscal 2018/19. The narrowing of the borrowing requirement over the three years to fiscal 2018/19 mainly reflected government’s budget consolidation measures and lower borrowing by state-owned companies.
Public-sector borrowing requirement1
R billions
| Revised estimate |
Medium-term estimates |
|||||||||||||||
| Level of government |
|
|
||||||||||||||
| 2015/16 | 2016/17 | 2017/18 | 2018/19 | |||||||||||||
| National government |
172,8 | 156,3 | 157,4 | 151,3 | ||||||||||||
| Extra-budgetary institutions |
3,5 | 1,0 | 0,3 | -2,5 | ||||||||||||
| Social security funds |
-19,2 | -20,6 | -23,4 | -25,9 | ||||||||||||
| Provincial governments |
0,4 | 1,0 | -0,3 | -0,6 | ||||||||||||
| Local authorities |
9,5 | 9,8 | 10,0 | 10,9 | ||||||||||||
| General government borrowing2 |
167,0 | 147,5 | 144,0 | 133,2 | ||||||||||||
| Per cent of gross domestic product |
4,1 | % | 3,4 | % | 3,0 | % | 2,6 | % | ||||||||
| State-owned companies |
87,2 | 72,9 | 83,5 | 67,1 | ||||||||||||
| Public-sector borrowing requirement2 |
254,2 | 220,4 | 227,5 | 200,3 | ||||||||||||
| Per cent of gross domestic product |
6,2 | % | 5,0 | % | 4,8 | % | 3,9 | % | ||||||||
| Estimated gross domestic product |
4 073,2 | 4 388,4 | 4 750,7 | 5 161,3 | ||||||||||||
| 1 | Deficit (+), surplus (-) |
| 2 | Excluding RDP Fund. Components may not add up to totals due to rounding |
The public-sector borrowing requirement would be partially offset by surpluses accumulated by social security funds, provincial governments as well as other public entities. Social security funds continued to hold large cash surpluses; these cash surpluses were projected to increase from R19,2 billion in fiscal 2015/16 to R25,9 billion in fiscal 2018/19.
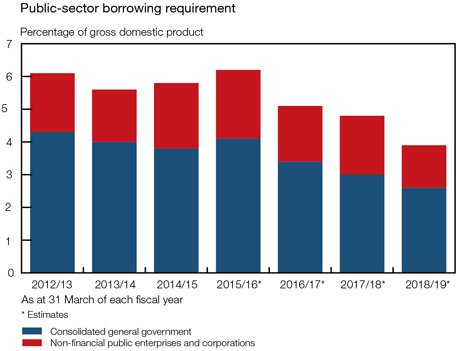
|
|
Quarterly Bulletin March 2016 |
The borrowing requirement of non-financial public enterprises and corporations was projected to increase marginally from 2,0 per cent of GDP in fiscal 2014/15 to 2,1 per cent of GDP in fiscal 2015/16 before trending down to, on average, 1,6 per cent over the medium term.
Total public-sector debt – the sum of the gross loan debt of national government, state-owned companies and local government – equalled 61,9 per cent of GDP in fiscal 2014/15. This ratio is projected to decrease in line with the slower accumulation of debt and lower borrowing by state-owned companies.
Capital expenditure by state-owned companies was projected to reach R337 billion over the medium term, with Eskom, Transnet and the South African National Roads Agency Limited (SANRAL) accounting for the bulk of the expenditure. This would further raise the asset base of state-owned companies, which had already increased from R640 billion in fiscal 2010/11 to R1 042 billion in fiscal 2014/15, and at the same time assist in debottlenecking the South African economy.
| Quarterly Bulletin March 2016 |
|


Statement of the Monetary Policy Committee
28 January 2016
Issued by Lesetja Kganyago, Governor of the South African Reserve Bank, at a meeting of the Monetary Policy Committee in Pretoria
Since the previous meeting of the Monetary Policy Committee (MPC), the inflation outlook has deteriorated significantly, mainly due to exchange rate and food price developments. The rand has depreciated considerably in response to domestic and external developments, while the impact of the worsening drought on food prices is becoming increasingly evident. The inflation outlook is complicated by the fact that the domestic growth outlook has weakened further. The global backdrop has also become more challenging, particularly for emerging markets, and downside risks to the sustainability of the recovery in the advanced economies have increased.
The year-on-year inflation rate, as measured by the consumer price index (CPI) for all urban areas, stood at 5,2 per cent in December, up from 4,8 per cent in November. This increase was broadly in line with both market and the Bank’s expectations, and reflected in part the delayed response of food price inflation to the impact of the drought on agricultural prices. Food and non-alcoholic beverages inflation accelerated to 5,9 per cent, up from 4,8 per cent previously, and contributed 0,9 percentage points to the overall CPI outcome. Goods price inflation increased to 4,6 per cent from 3,8 per cent previously, mainly due to higher petrol and food prices, while services price inflation remained unchanged at 5,7 per cent. The Bank’s measure of core inflation – which excludes food, petrol and electricity – remained relatively stable at 5,2 per cent, up from 5,1 per cent in November.
Producer price inflation (PPI) for final manufactured goods increased from 4,3 per cent in November to 4,8 per cent in December. The category of food, beverages and tobacco products contributed 2,1 percentage points to the December outcome.
The latest inflation forecast of the Bank shows a marked deterioration. Having averaged 4,6 per cent in 2015, inflation is now expected to average 6,8 per cent in 2016 and 7,0 per cent in 2017. This compares with the previous forecast of 6,0 per cent and 5,8 per cent for these years. Inflation is still expected to breach the upper end of the target range in the first quarter of 2016, but is now expected to remain outside the target range for the entire forecast period. A peak of 7,8 per cent is expected in the fourth quarter of 2016 and in the first quarter of 2017, followed by a moderation to 6,2 per cent in the final quarter of that year (5,7 per cent previously). The changes in the forecast are mainly due to a significantly more depreciated real exchange rate assumption and higher-than-expected food price inflation. These upward revisions more than offset the impact of the lower international oil price assumption. The electricity price assumption remains unchanged from the previous meeting.
The forecast for core inflation has also deteriorated, although to a lesser degree than that for headline inflation. Core inflation is expected to breach the upper end of the target range for four consecutive quarters from the third quarter of 2016, with a peak of 6,4 per cent in the final quarter of 2016 and in the first quarter of 2017. This measure is expected to average 6,0 per cent in 2016 and 5,9 per cent in 2017, moderating to 5,5 per cent by the final quarter of next year. The deterioration in this forecast is mainly due to the significantly more depreciated real exchange rate assumption and expected higher unit labour costs.
Inflation expectations, as reflected in the survey conducted by the Bureau for Economic Research (BER), show a marginal upward movement for 2016 but a more pronounced deterioration for 2017, with average inflation expectations increasing from 5,9 per cent to 6,2 per cent, mainly due to changes in the expectations of trade union officials. Five-year inflation expectations edged up to 6,1 per cent, also mainly due to changes in the expectations of trade union officials. This survey was concluded prior to the depreciation of the rand in December, so the outcome of the next survey will be closely monitored.
The impact of the rand exchange rate weakness on market forecasts is evident in the changes to the Reuters Econometer survey between December and January. Median inflation expectations
|
|
Quarterly Bulletin March 2016 |
were stable in November and December, at 5,9 per cent and 5,8 per cent for 2016 and 2017, but increased in January to 6,0 per cent and 6,1 per cent. The median forecast for 2018 is 5,7 per cent. Break-even inflation rates also increased significantly across all maturities, with the five-year maturities rising to current levels of around 7,3 per cent.
The global growth outlook appears to have worsened somewhat in recent weeks, contributing to a correction in global equity markets. Although most of the downward revisions to global growth have been due to the deteriorating prognosis for emerging markets, more recently the risks of a slowdown in the United States (US) have increased, amid declining consumer expenditure and the impact of low oil prices and a strengthening dollar on business investment. However, despite the fourth-quarter slowdown, growth of around trend is still generally expected. While the recovery in the euro area remains modest, the growth forecasts for the United Kingdom (UK) and Japan have generally been revised down.
Emerging market growth prospects, particularly for commodity-producing countries, remain constrained amid persistent capital outflows. The outlook is heavily influenced by the slowing Chinese economy, but there are conflicting views as to whether a hard landing can be expected. There is also uncertainty regarding the efficacy of policy reforms that have been undertaken. Perceptions of the modifications to the renminbi exchange rate regime as well as equity market volatility have added to this uncertainty.
Global inflation pressures remain benign, reinforced by a further decline in international oil prices, but there have been upward revisions in some emerging markets. Monetary policies in most advanced economies are expected to remain accommodative. The slow pace of normalisation in the US is expected to continue, but further easing is expected in Japan and the euro area, while the Bank of England has indicated that monetary policy tightening is still some way off. Divergent monetary policy paths are also expected in the emerging markets. Commodity importers with sound macroeconomic fundamentals have scope for further easing, while some commodity producers, particularly those experiencing exchange rate-induced inflationary pressures, have been in a tightening mode despite slowing growth.
The exchange rate of the rand has depreciated markedly since the previous meeting of the MPC, contributing significantly to the deterioration in the inflation forecast. Since the previous meeting, the rand has depreciated by 13,5 per cent against the US dollar, by 15,2 per cent against the euro, and by 12,9 per cent on a trade-weighted basis. The muted reaction of the exchange rate to the start of US Fed normalisation suggests that this move was more or less priced in, but this was overshadowed by the impact of domestic developments on the exchange rate earlier in the month.
In early January, the rand reacted further to growing concerns about the outlook for the Chinese economy. While most emerging market currencies were affected, since the previous meeting of the MPC, the rand’s depreciation has been in excess of most of its emerging market peers. Other indicators, such as widening credit spreads and the sharp increase in domestic bond yields, point to a higher risk premium attached to South African assets.
Although the rand may appear to be undervalued at current levels, divergences from equilibrium can persist for some time. Furthermore, the current-account adjustment remains slow, with the deficit expected to widen further in the face of continued weakness in commodity prices and higher, drought-induced agricultural imports. The financing of the deficit will also be more challenging in an environment of persistent capital outflows from emerging markets. Since the previous MPC meeting, non-residents have been net sellers of South African bonds and equities.
From a monetary policy perspective, a key risk to the inflation outlook is not only the possibility of further depreciation, but also the extent to which there is a change in the pass-through dynamics, which have been relatively muted in recent years.
The domestic economic growth outlook remains weak, with further downward revisions to the Bank’s forecast. Growth in 2015 is estimated to have averaged around 1,3 per cent and is expected to moderate to 0,9 per cent in 2016 before accelerating to 1,6 per cent in 2017. This compares with the previous forecast of 1,5 per cent and 2,1 per cent for 2016 and 2017.
| Quarterly Bulletin March 2016 |
|


The Bank’s estimate of potential output growth was revised down from 1,9 per cent to 1,5 per cent for 2016, and from 2,1 per cent to 1,6 per cent for 2017. Although there was a marginal increase in the Bank’s leading business cycle indicator in November, the trend remains negative, consistent with the subdued outlook. The RMB/BER business confidence index declined further in the fourth quarter of 2015, to its lowest level in five years.
High frequency data indicate that the mining sector remains under pressure in the face of declining commodity prices and weak demand. Despite a recovery in the third quarter, the manufacturing sector outlook remains negative. Capacity utilisation has declined further, and the Barclays Purchasing Managers’ Index (PMI), which has remained well below the neutral level for some months, is consistent with a contraction in the fourth quarter. The continuing drought means that near-term respite for the agricultural sector is unlikely.
Underlying this growth outlook is the continued low growth in gross fixed capital formation, with private sector investment contracting in the third quarter. The prospects for formal sector employment growth therefore remain bleak: the Quarterly Employment Statistics survey of Statistics South Africa reports static employment levels over the four quarters to the third quarter of 2015.
Growth in consumption expenditure by households moderated in the third quarter, with contractions in spending on both durable and non-durable goods. Domestic motor vehicle sales reflected this weakness, although recent retail sales data, particularly with respect to semi-durable goods, suggest there may have been a modest improvement in the final quarter of last year. However, the decline in the FNB/BER consumer confidence index in the fourth quarter of 2015 to a 14-year low suggests that household consumption expenditure is likely to remain constrained.
Credit extension to households has increased marginally recently, particularly with respect to mortgage and general loans. However, these increases remain low and credit growth remains negative in real terms while instalment sale credit continues to slow. Tighter National Credit Act Regulations related to affordability assessments became effective from September and are expected to constrain credit to households further.
While credit extension to corporates remains robust, it is relatively narrow-based and reflects, in part, increased demand for mortgage loans by property funds.
Wage and salary trends continue to contribute to the persistence of inflation at higher levels. Year-on-year growth in nominal salaries and wages, while lower in the third quarter of last year, was still above the upper end of the inflation target range. After adjusting for labour productivity increases, growth in total unit labour costs slowed marginally to 5,0 per cent in the third quarter. Andrew Levy Employment Publications reported an average wage settlement rate in collective bargaining agreements of 7,7 per cent in 2015.
Food prices remain a significant risk to the inflation outlook. The surge in agricultural commodity prices since early 2015 is beginning to impact on consumer food price inflation, and these pressures are likely to increase in light of the persistent drought and the weaker exchange rate – despite continued moderation in global food prices. Although previous forecasts had incorporated an expectation of higher food price inflation, recent adverse developments have resulted in a further deterioration of the Bank’s food price forecast, which is now expected to peak at around 11 per cent in the fourth quarter of this year.
International oil prices have declined to multi-year lows since the previous MPC meeting. The global oversupply and consequent low prices are expected to persist in the short term, particularly following the lifting of sanctions against Iran. But with marginal producers expected to reduce production or even shut down, prices are expected to follow a moderate upward trend over the forecast period. The impact of this upward trend on domestic petrol prices has contributed to the higher inflation forecast for 2017 in particular. The potentially favourable impact of the international oil price decline on domestic petrol prices has been more or less offset by the depreciation of the rand. Petrol prices have declined only marginally since November, and the current under-recovery suggests a possible increase of around 7 cents per litre in February.
|
|
Quarterly Bulletin March 2016 |
Previously, the Committee expressed concerns about the growing risks to the inflation outlook, mainly due to exchange rate and food price risks. These risks appear to be materialising and have contributed to the significant deterioration of the inflation forecast. The intensity of the drought has brought about a sizeable revision to the Bank’s food price outlook, while the exchange rate has depreciated significantly more than expected. While oil prices have a moderating impact on the inflation outlook in the near term, base effects and the assumed upward trajectory contribute to the adverse inflation outlook for 2017. The forecast also incorporates changes in administered prices, in particular for water, while an upside risk remains regarding electricity tariff increases.
The MPC assesses the risks to the inflation outlook to be relatively balanced. While there may be potential for further rand weakness in the short term given the negative outlook for emerging markets in general as well as domestic factors, the lower observed exchange rate pass-through remains a mitigating factor. However, there is still uncertainty as to the sustainability of this low pass-through, particularly in the face of large nominal exchange rate movements as recently experienced. The upside risk from the exchange rate is more or less offset by the downside risks from the international oil price assumptions and projected food price inflation.
Demand pressures remain constrained, and the focus of the MPC will therefore be on the evolution of inflation expectations and indications of second-round effects of the exogenous shocks to the inflation outlook. There are some indications that inflation expectations may have deteriorated, but the extent of this will become more evident in the coming surveys. The trend in core inflation provides some indication of the possible emergence of second-round effects. Although core inflation has remained relatively contained in recent months, it is expected to accelerate and to exceed the upper end of the inflation target range for some time in response to exchange rate and wage pressures.
The Committee faced the continuing dilemma of a deteriorating inflation environment and a worsening growth outlook. The risks to the growth outlook are assessed to be on the downside, despite the downward revision to the forecast.
Given the deterioration in the inflation outlook, the MPC has decided to increase the repurchase rate by 50 basis points to 6,75 per cent per annum, effective from 29 January 2016. Three MPC members supported a 50 basis point increase, two members preferred a 25 basis point increase; while one member preferred no change.
The MPC still views the stance of monetary policy to be accommodative. Despite the rate increase, the real repurchase rate remains low given the higher-than-expected inflation over the period.
The MPC will remain focused on its core mandate of containing inflation within a flexible inflation-targeting framework. As noted on a number of occasions in the past, the MPC is of the view that the growth constraints facing the economy are primarily of a structural nature and cannot be solved solely by monetary policy. Nevertheless, the MPC remains sensitive, to the extent possible, to the possible negative impact of monetary policy actions on cyclical growth. As before, future moves will be highly data-dependent.
| Quarterly Bulletin March 2016 |
|


Annexure
Summary of assumptions: Monetary Policy Commitee meeting on 28 January 2016*
| 1. | Foreign-sector assumptions |
| Percentage changes (unless otherwise indicated) | Actual | Forecast | ||||||||||||||||||
| 2013 | 2014 | 2015 | 2016 | 2017 | ||||||||||||||||
| 1. Real GDP growth in South Africa’s major trading partner countries |
3,0 | % | 3,1 | % | 2,8 | % | 2,9 | % | 3,3 | % | ||||||||||
| 2. International commodity prices in US$ (excluding oil) |
-6,4 | % | -9,8 | % | -19,3 | % | -15,0 | % | 1,0 | % | ||||||||||
| (-18,2 | %) | (-7,0 | %) | (0,5 | %) | |||||||||||||||
| 3. Brent crude (US$/barrel) |
108,8 | 99,2 | 52,2 | 41,0 | 50,0 | |||||||||||||||
| (54,9 | ) | (56,0 | ) | (60,0 | ) | |||||||||||||||
| 4. World food prices (US$) |
-1,6 | % | -3,8 | % | -18,5 | % | -2,8 | % | 2,7 | % | ||||||||||
| (-18,0 | %) | (-2,8 | %) | (2,7 | %) | |||||||||||||||
| 5. International wholesale prices |
0,3 | % | -0,1 | % | -3,4 | % | -1,0 | % | 1,0 | % | ||||||||||
| (-3,2 | %) | (0,2 | %) | (0,8 | %) | |||||||||||||||
| 6. Real effective exchange rate of the rand (index 2010 = 100) |
81,91 | 79,17 | 80,06 | 70,45 | 70,45 | |||||||||||||||
| (80,41 | ) | (77,00 | ) | (77,00 | ) | |||||||||||||||
| 7. Real effective exchange rate of the rand |
-10,1 | % | -3,3 | % | 1,1 | % | -12,0 | % | 0,0 | % | ||||||||||
| (1,6 | %) | (-4,2 | %) | (0,0 | %) | |||||||||||||||
| 2. | Domestic-sector assumptions |
| Percentage changes (unless otherwise indicated) | Actual | Forecast | ||||||||||||||||||
| 2013 | 2014 | 2015 | 2016 | 2017 | ||||||||||||||||
| 1. Real government consumption expenditure |
3,3 | % | 1,9 | % | 0,3 | % | 1,5 | % | 1,5 | % | ||||||||||
| (0,5 | %) | (1,5 | %) | (1,5 | %) | |||||||||||||||
| 2. Administered prices |
8,7 | % | 6,7 | % | 1,7 | % | 8,0 | % | 9,9 | % | ||||||||||
| (1,7 | %) | (7,7 | %) | (8,1 | %) | |||||||||||||||
| – Petrol price |
11,8 | % | 7,2 | % | -10,7 | % | 7,9 | % | 12,4 | % | ||||||||||
| (-10,6 | %) | (7,2 | %) | (6,4 | %) | |||||||||||||||
| – Electricity price |
8,7 | % | 7,2 | % | 9,4 | % | 12,2 | % | 13,0 | % | ||||||||||
| (9,4 | %) | (12,2 | %) | (13,0 | %) | |||||||||||||||
| 3. Potential growth |
2,1 | % | 1,8 | % | 1,6 | % | 1,5 | % | 1,6 | % | ||||||||||
| (2,1 | %) | (1,9 | %) | (1,8 | %) | (1,9 | %) | (2,1 | %) | |||||||||||
| 4. Repurchase rate (per cent) |
5,00 | 5,57 | 5,89 | 6,25 | 6,25 | |||||||||||||||
| (5,86 | ) | (6,00 | ) | (6,00 | ) | |||||||||||||||
The figures in brackets represent the previous assumption of the Monetary Policy Committee.
| * | For an explanation of foreign-sector assumptions and domestic-sector assumptions, see pages 100 and 101. |
|
|
Quarterly Bulletin March 2016 |
Selected forecast results: Monetary Policy
Committee meeting on 28 January 2016
Selected forecast results (quarterly)
| Year-on-year percentage change |
Actual | Forecast | ||||||||||||||||||||||||||||||||||||||||||||||||||||||||||||||||||||||||||||||
| 1 | 2 | 3 | 4 | 2014 | 1 | 2 | 3 | 4 | 2015 | 1 | 2 | 3 | 4 | 2016 | 1 | 2 | 3 | 4 | 2017 | |||||||||||||||||||||||||||||||||||||||||||||||||||||||||||||
| 1. Headline inflation |
5,9 | 6,5 | 6,2 | 5,7 | 6,1 | 4,2 | 4,6 | 4,7 | 4,9 | 4,6 | 6,2 | 6,1 | 7,0 | 7,8 | 6,8 | 7,8 | 7,3 | 6,7 | 6,2 | 7,0 | ||||||||||||||||||||||||||||||||||||||||||||||||||||||||||||
| (4,7 | ) | (5,0 | ) | (4,6 | ) | (6,4 | ) | (5,6 | ) | (5,7 | ) | (6,1 | ) | (6,0 | ) | (5,9 | ) | (5,8 | ) | (5,8 | ) | (5,7 | ) | (5,8 | ) | |||||||||||||||||||||||||||||||||||||||||||||||||||||||
| 2. Core inflation |
5,4 | 5,6 | 5,7 | 5,7 | 5,6 | 5,7 | 5,6 | 5,3 | 5,2 | 5,5 | 5,4 | 5,9 | 6,3 | 6,4 | 6,0 | 6,4 | 6,1 | 5,7 | 5,5 | 5,9 | ||||||||||||||||||||||||||||||||||||||||||||||||||||||||||||
| (5,3 | ) | (5,3 | ) | (5,5 | ) | (5,5 | ) | (5,5 | ) | (5,5 | ) | (5,6 | ) | (5,5 | ) | (5,4 | ) | (5,4 | ) | (5,3 | ) | (5,3 | ) | (5,4 | ) | |||||||||||||||||||||||||||||||||||||||||||||||||||||||
The figures in brackets represent the previous forecasts of the Monetary Policy Committee.
Selected forecast results (annual)
| Per cent |
Actual | Forecast | ||||||||||||||||||
| 2013 | 2014 | 2015 | 2016 | 2017 | ||||||||||||||||
| 1. Real gross domestic product (GDP) growth |
2,2 | % | 1,5 | % | 1,3 | % | 0,9 | % | 1,6 | % | ||||||||||
| (1,4 | %) | (1,5 | %) | (2,1 | %) | |||||||||||||||
| 2. Current account as a ratio to nominal GDP |
-5,8 | -5,4 | -4,2 | -5,2 | -5,3 | |||||||||||||||
| (-4,2 | ) | (-4,6 | ) | (-4,6 | ) | |||||||||||||||
The figures in brackets represent the previous forecasts of the Monetary Policy Committee.
| Quarterly Bulletin March 2016 |
|


Foreign-sector assumptions
| 1. | Trading partner gross domestic product (GDP) growth is determined broadly using the Global Projection Model (GPM) of the International Monetary Fund (IMF), which is then adjusted to aggregate the GDP growth rates of South Africa’s major trading partners on a trade-weighted basis. Individual projections are done for the four largest trading partners: the euro area, China, the United States (US) and Japan. The remaining trading partners are grouped into three regions: Emerging Asia (excluding China), Latin America and the Rest of Countries bloc. The assumption takes account of country-specific ‘consensus’ forecasts as well as IMF regional growth prospects. |
| 2. | The commodity price index is a weighted aggregate price index of the major South African export commodities based on 2010 prices. The composite index represents the total of the individual commodity prices multiplied by their smoothed export weights. Commodity price prospects generally remain commensurate with global liquidity as well as commodity supply/ demand pressures as reflected by the pace of growth in the trading partner countries. |
| 3. | The Brent crude oil price is expressed in US dollar per barrel. The assumption incorporates an analysis of the factors of supply, demand (using global growth expectations) and inventories of oil (of all grades) as well as the expectations of the US Energy Information Administration (EIA), Organization of the Petroleum Exporting Countries (OPEC) and Reuters. |
| 4. | World food prices uses the composite food price index of the Food and Agriculture Organization of the United Nations (FAO) in US dollar. The index is weighted using average export shares and represents the monthly change in the international prices of a basket of five food commodity price indices (cereals, vegetable oil, dairy, meat and sugar). World food price prospects incorporate selected global institution forecasts for food prices as well as imbalances from the anticipated trend in international food supplies relative to expected food demand pressures. |
| 5. | International wholesale prices refers to a weighted aggregate of the producer price indices (PPIs) of South Africa’s major trading partners, as per the official real effective exchange rate calculation of the South African Reserve Bank (the Bank). Although individual country consumer price inflation (CPI) forecasts provide a good indication for international wholesale price pressures, the key drivers of the assumed trend in global wholesale inflation are oil and food prices as well as expected demand pressures emanating from the trends in the output gaps of the major trading partner countries. Other institutional forecasts for international wholesale prices are also considered. |
| 6. | The real effective exchange rate is the nominal effective exchange rate of the rand deflated by the producer price differential between South Africa and an aggregate of its trading partner countries (as reflected in the Quarterly Bulletin published by the Bank). Although the nominal rate is a weighted average of South Africa’s 20 largest trading partners, particular focus is placed on the rand outlook against the US dollar, the euro, the Chinese yuan, the British pound and the Japanese yen. The assumed trend in the real effective exchange rate remains constant from the latest available quarterly average over the projection period. However, due to the time delay in the calculation of the real effective exchange rate, the most recent trend in the nominal effective exchange rate is adjusted with the assumed trend for the domestic and foreign price differential for the current quarter. This may result in a technical annual adjustment over the current and next forecast year that differs from zero. |
|
|
Quarterly Bulletin March 2016 |
Domestic-sector assumptions
| 1. | Government consumption expenditure (real) is broadly based on the most recent National Treasury budget projections. However, since these projections take place twice a year, the most recent actual data points also play a significant role in the assumptions process. |
| 2. | Administered prices represent the total of regulated and non-regulated administered prices as reflected by Statistics South Africa (Stats SA). Their weight in the consumer price index basket is 18,48 per cent and the assumed trend over the forecast period is largely determined by the expected pace of growth in petrol prices, electricity tariffs, school fees as well as water and other municipal assessment rates. |
The petrol price is an administered price and comprises 5,68 per cent of the overall basket. The basic fuel price (which currently accounts for roughly half of the petrol price) is determined by the exchange rate and the price of petrol quoted in US dollars at refined petroleum centres in the Mediterranean, the Arab Gulf and Singapore. The remainder of the petrol price is made up of wholesale and retail margins as well as the fuel levy and contributions to the Road Accident Fund (RAF). Since most taxes and retail margins are changed once a year, the assumed trajectory of the petrol price largely reflects the anticipated trend in oil prices and the exchange rate.
The electricity price is an administered price measured at the municipal level with a weight of 4,13 per cent in the CPI basket. Electricity price adjustments generally take place in July and August of each year, and the assumed pace of increase over the forecast period reflects the multi-year price determination (MYPD) by the National Energy Regulator in respect of Eskom, with a slight adjustment for measurement at municipal level.
| 3. | The pace of potential growth is derived from the Bank’s semi-structural potential output model. The measurement accounts for the impact of the financial cycle on real economic activity and introduces economic structure via the relationship between potential output and capacity utilisation in the manufacturing sector (See South African Reserve Bank Working Paper Series WP/14/08). |
| 4. | The repurchase rate, (commonly called the ‘repo rate’) is the official monetary policy instrument and represents the interest rate at which banks borrow money from the SARB. Although the rate is held constant over the forecast period, this assumption is relaxed in alternative scenarios where, for instance, the policy rate responds to deviations of output from its potential and the gap between future inflation and the inflation target, in other words, via a stylised ‘Taylor rule’, one that is based on market expectations of the future path of the policy rate, and other paths (as requested). |
| Quarterly Bulletin March 2016 |
|

Business cycles in South Africa from 2009 to 2013
J C Venter1
Introduction
The South African Reserve Bank (the Bank) had previously identified reference turning points in the cyclical movement of the South African economy for the period 1946 to 2009. These historic upper (peaks) and lower (troughs) turning points in the business cycle were discussed in various articles and notes published in earlier issues of the Bank’s Quarterly Bulletin. In addition, the reference chronology of peaks and troughs in the South African business cycle is regularly published on page S-157 of the Quarterly Bulletin. The most recently identified trough in the business cycle occurred in August 2009.2
The purpose of this article is to identify a reference peak in the business cycle, following the trough in August 2009. The next section briefly describes the methodology applied by the Bank in identifying a reference turning point in the business cycle, including the business cycle definition employed by the Bank. This is followed by the statistical results obtained when applying the methodology in this study. A brief overview of macroeconomic events and developments between 2009 and 2013 is then presented, followed by a graphic comparison of movements in selected economic indicators during the three post-apartheid upward phases in the South African business cycle. The article concludes with the identification of the most recent upper reference turning-point date.
Methods used to determine reference turning points in the business cycle
The Bank determines reference turning points in the business cycle in terms of the growth cycle definition of business cycles and not in terms of the classical definition of business cycles. Classical business cycles refer to periods of absolute increase in aggregate economic activity, followed by periods of absolute decrease (contractions) in aggregate economic activity, i.e. recessions. However, growth cycles represent the fluctuations around the long-term growth trend of aggregate economic activity – so-called trend-adjusted business cycles. Therefore, the Bank’s business cycle chronology represents reference turning-point dates that distinguish between upward phases – when the pace of growth in aggregate economic activity either matched or exceeded its long-term growth trend – and downward phases – when aggregate economic activity either contracted or increased at a slower rate than its long-term growth trend.
The Bank employs several statistical tools to establish whether a reference turning point in the South African business cycle has occurred. Firstly, the Bank’s three composite business cycle indicators – leading, coincident and lagging – are continuously monitored for an early indication of a possible turning point in the business cycle. A composite business cycle indicator is compiled by integrating various economic indicators into a single index. The composite leading business cycle indicator currently combines 11 individual economic indicators which have historically preceded turning points in the business cycle. The composite coincident business cycle indicator combines five economic indicators which have historically coincided with turning points in the business cycle. Similarly, the composite lagging business cycle indicator incorporates seven economic indicators which have historically followed turning points in the business cycle.3
Once the composite business cycle indicators point to the likelihood that a turning point in the business cycle has occurred, two comprehensive diffusion indices are calculated. Similarly to the calculation of the composite business cycle indicators, the current diffusion index is compiled from the actual month-to-month symmetrical percentage changes4 in each of a number of
|
|
Quarterly Bulletin March 2016 |
seasonally adjusted economic time series (in this study, 170 time series were analysed). These indicators represent diverse economic processes such as production, sales, employment, prices, monetary aggregates, and investment in the various sectors of the economy. The deviation of the current diffusion index from its long-term trend provides a quantitative measure for the cyclical movement in aggregate economic activity, with its turning points serving as a proxy for reference turning points in the business cycle.
In addition, the same 170 seasonally adjusted economic time series were used to calculate the historical diffusion index, which can be defined as a measure of dispersion of the changes in a number of time series. This index depicts the number of time series that are increasing (relative to each one’s long-term trend) as a percentage of the total number of series considered. Therefore, an index value exceeding 50 indicates that the majority of time series considered was increasing in that particular month, implying that the economy was in an upward phase of the business cycle. Similarly, an index value below 50 indicates that the economy was in a downward phase of the business cycle in that particular month. Turning points in the historical diffusion index, which provide a proxy for reference turning points in the business cycle, therefore occur when the index passes through the 50-per-cent mark. In the construction of both the current and the historical diffusion indices, the sectoral contributions are weighted according to each sector’s contribution to real gross value added in the economy.
The identification of a reference turning point in the business cycle is never simply reduced to a mechanical statistical exercise. In fact, the statistical tools described above seldom all point to exactly the same reference turning-point date. Consequently, various other macroeconomic indicators, as well as significant economic events and developments occurring near a possible turning point, have to be considered in order to identify the reference turning-point date.
Statistical results
Upon applying the statistical methods described above, the results reconfirmed that a definite upward phase of the business cycle commenced after August 2009 – the most recently identified reference trough in the business cycle. The results also indicated that a subsequent reference peak in the business cycle has already been reached.
The composite business cycle indicators
The composite leading business cycle indicator reached a trough in January 2009 – seven months before the most recent business cycle trough (see Graph 1 on next page). Subsequently, the leading indicator increased significantly up to April 2010 before effectively trending sideways for about two and a half years, reflecting an extended period of uncertainty in the South African economy. However, the leading indicator embarked on a distinct downward trend after November 2012, its most recent peak, signalling a possible slowdown in the growth rate of aggregate economic activity. Initially, the downward trend in the leading indicator was fairly muted before picking up pace after November 2014. Based on its historical relationship with the business cycle, the leading indicator pointed to a possible peak in the business cycle in the second half of 2013 or in the first half of 2014.
The ratio of the composite coincident business cycle indicator relative to the composite lagging business cycle indicator serves as an additional leading indicator of the business cycle.5 As depicted in Graph 1, movements in this ratio have historically been quite similar to those in the composite leading business cycle indicator, with both indicators reaching their most recent low points in January 2009. However, following an initial strong recovery and a subsequent period of sideways movement (similar to the leading indicator), the ratio did not decline in tandem with the leading indicator. Instead, it shifted upwards in the closing months of 2014 and then continued to trend sideways. The behaviour of the ratio since 2013 relative to that of the leading indicator illustrates a unique characteristic of the current business cycle: the reference peak identified in this study does not appear to have been brought about by endogenous factors that often occur during typical boom/bust cycles, such as over-investment, rapid
| Quarterly Bulletin March 2016 |
|


credit-driven growth in household consumption expenditure, or a brisk rise in unit labour costs. The composite lagging business cycle indicator incorporates component time series that largely reflect the build-up (or subsidence) of such endogenous cost pressures or imbalances in the economy. Therefore, during the latter part of a typical upward phase in the business cycle, the composite lagging business cycle indicator usually rises rapidly, dragging down the ratio of the coincident to lagging indicator. However, throughout the upward phase in the business cycle that commenced in September 2009, the lagging indicator has increased at a similar or slower pace than the coincident indicator, showing no signs of an overheating economy. In contrast, the decline in the composite leading business cycle indicator was brought about by falling business confidence, slowing global output growth and falling international commodity prices (both reflecting external demand) as well as slowing domestic demand (reflected in declining passenger vehicle sales and lower domestic manufacturing order volumes).
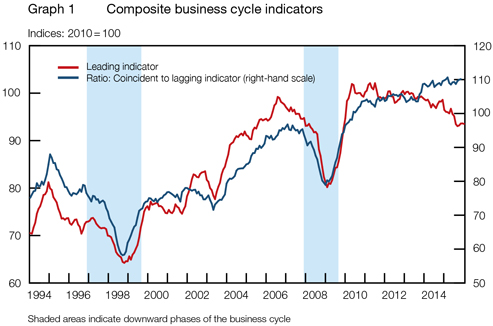
The composite coincident business cycle indicator – expressed as the deviation from its long-term trend – moved broadly sideways during most of 2007 before reaching a peak in April 2008 (see Graph 2 on next page). The coincident indicator then fell notably to August 2009, followed by a protracted upward movement. Initially, the coincident indicator rose at a fairly brisk pace, but the growth rate in the coincident indicator slowed during each successive year after 2011 as the upward phase in the business cycle lost momentum. The coincident indicator has trended broadly sideways since the end of 2013, with the deviation from its long-term trend reaching an upper turning point in November 2013, suggesting that a reference peak in the business cycle may have been reached.
|
|
Quarterly Bulletin March 2016 |
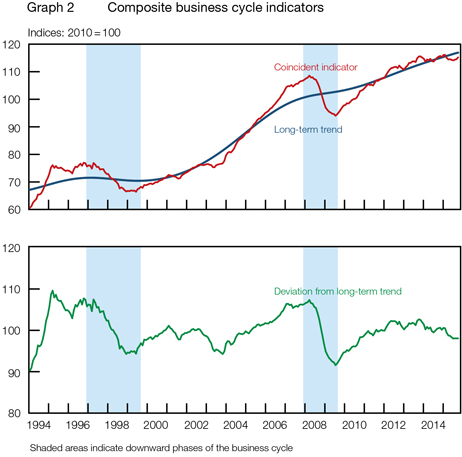
The current diffusion index
The deviation of the current diffusion index from its long-term trend fell sharply during 2008 and reached a lower turning point in May 2009. Graph 3 shows that the indicator then increased for a few months before receding somewhat to February 2010. Subsequently, the trend-adjusted current diffusion index followed a sustained upward trend before levelling off in 2013, reaching a peak in November of that year and then decreasing notably.
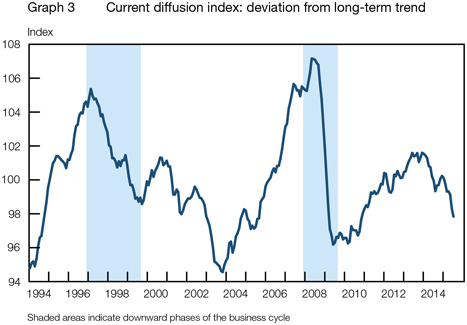
| Quarterly Bulletin March 2016 |
|


The historical diffusion index
As depicted in Graph 4, the historical diffusion index rose to above 50 per cent in December 2009, implying that the majority of the time series analysed increased from that month onwards relative to their respective long-term trends. The indicator rose briskly to just below the 70-per-cent mark in February 2011 before declining steadily thereafter. The historical diffusion index fell below the 50-per-cent mark in September 2013, implying that the number of economic time series decreasing (relative to their respective long-term trends) outnumbered those increasing from that month onwards – suggesting that a peak in the business cycle had been reached in August 2013.
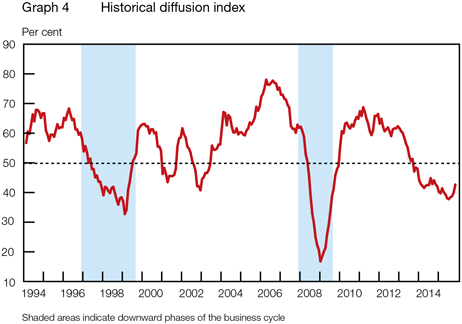
Macroeconomic events and developments
The severity of the previous downward phase in the South African business cycle – from December 2007 to August 2009 – was exacerbated by the global financial crisis. Likewise, the nature of the subsequent economic recovery that commenced in September 2009 was to a large extent influenced by the global financial crisis and its aftermath, including the global response to the crisis. Globally, monetary policy became extremely accommodative in 2009 and 2010, with short-term interest rates falling to historically low levels, particularly in advanced economies. International commodity prices more than halved from the third quarter of 2008 to the first quarter of 2009, and global consumer price inflation slowed markedly in 2009.
Throughout the global financial crisis, economic growth in some emerging-market economies, in particular China and India, remained fairly robust. Renewed strong demand for mining commodities from China in particular, taking advantage of the low price levels, led to an increase in international commodity prices from the middle of 2009, providing a much-needed fillip to commodity-exporting countries such as South Africa. Rising export volumes provided some growth momentum to the mining and manufacturing sectors, in particular in the second half of 2009 and into 2010. Aided by increased export demand, business confidence and capacity utilisation picked up from the fourth quarter of 2009. Confidence levels were also lifted by a recovery in share prices and residential property prices from the second quarter of 2009, while new vehicle sales started to increase at around the same time after contracting markedly for a period of almost three years.
|
|
Quarterly Bulletin March 2016 |
Formal non-agricultural employment contracted severely during the downward phase of the business cycle and only started to recover from the second quarter of 2010. Employment losses occurred primarily in the private sector as the public sector continued to expand its staff complement in a contra-cyclical fashion throughout the downswing, with the pace of public-sector job creation merely slowing somewhat in 2009. Nevertheless, remuneration growth remained elevated in both the private and the public sectors between 2008 and 2010, aiding a slightly lagged recovery in household consumption expenditure from the first quarter of 2010. In fact, consumption expenditure by households grew briskly throughout 2010, assisted by a moderation in consumer price inflation, very high real remuneration increases as well as positive wealth effects following rising financial asset prices. Gross fixed capital formation (dependent on long-term investment decisions) contracted notably in 2009 and remained sluggish in 2010, responding to the upward phase in the business cycle with a significant lag. The delayed sharp contraction and subsequent lacklustre pickup in gross fixed capital formation was exacerbated by the completion of a number of large infrastructure projects that had been embarked upon in preparation for the hosting of the 2010 FIFA World CupTM tournament.
Between 2010 and 2012, the global economy continued on an uneven recovery path as the fairly buoyant economic growth rates recorded in emerging-market countries stood in stark contrast to the pedestrian and hesitant recovery observed in most developed economies. Monetary policy in advanced economies remained extremely accommodative throughout this period, with short-term interest rates in a number of countries remaining close to the zero lower bound for a protracted period. In addition, unconventional measures collectively known as quantitative easing were continuously applied to bolster liquidity in financial markets. In many European countries, the quantum and cost of public debt raised fears about the sustainability of public finances, resulting in the economic crisis morphing into a sovereign debt crisis. Sovereign bond yield spreads in peripheral European countries rose dramatically over this period, particularly in Greece, leading to a succession of debt bailout and debt restructuring packages being extended to some of these countries by the European Central Bank and the International Monetary Fund. These economies had to resort to fiscal austerity measures in an effort to restore confidence and credibility, contributing to renewed economic recessions experienced in many European countries towards the end of 2011 and into 2012.
The flood of global liquidity created by the monetary policies pursued in advanced economies resulted in large capital inflows into emerging-market economies, leading to rising share prices and lower bond yields, also in South Africa. In addition to the glut in global liquidity searching for high yields, strong demand from China in particular led to sharp increases in international commodity prices in 2010 and 2011. However, from the fourth quarter of 2011 onwards, commodity prices embarked on a prolonged downward trend, initially weighed down by the lacklustre recovery in advanced economies, particularly in Europe, as well as slowing output growth in some emerging-market economies. Despite falling international commodity prices, international crude oil prices remained fairly elevated throughout 2012 and 2013, supported by fears regarding the security of oil supply following political turmoil and conflict in a number of countries in the Middle East and North Africa – the so-called Arab Spring. In subsequent years, however, the fall in international commodity prices was increasingly being attributed to the economic slowdown in China, associated with the rebalancing of Chinese economic growth away from infrastructure investment and towards consumption expenditure – requiring less commodity inputs.
Against this largely unfavourable and often turbulent global economic backdrop, output growth in the South African economy lost some momentum in the second half of 2011. Apart from global headwinds, the longevity of the upward phase in the business cycle was increasingly being hampered by a host of domestic structural supply-side constraints. These included the following:
| • | The rapidly escalating cost and declining reliability of the supply of electricity increasingly became a constraint to output growth in the South African economy as the upswing progressed. Large industrial energy users were initially requested to reduce their electricity consumption for a prolonged period, with more general electricity-supply disruptions occurring frequently in 2014 and 2015. In addition, the expected completion dates of two new large coal-fired power stations kept being pushed out further into the future. |
| Quarterly Bulletin March 2016 |
|


| • | The upward phase in the business cycle was characterised by a marked deterioration in the labour relations environment as the incidence of protracted and disruptive labour strikes increased notably, often accompanied by intimidation and violence. Although the mining sector bore the brunt of these disruptions, a number of other economic sectors were also unsettled by industrial action between 2011 and 2014. |
| • | Economic policy uncertainty in general and in the mining sector in particular contributed to the erosion of confidence in the South African economy. Initially, debate around nationalisation caused much uncertainty in the mining sector, with renewed doubt regarding the regulatory environment emanating from the delayed finalisation and clarity around the Mineral and Petroleum Resources Development Act Amendment Bill. More generally, broader economic policy documents such as the National Development Plan and the New Growth Path were perceived by some investors as conveying contradictory policy directions. |
| • | More unique features of the economic upswing were the sustained low levels of business confidence and low rates of capacity utilisation that contributed to a lack of meaningful investment growth, by private business enterprises in particular. In the 25 quarters from the fourth quarter of 2009 to the fourth quarter of 2015, the RMB/BER Business Confidence Index rose above the neutral 50 level only on four brief occasions – unprecedented during previous upward phases in the business cycle. |
Following a marked deceleration to around 3 per cent in September 2010, consumer price inflation quickened in 2011 and subsequently hovered around the 6-per-cent upper band of the inflation target range up to the end of 2014. Over this period, inflationary pressures emanated mainly from food prices and a fairly broad range of administered prices, in particular electricity prices, while wage settlements remained close to the 8-per-cent level throughout. Despite the continuous depreciation in the exchange rate of the rand up to the first quarter of 2014, subdued domestic demand conditions muted the pass-through to consumer price inflation. As such, the measures of underlying inflationary pressures accelerated at a very moderate pace, never exceeding the upper band of the inflation target range. Given these largely cost-push inflationary pressures, monetary policy stayed fairly accommodative throughout the upward phase in the business cycle, while remaining cognisant of slowing output growth; the Bank’s repurchase rate was lowered aggressively from 12 per cent in 2008 to 7 per cent in 2009 and further to 5,5 per cent in 2010 before it was lowered again to 5 per cent in 2012 and kept at that level until the end of 2013.
In response to the initial sharp recovery in export volumes and the concomitant acceleration in output growth from the second half of 2009 and throughout 2010, formal non-agricultural employment picked up notably in 2010 and 2011. However, employment growth slowed again from 2012 onwards as private-sector employment growth in particular moderated markedly. In fact, formal private-sector employment contracted in 2013 and 2014, with job-shedding occurring mainly in the mining, manufacturing and construction sectors, while employment levels in the services sectors of the economy remained fairly static over the period. Private-sector firms, particularly in the goods-producing sectors of the economy, responded to the deteriorating labour relations environment, high wage demands and other input cost pressures (such as electricity) as well as ample spare capacity by reducing their staff complement. This lack of employment creation kept the increases in unit labour costs in check; unit labour cost inflation in the formal non-agricultural sector of the economy almost halved from around 10 per cent in 2009 to marginally above 5 per cent in 2013 and 2014.
Despite high nominal wage increases being negotiated throughout the upward phase of the business cycle, static employment levels and rising cost-push inflation began to erode the disposable income of households from 2012 onwards. This, in turn, resulted in a gradual slowdown in household consumption expenditure growth over the period. Private-sector credit extension started to pick up in 2010, but despite the historically low interest rate environment, growth in credit extension tapered off from 2012 onwards and remained fairly pedestrian compared to previous upward phases in the business cycle. The initial acceleration in credit growth was driven largely by a marked acceleration in general loans to the household sector – often referred to as unsecured lending – which peaked at around the 40-per-cent mark in mid-2011
|
|
Quarterly Bulletin March 2016 |
before receding notably. Many of these loans were extended to mine workers and faced repayment difficulties in the wake of the labour market turmoil that erupted in the mining sector shortly thereafter. Consumption expenditure on durable goods was to a large extent driven by new vehicle sales which increased notably in 2010 and 2011 before slowing somewhat and reaching a peak in mid-2013. As such, instalment sale credit grew fairly briskly until the third quarter of 2013 before slowing notably thereafter.
In contrast, following years of exceptional growth prior to the 2008-09 recession, growth in mortgage advances kept on slowing throughout the subsequent upward phase in the business cycle, weighed down by muted house price growth, slow gains in employment, a bottoming out in the number of residential building plans passed, and a tightening of lending criteria, such as the requirement of a larger deposit when purchasing a residential property. As such, residential construction activity remained rather depressed throughout the upward phase. However, total gross fixed capital formation started to pick up in 2011 after the establishment of the Presidential Infrastructure Co-ordinating Commission in an effort to speed up the alleviation of infrastructure bottlenecks in the economy. Although capital formation initially rose strongly in the agricultural, mining and manufacturing sectors, the private sector’s contribution to overall investment growth dwindled as the upswing matured. As a result, growth in gross fixed capital formation was largely driven by general government and public corporations, notably Eskom and Transnet, particularly between 2012 and 2014. Over this period, private-sector investment got a fillip from a large number of renewable energy projects following a succession of independent power producer bid windows.
The subdued performance of the goods-producing sectors of the economy from 2011 onwards was reflected in the fairly pedestrian pace of expansion in export volumes over the period, exacerbated by a sustained deterioration in the terms of trade from about mid-2011 to the end of 2013 as South African export commodity prices decreased at a faster pace than import prices, in particular crude oil prices. Underpinned by relatively buoyant domestic expenditure on durable, semi-durable and capital goods, import volumes generally grew at a faster pace than export volumes over the period. This resulted in a persistent widening of the deficit on the current account of the balance of payments, amounting to more than 6 per cent of gross domestic product (GDP) in mid-2013. However, in 2013 and 2014 growth in the volume of imports slowed notably as domestic demand continued to moderate. The terms of trade improved significantly in 2014 as international crude oil prices plummeted in response to a further slowing of the economic growth rate in China as well as the increased supply and lower prices of shale gas. The deficit on the current account of the balance of payments subsequently narrowed to around 5 per cent of GDP at the end of 2014. In response to the improvement in the terms of trade, the exchange rate of the rand appreciated throughout 2014, following three consecutive years of continuous depreciation.
In addition to rising public-sector employment levels, government consumption expenditure rose at a brisk pace in 2011 and 2012 as the economic recovery was supported by a relatively expansionary fiscal policy stance. However, this resulted in national government’s budget deficit rising to above 5 per cent of GDP in both the 2012/13 and the 2013/14 fiscal years, exacerbated by a rapidly rising public-sector wage bill. The structural supply-side impediments to economic growth mentioned earlier, together with the gradual worsening of the current-account deficit and the fiscal budget deficit, eventually led to South Africa’s sovereign credit rating being downgraded twice by international ratings agencies, in 2012 and again in 2014, the first such downgrades since the dawn of a democratic South Africa in April 1994. The pace of expansion in government consumption expenditure slowed markedly in 2013 and 2014 as government embarked on a path of fiscal consolidation, contributing to the continued slowdown in gross domestic expenditure in the economy.
In the first half of 2014, the South African economy was hit by a five-month labour strike in the platinum-mining sector, resulting in a marked loss of mining output and, through linkages with the manufacturing sector in particular, in economic output in general. However, aggregate economic activity had already fallen below its trend rate of growth by then. The frequent occurrence of labour strikes and electricity-supply disruptions contributed to extreme volatility in
| Quarterly Bulletin March 2016 |
|


economic activity, visible in mining and manufacturing output in particular, from 2011 onwards. In addition to the volatile nature of output growth, it trended gradually lower from 2012 to 2015 as the weak global economy, domestic structural constraints and later also slowing domestic consumer demand all contributed to the demise of the upward phase in the business cycle.
Upward phase comparison
Graph 5 shows the movements of selected economic indicators during the most recent upward phase of the business cycle, as well as during the previous two post-apartheid upward phases, highlighting some of the distinct characteristics of the most recent upward phase in the business cycle.
Similarly, Graph 6 compares the movement in a number of selected economic indicators over the three most recent upward phases in the business cycle. The data for each indicator were indexed to set the trough-month (preceding each upward phase) equal to 100.
|
|
Quarterly Bulletin March 2016 |
| Quarterly Bulletin March 2016 |
|


Conclusion
Following an initial acceleration in output growth, the most recent upward phase in the South African business cycle gradually lost momentum from 2012 onwards. The weak and uneven global economic recovery failed to provide any impetus to the domestic economic recovery. In addition, the upward phase was characterised by a number of structural supply-side constraints, the combination of which eventually took its toll and contributed to the demise of the upswing.
Although the statistical results show that the majority of analytical indicators points to a reference peak in the business cycle being reached in the fourth quarter of 2013, some indicators reached a peak earlier in the year. The composite leading business cycle indicator reached an upper turning point in November 2012, whereafter it has followed a sustained downward trend. The composite coincident business cycle indicator started to lose momentum from 2012 while the deviation from its long-term trend peaked in November 2013. Similarly, the deviation of the current diffusion index from its long-term trend reached an upper turning point in November 2013. The historical diffusion index pointed to an upper turning point in the business cycle being reached a few months earlier, in August 2013. While the quarter-to-quarter growth rates in real GDP and non-agricultural real GDP were erratic, they both reached recent peaks in the fourth quarter of 2013.
Having duly considered all the available information, the final reference date for the upper turning point in the South African business cycle was established as November 2013, with the most recent upward phase of the business cycle lasting 51 months.
|
|
Quarterly Bulletin March 2016 |
Arrangements between the South African Reserve Bank and Statistics South Africa regarding the transfer of the compilation of the gross domestic product (expenditure approach) to Statistics South Africa
In accordance with the arrangements between Statistics South Africa (Stats SA) and the South African Reserve Bank (the Bank), Stats SA will with effect from June 2016 assume responsibility for the compilation and dissemination of South Africa’s gross domestic product (GDP) based on the expenditure approach – a role that the Bank has fulfilled since 1946. Stats SA will thus take responsibility for the compilation and publication of the GDP in the national accounts according to both the production and expenditure approaches, whereas the Bank will remain responsible for the computation and dissemination of all other sub-accounts in the national accounts framework, ultimately feeding into sectoral balance sheet information for South Africa.
Stats SA intends to release the country’s GDP data (according to both the production and expenditure approaches) in one publication, scheduled as follows:
| • | First-quarter GDP: first Tuesday of June (previously final Tuesday of May); |
| • | Second-quarter GDP: first Tuesday of September (previously final Tuesday of August); |
| • | Third-quarter GDP: first Tuesday of December (previously final Tuesday of November); and |
| • | Fourth-quarter GDP: first Tuesday of March (previously final Tuesday of February). |
However, since the Bank remains responsible for the compilation and dissemination of South Africa’s balance of payments and international investment statistics, the Bank will release the nominal and constant price values (quarterly numbers before and after adjustment for seasonal patterns) for merchandise trade (merchandise exports, net gold exports and imports) as well as international trade in services on the Friday prior to the release of the GDP data by Stats SA. This will be done electronically on the Bank’s website. The more comprehensive analytical presentation of the balance of payments – comprising the current, capital transfer and financial accounts of the balance of payments – will be published in the Bank’s Quarterly Bulletin, as in the past.
| Quarterly Bulletin March 2016 |
|