Medium Term
Budget Policy Statement
2017
National Treasury
Republic of South Africa
25 October 2017

| ISBN: |
978-0-621-45853-4
|
| RP: |
RP312/2017
|
The Medium Term Budget Policy Statement is compiled using the latest available information from departmental and other sources. Some of this information is unaudited or subject to revision.
To obtain additional copies of this document, please contact:
Communications Directorate
National Treasury
Private Bag X115
Pretoria
0001
South Africa
Tel: +27 12 315 5944
Fax: +27 12 407 9055
The document is also available on the internet at: www.treasury.gov.za.
ii
Foreword
The most urgent task before our nation is to ignite inclusive, job-creating economic growth.
The National Development Plan (NDP) targets sustained economic growth of 5.4 per cent per year to dramatically reduce unemployment, poverty and inequality. This year, we expect the economy to grow by only 0.7 per cent. This is clearly insufficient to achieve our development aspirations, and places pressure on our fiscal framework.
Government remains committed to a path of fiscal consolidation. We will take steps to narrow the primary budget deficit and stabilise gross public debt, while protecting social spending and investments supporting economic expansion. Yet there are limits to what these measures can achieve.
The only sustainable solution for our development and the health of our public finances is to grow the economy inclusively.
The strengthening world economy offers an opportunity to implement reforms that will enable inclusive growth. Business and consumer confidence are exceptionally weak, and have been undermined by political uncertainty, policy uncertainty and poor governance in several state-owned companies. Government recognises the need for decisive action in these areas, and in July announced 14 measures to boost confidence and investment. The Medium Term Budget Policy Statement reports on the progress of those measures.
To ensure growth benefits all, radical economic transformation is required to change the structures and patterns of ownership, management and control of the economy, so that they include all South Africans. Government policy should support higher levels of value addition in our exports, the use of public procurement to promote localisation and broad-based black economic empowerment, reindustrialisation and address market concentration, which undermines competition and raises barriers to entry for small businesses and the historically disadvantaged.
The budget remains progressive and redistributive, and makes large contributions to transformation and inclusive growth. Core social expenditure is protected.
Spending priorities for the medium-term expenditure framework period ahead are guided by the NDP and the Mandate Paper. Yet pressures on the public finances are mounting. Debt is expanding and debt-service costs are the fastest-growing category of government expenditure. In this context, a series of risks must be managed. This will require difficult trade-offs and compromises.
Government will maintain the expenditure ceiling over the medium term. A presidential task team is examining possible asset disposals to ensure that there is no breach of the ceiling in the current year. Given the shortfall in revenue, new spending initiatives can only be accommodated through reprioritisation or parallel tax increases.
I would like to thank President Jacob Zuma, the Cabinet, my colleagues across government and Deputy Minister Sfiso Buthelezi for their inputs. I appreciate the hard and diligent work of the National Treasury staff in putting together this Medium Term Budget Policy Statement.
Tough times require tough decisions. We are committed to making them. Working together, we can grow the economy for the benefit of all.

Malusi Gigaba
Minister of Finance
iii
Contents
|
Chapter 1
|
Overview
|
1
|
|
The budget, transformation and inclusive growth
|
1
|
|
|
Economic outlook
|
2
|
|
|
Fiscal outlook
|
4
|
|
|
Spending priorities
|
6
|
|
|
Conclusion
|
8
|
|
|
Chapter 2
|
Economic outlook
|
9
|
|
Transformation, inclusive growth and competitiveness
|
9
|
|
|
Global outlook
|
11
|
|
|
Review of domestic economic performance
|
13
|
|
|
Macroeconomic outlook
|
15
|
|
|
Chapter 3
|
Fiscal policy
|
19
|
|
Erosion of the fiscal position
|
19
|
|
|
Revenue performance and outlook
|
21
|
|
|
Expenditure performance and outlook
|
25
|
|
|
Fiscal framework
|
27
|
|
|
Financing and debt management strategy
|
29
|
|
|
Chapter 4
|
Expenditure priorities
|
31
|
|
Introduction
|
31
|
|
|
Expenditure priorities and pressures
|
32
|
|
|
In-year adjustments to spending
|
36
|
|
|
Medium-term spending priorities
|
36
|
|
|
Division of revenue
|
41
|
|
|
Annexure A
|
Fiscal risk statement
|
49
|
|
Annexure B
|
Compensation data
|
59
|
|
Annexure C
|
Technical annexure
|
67
|
|
Annexure D
|
Glossary
|
75
|
iv
|
Tables
|
Figures
|
||||||
|
1.1
|
Macroeconomic projections
|
2
|
1.1
|
South Africa’s per capita income
|
2
|
||
|
1.2
|
Consolidated government fiscal framework
|
5
|
1.2
|
Main budget revenue and noninterest spending
|
4
|
||
|
1.3
|
Consolidated government expenditure
|
7
|
1.3
|
Growth in gross tax revenue and nominal GDP
|
5
|
||
|
2.1
|
Economic growth in selected countries
|
12
|
2.1
|
Business confidence and private investment
|
10
|
||
|
2.2
|
Sector growth trends
|
15
|
2.2
|
Comparative pricing of 1GB of data across Africa
|
14
|
||
|
2.3
|
Macroeconomic performance and projections
|
15
|
2.3
|
Growth in fixed investment in key sectors
|
16
|
||
|
2.4
|
Assumptions used in the economic forecast
|
18
|
3.1
|
Gross debt-to-GDP outlook without additional fiscal measures
|
20
|
||
|
3.1
|
Gross tax revenue
|
21
|
3.2
|
Medical tax credit per income group
|
24
|
||
|
3.2
|
Medium-term revenue framework
|
23
|
3.3
|
Medical tax credit as percentage of taxable income of taxpayers
|
24
|
||
|
3.3
|
Main budget expenditure ceiling
|
25
|
3.4
|
Interest payments as a share of main budget revenue
|
27
|
||
|
3.4
|
Revisions to the 2017/18 expenditure ceiling
|
25
|
4.1
|
Average nominal growth in spending, 2017/18 – 2020/21
|
32
|
||
|
3.5
|
Main budget framework
|
28
|
4.2
|
Growth in main budget expenditure and consumer inflation
|
34
|
||
|
3.6
|
Consolidated fiscal framework
|
29
|
|||||
|
3.7
|
Total national government debt
|
29
|
|||||
|
3.8
|
Gross borrowing requirement
|
30
|
|||||
|
4.1
|
Summary of expenditure on cost containment related items: national and provinces
|
35
|
|||||
|
4.2
|
Consolidated expenditure by function
|
37
|
|||||
|
4.3
|
Consolidated expenditure by economic classification
|
39
|
|||||
|
4.4
|
Division of revenue framework
|
41
|
|||||
|
4.5
|
Changes to division of revenue
|
42
|
|||||
|
4.6
|
Provincial equitable share
|
43
|
|||||
v
vi
1
Overview
|
█ The budget, transformation and inclusive growth
|
||
|
South Africa’s budget makes a substantial contribution to transformation and inclusive growth. It finances the construction of houses and schools, the operation of hospitals and clinics, the education of youth, care of the elderly and social grants for the most vulnerable. A large number of programmes encourage the growth of new businesses, empower small farmers, develop human capabilities, and provide incentives for job creation and economic transformation.
|
Budget makes a large contribution to transformation and inclusive growth
|
|
|
The budget is strongly aligned with constitutional imperatives and is highly progressive. Two-thirds of spending goes to functions responsible for realising constitutionally mandated social rights. Among developing countries, South Africa’s fiscal system is notable for its capacity to redistribute resources from the wealthy to the poor and working families. The allocation of funds to provinces and municipalities is governed by transparent rules that ensure redistribution of resources from cities to the countryside.
|
||
|
The budget establishes a solid foundation for national development. But government’s ability to sustain improvements in the quality of life of citizens depends on investment and economic growth.
Over the last several years, South Africa’s per capita income has begun to stagnate. Unemployment is rising and, at 27.7 per cent, has reached the highest level recorded since 2003. Poverty, which had been in decline, has risen since 2011, and more than 30 million South Africans live on less than R1 000 per month.
To expand job creation, build an inclusive and transformed economy, and reduce inequality, South Africa needs a strong, sustained economic expansion. Growth is also the essential prerequisite for restoring the health of the nation’s public finances.
|
Government’s ability to improve citizens’ quality of life depends on investment and economic growth
|
|
1
|
2017 MEDIUM TERM BUDGET POLICY STATEMENT
|
 |
||
|
█ Economic outlook
|
||
|
Economic growth revised down to 0.7 per cent in 2017, reaching 1.9 per cent by 2020
|
The 2017 Budget projected GDP growth of 1.3 per cent in 2017. That projection has been revised down to 0.7 per cent, following a recession in the fourth quarter of 2016 and the first quarter of this year. Economic growth is expected to recover slowly, reaching 1.9 per cent in 2020.
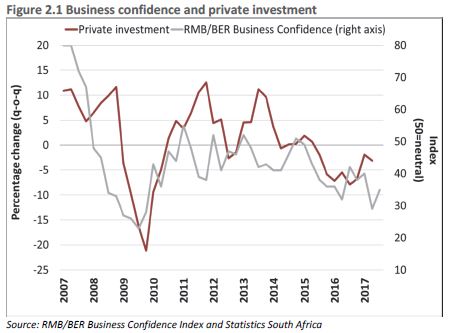
The weaker growth outlook reflects a continued deterioration in business and consumer confidence that has gathered pace since 2014. It also flows from perceptions of heightened risk as indicated in lower credit ratings, higher bond yields and sluggish investment. In 2016, gross fixed capital investment declined by 3.9 per cent, with large decreases in mining and manufacturing. Capital investment is expected to decline by 0.6 per cent in the current year.
Conditions in the global economy continue to improve, but the risks of financial turbulence remain high, and the longer-term outlook for growth and commodity prices is muted.
|
Table 1.1 Macroeconomic projections
|
Calendar year
|
2016
Actual |
2017
Estimate |
2018
|
2019
Forecast |
2020
|
|
Percentage change unless otherwise indicated
|
|||||
|
Household consumption
|
0.8
|
1.0
|
1.2
|
1.6
|
1.9
|
|
Gross fixed capital formation
|
-3.9
|
-0.6
|
0.5
|
3.0
|
3.5
|
|
Real GDP growth
|
0.3
|
0.7
|
1.1
|
1.5
|
1.9
|
|
GDP at current prices (R billion)
|
4 338.9
|
4 601.8
|
4 888.8
|
5 222.3
|
5 611.9
|
|
CPI inflation
|
6.3
|
5.4
|
5.2
|
5.5
|
5.5
|
|
Current account balance (% of GDP)
|
-3.3
|
-2.3
|
-2.6
|
-2.9
|
-3.1
|
Source: Reserve Bank and National Treasury
|
These factors are important in the context of South Africa’s external vulnerabilities. The country consumes more than it produces, and relies on foreign savings to finance the gap between low levels of domestic savings and the capital required for its investments. This relationship is expressed in the form of a persistent current account deficit, which is expected to widen over the medium term. Government debt held by non-residents has risen from 4.4 per cent of GDP in 2007 to 17.6 per cent of GDP in 2017. A sharply negative shift in global investor sentiment towards South Africa could result in large capital outflows, with highly destabilising consequences for the economy.
|
2
|
CHAPTER 1: OVERVIEW
|
|
Decisive action needed for a new growth trajectory
|
||
|
Last year’s Medium Term Budget Policy Statement warned that further deterioration of the economy could see South Africa entering a low-growth trap. In such a scenario, weak gross domestic product (GDP) growth produces less tax revenue. Aggressive fiscal consolidation to stabilise the growth of national debt and narrow the budget deficit might reduce perceived financial risks, but could also weaken demand, curbing investment and job creation. Yet taking no action could well result in credit-rating downgrades, rapid exchange-rate depreciation and capital flight.
|
South Africa confronts a low-growth trap
|
|
|
This cycle feeds on itself. Falling incomes and shrinking resources for public services raise social tensions, deepening political polarisation and creating doubts about future development. Declining confidence and economic uncertainty curb investment, entrenching low growth.
|
||
|
The National Treasury’s macroeconomic projections imply that per capita income will continue to stagnate in the years ahead. Unless decisive action is taken to chart a new course, the country could remain caught in a cycle of weak growth, mounting government debt, shrinking budgets and rising unemployment. Much depends on the policy choices made and the effectiveness of their implementation. Hard choices are required to return the public finances to a sustainable position. A failure to make such decisions, or to effectively implement them, will reinforce economic and fiscal deterioration.
|
Much depends on policy choices and their effective implementation
|
|
|
Government recognises these risks and opportunities, and is acting to break out of the low-growth trap. A new cycle of inclusive development requires clear intervention to stimulate economic activity, ensure effective regulation, improve the competitiveness of manufactured exports, promote localisation and reindustrialise the economy. This in turn requires renewed attention to strengthen the capacity of the state to develop the country’s economic potential.
|
||
|
In July, the Minister of Finance announced a set of 14 actions agreed to by Cabinet to revive investment. Progress has been made on several fronts:
|
Progress registered on 14 actions agreed by Cabinet to revive investment
|
|
●
|
A new board and CEO have been appointed to lead a turnaround at South African Airways (SAA).
|
||
|
●
|
The Budget Facility for Infrastructure, which is intended to overcome shortcomings in the planning and execution of large infrastructure projects, has begun considering proposals.
|
||
|
●
|
New procurement regulations have been implemented.
|
||
|
●
|
The Financial Sector Regulation Act has been signed into law.
|
|
Work is under way to license broadband spectrum, optimise government’s asset portfolio, reform the governance of state-owned companies and encourage private-sector participation in public investment programmes. A stronger package of measures to stimulate economic growth is being developed.
|
Work is under way to license broadband spectrum and optimise the state asset portfolio
|
|
|
Government continues to prioritise the expansion of network infrastructure to support the economy, alongside social infrastructure that serves community needs. The public sector will spend more than R300 billion each year on infrastructure, with about half of this funded directly from the budget.
|
3
|
2017 MEDIUM TERM BUDGET POLICY STATEMENT
|
|
Reforms needed to transform markets, improve national competitiveness and reconfigure urban landscape
|
To sustain economic growth, these measures need to be accompanied by microeconomic reforms that raise productivity and labour absorption. These include taking strong steps to transform markets, improve national competitiveness through innovation, break down structural barriers to new economic participants, promote manufacturing development and deconcentrate industries dominated by a few producers. Such reforms need to be complemented by plans to reconfigure the urban landscape, which remains dominated by inefficient and inequitable patterns of settlement.
|
|
|
█ Fiscal outlook
|
||
|
Strong tax revenues, which sustained fiscal consolidation efforts, are now under threat
|
Over the past five years, government’s efforts to achieve a measured and balanced fiscal consolidation met with some success. While the stabilisation of debt proved elusive, expenditure remained well contained, and the primary balance – the gap between revenue and non-interest spending – narrowed. This progress was sustained by tax revenues that outperformed economic growth.
|
|
 |
||
|
Strong revenue collection was partly the result of policy changes that raised the rate of taxation. Growth in key sectors of the economy bolstered revenues. Personal income taxes benefited from robust public- and private-sector wage settlements. The expanding middle class contributed to resilient household demand. The sustained depreciation of the exchange rate in an environment of contained inflation lifted profits in tradable sectors, adding to company tax receipts. Growth in capital investment continued to draw in imports, attracting value-added tax and customs duties.
|
||
|
Revenue shortfall of R50.8 billion projected in 2017/18
|
This period of revenue buoyancy appears to have run its course. The National Treasury projects a revenue shortfall of R50.8 billion in 2017/18. Lower revenue this year carries forward, and gross tax revenue is projected to fall short of the 2017 Budget estimates by R69.3 billion in 2018/19 and R89.4 billion in 2019/20. This reflects slowing economic growth, but may also suggest a profound shift in the relationship between economic growth and tax collection in the years ahead.
|
4
|
CHAPTER 1: OVERVIEW
|
 |
||
|
Fiscal framework
|
||
|
As a result of revenue shortfalls, the consolidated budget deficit for 2017/18 is expected to be 4.3 per cent of GDP, compared with a 2017 Budget estimate of 3.1 per cent. The main budget deficit, which determines government’s net borrowing requirement, will be 4.7 per cent of GDP this year.
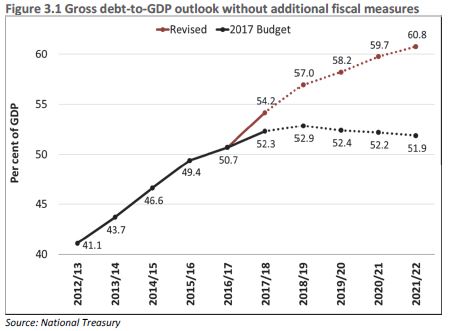
In contrast to projections set out in the last budget, the revised projection is for the deficit to remain at this elevated level over the medium term. On this estimate, gross national debt is projected to continue rising, reaching over 60 per cent of GDP by 2022.
|
Consolidated budget deficit is 4.3 per cent of GDP in current year against projection of 3.1 per cent
|
Table 1.2 Consolidated government fiscal framework
|
2016/17
|
2017/18
|
2018/19
|
2019/20
|
2020/21
|
|
|
R billion/Percentage of GDP
|
Outcome
|
Revised
|
Medium-term estimates
|
||
|
Revenue
|
1 298.2
|
1 363.6
|
1 477.5
|
1 594.2
|
1 709.3
|
|
29.5%
|
29.2%
|
29.7%
|
30.0%
|
29.9%
|
|
|
Expenditure
|
1 445.7
|
1 566.6
|
1 670.6
|
1 802.3
|
1 935.1
|
|
32.8%
|
33.5%
|
33.6%
|
33.9%
|
33.9%
|
|
|
Budget balance
|
-147.5
|
-203.0
|
-193.1
|
-208.1
|
-225.8
|
|
-3.3%
|
-4.3%
|
-3.9%
|
-3.9%
|
-3.9%
|
|
|
Total gross loan debt
|
2 232.9
|
2 530.5
|
2 829.6
|
3 094.2
|
3 415.6
|
|
50.7%
|
54.2%
|
57.0%
|
58.2%
|
59.7%
|
|
Source: National Treasury
|
In this context, government faces difficult choices. To offset revenue shortfalls and reduce borrowing, the contingency reserve has been pared down to R16 billion over the next three years. This leaves government little room to manoeuvre if risks to the expenditure ceiling materialise. Beyond this, it is likely that some programmes will need to be eliminated, or their funding reduced.
South Africa’s stated policy aspirations and its social needs far exceed available public resources. Moreover, there is little space for tax increases in the current environment. Any new policy proposals, or expansion of existing programmes, should address only the most effective and necessary interventions.
|
5
|
2017 MEDIUM TERM BUDGET POLICY STATEMENT
|
|
Government remains committed to operating within the expenditure ceiling over the medium term. In the current year, however, the recapitalisation of SAA and the South African Post Office put the ceiling at risk of a R3.9 billion breach.
|
|
Risks to fiscus include rising debt-service costs and public-sector wage bill
|
In addition, there are several risks to the fiscus over the period ahead:
|
||
|
●
|
The economy and revenue could underperform projections. The GDP growth outlook may be improving, but the relationship between growth and revenue collection could deteriorate further.
|
||
|
●
|
Strains and imbalances within the public finances may become more pronounced. The public-sector wage bill has increasingly crowded out other spending and limited government’s ability to increase public employment.
|
||
|
●
|
Debt-service costs are set to absorb a rising share of revenue.
|
||
|
●
|
Several years of fiscal restraint have left funding gaps in both infrastructure and social services, reflected in the build-up of unpaid accounts and financial imbalances.
|
||
|
●
|
Continued financial deterioration of major state-owned companies is a clear and substantial danger to the public finances.
|
||
|
Changing course to mitigate risks
|
||
|
Over the next three years, government will adhere strictly to the spending limits it has set for itself. But more is clearly required. A combination of fiscal measures and economic interventions is needed to grow the economy, address immediate challenges facing the public finances and reduce long-term risks.
|
||
|
Presidential task team to develop proposals to stabilise debt over medium term
|
A team of Cabinet ministers reporting directly to the President has been established to develop proposals to stabilise the national debt over the medium term. These will include proposals to narrow the deficit, stimulate economic growth and build investor confidence. The team will work to ensure that the spending ceiling remains intact in the current year. A broader set of asset disposals is also under consideration, along with a restructuring of the portfolio of public assets to reduce risks posed by contingent liabilities. A new framework for the management of guarantees is being developed.
|
|
|
Additional measures to reduce expenditure, raise revenue and improve the impact of public resources on economic growth will be announced in the 2018 Budget.
|
||
|
█ Spending priorities
|
||
|
Mandate Paper intended to strengthen alignment of budget, medium-term strategic framework and NDP
|
In August 2017, Cabinet approved a Mandate Paper to guide the spending choices of national government. Its purpose is to strengthen alignment of the national budget, the medium-term strategic framework and the National Development Plan (NDP) during the remaining term of the current administration.
|
|
|
The paper observes that on current trends, South Africa is unlikely to achieve its NDP goals. It also notes that there will be no additional funds available to increase baseline expenditure over the 2018 Budget, and some programmes may have to be cut to meet unanticipated spending pressures. It proposes seven expenditure priorities for the MTEF period:
|
6
|
CHAPTER 1: OVERVIEW
|
|
●
|
Job creation and small business development
|
||
|
●
|
Youth development
|
||
|
●
|
Infrastructure expansion and maintenance
|
||
|
●
|
Land reform, smallholder farmer and agriculture development
|
||
|
●
|
Comprehensive social security, education and skills
|
||
|
●
|
An integrated plan to fight crime
|
||
|
●
|
Advancing the national interest in the Southern African Development Community, throughout Africa, and through participation in the BRICS (Brazil, Russia, India, China and South Africa) bloc and the Indian Ocean Rim Association.
|
|
Government spending priorities continue to align with the NDP, as elaborated in the medium-term strategic framework and the Mandate Paper for 2018.
|
Table 1.3 Consolidated government expenditure
|
2017/18
|
2018/19
|
2019/20
|
2020/21
|
Average
|
|
|
Revised
|
Medium-term estimates
|
annual
|
|||
|
growth
|
|||||
|
2017/18–
|
|||||
|
R billion
|
2020/21
|
||||
|
Learning and culture
|
317.8
|
340.7
|
367.3
|
395.7
|
7.6%
|
|
Health
|
189.6
|
204.5
|
220.0
|
235.5
|
7.5%
|
|
Social development
|
234.2
|
251.2
|
269.0
|
286.9
|
7.0%
|
|
Community development
|
193.5
|
210.1
|
226.5
|
243.1
|
7.9%
|
|
Economic development
|
190.9
|
202.2
|
217.7
|
229.9
|
6.4%
|
|
Peace and security
|
195.5
|
206.2
|
220.7
|
235.5
|
6.4%
|
|
General public services
|
62.3
|
64.7
|
67.5
|
71.6
|
4.8%
|
|
Payments for financial assets
|
19.5
|
5.0
|
5.2
|
5.5
|
–
|
|
Total expenditure by function
|
1 403.3
|
1 484.5
|
1 594.0
|
1 703.8
|
6.7%
|
|
Debt-service costs
|
163.3
|
183.1
|
203.3
|
223.4
|
11.0%
|
|
Contingency reserve
|
–
|
3.0
|
5.0
|
8.0
|
–
|
|
Total expenditure
|
1 566.6
|
1 670.6
|
1 802.3
|
1 935.1
|
7.3%
|
Source: National Treasury
|
Over the medium term, expenditure will grow by an annual average of 7.3 per cent, from R1.6 trillion in 2017/18 to R1.9 trillion in 2020/21. The fastest-growing category of expenditure is debt-service costs, which reach nearly 15 per cent of revenue in the outer year and increasingly crowd out spending on services. The fastest-growing elements of spending are Learning and Culture (which includes post-school education and training), Health and Community Development, with growth rates of 7.6 per cent, 7.5 per cent and 7.9 per cent respectively.
|
||
|
Despite a highly constrained fiscal environment, government is protecting expenditure that delivers services to low-income households. However, additional resources to support spending priorities are severely limited.
|
Spending that aims to deliver services to low-income households is protected
|
|
|
As in recent years, additional allocations will be funded mainly through reprioritisation of existing budget baselines. Structural increases in expenditure to accommodate new policy initiatives, and resulting adjustments to the spending ceiling, will need to be matched by parallel tax increases.
|
7
|
2017 MEDIUM TERM BUDGET POLICY STATEMENT
|
|
█ Conclusion
|
||
|
Improved confidence and microeconomic reforms will return the economy to a higher growth rate over time
|
Stronger economic growth is required to return the public finances to a sustainable position, and put South Africa back on a path of rising employment and increasing prosperity. Government is committed to transformation and confidence-boosting measures to promote investment. Combined with microeconomic reforms, higher levels of business and consumer confidence will return the economy to a higher growth path over time.
|
8
2
Economic outlook
|
In brief
|
|
|
●
|
South Africa’s projected GDP growth for 2017, forecast at 1.3 per cent at the time of the 2017 Budget, has been revised down to 0.7 per cent. Over the medium term, GDP growth is expected to increase slowly, reaching 1.9 per cent in 2020.
|
|
●
|
Despite substantial risks, the global economic outlook is improving, with growth of 3.7 per cent forecast in 2018. Higher global growth can benefit South Africa’s medium- to long-term growth prospects if the country can boost investment and export competitiveness.
|
|
●
|
Concerns about policy and political uncertainty, along with weak domestic demand, weigh heavily on business and consumer confidence, deterring investment and job creation.
|
|
●
|
Government’s economic policy, guided by the objectives of the National Development Plan, centres on inclusive growth, transformation and competitiveness. Progress has been registered on the 14 confidence-boosting measures announced earlier this year. A series of microeconomic reforms would provide impetus to confidence and investment.
|
|
█ Transformation, inclusive growth and competitiveness
|
||
|
The South African economy grew by an annual average of 1.9 per cent between 2010 and 2016, well below the target of 5.4 per cent envisaged in the National Development Plan (NDP). Per capita GDP has declined for two consecutive years, severely constraining efforts to transform the economy, and threatening the sustainability of the public finances.
|
Slow economic growth severely constrains efforts to transform the economy
|
|
|
Persistently weak economic growth reinforces the country’s legacy of socioeconomic exclusion. Today, 30.4 million South Africans are living in poverty. Unemployment is 27.7 per cent – the highest level since September 2003. The share of total income going to the top 10 per cent of income earners is between 60 and 65 per cent. Wealth inequality is even more pronounced. Low levels of economic opportunity for a large proportion of the population undermine growth potential and the realisation of the constitutional vision of a more equal society.
|
||
9
|
2017 MEDIUM TERM BUDGET POLICY STATEMENT
|
|
Inclusive growth, transformation and competitiveness form a virtuous circle
|
Government is focused on inclusive growth, transformation and competitiveness. These three policy objectives form a virtuous circle. Inclusive growth reduces poverty and inequality, and provides the resources to support critical social spending. Broad-based economic transformation opens up the economy to those previously marginalised, generating new businesses and wealth. A competitive economy sells goods and services to the rest of the world and attracts investment to support its own development.
|
|
|
Guided by the NDP and the nine-point plan announced in February 2015, government aims to break down structural impediments to new economic activity, deconcentrate industries dominated by few participants, accelerate the inclusion of millions of black South Africans into jobs and businesses, and return to a path of rising incomes for all.
|
||
|
The central challenge for economic policy remains effective implementation.
|
||
|
Rebuilding confidence
|
||
|
Weak business and consumer confidence reduce investment, job creation and household spending
|
Business and consumer confidence have been exceptionally weak in recent years, with direct consequences for investment, job creation and household spending. At present, concerns about policy and political uncertainty, along with weak domestic demand, weigh heavily on business and consumer confidence.
|
|
 |
||
|
Delays in finalising key regulatory processes, as well as a pattern of poor governance in several large state-owned companies, contribute to concerns about policy uncertainty. Addressing these concerns would bolster confidence, supporting higher levels of investment and growth.
|
||
|
Restoring South Africa’s potential growth rate, which has fallen below 2 per cent since 2014, requires additional policy measures. Rapid implementation of a range of microeconomic reforms, as outlined in the NDP, would boost confidence and provide support to the economy.
|
10
|
CHAPTER 2: ECONOMIC OUTLOOK
|
|
South Africa’s macroeconomic framework is underpinned by fiscal sustainability and credibility, inflation-targeting and a flexible exchange rate. This approach protects the public finances for generations to come, and shields businesses and households from a range of economic shocks.
|
|
Update on government’s short-term confidence-boosting measures
|
|
|
Restore the sustainability of fiscal policy:
|
|
|
−
|
The Budget Facility on Infrastructure run by the National Treasury and the Presidential Infrastructure Coordinating Commission received 59 project submissions with an aggregate funding requirement of R135 billion. Several projects have been recommended for detailed appraisal.
|
|
−
|
Negotiations on the next public-service wage agreement are under way.
|
|
Promote transformation and competitive outcomes by implementing sector reforms:
|
|
|
−
|
The Preferential Procurement Policy Framework Act Regulations took effect on 1 April 2017.
|
|
−
|
The Financial Sector Regulation Act was signed into law on 21 August 2017.
|
|
−
|
The Government Technical Advisory Centre has been commissioned to set up a fund to benefit small and medium enterprises, with a particular focus on start-ups.
|
|
Manage fiscal and economic risks associated with state-owned entities:
|
|
|
−
|
Government granted South African Airways R5.2 billion to address debt obligations. This allowed SAA to avoid default, roll over some debt and continue negotiations with lenders. A permanent chief executive officer has been appointed and the appointment of a chief restructuring officer is under way.
|
|
−
|
A private-sector participation framework and a template to determine and cost developmental mandates have been approved by Cabinet.
|
|
−
|
An energy task team resolved not to provide balance sheet support to Eskom. The Minister of Energy announced that Eskom will sign power-purchase agreements with independent power producers at a tariff not exceeding 77c/kWh.
|
|
Create policy certainty by finalising key legislative and policy processes:
|
|
|
−
|
The Council for Scientific and Industrial Research completed a study on spectrum availability and open access.
|
|
−
|
The Competition Commission launched a market inquiry to investigate data prices.
|
|
−
|
Draft legislation is being finalised to facilitate the licensing of Postbank.
|
|
−
|
Implementation of the revised Mining Charter has been postponed to December 2017.
|
|
−
|
Government is consulting stakeholders on the Regulation of Agricultural Land Holdings Bill.
|
|
█ Global outlook
|
||
|
The world economy continues to strengthen. According to the International Monetary Fund (IMF), global growth is projected to reach 3.6 per cent in 2017 and 3.7 per cent in 2018, up from 3.2 per cent in 2016.
|
World economy is strengthening, with projected growth of 3.7 per cent in 2018
|
|
|
The outlook largely reflects a recovery in demand and trade in Europe and Asia. World trade volumes are expected to increase by 4.2 per cent in 2017. Low interest rates in the United States, Europe and Japan remain supportive of growth. The euro area should benefit from strong domestic demand, and better-than-expected growth in Japan’s net exports will improve its performance in 2017. Brazil and Russia have returned to growth after lengthy recessions, supported by a strong export performance (Brazil), and stabilising oil prices and improved confidence (Russia).
|
||
11
|
2017 MEDIUM TERM BUDGET POLICY STATEMENT
|
|
These upward revisions in growth projections offset lower estimates for the US and the United Kingdom. The UK economy slowed more than anticipated in the first half of the year. The US growth forecast for 2017 has been trimmed from 2.3 per cent to 2.2 per cent, because an expected fiscal stimulus driven by tax cuts did not come about. US growth is projected to reach the pre-crisis average of 2.3 per cent in 2018.
|
||
|
Growth in sub-Saharan Africa projected to tick upwards in 2017, reaching 2.6 per cent.
|
Growth in sub-Saharan Africa has been depressed as a result of underperformance in the region’s two largest economies – Nigeria and South Africa. Economic growth in the region is projected to tick upwards, reaching 2.6 per cent in 2017 and 3.4 per cent in 2018, in response to improved oil production and agricultural output. The Angolan economy is expected to grow by 1.5 per cent in 2017. Growth outcomes for fuel-importers in the region are generally better. Kenya and Ethiopia are expected to grow at 5.0 and 8.5 per cent respectively in 2017 due to strong domestic demand and infrastructure investment.
|
Table 2.1 Economic growth in selected countries
|
Region / country
|
2000-2008
|
2010-2015
|
2016
|
2017
|
2018
|
|
Percentage
|
Pre-crisis
|
Post-crisis
|
Average GDP1
|
||
|
World
|
4.3
|
3.9
|
3.2
|
3.6
|
3.7
|
|
Advanced economies
|
2.4
|
1.9
|
1.7
|
2.2
|
2.0
|
|
US
|
2.3
|
2.2
|
1.5
|
2.2
|
2.3
|
|
Euro area
|
2.0
|
1.0
|
1.8
|
2.1
|
1.9
|
|
UK
|
2.5
|
2.0
|
1.8
|
1.7
|
1.5
|
|
Japan
|
1.2
|
1.5
|
1.0
|
1.5
|
0.7
|
|
Developing countries
|
6.5
|
5.5
|
4.3
|
4.6
|
4.9
|
|
Brazil
|
3.8
|
2.2
|
-3.6
|
0.7
|
1.5
|
|
Russia
|
7.0
|
2.2
|
-0.2
|
1.8
|
1.6
|
|
India
|
6.8
|
7.4
|
7.1
|
6.7
|
7.4
|
|
Chile
|
4.8
|
4.2
|
1.6
|
1.4
|
2.5
|
|
Mexico
|
2.6
|
3.2
|
2.3
|
2.1
|
1.9
|
|
Indonesia
|
5.3
|
5.7
|
5.0
|
5.2
|
5.3
|
|
China
|
10.4
|
8.3
|
6.7
|
6.8
|
6.5
|
|
Sub-Saharan Africa
|
5.9
|
5.0
|
1.4
|
2.6
|
3.4
|
|
South Africa2
|
4.2
|
2.3
|
0.3
|
0.7
|
1.1
|
| 1. |
IMF World Economic Outlook Update, October 2017
|
| 2. |
National Treasury Forecasts
|
|
Yet despite the cyclical upturn, there are considerable risks to the global outlook. These include high levels of debt, continued political and policy uncertainty in advanced economies, imbalances in the Chinese financial system and a more rapid tightening of global financial conditions.
|
||
|
Risks to global outlook include changes to US trade policy, Brexit and tightening global financial conditions
|
Possible changes to US trade policy and uncertainty about the terms of the UK’s exit from the European Union pose risks to global trade. Tighter global financial conditions could result from higher interest rates in advanced economies or developments that prompt global risk aversion, raising external financing risks and reducing capital flows to developing economies. Lower capital inflows could lead to currency depreciation, higher inflation and rising interest rates. A debt crisis in China’s banking sector would lower global growth significantly, particularly for countries that are reliant on trade with China.
|
12
|
CHAPTER 2: ECONOMIC OUTLOOK
|
|
The improved global outlook can strengthen South Africa’s medium- to long-term growth prospects, provided the country can boost export competiveness. South Africa’s post-crisis growth outcomes were marginally better than those of Brazil and Russia, but worse than Chile and Indonesia, which undertook a range of microeconomic reforms.
|
Improved world outlook can benefit South Africa, provided economy can boost investment and export performance
|
|
|
█ Review of domestic economic performance
|
||
|
The South African economy grew by an annualised 2.5 per cent in the second quarter of 2017, following a recession that began in the fourth quarter of 2016. The stronger-than-expected rebound was underpinned by a return to growth in the services sector and robust agricultural output.
|
||
|
Overview of major economic sectors
|
||
|
Agriculture
|
||
|
Real value added in the agriculture, forestry and fishing sector grew by 21.2 per cent in the first half of 2017 compared with the same period in 2016. Good rains in the summer rainfall region led to a recovery following a severe drought, which caused agriculture to contract in 2015 and 2016. Maize production is expected to reach 16.7 million tons in 2017 – a 115 per cent increase from the 2016 crop of 7.8 million tons. Soybean production is expected to increase by 77 per cent. Wheat production, however, is expected to decline by 10 per cent in 2017 due to continued drought in the Western Cape. An ongoing outbreak of avian flu in June 2017 may lead to higher poultry prices. Growth in the sector is expected to be sustained throughout 2017.
|
Strong rebound in agriculture following good season in summer rainfall regions
|
|
|
Mining
|
||
|
Mining value added expanded by 4.3 per cent in the first half of 2017 compared with the same period in 2016. The sector is recovering from the contraction of 2016, supported by higher commodity prices and growth in iron ore, manganese and copper. Mineral sales increased by 6.8 per cent in the first half of 2017 compared with the same period last year, driven largely by coal and iron ore. Gold sales fell by 16.2 per cent over the same period.
|
Mining recovering from low of 2016, but policy uncertainty limits growth
|
|
|
Declining fixed investment in mining undermines sustainable growth. Elevated operating costs and uncertainty related to the Mining Charter and the Mineral and Petroleum Resources Development Amendment Bill continue to constrain growth. South Africa is currently ranked 13th in Africa on the mining Investment Attractiveness Index. The mining outlook remains subdued due to continued domestic policy uncertainty and rising production costs.
|
||
|
Manufacturing
|
||
|
Real value added in manufacturing declined by 1.5 per cent and production contracted by 1.8 per cent in the first half of 2017 compared to the same period last year. Production in petrochemicals and wood and paper fell by 6.1 per cent and 2.9 per cent respectively. Capacity utilisation in manufacturing moderated slightly from 81.5 per cent in the first quarter of 2017 to 81.3 per cent in the second. Fixed-capital stock in manufacturing has declined every year since 2009, indicating a gradual erosion of capacity.
|
Manufacturing remains subdued and fixed-capital stock continues to decline
|
13
|
2017 MEDIUM TERM BUDGET POLICY STATEMENT
|
|
Realising the benefits of a well-designed telecommunications spectrum auction
|
|
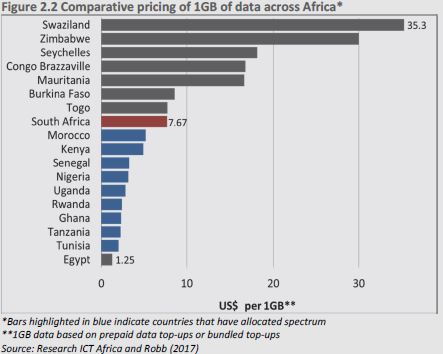
The delay in allocating telecommunications spectrum constrains growth across the economy. Lack of radio frequency limits the ability of businesses to deploy new technologies and contributes to the high cost of broadband. A well-designed spectrum auction can promote transformation and improve competition as new participants enter the market. Universal service conditions can improve access for low-income households. And a competitive auction can sharply reduce data costs. The bulk of additional spectrum is ready to be allocated immediately, without requiring the migration of existing spectrum users to digital television.
|
 |
|
Finance
|
||
|
Bank profitability remains resilient despite declining growth in interest income
|
Financial and business services grew by 1 per cent in the first half of 2017 compared with the same period in 2016. Lacklustre growth reflects high levels of household debt and slowing income growth, which affects banks and insurance companies. Bank profitability remains relatively resilient despite declining growth in interest income, which averaged 3.8 per cent in the first half of 2017 compared with 14.8 per cent a year earlier. Tier 1 capital adequacy, denoting high-quality reserves, rose from 12.5 per cent to 13.5 per cent in the year to July 2017. Asset quality is strong, with impaired advances as a share of outstanding loans at 2.9 per cent.
|
|
|
Employment
|
||
|
Formal employment declined by 0.2 per cent in first half of 2017, and about 6.2 million people are searching for work
|
Formal non-agricultural employment declined by 0.2 per cent in the first half of 2017 compared to the same period last year. Employment in community services fell by 41 041 during the first half of the year. Financial and business services lost 7 681 jobs over the same period, mostly in banking and insurance. Employment prospects in manufacturing remain constrained. Similarly, employment growth in the trade sector is likely to remain under pressure given low consumer confidence and weak credit growth. Mining recovered some jobs in the first half of 2017, expanding employment by 1.6 per cent. The ability of the economy to absorb new workers peaked in 2008 and has not recovered. An estimated 6.2 million South Africans are actively looking for work.
|
14
|
CHAPTER 2: ECONOMIC OUTLOOK
|
Table 2.2 Sector growth trends
|
Percentage
|
2012
|
2013
|
2014
|
2015
|
2016
|
20171
|
|
Agriculture, forestry and fishing
|
1.8
|
4.5
|
6.9
|
-6.1
|
-7.8
|
21.2
|
|
Mining and quarrying
|
-2.9
|
4.0
|
-1.4
|
3.9
|
-4.7
|
4.3
|
|
Manufacturing
|
2.1
|
1.0
|
0.2
|
-0.2
|
0.7
|
-1.5
|
|
Electricity and water
|
-0.4
|
-0.6
|
-1.1
|
-1.5
|
-3.5
|
-0.5
|
|
Construction
|
2.6
|
4.6
|
3.6
|
1.7
|
0.7
|
0.3
|
|
Wholesale and retail trade
|
4.0
|
2.0
|
1.6
|
1.4
|
1.2
|
-1.1
|
|
Transport and communication
|
2.4
|
2.9
|
3.2
|
1.1
|
0.4
|
1.3
|
|
Finance, real estate and business services
|
3.0
|
2.6
|
2.2
|
2.8
|
1.9
|
1.0
|
|
Personal services
|
2.1
|
2.6
|
2.0
|
1.1
|
1.2
|
0.8
|
|
General government
|
3.0
|
3.2
|
2.9
|
0.8
|
1.4
|
0.4
|
|
GDP
|
2.2
|
2.5
|
1.7
|
1.3
|
0.3
|
1.1
|
1. The first 6 months of 2017
Source: Statistics South Africa
|
█ Macroeconomic outlook
|
||
|
South Africa’s projected GDP growth for 2017, forecast at 1.3 per cent at the time of the 2017 Budget, has been revised down to 0.7 per cent. GDP growth is expected to increase slowly, reaching 1.9 per cent in 2020.
|
GDP growth projected to grow moderately, reaching 1.9 per cent in 2020
|
|
|
Revisions to the forecast reflect a significant deterioration in business and consumer confidence over the past year. Other contributing factors include weaker-than-anticipated growth in the fourth quarter of 2016, a large contraction in the finance sector in the first quarter of 2017 and a higher risk premium, reflected in higher bond yields. The impact of domestic factors on economic growth has been partially offset by improved global growth and commodity prices.
|
Table 2.3 Macroeconomic performance and projections
|
Calendar year
|
2014
|
2015
|
2016
|
2017
|
2018
|
2019
|
2020
|
|
Percentage change
|
Actual | Estimate | Forecast | ||||
|
Household consumption
|
0.7
|
1.7
|
0.8
|
1.0
|
1.2
|
1.6
|
1.9
|
|
Government consumption
|
1.1
|
0.5
|
2.0
|
0.9
|
1.7
|
1.0
|
1.0
|
|
Gross fixed capital formation
|
1.7
|
2.3
|
-3.9
|
-0.6
|
0.5
|
3.0
|
3.5
|
|
Gross domestic expenditure
|
0.6
|
1.8
|
-0.8
|
1.2
|
1.1
|
1.5
|
2.0
|
|
Exports
|
3.2
|
3.9
|
-0.1
|
2.5
|
3.2
|
3.4
|
3.5
|
|
Imports
|
-0.5
|
5.4
|
-3.7
|
4.0
|
3.1
|
3.5
|
3.8
|
|
Real GDP growth
|
1.7
|
1.3
|
0.3
|
0.7
|
1.1
|
1.5
|
1.9
|
|
GDP inflation
|
5.8
|
5.0
|
6.8
|
5.1
|
5.0
|
5.3
|
5.5
|
|
GDP at current prices (R billion)
|
3 807.7
|
4 049.8
|
4 338.9
|
4 601.8
|
4 888.8
|
5 222.3
|
5 611.9
|
|
CPI inflation
|
6.1
|
4.6
|
6.3
|
5.4
|
5.2
|
5.5
|
5.5
|
|
Current account balance (% of GDP)
|
-5.3
|
-4.4
|
-3.3
|
-2.3
|
-2.6
|
-2.9
|
-3.1
|
Source: National Treasury
|
Household consumption
|
||
|
Growth in household spending increased marginally to 1.1 per cent in the first half of the year from 0.6 per cent over the same period of 2016.
|
||
15
|
2017 MEDIUM TERM BUDGET POLICY STATEMENT
|
|
Notably, expenditure on durable goods, such as vehicles and washing machines, contracted during the first half of 2017.
|
||
|
Household consumption expenditure is projected to grow by 1 per cent in 2017
|
A 2.1 per cent contraction in real household disposable income in the first quarter was followed by growth of 4.5 per cent in the second, supported by rising real wages. Nominal year-on-year growth in employee compensation was 7 per cent in the second quarter, with strong increases in general government services. High debt levels continue to constrain household spending. The ratio of household debt to disposable income was 73 per cent in the first half of 2017, compared with 75 per cent in the same period in 2016. Growth in household consumption expenditure is projected to increase to 1 per cent in 2017, reaching 1.9 per cent in 2020 as employment growth strengthens and confidence improves.
|
|
 |
||
|
Fixed investment
|
||
|
Capital investment by public corporations has declined for four quarters
|
Total capital investment fell by 1.1 per cent in the first half of 2017 compared with a 2.7 per cent decline in the corresponding period of 2016. Investment by general government grew by 6.3 per cent. Investment by public and private corporations fell by 3.7 per cent and 2.5 per cent respectively. Capital investment by public corporations has declined for four consecutive quarters. In 2016, total capital investment declined for the first time since 2010, with large decreases in mining and manufacturing.
|
|
|
Private-sector investment accounts for 60 per cent of South Africa’s total investment. Weak domestic demand and continued policy uncertainty continue to curb investment plans. Over the long term, this reduces the economy’s potential growth rate. Gross fixed capital formation is expected to average 2.3 per cent growth over the next three years.
|
||
|
Net exports and the current account
|
||
|
Current account deficit narrowed to 2.2 per cent of GDP in first half of 2017
|
The current account deficit narrowed to 2.2 per cent of GDP in the first half of 2017 from 3.8 per cent over the same period in 2016. Imports declined, and the trade surplus improved to 1.3 per cent of GDP in the first half of 2017, compared with 0.1 per cent of GDP in the same period in 2016.
|
16
|
CHAPTER 2: ECONOMIC OUTLOOK
|
|
Merchandise exports saw an uptick from R541.5 billion in the first half of 2016 to R563.3 billion in the first half of this year. Increased mining and manufactured exports were supported by higher commodity prices. The shortfall in the net services, income and transfers balance narrowed from 3.9 per cent of GDP in the first half of 2016 to 3.6 per cent during the same period in 2017.
|
||
|
The current account deficit is projected to increase to 2.3 per cent of GDP in 2017, reaching 3.1 per cent in 2020.
|
||
|
Inflation
|
||
|
Consumer price index (CPI) inflation returned to within the 3 to 6 per cent target band in the second quarter of 2017. CPI inflation declined from 6.6 per cent in January to 4.8 per cent in August. Core inflation, which excludes price-volatile items such as food, fuel and electricity, fell from 5.9 per cent in December 2016 to 4.6 per cent in August 2017, reflecting weak domestic demand. Food price inflation declined from 12 per cent in December 2016 to 5.7 per cent in August 2017 as drought conditions subsided. Noting the improved inflation outlook, the Reserve Bank cut the repurchase (repo) rate from 7 per cent to 6.75 per cent in July 2017.
|
CPI inflation fell back within the target band, reflecting lower core inflation and food prices
|
|
|
Inflation expectations remain near the upper end of the target band. However, the inflation outlook has improved since the 2017 Budget. Headline inflation is now expected to average 5.4 per cent in 2017, down from 6.4 per cent. The revisions to the inflation outlook reflect lower oil and food prices, and a slightly stronger exchange rate assumption. The risks to the inflation outlook remain currency depreciation, higher oil prices, rising electricity tariffs and further sovereign rating downgrades.
|
||
|
Risks to the outlook
|
||
|
Policy and political uncertainty remain central risks to the domestic economic outlook. Elevated policy and political uncertainty, coupled with weak confidence, discourage investment and consumption. Further risks include a downgrade of the local currency rating and higher administrative prices, which would lead to higher inflation. In contrast, improving commodity prices can benefit mining, especially if policy certainty is restored. Better rainfall, especially in the Western and Northern Cape, can result in stronger-than-expected growth in agriculture.
|
Policy and political uncertainty, coupled with weak confidence, discourage investment and consumption
|
|
|
Economic assumptions
|
||
|
The macroeconomic forecast is underpinned by a set of assumptions. Those related to growth and inflation for key trading partners are sourced from the IMF. Commodity prices and global exchange rates are informed by futures curves, and calculated as a moving monthly average. Public investment assumptions are based on approved infrastructure expenditure plans. Food inflation assumptions are informed by high-frequency indicators and analysis.
|
Assumptions underpinning forecast cover global growth, inflation, trade and commodity prices
|
17
|
2017 MEDIUM TERM BUDGET POLICY STATEMENT
|
Table 2.4 Assumptions used in the economic forecast
|
2015
|
2016
|
2017
|
2018
|
2019
|
2020
|
|
|
Percentage
|
Actual
|
Estimate
|
Forecast
|
|||
|
Global demand1
|
4.2
|
4.0
|
4.3
|
4.4
|
4.2
|
4.2
|
|
International commodity prices2
|
||||||
|
Oil (US$ per barrel)
|
52.7
|
44.2
|
52.0
|
51.6
|
52.1
|
52.7
|
|
Gold (US$ per ounce)
|
1 160.4
|
1 247.9
|
1 267.6
|
1 320.0
|
1 342.0
|
1 363.6
|
|
Platinum (US$ per ounce)
|
1 055.4
|
988.3
|
967.7
|
992.2
|
1 014.5
|
1 037.4
|
|
Coal (US$ per ton)
|
57.1
|
64.4
|
83.8
|
79.8
|
74.6
|
71.8
|
|
Iron ore (US$ per ton)
|
56.1
|
58.6
|
73.8
|
67.8
|
61.6
|
57.9
|
|
Food inflation
|
5.1
|
10.5
|
7.3
|
5.1
|
5.9
|
6.0
|
|
Electricity inflation
|
9.2
|
9.2
|
4.7
|
5.1
|
8.0
|
8.0
|
|
Sovereign risk premium
|
2.9
|
3.4
|
2.9
|
2.8
|
2.4
|
2.3
|
|
Real public corporation investment
|
6.0
|
0.7
|
-1.3
|
0.0
|
3.0
|
4.3
|
|
Real private residential investment
|
8.4
|
-1.8
|
0.4
|
-2.1
|
1.2
|
4.4
|
| 1. |
Combined growth index of South Africa’s top 15 trading partners (IMF World Economic Outlook, October 2017)
|
| 2. |
Source: Bloomberg futures prices as at 8 September 2017
|
Source: National Treasury
|
The main revisions to the assumptions since the February 2017 forecast include greater global demand and improved commodity prices, mainly due to higher-than-expected iron ore prices. The risk premium – a measure of the extra return required by global buyers of South African bonds – is higher to reflect domestic policy uncertainty. Investment by public corporations is lower as capital projects are delayed due to weak economic conditions.
|
||
|
Alternative scenarios
|
||
|
The National Treasury has generated three alternate scenarios quantifying some of the risks to the baseline economic forecast.
|
||
|
Scenarios model effects of risk premium increases, as well as higher-than-expected global growth
|
Two scenarios involve downgrades to the local currency debt by global ratings agencies. In both scenarios, the risk premium increases to varying degrees. Global developments leading to broad aversion towards developing-country debt, or a sharp deterioration in the balance sheet of a state-owned company, could have similar effects. A moderate increase in the risk premium could see growth slow to 0.6 per cent in 2018 and 0.9 per cent in 2019. A large increase in the risk premium could see growth contracting by 1.2 per cent in 2018 and 0.8 per cent in 2019.
|
|
|
In the third scenario, global growth improves by an annual average of 0.5 percentage points over the medium term. Export commodity prices are 5 per cent higher than the baseline. The risk premium and bond yields are lower. Growth reaches 1.4 per cent in 2018 and 2.4 per cent in 2020.
|
||
|
The scenarios are presented in Annexure A.
|
18
3
Fiscal policy
|
In brief
|
|
|
●
|
The economic outlook has deteriorated significantly since the beginning of the year. Gross tax revenue for the 2017/18 – 2019/20 period is projected to fall short of the 2017 Budget estimates by R209 billion.
|
|
●
|
The consolidated budget deficit will widen to 4.3 per cent of GDP in 2017/18, against a 2017 Budget target of 3.1 per cent of GDP. Gross national debt is projected to reach over 60 per cent of GDP by 2022, with debt-service costs reaching 15 per cent of main budget revenue by 2020/21.
|
|
●
|
The expenditure ceiling could be breached by R3.9 billion in the current year, mainly as a result of government’s recapitalisation of South African Airways and the South African Post Office. Government is considering the disposal of assets to offset these appropriations during the current year.
|
|
●
|
Additional risks to the framework include more financial demands from state-owned companies, public-service compensation pressures and new spending commitments, particularly in higher education.
|
|
●
|
A presidential task team is considering a range of steps to bring the public finances back onto a sustainable path. Announcements will be made at the time of the 2018 Budget.
|
|
█ Erosion of the fiscal position
|
||
|
Over the past four years, government has followed a path of measured fiscal consolidation, aiming to stabilise the debt-to-GDP ratio by reducing spending and introducing tax increases. This strategy met with some success, reflected in a narrowing primary deficit. But debt has continued to rise as a share of GDP as economic growth rates have declined.
|
Debt levels have risen as economic growth and revenue collection have deteriorated
|
|
|
This year, a sharp deterioration in revenue collection and further downward revisions to economic growth projections have significantly eroded government’s fiscal position. Tax revenue is projected to fall short of the 2017 Budget estimate by R50.8 billion in the current year, the largest under-collection since the 2009 recession. At the same time, additional appropriations of R13.7 billion have been agreed to forestall calls against guaranteed debt by the creditors of South African Airways (SAA) and the South African Post Office (SAPO). These are partially offset by use of the contingency reserve, as well as projected underspending.
|
||
19
|
2017 MEDIUM TERM BUDGET POLICY STATEMENT
|
|
Consolidated budget deficit set to widen to 4.3 per cent of GDP in 2017/18
|
As a result of these developments, the consolidated budget deficit will widen to 4.3 per cent of GDP in 2017/18, against a 2017 Budget target of 3.1 per cent of GDP. Government’s short-term options to reverse this situation are limited. Given that per capita income is falling, the economic impact of further expenditure cuts or tax hikes could be counter-productive.
|
|
|
Following several years of expenditure restraint, further budget cuts will involve hard choices and difficult compromises. Sudden or deep additional cuts that are not well-targeted could put severe pressure on already stressed departmental budgets. Some national departments are battling to operate within the compensation limits set by Parliament in the current year. And several provincial departments are running up unpaid bills to maintain service delivery levels.
|
||
|
Stabilising gross debt below 60 per cent of GDP will require large spending cuts or tax hikes
|
At the same time, government is acutely aware of the dangers of unchecked debt accumulation. Debt-service costs are the fastest-growing category of expenditure, crowding out social and economic spending. By 2020/21, nearly 15 per cent of main budget revenue will be spent servicing debt. The National Treasury estimates that stabilising gross debt below 60 per cent of GDP over the coming decade will require spending cuts or tax hikes amounting to 0.8 per cent of GDP. In 2018/19, 0.8 per cent of GDP would amount to R40 billion.
|
|
 |
||
|
Sustainable public finances require significantly higher economic growth
|
Over the medium term, government is committed to maintaining the ceiling on non-interest expenditure. New spending priorities will have to be met by funds reallocated from within existing limits. Any adjustments to the ceiling itself would need to be matched by revenue increases.
|
|
|
A team of Cabinet ministers reporting directly to the President is considering a range of proposals to bring the public finances back onto a sustainable path. Announcements are expected to be made at the time of the 2018 Budget. More fundamentally, sustainable public finances require a significant acceleration of economic growth.
|
20
|
CHAPTER 3: FISCAL POLICY
|
|
█ Revenue performance and outlook
|
||
|
Over the past five years, despite a declining rate of economic growth, tax revenue continued to grow more rapidly than GDP. This trend came to an abrupt halt towards the end of 2016/17 as South Africa entered a recession. Despite substantial tax increases over the past two years, tax revenue growth has barely exceeded the low rate of economic growth.
|
The trend of buoyant revenue collection has run its course
|
|
|
In 2016/17, the largest shortfall against the 2017 Budget estimate was in customs duties, which slowed in tandem with falling import growth. Personal income tax, value-added tax (VAT) and corporate income tax also performed below projections. These shortfalls were offset by higher-than-projected dividend withholding taxes amounting to R5.4 billion. This windfall may have resulted from artificial declarations of dividend payments before the effective date to avoid the higher tax rate introduced in the 2017 Budget.
|
||
Table 3.1 Gross tax revenue
|
2016/17
|
2017/18
|
|||||
|
R billion
|
Budget1
|
Outcome
|
Deviations
|
Budget1
|
Revised
|
Deviations
|
|
Persons and individuals
|
425.8
|
424.5
|
-1.3
|
482.1
|
461.3
|
-20.8
|
|
Companies
|
205.1
|
204.4
|
-0.7
|
218.7
|
213.9
|
-4.8
|
|
Value-added tax
|
290.0
|
289.2
|
-0.8
|
312.8
|
301.3
|
-11.4
|
|
Dividend withholding tax2
|
25.7
|
31.1
|
5.4
|
34.2
|
31.6
|
-2.6
|
|
Specific excise duties
|
35.7
|
35.8
|
0.1
|
39.9
|
37.4
|
-2.5
|
|
Fuel levy
|
63.0
|
62.8
|
-0.2
|
70.9
|
70.1
|
-0.8
|
|
Customs duties
|
47.5
|
45.6
|
-1.9
|
52.6
|
47.2
|
-5.4
|
|
Ad-valorem excise duties
|
3.4
|
3.4
|
0.0
|
3.6
|
3.6
|
-0.0
|
|
Other
|
48.2
|
47.3
|
-0.9
|
50.7
|
48.4
|
-2.3
|
|
Gross tax revenue
|
1 144.4
|
1 144.1
|
-0.3
|
1 265.5
|
1 214.7
|
-50.8
|
| 1. |
2017 Budget figures
|
| 2. |
Includes secondary tax on companies
|
Source: National Treasury
|
Factors contributing to poor revenue performance
|
||
|
The lower outcomes in 2016/17 explain part of the shortfall in the current year. However, revenue growth has remained weak, even as the economy emerged from recession in the second quarter of 2017. For the first six months of 2017/18, gross tax revenue grew by 5.9 per cent year-on-year against a target of 10.7 per cent. All tax instruments are performing poorly, with large shortfalls for personal and corporate income tax, and dividend withholding tax. The National Treasury projects a tax revenue shortfall of R50.8 billion in 2017/18 compared with the 2017 Budget estimate.
Revenue weakness reflects a number of economic factors:
|
Projected revenue shortfall of R50.8 billion in current year
|
|
●
|
Growth in key sectors that have supported buoyant revenue collection – such as finance, retail and telecommunications – has slowed.
|
||
|
●
|
Personal income tax collection has been affected by low bonus payments, moderate wage settlements, job losses and a slower expansion of public-sector employment.
|
||
|
●
|
Corporate income tax under-collections in the first half of 2017/18 resulted from persistently weak growth and commodity price volatility.
|
||
|
●
|
Weak investment and household consumption led to a sharp contraction in imports in 2016, affecting VAT and customs duties.
|
|
21
|
2017 MEDIUM TERM BUDGET POLICY STATEMENT
|
|
●
|
The stabilisation of the rand has muted the buoyancy of import taxes and revenue on profits in traded sectors, such as mining.
|
|
Compliance concerns mounting in face of tax administration challenges and weaker tax morality
|
Policy and administrative factors may also be contributing to the shortfall. Behavioural responses to tax increases may be larger than anticipated and revenue could perform below expectations even if taxes are hiked. Compliance concerns are mounting in the context of tax administration challenges and weakening tax morality. Implementing the recommendations from the Tax Ombud’s report on delays in the payment of VAT refunds by the South African Revenue Service will help to improve taxpayer confidence in revenue administration.
|
|
|
Medium-term revenue outlook
|
||
|
The 2016/17 revenue outcomes, the recent recession and the changing composition of economic growth underline the need for caution when estimating revenue growth in the period ahead. Compared with the 2017 Budget, nominal GDP growth forecasts have been revised down by about 1.5 percentage points per year between 2017/18 and 2019/20. Forecasts for nominal growth in gross tax revenue have been revised down by an annual average of 2.2 per cent over the same period.
|
||
|
Tax buoyancy has fallen significantly over the past two years
|
Tax buoyancy – the expansion of revenue associated with economic growth – has fallen significantly in the past two years. Between 2010/11 and 2015/16, each percentage point of GDP growth led to a 1.23 per cent growth in gross tax revenue. Last year, tax buoyancy fell to only 1.01, despite tax policy changes intended to raise R18 billion in additional revenue. This year, despite tax policy measures designed to add R28 billion to revenue, buoyancy of only 1.02 is estimated.
|
|
|
The medium-term revenue framework is set out in Table 3.2. It shows the assumptions underlying the projections for each major tax instrument. The framework assumes annual adjustments to thresholds and brackets in line with consumer price index (CPI) inflation projections. It also shows the tax policy measures announced in the 2016 Budget, amounting to R15 billion in 2018/19.
|
||
|
Lower revenue growth in years ahead reflects downward revisions of growth in major tax bases
|
Excluding the 2018/19 tax increase, gross tax revenue buoyancy averages 1.11 over the medium term. Lower revenue growth in the years ahead reflects the downward revisions to the growth of major tax bases – wages, corporate profits and household consumption spending – as well as expectations of lower tax buoyancy. The medium-term buoyancy of personal income tax has been revised down to 1.15, well below the 2016 MTBPS estimate of 1.28. The buoyancy of corporate income tax is highly uncertain, and projections have been set at a long-run average of 1.0. VAT buoyancy averages 1.17 over the medium term. Last year’s VAT buoyancy was muted by the sharp contraction of imports, which is not expected to continue.
|
|
|
These assumptions produce gross tax revenue projections that fall short of 2017 Budget estimates by R50.8 billion in 2017/18, R69.3 billion in 2018/19 and R89.4 billion in 2019/20.
|
22
|
CHAPTER 3: FISCAL POLICY
|
Table 3.2 Medium-term revenue framework
|
2014/15
|
2015/16
|
2016/17
|
2017/18
|
2018/19
|
2019/20
|
2020/21
|
|
|
R billion
|
Outcome
|
Estimate
|
Medium-term estimates
|
||||
|
Personal income tax
|
353.0
|
388.1
|
424.5
|
461.3
|
499.8
|
544.9
|
595.5
|
|
Wage bill1
|
1 803.6
|
1 939.3
|
2 090.7
|
2 223.3
|
2 385.0
|
2 571.9
|
2 779.6
|
|
Buoyancy
|
1.61
|
1.32
|
1.20
|
1.36
|
1.15
|
1.15
|
1.15
|
|
Corporate income tax
|
184.9
|
191.2
|
204.4
|
213.9
|
223.6
|
236.2
|
251.0
|
|
Net operating surplus
|
1 064.2
|
1 090.8
|
1 158.0
|
1 238.7
|
1 294.7
|
1 367.7
|
1 453.8
|
|
Buoyancy
|
1.73
|
1.35
|
1.13
|
0.67
|
1.00
|
1.00
|
1.00
|
|
Value-added tax
|
261.3
|
281.1
|
289.2
|
301.3
|
324.8
|
352.1
|
383.3
|
|
Household consumption
|
2 310.7
|
2 449.7
|
2 619.2
|
2 771.6
|
2 956.2
|
3 169.4
|
3 410.6
|
|
Buoyancy
|
1.65
|
1.26
|
0.41
|
0.72
|
1.17
|
1.17
|
1.16
|
|
Gross tax revenue (pre-proposals)
|
986.3
|
1 070.0
|
1 144.1
|
1 214.7
|
1 300.1
|
1 402.1
|
1 519.0
|
|
Buoyancy
|
1.37
|
1.29
|
1.01
|
1.02
|
1.11
|
1.12
|
1.11
|
|
Announced tax policy measures2
|
–
|
–
|
–
|
–
|
15.0
|
16.0
|
17.3
|
|
Gross tax revenue (post-proposals)
|
986.3
|
1 070.0
|
1 144.1
|
1 214.7
|
1 315.1
|
1 418.1
|
1 536.3
|
|
Nominal GDP
|
3 867.9
|
4 122.6
|
4 404.5
|
4 672.2
|
4 968.1
|
5 315.5
|
5 716.7
|
|
Buoyancy
|
1.37
|
1.29
|
1.01
|
1.02
|
1.31
|
1.12
|
1.10
|
|
Non-tax revenue
|
18.3
|
42.9
|
18.8
|
18.0
|
18.5
|
19.5
|
20.7
|
|
Southern African Customs Union3
|
-51.7
|
-51.0
|
-39.4
|
-56.0
|
-48.3
|
-44.7
|
-57.8
|
|
National Revenue Fund receipts4
|
12.6
|
14.4
|
14.2
|
16.7
|
9.2
|
6.0
|
3.0
|
|
Main budget revenue
|
965.5
|
1 076.2
|
1 137.6
|
1 193.5
|
1 294.5
|
1 398.9
|
1 502.1
|
| 1. |
Total remuneration in the formal non-agriculture sector
|
| 2. |
Unspecified tax policy measures announced in the 2016 Budget. The details will be announced in 2018.
The initial tax increase in 2018/19 is carried into the following two years at the same rate as nominal GDP growth |
| 3. |
Amount made up of payments and other adjustments
|
| 4. |
Mainly revaluation profits on foreign-currency transactions and premiums on loan transactions
|
Source: National Treasury
|
Shortfalls over the next two years are partially offset by lower payments to the Southern African Customs Union (SACU), stronger departmental receipts, and mineral and petroleum royalties. More detail on the medium-term revenue framework is contained in Annexure C.
|
|
Revisions to Southern African Customs Union outlook
|
|||||||||
|
Compared with 2017 Budget estimates, South Africa’s projected payments to SACU have been revised down by R14.1 billion in 2018/19 and R19.8 billion in 2019/20. The SACU Common Revenue Pool is expected to shrink as weaker-than-expected imports and household consumption reduce customs and excise duties. South Africa’s customs duty – a major driver of payments to SACU – was the poorest-performing tax category in 2016/17.
|
|||||||||
|
Changes to the Common Revenue Pool since 2017 Budget
|
|||||||||
|
2017/18
|
2018/19
|
2019/20
|
|||||||
|
R million
|
2017
Budget
|
Revised
|
Deviations
|
2017
Budget
|
Revised
|
Deviations
|
2017
Budget
|
Revised
|
Deviations
|
|
Customs duties
|
52 608
|
47 162
|
-5 446
|
58 059
|
50 116
|
-7 942
|
64 170
|
54 249
|
-9 921
|
|
Specific excise duties
|
39 871
|
37 373
|
-2 497
|
42 124
|
39 403
|
-2 721
|
44 497
|
41 572
|
-2 925
|
|
Ad-valorem duties
|
3 640
|
3 603
|
-37
|
3 937
|
3 831
|
-107
|
4 257
|
4 099
|
-159
|
|
Gross tax revenue
|
96 118
|
88 138
|
-7 980
|
104 120
|
93 350
|
-10 770
|
112 925
|
99 920
|
-13 004
|
|
To manage the impact of lower collections, the SACU revenue-sharing formula takes account of forecast errors, with a two-year lag. The revision in 2018/19 partly reflects an overpayment from South Africa to other SACU members in 2016/17. Similarly, lower-than-anticipated customs duties in 2017/18 will reduce revenue transfers in 2019/20.
Member states are reviewing the 2002 SACU Agreement with a view to making SACU transfers more stable.
|
|||||||||
|
2018/19 SACU revenue shares
|
|
||||||||
|
R million
|
Botswana
|
Lesotho
|
Namibia
|
Swaziland
|
South Africa
|
Total
|
|
|
|
|
2018/19 revenue shares
|
19 896
|
5 669
|
17 769
|
5 989
|
43 942
|
93 265
|
|
||
|
2016/17 CRP adjustment
|
-436
|
-128
|
-398
|
-147
|
-884
|
-1 993
|
|
|
|
|
Total
|
19 460
|
5 541
|
17 371
|
5 843
|
43 058
|
91 272
|
|
|
|
23
|
2017 MEDIUM TERM BUDGET POLICY STATEMENT
|
|
Weaker-than-expected growth and changes in composition of underlying tax bases are risks to revenue outlook
|
The primary risks to the revenue outlook are weaker-than-expected economic growth, the effects of changes in the composition of underlying tax bases and deterioration in tax morality, compliance and administration.
|
|
|
Tax policy, expenditure limits and debt stabilisation
|
||
|
To anchor a sustainable budget, structural increases in expenditure must be matched by structural increases in revenue. As stated in the 2015 MTBPS, the expenditure ceiling can be adjusted to accommodate new spending priorities when a permanent source of revenue is found to offset increased spending. For example, government is considering proposals to finance national health insurance (NHI) through adjustments to the medical tax credit, discussed below.
|
||
|
Any additional tax proposals need to be carefully considered in light of economic and fiscal pressures
|
Similar consideration is needed for other emerging policy priorities, such as proposals to increase funding for higher education and defence. Furthermore, additional tax proposals need to be carefully considered in light of overall pressures in the economy and the fiscus, and the need to stabilise the debt-to-GDP ratio.
|
|
|
The Health Promotion Levy, which discourages the consumption of sugary beverages, is under consideration in Parliament, with a proposed start date of 1 April 2018. The revised Carbon Tax Bill will be published shortly.
|
|
Medical tax credit
|
|
In 2012, government moved from a system of deductions for medical aid contributions and qualifying expenses to a system of tax credits independent of taxable income. In 2014/15, 3 million taxpayers claimed the credit on behalf of 8 million medical scheme members, resulting in a tax expenditure of R18.5 billion. The incidence of these credits is spread across the income distribution: 56 per cent of the total credits claimed accrued to 1.9 million taxpayers who had a taxable income of less than R300 000. This includes many workers who belong to medical aid schemes.
|
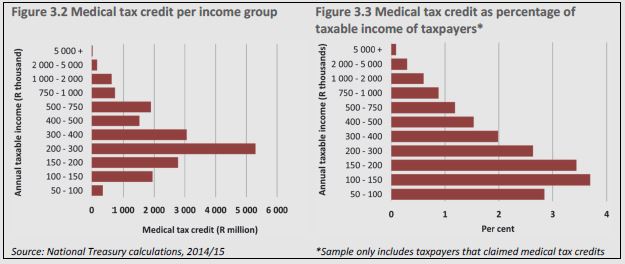 |
|
The 2017 Budget Speech stated that “consideration is being given to possible reductions in this subsidy in future, as part of the financing framework for national health insurance”. The National Treasury is considering changes to the design, targeting and value of the medical tax credit as part of the policy development process for the 2018 Budget. Tax data, however, indicates that the programme is well-targeted to lower and middle-income taxpayers. The National Treasury will seek input from the Davis Tax Committee on the feasibility of proposals to adjust the medical tax credit to fund NHI.
|
24
|
CHAPTER 3: FISCAL POLICY
|
|
█ Expenditure performance and outlook
|
||
|
Expenditure ceiling
|
||
|
The 2012 Budget introduced expenditure ceilings to enable government to manage departmental spending levels in the context of a constrained fiscal framework. Allocations made over the MTEF period provide an agreed-upon upper limit within which departments prepare their budgets. The expenditure ceiling has been lowered by R7 billion in 2018/19 and R15 billion in 2019/20 as a result of reductions to the contingency reserve.
|
||
Table 3.3 Main budget expenditure ceiling1
|
R million
|
2014/15
|
2015/16
|
2016/17
|
2017/18
|
2018/19
|
2019/20
|
2020/21
|
|
2015 Budget Review
|
1 006 905
|
1 081 214
|
1 152 833
|
1 250 086
|
|||
|
2016 Budget Review
|
1 001 874
|
1 076 705
|
1 152 833
|
1 240 086
|
1 339 422
|
||
|
2016 MTBPS
|
1 074 992
|
1 144 353
|
1 229 742
|
1 323 465
|
1 435 314
|
||
|
2017 Budget Review2
|
1 074 970
|
1 144 225
|
1 229 823
|
1 323 553
|
1 435 408
|
||
|
2017 MTBPS
|
1 074 970
|
1 141 978
|
1 233 722
|
1 316 553
|
1 420 408
|
1 524 222
|
| 1. |
The expenditure ceiling differs from main budget non-interest expenditure. The precise definition and calculation of the expenditure ceiling is contained in Annexure C
|
| 2. |
Adjusted for the full amount for New Development Bank in 2015/16 and for the International Oil Pollution Compensation Fund
|
Source: National Treasury
|
Interest payments are excluded from the expenditure ceiling. So are payments for financial assets funded by the sale of assets in the same year. This principle was applied to the R23 billion allocation to Eskom in 2015, which was financed by the sale of government’s Vodacom shares.
|
||
|
As Table 3.4 shows, expenditure is expected to breach the ceiling by R3.9 billion in the current year. This is the result of large appropriations for SAA and the SAPO. In combination, these allocations amount to R13.7 billion. Government is considering the disposal of assets to offset these appropriations. Should such disposals take place, the breach will not occur.
|
Asset disposals being considered to rectify potential breach of expenditure ceiling in current year
|
Table 3.4 Revisions to the 2017/18 expenditure ceiling
|
R million
|
||
|
Expenditure ceiling: 2017 Budget Review
|
1 229 823
|
|
|
Upward expenditure adjustments
|
16 167
|
|
|
Roll-over of funds from 2016/17
|
217
|
|
|
Unforeseeable and unavoidable expenditure
|
586
|
|
|
Section 16 of the PFMA (SAA recapitalisation)
|
5 208
|
|
|
Announced in the 2017 Budget1
|
8 609
|
|
|
Self-financing2
|
1 547
|
|
|
Downward expenditure adjustments
|
(12 268)
|
|
|
Declared unspent funds
|
(1 668)
|
|
|
Direct charges against the National Revenue Fund:
|
(100)
|
|
|
Magistrates’ salaries
|
||
|
Contingency reserve
|
(6 000)
|
|
|
National government projected underspending
|
(3 000)
|
|
|
Local government repayment to the National Revenue Fund
|
(1 500)
|
|
|
Revised expenditure ceiling
|
1 233 722
|
| 1. |
Includes the recapitalisation of the SAPO (R3.7 billion) and SAA (R4.8 billion) and the
finalisation of the establishment of the Tirisano Construction Fund Trust (R117 million) |
| 2. |
Spending financed from revenue derived from a vote’s specific activities
|
Source: National Treasury
25
|
2017 MEDIUM TERM BUDGET POLICY STATEMENT
|
|
Medium-term expenditure outlook
|
||
|
Reduction in contingency reserve leaves government little room to manoeuvre if risks materialise
|
To offset revenue shortfalls and reduce borrowing, the contingency reserve has been pared down to R3 billion in 2018/19, R5 billion in 2019/20 and R8 billion in 2020/21. This leaves government with little room to manoeuvre should risks to the expenditure ceiling materialise. Moreover, further reductions in the ceiling may be required to stabilise national debt. A presidential committee will consider options in this regard to be tabled as part of the MTEF tabled with the 2018 Budget.
|
|
|
Expenditure trends are discussed in Chapter 4. Various risks and pressures need to be taken into account over the medium term:
|
|
●
|
Additional spending commitments may emerge from policy processes under way. Government is evaluating the implications of providing fee-free higher education and training to poor and middle-income students. Other policy commitments include NHI, proposals in the Defence Review, improved early childhood development, accelerated land reform and several large infrastructure project proposals.
|
||
|
●
|
The inflation outlook has been revised down compared with the 2017 Budget, relieving pressure on inflation-linked expenditure such as the wage bill. However, public-sector remuneration budgets pose a large and imminent risk, with the possibility that some national and provincial departments will exceed compensation ceilings.
|
||
|
●
|
A new civil service wage agreement in which salary increases exceed CPI inflation, and without headcount reductions, would render the current expenditure limits difficult to achieve. Analysis of compensation trends appears in Annexure B.
|
||
|
●
|
Several state-owned companies persistently demonstrate operational inefficiencies, poor procurement practices, weak corporate governance and failures to abide by fiduciary obligations. The risk here is substantial, as discussed in the box below.
|
||
|
These and other fiscal risks are discussed at length in Annexure A.
|
|||
|
Fiscal risks posed by state-owned companies
|
|
Since 2012, the profitability of state-owned companies has declined due to a combination of operational inefficiencies, governance failures and weak demand. These factors have increased reliance on borrowing to fund operations, leaving several entities heavily indebted, without sufficient cash to service their debt obligations or even to run their operations.
|
|
With no meaningful prospects of a short-term recovery in earnings, lenders are increasingly unwilling to roll over maturing debt or extend new loans, even with government guarantees. State-owned companies that have been able to roll over maturing debt have done so on an increasingly unsustainable basis, with shorter repayment terms, higher interest rates or reliance on government guarantees. Several lenders have declined to roll over debt falling due and required settlement.
|
|
Government stepped in to bail out SAA, preventing a call on guarantees or the liquidation of the carrier. It is unlikely that SAPO would have been able to settle its loan without state support given the deficit it has been running for months. Several others, including Denel, South African Express and the South African Broadcasting Corporation face liquidity shortfalls, and will likely require some form of intervention from government.
|
26
|
CHAPTER 3: FISCAL POLICY
|
|
Debt-service costs
|
||
|
At a time when revenue is under pressure, an increasing share of tax collection will be diverted to settle interest payments. As gross debt expands, debt service will remain the fastest-growing category of spending over the next three years.
|
||
|
Relative to the 2017 Budget projections, debt-service costs will be R1 billion higher in 2017/18, R2.4 billion higher in 2018/19 and R6 billion higher in 2019/20. By 2020/21, government projects that nearly 15 per cent of main budget revenue will go toward servicing debt. This crowds out the space to fund social and economic priorities.
|
Mounting debt-service costs crowd out social and economic expenditure
|
|
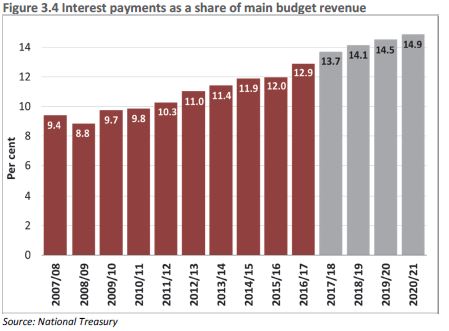 |
||
|
Over the next two years, the impact of higher borrowing will be partially offset by two factors. Lower interest rates have reduced short-term debt-service costs following the Reserve Bank’s decision to cut the repo rate. And the stronger-than-anticipated exchange rate has eased interest payments on debt denominated in foreign currency.
|
||
|
█ Fiscal framework
|
||
|
Main budget framework
|
||
|
The main budget framework, presented in Table 3.5, summarises expenditure financed from the National Revenue Fund. Main budget revenue is projected to grow from 25.5 per cent of GDP in 2017/18 to 26.3 per cent of GDP in 2020/21. Over the same period, main budget expenditure will grow from 30.2 per cent of GDP to 30.9 per cent of GDP.
|
Revenue projected to grow to 26.3 per cent of GDP in 2020/21, while expenditure will rise to 30.9 per cent of GDP
|
|
|
The main budget deficit, which is government’s net borrowing requirement, will be 4.7 per cent of GDP in 2017/18, compared with a 2017 Budget projection of 3.5 per cent. Borrowing will need to be R52.8 billion higher than projected in the current year, mainly as a result of revenue shortfalls. Over the medium term, the main budget deficit is expected to stabilise at 4.6 per cent of GDP. The primary balance – the difference between revenue and non-interest spending – had been projected to continue narrowing. However, revenue shortfalls now result in the primary deficit stabilising at 0.7 per cent of GDP.
|
27
|
2017 MEDIUM TERM BUDGET POLICY STATEMENT
|
|
Table 3.5 Main budget framework
|
|||||||
|
2014/15
|
2015/16
|
2016/17
|
2017/18
|
2018/19
|
2019/20
|
2020/21
|
|
|
R billion/percentage of GDP
|
Outcome
|
Revised
|
Medium-term estimates
|
||||
|
Main budget revenue
|
965.5
|
1 076.2
|
1 137.6
|
1 193.5
|
1 294.5
|
1 398.9
|
1 502.1
|
|
25.0%
|
26.1%
|
25.8%
|
25.5%
|
26.1%
|
26.3%
|
26.3%
|
|
|
Main budget expenditure
|
1 131.9
|
1 244.6
|
1 305.5
|
1 413.1
|
1 516.6
|
1 642.0
|
1 767.4
|
|
29.3%
|
30.2%
|
29.6%
|
30.2%
|
30.5%
|
30.9%
|
30.9%
|
|
|
Non-interest expenditure
|
1 017.1
|
1 115.8
|
1 159.0
|
1 249.8
|
1 333.5
|
1 438.7
|
1 544.1
|
|
26.3%
|
27.1%
|
26.3%
|
26.7%
|
26.8%
|
27.1%
|
27.0%
|
|
|
Debt-service costs
|
114.8
|
128.8
|
146.5
|
163.3
|
183.1
|
203.3
|
223.4
|
|
3.0%
|
3.1%
|
3.3%
|
3.5%
|
3.7%
|
3.8%
|
3.9%
|
|
|
Main budget balance
|
-166.4
|
-168.4
|
-167.8
|
-219.6
|
-222.0
|
-243.1
|
-265.3
|
|
-4.3%
|
-4.1%
|
-3.8%
|
-4.7%
|
-4.5%
|
-4.6%
|
-4.6%
|
|
|
Primary balance
|
-51.6
|
-39.6
|
-21.3
|
-56.3
|
-39.0
|
-39.8
|
-42.0
|
|
-1.3%
|
-1.0%
|
-0.5%
|
-1.2%
|
-0.8%
|
-0.7%
|
-0.7%
|
|
Source: National Treasury
|
Consolidated budget framework
|
||
|
The consolidated budget includes the main budget and spending financed from the revenues raised directly by provinces, social security funds and public entities.
|
||
|
Social security funds, primarily the Unemployment Insurance Fund, continue to run a surplus
|
The estimates for social security funds and public entities over the 2017/18 – 2019/20 period remain unchanged from the 2017 Budget. Social security funds are expected to continue operating with an annual cash surplus, the bulk of which comes from the Unemployment Insurance Fund. Public entities are government agencies that largely operate on the basis of transfers from the fiscus, supported in some cases by user charges. The deficit of public entities in the current year reflects the financing of increased allocations of the National Student Financial Aid Scheme from the retained surpluses of the National Skills Fund, as announced at the time of the 2017 Budget. Otherwise, public entities collectively continue to operate with an annual cash surplus.
|
|
|
Provincial data has been revised in line with tabled provincial budgets and annual financial statements. Reduced allocations to provinces last year were cushioned by running down cash reserves previously built up by provincial governments. The Reconstruction and Development Fund is the statutory conduit for resources donated by international development partners, which are received up front and run down over time.
|
||
|
Taken together, the annual cash balances of the social security funds and public entities offset the deficit on the main budget. The consolidated deficit is now projected at 4.3 per cent of GDP compared with a 2017 Budget estimate of 3.1 per cent of GDP. Over the next two years, the consolidated budget deficit is projected to be 1.2 per cent of GDP wider than the 2017 Budget estimate.
|
28
|
CHAPTER 3: FISCAL POLICY
|
|
Table 3.6 Consolidated fiscal framework
|
|||||||
|
2014/15
|
2015/16
|
2016/17
|
2017/18
|
2018/19
|
2019/20
|
2020/21
|
|
|
R billion/percentage of GDP
|
Outcome
|
Revised
|
Medium-term estimates
|
||||
|
Main budget
|
|||||||
|
Revenue
|
965.5
|
1 076.2
|
1 137.6
|
1 193.5
|
1 294.5
|
1 398.9
|
1 502.1
|
|
Expenditure
|
1 131.9
|
1 244.6
|
1 305.5
|
1 413.1
|
1 516.6
|
1 642.0
|
1 767.4
|
|
Balance
|
-166.4
|
-168.4
|
-167.8
|
-219.6
|
-222.0
|
-243.1
|
-265.3
|
|
Social security funds
|
|||||||
|
Revenue
|
51.3
|
63.9
|
72.9
|
76.9
|
81.6
|
86.1
|
90.8
|
|
Expenditure
|
35.5
|
45.0
|
53.1
|
55.5
|
58.3
|
61.7
|
65.2
|
|
Balance
|
15.8
|
18.9
|
19.8
|
21.4
|
23.2
|
24.4
|
25.7
|
|
Public entities
|
|||||||
|
Revenue
|
63.5
|
62.8
|
66.9
|
73.5
|
79.2
|
86.3
|
92.4
|
|
Expenditure
|
54.0
|
55.7
|
64.3
|
77.6
|
73.5
|
76.5
|
81.9
|
|
Balance
|
9.5
|
7.1
|
2.6
|
-4.1
|
5.7
|
9.9
|
10.6
|
|
Other balances
|
|||||||
|
Provinces
|
6.2
|
0.6
|
-2.6
|
-0.8
|
0.3
|
1.1
|
3.6
|
|
RDP Fund
|
0.4
|
-0.5
|
0.6
|
0.1
|
-0.3
|
-0.3
|
-0.3
|
|
Consolidated budget
|
|||||||
|
Revenue
|
1 098.9
|
1 222.0
|
1 298.2
|
1 363.6
|
1 477.5
|
1 594.2
|
1 709.3
|
|
Expenditure
|
1 233.5
|
1 364.2
|
1 445.7
|
1 566.6
|
1 670.6
|
1 802.3
|
1 935.1
|
|
Balance
|
-134.6
|
-142.2
|
-147.5
|
-203.0
|
-193.1
|
-208.1
|
-225.8
|
|
-3.5%
|
-3.4%
|
-3.3%
|
-4.3%
|
-3.9%
|
-3.9%
|
-3.9%
|
|
Source: National Treasury
|
█ Financing and debt management strategy
|
||
|
Gross loan debt is expected to increase from R2.5 trillion or 54.2 per cent of GDP in 2017/18 to R3.4 trillion or 59.7 per cent of GDP in 2020/21. Absent higher economic growth or additional steps to narrow the budget deficit, the debt-to-GDP ratio is unlikely to stabilise over the medium term.
|
||
|
Table 3.7 Total national government debt
|
|||||
|
End of period
|
2016/17
|
2017/18
|
2018/19
|
2019/20
|
2020/21
|
|
R billion
|
Outcome
|
Estimate
|
Medium-term estimates
|
||
|
Domestic loans1
|
2 020.1
|
2 281.2
|
2 529.9
|
2 793.0
|
3 075.7
|
|
Short-term
|
277.2
|
310.1
|
331.7
|
360.7
|
396.7
|
|
Long-term
|
1 742.9
|
1 971.1
|
2 198.2
|
2 432.3
|
2 679.0
|
|
Fixed-rate
|
1 300.3
|
1 452.5
|
1 605.1
|
1 757.0
|
1 915.4
|
|
Inflation-linked
|
442.6
|
518.6
|
593.1
|
675.3
|
763.6
|
|
Foreign loans1
|
212.8
|
249.3
|
299.7
|
301.2
|
339.9
|
|
Gross loan debt
|
2 232.9
|
2 530.5
|
2 829.6
|
3 094.2
|
3 415.6
|
|
Less: National Revenue Fund
bank balances |
-224.6
|
-236.3
|
-261.1
|
-230.6
|
-236.2
|
|
Net loan debt2
|
2 008.3
|
2 294.2
|
2 568.5
|
2 863.6
|
3 179.4
|
|
As percentage of GDP:
|
|||||
|
Gross loan debt
|
50.7%
|
54.2%
|
57.0%
|
58.2%
|
59.7%
|
|
Net loan debt
|
45.6%
|
49.1%
|
51.7%
|
53.9%
|
55.6%
|
1. Estimates include revaluations based on National Treasury’s projections of inflation and exchange rates
2. Net loan debt is gross loan debt minus the bank balances of the National Revenue Fund
Source: National Treasury
29
|
2017 MEDIUM TERM BUDGET POLICY STATEMENT
|
|
In addition to the main budget deficit, government needs to refinance maturing debt. Debt redemptions that need to be rolled over increase to R109.3 billion in 2019/20, mainly due to large foreign loan redemptions. This refinancing will be done at higher forecasted long-term interest rates.
|
||
|
Over medium term, gross borrowing requirement is nearly R1 trillion
|
The gross borrowing requirement – defined as the sum of budget deficits and funds required to roll over (refinance) debt that matures during a year – is projected to increase from R248.3 billion in 2017/18 to R333.5 billion in 2020/21. Over the medium term, the gross borrowing requirement is close to R1 trillion. The refinancing of Treasury bills with maturities of less than a year is not included in the table below. These amount to R1.6 trillion over the same period.
|
|
Table 3.8 Gross borrowing requirement
|
||||||
|
2016/17
|
2017/18
|
2018/19
|
2019/20
|
2020/21
|
||
|
R billion
|
Outcome
|
Budget
|
Revised
|
Medium-term estimates
|
||
|
Main budget deficit
|
167.8
|
166.8
|
219.6
|
222.0
|
243.1
|
265.3
|
|
Redemptions
|
73.1
|
54.1
|
28.7
|
48.7
|
109.4
|
68.2
|
|
Domestic long-term loans
|
57.4
|
49.5
|
24.6
|
46.4
|
58.9
|
55.9
|
|
Foreign loans
|
15.7
|
4.6
|
4.1
|
2.3
|
50.5
|
12.3
|
|
Total
|
240.9
|
220.9
|
248.3
|
270.7
|
352.5
|
333.5
|
|
Percentage of GDP
|
5.5%
|
4.7%
|
5.3%
|
5.4%
|
6.6%
|
5.8%
|
Source: National Treasury
|
Government’s borrowing programme is underpinned by prudent benchmarks for refinancing, interest, inflation and currency risks, which ensure the debt portfolio remains well-structured.
|
|||
|
In response to the widening deficit, government has adjusted its funding strategy, but will remain within its benchmarks. Adjustments include:
|
|||
|
●
|
Increasing Treasury bill issuance to use as bridging finance and to fund part of the higher borrowing requirement.
|
||
|
●
|
Raising the amount of debt issued in weekly auctions for both fixed-rate and inflation-linked bonds.
|
||
|
●
|
Increasing borrowing from global markets to pre-fund foreign-currency redemptions in 2019/20, and to fully cover government’s foreign-currency commitments.
|
||
|
Details of government’s financing of the borrowing requirement by instrument are shown in Annexure C.
|
|||
30
4
Expenditure priorities
|
In brief
|
|
|
●
|
Medium-term spending plans have been developed in the context of weak economic growth trends, limited budgetary resources and rising pressures on the fiscus.
|
|
●
|
Over the three-year spending period ahead, consolidated expenditure will grow by an annual average of 7.3 per cent, from R1.6 trillion in 2017/18 to R1.9 trillion in 2020/21. The fastest-growing functions are Community Development, Learning and Culture, and Health. The fastest-growing category of expenditure is debt-service costs, which grows by 11 per cent.
|
|
●
|
Government will protect spending on core social programmes that benefit poor South Africans. Funding for any new policy priorities will come mainly from reprioritisation.
|
|
●
|
The division of non-interest expenditure between national, provincial and local government remains stable at 47.6 per cent, 43.2 per cent and 9.2 per cent respectively.
|
|
█ Introduction
|
||
|
In August 2017, Cabinet approved a Mandate Paper to guide the spending choices of national government. As in recent years, additional allocations over the medium-term expenditure framework (MTEF) period will be funded mainly through reprioritisation of existing budget baselines. Additional resources to support spending priorities will be severely limited by the economic outlook presented in Chapter 2 and the fiscal policy challenges set out in Chapter 3. Structural increases in expenditure to accommodate new policy initiatives, and resulting adjustments to the spending ceiling, will need to be matched by parallel tax increases.
|
Spending on new policy initiatives will require reprioritisation or matching tax increases
|
|
|
Over the three-year spending period ahead, consolidated expenditure will grow by an annual average of 7.3 per cent, from R1.6 trillion in 2017/18 to R1.9 trillion in 2020/21. The fastest-growing functions are Community Development, Learning and Culture (which includes post-school education and training) and Health, with growth rates of 7.9 per cent, 7.6 per cent and 7.5 per cent respectively. Debt-service costs as an expenditure category grows the fastest at 11 per cent.
|
||
31
|
2017 MEDIUM TERM BUDGET POLICY STATEMENT
|
|
Reductions in expenditure ceiling may be required to stabilise public finances
|
Further reductions in the expenditure ceiling may be required over the next three years to stabilise the public finances. A presidential task team will identify savings and programme closures to improve the efficiency and impact of expenditure. Details will be announced in the 2018 Budget.
|
|
|
█ Expenditure priorities and pressures
|
||
|
The Mandate Paper prepared by the Department of Planning, Monitoring and Evaluation serves as a Cabinet-endorsed mandate against which departments and public agencies should refine their plans and budget proposals. The purpose is to strengthen alignment of the national budget, the medium-term strategic framework and the National Development Plan (NDP), during the final 24 months of the current administration.
|
||
|
Mandate Paper notes that on current trends, South Africa is unlikely to meet its NDP goals
|
The paper observes that on current trends, South Africa is unlikely to achieve its NDP goals. It also notes that there will be no additional funds available to increase baseline expenditure over the 2018 Budget, and some programmes might have to be cut to meet unanticipated spending pressures. It establishes seven expenditure priorities and identifies focus areas that should be addressed in the 2018 Budget.
|
|
|
To support spending in these areas the Mandate Paper proposes to cut programmes that are not aligned to the NDP (“non-core”), or which are not realising their intended outcomes. It suggests that departments can realise savings by reducing spending on consultants; establishing strict limits on contingent liabilities and litigation costs; ensuring that the initiatives of the Office of the Chief Procurement Officer take effect; and improving returns and value for money on state infrastructure projects.
|
||
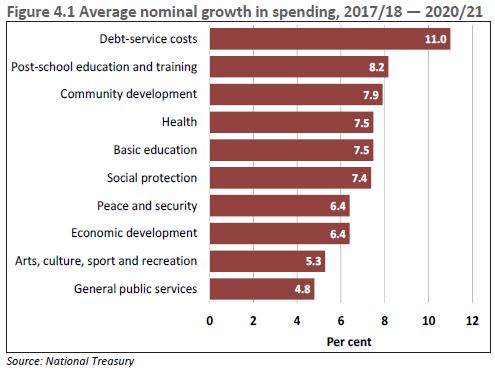 |
||
|
Departmental submissions for the 2018 Budget complement the Mandate Paper priorities with several proposals that require large additional resource commitments. These include significant additional funding for the post-school education and training system, national health insurance (NHI), qualified teachers for Grade R, the implementation of the defence review, land restitution and large infrastructure projects.
|
32
|
CHAPTER 4: EXPENDITURE PRIORITIES
|
|
Mandate Paper priorities for the 2018 Budget
|
||
|
Job creation and small business development
|
−
|
Implement 30 per cent set-asides
|
|
−
|
Localisation
|
|
|
−
|
Integrated community development and community-based workers.
|
|
|
Youth development
|
−
|
Business opportunities for youth including the internet
|
|
−
|
Capacitate youth enterprises, particularly in tourism and hospitality
|
|
|
−
|
Scale up labour-intensive programmes, learnerships and artisan training
|
|
|
Infrastructure spending
|
−
|
Maintain real infrastructure spend
|
|
−
|
Revitalise township industrial parks and technology innovation hubs
|
|
|
−
|
Expand agri-parks programme
|
|
|
−
|
Rural roads, broadband and water infrastructure
|
|
|
−
|
Maintenance, especially at local level.
|
|
|
Land reform and agricultural development
|
−
|
Fast-track restitution settlement and redistribution
|
|
−
|
Implement farmer support
|
|
|
−
|
Transform wildlife economy
|
|
|
−
|
Off-take agreements for small business and cooperatives
|
|
|
Comprehensive social protection, education and skills
|
−
|
Implement national health insurance, and HIV/AIDS and tuberculosis plan
|
|
−
|
Expand early childhood development
|
|
|
−
|
Establish different pathways to work
|
|
|
−
|
Free education for the poor
|
|
|
−
|
Expand student accommodation
|
|
|
Integrated plan to fight crime
|
−
|
Combat violence during protests
|
|
−
|
Integrated criminal justice system and national identification system
|
|
|
−
|
Fight corruption and economic crimes
|
|
|
−
|
Finalise border management
|
|
|
Regional integration and development
|
−
|
Advance the national interest in the Southern African Development Community, throughout Africa, and through participation in BRICS (Brazil, Russia, India, China and South Africa) and the Indian Ocean Rim Association.
|
|
Pressure on the public finances
|
||
|
The public finances face growing strains and risks. Several years of fiscal restraint have left funding gaps in a number of programmes, reflected in the build-up of unpaid accounts and financial imbalances. Without resolute action and planning to cut wasteful and inefficient spending areas, there is a growing danger that the most vulnerable citizens will suffer the effects of fiscal consolidation.
|
||
|
The public-sector wage bill has increasingly crowded out other areas of spending, including complementary inputs that public servants need to do their work. Infrastructure budgets that are poorly designed or not effectively delivered have resulted in high operating deficits, with insufficient allocations for maintenance. Many departments are delaying paying their bills – a trend that contributes to a rising hidden deficit. Provinces entered 2017/18 with R26.4 billion of unpaid bills from the prior year, and a number of municipalities are in financial distress.
|
Public-sector wage bill has increasingly crowded out other areas of spending
|
33
|
2017 MEDIUM TERM BUDGET POLICY STATEMENT
|
|
Determined action needs to balance competing demands and interests
|
This situation requires determined action that balances competing demands and interests. These trade-offs are particularly stark in the current round of public-service wage negotiations. Since 2011, government has been forced to restrict employee headcount growth to accommodate rising salaries. Yet spending on compensation has continued to grow more quickly than nominal GDP. A fair and reasonable compromise between government and state employees in the current round of wage talks is in the public interest.
|
|
|
The MTEF provides for an overall increase of 7.3 per cent a year to accommodate improvements in conditions of service. Many departments are already at risk of exceeding this limit, even assuming that personnel numbers do not increase. Moderation in public-service personnel costs is essential if improvements in service delivery are to be achieved.
|
||
|
Annexure B provides data on public-service employment and compensation trends.
|
||
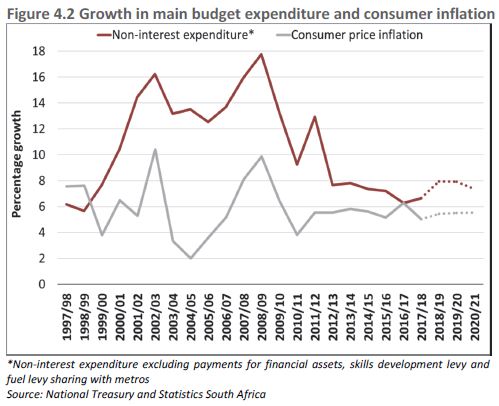 |
||
|
Commission of Inquiry into Higher Education and Training delivered its final report in August 2017
|
A second major cost pressure over the period ahead is higher education. The Commission of Inquiry into Higher Education and Training delivered its final report to the President in August 2017.
|
34
|
CHAPTER 4: EXPENDITURE PRIORITIES
|
|
Higher education funding shortfalls
|
||||
|
In 2016, the National Student Financial Aid Scheme (NSFAS) provided financial assistance to 225 950 university students whose family income was below R122 000 per year. This amounts to about 30 per cent of university undergraduates. In general, NSFAS loans and bursaries are only able to cover a portion of the full cost given the many students requesting aid. Tuition fees account for about 35 per cent of the full cost of study, which includes lodging, food and textbooks.
If NSFAS were to cover the full cost of study for the 30 per cent of undergraduates who currently qualify, the scheme would require about R10.7 billion in the 2018 academic year in addition to the R11.4 billion currently available. Proposals have been made to extend the provision of financial aid to students from middle-income households. Estimates of the number of students falling within this threshold are unreliable. Government is working with universities to verify the data.
The table below shows the additional funding that would be required to cover the full cost of study for various proportions of the undergraduate population. For example, extending funding to 40 per cent of undergraduates would create a shortfall of R17.7 billion in 2018, or R61.7 billion over the next three years.
|
||||
|
Funding shortfalls on full cost of study for university students
|
||||
|
Share of undergraduate students
|
2018
|
2019
|
2020
|
2021
|
|
Shortfall (R million)
|
||||
|
30%
|
10 724
|
12 661
|
14 875
|
17 343
|
|
40%
|
17 691
|
20 432
|
23 550
|
27 035
|
|
50%
|
24 980
|
28 553
|
32 606
|
37 143
|
|
75%
|
40 728
|
46 060
|
52 083
|
58 827
|
|
NSFAS budget
|
11 428
|
12 045
|
12 702
|
13 464
|
|
There is also a large gap in funding for technical and vocational education and training (TVET) colleges. In 2016, NSFAS provided financial assistance to 225 557 TVET college students whose family income is below R122 000 per year – about 70 per cent of full-time equivalent students. Covering the full cost of study for all TVET students, while ensuring that adequate programme funding is available, would require an additional R7.1 billion next year in addition to the R10 billion already allocated, or R23.5 billion over the next three years.
|
||||
|
Cost containment and improved value from procurement
|
||
|
Spending on goods and services by national and provincial departments increased by only 5.6 per cent between 2013/14 and 2016/17. Spending on core service delivery items like medicines, schoolbooks and fuel has continued to grow faster than inflation.
|
|
Table 4.1 Summary of expenditure on cost-containment related items: national and provinces
|
||||
|
Cost-containment related
expenditure items
R million
|
2013/14
Audited outcome
|
2016/17
Preliminary
outcome
|
2013/14 to
2016/17 Change in
value
|
2013/14 to
2016/17 Average
annual growth
|
|
Consultants
|
6 980
|
6 148
|
-832
|
-4.1%
|
|
Travel and subsistence
|
9 828
|
9 305
|
-523
|
-1.8%
|
|
Catering and events
|
908
|
815
|
-93
|
-3.6%
|
|
Entertainment
|
44
|
25
|
-19
|
-17.5%
|
|
Advertising
|
1 246
|
1 094
|
-152
|
-4.2%
|
|
Newspapers and publications
|
270
|
202
|
-68
|
-9.2%
|
|
Conferences (venues and facilities)
|
1 241
|
999
|
-242
|
-7.0%
|
|
Other expenditure (communication)
|
3 227
|
3 243
|
16
|
0.2%
|
|
Total
|
23 744
|
21 831
|
-1 913
|
-2.8%
|
Source: National Treasury
|
Since expenditure ceilings and cost-containment measures were introduced in 2012/13, spending on consultants, travel, lodging, catering, advertising and conferences has fallen sharply. There is now little room for departments to further curb such spending without negatively affecting service delivery.
|
35
|
2017 MEDIUM TERM BUDGET POLICY STATEMENT
|
|
Transversal contracts negotiated by government have begun to yield positive results. Under these agreements, a supplier procures goods and services for more than one department, provided that the contracts are cost-effective. Centralised tendering has resulted in a sharp reduction in antiretroviral drug prices, for example.
|
||
|
█ In-year adjustments to spending
|
||
|
Adjustments Appropriation Bill includes allocations for SAA and the South African Post Office
|
The Adjustments Appropriation Bill allows for revisions to the budget tabled in February, as prescribed in the Public Finance Management Act (PFMA) (1999). Major additions to spending include:
|
|
●
|
Allocations for items that were not included in the February budget, but were announced in the budget speech. This includes R4.8 billion allocated to South African Airways (SAA), R3.7 billion to the South African Post Office and a R117 million transfer to the Tirisano Construction Fund Trust, which promotes development projects and black participation in the construction sector.
|
||
|
●
|
R5.2 billion to defray expenditure authorised by the Minister of Finance in terms of section 16 of the PFMA to forestall a call on government-guaranteed debt by an SAA creditor.
|
||
|
●
|
R1.5 billion in self-financing expenditure, the bulk of which is for the Department of Home Affairs passport programme.
|
||
|
●
|
R586 million of expenditure deemed unavoidable, but which was “unforeseeable” when the 2017 Budget was tabled. Of this amount R500 million was allocated to the Department of Water and Sanitation to implement the Butterworth emergency water supply scheme and to upgrade the capacity of the Thukela Goedertrouw transfer scheme.
|
|
Proposals to reduce appropriations to national departments in anticipation of underspending
|
The adjustments budget also proposes to reduce appropriations to national departments by R1.67 billion in anticipation of underspending. In these cases, expenditure trends indicate that the resources will not be used by the end of the year.
|
|
|
Details of all the revised national spending allocations are set out in the 2017 Adjusted Estimates of National Expenditure. Changes to conditional grants are included in the 2017 Division of Revenue Amendment Bill. Revised provincial appropriations will be tabled in provincial legislatures before the end of the current financial year.
|
||
|
█ Medium-term spending priorities
|
||
|
Spending on services to low-income households remains a priority
|
Government spending priorities continue to align with the NDP, as elaborated in the medium-term strategic framework and the Mandate Paper. Despite limited fiscal resources, government is protecting expenditure that aims to deliver services to low-income households.
|
36
|
CHAPTER 4: EXPENDITURE PRIORITIES
|
|
Table 4.2 Consolidated expenditure by function1
|
||||||
|
2016/17
|
2017/18
|
2018/19
|
2019/20
|
2020/21
|
Average
|
|
|
Outcome
|
Revised
|
Medium-term estimates
|
annual
|
|||
|
growth
|
||||||
|
2017/18 –
|
||||||
|
R billion
|
2020/21
|
|||||
|
Learning and culture
|
295.3
|
317.8
|
340.7
|
367.3
|
395.7
|
7.6%
|
|
Basic education
|
216.9
|
230.8
|
249.8
|
267.2
|
286.5
|
7.5%
|
|
Post-school education and training
|
68.7
|
76.7
|
80.1
|
88.8
|
97.0
|
8.2%
|
|
Arts, sport, recreation and culture
|
9.7
|
10.4
|
10.8
|
11.3
|
12.1
|
5.3%
|
|
Health
|
176.1
|
189.6
|
204.5
|
220.0
|
235.5
|
7.5%
|
|
Peace and security
|
184.8
|
195.5
|
206.2
|
220.7
|
235.5
|
6.4%
|
|
Defence and state security
|
47.9
|
49.8
|
51.4
|
54.7
|
58.2
|
5.3%
|
|
Police services
|
86.9
|
93.7
|
100.0
|
106.8
|
114.2
|
6.8%
|
|
Law courts and prisons
|
41.3
|
43.6
|
46.5
|
49.7
|
53.1
|
6.7%
|
|
Home affairs
|
8.7
|
8.4
|
8.3
|
9.5
|
10.0
|
6.1%
|
|
Community development
|
181.4
|
193.5
|
210.1
|
226.5
|
243.1
|
7.9%
|
|
Economic development
|
175.9
|
190.9
|
202.2
|
217.7
|
229.9
|
6.4%
|
|
Industrialisation and exports
|
32.3
|
33.2
|
36.0
|
38.9
|
41.2
|
7.5%
|
|
Agriculture and rural development
|
25.9
|
26.5
|
28.1
|
30.1
|
31.8
|
6.3%
|
|
Job creation and labour affairs
|
17.9
|
20.0
|
21.3
|
22.5
|
23.9
|
6.1%
|
|
Economic infrastructure and network regulations
|
83.3
|
93.7
|
98.7
|
107.1
|
112.6
|
6.3%
|
|
Innovation, science and technology
|
16.6
|
17.5
|
18.1
|
19.2
|
20.4
|
5.2%
|
|
General public services
|
60.4
|
62.3
|
64.7
|
67.5
|
71.6
|
4.8%
|
|
Executive and legislative organs
|
13.1
|
14.8
|
16.2
|
16.9
|
17.7
|
6.1%
|
|
Public administration and fiscal affairs
|
39.5
|
40.1
|
40.7
|
43.0
|
45.9
|
4.6%
|
|
External affairs
|
7.8
|
7.4
|
7.8
|
7.6
|
8.1
|
3.1%
|
|
Social development
|
218.2
|
234.2
|
251.2
|
269.0
|
286.9
|
7.0%
|
|
Social protection
|
165.1
|
178.7
|
192.8
|
207.3
|
221.7
|
7.5%
|
|
Social security funds
|
53.1
|
55.5
|
58.4
|
61.7
|
65.2
|
5.5%
|
|
Payments for financial assets
|
7.2
|
19.5
|
5.0
|
5.2
|
5.5
|
–
|
|
Allocated by function
|
1 299.2
|
1 403.3
|
1 484.5
|
1 594.0
|
1 703.8
|
6.7%
|
|
Debt-service costs
|
146.5
|
163.3
|
183.1
|
203.3
|
223.4
|
11.0%
|
|
Contingency reserve
|
–
|
–
|
3.0
|
5.0
|
8.0
|
–
|
|
Consolidated expenditure
|
1 445.7
|
1 566.6
|
1 670.6
|
1 802.3
|
1 935.1
|
7.3%
|
1. Consisting of national and provincial departments, social security funds and public entities
Source: National Treasury
|
Health and social development
|
||
|
The NDP envisages a strong public health system that works for everyone, and a sharp reduction in the disease burden. Government also aims to provide a social safety net for all South Africans, particularly the young, elderly and disabled. Spending priorities include rolling out NHI, expanding provision of antiretroviral treatment, continuing early childhood development and building an integrated community health worker programme.
|
||
|
The National Treasury and the Department of Health are working on proposals to expand NHI services in a progressive and affordable manner. Legislation is being drafted to establish the legal framework for an NHI Fund. Government is considering options to establish an interim fund structure to support a limited set of priority interventions, and operate in line with current legislation.
|
Government intends to expand NHI services in a progressive and affordable manner
|
37
|
2017 MEDIUM TERM BUDGET POLICY STATEMENT
|
|
Provision for additional support to antiretroviral treatment programme and early childhood education
|
Government’s antiretroviral treatment programme has been growing by about 400 000 patients each year. The MTEF makes provision for the growth in patient numbers expected with the implementation of the universal test-and-treat policy.
The early childhood development conditional grant will receive allocations of about R500 million per year over the medium term to improve health and learning outcomes. Government also proposes to shift the current home-based care programme in the comprehensive HIV, AIDS and TB grant to a more integrated community health worker programme. This will include health-related early childhood development services such as breastfeeding support for the first 1 000 days of a child’s life.
Government’s centralised approach to dispensing and distributing chronic medicines allows patients to collect their medication from alternative pick-up points such as private pharmacies. By June 2017, over 1.5 million patients were on the programme, which is more convenient for patients and reduces unnecessary consultations.
Learning and culture
Improving the quality of education and building skills are core objectives of the NDP. The Mandate Paper proposes strengthening support for skills development. Over the medium term, the budget supports increased university access by students from poor households, and the expansion of technical and vocational education and training.
|
|
|
Early childhood development to reach universal enrolment by 2019
|
About 95 per cent of six-year-olds are enrolled in Grade R, which forms part of early childhood development. Universal enrolment is expected by 2019. Over the three-year spending period ahead, the focus is to improve the quality of education by strengthening educator qualifications, and providing appropriate learner and teacher support materials.
The Department of Basic Education is working on a proposal to introduce a technical occupational stream in secondary schools. It would operate alongside the existing technical vocational and academic streams. The “three streams” model aims to provide additional pathways to work and complement existing training programmes. Findings from pilot sites will be used to refine the model.
The NSFAS was allocated over R40 billion from 2017/18 to 2019/20 to enable more than 450 000 students from poor households to access public universities and TVET colleges.
Government proposes to allocate R11.1 billion over the medium term for infrastructure projects at higher education institutions. Expanding student accommodation is a priority, and the Department of Higher Education and Training is refining a proposal to provide 300 000 new beds at public universities and TVET colleges by 2026.
|
|
|
Revenue from skills development levy to produce over 69 000 qualified artisans
|
Over the MTEF period, R51 billion in revenue from the skills development levy will support programmes expected to produce over 69 000 qualified artisans, and create 405 000 work-based learning opportunities through learnerships, internships and apprenticeships.
|
|
38
|
CHAPTER 4: EXPENDITURE PRIORITIES
|
|
Table 4.3 Consolidated expenditure by economic classification1
|
||||||
|
2016/17
|
2017/18
|
2018/19
|
2019/20
|
2020/21
|
Average
|
|
|
Outcome
|
Revised
|
Medium-term estimates
|
annual
|
|||
|
growth
|
||||||
|
2017/18 –
|
||||||
|
R billion
|
2020/21
|
|||||
|
Current payments
|
872.0
|
939.6
|
1 014.4
|
1 097.9
|
1 180.8
|
7.9%
|
|
Compensation of employees
|
510.3
|
549.3
|
587.9
|
629.9
|
677.8
|
7.3%
|
|
Goods and services
|
208.1
|
220.0
|
236.4
|
255.8
|
270.2
|
7.1%
|
|
Interest and rent on land
|
153.6
|
170.4
|
190.0
|
212.2
|
232.7
|
11.0%
|
|
of which: debt-service costs
|
146.5
|
163.3
|
183.1
|
203.3
|
223.4
|
11.0%
|
|
Transfers and subsidies
|
472.9
|
505.1
|
543.1
|
584.8
|
627.1
|
7.5%
|
|
Provinces and municipalities
|
112.5
|
120.7
|
131.9
|
143.3
|
155.9
|
8.9%
|
|
Departmental agencies and accounts
|
25.2
|
24.9
|
26.2
|
27.7
|
30.9
|
7.5%
|
|
Higher education institutions
|
30.9
|
38.1
|
38.9
|
41.0
|
43.2
|
4.3%
|
|
Foreign governments and international organisations
|
2.2
|
2.0
|
2.1
|
2.2
|
2.3
|
5.4%
|
|
Public corporations and private enterprises
|
32.8
|
31.4
|
33.7
|
36.2
|
38.1
|
6.8%
|
|
Non-profit institutions
|
29.6
|
31.9
|
34.0
|
36.2
|
38.4
|
6.4%
|
|
Households
|
239.8
|
256.2
|
276.3
|
298.2
|
318.2
|
7.5%
|
|
Payments for capital assets
|
93.6
|
102.4
|
105.1
|
109.3
|
113.8
|
3.6%
|
|
Buildings and other capital assets
|
72.8
|
79.5
|
83.1
|
86.7
|
90.0
|
4.2%
|
|
Machinery and equipment
|
20.8
|
22.9
|
22.1
|
22.6
|
23.8
|
1.3%
|
|
Payments for financial assets
|
7.2
|
19.5
|
5.0
|
5.2
|
5.5
|
–
|
|
Total
|
1 445.7
|
1 566.6
|
1 667.6
|
1 797.3
|
1 927.1
|
7.1%
|
|
Contingency reserve
|
–
|
–
|
3.0
|
5.0
|
8.0
|
–
|
|
Consolidated expenditure
|
1 445.7
|
1 566.6
|
1 670.6
|
1 802.3
|
1 935.1
|
7.3%
|
1. Consisting of national and provincial departments, social security funds and public entities
Source: National Treasury
|
Protection services
|
||
|
The NDP underlines the need for an effective criminal justice system and responsive police services. The budget will continue to fund the normal operations of the departments within the justice, crime prevention and security cluster, giving effect to a priority of the Mandate Paper – the integrated operational plan to fight crime. However, this cluster needs to manage pressures arising from employee compensation budgets. This will require reconsideration of recruitment strategies, as well as the composition and suitability of existing staff complements.
Medium-term priorities include completing infrastructure projects under way, and maintaining and rehabilitating police stations, courts, correctional facilities, and military bases and health facilities. The new Mpumalanga High Court will open in 2018. Funding options for the Defence Review’s recommendations are also under consideration (see Annexure A).
Once established, the Border Management Agency will take over management of South Africa’s 72 air, land and sea ports of entry. The agency will be funded mainly through reallocations from those departments and agencies currently involved in border control and management.
|
Pressures arising from employee compensation in justice, crime prevention and security need to be managed
|
|
39
|
2017 MEDIUM TERM BUDGET POLICY STATEMENT
|
|
Community development
Social and economic transformation requires South Africa to overcome the spatial legacy of apartheid. Integrated community development requires strengthened cooperation between national government, provinces and municipalities in housing, water, sanitation, electrification and public transport. Over the medium term, the focus remains on balancing resources to respond to water, sanitation and electrification infrastructure needs in rural areas, and improving public transport services and access to shelter in urban areas.
|
||
|
Public transport in smaller cities will have greater differentiation to ensure sustainability
|
Creating integrated public transport networks that expand access to economic activity and social services is a central objective of urban reform initiatives. To ensure that municipal public transport systems are sustainable, government aims to provide greater differentiation in the norms and standards of services and infrastructure. This includes moderating public transport service levels in smaller cities to ensure quality services that are affordable.
New conditional grants proposed for human settlements are discussed under the division of revenue. In addition, a new policy framework is being developed by the Department of Human Settlements.
Economic development
|
|
|
Spending focused on jobs, small businesses, small-scale agricultural production and industrial incentives
|
Growing and transforming the economy to create jobs and generate the resources needed to fund social services is at the heart of the NDP. Spending in this function will focus on expanding access to jobs, supporting small businesses and small-scale agricultural production, along with incentives for industrialisation, economic transformation and sustainable resource management.
The Community Work Programme maintains and improves local infrastructure using labour-intensive methods, providing income support to unemployed persons. It provides a bridging opportunity for youth and others who are actively looking for work. The work done by programme participants benefits their communities. Similarly, the social sector component of the Expanded Public Works Programme subsidises the pay of extra workers at non-profit organisations that are performing social functions.
|
|
|
Initial allocation of R1 billion for new fund to support small business and innovation
|
The National Treasury is working with the departments of Science and Technology and Small Business Development to establish a new fund for small business and innovation. The fund, which will be allocated R1 billion in 2019/20, will provide wholesale funding to private- and public-sector incubators, which will on-lend to entrepreneurs at the concept stage.
The Department of Science and Technology, with an allocation of R24.8 billion over the medium term, will invest in producing new knowledge, developing human capital, and for research and innovation.
Successful land reform programmes link new farmers into agricultural value chains. Agri-parks are central locations where smallholder farmers can process their produce and access market networks. Funding for agri-parks is provided through the Department of Rural Development and Land Reform. Three agri-parks are nearing completion, and government intends to build one such facility in each of the 44 district municipalities.
|
|
40
|
CHAPTER 4: EXPENDITURE PRIORITIES
|
|
South Africa is a water-scarce country. Managing limited water resources is critical, as shown by the recent drought and the current water crisis in Cape Town. The Department of Water and Sanitation is expected to complete the water-pricing strategy in 2018/19. It will establish a new framework for how water is charged and subsidised for industrial, commercial, agricultural and domestic use. The institutional review for water resources, which includes establishing a national water infrastructure agency and catchment management agencies, is expected to be completed over the medium term.
Administrative services
|
New pricing strategy to be completed in line with urgent need to improve water resource management
|
|
|
The administrative services function comprises central planning and financial services, international relations and other general services. Government aims to build a people-centred, professional and ethical public service. Given fiscal pressures and needs in other areas, general public services will see a real decline in budgets over the medium term.
Regional integration and development are important for economic and social progress in southern Africa. South Africa is currently chairing the Southern African Development Community, and is set to chair the Indian Ocean Rim Association for the next two years. The Mandate Paper identifies these responsibilities as priorities. The Department of International Relations and Cooperation will fund the associated costs from its current baseline through reprioritisation.
|
Given pressing needs in other areas, administrative services budgets will decline over medium term
|
|
|
█ Division of revenue
|
||
|
The proposed division of revenue continues to prioritise funding of services for poor communities. Allocations to provinces focus on education, health and other social services. Allocations to local government subsidise the delivery of free basic services to low-income households, and the infrastructure needed to deliver those services.
|
|
Table 4.4 Division of revenue framework
|
|||||||
|
2014/15
|
2015/16
|
2016/17
|
2017/18
|
2018/19
|
2019/20
|
2020/21
|
|
|
R billion
|
Outcome
|
Revised
|
Medium-term estimates
|
||||
|
Division of available funds
|
|||||||
|
National departments
|
490.0
|
546.1
|
555.7
|
603.5
|
633.1
|
683.5
|
729.2
|
|
Provinces
|
439.5
|
471.4
|
500.4
|
538.2
|
575.8
|
617.8
|
663.9
|
|
Equitable share
|
359.9
|
386.5
|
410.7
|
441.3
|
471.7
|
506.6
|
543.7
|
|
Conditional grants
|
79.6
|
84.9
|
89.7
|
96.9
|
104.1
|
111.2
|
120.1
|
|
Local government
|
87.6
|
98.3
|
102.9
|
112.6
|
121.6
|
132.4
|
143.0
|
|
Equitable share
|
41.6
|
49.4
|
50.7
|
57.0
|
62.7
|
69.0
|
75.7
|
|
General fuel levy sharing with metropolitan municipalities
|
10.2
|
10.7
|
11.2
|
11.8
|
12.5
|
13.2
|
14.0
|
|
Conditional grants
|
35.8
|
38.3
|
40.9
|
43.8
|
46.4
|
50.3
|
53.3
|
|
Total
|
1 017.1
|
1 115.8
|
1 159.0
|
1 254.3
|
1 330.5
|
1 433.7
|
1 536.1
|
|
Percentage shares
|
|||||||
|
National departments
|
48.2%
|
48.9%
|
48.0%
|
48.1%
|
47.6%
|
47.7%
|
47.5%
|
|
Provinces
|
43.2%
|
42.2%
|
43.2%
|
42.9%
|
43.3%
|
43.1%
|
43.2%
|
|
Local government
|
8.6%
|
8.8%
|
8.9%
|
9.0%
|
9.1%
|
9.2%
|
9.3%
|
Source: National Treasury
41
|
2017 MEDIUM TERM BUDGET POLICY STATEMENT
|
|
Provincial allocations grow by 7.2 per cent and local government allocations by 8.3 per cent
|
Over the medium term, government proposes to allocate national departments 47.6 per cent of available non-interest expenditure, provinces 43.2 per cent and local governments 9.2 per cent. Over this period, national government resources grow by 6.5 per cent, provincial resources by 7.2 per cent and local government resources by 8.3 per cent.
|
|
|
Table 4.5 Changes to division of revenue1
|
|||||
|
2017/18
|
2018/19
|
2019/20
|
|||
|
R billion
|
Revised
|
Medium-term
estimates
|
|||
|
Changes to baseline
|
|||||
|
National allocations
of which:
|
13.3
|
2.9
|
15.2
|
||
|
Indirect grants to provinces 2
|
-0.4
|
2.8
|
3.0
|
||
|
Indirect grants to local government
|
0.5
|
–
|
–
|
||
|
Provincial allocations
|
0.0
|
-2.8
|
-2.6
|
||
|
Equitable share
|
–
|
0.2
|
0.5
|
||
|
Conditional grants
|
0.0
|
-3.0
|
-3.1
|
||
|
Local government allocations
|
0.1
|
0.1
|
1.9
|
||
|
Total
|
13.4
|
0.2
|
14.6
|
||
|
1. Additions include the confirmation of provisional allocations in the 2017 Budget, announced but not previously included in baselines
|
|||||
|
2. Amounts may be shifted between direct and indirect grants to provinces and local government before the 2018 Budget is tabled
Source: National Treasury
|
|||||
|
Provincial allocations
Nearly 80 per cent of provincial budgets are spent on health, basic education and social welfare.
The provincial equitable share formula has been under review since 2016 to ensure that it remains impartial, fair and responsive to the needs of the provinces. As part of the review, data used for learner enrolment, previously based on annual surveys of schools, will now be collected through a tracking system established by the Department of Basic Education. The new system allows data to be verified and learners’ progress to be tracked throughout their school careers. The more advanced system results in small changes to allocations as previous over-reporting by schools is corrected. The new data will be phased in over three years. Changes to other components of the formula flowing from the review will be introduced in consultation with provincial treasuries.
|
||
|
Programmes to prevent violence against women and children get R788.2 million
|
The equitable share has been increased by about R1.2 billion over the MTEF period to take account of provincial responsibilities aimed at preventing violence against women and children, and to support organisations that provide statutory social welfare services on behalf of provincial departments. The latter flows from the judgement of the Free State High Court in the National Association of Welfare Organisations and Non-Governmental Organisations case. The court found that government must determine a fair and transparent method of funding non-profit organisations that provide statutory social welfare services on behalf of the state. Research is being done to quantify the gap between current funding and the actual cost of service provision.
|
42
|
CHAPTER 4: EXPENDITURE PRIORITIES
|
|
Table 4.6 Provincial equitable share
|
||||||
|
2017/18
|
2018/19
|
2019/20
|
2020/21
|
|||
|
R million
|
||||||
|
Eastern Cape
|
61 848
|
65 700
|
70 026
|
74 590
|
||
|
Free State
|
24 522
|
26 258
|
28 159
|
30 180
|
||
|
Gauteng
|
86 643
|
93 670
|
101 240
|
109 354
|
||
|
KwaZulu-Natal
|
93 757
|
99 567
|
106 697
|
114 271
|
||
|
Limpopo
|
51 960
|
55 347
|
59 373
|
63 656
|
||
|
Mpumalanga
|
36 082
|
38 585
|
41 524
|
44 662
|
||
|
Northern Cape
|
11 720
|
12 513
|
13 446
|
14 439
|
||
|
North West
|
30 330
|
32 491
|
34 898
|
37 462
|
||
|
Western Cape
|
44 470
|
47 592
|
51 240
|
55 135
|
||
|
Total
|
441 331
|
471 724
|
506 604
|
543 749
|
||
|
Source: National Treasury
|
||||||
|
Changes to provincial conditional grants
|
||
|
Government proposes several changes to health conditional grants over the MTEF period.
|
Changes to grants support community health workers and healthcare facility maintenance
|
|
●
|
A component will be introduced in the comprehensive HIV, AIDS and TB grant to standardise the Community Health Worker Programme.
|
||
|
●
|
A portion of the direct health facility revitalisation grant and the infrastructure component of the indirect national health insurance grant will be ring-fenced for maintenance.
|
||
|
●
|
Proposed additions of R22.4 million to the national tertiary services grant will extend the diagnosis-related groups project across the Western Cape and build capacity for other provinces to implement this initiative. The diagnosis-related group approach is a patient classification system used globally for payment of hospital services.
|
|
Spending on the indirect school infrastructure backlogs grant has been poor for a number of years and was scheduled to come to an end in 2017/18. However, the Department of Basic Education needs to complete projects that are under way. Government now proposes that R7.3 billion that had been shifted to the provincially-administered education infrastructure grant, but had not been allocated to specific projects, be returned to the department’s school infrastructure backlogs grant over the 2018 MTEF period. Within the direct education infrastructure grant, the remaining R1.5 billion shifted from the school infrastructure backlogs grant in the 2017 MTEF will be ring-fenced to maintain existing school infrastructure.
|
Shifts to ensure completion of school infrastructure projects and adequate maintenance
|
|
|
A full review of the human settlements development grant will be conducted based on the outcomes of the human settlements policy review. For the 2018 Budget, two new human settlements grants are proposed, both to be funded through reprioritisations from the human settlements development grant:
|
New grants to clear backlog of title deeds for homes built with state subsidies
|
|
●
|
Funds previously ring-fenced to clear the backlog of title deeds that have not yet been issued for homes built with state subsidies will now be allocated in a dedicated grant for a three-year period. The grant will have both direct and indirect components, with a small portion reprioritised for capacity in the national department.
|
43
|
2017 MEDIUM TERM BUDGET POLICY STATEMENT
|
|
●
|
A grant will be established to fund responses to emergencies in line with housing policy. The funds will be held by the Department of Human Settlements and transferred to provinces or municipalities following an emergency.
|
||
|
Funds to maintain coal haulage roads in Mpumalanga will be ring-fenced in the provincial roads maintenance grant for another two years.
|
|||
|
Encouraging transformation through procurement in provinces
Provinces will procure more than R600 billion in goods and services over the next three years. In line with the Preferential Procurement Policy Framework Act (2000), these purchases can promote transformation while ensuring value for money.
Several provinces are targeting increased procurement from disadvantaged areas. Gauteng has increased the number of registered township suppliers from 1 072 in 2014 to 8 268 in 2017. North West is focusing on procuring from townships, small towns and villages. By the end of 2016/17, the province had sourced goods and services from 6 659 suppliers, of which 3 263 (49 per cent) came from these targeted areas.
Mpumalanga has procured agricultural products, including for the School Nutrition Programme, to support black-owned businesses and small farmers. Several provinces have an integrated contractor development programme to promote construction-sector transformation. In the Western Cape, 51 per cent of the 5 500 suppliers the provincial government has done business with are small businesses, and about 2 221 are entirely black owned.
|
|
Local government allocations
The local government equitable share is the largest transfer to municipalities. Although funding is unconditional, it is calculated to subsidise the cost of delivering free basic services to poor households and to cover basic administrative costs in poorer municipalities. The confirmation of an additional R1.5 billion in 2019/20 that was part of a provisional allocation in the 2017 Budget means that the formula is fully funded to take account of rising bulk costs of electricity and water, as well as household growth.
|
||
|
New funding mechanisms for intermediate cities will be piloted in 2018/19
|
In line with government’s integrated urban development framework, a new approach to funding intermediate cities will be piloted as part of the municipal infrastructure grant in 2018/19. It will emphasise a programme of capital investment that combines grant and non-grant funding. This approach may take the form of a separate grant for qualifying cities over the medium term, with strong performance incentives.
The allocation mechanism of the public transport network grant, which funds the improvement of urban public transport systems, will be amended. The changes will provide more stability in allocations for smaller cities. Performance incentives will be introduced and stricter conditions applied. Where cities fail to demonstrate that they have financially sustainable plans for public transport networks, allocations will be cut. Performance incentives will also be considered for other conditional grants, including for improved spending on infrastructure maintenance.
|
|
|
Spending on informal settlement upgrading in cities to be reviewed
|
The National Treasury and the Department of Human Settlements will review spending on urban informal settlement upgrading, with a view to changing the grant system to enable increased investment in on-site upgrading. This work will be aligned to the review of the provincial human settlements development grant.
|
44
|
CHAPTER 4: EXPENDITURE PRIORITIES
|
|
Reforms over the medium term will enhance the ability of municipalities to raise revenue to invest in their own development. Government will:
|
|
●
|
Table amendments to the Municipal Fiscal Powers and Functions Act (2007) to better regulate municipal development charges, through which landowners pay for the cost of connecting new developments to public infrastructure and services.
|
||
|
●
|
Update the policy framework for municipal borrowing and financial emergencies. This will clarify the role of development finance institutions in enabling municipalities to obtain private-sector financing for infrastructure investment.
|
|
Municipal revenue-raising capacities vary widely. The National Treasury will consider applications to waive co-funding requirements for infrastructure projects in municipalities with little or no ability to raise finance for such projects. Reprioritisations within the regional bulk infrastructure grant, water services infrastructure grant and municipal infrastructure grant will be made to fund the Bucket Eradication Programme.
|
Reforms aim to enhance municipalities’ ability to raise more revenue for development
|
|
Financial management challenges in municipalities
Like the rest of government, municipalities face a difficult fiscal environment. Even as demand for services rises, weak economic growth has put stress on consumers’ ability to pay for services, while transfers from national government are growing more slowly than in the past.
Some municipalities have managed these challenges well, but others have fallen into financial distress and face liquidity problems. These include municipalities that are unable to meet their payment obligations to Eskom, water boards and other creditors. These municipalities need to rectify governance and management problems, focus on collecting revenues owed to them, and eliminate wasteful and non-core spending.
The National Treasury is working with other departments to develop a funding mechanism to support recovery plans for municipalities that face a financial crisis, as provided for in section 139(5) of the Constitution.
|
45
|
2017 MEDIUM TERM BUDGET POLICY STATEMENT
|
This page was left blank intentionally.
46
ANNEXURES
47
|
2017 MEDIUM TERM BUDGET POLICY STATEMENT
|
48
A
Fiscal risk statement
█ Introduction
The 2016 Medium Term Budget Policy Statement identified South Africa’s most significant fiscal risks as lower-than-expected economic growth, the possibility of claims against the guaranteed debt of some state-owned companies and higher-than-expected increases in compensation budgets.
The first two risks have materialised.
The current outlook is characterised by a deteriorating macroeconomic position over the medium term, severe revenue underperformance, expenditure pressures, and contingent liability risks that are beginning to crystallise. Sources of uncertainty include decisions on the scope of funding for higher education and the outcome of public-service wage negotiations.
Government’s approach to reporting risks to the fiscal outlook is summarised in Figure A.1.
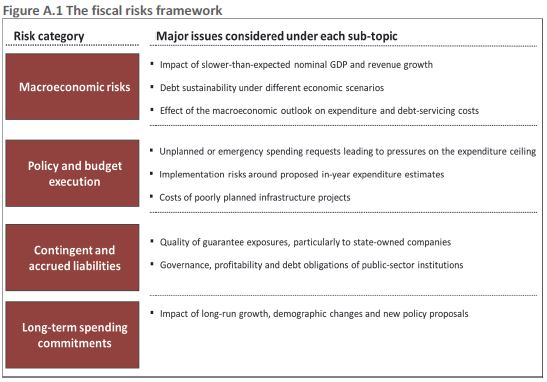
49
|
2017 MEDIUM TERM BUDGET POLICY STATEMENT
|
█ Macroeconomic risks
As noted in Chapter 3, the most serious risk to medium-term revenue collection is a further deterioration in the economic outlook. A related risk is uncertainty about tax buoyancy – the ratio of revenue growth and economic growth – which can be affected by the composition of GDP, taxpayer compliance and tax administration. Excluding next year’s proposed tax increase of R15 billion, the current baseline assumes a buoyancy of 1.1 in 2018/19. However, if buoyancy were to decline to 1.0, the tax shortfall would increase by R8.5 billion.
To assess the magnitude of macroeconomic and fiscal risks, the National Treasury developed three scenarios around the baseline economic forecast. The baseline fiscal outlook is presented in Chapter 3.
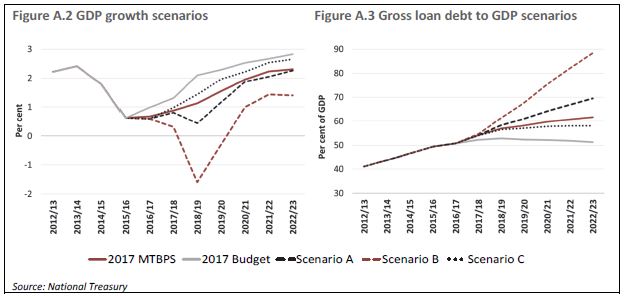
Scenario A – Local currency downgrade with limited effects. The local currency rating is downgraded due to the weak growth trajectory and widening fiscal deficits. Growth slows to 0.6 per cent in 2018 and 0.9 per cent in 2019. However, the impact on capital flows and interest rates is limited by stronger world growth and increased global risk appetite. The yield on long-term government bonds is 90 basis points higher on average compared to the baseline. Inflation expectations remain well anchored.
Scenario B – Local currency downgrade with pronounced effects. The local currency rating is downgraded without the offsetting benefits of strong global growth. GDP contracts by 1.2 per cent in 2018 and 0.8 per cent in 2019. The risk premium increases by 200 basis points and remains at that level. The yield on long-term government bonds is 180 basis points higher on average compared to the baseline. Borrowing costs increase, while investment and consumption decline. Inflation peaks at 6.6 per cent in 2018.
Scenario C – Higher global growth and commodity prices. Global growth improves by an annual average of 0.5 percentage points over the medium term. Export commodity prices increase by 5 per cent over the same period. The risk premium is 50 basis points lower than in the baseline scenario, reflecting lower global risk aversion. GDP growth increases to 1.4 per cent in 2018. By 2020, GDP growth is 2.4 per cent, as higher incomes promote stronger consumption and investment demand. Inflation remains well anchored in the 3-6 per cent target band and the rand is slightly stronger compared to the baseline. Bond yields are 30 basis points lower on average compared to the baseline.
The scenarios assume that no new revenue or expenditure measures are taken to compensate for fiscal slippage. The fiscal results of the scenarios are as follows:
| • |
Scenario A would result in the primary deficit widening to 2.0 per cent of GDP by 2020/21. The cumulative tax revenue shortfall against the 2017 MTBPS baseline would be between R130 billion and R140 billion owing to the effect of lower buoyancies and weaker nominal GDP growth. As a result, the debt-to-GDP ratio would not stabilise.
|
50
|
ANNEXURE A: FISCAL RISK STATEMENT
|
| • |
Scenario B would result in an even larger fiscal slippage. The cumulative tax revenue shortfall over the 2018 medium-term expenditure framework (MTEF) period would be between R400 billion and R450 billion. The primary deficit would widen to 4.9 per cent over the medium term and remain above 4 per cent over the longer term. Debt would grow rapidly, reaching over 80 per cent of GDP by 2022/23.
|
| • |
Scenario C also results in a primary deficit over the medium term. However, the primary balance would close and go into surplus over the long term. Higher GDP growth would lead to improved tax revenue collection over the next three years. As a result, debt would stabilise at 58.0 per cent of GDP in 2021/22.
|
The fiscal scenarios assume that South Africa would be able to increase borrowing from capital markets at affordable rates. However, in the event of a much worse fiscal position, accompanied by further credit ratings downgrades, it is likely that bond yields would rise and the exchange rate would depreciate. Both developments would increase debt and debt-service costs. Given the persistence of the current account and budget deficits, sharply higher bond yields and currency depreciation could prompt significant turmoil in domestic capital markets, reinforcing a cycle of fiscal deterioration.
Macroeconomic risks and debt management
Over the next decade, redemptions of domestic and foreign debt are projected to increase, as shown in Figure A.4.
The main macroeconomic variables that affect government’s ability to service its debt are economic growth, inflation, exchange rates and interest rates. A significant proportion of debt is linked to inflation. A sudden spike in inflation would increase both the debt stock and debt-service costs. An exchange rate depreciation would also raise debt-service costs and lead to an upward revaluation of debt stock.
Interest rates are affected by domestic and global events. Domestic factors mainly relate to perceptions of macroeconomic and fiscal policies. If there is widespread belief that the public finances are unsustainable or vulnerable to a shock, the risk premium on debt could rise, increasing interest rates and debt-service costs. Global events that could lead to higher interest rates include tightening financial conditions and major geopolitical risks.
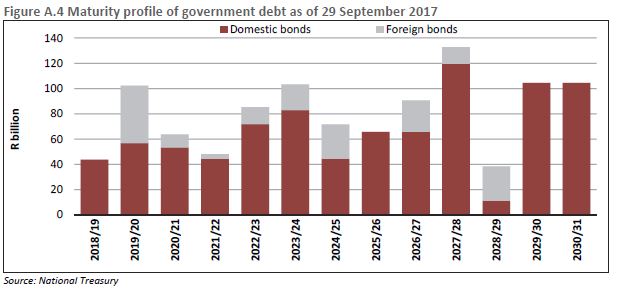
51
|
2017 MEDIUM TERM BUDGET POLICY STATEMENT
|
Over the medium term, government’s bond-switch programme – which exchanges short-term for longer-term debt – and growing cash balances will mitigate this risk. However, the bond-switch programme itself poses a risk if it raises the effective interest rate paid by government on debt, potentially leading to higher debt-service costs.
South Africa’s sovereign debt stock is well-structured and remains comfortably within global best-practice benchmarks. Global investors hold about 41 per cent of total outstanding debt securities (including foreign-denominated issuances), indicating a potential exposure to capital flight. The depth of the domestic market reduces the likelihood of a liquidity crisis. The short-term rollover risk emanating from the Treasury bill portfolio is monitored through a benchmark limit of 15 per cent of domestic debt. Currently, Treasury bills are below this limit.
█ Medium-term policy and budget execution risks
Policy risks include unplanned spending requirements that cannot be accommodated within the expenditure ceiling. Budget execution risks emerge when departments or entities exceed their spending ceilings. At the aggregate level, budget execution has been good. Spending outcomes in 2016/17 remained within the expenditure ceiling. The main medium-term expenditure risks are the public-service wage bill and additional funding needs for higher education. Demands for additional financial support to state-owned companies, which are likely over the medium term, are discussed later in this chapter.
Over the three-year spending period ahead, the contingency reserve amounts to R16 billion, which is considerably smaller than it has been in previous budgeting cycles. This diminishes government’s capacity to respond to spending risks.
Departments have proposed a range of policy interventions that are currently not funded. These include significant additional funding for the post-school education and training system, national health insurance (NHI), qualified teachers for Grade R, the implementation of the Defence Review, land restitution and large infrastructure projects.
The most pressing is higher education, where government is considering options to increase affordability for students. The additional funding required for the post-school and education sector is difficult to determine without firm policy guidelines. However initial costing of the options suggests that the funding requirement could range from R17.7 billion to R40.7 billion in 2018/19. Medium-term options are discussed in detail in Chapter 4, and the long-term costs of higher education are discussed later in this annexure.
The primary budget execution risks stem from:
| • |
Departmental spending limits on compensation of employees. Assuming stable personnel numbers and salary increases pegged to Consumer Price Index (CPI) inflation, National Treasury expenditure estimates for national departments exceed next year’s budgeted compensation ceilings. The departments of Defence and International Relations and Cooperation will need to take strong remedial measures to avoid exceeding their compensation ceilings. Such action can take the form of shifting resources from other budget lines into compensation, limiting recruitment of new personnel or finding other means to reduce headcounts. Many other national and provincial departments – provincial health in particular – are facing similar pressures.
|
| • |
Public-service wage negotiations. The shortfall in compensation budgets will deteriorate substantially if the public-service wage talks leads to an agreement that exceeds CPI inflation. For example, a CPI + 1 agreement would raise the national shortfall in 2018/19 to R8.2 billion, with the gap in provincial compensation budgets amounting to R4 billion. At this level, a three-year agreement would push the national shortfall to R11.8 billion by 2020/21, and provincial compensation spending would need to increase by R12.7 billion.
|
52
|
ANNEXURE A: FISCAL RISK STATEMENT
|
| • |
Unpaid provincial invoices. Many provincial departments are delaying payment of bills, contributing to a rising hidden deficit that poses significant budget execution risks. Provinces started the current financial year with unpaid bills of R26.4 billion from 2016/17, a 30 per cent increase from the prior year. Health departments accounted for 52.6 per cent of unpaid bills.
|
| • |
Medical negligence claims. Medical negligence claims are legal claims for malpractice (e.g. leading to lifelong disability) in public health facilities. Although some of these claims are legitimate, others are unjustified or excessive. Estimated pay-outs for medical negligence claims have grown at an average rate of 45 per cent since 2012/13, and amounted to R1.2 billion in 2016/17. The contingent liability arising from claims against the state at the end of 2016/17 totalled an estimated R56 billion. The Department of Health is considering establishing teams of clinical and legal experts to help defend provinces against unjustified or excessive claims.
|
| • |
Financial management challenges in municipalities. Weak financial management, high remuneration levels and poor maintenance of infrastructure threaten the sustainability of some municipalities. While demand for services has risen, low levels of economic growth have put pressure on consumers’ ability to pay for services, while transfers from national government are growing more slowly than in the past. As a result, some municipalities have fallen into financial distress and face liquidity problems. To manage these difficulties, these municipalities are delaying payments to Eskom, water boards and other creditors, contributing to financial imbalances in other parts of the public sector.
|
█ Contingent liability risks
Government’s major explicit contingent liabilities are its guarantees. Total guarantees issued to public institutions, independent power producers and public-private partnerships stood at R688.8 billion in 2016/17. Total guarantee exposure was R445 billion, because several entities had not fully used their available guarantee facilities. Between 2011/12 and 2016/17, the combined profitability of the state-owned companies, measured by return-on-equity, declined from 7.5 per cent to an estimated 0.2 per cent. A growing portion of their operating expenditure is funded through debt.
Lenders, alarmed by governance failures, are taking a more active stance. As a result, state-owned companies are having difficulty raising debt, or are forced to refinance debt at higher rates. This situation creates liquidity challenges, leading to greater demands on the fiscus. Addressing this requires not only stabilisation measures at troubled entities, but a broader restructuring of state-owned companies and an acceleration of the reforms highlighted in recent editions of the Budget Review.
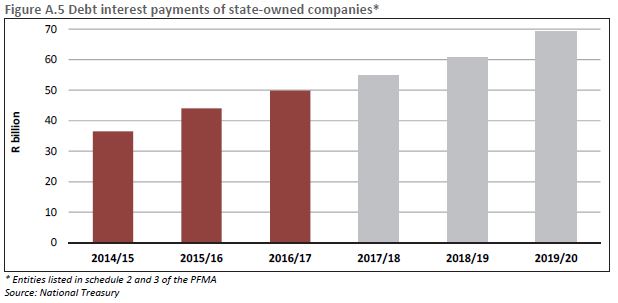
53
|
2017 MEDIUM TERM BUDGET POLICY STATEMENT
|
Total interest payments by state-owned companies are projected to increase from R49.8 billion in 2016/17 to R69.3 billion by 2019/20. Given the sharp increase in interest commitments, some entities may have insufficient cash to settle their obligations unless immediate reforms are implemented to improve governance and boost profitability.
The largest government guarantees are described below.
Eskom
The largest state guarantee (R350 billion) supports Eskom’s capital investment programme. Eskom is experiencing financial turbulence because of weak governance. This has led to a qualified audit opinion and a violation of some debt covenants with lenders. Eskom forecasts that electricity sales growth over its planning period will be flat, with revenue growth secured through tariff increases. However, the National Energy Regulator of South Africa could grant tariff increases below Eskom’s application, as it did during the multi-year price determination process for April 2013 to March 2018. There are also risks that sales growth will perform below projections, or decline as households and businesses improve their energy efficiency. If this happens, Eskom will likely apply for even steeper tariff increases.
Any of the options required to stabilise Eskom could have significant fiscal implications. If higher tariffs slow economic activity, tax revenue collections will be lower, delaying government’s fiscal objectives of closing the deficit and stabilising debt. However, if Eskom does not secure sufficiently high tariff increases its financial position may weaken, requiring it to seek government assistance.
Government has extended its R350 billion guarantee from 31 March 2017 to 31 March 2023 because of delays in Eskom’s capital investment programme. The extension of the guarantee will allow Eskom to use the remaining portion to complete its planned capital expenditure programme. The Eskom board has developed a plan to address governance concerns that they will share with lenders. The regulator is expected to rule on Eskom’s application for a tariff increase for 2018/19 as well as its Regulatory Clearing Account application. If these applications are successful it would represent a step-change in Eskom’s future revenues. Combined with strong cost management, this could allow the utility to cover all its obligations without fiscal support.
South African National Roads Agency Limited
Government provided SANRAL with a R38.9 billion guarantee to expand its toll roads portfolio. In response to public concerns about electronic tolling in Gauteng, SANRAL introduced a lower-cost dispensation. However, collections remain lower than projected, making it difficult for the agency to service its debt. Government has clarified the conditions of the SANRAL guarantee. This gives SANRAL more room to borrow under the guarantee and allows the agency to service all its commitments over the medium term. Over the long term, an improvement in toll revenue collection is needed to ensure SANRAL’s sustainability. If government does not proceed with tolling to fund major freeways, difficult trade-offs will need to be made to avoid a deterioration in the national road network.
South African Airways
Government has issued a R19.1 billion guarantee facility to SAA to ensure the company continues to operate as a going concern. Total recapitalisation of R10 billion will be provided in 2017/18. An amount of R5.2 billion has already been provided, with the remaining R4.8 billion to be transferred by 31 March 2018. These funds will be used for working capital and to settle debt, enabling the airline to reduce its interest expenses. Even after the capital allocation, government’s exposure to SAA debt remains significant at R15 billion. There is risk that if SAA’s financial fortunes do not improve, there will be further calls on the remaining guarantee. A new, full-strength board has been tasked with returning the airline to financial sustainability. The appointment of a permanent chief executive officer, who will start on 1 November 2017, is a critical step in ensuring that the airline’s turnaround strategy is aggressively implemented. If SAA executes a successful turnaround in line with its projections by 2019/20, its reliance on guarantees will subside, as will government’s risk exposure.
54
|
ANNEXURE A: FISCAL RISK STATEMENT
|
Denel
Arms manufacturer Denel faces refinancing and default risk on government-guaranteed debt amounting to R1.85 billion. The group has struggled to refinance debt due to concerns about corporate governance failures and corruption. Government has extended Denel’s guarantee to 30 September 2018. The group has exited the Denel Asia Joint Venture, which it entered into with VR Laser Asia in January 2016, and has withdrawn its court case against the National Treasury and the Minister of Finance.
Trans-Caledon Tunnel Authority
Government has issued a R25.7 billion guarantee to the TCTA. The agency relies on payments from the Department of Water and Sanitation’s Water Trading Account to settle obligations with lenders. Weak financial management at the department threatens the ability of the TCTA to meet its commitments, raising the likelihood of a call on the guarantee. In the long term, government’s ability to deliver water infrastructure could be compromised.
Road Accident Fund
The RAF has been insolvent for over 35 years and its total liabilities continue to grow to unsustainable levels. An immediate concern is claim amounts that have been settled in court but not yet paid. These amounted to about R8.5 billion at the end of 2016/17 and are forecast to grow over the medium term. Government has tabled legislation to create an equitable and affordable benefit arrangement to replace the fund. The replacement scheme is expected to significantly reduce costs, but will not eliminate the accumulated liability of the current fund.
█ Long-term spending commitments
The National Treasury regularly updates its long-term fiscal model to determine the sustainability of its major social spending commitments. The outlook for these programmes is largely determined by demographic changes, GDP growth, sector-specific cost pressures and trends in the use of public services.
Population estimates have changed significantly over the past few years. The National Development Plan (NDP) had projected the population would be between 58.2 million and 61.5 million by 2030. However, the latest actuarial projections put the population at 65 million in 2030. The increase largely reflects an unanticipated spike in fertility rates in the 2000s. This has been reflected in higher-than-expected enrolments in primary schools, and will affect high school enrolment rates from 2018. At the same time, infant mortality has been declining for a number of years, and life expectancy rates have been increasing. Higher numbers of young and older people place additional pressure on the public finances, because a large portion of social spending is directed towards these two age groups.
Since the National Treasury initially presented its fiscal modelling results in 2014, the economic growth outlook has been revised down. This has led to lower estimates of long-term potential growth and a higher expenditure-to-GDP ratio. The current modelling exercise assumes low, baseline and high growth scenarios, with long-term real GDP growth stabilising at 1.5, 2.5 and 4.5 per cent respectively. If growth remains at 1.5 per cent (the average over the past five years), spending would likely grow sharply as a share of GDP from current levels, even if no new policy initiatives are undertaken. If growth remains fixed at about 2.5 per cent (average growth over the past decade), spending is likely to grow gradually as a share of GDP over the coming decade. At a minimum, economic growth of about 3 per cent is required to sustain current spending commitments.
In addition to analysing the trend of current commitments, the National Treasury regularly models the costs associated with policy choices under consideration in government.
55
|
2017 MEDIUM TERM BUDGET POLICY STATEMENT
|
Post-school education and training
Major reforms are being considered in post-school education and training. The white paper on post-school education and training proposes to significantly increase enrolments at universities and technical and vocational education and training (TVET) colleges. The Commission of Inquiry into Higher Education and Training has submitted its report to the President on the feasibility of providing fee-free higher education. In addition, government is exploring the possibility of providing financial aid towards the full cost of study for students from poor and middle-income households.
Working with the Department of Higher Education and Training, the National Treasury has estimated the costs of achieving the enrolment targets set out in the white paper, as well as the costs of providing financial aid to cover full cost of study to 30 per cent, 50 per cent and 75 per cent of undergraduate university students. In the white paper scenario, university enrolments increase from about 980 000 in 2015 to 1.6 million by 2030. TVET enrolments grow from about 730 000 to 2.5 million over the same period. At a minimum, these changes would result in public expenditure on post-school education and training rising from 1.4 per cent to 2.5 per cent of GDP. This projection assumes, however, that fees and other forms of income would keep pace with the rise in enrolments. A more probable scenario is that government would have to fund shortfalls from fees and other income sources, shouldering an increasing share of total post-school education and training costs.
If government were to target the white paper enrolment rates while providing additional subsidies to poor and middle-income students, spending would increase more rapidly. Providing financial aid for the full cost of study to 75 per cent of undergraduate university students, for example, would push post-school education spending up to 4.1 per cent of GDP by 2030/31.
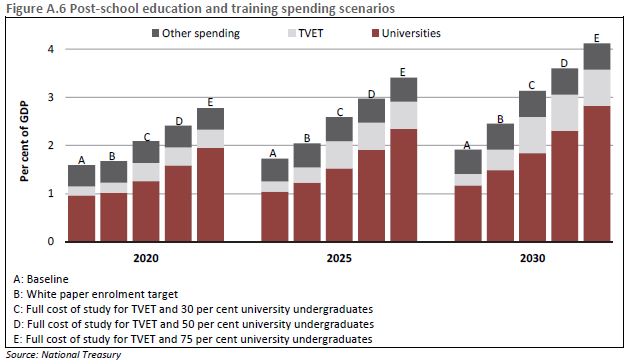
National health insurance
Public health expenditure is driven by population growth, service utilisation rates and costs – with the latter element typically growing more rapidly than CPI inflation. A combination of growing utilisation, an ageing population and significant cost pressures means that health spending is likely to grow as a share of GDP even without policy changes.
Cabinet adopted the white paper on NHI in June 2017. The white paper estimates that full implementation of NHI would increase public health spending from 3.9 per cent in 2017/18 to 6.2 per cent of GDP by 2025/26. This projection assumes a long-term economic growth rate of 3.5 per cent. However, working with an assumed economic growth rate of 2.5 per cent and the white paper’s costings, the National Treasury estimates that full implementation of the NHI will increase public health expenditure to 6.8 per cent of GDP in 2025/26.
56
|
ANNEXURE A: FISCAL RISK STATEMENT
|
Social grants
Spending on social grants is driven by changes in the number of grant recipients and grant values. The baseline scenario projects that the number of grant recipients will grow from 17.3 million in the current year to 23.5 million recipients by 2030/31, with grant values increasing in line with CPI inflation. In the baseline growth scenario, social grants rise from 3.3 per cent of GDP to a peak of 3.5 per cent in 2030, before declining slowly thereafter. Even in the low-growth scenario, grant expenditure is projected to peak at 3.8 per cent of GDP.
Defence Review
Recommendations flowing from the Defence Review, if implemented in full, would add R53.3 billion to defence expenditure over the next six years. Over the longer term, the review proposes that defence spending grow from the current level of 1 per cent of GDP to 2 per cent of GDP.
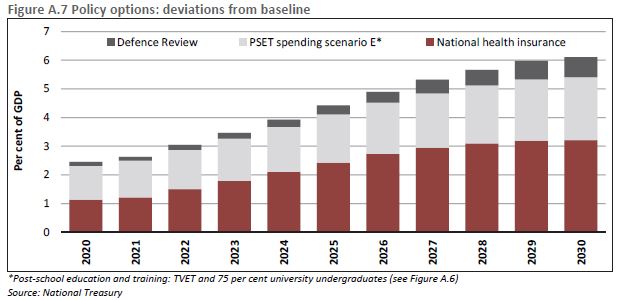
Beyond current spending commitments on health, defence and higher education, the implementation of NHI, the Defence Review and scenario E of the post-school education and training projections would require additional spending of 6 per cent of GDP by 2030. In the absence of higher economic growth, several of government’s current policy commitments will need to be revisited, because their cost implications appear to exceed available resources.
█ Conclusion
Fiscal risks are elevated over the medium term, primarily because the potential for weaker-than-expected economic performance threatens the revenue forecast. The outlook for contingent liabilities is also a source of vulnerability. The macroeconomic and fiscal policies outlined in Chapters 2 and 3 are, in part, designed to reduce these risks, and ensure that government’s fiscal targets are achieved.
57
|
2017 MEDIUM TERM BUDGET POLICY STATEMENT
|
This page was left blank intentionally.
58
B
Compensation data
The compensation of public employees is a core determinant of government spending. This annexure presents budget data and trends in compensation spending. It also examines data from government’s payroll system (PERSAL) to gauge trends in public-service employment. A fuller data set is available at www.treasury.gov.za/documents/MTBPS/2017. Headcount data has been extracted from the PERSAL system. Two points should be noted:
| • |
The data has been adjusted to reflect the average number of full-time equivalent1 employees over a year. As a result, there may be minor differences between the data published here and information contained in the 2017 Estimates of National Expenditure, which provided a snapshot of unadjusted headcounts at year end.
|
| • |
About 240 000 employees on government’s payroll are contracted through initiatives such as the Community Work Programme and the Expanded Public Works Programme. Since they are not part of the public service, they are not included in the information presented in this annexure.
|
Unless otherwise indicated, the data is presented in real terms: rand values have been adjusted for inflation and reflect 2016 equivalents.
█ Trends in compensation spending
Compensation spending has grown more quickly than the overall budget over the past eight years, and accounted for 35.3 per cent of consolidated expenditure in 2016/17, up from 32.9 per cent in 2008/09. Only interest payments grew faster than compensation, and the combination of these two factors has resulted in much slower growth in capital, goods and services, and transfer payments.
|
Table B.1 Summary of consolidated public expenditure
|
||||
|
2008/09
|
2016/17
|
Average annual
|
% of total spending
|
|
|
R million
|
Outcome
|
growth
|
in 2016/17
|
|
|
Compensation of employees
|
233 345
|
510 328
|
10.3%
|
35.3%
|
|
Transfers
|
237 946
|
472 938
|
9.0%
|
32.7%
|
|
Goods and services
|
117 809
|
208 098
|
7.4%
|
14.4%
|
|
Interest payments
|
58 627
|
153 607
|
12.8%
|
10.6%
|
|
Capital
|
49 707
|
93 564
|
8.2%
|
6.5%
|
|
Total
|
708 489
|
1 445 719
|
9.3%
|
100.0%
|
Source: National Treasury (budget data)
Since 2008/09, nominal GDP has grown at an annual average of 7.9 per cent a year. Over the same period, spending on public-service compensation has grown at 10.3 per cent.
______________________
1 An employee who receives fewer than 12 salary payments per year – for example, because they are temporary or contract staff – is not counted as one full-time employee. Their contributions are aggregated into full-time equivalents.
59
|
2017 MEDIUM TERM BUDGET POLICY STATEMENT
|
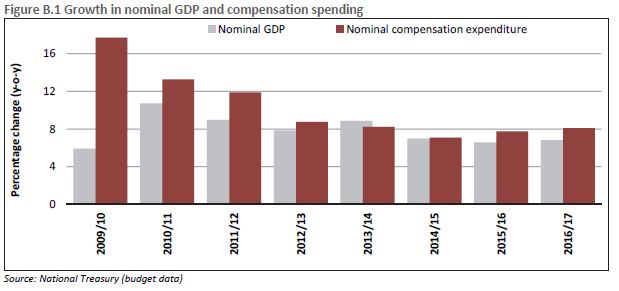
Between 2008/09 and 2016/17, compensation spending increased by about 37 per cent in real terms, or 4.1 per cent a year. About a quarter of the increase resulted from expanded employment, with the remaining three-quarters due to higher remuneration.
In South Africa’s constrained fiscal environment, rising compensation budgets increasingly crowd out other expenditure, including the complementary inputs required for public servants to execute their functions effectively. In labour-intensive national departments – such as defence, justice and the police – compensation absorbs a rising share of budget allocations. In provinces, compensation pressures are particularly high in the health sector. In Limpopo, for example, compensation accounts for 71 per cent of the health budget, up from 58.9 per cent in 2008/09.
|
Table B.2 Compensation spending as a share of total expenditure
|
|||
|
Department/Sector
|
2008/09
% of Total
|
2016/17
% of Total
|
|
|
National labour intensive departments
|
57.7%
|
67.7%
|
|
|
Correctional services
|
63.0%
|
66.9%
|
|
|
Defence
|
38.2%
|
57.3%
|
|
|
Justice
|
54.1%
|
55.9%
|
|
|
Police
|
70.0%
|
76.6%
|
|
|
Provincial health departments
|
57.0%
|
63.2%
|
|
|
Eastern Cape
|
58.0%
|
65.6%
|
|
|
Free State
|
64.7%
|
64.1%
|
|
|
Gauteng
|
52.0%
|
62.2%
|
|
|
KwaZulu-Natal
|
58.9%
|
63.1%
|
|
|
Limpopo
|
58.9%
|
71.0%
|
|
|
Mpumalanga
|
58.5%
|
63.2%
|
|
|
North West
|
56.6%
|
62.0%
|
|
|
Northern Cape
|
51.1%
|
53.1%
|
|
|
Western Cape
|
56.3%
|
58.9%
|
|
|
Total consolidated expenditure
|
32.4%
|
35.3%
|
|
Source: National Treasury (budget data)
60
|
ANNEXURE B: COMPENSATION DATA
|
█ Public-service employment trends
Between 2001/02 and 2011/12, public-service employment grew rapidly. Employment in public health increased from 216 000 to 318 000. Employment in criminal justice – including police, correctional services and justice – grew to 261 000 from 181 000. Employment in public education increased from 419 000 to 494 000.
The rate of expansion slowed after 2011/12. Measured by full-time equivalents, personnel numbers peaked at 1.33 million in 2012/13 and have fallen by about 22 000 since then. In health, education and criminal justice, employment levels have declined marginally in recent years. This decline reflects the implicit trade-off between headcount and salaries. While the number of employees stagnated, real remuneration per employee continued to rise after 2011/12, driving up overall spending on compensation.
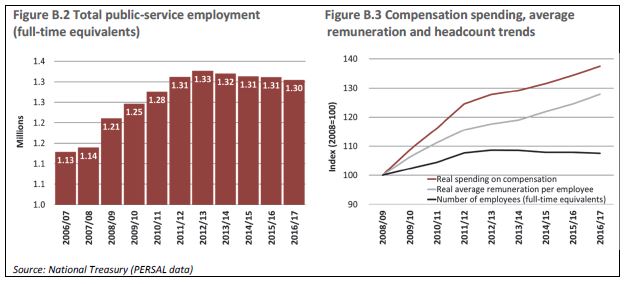
There are considerable variations within the aggregate trends. As a result, the data should be interpreted with care. Reaching accurate conclusions about the composition of employment in a given sector requires detailed attention to its specific dynamics. For example, while the total number of South African Police Service (SAPS) employees rose from just over 170 000 in 2008/09 to 190 000 in 2016/17, much of this increase resulted from recruitment of civilian employees. This might be viewed as crowding out frontline staff with administrative employees. But civilian personnel cost the SAPS less to perform tasks that would otherwise occupy the time of uniformed officers, freeing the latter to fight crime. The number of police officers has remained broadly stable at about 150 000.
Table B.3 shows trends in employment and remuneration in the largest occupation-specific dispensation (OSD) groups in the public service. Employment of teachers has not increased since 2009/10, but the nursing provision has continued to grow. On average, remuneration of these two groups has outpaced inflation by more than 2 percentage points over the past seven years.
61
|
2017 MEDIUM TERM BUDGET POLICY STATEMENT
|
|
Table B.3 Employment1 and remuneration2 in major OSD groups
|
||||
|
OSD group
|
2009/10
|
2016/17
|
Average annual
growth
|
|
|
Teachers
|
||||
|
Employment
|
404 733
|
404 281
|
0.0%
|
|
|
Average compensation
|
317 028
|
374 450
|
2.4%
|
|
|
Nurses
|
||||
|
Employment
|
115 813
|
141 686
|
2.9%
|
|
|
Average compensation
|
287 866
|
332 524
|
2.1%
|
|
|
Police and corrections
|
||||
|
Employment
|
173 965
|
179 732
|
0.5%
|
|
|
Average compensation
|
279 558
|
325 524
|
2.2%
|
|
1. Full-time equivalents
2. Real 2016 rand
Source: National Treasury (PERSAL data)
Table B.4 disaggregates the changes in employment by salary level for all employees on the payroll. Although there has been significant headcount growth at managerial levels (salary levels 13-16), the greatest share of growth has been in the ranks of those receiving OSDs. These are generally skilled professionals rather than managers. Absolute declines in employment at the lowest salary levels largely reflect progression and promotion of employees to higher levels, as discussed below.
|
Table B.4 Employment by level (full-time equivalents)
|
||||||
|
Salary level
|
Non-OSD
|
Average annual
growth
|
OSD
|
Average annual
growth
|
||
|
2008/09
|
2016/17
|
2008/09
|
2016/17
|
|||
|
01 - 04
|
231 239
|
175 966
|
-3.4%
|
80 980
|
74 633
|
-1.0%
|
|
05 - 08
|
143 584
|
207 340
|
4.7%
|
529 514
|
566 549
|
0.8%
|
|
09 - 12
|
36 434
|
39 365
|
1.0%
|
132 018
|
170 864
|
3.3%
|
|
13 - 16
|
7 021
|
9 011
|
3.2%
|
2 514
|
10 778
|
20.0%
|
|
Total
|
418 278
|
431 682
|
0.4%
|
745 026
|
822 824
|
1.2%
|
Source: National Treasury (PERSAL data)
█ Remuneration trends
Employee salaries have increased by an average of 29 per cent since 2008/09. Average remuneration per employee has grown from about R260 000 a year (in 2016 rands) in 2008/09 to R335 000 a year in 2016/17. This rise in remuneration is the result of several factors:
| • |
Above-inflation increases to basic salaries through annual cost-of-living adjustments.
|
| • |
The introduction of OSDs, which led to a level shift in the remuneration and conditions of service of teachers, nurses, police officers and others.
|
| • |
The introduction of a new salary grading system in 2009 for public servants not receiving an OSD.
|
| • |
Promotions, salary progressions and other human resource policies leading to an upward drift in the distribution of personnel across pay scales.
|
Over the last decade, negotiated annual cost-of-living adjustments have exceeded Consumer Price Index (CPI) inflation by an average of 2 per cent. In some years, this resulted from agreements set well above the prevailing inflation rate. At other times, lower-than-anticipated inflation has boosted the value of adjustments based on projections. For example, in the current year public servants received a cost-of-living adjustment of 7.3 per cent, based on an inflation forecast of 6.3 per cent. Inflation has now been revised down to 5 per cent, implying an effective salary increase of CPI plus 2.3 per cent.
62
|
ANNEXURE B: COMPENSATION DATA
|
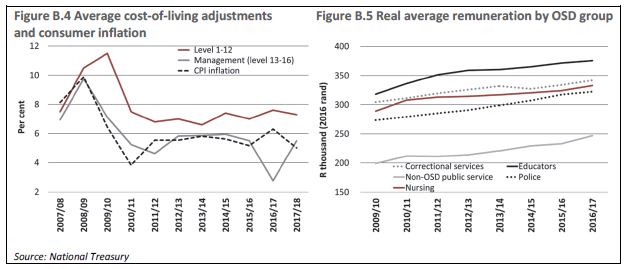
From 2008, when OSDs were introduced into the salary structure, they had a pronounced effect on average remuneration, as shown in Figure B.5. In general, non-OSD public servants earn significantly less than designated occupations. Teachers earn more than the other large OSD groups. Smaller OSD groups receiving higher salaries – such as doctors, lawyers and engineers – are not shown in the figure.
Other improvements in conditions of service boost average remuneration levels. These include a complex mix of negotiated benefits, allowances, overtime provisions and practices that make it difficult to provide a single statistic summing up the effect of bargaining outcomes on remuneration.
Promotion, progression and other remuneration policies
Other policies also increase average remuneration. These include:
| • |
Notch progression, where employees move up the scale within their salary level.
|
| • |
Promotions as vacancies arise, and the upgrading of personnel in line with revised job descriptions.
|
| • |
Wholesale promotion of personnel from one salary level to another. In 2013/14, for example, all clerks were upgraded from level 1 - 4 to level 5, and from level 5 to 7.
|
While progression and promotions are intended as performance-linked incentives, in many sectors they have become automatic. As a result, most public servants receive an automatic cost-of-living adjustment and an increase from salary-scale progression. On average, promotions and notch progressions increase government’s wage bill by 1.5 per cent each year.
Figure B.6 shows that between 2008/09 and 2016/17, the proportion of public servants in the lowest four salary levels fell from 26.8 per cent to 20 per cent, while the proportion of staff distributed across levels five to seven rose from 43.8 per cent to 50.8 per cent. This upward drift in the distribution of employees raises average remuneration significantly over time.
63
|
2017 MEDIUM TERM BUDGET POLICY STATEMENT
|
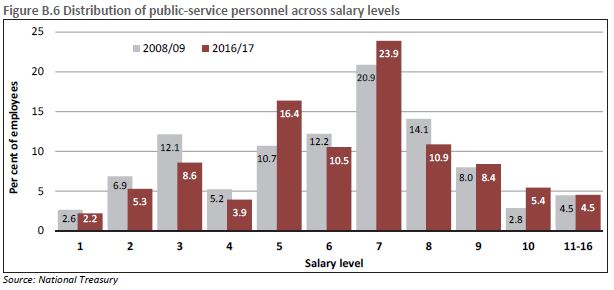
█ Level and distribution of remuneration
Table B.5 shows that wage growth has been somewhat faster at lower salary levels than at higher ones. Average real remuneration has declined for personnel in level 16 of the pay scale.
|
Table B.5 Average remuneration by level (Real 2016 rand)
|
||||
|
Level
|
2008/09
|
2016/17
|
Average annual
growth
|
|
|
01 - 04
|
R119 456
|
R159 573
|
3.7%
|
|
|
05 - 08
|
R258 070
|
R308 187
|
2.2%
|
|
|
09 - 12
|
R480 949
|
R576 294
|
2.3%
|
|
|
13 - 16
|
R1 092 923
|
R1 232 642
|
1.5%
|
|
|
Average
|
R259 966
|
R337 971
|
3.3%
|
|
Source: National Treasury (PERSAL data)
This reflects two factors. First, cost-of-living adjustments and other improvements in remuneration have been targeted to benefit lower-income earners. Second, allowances set in nominal terms – such as housing allowances and employer medical contributions – constitute a larger share of the remuneration of lower-income employees, who receive larger proportional gains when such allowances are improved.
The combination of salary adjustments, improved benefits and upward progression has resulted in a large increase and equalisation in remuneration levels in the public service over the past decade. In 2016/17, nearly 461 000 public servants (37 per cent of the total) earned more than R20 000 per month, up from 17 per cent, or 199 000, in 2008/09. Just 17 percent earned less than R10 000 per month in 2016/17, compared with more than 35 per cent of public servants in 2008/09.
Figure B.8 – based on data from South African Revenue Service tax filings – shows that public servants tend to receive higher remuneration than taxpayers in general at every point of the distribution up to the 90th percentile. While the income of the median taxpayer in 2014 was just under R100 000, the income of the median public servant was over R260 000. Only at the highest income levels do public servants earn less than the average taxpayer. Taxpayers in the 95th percentile earned about R682 000 compared with R563 000 earned by public servants in that percentile.
64
|
ANNEXURE B: COMPENSATION DATA
|
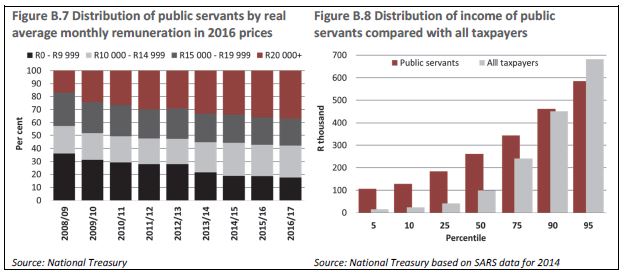
The income of public servants is more equally distributed than is the case for income-earners as a whole. The highest-paid 1 per cent of public servants receive an income 23 times that of the lowest-paid 1 per cent. By comparison, the income of the top 1 per cent of all taxpayers is 633 times more than the lowest 1 per cent.
65
|
2017 MEDIUM TERM BUDGET POLICY STATEMENT
|
This page was left blank intentionally.
66
C
Technical annexure
Main budget expenditure ceiling
The expenditure ceiling differs slightly from main budget non-interest expenditure due to technical modifications introduced in the 2015 Medium Term Budget Policy Statement. The ceiling excludes payments that are directly financed by dedicated revenue flows and others not subject to policy oversight. These include:
| • |
Payments for financial assets financed by the sale of assets in the same fiscal year: Funds allocated to equity investments financed from the sale of assets are deficit-neutral. The increases in associated spending levels are generally not financed through adjustments to departmental allocations. For example, in 2015/16, the Eskom and the New Development Bank capital contributions amounting to R25 billion were financed from the sale of Vodacom shares. This transaction was deficit-neutral.
|
| • |
Payment transactions linked to the management of debt: This includes premiums paid on new loan issues, bond switches and buy-back transactions, revaluation profits or losses on government’s foreign-exchange deposits at the Reserve Bank when used to meet government’s foreign-currency commitments, and realised profits and losses on the Gold and Foreign Exchange Contingency Reserve Account. These items relate to debt and currency transactions that are not financed through adjustments in departmental appropriations.
|
| • |
Direct charges that relate to specific payments made in terms of legislation that provides for the collection and transfer of such receipts outside of the main budget: These include skills development levy contributions and the International Oil Pollution Compensation Fund. Skills development levy contributions are paid to the National Skills Fund and the sector education and training authorities. In general, the payment schedule to the National Skills Fund is revised to align it directly with anticipated receipts from the levy.
|
|
Table C.1 Expenditure ceiling calculations
|
|||||||
|
R million
|
2014/15
|
2015/16
|
2016/17
|
2017/18
|
2018/19
|
2019/20
|
2020/21
|
|
Non-interest expenditure
|
1 017 102
|
1 115 827
|
1 158 989
|
1 249 753
|
1 333 493
|
1 438 718
|
1 544 053
|
|
Technical adjustments
|
|||||||
|
Skills development levy
|
-13 839
|
-15 156
|
-15 233
|
-15 771
|
-16 929
|
-18 299
|
-19 819
|
|
Eskom equity contribution
|
–
|
-23 000
|
–
|
–
|
–
|
–
|
–
|
|
New Development Bank
|
–
|
-2 019
|
–
|
–
|
–
|
–
|
–
|
|
Debt management and
|
-1 526
|
-682
|
-1 778
|
-250
|
–
|
–
|
–
|
|
GFECRA1 transactions
|
|||||||
|
International Oil Pollution
|
–
|
–
|
–
|
-10
|
-10
|
-10
|
-11
|
|
Compensation Fund
|
|||||||
|
Expenditure ceiling
|
1 001 737
|
1 074 970
|
1 141 978
|
1 233 722
|
1 316 553
|
1 420 408
|
1 524 222
|
1. Gold and Foreign Exchange Contingency Reserve Account (GFECRA)
Source: National Treasury
67
|
2017 MEDIUM TERM BUDGET POLICY STATEMENT
|
|
Table C.2 Main budget framework and financing requirements
|
|||||||
|
MACROECONOMIC PROJECTIONS
|
|||||||
|
R billion/percentage change
|
2014/15
|
2015/16
|
2016/17
|
2017/18
|
2018/19
|
2019/20
|
2020/21
|
|
Real GDP growth
|
1.9%
|
0.5%
|
0.7%
|
0.9%
|
1.1%
|
1.6%
|
2.0%
|
|
Nominal GDP growth
|
7.0%
|
6.6%
|
6.8%
|
6.1%
|
6.3%
|
7.0%
|
7.5%
|
|
CPI inflation
|
5.6%
|
5.2%
|
6.3%
|
5.0%
|
5.4%
|
5.5%
|
5.5%
|
|
GDP at current prices (R billion)
|
3 867.9
|
4 122.6
|
4 404.5
|
4 672.2
|
4 968.1
|
5 315.5
|
5 716.7
|
|
MAIN BUDGET FRAMEWORK
|
|||||||
|
R billion/percentage of GDP
|
2014/15
|
2015/16
|
2016/17
|
2017/18
|
2018/19
|
2019/20
|
2020/21
|
|
Revenue
|
|||||||
|
Personal income tax
|
353.0
|
388.1
|
424.5
|
461.3
|
499.8
|
544.9
|
595.5
|
|
Corporate income tax
|
184.9
|
191.2
|
204.4
|
213.9
|
223.6
|
236.2
|
251.0
|
|
Value-added tax
|
261.3
|
281.1
|
289.2
|
301.3
|
324.8
|
352.1
|
383.3
|
|
Other tax revenue
|
111.1
|
125.3
|
141.2
|
150.1
|
158.6
|
169.0
|
182.0
|
|
Customs and excise duties
|
76.0
|
84.3
|
84.7
|
88.1
|
93.3
|
99.9
|
107.3
|
|
SACU transfers
|
-51.7
|
-51.0
|
-39.4
|
-56.0
|
-48.3
|
-44.7
|
-57.8
|
|
Announced tax policy measures1
|
–
|
–
|
–
|
–
|
15.0
|
16.0
|
17.3
|
|
Non-tax revenue
|
18.3
|
42.9
|
18.8
|
18.0
|
18.5
|
19.5
|
20.7
|
|
National Revenue Fund receipts2
|
12.6
|
14.4
|
14.2
|
16.7
|
9.2
|
6.0
|
3.0
|
|
Main budget revenue
|
965.5
|
1 076.2
|
1 137.6
|
1 193.5
|
1 294.5
|
1 398.9
|
1 502.1
|
|
25.0%
|
26.1%
|
25.8%
|
25.5%
|
26.1%
|
26.3%
|
26.3%
|
|
|
Expenditure
|
|||||||
|
Expenditure ceiling
|
1 001.7
|
1 075.0
|
1 142.0
|
1 233.7
|
1 316.6
|
1 420.4
|
1 524.2
|
|
Baseline allocations
|
1 001.7
|
1 075.0
|
1 142.0
|
1 233.7
|
1 313.6
|
1 415.4
|
1 516.2
|
|
Contingency reserve
|
–
|
–
|
–
|
–
|
3.0
|
5.0
|
8.0
|
|
Other non-interest expenditure3
|
15.4
|
40.9
|
17.0
|
16.0
|
16.9
|
18.3
|
19.8
|
|
Non-interest expenditure
|
1 017.1
|
1 115.8
|
1 159.0
|
1 249.8
|
1 333.5
|
1 438.7
|
1 544.1
|
|
Debt-service costs
|
114.8
|
128.8
|
146.5
|
163.3
|
183.1
|
203.3
|
223.4
|
|
Main budget expenditure
|
1 131.9
|
1 244.6
|
1 305.5
|
1 413.1
|
1 516.6
|
1 642.0
|
1 767.4
|
|
29.3%
|
30.2%
|
29.6%
|
30.2%
|
30.5%
|
30.9%
|
30.9%
|
|
|
Main budget balance
|
-166.4
|
-168.4
|
-167.8
|
-219.6
|
-222.0
|
-243.1
|
-265.3
|
|
-4.3%
|
-4.1%
|
-3.8%
|
-4.7%
|
-4.5%
|
-4.6%
|
-4.6%
|
|
|
Primary balance
|
-51.6
|
-39.6
|
-21.3
|
-56.3
|
-39.0
|
-39.8
|
-42.0
|
|
-1.3%
|
-1.0%
|
-0.5%
|
-1.2%
|
-0.8%
|
-0.7%
|
-0.7%
|
|
|
BORROWING REQUIREMENT
|
|||||||
|
Main budget deficit
|
166.4
|
168.4
|
167.8
|
219.6
|
222.0
|
243.1
|
265.3
|
|
Refinancing of redemptions
|
48.8
|
32.0
|
73.1
|
28.7
|
48.7
|
109.4
|
68.2
|
|
Gross borrowing requirement
|
215.2
|
200.4
|
240.9
|
248.3
|
270.7
|
352.5
|
333.5
|
|
5.6%
|
4.9%
|
5.5%
|
5.3%
|
5.4%
|
6.6%
|
5.8%
|
|
|
GOVERNMENT DEBT
|
|||||||
|
Gross loan debt
|
1 798.9
|
2 019.0
|
2 232.9
|
2 530.5
|
2 829.6
|
3 094.2
|
3 415.6
|
|
46.6%
|
49.4%
|
50.7%
|
54.2%
|
57.0%
|
58.2%
|
59.7%
|
|
|
Net loan debt
|
1 584.2
|
1 804.6
|
2 008.3
|
2 294.2
|
2 568.5
|
2 863.6
|
3 179.4
|
|
41.0%
|
44.2%
|
45.6%
|
49.1%
|
51.7%
|
53.9%
|
55.6%
|
|
1. Unspecified tax policy measures announced in the 2016 Budget. The details will be announced in the 2018 Budget
2. Mainly revaluation profits on foreign-currency transactions and premiums on loan transactions
3. Technical adjustments explained in table C.1
Source: National Treasury
68
|
ANNEXURE C: TECHNICAL ANNEXURE
|
|
Table C.3 Tax revenue and tax bases
|
|||||||
|
R million
|
2014/15
|
2015/16
Outcome
|
2016/17
|
2017/18
Estimate
|
2018/19
|
2019/20
Projections
|
2020/21
|
|
Personal income tax
|
352 950
|
388 102
|
424 545
|
461 262
|
499 839
|
544 873
|
595 467
|
|
Wage bill1
|
8.6%
|
7.5%
|
7.8%
|
6.3%
|
7.3%
|
7.8%
|
8.1%
|
|
Buoyancy
|
1.61
|
1.32
|
1.20
|
1.36
|
1.15
|
1.15
|
1.15
|
|
Corporate income tax
|
184 925
|
191 152
|
204 432
|
213 905
|
223 577
|
236 172
|
251 047
|
|
Net operating surplus
|
2.5%
|
2.5%
|
6.2%
|
7.0%
|
4.5%
|
5.6%
|
6.3%
|
|
Buoyancy
|
1.73
|
1.35
|
1.13
|
0.67
|
1.00
|
1.00
|
1.00
|
|
Net value-added tax
|
261 295
|
281 111
|
289 167
|
301 320
|
324 750
|
352 135
|
383 266
|
|
Household consumption
|
6.0%
|
6.0%
|
6.9%
|
5.8%
|
6.7%
|
7.2%
|
7.6%
|
|
Buoyancy
|
1.65
|
1.26
|
0.41
|
0.72
|
1.17
|
1.17
|
1.16
|
|
Domestic VAT
|
286 776
|
297 422
|
321 475
|
340 354
|
365 294
|
394 271
|
427 274
|
|
Household consumption
|
6.0%
|
6.0%
|
6.9%
|
5.8%
|
6.7%
|
7.2%
|
7.6%
|
|
Buoyancy
|
1.47
|
0.62
|
1.17
|
1.01
|
1.10
|
1.10
|
1.10
|
|
Import VAT
|
136 544
|
150 745
|
149 265
|
151 967
|
161 486
|
174 804
|
190 083
|
|
Nominal imports
|
2.6%
|
3.0%
|
0.9%
|
4.3%
|
6.3%
|
8.2%
|
8.7%
|
|
Buoyancy
|
1.63
|
3.45
|
-1.08
|
0.42
|
1.00
|
1.00
|
1.00
|
|
VAT refunds
|
-162 025
|
-167 056
|
-181 574
|
-191 000
|
-202 030
|
-216 940
|
-234 091
|
|
Nominal exports
|
4.4%
|
5.3%
|
6.4%
|
6.0%
|
5.8%
|
7.4%
|
7.9%
|
|
Buoyancy
|
0.74
|
0.58
|
1.36
|
0.87
|
1.00
|
1.00
|
1.00
|
|
Customs duties
|
40 679
|
46 250
|
45 579
|
47 162
|
50 116
|
54 249
|
58 991
|
|
Nominal imports
|
2.6%
|
3.0%
|
0.9%
|
4.3%
|
6.3%
|
8.2%
|
8.7%
|
|
Buoyancy
|
-3.09
|
4.54
|
-1.60
|
0.80
|
1.00
|
1.00
|
1.00
|
|
Specific excise duties
|
32 334
|
35 077
|
35 774
|
37 373
|
39 403
|
41 572
|
43 872
|
|
CPI
|
5.6%
|
5.2%
|
6.3%
|
5.0%
|
5.4%
|
5.5%
|
5.5%
|
|
Buoyancy
|
2.02
|
1.64
|
0.32
|
0.89
|
1.00
|
1.00
|
1.00
|
|
Skills development levy
|
14 032
|
15 220
|
15 315
|
15 771
|
16 929
|
18 299
|
19 819
|
|
Private sector wage bill
|
8.7%
|
7.6%
|
7.6%
|
5.6%
|
7.3%
|
8.1%
|
8.3%
|
|
Buoyancy
|
1.43
|
1.11
|
0.08
|
0.53
|
1.00
|
1.00
|
1.00
|
|
Fuel levy
|
48 467
|
55 607
|
62 779
|
70 088
|
74 527
|
79 739
|
85 758
|
|
Nominal GDP
|
7.0%
|
6.6%
|
6.8%
|
6.1%
|
6.3%
|
7.0%
|
7.5%
|
|
Buoyancy
|
1.56
|
2.24
|
1.89
|
1.92
|
1.00
|
1.00
|
1.00
|
|
Other2
|
51 613
|
57 463
|
66 491
|
67 846
|
71 002
|
75 022
|
80 815
|
|
Nominal GDP
|
7.0%
|
6.6%
|
6.8%
|
6.1%
|
6.3%
|
7.0%
|
7.5%
|
|
Buoyancy
|
1.81
|
1.72
|
2.30
|
0.34
|
0.73
|
0.81
|
1.02
|
|
Gross tax (pre-proposals)
|
986 295
|
1 069 983
|
1 144 081
|
1 214 727
|
1 300 143
|
1 402 063
|
1 519 034
|
|
Nominal GDP
|
7.0%
|
6.6%
|
6.8%
|
6.1%
|
6.3%
|
7.0%
|
7.5%
|
|
Buoyancy
|
1.37
|
1.29
|
1.01
|
1.02
|
1.11
|
1.12
|
1.11
|
|
Announced tax policy measures3
|
–
|
–
|
–
|
–
|
15 000
|
16 049
|
17 260
|
|
Gross tax (post-proposals)
|
986 295
|
1 069 983
|
1 144 081
|
1 214 727
|
1 315 143
|
1 418 112
|
1 536 295
|
|
Nominal GDP
|
7.0%
|
6.6%
|
6.8%
|
6.1%
|
6.3%
|
7.0%
|
7.5%
|
|
Buoyancy
|
1.37
|
1.29
|
1.01
|
1.02
|
1.31
|
1.12
|
1.10
|
| 1 |
Total remuneration in the formal non-agriculture sector
|
| 2. |
Other includes dividend withholding tax, ad valorem excise duties, interest on overdue income tax, taxes on property, stamp duties and fees, air departure tax, electricity levy, plastic bag levy and all other minor taxes
|
| 3. |
Unspecified tax policy measures announced in the 2016 Budget. The details will be announced in the 2018 Budget. The initial tax increase in 2018/19 is carried through into the following two years at the same rate as nominal GDP growth
|
Source: National Treasury
69
|
2017 MEDIUM TERM BUDGET POLICY STATEMENT
|
|
Table C.4 Financing of national government borrowing requirement
|
||||||
|
2016/17
|
2017/18
|
2018/19
|
2019/20
|
2020/21
|
||
|
R million
|
Outcome
|
Budget
|
Revised
|
Medium-term estimates
|
||
|
Main budget balance
|
-167 837
|
-166 798
|
-219 644
|
-222 049
|
-243 127
|
-265 314
|
|
Redemptions
|
-73 040
|
-54 078
|
-28 665
|
-48 644
|
-109 339
|
-68 148
|
|
Domestic long-term loans
|
-57 350
|
-49 514
|
-24 577
|
-46 412
|
-58 878
|
-55 841
|
|
Foreign loans
|
-15 690
|
-4 564
|
-4 088
|
-2 232
|
-50 461
|
-12 307
|
|
Total
|
-240 877
|
-220 876
|
-248 309
|
-270 693
|
-352 466
|
-333 462
|
|
Financing
|
||||||
|
Domestic short-term loans
|
40 506
|
21 000
|
33 000
|
21 500
|
29 000
|
36 000
|
|
Treasury bills
|
40 501
|
21 000
|
33 000
|
21 500
|
29 000
|
36 000
|
|
Corporation for Public Deposits
|
5
|
–
|
–
|
–
|
–
|
–
|
|
Domestic long-term loans
|
174 034
|
191 500
|
199 670
|
231 800
|
247 500
|
255 000
|
|
Market loans
|
175 070
|
191 500
|
200 700
|
231 800
|
247 500
|
255 000
|
|
Loans issued for switches
|
-1 036
|
–
|
-1 030
|
–
|
–
|
–
|
|
Foreign loans
|
52 070
|
29 600
|
33 895
|
42 510
|
43 650
|
44 550
|
|
Market loans
|
50 959
|
29 600
|
33 895
|
42 510
|
43 650
|
44 550
|
|
Loans issued for switches
|
1 111
|
–
|
–
|
–
|
–
|
–
|
|
Change in cash and other balances
|
-25 733
|
-21 224
|
-18 256
|
-25 117
|
32 316
|
-2 088
|
|
Cash balances
|
-26 216
|
-25 443
|
-22 138
|
-29 161
|
28 375
|
-6 176
|
|
Other balances
|
483
|
4 219
|
3 882
|
4 044
|
3 941
|
4 088
|
|
Total
|
240 877
|
220 876
|
248 309
|
270 693
|
352 466
|
333 462
|
|
Percentage GDP
|
5.5%
|
4.7%
|
5.3%
|
5.4%
|
6.6%
|
5.8%
|
Source: National Treasury
█ 2016/17 outcomes and 2017/18 mid-year estimates
Table C.5 shows a summary of national and provincial appropriated expenditure outcomes for 2016/17, and estimates for the first half of 2017/18. Details are presented in Tables C.6 and C.7.
National expenditure was R1.31 trillion in 2016/17, R7.4 billion lower than the adjusted budget estimate. This underspending was driven by transfers and subsidies, goods and services, and compensation of employees. However, spending on capital and financial assets was higher than the adjusted budget estimates. Provincial expenditure in 2016/17 amounted to R520.5 billion, or 99.1 per cent of the 2016 adjusted estimate.
National spending in the first six months of 2017/18 was R686.2 billion, or 48.4 per cent of the October 2017 adjusted estimate of R1.42 trillion for the year with transfers and subsidies forming the largest category. Transfers and subsidies include transfers to provincial and local government through the equitable share and conditional grants, as well as payments for social grants, housing subsidies and transfers to universities, science councils and public entities.
Expenditure by provinces was R226.6 billion in the first five months of 2017/18, representing 41 per cent of the original budget for the year. Provinces are primarily responsible for the delivery of social services including basic education and health. Compensation of employees is the largest category of spending in provincial budgets, accounting for 60.9 per cent of expenditure in the first half of 2017/18.
70
|
ANNEXURE C: TECHNICAL ANNEXURE
|
|
Table C.5 National and provincial expenditure outcomes and mid-year estimates
|
|||||||
|
2016/17
|
2017/18
|
||||||
|
Original
|
Adjusted
|
Audited
|
Over(-)/
|
Original
|
Adjusted
|
Actual
|
|
|
budget
|
estimate
|
outcome
|
under(+)
|
budget
|
estimate1
|
spending
|
|
|
April to
|
|||||||
|
R billion
|
September2
|
||||||
|
National appropriation
|
721.1
|
723.1
|
716.8
|
6.3
|
767.0
|
781.5
|
373.4
|
|
Direct charges
|
590.9
|
589.8
|
588.7
|
1.1
|
636.2
|
636.1
|
312.8
|
|
Debt-service costs
|
147.7
|
147.7
|
146.5
|
1.2
|
162.4
|
163.3
|
78.6
|
|
Provincial equitable share
|
410.7
|
410.7
|
410.7
|
–
|
441.3
|
441.3
|
220.7
|
|
Other direct charges
|
32.5
|
31.4
|
31.5
|
-0.1
|
32.5
|
31.4
|
13.5
|
|
National votes
of which:
|
1 312.1
|
1 312.9
|
1 305.5
|
7.4
|
1 403.2
|
1 417.6
|
686.2
|
|
Compensation of employees
|
148.5
|
148.5
|
147.1
|
1.4
|
154.7
|
155.7
|
77.0
|
|
Goods and services
|
63.3
|
65.6
|
62.6
|
3.0
|
65.7
|
66.1
|
25.8
|
|
Transfers and subsidies
|
932.9
|
930.5
|
926.9
|
3.5
|
999.1
|
997.2
|
493.5
|
|
Payments for capital assets
|
14.4
|
14.6
|
15.6
|
-1.1
|
15.8
|
15.7
|
5.6
|
|
Payments for financial assets
|
5.0
|
6.0
|
6.6
|
-0.7
|
5.4
|
19.4
|
5.6
|
|
Contingency reserves
|
6.3
|
–
|
–
|
–
|
6.0
|
–
|
–
|
|
Projected underspending
|
–
|
-4.2
|
–
|
-4.2
|
–
|
-4.5
|
–
|
|
Main budget expenditure
|
1 318.3
|
1 308.7
|
1 305.5
|
3.2
|
1 409.2
|
1 413.1
|
686.2
|
|
Provincial expenditure
of which:
|
517.2
|
525.0
|
520.5
|
4.5
|
551.9
|
n/a
|
226.6
|
|
Compensation of employees
|
313.4
|
312.6
|
311.8
|
0.9
|
336.0
|
n/a
|
138.0
|
|
Transfers and subsidies
|
69.5
|
73.6
|
74.2
|
-0.7
|
74.7
|
n/a
|
29.8
|
|
Payments for capital assets
|
36.1
|
36.3
|
33.8
|
2.5
|
35.3
|
n/a
|
13.7
|
| 1. |
Provinces will table adjusted estimates during November 2017
|
| 2. |
Provincial expenditure as at 31 August 2017
|
Source: National Treasury
71
|
2017 MEDIUM TERM BUDGET POLICY STATEMENT
|
|
Table C.6 Expenditure by vote
|
||||||||
|
2016/17
|
2017/18
|
|||||||
|
Main
|
Adjusted
|
Preliminary
|
Over(-)/
|
Main
|
Adjusted
|
Actual
|
||
|
budget
|
budget
|
outcome
|
Under(+)
|
budget
|
budget
|
spending
|
||
|
April to
|
||||||||
|
R million
|
September
|
|||||||
|
1
|
The Presidency
|
500
|
490
|
475
|
14
|
495
|
501
|
213
|
|
2
|
Parliament1
|
1 660
|
1 660
|
1 739
|
-79
|
1 712
|
1 712
|
–
|
|
3
|
Communication
|
1 345
|
1 350
|
1 336
|
14
|
1 425
|
1 428
|
676
|
|
4
|
Cooperative Governance and Traditional Affairs
|
72 994
|
73 022
|
69 852
|
3 170
|
78 414
|
78 464
|
31 187
|
|
5
|
Home Affairs
|
7 167
|
8 156
|
8 144
|
12
|
7 056
|
8 302
|
3 908
|
|
6
|
International Relations and Cooperation
|
5 889
|
6 839
|
6 845
|
-6
|
6 575
|
6 408
|
2 854
|
|
7
|
National Treasury
|
28 471
|
28 471
|
28 200
|
272
|
30 799
|
40 584
|
16 675
|
|
8
|
Planning, Monitoring and Evaluation
|
828
|
798
|
781
|
16
|
923
|
898
|
447
|
|
9
|
Public Enterprises
|
274
|
268
|
254
|
14
|
267
|
267
|
115
|
|
10
|
Public Service and Administration
|
770
|
780
|
763
|
17
|
897
|
877
|
401
|
|
11
|
Public Works
|
6 529
|
6 513
|
6 403
|
109
|
7 038
|
6 985
|
3 393
|
|
12
|
Statistics South Africa
|
2 489
|
2 538
|
2 461
|
77
|
2 146
|
2 178
|
1 004
|
|
13
|
Women
|
197
|
197
|
195
|
2
|
206
|
206
|
97
|
|
14
|
Basic Education
|
22 270
|
22 413
|
21 476
|
937
|
23 409
|
22 994
|
12 631
|
|
15
|
Higher Education and Training
|
49 188
|
49 188
|
49 138
|
51
|
52 308
|
52 308
|
38 316
|
|
16
|
Health
|
38 563
|
38 597
|
38 496
|
101
|
42 626
|
42 646
|
21 112
|
|
17
|
Social Development
|
148 938
|
147 933
|
147 343
|
591
|
160 708
|
160 358
|
79 160
|
|
18
|
Correctional Services
|
21 577
|
21 580
|
21 542
|
38
|
22 814
|
22 815
|
10 681
|
|
19
|
Defence and Military Veterans
|
47 170
|
47 236
|
47 197
|
39
|
48 619
|
49 000
|
23 220
|
|
20
|
Independent Police Investigative Directorate
|
246
|
242
|
242
|
–
|
255
|
255
|
138
|
|
21
|
Justice and Constitutional Development
|
16 050
|
16 041
|
16 039
|
2
|
16 787
|
16 787
|
7 840
|
|
22
|
Office of the Chief Justice and Judicial Administration
|
865
|
874
|
856
|
18
|
1 019
|
1 019
|
488
|
|
23
|
Police
|
80 985
|
80 985
|
80 985
|
–
|
87 025
|
86 761
|
42 110
|
|
24
|
Agriculture, Forestry and Fisheries
|
6 333
|
6 515
|
6 491
|
24
|
6 807
|
6 847
|
3 433
|
|
25
|
Economic Development
|
675
|
675
|
665
|
10
|
797
|
914
|
423
|
|
26
|
Energy
|
7 545
|
7 551
|
7 513
|
38
|
8 113
|
8 145
|
4 395
|
|
27
|
Environmental Affairs
|
6 430
|
6 425
|
6 381
|
44
|
6 848
|
6 848
|
2 625
|
|
28
|
Labour
|
2 848
|
2 843
|
2 762
|
81
|
3 066
|
3 056
|
1 330
|
|
29
|
Mineral Resources
|
1 669
|
1 669
|
1 661
|
8
|
1 779
|
1 779
|
948
|
|
30
|
Science and Technology
|
7 429
|
7 429
|
7 384
|
45
|
7 557
|
7 557
|
3 185
|
|
31
|
Small Business Development
|
1 325
|
1 318
|
1 197
|
121
|
1 450
|
1 476
|
699
|
|
32
|
Telecommunications and Postal Services
|
2 417
|
2 417
|
2 076
|
342
|
1 614
|
5 174
|
733
|
|
33
|
Tourism
|
2 010
|
2 010
|
1 920
|
90
|
2 140
|
2 140
|
1 182
|
|
34
|
Trade and Industry
|
10 328
|
10 390
|
10 349
|
40
|
9 275
|
9 343
|
3 797
|
|
35
|
Transport
|
56 015
|
56 286
|
56 404
|
-118
|
59 795
|
59 795
|
27 642
|
|
36
|
Water and Sanitation
|
15 245
|
15 525
|
15 635
|
-111
|
15 107
|
15 607
|
6 962
|
|
37
|
Arts and Culture
|
4 071
|
4 063
|
3 957
|
105
|
4 450
|
4 372
|
2 053
|
|
38
|
Human Settlements
|
30 691
|
30 696
|
30 587
|
109
|
33 464
|
33 478
|
13 064
|
|
39
|
Rural Development and Land Reform
|
10 124
|
10 124
|
10 067
|
57
|
10 184
|
10 184
|
3 772
|
|
40
|
Sport and Recreation South Africa
|
1 029
|
1 027
|
1 024
|
3
|
1 067
|
1 067
|
475
|
|
Total appropriation by vote
|
721 148
|
723 132
|
716 833
|
6 299
|
767 038
|
781 537
|
373 382
|
|
72
|
ANNEXURE C: TECHNICAL ANNEXURE
|
|
Table C.6 Expenditure by vote (continued)
|
|||||||
|
2016/17
|
2017/18
|
||||||
|
Main
|
Adjusted
|
Preliminary
|
Over(-)/
|
Main
|
Adjusted
|
Actual
|
|
|
budget
|
budget
|
outcome
|
Under(+)
|
budget
|
budget
|
spending
|
|
|
April to
|
|||||||
|
R million
|
September
|
||||||
|
Total appropriation by vote
|
721 148
|
723 132
|
716 833
|
6 299
|
767 038
|
781 537
|
373 382
|
|
Plus:
|
|||||||
|
Direct charges against the National Revenue Fund
|
|||||||
|
President and Deputy President salary (The Presidency)
|
6
|
6
|
6
|
–
|
6
|
6
|
3
|
|
Members’ remuneration (Parliament)1
|
530
|
530
|
436
|
93
|
556
|
556
|
–
|
|
Debt-service costs (National Treasury)
|
147 720
|
147 689
|
146 497
|
1 193
|
162 353
|
163 348
|
78 626
|
|
Provincial equitable share (National Treasury)
|
410 699
|
410 699
|
410 699
|
–
|
441 331
|
441 331
|
220 666
|
|
General fuel levy sharing with metropolitan municipalities (National Treasury)
|
11 224
|
11 224
|
11 224
|
–
|
11 785
|
11 785
|
3 928
|
|
National Revenue Fund payments (National Treasury)2
|
145
|
1 221
|
1 778
|
-557
|
388
|
250
|
250
|
|
Skills levy and sector education and training authorities (Higher Education and Training)
|
17 640
|
15 462
|
15 233
|
229
|
16 641
|
15 771
|
7 954
|
|
Magistrates’ salaries (Justice and Constitutional Development)
|
2 040
|
2 010
|
1 846
|
164
|
2 141
|
2 041
|
925
|
|
Judges’ salaries (Office of the Chief Justice and Judicial Administration)
|
920
|
950
|
931
|
19
|
966
|
966
|
478
|
|
International Oil Pollution Compensation Fund (Transport)
|
–
|
2
|
4
|
-2
|
10
|
10
|
–
|
|
Total direct charges against the National Revenue Fund
|
590 923
|
589 793
|
588 653
|
1 140
|
636 178
|
636 064
|
312 830
|
|
Provisional allocation not assigned to votes
|
267
|
–
|
–
|
–
|
–
|
–
|
–
|
|
Contingency reserve
|
6 000
|
–
|
–
|
–
|
6 000
|
–
|
–
|
|
National government projected underspending
|
–
|
-3 000
|
–
|
-3 000
|
–
|
-3 000
|
–
|
|
Local government repayment to the National Revenue Fund
|
–
|
-1 200
|
–
|
-1 200
|
–
|
-1 500
|
–
|
|
Total
|
1 318 338
|
1 308 725
|
1 305 486
|
3 239
|
1 409 215
|
1 413 100
|
686 212
|
| 1. |
The audited outcome for Parliament is converted from accrual to cash. Amendments to Parliament’s budget are determined independently of the national government’s budget processes in accordance with the Financial Management of Parliament and Provincial Legislatures Act, 2009 as amended
|
| 2. |
National Revenue Fund payments previously classified as extraordinary payments
|
Source: National Treasury
73
|
2017 MEDIUM TERM BUDGET POLICY STATEMENT
|
|
Table C.7 Expenditure by province
|
|||||||
|
2016/17
|
2017/18
|
||||||
|
Main
|
Adjusted
|
Preliminary
|
Over(-)/
|
Deviation
|
Main
|
Actual
|
|
|
budget
|
budget
|
outcome
|
Under(+)
|
from
|
budget
|
spending
|
|
|
adjusted
|
April to
|
||||||
|
R million
|
budget
|
August
|
|||||
|
Eastern Cape
|
69 591
|
69 989
|
69 517
|
472
|
0.7%
|
74 462
|
31 265
|
|
Education
|
31 003
|
30 983
|
30 971
|
11
|
0.0%
|
32 989
|
13 442
|
|
Health
|
20 244
|
20 648
|
20 506
|
142
|
0.7%
|
21 707
|
9 673
|
|
Social Development
|
2 384
|
2 404
|
2 384
|
20
|
0.8%
|
2 633
|
1 010
|
|
Other functions
|
15 960
|
15 954
|
15 656
|
298
|
1.9%
|
17 133
|
7 140
|
|
Free State
|
30 829
|
31 087
|
30 920
|
167
|
0.5%
|
32 898
|
14 256
|
|
Education
|
12 060
|
12 201
|
12 094
|
107
|
0.9%
|
12 739
|
5 754
|
|
Health
|
9 049
|
9 042
|
9 077
|
-35
|
-0.4%
|
9 775
|
4 077
|
|
Social Development
|
1 145
|
1 137
|
1 145
|
-8
|
-0.7%
|
1 172
|
489
|
|
Other functions
|
8 576
|
8 707
|
8 604
|
103
|
1.2%
|
9 212
|
3 936
|
|
Gauteng
|
103 365
|
105 254
|
104 376
|
878
|
0.8%
|
108 762
|
45 552
|
|
Education
|
39 069
|
39 509
|
39 410
|
99
|
0.2%
|
40 844
|
17 364
|
|
Health
|
37 408
|
37 657
|
37 440
|
217
|
0.6%
|
40 207
|
18 376
|
|
Social Development
|
4 235
|
4 272
|
4 235
|
36
|
0.8%
|
4 442
|
1 769
|
|
Other functions
|
22 653
|
23 817
|
23 291
|
527
|
2.2%
|
23 269
|
8 043
|
|
KwaZulu-Natal
|
109 006
|
109 914
|
109 595
|
320
|
0.3%
|
115 258
|
47 567
|
|
Education
|
45 464
|
45 740
|
45 663
|
77
|
0.2%
|
47 477
|
20 070
|
|
Health
|
36 579
|
37 039
|
37 026
|
13
|
0.0%
|
39 548
|
17 118
|
|
Social Development
|
2 778
|
2 782
|
2 778
|
4
|
0.1%
|
3 041
|
1 084
|
|
Other functions
|
24 185
|
24 353
|
24 213
|
140
|
0.6%
|
25 192
|
9 295
|
|
Limpopo
|
56 969
|
59 050
|
57 905
|
1 145
|
1.9%
|
61 459
|
25 242
|
|
Education
|
27 172
|
27 392
|
26 826
|
565
|
2.1%
|
28 783
|
11 766
|
|
Health
|
16 371
|
17 299
|
17 218
|
81
|
0.5%
|
18 043
|
7 968
|
|
Social Development
|
1 634
|
1 680
|
1 634
|
46
|
2.7%
|
1 821
|
651
|
|
Other functions
|
11 793
|
12 680
|
12 227
|
453
|
3.6%
|
12 812
|
4 856
|
|
Mpumalanga
|
41 301
|
41 705
|
41 412
|
293
|
0.7%
|
44 537
|
17 957
|
|
Education
|
17 917
|
17 937
|
17 813
|
124
|
0.7%
|
19 323
|
7 777
|
|
Health
|
10 642
|
10 606
|
10 580
|
26
|
0.2%
|
12 020
|
4 972
|
|
Social Development
|
1 455
|
1 436
|
1 455
|
-19
|
-1.3%
|
1 456
|
600
|
|
Other functions
|
11 288
|
11 725
|
11 564
|
161
|
1.4%
|
11 738
|
4 607
|
|
Northern Cape
|
14 850
|
15 409
|
15 176
|
234
|
1.5%
|
16 065
|
6 529
|
|
Education
|
5 439
|
5 448
|
5 512
|
-64
|
-1.2%
|
5 858
|
2 650
|
|
Health
|
4 198
|
4 494
|
4 369
|
125
|
2.8%
|
4 434
|
1 812
|
|
Social Development
|
774
|
776
|
774
|
2
|
0.3%
|
819
|
313
|
|
Other functions
|
4 440
|
4 692
|
4 521
|
171
|
3.6%
|
4 954
|
1 753
|
|
North West
|
36 229
|
36 589
|
35 971
|
618
|
1.7%
|
39 081
|
15 395
|
|
Education
|
14 331
|
14 242
|
14 086
|
156
|
1.1%
|
15 282
|
6 057
|
|
Health
|
9 461
|
9 676
|
9 767
|
-91
|
-0.9%
|
10 461
|
4 490
|
|
Social Development
|
1 415
|
1 393
|
1 415
|
-22
|
-1.6%
|
1 533
|
580
|
|
Other functions
|
11 022
|
11 279
|
10 702
|
576
|
5.1%
|
11 806
|
4 268
|
|
Western Cape
|
55 048
|
55 956
|
55 510
|
446
|
0.8%
|
59 398
|
22 799
|
|
Education
|
19 247
|
19 531
|
19 301
|
230
|
1.2%
|
20 630
|
8 189
|
|
Health
|
19 983
|
20 145
|
20 078
|
66
|
0.3%
|
21 680
|
8 504
|
|
Social Development
|
1 961
|
1 964
|
1 961
|
2
|
0.1%
|
2 107
|
893
|
|
Other functions
|
13 856
|
14 317
|
14 169
|
147
|
1.0%
|
14 981
|
5 212
|
|
Total
|
517 189
|
524 954
|
520 467
|
4 487
|
0.9%
|
551 920
|
226 562
|
|
Education
|
211 702
|
212 981
|
211 677
|
1 305
|
0.6%
|
223 924
|
93 070
|
|
Health
|
163 934
|
166 606
|
166 062
|
544
|
0.3%
|
177 875
|
76 992
|
|
Social Development
|
17 781
|
17 843
|
17 781
|
62
|
0.3%
|
19 024
|
7 390
|
|
Other functions
|
123 772
|
127 524
|
124 948
|
2 576
|
2.0%
|
131 096
|
49 111
|
Source: National Treasury
74
Glossary
|
Adjustments estimate
|
Presentation to Parliament of the amendments to be made to the appropriations voted in the main budget for the year.
|
|
|
Appropriation
|
The approval by Parliament of spending from the National Revenue Fund, or by a provincial legislature from the Provincial Revenue Fund.
|
|
|
Asset price inflation
|
An increase in the overall price of assets over a specific period of time.
|
|
|
Balance of payments
|
A summary statement of all the transactions of the residents of a country with the rest of the world over a particular time period.
|
|
|
Basel III
|
Reforms developed by the Basel Committee on Banking Supervision to strengthen the regulation, supervision and risk management of the banking sector.
|
|
|
Baseline
|
The initial allocations used during the budget process, derived from the previous year’s forward estimates.
|
|
|
Budget balance
|
The difference between expenditure and revenue. If expenditure exceeds revenue, the budget is in deficit. If the reverse is true, it is in surplus.
|
|
|
Capital erosion
|
The deterioration of capital due to the lack of investment in maintenance.
|
|
|
Capital flight
|
A large outflow of investments from a country in response to heightened economic, political or policy risk.
|
|
|
Capital flow
|
A flow of investments in and out of a country.
|
|
|
Conditional grants
|
Allocations of money from one sphere of government to another, conditional on certain services being delivered or on compliance with specified requirements.
|
|
|
Consolidated government expenditure
|
Total expenditure by national and provincial government, social security funds and selected public entities, including transfers to municipalities, businesses or other entities. See also main budget expenditure.
|
|
|
Consumer price index (CPI)
|
The main measure of inflation, charting the price movements of a basket of consumer goods and services.
|
|
|
Consumption expenditure
|
Expenditure on goods and services, including salaries, which are consumed within a short period of time – usually a year.
|
|
|
Contingency reserve
|
An amount set aside, but not allocated in advance, to accommodate changes to the economic environment and to meet unforeseen spending pressures.
|
|
75
|
2017 MEDIUM TERM BUDGET POLICY STATEMENT
|
|
Core inflation
|
A measure of the change in price level that excludes temporary shocks and represents the long-run trend of the price level.
|
|
|
Countercyclical fiscal policy
|
Policy that has the opposite effect on economic activity to that caused by the business cycle, such as slowing spending growth in a boom period and accelerating spending in a recession.
|
|
|
Credit rating
|
An indicator of the risk of default by a borrower or the riskiness of a financial instrument. Grades such as AAA, Baa2 and D are given, signifying the extent of the borrower’s capacity to meet its financial obligations or the probability that the value of the financial instrument will be realised. See also rating agency.
|
|
|
Crowding-in
|
Increase of private investment as a result of government spending.
|
|
|
Crowding-out
|
A fall in private investment or consumption as a result of increased government expenditure.
|
|
|
Current account (of the balance of payments)
|
The difference between total exports and imports, including service payments and receipts, interest, dividends and transfers. This account can be in deficit or surplus. See also trade balance.
|
|
|
Current balance
|
The difference between revenue and current expenditure, which consists of compensation of employees, goods and services, and interest and rent on land.
|
|
|
Debt-service cost
|
The cost of interest on government debt.
|
|
|
Debt redemption
|
Repayment of the principal and any outstanding interest on a bond.
|
|
|
Depreciation (capital)
|
A reduction in the value of fixed capital as a result of wear and tear or redundancy.
|
|
|
Depreciation (exchange rate)
|
A reduction in the external value of a currency.
|
|
|
Division of revenue
|
The allocation of funds between national, provincial and local government as required by the Constitution.
|
|
|
Economic cost
|
The cost of an alternative forgone to pursue a certain action.
|
|
|
Employment tax incentive
|
An incentive meant to encourage the creation of jobs for youths by allowing employers to claim a reduction in employees’ tax.
|
|
|
Equitable share
|
The allocation of revenue to national, provincial and local government as required by the Constitution.
|
|
|
Expenditure ceiling
|
An overall limit on expenditure that enables government to manage departmental spending levels.
|
|
|
External imbalance
|
An excessively positive or negative current account balance, reflecting an excess or deficit of domestic investment over domestic savings.
|
|
|
Financial account (of the balance of payments)
|
A statement of all financial transactions between a country and the rest of the world, including portfolio and fixed investment flows, and movements in foreign reserves.
|
|
|
Financial and Fiscal Commission
|
An independent body established in terms of the Constitution to make recommendations to Parliament and provincial legislatures about financial issues affecting the three spheres of government.
|
|
76
|
GLOSSARY
|
|
Financial year
|
The 12 months according to which companies and organisations budget and account. Government’s financial year runs from 1 April to 31 March.
|
|
|
Fiscal consolidation
|
Measures to stabilise a government’s debt-to-GDP ratio and narrow its current account deficit.
|
|
|
Fiscal drag
|
The tendency of inflation and earnings growth to push taxpayers into higher tax brackets
|
|
|
Fiscal policy
|
Policy on taxation, spending and borrowing by government.
|
|
|
Fiscal space
|
The ability of a government’s budget to provide additional resources without jeopardising fiscal sustainability.
|
|
|
Flexible exchange rate
|
Determination of currency exchange rates by market forces.
|
|
|
Foreign direct investment
|
The acquisition of long-term business interests in another country, usually involving management, technology and financial participation.
|
|
|
Full-time equivalent
|
An indicator measuring the number of workers or students in a system or programme that includes a substantial number of part-time participants. It enables government to estimate costs by aggregating the amount of part-time work or study, and calculating their full-time equivalents.
|
|
|
GDP inflation
|
A measure of the total increase in prices in the whole economy. Unlike CPI inflation, GDP inflation includes price increases in goods that are exported and intermediate goods such as machines, but excludes imported goods.
|
|
|
Gold and foreign exchange account
|
A Reserve Bank account that reflects its losses and profits on holdings of foreign currency and gold reserves, driven by changes in the rand/$ exchange rate and the gold price.
|
|
|
Government guarantee
|
An assurance made by government to a lender that a financial obligation will be honoured, even if the borrowing government institution is unable to repay the debt.
|
|
|
Gross domestic product (GDP)
|
A measure of total national output, income and expenditure in the economy.
|
|
|
Gross fixed capital formation
|
The addition to a country’s fixed capital stock over a specific period, before provision for depreciation.
|
|
|
Headline inflation
|
A measure of the increase in price level that includes temporary price shocks to the economy, such as one-time price changes.
|
|
|
Integrated financial management system (IFMS) project
|
A project to review, upgrade and integrate government’s financial management information technology systems.
|
|
|
Independent power producer
|
A private-sector producer of power for the national grid.
|
|
|
Indirect grant
|
A grant allowing a national department to perform a function on behalf of a province or municipality. No funds are transferred, but the end-product of the grant, such as infrastructure built, is generally transferred to provincial or municipal ownership.
|
|
|
Inflation
|
An increase in the general level of prices.
|
|
77
|
2017 MEDIUM TERM BUDGET POLICY STATEMENT
|
|
Inflation targeting
|
A monetary policy framework intended to achieve price stability over a certain period of time. The Reserve Bank and government agree on a target rate or range of inflation to be maintained.
|
|
|
Labour force participation
|
The ratio of employed and unemployed workers (the labour force) relative to the working age population.
|
|
|
Main budget expenditure
|
National government expenditure and transfers to provincial and local government financed from the National Revenue Fund, excluding revenues and spending related to social security funds, extra-budgetary institutions and provincial own revenue. See also consolidated government expenditure.
|
|
|
Medium-term Expenditure Committee
|
The committee responsible for evaluating the budget submissions of national departments and recommending allocations.
|
|
|
Medium-term expenditure framework (MTEF)
|
The three-year spending plans of national and provincial governments published at the time of the Budget.
|
|
|
Medium-term strategic framework
|
The five-year strategy of government coinciding with the electoral term.
|
|
|
Monetary policy
|
The actions taken by a country’s monetary authority (e.g. the Reserve Bank), normally focused around money supply and interest rates.
|
|
|
Money supply
|
The total stock of money in an economy.
|
|
|
National budget
|
The projected revenue and expenditure flowing through the National Revenue Fund. It does not include spending by provinces or local government from their own revenues.
|
|
|
National Development Plan (NDP)
|
A national strategy to eliminate poverty and reduce inequality.
|
|
|
National Revenue Fund
|
The consolidated account of national government into which all taxes, fees and charges collected by the South African Revenue Service and departmental revenue must be paid.
|
|
|
Net asset position
|
The total value of a company’s assets minus its liabilities.
|
|
|
Nominal exchange rate
|
The current rate of exchange between the rand and foreign currencies.
|
|
|
Non-interest expenditure
|
Total expenditure by government less debt-service costs.
|
|
|
Primary deficit/surplus
|
The difference between total revenue and non-interest expenditure. When revenue exceeds non-interest expenditure there is a surplus.
|
|
|
Primary expenditure
|
Non-interest expenditure by government.
|
|
|
Primary sector
|
The agricultural and mining sectors of the economy.
|
|
|
Private-sector credit extension
|
Credit provided to the private sector by banks. This includes all loans, credit card balances and leases.
|
|
|
Productivity
|
A measure of the amount of output generated from every unit of input over a period of time. Typically used to measure changes in labour efficiency.
|
|
|
Protectionism
|
When a country restricts international trade to protect domestic industries.
|
|
|
Public entities
|
Companies, agencies, funds and accounts that are fully or partly owned by government or public authorities and regulated by law.
|
|
78
|
GLOSSARY
|
|
Public-private partnership (PPP)
|
A contractual arrangement in which a private party performs part of a government function and assumes the associated risks. In return, the private party receives a fee based on predefined performance criteria.
|
|
|
Public-sector borrowing requirement
|
The consolidated cash borrowing requirement of general government and non-financial public enterprises.
|
|
|
Purchasing managers’ index (PMI)
|
A composite index measuring the change in manufacturing activity compared with the previous month.
|
|
|
Rating agency
|
A company that evaluates the ability of countries or other borrowers to honour their debt obligations. Credit ratings are used by international investors as indications of sovereign risk. See also credit rating.
|
|
|
Real effective exchange rate
|
A measure of the rate of exchange of the rand relative to a trade-weighted average of South Africa’s trading partners’ currencies, adjusted for price trends.
|
|
|
Real expenditure
|
Expenditure measured in constant prices, i.e. after taking account of inflation.
|
|
|
Real interest rate
|
The level of interest after taking account of inflation.
|
|
|
Revaluation gain/loss
|
The difference between the value of a foreign currency deposit from the original (historical) rate to execution of a trade based on the spot rate.
|
|
|
Repurchase (repo) rate
|
The rate at which the Reserve Bank lends to commercial banks.
|
|
|
Reserves (foreign exchange)
|
Holdings of foreign exchange, either by the Reserve Bank only, or by the Reserve Bank and domestic banking institutions.
|
|
|
Rollover
|
Funds not spent during a given financial year that flow into the following year’s budget.
|
|
|
Seasonally adjusted and annualised
|
The process of removing the seasonal volatility (monthly or quarterly) from a time series. This provides a measure of the underlying trend in the data. Annualised: to express a rate as if it were applied over one year.
|
|
|
Social wage
|
Social benefits available to all individuals, funded wholly or partly by the state.
|
|
|
Southern African Customs Union (SACU) agreement
|
An agreement that allows for the unrestricted flow of goods and services, and a sharing of customs and excise revenue, between South Africa, Botswana, Lesotho, Namibia and Swaziland.
|
|
|
Southern African Development Community (SADC)
|
A regional intergovernmental organisation that promotes collaboration, economic integration and technical cooperation throughout Southern Africa.
|
|
|
Sovereign debt
|
Debt issued by a government.
|
|
|
Special economic zone
|
A designated area where infrastructure and incentives are provided to clusters of businesses to encourage private investment and employment growth.
|
|
|
Supply-side constraints
|
A situation where a country’s productive capacity cannot keep up with rising demand.
|
|
79
|
2017 MEDIUM TERM BUDGET POLICY STATEMENT
|
|
Switch (auction)
|
Auctions to exchange bonds to manage refinancing risk or improve tradability.
|
|
|
Tax buoyancy
|
The ratio of the growth of a revenue stream to the growth of its underlying tax base.
|
|
|
Terms of trade
|
An index measuring the ratio of export prices to import prices.
|
|
|
Trade balance
|
The monetary record of a country’s net imports and exports of physical merchandise. See also current account.
|
|
|
Transversal term contract
|
A fixed-term contract for the procurement of goods or services needed by more than one government department.
|
|
|
Treasury bills
|
Short-term government debt instruments that yield no interest but are issued at a discount. Maturities vary from one day to 12 months.
|
|
|
Twin deficit
|
A budget deficit in combination with a deficit on the current account.
|
|
|
Twin peaks
|
An approach to organising financial sector regulation and supervision involving two regulators. One is responsible for ensuring financial services firms sell their products in an appropriate way. The other is responsible for ensuring financial firms remain financially sound and are generally prudent.
|
|
|
Undercapitalisation
|
Lack of sufficient funds (capital) to conduct day-to-day operations.
|
|
|
Unit labour costs
|
The cost of labour per unit of output, calculated by dividing average wages by productivity (output per worker per hour).
|
|
|
Unsecured lending
|
A loan that is not backed or secured by any type of collateral to reduce the lender’s risk.
|
|
|
Yield
|
A financial return or interest paid to buyers of government bonds.
|
80