UNITED STATES
SECURITIES
AND EXCHANGE COMMISSION
Washington,
D.C. 20549
FORM
8-K
CURRENT
REPORT
Pursuant
to Section 13 OR 15(d) of the Securities Exchange Act of 1934
Date
of Report (Date of earliest event reported): October 22, 2014
POLARIS INDUSTRIES INC.
(Exact
name of Registrant as specified in its charter)
Minnesota |
1-11411 |
41-1790959 |
(State of Incorporation) |
(Commission File Number) |
(I.R.S. Employer Identification No.) |
2100 Highway 55
Medina, Minnesota 55340
(Address of
principal executive offices)
(Zip Code)
(763) 542-0500
(Registrant’s
telephone number, including area code)
Check the appropriate box below if the Form 8-K filing is intended to simultaneously satisfy the filing obligation of the registrant under any of the following provisions:
⃞ Written communications pursuant to Rule 425 under the Securities Act (17 CFR 230.425)
⃞ Soliciting material pursuant to Rule 14a-12 under the Exchange Act (17 CFR 240.14a-12)
⃞ Pre-commencement communications pursuant to Rule 14d-2(b) under the Exchange Act (17 CFR 240.14d-2(b))
⃞ Pre-commencement communications pursuant to Rule 13e-4(c) under the Exchange Act (17 CFR 240.13e-4(c))
Item 2.02 Results of Operations and Financial Condition.
On October 22, 2014, Polaris Industries Inc. (the “Company”) issued a press release announcing the Company’s third quarter 2014 financial results for the reporting period ended September 30, 2014. On October 22, 2014, the Company also hosted its quarterly earnings conference call, which was accessible to the public. A recording of the conference call will be available through the end of the business day on November 5, 2014 by dialing 855-859-2056 in the U.S. and Canada, or 404-537-3406 for international calls and entering passcode 24525990, and on the Company’s website, www.polaris.com/irhome.
A copy of the Company’s press release is furnished as Exhibit 99.1
attached hereto and a copy of the presentation materials discussed
during the conference call is being furnished as Exhibit 99.2 to this
Current Report on Form 8-K.
Item 7.01 Regulation FD Disclosure.
The disclosures set forth in Item 2.02 above are hereby incorporated by reference into this Item 7.01.
Item 9.01 Financial Statements and Exhibits.
(d) Exhibits.
99.1 | Press Release dated October 22, 2014 of Polaris Industries Inc. | |
99.2 | Presentation materials dated October 22, 2014 of Polaris Industries Inc. |
The information contained in this Current Report is furnished and not deemed to be filed for purposes of Section 18 of the Securities and Exchange Act of 1934, as amended, or otherwise subject to the liabilities of that section. The information in this Current Report shall not be incorporated by reference into any filing or other document pursuant to the Securities Act of 1933, as amended, except as shall be expressly set forth by specific reference in such filing or document.
SIGNATURES
Pursuant to
the requirements of the Securities Exchange Act of 1934, the registrant
has duly caused this report to be signed on its behalf by the
undersigned thereunto duly authorized.
Date: |
October 22, 2014 |
|
POLARIS INDUSTRIES INC. | ||
/s/ Michael W. Malone |
||
Michael W. Malone |
||
Vice President – Finance and |
||
Chief Financial Officer of Polaris Industries Inc. |
EXHIBIT INDEX
Exhibit Number |
Description |
|
99.1 |
Press Release dated October 22, 2014 of Polaris Industries Inc. |
|
99.2 |
Presentation materials dated October 22, 2014 of Polaris Industries Inc. |
Exhibit 99.1
Polaris Reports Record Third Quarter 2014 Results; EPS from Continuing Operations Increased 26% to $2.06 on 18% Sales Growth
Company increases full year 2014 EPS guidance
Third Quarter Highlights:
MINNEAPOLIS--(BUSINESS WIRE)--October 22, 2014--Polaris Industries Inc. (NYSE:PII) today reported record third quarter net income from continuing operations of $140.8 million for the quarter ended September 30, 2014, an increase of 20 percent from the prior year’s third quarter net income from continuing operations of $116.9 million. Earnings per share from continuing operations was also a record at $2.06 per diluted share for the 2014 third quarter, up 26 percent from the prior year’s third quarter of $1.64 per diluted share from continuing operations. Sales for the third quarter 2014 totaled a record $1,302.3 million, an increase of 18 percent over last year’s third quarter sales of $1,102.6 million.
“Our strong third quarter results reflect the continued execution of our long-term strategy and broad strength across our industry-leading portfolio,” commented Scott Wine, Polaris’ Chairman and Chief Executive Officer. “Amid heightened competition we garnered strong retail sales in all categories, even as we introduced more than 20 new off-road vehicles and motorcycles and over 300 new complementary accessories for our consumers.”
Wine continued, “Along with industry-leading innovation, we remain focused on improving our operations as part of our evolution into a highly profitable, customer-centric global Lean enterprise. We recently made significant progress toward this goal with the hiring of Ken Pucel to fill the newly formed position of Executive Vice President of Operations, Engineering and Lean. This move was preceded by the grand opening of our manufacturing facility in Poland, which will provide a timely capacity increase, enable us to deliver superior customer service, and ultimately serve as a growth catalyst in the EMEA region. These initiatives are important pieces of the infrastructure we are creating to support our continued growth toward becoming an $8.0 billion company.”
2014 Business Outlook
For the full year 2014, the Company is increasing its guidance and now expects earnings from continuing operations to be in the range of $6.55 to $6.65 per diluted share, an increase of 21 percent to 23 percent over full year 2013 earnings from continuing operations of $5.40 per diluted share. Full year 2014 sales are expected to grow in the range of 17 percent to 18 percent when compared to 2013.
Third Quarter Performance Summary (in thousands except per share data) |
||||||||||||||||||||||
Three Months ended September 30, |
Nine Months ended September 30, |
|||||||||||||||||||||
Product line sales |
2014 |
2013 |
Change |
2014 |
2013 |
Change |
||||||||||||||||
Off-Road Vehicles | $ | 823,214 | $ | 702,013 | 17 | % | $ | 2,127,520 | $ | 1,862,508 | 14 | % | ||||||||||
Snowmobiles | 162,652 | 143,550 | 13 | % | 184,379 | 166,725 | 11 | % | ||||||||||||||
Motorcycles | 63,263 | 49,372 | 28 | % | 245,258 | 151,041 | 62 | % | ||||||||||||||
Small Vehicles | 34,158 | 31,716 | 8 | % | 116,166 | 76,489 | 52 | % | ||||||||||||||
Parts, Garments & Accessories | 219,056 | 175,998 | 24 | % | 531,325 | 436,595 | 22 | % | ||||||||||||||
Total Sales |
$ | 1,302,343 | $ | 1,102,649 | +18 | % | $ | 3,204,648 | $ | 2,693,358 | +19 | % | ||||||||||
Gross profit |
$ | 388,274 | $ | 334,785 | +16 | % | $ | 951,605 | 803,771 |
+18 |
% |
|||||||||||
Gross profit as a % of sales | 29.8 | % | 30.4 | % | -55 bps | 29.7 | % | 29.8 | % | -15 bps | ||||||||||||
Operating expenses |
$ | 182,749 | $ | 165,163 | +11 | % | $ | 489,228 | $ | 428,202 | +14 | % | ||||||||||
Operating expenses as a % of sales | 14.0 | % | 15.0 | % | -95 bps | 15.3 | % | 15.9 | % | -63 bps | ||||||||||||
Operating income |
$ | 222,573 | $ | 181,293 | ±23% | $ | 504,690 | $ | 408,816 |
+23 |
% |
|||||||||||
Operating income as a % of sales | 17.1 | % | 16.4 | % | +65 bps | 15.7 | % | 15.2 | % | +57 bps | ||||||||||||
Net income from continuing operations |
$ | 140,826 | $ | 116,921 | +20 | % | $ | 318,632 | $ | 272,389 | +17 | % | ||||||||||
Net income from continuing operations as a % of sales | 10.8 | % | 10.6 | % | +21 bps | 9.9 | % | 10.1 | % | -17 bps | ||||||||||||
Diluted net income per share from continuing operations |
$ | 2.06 | $ | 1.64 | +26 | % | $ | 4.68 | $ | 3.84 | +22 | % | ||||||||||
Off-Road Vehicle (“ORV”) sales in the third quarter of 2014 increased 17 percent from the third quarter 2013 to $823.2 million. This increase is the result of strong demand for both ATV and side-by-side vehicles along with continued market share gains. Polaris’ North American ORV unit retail sales increased high-single digits percent notwithstanding the strong low-teens percent increase realized in the third quarter of last year. Consumer purchases of Polaris side-by-side vehicles climbed double digits percent during the 2014 third quarter while ATV retail sales were down slightly during the quarter. The Sportsman ACE™ product category continued to receive heightened consumer interest during the quarter. The Company estimates that North American industry ORV retail sales increased mid-single-digits percent from the third quarter of 2013 with side-by-sides up about ten percent and ATVs down low-single digits percent. As expected, North American Polaris ORV dealer inventories were up mid-teens percent from the third quarter of 2013 as the Company began shipping most of the 18 new model year 2015 products recently introduced. Sales of Polaris ORVs outside of North America increased 18 percent in the third quarter of 2014 as compared to the year-ago period driven by continued market share gains in both side-by-side vehicles and ATVs.
Snowmobile sales increased 13 percent to $162.7 million for third quarter of 2014 as compared to $143.6 million in the third quarter of 2013. The increase is due to a higher number of snowmobiles shipped in the 2014 third quarter in preparation for the upcoming selling season as dealer snowmobile inventories are low coming off good snowfall and colder weather in most of the North American snowbelt this past snowmobile riding season. While less than ten percent of the snowmobile retail selling season has occurred, year-to-date industry retail sales in North America for the season ending March 2015 are up over 30 percent. This early season performance is largely driven by Polaris' retail performance of up well over 50 percent for the year-to-date season, due to high early season sales of our model year 2015 snowmobiles with the new Axys™ chassis. Sales of snowmobiles outside of North America decreased 29 percent in the third quarter of 2014 compared to a year ago due to poor snowfall in the previous riding season.
Sales for the Motorcycles division increased 28 percent to $63.3 million in the 2014 third quarter compared to the same period last year due to continued strong demand for the new Indian motorcycles. Consumer retail demand for Polaris motorcycles, driven by Indian Motorcycle retail sales, were up nearly 30 percent during the 2014 third quarter, while third quarter North American industry heavyweight cruiser and touring motorcycle retail sales were up low-single digits percent versus the 2013 third quarter. During the quarter, the Company added two new models to the 2015 Indian Motorcycle line-up with the addition of the Roadmaster®, a luxury touring motorcycle, and the return of the Scout®, one of motorcycling’s most famous and coveted mid-sized motorcycles. In addition, two-tone paint schemes were added for the three Indian Chief models introduced last year. Victory motorcycles retail sales in the 2014 third quarter were down mid-teens percent impacted by timing delays of shipments of the 2015 Victory Magnum, a new custom bagger, and the prior year’s tough comparison as Victory retail sales were up over 30 percent in the 2013 third quarter. Sales of Polaris motorcycles outside of North America were up over 80 percent in the third quarter of 2014 as compared to the year-ago period driven by strong demand for Indian motorcycles.
Sales of the Small Vehicles division in the third quarter of 2014 increased eight percent to $34.2 million compared to the third quarter of 2013. Both GEM and Aixam Mega experienced increased sales during the 2014 third quarter compared to the same period last year. Goupil sales decreased during the 2014 third quarter due to the soft European economy, particularly in France, and its impact on business and government sales.
Parts, Garments, and Accessories (“PG&A”) sales increased 24 percent to $219.1 million during the third quarter of 2014 as compared to the same period last year. ORV, motorcycles and snowmobile related PG&A experienced sales growth during the quarter. Sales of PG&A to customers outside of North America increased eight percent during the 2014 third quarter compared to the same period last year. Innovation remains a driving factor in delivering continued growth with over 300 new model year 2015 accessories added to the PG&A product line-up. Additionally, the accessory dollars sold per unit has increased compared to this time last year driven by customer focused solutions like the PRO-FIT storage systems for snowmobiles and additional Lock and Ride® accessories for ORVs and motorcycles.
International sales totaled $151.6 million for the 2014 third quarter, a nine percent increase over the same period in 2013. The increase in third quarter sales resulted from strong sales growth in ORV and Motorcycles, offset somewhat by lower snowmobile shipments due to the poor snowfall last winter in the Scandinavian and Russian regions. Asia Pacific sales for the third quarter of 2014 were up 37 percent and Latin America sales increased 48 percent while Europe, Middle East and Africa (“EMEA”) sales were about flat in spite of the weak Euro and lower snowmobiles sales. Both ORV and motorcycles gained retail market share outside of North America during the 2014 third quarter.
Gross profit increased 16 percent to $388.3 million compared to $334.8 million in the third quarter of 2013. As a percentage of sales, gross profit margin decreased 55 basis points to 29.8 percent of sales for the third quarter of 2014, compared to 30.4 percent of sales for the same period last year. The gross margin percentage declined during the quarter, as expected, due principally to pressures from negative currency movements, offset somewhat by the benefit of lower product costs and higher pricing.
Operating expenses for the third quarter of 2014 declined 95 basis points, as a percentage of sales, to 14.0 percent compared to 15.0 percent of sales in the 2013 third quarter. Operating expenses in dollars increased 11 percent to $182.7 million in the 2014 third quarter compared to $165.2 million for the third quarter of 2013. Operating expenses as a percent of sales for the 2014 third quarter declined due to lower long-term incentive compensation expenses partially offset by higher marketing and advertising expenses related to the launch of various new model year 2015 products and the continued roll-out of Indian Motorcycle.
Income from financial services increased 46 percent to $17.0 million during the third quarter of 2014 compared to $11.7 million in the third quarter of 2013, due to higher income from Polaris Acceptance’s dealer inventory financing as well as increased profitability of the retail credit portfolio.
Equity in loss of other affiliates was $1.0 million for the third quarter of 2014 compared to $0.6 million in the third quarter last year, which represents the Company’s portion of the start-up costs related to the Polaris/Eicher joint venture in India established in 2012.
Non-operating other expense (income), which primarily relates to foreign currency exchange rate movements and the corresponding effects on foreign currency transactions related to the Company’s foreign subsidiaries, was $0.3 million of expense in the third quarter of 2014 compared to $2.6 million of income in the third quarter of 2013.
The provision for income taxes for the third quarter of 2014 was $77.6 million or 35.5 percent of pretax income compared to $64.8 million or 35.7 percent of pretax income for the third quarter 2013. The income tax provision for the third quarter of 2014 was negatively impacted from the United States Congress not yet extending the research and development income tax credit for 2014, offset by net tax benefits related to finalizing the United States federal tax return for calendar year 2013.
The weighted average diluted shares outstanding for the third quarter of 2014 decreased four percent to 68.3 million shares compared to 71.2 million shares in the third quarter of last year. The decrease in the weighted average diluted shares outstanding is primarily due to the Company’s purchase of 3.96 million shares of Polaris stock previously held by FHI Heavy Industries Ltd. (“Fuji”) in November 2013.
Loss from Discontinued Operations in the Third Quarter of 2013
In the third quarter of 2013 Polaris recorded a non-recurring loss from discontinued operations of $3.8 million, net of tax, or $0.05 per diluted share resulting from a jury verdict in connection with a personal watercraft accident. Reported net income for the third quarter of 2013, including both continuing and discontinued operations, was $113.1 million, or $1.59 per diluted share. The Company ceased manufacturing marine products in September 2004 and substantially completed the exit of the business in 2007.
Financial Position and Cash Flow
Net cash provided by operating activities from continuing operations was $380.4 million for the year-to-date period ended September 30, 2014, approximately flat with the net cash provided by operating activities from continuing operations for the first nine months of 2013 of $381.8 million. Higher net income for the 2014 year-to-date period was offset primarily by higher factory inventory to support the new manufacturing plant in Poland and increased demand for Polaris products, and timing of estimated income tax payments. Total debt, including capital lease obligations, at the end of the third quarter of 2014 was $228.0 million. The Company’s debt-to-total-capital ratio increased to 22 percent at September 30, 2014 compared to ten percent at September 30, 2013 due to the significant share repurchase transaction completed in November of 2013. Cash and cash equivalents were $169.0 million at September 30, 2014 compared to $387.8 million at September 30, 2013.
Conference Call and Webcast Presentation
Today at 8:00 AM central time Polaris Industries Inc. will host a conference call and webcast to discuss Polaris’ 2014 third quarter earnings results released this morning. The call will be hosted by Scott Wine, Chairman and CEO, Bennett Morgan, President and COO, and Mike Malone, Vice President―Finance and CFO. A slide presentation and link to the audio webcast will be posted on the Investor Relations page of the Polaris web site at www.polaris.com/irhome.
To listen to the conference call by phone, dial 877-706-7543 in the U.S. and Canada, or 973-200-3967 internationally. The Conference ID is # 24525990.
A replay of the conference call will be available approximately two hours after the call for a one-week period by accessing the same link on our website, or by dialing 855-859-2056 in the U.S. and Canada, or 404-537-3406 internationally.
About Polaris
Polaris is a recognized leader in the powersports industry with annual 2013 sales of $3.8 billion. Polaris designs, engineers, manufactures and markets innovative, high quality off-road vehicles, including all-terrain vehicles (ATVs) and the Polaris RANGER® and RZR® side-by-side vehicles, snowmobiles, motorcycles and on-road electric/hybrid powered vehicles.
Polaris is among the global sales leaders for both snowmobiles and off-road vehicles and has established a presence in the heavyweight cruiser and touring motorcycle market with the Victory, Indian Motorcycle and Slingshot brands. Additionally, Polaris continues to invest in the global on-road small electric/hybrid powered vehicle industry with Global Electric Motorcars (GEM), Goupil Industrie SA, Aixam Mega S.A.S., and internally developed vehicles. Polaris enhances the riding experience with a complete line of Polaris Engineered Parts, Accessories and Apparel, Klim branded apparel and ORV accessories under the Kolpin and Cycle Country brands.
Polaris Industries Inc. trades on the New York Stock Exchange under the symbol “PII”, and the Company is included in the S&P Mid-Cap 400 stock price index.
Information about the complete line of Polaris products, apparel and vehicle accessories are available from authorized Polaris dealers or anytime at www.polaris.com.
Except for historical information contained herein, the matters set forth in this news release, including management’s expectations regarding 2014 sales, shipments, net income, and net income per share are forward-looking statements that involve certain risks and uncertainties that could cause actual results to differ materially from those forward-looking statements. Potential risks and uncertainties include such factors as the Company’s ability to successfully implement its manufacturing operations realignment initiatives, product offerings, promotional activities and pricing strategies by competitors; acquisition integration costs; warranty expenses; foreign currency exchange rate fluctuations; environmental and product safety regulatory activity; effects of weather; commodity costs; uninsured product liability claims; uncertainty in the retail and wholesale credit markets; performance of affiliate partners; changes in tax policy and overall economic conditions, including inflation, consumer confidence and spending and relationships with dealers and suppliers. Investors are also directed to consider other risks and uncertainties discussed in documents filed by the Company with the Securities and Exchange Commission. The Company does not undertake any duty to any person to provide updates to its forward-looking statements.
(summarized financial data follows)
POLARIS INDUSTRIES INC. |
||||||||||||||||
CONSOLIDATED STATEMENTS OF INCOME |
||||||||||||||||
(In Thousands, Except Per Share Data) |
||||||||||||||||
(Unaudited) | ||||||||||||||||
Three months ended September 30, | Nine months ended September 30, | |||||||||||||||
2014 | 2013 | 2014 | 2013 | |||||||||||||
Sales | $ | 1,302,343 | $ | 1,102,649 | $ | 3,204,648 | $ | 2,693,358 | ||||||||
Cost of sales | 914,069 | 767,864 | 2,253,043 | 1,889,587 | ||||||||||||
Gross profit | 388,274 | 334,785 | 951,605 | 803,771 | ||||||||||||
Operating expenses: | ||||||||||||||||
Selling and marketing | 87,567 | 78,810 | 227,315 | 195,541 | ||||||||||||
Research and development | 38,586 | 37,010 | 111,083 | 103,064 | ||||||||||||
General and administrative | 56,596 | 49,343 | 150,830 | 129,597 | ||||||||||||
Total operating expenses | 182,749 | 165,163 | 489,228 | 428,202 | ||||||||||||
Income from financial services | 17,048 | 11,671 | 42,313 | 33,247 | ||||||||||||
Operating income | 222,573 | 181,293 | 504,690 | 408,816 | ||||||||||||
Non-operating expense (income): | ||||||||||||||||
Interest expense | 2,835 | 1,520 | 8,686 | 4,364 | ||||||||||||
Equity in loss of other affiliates | 1,036 | 631 | 2,899 | 1,629 | ||||||||||||
Other expense (income), net | 252 | (2,576 | ) | (3,736 | ) | (6,274 | ) | |||||||||
Income before income taxes | 218,450 | 181,718 | 496,841 | 409,097 | ||||||||||||
Provision for income taxes | 77,624 | 64,797 | 178,209 | 136,708 | ||||||||||||
Net income from continuing operations | 140,826 | 116,921 | 318,632 | 272,389 | ||||||||||||
Loss from discontinued operations, net of tax | — | (3,777 | ) | — | (3,777 | ) | ||||||||||
Net income | $ | 140,826 | $ | 113,144 | $ | 318,632 | $ | 268,612 | ||||||||
Basic net income per share: | ||||||||||||||||
Continuing operations | $ | 2.13 | $ | 1.69 | $ | 4.82 | $ | 3.95 | ||||||||
Loss from discontinued operations | — | (0.05 | ) | — | (0.05 | ) | ||||||||||
Basic net income per share | $ | 2.13 | $ | 1.64 | $ | 4.82 | $ | 3.90 | ||||||||
Diluted net income per share: | ||||||||||||||||
Continuing operations | $ | 2.06 | $ | 1.64 | $ | 4.68 | $ | 3.84 | ||||||||
Loss from discontinued operations | — | (0.05 | ) | — | (0.05 | ) | ||||||||||
Diluted net income per share | $ | 2.06 | $ | 1.59 | $ | 4.68 | $ | 3.79 | ||||||||
Weighted average shares outstanding: | ||||||||||||||||
Basic | 66,261 | 69,179 | 66,051 | 68,946 | ||||||||||||
Diluted | 68,328 | 71,186 | 68,125 | 70,901 | ||||||||||||
POLARIS INDUSTRIES INC. | ||||||
CONSOLIDATED BALANCE SHEETS | ||||||
(In Thousands) | ||||||
(Unaudited) | ||||||
Subject to Reclassification | September 30, 2014 | September 30, 2013 | ||||
Assets | ||||||
Current Assets: | ||||||
Cash and cash equivalents | $ | 169,018 | $ | 387,804 | ||
Trade receivables, net | 153,839 | 157,015 | ||||
Inventories, net | 582,193 | 460,592 | ||||
Prepaid expenses and other | 61,780 | 56,450 | ||||
Income taxes receivable | 20,423 | 15,657 | ||||
Deferred tax assets | 93,312 | 84,986 | ||||
Total current assets | 1,080,565 | 1,162,504 | ||||
Property and equipment, net | 538,031 | 420,328 | ||||
Investment in finance affiliate | 71,515 | 58,338 | ||||
Investment in other affiliates | 21,502 | 16,775 | ||||
Deferred tax assets | 25,096 | 33,500 | ||||
Goodwill and other intangible assets, net | 224,443 | 227,889 | ||||
Other long-term assets | 47,680 | 29,832 | ||||
Total assets | $ | 2,008,832 | $ | 1,949,166 | ||
Liabilities and Shareholders' Equity | ||||||
Current Liabilities: | ||||||
Current portion of capital lease obligations | $ | 2,809 | $ | 3,318 | ||
Accounts payable | 340,606 | 280,284 | ||||
Accrued expenses: | ||||||
Compensation | 96,055 | 129,311 | ||||
Warranties | 51,394 | 48,102 | ||||
Sales promotions and incentives | 142,195 | 120,004 | ||||
Dealer holdback | 111,259 | 94,142 | ||||
Other | 77,765 | 87,810 | ||||
Income taxes payable | 3,219 | 43,765 | ||||
Current liabilities of discontinued operations | — | 10,000 | ||||
Total current liabilities | 825,302 | 816,736 | ||||
Long term income taxes payable | 12,928 | 14,443 | ||||
Capital lease obligations | 25,214 | 3,904 | ||||
Long-term debt | 200,000 | 100,000 | ||||
Deferred tax liabilities | 21,100 | 25,947 | ||||
Other long-term liabilities | 85,246 | 56,454 | ||||
Total liabilities | $ | 1,169,790 | $ | 1,017,484 | ||
Deferred compensation | 16,340 | — | ||||
Shareholders’ equity: | ||||||
Total shareholders’ equity | 822,702 | 931,682 | ||||
Total liabilities and shareholders’ equity | $ | 2,008,832 | $ | 1,949,166 | ||
Certain reclassifications of previously reported balance sheet amounts have been made to conform to the current year presentation | ||||||
POLARIS INDUSTRIES INC. | ||||||||
CONSOLIDATED STATEMENTS OF CASH FLOWS | ||||||||
(In Thousands) | ||||||||
(Unaudited) | ||||||||
Subject to Reclassification | Nine months ended September 30, | |||||||
2014 | 2013 | |||||||
Operating Activities: | ||||||||
Net income | $ | 318,632 | $ | 268,612 | ||||
Loss from discontinued operations | — | 3,777 | ||||||
Adjustments to reconcile net income to net cash provided by operating activities: | ||||||||
Depreciation and amortization | 91,041 | 64,364 | ||||||
Noncash compensation | 47,207 | 46,304 | ||||||
Noncash income from financial services | (10,778 | ) | (3,440 | ) | ||||
Noncash loss from other affiliates | 2,899 | 1,629 | ||||||
Deferred income taxes | (10,915 | ) | (10,781 | ) | ||||
Tax effect of share-based compensation exercises | (26,169 | ) | (22,247 | ) | ||||
Changes in operating assets and liabilities: | ||||||||
Trade receivables | 30,479 | (24,711 | ) | |||||
Inventories | (168,727 | ) | (94,110 | ) | ||||
Accounts payable | 102,216 | 94,097 | ||||||
Accrued expenses | 139 | 20,671 | ||||||
Income taxes payable/receivable | 11,110 | 62,332 | ||||||
Prepaid expenses and others, net | (6,699 | ) | (24,690 | ) | ||||
Cash provided by continuing operations | 380,435 | 381,807 | ||||||
Cash used for discontinued operations | — | (642 | ) | |||||
Net cash provided by operating activities | 380,435 | 381,165 | ||||||
Investing Activities: | ||||||||
Purchase of property and equipment | (146,473 | ) | (192,350 | ) | ||||
Investment in finance affiliate, net | 8,480 | 2,091 | ||||||
Investment in other affiliates | (8,316 | ) | (6,063 | ) | ||||
Acquisition of businesses, net of cash acquired | (17,199 | ) | (134,817 | ) | ||||
Net cash used for investing activities | (163,508 | ) | (331,139 | ) | ||||
Financing Activities: | ||||||||
Borrowings under debt arrangements | 1,921,386 | 1,682 | ||||||
Repayments under debt arrangements and capital lease obligations | (2,003,422 | ) | (2,780 | ) | ||||
Repurchase and retirement of common shares | (3,970 | ) | (31,907 | ) | ||||
Cash dividends to shareholders | (95,004 | ) | (86,482 | ) | ||||
Proceeds from stock issuances under employee plans | 22,970 | 17,834 | ||||||
Tax effect of proceeds from share-based compensation exercises | 26,169 | 22,247 | ||||||
Net cash used for financing activities | (131,871 | ) | (79,406 | ) | ||||
Impact of currency exchange rates on cash balances | (8,286 | ) | 169 | |||||
Net increase (decrease) in cash and cash equivalents | 76,770 | (29,211 | ) | |||||
Cash and cash equivalents at beginning of period | 92,248 | 417,015 | ||||||
Cash and cash equivalents at end of period | $ | 169,018 | $ | 387,804 | ||||
CONTACT:
Polaris Industries Inc.
Richard Edwards, 763-542-0500
Exhibit 99.2
Third Quarter 2014 Earnings Results October 22, 2014 POLARIS INDUSTRIES INC.Relentless MAKING OUR POWERFUL POTFOLIO EVEN STRONGER
Except for historical information contained herein, the matters set forth in this document, including but not limited to management’s expectations regarding 2014 and 2015 sales, shipments, margins, netincome and cash flow, the trend toward producing more of the Company’s own engines for its vehicles,the opportunities for expansion and diversification of the Company’s business, the impact of therepurchase of shares on the Company’s full year 2014 earnings per share and the Company’s guidanceon earnings per share from continuing operations are forward-looking statements that involve certain risks and uncertainties that could cause actual results to differ materially from those forward-looking statements. Potential risks and uncertainties include such factors as product offerings, promotional activities and pricing strategies by competitors; manufacturing operation initiatives; acquisition integration costs; warranty expenses; foreign currency exchange rate fluctuations; environmental and product safety regulatory activity; effects of weather; commodity costs; uninsured product liability claims; uncertainty in the retail and wholesale credit markets; performance of affiliate partners; changes in tax policy and overall economic conditions, including inflation, consumer confidence and spending and relationships with dealers and suppliers. Investors are also directed to consider other risks and uncertainties discussed in our 2013 annual report and Form 10-K filed by the Company with the Securities and Exchange Commission. The Company does not undertake any duty to any person to provide updates to its forward-looking statements.The data source for retail sales figures included in this presentation is registration information provided by Polaris dealers in North America and compiled by the Company or Company estimates. The Company must rely on information that its dealers supply concerning retail sales, and other retail sales data sources and this information is subject to revision. Q3-2014 2
Scott W. Wine Chairman & CEO Third Quarter 2014 Earnings Results October 22, 2014 POLARIS INDUSTRIES INC.
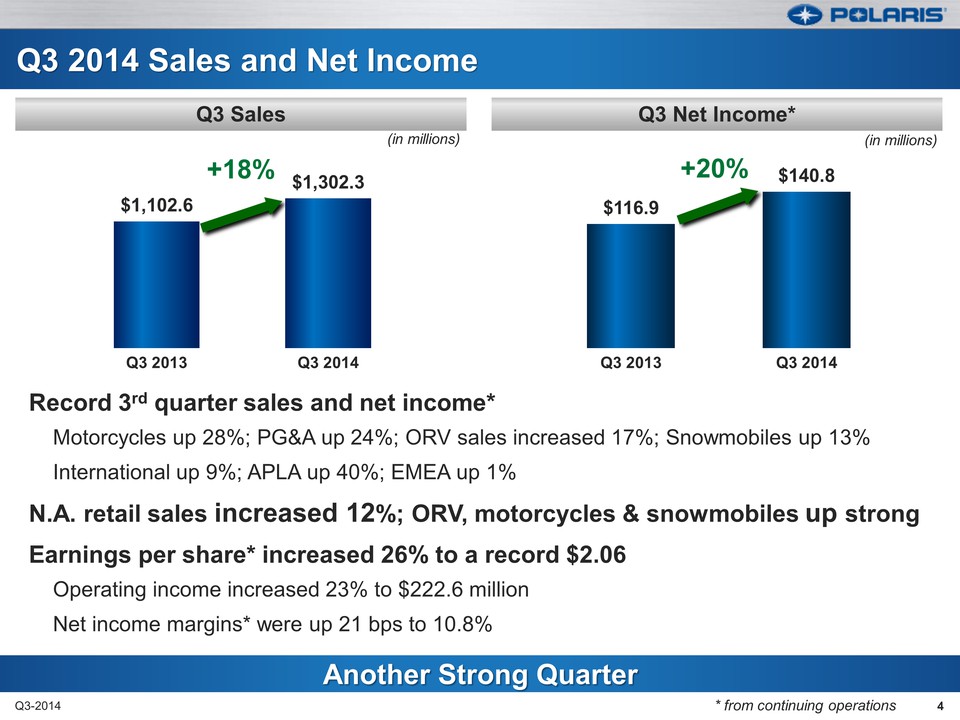
$116.9 $140.8 Q3 2013 Q3 2014 Q3 2014 Sales and Net Income Record 3rd quarter sales and net income* Motorcycles up 28%; PG&A up 24%; ORV sales increased 17%; Snowmobiles up 13% International up 9%; APLA up 40%; EMEA up 1% N.A. retail sales increased 12%; ORV, motorcycles & snowmobiles up strong Earnings per share* increased 26% to a record $2.06 Operating income increased 23% to $222.6 million Net income margins* were up 21 bps to 10.8% $1,102.6 $1,302.3 Q3 2013 Q3 2014 Another Strong Quarter Q3 Net Income* Q3 Sales (in millions) (in millions) +20% +18% Q3-2014 4 * from continuing operations 4
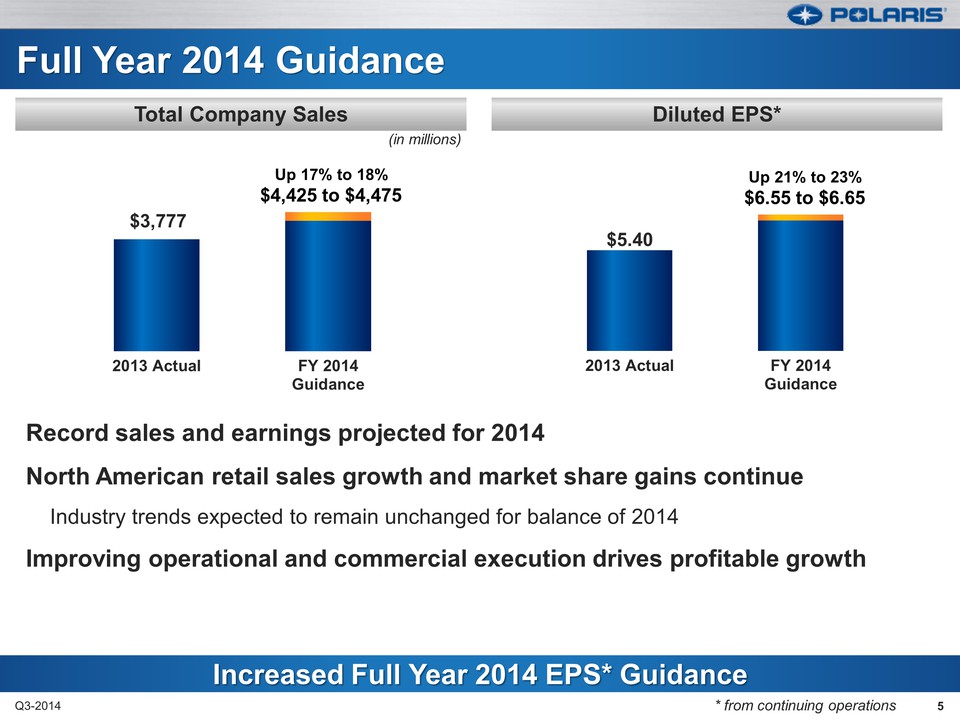
Full Year 2014 Guidance Record sales and earnings projected for 2014 North American retail sales growth and market share gains continue Industry trends expected to remain unchanged for balance of 2014 Improving operational and commercial execution drives profitable growth 5 Q3-2014 $3,777 2013 Actual FY 2014 Guidance $5.40 2013 Actual FY 2014 Guidance Increased Full Year 2014 EPS* Guidance Diluted EPS* Total Company Sales Up 17% to 18% $4,425 to $4,475 Up 21% to 23% $6.55 to $6.65 (in millions) * from continuing operations 5
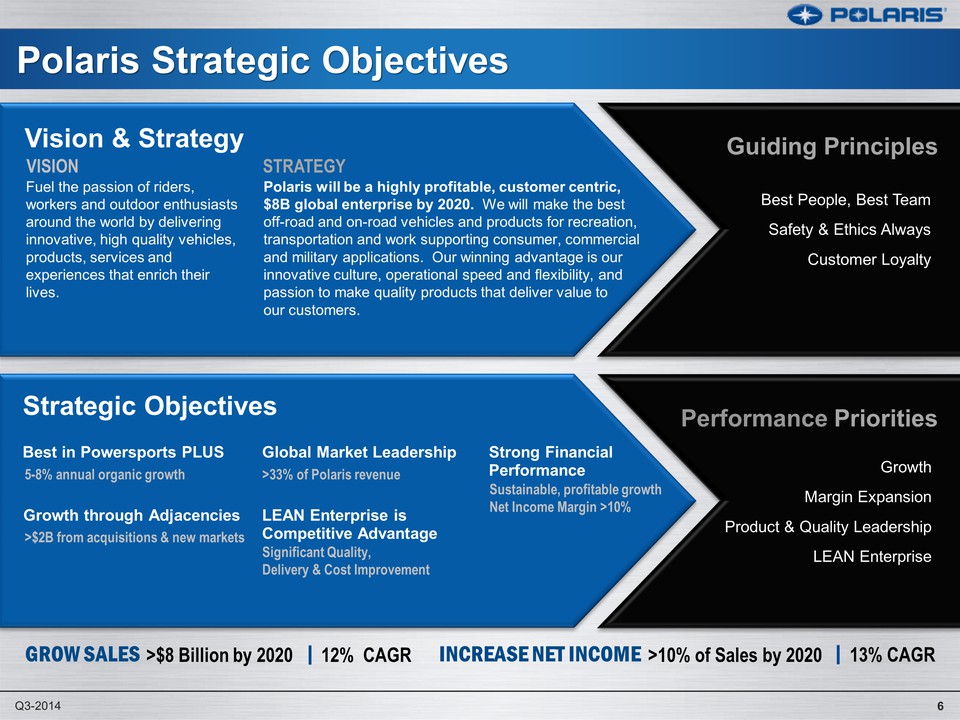
Polaris Strategic Objectives Vision & Strategy VISION STRATEGY Fuel the passion of riders, workers and outdoor enthusiasts around the world by delivering innovative, high quality vehicles, products, services and experiences that enrich their lives. Polaris will be a highly profitable, customer centric, $8B global enterprise by 2020. We will make the best off-road and on-road vehicles and products for recreation, transportation and work supporting consumer, commercial and military applications. Our winning advantage is our innovative culture, operational speed and flexibility, and passion to make quality products that deliver value to our customers. Strategic Objectives Best in Powersports PLUS Global Market Leadership Strong Financial Performance Growth through Adjacencies LEAN Enterprise is Competitive Advantage 5-8% annual organic growth >33% of Polaris revenue $2B from acquisitions & new markets Significant Quality, Delivery & Cost Improvement Sustainable, profitable growth Net Income Margin >10% Guiding Principles Performance Priorities Best People, Best Team Safety & Ethics AlwaysCustomer Loyalty Growth Margin Expansion Product & Quality Leadership LEAN Enterprise GROW SALES >$8 Billion by 2020 12% CAGR INCREASE NET INCOME >10% of Sales by 2020 13% CAG Q3-2014 6
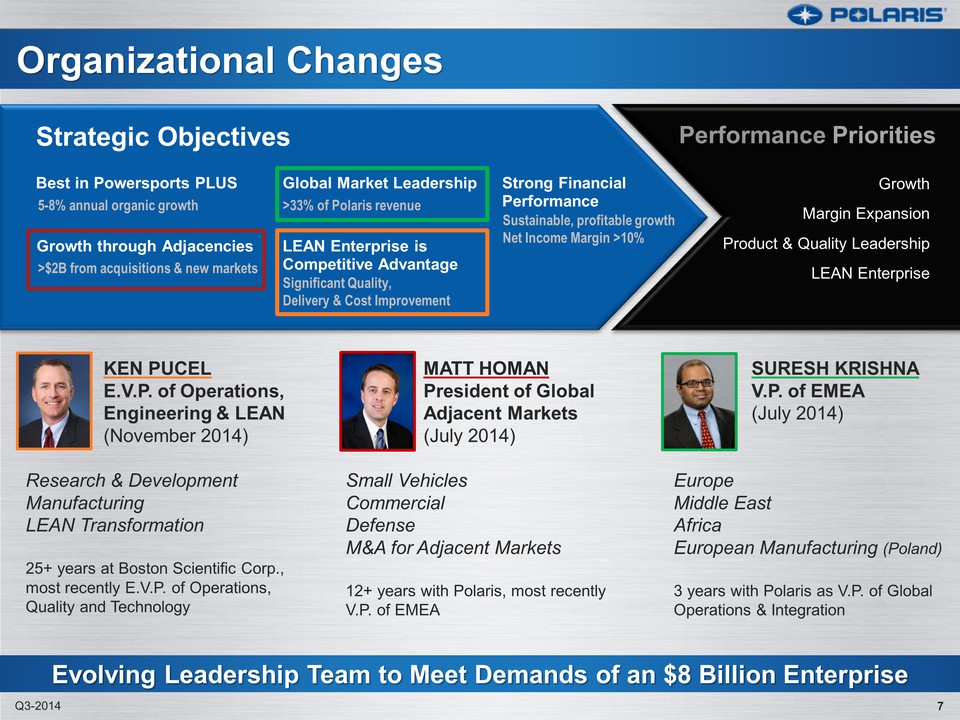
Evolving Leadership Team to Meet Demands of an $8 Billion Enterprise 7 Organizational Changes Q3-2014 MATT HOMAN President of Global Adjacent Markets (July 2014) Small Vehicles Commercial Defense M&A for Adjacent Markets 12+ years with Polaris, most recently V.P. of EMEA SURESH KRISHNA V.P. of EMEA (July 2014) Europe Middle East Africa European Manufacturing (Poland) 3 years with Polaris as V.P. of Global Operations & Integration KEN PUCEL E.V.P. of Operations, Engineering & LEAN (November 2014) Research & Development Manufacturing LEAN Transformation 25+ years at Boston Scientific Corp., most recently E.V.P. of Operations, Quality and Technology Strategic Objectives Best in Powersports PLUS Global Market Leadership Strong Financial Performance Growth through Adjacencies LEAN Enterprise is Competitive Advantage 5-8% annual organic growth >33% of Polaris revenue $2B from acquisitions & new markets Significant Quality, Delivery & Cost Improvement Sustainable, profitable growth Net Income Margin >10% MPerformance Priorities Growth Margin Expansion Product & Quality Leadership LEAN Enterprise 7
Bennett Morgan President & COO Third Quarter 2014 Earnings Results October 22, 2014 POLARIS INDUSTRIES INC.
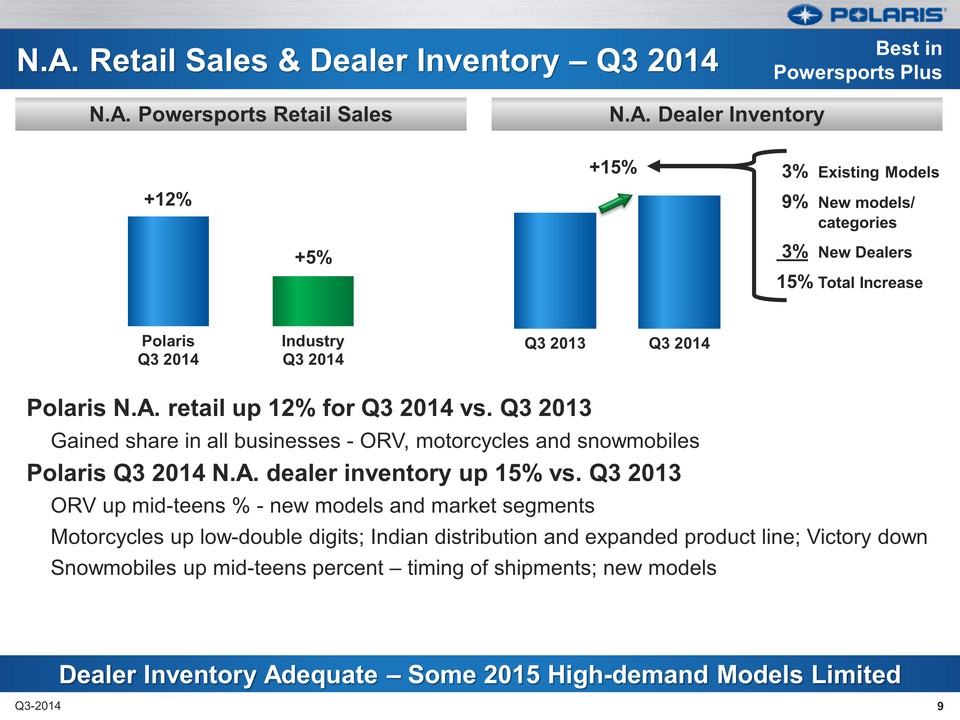
Q3 2013 Q3 2014 3% Existing Models 9% New models/ categories 3% New Dealers 15% Total Increase Polaris Q3 2014 Industry Q3 2014 N.A. Retail Sales & Dealer Inventory – Q3 2014 Dealer Inventory Adequate – Some 2015 High-demand Models Limited N.A. Dealer Inventory N.A. Powersports Retail Sales Best in Powersports Plus Polaris N.A. retail up 12% for Q3 2014 vs. Q3 2013 Gained share in all businesses - ORV, motorcycles and snowmobiles Polaris Q3 2014 N.A. dealer inventory up 15% vs. Q3 2013 ORV up mid-teens % - new models and market segments Motorcycles up low-double digits; Indian distribution and expanded product line; Victory down Snowmobiles up mid-teens percent – timing of shipments; new models +5% +12% Q3-2014 9 +15% 9
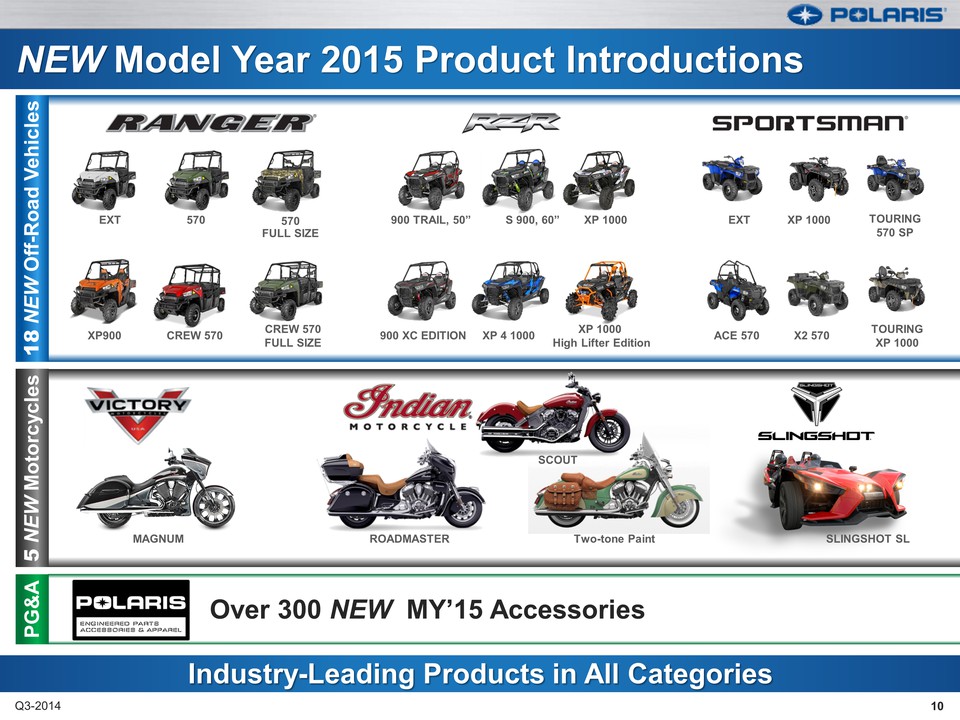
18 NEW Off-Road Vehicles 5 NEW Motorcycles 10 Q3-2014 NEW Model Year 2015 Product Introductions Industry-Leading Products in All Categories PG&A Over 300 NEW MY’15 Accessories XP 1000 High Lifter Edition 900 TRAIL, 50” S 900, 60” 900 XC EDITION XP 4 1000 XP 1000 XP 1000 ACE 570 EXT X2 570 TOURING 570 SP TOURING XP 1000 EXT 570 570 FULL SIZE CREW 570 CREW 570 FULL SIZE XP900 MAGNUM ROADMASTER SLINGSHOT SL Two-tone Paint SCOUT 10
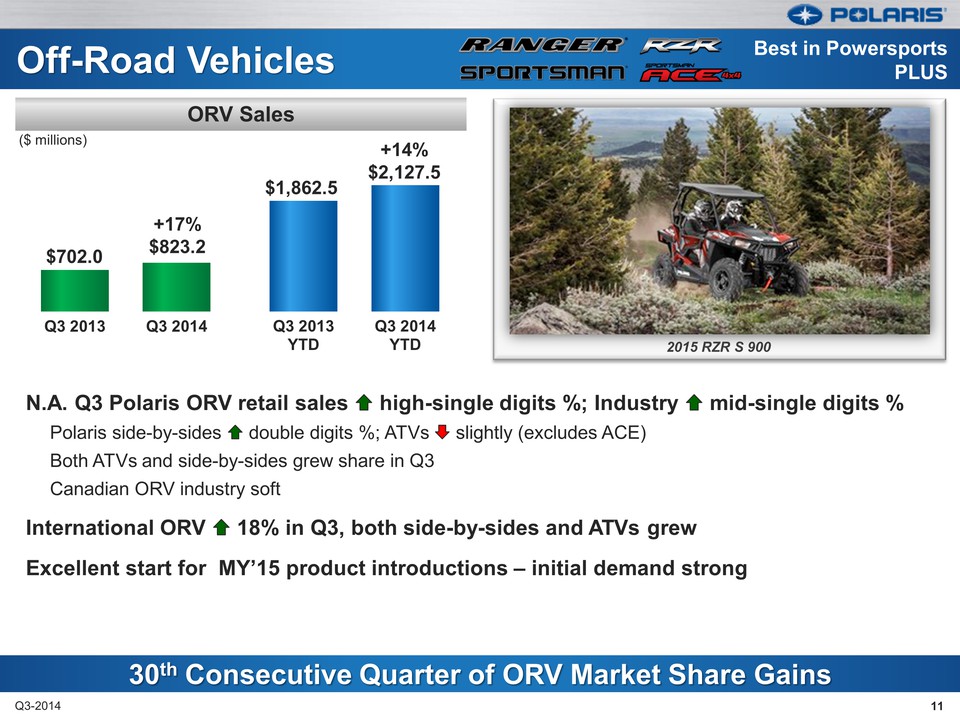
Q3 2013 Q3 2014 Q3 2013 YTD Q3 2014 YTD Off-Road Vehicles N.A. Q3 Polaris ORV retail sales high single digits %; Industry mid-single digits % Polaris side-by-sides double digits %; ATVs slightly (excludes ACE) Both ATVs and side-by-sides grew share in Q3 Canadian ORV industry soft International ORV 18% in Q3, both side-by-sides and ATVs grew Excellent start for MY’15 product introductions – initial demand strong 11 Q3-2014 30th Consecutive Quarter of ORV Market Share Gains ORV Sales$702.0 Best in Powersports PLUS ($ millions) +17% $823.2 $1,862.5 +14% $2,127.5 2015 RZR S 900 11
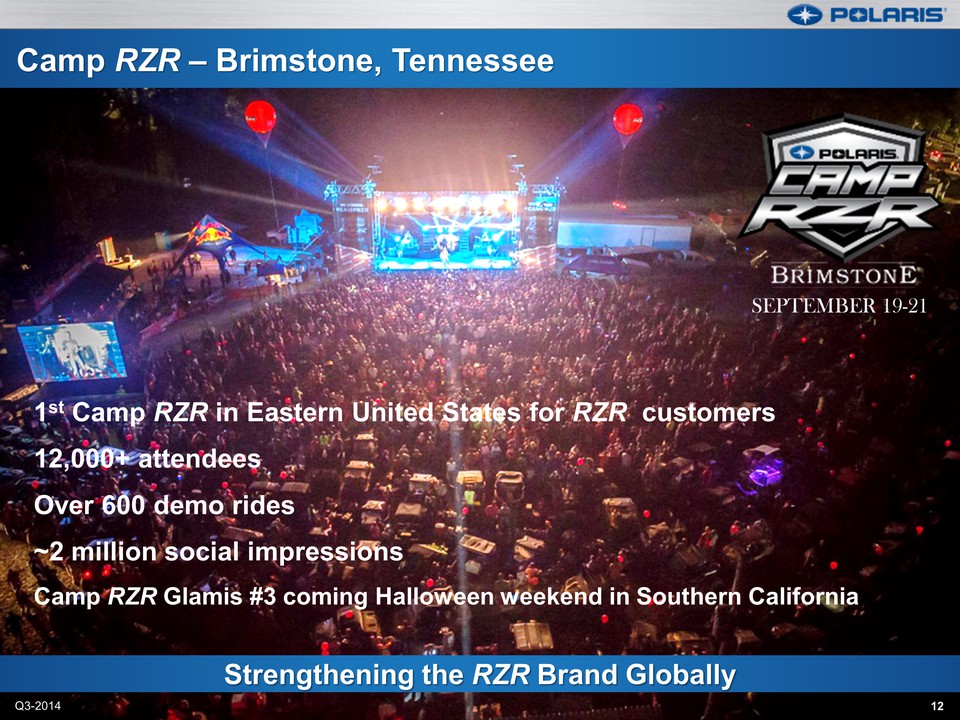
Strengthening the RZR Brand Globally 12 Camp RZR – Brimstone, Tennessee 1st Camp RZR in Eastern United States for RZR customers 12,000+ attendees Over 600 demo rides 2 million social impressions Camp RZR Glamis #3 coming Halloween weekend in Southern California SEPTEMBER 19-21 Q3-2014 12
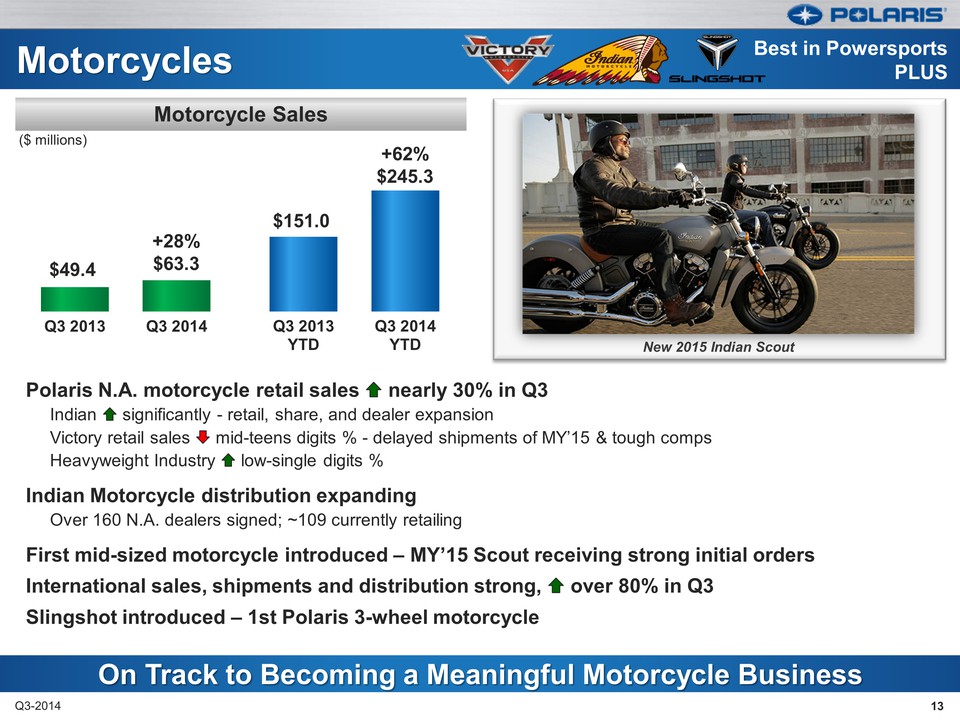
Q3 2013 YTD Q3 2014 YTD Q3 2013 Q3 2014 Motorcycles Polaris N.A. motorcycle retail sales nearly 30% in Q3 Indian significantly - retail, share, and dealer expansion Victory retail sales mid-teens digits % - delayed shipments of MY’15 & tough comps Heavyweight Industry low-single digits % Indian Motorcycle distribution expanding Over 160 N.A. dealers signed; ~109 currently retailing First mid-sized motorcycle introduced – MY’15 Scout receiving strong initial orders International sales, shipments and distribution strong, over 80% in Q3 Slingshot introduced – 1st Polaris 3-wheel motorcycle 13 Q3-2014 On Track to Becoming a Meaningful Motorcycle Business N.A. ORV Polaris Sales Best in Powersports PLUS Motorcycle Sales $49.4 +28% $63.3 ($ millions) New 2015 Indian Scout $151.0 +62% $245.3 13
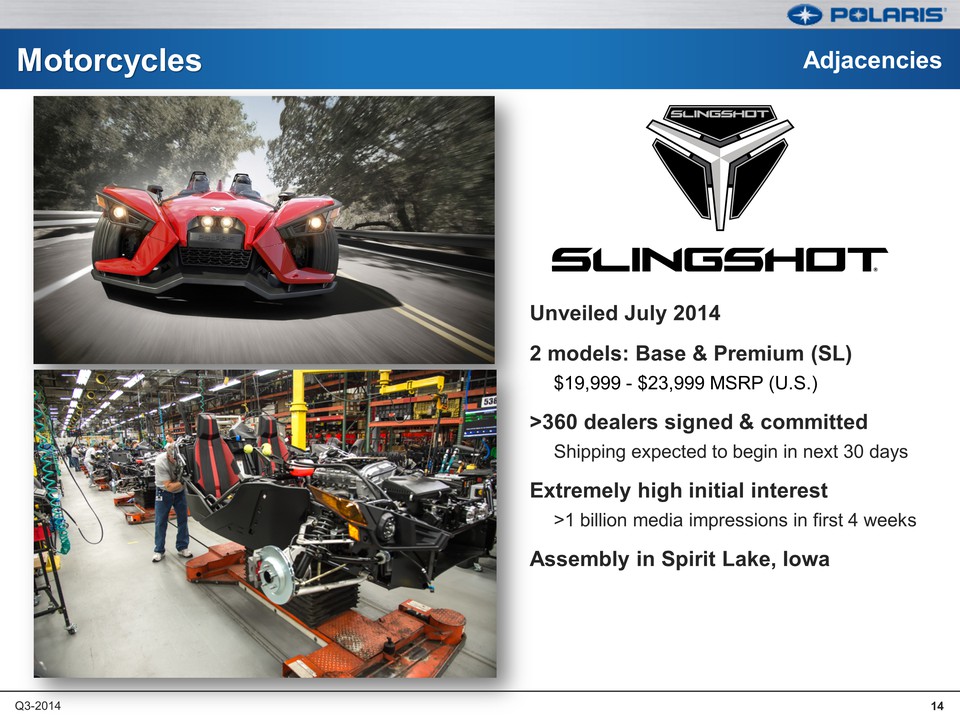
Motorcycles Unveiled July 2014 2 models: Base & Premium (SL) $19,999 - $23,999 MSRP (U.S.) 360 dealers signed & committed Shipping expected to begin in next 30 days Extremely high initial interest 1 billion media impressions in first 4 weeks Assembly in Spirit Lake, Iowa Adjacencies Q3-2014 14
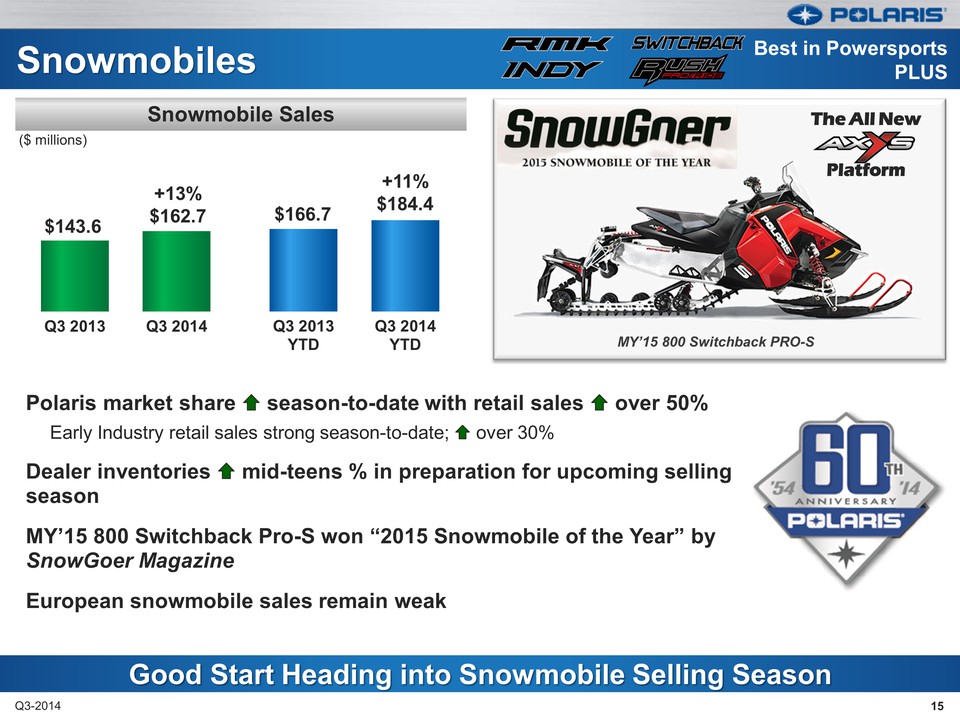
Q3 2013 YTD Q3 2014 YTD Q3 2013 Q3 2014 Snowmobiles Polaris market share season-to-date with retail sales over 50% Early Industry retail sales strong season-to-date; over 30% Dealer inventories mid-teens % in preparation for upcoming selling season MY’15 800 Switchback Pro-S won “2015 Snowmobile of the Year” by SnowGoer Magazine European snowmobile sales remain weak 15 Q3-2014 Good Start Heading into Snowmobile Selling Season Snowmobile Sales $143.6 Best in Powersports PLUS ($ millions) +13% $162.7 MY’15 800 Switchback PRO-S The All New Platform $166.7 +11% $184.4 15
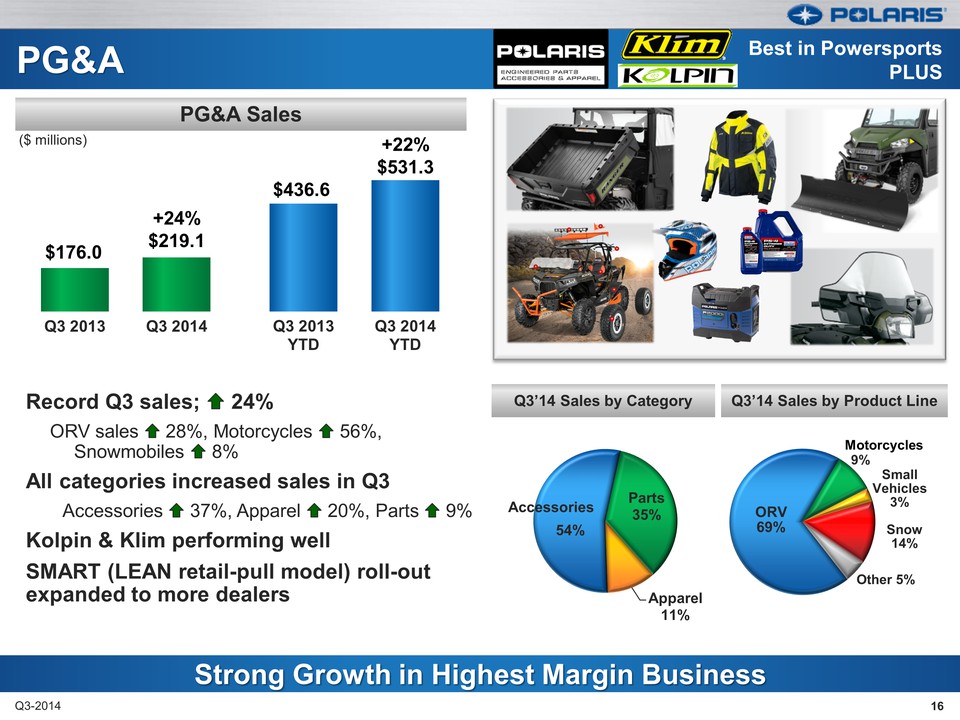
Q3 2013 YTD Q3 2014 YTD Q3 2013 Q3 2014 PG&A 16 Q3-2014 Strong Growth in Highest Margin Business PG&A Sales Best in Powersports PLUS $176.0 ($ millions) +24% $219.1 Record Q3 sales; 24% ORV sales 28%, Motorcycles 56%, Snowmobiles 8% All categories increased sales in Q3 Accessories 37%, Apparel 20%, Parts 9% Kolpin & Klim performing well SMART (LEAN retail-pull model) roll-out expanded to more dealers ORV 69% 9% Small Vehicles 3% Snow 14% Other 5% 54% Parts 35% Apparel 11% Accessories Q3’14 Sales by Category Q3’14 Sales by Product Line Motorcycles $436.6 +22% $531.3 16
Defense / Commercial 17
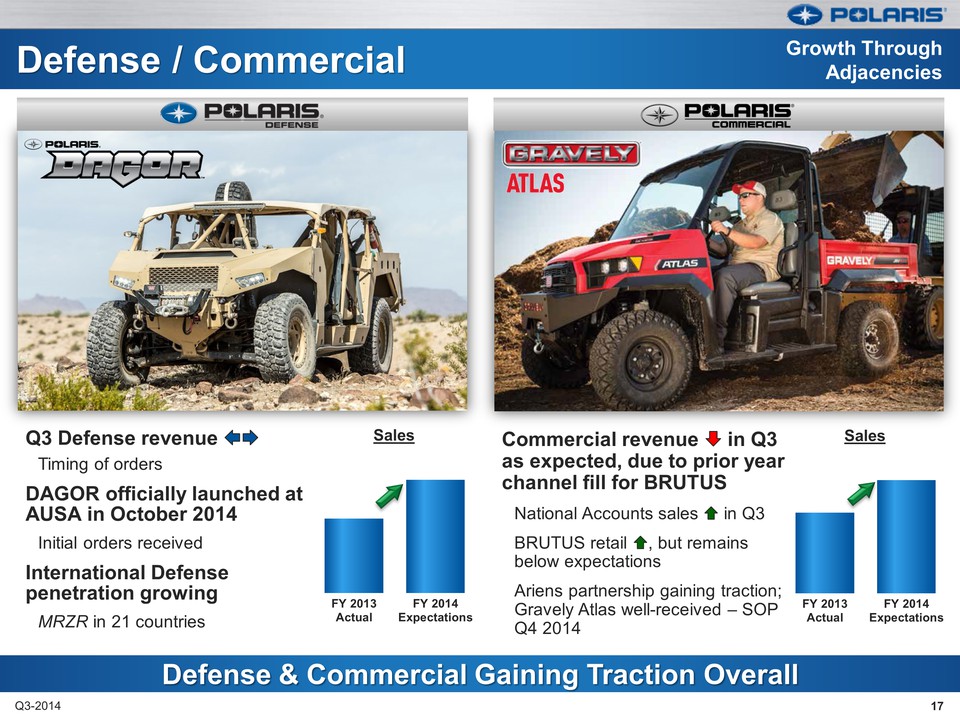
Q3-2014 Q3 Defense revenue Timing of orders DAGOR officially launched at
AUSA in October 2014 Initial orders received International Defense
penetration growing MRZR in 21 countries Commercial revenue in Q3 as
expected, due to prior year channel fill for BRUTUS National Accounts
sales in Q3 BRUTUS retail , but remains below expectations Ariens
partnership gaining traction; Gravely Atlas well-received – SOP Q4 2014
Defense & Commercial Gaining Traction Overall Growth Through Adjacencies
FY 2013 Actual FY 2014 Expectations Sales FY 2013 Actual FY 2014
Expectations Sales 17
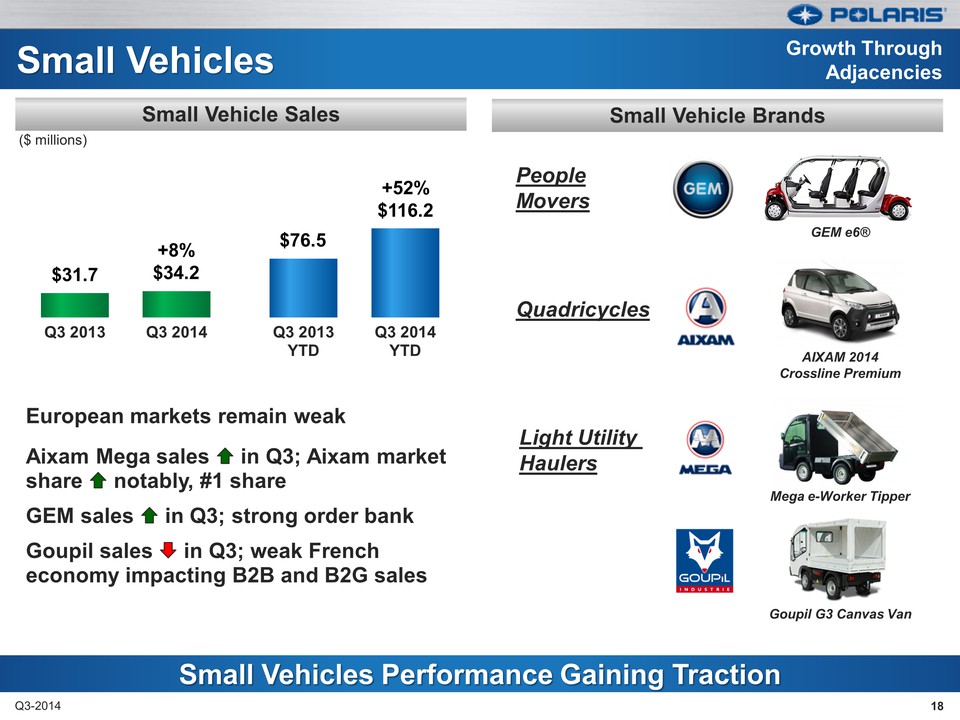
Q3 2013 YTD Q3 2014 YTD Q3 2013 Q3 2014 Small Vehicles 18 Q3-2014 Small Vehicles Performance Gaining Traction Small Vehicle Sales European markets remain weak Aixam Mega sales in Q3; Aixam market share notably, #1 share GEM sales in Q3; strong order bank Goupil sales in Q3; weak French economy impacting B2B and B2G sales Small Vehicle Brands Growth Through Adjacencies $31.7 ($ millions) +8% $34.2 AIXAM 2014 Crossline Premium GEM e6® Goupil G3 Canvas Van Mega e-Worker Tipper People Movers Quadricycles Light UtilityHaulers$76.5 +52% $116.2 18
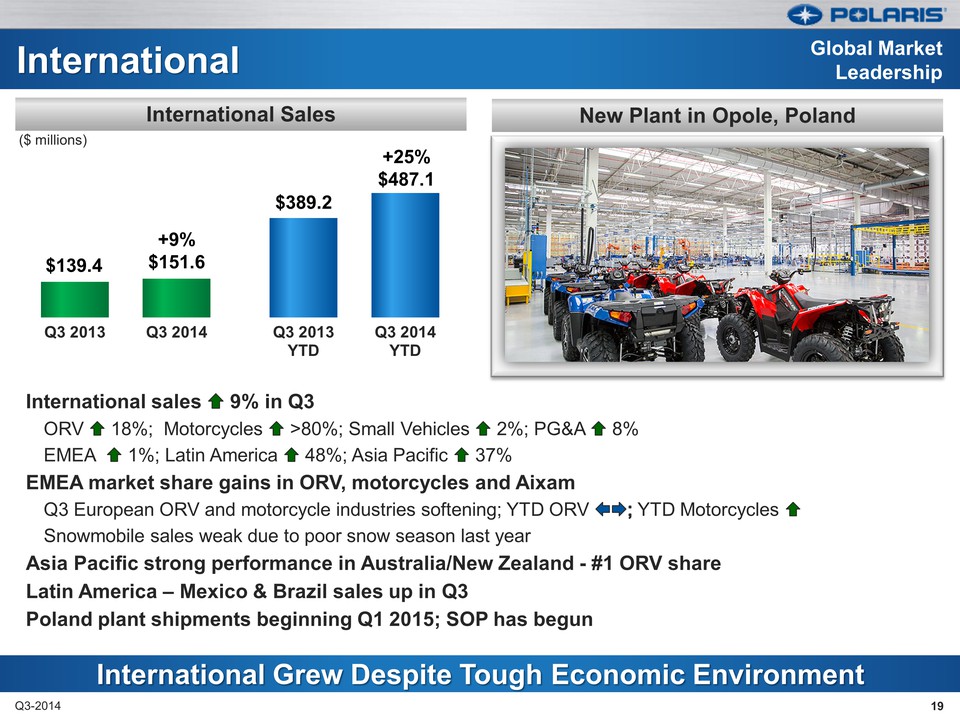
Q3 2013 YTD Q3 2014 YTD Q3 2013 Q3 2014 International 19 Q3-2014 International Grew Despite Tough Economic Environment International Sales International sales 9% in Q3 ORV 18%; Motorcycles 80%; Small Vehicles 2%; PG&A 8% EMEA 1%; Latin America 48%; Asia Pacific 37% EMEA market share gains in ORV, motorcycles and Aixam Q3 European ORV and motorcycle industries softening; YTD ORV YTD Motorcycles Snowmobile sales weak due to poor snow season last year Asia Pacific strong performance in Australia/New Zealand - #1 ORV share Latin America – Mexico & Brazil sales up in Q3 Poland plant shipments beginning Q1 2015; SOP has begun New Plant in Opole, Poland $139.4 ($ millions) Global Market Leadership +9% $151.6 $389.2 +25% $487.1 19
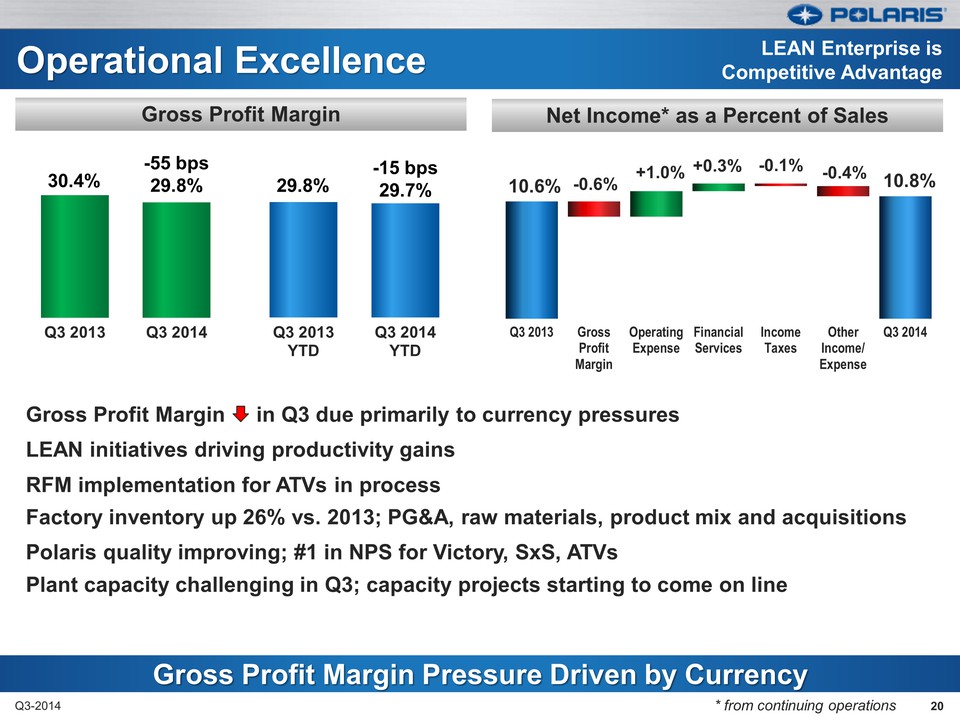
Q3 2013 Q3 2014 Q3 2013 YTD Q3 2014 YTD Operational Excellence 20 Q3-2014 Gross Profit Margin Pressure Driven by Currency Gross Profit Margin Gross Profit Margin in Q3 due primarily to currency pressures LEAN initiatives driving productivity gains RFM implementation for ATVs in process Factory inventory up 26% vs. 2013; PG&A, raw materials, product mix and acquisitionsPolaris quality improving; #1 in NPS for Victory, SxS, ATVs Plant capacity challenging in Q3; capacity projects starting to come on line Q3 2013 Gross Profit Margin Operating Expense Financial Services Income Taxes Other Income/ Expense Q3 2014 10.6% -0.6% +1.0% +0.3% -0.1% -0.4% 10.8% Net Income* as a Percent of Sales 30.4% LEAN Enterprise is Competitive Advantage -55 bps 29.8% 29.8% -15 bps 29.7% * from continuing operations 20
Mike Malone V.P Finance & CFO Third Quarter 2014 Earnings Results October 22, 2014 POLARIS INDUSTRIES INC.
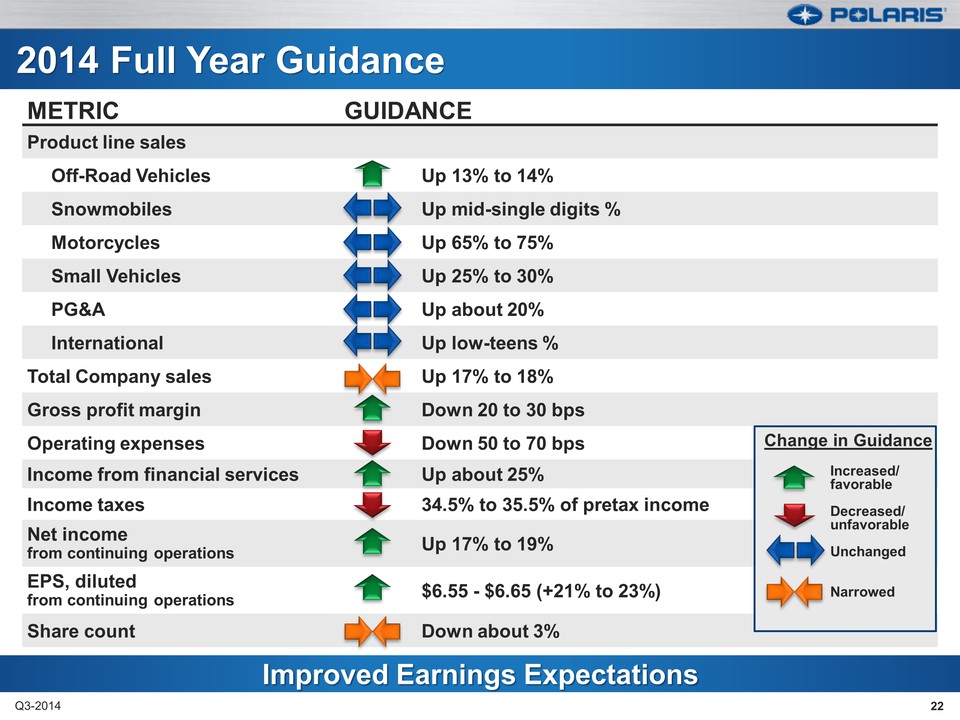
Improved Earnings Expectations 2014 Full Year Guidance METRIC GUIDANCE Product line sales Off-Road Vehicles Up 13% to 14% Snowmobiles Up mid-single digits % Motorcycles Up 65% to 75% Small Vehicles Up 25% to 30% PG&A Up about 20% International Up low-teens % Total Company sales Up 17% to 18% Gross profit margin Down 20 to 30 bps Operating expenses Down 50 to 70 bps Income from financial services Up about 25% Income taxes 34.5% to 35.5% of pretax income Net income from continuing operations Up 17% to 19% EPS, diluted from continuing operations $6.55 - $6.65 (+21% to 23%) Share count Down about 3% Change in Guidance Increased/ favorable Decreased/ unfavorable Unchanged Narrowed Q3-2014 22
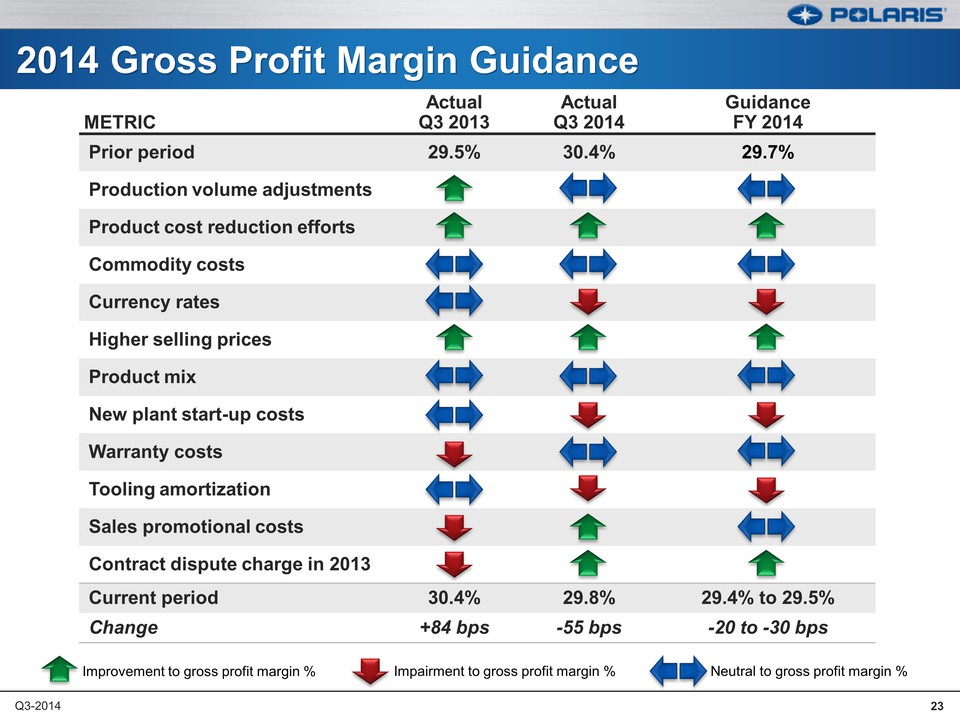
METRIC Actual Q3 2013 Actual Q3 2014 Guidance FY 2014 Prior period 29.5% 30.4% 29.7% Production volume adjustments Product cost reduction efforts Commodity costs Currency rates Higher selling prices Product mix New plant start-up costs Warranty costs Tooling amortization Sales promotional costs Contract dispute charge in 2013 Current period 30.4% 29.8% 29.4% to 29.5% Change +84 bps -55 bps -20 to -30 bps 2014 Gross Profit Margin Guidance Improvement to gross profit margin % Impairment to gross profit margin % Neutral to gross profit margin % Q3-2014 23
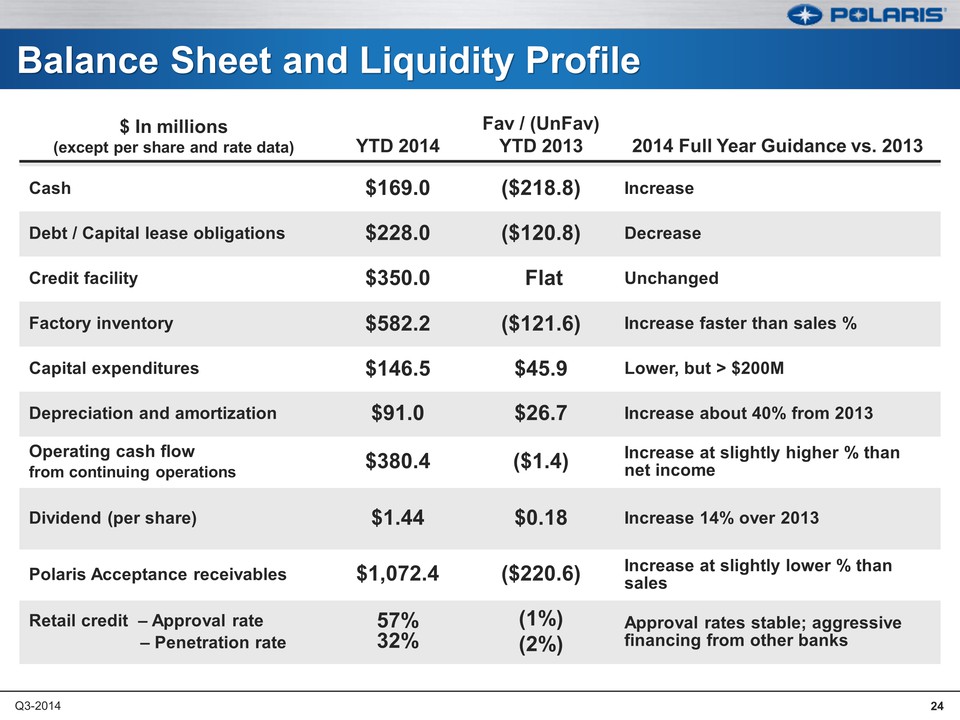
Balance Sheet and Liquidity Profile $ In millions (except per share and rate data) YTD 2014 Fav / (UnFav) YTD 2013 2014 Full Year Guidance vs. 2013 Cash $169.0 ($218.8) Increase Debt / Capital lease obligations $228.0 ($120.8) Decrease Credit facility $350.0 Flat Unchanged Factory inventory $582.2 ($121.6) Increase faster than sales % Capital expenditures $146.5 $45.9 Lower, but > $200MDepreciation and amortization $91.0 $26.7 Increase about 40% from 2013 Operating cash flow from continuing operations $380.4 ($1.4) Increase at slightly higher % than net income Dividend (per share) $1.44 $0.18 Increase 14% over 2013 Polaris Acceptance receivables $1,072.4 ($220.6) Increase at slightly lower % than sales Retail credit – Approval rate– Penetration rate57% 32% (1%) (2%) Approval rates stable; aggressive financing from other banks Q3-2014 24
Scott W. Wine Chairman & CEO Third Quarter 2014 Earnings Results October 22, 2014 POLARIS INDUSTRIES INC.
Notable Headwinds, but
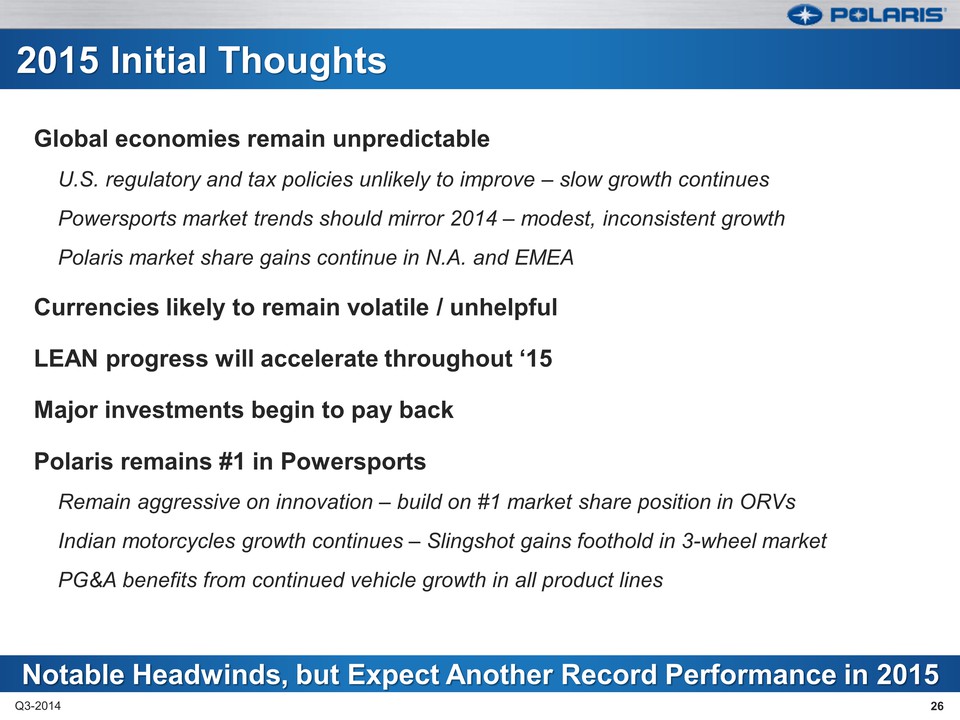
Expect Another Record Performance in 2015 2015 Initial Thoughts Global
economies remain unpredictable U.S. regulatory and tax policies unlikely
to improve – slow growth continues Powersports market trends should
mirror 2014 – modest, inconsistent growth Polaris market share gains
continue in N.A. and EMEA Currencies likely to remain volatile /
unhelpful LEAN progress will accelerate throughout ’15 Major investments
begin to pay back Polaris remains #1 in Powersports Remain aggressive on
innovation – build on #1 market share position in ORVs Indian
motorcycles growth continues – Slingshot gains foothold in 3-wheel
market PG&A benefits from continued vehicle growth in all product lines
26 Q3-2014 26
POLARIS Thank you Questions?
9(WOY@JK&Z%O
MO`<=S4AV'_EH!]*`+*H G75XP^T;%8)-;3GO
M-"Y`+?QJR-UR:]L^U0?\]H_^^A7YT_L::5=?"_XR^-_!,4$EMIVB^+[62PAD
ME\W9!>6DP(#;5R&C6%N@^Z.XS7Z-#D"O"JTXT:LJ<7=+;T:NCWZLG6IT\0U9
MR3O_`(HNS?ST?K +S4M=3E6]#740
M245'#+YJ9(VL.&7T--N'8D11G$C]_P"Z.YH&-(^U2D'F&,\^C-_@/Y_2B$^0
M_D,?EZQD^GI^'\JFC18D5%&%`P!39HO.3&=K#E6]#ZT")**B@E\U#D;74X9?
M0TEQ(PQ'&?WC]#_=' OU-`"BU!A*.I_"@91F63
MSV_>*8 G\'Y]>F?PJT_^DR^
M6/\`5H
3
M_A3+:U\IFA>64O\`>#;S\X]?Z?E4\`,K&=AC(PBGLO\`B?\`"GSQ&105.)%.
M5;T/^%`AOV4?\])?^^S1]E'_`#TE_P"^S3X91-&&Q@]"IZ@]Q3R0`23@"@95
MGA6.,Y>5RWRA=Y^8^E16MKY#&)Y)-Y^8,'/S?_JZ?3%6(`9W\]A\O2,'L/7\
M?Y5)/%YJ<':ZG*MZ&@0S[*/^>DO_`'V:/LH_YZ2_]]FGPR^:F2-K`X9?0U)0
M,Y+XDZ=/-X+U%K3S)[JV$=Y##N),KPR+,J`=R3'C\:\]_9G^!UC\(HO'VM07
M4%\_C/Q%=Z_#<0DX6SEI-?HS]CB_NG_OH_XTR2
MW@B1G8$`?[1_QH"[/@:X_8/\;:IX4\&^$)M6L#X4T::.YNM+,GRZA<1H(TDF
M(YV)R?+`.2S#/.18_:7_`."9[?$[Q3H^M>$=:CTV5-.CL]1^U1[VN9H^%GZC
M!*G!`X&U<=*^Z%M%@832)A9#AP&/R>G_`->K?V.+^Z?^^C_C0";/B3]F;]@#
M4OA?XPBU;QGJT7B%;6WCM[=V;)2&,YBME4YVQAOG;GG:JXQG/FWBG_@EIXM3
MXEW'B;2O&T&L>9J+:DLFL6JRR22&0O\`O06`?GKZU^DGV.+^Z?\`OH_XTCVT
M$:%F!"@9)W'_`!H"[/S7\>_\$S?&WCWQ(FN7GB^V-_=_\?J6T20J2I`P@7&T
M[1R3OY(.3TKN_BS^P;XT\9_#S0/!&@:Q8:!X?M`ES?Q1YD-W<*NV)"Q(/EPJ
M2%!^\S.YY(Q]QBT6)OM#H0K_`'ERH]J2>7RDX&YV.%7U-`RO+;Q2R>2L2`=78*.!Z?4T0PPQN87CC)`R
MI*CYE_Q'^%6((O)3&=S$Y9O4U^;W[;O[1'Q)^'?[06IZ)X:\8ZCH^E16-I*E
MI;^7L5FC)8\J3R?>N_!8.>-J>R@TG:^IP8S%PP5/VLTVKVT/T?\`L\'_`#SC
M_P"^11]G@_YYQ_\`?(K\T_@?XF^/OQ^^'_C#5?#/Q1U5O$?A^X@":3-Y"I>0
MR(Y(5]GRR90XS\IZ$CK7CNJ_M6?';0]2NM.U'QUKUA?VLAAGM;F.-)(G'564
MQY!%>K#(ZDYRIQJQO'=:GESSNE"$:DJ ;]_]V;J@(^Z/0_7O_P#6JQ%*LJ!@,=B#U!]*U/S(3[5!
M_P`]H_\`OH4C7-NZE6EC((P06'->,_M8_M&6/[./PRGU8"*Y\1WY:VT>QEY$
MLV.9'`Y\N,'
GU/4_@.U9-C&EQ=?O,^3$
\;;-K963
MU3;=FK9QAAU.
"D^T!QZ%#U'X5Y]:>Z@ST:-*ZO-'I'P[_`."@WQ,\,7D3:GJ,?B.R
M!^>VU-`VX>SJ`RGWS^%?HC\`/CWX?^/_`(4.JZ/FTOK