UNITED STATES
SECURITIES
AND EXCHANGE COMMISSION
Washington,
D.C. 20549
FORM
8-K
CURRENT
REPORT
Pursuant
to Section 13 OR 15(d) of the Securities Exchange Act of 1934
Date
of Report (Date of earliest event reported): July 22, 2014
POLARIS INDUSTRIES INC.
(Exact
name of Registrant as specified in its charter)
Minnesota |
1-11411 |
41-1790959 |
(State of Incorporation) |
(Commission File Number) |
(I.R.S. Employer Identification No.) |
2100 Highway 55
Medina, Minnesota 55340
(Address of
principal executive offices)
(Zip Code)
(763) 542-0500
(Registrant’s
telephone number, including area code)
Check the appropriate box below if the Form 8-K filing is intended to simultaneously satisfy the filing obligation of the registrant under any of the following provisions:
⃞ Written communications pursuant to Rule 425 under the Securities Act (17 CFR 230.425)
⃞ Soliciting material pursuant to Rule 14a-12 under the Exchange Act (17 CFR 240.14a-12)
⃞ Pre-commencement communications pursuant to Rule 14d-2(b) under the Exchange Act (17 CFR 240.14d-2(b))
⃞ Pre-commencement communications pursuant to Rule 13e-4(c) under the Exchange Act (17 CFR 240.13e-4(c))
Item 2.02 Results of Operations and Financial Condition.
On July 22, 2014, Polaris Industries Inc. (the “Company”) issued a press release announcing the Company’s second quarter 2014 financial results for the reporting period ended June 30, 2014. On July 22, 2014, the Company also hosted its quarterly earnings conference call, which was accessible to the public. A recording of the conference call will be available through the end of the business day on August 5, 2014 by dialing 855-859-2056 in the U.S. and Canada, or 404-537-3406 for international calls and entering passcode 24524293, and on the Company’s website, www.polaris.com/irhome.
A copy of the Company’s press release is furnished as Exhibit 99.1 attached hereto and a copy of the presentation materials discussed during the conference call is being furnished as Exhibit 99.2 to this Current Report on Form 8-K.
Item 7.01 Regulation FD Disclosure.
The disclosures set forth in Item 2.02 above are hereby incorporated by reference into this Item 7.01.
Item 9.01 Financial Statements and Exhibits.
(d) Exhibits.
99.1 | Press Release dated July 22, 2014 of Polaris Industries Inc. | |
99.2 | Presentation materials dated July 22, 2014 of Polaris Industries Inc. |
The information contained in this Current Report is furnished and not deemed to be filed for purposes of Section 18 of the Securities and Exchange Act of 1934, as amended, or otherwise subject to the liabilities of that section. The information in this Current Report shall not be incorporated by reference into any filing or other document pursuant to the Securities Act of 1933, as amended, except as shall be expressly set forth by specific reference in such filing or document.
SIGNATURES
Pursuant to
the requirements of the Securities Exchange Act of 1934, the registrant
has duly caused this report to be signed on its behalf by the
undersigned thereunto duly authorized.
Date: |
July 22, 2014 |
|
POLARIS INDUSTRIES INC. | ||
/s/ Michael W. Malone |
||
Michael W. Malone |
||
Vice President – Finance and |
||
Chief Financial Officer of Polaris Industries Inc. |
EXHIBIT INDEX
Exhibit Number |
Description |
|
99.1 |
Press Release dated July 22, 2014 of Polaris Industries Inc. |
|
99.2 |
Presentation materials dated July 22, 2014 of Polaris Industries Inc. |
Exhibit 99.1
CONTACT:
Polaris Industries Inc.
Richard Edwards, 763-542-0500
Polaris Reports Record Second Quarter 2014 Results; EPS Increased 26% to $1.42 on 20% Sales Growth
Company increases full year 2014 Sales and EPS guidance
Second Quarter Highlights:
MINNEAPOLIS--(BUSINESS WIRE)--July 22, 2014--Polaris Industries Inc. (NYSE:PII) today reported record second quarter net income of $96.9 million for the quarter ended June 30, 2014, up 21 percent from the prior year’s second quarter net income of $80.0 million. Earnings per share were also a record at $1.42 per diluted share for the 2014 second quarter compared to $1.13 for the second quarter of 2013. Sales for the second quarter 2014 totaled a record $1,014.0 million, an increase of 20 percent over last year’s second quarter sales of $844.8 million.
Scott Wine, Polaris’ Chairman and Chief Executive Officer, stated, “The second quarter results, our 19th consecutive quarter of record earnings performance, exemplify our commitment to delivering high quality innovative products and a first-class purchase experience that our consumers expect. Our strong financial performance in the quarter was driven by outstanding retail sales growth, up 15 percent in North America, driven by share gains in our side-by-side vehicle product line and continued growth of our Indian motorcycle business. The recently introduced Sportsman ACE™ further solidifies our #1 market share position in the North American ORV market and our Small Vehicle and PG&A businesses delivered impressive growth, up 29 percent and 20 percent year-over-year in the second quarter, respectively.”
Wine continued, “On the heels of last year’s new product launch, which was lauded to be the largest and most groundbreaking in our Company’s history, next week we will celebrate our 60th anniversary and further enhance our innovation profile with the unveiling of our model year 2015 products for ORVs, motorcycles and the much anticipated Slingshot vehicle. Between strong demand for our existing offerings and our industry leading product innovation, we believe sales and earnings will continue to accelerate in the second half of the year, supporting our confidence and decision to again raise full year sales and earnings guidance for 2014.”
2014 Business Outlook
For the full year 2014, the Company is increasing its guidance and now expects earnings to be in the range of $6.48 to $6.58 per diluted share, an increase of 20 percent to 22 percent over full year 2013 earnings of $5.40 per diluted share from continuing operations. Full year 2014 sales are now expected to grow in the range of 16 percent to 18 percent when compared to 2013.
Second Quarter Performance Summary (in thousands except per share data) |
||||||||||||
Three Months ended June 30, |
Six Months ended June 30, |
|||||||||||
Product line sales |
2014 | 2013 | Change | 2014 | 2013 | Change | ||||||
Off-Road Vehicles | $ 701,463 | $ 619,223 | 13% | $ 1,304,306 | $ 1,160,495 | 12% | ||||||
Snowmobiles | 6,141 | 8,461 | -27% | 21,727 | 23,175 | -6% | ||||||
Motorcycles | 103,128 | 49,872 | 107% | 181,995 | 101,669 | 79% | ||||||
Small Vehicles | 43,525 | 33,714 | 29% | 82,008 | 44,773 | 83% | ||||||
Parts, Garments & Accessories | 159,702 | 133,530 | 20% | 312,269 | 260,597 | 20% | ||||||
Total Sales | $ 1,013,959 | $ 844,800 | +20% | $ 1,902,305 | $ 1,590,709 | +20% | ||||||
Gross profit | $ 304,914 | $ 252,338 |
+21% |
$ 563,331 | $ 468,986 | +20% | ||||||
Gross profit as a % of sales | 30.1% | 29.9% | +20 bpts | 29.6% | 29.5% | +10 bpts | ||||||
Operating expenses | $ 164,104 | $ 138,286 |
+19% |
$ 306,479 | $ 263,039 | +17% | ||||||
Operating expenses as a % of sales | 16.2% | 16.4% | -20 bpts | 16.1% | 16.5% | -40 bpts | ||||||
Operating Income | 155,435 | 125,554 |
+24% |
$ 282,117 | $ 227,523 | +24% | ||||||
Operating Income as a % of sales | 15.3% | 14.9% | +40 bpts | 14.8% | 14.3% | +50 bpts | ||||||
Net Income | $ 96,905 | $ 80,004 | +21% | $ 177,806 | $ 155,468 | +14% | ||||||
Net income as a % of sales | 9.6% | 9.5% | +10 bpts | 9.3% | 9.8% | -50 bpts | ||||||
Diluted Net Income per share | $ 1.42 | $ 1.13 | +26% | $ 2.61 | $ 2.20 | +19% | ||||||
|
Off-Road Vehicle (“ORV”) sales increased 13 percent from the second quarter 2013 to $701.5 million. This increase reflects increased demand and North American market share gains for both ATVs and side-by-side vehicles. Polaris North American ORV unit retail sales were up low-double digits percent from the second quarter last year, with consumer purchases of side-by-side vehicles climbing low-teens percent, ATV retail sales increasing mid-single digits percent and the new Sportsman ACE™ category continuing to gain retail momentum. The Company estimates the North American industry ORV retail sales increased high-single-digits percent from the second quarter of 2013. North American ORV dealer inventories for Polaris were up low-teens percent from the second quarter of 2013 primarily as a result of efforts to support new ORV product categories, but down sequentially from the 2014 first quarter, as anticipated. Sales of Polaris ORVs outside of North America increased 19 percent in the second quarter of 2014 as compared to the year-ago period driven by continued market share gains in side-by-side vehicles and ATVs.
Snowmobile sales totaled $6.1 million for the 2014 second quarter compared to $8.5 million for the second quarter of 2013. Snowmobile sales in the Company’s second quarter are routinely low as it is the off-season for snowmobile retail sales and shipments.
Sales for the Motorcycles division increased 107 percent to $103.1 million in the 2014 second quarter compared to same period last year due to continued strong demand for the new model year 2014 Indian motorcycles. Consumer retail demand for Polaris motorcycles, driven by Indian Motorcycle retail sales, was up approximately 50 percent during the 2014 second quarter, while second quarter North American industry heavyweight cruiser and touring motorcycle retail sales were about flat versus the 2013 second quarter. The re-launch of Indian Motorcycle continued during the 2014 second quarter as additional dealers began retailing the bikes and awareness of the brand’s revival continued to gain momentum in the motorcycle community. Victory retail sales in the 2014 second quarter were down mid-single digits percent largely due to a product recall in May, but we are encouraged by our performance of market share gains in April and June. Sales of Polaris motorcycles outside of North America almost doubled in the second quarter of 2014 as compared to the year-ago period driven by strong retail demand for Indian motorcycles.
Sales of the Small Vehicles division increased 29 percent to $43.5 million compared to the second quarter of 2013. All three businesses, Aixam Mega, GEM and Goupil experienced increased sales during the 2014 second quarter compared to the same period last year.
Parts, Garments, and Accessories (“PG&A”) sales increased 20 percent to $159.7 million during the second quarter of 2014 as compared to the same period last year. All product lines experienced double digits percent sales growth during the quarter. In addition, the Kolpin acquisition in April 2014 added to the sales increase during the quarter. Sales of PG&A to customers outside of North America increased ten percent during the 2014 second quarter compared to the same period last year.
International sales totaled $170.5 million for the 2014 second quarter, a 26 percent increase over the same period in 2013. The increase in second quarter sales resulted from strong sales growth in all international regions. Europe, Middle East and Africa (“EMEA”) sales increased 22 percent, Asia Pacific sales were up 40 percent and Latin America sales increased 36 percent. Both ORV and Motorcycles gained market share outside of North America during the 2014 second quarter.
Gross profit increased 21 percent to $304.9 million compared to $252.3 million in the second quarter of 2013. As a percentage of sales, gross profit margin improved 20 basis points to 30.1 percent of sales for the second quarter of 2014, compared to 29.9 percent of sales for the same period last year. The pressure to gross margins from the negative currency movements of the Canadian dollar and weaker product mix during the 2014 second quarter was more than offset by lower product costs and higher pricing.
Operating expenses for second quarter 2014 declined 20 basis points, as a percentage of sales, to 16.2 percent compared to 16.4 percent of sales in the 2013 second quarter. Operating expenses in dollars increased 19 percent to $164.1 million in the 2014 second quarter compared to $138.3 million for the second quarter of 2013. Operating expenses as a percent of sales for the 2014 second quarter declined due to lower long-term incentive compensation expenses partially offset by higher marketing and advertising expenses related to the re-launch of Indian Motorcycle and higher product liability provisioning.
Income from financial services increased 27 percent to $14.6 million during the second quarter 2014 compared to $11.5 million in the second quarter of 2013, primarily due to higher income from Polaris Acceptance’s dealer inventory financing.
Equity in loss of affiliates was $1.0 million for the second quarter of 2014 compared to $0.6 million in the second quarter last year, which represents the Company’s portion of the start-up costs related to the Polaris/Eicher joint venture in India established in 2012.
Non-operating other income, which primarily relates to foreign currency exchange rate movements and the corresponding effects on foreign currency transactions related to the Company’s foreign subsidiaries, was $1.9 million in the second quarter of 2014 compared to $1.2 million in the second quarter of 2013.
The provision for income taxes for the second quarter of 2014 was $56.4 million or 36.8 percent of pretax income compared to $44.8 million or 35.9 percent of pretax income for the second quarter 2013. The higher income tax rate for the second quarter of 2014 is primarily due to the United States federal government not yet extending the research and development income tax credit as of June 30, 2014.
The weighted average diluted shares outstanding for the second quarter of 2014 decreased four percent to 68.1 million shares compared to 70.8 million shares in the second quarter of last year. The decrease in the weighted average diluted shares outstanding is primarily due to the Company’s purchase of 3.96 million shares of Polaris stock previously held by FHI Heavy Industries Ltd. (“Fuji”) in November 2013.
Financial Position and Cash Flow
Net cash provided by operating activities increased 26 percent to $130.9 million for the year-to-date period ended June 30, 2014 compared to $103.5 million for the first half of 2013. The increase in net cash provided by operating activities for the 2014 period was largely due to increased net income and depreciation and amortization. Total debt, including capital lease obligations, at the end of the second quarter of 2014 was $367.6 million. The Company’s debt-to-total capital ratio increased to 35 percent at June 30, 2014 compared to 12 percent at June 30, 2013 due to the significant share repurchase transaction completed in November of 2013. Cash and cash equivalents were $119.0 million at June 30, 2014 compared to $217.7 million at June 30, 2013.
Conference Call and Webcast Presentation
Today at 9:00 AM central time Polaris Industries Inc. will host a conference call and webcast to discuss Polaris’ 2014 second quarter earnings results released this morning. The call will be hosted by Scott Wine, Chairman and CEO, Bennett Morgan, President and COO, and Mike Malone, Vice President―Finance and CFO. A slide presentation and link to the audio webcast will be posted on the Investor Relations page of the Polaris web site at www.polaris.com/irhome.
To listen to the conference call by phone, dial 877-706-7543 in the U.S. and Canada, or 973-200-3967 internationally. The Conference ID is # 24524293.
A replay of the conference call will be available approximately two hours after the call for a one-week period by accessing the same link on our website, or by dialing 855-859-2056 in the U.S. and Canada, or 404-537-3406 internationally.
Polaris Industries Inc. to Host and Webcast Analyst & Investor Meeting
Polaris Industries Inc. also announced today that the executive management team of Polaris will host an Analyst / Investor Meeting in Minneapolis, Minnesota in conjunction with the annual dealer meeting and Polaris’ celebration of its 60th anniversary. The meeting will be held on Monday, July 28, 2014 from 7:30 AM to 11:00 AM central time. Management will be discussing its future strategy to drive growth and profitability, including a first look at some exciting new model year 2015 products including ORVs, motorcycles and Slingshot.
Presenters at the Analyst/Investor meeting will include Scott Wine, Chairman and CEO; Bennett Morgan, President and COO and Mike Malone, Vice President―Finance and CFO in addition to other members of the Polaris management team. The meeting agenda will be posted under the “presentations” tab on the Polaris Investor Relations website www.polaris.com/irhome.
A live webcast of the meeting including audio and a slide presentation will be available by accessing our website at www.polaris.com/irhome. A replay of the webcast will be available on our website for one week following the event accessible through the same above link.
For more information about the Analyst/Investor Meeting, please contact Peggy James at 763-542-0502.
About Polaris
Polaris is a recognized leader in the powersports industry with annual 2013 sales of $3.8 billion. Polaris designs, engineers, manufactures and markets innovative, high quality off-road vehicles, including all-terrain vehicles (ATVs) and the Polaris RANGER® and RZR® side-by-side vehicles, snowmobiles, motorcycles and on-road electric/hybrid powered vehicles.
Polaris is among the global sales leaders for both snowmobiles and off-road vehicles and has established a presence in the heavyweight cruiser and touring motorcycle market with the Victory and Indian Motorcycle brands. Additionally, Polaris continues to invest in the global on-road small electric/hybrid powered vehicle industry with Global Electric Motorcars (GEM), Goupil Industrie SA, Aixam Mega S.A.S., and internally developed vehicles. Polaris enhances the riding experience with a complete line of Polaris Engineered Parts, Accessories and Apparel, Klim branded apparel and ORV accessories under the Kolpin and Cycle Country brands.
Polaris Industries Inc. trades on the New York Stock Exchange under the symbol “PII”, and the Company is included in the S&P Mid-Cap 400 stock price index.
Information about the complete line of Polaris products, apparel and vehicle accessories are available from authorized Polaris dealers or anytime at www.polaris.com.
Except for historical information contained herein, the matters set forth in this news release, including management’s expectations regarding 2014 sales, shipments, net income, and net income per share from continuing operations are forward-looking statements that involve certain risks and uncertainties that could cause actual results to differ materially from those forward-looking statements. Potential risks and uncertainties include such factors as the Company’s ability to successfully implement its manufacturing operations realignment initiatives, product offerings, promotional activities and pricing strategies by competitors; acquisition integration costs; warranty expenses; foreign currency exchange rate fluctuations; environmental and product safety regulatory activity; effects of weather; commodity costs; uninsured product liability claims; uncertainty in the retail and wholesale credit markets; performance of affiliate partners; changes in tax policy and overall economic conditions, including inflation, consumer confidence and spending and relationships with dealers and suppliers. Investors are also directed to consider other risks and uncertainties discussed in documents filed by the Company with the Securities and Exchange Commission. The Company does not undertake any duty to any person to provide updates to its forward-looking statements.
(summarized financial data follows)
POLARIS INDUSTRIES INC. |
||||||||||||||||
CONSOLIDATED STATEMENTS OF INCOME |
||||||||||||||||
(In Thousands, Except Per Share Data) |
||||||||||||||||
(Unaudited) |
||||||||||||||||
Three months ended June 30, |
Six months ended June 30, | |||||||||||||||
2014 | 2013 | 2014 | 2013 | |||||||||||||
Sales | $ | 1,013,959 | $ | 844,800 | $ | 1,902,305 | $ | 1,590,709 | ||||||||
Cost of sales | 709,045 | 592,462 | 1,338,974 | 1,121,723 | ||||||||||||
Gross profit | 304,914 | 252,338 | 563,331 | 468,986 | ||||||||||||
Operating expenses: | ||||||||||||||||
Selling and marketing | 74,178 | 62,238 | 139,748 | 116,731 | ||||||||||||
Research and development | 36,984 | 34,604 | 72,497 | 66,054 | ||||||||||||
General and administrative | 52,942 | 41,444 | 94,234 | 80,254 | ||||||||||||
Total operating expenses | 164,104 | 138,286 | 306,479 | 263,039 | ||||||||||||
Income from financial services | 14,625 | 11,502 | 25,265 | 21,576 | ||||||||||||
Operating income | 155,435 | 125,554 | 282,117 | 227,523 | ||||||||||||
Non-operating expense (income): | ||||||||||||||||
Interest expense | 3,039 | 1,371 | 5,851 | 2,844 | ||||||||||||
Equity in loss of other affiliates | 967 | 586 | 1,863 | 998 | ||||||||||||
Other (income), net | (1,883 | ) | (1,230 | ) | (3,988 | ) | (3,698 | ) | ||||||||
Income before income taxes | 153,312 | 124,827 | 278,391 | 227,379 | ||||||||||||
Provision for income taxes | 56,407 | 44,823 | 100,585 | 71,911 | ||||||||||||
Net income | $ | 96,905 | $ | 80,004 | $ | 177,806 | $ | 155,468 | ||||||||
Basic net income per share | $ | 1.47 | $ | 1.16 | $ | 2.70 | $ | 2.26 | ||||||||
Diluted net income per share | $ | 1.42 | $ | 1.13 | $ | 2.61 | $ | 2.20 | ||||||||
Weighted average shares outstanding: |
||||||||||||||||
Basic | 66,060 | 68,867 | 65,946 | 68,830 | ||||||||||||
Diluted | 68,088 | 70,755 | 68,023 | 70,759 | ||||||||||||
POLARIS INDUSTRIES INC. |
||||||
CONSOLIDATED BALANCE SHEETS |
||||||
(In Thousands) |
||||||
(Unaudited) |
||||||
Subject to Reclassification |
June 30, 2014 |
June 30, 2013 | ||||
Assets |
||||||
Current Assets: | ||||||
Cash and cash equivalents | $ | 119,040 | $ | 217,674 | ||
Trade receivables, net | 135,411 | 148,725 | ||||
Inventories, net | 559,876 | 428,634 | ||||
Prepaid expenses and other | 60,002 | 47,169 | ||||
Income taxes receivable | 24,890 | 13,520 | ||||
Deferred tax assets | 94,228 | 84,215 | ||||
Total current assets | 993,447 | 939,937 | ||||
Property and equipment, net | 532,425 | 342,713 | ||||
Investment in finance affiliate | 67,597 | 55,346 | ||||
Investment in other affiliates | 18,622 | 17,901 | ||||
Deferred tax assets | 21,803 | 30,508 | ||||
Goodwill and other intangible assets, net | 238,118 | 224,572 | ||||
Other long-term assets | 47,037 | 28,440 | ||||
Total assets | $ | 1,919,049 | $ | 1,639,417 | ||
Liabilities and Shareholders' equity | ||||||
Current Liabilities: | ||||||
Current portion of capital lease obligations | $ | 3,119 | $ | 3,297 | ||
Accounts payable | 289,423 | 236,347 | ||||
Accrued expenses: | ||||||
Compensation | 64,782 | 85,206 | ||||
Warranties | 44,811 | 42,717 | ||||
Sales promotions and incentives | 129,161 | 98,006 | ||||
Dealer holdback | 102,890 | 84,570 | ||||
Other | 86,656 | 67,487 | ||||
Income taxes payable | 4,530 | 16,539 | ||||
Current liabilities of discontinued operations | — | 5,000 | ||||
Total current liabilities | 725,372 | 639,169 | ||||
Long term income taxes payable | 13,377 | 11,472 | ||||
Capital lease obligations | 27,506 | 4,304 | ||||
Long-term debt | 337,000 | 100,000 | ||||
Deferred tax liabilities | 22,982 | 25,822 | ||||
Other long-term liabilities | 86,301 | 51,187 | ||||
Total liabilities | $ | 1,212,538 | $ | 831,954 | ||
Deferred compensation | 12,091 | — | ||||
Shareholders’ equity: | ||||||
Total shareholders’ equity | 694,420 | 807,463 | ||||
Total liabilities and Shareholders’ equity | $ | 1,919,049 | $ | 1,639,417 | ||
Certain reclassifications of previously reported balance sheet amounts have been made to conform to the current year presentation
|
||||||||
POLARIS INDUSTRIES INC. |
||||||||
CONSOLIDATED STATEMENTS OF CASH FLOWS |
||||||||
(In Thousands) |
||||||||
(Unaudited) |
||||||||
Subject to Reclassification |
Six months ended June 30, |
|||||||
2014 | 2013 | |||||||
Operating Activities: | ||||||||
Net income | $ | 177,806 | $ | 155,468 | ||||
Adjustments to reconcile net income to net cash provided by operating activities: | ||||||||
Depreciation and amortization | 56,781 | 39,279 | ||||||
Noncash compensation | 28,273 | 34,043 | ||||||
Noncash income from financial services | (4,503 | ) | (2,384 | ) | ||||
Noncash loss from other affiliates | 1,863 | 998 | ||||||
Deferred income taxes | (7,790 | ) | (6,356 | ) | ||||
Tax effect of share-based compensation exercises | (11,939 | ) | (9,868 | ) | ||||
Changes in operating assets and liabilities: | ||||||||
Trade receivables | 52,899 | (18,297 | ) | |||||
Inventories | (136,323 | ) | (65,761 | ) | ||||
Accounts payable | 48,666 | 51,212 | ||||||
Accrued expenses | (53,595 | ) | (84,105 | ) | ||||
Income taxes payable/receivable | (6,264 | ) | 20,358 | |||||
Prepaid expenses and others, net | (14,961 | ) | (11,073 | ) | ||||
Net cash provided by operating activities | 130,913 | 103,514 | ||||||
Investing Activities: | ||||||||
Purchase of property and equipment | (101,607 | ) | (93,720 | ) | ||||
Investment in finance affiliate, net | 6,124 | 4,026 | ||||||
Investment in other affiliates | (4,158 | ) | (6,063 | ) | ||||
Acquisition of businesses, net of cash acquired | (17,199 | ) | (134,817 | ) | ||||
Net cash used for investing activities | (116,840 | ) | (230,574 | ) | ||||
Financing Activities: | ||||||||
Borrowings under debt arrangements | 1,452,444 | 1,432 | ||||||
Repayments under debt arrangements and capital lease obligations | (1,397,210 | ) | (1,873 | ) | ||||
Repurchase and retirement of common shares | (3,945 | ) | (31,869 | ) | ||||
Cash dividends to shareholders | (63,415 | ) | (57,487 | ) | ||||
Proceeds from stock issuances under employee plans | 12,994 | 10,219 | ||||||
Tax effect of proceeds from share-based compensation exercises | 11,939 | 9,868 | ||||||
Net cash provided by (used for) financing activities | 12,807 | (69,710 | ) | |||||
Impact of currency exchange rates on cash balances | (88 | ) | (2,571 | ) | ||||
Net increase (decrease) in cash and cash equivalents | 26,792 | (199,341 | ) | |||||
Cash and cash equivalents at beginning of period | 92,248 | 417,015 | ||||||
Cash and cash equivalents at end of period | $ | 119,040 | $ | 217,674 | ||||
Exhibit 99.2
POLARIS INDUSTRIES INC. Second Quarter 2014 Earnings Results July 22, 2014
Safe Harbor Except for historical information contained herein, the matters set forth in this document, including but not limited to management’s expectations regarding 2014 sales, shipments, margins, net income and cash flow, the trend toward producing more of the Company’s own engines for its vehicles, the opportunities for expansion and diversification of the Company’s business, the impact of the repurchase of shares on the Company’s full year 2014 earnings per share and the Company’s guidance on earnings per share from continuing operations are forward-looking statements that involve certain risks and uncertainties that could cause actual results to differ materially from those forward-looking statements. Potential risks and uncertainties include such factors as product offerings, promotional activities and pricing strategies by competitors; manufacturing operation initiatives; acquisition integration costs; warranty expenses; foreign currency exchange rate fluctuations; environmental and product safety regulatory activity; effects of weather; commodity costs; uninsured product liability claims; uncertainty in the retail and wholesale credit markets; performance of affiliate partners; changes in tax policy and overall economic conditions, including inflation, consumer confidence and spending and relationships with dealers and suppliers. Investors are also directed to consider other risks and uncertainties discussed in our 2013 annual report and Form 10-K filed by the Company with the Securities and Exchange Commission. The Company does not undertake any duty to any person to provide updates to its forward-looking statements. The data source for retail sales figures included in this presentation is registration information provided by Polaris dealers in North America and compiled by the Company or Company estimates. The Company must rely on information that its dealers supply concerning retail sales, and other retail sales data sources and this information is subject to revision. Q2-2014 2
Scott W. Wine Chairman & CEO POLARIS INDUSTRIES INC. Second Quarter 2014 Earnings Results July 22, 2014
Q2 2014 Sales and Net Income Q2 Sales Q2 Net Income (in millions) +20% (in millions) +21% $844.8 $1,014.0 Q2 2013 Q2 2014 $80.0 $96.9 Q2 2013 Q2 2014 Record 2nd quarter sales and net income ORV sales increased 13%; Motorcycles up 107%; PG&A up 20%; International up 26% N.A. retail sales increased 15%; both ORV and motorcycles up strong Earnings per share increased 26% to a record $1.42 Gross profit margin improved 20 bps in spite of currency pressure Operating income increased 24% to $155.4 million Net income margins were up 10 bps to 9.6% A Strong Quarter Leading into Mid-year New Product Launch Q2-2014 4
Full Year 2014 Guidance Total Company Sales (in millions) Diluted EPS* $3,777 Up 16% to 18% $4,375 to $4,475 2013 Actual FY 2014 Guidance $5.40 Up 20% to 22% $6.48 to $6.58 2013 Actual FY 2014 Guidance Record sales and earnings projected for 2014 North American retail sales growth and market share gains remain strong International sales projected to increase low-teens % Net income* projected up 16% to 18% Net income margin* projected to hold above long-term goal of 10% Increased Full Year 2014 Sales & EPS Guidance Q2-2014 * from continuing operations 5
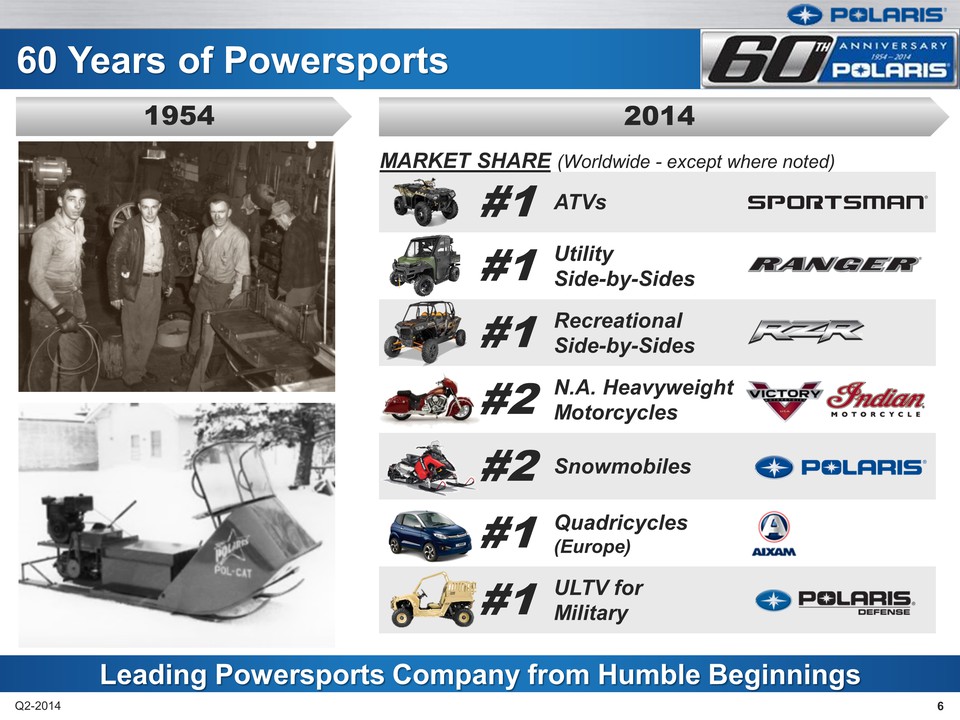
60 Years of Powersports 1954 2014 MARKET SHARE (Worldwide - except where noted) #1 ATVs #1 Utility Side-by-Sides #1 Recreational Side-by-Sides #2 N.A. Heavyweight Motorcycles #2 Snowmobiles #1 Quadricycles (Europe) #1 ULTV for Military Leading Powersports Company from Humble Beginnings Q2-2014 6
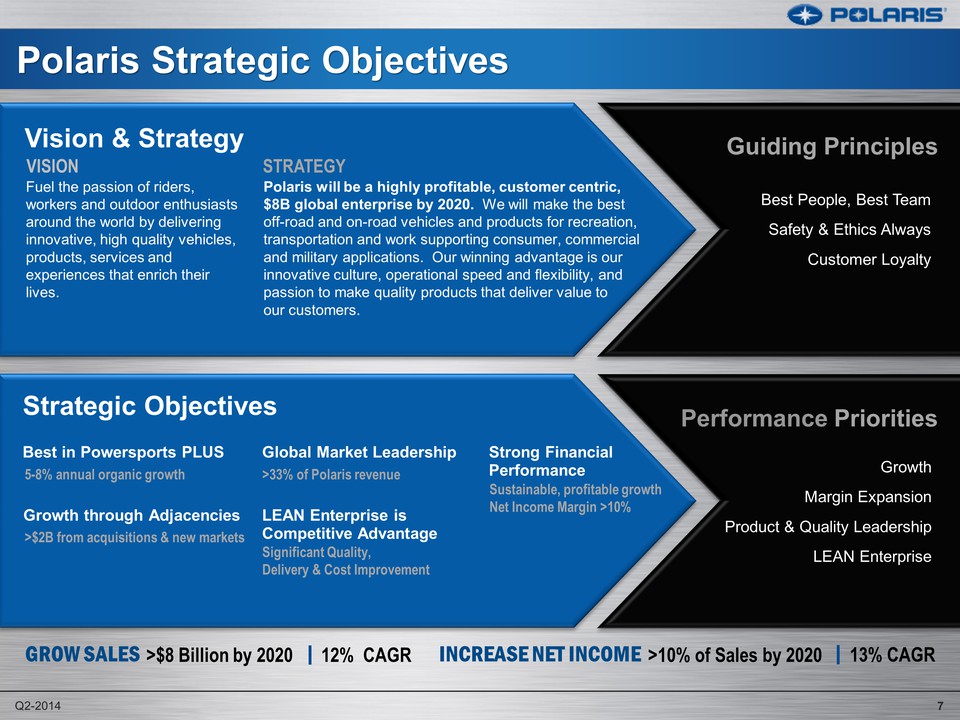
Polaris Strategic Objectives Vision & Strategy VISION Fuel the passion of riders, workers and outdoor enthusiasts around the world by delivering innovative, high quality vehicles, products, services and experiences that enrich their lives. STRATEGY Polaris will be a highly profitable, customer centric, $8B global enterprise by 2020. We will make the best off-road and on-road vehicles and products for recreation, transportation and work supporting consumer, commercial and military applications. Our winning advantage is our innovative culture, operational speed and flexibility, and passion to make quality products that deliver value to our customers. Guiding Principles Best People, Best Team Safety & Ethics Always Customer Loyalty Strategic Objectives Best in Powersports PLUS 5-8% annual organic growth Global Market Leadership >33% of Polaris revenue Strong Financial Performance Sustainable, profitable growth Net Income Margin >10% Growth through Adjacencies >$2B from acquisitions & new markets LEAN Enterprise is Competitive Advantage Significant Quality, Delivery & Cost Improvement Performance Priorities Growth Margin Expansion Product & Quality Leadership LEAN Enterprise GROW SALES >$8 Billion by 2020 12% CAGR INCREASE NET INCOME >10% of Sales by 2020 13% CAGR Q2-2014 7
Bennett Morgan President & COO POLARIS INDUSTRIES INC. Second Quarter 2014 Earnings Results July 22, 2014
N.A. Retail Sales & Dealer Inventory – Q2 2014 Best in Powersports Plus N.A. Powersports Retail Sales N.A. Dealer Inventory +15% +5% Polaris Q2 2014 Industry Q2 2014 +13% 3% Existing Models 7% New models/ categories 3% New Dealers 13% Total Increase Q2-2013 Q2-2014 Polaris N.A. retail 15% for Q2 2014 vs. Q2 2013 Gained share in ORV and motorcycles Polaris Q2 2014 N.A. dealer inventory 13% vs. Q2 2013 ORV low-teens % driven primarily by side-by-sides due to new models and market categories Motorcycles 20%; increased Indian distribution and shipments Snowmobiles and Small Vehicles low-single digits Dealer Inventory in Strong Position Heading into Model Year 2015 Launch Q2-2014 9
Off-Road Vehicles Best in Powersports PLUS ORV Sales ($ millions) $619.2 +13% $701.5 Q2 2013 Q2 2014 FY ‘14 Guidance 11% to 13% INCREASED (previous: +9% to +11%) New 2015 RANGER XP 900 with 13% more horsepower N.A. Q2 Polaris ORV retail sales low-double digits %; Industry high-single digits % Polaris side-by-sides low-teens %; ATVs mid-single digits % (excluding ACE) New Sportsman ACE selling well; all-new category Excellent MY’15 product introductions coming Pre-announced two MY’15 products: RANGER XP 900 with 13% more power and RZR 1000 with 110 hp Remain Clear Market Share Leader in ORV Q2-2014 10
Motorcycles Best in Powersports PLUS Motorcycle Sales ($ millions) $49.9 +107% $103.1 Q2 2013 Q2 2014 FY ‘14 Guidance 65% to 75% - UNCHANGED ˗ New 2015 Two-Tone Indian Chief Motorcycles Polaris N.A. motorcycle retail sales about 50% in Q2 Indian significantly: retail, share, and dealer expansion continues Victory retail sales mid-single digits % Heavyweight Industry about flat for Q2 Indian Motorcycle distribution expanding Over 150 N.A. dealers signed; 95+ currently retailing Pre-announced 3 new MY’15 Chiefs with two-tone paint schemes Additional compelling MY’15 product news coming International sales, shipments and distribution strong Celebrating One Year of Successful “Choice” for Consumers Q2-2014 11
Slingshot Growth Through Adjacencies Exhilarating on-road driving experience – consumer anticipation building Two initial models – base and premium trim levels Official public reveal on July 27th during 60th anniversary sales meeting The Worst Kept Secret in Powersports Q2-2014 12
Snowmobiles Snowmobile Sales Best in Powersports PLUS ($ millions) $8.5 $6.1 Q2 2013 Q2 2014 FY ‘14 Guidance mid-single digits % - UNCHANGED˗ MY’15 600 Switchback PRO-S Historically slow quarter for snowmobile shipments Final MY’15 orders slightly ahead of expectations Snowcheck orders strong Dealer inventories healthy Healthy Product Portfolio for Upcoming Season Q2-2014 13
PG&A Best in Powersports PLUS PG&A Sales ($ millions) $133.5 +20% $159.7 Q2 2013 Q2 2014 FY ‘14 Guidance About 20% ˗UNCHANGED˗ Record Q2 sales; 20% ORV sales 17%, Motorcycles 35%, Small Vehicles 21% All categories increased sales in Q2 Accessories 26%, Apparel 57%, Parts 9% Kolpin acquisition integration – strong start Significant MY’15 product launch next week Introducing ~350 MY’15 accessories Q2 2014 Sales by Category 52% 44% 4% Accessories Parts Apparel Q2 2014 Sales by Product Line 74% 11% 5% 5% 5% ORV Motorcycles Small Vehicles Other Snow Excellent Results Continue in Q2 Q2-2014 14
Defense / Commercial Growth Through Adjacencies 2014 Sales Expectations Defense FY 2013 Actual FY 2014 Expectations Commercial FY 2013 Actual FY 2014 Expectations Product Line of Light Utility Tactical Vehicles (“ULTV”) Q2 Defense revenue about 50%; more stable environment U.S. DoD FY’14 &’15 Budget signed International Sales in Q2 DAGOR completes family of Ultra-Light Combat Vehicles First DAGOR orders received: interest level high, SOP in September 2014 Revenue down mid-teens % in Q2 due to comparables National Accounts sales continue to grow, 50%+ in Q2 Defense Re-establishing Momentum in 2014 Q2-2014 15
Small Vehicles Growth Through Adjacencies Small Vehicle Sales ($ millions) $33.7 +29% $43.5 Q2 2013 Q2 2014 FY ‘14 Guidance 25% to 30% ˗UNCHANGED˗ Aixam Mega sales up over 40% in Q2 Aixam market share notably, #1 share New MY’14 vehicles well-received GEM & Goupil sales 6%, combined New products coming in 2nd Half Small Vehicle Brands People Movers GEM e6® Quadricycles Aixam Coupe Light Utility Haulers Mega e-Worker Tipper Goupil G3 Canvas Van Small Vehicles Performance Exceeding Expectations Q2-2014 16
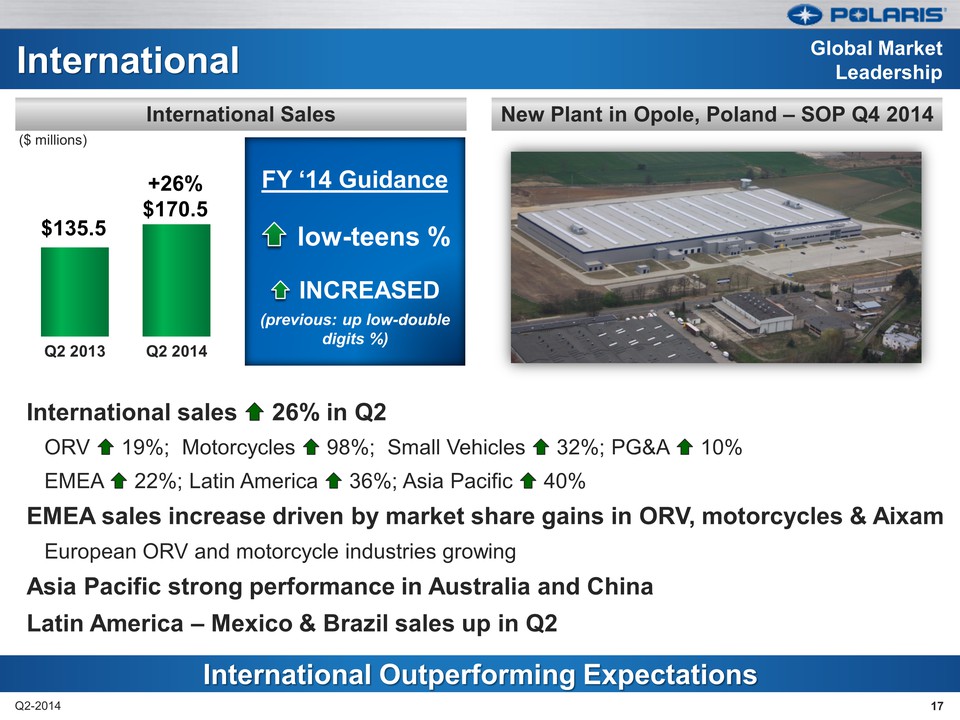
International Global Market Leadership International Sales ($ millions) $135.5 +26% $170.5 Q2 2013 Q2 2014 FY ‘14 Guidance low-teens % INCREASED (previous: up low-double digits %) New Plant in Opole, Poland – SOP Q4 2014 International sales 26% in Q2 ORV 19%; Motorcycles 98%; Small Vehicles 32%; PG&A 10% EMEA 22%; Latin America 36%; Asia Pacific 40% EMEA sales increase driven by market share gains in ORV, motorcycles & Aixam European ORV and motorcycle industries growing Asia Pacific strong performance in Australia and China Latin America – Mexico & Brazil sales up in Q2 International Outperforming Expectations Q2-2014 17
Operational Excellence LEAN Enterprise is Competitive Advantage Gross Margins 29.9% +20 bps 30.1% Q2 2013 Q2 2014 FY ‘14 Guidance 30-50 bps IMPROVED (previous: down 50-70 bps) LEAN initiatives driving productivity gains; +5% in Q2 RFM yielding results in motorcycles Implementing for ATVs in late 2014 Factory inventory 31% vs. 2013: product mix, acquisitions and new products Polaris quality improving #1 in NPS for Victory, SxS, ATVs Warranty expense down in Q2 Significant plant investments coming on-line in 2H’14 ORV near full production capacity in 2H’14 LEAN Initiatives “Tip to Tail” Value Stream Projects – great initial results YTD: 28 teams, over 8 Kaizen weeks Cumulative benefits in focus areas Assembly Cycle Time Changeover Cycle Time Inventory, tube fab & weld Lead-times BEFORE AFTER Eliminate Bulk Packaging + Relocate Tools & Materials into “Strike Zone” + Standard Work = Improved Efficiency LEAN = Customer Satisfaction / Improved Profitability Q2-2014 18
Mike Malone V.P Finance & CFO POLARIS INDUSTRIES INC. Second Quarter 2014 Earnings Results July 22, 2014
2014 Full Year Guidance METRIC GUIDANCE Product Line Sales Off-Road Vehicles Up 11% to 13% Snowmobiles Up mid-single digits % Motorcycles Up 65% to 75% Small Vehicles Up 25% to 30% PG&A Up about 20% International Up low-teens % Total Company Sales Up 16% to 18% Gross Margins Down 30 to 50 bps Operating Expenses Down 60 to 80 bps Income from Financial Services Up about 20% Income Taxes 34.25% to 34.5% of pretax income Net Income from continuing operations Up 16% to 18% EPS, Diluted from continuing operations $6.48 - $6.58 (+20% to 22%) Share Count Down 2% to 3% Change in Guidance Increased/favorable Decreased/unfavorable Unchanged Narrowed Raised Sales and Earnings Expectations Q2-2014 20
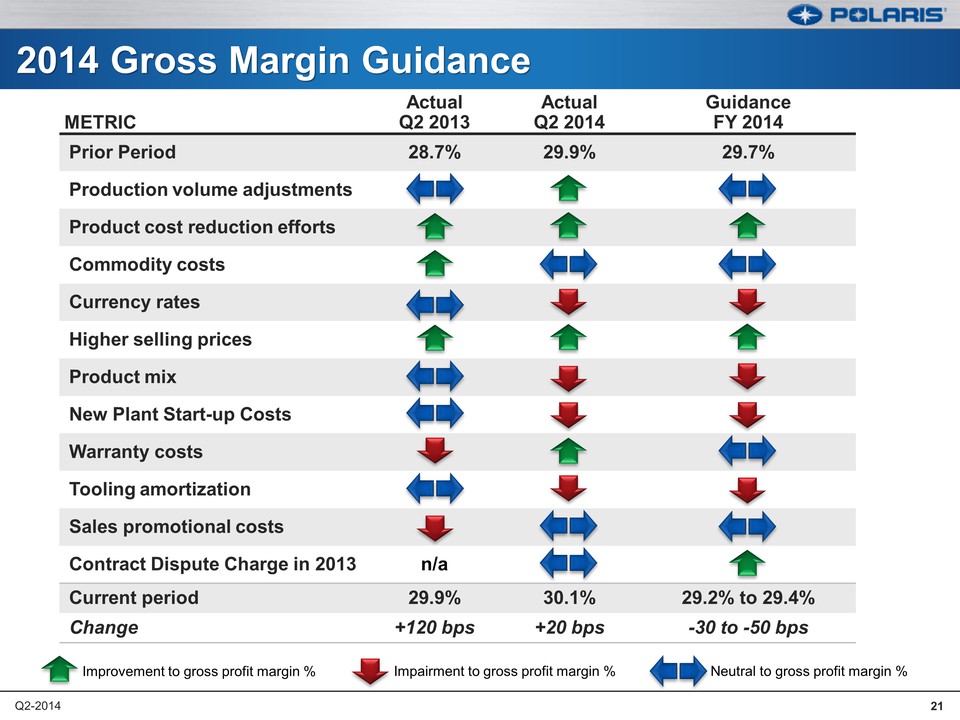
2014 Gross Margin Guidance METRIC Actual Q2 2013 Actual Q2 2014 Guidance FY 2014 Prior Period 28.7% 29.9% 29.7% Production volume adjustments Product cost reduction efforts Commodity costs Currency rates Higher selling prices Product mix New Plant Start-up Costs Warranty costs Tooling amortization Sales promotional costs Contract Dispute Charge in 2013 n/a Current period 29.9% 30.1% 29.2% to 29.4% Change +120 bps +20 bps -30 to -50 bps Improvement to gross profit margin % Impairment to gross profit margin % Neutral to gross profit margin % Q2-2014 21
Balance Sheet and Liquidity Profile $ In millions (except per share and rate data) YTD 2014 Fav / (UnFav) YTD 2013 2014 Full Year Guidance vs. 2013 Cash $119.0 ($98.6) Increase Debt / Capital Lease Obligations $367.6 ($260.0) Decrease Credit Facility $350.0 Flat Unchanged Factory Inventory $559.9 ($131.2) Increase similar to sales % Capital Expenditures $101.6 ($7.9) Lower, but > $200M Depreciation & Amortization $56.8 $17.5 Increase about 40% from 2013 Operating cash flow from continuing operations $130.9 $27.4 Increase at slightly higher % than net income Dividend (per share) $0.96 $0.12 Increase 14% over 2013 Polaris Acceptance Receivables $879.6 ($166.8) Increase upper single-digits % Retail Credit – Approval Rate – Penetration Rate 54% 32% (2%) (2%) Approval Rates stable; aggressive financing from other banks Healthy Balance Sheet & Liquidity Profile Remains Unchanged Q2-2014 22
Scott W. Wine Chairman & CEO POLARIS INDUSTRIES INC. Second Quarter 2014 Earnings Results July 22, 2014
Closing Comments 1st half results solid – leading into new product launch MY ‘15 product introductions – another year of “big” news ORV expanding #1 market share position Both ATVs and side-by-sides growing share Military winning orders with DAGOR vehicle Indian Motorcycles’ first full year a success More news coming! PG&A aggressively growing and adding value to customers Small Vehicles, Military and Commercial building capability & offerings Best team in the industry Innovation & Execution Expected to Drive Another Record Year Q2-2014 24
Thank you Questions?
9(WOY@JK&Z%O
MO`<=S4AV'_EH!]*`+*H G75XP^T;%8)-;3GO
M-"Y`+?QJR-UR:]L^U0?\]H_^^A7YT_L::5=?"_XR^-_!,4$EMIVB^+[62PAD
ME\W9!>6DP(#;5R&C6%N@^Z.XS7Z-#D"O"JTXT:LJ<7=+;T:NCWZLG6IT\0U9
MR3O_`(HNS?ST?K +S4M=3E6]#740
M245'#+YJ9(VL.&7T--N'8D11G$C]_P"Z.YH&-(^U2D'F&,\^C-_@/Y_2B$^0
M_D,?EZQD^GI^'\JFC18D5%&%`P!39HO.3&=K#E6]#ZT")**B@E\U#D;74X9?
M0TEQ(PQ'&?WC]#_=' OU-`"BU!A*.I_"@91F63
MSV_>*8 G\'Y]>F?PJT_^DR^
M6/\`5H
3
M_A3+:U\IFA>64O\`>#;S\X]?Z?E4\`,K&=AC(PBGLO\`B?\`"GSQ&105.)%.
M5;T/^%`AOV4?\])?^^S1]E'_`#TE_P"^S3X91-&&Q@]"IZ@]Q3R0`23@"@95
MGA6.,Y>5RWRA=Y^8^E16MKY#&)Y)-Y^8,'/S?_JZ?3%6(`9W\]A\O2,'L/7\
M?Y5)/%YJ<':ZG*MZ&@0S[*/^>DO_`'V:/LH_YZ2_]]FGPR^:F2-K`X9?0U)0
M,Y+XDZ=/-X+U%K3S)[JV$=Y##N),KPR+,J`=R3'C\:\]_9G^!UC\(HO'VM07
M4%\_C/Q%=Z_#<0DX6SEI-?HS]CB_NG_OH_XTR2
MW@B1G8$`?[1_QH"[/@:X_8/\;:IX4\&^$)M6L#X4T::.YNM+,GRZA<1H(TDF
M(YV)R?+`.2S#/.18_:7_`."9[?$[Q3H^M>$=:CTV5-.CL]1^U1[VN9H^%GZC
M!*G!`X&U<=*^Z%M%@832)A9#AP&/R>G_`->K?V.+^Z?^^C_C0";/B3]F;]@#
M4OA?XPBU;QGJT7B%;6WCM[=V;)2&,YBME4YVQAOG;GG:JXQG/FWBG_@EIXM3
MXEW'B;2O&T&L>9J+:DLFL6JRR22&0O\`O06`?GKZU^DGV.+^Z?\`OH_XTCVT
M$:%F!"@9)W'_`!H"[/S7\>_\$S?&WCWQ(FN7GB^V-_=_\?J6T20J2I`P@7&T
M[1R3OY(.3TKN_BS^P;XT\9_#S0/!&@:Q8:!X?M`ES?Q1YD-W<*NV)"Q(/EPJ
M2%!^\S.YY(Q]QBT6)OM#H0K_`'ERH]J2>7RDX&YV.%7U-`RO+;Q2R>2L2`=78*.!Z?4T0PPQN87CC)`R
MI*CYE_Q'^%6((O)3&=S$Y9O4U^;W[;O[1'Q)^'?[06IZ)X:\8ZCH^E16-I*E
MI;^7L5FC)8\J3R?>N_!8.>-J>R@TG:^IP8S%PP5/VLTVKVT/T?\`L\'_`#SC
M_P"^11]G@_YYQ_\`?(K\T_@?XF^/OQ^^'_C#5?#/Q1U5O$?A^X@":3-Y"I>0
MR(Y(5]GRR90XS\IZ$CK7CNJ_M6?';0]2NM.U'QUKUA?VLAAGM;F.-)(G'564
MQY!%>K#(ZDYRIQJQO'=:GESSNE"$:DJ ;]_]V;J@(^Z/0_7O_P#6JQ%*LJ!@,=B#U!]*U/S(3[5!
M_P`]H_\`OH4C7-NZE6EC((P06'->,_M8_M&6/[./PRGU8"*Y\1WY:VT>QEY$
MLV.9'`Y\N,'
GU/4_@.U9-C&EQ=?O,^3$
\;;-K963
MU3;=FK9QAAU.
"D^T!QZ%#U'X5Y]:>Z@ST:-*ZO-'I'P[_`."@WQ,\,7D3:GJ,?B.R
M!^>VU-`VX>SJ`RGWS^%?HC\`/CWX?^/_`(4.JZ/FTOK