Exhibit 99.2
Third Quarter 2013 Earnings Results October 22, 2013 POLARIS INDUSTRIES INC.
 Safe Harbor Safe
Harbor Except for historical information contained herein, the matters
set forth in this document, including but not limited to management’s
expectations regarding 2013 and 2014 sales, shipments, margins, and net
income and cash flow from both continuing and discontinued operations
are forward-looking statements that involve certain risks and
uncertainties that could cause actual results to differ materially from
those forward-looking statements. Potential risks and uncertainties
include such factors as product offerings, promotional activities and
pricing strategies by competitors; manufacturing operation initiatives;
acquisition integration costs; warranty expenses; impact of changes in
Polaris stock prices on incentive compensation; foreign currency
exchange rate fluctuations; environmental and product safety regulatory
activity; effects of weather; commodity costs; uninsured product
liability claims; uncertainty in the retail and wholesale credit
markets; changes in tax policy and overall economic conditions,
including inflation, consumer confidence and spending and relationships
with dealers and suppliers. Investors are also directed to consider
other risks and uncertainties discussed in our 2012 annual report and
Form 10-K filed by the Company with the Securities and Exchange
Commission. The Company does not undertake any duty to any person to
provide updates to its forward-looking statements. The data source for
retail sales figures included in this presentation is registration
information provided by Polaris dealers in North America and compiled by
the Company or Company estimates. The Company must rely on information
that its dealers supply concerning retail sales, and other retail sales
data sources and this information is subject to revision. 2 Q3-2013
Safe Harbor Safe
Harbor Except for historical information contained herein, the matters
set forth in this document, including but not limited to management’s
expectations regarding 2013 and 2014 sales, shipments, margins, and net
income and cash flow from both continuing and discontinued operations
are forward-looking statements that involve certain risks and
uncertainties that could cause actual results to differ materially from
those forward-looking statements. Potential risks and uncertainties
include such factors as product offerings, promotional activities and
pricing strategies by competitors; manufacturing operation initiatives;
acquisition integration costs; warranty expenses; impact of changes in
Polaris stock prices on incentive compensation; foreign currency
exchange rate fluctuations; environmental and product safety regulatory
activity; effects of weather; commodity costs; uninsured product
liability claims; uncertainty in the retail and wholesale credit
markets; changes in tax policy and overall economic conditions,
including inflation, consumer confidence and spending and relationships
with dealers and suppliers. Investors are also directed to consider
other risks and uncertainties discussed in our 2012 annual report and
Form 10-K filed by the Company with the Securities and Exchange
Commission. The Company does not undertake any duty to any person to
provide updates to its forward-looking statements. The data source for
retail sales figures included in this presentation is registration
information provided by Polaris dealers in North America and compiled by
the Company or Company estimates. The Company must rely on information
that its dealers supply concerning retail sales, and other retail sales
data sources and this information is subject to revision. 2 Q3-2013
Scott Wine Chairman & CEO Third Quarter 2013 Earnings Results October 22, 2013 POLARIS INDUSTRIES INC.
 $94.3 $116.9 Q3
2012Q3 2013+24% Q3 2013 Sales and Net Income Q3 2013 Sales and Net
Income Record 3rd quarter sales and net income from continuing
operations ORV Sales remained strong up 23%, snowmobiles up 25% and PG&A
up 37% International Sales up 38%, includes Aixam Mega acquisition sales
EMEA region grew 52% Earnings per share from continuing operations up
23% to a record $1.64 Gross Profit Margin up 90 bps Operating Income
from continuing operations increased 28% to $181.3 million Q3-2013
$879.9 $1,102.6 Q3 2012Q3 2013+25% Exceeded $1 Billion – First Time in
Company History Q3 Sales Exceeded $1 Billion – First Time in Company
History Q3 Net Income from Continuing Operations Q3 Sales 4 (in
millions) (in millions)
$94.3 $116.9 Q3
2012Q3 2013+24% Q3 2013 Sales and Net Income Q3 2013 Sales and Net
Income Record 3rd quarter sales and net income from continuing
operations ORV Sales remained strong up 23%, snowmobiles up 25% and PG&A
up 37% International Sales up 38%, includes Aixam Mega acquisition sales
EMEA region grew 52% Earnings per share from continuing operations up
23% to a record $1.64 Gross Profit Margin up 90 bps Operating Income
from continuing operations increased 28% to $181.3 million Q3-2013
$879.9 $1,102.6 Q3 2012Q3 2013+25% Exceeded $1 Billion – First Time in
Company History Q3 Sales Exceeded $1 Billion – First Time in Company
History Q3 Net Income from Continuing Operations Q3 Sales 4 (in
millions) (in millions)
 Indian Motorcycle
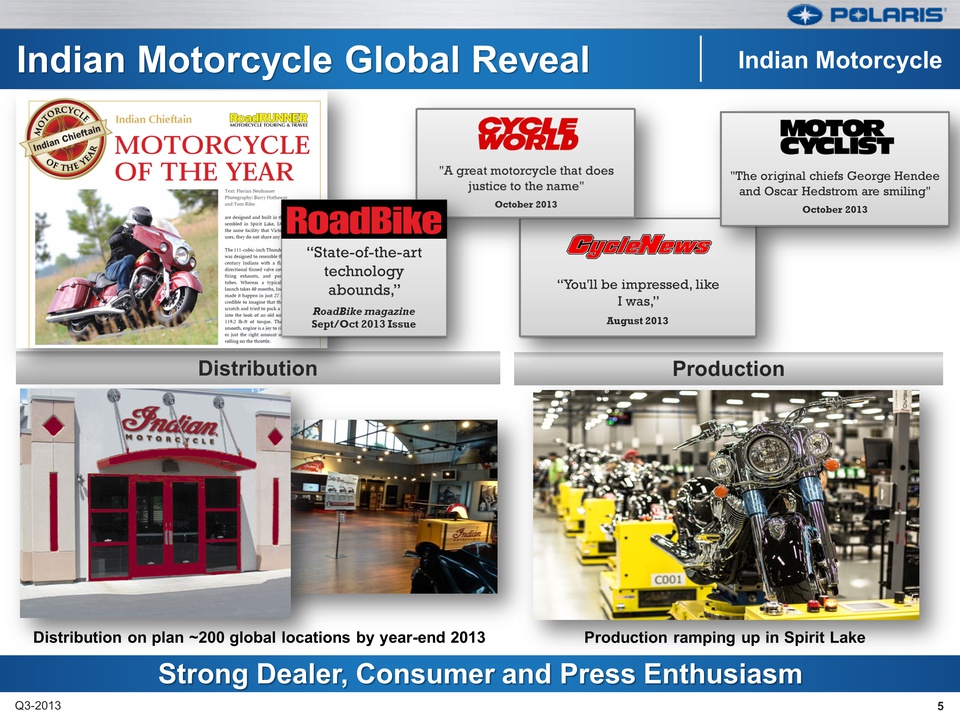
Global Reveal Indian Motorcycle Global Reveal Production Distribution
Strong Dealer, Consumer and Press Enthusiasm Strong Dealer, Consumer and
Press Enthusiasm Indian Motorcycle Production ramping up in Spirit Lake
Distribution on plan ~200 global locations by year-end 2013 Q3-2013
Indian Motorcycle
Global Reveal Indian Motorcycle Global Reveal Production Distribution
Strong Dealer, Consumer and Press Enthusiasm Strong Dealer, Consumer and
Press Enthusiasm Indian Motorcycle Production ramping up in Spirit Lake
Distribution on plan ~200 global locations by year-end 2013 Q3-2013
 Full Year 2013
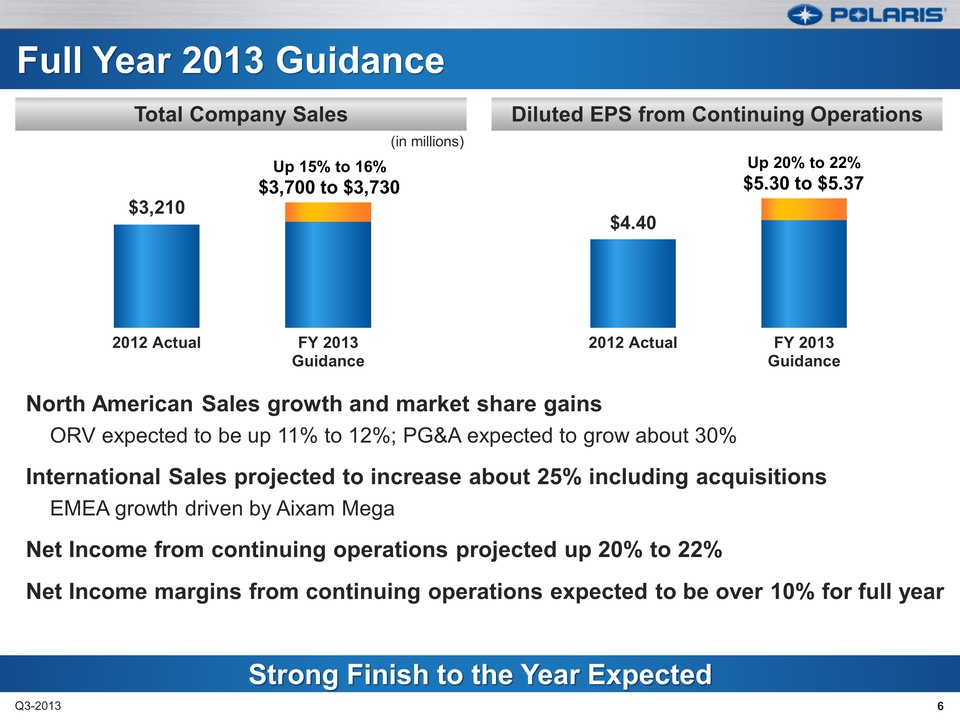
Guidance Full Year 2013 Guidance North American Sales growth and market
share gains ORV expected to be up 11% to 12%; PG&A expected to grow
about 30% International Sales projected to increase about 25% including
acquisitions EMEA growth driven by Aixam Mega Net Income from continuing
operations projected up 20% to 22% Net Income margins from continuing
operations expected to be over 10% for full year Q3-2013 $3,210 2012
ActualFY 2013Guidance$4.40 2012 ActualFY 2013GuidanceStrong Finish to
the Expected Strong Finish to the Year Expected Diluted EPS from
Continuing Operations Total Company Sales Up 15% to 16% $3,700 to $3,730
Up 20% to 22% $5.30 to $5.37 6 (in millions)
Full Year 2013
Guidance Full Year 2013 Guidance North American Sales growth and market
share gains ORV expected to be up 11% to 12%; PG&A expected to grow
about 30% International Sales projected to increase about 25% including
acquisitions EMEA growth driven by Aixam Mega Net Income from continuing
operations projected up 20% to 22% Net Income margins from continuing
operations expected to be over 10% for full year Q3-2013 $3,210 2012
ActualFY 2013Guidance$4.40 2012 ActualFY 2013GuidanceStrong Finish to
the Expected Strong Finish to the Year Expected Diluted EPS from
Continuing Operations Total Company Sales Up 15% to 16% $3,700 to $3,730
Up 20% to 22% $5.30 to $5.37 6 (in millions)
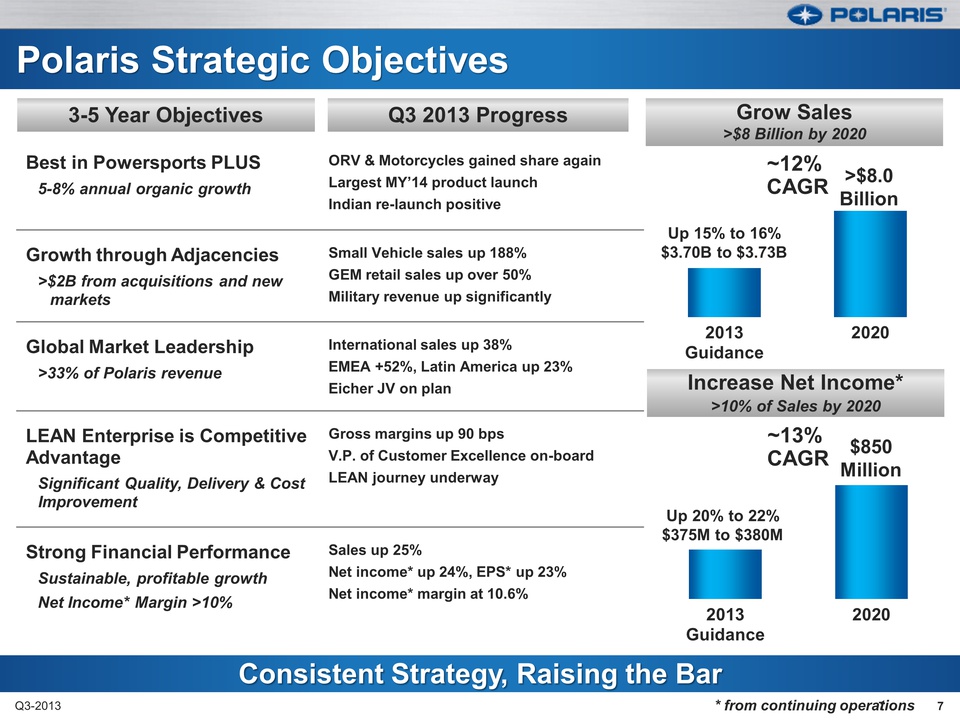 2013Guidance20202013Guidance2020Grow
Sales >$8 Billion by 2020 Q3 2013 Progress Polaris Strategic Objectives
Polaris Strategic Objectives 7 Q3-2013 3-5 Year Objectives Best in
Powersports PLUS 5-8% annual organic growth ORV & Motorcycles gained
share again Largest MY’14 product launch Indian re-launch positive
Growth through Adjacencies >$2B from acquisitions and new markets Small
Vehicle sales up 188% GEM retail sales up over 50% Military revenue up
significantly Global Market Leadership >33% of Polaris revenue
International sales up 38% EMEA +52%, Latin America up 23% Eicher JV on
plan LEAN Enterprise is Competitive Advantage Significant Quality,
Delivery & Cost Improvement Gross margins up 90 bps V.P. of Customer
Excellence on-board LEAN journey underway Strong Financial Performance
Sustainable, profitable growth Net Income* Margin >10% Sales up 25% Net
income* up 24%, EPS* up 23% Net income* margin at 10.6% Consistent
Strategy, Raising the Bar Consistent Strategy, Raising the Bar Increase
Net Income* >10% of Sales by 2020 7 ~12% CAGR ~13% CAGR Up 15% to 16%
$3.70B to $3.73B Up 20% to 22% $375M to $380M $850 Million >$8.0 Billion
* from continuing operations
2013Guidance20202013Guidance2020Grow
Sales >$8 Billion by 2020 Q3 2013 Progress Polaris Strategic Objectives
Polaris Strategic Objectives 7 Q3-2013 3-5 Year Objectives Best in
Powersports PLUS 5-8% annual organic growth ORV & Motorcycles gained
share again Largest MY’14 product launch Indian re-launch positive
Growth through Adjacencies >$2B from acquisitions and new markets Small
Vehicle sales up 188% GEM retail sales up over 50% Military revenue up
significantly Global Market Leadership >33% of Polaris revenue
International sales up 38% EMEA +52%, Latin America up 23% Eicher JV on
plan LEAN Enterprise is Competitive Advantage Significant Quality,
Delivery & Cost Improvement Gross margins up 90 bps V.P. of Customer
Excellence on-board LEAN journey underway Strong Financial Performance
Sustainable, profitable growth Net Income* Margin >10% Sales up 25% Net
income* up 24%, EPS* up 23% Net income* margin at 10.6% Consistent
Strategy, Raising the Bar Consistent Strategy, Raising the Bar Increase
Net Income* >10% of Sales by 2020 7 ~12% CAGR ~13% CAGR Up 15% to 16%
$3.70B to $3.73B Up 20% to 22% $375M to $380M $850 Million >$8.0 Billion
* from continuing operations
Bennett Morgan President & COO Third Quarter 2013 Earnings Results October 22, 2013 POLARIS INDUSTRIES INC.
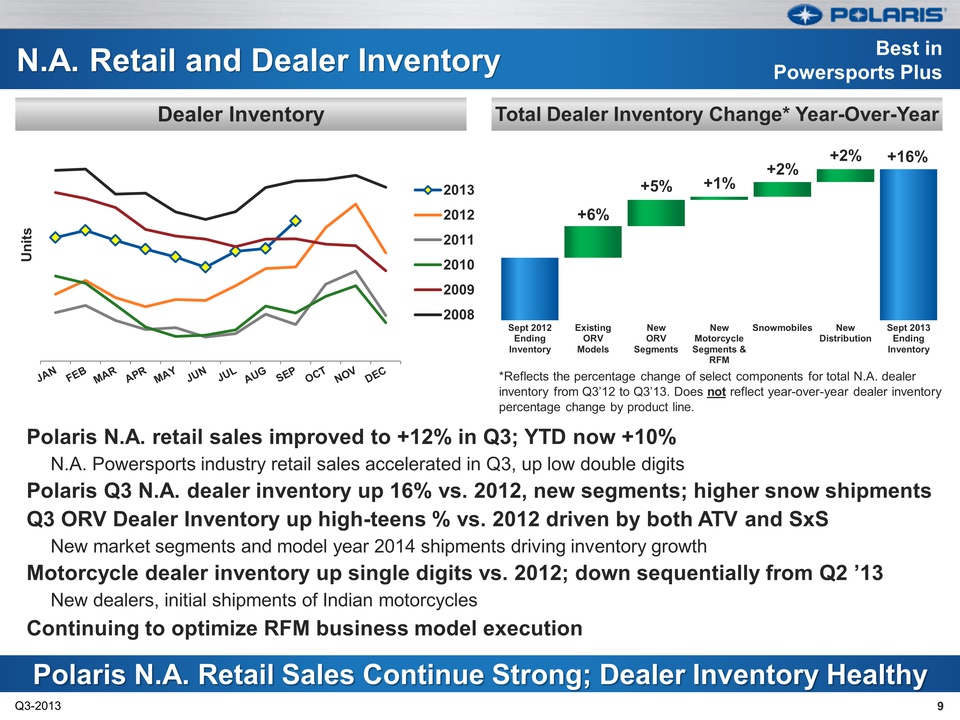 N.A. Retail and
Dealer Inventory N.A. Retail and Dealer Inventory Q3-2013 Polaris Sales
Continue Strong; Healthy Polaris N.A. Retail Sales Continue Strong;
Dealer Inventory Healthy Total Dealer Inventory Change* Year-Over-Year
Dealer Inventory Best in Powersports Plus
JANFEBMARAPRMAYJUNJULAUGSEPOCTNOVDECUnits
201320122011201020092008Polaris N.A. retail sales improved to +12% in
Q3; YTD now +10% N.A. Powersports industry retail sales accelerated in
Q3, up low double digits Polaris Q3 N.A. dealer inventory up 16% vs.
2012, new segments; higher snow shipments Q3 ORV Dealer Inventory up
high-teens % vs. 2012 driven by both ATV and SxS New market segments and
model year 2014 shipments driving inventory growth Motorcycle dealer
inventory up single digits vs. 2012; down sequentially from Q2 ’13 New
dealers, initial shipments of Indian motorcycles Continuing to optimize
RFM business model execution *Reflects the percentage change of select
components for total N.A. dealer inventory from Q3’12 to Q3’13. Does not
reflect year-over-year dealer inventory percentage change by product
line. 9 +16% +6% +5% +1% +2% +2% Sept
2012EndingInventoryExistingORVModelsNewORVSegmentsNewMotorcycleSegments
&RFMSnowmobilesNewDistributionSept 2013EndingInventory
N.A. Retail and
Dealer Inventory N.A. Retail and Dealer Inventory Q3-2013 Polaris Sales
Continue Strong; Healthy Polaris N.A. Retail Sales Continue Strong;
Dealer Inventory Healthy Total Dealer Inventory Change* Year-Over-Year
Dealer Inventory Best in Powersports Plus
JANFEBMARAPRMAYJUNJULAUGSEPOCTNOVDECUnits
201320122011201020092008Polaris N.A. retail sales improved to +12% in
Q3; YTD now +10% N.A. Powersports industry retail sales accelerated in
Q3, up low double digits Polaris Q3 N.A. dealer inventory up 16% vs.
2012, new segments; higher snow shipments Q3 ORV Dealer Inventory up
high-teens % vs. 2012 driven by both ATV and SxS New market segments and
model year 2014 shipments driving inventory growth Motorcycle dealer
inventory up single digits vs. 2012; down sequentially from Q2 ’13 New
dealers, initial shipments of Indian motorcycles Continuing to optimize
RFM business model execution *Reflects the percentage change of select
components for total N.A. dealer inventory from Q3’12 to Q3’13. Does not
reflect year-over-year dealer inventory percentage change by product
line. 9 +16% +6% +5% +1% +2% +2% Sept
2012EndingInventoryExistingORVModelsNewORVSegmentsNewMotorcycleSegments
&RFMSnowmobilesNewDistributionSept 2013EndingInventory
 Victory® Cross
Country 8-Ball Cross Roads 8-Ball MY’14 Victory Factory Custom Paint
Program Indian® Chief® Classic Chief® Vintage Chieftain® RANGER® CREW
900 570 EFI CREW 570 EFI RZR® XP 1000 XP 4 1000 (Oct. ’13) 800 XC
Sportsman® 570 EFI ` Touring 570 EFI 850 LE’s Model Year 2014 New
Product Introductions Model Year 2014 New Product Introductions Q3-2013
Largest Launch in Polaris History Largest New Product Launch in Polaris
History MY’14 MOTORCYCLES MY’14 OFF-ROAD VEHICLES 10
Victory® Cross
Country 8-Ball Cross Roads 8-Ball MY’14 Victory Factory Custom Paint
Program Indian® Chief® Classic Chief® Vintage Chieftain® RANGER® CREW
900 570 EFI CREW 570 EFI RZR® XP 1000 XP 4 1000 (Oct. ’13) 800 XC
Sportsman® 570 EFI ` Touring 570 EFI 850 LE’s Model Year 2014 New
Product Introductions Model Year 2014 New Product Introductions Q3-2013
Largest Launch in Polaris History Largest New Product Launch in Polaris
History MY’14 MOTORCYCLES MY’14 OFF-ROAD VEHICLES 10
 SxS SxS ATV ATV FY
2012FY 2013GuidanceSxS SxS ATV ATV Q3 2012Q3 2013Industry Polaris Best
in Powersports Plus Best in Powersports Plus Q3-2013 N.A. ORV Retail
Sales Q3 2013 Polaris ORV Sales ($ in millions) ORV on the Gas with
Product News ORV on the Gas with Product News Polaris retail up in Q3 Q3
2013 retail sales for ORV were up low-teens % Both side-by-sides and
ATVs experience double digit retail sales growth Market share remains
strong in ORVs Model Year ’14 products well-received & shipping RZR XP
1000 high initial retail turns <10 days RZR XP 4 1000 just announced –
shipping mid-Q4 More MY 14.5 ORV news coming Off-Road Vehicles Up 11% -
12% +23% $702.0 +22% $2,226 $573.0 Up low-double digits% Up low- teens %
Q3 2013 HARDEST WORKING SMOOTHEST RIDING WORKINGSMOOTHEST RIDINGRAZOR
SHARP PERFORMANCE RAZOR RANGER® CREW® 900 RZR® XP 1000 11 Sportsman® 570
EFI
SxS SxS ATV ATV FY
2012FY 2013GuidanceSxS SxS ATV ATV Q3 2012Q3 2013Industry Polaris Best
in Powersports Plus Best in Powersports Plus Q3-2013 N.A. ORV Retail
Sales Q3 2013 Polaris ORV Sales ($ in millions) ORV on the Gas with
Product News ORV on the Gas with Product News Polaris retail up in Q3 Q3
2013 retail sales for ORV were up low-teens % Both side-by-sides and
ATVs experience double digit retail sales growth Market share remains
strong in ORVs Model Year ’14 products well-received & shipping RZR XP
1000 high initial retail turns <10 days RZR XP 4 1000 just announced –
shipping mid-Q4 More MY 14.5 ORV news coming Off-Road Vehicles Up 11% -
12% +23% $702.0 +22% $2,226 $573.0 Up low-double digits% Up low- teens %
Q3 2013 HARDEST WORKING SMOOTHEST RIDING WORKINGSMOOTHEST RIDINGRAZOR
SHARP PERFORMANCE RAZOR RANGER® CREW® 900 RZR® XP 1000 11 Sportsman® 570
EFI
 12 Q3-2013 Growth
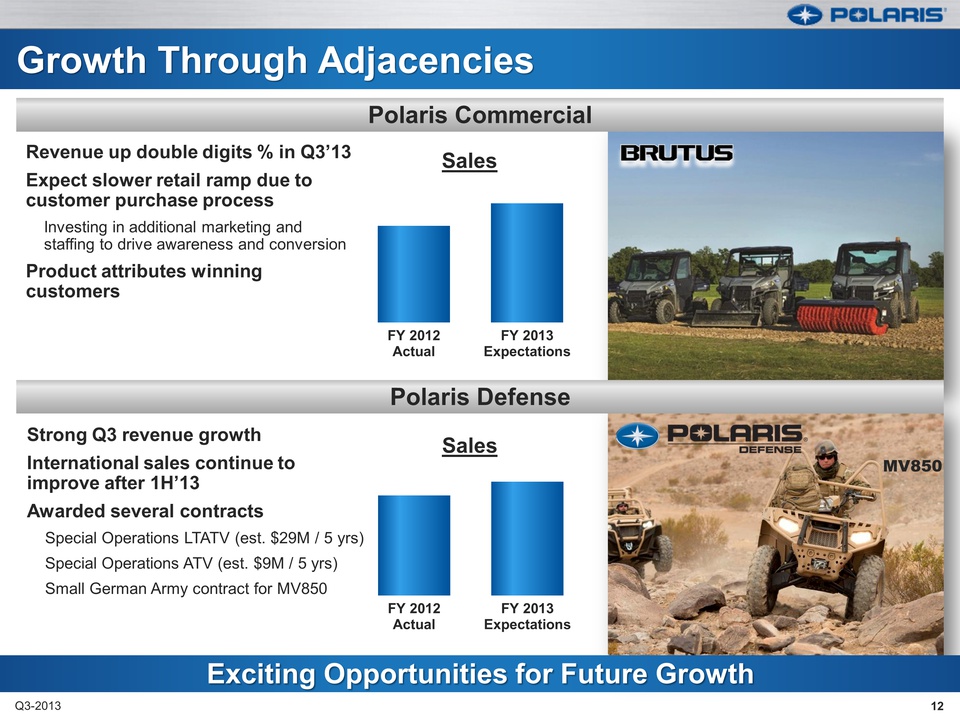
Through Adjacencies Growth Through Adjacencies Polaris Defense Exciting
Opportunities for Future Exciting Opportunities for Future Growth
Polaris Commercial Revenue up double digits % in Q3’13 Expect slower
retail ramp due to customer purchase process Investing in additional
marketing and staffing to drive awareness and conversion Product
attributes winning customers Strong Q3 revenue growth International
sales continue to improve after 1H’13 Awarded several contracts Special
Operations LTATV (est. $29M / 5 yrs) Special Operations ATV (est. $9M /
5 yrs) Small German Army contract for MV850 MV850 FY 2012ActualFY
2013ExpectationsSales FY 2012ActualFY 2013ExpectationsSales
12 Q3-2013 Growth
Through Adjacencies Growth Through Adjacencies Polaris Defense Exciting
Opportunities for Future Exciting Opportunities for Future Growth
Polaris Commercial Revenue up double digits % in Q3’13 Expect slower
retail ramp due to customer purchase process Investing in additional
marketing and staffing to drive awareness and conversion Product
attributes winning customers Strong Q3 revenue growth International
sales continue to improve after 1H’13 Awarded several contracts Special
Operations LTATV (est. $29M / 5 yrs) Special Operations ATV (est. $9M /
5 yrs) Small German Army contract for MV850 MV850 FY 2012ActualFY
2013ExpectationsSales FY 2012ActualFY 2013ExpectationsSales
 Q3 2012Q3 2013FY
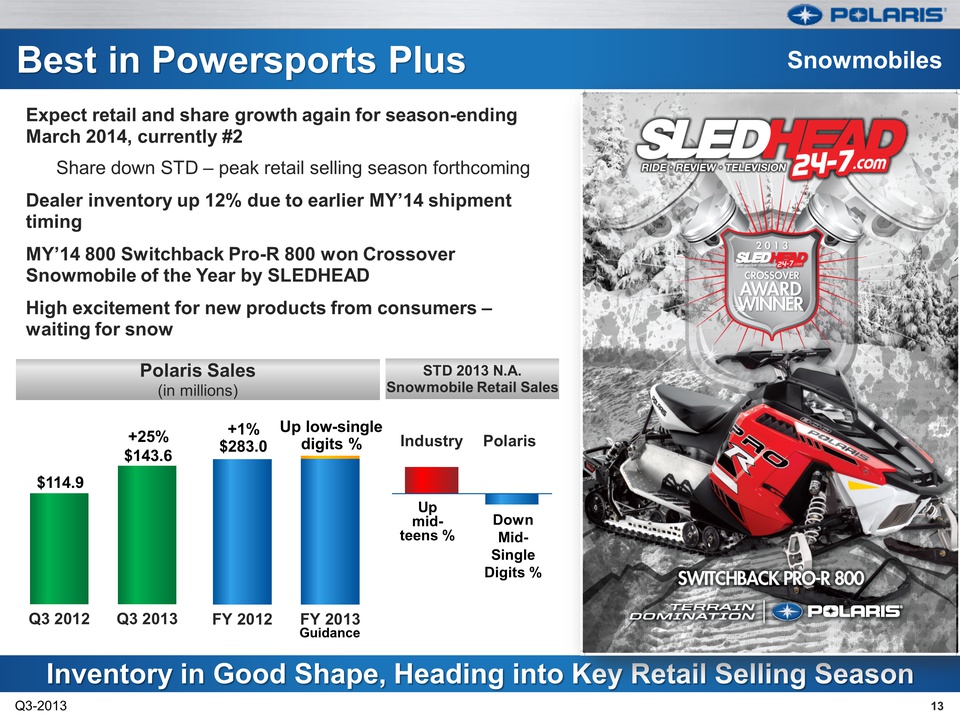
2012FY 201313 Q3-2013 Expect retail and share growth again for
season-ending March 2014, currently #2 Share down STD – peak retail
selling season forthcoming Dealer inventory up 12% due to earlier MY’14
shipment timing MY’14 800 Switchback Pro-R 800 won Crossover Snowmobile
of the Year by SLEDHEAD High excitement for new products from consumers
– waiting for snow Best in Powersports Plus Best in Powersports Plus STD
2013 N.A. Snowmobile Retail Sales Polaris Sales (in millions) Inventory
Good Shape, Heading into Key Retail Selling Season Inventory in Good
Shape, Heading into Key Retail Selling Season Snowmobiles Up low-single
digits % +25% $143.6 +1% $283.0 $114.9 Guidance IndustryPolarisUp
mid-teens % Down Mid- Single Digits % UPDATE
Q3 2012Q3 2013FY
2012FY 201313 Q3-2013 Expect retail and share growth again for
season-ending March 2014, currently #2 Share down STD – peak retail
selling season forthcoming Dealer inventory up 12% due to earlier MY’14
shipment timing MY’14 800 Switchback Pro-R 800 won Crossover Snowmobile
of the Year by SLEDHEAD High excitement for new products from consumers
– waiting for snow Best in Powersports Plus Best in Powersports Plus STD
2013 N.A. Snowmobile Retail Sales Polaris Sales (in millions) Inventory
Good Shape, Heading into Key Retail Selling Season Inventory in Good
Shape, Heading into Key Retail Selling Season Snowmobiles Up low-single
digits % +25% $143.6 +1% $283.0 $114.9 Guidance IndustryPolarisUp
mid-teens % Down Mid- Single Digits % UPDATE
 Best in Powersports
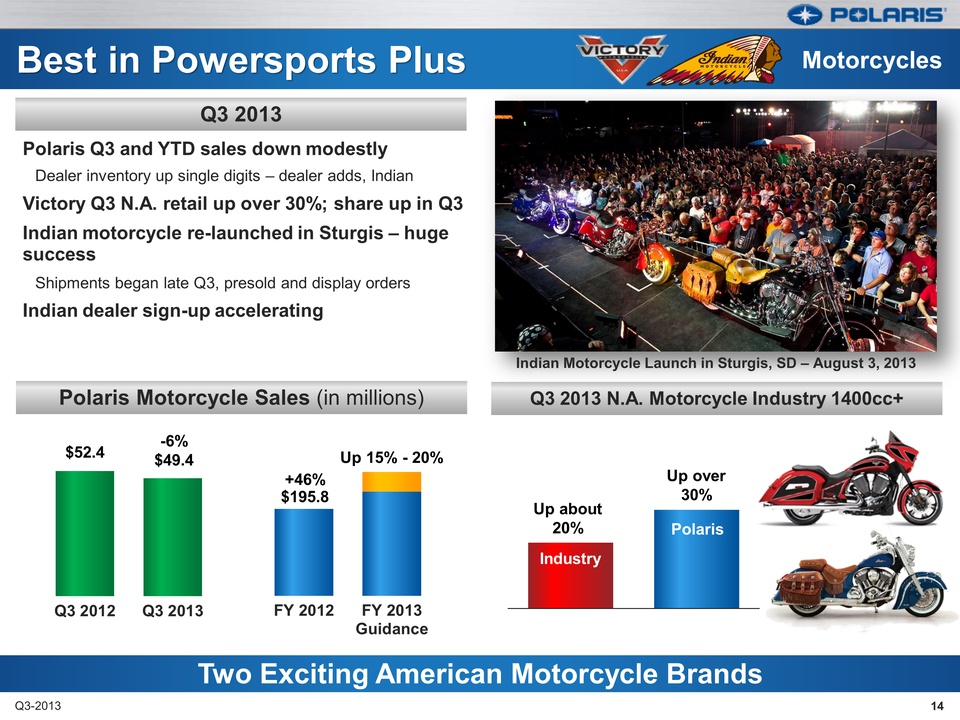
Plus Best in Powersports Plus Q3-2013 Q3 2013 N.A. Motorcycle Industry
1400cc+ Polaris Motorcycle Sales (in millions) Q3 2013 Two Exciting
American Motorcycle Brands Polaris Q3 and YTD sales down modestly Dealer
inventory up single digits – dealer adds, Indian Victory Q3 N.A. retail
up over 30%; share up in Q3 Indian motorcycle re-launched in Sturgis –
huge success Shipments began late Q3, presold and display orders Indian
dealer sign-up accelerating Motorcycles FY 2012FY 2013GuidanceUp 15% -
20% +46% $195.8 Q3 2012Q3 2013$52.4 -6% $49.4 Up about 20% Up over 30%
14 Industry Polaris Indian Motorcycle Launch in Sturgis, SD – August 3,
2013
Best in Powersports
Plus Best in Powersports Plus Q3-2013 Q3 2013 N.A. Motorcycle Industry
1400cc+ Polaris Motorcycle Sales (in millions) Q3 2013 Two Exciting
American Motorcycle Brands Polaris Q3 and YTD sales down modestly Dealer
inventory up single digits – dealer adds, Indian Victory Q3 N.A. retail
up over 30%; share up in Q3 Indian motorcycle re-launched in Sturgis –
huge success Shipments began late Q3, presold and display orders Indian
dealer sign-up accelerating Motorcycles FY 2012FY 2013GuidanceUp 15% -
20% +46% $195.8 Q3 2012Q3 2013$52.4 -6% $49.4 Up about 20% Up over 30%
14 Industry Polaris Indian Motorcycle Launch in Sturgis, SD – August 3,
2013
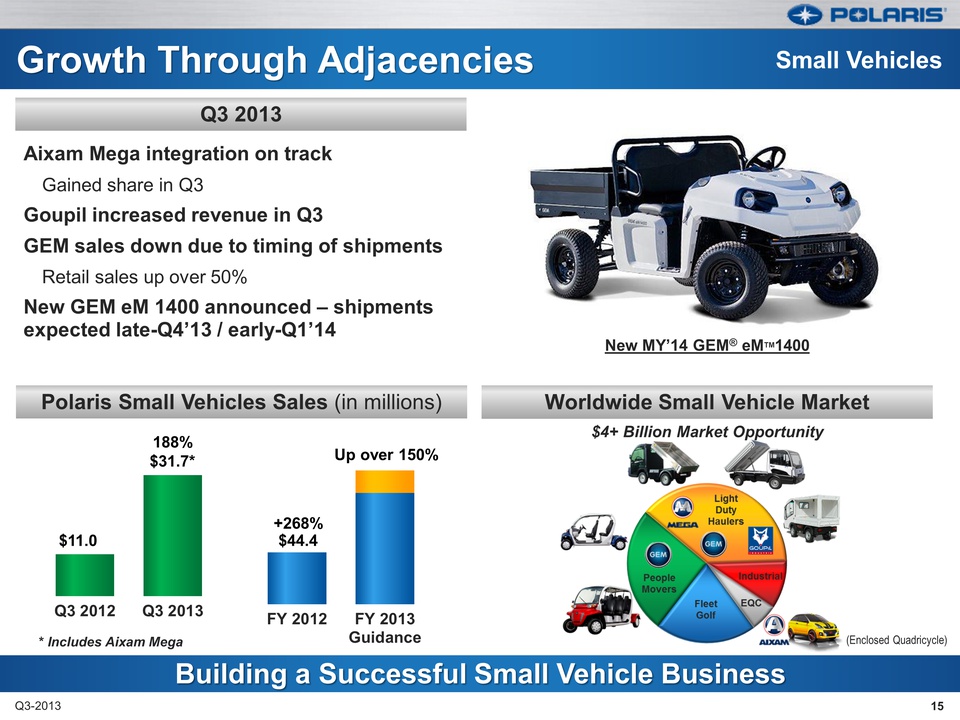 Growth Through
Adjacencies Growth Through Adjacencies Q3-2013 Polaris Small Vehicles
Sales (in millions) Q3 2013 Building a Successful Small Vehicle Business
Building a Successful Small Vehicle Business Aixam Mega integration on
track Gained share in Q3 Goupil increased revenue in Q3 GEM sales down
due to timing of shipments Retail sales up over 50% New GEM eM 1400
announced – shipments expected late-Q4’13 / early-Q1’14 Small Vehicles
FY 2012FY 2013GuidanceUp over 150% +268% $44.4 Q3 2012Q3 2013$11.0 188%
$31.7* * Includes Aixam Mega 15 $4+ Billion Market Opportunity (Enclosed
Quadricycle) New MY’14 GEM® eMTM1400 Worldwide Small Vehicle Market
Growth Through
Adjacencies Growth Through Adjacencies Q3-2013 Polaris Small Vehicles
Sales (in millions) Q3 2013 Building a Successful Small Vehicle Business
Building a Successful Small Vehicle Business Aixam Mega integration on
track Gained share in Q3 Goupil increased revenue in Q3 GEM sales down
due to timing of shipments Retail sales up over 50% New GEM eM 1400
announced – shipments expected late-Q4’13 / early-Q1’14 Small Vehicles
FY 2012FY 2013GuidanceUp over 150% +268% $44.4 Q3 2012Q3 2013$11.0 188%
$31.7* * Includes Aixam Mega 15 $4+ Billion Market Opportunity (Enclosed
Quadricycle) New MY’14 GEM® eMTM1400 Worldwide Small Vehicle Market
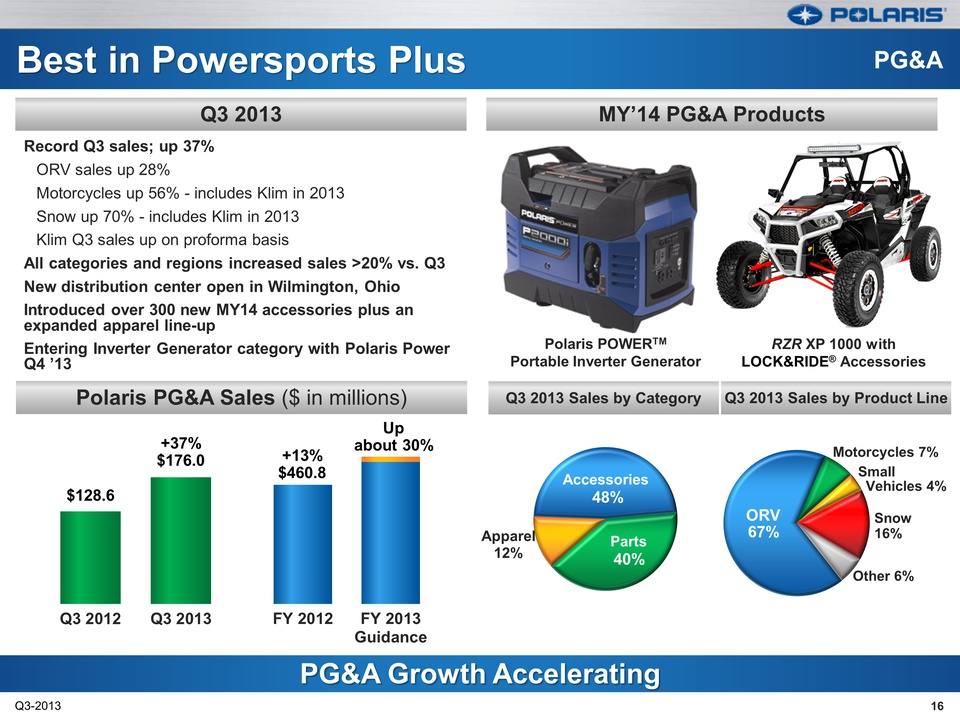 ORV 67% FY 2012FY
2013GuidanceBest in Powersports Plus Best in Powersports Plus Q3-2013
Polaris PG&A Sales ($ in millions) Q3 2013 PG&A Growth Accelerating PG&A
Growth Accelerating Record Q3 sales; up 37% ORV sales up 28% Motorcycles
up 56% - includes Klim in 2013 Snow up 70% - includes Klim in 2013 Klim
Q3 sales up on proforma basis All categories and regions increased sales
>20% vs. Q3 New distribution center open in Wilmington, Ohio Introduced
over 300 new MY14 accessories plus an expanded apparel line-up Entering
Inverter Generator category with Polaris Power Q4 ’13 48% Parts 40%
Apparel 12% Q3 2012Q3 2013+37% $176.0 +13% $460.8 $128.6 Up about 30%
Accessories Q3 2013 Sales by Category Q3 2013 Sales by Product Line
MY’14 PG&A Products Motorcycles 7% Small Vehicles 4% Snow 16% Other 6%
PG&A 16 Polaris POWERTM Portable Inverter Generator RZR XP 1000 with
LOCK&RIDE® Accessories
ORV 67% FY 2012FY
2013GuidanceBest in Powersports Plus Best in Powersports Plus Q3-2013
Polaris PG&A Sales ($ in millions) Q3 2013 PG&A Growth Accelerating PG&A
Growth Accelerating Record Q3 sales; up 37% ORV sales up 28% Motorcycles
up 56% - includes Klim in 2013 Snow up 70% - includes Klim in 2013 Klim
Q3 sales up on proforma basis All categories and regions increased sales
>20% vs. Q3 New distribution center open in Wilmington, Ohio Introduced
over 300 new MY14 accessories plus an expanded apparel line-up Entering
Inverter Generator category with Polaris Power Q4 ’13 48% Parts 40%
Apparel 12% Q3 2012Q3 2013+37% $176.0 +13% $460.8 $128.6 Up about 30%
Accessories Q3 2013 Sales by Category Q3 2013 Sales by Product Line
MY’14 PG&A Products Motorcycles 7% Small Vehicles 4% Snow 16% Other 6%
PG&A 16 Polaris POWERTM Portable Inverter Generator RZR XP 1000 with
LOCK&RIDE® Accessories
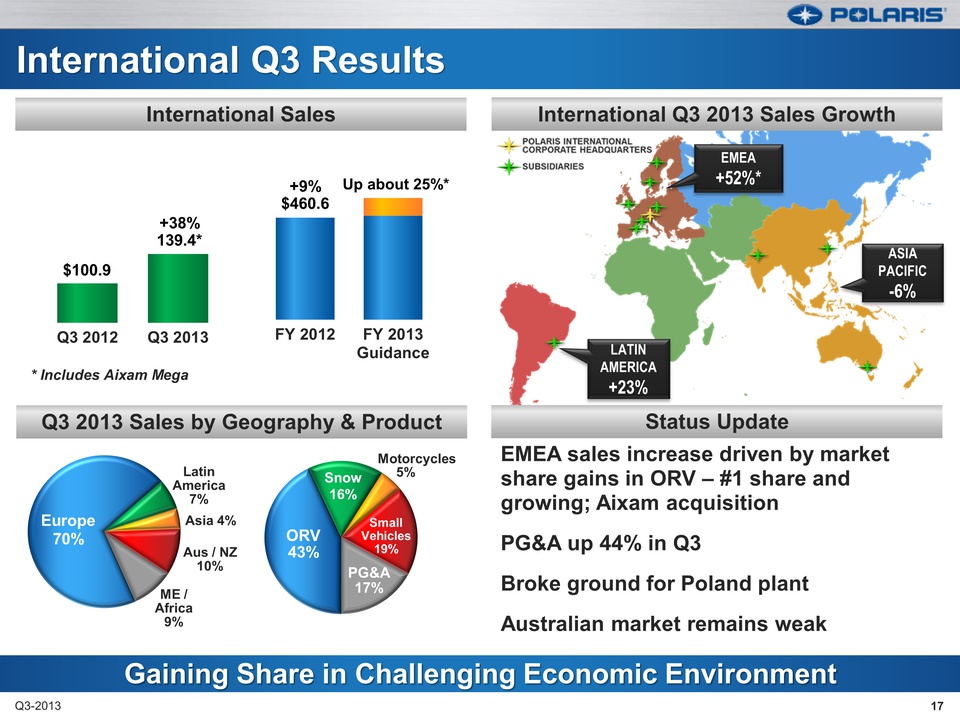 International Q3
Results International Q3 Results Q3-2013 2013 Objectives Gaining Share
in Challenging Economic Environment Gaining Share in Challenging
Economic Environment ORV 43% Small Vehicles 19% PG&A 17% Q3 2012Q3
2013FY 2012FY 2013GuidanceUp about 25%* +38% 139.4* +9% $460.6 $100.9
Europe 70% Latin America 7% Asia 4% Aus / NZ 10% ME / Africa 9% *
Includes Aixam Mega Polaris International Sales (in millions)
International Q3 2013 Sales Growth EMEA +52%* ASIA PACIFIC -6% Status
Update LATIN AMERICA +23% Snow 16% EMEA sales increase driven by market
share gains in ORV – #1 share and growing; Aixam acquisition PG&A up 44%
in Q3 Broke ground for Poland plant Australian market remains weak Q3
2013 Sales by Geography & Product International Sales Motorcycles 5% 17
International Q3
Results International Q3 Results Q3-2013 2013 Objectives Gaining Share
in Challenging Economic Environment Gaining Share in Challenging
Economic Environment ORV 43% Small Vehicles 19% PG&A 17% Q3 2012Q3
2013FY 2012FY 2013GuidanceUp about 25%* +38% 139.4* +9% $460.6 $100.9
Europe 70% Latin America 7% Asia 4% Aus / NZ 10% ME / Africa 9% *
Includes Aixam Mega Polaris International Sales (in millions)
International Q3 2013 Sales Growth EMEA +52%* ASIA PACIFIC -6% Status
Update LATIN AMERICA +23% Snow 16% EMEA sales increase driven by market
share gains in ORV – #1 share and growing; Aixam acquisition PG&A up 44%
in Q3 Broke ground for Poland plant Australian market remains weak Q3
2013 Sales by Geography & Product International Sales Motorcycles 5% 17
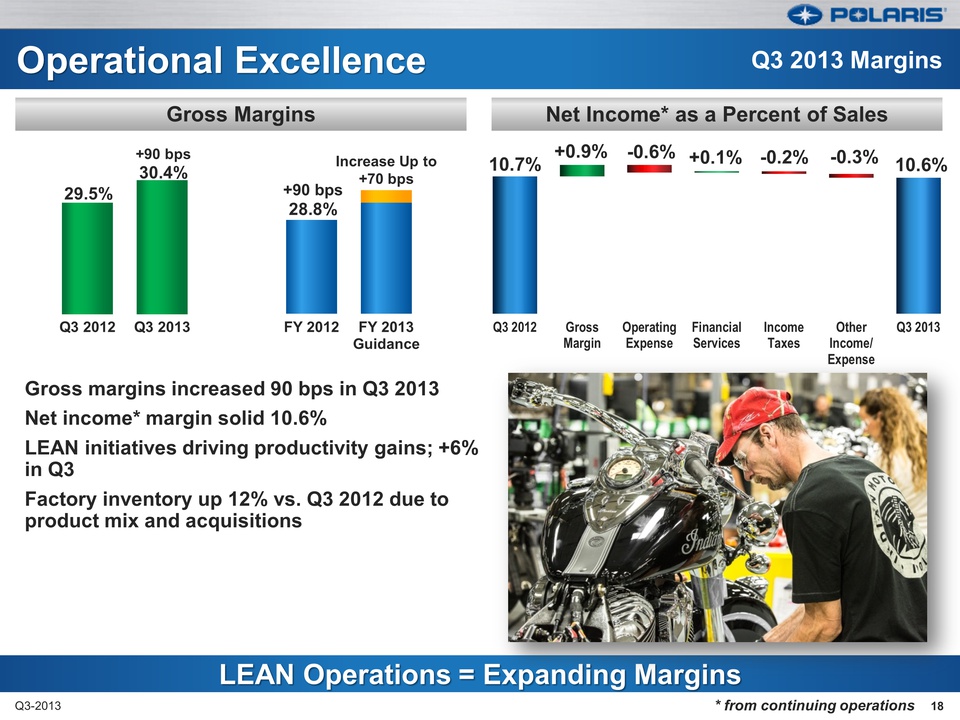 Operational
Excellence Operational Excellence Gross margins increased 90 bps in Q3
2013 Net income* margin solid 10.6% LEAN initiatives driving
productivity gains; +6% in Q3 Factory inventory up 12% vs. Q3 2012 due
to product mix and acquisitions Q3-2013 +90 bps 28.8% 29.5% +90 bps
30.4% Q3 2012Q3 2013FY 2012FY 2013GuidanceQ3 2012 Gross Margin Operating
Expense Financial Services Income Taxes Other Income/ExpenseQ3 201310.7%
+0.9% -0.6% +0.1% -0.2% -0.3% 10.6% LEAN Operations = Expanding Margins
LEAN Operations = Expanding Margins Net Income* as a Percent of Sales
Gross Margins Increase Up to +70 bps Q3 2013 Margins 18 * from
continuing operations
Operational
Excellence Operational Excellence Gross margins increased 90 bps in Q3
2013 Net income* margin solid 10.6% LEAN initiatives driving
productivity gains; +6% in Q3 Factory inventory up 12% vs. Q3 2012 due
to product mix and acquisitions Q3-2013 +90 bps 28.8% 29.5% +90 bps
30.4% Q3 2012Q3 2013FY 2012FY 2013GuidanceQ3 2012 Gross Margin Operating
Expense Financial Services Income Taxes Other Income/ExpenseQ3 201310.7%
+0.9% -0.6% +0.1% -0.2% -0.3% 10.6% LEAN Operations = Expanding Margins
LEAN Operations = Expanding Margins Net Income* as a Percent of Sales
Gross Margins Increase Up to +70 bps Q3 2013 Margins 18 * from
continuing operations
Mike Malone V.P Finance & CFO Third Quarter 2013 Earnings Results October 22, 2013 POLARIS INDUSTRIES INC.
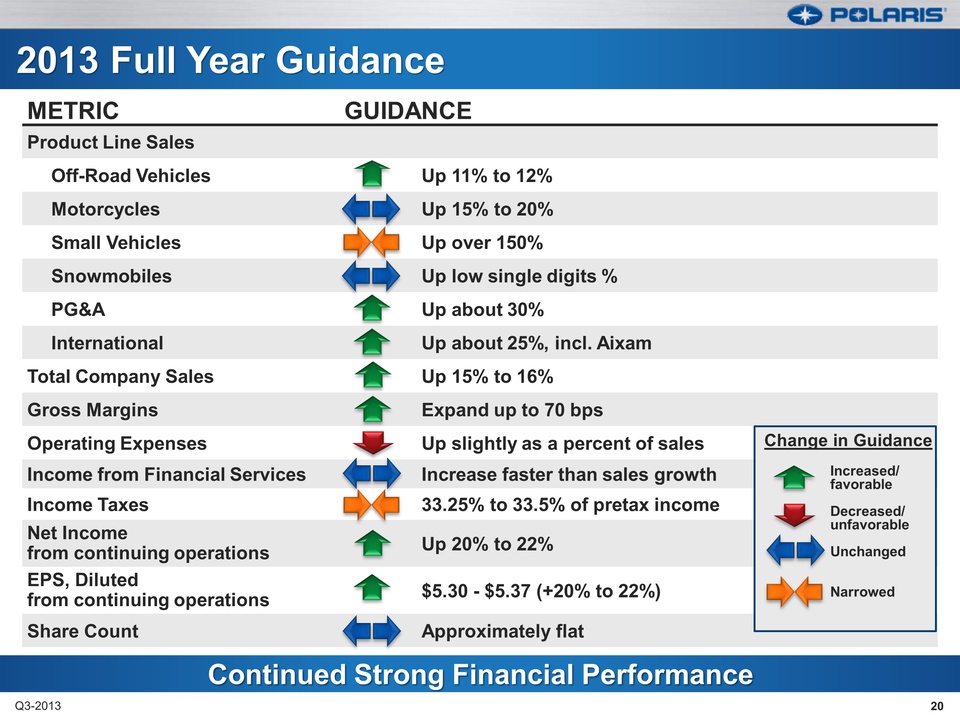 Continued Strong
Financial Performance Continued Strong Financial Performance 2013 Full
Year Guidance 2013 Full Year Guidance METRIC GUIDANCE Product Line Sales
Off-Road Vehicles Up 11% to 12% Motorcycles Up 15% to 20% Small Vehicles
Up over 150% Snowmobiles Up low single digits % PG&A Up about 30%
International Up about 25%, incl. Aixam Total Company Sales Up 15% to
16% Gross Margins Expand up to 70 bps Operating Expenses Up slightly as
a percent of sales Income from Financial Services Increase faster than
sales growth Income Taxes 33.25% to 33.5% of pretax income Net Income
from continuing operations Up 20% to 22% EPS, Diluted from continuing
operations $5.30 - $5.37 (+20% to 22%) Share Count Approximately flat
Change in Guidance Increased/ favorable Decreased/ unfavorable Unchanged
Narrowed 20 Q3-2013
Continued Strong
Financial Performance Continued Strong Financial Performance 2013 Full
Year Guidance 2013 Full Year Guidance METRIC GUIDANCE Product Line Sales
Off-Road Vehicles Up 11% to 12% Motorcycles Up 15% to 20% Small Vehicles
Up over 150% Snowmobiles Up low single digits % PG&A Up about 30%
International Up about 25%, incl. Aixam Total Company Sales Up 15% to
16% Gross Margins Expand up to 70 bps Operating Expenses Up slightly as
a percent of sales Income from Financial Services Increase faster than
sales growth Income Taxes 33.25% to 33.5% of pretax income Net Income
from continuing operations Up 20% to 22% EPS, Diluted from continuing
operations $5.30 - $5.37 (+20% to 22%) Share Count Approximately flat
Change in Guidance Increased/ favorable Decreased/ unfavorable Unchanged
Narrowed 20 Q3-2013
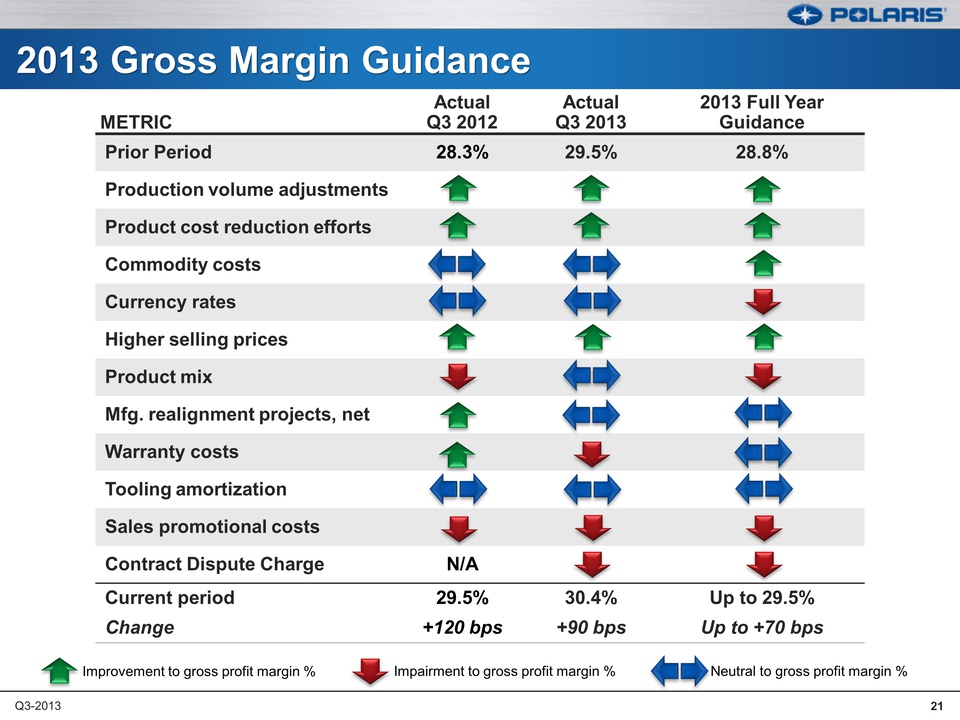 2013 Gross Margin
Guidance 2013 Gross Margin Guidance METRIC Actual Q3 2012 Actual Q3 2013
2013 Full Year Guidance Prior Period 28.3% 29.5% 28.8% Production volume
adjustments Product cost reduction efforts Commodity costs Currency
rates Higher selling prices Product mix Mfg. realignment projects, net
Warranty costs Tooling amortization Sales promotional costs Contract
Dispute Charge N/A Current period 29.5% 30.4% Up to 29.5% Change +120
bps +90 bps Up to +70 bps Improvement to gross profit margin %
Impairment to gross profit margin % Neutral to gross profit margin % 21
Q3-2013
2013 Gross Margin
Guidance 2013 Gross Margin Guidance METRIC Actual Q3 2012 Actual Q3 2013
2013 Full Year Guidance Prior Period 28.3% 29.5% 28.8% Production volume
adjustments Product cost reduction efforts Commodity costs Currency
rates Higher selling prices Product mix Mfg. realignment projects, net
Warranty costs Tooling amortization Sales promotional costs Contract
Dispute Charge N/A Current period 29.5% 30.4% Up to 29.5% Change +120
bps +90 bps Up to +70 bps Improvement to gross profit margin %
Impairment to gross profit margin % Neutral to gross profit margin % 21
Q3-2013
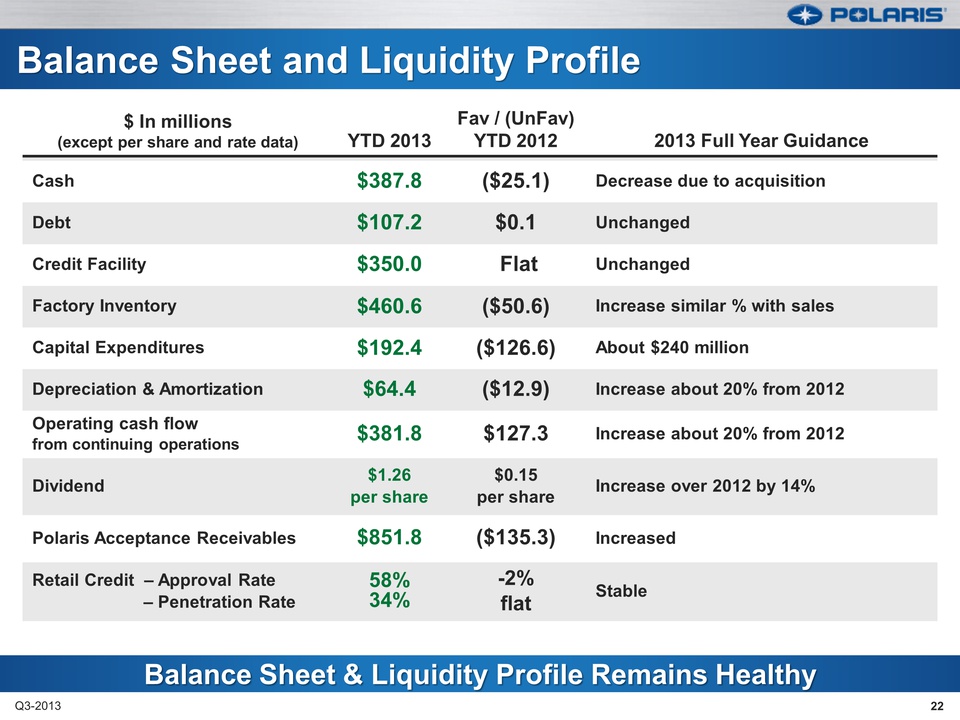 Balance Sheet &
Liquidity Profile Remains Healthy Balance Sheet & Liquidity Profile
Remains Healthy and Balance Sheet and Liquidity Profile $ In millions
(except per share and rate data) YTD 2013 Fav / (UnFav) YTD 2012 2013
Full Year Guidance Cash $387.8 ($25.1) Decrease due to acquisition Debt
$107.2 $0.1 Unchanged Credit Facility $350.0 Flat Unchanged Factory
Inventory $460.6 ($50.6) Increase similar % with sales Capital
Expenditures $192.4 ($126.6) About $240 million Depreciation &
Amortization $64.4 ($12.9) Increase about 20% from 2012 Operating cash
flow from continuing operations $381.8 $127.3 Increase about 20% from
2012 Dividend $1.26 per share $0.15 per share Increase over 2012 by 14%
Polaris Acceptance Receivables $851.8 ($135.3) Increased Retail Credit –
Approval Rate – Penetration Rate 58% 34% -2% flat Stable 22 Q3-2013
Balance Sheet &
Liquidity Profile Remains Healthy Balance Sheet & Liquidity Profile
Remains Healthy and Balance Sheet and Liquidity Profile $ In millions
(except per share and rate data) YTD 2013 Fav / (UnFav) YTD 2012 2013
Full Year Guidance Cash $387.8 ($25.1) Decrease due to acquisition Debt
$107.2 $0.1 Unchanged Credit Facility $350.0 Flat Unchanged Factory
Inventory $460.6 ($50.6) Increase similar % with sales Capital
Expenditures $192.4 ($126.6) About $240 million Depreciation &
Amortization $64.4 ($12.9) Increase about 20% from 2012 Operating cash
flow from continuing operations $381.8 $127.3 Increase about 20% from
2012 Dividend $1.26 per share $0.15 per share Increase over 2012 by 14%
Polaris Acceptance Receivables $851.8 ($135.3) Increased Retail Credit –
Approval Rate – Penetration Rate 58% 34% -2% flat Stable 22 Q3-2013

Scott Wine Chairman & CEO Third Quarter 2013 Earnings Results October 22, 2013 POLARIS INDUSTRIES INC.
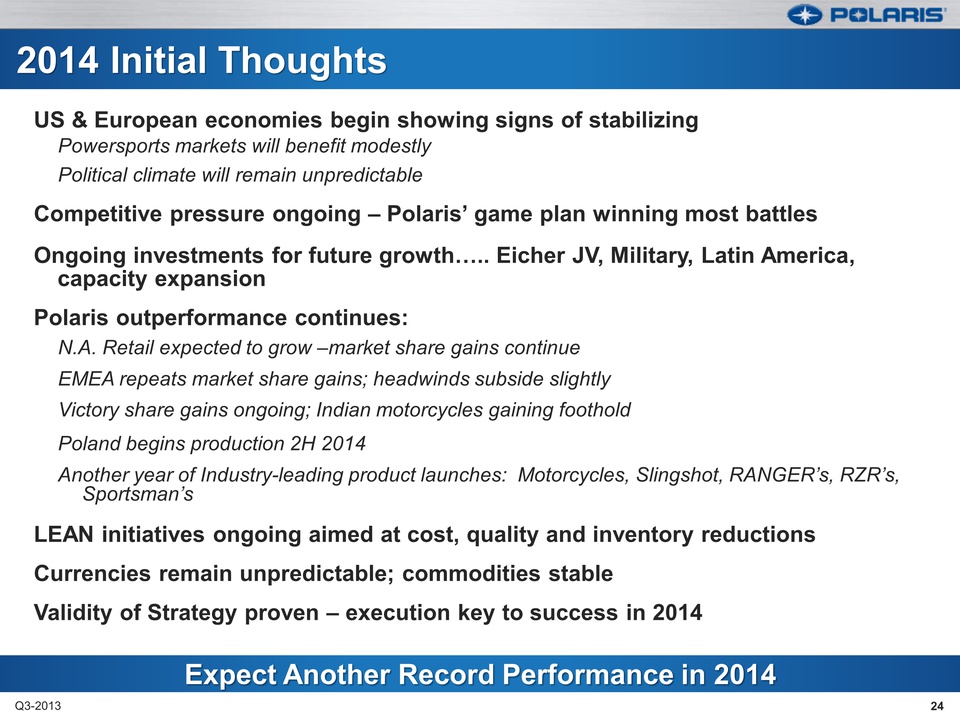 Expect Another
Record Performance in 2014 Expect Another Record Performance in 2014
Initial Thoughts 2014 Initial Thoughts US & European economies begin
showing signs of stabilizing Powersports markets will benefit modestly
Political climate will remain unpredictable Competitive pressure ongoing
– Polaris’ game plan winning most battles Ongoing investments for future
growth….. Eicher JV, Military, Latin America, capacity expansion Polaris
outperformance continues: N.A. Retail expected to grow –market share
gains continue EMEA repeats market share gains; headwinds subside
slightly Victory share gains ongoing; Indian motorcycles gaining
foothold Poland begins production 2H 2014 Another year of
Industry-leading product launches: Motorcycles, Slingshot, RANGER’s,
RZR’s, Sportsman’s LEAN initiatives ongoing aimed at cost, quality and
inventory reductions Currencies remain unpredictable; commodities stable
Validity of Strategy proven – execution key to success in 2014 24 Q3-2013
Expect Another
Record Performance in 2014 Expect Another Record Performance in 2014
Initial Thoughts 2014 Initial Thoughts US & European economies begin
showing signs of stabilizing Powersports markets will benefit modestly
Political climate will remain unpredictable Competitive pressure ongoing
– Polaris’ game plan winning most battles Ongoing investments for future
growth….. Eicher JV, Military, Latin America, capacity expansion Polaris
outperformance continues: N.A. Retail expected to grow –market share
gains continue EMEA repeats market share gains; headwinds subside
slightly Victory share gains ongoing; Indian motorcycles gaining
foothold Poland begins production 2H 2014 Another year of
Industry-leading product launches: Motorcycles, Slingshot, RANGER’s,
RZR’s, Sportsman’s LEAN initiatives ongoing aimed at cost, quality and
inventory reductions Currencies remain unpredictable; commodities stable
Validity of Strategy proven – execution key to success in 2014 24 Q3-2013

Thank you Questions?