UNITED STATES
SECURITIES
AND EXCHANGE COMMISSION
Washington,
D.C. 20549
FORM
8-K
CURRENT
REPORT
Pursuant
to Section 13 or 15(d) of the Securities Exchange Act of 1934
Date
of Report (Date of earliest event reported): July 19, 2011
POLARIS INDUSTRIES INC.
(Exact
name of Registrant as specified in its charter)
Minnesota |
1-11411 |
41-1790959 |
(State of Incorporation) |
(Commission File Number) |
(I.R.S. Employer Identification No.) |
2100 Highway 55
Medina, Minnesota 55340
(Address of
principal executive offices)
(Zip Code)
(763) 542-0500
(Registrant’s
telephone number, including area code)
Check the appropriate box below if the Form 8-K filing is intended to simultaneously satisfy the filing obligation of the registrant under any of the following provisions:
⃞ Written communications pursuant to Rule 425 under the Securities Act (17 CFR 230.425)
⃞ Soliciting material pursuant to Rule 14a-12 under the Exchange Act (17 CFR 240.14a-12)
⃞ Pre-commencement communications pursuant to Rule 14d-2(b) under the Exchange Act (17 CFR 240.14d-2(b))
⃞ Pre-commencement communications pursuant to Rule 13e-4(c) under the Exchange Act (17 CFR 240.13e-4(c))
Item 2.02 Results of Operations and Financial Condition.
On July 19, 2011, Polaris Industries Inc. (the “Company”) issued a press release announcing the Company’s second quarter financial results for the reporting period ended June 30, 2011. On July 19, 2011, the Company also hosted its quarterly earnings conference call, which was accessible to the public. A recording of the conference call will be available through the end of the business day on July 26, 2011 by dialing 800-642-1687 in the U.S. and Canada, or 706-645-9291 Internationally, and on the Company’s website, www.polarisindustries.com/irhome.
A copy of the Company’s press release is furnished as Exhibit 99.1 attached hereto and a copy of the presentation materials discussed during the conference call is being furnished as Exhibit 99.2 to this Current Report on Form 8-K.
Item 7.01 Regulation FD Disclosure.
The disclosures set forth in Item 2.02 above are hereby incorporated by reference into this Item 7.01.
Item 9.01 Financial Statements and Exhibits.
(d) Exhibits.
99.1 Press Release dated July 19, 2011 of Polaris Industries Inc.
99.2 Presentation materials dated July 19, 2011 of Polaris Industries Inc.
SIGNATURES
Pursuant to
the requirements of the Securities Exchange Act of 1934, the registrant
has duly caused this report to be signed on its behalf by the
undersigned thereunto duly authorized.
Date: |
July 19, 2011 |
|
POLARIS INDUSTRIES INC. |
||
|
||
|
|
/s/ Michael W. Malone |
Michael W. Malone |
||
Vice President – Finance and |
||
Chief Financial Officer of Polaris Industries Inc. |
EXHIBIT INDEX
Exhibit |
Description | |
99.1 |
Press Release dated July 19, 2011 of Polaris Industries Inc. |
|
99.2 |
Presentation materials dated July 19, 2011 of Polaris Industries Inc. |
Exhibit 99.1
CONTACT:
Polaris Industries Inc.
Richard Edwards, 763-542-0500
Polaris Reports Record Second Quarter 2011 Results; EPS Increased 83% to $1.37 with Sales Growth of 41%
Company increases full year 2011 guidance
Second Quarter Highlights:
MINNEAPOLIS--(BUSINESS WIRE)--July 19, 2011--Polaris Industries Inc. (NYSE:PII) today reported record second quarter net income of $48.7 million, or $1.37 per diluted share, for the quarter ended June 30, 2011, up 90 percent from the prior year’s second quarter net income of $25.6 million, or $0.75 per diluted share. Sales for the second quarter 2011 totaled a record $607.9 million, an increase of 41 percent from last year’s second quarter sales of $430.9 million.
“The Polaris team continues to excel and I am proud of our ability to accelerate sales while simultaneously expanding margins and strengthening earnings. Strong consumer retail sales demand for Polaris products, up 19 percent in North America for the second quarter, drove market share gains, while margin expansion efforts generated gross profit margin improvement of 300 basis points and net income margin improvement of 210 basis points compared to the 2010 second quarter. We expect our new Monterrey, Mexico production facility to play a key role in supporting future sales growth and margin expansion and we are pleased to note it came online during the second quarter on budget and on schedule. We are making steady progress in our LEAN journey, and the results and opportunities are extremely promising,” commented Scott Wine, Polaris’ Chief Executive Officer.
“Given our first half results and the continued strength of our businesses, we are again significantly raising our expectations for sales and earnings for the full year 2011. We continue to seek strategic investments to further strengthen our Company, as evidenced by the recently announced acquisitions of Indian Motorcycle Company and Global Electric Motorcars (GEM).”
Wine continued, “Next week we will be unveiling a number of new model year 2012 products. Innovation has always been one of our key competitive advantages and these products exemplify our commitment to providing consumers with high quality, cutting-edge products. I am confident that these new products, combined with continued execution of our strategic objectives, will drive profitable growth for the remainder of 2011 and deliver another record year for sales, net income and earnings per share.”
2011 Business Outlook
Based on Polaris’ performance in the first half of 2011 and projections for the remainder of the year, the Company is increasing its 2011 full year sales and earnings guidance. The Company now expects full year 2011 earnings to be in the range of $5.93 to $6.05 per diluted share, an increase of between 39 and 41 percent over full year 2010 earnings of $4.28 per diluted share. Full year 2011 sales are now expected to grow in the range of 25 percent to 28 percent from 2010. Revised full year 2011 expectations include costs and savings related to the ongoing manufacturing realignment and the impact of integrating the Indian Motorcycle Company and GEM acquisitions announced during the second quarter.
Second Quarter Performance Summary (in thousands except per share data) |
|||||||||||||||||||||||||||
Three Months ended June 30, |
Six Months ended June 30, |
||||||||||||||||||||||||||
Product line sales |
2011 |
2010 |
Change |
2011 |
2010 |
Change |
|||||||||||||||||||||
Off-Road Vehicles | $ | 482,304 | $ | 342,071 | 41% | $ | 870,323 | $ | 592,474 | 47% | |||||||||||||||||
Snowmobiles | 6,828 | 1,965 | 247% | 15,763 | 7,519 | 110% | |||||||||||||||||||||
On-Road Vehicles | 30,886 | 15,494 | 99% | 75,794 | 40,847 | 86% | |||||||||||||||||||||
Parts, Garments & Accessories | 87,903 | 71,377 | 23% | 183,239 | 151,775 | 21% | |||||||||||||||||||||
Total Sales | $ | 607,921 | $ | 430,907 |
+41% |
$ | 1,145,119 | $ | 792,615 | +44% | |||||||||||||||||
Gross profit | $ | 177,604 | $ | 113,084 |
+57% |
$ | 329,439 | $ | 207,998 |
+58% |
|||||||||||||||||
Gross profit as a % of sales | 29.2% | 26.2% | +300 bpts | 28.8% | 26.2% | +260 bpts | |||||||||||||||||||||
Operating expenses | $ | 106,209 | $ | 74,386 |
+43% |
$ | 193,747 | $ | 141,620 |
+37% |
|||||||||||||||||
Operating expenses as a % of sales | 17.5% | 17.3% | +20 bpts | 16.9% | 17.9% | -100 bpts | |||||||||||||||||||||
Operating Income | $ | 76,921 | $ | 42,943 |
+79% |
$ | 146,504 | $ | 74,879 |
+96% |
|||||||||||||||||
Operating Income as a % of sales | 12.7% | 10.0% | +270 bpts | 12.8% | 9.4% | +340 bpts | |||||||||||||||||||||
Net Income | $ | 48,729 | $ | 25,624 | +90% | $ | 96,039 | $ | 45,395 | +112% | |||||||||||||||||
Net income as a % of sales | 8.0% | 5.9% | +210 bpts | 8.4% | 5.7% | +270 bpts | |||||||||||||||||||||
Diluted Net Income per share | $ | 1.37 | $ | 0.75 | +83% | $ | 2.71 | $ | 1.34 | +102% |
Off-Road Vehicle (“ORV”) sales, comprised of all-terrain vehicles (“ATVs”) and RANGER™ side-by-side vehicles, increased 41 percent from the second quarter 2010 to $482.3 million. This increase reflects significant North American market share gains for both ATVs and side-by-side vehicles and increased sales in our military and Bobcat businesses. North American consumer ORV unit retail sales for Polaris were up mid-teens percent from the second quarter last year, with side-by-side vehicle retail sales climbing significantly and ATV retail sales up mid-single digits percent. North American ORV dealer inventories were up slightly from the second quarter of 2010, as higher side-by-side vehicle inventory was required to support very strong retail demand. Sales of ORVs outside of North America increased 35 percent compared to the second quarter 2010, due to higher volume, increased sales of higher priced side-by-side vehicles, and positive currency benefit from the weaker US dollar.
Snowmobile sales totaled $6.8 million for the 2011 second quarter compared to $2.0 million for the second quarter of 2010. Historically, second quarter snowmobile sales are seasonally low, as deliveries to dealers ramp up in the second half of the calendar year before the snowmobile retail selling season begins in earnest.
Sales of the On-Road Vehicles division, comprised primarily of Victory motorcycles, increased 99 percent to $30.9 million when compared to the same period in 2010. Sales of On-Road Vehicles to customers outside of North America increased 34 percent compared to the prior year’s second quarter. Second quarter North American heavyweight cruiser and touring motorcycle industry retail sales were up mid-single digits percent over the prior year’s second quarter, while Victory unit retail sales in North America were up about 40 percent during the same period. North American dealer inventory levels of Victory motorcycles for the 2011 second quarter remained approximately equal to the same period last year.
Parts, Garments, and Accessories (“PG&A”) sales increased 23 percent during the second quarter 2011 compared to the same period last year, with PG&A sales increasing across all businesses and product lines.
Gross profit was 29.2 percent of sales for the second quarter of 2011, an increase of 300 basis points from 26.2 percent for the second quarter of 2010. Gross profit dollars increased 57 percent to $177.6 million for the second quarter of 2011, compared to $113.1 million for the second quarter of 2010. These increases resulted primarily from continued product cost reduction efforts, lower warranty costs, higher selling prices, and favorable currency movements, and were partially offset by increasing commodity costs and an unfavorable product mix.
Operating expenses for second quarter 2011 increased 43 percent to $106.2 million, or 17.5 percent of sales, compared to $74.4 million, or 17.3 percent of sales, for the second quarter of 2010. Operating expenses in absolute dollars for the second quarter of 2011 increased primarily due to continued infrastructure investments being made in international and adjacent markets for future growth opportunities and increased incentive compensation plan expenses due to the higher expected profitability and the current higher stock price.
Income from financial services was $5.5 million during second quarter 2011 compared to $4.2 million in the second quarter of 2010, primarily a consequence of increased profitability generated from retail credit portfolios with GE, HSBC, and Sheffield.
Non-operating other expense was $1.6 million in the second quarter of 2011, as compared to $2.3 million in the second quarter of 2010. The decrease in expense is the result of foreign currency exchange rate movements and the resulting effects on foreign currency transactions related to the Company’s foreign subsidiaries.
Financial Position and Cash Flow
Net cash provided by operating activities increased eight percent to $61.8 million for the year-to-date period ended June 30, 2011 compared to $57.0 million for the first half of 2010. The increase in net cash provided by operating activities for the 2011 period was due to increased net income, mostly offset by a higher investment in working capital, largely due to higher accounts receivable compared to the same period in 2010. Total long-term debt was $100.0 million compared to $200.0 million in the same period in 2010. The Company’s debt-to-total capital ratio was 18 percent at June 30, 2011, compared to 45 percent at the same period in 2010. Cash and cash equivalents were $262.2 million at June 30, 2011 compared to $166.3 million for the same period in 2010.
Conference Call and Webcast Presentation
Today at 10:00 AM (CT) Polaris Industries Inc. will host a conference call and webcast to discuss Polaris’ 2011 second quarter earnings results released this morning. The call will be hosted by Scott Wine, CEO, Bennett Morgan, President and COO, and Mike Malone, Vice President―Finance and CFO. A slide presentation and link to the audio webcast will be posted on the Investor Relations page of the Polaris web site at www.polarisindustries.com/irhome approximately 30 minutes before the conference call begins.
To listen to the conference call by phone, dial 800-374-6475 in the U.S. and Canada, or 973-200-3967 internationally. The Conference ID is # 75871740.
A replay of the conference call will be available approximately two hours after the call for a one-week period by accessing the same link on our website, or by dialing 800-642-1687 in the U.S. and Canada, or 706-645-9291 internationally.
About Polaris
With annual 2010 sales of $1.99 billion, Polaris designs, engineers, manufactures and markets innovative, high quality off-road vehicles (ORVs), including all-terrain vehicles (ATVs) and the Polaris RANGER® for recreational and utility use, snowmobiles, motorcycles and on-road electric powered vehicles.
Polaris is a recognized leader in the powersports industry, among the global sales leaders for both snowmobiles and off-road vehicles. The Company has established a presence in the heavyweight cruiser and touring motorcycle market with Victory motorcycles and the acquisition of Indian Motorcycle Company. Additionally, Polaris continues to invest in the global on-road low speed vehicle industry with internally developed vehicles and the acquisition of Global Electric Motorcars (GEM). Polaris enhances the riding experience with a complete line of Pure Polaris apparel, accessories and parts, available at Polaris dealerships.
Polaris Industries Inc. trades on the New York Stock Exchange under the symbol “PII”, and the Company is included in the S&P Mid-Cap 400 stock price index.
Information about the complete line of Polaris products, apparel and vehicles accessories are available from authorized Polaris dealers or anytime at www.polarisindustries.com.
Except for historical information contained herein, the matters set forth in this news release, including management’s expectations regarding 2011 sales, shipments, net income, net income per share, manufacturing realignment transition costs and savings in logistical and production costs, are forward-looking statements that involve certain risks and uncertainties that could cause actual results to differ materially from those forward-looking statements. Potential risks and uncertainties include such factors as the Company’s ability to successfully implement its manufacturing operations realignment initiatives, product offerings, promotional activities and pricing strategies by competitors; acquisition integration costs; warranty expenses; impact of changes in Polaris stock price on incentive compensation plan costs; foreign currency exchange rate fluctuations; environmental and product safety regulatory activity; effects of weather; commodity costs; uninsured product liability claims; uncertainty in the retail and wholesale credit markets; changes in tax policy and overall economic conditions, including inflation, consumer confidence and spending and relationships with dealers and suppliers. Investors are also directed to consider other risks and uncertainties discussed in documents filed by the Company with the Securities and Exchange Commission. The Company does not undertake any duty to any person to provide updates to its forward-looking statements.
(summarized financial data follows)
POLARIS INDUSTRIES INC. | |||||||||||||||
CONSOLIDATED STATEMENTS OF INCOME | |||||||||||||||
(In Thousands, Except Per Share Data) | |||||||||||||||
(Unaudited) | |||||||||||||||
For Three Months | For Six Months | ||||||||||||||
Ended June 30, |
Ended June 30, |
||||||||||||||
2011 | 2010 | 2011 | 2010 | ||||||||||||
Sales | $ | 607,921 | $ | 430,907 | $ | 1,145,119 | $ | 792,615 | |||||||
Cost of Sales | 430,317 | 317,823 | 815,680 | 584,617 | |||||||||||
Gross profit | 177,604 | 113,084 | 329,439 | 207,998 | |||||||||||
Operating expenses | |||||||||||||||
Selling and marketing | 43,453 | 34,164 | 80,666 | 64,262 | |||||||||||
Research and development | 25,499 | 18,512 | 48,498 | 37,250 | |||||||||||
General and administrative | 37,257 | 21,710 | 64,583 | 40,108 | |||||||||||
Total operating expenses | 106,209 | 74,386 | 193,747 | 141,620 | |||||||||||
Income from financial services | 5,526 | 4,245 | 10,812 | 8,501 | |||||||||||
Operating Income | 76,921 | 42,943 | 146,504 | 74,879 | |||||||||||
Non-operating Expense (Income): | |||||||||||||||
Interest expense | 985 | 729 | 1,496 | 1,428 | |||||||||||
Impairment charge on securities held for sale | - | 769 | - | 769 | |||||||||||
Other expense (income), net | 1,642 | 2,318 | (1,559 | ) | 2,498 | ||||||||||
Income before income taxes | 74,294 | 39,127 | 146,567 | 70,184 | |||||||||||
Provision for Income Taxes | 25,565 | 13,503 | 50,528 | 24,789 | |||||||||||
Net Income | $ | 48,729 | $ | 25,624 | $ | 96,039 | $ | 45,395 | |||||||
Basic Net Income per share | $ | 1.42 | $ | 0.77 | $ | 2.80 | $ | 1.37 | |||||||
Diluted Net Income per share | $ | 1.37 | $ | 0.75 | $ | 2.71 | $ | 1.34 | |||||||
Weighted average shares outstanding: | |||||||||||||||
Basic | 34,405 | 33,255 | 34,337 | 33,162 | |||||||||||
Diluted | 35,607 | 34,248 | 35,469 | 33,999 |
POLARIS INDUSTRIES INC. | |||||||
CONSOLIDATED BALANCE SHEETS | |||||||
(In Thousands) | |||||||
(Unaudited) | |||||||
Subject to Reclassification | June 30, 2011 | June 30, 2010 | |||||
Assets | |||||||
Current Assets: | |||||||
Cash and cash equivalents | $ | 262,174 | $ | 166,272 | |||
Trade receivables, net | 136,903 | 96,638 | |||||
Inventories, net | 286,137 | 222,608 | |||||
Prepaid expenses and other | 28,622 | 22,483 | |||||
Income taxes receivable | 13,400 | - | |||||
Deferred tax assets | 70,060 | 59,838 | |||||
Total current assets | 797,296 | 567,839 | |||||
Property and equipment, net | 193,071 | 184,572 | |||||
Investments in finance affiliate | 35,567 | 31,857 | |||||
Investments in manufacturing affiliates | 975 | 9,461 | |||||
Deferred tax assets | 3,475 | - | |||||
Goodwill and intangibles, net | 60,878 | 27,579 | |||||
Total Assets | $ | 1,091,262 | $ | 821,308 | |||
Liabilities and Shareholders’ Equity | |||||||
Current Liabilities: | |||||||
Accounts payable | $ | 148,208 | $ | 102,037 | |||
Accrued expenses: | |||||||
Compensation | 138,490 | 56,699 | |||||
Warranties | 31,862 | 24,661 | |||||
Sales promotions and incentives | 74,869 | 66,297 | |||||
Dealer holdback | 67,508 | 65,092 | |||||
Other | 68,879 | 41,418 | |||||
Income taxes payable | 2,271 | 4,099 | |||||
Current liabilities of discontinued operations | 1,550 | 1,850 | |||||
Total current liabilities | 533,637 | 362,153 | |||||
Long term income taxes payable | 6,184 | 5,659 | |||||
Deferred income taxes | - | 13,698 | |||||
Long term debt | 100,000 | 200,000 | |||||
Total liabilities | $ | 639,821 | $ | 581,510 | |||
Shareholders’ Equity: | |||||||
Total shareholders' equity | $ | 451,441 | $ | 239,798 | |||
Total Liabilities and Shareholders' Equity | $ | 1,091,262 | $ | 821,308 |
POLARIS INDUSTRIES INC. | ||||||||
CONSOLIDATED STATEMENTS OF CASH FLOWS | ||||||||
(In Thousands) | ||||||||
(Unaudited) | ||||||||
Subject to Reclassification | For Six Months | |||||||
Ended June 30, | ||||||||
2011 | 2010 | |||||||
Operating Activities: | ||||||||
Net income | $ | 96,039 | $ | 45,395 | ||||
Adjustments to reconcile net income to net cash provided by operating activities: |
||||||||
Noncash impairment charge on securities held for sale | - | 769 | ||||||
Depreciation and amortization | 34,995 | 31,562 | ||||||
Noncash compensation | 9,673 | 9,321 | ||||||
Noncash (income) from financial services | (2,272 | ) | (2,293 | ) | ||||
Noncash loss from manufacturing affiliates | 34 | 918 | ||||||
Deferred income taxes | (7,026 | ) | 3,769 | |||||
Tax effect of stock based compensation exercises | (9,894 | ) | (4,407 | ) | ||||
Changes in current operating items: | ||||||||
Trade receivables | (43,894 | ) | (6,233 | ) | ||||
Inventories | (38,919 | ) | (43,293 | ) | ||||
Accounts payable | 32,954 | 26,380 | ||||||
Accrued expenses | 1,814 | (4,698 | ) | |||||
Income taxes payable | (3,133 | ) | 2,475 | |||||
Prepaid expenses and others, net | (8,599 | ) | (2,683 | ) | ||||
Net cash provided by operating activities | 61,772 | 56,982 | ||||||
Investing Activities: | ||||||||
Purchase of property and equipment | (40,601 | ) | (20,925 | ) | ||||
Investments in finance affiliate, net | 3,873 | 11,768 | ||||||
Acquisition of businesses, net of cash acquired | (27,960 | ) | (2,500 | ) | ||||
Net cash (used for) investing activities | (64,688 | ) | (11,657 | ) | ||||
Financing Activities: | ||||||||
Borrowings under senior notes | 100,000 | - | ||||||
Repayments under credit agreement | (200,000 | ) | - | |||||
Repurchase and retirement of common shares | (32,856 | ) | (27,398 | ) | ||||
Cash dividends to shareholders | (30,675 | ) | (26,289 | ) | ||||
Tax effect of proceeds from stock based compensation exercises | 9,894 | 4,407 | ||||||
Proceeds from stock issuances under employee plans | 23,083 | 29,987 | ||||||
Net cash (used for) financing activities | (130,554 | ) | (19,293 | ) | ||||
Impact of currency exchange rates on cash balances | 1,717 | - | ||||||
Net (decrease) increase in cash and cash equivalents | (131,753 | ) | 26,032 | |||||
Cash and cash equivalents at beginning of period | 393,927 | 140,240 | ||||||
Cash and cash equivalents at end of period | $ | 262,174 | $ | 166,272 |
Exhibit 99.2
Second Quarter 2011 Earnings Results July 19, 2011
2 Safe Harbor Except for historical information contained herein, the matters set forth in this document, including but not limited to management’s expectations regarding 2011 sales, shipments, net income, cash flow, and manufacturing realignment transition costs and savings, are forward-looking statements that involve certain risks and uncertainties that could cause actual results to differ materially from those forward-looking statements. Potential risks and uncertainties include such factors as product offerings, promotional activities and pricing strategies by competitors; manufacturing realignment transition costs; acquisition integration costs; warranty expenses; impact of changes in Polaris stock prices on incentive compensation; foreign currency exchange rate fluctuations; environmental and product safety regulatory activity; effects of weather; commodity costs; uninsured product liability claims; uncertainty in the retail and wholesale credit markets; changes in tax policy and overall economic conditions, including inflation, consumer confidence and spending and relationships with dealers and suppliers. Investors are also directed to consider other risks and uncertainties discussed in our 2010 annual report and Form 10-K filed by the Company with the Securities and Exchange Commission. The Company does not undertake any duty to any person to provide updates to its forward-looking statements. The data source for retail sales figures included in this presentation is registration information provided by Polaris dealers in North America and compiled by the Company or Company estimates. The Company must rely on information that its dealers supply concerning retail sales, and other retail sales data sources and this information is subject to revision. July 2011
Scott Wine CEO Second Quarter 2011 Earnings Results July 19, 2011
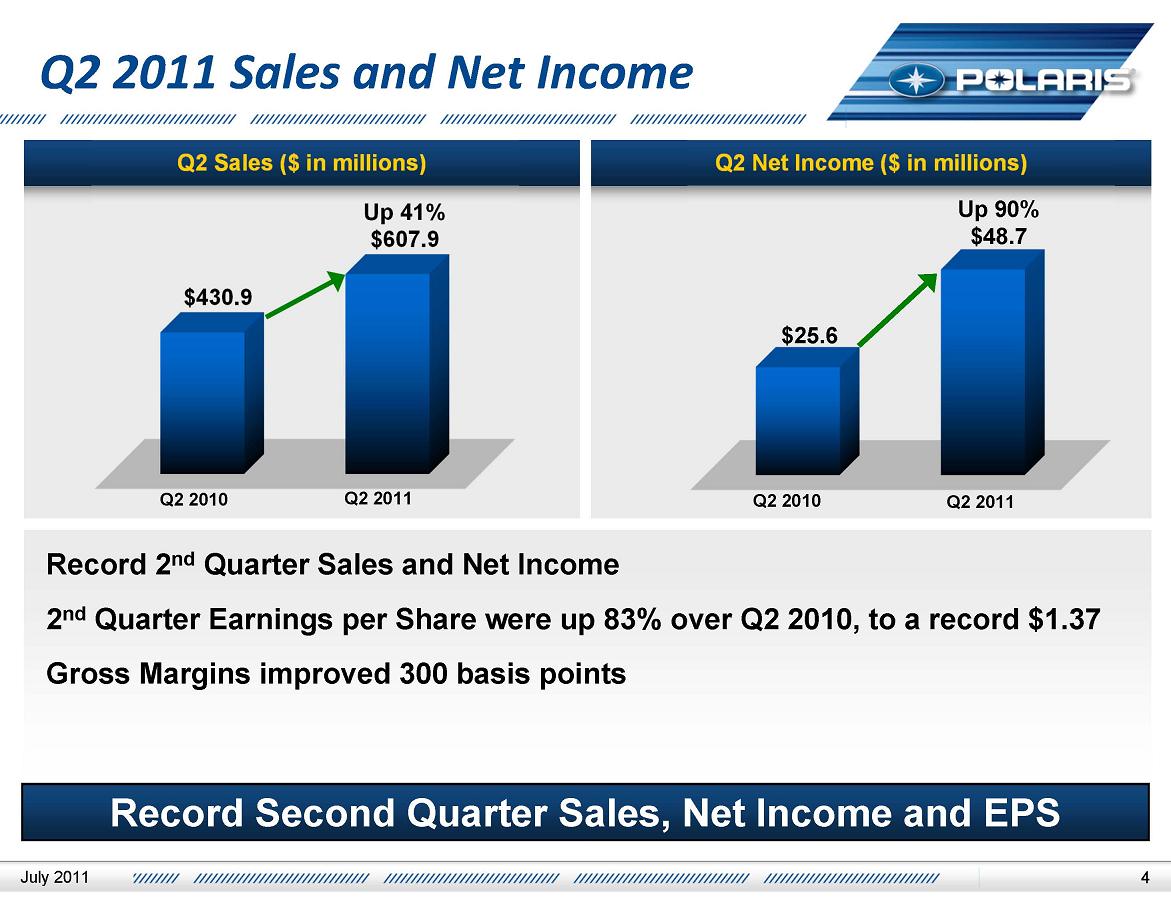
4 Q2 2011 Sales and Net Income Q2 Sales ($ in millions) Q2 Net Income ($ in millions) $430.9 Up 41% $607.9 $25.6 Up 90% $48.7 Q2 2010 Q2 2011 Q2 2010 Q2 2011 Record 2nd Quarter Sales and Net Income 2nd Quarter Earnings per Share were up 83% over Q2 2010, to a record $1.37 Gross Margins improved 300 basis points Record Second Quarter Sales, Net Income and EPS July 2011
5 Full Year 2011 Guidance Total Company Sales (in millions) Diluted EPS $1,991 Up 25% to 28% $2,490 to $2,540 2010 Actual 2011 Guidance $4.28 Up 39% to 41% $5.93 to $6.05 2010 Actual 2011 Guidance Retail sales growth continues to outpace the industry International, Military, and Bobcat businesses accelerating growth Net income dollars projected up 45% to 47% Net income margin improvement accelerating Diluted EPS expected to be up 39% to 41% EPS expected in $5.93 to $6.05 range 2011 Sales & EPS Projections Raised, Again July 2011
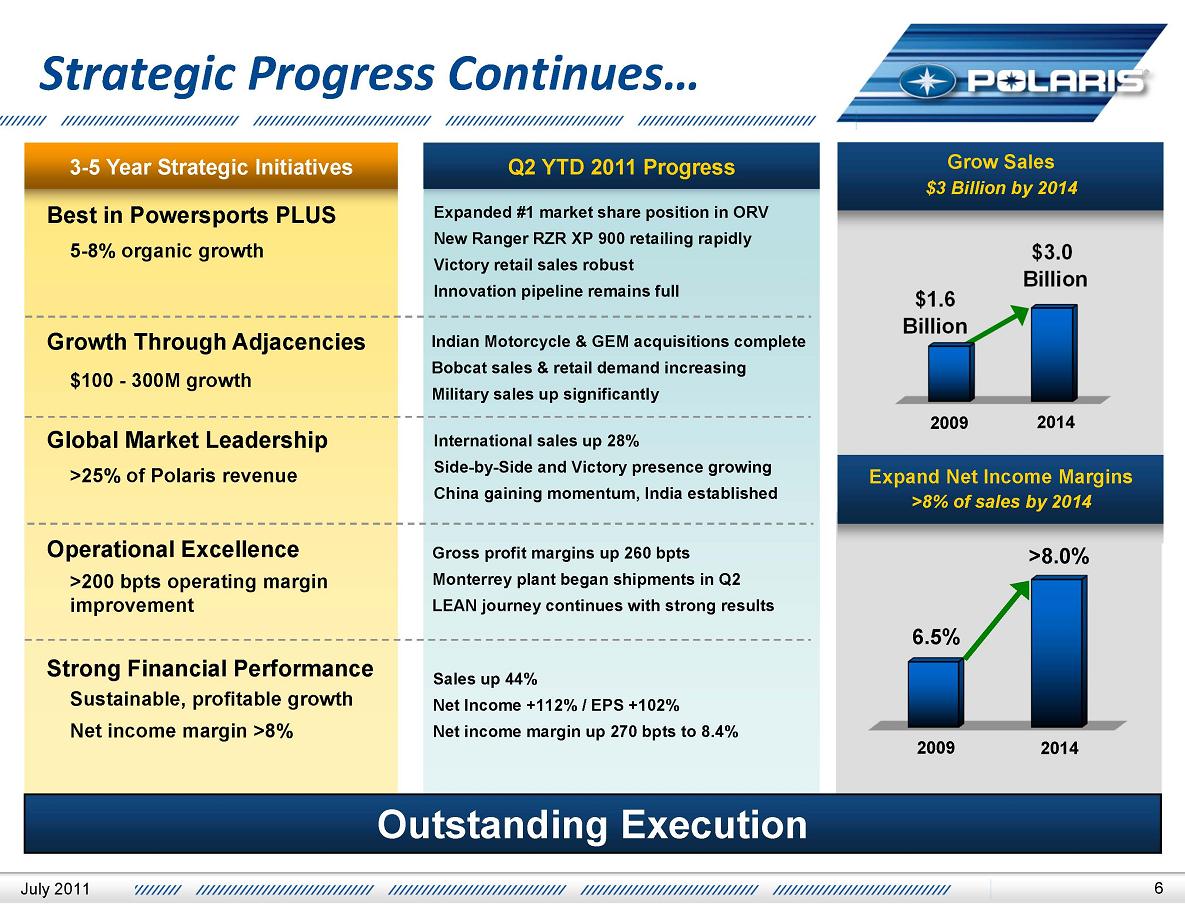
6 Strategic Progress Continues… 3-5 Year Strategic Initiatives Q2 YTD 2011 Progress Grow Sales $3 Billion by 2014 $1.6 Billion $3.0 Billion 2009 2014 Expand Net Income Margins >8% of sales by 2014 6.5% >8.0% 2009 2014 Best in Powersports PLUS 5-8% organic growth Growth Through Adjacencies $100 - 300M growth Global Market Leadership >25% of Polaris revenue Operational Excellence >200 bpts operating margin improvement Strong Financial Performance Sustainable, profitable growth Net income margin >8% Expanded #1 market share position in ORV New Ranger RZR XP 900 retailing rapidly Victory retail sales robust Innovation pipeline remains full Indian Motorcycle & GEM acquisitions complete Bobcat sales & retail demand increasing Military sales up significantly International sales up 28% Side-by-Side and Victory presence growing China gaining momentum, India established Gross profit margins up 260 bpts Monterrey plant began shipments in Q2 LEAN journey continues with strong results Sales up 44% Net Income +112% / EPS +102% Net income margin up 270 bpts to 8.4% Outstanding Execution July 2011
Bennett Morgan President & COO Second Quarter 2011 Earnings Results July 19, 2011
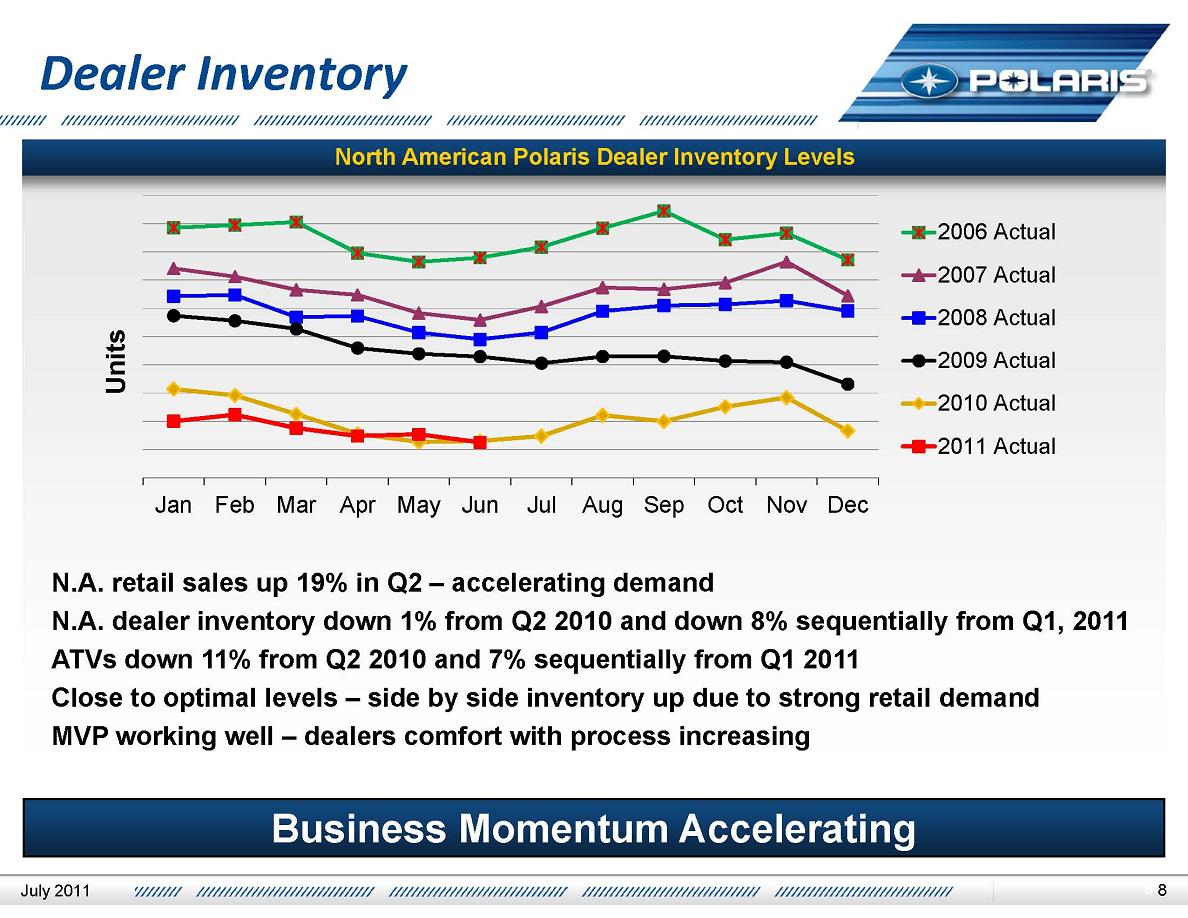
8 Dealer Inventory North American Polaris Dealer Inventory Levels Jan Feb Mar Apr May Jun Jul Aug Sep Oct Nov Dec Units 2006 Actual 2007 Actual 2008 Actual 2009 Actual 2010 Actual 2011 Actual N.A. retail sales up 19% in Q2 – accelerating demand N.A. dealer inventory down 1% from Q2 2010 and down 8% sequentially from Q1, 2011 ATVs down 11% from Q2 2010 and 7% sequentially from Q1 2011 Close to optimal levels – side by side inventory up due to strong retail demand MVP working well – dealers comfort with process increasing Business Momentum Accelerating July 2011
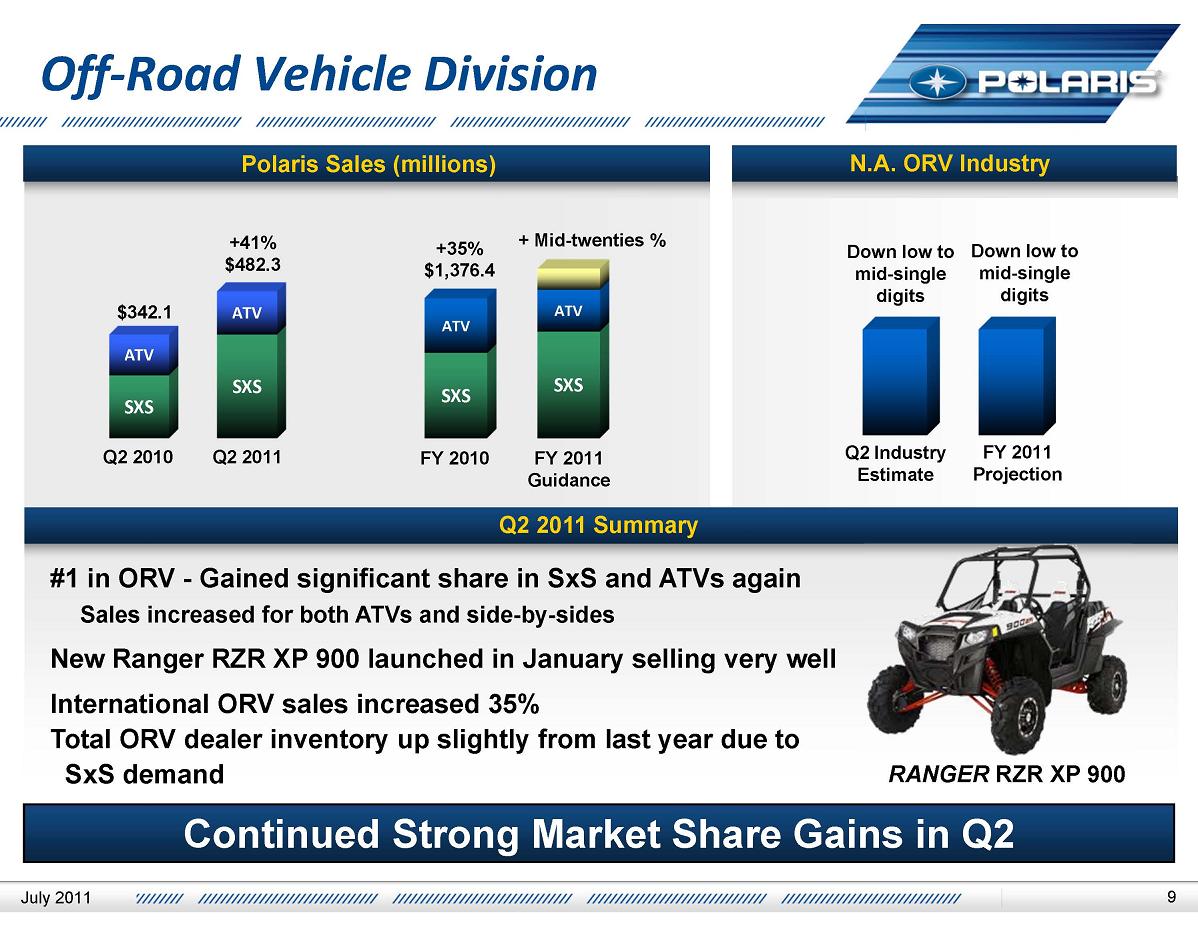
9 Off‐Road Vehicle Division Polaris Sales (millions) N.A. ORV Industry ATV SXS ATV SXS ATV SXS ATV SXS $342.1 +41% $482.3 Q2 2010 Q2 2011 +35% $1,376.4 + Mid-twenties % FY 2010 FY 2011 Guidance Down low to mid-single digits Down low to mid-single digits Q2 Industry Estimate FY 2011 Projection Q2 2011 Summary #1 in ORV - Gained significant share in SxS and ATVs again Sales increased for both ATVs and side-by-sides New Ranger RZR XP 900 launched in January selling very well International ORV sales increased 35% Total ORV dealer inventory up slightly from last year due to SxS demand RANGER RZR XP 900 Continued Strong Market Share Gains in Q2 July 2011
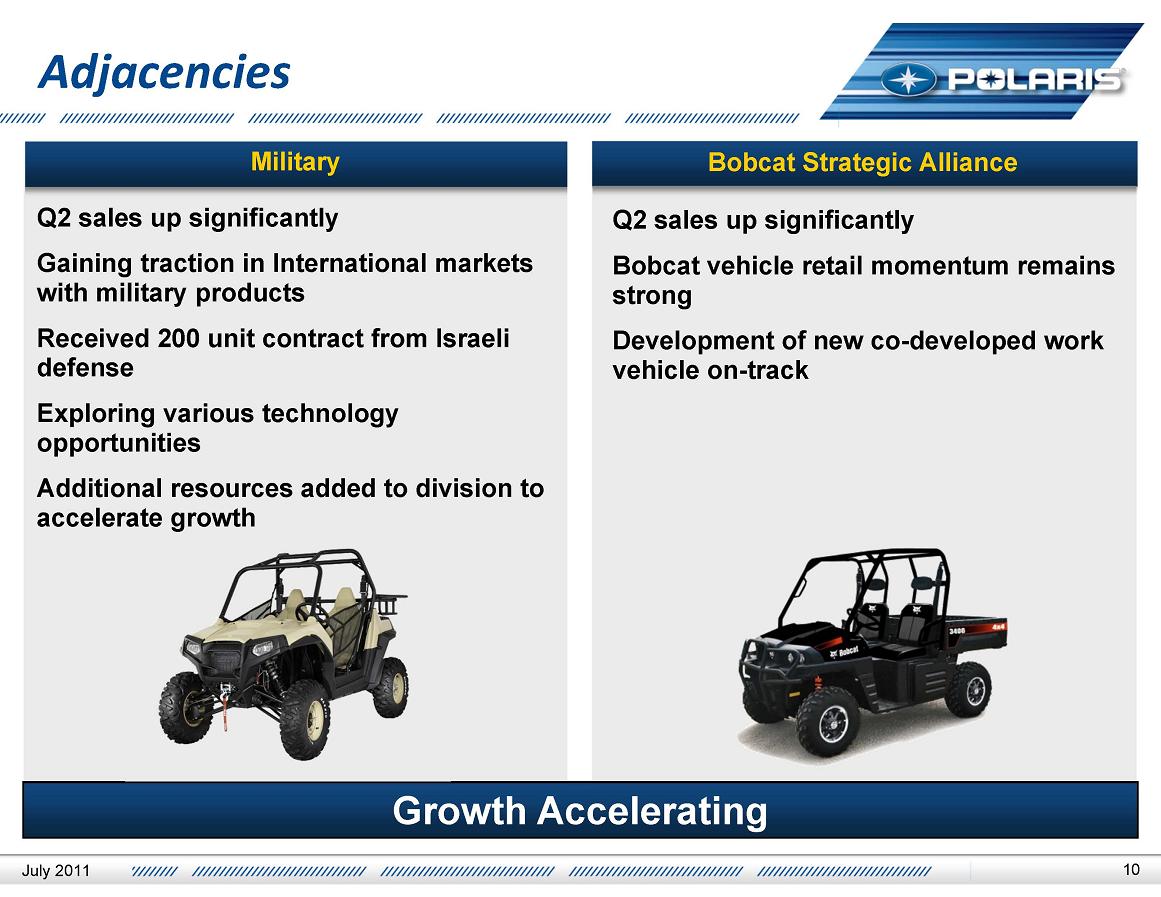
10 Adjacencies Military Bobcat Strategic Alliance Q2 sales up significantly Gaining traction in International markets with military products Received 200 unit contract from Israeli defense Exploring various technology opportunities Additional resources added to division to accelerate growth Q2 sales up significantly Bobcat vehicle retail momentum remains strong Development of new co-developed work vehicle on-track Growth Accelerating July 2011
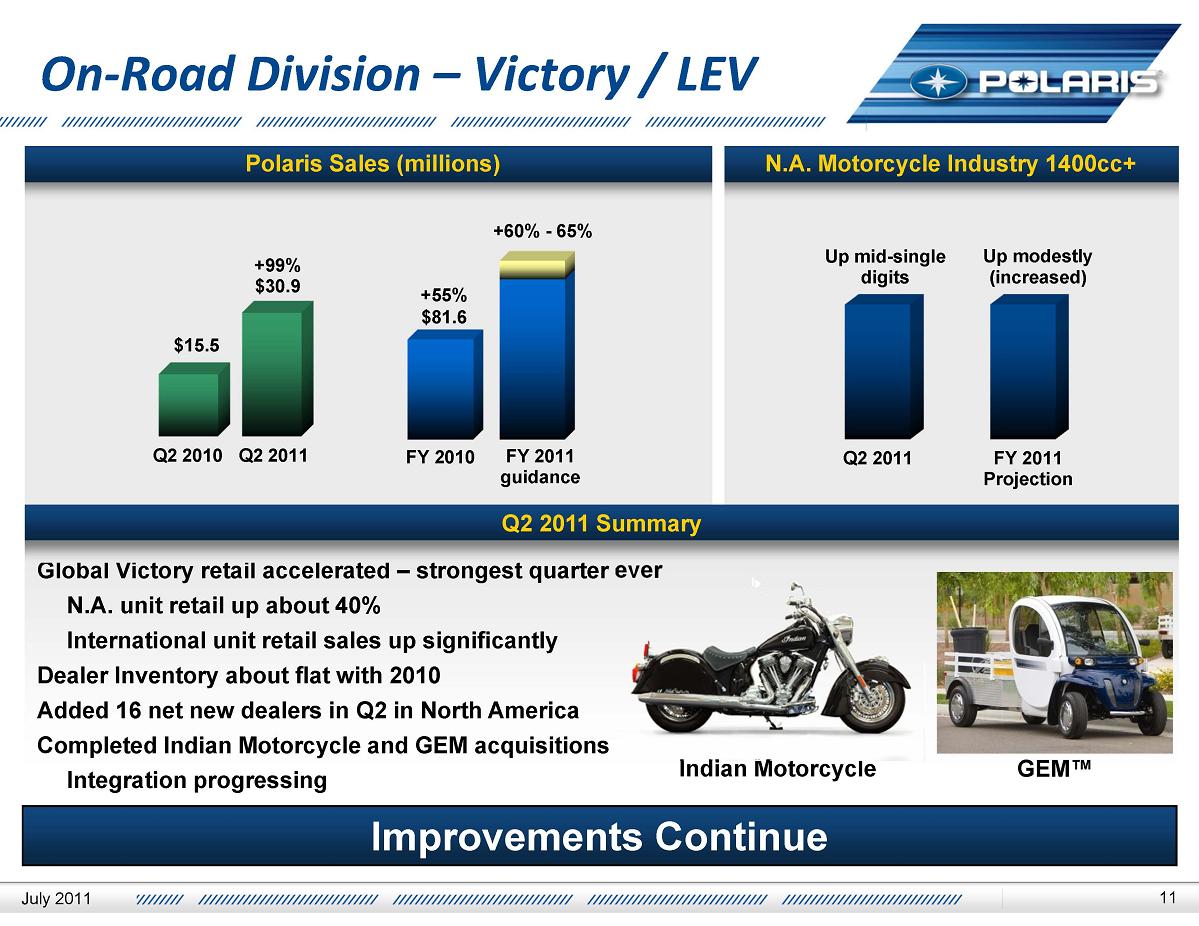
11 On‐Road Division – Victory / LEV Polaris Sales (millions) N.A. Motorcycle Industry 1400cc+ $15.5 +99% $30.9 Q2 2010 Q2 2011 +55% $81.6 +60% - 65% FY 2010 FY 2011 guidance Up mid-single digits Up modestly (increased) Q2 2011 FY 2011 Projection Q2 2011 Summary Global Victory retail accelerated – strongest quarter ever N.A. unit retail up about 40% International unit retail sales up significantly Dealer Inventory about flat with 2010 Added 16 net new dealers in Q2 in North America Completed Indian Motorcycle and GEM acquisitions Integration progressing Indian Motorcycle GEM™ Improvements Continue July 2011
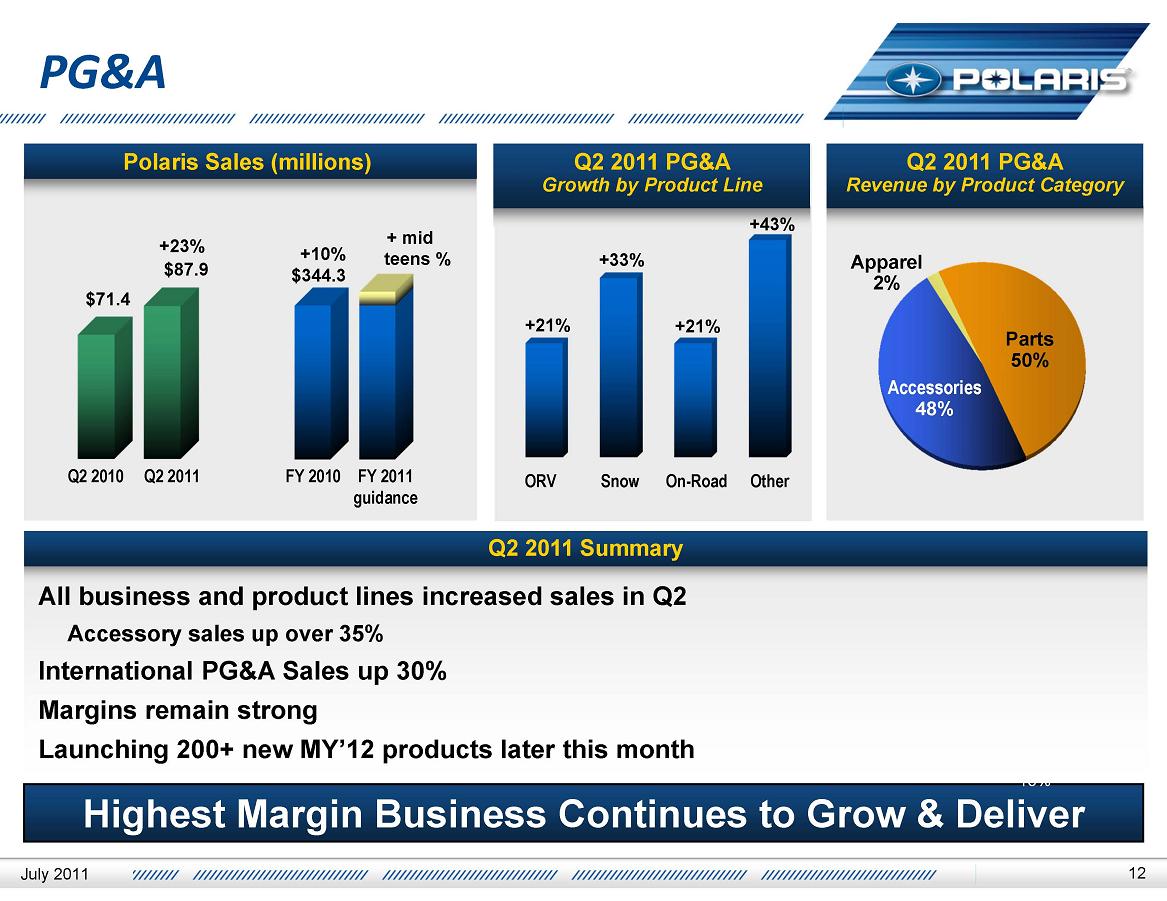
12 PG&A Polaris Sales (millions) Q2 2011 PG&A Growth by Product Line Q2 2011 PG&A Revenue by Product Category $71.4 +23% $87.9 Q2 2010 Q2 2011 +10% $344.3 + mid teens % FY 2010 FY 2011 guidance ORV Snow On-Road Other +21% +33% +21% +43% Parts 50% Accessories 48% Apparel 2% Aus/NZ 13% Q2 2011 Summary All business and product lines increased sales in Q2 Accessory sales up over 35% International PG&A Sales up 30% Margins remain strong Launching 200+ new MY’12 products later this month Highest Margin Business Continues to Grow & Deliver July 2011
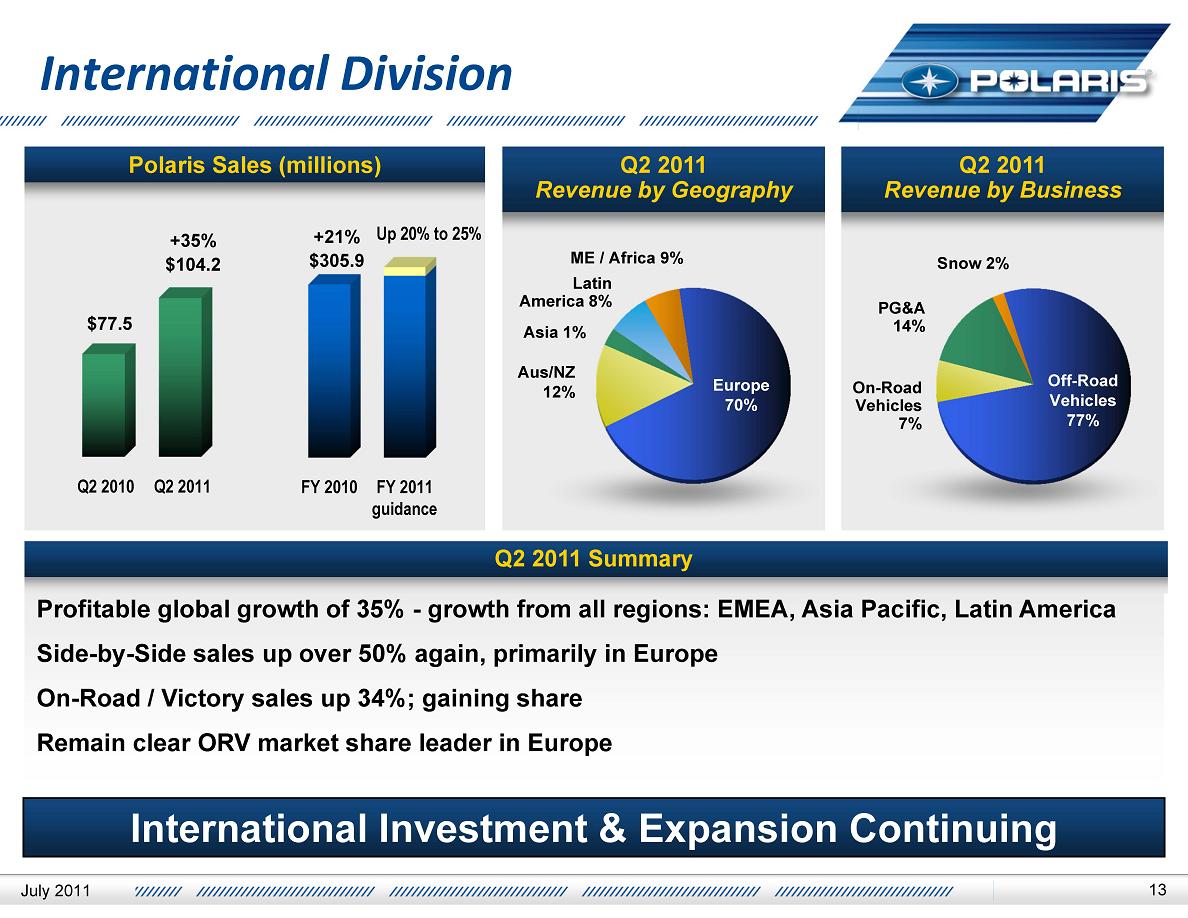
13 International Division Polaris Sales (millions) Q2 2011 Revenue by Geography Q2 2011 Revenue by Business $77.5 +35% $104.2 Q2 2010 Q2 2011 +21% $305.9 Up 20% to 25% FY 2010 FY 2011 guidance Europe 70% ME / Africa 9% Latin America 8% Asia 1% Aus/NZ 12% Off-Road Vehicles 77% On-Road Vehicles 7% PG&A 14% Snow 2% Q2 2011 Summary Profitable global growth of 35% - growth from all regions: EMEA, Asia Pacific, Latin America Side-by-Side sales up over 50% again, primarily in Europe On-Road / Victory sales up 34%; gaining share Remain clear ORV market share leader in Europe International Investment & Expansion Continuing July 2011
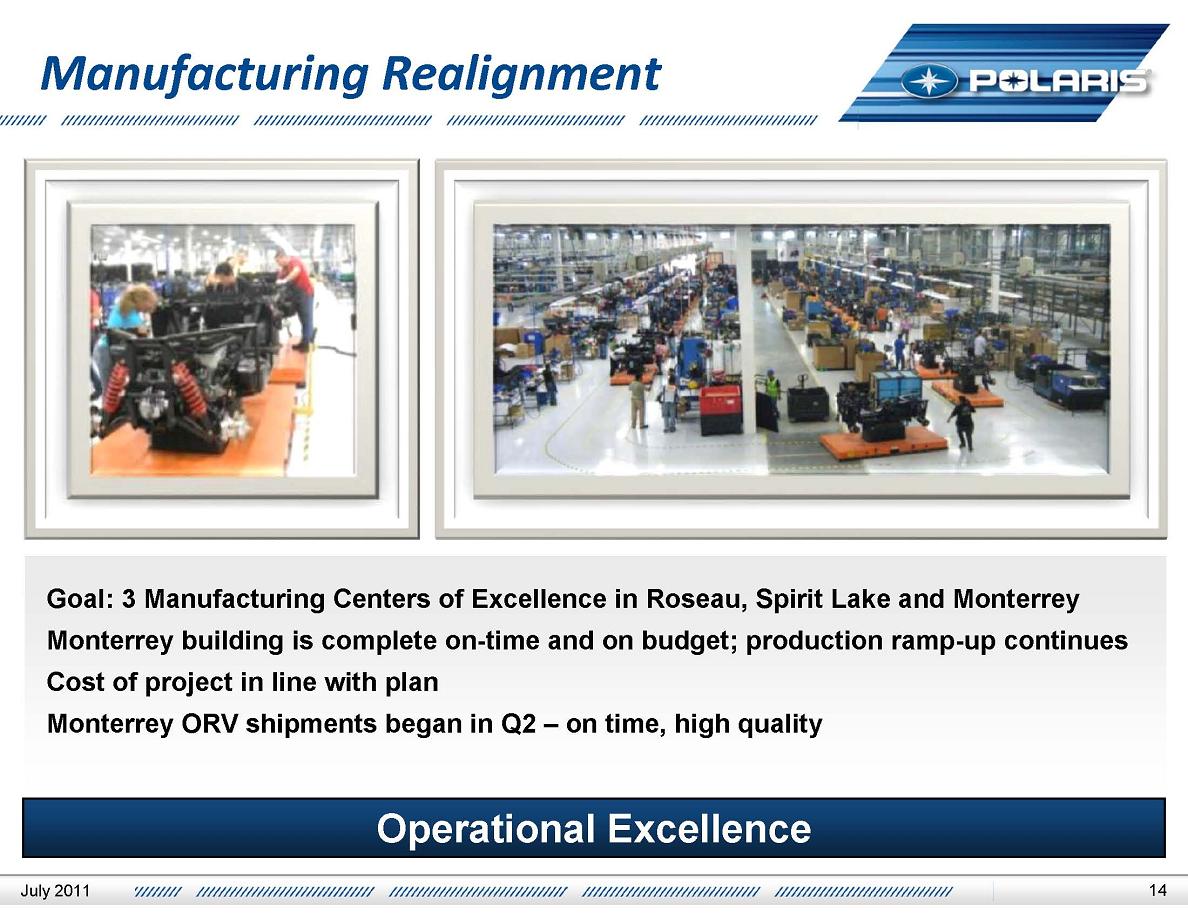
14 Manufacturing Realignment Goal: 3 Manufacturing Centers of Excellence in Roseau, Spirit Lake and Monterrey Monterrey building is complete on-time and on budget; production ramp-up continues Cost of project in line with plan Monterrey ORV shipments began in Q2 – on time, high quality Operational Excellence July 2011
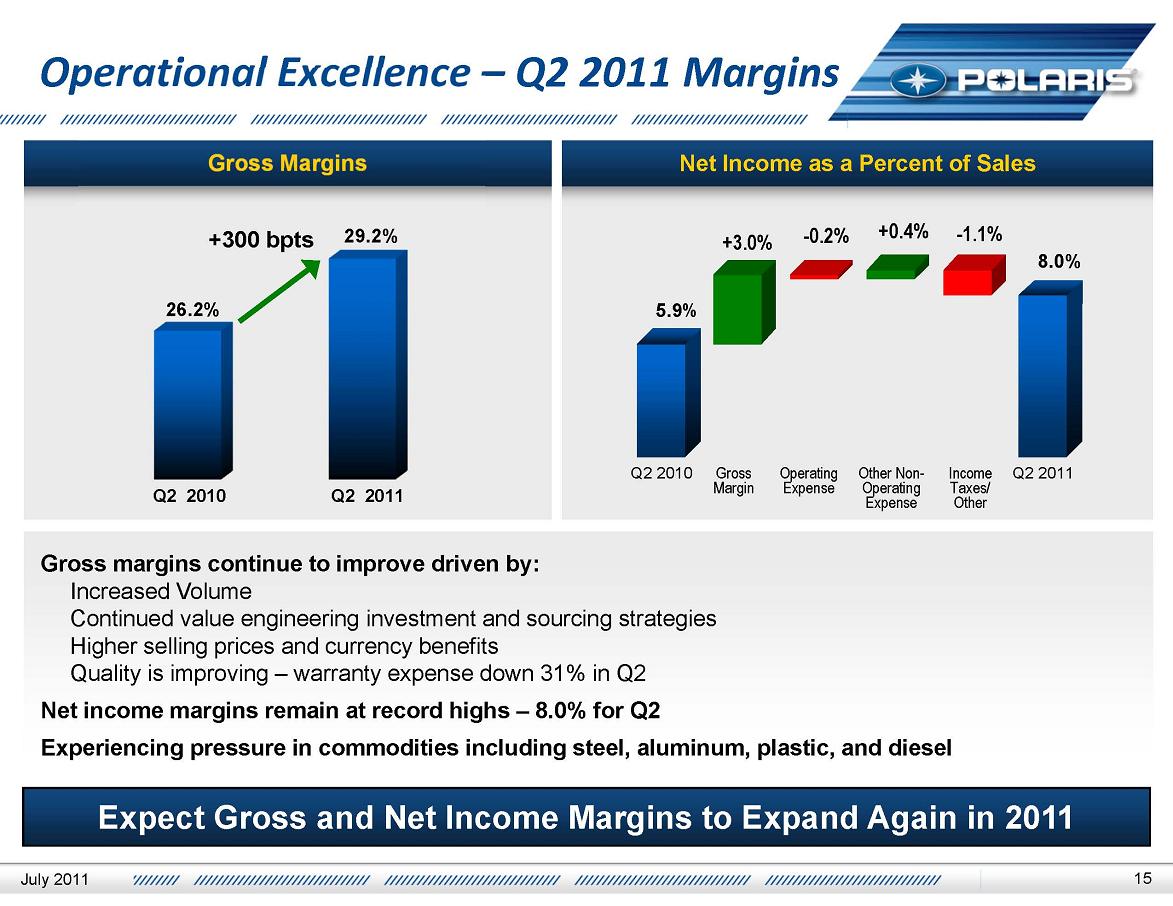
15 Operational Excellence – Q2 2011 Margins Gross Margins Net Income as a Percent of Sales 26.2% 29.2% +300 bpts Q2 2010 Q2 2011 5.9% +3.0% -0.2% +0.4% -1.1% 8.0% Q2 2010 Gross Margin Operating Expense Other Non-Operating Expense Income Taxes/Other Q2 2011 Gross margins continue to improve driven by: Increased Volume Continued value engineering investment and sourcing strategies Higher selling prices and currency benefits Quality is improving – warranty expense down 31% in Q2 Net income margins remain at record highs – 8.0% for Q2 Experiencing pressure in commodities including steel, aluminum, plastic, and diesel Expect Gross and Net Income Margins to Expand Again in 2011 July 2011
Mike Malone V.P. Finance & CFO Second Quarter 2011 Earnings Results July 19, 2011
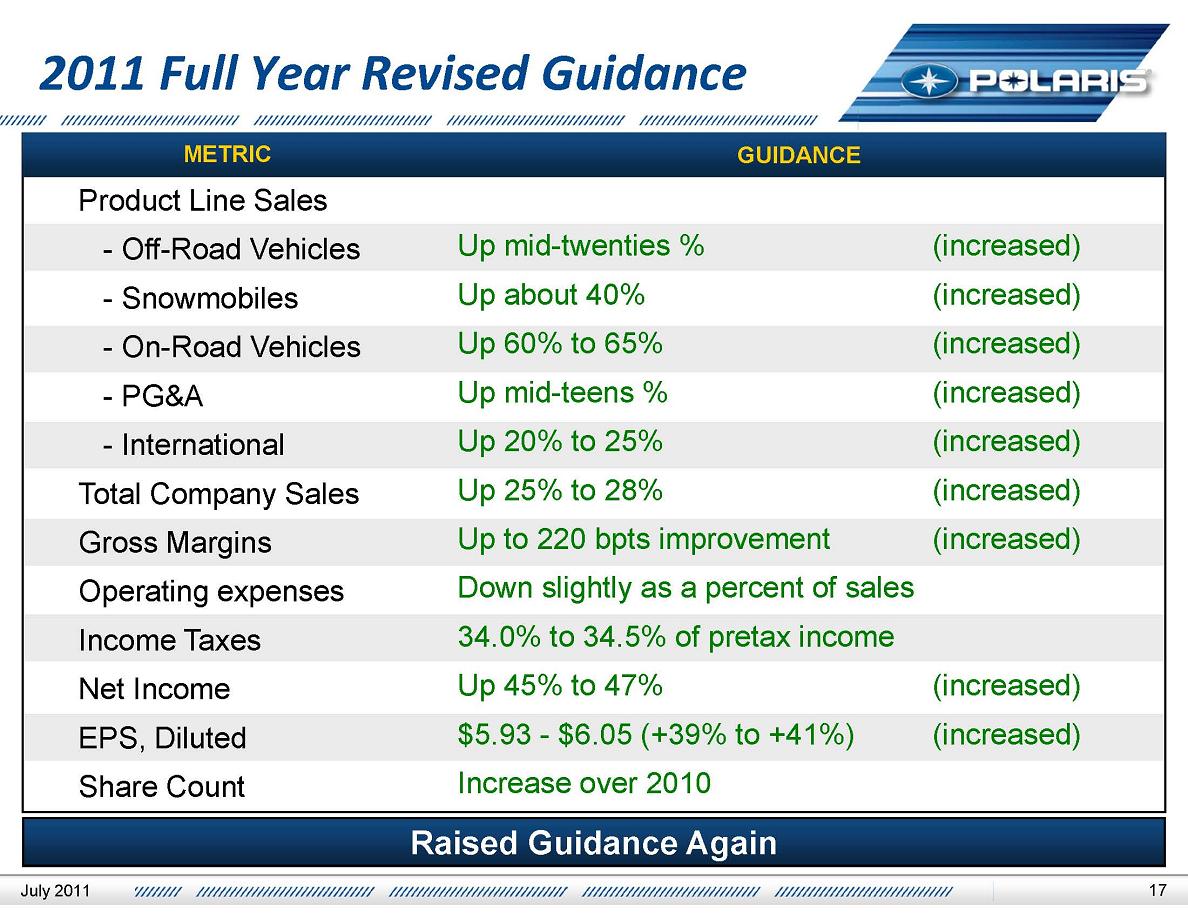
17 2011 Full Year Revised Guidance METRIC GUIDANCE Product Line Sales - Off-Road Vehicles Up mid-twenties % (increased) - Snowmobiles Up about 40% (increased) - On-Road Vehicles Up 60% to 65% (increased) - PG&A Up mid-teens % (increased) - International Up 20% to 25% (increased) Total Company Sales Up 25% to 28% (increased) Gross Margins Up to 220 bpts improvement (increased) Operating expenses Down slightly as a percent of sales Income Taxes 34.0% to 34.5% of pretax income Net Income Up 45% to 47% (increased) EPS, Diluted $5.93 - $6.05 (+39% to +41%) (increased) Share Count Increase over 2010 Raised Guidance Again July 2011
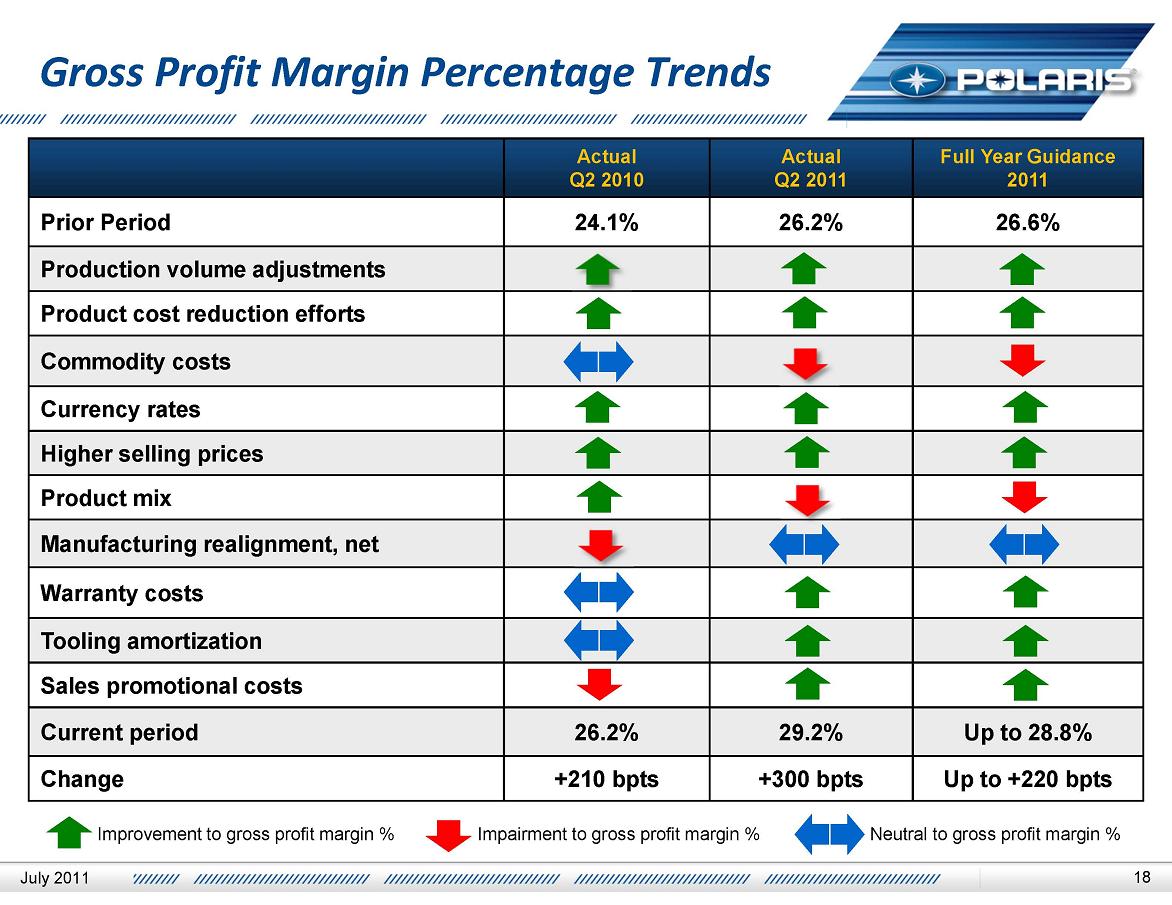
18 Gross Profit Margin Percentage Trends Actual Q2 2010 Actual Q2 2011 Full Year Guidance 2011 Prior Period 24.1% 26.2% 26.6% Production volume adjustments Product cost reduction efforts Commodity costs Currency rates Higher selling prices Product mix Manufacturing realignment, net Warranty costs Tooling amortization Sales promotional costs Current period 26.2% 29.2% Up to 28.8% Change +210 bpts +300 bpts Up to +220 bpts Improvement to gross profit margin % Impairment to gross profit margin % Neutral to gross profit margin % July 2011
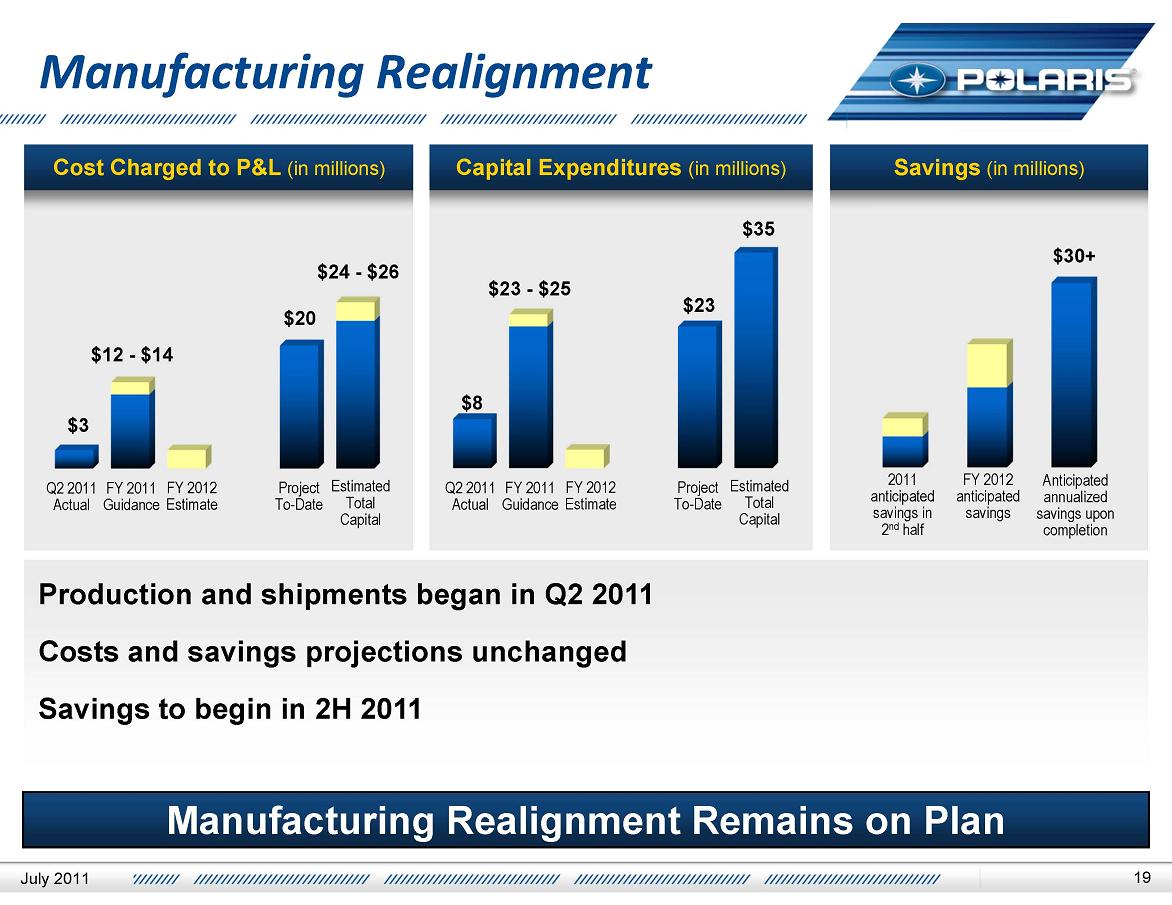
19 Manufacturing Realignment Cost Charged to P&L (in millions) Capital Expenditures (in millions) Savings (in millions) $3 $12 - $14 $20 $24 - $26 Q2 2011 Actual FY 2011 Guidance FY 2012 Estimate Project To-Date Estimated Total Capital $8 $23 - $25 $23 $35 Q2 2011 Actual FY 2011 Guidance FY 2012 Estimate Project To-Date Estimated Total Capital $30+ 2011 anticipated savings in 2nd half FY 2012 anticipated savings Anticipated annualized savings upon completion Production and shipments began in Q2 2011 Costs and savings projections unchanged Savings to begin in 2H 2011 Manufacturing Realignment Remains on Plan July 2011
20 Balance Sheet and Liquidity Profile $ In millions (except per share and interest rate data) YTD 2011 Fav (Unfav) 2010 2011 Full Year Guidance Cash $262.2 $95.9 Increase from 2010 Long Term Debt $100.0 $100.0 $100 private placement at 4.4% fixed rate Credit Facility (expires December 2011) $250.0 ($200.0) TBD Factory Inventory $286.1 ($63.5) Similar $ but better turns than 2010 Capital Expenditures $40.6 ($19.7) $75 to $80 (includes manufacturing realignment) Depreciation & Amortization $35.0 ($3.4) $65 to $70 Operating cash flow $61.8 $4.8 Increase double digit % Dividend $0.90 per share $0.10 per share Increased 13% to $1.80 per share Retail Credit – Approval Rate – Penetration Rate 58% 35% +3% pts +2% pts Stabilized Strong Financial Position July 2011
Scott Wine CEO Second Quarter 2011 Earnings Results July 19, 2011
22 Excellent First Half 2011 Powersports momentum continues Ranger and RZR performance remains strong Snow share gains and order increases translating into significant sales and profit growth Victory: North American retail sales and global growth plans on track Manufacturing realignment remains on plan Monterrey plant began Ranger production in early April; engine assembly began in June Project costs and savings adhering to plan Commodity costs increasing, mitigation steps taken Operational Excellence and LEAN initiatives helping to offset increases Japanese supply chain challenges behind us Adjacency strategy gaining velocity Integration of Indian and GEM ongoing; solid funnel of additional growth accelerators Military and Bobcat building momentum and delivering significant year-over-year growth International growth and expansion ongoing All regions generated revenue growth in Q2 New market development progressing Margin expansion accelerating Expected Record Performance in 2011 Accelerating July 2011
23 Polaris Industries Inc. Thank you. Q & A July 2011
D!\@'Z`@,"#`(4`AT")@(O`C@"00)+
M`E0"70)G`G$">@*$`HX"F`*B`JP"M@+!`LL"U0+@`NL"]0,``PL#%@,A`RT#
M.`-#`T\#6@-F`W(#?@.*`Y8#H@.N`[H#QP/3`^`#[`/Y!`8$$P0@!"T$.P1(
M!%4$8P1Q!'X$C`2:!*@$M@3$!-,$X03P!/X%#044%]@8&!A8&)P8W!D@&609J!GL&C`:=!J\&P`;1!N,&]0<'
M!QD'*P<]!T\'80=T!X8'F0>L![\'T@?E!_@("P@?"#((1@A:"&X(@@B6"*H(
MO@C2".<(^PD0"24).@E/"60)>0F/":0)N@G/">4)^PH1"B<*/0I4"FH*@0J8
M"JX*Q0K<"O,+"PLB"SD+40MI"X`+F`NP"\@+X0OY#!(,*@Q##%P,=0R.#*<,
MP`S9#/,-#0TF#4`-6@UT#8X-J0W##=X-^`X3#BX.20YD#G\.FPZV#M(.[@\)
M#R4/00]>#WH/E@^S#\\/[!`)$"800Q!A$'X0FQ"Y$-<0]1$3$3$13Q%M$8P1
MJA')$>@2!Q(F$D429!*$$J,2PQ+C$P,3(Q-#$V,3@Q.D$\43Y10&%"<4211J
M%(L4K13.%/`5$A4T%585>!6;%;T5X!8#%B86219L%H\6LA;6%OH7'1=!%V47
MB1>N%](7]Q@;&$`891B*&*\8U1CZ&2`911EK&9$9MQG=&@0:*AI1&G<:GAK%
M&NP;%!L[&V,;BANR&]H<`APJ'%(<>QRC',P<]1T>'4<=
M:AZ4'KX>Z1\3'SX?:1^4'[\?ZB`5($$@;""8(,0@\"$<(4@A=2&A( &YXS'DJ>8EYYWI&>J5[!'MC>\)\(7R!?.%]07VA?@%^
M8G["?R-_A'_E@$>`J($*@6N!S8(P@I*"](-7@[J$'82`A..%1X6KA@Z& QR>7-!_HD4@;4;K]Y<3J/]6O38?=4?CSAJ18
M>5!-_HD>V/3+/_7$GB1ASM)/4#JQ[G@_Q4?:,_\`$UN$8C[EG!C#'/`.#_$W
MZ+Z?-1Y4,W^B)M33;/\`UQ)XD8<[23U`ZL>YX/\`%1]HS_Q-;A&(^Y9P8PQS
MQG!_B;]%]/FH`,3VY\A'5M3N_GED`RL2CC/T7.%'<\_WC2K!'.1IT&196W^O
M;.?,;KLSW]6/?..YI,3V_P"X1U;5+OYI9`,K$H[_`.ZO11W)_P!XTJP1SL-.
MM\BRMO\`7MG/F/UV9[^K'OG'6D_!*;_P`)+I_K+_WQ
M7$LY9LDYIRG!J_8Q(]O*YVO_``DEA_TU_P"^*/\`A([#UE_[XKCP].#`FE[*
M(_;2.O'B&Q/>7_OBGKKMF_0R?]\UR:@58BX/2I=.)7M)'5#5+<]-_P#WS3UO
MX7.!N_$5S\
7;+$/MTL1:^N/W5M;D_<7J`?3^\
MQ]L
P`';G7HHN%C',$\*+9Q.QN[DF2YN@,;1T)'OT51VZ\X.7>0D\BVJQ
M>7I]IC<"#B1AR![J.I]3]#G6HHN%C(61R#JDT$C.1LM;?'S*#W/HS<9S]T?C
MD\FXMT$$;9OKLEYK@+\L8'4CZ#A1^)SS6O11<+&3]F69UL8XS'86V/,SG]ZW
M4+[CNQ[GCGFD$C/NU2>&1@HVVD`7YL'C<1V9O?H.N,M6O61XE\06GAG19M2N
MSD)\L<8.#*YZ*/\`/`R::NW9"=HJ[.2\=>*F\)Z2UO#*K:]J(R77_EBG3(]A
MR%]\GUKP]5))).>^2>M6]2U*[US4[C4;Y]]Q.VXGL!V4>P'`J`DE0.!CTKT*
M<.16ZGD5:KJ2N]N@W)`ZU*CX7FH32K6EC#FL60Y`]*=YI]
JC&176
M7-GX2TW8T.B6\Z,H='QPP/(()KY_KN/#7B5KC3!H]XX+P`M:R-Z=2G^%.'NL
MYL16CB$O=2:7WGH:>)-"B^5=`@3_`'57_"M&UU70=20@:#'*$'(\I.!]<5Y?
M=:I#$H+ORWW5`R3]!6=)>WCAF,SVL)'W0
89.NU:-)(73L+
MT,K`?G7,ZXZ7'B%X]A
:VIQ6[.:K-O2(\74I'WS^=`NYAP)6]^:B\HYC$0.O
M-:VB8