 |
|
| |
(as revised March 18, 2024) |
 |
2023 Prospectus |
• iShares Asia/Pacific Dividend ETF | DVYA | NYSE ARCA
The Securities and Exchange Commission (“SEC”) has not approved or disapproved these securities or passed upon the adequacy of this prospectus. Any representation to the contrary is a criminal offense.
Table of Contents
The “Dow Jones Asia/Pacific Select Dividend 50 IndexTM” is a product of S&P Dow Jones Indices LLC (“SPDJI”), and has been licensed for use by BlackRock Fund Advisors or its affiliates. Standard & Poor’s® and S&P® are registered trademarks of Standard & Poor’s Financial Services LLC (“S&P”); Dow Jones® is a registered trademark of Dow Jones Trademark Holdings LLC (“Dow Jones”) and these trademarks have been licensed for use by SPDJI and sublicensed for certain purposes by iShares, Inc. iShares® and BlackRock® are registered trademarks of BlackRock Fund Advisors and its affiliates. The Fund is not sponsored, endorsed, sold or promoted by SPDJI, Dow Jones, S&P or their respective affiliates, and none of such parties makes any representation regarding the advisability of investing in such product(s), nor do they have any liability for any errors, omissions, or interruptions of the Dow Jones Asia/Pacific Select Dividend 50 Index.
i
iSHARES® ASIA/PACIFIC DIVIDEND ETF
Ticker: DVYA Stock Exchange: NYSE Arca
Investment Objective
The iShares Asia/Pacific Dividend ETF (the “Fund”) seeks to track the investment results of an index composed of relatively high dividend paying equities in Asia/Pacific developed markets.
Fees and Expenses
The following table describes the fees and expenses that you will incur if you buy, hold and sell shares of the Fund. The investment advisory agreement between iShares, Inc. (the “Company”) and BlackRock Fund Advisors (“BFA”) (the “Investment Advisory Agreement”) provides that BFA will pay all operating expenses of the Fund, except: (i) the management fees, (ii) interest expenses, (iii) taxes, (iv) expenses incurred with respect to the acquisition and disposition of portfolio securities and the execution of portfolio transactions, including brokerage commissions, (v) distribution fees or expenses, and (vi) litigation expenses and any extraordinary expenses. The Fund may incur “Acquired Fund Fees and Expenses.” Acquired Fund Fees and Expenses reflect the Fund's pro rata share of the fees and expenses incurred indirectly by the Fund as a result of investing in other investment companies. The impact of Acquired Fund Fees and Expenses is included in the total returns of the Fund. Acquired Fund Fees and Expenses are not included in the calculation of the ratio of expenses to average net assets shown in the Financial Highlights section of the Fund's prospectus (the “ Prospectus ” ). BFA, the investment adviser to the Fund, has contractually agreed to waive its management fees in an amount equal to the Acquired Fund Fees and Expenses, if any, attributable to investments by the Fund in other funds advised by BFA or its affiliates through August 31, 2025. The contractual waiver may be terminated prior to August 31, 2025 only upon written agreement of the Company and BFA.
You may pay other fees, such as brokerage commissions and other fees to financial intermediaries, which are not reflected in the tables and examples below.
| | ||||||
| Management Fees |
Distribution and Service (12b-1) Fees |
Other Expenses 2 |
Acquired Fund Fees and Expenses2 |
Total Annual Fund Operating Expenses |
Fee Waiver2 |
Total Annual Fund Operating Expenses After Fee Waiver |
| |
|
|
|
|
( |
|
1
2
S-1
| 1 Year |
3 Years |
5 Years |
10 Years |
| $ |
$ |
$ |
$ |
Principal Investment Strategies
The Fund seeks to track the investment results of the Dow Jones Asia/Pacific Select Dividend 50 Index (the “Underlying Index”), which is provided by S&P Dow Jones Indices LLC (the “Index Provider” or “SPDJI”). The Underlying Index measures the performance of 50 high dividend-paying companies in Australia, Hong Kong, Japan, New Zealand, and Singapore, selected according to indicated annual dividend (“IAD”) yield, subject to screening and buffering criteria and weighting constraints. IAD yield is
defined as a stock’s IAD (not including any special dividends) divided by its price.
The starting universe for the Underlying Index comprises the S&P BMI indexes for the jurisdictions listed above, excluding real estate investment trusts. To be eligible for the Underlying Index as a new constituent, an issuer must (i) have paid dividends in each of the previous three years; (ii) have a current year trailing 12-month dividend-per-share ratio that is greater than or equal to its three-year average dividend-per-share ratio; and (iii) have a five-year average dividend coverage ratio that is greater than or equal to two-thirds of the five-year average dividend coverage ratio of the corresponding S&P BMI country index, or greater than 118%, whichever is greater. In addition, the security must have (x) a non-negative trailing 12-month earnings per share; (y) a float-adjusted market capitalization of at least $600 million, or at least $400 million for current constituents; and (z) a three-month average daily trading value of at least $3 million, or at least $1.5 million for current constituents. Current constituents are included in the eligible universe regardless of their dividend growth rate, coverage ratio or current year earnings per share.
S-2
To select the 50 constituents, the Index Provider ranks the eligible securities by IAD yield and first includes all non-constituent stocks that are ranked in the top 25 and then adds all current constituents in the top 80 in rank order until the count reaches 50. No more than 25 companies from any eligible country can be included.
The Underlying Index is reconstituted annually with constituent weights determined based on tilted IAD yield, which is calculated by multiplying the constituent’s IAD yield (capped at 20%) by the square root of its fair market capitalization. The capping methodology also limits the weight of individual securities to 10% and the aggregate weight of constituents within each Global Industry Classification Standard sector to 30%.
The Underlying Index is reviewed daily based on each constituent’s weight. Daily capping is performed if the aggregate weight of constituents with an individual weight greater than 4.8% exceeds 24% of the Underlying Index’s total weight. If that threshold is breached, the current constituent weights are recapped, with the weights of individual constituents capped at 10% and the aggregate weight of constituents with an individual weight greater than 4.5% capped at 22.5% of the Underlying Index’s total weight. IAD yields and tilted yield weights are not recalculated if the capping thresholds are breached throughout the year. A freeze period on the daily capping is implemented during the annual index reconstitution.
The Underlying Index includes large-, mid‑ and small-capitalization companies and may change over time. As of January 22, 2024, a significant
portion of the Underlying Index is represented by securities of companies in the financials, industrials, and materials industries or sectors. The components of the Underlying Index are likely to change over time.
BFA uses an indexing approach to try to achieve the Fund’s investment objective. Unlike many investment companies, the Fund does not try to “beat” the index it tracks and does not seek temporary defensive positions when markets decline or appear overvalued.
Indexing may eliminate the chance that the Fund will substantially outperform the Underlying Index but also may reduce some of the risks of active management, such as poor security selection. Indexing seeks to achieve lower costs and better after-tax performance by aiming to keep portfolio turnover low in comparison to actively managed investment companies.
BFA uses a representative sampling indexing strategy to manage the Fund. “Representative sampling” is an indexing strategy that involves investing in a representative sample of securities that collectively has an investment profile similar to that of an applicable underlying index. The securities selected are expected to have, in the aggregate, investment characteristics (based on factors such as market capitalization and industry weightings), fundamental characteristics (such as return variability and yield) and liquidity measures similar to those of an applicable underlying index. The Fund may or may not hold all of the securities in the Underlying Index.
The Fund generally will invest at least 80% of its assets in the component securities of its Underlying Index and in
S-3
investments that have economic characteristics that are substantially identical to the component securities of its Underlying Index (i.e., depositary receipts representing securities of the Underlying Index) and may invest up to 20% of its assets in certain futures, options and swap contracts, cash and cash equivalents, including shares of money market funds advised by BFA or its affiliates (“BlackRock Cash Funds”), as well as in securities not included in the Underlying Index, but which BFA believes will help the Fund track the Underlying Index. Cash and cash equivalent investments associated with a derivative position will be treated as part of that position for the purposes of calculating the percentage of investments included in the Underlying Index. The Fund seeks to track the investment results of the Underlying Index before fees and expenses of the Fund.
The Fund may lend securities representing up to one-third of the value of the Fund's total assets (including the value of any collateral received).
The Underlying Index is sponsored by S&P Dow Jones Indices LLC (the “Index Provider” or “SPDJI”), which is independent of the Fund and BFA. The Index Provider determines the composition and relative weightings of the securities in the Underlying Index and publishes information regarding the market value of the Underlying Index.
Industry Concentration Policy. The Fund will concentrate its investments (i.e., hold 25% or more of its total assets) in a particular industry or group of industries to approximately the same extent that the Underlying Index is concentrated. For purposes of this limitation, securities of the U.S.
government (including its agencies and instrumentalities) and repurchase agreements collateralized by U.S. government securities are not considered to be issued by members of any industry.
Summary of Principal Risks
Asset Class Risk. Securities and other assets in the Underlying Index or in the Fund's portfolio may underperform in comparison to the general financial markets, a particular financial market or other asset classes.
Authorized Participant Concentration Risk. Only an Authorized Participant (as defined in the Creations and Redemptions section of this Prospectus) may engage in creation or redemption transactions directly with the Fund, and none of those Authorized Participants is obligated to engage in creation and/or redemption transactions. The Fund has a limited number of institutions that may act as Authorized Participants on an agency basis (i.e., on behalf of other market participants). To the extent that Authorized Participants exit the business or are unable to proceed with creation or redemption orders with respect to the Fund and no other Authorized Participant is able to step forward to create or redeem, Fund shares may be more likely to trade at a premium or discount to NAV and possibly face trading halts or delisting.
S-4
Authorized Participant concentration risk may be heightened for exchange-traded funds (“ETFs”), such as the Fund, that invest in securities issued by non-U.S. issuers or other securities or instruments that have lower trading volumes.
Concentration Risk. The Fund may be susceptible to an increased risk of loss, including losses due to adverse events that affect the Fund’s investments more than the market as a whole, to the extent that the Fund's investments are concentrated in the securities and/or other assets of a particular issuer or issuers, country, group of countries, region, market, industry, group of industries, sector, market segment or asset class.
Currency Risk. Because the Fund's NAV is determined in U.S. dollars, the Fund's NAV could decline if the currency of a non-U.S. market in which the Fund invests depreciates against the U.S. dollar or if there are delays or limits on repatriation of such currency. Currency exchange rates can be very volatile and can change quickly and unpredictably. As a result, the Fund's NAV may change quickly and without warning.
Cybersecurity Risk. Failures or breaches of the electronic systems of the Fund, the Fund's adviser, distributor, the Index Provider and other service providers, market makers, Authorized Participants or the issuers of securities in which the Fund invests have the ability to cause disruptions, negatively impact the Fund’s business operations and/or potentially result in financial losses to the Fund and its shareholders. While the Fund has established business continuity plans and risk management systems seeking to address system breaches or failures, there are inherent limitations in such plans and systems. Furthermore, the Fund cannot control the cybersecurity plans and systems of the Fund’s Index Provider and other service providers, market makers,
Authorized Participants or issuers of securities in which the Fund invests.
Dividend-Paying Stock Risk. Investing in dividend-paying stocks involves the risk that such stocks may fall out of favor with investors and underperform the broader market. Companies that issue dividend-paying stocks are not required to pay or continue paying dividends on such stocks. It is possible that issuers of the stocks held by the Fund will not declare dividends in the future or will reduce or eliminate the payment of dividends (including reducing or eliminating anticipated accelerations or increases in the payment of dividends) in the future.
Equity Securities Risk. Equity securities are subject to changes in value, and their values may be more volatile than those of other asset classes. The Underlying Index is composed of common stocks, which generally subject their holders to more risks than preferred stocks and debt securities because common stockholders’ claims are subordinated to those of holders of preferred stocks and debt securities upon the bankruptcy of the issuer.
Financials Sector Risk. The performance of companies in the financials sector may be adversely impacted by many factors, including, among others, changes in government regulations, economic conditions, and interest rates, credit rating downgrades, adverse public perception, exposure concentration and decreased liquidity in credit markets. The impact of changes in regulation of any individual financial company, or of the financials sector as a whole, cannot be predicted. Cybersecurity incidents and technology malfunctions and failures have become increasingly frequent and have caused significant losses to companies in this sector, which may negatively impact the Fund.
S-5
Geographic Risk. A natural disaster could occur in a geographic region in which the Fund invests, which could adversely affect the economy or the business operations of companies in the specific geographic region, causing an adverse impact on the Fund's investments in, or which are exposed to, the affected region.
Index-Related Risk. There is no guarantee that the Fund’s investment results will have a high degree of correlation to those of the Underlying Index or that the Fund will achieve its investment objective. Market disruptions and regulatory restrictions could have an adverse effect on the Fund’s ability to adjust its exposure to the required levels in order to track the Underlying Index. Errors in index data, index computations or the construction of the Underlying Index in accordance with its methodology may occur from time to time and may not be identified and corrected by the Index Provider for a period of time or at all, which may have an adverse impact on the Fund and its shareholders. Unusual market conditions or other unforeseen circumstances (such as natural disasters, political unrest or war) may impact the Index Provider or a third-party data provider, and could cause the Index Provider to postpone a scheduled rebalance. This could cause the Underlying Index to vary from its normal or expected composition.
Indexing Investment Risk. The Fund is not actively managed, and BFA generally does not attempt to take defensive positions under any market conditions, including declining markets.
Industrials Sector Risk. Companies in the industrials sector may be adversely affected by changes in the supply of and demand for products and services, product obsolescence, claims for environmental damage or product liability and changes in general
economic conditions, among other factors.
Infectious Illness Risk. A widespread outbreak of an infectious illness, such as the COVID-19 pandemic, may result in travel restrictions, disruption of healthcare services, prolonged quarantines, cancellations, supply chain disruptions, business closures, lower consumer demand, layoffs, ratings downgrades, defaults and other significant economic, social and political impacts. Markets may experience temporary closures, extreme volatility, severe losses, reduced liquidity and increased trading costs. Such events may adversely affect the Fund and its investments and may impact the Fund’s ability to purchase or sell securities or cause elevated tracking error and increased premiums or discounts to the Fund's NAV. Despite the development of vaccines, the duration of the COVID-19 pandemic and its effects cannot be predicted with certainty.
Issuer Risk. The performance of the Fund depends on the performance of individual securities to which the Fund has exposure. Changes in the financial condition or credit rating of an issuer of those securities may cause the value of the securities to decline. There is no guarantee that an issuer that paid dividends in the past will continue to do so in the future or will continue paying dividends at the same level.
Large-Capitalization Companies Risk. Large-capitalization companies may be less able than smaller capitalization companies to adapt to changing market conditions. Large-capitalization companies may be more mature and subject to more limited growth potential compared with smaller capitalization companies. During different market cycles, the performance of large-capitalization companies has trailed the overall performance of the broader securities markets.
S-6
Management Risk. As the Fund will not fully replicate the Underlying Index, it is subject to the risk that BFA's investment strategy may not produce the intended results.
Market Risk. The Fund could lose money over short periods due to short-term market movements and over longer periods during more prolonged market downturns. Local, regional or global events such as war, acts of terrorism, public health issues, recessions, the prospect or occurrence of a sovereign default or other financial crisis, or other events could have a significant impact on the Fund and its investments and could result in increased premiums or discounts to the Fund’s NAV.
Market Trading Risk. The Fund faces numerous market trading risks, including the potential lack of an active market for Fund shares, losses from trading in secondary markets, periods of high volatility and disruptions in the creation/redemption process. ANY OF THESE FACTORS, AMONG OTHERS, MAY LEAD TO THE FUND'S SHARES TRADING AT A PREMIUM OR DISCOUNT TO NAV.
Materials Sector Risk. Companies in the materials sector may be adversely impacted by the volatility of commodity prices, changes in exchange rates, social and political unrest, war, depletion of resources, decreases in demand, over-production, litigation and changes in government regulations, among other factors.
National Closed Market Trading Risk. To the extent that the underlying securities or other instruments held by the Fund trade on foreign exchanges or in foreign markets that may be closed when the securities exchange on which the Fund’s shares trade is open, there are likely to be deviations between the current price of such an underlying security and the last quoted price for the underlying security (i.e., the Fund’s
quote from the closed foreign market). The impact of a closed foreign market on the Fund is likely to be greater where a large portion of the Fund’s underlying securities or other instruments trade on that closed foreign market or when the foreign market is closed for unscheduled reasons. These deviations could result in premiums or discounts to the Fund’s NAV that may be greater than those experienced by other ETFs.
Non-U.S. Securities Risk. Investments in the securities of non-U.S. issuers are subject to the risks associated with investing in those non-U.S. markets, such as heightened risks of inflation or nationalization. The Fund may lose money due to political, economic and geographic events affecting issuers of non-U.S. securities or non-U.S. markets. In addition, non-U.S. securities markets may trade a small number of securities and may be unable to respond effectively to changes in trading volume, potentially making prompt liquidation of holdings difficult or impossible at times. The Fund is specifically exposed to Asian Economic Risk and Australasian Economic Risk.
Operational Risk. The Fund is exposed to operational risks arising from a number of factors, including, but not limited to, human error, processing and communication errors, errors of the Fund’s service providers, counterparties or other third parties, failed or inadequate processes and technology or systems failures. The Fund and BFA seek to reduce these operational risks through controls and procedures. However, these measures do not address every possible risk and may be inadequate to address significant operational risks.
Reliance on Trading Partners Risk. The Fund invests in countries or regions whose economies are heavily dependent upon trading with key partners. Any reduction in this trading
S-7
may have an adverse impact on the Fund's investments. Through its holdings of securities of certain issuers, the Fund is specifically exposed to Asian Economic Risk and U.S. Economic Risk.
Risk of Investing in Asia. Investments in securities of issuers in certain Asian countries involve risks that are specific to Asia, including certain legal, regulatory, political and economic risks. Certain Asian countries have experienced expropriation and/or nationalization of assets, confiscatory taxation, political instability, armed conflict and social instability as a result of religious, ethnic, socio-economic and/or political unrest. In particular, escalated tensions involving North Korea and any outbreak of hostilities involving North Korea, or even the threat of an outbreak of hostilities, could have a severe adverse effect on Asian economies. Some economies in this region are dependent on a range of commodities, and are strongly affected by international commodity prices and particularly vulnerable to price changes for these products. The market for securities in this region may also be directly influenced by the flow of international capital, and by the economic and market conditions of neighboring countries. Many Asian economies have experienced rapid growth and industrialization, and there is no assurance that this growth rate will be maintained. Some Asian economies are highly dependent on trade, institution of tariffs or other trade barriers and economic conditions in other countries can impact these economies.
Risk of Investing in Australia. Investments in Australian issuers may subject the Fund to legal, regulatory, political, currency, security, and economic risk specific to Australia. The Australian economy is heavily dependent on exports from the energy,
agricultural and mining sectors. This makes the Australian economy susceptible to fluctuations in the commodity markets. Australia is also dependent on trading with key trading partners.
Risk of Investing in Developed Countries. The Fund’s investment in developed country issuers may subject the Fund to legal, regulatory, political, currency, security, economic and other risks associated with developed countries. Developed countries tend to represent a significant portion of the global economy and have generally experienced slower economic growth than some less developed countries. Certain developed countries have experienced security concerns, such as war, terrorism and strained international relations. Incidents involving a country’s or region’s security may cause uncertainty in its markets and may adversely affect its economy and the Fund’s investments. In addition, developed countries may be adversely impacted by changes to the economic conditions of certain key trading partners, regulatory burdens, debt burdens and the price or availability of certain commodities.
Risk of Investing in Japan. The Japanese economy may be subject to considerable degrees of economic, political and social instability, which could have a negative impact on Japanese securities. Since 2000, Japan’s economic growth rate has generally remained low relative to other advanced economies, and it may remain low in the future. In addition, Japan is subject to the risk of natural disasters, such as earthquakes, volcanic eruptions, typhoons and tsunamis, which could negatively affect the Fund. Japan’s relations with its neighbors have at times been strained, and strained relations may cause uncertainty in the Japanese markets and adversely affect the overall Japanese economy.
S-8
Securities Lending Risk. The Fund may engage in securities lending. Securities lending involves the risk that the Fund may lose money because the borrower of the loaned securities fails to return the securities in a timely manner or at all. The Fund could also lose money in the event of a decline in the value of collateral provided for loaned securities or a decline in the value of any investments made with cash collateral. These events could also trigger adverse tax consequences for the Fund.
Small Fund Risk. When the Fund’s size is small, the Fund may experience low trading volume and wide bid/ask spreads. In addition, the Fund may face the risk of being delisted if the Fund does not meet certain conditions of the listing exchange. Any resulting liquidation of the Fund could cause the Fund to incur elevated transaction costs for the Fund and negative tax consequences for its shareholders.
Tracking Error Risk. The Fund may be subject to “tracking error,” which is the divergence of the Fund’s performance from that of the Underlying Index. Tracking error may occur because of differences between the securities and other instruments held in the Fund’s portfolio and those included in the Underlying Index, pricing differences (including, as applicable, differences between a security’s price at the local market close and the Fund's valuation of a security at the time of calculation of the Fund's NAV), transaction costs incurred by the Fund, the Fund’s holding of uninvested cash, differences in timing of the accrual or the valuation of dividends or interest received by the Fund or distributions paid to the Fund’s shareholders, the requirements to maintain pass-through tax treatment, portfolio transactions carried out to minimize the distribution of capital gains to shareholders, acceptance of custom baskets, changes
to the Underlying Index or the costs to the Fund of complying with various new or existing regulatory requirements, among other reasons. This risk may be heightened during times of increased market volatility or other unusual market conditions. Tracking error also may result because the Fund incurs fees and expenses, while the Underlying Index does not. Tracking error may occur due to differences between the methodologies used in calculating the value of the Underlying Index and determining the Fund’s NAV. INDEX ETFs THAT TRACK INDICES WITH SIGNIFICANT WEIGHT IN EMERGING MARKETS ISSUERS MAY EXPERIENCE HIGHER TRACKING ERROR THAN OTHER INDEX ETFs THAT DO NOT TRACK SUCH INDICES.
Valuation Risk. The price the Fund could receive upon the sale of a security or other asset may differ from the Fund's valuation of the security or other asset and from the value used by the Underlying Index, particularly for securities or other assets that trade in low volume or volatile markets or that are valued using a fair value methodology as a result of trade suspensions or for other reasons. In addition, the value of the securities or other assets in the Fund's portfolio may change on days or during time periods when shareholders will not be able to purchase or sell the Fund's shares. Authorized Participants who purchase or redeem Fund shares on days when the Fund is holding fair-valued securities may receive fewer or more shares, or lower or higher redemption proceeds, than they would have received had the securities not been fair valued or been valued using a different methodology. The ability to value investments may be impacted by technological issues or errors by pricing services or other third-party service providers.
S-9
Performance Information
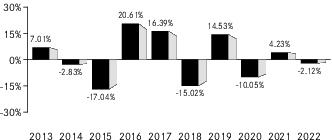
Year by Year Returns1 (Years Ended December 31)
1
The best calendar quarter return during the periods shown above was 18.10 % in the 2nd quarter of 2020 ; the worst was -34.47 % in the 1st quarter of 2020 .
Updated performance information, including the Fund’s current NAV, may be obtained by visiting our website at www.iShares.com or by calling 1-800-iShares (1-800-474-2737) (toll free) .
S-10
Average Annual Total Returns
(for the periods ended December 31, 2022)
(for the periods ended December 31, 2022)
| |
One Year |
Five Years |
Ten Years |
| (Inception Date: |
|
|
|
| Return Before Taxes |
- |
- |
|
| Return After Taxes on Distributions1 |
- |
- |
- |
| Return After Taxes on Distributions and Sale of Fund Shares1 |
- |
- |
|
| Dow Jones Asia/Pacific Select Dividend 50 Index2 (Index returns do not reflect deductions for fees, expenses, or taxes) |
- |
- |
|
1
2
S-11
Management
Investment Adviser. BlackRock Fund Advisors.
Portfolio Managers. Jennifer Hsui, Greg Savage and Paul Whitehead (the “Portfolio Managers”) are primarily responsible for the day-to-day management of the Fund. Each Portfolio Manager supervises a portfolio management team. Ms. Hsui, Mr. Savage and Mr. Whitehead have been Portfolio Managers of the Fund since 2012, 2012 and 2022, respectively.
Purchase and Sale of Fund Shares
The Fund is an ETF. Individual shares of the Fund may only be bought and sold in the secondary market through a broker-dealer. Because ETF shares trade at market prices rather than at NAV, shares may trade at a price greater than NAV (a premium) or less than NAV (a discount). An investor may incur costs attributable to the difference between the highest price a buyer is willing to pay to purchase shares of the Fund (bid) and the lowest price a seller is willing to accept for shares of the Fund (ask) when buying or selling shares in the secondary market (the “bid-ask spread”).
Tax Information
The Fund intends to make distributions that may be taxable to you as ordinary income or capital gains, unless you are investing through a tax-deferred arrangement such as a 401(k) plan or an IRA, in which case, your distributions generally will be taxed when withdrawn.
Payments to Broker-Dealers and Other Financial Intermediaries
If you purchase shares of the Fund through a broker-dealer or other financial intermediary (such as a bank), BFA or other related companies may pay the intermediary for marketing activities and presentations, educational training programs, conferences, the development of technology platforms and reporting systems or other services related to the sale or promotion of the Fund. These payments may create a conflict of interest by influencing the broker-dealer or other intermediary and your salesperson to recommend the Fund over another investment. Ask your salesperson or visit your financial intermediary’s website for more information.
S-12
More Information About the Fund
This Prospectus contains important information about investing in the Fund. Please read this Prospectus carefully before you make any investment decisions. Additional information regarding the Fund is available at www.iShares.com.
BFA is the investment adviser to the Fund. Shares of the Fund are listed for trading on NYSE Arca, Inc. (“NYSE Arca”). The market price for a share of the Fund may be different from the Fund’s most recent NAV.
ETFs are funds that trade like other publicly traded securities. The Fund is designed to track an index. Similar to shares of an index mutual fund, each share of the Fund represents an ownership interest in an underlying portfolio of securities and other instruments intended to track a market index. Unlike shares of a mutual fund, which can be bought and redeemed from the issuing fund by all shareholders at a price based on NAV, shares of the Fund may be purchased or redeemed directly from the Fund at NAV solely by Authorized Participants and only in aggregations of a specified number of shares (“Creation Units”). Also unlike shares of a mutual fund, shares of the Fund are listed on a national securities exchange and trade in the secondary market at market prices that change throughout the day.
The Fund invests in a particular segment of the securities markets and seeks to track the performance of a securities index that is not representative of the market as a whole. The Fund is designed to be used as part of broader asset allocation strategies. Accordingly, an investment in the Fund should not constitute a complete investment program.
An index is a financial calculation, based on a grouping of financial instruments, and is not an investment product, while the Fund is an actual investment portfolio. The performance of the Fund and the Underlying Index may vary for a number of reasons, including transaction costs, non-U.S. currency valuations, asset valuations, corporate actions (such as mergers and spin-offs), timing variances and differences between the Fund’s portfolio and the Underlying Index resulting from the Fund's use of representative sampling or from legal restrictions (such as diversification requirements) that apply to the Fund but not to the Underlying Index. From time to time, the Index Provider may make changes to the methodology or other adjustments to the Underlying Index. Unless otherwise determined by BFA, any such change or adjustment will be reflected in the calculation of the Underlying Index performance on a going-forward basis after the effective date of such change or adjustment. Therefore, the Underlying Index performance shown for periods prior to the effective date of any such change or adjustment will generally not be recalculated or restated to reflect such change or adjustment.
Because the Fund uses a representative sampling indexing strategy, it can be expected to have a larger tracking error than if it used a replication indexing strategy. “Replication” is an indexing strategy in which a fund invests in substantially all of the securities in its underlying index in approximately the same proportions as in the underlying index.
1
An investment in the Fund is not a bank deposit and it is not insured or guaranteed by the Federal Deposit Insurance Corporation or any other government agency, BFA or any of its affiliates.
The Fund's investment objective and the Underlying Index may be changed without shareholder approval.
A Further Discussion of Principal Risks
The Fund is subject to various risks, including the principal risks noted below, any of which may adversely affect the Fund’s NAV, trading price, yield, total return and ability to meet its investment objective. You could lose all or part of your investment in the Fund, and the Fund could underperform other investments. The order of the below risk factors does not indicate the significance of any particular risk factor. The Fund discloses its portfolio holdings daily at www.iShares.com.
Asian Economic Risk. Many Asian economies have experienced rapid growth and industrialization in recent years, but there is no assurance that this growth rate will be maintained. Other Asian economies, however, have experienced high inflation, high unemployment, currency devaluations and restrictions, and over-extension of credit. Geopolitical hostility, political instability, and economic or environmental events in any one Asian country may have a significant economic effect on the entire Asian region, as well as on major trading partners outside Asia. Any adverse event in the Asian markets may have a significant adverse effect on some or all of the economies of the countries in which the Fund invests. In particular, China is a key trading partner of many Asian countries and any changes in trading relationships between China and other Asian countries may affect the region as a whole. Many Asian countries are subject to political risk, including political instability, corruption and regional conflict with neighboring countries. North Korea and South Korea each have substantial military capabilities, and historical tensions between the two countries present the risk of war. Escalated tensions involving the two countries and any outbreak of hostilities between the two countries, or even the threat of an outbreak of hostilities, could have a severe adverse effect on the entire Asian region. Certain Asian countries have developed increasingly strained relationships with the U.S. or with China, and if these relations were to worsen, they could adversely affect Asian issuers that rely on the U.S. or China for trade. In addition, many Asian countries are subject to social and labor risks associated with demands for improved political, economic and social conditions. These risks, among others, may adversely affect the value of the Fund's investments.
Asset Class Risk. The securities and other assets in the Underlying Index or in the Fund’s portfolio may underperform in comparison to other securities or indexes that track other countries, groups of countries, regions, industries, groups of industries, markets, market segments, asset classes or sectors. Various types of securities, currencies and indexes may experience cycles of outperformance and underperformance in comparison to the general financial markets depending upon a number of factors including, among other things, inflation, interest rates, productivity, global demand for local products or resources, and regulation and governmental controls. This may cause the Fund to underperform other investment vehicles that invest in different asset classes.
2
Australasian Economic Risk. The economies of Australasia, which include Australia and New Zealand, are dependent on exports from the energy, agricultural and mining sectors. This makes Australasian economies susceptible to fluctuations in the commodity markets. Australasian economies are also increasingly dependent on their growing service industries. Because the economies of Australasia are dependent on the economies of their key trading partners, which include the U.S., China, Japan, South Korea, as well as other Asian countries and certain European countries, reduction in spending by any of these trading partners on Australasian products and services, or negative changes in any of these economies, may cause an adverse impact on some or all of the Australasian economies. Economic events in key trading countries can have a significant economic effect on the Australasian economies.
Authorized Participant Concentration Risk. Only an Authorized Participant may engage in creation or redemption transactions directly with the Fund, and none of those Authorized Participants is obligated to engage in creation and/or redemption transactions. The Fund has a limited number of institutions that may act as Authorized Participants on an agency basis (i.e., on behalf of other market participants). To the extent that Authorized Participants exit the business or are unable to proceed with creation or redemption orders with respect to the Fund and no other Authorized Participant is able to step forward to create or redeem Creation Units, Fund shares may be more likely to trade at a premium or discount to NAV and possibly face trading halts or delisting. Authorized Participant concentration risk may be heightened because ETFs, such as the Fund, that invest in securities issued by non-U.S. issuers or other securities or instruments that are less widely traded often involve greater settlement and operational issues and capital costs for Authorized Participants, which may limit the availability of Authorized Participants.
Concentration Risk. The Fund may be susceptible to an increased risk of loss, including losses due to adverse events that affect the Fund’s investments more than the market as a whole, to the extent that the Fund's investments are concentrated in the securities and/or other assets of a particular issuer or issuers, country, group of countries, region, market, industry, group of industries, project types, group of project types, sector, market segment or asset class. The Fund may be more adversely affected by the underperformance of those securities and/or other assets, may experience increased price volatility and may be more susceptible to adverse economic, market, political or regulatory occurrences affecting those securities and/or other assets than a fund that does not concentrate its investments.
Currency Risk. Because the Fund's NAV is determined on the basis of the U.S. dollar, investors may lose money if the currency of a non-U.S. market in which the Fund invests depreciates against the U.S. dollar or if there are delays or limits on repatriation of such currency, even if such currency value of the Fund's holdings in that market increases. Currency exchange rates can be very volatile and can change quickly and unpredictably. As a result, the Fund’s NAV may change quickly and without warning.
Cybersecurity Risk. The Fund, Authorized Participants, service providers and the relevant listing exchange are susceptible to operational, information security and related “cyber” risks both directly and through their service providers. Similar types of
3
cybersecurity risks are also present for issuers of securities in which the Fund invests, which could result in material adverse consequences for such issuers and may cause the Fund’s investment in such issuers to lose value. In general, cyber incidents can result from deliberate attacks or unintentional events. Cyber incidents include, but are not limited to, gaining unauthorized access to digital systems (e.g., through “hacking” or malicious software coding) for purposes of misappropriating assets or sensitive information, corrupting data, or causing operational disruption. Cyberattacks may also be carried out in a manner that does not require gaining unauthorized access, such as causing denial-of-service attacks on websites (i.e., efforts to make network services unavailable to intended users). Geopolitical tensions may increase the scale and sophistication of deliberate attacks, particularly those from nation-states or from entities with nation-state backing.
Cybersecurity failures by, or breaches of, the systems of the Fund's adviser, distributor and other service providers (including, but not limited to, index and benchmark providers, fund accountants, custodians, transfer agents and administrators), market makers, Authorized Participants or the issuers of securities in which the Fund invests have the ability to cause disruptions and impact business operations, potentially resulting in: financial losses, interference with the Fund’s ability to calculate its NAV, disclosure of confidential trading information, impediments to trading, submission of erroneous trades or erroneous creation or redemption orders, the inability of the Fund or its service providers to transact business, violations of applicable privacy and other laws, regulatory fines, penalties, reputational damage, reimbursement or other compensation costs, or additional compliance costs. In addition, cyberattacks may render records of Fund assets and transactions, shareholder ownership of Fund shares, and other data integral to the functioning of the Fund inaccessible, inaccurate or incomplete. Substantial costs may be incurred by the Fund in order to resolve or prevent cyber incidents. While the Fund has established business continuity plans in the event of, and risk management systems to prevent, such cyber incidents, there are inherent limitations in such plans and systems, including the possibility that certain risks have not been identified, that prevention and remediation efforts will not be successful or that cyberattacks will go undetected. Furthermore, the Fund cannot control the cybersecurity plans and systems put in place by service providers to the Fund, issuers in which the Fund invests, the Index Provider, market makers or Authorized Participants. The Fund and its shareholders could be negatively impacted as a result.
Dividend-Paying Stock Risk. Investing in dividend-paying stocks involves the risk that such stocks may fall out of favor with investors and underperform the broader market. Companies that issue dividend-paying stocks are not required to pay or continue paying dividends on such stocks. It is possible that issuers of the stocks held by the Fund will not declare dividends in the future or will reduce or eliminate the payment of dividends (including reducing or eliminating anticipated accelerations or increases in the payment of dividends) in the future.
Equity Securities Risk. The Fund invests in equity securities, which are subject to changes in value that may be attributable to market perception of a particular issuer or to general stock market fluctuations that affect all issuers. Investments in equity
4
securities may be more volatile than investments in other asset classes. The Underlying Index is composed of common stocks, which generally subject their holders to more risks than preferred stocks and debt securities because common stockholders' claims are subordinated to those of holders of preferred stocks and debt securities upon the bankruptcy of the issuer.
Financials Sector Risk. Companies in the financials sector are subject to extensive governmental regulation and intervention, which may adversely affect the scope of their activities, the prices they can charge, the amount of capital and liquid assets they must maintain and, potentially, their size. Governmental regulation may change frequently and may have significant adverse consequences for companies in the financials sector, including effects not intended by such regulation. Increased risk taking by financial companies may also result in greater overall risk in the U.S. and global financials sector. The impact of changes in capital requirements, or recent or future regulation in various countries, on any individual financial company or on the financials sector as a whole cannot be predicted.
Certain risks may impact the value of investments in the financials sector more severely than those of investments outside this sector, including the risks associated with companies that operate with substantial financial leverage. Companies in the financials sector are exposed directly to the credit risk of their borrowers and counterparties, who may be leveraged to an unknown degree, including through swaps and other derivatives products. Financial services companies may have significant exposure to the same borrowers and counterparties, with the result that a borrower’s or counterparty’s inability to meet its obligations to one company may affect other companies with exposure to the same borrower or counterparty. This interconnectedness of risk may result in significant negative impacts to companies with direct exposure to the defaulting counterparty as well as adverse cascading effects in the markets and the financials sector generally. Companies in the financials sector may also be adversely affected by increases in interest rates and loan losses, decreases in the availability of money or asset valuations, credit rating downgrades, adverse public perception and adverse conditions in other related markets. Insurance companies, in particular, may be subject to severe price competition and/or rate regulation, which may have an adverse impact on their profitability. The financials sector is particularly sensitive to fluctuations in interest rates. The financials sector is also a target for cyberattacks. Cybersecurity incidents and technology malfunctions and failures have become increasingly frequent and have caused significant losses to companies in this sector, which may negatively impact the Fund. The extent to which the Fund may invest in a company that engages in securities-related activities or banking is limited by applicable law.
Geographic Risk. Some of the companies in which the Fund invests are located in parts of the world that have historically been prone to natural disasters, such as earthquakes, tornadoes, volcanic eruptions, droughts, floods, hurricanes or tsunamis, and are economically sensitive to environmental events. Any such event may adversely impact the economies of these geographic areas or business operations of companies in these geographic areas, causing an adverse impact on the value of the Fund.
5
Index-Related Risk. The Fund seeks to achieve a return that corresponds generally to the price and yield performance, before fees and expenses, of the Underlying Index as published by the Index Provider. There is no assurance that the Index Provider or any agents that may act on its behalf will compile the Underlying Index accurately, or that the Underlying Index will be determined, composed or calculated accurately. While the Index Provider provides descriptions of what the Underlying Index is designed to achieve, neither the Index Provider nor its agents provide any warranty or accept any liability in relation to the quality, accuracy or completeness of the Underlying Index or its related data, and they do not guarantee that the Underlying Index will be in line with the Index Provider’s methodology. BFA’s mandate as described in this Prospectus is to manage the Fund consistently with the Underlying Index provided by the Index Provider to BFA. BFA does not provide any warranty or guarantee against the Index Provider’s or any agent’s errors. Errors in respect of the quality, accuracy and completeness of the data used to compile the Underlying Index may occur from time to time and may not be identified and corrected by the Index Provider for a period of time or at all, particularly where the indices are less commonly used as benchmarks by funds or managers. Such errors may negatively or positively impact the Fund and its shareholders. For example, during a period where the Underlying Index contains incorrect constituents, the Fund would have market exposure to such constituents and would be underexposed to the Underlying Index’s other constituents. Shareholders should understand that any gains from Index Provider errors will be kept by the Fund and its shareholders and any losses or costs resulting from Index Provider errors will be borne by the Fund and its shareholders.
Unusual market conditions or other unforeseen circumstances (such as natural disasters, political unrest or war) may impact the Index Provider or a third-party data provider, and could cause the Index Provider to postpone a scheduled rebalance to the Underlying Index. This could cause the Underlying Index to vary from its normal or expected composition. The postponement of a scheduled rebalance could mean that constituents of the Underlying Index that would otherwise be removed at rebalance due to changes in market capitalizations, issuer credit ratings, or other reasons may remain, causing the performance and constituents of the Underlying Index to vary from those expected under normal conditions. Apart from scheduled rebalances, the Index Provider or its agents may carry out additional ad hoc rebalances to the Underlying Index due to reaching certain weighting constraints, unusual market conditions or corporate events or, for example, to correct an error in the selection of index constituents. When the Underlying Index is rebalanced and the Fund in turn rebalances its portfolio to attempt to increase the correlation between the Fund’s portfolio and the Underlying Index, any transaction costs and market exposure arising from such portfolio rebalancing will be borne directly by the Fund and its shareholders. Therefore, errors and additional ad hoc rebalances carried out by the Index Provider or its agents to the Underlying Index may increase the costs to and the tracking error risk of the Fund.
Indexing Investment Risk. The Fund is not actively managed and may be affected by a general decline in market segments related to the Underlying Index. The Fund invests in securities included in, or representative of, the Underlying Index, regardless of their
6
investment merits. BFA generally does not attempt to invest the Fund's assets in defensive positions under any market conditions, including declining markets.
Industrials Sector Risk. The value of securities issued by companies in the industrials sector may be adversely affected by supply and demand changes related to their specific products or services and industrials sector products in general. The products of manufacturing companies may face obsolescence due to rapid technological developments and frequent new product introduction. Global events, trade disputes and changes in government regulations, economic conditions and exchange rates may adversely affect the performance of companies in the industrials sector. Companies in the industrials sector may be adversely affected by liability for environmental damage and product liability claims. The industrials sector may also be adversely affected by changes or trends in commodity prices, which may be influenced by unpredictable factors. Companies in the industrials sector, particularly aerospace and defense companies, may also be adversely affected by government spending policies because companies in this sector tend to rely to a significant extent on government demand for their products and services.
Infectious Illness Risk. A widespread outbreak of an infectious illness, such as the COVID-19 pandemic, may adversely affect the economies of many nations and the global economy and may impact individual issuers and capital markets in ways that cannot be foreseen.
An infectious illness outbreak may result in travel restrictions, closed international borders, disruption of healthcare services, prolonged quarantines, cancellations, supply chain disruptions, lower consumer demand, temporary and permanent closures of businesses, layoffs, defaults and other significant economic, social and political impacts, as well as general concern and uncertainty.
An infectious illness outbreak may result in extreme volatility, severe losses, credit deterioration of issuers, and disruptions in markets, which could adversely impact the Fund and its investments, including impairing any hedging activity.
Certain local markets may be subject to closures. Any suspension of trading in markets in which the Fund invests will have an impact on the Fund and its investments and will impact the Fund’s ability to purchase or sell securities in such markets. Market or economic disruptions could result in elevated tracking error and increased premiums or discounts to the Fund's NAV. Additionally, an outbreak could impair the operations of the Fund’s service providers, including BFA, which could adversely impact the Fund.
Governmental and quasi-governmental authorities and regulators throughout the world may respond to an outbreak and any resulting economic disruptions with a variety of fiscal and monetary policy changes, including direct capital infusions into companies and other issuers, new monetary policy tools, and changes in interest rates. A reversal of these policies, or the ineffectiveness of such policies, is likely to increase market volatility, which could adversely affect the Fund’s investments.
An outbreak may exacerbate other pre-existing political, social and economic risks in certain countries or globally, which could adversely affect the Fund and its investments and could result in increased premiums or discounts to the Fund's NAV.
7
Despite the development of vaccines, the duration of the COVID-19 pandemic and its effects cannot be predicted with certainty.
Issuer Risk. The performance of the Fund depends on the performance of individual securities to which the Fund has exposure. Any issuer of these securities may perform poorly, causing the value of its securities to decline. Poor performance may be caused by poor management decisions, competitive pressures, changes in technology, expiration of patent protection, disruptions in supply, labor problems or shortages, corporate restructurings, fraudulent disclosures, credit deterioration of the issuer or other factors. Issuers may, in times of distress or at their own discretion, decide to reduce or eliminate dividends, which may also cause their stock prices to decline. There is no guarantee that an issuer that paid dividends in the past will continue to do so in the future or will continue paying dividends at the same level. An issuer may also be subject to risks associated with the countries, states and regions in which the issuer resides, invests, sells products, or otherwise conducts operations.
Large-Capitalization Companies Risk. Large-capitalization companies may be less able than smaller capitalization companies to adapt to changing market conditions. Large-capitalization companies may be more mature and subject to more limited growth potential compared with smaller capitalization companies. During different market cycles, the performance of large-capitalization companies has trailed the overall performance of the broader securities markets.
Management Risk. Because BFA uses a representative sampling indexing strategy, the Fund will not fully replicate the Underlying Index and may hold securities not included in the Underlying Index. As a result, the Fund is subject to the risk that BFA’s investment strategy, the implementation of which is subject to a number of constraints, may not produce the intended results.
Market Risk. The Fund could lose money over short periods due to short-term market movements and over longer periods during more prolonged market downturns. The value of a financial instrument or other asset may decline due to changes in general market conditions, economic trends or events that are not specifically related to the particular instrument or asset, or factors that affect one or more issuers, counterparties, exchanges, countries, regions, markets, industries, sectors or asset classes, as applicable. Local, regional or global events such as war, acts of terrorism, public health issues, recessions, the prospect or occurrence of a sovereign default or other financial crisis, or other events could have a significant impact on the Fund and its investments and could result in increased premiums or discounts to the Fund’s NAV. Changes in market and economic conditions generally do not have the same impact on all types of instruments and assets.
Market Trading Risk.
Absence of Active Market. Although shares of the Fund are listed for trading on one or more stock exchanges, there can be no assurance that an active trading market for such shares will develop or be maintained by market makers or Authorized Participants.
Risk of Secondary Listings. The Fund's shares may be listed or traded on U.S. and non-U.S. stock exchanges other than the U.S. stock exchange where the Fund's primary
8
listing is maintained, and may otherwise be made available to non-U.S. investors through funds or structured investment vehicles similar to depositary receipts. There can be no assurance that the Fund’s shares will continue to trade on any such stock exchange or in any market or that the Fund’s shares will continue to meet the requirements for listing or trading on any exchange or in any market. The Fund's shares may be less actively traded in certain markets than in others, and investors are subject to the execution and settlement risks and market standards of the market where they or their broker direct their trades for execution. Certain information available to investors who trade Fund shares on a U.S. stock exchange during regular U.S. market hours may not be available to investors who trade in other markets, which may result in secondary market prices in such markets being less efficient.
Secondary Market Trading Risk. Shares of the Fund may trade in the secondary market at times when the Fund does not accept orders to purchase or redeem shares. At such times, shares may trade in the secondary market with more significant premiums or discounts than might be experienced at times when the Fund accepts purchase and redemption orders.
Secondary market trading in Fund shares may be halted by a stock exchange because of market conditions or for other reasons. In addition, trading in Fund shares on a stock exchange or in any market may be subject to trading halts caused by extraordinary market volatility pursuant to “circuit breaker” rules on the stock exchange or market.
Shares of the Fund, similar to shares of other issuers listed on a stock exchange, may be sold short and are therefore subject to the risk of increased volatility and price decreases associated with being sold short. In addition, trading activity in derivative products based on the Fund may lead to increased trading volume and volatility in the secondary market for the shares of the Fund.
Shares of the Fund May Trade at Prices Other Than NAV. Shares of the Fund trade on stock exchanges at prices at, above or below the Fund’s most recent NAV. The NAV of the Fund is calculated at the end of each business day and fluctuates with changes in the market value of the Fund’s holdings. The trading price of the Fund's shares fluctuates continuously throughout trading hours based on both market supply of and demand for Fund shares and the underlying value of the Fund's portfolio holdings or NAV. As a result, the trading prices of the Fund’s shares may deviate significantly from NAV during periods of market volatility. ANY OF THESE FACTORS, AMONG OTHERS, MAY LEAD TO THE FUND'S SHARES TRADING AT A PREMIUM OR DISCOUNT TO NAV. However, because shares can be created and redeemed in Creation Units at NAV, BFA believes that large discounts or premiums to the NAV of the Fund are not likely to be sustained over the long term (unlike shares of many closed-end funds, which frequently trade at appreciable discounts from, and sometimes at premiums to, their NAVs). While the creation/redemption feature is designed to make it more likely that the Fund’s shares normally will trade on stock exchanges at prices close to the Fund’s next calculated NAV, exchange prices are not expected to correlate exactly with the Fund's NAV due to timing reasons, supply and demand imbalances and other factors. In addition, disruptions to creations and redemptions, including disruptions at market makers, Authorized Participants, or other market participants, and during
9
periods of significant market volatility, may result in trading prices for shares of the Fund that differ significantly from its NAV. Authorized Participants may be less willing to create or redeem Fund shares if there is a lack of an active market for such shares or its underlying investments, which may contribute to the Fund’s shares trading at a premium or discount to NAV.
Costs of Buying or Selling Fund Shares. Buying or selling Fund shares on an exchange involves two types of costs that apply to all securities transactions. When buying or selling shares of the Fund through a broker, you will likely incur a brokerage commission and other charges. In addition, you may incur the cost of the “spread”; that is, the difference between what investors are willing to pay for Fund shares (the “bid” price) and the price at which they are willing to sell Fund shares (the “ask” price). The spread, which varies over time for shares of the Fund based on trading volume and market liquidity, is generally narrower if the Fund has more trading volume and market liquidity and wider if the Fund has less trading volume and market liquidity. In addition, increased market volatility may cause wider spreads. There may also be regulatory and other charges that are incurred as a result of trading activity. Because of the costs inherent in buying or selling Fund shares, frequent trading may detract significantly from investment results and an investment in Fund shares may not be advisable for investors who anticipate regularly making small investments through a brokerage account.
Materials Sector Risk. Companies in the materials sector may be adversely affected by commodity price volatility, exchange rate fluctuations, social and political unrest, war, import or export controls, increased competition, depletion of resources, technical advances, labor relations, over-production, decreases in the demand for materials, litigation and government regulations, among other factors. Companies in the materials sector are also at risk of liability for environmental damage and product liability claims and may incur significant environmental remediation costs in complying with environmental laws. Production of materials may exceed demand as a result of market imbalances or economic downturns, leading to poor investment returns.
National Closed Market Trading Risk. To the extent that the underlying securities or other instruments held by the Fund trade on foreign exchanges or in foreign markets that may be closed when the securities exchange on which the Fund’s shares trade is open, there are likely to be deviations between the current price of an underlying security and the last quoted price for the underlying security (i.e., the Fund’s quote from the closed foreign market). The impact of a closed foreign market on the Fund is likely to be greater where a large portion of the Fund’s underlying securities or other instruments trade on that closed foreign market or when the foreign market is closed for unscheduled reasons. These deviations could result in premiums or discounts to the Fund’s NAV that may be greater than those experienced by other ETFs.
Non-U.S. Securities Risk. Investments in the securities of non-U.S. issuers are subject to the risks of investing in the markets where such issuers are located, including heightened risks of inflation, nationalization and market fluctuations caused by economic and political developments. As a result of investing in non-U.S. securities, the Fund may be subject to increased risk of loss caused by any of the factors listed below:
10
■
Government intervention in issuers' operations or structure;
■
A lack of market liquidity and market efficiency;
■
Greater securities price volatility;
■
Exchange rate fluctuations and exchange controls;
■
Less availability of public information about issuers;
■
Limitations on foreign ownership of securities;
■
Imposition of withholding or other taxes;
■
Imposition of restrictions on the expatriation of the funds or other assets of the Fund;
■
Higher transaction and custody costs and delays in settlement procedures;
■
Difficulties in enforcing contractual obligations;
■
Lower levels of regulation of the securities markets;
■
Weaker accounting, disclosure and reporting requirements and the risk of being delisted from U.S. exchanges; and
■
Legal principles relating to corporate governance, directors’ fiduciary duties and liabilities and stockholders’ rights in markets in which the Fund invests may differ from or may not be as extensive or protective as those that apply in the U.S.
Withholding Tax Reclaims Risk. The Fund may file claims to recover withholding tax on dividend and interest income (if any) received from issuers in certain countries where such withholding tax reclaim is possible. Whether or when the Fund will receive a withholding tax refund in the future is within the control of the tax authorities in such countries. Where the Fund expects to recover withholding tax based on a continuous assessment of probability of recovery, the NAV of the Fund generally includes accruals for such tax refunds. The Fund continues to evaluate tax developments for potential impact to the probability of recovery. If the likelihood of receiving refunds materially decreases, for example due to a change in tax regulation or approach, accruals in the Fund’s NAV for such refunds may need to be written down partially or in full, which will adversely affect that Fund’s NAV. Investors in the Fund at the time an accrual is written down will bear the impact of any resulting reduction in NAV regardless of whether they were investors during the accrual period. Conversely, if a Fund receives a tax refund that has not been previously accrued, investors in the Fund at the time the claim is successful will benefit from any resulting increase in the Fund’s NAV. Investors who sold their shares prior to such time will not benefit from such NAV increase.
Operational Risk. The Fund is exposed to operational risks arising from a number of factors, including, but not limited to, human error, processing and communication errors, errors of the Fund's service providers, counterparties or other third parties, failed or inadequate processes and technology or systems failures. The Fund and BFA seek to reduce these operational risks through controls and procedures. However, these measures do not address every possible risk and may be inadequate to address significant operational risks.
Reliance on Trading Partners Risk. The economies of some countries or regions in which the Fund invests are dependent on trading with certain key trading partners.
11
Reduction in spending on the products and services of these countries or regions, institution of tariffs or other trade barriers by any of their key trading partners or a slowdown in the economies of any of their key trading partners may cause an adverse impact on the economies of such countries or regions.
Risk of Investing in Asia. Many Asian economies have experienced rapid growth and industrialization in recent years, but there is no assurance that this growth rate will be maintained. Other Asian economies, however, have experienced high inflation, high unemployment, currency devaluations and restrictions, and over-extension of credit. During the global recession that began in 2007, many of the export-driven Asian economies experienced the effects of the economic slowdown in the U.S. and Europe, and certain Asian governments implemented stimulus plans, low-rate monetary policies and currency devaluations. Economic events in any one Asian country may have a significant economic effect on the entire Asian region, as well as on major trading partners outside Asia. Any adverse event in the Asian markets may have a significant adverse effect on some or all of the economies of the countries in which the Fund invests. Many Asian countries are subject to political risk, including corruption and regional conflict with neighboring countries. North Korea and South Korea each have substantial military capabilities, and historical tensions between the two countries present the risk of war. Escalated tensions involving the two countries and any outbreak of hostilities between the two countries, or even the threat of an outbreak of hostilities, could have a severe adverse effect on the entire Asian region. Certain Asian countries have also developed increasingly strained relationships with the U.S., and if these relations were to worsen, they could adversely affect Asian issuers that rely on the U.S. for trade. In addition, many Asian countries are subject to social and labor risks associated with demands for improved political, economic and social conditions. These risks, among others, may adversely affect the value of the Fund’s investments.
Risk of Investing in Australia. Investment in Australian issuers may subject the Fund to regulatory, political, currency, security, and economic risk specific to Australia. The Australian economy is heavily dependent on exports from the energy, agricultural and mining sectors. As a result, the Australian economy is susceptible to fluctuations in the commodity markets. The Australian economy is also becoming increasingly dependent on its growing services industry. The Australian economy is dependent on trading with key trading partners, including the U.S., China, Japan, South Korea, other Asian and certain European countries. Economic events in the U.S., Asia, or in other key trading countries can have a significant economic effect on the Australian economy. Reduction in spending on Australian products and services or changes in any of the economies may cause an adverse impact on the Australian economy.
Risk of Investing in Developed Countries. Investment in developed country issuers may subject the Fund to legal, regulatory, political, currency, security, economic and other risks associated with developed countries. Developed countries generally tend to rely on services sectors (e.g., the financial services sector) as the primary means of economic growth. A prolonged slowdown in one or more services sectors is likely to have a negative impact on economies of certain developed countries, although economies of individual developed countries can be impacted by slowdowns in other
12
sectors. In the past, certain developed countries have been targets of terrorism, and some geographic areas in which the Fund invests have experienced strained international relations due to territorial disputes, historical animosities, defense concerns and other security concerns. These situations may cause uncertainty in the financial markets in these countries or geographic areas and may adversely affect the performance of the issuers to which the Fund has exposure. Heavy regulation of certain markets, including labor and product markets, may have an adverse effect on certain issuers. Such regulations may negatively affect economic growth or cause prolonged periods of recession. Many developed countries are heavily indebted and face rising healthcare and retirement expenses. In addition, price fluctuations of certain commodities and regulations impacting the import of commodities may negatively affect developed country economies.
Risk of Investing in Japan. Japan may be subject to political, economic, nuclear, and labor risks, among others. Any of these risks, individually or in the aggregate, can impact an investment made in Japan.
Currency Risk. The Japanese yen has fluctuated widely at times, and any increase in its value may cause a decline in exports that could weaken the Japanese economy. The Japanese government has, in the past, intervened in the currency markets to attempt to maintain or reduce the value of the yen. Japanese intervention in the currency markets could cause the value of the yen to fluctuate sharply and unpredictably and could cause losses to investors.
Economic Risk. The growth of Japan's economy has recently lagged that of its Asian neighbors and other major developed economies. Since 2000, Japan’s economic growth rate has generally remained low relative to other advanced economies, and it may remain low in the future. The Japanese economy is heavily dependent on international trade and has been adversely affected in the past by trade tariffs, other protectionist measures, competition from emerging economies and the economic conditions of its trading partners. Japan is also heavily dependent on oil and other commodity imports, and higher commodity prices could therefore have a negative impact on the Japanese economy.
Geographic Risk. Natural disasters, such as earthquakes, volcanic eruptions, typhoons and tsunamis, could occur in Japan or surrounding areas and could negatively affect the Japanese economy, and, in turn, could negatively affect the value of the Fund.
Labor Risk. Japan has an aging workforce and has experienced a significant population decline in recent years. Japan’s labor market appears to be undergoing fundamental structural changes, as a labor market traditionally accustomed to lifetime employment adjusts to meet the need for increased labor mobility, which may adversely affect Japan’s economic competitiveness.
Large Government and Corporate Debt Risk. The Japanese economy faces several concerns, including a financial system with large levels of nonperforming loans, over-leveraged corporate balance sheets, extensive cross-ownership by major corporations, a changing corporate governance structure, and large government deficits. These issues may cause a slowdown of the Japanese economy.
13
Political Risk. Historically, Japan has had unpredictable national politics and may experience frequent political turnover. Future political developments may lead to changes in policy that might adversely affect the Fund’s investments. In addition, China has become an important trading partner with Japan. Japan's political relationship with China, however, is strained and delicate. Should political tension increase, it could adversely affect the Japanese economy and destabilize the region as a whole.
Security Risk. Japan's relations with its neighbors, particularly China, North Korea, South Korea and Russia, have at times been strained due to territorial disputes, historical animosities and defense concerns. Most recently, the Japanese government has shown concern over the increased nuclear and military activity by North Korea and China. Strained relations may cause uncertainty in the Japanese markets and adversely affect the overall Japanese economy, particularly in times of crisis.
Securities Lending Risk. The Fund may engage in securities lending. Securities lending involves the risk that the Fund may lose money because the borrower of the loaned securities fails to return the securities in a timely manner or at all. The Fund could also lose money in the event of a decline in the value of collateral provided for loaned securities or a decline in the value of any investments made with cash collateral. These events could also trigger adverse tax consequences for the Fund. BlackRock Institutional Trust Company, N.A. (“BTC”), the Fund's securities lending agent, will take into account the tax impact to shareholders of substitute payments for dividends when managing the Fund's securities lending program.
Small Fund Risk. When the Fund’s size is small, the Fund may experience low trading volume and wide bid/ask spreads. In addition, the Fund may face the risk of being delisted if the Fund does not meet certain conditions of the listing exchange. If the Fund were to be required to delist from the listing exchange, the value of the Fund may rapidly decline and performance may be negatively impacted. Any resulting liquidation of the Fund could cause the Fund to incur elevated transaction costs for the Fund and negative tax consequences for its shareholders.
Tracking Error Risk. The Fund may be subject to “tracking error,” which is the divergence of the Fund’s performance from that of the Underlying Index. Tracking error may occur because of differences between the securities and other instruments held in the Fund’s portfolio and those included in the Underlying Index, pricing differences (including, as applicable, differences between a security’s price at the local market close and the Fund's valuation of a security at the time of calculation of the Fund's NAV), transaction costs incurred by the Fund, the Fund’s holding of uninvested cash, differences in timing of the accrual or the valuation of dividends or interest received by the Fund or distributions paid to the Fund’s shareholders, the requirements to maintain pass-through tax treatment, portfolio transactions carried out to minimize the distribution of capital gains to shareholders, acceptance of custom baskets, changes to the Underlying Index or the costs to the Fund of complying with various new or existing regulatory requirements, among other reasons. This risk may be heightened during times of increased market volatility or other unusual market conditions. Tracking error also may result because the Fund incurs fees and expenses, while the Underlying Index does not. Tracking error may occur due to differences between the methodologies used in calculating the value of the Underlying Index and
14
determining the Fund’s NAV. INDEX ETFs THAT TRACK INDICES WITH SIGNIFICANT WEIGHT IN EMERGING MARKETS ISSUERS MAY EXPERIENCE HIGHER TRACKING ERROR THAN OTHER INDEX ETFs THAT DO NOT TRACK SUCH INDICES.
U.S. Economic Risk. The U.S. is a significant, and in some cases the most significant, trading partner of, or foreign investor in, certain countries in which the Fund invests. As a result, economic conditions of such countries may be particularly affected by changes in the U.S. economy. A decrease in U.S. imports or exports, new trade and financial regulations or tariffs, changes in the U.S. dollar exchange rate or an economic slowdown in the U.S. may have a material adverse effect on the economic conditions of such countries and, as a result, securities to which the Fund has exposure. Circumstances could arise that could prevent the timely payment of interest or principal on U.S. government debt, such as reaching the legislative “debt ceiling.” Such non-payment would result in substantial negative consequences for the U.S. economy and the global financial system.
Valuation Risk. The price the Fund could receive upon the sale of a security or other asset may differ from the Fund's valuation of the security or other asset and from the value used by the Underlying Index, particularly for securities or other assets that trade in low volume or volatile markets or that are valued using a fair value methodology as a result of trade suspensions or for other reasons. Because non-U.S. exchanges may be open on days or during time periods when the Fund does not price its shares, the value of the securities or other assets in the Fund's portfolio may change on days or during time periods when shareholders will not be able to purchase or sell the Fund’s shares. In addition, for purposes of calculating the Fund's NAV, the value of assets denominated in non-U.S. currencies is translated into U.S. dollars at the prevailing market rates. This translation may result in a difference between the prices used to calculate the Fund's NAV and the prices used by the Underlying Index, which, in turn, could result in a difference between the Fund's performance and the performance of the Underlying Index. Authorized Participants who purchase or redeem Fund shares on days when the Fund is holding fair-valued securities may receive fewer or more shares, or lower or higher redemption proceeds, than they would have received had the securities not been fair valued or been valued using a different methodology. The ability to value investments may be impacted by technological issues or errors by pricing services or other third-party service providers.
A Further Discussion of Other Risks
The Fund may also be subject to certain other risks associated with its investments and investment strategies. The order of the below risk factors does not indicate the significance of any particular risk factor.
Close-Out Risk for Qualified Financial Contracts. Regulations adopted by global prudential regulators require counterparties that are part of U.S. or foreign global systemically important banking organizations to include contractual restrictions on close-out and cross-default in agreements relating to qualified financial contracts. Qualified financial contracts include agreements relating to swaps, currency forwards and other derivatives as well as repurchase agreements and securities lending
15
agreements. The restrictions prevent the Fund from closing out a qualified financial contract during a specified time period if the counterparty is subject to resolution proceedings and also prohibit the Fund from exercising default rights due to a receivership or similar proceeding of an affiliate of the counterparty. These requirements may increase credit risk and other risks to the Fund.
Consumer Discretionary Sector Risk. The success of consumer product manufacturers and retailers is tied closely to the performance of domestic and international economies, interest rates, exchange rates, supply chains, competition, consumer confidence, changes in demographics and consumer preferences. Companies in the consumer discretionary sector depend heavily on disposable household income and consumer spending, and may be strongly affected by social trends and marketing campaigns. These companies may be subject to severe competition, which may have an adverse impact on their profitability.
Illiquid Investments Risk. The Fund may not acquire any illiquid investment if, immediately after the acquisition, the Fund would have invested more than 15% of its net assets in illiquid investments. An illiquid investment is any investment that the Fund reasonably expects cannot be sold or disposed of in current market conditions in seven calendar days or less without significantly changing the market value of the investment. Liquid investments may become illiquid after purchase by the Fund, particularly during periods of market turmoil. There can be no assurance that a security or instrument that is deemed to be liquid when purchased will continue to be liquid for as long as it is held by the Fund, and any security or instrument held by the Fund may be deemed an illiquid investment pursuant to the Fund’s liquidity risk management program. To the extent the Fund holds illiquid investments, the illiquid investments may reduce the returns of the Fund because the Fund may be unable to transact at advantageous times or prices. An investment may be illiquid due to, among other things, the reduced number and capacity of traditional market participants to make a market in securities or instruments, the lack of an active market for such securities or instruments, capital controls, delays or limits on repatriation of local currency, or insolvency of local governments. To the extent that the Fund invests in securities or instruments with substantial market and/or credit risk, the Fund will tend to have increased exposure to the risks associated with illiquid investments. Illiquid investments may be harder to value, especially in changing markets. Although the Fund primarily seeks to redeem shares of the Fund on an in-kind basis, if the Fund is forced to sell underlying investments at reduced prices or under unfavorable conditions to meet redemption requests or for other cash needs, the Fund may suffer a loss. This may be magnified in a rising interest rate environment or other circumstances where redemptions from the Fund may be greater than normal. Other market participants may be attempting to liquidate holdings at the same time as the Fund, causing increased supply of the Fund’s underlying investments in the market and contributing to illiquid investments risk and downward pricing pressure. In addition, if the Fund is limited in its ability to sell illiquid investments during periods when shareholders are redeeming their shares, the Fund will need to sell liquid securities to meet redemption requests and illiquid securities will become a larger portion of the Fund’s holdings. During periods of market volatility, liquidity in the market for the Fund’s shares may be impacted by the liquidity in the market for the underlying securities or instruments
16
held by the Fund, which could lead to the Fund’s shares trading at a premium or discount to the Fund's NAV.
Large Shareholder and Large-Scale Redemption Risk. Certain shareholders, including an Authorized Participant, a third-party investor, the Fund’s adviser or an affiliate of the Fund’s adviser, a market maker, or another entity, may from time to time own or manage a substantial amount of Fund shares or may invest in the Fund and hold their investment for a limited period of time. These shareholders may also pledge or loan Fund shares (to secure financing or otherwise), which may result in the shares becoming concentrated in another party. There can be no assurance that any large shareholder or large group of shareholders would not redeem their investment or that the size of the Fund would be maintained. Redemptions of a large number of Fund shares by these shareholders may adversely affect the Fund’s liquidity and net assets. To the extent the Fund permits redemptions in cash, these redemptions may force the Fund to sell portfolio securities when it might not otherwise do so, which may negatively impact the Fund’s NAV, have a material effect on the market price of the Shares and increase the Fund’s brokerage costs and/or accelerate the realization of taxable income and/or gains and cause the Fund to make taxable distributions to its shareholders earlier than the Fund otherwise would have. In addition, under certain circumstances, non-redeeming shareholders may be treated as receiving a disproportionately large taxable distribution during or with respect to such tax year. The Fund also may be required to sell its more liquid Fund investments to meet a large redemption, in which case the Fund’s remaining assets may be less liquid, more volatile, and more difficult to price. To the extent these large shareholders transact in shares on the secondary market, such transactions may account for a large percentage of the trading volume for the shares of the Fund and may, therefore, have a material upward or downward effect on the market price of the Fund shares. In addition, large purchases of Fund shares may adversely affect the Fund’s performance to the extent that the Fund is delayed in investing new cash and is required to maintain a larger cash position than it ordinarily would, diluting its investment returns.
Mid-Capitalization Companies Risk. Stock prices of mid-capitalization companies may be more volatile than those of large-capitalization companies and, therefore, the Fund’s share price may be more volatile than those of funds that invest a larger percentage of their assets in stocks issued by large-capitalization companies. Stock prices of mid-capitalization companies are also more vulnerable than those of large-capitalization companies to adverse business or economic developments, and the stocks of mid-capitalization companies may be less liquid than those of large-capitalization companies, making it difficult for the Fund to buy and sell shares of mid-capitalization companies. In addition, mid-capitalization companies generally have less diverse product lines than large-capitalization companies and are more susceptible to adverse developments related to their products.
Small-Capitalization Companies Risk. Stock prices of small-capitalization companies may be more volatile than those of larger companies and, therefore, the Fund's share price may be more volatile than those of funds that invest a larger percentage of their assets in stocks issued by mid- or large-capitalization companies. Stock prices of small-capitalization companies are generally more vulnerable than
17
those of mid- or large-capitalization companies to adverse business and economic developments. Securities of small-capitalization companies may be thinly traded, making it difficult for the Fund to buy and sell them. In addition, small-capitalization companies are typically less financially stable than larger, more established companies and may depend on a small number of essential personnel, making these companies more vulnerable to experiencing adverse effects due to the loss of personnel. Small-capitalization companies also normally have less diverse product lines than those of mid- or large-capitalization companies and are more susceptible to adverse developments concerning their products.
Threshold/Underinvestment Risk. If certain aggregate and/or fund-level ownership thresholds are reached through transactions undertaken by BFA, its affiliates or the Fund, or as a result of third-party transactions or actions by an issuer or regulator, the ability of BFA and its affiliates on behalf of clients (including the Fund) to purchase or dispose of investments, or exercise rights or undertake business transactions, may be restricted by regulation or otherwise impaired. The capacity of the Fund to make investments in certain securities may be affected by the relevant threshold limits, and such limitations may have adverse effects on the liquidity and performance of the Fund’s portfolio holdings compared to the performance of the Underlying Index. This may increase the risk of the Fund being underinvested to the Underlying Index and increase the risk of tracking error.
For example, in certain circumstances where the Fund invests in securities issued by companies that operate in certain regulated industries or in certain emerging or international markets, is subject to corporate or regulatory ownership restrictions, or invests in certain futures or other derivative transactions, there may be limits on the aggregate and/or fund-level amount invested or voted by BFA and its affiliates for their proprietary accounts and for client accounts (including the Fund) that may not be exceeded without the grant of a license or other regulatory or corporate consent or, if exceeded, may cause BFA and its affiliates, the Fund or other client accounts to suffer disadvantages or business restrictions.
Portfolio Holdings Information
A description of the Company's policies and procedures with respect to the disclosure of the Fund’s portfolio securities is available in the Fund's Statement of Additional Information (“SAI”). The Fund discloses its portfolio holdings daily at www.iShares.com. Fund fact sheets providing information regarding the Fund's top holdings are posted on www.iShares.com when available and may be requested by calling 1-800-iShares (1-800-474-2737).
Management
Investment Adviser. As investment adviser, BFA has overall responsibility for the general management and administration of the Fund. BFA provides an investment program for the Fund and manages the investment of the Fund’s assets. In managing the Fund, BFA may draw upon the research and expertise of its asset management affiliates with respect to certain portfolio securities. In seeking to achieve the Fund's investment objective, BFA uses teams of portfolio managers, investment strategists
18
and other investment specialists. This team approach brings together many disciplines and leverages BFA’s extensive resources.
Pursuant to the Investment Advisory Agreement between BFA and the Company (entered into on behalf of the Fund), BFA is responsible for substantially all expenses of the Fund, except the management fees, interest expenses, taxes, expenses incurred with respect to the acquisition and disposition of portfolio securities and the execution of portfolio transactions, including brokerage commissions, distribution fees or expenses, and litigation expenses and any extraordinary expenses (as determined by a majority of the Directors who are not “interested persons” of the Company). Operating expenses paid by BFA under the Investment Advisory Agreement exclude Acquired Fund Fees and Expenses, if any.
For the fiscal year ended April 30, 2023, BFA was paid a management fee from the Fund, as a percentage of the Fund's average daily net assets, net of any applicable waivers, at the annual rate of 0.49%.
BFA has contractually agreed to waive its management fees in an amount equal to the Acquired Fund Fees and Expenses, if any, attributable to investments by the Fund in other funds advised by BFA or its affiliates through August 31, 2025. The contractual waiver may be terminated prior to August 31, 2025 only upon written agreement of the Company and BFA. In addition, BFA may from time to time voluntarily waive and/or reimburse fees or expenses in order to limit total annual fund operating expenses (excluding Acquired Fund Fees and Expenses, if any). Any such voluntary waiver or reimbursement may be eliminated by BFA at any time.
BFA is located at 400 Howard Street, San Francisco, CA 94105. It is an indirect wholly-owned subsidiary of BlackRock, Inc. (“BlackRock”). As of June 30, 2023, BFA and its affiliates provided investment advisory services for assets of approximately $9.4 trillion. BFA and its affiliates trade and invest for their own accounts in the actual securities and types of securities in which the Fund may also invest, which may affect the price of such securities.
A discussion regarding the basis for the approval by the Company's Board of Directors (the “Board”) of the Investment Advisory Agreement with BFA is available in the Fund's Semi-Annual Report for the period ended October 31.
Portfolio Managers. Jennifer Hsui, Greg Savage and Paul Whitehead are primarily responsible for the day-to-day management of the Fund. The Portfolio Managers are responsible for various functions related to portfolio management, including, but not limited to, investing cash inflows, coordinating with members of their respective portfolio management teams to focus on certain asset classes, implementing investment strategy, researching and reviewing investment strategy and overseeing members of their respective portfolio management teams who have more limited responsibilities.
Jennifer Hsui has been employed by BFA or its affiliates as a senior portfolio manager since 2007. Prior to that, Ms. Hsui was a portfolio manager from 2006 to 2007 for Barclays Global Fund Advisors (“BGFA”). Ms. Hsui has been a Portfolio Manager of the Fund since 2012.
19
Greg Savage has been employed by BFA or its affiliates as a senior portfolio manager since 2006. Prior to that, Mr. Savage was a portfolio manager from 2001 to 2006 for BGFA. Mr. Savage has been a Portfolio Manager of the Fund since 2012.
Paul Whitehead has been with BlackRock since 1996, including his years with Barclays Global Investors (“BGI”), which merged with BlackRock in 2009. Mr. Whitehead has been employed by BlackRock as a Managing Director since 2010 and a Director from 2009 to 2010. Mr. Whitehead was employed by BGI as Principal from 2002 to 2009. Mr. Whitehead has been a Portfolio Manager of the Fund since 2022.
The Fund's SAI provides additional information about the Portfolio Managers' compensation, other accounts managed by the Portfolio Managers and the Portfolio Managers' ownership (if any) of shares in the Fund.
Administrator, Custodian and Transfer Agent. State Street Bank and Trust Company (“State Street”) is the administrator, custodian and transfer agent for the Fund. JPMorgan Chase Bank, N.A. serves as custodian for the Fund in connection with certain securities lending activities.
Conflicts of Interest. The investment activities of BFA and its affiliates (including BlackRock and its subsidiaries (collectively, the “Affiliates”)), and their respective directors, officers or employees, in the management of, or their interest in, their own accounts and other accounts they manage, may present conflicts of interest that could disadvantage the Fund and its shareholders. BFA and its Affiliates provide investment management services to other funds and discretionary managed accounts that may follow investment programs similar to that of the Fund. BFA and its Affiliates are involved worldwide with a broad spectrum of financial services and asset management activities and may engage in the ordinary course of business in activities in which their interests or the interests of their clients may conflict with those of the Fund. BFA or one or more Affiliates act, or may act, as an investor, research provider, investment manager, commodity pool operator, commodity trading advisor, financier, underwriter, adviser, trader, lender, index provider, agent and/or principal, and have other direct and indirect interests in securities, currencies, commodities, derivatives and other instruments in which the Fund may directly or indirectly invest. The Fund may invest in securities of, or engage in other transactions with, companies with which an Affiliate has significant debt or equity investments or other interests. The Fund may also invest in issuances (such as structured notes) by entities for which an Affiliate provides and is compensated for cash management services relating to the proceeds from the sale of such issuances. The Fund also may invest in securities of, or engage in other transactions with, companies for which an Affiliate provides or may in the future provide research coverage. An Affiliate may have business relationships with, and purchase or distribute or sell services or products from or to, distributors, consultants or others who recommend the Fund or who engage in transactions with or for the Fund, and may receive compensation for such services. BFA or one or more Affiliates may engage in proprietary trading and advise accounts and funds that have investment objectives similar to those of the Fund and/or that engage in and compete for transactions in the same types of securities, currencies and other instruments as the Fund. This may include transactions in securities issued by other open-end and closed-end investment companies (which may include investment companies that are
20
affiliated with the Fund and BFA, to the extent permitted under the Investment Company Act of 1940, as amended (the “1940 Act”)). The trading activities of BFA and these Affiliates are carried out without reference to positions held directly or indirectly by the Fund and may result in BFA or an Affiliate having positions in certain securities that are senior or junior to, or have interests different from or adverse to, the securities that are owned by the Fund.
Neither BlackRock nor any Affiliate is under any obligation to share any investment opportunity, idea or strategy with the Fund. As a result, an Affiliate may compete with the Fund for appropriate investment opportunities. The results of the Fund's investment activities, therefore, may differ from those of an Affiliate and of other accounts managed by BlackRock or an Affiliate, and it is possible that the Fund could sustain losses during periods in which one or more Affiliates and other accounts achieve profits on their trading for proprietary or other accounts. The opposite result is also possible.
In addition, the Fund may, from time to time, enter into transactions in which BFA or an Affiliate or its or their directors, officers, employees or clients have an adverse interest. Furthermore, transactions undertaken by clients advised or managed by BFA or its Affiliates may adversely impact the Fund. Transactions by one or more clients or by BFA or its Affiliates or their directors, officers or employees may have the effect of diluting or otherwise disadvantaging the values, prices or investment strategies of the Fund.
The Fund's activities may be limited because of regulatory restrictions applicable to BFA or one or more Affiliates and/or their internal policies designed to comply with such restrictions.
Under a securities lending program approved by the Board, the Fund has retained BTC, an Affiliate of BFA, to serve as the securities lending agent for the Fund to the extent that the Fund participates in the securities lending program. For these services, the securities lending agent will receive a fee from the Fund, based on the returns earned on the Fund’s lending activities, including investment of the cash received as collateral for the loaned securities. In addition, one or more Affiliates may be among the entities to which the Fund may lend its portfolio securities under the securities lending program.
It is also possible that, from time to time, BlackRock and/or its advisory clients (including other funds and separately managed accounts) may, subject to compliance with applicable law, purchase and hold shares of the Fund. The price, availability, liquidity, and (in some cases) expense ratio of the Fund may be impacted by purchases and sales of the Fund by BlackRock and/or its advisory clients.
The activities of BFA and its Affiliates and their respective directors, officers or employees may give rise to other conflicts of interest that could disadvantage the Fund and its shareholders. BFA has adopted policies and procedures designed to address these potential conflicts of interest. See the SAI for further information.
21
Shareholder Information
Additional shareholder information, including how to buy and sell shares of the Fund, is available free of charge by calling toll-free: 1-800-iShares (1-800-474-2737) or visiting our website at www.iShares.com.
Buying and Selling Shares. Shares of the Fund may be acquired or redeemed directly from the Fund only in Creation Units or multiples thereof, as discussed in the Creations and Redemptions section of this Prospectus. Only an Authorized Participant may engage in creation or redemption transactions directly with the Fund. Once created, shares of the Fund generally trade in the secondary market in amounts less than a Creation Unit.
Shares of the Fund are listed on a national securities exchange for trading during the trading day. Shares can be bought and sold throughout the trading day like shares of other publicly traded companies. The Company does not impose any minimum investment for shares of the Fund purchased on an exchange or otherwise in the secondary market. The Fund's shares trade under the ticker symbol “DVYA.”
Buying or selling Fund shares on an exchange or other secondary market involves two types of costs that may apply to all securities transactions. When buying or selling shares of the Fund through a broker, you may incur a brokerage commission and other charges. The commission is frequently a fixed amount and may be a significant proportional cost for investors seeking to buy or sell small amounts of shares. In addition, you may incur the cost of the “spread,” that is, any difference between the bid price and the ask price. The spread varies over time for shares of the Fund based on the Fund’s trading volume and market liquidity, and is generally lower if the Fund has high trading volume and market liquidity, and higher if the Fund has little trading volume and market liquidity (which is often the case for funds that are newly launched or small in size). The Fund's spread may also be impacted by the liquidity or illiquidity of the underlying securities held by the Fund, particularly for newly launched or smaller funds or in instances of significant volatility of the underlying securities.
The Fund does not impose restrictions on the frequency of purchases and redemptions of Fund shares directly with the Fund. The Board determined not to adopt policies and procedures designed to prevent or monitor for frequent purchases and redemptions of Fund shares because the Fund generally sells and redeems its shares directly through transactions that are in-kind and/or for cash, with a deadline for placing cash-related transactions no later than the close of the primary markets for the Fund’s portfolio securities. However, the Fund has taken certain measures (e.g., imposing transaction fees on purchases and redemptions of Creation Units and reserving the right to reject purchases of Creation Units under certain circumstances) to minimize the potential consequences of frequent cash purchases and redemptions by Authorized Participants, such as increased tracking error, disruption of portfolio management, dilution to the Fund, and/or increased transaction costs. Further, the vast majority of trading in Fund shares occurs on the secondary market, which does not involve the Fund directly, and such trading is unlikely to cause many of the harmful effects of frequent cash purchases or redemptions of Fund shares.
22
The national securities exchange on which the Fund's shares are listed is open for trading Monday through Friday and is closed on weekends and the following holidays (or the days on which they are observed): New Year’s Day, Martin Luther King, Jr. Day, Presidents’ Day, Good Friday, Memorial Day, Juneteenth, Independence Day, Labor Day, Thanksgiving Day and Christmas Day. The Fund’s primary listing exchange is NYSE Arca.
Section 12(d)(1) of the 1940 Act generally restricts investments by investment companies, including foreign and unregistered investment companies, in the securities of other investment companies. For example, a registered investment company (the “Acquired Fund”), such as the Fund, may not knowingly sell or otherwise dispose of any security issued by the Acquired Fund to any investment company (the “Acquiring Fund”) or any company or companies controlled by the Acquiring Fund if, immediately after such sale or disposition: (i) more than 3% of the total outstanding voting stock of the Acquired Fund is owned by the Acquiring Fund and any company or companies controlled by the Acquiring Fund, or (ii) more than 10% of the total outstanding voting stock of the Acquired Fund is owned by the Acquiring Fund and other investment companies and companies controlled by them. However, registered investment companies are permitted to invest in the Fund beyond the limits set forth in Section 12(d)(1), subject to certain terms and conditions set forth in SEC rules. In order for a registered investment company to invest in shares of the Fund beyond the limitations of Section 12(d)(1) in reliance on Rule 12d1-4 under the 1940 Act, the registered investment company must, among other things, enter into an agreement with the Company. Foreign investment companies are permitted to invest in the Fund only up to the limits set forth in Section 12(d)(1), subject to any applicable SEC no-action relief.
Book Entry. Shares of the Fund are held in book-entry form, which means that no stock certificates are issued. The Depository Trust Company (“DTC”) or its nominee is the record owner of, and holds legal title to, all outstanding shares of the Fund.
Investors owning shares of the Fund are beneficial owners as shown on the records of DTC or its participants. DTC serves as the securities depository for shares of the Fund. DTC participants include securities brokers and dealers, banks, trust companies, clearing corporations and other institutions that directly or indirectly maintain a custodial relationship with DTC. As a beneficial owner of shares, you are not entitled to receive physical delivery of stock certificates or to have shares registered in your name, and you are not considered a registered owner of shares. Therefore, to exercise any right as an owner of shares, you must rely upon the procedures of DTC and its participants. These procedures are the same as those that apply to any other securities that you hold in book-entry or “street name” form.
Share Prices. The trading prices of the Fund’s shares in the secondary market generally differ from the Fund’s daily NAV and are affected by market forces such as the supply of and demand for ETF shares and shares of underlying securities held by the Fund, economic conditions and other factors.
Determination of Net Asset Value. The NAV of the Fund normally is determined once daily Monday through Friday, generally as of the close of regular trading hours of the New York Stock Exchange (“NYSE”) (normally 4:00 p.m., Eastern time) on each day that the NYSE is open for trading, based on prices at the time of closing, provided that
23
any Fund assets or liabilities denominated in currencies other than the U.S. dollar are translated into U.S. dollars at the prevailing market rates on the date of valuation as quoted by one or more data service providers. The NAV of the Fund is calculated by dividing the value of the net assets of the Fund (i.e., the value of its total assets less total liabilities) by the total number of outstanding shares of the Fund, generally rounded to the nearest cent.
The value of the securities and other assets and liabilities held by the Fund is determined pursuant to BFA’s valuation policies and procedures. BFA has been designated by the Board as the valuation designee for the Fund pursuant to Rule 2a-5 under the 1940 Act.
Equity securities and other equity instruments for which market quotations are readily available are valued at market value, which is generally determined using the last reported official closing price or, if a reported closing price is not available, the last traded price on the exchange or market on which the security or instrument is primarily traded at the time of valuation. Shares of underlying open-end funds (including money market funds) are valued at net asset value. Shares of underlying exchange-traded closed-end funds or other ETFs are valued at their most recent closing price.
Generally, trading in non-U.S. securities and money market instruments is substantially completed each day at various times prior to the close of regular trading hours of the NYSE. The values of such securities used in computing the NAV of the Fund are determined as of such times.
When market quotations are not readily available or are believed by BFA to be unreliable, BFA will fair value the Fund’s investments in accordance with its policies and procedures. BFA may conclude that a market quotation is not readily available or is unreliable if a security or other asset or liability does not have a price source due to its lack of trading or other reasons, if a market quotation differs significantly from recent price quotations or otherwise no longer appears to reflect fair value, where the security or other asset or liability is thinly traded, when there is a significant event subsequent to the most recent market quotation, or if the trading market on which a security is listed is suspended or closed and no appropriate alternative trading market is available. A “significant event” is deemed to occur if BFA determines, in its reasonable business judgment prior to or at the time of pricing the Fund’s assets or liabilities, that the event is likely to cause a material change to the last exchange closing price or closing market price of one or more assets held by, or liabilities of, the Fund.
For certain foreign assets, a third-party vendor supplies evaluated, systematic fair value pricing based upon the movement of a proprietary multi-factor model after the relevant foreign markets have closed. This systematic fair value pricing methodology is designed to correlate the prices of foreign assets in one or more non-U.S. markets following the close of the local markets to the prices that might have prevailed as of the Fund’s pricing time.
Fair value represents a good faith approximation of the value of an asset or liability. The fair value of an asset or liability held by the Fund is the amount the Fund might reasonably expect to receive from the current sale of that asset or the cost to
24
extinguish that liability in an arm’s-length transaction. Valuing the Fund’s investments using fair value pricing will result in prices that may differ from current market valuations and that may not be the prices at which those investments could have been sold during the period in which the particular fair values were used. Use of fair value prices and certain current market valuations could result in a difference between the prices used to calculate the Fund’s NAV and the prices used by the Underlying Index, which, in turn, could result in a difference between the Fund’s performance and the performance of the Underlying Index.
Dividends and Distributions.
General Policies. Dividends from net investment income, if any, generally are declared and paid at least once a year by the Fund. Distributions of net realized securities gains, if any, generally are declared and paid once a year, but the Company may make distributions on a more frequent basis for the Fund. The Company reserves the right to declare special distributions if, in its reasonable discretion, such action is necessary or advisable to preserve its status as a regulated investment company (“RIC”) or to avoid imposition of income or excise taxes on undistributed income or realized gains.
Dividends and other distributions on shares of the Fund are distributed on a pro rata basis to beneficial owners of such shares. Dividend payments are made through DTC participants and indirect participants to beneficial owners then of record with proceeds received from the Fund.
Dividend Reinvestment Service. No dividend reinvestment service is provided by the Company. Broker-dealers may make available the DTC book-entry Dividend Reinvestment Service for use by beneficial owners of the Fund for reinvestment of their dividend distributions. Beneficial owners should contact their broker to determine the availability and costs of the service and the details of participation therein. Brokers may require beneficial owners to adhere to specific procedures and timetables. If this service is available and used, dividend distributions of both income and realized gains will be automatically reinvested in additional whole shares of the Fund purchased in the secondary market.
Note on Tax Information. The following sections summarize some of the consequences under current U.S. federal tax law of an investment in the Fund. It is not a substitute for personal tax advice. You may also be subject to state and local taxation on Fund distributions and sales of shares. Certain states and localities may exempt from tax distributions attributable to interest from U.S. federal government obligations. Consult your personal tax advisor about the potential tax consequences of an investment in shares of the Fund under all applicable tax laws.
Taxes. As with any investment, you should consider how your investment in shares of the Fund will be taxed. The tax information in this Prospectus is provided as general information, based on current law. You should consult your own tax professional about the tax consequences of an investment in shares of the Fund.
Unless your investment in Fund shares is made through a tax-exempt entity or tax-deferred retirement account, such as an IRA, in which case your distributions generally will be taxable when withdrawn, you need to be aware of the possible tax consequences when the Fund makes distributions or you sell Fund shares.
25
Taxes on Distributions. Distributions from the Fund’s net investment income (other than qualified dividend income), including distributions of income from securities lending and distributions out of the Fund’s net short-term capital gains, if any, are taxable to you as ordinary income. Distributions by the Fund of net long-term capital gains, if any, in excess of net short-term capital losses (capital gain dividends) are taxable to you as long-term capital gains, regardless of how long you have held the Fund’s shares. Distributions by the Fund that qualify as qualified dividend income are taxable to you at long-term capital gain rates. Long-term capital gains and qualified dividend income are generally eligible for taxation at a maximum rate of 15% or 20% for non-corporate shareholders, depending on whether their income exceeds certain threshold amounts. In addition, a 3.8% U.S. federal Medicare contribution tax is imposed on “net investment income,” including, but not limited to, interest, dividends, and net gain, of U.S. individuals with income exceeding $200,000 (or $250,000 if married and filing jointly) and of estates and trusts.
Dividends will be qualified dividend income to you if they are attributable to qualified dividend income received by the Fund. Generally, qualified dividend income includes dividend income from taxable U.S. corporations and qualified non-U.S. corporations, provided that the Fund satisfies certain holding period requirements in respect of the stock of such corporations and has not hedged its position in the stock in certain ways. Substitute dividends received by the Fund with respect to dividends paid on securities lent out will not be qualified dividend income. For this purpose, a qualified non-U.S. corporation means any non-U.S. corporation that is eligible for benefits under a comprehensive income tax treaty with the U.S., which includes an exchange of information program, or if the stock with respect to which the dividend was paid is readily tradable on an established U.S. securities market. The term excludes a corporation that is a passive foreign investment company.
Dividends received by the Fund from a RIC generally are qualified dividend income only to the extent such dividend distributions are made out of qualified dividend income received by such RIC. Additionally, it is expected that dividends received by the Fund from a REIT and distributed to a shareholder generally will be taxable to the shareholder as ordinary income. However, for tax years beginning after December 31, 2017 and before January 1, 2026, the Fund may report dividends eligible for a 20% “qualified business income” deduction for non-corporate U.S. shareholders to the extent the Fund’s income is derived from ordinary REIT dividends, reduced by allocable Fund expenses.
For a dividend to be treated as qualified dividend income, the dividend must be received with respect to a share of stock held without being hedged by the Fund, and with respect to a share of the Fund held without being hedged by you, for 61 days during the 121-day period beginning at the date which is 60 days before the date on which such share becomes ex-dividend with respect to such dividend or, in the case of certain preferred stock, 91 days during the 181-day period beginning 90 days before such date.
Fund distributions, to the extent attributable to dividends from U.S. corporations, will be eligible for the dividends received deduction for Fund shareholders that are corporations, subject to certain hedging and holding requirements.
26
In general, your distributions are subject to U.S. federal income tax for the year when they are paid. Certain distributions paid in January, however, may be treated as paid on December 31 of the prior year.
If the Fund’s distributions exceed current and accumulated earnings and profits, all or a portion of the distributions made in the taxable year may be recharacterized as a return of capital to shareholders. Distributions in excess of the Fund’s minimum distribution requirements, but not in excess of the Fund’s earnings and profits, will be taxable to shareholders and will not constitute nontaxable returns of capital. A return of capital distribution generally will not be taxable but will reduce the shareholder’s cost basis and result in a higher capital gain or lower capital loss when those shares on which the distribution was received are sold. Once a shareholder's cost basis is reduced to zero, further distributions will be treated as capital gain, if the shareholder holds shares of the Fund as capital assets.
Dividends, interest and capital gains earned by the Fund with respect to securities issued by non-U.S. issuers may give rise to withholding, capital gains and other taxes imposed by non-U.S. countries. Tax conventions between certain countries and the U.S. may reduce or eliminate such taxes. If more than 50% of the total assets of the Fund at the close of a year consists of non-U.S. stocks or securities (generally, for this purpose, depositary receipts, no matter where traded, of non-U.S. companies are treated as “non-U.S.”), generally the Fund may “pass through” to you certain non-U.S. income taxes (including withholding taxes) paid by the Fund. This means that you would be considered to have received as an additional dividend your share of such non-U.S. taxes, but you may be entitled to either a corresponding tax deduction in calculating your taxable income, or, subject to certain limitations, a credit in calculating your U.S. federal income tax.
For purposes of foreign tax credits for U.S. shareholders of the Fund, foreign capital gains taxes may not produce associated foreign source income, limiting the availability of such credits for U.S. persons.
If you are neither a resident nor a citizen of the U.S. or if you are a non-U.S. entity (other than a pass-through entity to the extent owned by U.S. persons), the Fund’s ordinary income dividends (which include distributions of net short-term capital gains) will generally be subject to a 30% U.S. withholding tax, unless a lower treaty rate applies, provided that withholding tax will generally not apply to any gain or income realized by a non-U.S. shareholder in respect of any distributions of long-term capital gains or upon the sale or other disposition of shares of the Fund.
Separately, a 30% withholding tax is currently imposed on U.S.-source dividends, interest and other income items paid to (i) foreign financial institutions, including non-U.S. investment funds, unless they agree to collect and disclose to the U.S. Internal Revenue Service (“IRS”) information regarding their direct and indirect U.S. account holders and (ii) certain other foreign entities, unless they certify certain information regarding their direct and indirect U.S. owners. To avoid withholding, foreign financial institutions will need to (i) enter into agreements with the IRS that state that they will provide the IRS information, including the names, addresses and taxpayer identification numbers of direct and indirect U.S. account holders, comply with due diligence procedures with respect to the identification of U.S. accounts, report to the
27
IRS certain information with respect to U.S. accounts maintained, agree to withhold tax on certain payments made to non-compliant foreign financial institutions or to account holders who fail to provide the required information, and determine certain other information concerning their account holders, or (ii) in the event that an applicable intergovernmental agreement and implementing legislation are adopted, provide local revenue authorities with similar account holder information. Other foreign entities may need to report the name, address, and taxpayer identification number of each substantial U.S. owner or provide certifications of no substantial U.S. ownership unless certain exceptions apply.
If your Fund shares are loaned out pursuant to a securities lending arrangement, you may lose the ability to treat Fund dividends paid while the shares are held by the borrower as qualified dividend income. In addition, you may lose the ability to use foreign tax credits passed through by the Fund if your Fund shares are loaned out pursuant to a securities lending agreement.
If you are a resident or a citizen of the U.S., by law, backup withholding at a 24% rate will apply to your distributions and proceeds if you have not provided a taxpayer identification number or social security number and made other required certifications.
Taxes When Shares Are Sold. Currently, any capital gain or loss realized upon a sale of Fund shares is generally treated as a long-term gain or loss if the shares have been held for more than one year. Any capital gain or loss realized upon a sale of Fund shares held for one year or less is generally treated as short-term gain or loss, except that any capital loss on the sale of shares held for six months or less is treated as long-term capital loss to the extent that capital gain dividends were paid with respect to such shares. Any such capital gains, including from sales of Fund shares or from capital gain dividends, are included in “net investment income” for purposes of the 3.8% U.S. federal Medicare contribution tax mentioned above.
Chinese Tax Disclosure. The Fund’s investments in securities, issued by PRC companies may cause the Fund to become subject to withholding and other taxes imposed by the PRC. If the Fund were considered to be a tax resident of the PRC, it would be subject to PRC corporate income tax at the rate of 25% on its worldwide taxable income. If the Fund were considered to be a non-resident enterprise with a “permanent establishment” in the PRC, it would be subject to PRC corporate income tax of 25% on the profits attributable to the permanent establishment. BFA intends to operate the Fund in a manner that will prevent it from being treated as a tax resident of the PRC and from having a permanent establishment in the PRC. It is possible, however, that the PRC could disagree with that conclusion or that changes in PRC tax law could affect the PRC corporate income tax status of the Fund.
The PRC generally imposes withholding income tax at a rate of 10% on dividends, premiums, interest and capital gains originating in the PRC and paid to a company that is not a resident of the PRC for tax purposes and that has no permanent establishment in China. The withholding is in general made by the relevant PRC tax resident company making such payments. In the event the relevant PRC tax resident company fails to withhold the relevant PRC withholding income tax or otherwise fails to pay the relevant withholding income tax to the PRC tax authorities, the PRC tax authorities may, at their sole discretion, impose tax obligations on the Fund. Foreign investors are temporarily
28
exempt from withholding income tax on capital gains derived from the trading of certain shares. The exemptions are temporary and there is no indication how long the exemptions will continue. While the application and enforcement of this law to the Fund remains subject to clarification, to the extent that such taxes are imposed on any capital gains of the Fund, the Fund's NAV or returns may be adversely impacted. Stamp duty under PRC laws generally applies to the execution and receipt of taxable documents, which include contracts for the sale of shares traded on PRC stock exchanges. In the case of such contracts, the stamp duty is currently imposed on the seller but not on the purchaser, at the rate of 0.1%.
The above information is only a general summary of the potential PRC tax consequences that may be imposed on the Fund and its investors either directly or indirectly and should not be taken as a definitive, authoritative or comprehensive statement of the relevant matter. Investors should seek their own tax advice on their tax position with regard to their investment in the Fund.
The PRC government has implemented a number of tax reform policies in recent years. The current tax laws and regulations may be revised or amended in the future. Any revision or amendment in tax laws and regulations may affect the after-taxation profit of PRC companies and foreign investors in such companies, such as the Fund.
Creations and Redemptions. Prior to trading in the secondary market, shares of the Fund are “created” at NAV by market makers, large investors and institutions only in block-size Creation Units or multiples thereof. Each “creator” or authorized participant (an “Authorized Participant”) has entered into an agreement with the Fund's distributor, BlackRock Investments, LLC (the “Distributor” or “BRIL”), an affiliate of BFA. An Authorized Participant is a member or participant of a clearing agency registered with the SEC, which has a written agreement with the Fund or one of its service providers that allows such member or participant to place orders for the purchase and redemption of Creation Units.
A creation transaction, which is subject to acceptance by the Distributor and the Fund, generally takes place when an Authorized Participant deposits into the Fund a designated portfolio of securities, assets or other positions (a “creation basket”), and an amount of cash (including any cash representing the value of substituted securities, assets or other positions), if any, which together approximate the holdings of the Fund in exchange for a specified number of Creation Units. Similarly, shares can be redeemed only in Creation Units, generally for a designated portfolio of securities, assets or other positions (a “redemption basket”) held by the Fund and an amount of cash (including any portion of such securities for which cash may be substituted). The Fund may, in certain circumstances, offer Creation Units partially or solely for cash. Except when aggregated in Creation Units, shares are not redeemable by the Fund. Creation and redemption baskets may differ and the Fund may accept “custom baskets.” More information regarding custom baskets is contained in the Fund's SAI.
The prices at which creations and redemptions occur are based on the next calculation of NAV after a creation or redemption order is received in an acceptable form under the authorized participant agreement.
29
Only an Authorized Participant may create or redeem Creation Units with the Fund. Authorized Participants may create or redeem Creation Units for their own accounts or for customers, including, without limitation, affiliates of the Fund.
In the event of a system failure or other interruption, including disruptions at market makers or Authorized Participants, orders to purchase or redeem Creation Units either may not be executed according to the Fund's instructions or may not be executed at all, or the Fund may not be able to place or change orders.
To the extent the Fund engages in in-kind transactions, the Fund intends to comply with the U.S. federal securities laws in accepting securities for deposit and satisfying redemptions with redemption securities by, among other means, assuring that any securities accepted for deposit and any securities used to satisfy redemption requests will be sold in transactions that would be exempt from registration under the Securities Act of 1933, as amended (the “1933 Act”). Further, an Authorized Participant that is not a “qualified institutional buyer,” as such term is defined in Rule 144A under the 1933 Act, will not be able to receive restricted securities eligible for resale under Rule 144A.
Creations and redemptions must be made through a firm that is either a member of the Continuous Net Settlement System of the National Securities Clearing Corporation or a DTC participant that has executed an agreement with the Distributor with respect to creations and redemptions of Creation Unit aggregations. Information about the procedures regarding creation and redemption of Creation Units (including the cut-off times for receipt of creation and redemption orders) is included in the Fund's SAI.
Because new shares may be created and issued on an ongoing basis, at any point during the life of the Fund a “distribution,” as such term is used in the 1933 Act, may be occurring. Broker-dealers and other persons are cautioned that some activities on their part may, depending on the circumstances, result in their being deemed participants in a distribution in a manner that could render them statutory underwriters subject to the prospectus delivery and liability provisions of the 1933 Act. Any determination of whether one is an underwriter must take into account all the relevant facts and circumstances of each particular case.
Broker-dealers should also note that dealers who are not “underwriters” but are participating in a distribution (as contrasted to ordinary secondary transactions), and thus dealing with shares that are part of an “unsold allotment” within the meaning of Section 4(a)(3)(C) of the 1933 Act, would be unable to take advantage of the prospectus delivery exemption provided by Section 4(a)(3) of the 1933 Act. For delivery of prospectuses to exchange members, the prospectus delivery mechanism of Rule 153 under the 1933 Act is available only with respect to transactions on a national securities exchange.
Householding. Householding is an option available to certain Fund investors. Householding is a method of delivery, based on the preference of the individual investor, in which a single copy of certain shareholder documents can be delivered to investors who share the same address, even if their accounts are registered under different names. Please contact your broker-dealer if you are interested in enrolling in householding and receiving a single copy of prospectuses and other shareholder
30
documents, or if you are currently enrolled in householding and wish to change your householding status.
Distribution
The Distributor or its agent distributes Creation Units for the Fund on an agency basis. The Distributor does not maintain a secondary market in shares of the Fund. The Distributor has no role in determining the policies of the Fund or the securities that are purchased or sold by the Fund. The Distributor’s principal address is 50 Hudson Yards, New York, NY 10001.
BFA or its affiliates make payments to broker-dealers, registered investment advisers, banks or other intermediaries (together, “intermediaries”) related to marketing activities and presentations, educational training programs, conferences, the development of technology platforms and reporting systems, data provision services, or their making shares of the Fund and certain other iShares funds available to their customers generally and in certain investment programs. Such payments, which may be significant to the intermediary, are not made by the Fund. Rather, such payments are made by BFA or its affiliates from their own resources, which come directly or indirectly in part from fees paid by the iShares funds complex. Payments of this type are sometimes referred to as revenue-sharing payments. A financial intermediary may make decisions about which investment options it recommends or makes available, or the level of services provided, to its customers based on the payments or other financial incentives it is eligible to receive. Therefore, such payments or other financial incentives offered or made to an intermediary create conflicts of interest between the intermediary and its customers and may cause the intermediary to recommend the Fund or other iShares funds over another investment. More information regarding these payments is contained in the Fund's SAI. Please contact your salesperson or other investment professional for more information regarding any such payments his or her firm may receive from BFA or its affiliates.
31
Financial Highlights
The financial highlights table is intended to help investors understand the Fund’s financial performance for the past five years. Certain information reflects financial results for a single share of the Fund. The total returns in the table represent the rate that an investor would have earned (or lost) on an investment in the Fund, assuming reinvestment of all dividends and distributions. This information has been audited by PricewaterhouseCoopers LLP, whose report is included, along with the Fund's financial statements, in the Fund's Annual Report (available upon request).
Financial Highlights
(For a share outstanding throughout each period)
(For a share outstanding throughout each period)
| |
iShares Asia/Pacific Dividend ETF | ||||
| |
Year Ended 04/30/23 |
Year Ended 04/30/22 |
Year Ended 04/30/21 |
Year Ended 04/30/20 |
Year Ended 04/30/19 |
| Net asset value, beginning of year |
$36.22 |
$40.93 |
$32.05 |
$43.76 |
$46.83 |
| Net investment income(a) |
2.43 |
2.09 |
1.80 |
2.05 |
2.49 |
| Net realized and unrealized gain (loss)(b) |
(2.01 ) |
(4.91 ) |
8.51 |
(11.57 ) |
(2.96 ) |
| Net increase (decrease) from investment operations |
0.42 |
(2.82 ) |
10.31 |
(9.52 ) |
(0.47 ) |
| Distributions from net investment income(c) |
(2.59 ) |
(1.89 ) |
(1.43 ) |
(2.19 ) |
(2.60 ) |
| Net asset value, end of year |
$34.05 |
$36.22 |
$40.93 |
$32.05 |
$43.76 |
| Total Return(d) |
|
|
|
|
|
| Based on net asset value |
1.63 % |
(7.02 )% |
32.93 % |
(22.50 )% |
(0.83 )% |
| Ratios to Average Net Assets(e) |
|
|
|
|
|
| Total expenses |
0.49 % |
0.49 % |
0.49 % |
0.49 % |
0.49 % |
| Total expenses after fees waived |
0.49 % |
0.49 % |
0.49 % |
0.49 % |
0.49 % |
| Net investment income |
7.22 % |
5.38 % |
4.89 % |
4.99 % |
5.65 % |
| Supplemental Data |
|
|
|
|
|
| Net assets, end of year (000) |
$39,154 |
$39,846 |
$45,027 |
$24,038 |
$32,823 |
| Portfolio turnover rate(f) |
45 % |
57 % |
130 % |
5 % |
46 % |
| (a) Based on average shares outstanding. | |||||
| (b) The amounts reported for a share outstanding may not accord with the change in aggregate gains and losses in securities for the fiscal period due to the timing of capital share transactions in relation to the fluctuating market values of the Fund’s underlying securities. | |||||
| (c) Distributions for annual periods determined in accordance with U.S. federal income tax regulations. | |||||
| (d) Where applicable, assumes the reinvestment of distributions. | |||||
| (e) Excludes fees and expenses incurred indirectly as a result of investments in underlying funds. | |||||
| (f) Portfolio turnover rate excludes in-kind transactions. | |||||
32
Index Provider
SPDJI is the Index Provider for the Underlying Index and is not affiliated with the Company, BFA, the Distributor or any of their respective affiliates.
SPDJI is a resource for index-based concepts, data and research. SPDJI provides financial, economic and investment information and analytical services to the financial community. SPDJI calculates and maintains the S&P Global 1200, which includes the S&P 500® for the U.S., the S&P Europe 350 for Continental Europe, Ireland and the U.K., the S&P/TOPIX 150 for Japan, the S&P Asia 50, the S&P/TSX 60TM for Canada, the S&P/ASX 50 and the S&P Latin America 40. SPDJI also publishes the S&P MidCap 400®, S&P SmallCap 600®, S&P Total Market Index and S&P U.S. REIT for the U.S. SPDJI calculates and maintains the S&P Global Broad Market Index (BMI) Series, a set of rules-based equity benchmarks covering developed and emerging countries around the world. Company additions to and deletions from an S&P equity index do not in any way reflect an opinion on the investment merits of the company.
BFA or its affiliates have entered into a license agreement with SPDJI to use the Underlying Index. BFA or its affiliates sublicense rights in the Underlying Index to the Company at no charge.
33
Disclaimers
The Underlying Index is a product of SPDJI, and has been licensed for use by BFA or its affiliates. Standard & Poor’s® and S&P® are registered trademarks of Standard & Poor’s Financial Services LLC, a division of S&P Global (“S&P”); Dow Jones® is a registered trademark of Dow Jones Trademark Holdings LLC (“Dow Jones”) and these trademarks have been licensed for use by SPDJI and sublicensed for certain purposes by the Company. The Fund is not sponsored, endorsed, sold or promoted by SPDJI, Dow Jones, S&P, or any of their respective affiliates (collectively, “S&P Dow Jones Indices”). S&P Dow Jones Indices make no representation or warranty, express or implied, to the owners of shares of the Fund or any member of the public regarding the advisability of investing in securities generally or in the Fund in particular or the ability of the Underlying Index to track general market performance. S&P Dow Jones Indices’ only relationship to the Company and BFA and their affiliates with respect to the Underlying Index is the licensing of the Underlying Index and certain trademarks, service marks and/or trade names of S&P Dow Jones Indices and/or its third party licensors. The Underlying Index is determined, composed and calculated by S&P Dow Jones Indices without regard to the Company, BFA or its affiliates or the Fund. S&P Dow Jones Indices have no obligation to take the needs of BFA or its affiliates or the owners of shares of the Fund into consideration in determining, composing or calculating the Underlying Index. S&P Dow Jones Indices are not responsible for and have not participated in the determination of the prices, and amount of shares of the Fund or the timing of the issuance or sale of such shares or in the determination or calculation of the equation by which shares of the Fund are to be converted into cash, surrendered or redeemed, as the case may be. S&P Dow Jones Indices have no obligation or liability in connection with the administration, marketing or trading of shares of the Fund. There is no assurance that investment products based on the Underlying Index will accurately track index performance or provide positive investment returns. SPDJI is not an investment adviser. Inclusion of a security within an index is not a recommendation by S&P Dow Jones Indices to buy, sell, or hold such security, nor is it considered to be investment advice.
S&P DOW JONES INDICES DO NOT GUARANTEE THE ADEQUACY, ACCURACY, TIMELINESS AND/OR THE COMPLETENESS OF THE UNDERLYING INDEX OR ANY DATA RELATED THERETO OR ANY COMMUNICATION, INCLUDING BUT NOT LIMITED TO, ORAL OR WRITTEN COMMUNICATION (INCLUDING ELECTRONIC COMMUNICATIONS) WITH RESPECT THERETO. S&P DOW JONES INDICES SHALL NOT BE SUBJECT TO ANY DAMAGES OR LIABILITY FOR ANY ERRORS, OMISSIONS, OR DELAYS THEREIN. S&P DOW JONES INDICES MAKE NO EXPRESS OR IMPLIED WARRANTIES, AND EXPRESSLY DISCLAIM ALL WARRANTIES, OF MERCHANTABILITY OR FITNESS FOR A PARTICULAR PURPOSE OR USE OR AS TO RESULTS TO BE OBTAINED BY BFA OR ITS AFFILIATES, OWNERS OF SHARES OF THE FUND, OR ANY OTHER PERSON OR ENTITY FROM THE USE OF THE UNDERLYING INDEX OR WITH RESPECT TO
34
ANY DATA RELATED THERETO. WITHOUT LIMITING ANY OF THE FOREGOING, IN NO EVENT WHATSOEVER SHALL S&P DOW JONES INDICES BE LIABLE FOR ANY INDIRECT, SPECIAL, INCIDENTAL, PUNITIVE, OR CONSEQUENTIAL DAMAGES INCLUDING, BUT NOT LIMITED TO, LOSS OF PROFITS, TRADING LOSSES, LOST TIME OR GOODWILL, EVEN IF THEY HAVE BEEN ADVISED OF THE POSSIBILITY OF SUCH DAMAGES, WHETHER IN CONTRACT, TORT, STRICT LIABILITY, OR OTHERWISE. THERE ARE NO THIRD PARTY BENEFICIARIES OF ANY AGREEMENTS OR ARRANGEMENTS BETWEEN S&P DOW JONES INDICES AND BFA OR ITS AFFILIATES, OTHER THAN THE LICENSORS OF S&P DOW JONES INDICES.
Shares of the Fund are not sponsored, endorsed or promoted by NYSE Arca. NYSE Arca makes no representation or warranty, express or implied, to the owners of shares of the Fund or any member of the public regarding the ability of the Fund to track the total return performance of the Underlying Index or the ability of the Underlying Index to track market performance. NYSE Arca is not responsible for, nor has it participated in, the determination of the compilation or the calculation of the Underlying Index, nor in the determination of the timing of, prices of, or quantities of shares of the Fund to be issued, nor in the determination or calculation of the equation by which the shares are redeemable. NYSE Arca has no obligation or liability to owners of shares of the Fund in connection with the administration, marketing or trading of shares of the Fund.
NYSE Arca does not guarantee the accuracy and/or the completeness of the Underlying Index or any data included therein. NYSE Arca makes no warranty, express or implied, as to results to be obtained by the Company on behalf of the Fund as licensee, licensee’s customers and counterparties, owners of shares of the Fund, or any other person or entity from the use of the Underlying Index or any data included therein in connection with the rights licensed as described herein or for any other use. NYSE Arca makes no express or implied warranties and hereby expressly disclaims all warranties of merchantability or fitness for a particular purpose with respect to the Underlying Index or any data included therein. Without limiting any of the foregoing, in no event shall NYSE Arca have any liability for any direct, indirect, special, punitive, consequential or any other damages (including lost profits) even if notified of the possibility of such damages.
The past performance of the Underlying Index is not a guide to future performance. BFA and its affiliates do not guarantee the accuracy or the completeness of the Underlying Index or any data included therein and BFA and its affiliates shall have no liability for any errors, omissions or interruptions therein. BFA and its affiliates make no warranty, express or implied, to the owners of shares of the Fund or to any other person or entity, as to results to be obtained by the Fund from the use of the Underlying Index or any data included therein. Without limiting any of the foregoing, in no event shall BFA or its affiliates have any liability for any special, punitive, direct,
35
indirect, consequential or any other damages (including lost profits), even if notified of the possibility of such damages.
36
Want to know more?
iShares.com | 1-800-474-2737
Information on the Fund’s net asset value, market price, premiums and discounts, and bid-ask spreads can be found at www.iShares.com. Copies of the Prospectus, SAI, shareholder reports and other information, as applicable and when available, can be found on our website at www.iShares.com. For more information about the Fund, you may request a copy of the SAI. The SAI provides detailed information about the Fund and is incorporated by reference into this Prospectus. This means that the SAI, for legal purposes, is a part of this Prospectus.
Additional information about the Fund's investments is, or will be, available in the Fund's Annual and Semi-Annual Reports to shareholders. In the Fund's Annual Report, you will find a discussion of the market conditions and investment strategies that significantly affected the Fund's performance during the last fiscal year.
If you have any questions about the Company or shares of the Fund or you wish to obtain the SAI, Semi-Annual or Annual Report free of charge, please:
| Call: |
1-800-iShares or 1-800-474-2737 (toll free) Monday through Friday, 8:30 a.m. to 6:30 p.m. (Eastern time) |
| Email: |
iSharesETFs@blackrock.com |
| Write: |
c/o BlackRock Investments, LLC 1 University Square Drive, Princeton, NJ 08540 |
Reports and other information about the Fund are available on the EDGAR database on the SEC's website at www.sec.gov, and copies of this information may be obtained, after paying a duplicating fee, by electronic request at the following e-mail address: publicinfo@sec.gov.
No person is authorized to give any information or to make any representations about the Fund and its shares not contained in this Prospectus and you should not rely on any other information. Read and keep this Prospectus for future reference.
©2023 BlackRock, Inc. All rights reserved. iSHARES® and BLACKROCK®are registered trademarks of BFA and its affiliates. All other marks are the property of their respective owners.
Investment Company Act File No.: 811-09102
IS-P-DVYA-0324


| |
September 1, 2023 |
| |
(as revised March 18, 2024) |
 |
2023 Prospectus |
iShares, Inc.
• iShares Emerging Markets Dividend ETF | DVYE | NYSE ARCA
The Securities and Exchange Commission (“SEC”) has not approved or disapproved these securities or passed upon the adequacy of this prospectus. Any representation to the contrary is a criminal offense.
Table of Contents
The “Dow Jones Emerging Markets Select Dividend IndexTM” is a product of S&P Dow Jones Indices LLC (“SPDJI”), and has been licensed for use by BlackRock Fund Advisors or its affiliates. Standard & Poor’s® and S&P® are registered trademarks of Standard & Poor’s Financial Services LLC (“S&P”); Dow Jones® is a registered trademark of Dow Jones Trademark Holdings LLC (“Dow Jones”) and these trademarks have been licensed for use by SPDJI and sublicensed for certain purposes by iShares, Inc. iShares® and BlackRock® are registered trademarks of BlackRock Fund Advisors and its affiliates. The Fund is not sponsored, endorsed, sold or promoted by SPDJI, Dow Jones, S&P or their respective affiliates, and none of such parties makes any representation regarding the advisability of investing in such product(s), nor do they have any liability for any errors, omissions, or interruptions of the Dow Jones Emerging Markets Select Dividend Index.
i
iSHARES® EMERGING MARKETS
DIVIDEND ETF
DIVIDEND ETF
Ticker: DVYE Stock Exchange: NYSE Arca
Investment Objective
The iShares Emerging Markets Dividend ETF (the “Fund”) seeks to track the investment results of an index composed of relatively high dividend paying equities in emerging markets.
Fees and Expenses
The following table describes the fees and expenses that you will incur if you buy, hold and sell shares of the Fund. The investment advisory agreement between iShares, Inc. (the “Company”) and BlackRock Fund Advisors (“BFA”) (the “Investment Advisory Agreement”) provides that BFA will pay all operating expenses of the Fund, except: (i) the management fees, (ii) interest expenses, (iii) taxes, (iv) expenses incurred with respect to the acquisition and disposition of portfolio securities and the execution of portfolio transactions, including brokerage commissions, (v) distribution fees or expenses, and (vi) litigation expenses and any extraordinary expenses. The Fund may incur “Acquired Fund Fees and Expenses.” Acquired Fund Fees and Expenses reflect the Fund's pro rata share of the fees and expenses incurred indirectly by the Fund as a result of investing in other investment companies. The impact of Acquired Fund Fees and Expenses is included in the total returns of the Fund. Acquired Fund Fees and Expenses are not included in the calculation of the ratio of expenses to average net assets shown in the Financial Highlights section of the Fund's prospectus (the “ Prospectus ” ). BFA, the investment adviser to the Fund, has contractually agreed to waive a portion of its management fees in an amount equal to the aggregate Acquired Fund Fees and Expenses, if any, attributable to investments by the Fund in other series of iShares Trust and the Company through August 31, 2027. The contractual waiver may be terminated prior to August 31, 2027 only upon written agreement of the Company and BFA.
You may pay other fees, such as brokerage commissions and other fees to financial intermediaries, which are not reflected in the tables and examples below.
| | ||||||
| Management Fees |
Distribution and Service (12b-1) Fees |
Other Expenses 2 |
Acquired Fund Fees and Expenses2 |
Total Annual Fund Operating Expenses |
Fee Waiver2 |
Total Annual Fund Operating Expenses After Fee Waiver |
| |
|
|
|
|
( |
|
1
2
S-1
| 1 Year |
3 Years |
5 Years |
10 Years |
| $ |
$ |
$ |
$ |
Principal Investment Strategies
The Fund seeks to track the investment results of the Dow Jones Emerging Markets Select Dividend Index (the “Underlying Index”), which is provided by S&P Dow Jones Indices LLC (the “Index Provider” or “SPDJI”). The Underlying Index measures the performance of 100 leading dividend-paying emerging market companies, selected according to indicated annual dividend (“IAD”) yield, subject to screening and buffering criteria and weighting constraints. IAD yield is defined as a stock’s IAD (not including any special dividends) divided by its price. The starting universe for the Underlying Index is the S&P Emerging BMI, excluding real estate investment trusts. To be eligible for the Underlying Index, issuers must have paid dividends
in each of the previous three years, and their securities must have (i) a non-negative trailing 12-month earnings per share; (ii) an IAD yield greater than 0%; (iii) a float-adjusted market capitalization of at least $250 million; and (iv) a three-month average daily trading value of at least $3 million for new constituents, or at least $1.5 million for current constituents.
Eligible securities are ranked by IAD yield, and the top 100 stocks are selected as index constituents. No more than 30 stocks can be selected from any single country, subject to certain buffers. The Underlying Index is reconstituted annually with constituent weights determined based on tilted IAD yield, which is calculated by multiplying the constituent’s IAD yield (capped at 15%) by the square root of its fair market capitalization. The capping methodology also limits the weight of individual securities to 10%, the aggregate weight of constituents within each country of domicile to 25%, and the aggregate weight of constituents within each Global Industry Classification Standard sector to 30%. The Underlying Index is reviewed daily based on each constituent’s weight. Daily capping is performed if the aggregate weight of constituents with an individual weight greater than 4.8% exceeds 24% of the Underlying Index’s total weight. If that threshold is breached, the current constituent weights are recapped, with weights of
S-2
individual securities capped at 10% and the aggregate weight of stocks with an individual weight greater than 4.5% capped at 22.5% of the Underlying Index’s total weight. IAD yields and tilted yield weights are not recalculated if the capping thresholds are breached throughout the year. A freeze period on the daily capping is implemented during the annual index reconstitution. As of January 22, 2024, the Underlying Index consisted of issuers in the following countries: Brazil, Chile, China, Colombia, Czech Republic, Greece, India, Indonesia, Malaysia, the Philippines, Qatar, South Africa, Taiwan, Thailand and the United Arab Emirates. The Underlying Index includes large-, mid‑ and small-capitalization companies and may change over time. As of January 22, 2024, a significant portion of the Underlying Index is represented by securities of companies in the energy, financials, and materials industries or sectors. The components of the Underlying Index are likely to change over time.
BFA uses an indexing approach to try to achieve the Fund’s investment objective. Unlike many investment companies, the Fund does not try to “beat” the index it tracks and does not seek temporary defensive positions when markets decline or appear overvalued.
Indexing may eliminate the chance that the Fund will substantially outperform the Underlying Index but also may reduce some of the risks of active management, such as poor security selection. Indexing seeks to achieve lower costs and better after-tax performance by aiming to keep portfolio turnover low in comparison to actively managed investment companies.
BFA uses a representative sampling indexing strategy to manage the Fund. “Representative sampling” is an indexing strategy that involves investing in a representative sample of securities
that collectively has an investment profile similar to that of an applicable underlying index. The securities selected are expected to have, in the aggregate, investment characteristics (based on factors such as market capitalization and industry weightings), fundamental characteristics (such as return variability and yield) and liquidity measures similar to those of an applicable underlying index. The Fund may or may not hold all of the securities in the Underlying Index.
The Fund generally will invest at least 80% of its assets in the component securities of its Underlying Index and in investments that have economic characteristics that are substantially identical to the component securities of its Underlying Index (i.e., depositary receipts representing securities of the Underlying Index) and may invest up to 20% of its assets in certain futures, options and swap contracts, cash and cash equivalents, including shares of money market funds advised by BFA or its affiliates, as well as in securities not included in the Underlying Index, but which BFA believes will help the Fund track the Underlying Index. Cash and cash equivalent investments associated with a derivative position will be treated as part of that position for the purposes of calculating the percentage of investments included in the Underlying Index. The Fund seeks to track the investment results of the Underlying Index before fees and expenses of the Fund.
The Fund may lend securities representing up to one-third of the value of the Fund's total assets (including the value of any collateral received).
The Underlying Index is sponsored by S&P Dow Jones Indices LLC (the “Index Provider” or “SPDJI”), which is independent of the Fund and BFA. The Index Provider determines the composition and relative weightings of the securities in the Underlying Index
S-3
and publishes information regarding the market value of the Underlying Index.
Industry Concentration Policy. The Fund will concentrate its investments (i.e., hold 25% or more of its total assets) in a particular industry or group of industries to approximately the same extent that the Underlying Index is concentrated. For purposes of this limitation, securities of the U.S. government (including its agencies and instrumentalities) and repurchase agreements collateralized by U.S. government securities are not considered to be issued by members of any industry.
Summary of Principal Risks
Asset Class Risk. Securities and other assets in the Underlying Index or in the Fund's portfolio may underperform in comparison to the general financial markets, a particular financial market or other asset classes.
Authorized Participant Concentration Risk. Only an Authorized Participant (as defined in the Creations and Redemptions section of the Prospectus) may engage in creation or redemption transactions directly with the Fund, and none of those Authorized Participants is obligated to engage in creation and/or redemption transactions. The Fund has a limited number of institutions that may act as Authorized Participants on an agency basis (i.e., on behalf of other market participants). To the extent that
Authorized Participants exit the business or are unable to proceed with creation or redemption orders with respect to the Fund and no other Authorized Participant is able to step forward to create or redeem, Fund shares may be more likely to trade at a premium or discount to NAV and possibly face trading halts or delisting. Authorized Participant concentration risk may be heightened for exchange-traded funds (“ETFs”), such as the Fund, that invest in securities issued by non-U.S. issuers or other securities or instruments that have lower trading volumes.
Calculation Methodology Risk. The Index Provider relies on various sources of information to assess the criteria of components of the Underlying Index, including information that may be based on assumptions and estimates. Neither the Fund nor BFA can offer assurances that the Index Provider’s calculation methodology or sources of information will provide an accurate assessment of included components.
Concentration Risk. The Fund may be susceptible to an increased risk of loss, including losses due to adverse events that affect the Fund’s investments more than the market as a whole, to the extent that the Fund's investments are concentrated in the securities and/or other assets of a particular issuer or issuers, country, group of countries, region, market, industry, group of industries, sector, market segment or asset class.
Currency Risk. Because the Fund's NAV is determined in U.S. dollars, the Fund's NAV could decline if the currency of a non-U.S. market in which the Fund invests depreciates against the U.S. dollar or if there are delays or limits on repatriation of such currency. Currency exchange rates can be very volatile and can change quickly and unpredictably. As a result, the Fund's NAV may change quickly and without warning.
S-4
Custody Risk. Less developed securities markets are more likely to experience problems with the clearing and settling of trades, as well as the holding of securities by local banks, agents and depositories.
Cybersecurity Risk. Failures or breaches of the electronic systems of the Fund, the Fund's adviser, distributor, the Index Provider and other service providers, market makers, Authorized Participants or the issuers of securities in which the Fund invests have the ability to cause disruptions, negatively impact the Fund’s business operations and/or potentially result in financial losses to the Fund and its shareholders. While the Fund has established business continuity plans and risk management systems seeking to address system breaches or failures, there are inherent limitations in such plans and systems. Furthermore, the Fund cannot control the cybersecurity plans and systems of the Fund’s Index Provider and other service providers, market makers, Authorized Participants or issuers of securities in which the Fund invests.
Dividend-Paying Stock Risk. Investing in dividend-paying stocks involves the risk that such stocks may fall out of favor with investors and underperform the broader market. Companies that issue dividend-paying stocks are not required to pay or continue paying dividends on such stocks. It is possible that issuers of the stocks held by the Fund will not declare dividends in the future or will reduce or eliminate the payment of dividends (including reducing or eliminating anticipated accelerations or increases in the payment of dividends) in the future.
Energy Sector Risk. The market value of securities in the energy sector may decline for many reasons, including, among others, changes in energy prices, energy supply and demand, government regulations, costs related to exploration and production and energy conservation
efforts. Companies in the energy sector may also be significantly impacted by natural disasters, social and political unrest, war and environmental damage and may also be at risk for increased litigation and negative publicity or public perception. The energy sector may experience significant market volatility (e.g., as a result of Russia’s invasion of Ukraine in February 2022 and the resulting sanctions on Russia and other responses by the U.S. and other actors).
Equity Securities Risk. Equity securities are subject to changes in value, and their values may be more volatile than those of other asset classes. The Underlying Index is composed of common stocks, which generally subject their holders to more risks than preferred stocks and debt securities because common stockholders’ claims are subordinated to those of holders of preferred stocks and debt securities upon the bankruptcy of the issuer.
Financials Sector Risk. The performance of companies in the financials sector may be adversely impacted by many factors, including, among others, changes in government regulations, economic conditions, and interest rates, credit rating downgrades, adverse public perception, exposure concentration and decreased liquidity in credit markets. The impact of changes in regulation of any individual financial company, or of the financials sector as a whole, cannot be predicted. Cybersecurity incidents and technology malfunctions and failures have become increasingly frequent and have caused significant losses to companies in this sector, which may negatively impact the Fund.
Geographic Risk. A natural disaster could occur in a geographic region in which the Fund invests, which could adversely affect the economy or the business operations of companies in the specific geographic region, causing an
S-5
adverse impact on the Fund's investments in, or which are exposed to, the affected region.
Index-Related Risk. There is no guarantee that the Fund’s investment results will have a high degree of correlation to those of the Underlying Index or that the Fund will achieve its investment objective. Market disruptions and regulatory restrictions could have an adverse effect on the Fund’s ability to adjust its exposure to the required levels in order to track the Underlying Index. Errors in index data, index computations or the construction of the Underlying Index in accordance with its methodology may occur from time to time and may not be identified and corrected by the Index Provider for a period of time or at all, which may have an adverse impact on the Fund and its shareholders. Unusual market conditions or other unforeseen circumstances (such as natural disasters, political unrest or war) may impact the Index Provider or a third-party data provider, and could cause the Index Provider to postpone a scheduled rebalance. This could cause the Underlying Index to vary from its normal or expected composition.
Indexing Investment Risk. The Fund is not actively managed, and BFA generally does not attempt to take defensive positions under any market conditions, including declining markets.
Infectious Illness Risk. A widespread outbreak of an infectious illness, such as the COVID-19 pandemic, may result in travel restrictions, disruption of healthcare services, prolonged quarantines, cancellations, supply chain disruptions, business closures, lower consumer demand, layoffs, ratings downgrades, defaults and other significant economic, social and political impacts. Markets may experience temporary closures, extreme volatility, severe losses, reduced liquidity and increased trading costs. Such events
may adversely affect the Fund and its investments and may impact the Fund’s ability to purchase or sell securities or cause elevated tracking error and increased premiums or discounts to the Fund's NAV. Despite the development of vaccines, the duration of the COVID-19 pandemic and its effects cannot be predicted with certainty.
Issuer Risk. The performance of the Fund depends on the performance of individual securities to which the Fund has exposure. Changes in the financial condition or credit rating of an issuer of those securities may cause the value of the securities to decline. There is no guarantee that an issuer that paid dividends in the past will continue to do so in the future or will continue paying dividends at the same level.
Large-Capitalization Companies Risk. Large-capitalization companies may be less able than smaller capitalization companies to adapt to changing market conditions. Large-capitalization companies may be more mature and subject to more limited growth potential compared with smaller capitalization companies. During different market cycles, the performance of large-capitalization companies has trailed the overall performance of the broader securities markets.
Large Shareholder and Large-Scale Redemption Risk. Certain shareholders, including an Authorized Participant, a third-party investor, the Fund’s adviser or an affiliate of the Fund’s adviser, a market maker, or another entity, may from time to time own or manage a substantial amount of Fund shares, or may invest in the Fund and hold their investment for a limited period of time. There can be no assurance that any large shareholder or large group of shareholders would not redeem their investment. Redemptions of a large number of Fund shares could require the Fund to dispose of assets to meet the redemption requests, which
S-6
can accelerate the realization of taxable income and/or capital gains and cause the Fund to make taxable distributions to its shareholders earlier than the Fund otherwise would have. In addition, under certain circumstances, non-redeeming shareholders may be treated as receiving a disproportionately large taxable distribution during or with respect to such year. In some circumstances, the Fund may hold a relatively large proportion of its assets in cash in anticipation of large redemptions, diluting its investment returns. These large redemptions may also force the Fund to sell portfolio securities when it might not otherwise do so, which may negatively impact the Fund’s NAV, increase the Fund’s brokerage costs and/or have a material effect on the market price of the Fund shares.
Management Risk. As the Fund will not fully replicate the Underlying Index, it is subject to the risk that BFA's investment strategy may not produce the intended results.
Market Risk. The Fund could lose money over short periods due to short-term market movements and over longer periods during more prolonged market downturns. Local, regional or global events such as war, acts of terrorism, public health issues, recessions, the prospect or occurrence of a sovereign default or other financial crisis, or other events could have a significant impact on the Fund and its investments and could result in increased premiums or discounts to the Fund’s NAV.
Market Trading Risk. The Fund faces numerous market trading risks, including the potential lack of an active market for Fund shares, losses from trading in secondary markets, periods of high volatility and disruptions in the creation/redemption process. ANY OF THESE FACTORS, AMONG OTHERS, MAY LEAD TO THE FUND'S SHARES
TRADING AT A PREMIUM OR DISCOUNT TO NAV.
Materials Sector Risk. Companies in the materials sector may be adversely impacted by the volatility of commodity prices, changes in exchange rates, social and political unrest, war, depletion of resources, decreases in demand, over-production, litigation and changes in government regulations, among other factors.
Mid-Capitalization Companies Risk. Compared to large-capitalization companies, mid-capitalization companies may be less stable and more susceptible to adverse developments. In addition, the securities of mid-capitalization companies may be more volatile and less liquid than those of large-capitalization companies.
National Closed Market Trading Risk. To the extent that the underlying securities or other instruments held by the Fund trade on foreign exchanges or in foreign markets that may be closed when the securities exchange on which the Fund’s shares trade is open, there are likely to be deviations between the current price of such an underlying security and the last quoted price for the underlying security (i.e., the Fund’s quote from the closed foreign market). The impact of a closed foreign market on the Fund is likely to be greater where a large portion of the Fund’s underlying securities or other instruments trade on that closed foreign market or when the foreign market is closed for unscheduled reasons. These deviations could result in premiums or discounts to the Fund’s NAV that may be greater than those experienced by other ETFs.
Non-U.S. Securities Risk. Investments in the securities of non-U.S. issuers are subject to the risks associated with investing in those non-U.S. markets, such as heightened risks of inflation or nationalization. The Fund may lose money due to political, economic and
S-7
geographic events affecting issuers of non-U.S. securities or non-U.S. markets. In addition, non-U.S. securities markets may trade a small number of securities and may be unable to respond effectively to changes in trading volume, potentially making prompt liquidation of holdings difficult or impossible at times. The Fund is specifically exposed to Asian Economic Risk and Central and South American Economic Risk.
Operational Risk. The Fund is exposed to operational risks arising from a number of factors, including, but not limited to, human error, processing and communication errors, errors of the Fund’s service providers, counterparties or other third parties, failed or inadequate processes and technology or systems failures. The Fund and BFA seek to reduce these operational risks through controls and procedures. However, these measures do not address every possible risk and may be inadequate to address significant operational risks.
Privatization Risk. Some countries in which the Fund invests have privatized, or have begun the process of privatizing, certain entities and industries. Privatized entities may lose money or be re-nationalized.
Reliance on Trading Partners Risk. The Fund invests in countries or regions whose economies are heavily dependent upon trading with key partners. Any reduction in this trading may have an adverse impact on the Fund's investments. Through its holdings of securities of certain issuers, the Fund is specifically exposed to Asian Economic Risk and U.S. Economic Risk.
Risk of Investing in Brazil. Investment in Brazilian issuers involves risks that are specific to Brazil, including legal, regulatory, political, currency and economic risks. The Brazilian economy has historically been exposed to high rates of inflation and a high level of
debt, each of which may reduce and/or prevent economic growth.
Risk of Investing in Emerging Markets. Investments in emerging market issuers may be subject to a greater risk of loss than investments in issuers located or operating in more developed markets. Emerging markets may be more likely to experience inflation, social instability, political turmoil or rapid changes in economic conditions than more developed markets. Companies in many emerging markets are not subject to the same degree of regulatory requirements, accounting standards or auditor oversight as companies in more developed countries, and as a result, information about the securities in which the Fund invests may be less reliable or complete. Emerging markets often have less reliable securities valuations and greater risk associated with custody of securities than developed markets. There may be significant obstacles to obtaining information necessary for investigations into or litigation against companies and shareholders may have limited legal remedies. The Fund is not actively managed and does not select investments based on investor protection considerations.
Risk of Investing in Russia. Investing in Russian securities involves significant risks, including legal, regulatory, currency and economic risks that are specific to Russia. In addition, investing in Russian securities involves risks associated with the settlement of portfolio transactions and loss of the Fund’s ownership rights in its portfolio securities as a result of the system of share registration and custody in Russia. Governments in the U.S. and many other countries have imposed economic sanctions on certain Russian individuals and Russian corporate and banking entities. A number of jurisdictions may also institute broader
S-8
sanctions on Russia. Russia has issued a number of countersanctions, some of which restrict the distribution of profits by limited liability companies (e.g., dividends), and prohibit Russian persons from entering into transactions with designated persons from “unfriendly states” as well as the export of raw materials or other products from Russia to certain sanctioned persons. Russia launched a large-scale invasion of Ukraine on February 24, 2022. The extent and duration of the military action, resulting sanctions and resulting future market disruptions, including declines in its stock markets and the value of the ruble against the U.S. dollar, are impossible to predict, but could be significant. Disruptions caused by Russian military action or other actions (including cyberattacks and espionage) or resulting actual and threatened responses to such activity, including purchasing and financing restrictions, boycotts or changes in consumer or purchaser preferences, sanctions, import and export restrictions, tariffs or cyberattacks on the Russian government, Russian companies, or Russian individuals, including politicians, may impact Russia’s economy and Russian companies in which the Fund invests. Actual and threatened responses to Russian military action may also impact the markets for certain Russian commodities, such as oil and natural gas, as well as other sectors of the Russian economy, and are likely to have collateral impacts on such sectors globally. Russian companies may be unable to pay dividends and, if they pay dividends, the Fund may be unable to receive them. As a result of sanctions, the Fund is currently restricted from trading in Russian securities, including those in its portfolio, while the Underlying Index has removed Russian securities. It is unknown when, or if, sanctions may be lifted or the Fund’s
ability to trade in Russian securities will resume.
Risk of Investing in Saudi Arabia. The ability of foreign investors (such as the Fund) to invest in the securities of Saudi Arabian issuers is relatively new. Such ability could be restricted by the Saudi Arabian government at any time, and unforeseen risks could materialize with respect to foreign ownership in such securities. The economy of Saudi Arabia is dominated by petroleum exports. A sustained decrease in petroleum prices could have a negative impact on all aspects of the economy. Investments in the securities of Saudi Arabian issuers involve risks not typically associated with investments in securities of issuers in more developed countries that may negatively affect the value of the Fund’s investments. Such heightened risks may include, among others, expropriation and/or nationalization of assets, restrictions on and government intervention in international trade, confiscatory taxation, political instability, including authoritarian and/or military involvement in governmental decision making, armed conflict, crime and instability as a result of religious, ethnic and/or socioeconomic unrest. There remains the possibility that instability in the larger Middle East region could adversely impact the economy of Saudi Arabia, and there is no assurance of political stability in Saudi Arabia.
Saudi Arabia Broker Risk. There are a number of different ways of conducting transactions in equity securities in the Saudi Arabian market. The Fund generally expects to conduct its transactions in a manner in which the Fund would not be limited by Saudi Arabian regulations to a single broker. However, there may be a limited number of brokers who can provide services to the Fund, which may have an adverse impact on the prices, quantity or timing of Fund transactions.
S-9
Securities Lending Risk. The Fund may engage in securities lending. Securities lending involves the risk that the Fund may lose money because the borrower of the loaned securities fails to return the securities in a timely manner or at all. The Fund could also lose money in the event of a decline in the value of collateral provided for loaned securities or a decline in the value of any investments made with cash collateral. These events could also trigger adverse tax consequences for the Fund.
Security Risk. Some countries and regions in which the Fund invests have experienced security concerns, such as war, terrorism and strained international relations. Incidents involving a country's or region's security may cause uncertainty in its markets and may adversely affect its economy and the Fund's investments.
Tracking Error Risk. The Fund may be subject to “tracking error,” which is the divergence of the Fund’s performance from that of the Underlying Index. Tracking error may occur because of differences between the securities and other instruments held in the Fund’s portfolio and those included in the Underlying Index, pricing differences (including, as applicable, differences between a security’s price at the local market close and the Fund's valuation of a security at the time of calculation of the Fund's NAV), transaction costs incurred by the Fund, the Fund’s holding of uninvested cash, differences in timing of the accrual or the valuation of dividends or interest received by the Fund or distributions paid to the Fund’s shareholders, the requirements to maintain pass-through tax treatment, portfolio transactions carried out to minimize the distribution of capital gains to shareholders,
acceptance of custom baskets, changes to the Underlying Index or the costs to the Fund of complying with various new or existing regulatory requirements, among other reasons. This risk may be heightened during times of increased market volatility or other unusual market conditions. Tracking error also may result because the Fund incurs fees and expenses, while the Underlying Index does not. Tracking error may occur due to differences between the methodologies used in calculating the value of the Underlying Index and determining the Fund’s NAV. BFA EXPECTS THAT THE FUND WILL EXPERIENCE HIGHER TRACKING ERROR THAN IS TYPICAL FOR SIMILAR INDEX ETFs.
Valuation Risk. The price the Fund could receive upon the sale of a security or other asset may differ from the Fund's valuation of the
security or other asset and from the value used by the Underlying Index, particularly for securities or other assets that trade in low volume or volatile markets or that are valued using a fair value methodology as a result of trade suspensions or for other reasons. In addition, the value of the securities or other assets in the Fund's portfolio may change on days or during time periods when shareholders will not be able to purchase or sell the Fund's shares. Authorized Participants who purchase or redeem Fund shares on days when the Fund is holding fair-valued securities may receive fewer or more shares, or lower or higher redemption proceeds, than they would have received had the securities not been fair valued or been valued using a different methodology. The ability to value investments may be impacted by technological issues or errors by pricing services or other third-party service providers.
security or other asset and from the value used by the Underlying Index, particularly for securities or other assets that trade in low volume or volatile markets or that are valued using a fair value methodology as a result of trade suspensions or for other reasons. In addition, the value of the securities or other assets in the Fund's portfolio may change on days or during time periods when shareholders will not be able to purchase or sell the Fund's shares. Authorized Participants who purchase or redeem Fund shares on days when the Fund is holding fair-valued securities may receive fewer or more shares, or lower or higher redemption proceeds, than they would have received had the securities not been fair valued or been valued using a different methodology. The ability to value investments may be impacted by technological issues or errors by pricing services or other third-party service providers.
S-10
Performance Information
Year by Year Returns1 (Years Ended December 31)

1
The best calendar quarter return during the periods shown above was 25.53 % in the 4th quarter of 2020 ; the worst was -28.85 % in the 1st quarter of 2020 .
Updated performance information, including the Fund’s current NAV, may be obtained by visiting our website at www.iShares.com or by calling 1-800-iShares (1-800-474-2737) (toll free) .
S-11
Average Annual Total Returns
(for the periods ended December 31, 2022)
(for the periods ended December 31, 2022)
| |
One Year |
Five Years |
Ten Years |
| (Inception Date: |
|
|
|
| Return Before Taxes |
- |
- |
- |
| Return After Taxes on Distributions1 |
- |
- |
- |
| Return After Taxes on Distributions and Sale of Fund Shares1 |
- |
- |
- |
| Dow Jones Emerging Markets Select Dividend Index (Index returns do not reflect deductions for fees, expenses, or taxes) |
- |
- |
- |
1
S-12
Management
Investment Adviser. BlackRock Fund Advisors.
Portfolio Managers. Jennifer Hsui, Greg Savage and Paul Whitehead (the “Portfolio Managers”) are primarily responsible for the day-to-day management of the Fund. Each Portfolio Manager supervises a portfolio management team. Ms. Hsui, Mr. Savage and Mr. Whitehead have been Portfolio Managers of the Fund since 2012, 2012 and 2022, respectively.
Purchase and Sale of Fund Shares
The Fund is an ETF. Individual shares of the Fund may only be bought and sold in the secondary market through a broker-dealer. Because ETF shares trade at market prices rather than at NAV, shares may trade at a price greater than NAV (a premium) or less than NAV (a discount). An investor may incur costs attributable to the difference between the highest price a buyer is willing to pay to purchase shares of the Fund (bid) and the lowest price a seller is willing to accept for shares of the Fund (ask) when buying or selling shares in the secondary market (the “bid-ask spread”).
Tax Information
The Fund intends to make distributions that may be taxable to you as ordinary income or capital gains, unless you are investing through a tax-deferred arrangement such as a 401(k) plan or an IRA, in which case, your distributions generally will be taxed when withdrawn.
Payments to Broker-Dealers and Other Financial Intermediaries
If you purchase shares of the Fund through a broker-dealer or other financial intermediary (such as a bank), BFA or other related companies may pay the intermediary for marketing activities and presentations, educational training programs, conferences, the development of technology platforms and reporting systems or other services related to the sale or promotion of the Fund. These payments may create a conflict of interest by influencing the broker-dealer or other intermediary and your salesperson to recommend the Fund over another investment. Ask your salesperson or visit your financial intermediary’s website for more information.
S-13
More Information About the Fund
This Prospectus contains important information about investing in the Fund. Please read this Prospectus carefully before you make any investment decisions. Additional information regarding the Fund is available at www.iShares.com.
BFA is the investment adviser to the Fund. Shares of the Fund are listed for trading on NYSE Arca, Inc. (“NYSE Arca”). The market price for a share of the Fund may be different from the Fund’s most recent NAV.
ETFs are funds that trade like other publicly traded securities. The Fund is designed to track an index. Similar to shares of an index mutual fund, each share of the Fund represents an ownership interest in an underlying portfolio of securities and other instruments intended to track a market index. Unlike shares of a mutual fund, which can be bought and redeemed from the issuing fund by all shareholders at a price based on NAV, shares of the Fund may be purchased or redeemed directly from the Fund at NAV solely by Authorized Participants and only in aggregations of a specified number of shares (“Creation Units”). Also unlike shares of a mutual fund, shares of the Fund are listed on a national securities exchange and trade in the secondary market at market prices that change throughout the day.
The Fund invests in a particular segment of the securities markets and seeks to track the performance of a securities index that is not representative of the market as a whole. The Fund is designed to be used as part of broader asset allocation strategies. Accordingly, an investment in the Fund should not constitute a complete investment program.
An index is a financial calculation, based on a grouping of financial instruments, and is not an investment product, while the Fund is an actual investment portfolio. The performance of the Fund and the Underlying Index may vary for a number of reasons, including transaction costs, non-U.S. currency valuations, asset valuations, corporate actions (such as mergers and spin-offs), timing variances and differences between the Fund’s portfolio and the Underlying Index resulting from the Fund's use of representative sampling or from legal restrictions (such as diversification requirements) that apply to the Fund but not to the Underlying Index. From time to time, the Index Provider may make changes to the methodology or other adjustments to the Underlying Index. Unless otherwise determined by BFA, any such change or adjustment will be reflected in the calculation of the Underlying Index performance on a going-forward basis after the effective date of such change or adjustment. Therefore, the Underlying Index performance shown for periods prior to the effective date of any such change or adjustment will generally not be recalculated or restated to reflect such change or adjustment.
Because the Fund uses a representative sampling indexing strategy, it can be expected to have a larger tracking error than if it used a replication indexing strategy. “Replication” is an indexing strategy in which a fund invests in substantially all of the securities in its underlying index in approximately the same proportions as in the underlying index.
1
The Fund may borrow as a temporary measure for extraordinary or emergency purposes, including to meet redemptions or to facilitate the settlement of securities or other transactions. The Fund does not intend to borrow money in order to leverage its portfolio.
An investment in the Fund is not a bank deposit and it is not insured or guaranteed by the Federal Deposit Insurance Corporation or any other government agency, BFA or any of its affiliates.
The Fund's investment objective and the Underlying Index may be changed without shareholder approval.
A Further Discussion of Principal Risks
The Fund is subject to various risks, including the principal risks noted below, any of which may adversely affect the Fund’s NAV, trading price, yield, total return and ability to meet its investment objective. You could lose all or part of your investment in the Fund, and the Fund could underperform other investments. The order of the below risk factors does not indicate the significance of any particular risk factor. The Fund discloses its portfolio holdings daily at www.iShares.com.
Asian Economic Risk. Many Asian economies have experienced rapid growth and industrialization in recent years, but there is no assurance that this growth rate will be maintained. Other Asian economies, however, have experienced high inflation, high unemployment, currency devaluations and restrictions, and over-extension of credit. Geopolitical hostility, political instability, and economic or environmental events in any one Asian country may have a significant economic effect on the entire Asian region, as well as on major trading partners outside Asia. Any adverse event in the Asian markets may have a significant adverse effect on some or all of the economies of the countries in which the Fund invests. In particular, China is a key trading partner of many Asian countries and any changes in trading relationships between China and other Asian countries may affect the region as a whole. Many Asian countries are subject to political risk, including political instability, corruption and regional conflict with neighboring countries. North Korea and South Korea each have substantial military capabilities, and historical tensions between the two countries present the risk of war. Escalated tensions involving the two countries and any outbreak of hostilities between the two countries, or even the threat of an outbreak of hostilities, could have a severe adverse effect on the entire Asian region. Certain Asian countries have developed increasingly strained relationships with the U.S. or with China, and if these relations were to worsen, they could adversely affect Asian issuers that rely on the U.S. or China for trade. In addition, many Asian countries are subject to social and labor risks associated with demands for improved political, economic and social conditions. These risks, among others, may adversely affect the value of the Fund's investments.
Asset Class Risk. The securities and other assets in the Underlying Index or in the Fund’s portfolio may underperform in comparison to other securities or indexes that track other countries, groups of countries, regions, industries, groups of industries, markets, market segments, asset classes or sectors. Various types of securities, currencies and indexes may experience cycles of outperformance and underperformance in comparison to the general financial markets depending upon a number of factors including, among other things, inflation, interest rates, productivity, global demand for local products or resources, and regulation and governmental controls. This may cause the Fund to underperform other investment vehicles that invest in different asset classes.
2
Authorized Participant Concentration Risk. Only an Authorized Participant may engage in creation or redemption transactions directly with the Fund, and none of those Authorized Participants is obligated to engage in creation and/or redemption transactions. The Fund has a limited number of institutions that may act as Authorized Participants on an agency basis (i.e., on behalf of other market participants). To the extent that Authorized Participants exit the business or are unable to proceed with creation or redemption orders with respect to the Fund and no other Authorized Participant is able to step forward to create or redeem Creation Units, Fund shares may be more likely to trade at a premium or discount to NAV and possibly face trading halts or delisting. Authorized Participant concentration risk may be heightened because ETFs, such as the Fund, that invest in securities issued by non-U.S. issuers or other securities or instruments that are less widely traded often involve greater settlement and operational issues and capital costs for Authorized Participants, which may limit the availability of Authorized Participants.
Calculation Methodology Risk. The Index Provider relies on various sources of information to assess the criteria of components of the Underlying Index, including information that may be based on assumptions and estimates. Neither the Fund nor BFA can offer assurances that the Index Provider's calculation methodology or sources of information will provide an accurate assessment of included components.
Central and South American Economic Risk. Certain Central and South American countries have experienced high interest rates, economic volatility, high levels of inflation, currency devaluations, regime changes, government defaults and high unemployment rates. Additionally, commodities such as oil and gas, minerals and metals represent a significant percentage of the region’s exports, and the economies of countries in the region are particularly sensitive to fluctuations in commodity prices as a result. The impact of any of the foregoing events in one country could have a significant effect on the entire region.
Concentration Risk. The Fund may be susceptible to an increased risk of loss, including losses due to adverse events that affect the Fund’s investments more than the market as a whole, to the extent that the Fund's investments are concentrated in the securities and/or other assets of a particular issuer or issuers, country, group of countries, region, market, industry, group of industries, project types, group of project types, sector, market segment or asset class. The Fund may be more adversely affected by the underperformance of those securities and/or other assets, may experience increased price volatility and may be more susceptible to adverse economic, market, political or regulatory occurrences affecting those securities and/or other assets than a fund that does not concentrate its investments.
Currency Risk. Because the Fund's NAV is determined on the basis of the U.S. dollar, investors may lose money if the currency of a non-U.S. market in which the Fund invests depreciates against the U.S. dollar or if there are delays or limits on repatriation of such currency, even if such currency value of the Fund's holdings in that market increases. Currency exchange rates can be very volatile and can change quickly and unpredictably. As a result, the Fund’s NAV may change quickly and without warning.
Custody Risk. Custody risk refers to the risks inherent in the process of clearing and settling trades, as well as the holding of securities by local banks, agents and depositories. Low trading volumes and volatile prices in less developed markets may make trades harder to complete and settle, and governments or trade groups may compel local agents to hold securities in designated depositories that may not be
3
subject to independent evaluation. Local agents are held only to the standards of care of their local markets. In general, the less developed a country’s securities markets are, the higher the degree of custody risk.
Cybersecurity Risk. The Fund, Authorized Participants, service providers and the relevant listing exchange are susceptible to operational, information security and related “cyber” risks both directly and through their service providers. Similar types of cybersecurity risks are also present for issuers of securities in which the Fund invests, which could result in material adverse consequences for such issuers and may cause the Fund’s investment in such issuers to lose value. In general, cyber incidents can result from deliberate attacks or unintentional events. Cyber incidents include, but are not limited to, gaining unauthorized access to digital systems (e.g., through “hacking” or malicious software coding) for purposes of misappropriating assets or sensitive information, corrupting data, or causing operational disruption. Cyberattacks may also be carried out in a manner that does not require gaining unauthorized access, such as causing denial-of-service attacks on websites (i.e., efforts to make network services unavailable to intended users). Geopolitical tensions may increase the scale and sophistication of deliberate attacks, particularly those from nation-states or from entities with nation-state backing.
Cybersecurity failures by, or breaches of, the systems of the Fund's adviser, distributor and other service providers (including, but not limited to, index and benchmark providers, fund accountants, custodians, transfer agents and administrators), market makers, Authorized Participants or the issuers of securities in which the Fund invests have the ability to cause disruptions and impact business operations, potentially resulting in: financial losses, interference with the Fund’s ability to calculate its NAV, disclosure of confidential trading information, impediments to trading, submission of erroneous trades or erroneous creation or redemption orders, the inability of the Fund or its service providers to transact business, violations of applicable privacy and other laws, regulatory fines, penalties, reputational damage, reimbursement or other compensation costs, or additional compliance costs. In addition, cyberattacks may render records of Fund assets and transactions, shareholder ownership of Fund shares, and other data integral to the functioning of the Fund inaccessible, inaccurate or incomplete. Substantial costs may be incurred by the Fund in order to resolve or prevent cyber incidents. While the Fund has established business continuity plans in the event of, and risk management systems to prevent, such cyber incidents, there are inherent limitations in such plans and systems, including the possibility that certain risks have not been identified, that prevention and remediation efforts will not be successful or that cyberattacks will go undetected. Furthermore, the Fund cannot control the cybersecurity plans and systems put in place by service providers to the Fund, issuers in which the Fund invests, the Index Provider, market makers or Authorized Participants. The Fund and its shareholders could be negatively impacted as a result.
Dividend-Paying Stock Risk. Investing in dividend-paying stocks involves the risk that such stocks may fall out of favor with investors and underperform the broader market. Companies that issue dividend-paying stocks are not required to pay or continue paying dividends on such stocks. It is possible that issuers of the stocks held by the Fund will not declare dividends in the future or will reduce or eliminate the payment of dividends (including reducing or eliminating anticipated accelerations or increases in the payment of dividends) in the future.
Equity Securities Risk. The Fund invests in equity securities, which are subject to changes in value that may be attributable to market perception of a particular issuer or
4
to general stock market fluctuations that affect all issuers. Investments in equity securities may be more volatile than investments in other asset classes. The Underlying Index is composed of common stocks, which generally subject their holders to more risks than preferred stocks and debt securities because common stockholders' claims are subordinated to those of holders of preferred stocks and debt securities upon the bankruptcy of the issuer.
Energy Sector Risk. The market value of securities issued by companies in the energy sector may decline for the following reasons, among others: changes in and volatility of global energy prices, energy supply and demand, and spending on exploration and production of energy sources; exchange rates, interest rates, economic conditions, and tax treatment; changes in the actual or perceived availability of oil or other resource deposits; the enactment or cessation of trade sanctions or import controls; war or other geopolitical conflicts; negative perception; increased litigation; energy conservation efforts; energy infrastructure developments or service failures; and increased competition and technological advances. Companies in this sector may be subject to substantial government regulation and contractual fixed pricing, which may increase the cost of doing business and limit the earnings of these companies. A significant portion of the revenues of these companies may depend on a relatively small number of customers, including governmental entities and utilities. As a result, governmental budget constraints may have a material adverse effect on the stock prices of companies in this sector.
Energy companies may also operate in, or engage in transactions involving, countries that have less developed regulatory regimes or a history of expropriation, confiscation of assets, foreign investment restrictions, nationalization or other adverse policies or that are at greater risk of political and social unrest, coups or labor disruptions. Energy companies also face a significant risk of liability from accidents resulting in injury or loss of life or property, pollution or other environmental problems, equipment malfunctions or mishandling of materials and a risk of loss from terrorism, cyber incident, political strife or natural disasters. Any such event could have serious consequences for the general population of the affected area and could have an adverse impact on the Fund’s portfolio and the performance of the Fund. Energy companies may have relatively high levels of debt and may be more likely than other companies to restructure their businesses if there are downturns in energy markets or in the global economy. Energy production companies, especially those for oil and gas, may also have to contend with service disruptions, pipeline and equipment leaks and ruptures, explosions, fires, unscheduled downtime, transportation interruptions, discharges or releases of toxic or hazardous gases and other environmental risks.
The energy sector may experience significant market volatility. For example, Russia’s large-scale invasion of Ukraine on February 24, 2022 led to disruptions and increased volatility in the energy and commodity futures markets due to actual and potential disruptions in the supply and demand for certain commodities, including oil and natural gas. The U.S. and other actors have, in response, enacted various sanctions and restrictions on business dealings with Russia, which include restrictions on imports of oil, natural gas and coal. The effect of the current sanctions and restrictions, as well as the extent and duration of the Russian military action, additional sanctions and associated market disruptions on the energy sector, are impossible to predict and depend on a number of factors. The effect of these events or any related developments could be significant and may have a severe adverse effect on the performance of the Fund.
5
Financials Sector Risk. Companies in the financials sector are subject to extensive governmental regulation and intervention, which may adversely affect the scope of their activities, the prices they can charge, the amount of capital and liquid assets they must maintain and, potentially, their size. Governmental regulation may change frequently and may have significant adverse consequences for companies in the financials sector, including effects not intended by such regulation. Increased risk taking by financial companies may also result in greater overall risk in the U.S. and global financials sector. The impact of changes in capital requirements, or recent or future regulation in various countries, on any individual financial company or on the financials sector as a whole cannot be predicted.
Certain risks may impact the value of investments in the financials sector more severely than those of investments outside this sector, including the risks associated with companies that operate with substantial financial leverage. Companies in the financials sector are exposed directly to the credit risk of their borrowers and counterparties, who may be leveraged to an unknown degree, including through swaps and other derivatives products. Financial services companies may have significant exposure to the same borrowers and counterparties, with the result that a borrower’s or counterparty’s inability to meet its obligations to one company may affect other companies with exposure to the same borrower or counterparty. This interconnectedness of risk may result in significant negative impacts to companies with direct exposure to the defaulting counterparty as well as adverse cascading effects in the markets and the financials sector generally. Companies in the financials sector may also be adversely affected by increases in interest rates and loan losses, decreases in the availability of money or asset valuations, credit rating downgrades, adverse public perception and adverse conditions in other related markets. Insurance companies, in particular, may be subject to severe price competition and/or rate regulation, which may have an adverse impact on their profitability. The financials sector is particularly sensitive to fluctuations in interest rates. The financials sector is also a target for cyberattacks. Cybersecurity incidents and technology malfunctions and failures have become increasingly frequent and have caused significant losses to companies in this sector, which may negatively impact the Fund. The extent to which the Fund may invest in a company that engages in securities-related activities or banking is limited by applicable law.
Geographic Risk. Some of the companies in which the Fund invests are located in parts of the world that have historically been prone to natural disasters, such as earthquakes, tornadoes, volcanic eruptions, droughts, floods, hurricanes or tsunamis, and are economically sensitive to environmental events. Any such event may adversely impact the economies of these geographic areas or business operations of companies in these geographic areas, causing an adverse impact on the value of the Fund.
Index-Related Risk. The Fund seeks to achieve a return that corresponds generally to the price and yield performance, before fees and expenses, of the Underlying Index as published by the Index Provider. There is no assurance that the Index Provider or any agents that may act on its behalf will compile the Underlying Index accurately, or that the Underlying Index will be determined, composed or calculated accurately. While the Index Provider provides descriptions of what the Underlying Index is designed to achieve, neither the Index Provider nor its agents provide any warranty or accept any liability in relation to the quality, accuracy or completeness of the Underlying Index or its related data, and they do not guarantee that the Underlying Index will be in line with the Index Provider’s methodology. BFA’s mandate as described in this Prospectus is to manage the Fund consistently with the Underlying Index provided by the Index Provider
6
to BFA. BFA does not provide any warranty or guarantee against the Index Provider’s or any agent’s errors. Errors in respect of the quality, accuracy and completeness of the data used to compile the Underlying Index may occur from time to time and may not be identified and corrected by the Index Provider for a period of time or at all, particularly where the indices are less commonly used as benchmarks by funds or managers. In addition, there may be heightened risks associated with the adequacy and reliability of the information the Index Provider uses given the Fund's exposure to emerging markets, as certain emerging markets may have less information available or less regulatory oversight. Such errors may negatively or positively impact the Fund and its shareholders. For example, during a period where the Underlying Index contains incorrect constituents, the Fund would have market exposure to such constituents and would be underexposed to the Underlying Index’s other constituents. Shareholders should understand that any gains from Index Provider errors will be kept by the Fund and its shareholders and any losses or costs resulting from Index Provider errors will be borne by the Fund and its shareholders.
Unusual market conditions or other unforeseen circumstances (such as natural disasters, political unrest or war) may impact the Index Provider or a third-party data provider, and could cause the Index Provider to postpone a scheduled rebalance to the Underlying Index. This could cause the Underlying Index to vary from its normal or expected composition. The postponement of a scheduled rebalance could mean that constituents of the Underlying Index that would otherwise be removed at rebalance due to changes in market capitalizations, issuer credit ratings, or other reasons may remain, causing the performance and constituents of the Underlying Index to vary from those expected under normal conditions. Apart from scheduled rebalances, the Index Provider or its agents may carry out additional ad hoc rebalances to the Underlying Index due to reaching certain weighting constraints, unusual market conditions or corporate events or, for example, to correct an error in the selection of index constituents. When the Underlying Index is rebalanced and the Fund in turn rebalances its portfolio to attempt to increase the correlation between the Fund’s portfolio and the Underlying Index, any transaction costs and market exposure arising from such portfolio rebalancing will be borne directly by the Fund and its shareholders. Therefore, errors and additional ad hoc rebalances carried out by the Index Provider or its agents to the Underlying Index may increase the costs to and the tracking error risk of the Fund.
Indexing Investment Risk. The Fund is not actively managed and may be affected by a general decline in market segments related to the Underlying Index. The Fund invests in securities included in, or representative of, the Underlying Index, regardless of their investment merits. BFA generally does not attempt to invest the Fund's assets in defensive positions under any market conditions, including declining markets.
Infectious Illness Risk. A widespread outbreak of an infectious illness, such as the COVID-19 pandemic, may adversely affect the economies of many nations and the global economy and may impact individual issuers and capital markets in ways that cannot be foreseen.
An infectious illness outbreak may result in travel restrictions, closed international borders, disruption of healthcare services, prolonged quarantines, cancellations, supply chain disruptions, lower consumer demand, temporary and permanent closures of businesses, layoffs, defaults and other significant economic, social and political impacts, as well as general concern and uncertainty.
7
An infectious illness outbreak may result in extreme volatility, severe losses, credit deterioration of issuers, and disruptions in markets, which could adversely impact the Fund and its investments, including impairing any hedging activity.
Certain local markets may be subject to closures. Any suspension of trading in markets in which the Fund invests will have an impact on the Fund and its investments and will impact the Fund’s ability to purchase or sell securities in such markets. Market or economic disruptions could result in elevated tracking error and increased premiums or discounts to the Fund's NAV. Additionally, an outbreak could impair the operations of the Fund’s service providers, including BFA, which could adversely impact the Fund.
Governmental and quasi-governmental authorities and regulators throughout the world may respond to an outbreak and any resulting economic disruptions with a variety of fiscal and monetary policy changes, including direct capital infusions into companies and other issuers, new monetary policy tools, and changes in interest rates. A reversal of these policies, or the ineffectiveness of such policies, is likely to increase market volatility, which could adversely affect the Fund’s investments.
An outbreak may exacerbate other pre-existing political, social and economic risks in certain countries or globally, which could adversely affect the Fund and its investments and could result in increased premiums or discounts to the Fund's NAV.
Despite the development of vaccines, the duration of the COVID-19 pandemic and its effects cannot be predicted with certainty.
Issuer Risk. The performance of the Fund depends on the performance of individual securities to which the Fund has exposure. Any issuer of these securities may perform poorly, causing the value of its securities to decline. Poor performance may be caused by poor management decisions, competitive pressures, changes in technology, expiration of patent protection, disruptions in supply, labor problems or shortages, corporate restructurings, fraudulent disclosures, credit deterioration of the issuer or other factors. Issuers may, in times of distress or at their own discretion, decide to reduce or eliminate dividends, which may also cause their stock prices to decline. There is no guarantee that an issuer that paid dividends in the past will continue to do so in the future or will continue paying dividends at the same level. An issuer may also be subject to risks associated with the countries, states and regions in which the issuer resides, invests, sells products, or otherwise conducts operations.
Large-Capitalization Companies Risk. Large-capitalization companies may be less able than smaller capitalization companies to adapt to changing market conditions. Large-capitalization companies may be more mature and subject to more limited growth potential compared with smaller capitalization companies. During different market cycles, the performance of large-capitalization companies has trailed the overall performance of the broader securities markets.
Large Shareholder and Large-Scale Redemption Risk. Certain shareholders, including an Authorized Participant, a third-party investor, the Fund’s adviser or an affiliate of the Fund’s adviser, a market maker, or another entity, may from time to time own or manage a substantial amount of Fund shares or may invest in the Fund and hold their investment for a limited period of time. These shareholders may also pledge or loan Fund shares (to secure financing or otherwise), which may result in the shares becoming concentrated in another party. There can be no assurance that any large shareholder or large group of shareholders would not redeem their investment or that the size of the Fund would be maintained. Redemptions of a large number of Fund shares by these shareholders may adversely affect the Fund’s liquidity and net assets.
8
To the extent the Fund permits redemptions in cash, these redemptions may force the Fund to sell portfolio securities when it might not otherwise do so, which may negatively impact the Fund’s NAV, have a material effect on the market price of the Shares and increase the Fund’s brokerage costs and/or accelerate the realization of taxable income and/or gains and cause the Fund to make taxable distributions to its shareholders earlier than the Fund otherwise would have. In addition, under certain circumstances, non-redeeming shareholders may be treated as receiving a disproportionately large taxable distribution during or with respect to such tax year. The Fund also may be required to sell its more liquid Fund investments to meet a large redemption, in which case the Fund’s remaining assets may be less liquid, more volatile, and more difficult to price. To the extent these large shareholders transact in shares on the secondary market, such transactions may account for a large percentage of the trading volume for the shares of the Fund and may, therefore, have a material upward or downward effect on the market price of the Fund shares. In addition, large purchases of Fund shares may adversely affect the Fund’s performance to the extent that the Fund is delayed in investing new cash and is required to maintain a larger cash position than it ordinarily would, diluting its investment returns.
Management Risk. Because BFA uses a representative sampling indexing strategy, the Fund will not fully replicate the Underlying Index and may hold securities not included in the Underlying Index. As a result, the Fund is subject to the risk that BFA’s investment strategy, the implementation of which is subject to a number of constraints, may not produce the intended results.
Market Risk. The Fund could lose money over short periods due to short-term market movements and over longer periods during more prolonged market downturns. The value of a financial instrument or other asset may decline due to changes in general market conditions, economic trends or events that are not specifically related to the particular instrument or asset, or factors that affect one or more issuers, counterparties, exchanges, countries, regions, markets, industries, sectors or asset classes, as applicable. Local, regional or global events such as war, acts of terrorism, public health issues, recessions, the prospect or occurrence of a sovereign default or other financial crisis, or other events could have a significant impact on the Fund and its investments and could result in increased premiums or discounts to the Fund’s NAV. Changes in market and economic conditions generally do not have the same impact on all types of instruments and assets.
Market Trading Risk.
Absence of Active Market. Although shares of the Fund are listed for trading on one or more stock exchanges, there can be no assurance that an active trading market for such shares will develop or be maintained by market makers or Authorized Participants.
Risk of Secondary Listings. The Fund's shares may be listed or traded on U.S. and non-U.S. stock exchanges other than the U.S. stock exchange where the Fund's primary listing is maintained, and may otherwise be made available to non-U.S. investors through funds or structured investment vehicles similar to depositary receipts. There can be no assurance that the Fund’s shares will continue to trade on any such stock exchange or in any market or that the Fund’s shares will continue to meet the requirements for listing or trading on any exchange or in any market. The Fund's shares may be less actively traded in certain markets than in others, and investors are subject to the execution and settlement risks and market standards of the market where they or their broker direct their trades for execution. Certain information available to
9
investors who trade Fund shares on a U.S. stock exchange during regular U.S. market hours may not be available to investors who trade in other markets, which may result in secondary market prices in such markets being less efficient.
Secondary Market Trading Risk. Shares of the Fund may trade in the secondary market at times when the Fund does not accept orders to purchase or redeem shares. At such times, shares may trade in the secondary market with more significant premiums or discounts than might be experienced at times when the Fund accepts purchase and redemption orders.
Secondary market trading in Fund shares may be halted by a stock exchange because of market conditions or for other reasons. In addition, trading in Fund shares on a stock exchange or in any market may be subject to trading halts caused by extraordinary market volatility pursuant to “circuit breaker” rules on the stock exchange or market.
Shares of the Fund, similar to shares of other issuers listed on a stock exchange, may be sold short and are therefore subject to the risk of increased volatility and price decreases associated with being sold short. In addition, trading activity in derivative products based on the Fund may lead to increased trading volume and volatility in the secondary market for the shares of the Fund.
Shares of the Fund May Trade at Prices Other Than NAV. Shares of the Fund trade on stock exchanges at prices at, above or below the Fund’s most recent NAV. The NAV of the Fund is calculated at the end of each business day and fluctuates with changes in the market value of the Fund’s holdings. The trading price of the Fund's shares fluctuates continuously throughout trading hours based on both market supply of and demand for Fund shares and the underlying value of the Fund's portfolio holdings or NAV. As a result, the trading prices of the Fund’s shares may deviate significantly from NAV during periods of market volatility. ANY OF THESE FACTORS, AMONG OTHERS, MAY LEAD TO THE FUND'S SHARES TRADING AT A PREMIUM OR DISCOUNT TO NAV. However, because shares can be created and redeemed in Creation Units at NAV, BFA believes that large discounts or premiums to the NAV of the Fund are not likely to be sustained over the long term (unlike shares of many closed-end funds, which frequently trade at appreciable discounts from, and sometimes at premiums to, their NAVs). While the creation/redemption feature is designed to make it more likely that the Fund’s shares normally will trade on stock exchanges at prices close to the Fund’s next calculated NAV, exchange prices are not expected to correlate exactly with the Fund's NAV due to timing reasons, supply and demand imbalances and other factors. In addition, disruptions to creations and redemptions, including disruptions at market makers, Authorized Participants, or other market participants, and during periods of significant market volatility, may result in trading prices for shares of the Fund that differ significantly from its NAV. Authorized Participants may be less willing to create or redeem Fund shares if there is a lack of an active market for such shares or its underlying investments, which may contribute to the Fund’s shares trading at a premium or discount to NAV.
Costs of Buying or Selling Fund Shares. Buying or selling Fund shares on an exchange involves two types of costs that apply to all securities transactions. When buying or selling shares of the Fund through a broker, you will likely incur a brokerage commission and other charges. In addition, you may incur the cost of the “spread”; that is, the difference between what investors are willing to pay for Fund shares (the “bid” price) and the price at which they are willing to sell Fund shares (the “ask” price). The spread, which varies over time for shares of the Fund based on trading
10
volume and market liquidity, is generally narrower if the Fund has more trading volume and market liquidity and wider if the Fund has less trading volume and market liquidity. In addition, increased market volatility may cause wider spreads. There may also be regulatory and other charges that are incurred as a result of trading activity. Because of the costs inherent in buying or selling Fund shares, frequent trading may detract significantly from investment results and an investment in Fund shares may not be advisable for investors who anticipate regularly making small investments through a brokerage account.
Materials Sector Risk. Companies in the materials sector may be adversely affected by commodity price volatility, exchange rate fluctuations, social and political unrest, war, import or export controls, increased competition, depletion of resources, technical advances, labor relations, over-production, decreases in the demand for materials, litigation and government regulations, among other factors. Companies in the materials sector are also at risk of liability for environmental damage and product liability claims and may incur significant environmental remediation costs in complying with environmental laws. Production of materials may exceed demand as a result of market imbalances or economic downturns, leading to poor investment returns.
Mid-Capitalization Companies Risk. Stock prices of mid-capitalization companies may be more volatile than those of large-capitalization companies and, therefore, the Fund’s share price may be more volatile than those of funds that invest a larger percentage of their assets in stocks issued by large-capitalization companies. Stock prices of mid-capitalization companies are also more vulnerable than those of large-capitalization companies to adverse business or economic developments, and the stocks of mid-capitalization companies may be less liquid than those of large-capitalization companies, making it difficult for the Fund to buy and sell shares of mid-capitalization companies. In addition, mid-capitalization companies generally have less diverse product lines than large-capitalization companies and are more susceptible to adverse developments related to their products.
National Closed Market Trading Risk. To the extent that the underlying securities or other instruments held by the Fund trade on foreign exchanges or in foreign markets that may be closed when the securities exchange on which the Fund’s shares trade is open, there are likely to be deviations between the current price of an underlying security and the last quoted price for the underlying security (i.e., the Fund’s quote from the closed foreign market). The impact of a closed foreign market on the Fund is likely to be greater where a large portion of the Fund’s underlying securities or other instruments trade on that closed foreign market or when the foreign market is closed for unscheduled reasons. These deviations could result in premiums or discounts to the Fund’s NAV that may be greater than those experienced by other ETFs.
Non-U.S. Securities Risk. Investments in the securities of non-U.S. issuers are subject to the risks of investing in the markets where such issuers are located, including heightened risks of inflation, nationalization and market fluctuations caused by economic and political developments. As a result of investing in non-U.S. securities, the Fund may be subject to increased risk of loss caused by any of the factors listed below:
■
Government intervention in issuers' operations or structure;
■
A lack of market liquidity and market efficiency;
■
Greater securities price volatility;
■
Exchange rate fluctuations and exchange controls;
11
■
Less availability of public information about issuers;
■
Limitations on foreign ownership of securities;
■
Imposition of withholding or other taxes;
■
Imposition of restrictions on the expatriation of the funds or other assets of the Fund;
■
Higher transaction and custody costs and delays in settlement procedures;
■
Difficulties in enforcing contractual obligations;
■
Lower levels of regulation of the securities markets;
■
Weaker accounting, disclosure and reporting requirements and the risk of being delisted from U.S. exchanges; and
■
Legal principles relating to corporate governance, directors’ fiduciary duties and liabilities and stockholders’ rights in markets in which the Fund invests may differ from or may not be as extensive or protective as those that apply in the U.S.
Withholding Tax Reclaims Risk. The Fund may file claims to recover withholding tax on dividend and interest income (if any) received from issuers in certain countries where such withholding tax reclaim is possible. Whether or when the Fund will receive a withholding tax refund in the future is within the control of the tax authorities in such countries. Where the Fund expects to recover withholding tax based on a continuous assessment of probability of recovery, the NAV of the Fund generally includes accruals for such tax refunds. The Fund continues to evaluate tax developments for potential impact to the probability of recovery. If the likelihood of receiving refunds materially decreases, for example due to a change in tax regulation or approach, accruals in the Fund’s NAV for such refunds may need to be written down partially or in full, which will adversely affect that Fund’s NAV. Investors in the Fund at the time an accrual is written down will bear the impact of any resulting reduction in NAV regardless of whether they were investors during the accrual period. Conversely, if a Fund receives a tax refund that has not been previously accrued, investors in the Fund at the time the claim is successful will benefit from any resulting increase in the Fund’s NAV. Investors who sold their shares prior to such time will not benefit from such NAV increase.
Operational Risk. The Fund is exposed to operational risks arising from a number of factors, including, but not limited to, human error, processing and communication errors, errors of the Fund's service providers, counterparties or other third parties, failed or inadequate processes and technology or systems failures. The Fund and BFA seek to reduce these operational risks through controls and procedures. However, these measures do not address every possible risk and may be inadequate to address significant operational risks.
Privatization Risk. Some countries in which the Fund invests have privatized, or have begun the process of privatizing, certain entities and industries. Newly privatized companies may face strong competition from government-sponsored competitors that have not been privatized. In some instances, investors in newly privatized entities have suffered losses due to the inability of the newly privatized entities to adjust quickly to a competitive environment or changing regulatory and legal standards or, in some cases, due to re-nationalization of such privatized entities. There is no assurance that similar losses will not recur.
Reliance on Trading Partners Risk. The economies of some countries or regions in which the Fund invests are dependent on trading with certain key trading partners.
12
Reduction in spending on the products and services of these countries or regions, institution of tariffs or other trade barriers by any of their key trading partners or a slowdown in the economies of any of their key trading partners may cause an adverse impact on the economies of such countries or regions.
Risk of Investing in Brazil. Investment in Brazilian issuers involves risks that are specific to Brazil, including legal, regulatory, political, currency and economic risks. Specifically, Brazilian issuers are subject to possible regulatory and economic interventions by the Brazilian government, including the imposition of wage and price controls and the limitation of imports. The economy of Brazil has historically been negatively affected by corruption scandals involving private companies and government officials, which have led to sanctions against firms. In addition, the market for Brazilian securities is directly influenced by the flow of international capital and economic and market conditions of certain countries, especially other emerging market countries in Central and South America. The Brazilian economy has historically been exposed to high rates of inflation and a high level of debt, each of which may reduce and/or prevent economic growth. A rising unemployment rate could also have the same effect.
Risk of Investing in Emerging Markets. Investments in emerging market issuers are subject to a greater risk of loss than investments in issuers located or operating in more developed markets. This is due to, among other things, the potential for greater market volatility, lower trading volume, higher levels of inflation, social, political or economic instability, greater risk of a market shutdown and more governmental limitations on foreign investments in emerging market countries than are typically found in more developed markets.
Some countries in which the Fund may invest may experience economic instability, including instability resulting from substantial rates of inflation or significant devaluations of their currency, or economic recessions, which would have a negative effect on the economies and securities markets of their economies. Some of these countries may also impose restrictions on the exchange or export of currency or adverse currency exchange rates and may be characterized by a lack of available currency hedging instruments.
Disparities of wealth, the pace and success of democratization and ethnic, religious and racial disaffection, among other factors, may exacerbate social unrest, violence and labor unrest in some of the countries in which the Fund may invest. Unanticipated or sudden political or social developments may result in sudden and significant investment losses.
Companies in many emerging markets are not subject to the same degree of regulatory requirements, accounting standards or auditor oversight as companies in more developed countries, and as a result, information about the securities in which the Fund invests may be less reliable or complete. Moreover, emerging markets often have less reliable securities valuations and greater risks associated with custody of securities than developed markets. There may be significant obstacles to obtaining information necessary for investigations into or litigation against companies and shareholders may have limited legal remedies. The Fund is not actively managed and does not select investments based on investor protection considerations.
In addition, emerging markets often have greater risk of capital controls through such measures as taxes or interest rate control than developed markets. Certain emerging market countries may also lack the infrastructure necessary to attract large amounts
13
of foreign trade and investment. Chronic structural public sector deficits in some countries in which the Fund may invest may adversely impact securities held by the Fund.
Local securities markets in emerging market countries may trade a small number of securities and may be unable to respond effectively to changes in trading volume, potentially making prompt liquidation of holdings difficult or impossible at times. Settlement procedures in emerging market countries are frequently less developed and reliable than those in the U.S. (and other developed countries). In addition, significant delays may occur in certain markets in registering the transfer of securities. Settlement or registration problems may make it more difficult for the Fund to value its portfolio securities and could have an adverse effect on the Fund in seeking to achieve its investment objective.
Investing in emerging market countries involves a higher risk of loss due to expropriation, nationalization, confiscation of assets and property or the imposition of restrictions on foreign investments and on repatriation of capital invested in certain emerging market countries. As a result, investments in certain countries in which the Fund may invest may be subject to loss due to expropriation or nationalization of assets and property or the imposition of restrictions on foreign investments and repatriation of capital.
Risk of Investing in Russia. Investing in Russian securities involves significant risks, in addition to those described under “Risk of Investing in Emerging Markets” and “Non-U.S. Securities Risk,” that are not typically associated with investing in U.S. securities, including:
■
The risk of delays in settling portfolio transactions and the risk of loss arising out of the system of share registration and custody used in Russia;
■
Risks in connection with the maintenance of the Fund’s portfolio securities and cash with foreign sub-custodians and securities depositories, including the risk that appropriate sub-custody arrangements will not be available to the Fund;
■
The risk that the Fund’s ownership rights in portfolio securities could be lost through fraud or negligence because ownership in shares of Russian companies is recorded by the companies themselves and by registrars, rather than by a central registration system;
■
The risk that the Fund may not be able to pursue claims on behalf of its shareholders because of the system of share registration and custody, and because Russian banking institutions and registrars are not guaranteed by the Russian government; and
■
The risk that various responses by other nation-states to alleged Russian cyber activity will impact Russia’s economy and Russian issuers of securities in which the Fund invests.
Russian invasion of Ukraine. Russia launched a large-scale invasion of Ukraine on February 24, 2022. The extent and duration of the military action, resulting sanctions and resulting future market disruptions, including declines in its stock markets and the value of the ruble against the U.S. dollar, are impossible to predict, but could be significant. Disruptions caused by Russian military action or other actions (including cyberattacks and espionage) or resulting actual and threatened responses to such activity, including purchasing and financing restrictions, boycotts or changes in
14
consumer or purchaser preferences, sanctions, import and export restrictions, tariffs or cyberattacks on the Russian government, Russian companies or Russian individuals, including politicians, may impact Russia’s economy, Russian issuers of securities in which the Fund invests, or the economies of Europe as a whole. Actual and threatened responses to Russian military action may also impact the markets for certain Russian commodities, such as oil and natural gas, as well as other sectors of the Russian economy, and are likely to have collateral impacts on such sectors across Europe and globally.
Russia Sanctions. Governments in the U.S. and many other countries (collectively, the “Sanctioning Bodies”) have imposed economic sanctions on certain Russian individuals, including politicians, and Russian corporate and banking entities, including banning Russia from global payments systems that facilitate cross-border payments. The Sanctioning Bodies, or others, could also institute broader sanctions on Russia. These sanctions, or even the threat of further sanctions, may result in the decline of the value and liquidity of Russian securities, a weakening of the ruble or other adverse consequences to the Russian economy. These sanctions could also result in the immediate freeze of Russian securities and/or funds invested in prohibited assets, impairing the ability of the Fund to buy, sell, receive or deliver those securities and/or assets.
The sanctions against certain Russian issuers include prohibitions on transacting in or dealing in issuances of debt or equity of such issuers. Compliance with each of these sanctions has and may continue to impair the ability of the Fund to buy, sell, hold, receive or deliver the affected securities or other securities of such issuers. If it becomes impracticable or unlawful for the Fund to hold securities subject to, or otherwise affected by, sanctions (collectively, “affected securities”), or if deemed appropriate by BFA, the Fund may prohibit in-kind deposits of the affected securities in connection with creation transactions and instead require a cash deposit, which may also increase the Fund's transaction costs. The Fund may also be legally required to freeze assets in a blocked account.
Sanctions have resulted in Russia taking counter measures or retaliatory actions, which has impaired the value and liquidity of Russian securities. These retaliatory measures include the immediate freeze of Russian assets held by the Fund. Due to the freeze of these assets, including depositary receipts, the Fund may need to liquidate non-restricted assets in order to satisfy any Fund redemption orders. The liquidation of Fund assets during this time may also result in the Fund receiving substantially lower prices for its securities. Russia may implement additional retaliatory measures, which may further impair the value and liquidity of Russian securities and the ability of the Fund to receive dividend payments. Recently, Russia has issued a number of countersanctions, some of which restrict the distribution of profits by limited liability companies (e.g., dividends), and prohibits Russian persons from entering into transactions with designated persons from “unfriendly states” as well as the export of raw materials or other products from Russia to certain sanctioned persons. Russian companies may be unable to pay dividends and, if they pay dividends, the Fund may be unable to receive them.
These sanctions, the decision by Russia to suspend trading on the Moscow Exchange (MOEX) and prohibit non-resident investors from executing security sales, and other events have led to changes in the Fund's Underlying Index. The Fund’s Index Provider has removed Russian securities from the Underlying Index. To the extent that the Fund rebalances its portfolio and trades in non-Russian securities to seek to track the investment results of the Underlying Index, this may result in transaction costs and
15
increased tracking error. The Fund is currently restricted from trading in Russian securities, including those in its portfolio, while the Underlying Index has removed Russian securities. This disparity will also lead to increased tracking error. The inability of the Fund to trade in Russian securities may adversely affect the Fund’s ability to meet its investment objective. It is unknown when, or if, sanctions may be lifted or the Fund’s ability to trade in Russian securities will resume.
Also, if an affected security is included in the Fund's Underlying Index, the Fund may, where practicable, seek to eliminate its holdings of the affected security by employing or augmenting its representative sampling strategy to seek to track the investment results of its Underlying Index. The use of (or increased use of) a representative sampling strategy may increase the Fund’s tracking error risk. If the affected securities constitute a significant percentage of the Underlying Index, the Fund may not be able to effectively implement a representative sampling strategy, which may result in significant tracking error between the Fund’s performance and the performance of its Underlying Index.
Risk of Investing in Saudi Arabia. The ability of foreign investors (such as the Fund) to invest in the securities of Saudi Arabian issuers is relatively new. Such ability could be restricted by the Saudi Arabian government at any time, and unforeseen risks could materialize with respect to foreign ownership in such securities. In addition, the Saudi Arabian government places investment limitations on the ownership of Saudi Arabian issuers by foreign investors, including a limitation on the Fund’s ownership of any single issuer listed on the Saudi Arabian Stock Exchange, which may prevent the Fund from investing in accordance with its strategy and contribute to tracking error against the Underlying Index. Saudi Arabia is highly reliant on income from the sale of petroleum and trade with other countries involved in the sale of petroleum, and its economy is therefore vulnerable to changes in foreign currency values and the market for petroleum. As global demand for petroleum fluctuates, Saudi Arabia may be significantly impacted. Like most Middle Eastern governments, the government of Saudi Arabia exercises substantial influence over many aspects of the private sector. Although liberalization in the wider economy is underway, in many areas it has lagged significantly: restrictions on foreign ownership persist, and the government has an ownership stake in many key industries. The situation is exacerbated by the fact that Saudi Arabia is governed by an absolute monarchy. Saudi Arabia has historically experienced strained relations with economic partners worldwide, including other countries in the Middle East due to geopolitical events. Governmental actions in the future could have a significant effect on economic conditions in Saudi Arabia, which could affect private sector companies and the Fund, as well as the value of securities in the Fund’s portfolio. Any economic sanctions on Saudi Arabian individuals or Saudi Arabian corporate entities, or even the threat of sanctions, may result in the decline of the value and liquidity of Saudi Arabian securities, a weakening of the Saudi riyal or other adverse consequences to the Saudi Arabian economy. In addition, Saudi Arabia’s economy relies heavily on cheap, foreign labor, and changes in the availability of this labor supply could have an adverse effect on the economy.
Investments in the securities of Saudi Arabian issuers involve risks not typically associated with investments in securities of issuers in more developed countries that may negatively affect the value of the Fund’s investments. Such heightened risks may include, among others, expropriation and/or nationalization of assets, restrictions on and government intervention in international trade, confiscatory taxation, political instability, including authoritarian and/or military involvement in governmental decision making, armed conflict, crime and instability as a result of religious, ethnic
16
and/or socioeconomic unrest. Although the political situation in Saudi Arabia is largely stable, Saudi Arabia has historically experienced political instability, and there remains the possibility that instability in the larger Middle East region could adversely impact the economy of Saudi Arabia. Political instability in the larger Middle East region has caused significant disruptions to many industries. Continued political and social unrest in these areas may negatively affect the value of securities in the Fund’s portfolio.
Saudi Arabia Broker Risk. There are a number of different ways of conducting transactions in equity securities in the Saudi Arabian market. The Fund generally expects to conduct its transactions in a manner in which the Fund would not be limited by Saudi Arabian regulations to a single broker. However, there may be a limited number of brokers who can provide services to the Fund, which may have an adverse impact on the prices, quantity or timing of Fund transactions. The limited number of brokers may impact the Fund’s ability to achieve best execution on securities transactions. In addition, the limited number of brokers available to the Fund may make the Fund more susceptible to credit loss or trading disruptions in the event of a default or business disruption by one or more of the available brokers. Should the Fund’s ability to use one or more brokers be affected for any reason, this could disrupt the operations of the Fund and affect the ability of the Fund to track the Underlying Index and/or cause the Fund’s shares to trade at a premium or discount to NAV. The Fund may also incur losses due to the acts or omissions of its brokers in the execution or settlement of any transaction or in the transfer of any funds or securities.
Securities Lending Risk. The Fund may engage in securities lending. Securities lending involves the risk that the Fund may lose money because the borrower of the loaned securities fails to return the securities in a timely manner or at all. The Fund could also lose money in the event of a decline in the value of collateral provided for loaned securities or a decline in the value of any investments made with cash collateral. These events could also trigger adverse tax consequences for the Fund. BlackRock Institutional Trust Company, N.A. (“BTC”), the Fund's securities lending agent, will take into account the tax impact to shareholders of substitute payments for dividends when managing the Fund's securities lending program.
Security Risk. Some geographic areas in which the Fund invests have experienced acts of terrorism and strained international relations due to territorial disputes, historical animosities, defense concerns and other security concerns. These situations may cause uncertainty in the markets of these geographic areas and may adversely affect their economies.
Tracking Error Risk. The Fund may be subject to “tracking error,” which is the divergence of the Fund’s performance from that of the Underlying Index. Tracking error may occur because of differences between the securities and other instruments held in the Fund’s portfolio and those included in the Underlying Index, pricing differences (including, as applicable, differences between a security’s price at the local market close and the Fund's valuation of a security at the time of calculation of the Fund's NAV), transaction costs incurred by the Fund, the Fund’s holding of uninvested cash, differences in timing of the accrual or the valuation of dividends or interest received by the Fund or distributions paid to the Fund’s shareholders, the requirements to maintain pass-through tax treatment, portfolio transactions carried out to minimize the distribution of capital gains to shareholders, acceptance of custom baskets, changes to the Underlying Index or the costs to the Fund of complying with various new or existing regulatory requirements, among other reasons. This risk may be heightened during times of increased market volatility or other unusual market conditions. Tracking error also may result because the Fund incurs fees and expenses,
17
while the Underlying Index does not. Tracking error may occur due to differences between the methodologies used in calculating the value of the Underlying Index and determining the Fund’s NAV. BFA EXPECTS THAT THE FUND WILL EXPERIENCE HIGHER TRACKING ERROR THAN IS TYPICAL FOR SIMILAR INDEX ETFs.
U.S. Economic Risk. The U.S. is a significant, and in some cases the most significant, trading partner of, or foreign investor in, certain countries in which the Fund invests. As a result, economic conditions of such countries may be particularly affected by changes in the U.S. economy. A decrease in U.S. imports or exports, new trade and financial regulations or tariffs, changes in the U.S. dollar exchange rate or an economic slowdown in the U.S. may have a material adverse effect on the economic conditions of such countries and, as a result, securities to which the Fund has exposure. Circumstances could arise that could prevent the timely payment of interest or principal on U.S. government debt, such as reaching the legislative “debt ceiling.” Such non-payment would result in substantial negative consequences for the U.S. economy and the global financial system.
Valuation Risk. The price the Fund could receive upon the sale of a security or other asset may differ from the Fund's valuation of the security or other asset and from the value used by the Underlying Index, particularly for securities or other assets that trade in low volume or volatile markets or that are valued using a fair value methodology as a result of trade suspensions or for other reasons. Because non-U.S. exchanges may be open on days or during time periods when the Fund does not price its shares, the value of the securities or other assets in the Fund's portfolio may change on days or during time periods when shareholders will not be able to purchase or sell the Fund’s shares. In addition, for purposes of calculating the Fund's NAV, the value of assets denominated in non-U.S. currencies is translated into U.S. dollars at the prevailing market rates. This translation may result in a difference between the prices used to calculate the Fund's NAV and the prices used by the Underlying Index, which, in turn, could result in a difference between the Fund's performance and the performance of the Underlying Index. Authorized Participants who purchase or redeem Fund shares on days when the Fund is holding fair-valued securities may receive fewer or more shares, or lower or higher redemption proceeds, than they would have received had the securities not been fair valued or been valued using a different methodology. The ability to value investments may be impacted by technological issues or errors by pricing services or other third-party service providers.
A Further Discussion of Other Risks
The Fund may also be subject to certain other risks associated with its investments and investment strategies. The order of the below risk factors does not indicate the significance of any particular risk factor.
African Economic Risk. Investing in the economies of African countries involves risks not typically associated with investments in securities of issuers in more developed economies, countries or geographic regions that may negatively affect the value of investments in the Fund. Such heightened risks include, among others, expropriation and/or nationalization of assets, restrictions on and government intervention in international trade, confiscatory taxation, imposition of capital controls and delays or limits on repatriation of local currency, political instability, including authoritarian and/or military involvement in governmental decision making, armed conflict, civil war, and social instability as a result of religious, ethnic and/or socioeconomic unrest or widespread outbreaks of disease.
18
The securities markets in Africa are underdeveloped and are often considered to be less correlated to global economic cycles than markets located in more developed economies, countries or geographic regions. Securities markets in African countries are subject to greater risks associated with market volatility, lower market capitalization, lower trading volume, illiquidity, inflation, greater price fluctuations, uncertainty regarding the existence of trading markets, governmental control and heavy regulation of labor and industry. Moreover, trading on African securities markets may be suspended altogether.
Certain governments in African countries may restrict or control to varying degrees the ability of foreign investors to invest in securities of issuers located or operating in those countries. Moreover, certain countries in Africa may require governmental approval or special licenses prior to investment by foreign investors; may limit the amount of investment by foreign investors in a particular industry and/or issuer; may limit such foreign investment to a certain class of securities of an issuer that may have less advantageous rights than the classes available for purchase by domestic investors of those countries; and/or may impose additional taxes on foreign investors. These factors, among others, make investing in issuers located or operating in countries in Africa significantly riskier than investing in issuers located or operating in more developed countries.
Borrowing Risk. Borrowing may exaggerate changes in the NAV of Fund shares and in the return on the Fund’s portfolio. Borrowing will cost the Fund interest expense and other fees. The costs of borrowing may reduce the Fund’s return. Borrowing may also cause the Fund to liquidate positions when it may not be advantageous to do so to satisfy its obligations.
Close-Out Risk for Qualified Financial Contracts. Regulations adopted by global prudential regulators require counterparties that are part of U.S. or foreign global systemically important banking organizations to include contractual restrictions on close-out and cross-default in agreements relating to qualified financial contracts. Qualified financial contracts include agreements relating to swaps, currency forwards and other derivatives as well as repurchase agreements and securities lending agreements. The restrictions prevent the Fund from closing out a qualified financial contract during a specified time period if the counterparty is subject to resolution proceedings and also prohibit the Fund from exercising default rights due to a receivership or similar proceeding of an affiliate of the counterparty. These requirements may increase credit risk and other risks to the Fund.
Illiquid Investments Risk. The Fund may not acquire any illiquid investment if, immediately after the acquisition, the Fund would have invested more than 15% of its net assets in illiquid investments. An illiquid investment is any investment that the Fund reasonably expects cannot be sold or disposed of in current market conditions in seven calendar days or less without significantly changing the market value of the investment. Liquid investments may become illiquid after purchase by the Fund, particularly during periods of market turmoil. There can be no assurance that a security or instrument that is deemed to be liquid when purchased will continue to be liquid for as long as it is held by the Fund, and any security or instrument held by the Fund may be deemed an illiquid investment pursuant to the Fund’s liquidity risk management program. To the extent the Fund holds illiquid investments, the illiquid investments may reduce the returns of the Fund because the Fund may be unable to transact at advantageous times or prices. An investment may be illiquid due to, among other things, the reduced number and capacity of traditional market participants to make a market in securities or instruments, the lack of an active market for such securities or
19
instruments, capital controls, delays or limits on repatriation of local currency, or insolvency of local governments. To the extent that the Fund invests in securities or instruments with substantial market and/or credit risk, the Fund will tend to have increased exposure to the risks associated with illiquid investments. Illiquid investments may be harder to value, especially in changing markets. If the Fund is forced to sell underlying investments at reduced prices or under unfavorable conditions to meet redemption requests or for other cash needs, the Fund may suffer a loss. This may be magnified in a rising interest rate environment or other circumstances where redemptions from the Fund may be greater than normal. Other market participants may be attempting to liquidate holdings at the same time as the Fund, causing increased supply of the Fund’s underlying investments in the market and contributing to illiquid investments risk and downward pricing pressure. In addition, if the Fund is limited in its ability to sell illiquid investments during periods when shareholders are redeeming their shares, the Fund will need to sell liquid securities to meet redemption requests and illiquid securities will become a larger portion of the Fund’s holdings. During periods of market volatility, liquidity in the market for the Fund’s shares may be impacted by the liquidity in the market for the underlying securities or instruments held by the Fund, which could lead to the Fund’s shares trading at a premium or discount to the Fund's NAV.
Industrials Sector Risk. The value of securities issued by companies in the industrials sector may be adversely affected by supply and demand changes related to their specific products or services and industrials sector products in general. The products of manufacturing companies may face obsolescence due to rapid technological developments and frequent new product introduction. Global events, trade disputes and changes in government regulations, economic conditions and exchange rates may adversely affect the performance of companies in the industrials sector. Companies in the industrials sector may be adversely affected by liability for environmental damage and product liability claims. The industrials sector may also be adversely affected by changes or trends in commodity prices, which may be influenced by unpredictable factors. Companies in the industrials sector, particularly aerospace and defense companies, may also be adversely affected by government spending policies because companies in this sector tend to rely to a significant extent on government demand for their products and services.
Information Technology Sector Risk. Information technology companies face intense competition which may have an adverse effect on their profit margins. Like other technology companies, information technology companies may have limited product lines, markets, financial resources or personnel. The products of information technology companies may face obsolescence due to rapid technological developments, frequent new product introduction, unpredictable changes in growth rates and competition for the services of qualified personnel. Companies in the information technology sector are heavily dependent on patent and intellectual property rights. The loss or impairment of these rights may adversely affect the profitability of these companies. Companies in the information technology sector are facing increased government and regulatory scrutiny and may be subject to adverse government or regulatory action. Companies in the application software industry, in particular, may also be negatively affected by the decline or fluctuation of subscription renewal rates for their products and services, which may have an adverse effect on profit margins. Companies in the systems software industry may be adversely affected by, among other things, actual or perceived security vulnerabilities in their products
20
and services, which may result in individual or class action lawsuits, state or federal enforcement actions and other remediation costs.
Small-Capitalization Companies Risk. Investments in small-capitalization companies may be riskier, less liquid, more volatile and more susceptible to economic, market and industry changes than investments in large- or mid-capitalization companies. Small-capitalization companies may have more limited product lines, markets, financial resources, personnel and management experience. As a result, they generally are more vulnerable than larger companies to adverse business and economic developments. Small-capitalization companies may have a short business track record, with relatively less information available to investors. The securities of mid-sized companies may trade less frequently and in smaller volumes than the securities of larger companies. Some securities of smaller issuers may be illiquid or restricted as to resale, and their values may have significant volatility. A Fund may be unable to liquidate its positions in such securities at any time, or at a favorable price, in order to meet the Fund’s obligations.
Technology Sector Risk. Technology companies, including information technology companies, face intense competition, both domestically and internationally, which may have an adverse effect on a company’s profit margins. Technology companies may have limited product lines, markets, financial resources or personnel. The products of technology companies may face obsolescence due to rapid technological developments, frequent new product introduction, unpredictable changes in growth rates and competition for the services of qualified personnel. Companies in the technology sector are heavily dependent on patent and other intellectual property rights. A technology company’s loss or impairment of these rights may adversely affect the company’s profitability. Companies in the technology sector may face increased government and regulatory scrutiny and may be subject to adverse government or regulatory action. The technology sector may also be adversely affected by changes or trends in commodity prices, which may be influenced or characterized by unpredictable factors.
Threshold/Underinvestment Risk. If certain aggregate and/or fund-level ownership thresholds are reached through transactions undertaken by BFA, its affiliates or the Fund, or as a result of third-party transactions or actions by an issuer or regulator, the ability of BFA and its affiliates on behalf of clients (including the Fund) to purchase or dispose of investments, or exercise rights or undertake business transactions, may be restricted by regulation or otherwise impaired. The capacity of the Fund to make investments in certain securities may be affected by the relevant threshold limits, and such limitations may have adverse effects on the liquidity and performance of the Fund’s portfolio holdings compared to the performance of the Underlying Index. This may increase the risk of the Fund being underinvested to the Underlying Index and increase the risk of tracking error.
For example, in certain circumstances where the Fund invests in securities issued by companies that operate in certain regulated industries or in certain emerging or international markets, is subject to corporate or regulatory ownership restrictions, or invests in certain futures or other derivative transactions, there may be limits on the aggregate and/or fund-level amount invested or voted by BFA and its affiliates for their proprietary accounts and for client accounts (including the Fund) that may not be exceeded without the grant of a license or other regulatory or corporate consent or, if exceeded, may cause BFA and its affiliates, the Fund or other client accounts to suffer disadvantages or business restrictions.
21
Utilities Sector Risk. Companies in the utilities sector may be adversely affected by changes in exchange rates, domestic and international competition, and governmental limitations on rates charged to consumers. The value of regulated utility debt securities (and, to a lesser extent, equity securities) tends to have an inverse relationship to the movement of interest rates. Deregulation may subject utility companies to greater competition and may adversely affect their profitability. As deregulation allows utility companies to diversify outside of their original geographic regions and their traditional lines of business, utility companies may engage in riskier ventures. In addition, deregulation may eliminate restrictions on the profits of certain utility companies, but may also subject these companies to greater risk of loss. Companies in the utilities industry may have difficulty obtaining an adequate return on invested capital, raising capital, or financing large construction projects during periods of inflation or unsettled capital markets; face restrictions on operations and increased cost and delays attributable to environmental considerations and regulation; find that existing plants, equipment or products have been rendered obsolete by technological innovations; or be subject to increased costs because of the scarcity of certain fuels or the effects of man-made or natural disasters. Existing and future regulations or legislation may make it difficult for utility companies to operate profitably. Government regulators monitor and control utility revenues and costs, and therefore may limit utility profits. In certain countries, regulatory authorities may also restrict utility companies’ access to new markets, thereby diminishing these companies’ long-term prospects. There is no assurance that regulatory authorities will grant rate increases in the future or that such increases will be adequate to permit the payment of dividends on stocks issued by a utility company. Energy conservation and changes in climate policy may also have a significant adverse impact on the revenues and expenses of utility companies.
Portfolio Holdings Information
A description of the Company's policies and procedures with respect to the disclosure of the Fund’s portfolio securities is available in the Fund's Statement of Additional Information (“SAI”). The Fund discloses its portfolio holdings daily at www.iShares.com. Fund fact sheets providing information regarding the Fund's top holdings are posted on www.iShares.com when available and may be requested by calling 1-800-iShares (1-800-474-2737).
Management
Investment Adviser. As investment adviser, BFA has overall responsibility for the general management and administration of the Fund. BFA provides an investment program for the Fund and manages the investment of the Fund’s assets. In managing the Fund, BFA may draw upon the research and expertise of its asset management affiliates with respect to certain portfolio securities. In seeking to achieve the Fund's investment objective, BFA uses teams of portfolio managers, investment strategists and other investment specialists. This team approach brings together many disciplines and leverages BFA’s extensive resources.
Pursuant to the Investment Advisory Agreement between BFA and the Company (entered into on behalf of the Fund), BFA is responsible for substantially all expenses of the Fund, except the management fees, interest expenses, taxes, expenses incurred with respect to the acquisition and disposition of portfolio securities and the execution of portfolio transactions, including brokerage commissions, distribution fees or
22
expenses, and litigation expenses and any extraordinary expenses (as determined by a majority of the Directors who are not “interested persons” of the Company). Operating expenses paid by BFA under the Investment Advisory Agreement exclude Acquired Fund Fees and Expenses, if any.
For the fiscal year ended April 30, 2023, BFA was paid a management fee from the Fund, as a percentage of the Fund's average daily net assets, net of any applicable waivers, at the annual rate of 0.49%.
BFA has contractually agreed to waive a portion of its management fees in an amount equal to the aggregate Acquired Fund Fees and Expenses, if any, attributable to investments by the Fund in other series of iShares Trust and the Company through August 31, 2027. The contractual waiver may be terminated prior to August 31, 2027 only upon written agreement of the Company and BFA. In addition, BFA may from time to time voluntarily waive and/or reimburse fees or expenses in order to limit total annual fund operating expenses (excluding Acquired Fund Fees and Expenses, if any). Any such voluntary waiver or reimbursement may be eliminated by BFA at any time.
BFA is located at 400 Howard Street, San Francisco, CA 94105. It is an indirect wholly-owned subsidiary of BlackRock, Inc. (“BlackRock”). As of June 30, 2023, BFA and its affiliates provided investment advisory services for assets of approximately $9.4 trillion. BFA and its affiliates trade and invest for their own accounts in the actual securities and types of securities in which the Fund may also invest, which may affect the price of such securities.
A discussion regarding the basis for the approval by the Company's Board of Directors (the “Board”) of the Investment Advisory Agreement with BFA is available in the Fund's Semi-Annual Report for the period ended October 31.
Portfolio Managers. Jennifer Hsui, Greg Savage and Paul Whitehead are primarily responsible for the day-to-day management of the Fund. The Portfolio Managers are responsible for various functions related to portfolio management, including, but not limited to, investing cash inflows, coordinating with members of their respective portfolio management teams to focus on certain asset classes, implementing investment strategy, researching and reviewing investment strategy and overseeing members of their respective portfolio management teams who have more limited responsibilities.
Jennifer Hsui has been employed by BFA or its affiliates as a senior portfolio manager since 2007. Prior to that, Ms. Hsui was a portfolio manager from 2006 to 2007 for Barclays Global Fund Advisors (“BGFA”). Ms. Hsui has been a Portfolio Manager of the Fund since 2012.
Greg Savage has been employed by BFA or its affiliates as a senior portfolio manager since 2006. Prior to that, Mr. Savage was a portfolio manager from 2001 to 2006 for BGFA. Mr. Savage has been a Portfolio Manager of the Fund since 2012.
Paul Whitehead has been with BlackRock since 1996, including his years with Barclays Global Investors (“BGI”), which merged with BlackRock in 2009. Mr. Whitehead has been employed by BlackRock as a Managing Director since 2010 and a Director from 2009 to 2010. Mr. Whitehead was employed by BGI as Principal from 2002 to 2009. Mr. Whitehead has been a Portfolio Manager of the Fund since 2022.
23
The Fund's SAI provides additional information about the Portfolio Managers' compensation, other accounts managed by the Portfolio Managers and the Portfolio Managers' ownership (if any) of shares in the Fund.
Administrator, Custodian and Transfer Agent. State Street Bank and Trust Company (“State Street”) is the administrator, custodian and transfer agent for the Fund. JPMorgan Chase Bank, N.A. serves as custodian for the Fund in connection with certain securities lending activities.
Conflicts of Interest. The investment activities of BFA and its affiliates (including BlackRock and its subsidiaries (collectively, the “Affiliates”)), and their respective directors, officers or employees, in the management of, or their interest in, their own accounts and other accounts they manage, may present conflicts of interest that could disadvantage the Fund and its shareholders. BFA and its Affiliates provide investment management services to other funds and discretionary managed accounts that may follow investment programs similar to that of the Fund. BFA and its Affiliates are involved worldwide with a broad spectrum of financial services and asset management activities and may engage in the ordinary course of business in activities in which their interests or the interests of their clients may conflict with those of the Fund. BFA or one or more Affiliates act, or may act, as an investor, research provider, investment manager, commodity pool operator, commodity trading advisor, financier, underwriter, adviser, trader, lender, index provider, agent and/or principal, and have other direct and indirect interests in securities, currencies, commodities, derivatives and other instruments in which the Fund may directly or indirectly invest. The Fund may invest in securities of, or engage in other transactions with, companies with which an Affiliate has significant debt or equity investments or other interests. The Fund may also invest in issuances (such as structured notes) by entities for which an Affiliate provides and is compensated for cash management services relating to the proceeds from the sale of such issuances. The Fund also may invest in securities of, or engage in other transactions with, companies for which an Affiliate provides or may in the future provide research coverage. An Affiliate may have business relationships with, and purchase or distribute or sell services or products from or to, distributors, consultants or others who recommend the Fund or who engage in transactions with or for the Fund, and may receive compensation for such services. BFA or one or more Affiliates may engage in proprietary trading and advise accounts and funds that have investment objectives similar to those of the Fund and/or that engage in and compete for transactions in the same types of securities, currencies and other instruments as the Fund. This may include transactions in securities issued by other open-end and closed-end investment companies (which may include investment companies that are affiliated with the Fund and BFA, to the extent permitted under the Investment Company Act of 1940, as amended (the “1940 Act”)). The trading activities of BFA and these Affiliates are carried out without reference to positions held directly or indirectly by the Fund and may result in BFA or an Affiliate having positions in certain securities that are senior or junior to, or have interests different from or adverse to, the securities that are owned by the Fund.
Neither BlackRock nor any Affiliate is under any obligation to share any investment opportunity, idea or strategy with the Fund. As a result, an Affiliate may compete with
24
the Fund for appropriate investment opportunities. The results of the Fund's investment activities, therefore, may differ from those of an Affiliate and of other accounts managed by BlackRock or an Affiliate, and it is possible that the Fund could sustain losses during periods in which one or more Affiliates and other accounts achieve profits on their trading for proprietary or other accounts. The opposite result is also possible.
In addition, the Fund may, from time to time, enter into transactions in which BFA or an Affiliate or its or their directors, officers, employees or clients have an adverse interest. Furthermore, transactions undertaken by clients advised or managed by BFA or its Affiliates may adversely impact the Fund. Transactions by one or more clients or by BFA or its Affiliates or their directors, officers or employees may have the effect of diluting or otherwise disadvantaging the values, prices or investment strategies of the Fund.
The Fund's activities may be limited because of regulatory restrictions applicable to BFA or one or more Affiliates and/or their internal policies designed to comply with such restrictions.
Under a securities lending program approved by the Board, the Fund has retained BTC, an Affiliate of BFA, to serve as the securities lending agent for the Fund to the extent that the Fund participates in the securities lending program. For these services, the securities lending agent will receive a fee from the Fund, based on the returns earned on the Fund’s lending activities, including investment of the cash received as collateral for the loaned securities. In addition, one or more Affiliates may be among the entities to which the Fund may lend its portfolio securities under the securities lending program.
It is also possible that, from time to time, BlackRock and/or its advisory clients (including other funds and separately managed accounts) may, subject to compliance with applicable law, purchase and hold shares of the Fund. The price, availability, liquidity, and (in some cases) expense ratio of the Fund may be impacted by purchases and sales of the Fund by BlackRock and/or its advisory clients.
The activities of BFA and its Affiliates and their respective directors, officers or employees may give rise to other conflicts of interest that could disadvantage the Fund and its shareholders. BFA has adopted policies and procedures designed to address these potential conflicts of interest. See the SAI for further information.
Shareholder Information
Additional shareholder information, including how to buy and sell shares of the Fund, is available free of charge by calling toll-free: 1-800-iShares (1-800-474-2737) or visiting our website at www.iShares.com.
Buying and Selling Shares. Shares of the Fund may be acquired or redeemed directly from the Fund only in Creation Units or multiples thereof, as discussed in the Creations and Redemptions section of this Prospectus. Only an Authorized Participant may engage in creation or redemption transactions directly with the Fund. Once created, shares of the Fund generally trade in the secondary market in amounts less than a Creation Unit.
25
Shares of the Fund are listed on a national securities exchange for trading during the trading day. Shares can be bought and sold throughout the trading day like shares of other publicly traded companies. The Company does not impose any minimum investment for shares of the Fund purchased on an exchange or otherwise in the secondary market. The Fund's shares trade under the ticker symbol “DVYE.”
Buying or selling Fund shares on an exchange or other secondary market involves two types of costs that may apply to all securities transactions. When buying or selling shares of the Fund through a broker, you may incur a brokerage commission and other charges. The commission is frequently a fixed amount and may be a significant proportional cost for investors seeking to buy or sell small amounts of shares. In addition, you may incur the cost of the “spread,” that is, any difference between the bid price and the ask price. The spread varies over time for shares of the Fund based on the Fund’s trading volume and market liquidity, and is generally lower if the Fund has high trading volume and market liquidity, and higher if the Fund has little trading volume and market liquidity (which is often the case for funds that are newly launched or small in size). The Fund's spread may also be impacted by the liquidity or illiquidity of the underlying securities held by the Fund, particularly for newly launched or smaller funds or in instances of significant volatility of the underlying securities.
The Fund does not impose restrictions on the frequency of purchases and redemptions of Fund shares directly with the Fund. The Board determined not to adopt policies and procedures designed to prevent or monitor for frequent purchases and redemptions of Fund shares because the Fund generally sells and redeems its shares directly through transactions that are in-kind and/or for cash, with a deadline for placing cash-related transactions no later than the close of the primary markets for the Fund’s portfolio securities. However, the Fund has taken certain measures (e.g., imposing transaction fees on purchases and redemptions of Creation Units and reserving the right to reject purchases of Creation Units under certain circumstances) to minimize the potential consequences of frequent cash purchases and redemptions by Authorized Participants, such as increased tracking error, disruption of portfolio management, dilution to the Fund, and/or increased transaction costs. Further, the vast majority of trading in Fund shares occurs on the secondary market, which does not involve the Fund directly, and such trading is unlikely to cause many of the harmful effects of frequent cash purchases or redemptions of Fund shares.
The national securities exchange on which the Fund's shares are listed is open for trading Monday through Friday and is closed on weekends and the following holidays (or the days on which they are observed): New Year’s Day, Martin Luther King, Jr. Day, Presidents’ Day, Good Friday, Memorial Day, Juneteenth, Independence Day, Labor Day, Thanksgiving Day and Christmas Day. The Fund’s primary listing exchange is NYSE Arca.
Section 12(d)(1) of the 1940 Act generally restricts investments by investment companies, including foreign and unregistered investment companies, in the securities of other investment companies. For example, a registered investment company (the “Acquired Fund”), such as the Fund, may not knowingly sell or otherwise dispose of any security issued by the Acquired Fund to any investment company (the “Acquiring Fund”) or any company or companies controlled by the Acquiring Fund if, immediately
26
after such sale or disposition: (i) more than 3% of the total outstanding voting stock of the Acquired Fund is owned by the Acquiring Fund and any company or companies controlled by the Acquiring Fund, or (ii) more than 10% of the total outstanding voting stock of the Acquired Fund is owned by the Acquiring Fund and other investment companies and companies controlled by them. However, registered investment companies are permitted to invest in the Fund beyond the limits set forth in Section 12(d)(1), subject to certain terms and conditions set forth in SEC rules. In order for a registered investment company to invest in shares of the Fund beyond the limitations of Section 12(d)(1) in reliance on Rule 12d1-4 under the 1940 Act, the registered investment company must, among other things, enter into an agreement with the Company. Foreign investment companies are permitted to invest in the Fund only up to the limits set forth in Section 12(d)(1), subject to any applicable SEC no-action relief.
Book Entry. Shares of the Fund are held in book-entry form, which means that no stock certificates are issued. The Depository Trust Company (“DTC”) or its nominee is the record owner of, and holds legal title to, all outstanding shares of the Fund.
Investors owning shares of the Fund are beneficial owners as shown on the records of DTC or its participants. DTC serves as the securities depository for shares of the Fund. DTC participants include securities brokers and dealers, banks, trust companies, clearing corporations and other institutions that directly or indirectly maintain a custodial relationship with DTC. As a beneficial owner of shares, you are not entitled to receive physical delivery of stock certificates or to have shares registered in your name, and you are not considered a registered owner of shares. Therefore, to exercise any right as an owner of shares, you must rely upon the procedures of DTC and its participants. These procedures are the same as those that apply to any other securities that you hold in book-entry or “street name” form.
Share Prices. The trading prices of the Fund’s shares in the secondary market generally differ from the Fund’s daily NAV and are affected by market forces such as the supply of and demand for ETF shares and shares of underlying securities held by the Fund, economic conditions and other factors.
Determination of Net Asset Value. The NAV of the Fund normally is determined once daily Monday through Friday, generally as of the close of regular trading hours of the New York Stock Exchange (“NYSE”) (normally 4:00 p.m., Eastern time) on each day that the NYSE is open for trading, based on prices at the time of closing, provided that any Fund assets or liabilities denominated in currencies other than the U.S. dollar are translated into U.S. dollars at the prevailing market rates on the date of valuation as quoted by one or more data service providers. The NAV of the Fund is calculated by dividing the value of the net assets of the Fund (i.e., the value of its total assets less total liabilities) by the total number of outstanding shares of the Fund, generally rounded to the nearest cent.
The value of the securities and other assets and liabilities held by the Fund is determined pursuant to BFA’s valuation policies and procedures. BFA has been designated by the Board as the valuation designee for the Fund pursuant to Rule 2a-5 under the 1940 Act.
27
Equity securities and other equity instruments for which market quotations are readily available are valued at market value, which is generally determined using the last reported official closing price or, if a reported closing price is not available, the last traded price on the exchange or market on which the security or instrument is primarily traded at the time of valuation. Shares of underlying open-end funds (including money market funds) are valued at net asset value. Shares of underlying exchange-traded closed-end funds or other ETFs are valued at their most recent closing price.
Generally, trading in non-U.S. securities and money market instruments is substantially completed each day at various times prior to the close of regular trading hours of the NYSE. The values of such securities used in computing the NAV of the Fund are determined as of such times.
When market quotations are not readily available or are believed by BFA to be unreliable, BFA will fair value the Fund’s investments in accordance with its policies and procedures. BFA may conclude that a market quotation is not readily available or is unreliable if a security or other asset or liability does not have a price source due to its lack of trading or other reasons, if a market quotation differs significantly from recent price quotations or otherwise no longer appears to reflect fair value, where the security or other asset or liability is thinly traded, when there is a significant event subsequent to the most recent market quotation, or if the trading market on which a security is listed is suspended or closed and no appropriate alternative trading market is available. A “significant event” is deemed to occur if BFA determines, in its reasonable business judgment prior to or at the time of pricing the Fund’s assets or liabilities, that the event is likely to cause a material change to the last exchange closing price or closing market price of one or more assets held by, or liabilities of, the Fund.
For certain foreign assets, a third-party vendor supplies evaluated, systematic fair value pricing based upon the movement of a proprietary multi-factor model after the relevant foreign markets have closed. This systematic fair value pricing methodology is designed to correlate the prices of foreign assets in one or more non-U.S. markets following the close of the local markets to the prices that might have prevailed as of the Fund’s pricing time.
Fair value represents a good faith approximation of the value of an asset or liability. The fair value of an asset or liability held by the Fund is the amount the Fund might reasonably expect to receive from the current sale of that asset or the cost to extinguish that liability in an arm’s-length transaction. Valuing the Fund’s investments using fair value pricing will result in prices that may differ from current market valuations and that may not be the prices at which those investments could have been sold during the period in which the particular fair values were used. Use of fair value prices and certain current market valuations could result in a difference between the prices used to calculate the Fund’s NAV and the prices used by the Underlying Index, which, in turn, could result in a difference between the Fund’s performance and the performance of the Underlying Index.
28
Dividends and Distributions.
General Policies. Dividends from net investment income, if any, generally are declared and paid at least once a year by the Fund. Distributions of net realized securities gains, if any, generally are declared and paid once a year, but the Company may make distributions on a more frequent basis for the Fund. The Company reserves the right to declare special distributions if, in its reasonable discretion, such action is necessary or advisable to preserve its status as a regulated investment company (“RIC”) or to avoid imposition of income or excise taxes on undistributed income or realized gains.
Dividends and other distributions on shares of the Fund are distributed on a pro rata basis to beneficial owners of such shares. Dividend payments are made through DTC participants and indirect participants to beneficial owners then of record with proceeds received from the Fund.
Dividend Reinvestment Service. No dividend reinvestment service is provided by the Company. Broker-dealers may make available the DTC book-entry Dividend Reinvestment Service for use by beneficial owners of the Fund for reinvestment of their dividend distributions. Beneficial owners should contact their broker to determine the availability and costs of the service and the details of participation therein. Brokers may require beneficial owners to adhere to specific procedures and timetables. If this service is available and used, dividend distributions of both income and realized gains will be automatically reinvested in additional whole shares of the Fund purchased in the secondary market.
Note on Tax Information. The following sections summarize some of the consequences under current U.S. federal tax law of an investment in the Fund. It is not a substitute for personal tax advice. You may also be subject to state and local taxation on Fund distributions and sales of shares. Certain states and localities may exempt from tax distributions attributable to interest from U.S. federal government obligations. Consult your personal tax advisor about the potential tax consequences of an investment in shares of the Fund under all applicable tax laws.
Taxes. As with any investment, you should consider how your investment in shares of the Fund will be taxed. The tax information in this Prospectus is provided as general information, based on current law. You should consult your own tax professional about the tax consequences of an investment in shares of the Fund.
Unless your investment in Fund shares is made through a tax-exempt entity or tax-deferred retirement account, such as an IRA, in which case your distributions generally will be taxable when withdrawn, you need to be aware of the possible tax consequences when the Fund makes distributions or you sell Fund shares.
Taxes on Distributions. Distributions from the Fund’s net investment income (other than qualified dividend income), including distributions of income from securities lending and distributions out of the Fund’s net short-term capital gains, if any, are taxable to you as ordinary income. Distributions by the Fund of net long-term capital gains, if any, in excess of net short-term capital losses (capital gain dividends) are taxable to you as long-term capital gains, regardless of how long you have held the Fund’s shares. Distributions by the Fund that qualify as qualified dividend income are taxable to you at long-term capital gain rates. Long-term capital gains and qualified
29
dividend income are generally eligible for taxation at a maximum rate of 15% or 20% for non-corporate shareholders, depending on whether their income exceeds certain threshold amounts. In addition, a 3.8% U.S. federal Medicare contribution tax is imposed on “net investment income,” including, but not limited to, interest, dividends, and net gain, of U.S. individuals with income exceeding $200,000 (or $250,000 if married and filing jointly) and of estates and trusts.
Dividends will be qualified dividend income to you if they are attributable to qualified dividend income received by the Fund. Generally, qualified dividend income includes dividend income from taxable U.S. corporations and qualified non-U.S. corporations, provided that the Fund satisfies certain holding period requirements in respect of the stock of such corporations and has not hedged its position in the stock in certain ways. Substitute dividends received by the Fund with respect to dividends paid on securities lent out will not be qualified dividend income. For this purpose, a qualified non-U.S. corporation means any non-U.S. corporation that is eligible for benefits under a comprehensive income tax treaty with the U.S., which includes an exchange of information program, or if the stock with respect to which the dividend was paid is readily tradable on an established U.S. securities market. The term excludes a corporation that is a passive foreign investment company.
Dividends received by the Fund from a RIC generally are qualified dividend income only to the extent such dividend distributions are made out of qualified dividend income received by such RIC. Additionally, it is expected that dividends received by the Fund from a REIT and distributed to a shareholder generally will be taxable to the shareholder as ordinary income. However, for tax years beginning after December 31, 2017 and before January 1, 2026, the Fund may report dividends eligible for a 20% “qualified business income” deduction for non-corporate U.S. shareholders to the extent the Fund’s income is derived from ordinary REIT dividends, reduced by allocable Fund expenses.
For a dividend to be treated as qualified dividend income, the dividend must be received with respect to a share of stock held without being hedged by the Fund, and with respect to a share of the Fund held without being hedged by you, for 61 days during the 121-day period beginning at the date which is 60 days before the date on which such share becomes ex-dividend with respect to such dividend or, in the case of certain preferred stock, 91 days during the 181-day period beginning 90 days before such date.
Fund distributions, to the extent attributable to dividends from U.S. corporations, will be eligible for the dividends received deduction for Fund shareholders that are corporations, subject to certain hedging and holding requirements.
In general, your distributions are subject to U.S. federal income tax for the year when they are paid. Certain distributions paid in January, however, may be treated as paid on December 31 of the prior year.
If the Fund’s distributions exceed current and accumulated earnings and profits, all or a portion of the distributions made in the taxable year may be recharacterized as a return of capital to shareholders. Distributions in excess of the Fund’s minimum distribution requirements, but not in excess of the Fund’s earnings and profits, will be
30
taxable to shareholders and will not constitute nontaxable returns of capital. A return of capital distribution generally will not be taxable but will reduce the shareholder’s cost basis and result in a higher capital gain or lower capital loss when those shares on which the distribution was received are sold. Once a shareholder's cost basis is reduced to zero, further distributions will be treated as capital gain, if the shareholder holds shares of the Fund as capital assets.
Dividends, interest and capital gains earned by the Fund with respect to securities issued by non-U.S. issuers may give rise to withholding, capital gains and other taxes imposed by non-U.S. countries. Tax conventions between certain countries and the U.S. may reduce or eliminate such taxes. If more than 50% of the total assets of the Fund at the close of a year consists of non-U.S. stocks or securities (generally, for this purpose, depositary receipts, no matter where traded, of non-U.S. companies are treated as “non-U.S.”), generally the Fund may “pass through” to you certain non-U.S. income taxes (including withholding taxes) paid by the Fund. This means that you would be considered to have received as an additional dividend your share of such non-U.S. taxes, but you may be entitled to either a corresponding tax deduction in calculating your taxable income, or, subject to certain limitations, a credit in calculating your U.S. federal income tax.
For purposes of foreign tax credits for U.S. shareholders of the Fund, foreign capital gains taxes may not produce associated foreign source income, limiting the availability of such credits for U.S. persons.
If you are neither a resident nor a citizen of the U.S. or if you are a non-U.S. entity (other than a pass-through entity to the extent owned by U.S. persons), the Fund’s ordinary income dividends (which include distributions of net short-term capital gains) will generally be subject to a 30% U.S. withholding tax, unless a lower treaty rate applies, provided that withholding tax will generally not apply to any gain or income realized by a non-U.S. shareholder in respect of any distributions of long-term capital gains or upon the sale or other disposition of shares of the Fund.
Separately, a 30% withholding tax is currently imposed on U.S.-source dividends, interest and other income items paid to (i) foreign financial institutions, including non-U.S. investment funds, unless they agree to collect and disclose to the U.S. Internal Revenue Service (“IRS”) information regarding their direct and indirect U.S. account holders and (ii) certain other foreign entities, unless they certify certain information regarding their direct and indirect U.S. owners. To avoid withholding, foreign financial institutions will need to (i) enter into agreements with the IRS that state that they will provide the IRS information, including the names, addresses and taxpayer identification numbers of direct and indirect U.S. account holders, comply with due diligence procedures with respect to the identification of U.S. accounts, report to the IRS certain information with respect to U.S. accounts maintained, agree to withhold tax on certain payments made to non-compliant foreign financial institutions or to account holders who fail to provide the required information, and determine certain other information concerning their account holders, or (ii) in the event that an applicable intergovernmental agreement and implementing legislation are adopted, provide local revenue authorities with similar account holder information. Other foreign entities may need to report the name, address, and taxpayer identification number of each
31
substantial U.S. owner or provide certifications of no substantial U.S. ownership unless certain exceptions apply.
If your Fund shares are loaned out pursuant to a securities lending arrangement, you may lose the ability to treat Fund dividends paid while the shares are held by the borrower as qualified dividend income. In addition, you may lose the ability to use foreign tax credits passed through by the Fund if your Fund shares are loaned out pursuant to a securities lending agreement.
If you are a resident or a citizen of the U.S., by law, backup withholding at a 24% rate will apply to your distributions and proceeds if you have not provided a taxpayer identification number or social security number and made other required certifications.
Taxes When Shares Are Sold. Currently, any capital gain or loss realized upon a sale of Fund shares is generally treated as a long-term gain or loss if the shares have been held for more than one year. Any capital gain or loss realized upon a sale of Fund shares held for one year or less is generally treated as short-term gain or loss, except that any capital loss on the sale of shares held for six months or less is treated as long-term capital loss to the extent that capital gain dividends were paid with respect to such shares. Any such capital gains, including from sales of Fund shares or from capital gain dividends, are included in “net investment income” for purposes of the 3.8% U.S. federal Medicare contribution tax mentioned above.
Chinese Tax Disclosure. The Fund’s investments in securities, issued by PRC companies may cause the Fund to become subject to withholding and other taxes imposed by the PRC. If the Fund were considered to be a tax resident of the PRC, it would be subject to PRC corporate income tax at the rate of 25% on its worldwide taxable income. If the Fund were considered to be a non-resident enterprise with a “permanent establishment” in the PRC, it would be subject to PRC corporate income tax of 25% on the profits attributable to the permanent establishment. BFA intends to operate the Fund in a manner that will prevent it from being treated as a tax resident of the PRC and from having a permanent establishment in the PRC. It is possible, however, that the PRC could disagree with that conclusion or that changes in PRC tax law could affect the PRC corporate income tax status of the Fund.
The PRC generally imposes withholding income tax at a rate of 10% on dividends, premiums, interest and capital gains originating in the PRC and paid to a company that is not a resident of the PRC for tax purposes and that has no permanent establishment in China. The withholding is in general made by the relevant PRC tax resident company making such payments. In the event the relevant PRC tax resident company fails to withhold the relevant PRC withholding income tax or otherwise fails to pay the relevant withholding income tax to the PRC tax authorities, the PRC tax authorities may, at their sole discretion, impose tax obligations on the Fund. Foreign investors are temporarily exempt from withholding income tax on capital gains derived from the trading of certain shares. The exemptions are temporary and there is no indication how long the exemptions will continue. While the application and enforcement of this law to the Fund remains subject to clarification, to the extent that such taxes are imposed on any capital gains of the Fund, the Fund's NAV or returns may be adversely impacted. Stamp duty under PRC laws generally applies to the execution and receipt of taxable documents, which include contracts for the sale of shares traded on PRC stock
32
exchanges. In the case of such contracts, the stamp duty is currently imposed on the seller but not on the purchaser, at the rate of 0.1%.
The above information is only a general summary of the potential PRC tax consequences that may be imposed on the Fund and its investors either directly or indirectly and should not be taken as a definitive, authoritative or comprehensive statement of the relevant matter. Investors should seek their own tax advice on their tax position with regard to their investment in the Fund.
The PRC government has implemented a number of tax reform policies in recent years. The current tax laws and regulations may be revised or amended in the future. Any revision or amendment in tax laws and regulations may affect the after-taxation profit of PRC companies and foreign investors in such companies, such as the Fund.
Creations and Redemptions. Prior to trading in the secondary market, shares of the Fund are “created” at NAV by market makers, large investors and institutions only in block-size Creation Units or multiples thereof. Each “creator” or authorized participant (an “Authorized Participant”) has entered into an agreement with the Fund's distributor, BlackRock Investments, LLC (the “Distributor” or “BRIL”), an affiliate of BFA. An Authorized Participant is a member or participant of a clearing agency registered with the SEC, which has a written agreement with the Fund or one of its service providers that allows such member or participant to place orders for the purchase and redemption of Creation Units.
A creation transaction, which is subject to acceptance by the Distributor and the Fund, generally takes place when an Authorized Participant deposits into the Fund a designated portfolio of securities, assets or other positions (a “creation basket”), and an amount of cash (including any cash representing the value of substituted securities, assets or other positions), if any, which together approximate the holdings of the Fund in exchange for a specified number of Creation Units. Similarly, shares can be redeemed only in Creation Units, generally for a designated portfolio of securities, assets or other positions (a “redemption basket”) held by the Fund and an amount of cash (including any portion of such securities for which cash may be substituted). The Fund generally offers Creation Units partially for cash, but may, in certain circumstances, offer Creation Units solely for cash or solely in-kind. Except when aggregated in Creation Units, shares are not redeemable by the Fund. Creation and redemption baskets may differ and the Fund may accept “custom baskets.” More information regarding custom baskets is contained in the Fund's SAI.
The prices at which creations and redemptions occur are based on the next calculation of NAV after a creation or redemption order is received in an acceptable form under the authorized participant agreement.
Only an Authorized Participant may create or redeem Creation Units with the Fund. Authorized Participants may create or redeem Creation Units for their own accounts or for customers, including, without limitation, affiliates of the Fund.
In the event of a system failure or other interruption, including disruptions at market makers or Authorized Participants, orders to purchase or redeem Creation Units either may not be executed according to the Fund's instructions or may not be executed at all, or the Fund may not be able to place or change orders.
33
To the extent the Fund engages in in-kind transactions, the Fund intends to comply with the U.S. federal securities laws in accepting securities for deposit and satisfying redemptions with redemption securities by, among other means, assuring that any securities accepted for deposit and any securities used to satisfy redemption requests will be sold in transactions that would be exempt from registration under the Securities Act of 1933, as amended (the “1933 Act”). Further, an Authorized Participant that is not a “qualified institutional buyer,” as such term is defined in Rule 144A under the 1933 Act, will not be able to receive restricted securities eligible for resale under Rule 144A.
Creations and redemptions must be made through a firm that is either a member of the Continuous Net Settlement System of the National Securities Clearing Corporation or a DTC participant that has executed an agreement with the Distributor with respect to creations and redemptions of Creation Unit aggregations. Information about the procedures regarding creation and redemption of Creation Units (including the cut-off times for receipt of creation and redemption orders) is included in the Fund's SAI.
Because new shares may be created and issued on an ongoing basis, at any point during the life of the Fund a “distribution,” as such term is used in the 1933 Act, may be occurring. Broker-dealers and other persons are cautioned that some activities on their part may, depending on the circumstances, result in their being deemed participants in a distribution in a manner that could render them statutory underwriters subject to the prospectus delivery and liability provisions of the 1933 Act. Any determination of whether one is an underwriter must take into account all the relevant facts and circumstances of each particular case.
Broker-dealers should also note that dealers who are not “underwriters” but are participating in a distribution (as contrasted to ordinary secondary transactions), and thus dealing with shares that are part of an “unsold allotment” within the meaning of Section 4(a)(3)(C) of the 1933 Act, would be unable to take advantage of the prospectus delivery exemption provided by Section 4(a)(3) of the 1933 Act. For delivery of prospectuses to exchange members, the prospectus delivery mechanism of Rule 153 under the 1933 Act is available only with respect to transactions on a national securities exchange.
Householding. Householding is an option available to certain Fund investors. Householding is a method of delivery, based on the preference of the individual investor, in which a single copy of certain shareholder documents can be delivered to investors who share the same address, even if their accounts are registered under different names. Please contact your broker-dealer if you are interested in enrolling in householding and receiving a single copy of prospectuses and other shareholder documents, or if you are currently enrolled in householding and wish to change your householding status.
34
Distribution
The Distributor or its agent distributes Creation Units for the Fund on an agency basis. The Distributor does not maintain a secondary market in shares of the Fund. The Distributor has no role in determining the policies of the Fund or the securities that are purchased or sold by the Fund. The Distributor’s principal address is 50 Hudson Yards, New York, NY 10001.
BFA or its affiliates make payments to broker-dealers, registered investment advisers, banks or other intermediaries (together, “intermediaries”) related to marketing activities and presentations, educational training programs, conferences, the development of technology platforms and reporting systems, data provision services, or their making shares of the Fund and certain other iShares funds available to their customers generally and in certain investment programs. Such payments, which may be significant to the intermediary, are not made by the Fund. Rather, such payments are made by BFA or its affiliates from their own resources, which come directly or indirectly in part from fees paid by the iShares funds complex. Payments of this type are sometimes referred to as revenue-sharing payments. A financial intermediary may make decisions about which investment options it recommends or makes available, or the level of services provided, to its customers based on the payments or other financial incentives it is eligible to receive. Therefore, such payments or other financial incentives offered or made to an intermediary create conflicts of interest between the intermediary and its customers and may cause the intermediary to recommend the Fund or other iShares funds over another investment. More information regarding these payments is contained in the Fund's SAI. Please contact your salesperson or other investment professional for more information regarding any such payments his or her firm may receive from BFA or its affiliates.
35
Financial Highlights
The financial highlights table is intended to help investors understand the Fund’s financial performance for the past five years. Certain information reflects financial results for a single share of the Fund. The total returns in the table represent the rate that an investor would have earned (or lost) on an investment in the Fund, assuming reinvestment of all dividends and distributions. This information has been audited by PricewaterhouseCoopers LLP, whose report is included, along with the Fund's financial statements, in the Fund's Annual Report (available upon request).
Financial Highlights
(For a share outstanding throughout each period)
(For a share outstanding throughout each period)
| |
iShares Emerging Markets Dividend ETF | ||||
| |
Year Ended 04/30/23 |
Year Ended 04/30/22 |
Year Ended 04/30/21 |
Year Ended 04/30/20 |
Year Ended 04/30/19 |
| Net asset value, beginning of year |
$30.59 |
$39.62 |
$30.97 |
$40.67 |
$41.91 |
| Net investment income(a) |
2.23 |
2.66 |
1.94 |
2.25 |
2.31 |
| Net realized and unrealized gain (loss)(b) |
(5.42 ) |
(8.93 ) |
8.62 |
(9.42 ) |
(1.33 ) |
| Net increase (decrease) from investment operations |
(3.19 ) |
(6.27 ) |
10.56 |
(7.17 ) |
0.98 |
| Distributions from net investment income(c) |
(2.23 ) |
(2.76 ) |
(1.91 ) |
(2.53 ) |
(2.22 ) |
| Net asset value, end of year |
$25.17 |
$30.59 |
$39.62 |
$30.97 |
$40.67 |
| Total Return(d) |
|
|
|
|
|
| Based on net asset value |
(10.01 )% |
(17.19 )%(e) |
35.51 % |
(18.44 )% |
2.68 % |
| Ratios to Average Net Assets(f) |
|
|
|
|
|
| Total expenses |
0.49 % |
0.49 % |
0.49 % |
0.49 % |
0.49 % |
| Total expenses excluding professional fees for foreign withholding tax claims |
N/A |
0.49 % |
0.49 % |
N/A |
N/A |
| Net investment income |
8.78 % |
7.03 %(g) |
5.62 %(g) |
6.00 % |
5.79 % |
| Supplemental Data |
|
|
|
|
|
| Net assets, end of year (000) |
$645,719 |
$678,989 |
$841,985 |
$585,284 |
$571,435 |
| Portfolio turnover rate(h) |
55 % |
66 % |
107 % |
15 % |
69 % |
| (a) Based on average shares outstanding. | |||||
| (b) The amounts reported for a share outstanding may not accord with the change in aggregate gains and losses in securities for the fiscal period due to the timing of capital share transactions in relation to the fluctuating market values of the Fund’s underlying securities. | |||||
| (c) Distributions for annual periods determined in accordance with U.S. federal income tax regulations. | |||||
| (d) Where applicable, assumes the reinvestment of distributions. | |||||
| (e) Includes payment received from an affiliate, which impacted the Fund’s total return. Excluding the payment from an affiliate, the Fund’s total return would have been -17.17%. | |||||
| (f) Excludes fees and expenses incurred indirectly as a result of investments in underlying funds. | |||||
| (g) Reflects positive effect of foreign withholding tax claims, net of the associated professional fees, which resulted in the following increases for the years ended April 30, 2022 and April 30, 2021, respectively : ● Ratio of net investment income to average net assets by 0.01% and 0.02%, respectively. | |||||
| (h) Portfolio turnover rate excludes in-kind transactions. | |||||
36
Index Provider
SPDJI is the Index Provider for the Underlying Index and is not affiliated with the Company, BFA, the Distributor or any of their respective affiliates.
SPDJI is a resource for index-based concepts, data and research. SPDJI provides financial, economic and investment information and analytical services to the financial community. SPDJI calculates and maintains the S&P Global 1200, which includes the S&P 500® for the U.S., the S&P Europe 350 for Continental Europe, Ireland and the U.K., the S&P/TOPIX 150 for Japan, the S&P Asia 50, the S&P/TSX 60TM for Canada, the S&P/ASX 50 and the S&P Latin America 40. SPDJI also publishes the S&P MidCap 400®, S&P SmallCap 600®, S&P Total Market Index and S&P U.S. REIT for the U.S. SPDJI calculates and maintains the S&P Global Broad Market Index (BMI) Series, a set of rules-based equity benchmarks covering developed and emerging countries around the world. Company additions to and deletions from an S&P equity index do not in any way reflect an opinion on the investment merits of the company.
BFA or its affiliates have entered into a license agreement with SPDJI to use the Underlying Index. BFA or its affiliates sublicense rights in the Underlying Index to the Company at no charge.
Disclaimers
The Underlying Index is a product of SPDJI, and has been licensed for use by BFA or its affiliates. Standard & Poor’s® and S&P® are registered trademarks of Standard & Poor’s Financial Services LLC, a division of S&P Global (“S&P”); Dow Jones® is a registered trademark of Dow Jones Trademark Holdings LLC (“Dow Jones”) and these trademarks have been licensed for use by SPDJI and sublicensed for certain purposes by the Company. The Fund is not sponsored, endorsed, sold or promoted by SPDJI, Dow Jones, S&P, or any of their respective affiliates (collectively, “S&P Dow Jones Indices”). S&P Dow Jones Indices make no representation or warranty, express or implied, to the owners of shares of the Fund or any member of the public regarding the advisability of investing in securities generally or in the Fund in particular or the ability of the Underlying Index to track general market performance. S&P Dow Jones Indices’ only relationship to the Company and BFA and their affiliates with respect to the Underlying Index is the licensing of the Underlying Index and certain trademarks, service marks and/or trade names of S&P Dow Jones Indices and/or its third party licensors. The Underlying Index is determined, composed and calculated by S&P Dow Jones Indices without regard to the Company, BFA or its affiliates or the Fund. S&P Dow Jones Indices have no obligation to take the needs of BFA or its affiliates or the owners of shares of the Fund into consideration in determining, composing or calculating the Underlying Index. S&P Dow Jones Indices are not responsible for and have not participated in the determination of the prices, and amount of shares of the Fund or the timing of the issuance or sale of such shares or in the determination or calculation of the equation by which shares of the Fund are to be converted into cash, surrendered or redeemed, as the case may be. S&P Dow Jones Indices have no obligation or liability in connection with the administration, marketing or
37
trading of shares of the Fund. There is no assurance that investment products based on the Underlying Index will accurately track index performance or provide positive investment returns. SPDJI is not an investment adviser. Inclusion of a security within an index is not a recommendation by S&P Dow Jones Indices to buy, sell, or hold such security, nor is it considered to be investment advice.
S&P DOW JONES INDICES DO NOT GUARANTEE THE ADEQUACY, ACCURACY, TIMELINESS AND/OR THE COMPLETENESS OF THE UNDERLYING INDEX OR ANY DATA RELATED THERETO OR ANY COMMUNICATION, INCLUDING BUT NOT LIMITED TO, ORAL OR WRITTEN COMMUNICATION (INCLUDING ELECTRONIC COMMUNICATIONS) WITH RESPECT THERETO. S&P DOW JONES INDICES SHALL NOT BE SUBJECT TO ANY DAMAGES OR LIABILITY FOR ANY ERRORS, OMISSIONS, OR DELAYS THEREIN. S&P DOW JONES INDICES MAKE NO EXPRESS OR IMPLIED WARRANTIES, AND EXPRESSLY DISCLAIM ALL WARRANTIES, OF MERCHANTABILITY OR FITNESS FOR A PARTICULAR PURPOSE OR USE OR AS TO RESULTS TO BE OBTAINED BY BFA OR ITS AFFILIATES, OWNERS OF SHARES OF THE FUND, OR ANY OTHER PERSON OR ENTITY FROM THE USE OF THE UNDERLYING INDEX OR WITH RESPECT TO ANY DATA RELATED THERETO. WITHOUT LIMITING ANY OF THE FOREGOING, IN NO EVENT WHATSOEVER SHALL S&P DOW JONES INDICES BE LIABLE FOR ANY INDIRECT, SPECIAL, INCIDENTAL, PUNITIVE, OR CONSEQUENTIAL DAMAGES INCLUDING, BUT NOT LIMITED TO, LOSS OF PROFITS, TRADING LOSSES, LOST TIME OR GOODWILL, EVEN IF THEY HAVE BEEN ADVISED OF THE POSSIBILITY OF SUCH DAMAGES, WHETHER IN CONTRACT, TORT, STRICT LIABILITY, OR OTHERWISE. THERE ARE NO THIRD PARTY BENEFICIARIES OF ANY AGREEMENTS OR ARRANGEMENTS BETWEEN S&P DOW JONES INDICES AND BFA OR ITS AFFILIATES, OTHER THAN THE LICENSORS OF S&P DOW JONES INDICES.
Shares of the Fund are not sponsored, endorsed or promoted by NYSE Arca. NYSE Arca makes no representation or warranty, express or implied, to the owners of shares of the Fund or any member of the public regarding the ability of the Fund to track the total return performance of the Underlying Index or the ability of the Underlying Index to track market performance. NYSE Arca is not responsible for, nor has it participated in, the determination of the compilation or the calculation of the Underlying Index, nor in the determination of the timing of, prices of, or quantities of shares of the Fund to be issued, nor in the determination or calculation of the equation by which the shares are redeemable. NYSE Arca has no obligation or liability to owners of shares of the Fund in connection with the administration, marketing or trading of shares of the Fund.
NYSE Arca does not guarantee the accuracy and/or the completeness of the Underlying Index or any data included therein. NYSE Arca makes no warranty, express or implied, as to results to be obtained by the Company on behalf of the Fund as licensee, licensee’s customers and counterparties, owners of shares of the Fund, or any other person or entity from the use of the
38
Underlying Index or any data included therein in connection with the rights licensed as described herein or for any other use. NYSE Arca makes no express or implied warranties and hereby expressly disclaims all warranties of merchantability or fitness for a particular purpose with respect to the Underlying Index or any data included therein. Without limiting any of the foregoing, in no event shall NYSE Arca have any liability for any direct, indirect, special, punitive, consequential or any other damages (including lost profits) even if notified of the possibility of such damages.
The past performance of the Underlying Index is not a guide to future performance. BFA and its affiliates do not guarantee the accuracy or the completeness of the Underlying Index or any data included therein and BFA and its affiliates shall have no liability for any errors, omissions or interruptions therein. BFA and its affiliates make no warranty, express or implied, to the owners of shares of the Fund or to any other person or entity, as to results to be obtained by the Fund from the use of the Underlying Index or any data included therein. Without limiting any of the foregoing, in no event shall BFA or its affiliates have any liability for any special, punitive, direct, indirect, consequential or any other damages (including lost profits), even if notified of the possibility of such damages.
39
Want to know more?
iShares.com | 1-800-474-2737
Information on the Fund’s net asset value, market price, premiums and discounts, and bid-ask spreads can be found at www.iShares.com. Copies of the Prospectus, SAI, shareholder reports and other information, as applicable and when available, can be found on our website at www.iShares.com. For more information about the Fund, you may request a copy of the SAI. The SAI provides detailed information about the Fund and is incorporated by reference into this Prospectus. This means that the SAI, for legal purposes, is a part of this Prospectus.
Additional information about the Fund's investments is, or will be, available in the Fund's Annual and Semi-Annual Reports to shareholders. In the Fund's Annual Report, you will find a discussion of the market conditions and investment strategies that significantly affected the Fund's performance during the last fiscal year.
If you have any questions about the Company or shares of the Fund or you wish to obtain the SAI, Semi-Annual or Annual Report free of charge, please:
| Call: |
1-800-iShares or 1-800-474-2737 (toll free) Monday through Friday, 8:30 a.m. to 6:30 p.m. (Eastern time) |
| Email: |
iSharesETFs@blackrock.com |
| Write: |
c/o BlackRock Investments, LLC 1 University Square Drive, Princeton, NJ 08540 |
Reports and other information about the Fund are available on the EDGAR database on the SEC's website at www.sec.gov, and copies of this information may be obtained, after paying a duplicating fee, by electronic request at the following e-mail address: publicinfo@sec.gov.
No person is authorized to give any information or to make any representations about the Fund and its shares not contained in this Prospectus and you should not rely on any other information. Read and keep this Prospectus for future reference.
©2023 BlackRock, Inc. All rights reserved. iSHARES® and BLACKROCK®are registered trademarks of BFA and its affiliates. All other marks are the property of their respective owners.
Investment Company Act File No.: 811-09102
IS-P-DVYE-0324
