 |
December 30, 2019 |
| (as revised March 2, 2020) |
 |
2019 Prospectus |
| • | iShares ESG MSCI EM
ETF | ESGE | NASDAQ |
|
|
S-1 |
|
|
1 |
|
|
2 |
|
|
19 |
|
|
25 |
|
|
25 |
|
|
28 |
|
|
38 |
|
|
39 |
|
|
40 |
|
|
40 |
|
|
42 |
| Ticker: ESGE | Stock Exchange: NASDAQ |
| Annual
Fund Operating Expenses (ongoing expenses that you pay each year as a percentage of the value of your investments) | ||||||
| Management
Fees |
Distribution
and Service (12b-1) Fees |
Other
Expenses1 |
Total
Annual Fund Operating Expenses | |||
| 0.25% | None | 0.00% | 0.25% | |||
| 1 | The amount rounded to 0.00%. |
| 1 Year | 3 Years | 5 Years | 10 Years | |||
| $26 | $80 | $141 | $318 |
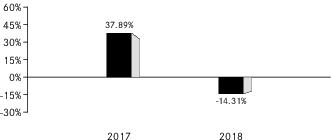
| 1 | The Fund’s year-to-date return as of September 30, 2019 was 6.35%. |
| One Year | Since
Fund Inception | ||
| (Inception Date: 6/28/2016) | |||
| Return Before Taxes | -14.31% | 10.35% | |
| Return After Taxes on Distributions1 | -14.66% | 9.94% | |
| Return After Taxes on Distributions and Sale of Fund Shares1 | -8.08% | 8.08% | |
| MSCI Emerging Markets Extended ESG Focus Index2 (Index returns do not reflect deductions for fees, expenses or taxes) | -14.53% | 11.04% |
| 1 | After-tax returns in the table above are calculated using the historical highest individual U.S. federal marginal income tax rates and do not reflect the impact of state or local taxes. Actual after-tax returns depend on an investor’s tax situation and may differ from those shown, and after-tax returns shown are not relevant to tax-exempt investors or investors who hold shares through tax-deferred arrangements, such as 401(k) plans or individual retirement accounts (“IRAs”). Fund returns after taxes on distributions and sales of Fund shares are calculated assuming that an investor has sufficient capital gains of the same character from other investments to offset any capital losses from the sale of Fund shares. As a result, Fund returns after taxes on distributions and sales of Fund shares may exceed Fund returns before taxes and/or returns after taxes on distributions. |
| 2 | Index returns through May 31, 2018 reflect the performance of the MSCI Emerging Markets ESG Focus Index. Index returns beginning on June 1, 2018 reflect the performance of the MSCI Emerging Markets Extended ESG Focus Index. This return reflects the net total return version of the Index, which is calculated including dividends but withholds taxes based on the maximum withholding tax rates applicable to dividends received by non-resident investors. The Index returns shown above assume dividends are reinvested after the deduction of withholding taxes using tax rates that may be higher than actually incurred by the Fund. |
| ■ | A lack of market liquidity and market efficiency; |
| ■ | Greater securities price volatility; |
| ■ | Exchange rate fluctuations and exchange controls; |
| ■ | Less availability of public information about issuers; |
| ■ | Limitations on foreign ownership of securities; |
| ■ | Imposition of withholding or other taxes; |
| ■ | Imposition of restrictions on the expatriation of the funds or other assets of the Fund; |
| ■ | Higher transaction and custody costs and delays in settlement procedures; |
| ■ | Difficulties in enforcing contractual obligations; |
| ■ | Lower levels of regulation of the securities markets; |
| ■ | Weaker accounting, disclosure and reporting requirements; and |
| ■ | Legal principles relating to corporate governance, directors’ fiduciary duties and liabilities and stockholders’ rights in markets in which the Fund invests may differ from and/or may not be as extensive or protective as those that apply in the U.S. |
| ■ | The risk of delays in settling portfolio transactions and the risk of loss arising out of the system of share registration and custody used in Russia; |
| ■ | Risks in connection with the maintenance of the Fund’s portfolio securities and cash with foreign sub-custodians and securities depositories, including the risk that appropriate sub-custody arrangements will not be available to the Fund; |
| ■ | The risk that the Fund’s ownership rights in portfolio securities could be lost through fraud or negligence because ownership in shares of Russian companies is recorded by the companies themselves and by registrars, rather than by a central registration system; |
| ■ | The risk that the Fund may not be able to pursue claims on behalf of its shareholders because of the system of share registration and custody, and because Russian banking institutions and registrars are not guaranteed by the Russian government; and |
| ■ | The risk that various responses by other nation-states to alleged Russian cyber activity will impact Russia’s economy and Russian issuers of securities in which the Fund invests. |
| ■ | The risk of delays in settling portfolio transactions and the risk of loss arising out of the system of share registration and custody used in certain Eastern European countries; |
| ■ | Risks in connection with the maintenance of the Fund's portfolio securities and cash with foreign sub-custodians and securities depositories, including the risk that appropriate sub-custody arrangements will not be available to the Fund; |
| ■ | The risk that the Fund's ownership rights in portfolio securities could be lost through fraud or negligence as a result of the fact that ownership in shares of certain Eastern European companies is recorded by the companies themselves and by registrars, rather than a central registration system; |
| ■ | The risk that the Fund may not be able to pursue claims on behalf of its shareholders because of the system of share registration and custody, and because certain Eastern European banking institutions and registrars are not guaranteed by their respective governments; and |
| ■ | Risks in connection with Eastern European countries' dependence on the economic health of Western European countries and the EU as a whole. |
| Approximate
Value of a Creation Unit |
Creation
Unit Size |
Standard
Creation/ Redemption Transaction Fee |
Maximum
Additional Charge for Creations* |
Maximum
Additional Charge for Redemptions* | ||||
| $3,258,000 | 100,000 | $12,400 | 3.0% | 2.0% |
| * | As a percentage of the net asset value per Creation Unit, inclusive, in the case of redemptions, of the standard redemption transaction fee. |
(For a share outstanding throughout each period)
| iShares ESG MSCI EM ETF | |||||||
| Year
Ended 08/31/19 |
Year
Ended 08/31/18(a) |
Year
Ended 08/31/17(a) |
Period
From 06/28/16(a)(b) to 08/31/16 | ||||
| Net asset value, beginning of period | $ 33.65 | $ 34.58 | $ 28.23 | $ 25.19 | |||
| Net investment income(c) | 0.91 | 0.94 | 0.85 | 0.16 | |||
| Net realized and unrealized gain (loss)(d) | (1.85) | (1.17) | 5.81 | 2.88 | |||
| Net increase (decrease) from investment operations | (0.94) | (0.23) | 6.66 | 3.04 | |||
| Distributions (e) | |||||||
| From net investment income | (0.68) | (0.70) | (0.31) | — | |||
| Total distributions | (0.68) | (0.70) | (0.31) | — | |||
| Net asset value, end of period | $ 32.03 | $ 33.65 | $ 34.58 | $28.23 | |||
| Total Return | |||||||
| Based on net asset value | (2.76)% | (0.72)% | 23.75% | 12.09% (f) | |||
| Ratios to Average Net Assets | |||||||
| Total expenses | 0.25% | 0.25% | 0.42% | 0.45% (g) | |||
| Net investment income | 2.76% | 2.63% | 2.73% | 3.26% (g) | |||
| Supplemental Data | |||||||
| Net assets, end of period (000) | $672,543 | $329,753 | $96,812 | $ 5,645 | |||
| Portfolio turnover rate(h) | 34% | 45% | 29% | 9% (f) | |||
|
(a) Per share amounts reflect a two-for-one stock split effective after the close of trading on May 24, 2018. | |||||||
| (b) Commencement of operations. | |||||||
| (c) Based on average shares outstanding. | |||||||
| (d) The amounts reported for a share outstanding may not accord with the change in aggregate gains and losses in securities for the fiscal period due to the timing of capital share transactions in relation to the fluctuating market values of the Fund’s underlying securities. | |||||||
| (e) Distributions for annual periods determined in accordance with U.S. federal income tax regulations. | |||||||
| (f) Not annualized. | |||||||
| (g) Annualized. | |||||||
| (h) Portfolio turnover rate excludes in-kind transactions. | |||||||
| Premium/Discount Range | Number of Days | Percentage of Total Days | ||
| Greater than 3.0% and Less than 3.5% | 1 | 0.23% | ||
| Greater than 2.0% and Less than 2.5% | 3 | 0.68 | ||
| Greater than 1.5% and Less than 2.0% | 9 | 2.05 | ||
| Greater than 1.0% and Less than 1.5% | 35 | 7.97 | ||
| Greater than 0.5% and Less than 1.0% | 110 | 25.07 | ||
| Greater than 0.0% and Less than 0.5% | 154 | 35.08 | ||
| At NAV | 7 | 1.59 | ||
| Less than 0.0% and Greater than -0.5% | 81 | 18.45 | ||
| Less than -0.5% and Greater than -1.0% | 24 | 5.47 | ||
| Less than -1.0% and Greater than -1.5% | 9 | 2.05 | ||
| Less than -1.5% and Greater than -2.0% | 3 | 0.68 | ||
| Less than -2.0% and Greater than -2.5% | 3 | 0.68 | ||
| 439 | 100.00% |
| Average Annual Total Returns | Cumulative Total Returns | ||||
| 1 Year | Since
Inception |
1 Year | Since
Inception | ||
| Fund NAV | (2.76)% | 9.62% | (2.76)% | 33.91% | |
| Fund Market | (3.38) | 9.53 | (3.38) | 33.55 | |
| Index | (2.55) | 10.22 | (2.55) | 36.15 | |
| The inception date of the Fund was 6/28/16. The first day of secondary market trading was 6/30/16. |
| Index performance through May 31, 2018 reflects the performance of the MSCI Emerging Markets ESG Focus Index. Index performance beginning on June 1, 2018 reflects the performance of the MSCI Emerging Markets Extended ESG Focus Index. |
| Call: | 1-800-iShares
or 1-800-474-2737 (toll free) Monday through Friday, 8:30 a.m. to 6:30 p.m. (Eastern time) |
| Email: | iSharesETFs@blackrock.com |
| Write: | c/o
BlackRock Investments, LLC 1 University Square Drive, Princeton, NJ 08540 |


|
|
December 30, 2019 |
| (as revised March 2, 2020) |
 |
2019 Prospectus |
| • | iShares MSCI Global
Silver and Metals Miners ETF | SLVP | CBOE BZX |
|
|
S-1 |
|
|
1 |
|
|
2 |
|
|
12 |
|
|
17 |
|
|
17 |
|
|
20 |
|
|
30 |
|
|
31 |
|
|
32 |
|
|
32 |
|
|
34 |
AND METALS MINERS ETF
| Ticker: SLVP | Stock Exchange: Cboe BZX |
| Annual
Fund Operating Expenses (ongoing expenses that you pay each year as a percentage of the value of your investments) | ||||||
| Management
Fees |
Distribution
and Service (12b-1) Fees |
Other
Expenses1 |
Total
Annual Fund Operating Expenses | |||
| 0.39% | None | 0.00% | 0.39% | |||
| 1 | The amount rounded to 0.00%. |
| 1 Year | 3 Years | 5 Years | 10 Years | |||
| $40 | $125 | $219 | $493 |
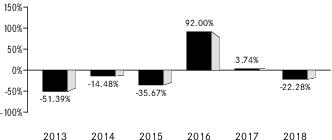
| 1 | The Fund’s year-to-date return as of September 30, 2019 was 16.37%. |
| One Year | Five Years | Since
Fund Inception | |||
| (Inception Date: 1/31/2012) | |||||
| Return Before Taxes | -22.28% | -3.16% | -13.33% | ||
| Return After Taxes on Distributions2 | -22.48% | -3.57% | -13.69% | ||
| Return After Taxes on Distributions and Sale of Fund Shares2 | -12.99% | -2.43% | -8.96% | ||
| MSCI ACWI Select Silver Miners IMI (Index returns do not reflect deductions for fees, expenses or taxes) | -22.34% | -3.18% | -13.33% |
| 2 | After-tax returns in the table above are calculated using the historical highest individual U.S. federal marginal income tax rates and do not reflect the impact of state or local taxes. Actual after-tax returns depend on an investor’s tax situation and may differ from those shown, and after-tax returns shown are not relevant to tax-exempt investors or investors who hold shares through tax-deferred arrangements, such as 401(k) plans or individual retirement accounts (“IRAs”). Fund returns after taxes on distributions and sales of Fund shares are calculated assuming that an investor has sufficient capital gains of the same character from other investments to offset any capital losses from the sale of Fund shares. As a result, Fund returns after taxes on distributions and sales of Fund shares may exceed Fund returns before taxes and/or returns after taxes on distributions. |
| ■ | A lack of market liquidity and market efficiency; |
| ■ | Greater securities price volatility; |
| ■ | Exchange rate fluctuations and exchange controls; |
| ■ | Less availability of public information about issuers; |
| ■ | Limitations on foreign ownership of securities; |
| ■ | Imposition of withholding or other taxes; |
| ■ | Imposition of restrictions on the expatriation of the funds or other assets of the Fund; |
| ■ | Higher transaction and custody costs and delays in settlement procedures; |
| ■ | Difficulties in enforcing contractual obligations; |
| ■ | Lower levels of regulation of the securities markets; |
| ■ | Weaker accounting, disclosure and reporting requirements; and |
| ■ | Legal principles relating to corporate governance, directors’ fiduciary duties and liabilities and stockholders’ rights in markets in which the Fund invests may differ from and/or may not be as extensive or protective as those that apply in the U.S. |
| Approximate
Value of a Creation Unit |
Creation
Unit Size |
Standard
Creation/ Redemption Transaction Fee |
Maximum
Additional Charge for Creations* |
Maximum
Additional Charge for Redemptions* | ||||
| $964,000 | 100,000 | $500 | 7.0% | 2.0% |
| * | As a percentage of the net asset value per Creation Unit, inclusive, in the case of redemptions, of the standard redemption transaction fee. |
(For a share outstanding throughout each period)
| iShares MSCI Global Silver and Metals Miners ETF | |||||||||
| Year
Ended 08/31/19 |
Year
Ended 08/31/18 |
Year
Ended 08/31/17 |
Year
Ended 08/31/16 |
Year
Ended 08/31/15 | |||||
| Net asset value, beginning of year | $ 8.43 | $ 11.47 | $ 13.61 | $ 6.14 | $ 12.70 | ||||
| Net investment income(a) | 0.09 | 0.10 | 0.09 | 0.05 | 0.05 | ||||
| Net realized and unrealized gain (loss)(b) | 2.40 | (3.05) | (1.94) | 7.44 | (6.42) | ||||
| Net increase (decrease) from investment operations | 2.49 | (2.95) | (1.85) | 7.49 | (6.37) | ||||
| Distributions (c) | |||||||||
| From net investment income | (0.08) | (0.09) | (0.29) | (0.02) | (0.19) | ||||
| Total distributions | (0.08) | (0.09) | (0.29) | (0.02) | (0.19) | ||||
| Net asset value, end of year | $ 10.84 | $ 8.43 | $ 11.47 | $ 13.61 | $ 6.14 | ||||
| Total Return | |||||||||
| Based on net asset value | 29.89% | (25.87)% | (13.26)% | 122.11% | (50.51)% | ||||
| Ratios to Average Net Assets | |||||||||
| Total expenses | 0.39% | 0.39% | 0.39% | 0.39% | 0.39% | ||||
| Net investment income | 0.98% | 0.94% | 0.79% | 0.47% | 0.57% | ||||
| Supplemental Data | |||||||||
| Net assets, end of year (000) | $99,757 | $50,577 | $64,258 | $87,078 | $12,279 | ||||
| Portfolio turnover rate(d) | 27% | 19% | 14% | 27% | 31% | ||||
|
(a) Based on average shares outstanding. | |||||||||
| (b) The amounts reported for a share outstanding may not accord with the change in aggregate gains and losses in securities for the fiscal period due to the timing of capital share transactions in relation to the fluctuating market values of the Fund’s underlying securities. | |||||||||
| (c) Distributions for annual periods determined in accordance with U.S. federal income tax regulations. | |||||||||
| (d) Portfolio turnover rate excludes in-kind transactions. | |||||||||
| Premium/Discount Range | Number of Days | Percentage of Total Days | ||
| Greater than 2.5% and Less than 3.0% | 1 | 0.23% | ||
| Greater than 2.0% and Less than 2.5% | 6 | 1.37 | ||
| Greater than 1.5% and Less than 2.0% | 1 | 0.23 | ||
| Greater than 1.0% and Less than 1.5% | 20 | 4.56 | ||
| Greater than 0.5% and Less than 1.0% | 116 | 26.42 | ||
| Greater than 0.0% and Less than 0.5% | 182 | 41.45 | ||
| At NAV | 3 | 0.68 | ||
| Less than 0.0% and Greater than -0.5% | 88 | 20.04 | ||
| Less than -0.5% and Greater than -1.0% | 20 | 4.56 | ||
| Less than -1.5% and Greater than -2.0% | 1 | 0.23 | ||
| Less than -2.0% and Greater than -2.5% | 1 | 0.23 | ||
| 439 | 100.00% |
| Average Annual Total Returns | Cumulative Total Returns | ||||||
| 1 Year | 5 Years | Since
Inception |
1 Year | 5 Years | Since
Inception | ||
| Fund NAV | 29.89% | (1.70)% | (9.06)% | 29.89% | (8.20)% | (51.37)% | |
| Fund Market | 30.44 | (1.83) | (9.04) | 30.44 | (8.83) | (51.28) | |
| Index | 29.75 | (1.77) | (9.07) | 29.75 | (8.56) | (51.39) | |
| The inception date of the Fund was 1/31/12. The first day of secondary market trading was 2/2/12. |
| Call: | 1-800-iShares
or 1-800-474-2737 (toll free) Monday through Friday, 8:30 a.m. to 6:30 p.m. (Eastern time) |
| Email: | iSharesETFs@blackrock.com |
| Write: | c/o
BlackRock Investments, LLC 1 University Square Drive, Princeton, NJ 08540 |

(as revised March 2, 2020)
| Funds | Ticker | Listing Exchange | ||
| iShares Core MSCI Emerging Markets ETF | IEMG | NYSE Arca | ||
| iShares Edge MSCI Min Vol Emerging Markets ETF | EEMV | Cboe BZX | ||
| iShares Edge MSCI Min Vol Global ETF | ACWV | Cboe BZX | ||
| iShares ESG MSCI EM ETF | ESGE | NASDAQ | ||
| iShares MSCI Brazil ETF | EWZ | NYSE Arca | ||
| iShares MSCI BRIC ETF | BKF | NYSE Arca | ||
| iShares MSCI Chile ETF | ECH | Cboe BZX | ||
| iShares MSCI Colombia ETF | ICOL | NYSE Arca | ||
| iShares MSCI Emerging Markets Asia ETF | EEMA | NASDAQ | ||
| iShares MSCI Emerging Markets ETF | EEM | NYSE Arca | ||
| iShares MSCI Emerging Markets Small-Cap ETF | EEMS | NYSE Arca | ||
| iShares MSCI Frontier 100 ETF | FM | NYSE Arca | ||
| iShares MSCI Global Agriculture Producers ETF | VEGI | NYSE Arca | ||
| iShares MSCI Global Energy Producers ETF | FILL | NYSE Arca | ||
| iShares MSCI Global Gold Miners ETF | RING | NASDAQ | ||
| iShares MSCI Global Metals & Mining Producers ETF | PICK | Cboe BZX | ||
| iShares MSCI Global Silver and Metals Miners ETF | SLVP | Cboe BZX | ||
| iShares MSCI Malaysia ETF | EWM | NYSE Arca | ||
| iShares MSCI South Korea ETF | EWY | NYSE Arca | ||
| iShares MSCI Taiwan ETF | EWT | NYSE Arca |
| • | iShares Core MSCI Emerging Markets ETF |
| • | iShares Edge MSCI Min Vol Emerging Markets ETF |
| • | iShares Edge MSCI Min Vol Global ETF |
| • | iShares ESG MSCI EM ETF |
| • | iShares MSCI Brazil ETF |
| • | iShares MSCI BRIC ETF |
| • | iShares MSCI Chile ETF |
| • | iShares MSCI Colombia ETF |
| • | iShares MSCI Emerging Markets Asia ETF |
| • | iShares MSCI Emerging Markets ETF |
| • | iShares MSCI Emerging Markets Small-Cap ETF |
| • | iShares MSCI Frontier 100 ETF |
| • | iShares MSCI Global Agriculture Producers ETF |
| • | iShares MSCI Global Energy Producers ETF |
| • | iShares MSCI Global Gold Miners ETF |
| • | iShares MSCI Global Metals & Mining Producers ETF |
| • | iShares MSCI Global Silver and Metals Miners ETF1 |
| • | iShares MSCI Malaysia ETF |
| • | iShares MSCI South Korea ETF |
| • | iShares MSCI Taiwan ETF |
| 1 | On November 7, 2019, the name of the Fund changed from iShares MSCI Global Silver Miners ETF to iShares MSCI Global Silver and Metals Miners ETF. |
| Diversified Funds | Non-Diversified Funds | |
| iShares Core MSCI Emerging Markets ETF | iShares MSCI Brazil ETF | |
| iShares Edge MSCI Min Vol Emerging Markets ETF | iShares MSCI Chile ETF | |
| iShares Edge MSCI Min Vol Global ETF | iShares MSCI Colombia ETF | |
| iShares ESG MSCI EM ETF | iShares MSCI Global Agriculture Producers ETF | |
| iShares MSCI BRIC ETF | iShares MSCI Global Energy Producers ETF | |
| iShares MSCI Emerging Markets Asia ETF | iShares MSCI Global Gold Miners ETF | |
| iShares MSCI Emerging Markets ETF | iShares MSCI Global Metals & Mining Producers ETF | |
| iShares MSCI Emerging Markets Small-Cap ETF | iShares MSCI Global Silver and Metals Miners ETF | |
| iShares MSCI Frontier 100 ETF | iShares MSCI Malaysia ETF | |
| iShares MSCI South Korea ETF | ||
| iShares MSCI Taiwan ETF |
| • | With respect to a foreign entity that holds the Indian assets directly, if the transferor of share or interest in such a foreign entity (along with its associated enterprises), at any time in the twelve months preceding the year of transfer neither holds the right of control or management in the foreign entity, nor holds voting power or share capital or interest exceeding 5% of the total voting power or total share capital or total interest in such foreign entity. |
| • | With respect to a foreign entity that holds the Indian assets indirectly, if the transferor of share or interest in such foreign entity (along with its associated enterprises), at any time in the twelve months preceding the year of transfer does not hold the right of control or management in relation to the foreign entity, which would entitle them to the right of control or management in the foreign entity which directly holds the Indian assets; or does not hold voting power or share capital or interest exceeding 5% of the total voting power or total share capital or total interest in the foreign entity, which results in holding the same share capital or voting power in the entity which directly holds the Indian assets. |
| • | creates rights, or obligations, which are not ordinarily created between persons dealing at arm's length; |
| • | results, directly or indirectly, in the misuse, or abuse, of the provisions of IT Act; |
| • | lacks commercial substance; or |
| • | is entered into, or carried out, by means, or in a manner, which are not ordinarily employed for bona fide purposes. |
| • | any arrangement where the aggregate tax benefit to all the parties of the arrangement in the relevant financial year does not exceed INR 30 Million; |
| • | foreign institutional investors (“FIIs”) that choose not to take any benefit under any tax treaty entered with India and has invested in listed or unlisted securities with prior permission of the competent authority in accordance with the applicable regulations; |
| • | non-resident investor in an FII who has invested in an FII, directly or indirectly, by way of an offshore derivative instrument or otherwise; or |
| • | any income derived from the transfer of shares or interests made prior to April 1, 2017. |
| • | MSCI Global Standard Indexes cover all investable large- and mid-cap securities by including the largest issuers comprising approximately 85% of each market's free float-adjusted market capitalization. |
| • | MSCI Global Large Cap Indexes provide coverage of all investable large-cap securities by including the largest issuers comprising approximately 70% of each market’s free-float adjusted market capitalization. |
| • | MSCI Global Mid Cap Indexes provide coverage in each market by deriving the difference between the market coverage of the MSCI Global Standard Index and the MSCI Global Large Cap Index in that market. |
| • | MSCI Global Small Cap Indexes provide coverage of companies with a market capitalization below that of the companies in the MSCI Global Standard Indexes. |
| • | Achieving global size integrity by ensuring that companies of comparable and relevant sizes are included in a given size segment across all markets in a composite index; and |
| • | Achieving consistent market coverage by ensuring that each market's size segment is represented in its proportional weight in the composite universe. |
| • | Semi-Annual Index Reviews (“SAIRs”), conducted on a fixed semi-annual timetable that systematically reassess the various dimensions of the equity universe for all markets; |
| • | Quarterly Index Reviews (“QIRs”), aimed at promptly reflecting other significant market events; and |
| • | Ongoing event-related changes, such as mergers, acquisitions, spin-offs, bankruptcies, reorganizations and other similar corporate events, which generally are implemented in the indexes as they occur. |
| • | The maximum weight of an index constituent will be the lower of 1.5% or 20 times its weight in the MSCI Global Standard Index; |
| • | The minimum weight of an index constituent will be 0.05%; |
| • | For countries in the MSCI Global Standard Index with weight greater than or equal to 2.5% in the parent index, the MSCI Global Minimum Volatility Indexes weight will not deviate by more than ±5% of its weight in the MSCI Global Standard Index; |
| • | For countries in the MSCI Global Standard Index with weight less than 2.5% in the parent index, the maximum MSCI Global Minimum Volatility Indexes weight will be three times its weight in the MSCI Global Standard Index; |
| • | Sector weights will not deviate by more than ±5% from its weight in the MSCI Global Standard Index; |
| • | Exposure to risk indices from Barra’s multi-factor risk model, including (i) Momentum; (ii) Value; (iii) Size; (iv) Size Nonlinearity; (v) Growth; (vi) Liquidity; and (vii) Financial Leverage will be limited to ±0.25 standard deviations relative to the MSCI Global Standard Index; exposure to the volatility risk index will be unlimited; and |
| • | The maximum one-way turnover will be 10%. |
| • | Poultry and Livestock: companies are included only if they are significantly involved in the breeding of animals by themselves or through contract farming; |
| • | Dairy: manufacturers of milk and milk products such as cheese and yogurt, are excluded due to the absence of revenue break up; |
| • | Sugar: manufacturers of sugar are included even if they do not farm sugarcane. Companies selling sweeteners, sugar free, syrups, etc. are excluded; |
| • | Edible oil: companies processing edible oil without cultivating the plantation are excluded; |
| • | Confectioneries and snacks: manufacturers of finished products are excluded due to their presence at the lower spectrum of the value chain; |
| • | Coffee: coffee companies are excluded due to their reliance on external parties for raw materials; and |
| • | Fishing: fishing companies are generally included, whether they operate fisheries or receive their catch from the ocean. |
| 1. | Concentrate its investments in a particular industry, as that term is used in the Investment Company Act, except that each Fund will concentrate to approximately the same extent that its Underlying Index concentrates in the securities of a particular industry or group of industries. |
| 2. | Borrow money, except as permitted under the Investment Company Act. |
| 3. | Issue senior securities to the extent such issuance would violate the Investment Company Act. |
| 4. | Purchase or hold real estate, except each Fund may purchase and hold securities or other instruments that are secured by, or linked to, real estate or interests therein, securities of REITs, mortgage-related securities and securities of issuers |
| engaged in the real estate business, and each Fund may purchase and hold real estate as a result of the ownership of securities or other instruments. | |
| 5. | Underwrite securities issued by others, except to the extent that the sale of portfolio securities by each Fund may be deemed to be an underwriting or as otherwise permitted by applicable law. |
| 6. | Purchase or sell commodities or commodity contracts, except as permitted by the Investment Company Act. |
| 7. | Make loans to the extent prohibited by the Investment Company Act. |
| 1. | Make loans, except as permitted under the 1940 Act, as interpreted, modified or otherwise permitted by regulatory authority having jurisdiction, from time to time; |
| 2. | Issue any senior security, except as permitted under the 1940 Act, as interpreted, modified or otherwise permitted by regulatory authority having jurisdiction, from time to time; |
| 3. | Pledge, hypothecate, mortgage or otherwise encumber its assets, except to secure permitted borrowings. (The deposit of underlying securities and other assets in escrow and collateral arrangements with respect to initial or variation margin for currency transactions and futures contracts will not be deemed to be pledges of the Fund’s assets); |
| 4. | Purchase, hold or deal in real estate, or oil, gas or mineral interests or leases, but the Fund may purchase and sell securities that are issued by companies that invest or deal in such assets; |
| 5. | Act as an underwriter of securities of other issuers, except to the extent the Fund may be deemed an underwriter in connection with the sale of securities in its portfolio; |
| 6. | Purchase securities on margin, except for such short-term credits as are necessary for the clearance of transactions, except that the Fund may make margin deposits in connection with transactions in currencies, options, futures and options on futures; |
| 7. | Sell securities short; or |
| 8. | Invest in commodities or commodity contracts, except that the Fund may buy and sell currencies and forward contracts with respect thereto, and may transact in futures contracts on securities, stock indices and currencies and options on such futures contracts and make margin deposits in connection with such contracts. |
| 1. | Concentrate its investments (i.e., invest 25% or more of its total assets in the securities of a particular industry or group of industries), except that each Fund will concentrate to approximately the same extent that its Underlying Index concentrates in the securities of such particular industry or group of industries. For purposes of this limitation, securities of the U.S. government (including its agencies and instrumentalities), repurchase agreements collateralized by U.S. government securities, and securities of state or municipal governments and their political subdivisions are not considered to be issued by members of any industry. |
| 2. | Borrow money, except that (i) each Fund may borrow from banks for temporary or emergency (not leveraging) purposes, including the meeting of redemption requests which might otherwise require the untimely disposition of securities; and (ii) each Fund may, to the extent consistent with its investment policies, enter into repurchase agreements, reverse repurchase agreements, forward roll transactions and similar investment strategies and techniques. To the extent that it engages in transactions described in (i) and (ii), each Fund will be limited so that no |
| more than 33 1/3% of the value of its total assets (including the amount borrowed) is derived from such transactions. Any borrowings which come to exceed this amount will be reduced in accordance with applicable law. | |
| 3. | Issue any senior security, except as permitted under the 1940 Act, as interpreted, modified or otherwise permitted by regulatory authority having jurisdiction, from time to time. |
| 4. | Make loans, except as permitted under the 1940 Act, as interpreted, modified or otherwise permitted by regulatory authority having jurisdiction, from time to time. |
| 5. | Purchase or sell real estate unless acquired as a result of ownership of securities or other instruments (but this restriction shall not prevent each Fund from investing in securities of companies engaged in the real estate business or securities or other instruments backed by real estate or mortgages), or commodities or commodity contracts (but this restriction shall not prevent each Fund from investing in securities of companies engaged in the production, ownership or distribution of commodities or in commodity-related businesses for the iShares Frontier 100 ETF, iShares MSCI Global Agriculture Producers ETF, iShares MSCI Global Energy Producers ETF, iShares MSCI Global Gold Miners ETF, iShares MSCI Global Metals & Mining Producers ETF and iShares MSCI Global Silver and Metals Miners ETF or from trading in futures contracts and options on futures contracts, including options on currencies to the extent consistent with each Fund’s investment objective and policies). |
| 6. | Engage in the business of underwriting securities issued by other persons, except to the extent that each Fund may technically be deemed to be an underwriter under the 1933 Act, in disposing of portfolio securities. |
| 1. | Lend any funds or other assets except through the purchase of all or a portion of an issue of securities or obligations of the type in which it is permitted to invest (including participation interests in such securities or obligations) and except that a Fund may lend its portfolio securities in an amount not to exceed 33 1/3% of the value of its total assets; |
| 2. | Issue senior securities or borrow money, except borrowings from banks for temporary or emergency purposes in an amount up to 33 1/3% of the value of the Fund’s total assets (including the amount borrowed), valued at the lesser of cost or market, less liabilities (not including the amount borrowed) valued at the time the borrowing is made, and the Fund will not purchase securities while borrowings in excess of 5% of the Fund’s total assets are outstanding, provided, that for purposes of this restriction, short-term credits necessary for the clearance of transactions are not considered borrowings; |
| 3. | Pledge, hypothecate, mortgage or otherwise encumber its assets, except to secure permitted borrowings. (The deposit of underlying securities and other assets in escrow and collateral arrangements with respect to initial or variation margin for currency transactions and futures contracts will not be deemed to be pledges of the Fund’s assets); |
| 4. | Purchase a security (other than obligations of the U.S. government, its agencies or instrumentalities) if as a result 25% or more of its total assets would be invested in a single issuer. (This restriction applies to the iShares MSCI South Korea ETF only); |
| 5. | Purchase, hold or deal in real estate, or oil, gas or mineral interests or leases, but a Fund may purchase and sell securities that are issued by companies that invest or deal in such assets; |
| 6. | Act as an underwriter of securities of other issuers, except to the extent the Fund may be deemed an underwriter in connection with the sale of securities in its portfolio; |
| 7. | Purchase securities on margin, except for such short-term credits as are necessary for the clearance of transactions, except that a Fund may make margin deposits in connection with transactions in currencies, options, futures and options on futures; |
| 8. | Sell securities short; or |
| 9. | Invest in commodities or commodity contracts, except that a Fund may buy and sell currencies and forward contracts with respect thereto, and may transact in futures contracts on securities, stock indices and currencies and options on such futures contracts and make margin deposits in connection with such contracts. |
| 1. | Concentrate its investments (i.e., invest 25% or more of its total assets in the securities of a particular industry or group of industries), except that the Fund will concentrate to approximately the same extent that the Underlying Index concentrates in the securities of such particular industry or group of industries. For purposes of this limitation, securities of the U.S. government (including its agencies and instrumentalities), repurchase agreements collateralized by U.S. government securities, and securities of state or municipal governments and their political subdivisions are not considered to be issued by members of any industry. |
| 2. | Borrow money, except that (i) the Fund may borrow from banks for temporary or emergency (not leveraging) purposes, including the meeting of redemption requests which might otherwise require the untimely disposition of securities; and (ii) the Fund may, to the extent consistent with its investment policies, enter into repurchase agreements, reverse repurchase agreements, forward roll transactions and similar investment strategies and techniques. To the extent that it engages in transactions described in (i) and (ii), the Fund will be limited so that no more than 33 1/3% of the value of its total assets (including the amount borrowed) is derived from such transactions. Any borrowings which come to exceed this amount will be reduced in accordance with applicable law. |
| 3. | Issue “senior securities” as defined in the 1940 Act and the rules, regulations and orders thereunder, except as permitted under the 1940 Act and the rules, regulation and orders thereunder. |
| 4. | Make loans, except as permitted under the 1940 Act, and as interpreted, modified or otherwise permitted by regulatory authority having jurisdiction, from time to time. |
| 5. | Purchase or sell real estate unless acquired as a result of ownership of securities or other instruments (but this restriction shall not prevent the Fund from investing in securities of companies engaged in the real estate business or securities or other instruments backed by real estate or mortgages), or commodities or commodity contracts (but this restriction shall not prevent the Fund from trading in futures contracts and options on futures contracts, including options on currencies to the extent consistent with the Fund’s investment objective and policies). |
| 6. | Engage in the business of underwriting securities issued by other persons, except to the extent that the Fund may technically be deemed to be an underwriter under the 1933 Act, in disposing of portfolio securities. |
| Fund | Industry or Industries | |
| iShares MSCI Colombia ETF | Banks | |
| iShares MSCI Colombia ETF | Oil & Gas |
| Fund | Industry or Industries | |
| iShares MSCI Frontier 100 ETF | Banks | |
| iShares MSCI Global Agriculture Producers ETF | Chemicals | |
| iShares MSCI Global Energy Producers ETF | Oil & Gas | |
| iShares MSCI Global Gold Miners ETF | Mining | |
| iShares MSCI Global Metals & Mining Producers ETF | Mining | |
| iShares MSCI Global Metals & Mining Producers ETF | Iron/Steel | |
| iShares MSCI Global Silver and Metals Miners ETF | Mining | |
| iShares MSCI Malaysia ETF | Banks | |
| iShares MSCI South Korea ETF | Semiconductors | |
| iShares MSCI Taiwan ETF | Semiconductors |
| Name (Age) | Position | Principal
Occupation(s) During the Past 5 Years |
Other
Directorships Held by Director | |||
| Robert
S. Kapito1 (62) |
Director
(since 2009). |
President, BlackRock, Inc. (since 2006); Vice Chairman of BlackRock, Inc. and Head of BlackRock’s Portfolio Management Group (since its formation in 1998) and BlackRock, Inc.’s predecessor entities (since 1988); Trustee, University of Pennsylvania (since 2009); President of Board of Directors, Hope & Heroes Children’s Cancer Fund (since 2002). | Director of BlackRock, Inc. (since 2006); Trustee of iShares Trust (since 2009); Trustee of iShares U.S. ETF Trust (since 2011). | |||
| Salim
Ramji2 (49) |
Director (since 2019). | Senior Managing Director, BlackRock, Inc. (since 2014); Global Head of BlackRock’s ETF and Index Investments Business (since 2019); Head of BlackRock’s U.S. Wealth Advisory Business (2015-2019); Global Head of Corporate Strategy, BlackRock, Inc. (2014-2015); Senior Partner, McKinsey & Company (2010-2014). | Trustee of iShares Trust (since 2019); Trustee of iShares U.S. ETF Trust (since 2019). |
| 1 | Robert S. Kapito is deemed to be an “interested person” (as defined in the 1940 Act) of the Company due to his affiliations with BlackRock, Inc. and its affiliates. |
| 2 | Salim Ramji is deemed to be an “interested person” (as defined in the 1940 Act) of the Company due to his affiliations with BlackRock, Inc. and its affiliates. |
| Name (Age) | Position | Principal
Occupation(s) During the Past 5 Years |
Other
Directorships Held by Director | |||
| Cecilia
H. Herbert (70) |
Director
(since 2005); Independent Board Chair (since 2016). |
Chair of the Finance Committee (since 2019) and Trustee and Member of the Finance, Technology and Quality Committees of Stanford Health Care (since 2016); Member of the Audit Committee (since 2018) and Trustee and Member of the Investment Committee, WNET, a New York public media company (since 2011); Chair (1994-2005) and Member (since 1992) of the Investment Committee, Archdiocese of San Francisco; Trustee of Forward Funds (14 portfolios) (2009-2018); Trustee of Salient MF Trust (4 portfolios) (2015-2018); Director (1998-2013) and President (2007-2011) of the Board of Directors, Catholic Charities CYO; Trustee (2002-2011) and Chair of the Finance and Investment Committee (2006-2010) of the Thacher School. | Trustee of iShares Trust (since 2005); Trustee of iShares U.S. ETF Trust (since 2011); Independent Board Chair of iShares Trust and iShares U.S. ETF Trust (since 2016); Trustee of Thrivent Church Loan and Income Fund (since 2019). | |||
| Jane
D. Carlin (63) |
Director
(since 2015); Risk Committee Chair (since 2016). |
Consultant (since 2012); Member of the Audit Committee (2012-2018), Chair of the Nominating and Governance Committee (2017-2018) and Director of PHH Corporation (mortgage solutions) (2012-2018); Managing Director and Global Head of Financial Holding Company Governance & Assurance and the Global Head of Operational Risk Management of Morgan Stanley (2006-2012). | Trustee of iShares Trust (since 2015); Trustee of iShares U.S. ETF Trust (since 2015); Member of the Audit Committee (since 2016) and Director of The Hanover Insurance Group, Inc. (since 2016). | |||
| Richard
L. Fagnani (65) |
Director
(since 2017); Audit Committee Chair (since 2019). |
Partner, KPMG LLP (2002-2016). | Trustee of iShares Trust (since 2017); Trustee of iShares U.S. ETF Trust (since 2017). | |||
| John
E. Kerrigan (64) |
Director
(since 2005); Nominating and Governance and Equity Plus Committee Chairs (since 2019). |
Chief Investment Officer, Santa Clara University (since 2002). | Trustee of iShares Trust (since 2005); Trustee of iShares U.S. ETF Trust (since 2011). |
| Name (Age) | Position | Principal
Occupation(s) During the Past 5 Years |
Other
Directorships Held by Director | |||
| Drew
E. Lawton (60) |
Director
(since 2017); 15(c) Committee Chair (since 2017). |
Senior Managing Director of New York Life Insurance Company (2010-2015). | Trustee of iShares Trust (since 2017); Trustee of iShares U.S. ETF Trust (since 2017). | |||
| John
E. Martinez (58) |
Director
(since 2003); Securities Lending Committee Chair (since 2019). |
Director of Real Estate Equity Exchange, Inc. (since 2005). | Trustee of iShares Trust (since 2003); Trustee of iShares U.S. ETF Trust (since 2011); Director of Cloudera Foundation (since 2017); and Director of Reading Partners (2012-2016). | |||
| Madhav
V. Rajan (55) |
Director
(since 2011); Fixed Income Plus Committee Chair (since 2019). |
Dean, and George Pratt Shultz Professor of Accounting, University of Chicago Booth School of Business (since 2017); Robert K. Jaedicke Professor of Accounting, Stanford University Graduate School of Business (2001-2017); Professor of Law (by courtesy), Stanford Law School (2005-2017); Senior Associate Dean for Academic Affairs and Head of MBA Program, Stanford University Graduate School of Business (2010-2016). | Trustee
of iShares Trust (since 2011); Trustee of iShares U.S. ETF Trust (since 2011). |
| Name (Age) | Position | Principal
Occupation(s) During the Past 5 Years | ||
| Armando
Senra (48) |
President (since 2019). | Managing Director, BlackRock, Inc. (since 2007); Head of U.S., Canada and Latam iShares, BlackRock, Inc. (since 2019); Head of Latin America Region, BlackRock, Inc. (2006-2019); Managing Director, Bank of America Merrill Lynch (1994-2006). | ||
| Trent
Walker (45) |
Treasurer
and Chief Financial Officer (since 2020). |
Managing Director of BlackRock, Inc. (since September 2019); Executive Vice President of PIMCO (2016-2019); Senior Vice President of PIMCO (2008-2015); Treasurer (2013-2019) and Assistant Treasurer (2007-2017) of PIMCO Funds, PIMCO Variable Insurance Trust, PIMCO ETF Trust, PIMCO Equity Series, PIMCO Equity Series VIT, PIMCO Managed Accounts Trust, 2 PIMCO-sponsored interval funds and 21 PIMCO-sponsored closed-end funds. |
| Name (Age) | Position | Principal
Occupation(s) During the Past 5 Years | ||
| Charles
Park (52) |
Chief Compliance Officer (since 2006). | Chief Compliance Officer of BlackRock Advisors, LLC and the BlackRock-advised Funds in the Equity-Bond Complex, the Equity-Liquidity Complex and the Closed-End Complex (since 2014); Chief Compliance Officer of BFA (since 2006). | ||
| Deepa
Damre (44) |
Secretary (since 2019). | Managing Director, BlackRock, Inc. (since 2014); Director, BlackRock, Inc. (2009-2013). | ||
| Scott
Radell (51) |
Executive
Vice President (since 2012). |
Managing Director, BlackRock, Inc. (since 2009); Head of Portfolio Solutions, BlackRock, Inc. (since 2009). | ||
| Alan
Mason (59) |
Executive
Vice President (since 2016). |
Managing Director, BlackRock, Inc. (since 2009). | ||
| Marybeth
Leithead (56) |
Executive
Vice President (since 2019). |
Managing Director, BlackRock, Inc. (since 2017); Chief Operating Officer of Americas iShares (since 2017); Portfolio Manager, Municipal Institutional & Wealth Management (2009-2016). |
| Name | Fund | Dollar
Range of Equity Securities in Named Fund |
Aggregate
Dollar Range of Equity Securities in all Registered Investment Companies Overseen by Director in Family of Investment Companies | |||
| Robert S. Kapito | None | None | None | |||
| Salim Ramji1 | iShares Commodities Select Strategy ETF | $10,001-$50,000 | Over $100,000 | |||
| iShares Core MSCI Emerging Markets ETF | Over $100,000 | |||||
| iShares Core S&P 500 ETF | $1-$10,000 | |||||
| iShares Core S&P Total U.S. Stock Market ETF | $1-$10,000 | |||||
| iShares Expanded Tech Sector ETF | $1-$10,000 | |||||
| iShares Expanded Tech-Software Sector ETF | $1-$10,000 | |||||
| iShares North American Natural Resources ETF | $10,001-$50,000 | |||||
| iShares Robotics and Artificial Intelligence Multisector ETF | $1-$10,000 | |||||
| iShares TIPS Bond ETF | $10,001-$50,000 | |||||
| Cecilia H. Herbert | iShares California Muni Bond ETF | Over $100,000 | Over $100,000 | |||
| iShares China Large-Cap ETF | $50,001-$100,000 | |||||
| iShares Core High Dividend ETF | $1-$10,000 | |||||
| iShares Core MSCI Emerging Markets ETF | $10,001-$50,000 | |||||
| iShares Core MSCI Total International Stock ETF | $10,001-$50,000 | |||||
| iShares Core S&P 500 ETF | Over $100,000 | |||||
| iShares Core S&P Small-Cap ETF | $1-$10,000 | |||||
| iShares Core S&P Total U.S. Stock Market ETF | $10,001-$50,000 | |||||
| iShares Core S&P U.S. Growth ETF | $50,001-$100,000 | |||||
| iShares Core S&P U.S. Value ETF | $50,001-$100,000 | |||||
| iShares iBoxx $ High Yield Corporate Bond ETF | $10,001-$50,000 | |||||
| iShares International Select Dividend ETF | $1-$10,000 | |||||
| iShares MSCI EAFE ETF | $1-$10,000 |
| Name | Fund | Dollar
Range of Equity Securities in Named Fund |
Aggregate
Dollar Range of Equity Securities in all Registered Investment Companies Overseen by Director in Family of Investment Companies | |||
| iShares MSCI Japan ETF | $10,001-$50,000 | |||||
| iShares National Muni Bond ETF | $10,001-$50,000 | |||||
| iShares Preferred and Income Securities ETF | $10,001-$50,000 | |||||
| Jane D. Carlin | iShares 1-3 Year Treasury Bond ETF | $50,001-$100,000 | Over $100,000 | |||
| iShares Core MSCI Emerging Markets ETF | $10,001-$50,000 | |||||
| iShares Core MSCI Total International Stock ETF | Over $100,000 | |||||
| iShares Core S&P Mid-Cap ETF | $10,001-$50,000 | |||||
| iShares Core S&P Small-Cap ETF | $50,001-$100,000 | |||||
| iShares Core U.S. Aggregate Bond ETF | Over $100,000 | |||||
| iShares Global Tech ETF | $10,001-$50,000 | |||||
| iShares MSCI ACWI ETF | Over $100,000 | |||||
| iShares MSCI ACWI ex U.S. ETF | $50,001-$100,000 | |||||
| iShares MSCI EAFE Small-Cap ETF | $10,001-$50,000 | |||||
| iShares MSCI Emerging Markets Small-Cap ETF | $10,001-$50,000 | |||||
| iShares Ultra Short-Term Bond ETF | Over $100,000 | |||||
| Richard L. Fagnani | iShares Core MSCI Emerging Markets ETF | $10,001-$50,000 | Over $100,000 | |||
| iShares Core S&P Total U.S. Stock Market ETF | $10,001-$50,000 | |||||
| iShares Core S&P U.S. Growth ETF | $10,001-$50,000 | |||||
| iShares Edge MSCI Min Vol Global ETF | $10,001-$50,000 | |||||
| iShares Edge MSCI Min Vol USA ETF | $10,001-$50,000 | |||||
| iShares Edge MSCI Min Vol USA Small-Cap ETF | $10,001-$50,000 | |||||
| iShares Edge MSCI USA Momentum Factor ETF | $10,001-$50,000 | |||||
| iShares PHLX Semiconductor ETF | $10,001-$50,000 | |||||
| iShares U.S. Consumer Services ETF | $10,001-$50,000 | |||||
| iShares U.S. Financials ETF | $10,001-$50,000 | |||||
| iShares U.S. Pharmaceuticals ETF | $10,001-$50,000 | |||||
| John E. Kerrigan | iShares MSCI ACWI ex U.S. ETF | Over $100,000 | Over $100,000 | |||
| iShares Short-Term National Muni Bond ETF | Over $100,000 | |||||
| Drew E. Lawton | iShares 0-5 Year High Yield Corporate Bond ETF | Over $100,000 | Over $100,000 | |||
| iShares Core Dividend Growth ETF | $50,001-$100,000 | |||||
| iShares Core MSCI Total International Stock ETF | $50,001-$100,000 | |||||
| iShares Core S&P Total U.S. Stock Market ETF | Over $100,000 | |||||
| iShares Exponential Technologies ETF | Over $100,000 |
| Name | Fund | Dollar
Range of Equity Securities in Named Fund |
Aggregate
Dollar Range of Equity Securities in all Registered Investment Companies Overseen by Director in Family of Investment Companies | |||
| iShares MSCI Frontier 100 ETF | $1-$10,000 | |||||
| iShares Nasdaq Biotechnology ETF | $10,001-$50,000 | |||||
| iShares Short Maturity Bond ETF | Over $100,000 | |||||
| iShares Ultra Short-Term Bond ETF | Over $100,000 | |||||
| John E. Martinez | iShares Core 5-10 Year USD Bond ETF | Over $100,000 | Over $100,000 | |||
| iShares Core MSCI EAFE ETF | Over $100,000 | |||||
| iShares Core MSCI Total International Stock ETF | $1-$10,000 | |||||
| iShares Core S&P Total U.S. Stock Market ETF | Over $100,000 | |||||
| iShares Global Consumer Staples ETF | Over $100,000 | |||||
| iShares MSCI All Country Asia ex Japan ETF | Over $100,000 | |||||
| iShares MSCI EAFE ETF | Over $100,000 | |||||
| iShares Russell 1000 ETF | Over $100,000 | |||||
| iShares Russell 1000 Value ETF | Over $100,000 | |||||
| iShares Russell 2000 ETF | Over $100,000 | |||||
| iShares Short Maturity Bond ETF | $1-$10,000 | |||||
| Madhav V. Rajan | iShares Broad USD High Yield Corporate Bond ETF | Over $100,000 | Over $100,000 | |||
| iShares Core Dividend Growth ETF | Over $100,000 | |||||
| iShares Core High Dividend ETF | Over $100,000 | |||||
| iShares Core MSCI EAFE ETF | Over $100,000 | |||||
| iShares Core S&P 500 ETF | Over $100,000 | |||||
| iShares Mortgage Real Estate ETF | Over $100,000 | |||||
| iShares Russell 2000 ETF | Over $100,000 | |||||
| iShares Select Dividend ETF | Over $100,000 | |||||
| iShares Short Maturity Bond ETF | Over $100,000 | |||||
| iShares Ultra Short-Term Bond ETF | Over $100,000 |
| 1 | Appointed to serve as an Interested Director effective June 19, 2019. |
| Name | iShares
Core MSCI Emerging Markets ETF |
iShares
Edge MSCI Min Vol Emerging Markets ETF |
iShares
Edge MSCI Min Vol Global ETF |
iShares
ESG MSCI EM ETF | ||||
| Independent Directors: | ||||||||
| Jane D. Carlin | $ 14,450 | $ 2,431 | $ 1,321 | $173 | ||||
| Richard L. Fagnani | 13,732 | 1,398 | 1,356 | 178 | ||||
| Cecilia H. Herbert | 15,317 | 1,559 | 1,513 | 198 | ||||
| Charles A. Hurty1 | 5,353 | 1,506 | 423 | 56 | ||||
| John E. Kerrigan | 13,967 | 1,422 | 1,379 | 181 | ||||
| Drew E. Lawton | 13,380 | 1,362 | 1,321 | 173 | ||||
| John E. Martinez | 13,380 | 1,362 | 1,321 | 173 | ||||
| Madhav V. Rajan | 13,380 | 1,362 | 1,321 | 173 | ||||
| Interested Directors: | ||||||||
| Robert S. Kapito | $ 0 | $ 0 | $ 0 | $0 | ||||
| Salim Ramji2 | 0 | 0 | 0 | 0 | ||||
| Mark K. Wiedman3 | 0 | 0 | 0 | 0 |
| Name | iShares
MSCI Brazil ETF |
iShares
MSCI BRIC ETF |
iShares
MSCI Chile ETF |
iShares
MSCI Colombia ETF | ||||
| Independent Directors: | ||||||||
| Jane D. Carlin | $ 2,142 | $ 1,112 | $ 86 | $6 | ||||
| Richard L. Fagnani | 2,198 | 44 | 88 | 6 | ||||
| Cecilia H. Herbert | 2,452 | 49 | 98 | 7 | ||||
| Charles A. Hurty1 | 686 | 1,083 | 27 | 2 | ||||
| John E. Kerrigan | 2,236 | 44 | 90 | 7 | ||||
| Drew E. Lawton | 2,142 | 43 | 86 | 6 | ||||
| John E. Martinez | 2,142 | 43 | 86 | 6 | ||||
| Madhav V. Rajan | 2,142 | 43 | 86 | 6 | ||||
| Interested Directors: | ||||||||
| Robert S. Kapito | $ 0 | $ 0 | $ 0 | $0 | ||||
| Salim Ramji2 | 0 | 0 | 0 | 0 | ||||
| Mark K. Wiedman3 | 0 | 0 | 0 | 0 |
| Name | iShares
MSCI Emerging Markets Asia ETF |
iShares
MSCI Emerging Markets ETF |
iShares
MSCI Emerging Markets Small-Cap ETF |
iShares
MSCI Frontier 100 ETF | ||||
| Independent Directors: | ||||||||
| Jane D. Carlin | $1,189 | $6,992 | $1,133 | $131 |
| Name | iShares
MSCI Emerging Markets Asia ETF |
iShares
MSCI Emerging Markets ETF |
iShares
MSCI Emerging Markets Small-Cap ETF |
iShares
MSCI Frontier 100 ETF | ||||
| Richard L. Fagnani | 123 | 6,079 | 65 | 135 | ||||
| Cecilia H. Herbert | 137 | 6,780 | 72 | 150 | ||||
| Charles A. Hurty1 | 1,108 | 2,966 | 1,090 | 42 | ||||
| John E. Kerrigan | 125 | 6,183 | 66 | 137 | ||||
| Drew E. Lawton | 119 | 5,923 | 63 | 131 | ||||
| John E. Martinez | 119 | 5,923 | 63 | 131 | ||||
| Madhav V. Rajan | 119 | 5,923 | 63 | 131 | ||||
| Interested Directors: | ||||||||
| Robert S. Kapito | $ 0 | $ 0 | $ 0 | $0 | ||||
| Salim Ramji2 | 0 | 0 | 0 | 0 | ||||
| Mark K. Wiedman3 | 0 | 0 | 0 | 0 |
| Name | iShares
MSCI Global Agriculture Producers ETF |
iShares
MSCI Global Energy Producers ETF |
iShares
MSCI Global Gold Miners ETF |
iShares
MSCI Global Metals & Mining Producers ETF | ||||
| Independent Directors: | ||||||||
| Jane D. Carlin | $7 | $ 12 | $ 86 | $58 | ||||
| Richard L. Fagnani | 7 | 13 | 88 | 60 | ||||
| Cecilia H. Herbert | 8 | 14 | 98 | 67 | ||||
| Charles A. Hurty1 | 2 | 4 | 28 | 19 | ||||
| John E. Kerrigan | 7 | 13 | 90 | 61 | ||||
| Drew E. Lawton | 7 | 12 | 86 | 58 | ||||
| John E. Martinez | 7 | 12 | 86 | 58 | ||||
| Madhav V. Rajan | 7 | 12 | 86 | 58 | ||||
| Interested Directors: | ||||||||
| Robert S. Kapito | $0 | $ 0 | $ 0 | $0 | ||||
| Salim Ramji2 | 0 | 0 | 0 | 0 | ||||
| Mark K. Wiedman3 | 0 | 0 | 0 | 0 |
| Name | iShares
MSCI Global Silver and Metals Miners ETF |
iShares
MSCI Malaysia ETF |
iShares
MSCI South Korea ETF |
iShares
MSCI Taiwan ETF | ||||
| Independent Directors: | ||||||||
| Jane D. Carlin | $26 | $ 102 | $ 986 | $606 | ||||
| Richard L. Fagnani | 27 | 104 | 1,012 | 622 | ||||
| Cecilia H. Herbert | 30 | 116 | 1,129 | 694 | ||||
| Charles A. Hurty1 | 8 | 33 | 316 | 194 | ||||
| John E. Kerrigan | 28 | 106 | 1,029 | 633 | ||||
| Drew E. Lawton | 26 | 102 | 986 | 606 | ||||
| John E. Martinez | 26 | 102 | 986 | 606 | ||||
| Madhav V. Rajan | 26 | 102 | 986 | 606 | ||||
| Interested Directors: | ||||||||
| Name | iShares
MSCI Global Silver and Metals Miners ETF |
iShares
MSCI Malaysia ETF |
iShares
MSCI South Korea ETF |
iShares
MSCI Taiwan ETF | ||||
| Robert S. Kapito | $0 | $0 | $0 | $0 | ||||
| Salim Ramji2 | 0 | 0 | 0 | 0 | ||||
| Mark K. Wiedman3 | 0 | 0 | 0 | 0 |
| Name | Pension
or Retirement Benefits Accrued As Part of Company Expenses4 |
Estimated
Annual Benefits Upon Retirement4 |
Total
Compensation From the Funds and Fund Complex5 | |||
| Independent Directors: | ||||||
| Jane D. Carlin | Not Applicable | Not Applicable | $361,765 | |||
| Richard L. Fagnani | Not Applicable | Not Applicable | 350,000 | |||
| Cecilia H. Herbert | Not Applicable | Not Applicable | 405,000 | |||
| Charles A. Hurty1 | Not Applicable | Not Applicable | 376,765 | |||
| John E. Kerrigan | Not Applicable | Not Applicable | 350,000 | |||
| Drew E. Lawton | Not Applicable | Not Applicable | 350,000 | |||
| John E. Martinez | Not Applicable | Not Applicable | 350,000 | |||
| Madhav V. Rajan | Not Applicable | Not Applicable | 350,000 | |||
| Interested Directors: | ||||||
| Robert S. Kapito | Not Applicable | Not Applicable | $0 | |||
| Salim Ramji2 | Not Applicable | Not Applicable | 0 | |||
| Mark K. Wiedman3 | Not Applicable | Not Applicable | 0 |
| 1 | Served as an Independent Director through December 31, 2018. |
| 2 | Appointed to serve as an Interested Director effective June 19, 2019. |
| 3 | Served as an Interested Director through June 19, 2019. |
| 4 | No Director or officer is entitled to any pension or retirement benefits from the Company. |
| 5 | Also includes compensation for service on the Boards of Trustees for iShares Trust and iShares U.S. ETF Trust. |
| Fund | Name | Percentage
of Ownership | ||
| iShares Core MSCI Emerging Markets ETF | Merrill
Lynch, Pierce, Fenner & Smith Incorporated - TS Sub 101 Hudson Street 9th Floor Jersey City, NJ 07302-3997 |
11.84% |
| Fund | Name | Percentage
of Ownership | ||
| National
Financial Services LLC 499 Washington Blvd Jersey City, NJ 07310 |
11.47% | |||
| The
Bank of New York Mellon 111 Sanders Creek Parkway 2nd Floor East Syracuse, NY 13057 |
7.39% | |||
| Charles
Schwab & Co., Inc. 101 Montgomery Street San Francisco, CA 94014 |
5.31% | |||
| iShares Edge MSCI Min Vol Emerging Markets ETF | National
Financial Services LLC 499 Washington Blvd Jersey City, NJ 07310 |
11.07% | ||
| Charles
Schwab & Co., Inc. 101 Montgomery Street San Francisco, CA 94014 |
9.52% | |||
| JPMorgan
Chase Bank, National Association 500 Stanton Christiana Road Newark, DE 19713 |
7.66% | |||
| CDS
Clearing and Depository Services Inc. 600 De Maisonneuve Blvd W Suite 210 Montreal, QC H3A 3J2 |
5.98% | |||
| TD
Ameritrade Clearing, Inc. 4700 Alliance Gateway Freeway Fort Worth, TX 76177 |
5.83% | |||
| Bank
of America, National Association GWIM TRUST OPERATIONS 411 N. Akard Street 5th Floor Dallas, TX 75201 |
5.67% | |||
| Morgan
Stanley Smith Barney LLC One New York Plaza New York, NY 10004 |
5.48% | |||
| Merrill
Lynch, Pierce, Fenner & Smith Incorporated - TS Sub 101 Hudson Street 9th Floor Jersey City, NJ 07302-3997 |
5.43% | |||
| iShares Edge MSCI Min Vol Global ETF | Charles
Schwab & Co., Inc. 101 Montgomery Street San Francisco, CA 94014 |
11.45% | ||
| JPMorgan
Chase Bank, National Association 500 Stanton Christiana Road Newark, DE 19713 |
9.37% | |||
| National
Financial Services LLC 499 Washington Blvd Jersey City, NJ 07310 |
8.35% |
| Fund | Name | Percentage
of Ownership | ||
| TD
Ameritrade Clearing, Inc. 4700 Alliance Gateway Freeway Fort Worth, TX 76177 |
6.28% | |||
| Merrill
Lynch, Pierce, Fenner & Smith Incorporated - TS Sub 101 Hudson Street 9th Floor Jersey City, NJ 07302-3997 |
5.37% | |||
| The
Bank of New York Mellon 111 Sanders Creek Parkway 2nd Floor East Syracuse, NY 13057 |
5.23% | |||
| iShares ESG MSCI EM ETF | Merrill
Lynch, Pierce, Fenner & Smith Incorporated - TS Sub 101 Hudson Street 9th Floor Jersey City, NJ 07302-3997 |
14.50% | ||
| Charles
Schwab & Co., Inc. 101 Montgomery Street San Francisco, CA 94014 |
9.49% | |||
| Morgan
Stanley Smith Barney LLC One New York Plaza New York, NY 10004 |
8.03% | |||
| Northern
Trust Company (The) 801 South Canal Street Chicago, IL 60607 |
7.35% | |||
| Citibank,
N.A. 3800 CitiBank Center Tampa Building B/1st Floor Zone 8 Tampa, FL 33610-9122 |
7.23% | |||
| National
Financial Services LLC 499 Washington Blvd Jersey City, NJ 07310 |
7.11% | |||
| Pershing
LLC One Pershing Plaza Jersey City, NJ 07399 |
6.23% | |||
| UBS
Financial Services Inc. 1000 Harbor Blvd. Weehawken, NJ 07086 |
5.85% | |||
| iShares MSCI Brazil ETF | Brown
Brothers Harriman & Co. 525 Washington Blvd. 11th Floor Jersey City, NJ 07310 |
28.90% | ||
| State
Street Bank and Trust Company 1776 Heritage Drive North Quincy, MA 02171 |
11.52% |
| Fund | Name | Percentage
of Ownership | ||
| The
Bank of New York Mellon 111 Sanders Creek Parkway 2nd Floor East Syracuse, NY 13057 |
11.31% | |||
| Citibank,
N.A. 3800 CitiBank Center Tampa Building B/1st Floor Zone 8 Tampa, FL 33610-9122 |
7.16% | |||
| iShares MSCI BRIC ETF | National
Financial Services LLC 499 Washington Blvd Jersey City, NJ 07310 |
12.14% | ||
| Citibank,
N.A. 3800 CitiBank Center Tampa Building B/1st Floor Zone 8 Tampa, FL 33610-9122 |
8.55% | |||
| JPMorgan
Chase Bank, National Association 500 Stanton Christiana Road Newark, DE 19713 |
8.48% | |||
| Charles
Schwab & Co., Inc. 101 Montgomery Street San Francisco, CA 94014 |
7.89% | |||
| Morgan
Stanley Smith Barney LLC One New York Plaza New York, NY 10004 |
7.67% | |||
| TD
Ameritrade Clearing, Inc. 4700 Alliance Gateway Freeway Fort Worth, TX 76177 |
6.32% | |||
| Merrill
Lynch, Pierce, Fenner & Smith Incorporated 101 Hudson Street 9th Floor Jersey City, NJ 07302-3997 |
5.68% | |||
| iShares MSCI Chile ETF | Brown
Brothers Harriman & Co. 525 Washington Blvd. 11th Floor Jersey City, NJ 07310 |
22.55% | ||
| Citibank,
N.A. 3800 CitiBank Center Tampa Building B/1st Floor Zone 8 Tampa, FL 33610-9122 |
16.54% | |||
| The
Bank of New York Mellon/Mellon Trust of New England, National Association 525 William Penn Place Suite 153-0400 Pittsburgh, PA 15259 |
8.46% | |||
| State
Street Bank and Trust Company 1776 Heritage Drive North Quincy, MA 02171 |
8.38% |
| Fund | Name | Percentage
of Ownership | ||
| Pershing
LLC One Pershing Plaza Jersey City, NJ 07399 |
5.29% | |||
| iShares MSCI Colombia ETF | The
Bank of New York Mellon 111 Sanders Creek Parkway 2nd Floor East Syracuse, NY 13057 |
22.08% | ||
| State
Street Bank and Trust Company 1776 Heritage Drive North Quincy, MA 02171 |
15.09% | |||
| Citibank,
N.A. 3800 CitiBank Center Tampa Building B/1st Floor Zone 8 Tampa, FL 33610-9122 |
10.23% | |||
| Merrill
Lynch, Pierce, Fenner & Smith Incorporated 101 Hudson Street 9th Floor Jersey City, NJ 07302-3997 |
8.83% | |||
| J.P.
Morgan Securities, LLC/JPMC 500 Stanton Christiana Road Newark, DE 19713 |
5.86% | |||
| Brown
Brothers Harriman & Co. 525 Washington Blvd. 11th Floor Jersey City, NJ 07310 |
5.76% | |||
| iShares MSCI Emerging Markets Asia ETF | Citibank,
N.A. 3800 CitiBank Center Tampa Building B/1st Floor Zone 8 Tampa, FL 33610-9122 |
25.31% | ||
| Charles
Schwab & Co., Inc. 101 Montgomery Street San Francisco, CA 94014 |
14.27% | |||
| Pershing
LLC One Pershing Plaza Jersey City, NJ 07399 |
6.62% | |||
| National
Financial Services LLC 499 Washington Blvd Jersey City, NJ 07310 |
6.50% | |||
| Merrill
Lynch, Pierce, Fenner & Smith Incorporated 101 Hudson Street 9th Floor Jersey City, NJ 07302-3997 |
5.47% | |||
| Brown
Brothers Harriman & Co. 525 Washington Blvd. 11th Floor Jersey City, NJ 07310 |
5.43% | |||
| Fund | Name | Percentage
of Ownership | ||
| iShares MSCI Emerging Markets ETF | National
Financial Services LLC 499 Washington Blvd Jersey City, NJ 07310 |
8.29% | ||
| Charles
Schwab & Co., Inc. 101 Montgomery Street San Francisco, CA 94014 |
6.77% | |||
| JPMorgan
Chase Bank, National Association 500 Stanton Christiana Road Newark, DE 19713 |
5.29% | |||
| JPMorgan
Chase Bank 383 Madison Avenue New York, NY 10179 |
5.13% | |||
| iShares MSCI Emerging Markets Small-Cap ETF | National
Financial Services LLC 499 Washington Blvd Jersey City, NJ 07310 |
21.54% | ||
| Charles
Schwab & Co., Inc. 101 Montgomery Street San Francisco, CA 94014 |
19.10% | |||
| The
Bank of New York Mellon 111 Sanders Creek Parkway 2nd Floor East Syracuse, NY 13057 |
6.04% | |||
| TD
Ameritrade Clearing, Inc. 4700 Alliance Gateway Freeway Fort Worth, TX 76177 |
5.52% | |||
| Northern
Trust Company (The) 801 South Canal Street Chicago, IL 60607 |
5.16% | |||
| iShares MSCI Frontier 100 ETF | Charles
Schwab & Co., Inc. 101 Montgomery Street San Francisco, CA 94014 |
12.60% | ||
| National
Financial Services LLC 499 Washington Blvd Jersey City, NJ 07310 |
12.08% | |||
| Citibank,
N.A. 3800 CitiBank Center Tampa Building B/1st Floor Zone 8 Tampa, FL 33610-9122 |
8.44% | |||
| TD
Ameritrade Clearing, Inc. 4700 Alliance Gateway Freeway Fort Worth, TX 76177 |
7.23% | |||
| Northern
Trust Company/ United Nations Joint Staff Pension Fund 50 South LaSalle Street Chicago, IL 60675 |
6.03% | |||
| Morgan
Stanley Smith Barney LLC One New York Plaza New York, NY 10004 |
5.46% | |||
| Fund | Name | Percentage
of Ownership | ||
| iShares MSCI Global Agriculture Producers ETF | National
Financial Services LLC 499 Washington Blvd Jersey City, NJ 07310 |
28.55% | ||
| Charles
Schwab & Co., Inc. 101 Montgomery Street San Francisco, CA 94014 |
13.27% | |||
| National
Bank Financial Inc. 1155 Metcalfe Street Montreal, QC H3B 4S9 Canada |
6.55% | |||
| iShares MSCI Global Energy Producers ETF | Raymond,
James & Associates, Inc. 880 Carillon Parkway P.O. Box 12749 St. Petersburg, FL 33733 |
15.53% | ||
| National
Financial Services LLC 499 Washington Blvd Jersey City, NJ 07310 |
12.55% | |||
| Ameriprise
Enterprise Investment Services, Inc. 901 3rd Avenue South Minneapolis, MN 55474 |
12.18% | |||
| Charles
Schwab & Co., Inc. 101 Montgomery Street San Francisco, CA 94014 |
7.62% | |||
| Pershing
LLC One Pershing Plaza Jersey City, NJ 07399 |
7.54% | |||
| TD
Ameritrade Clearing, Inc. 4700 Alliance Gateway Freeway Fort Worth, TX 76177 |
6.55% | |||
| iShares MSCI Global Gold Miners ETF | National
Financial Services LLC 499 Washington Blvd Jersey City, NJ 07310 |
31.25% | ||
| Citibank,
N.A. 3800 CitiBank Center Tampa Building B/1st Floor Zone 8 Tampa, FL 33610-9122 |
9.39% | |||
| Charles
Schwab & Co., Inc. 101 Montgomery Street San Francisco, CA 94014 |
8.21% | |||
| iShares MSCI Global Metals & Mining Producers ETF | National
Financial Services LLC 499 Washington Blvd Jersey City, NJ 07310 |
15.18% | ||
| Charles
Schwab & Co., Inc. 101 Montgomery Street San Francisco, CA 94014 |
13.24% | |||
| Citibank,
N.A. 3800 CitiBank Center Tampa Building B/1st Floor Zone 8 Tampa, FL 33610-9122 |
11.29% |
| Fund | Name | Percentage
of Ownership | ||
| TD
Ameritrade Clearing, Inc. 4700 Alliance Gateway Freeway Fort Worth, TX 76177 |
10.08% | |||
| Brown
Brothers Harriman & Co. 525 Washington Blvd. 11th Floor Jersey City, NJ 07310 |
6.82% | |||
| State
Street Bank and Trust Company 1776 Heritage Drive North Quincy, MA 02171 |
6.00% | |||
| The
Bank of New York Mellon 111 Sanders Creek Parkway 2nd Floor East Syracuse, NY 13057 |
5.12% | |||
| iShares MSCI Global Silver and Metals Miners ETF | National
Financial Services LLC 499 Washington Blvd Jersey City, NJ 07310 |
30.26% | ||
| Charles
Schwab & Co., Inc. 101 Montgomery Street San Francisco, CA 94014 |
12.15% | |||
| Citibank,
N.A. 3800 CitiBank Center Tampa Building B/1st Floor Zone 8 Tampa, FL 33610-9122 |
8.07% | |||
| TD
Ameritrade Clearing, Inc. 4700 Alliance Gateway Freeway Fort Worth, TX 76177 |
6.62% | |||
| Brown
Brothers Harriman & Co. 525 Washington Blvd. 11th Floor Jersey City, NJ 07310 |
5.71% | |||
| VANGUARD
Marketing Corporation 100 Vanguard Boulevard Malvern, PA 19355 |
5.39% | |||
| iShares MSCI Malaysia ETF | State
Street Bank and Trust Company 1776 Heritage Drive North Quincy, MA 02171 |
22.75% | ||
| JPMorgan
Chase Bank, National Association 500 Stanton Christiana Road Newark, DE 19713 |
9.54% | |||
| Citibank,
N.A. 3800 CitiBank Center Tampa Building B/1st Floor Zone 8 Tampa, FL 33610-9122 |
7.18% | |||
| The
Bank of New York Mellon 111 Sanders Creek Parkway 2nd Floor East Syracuse, NY 13057 |
6.08% | |||
| Fund | Name | Percentage
of Ownership | ||
| iShares MSCI South Korea ETF | State
Street Bank and Trust Company 1776 Heritage Drive North Quincy, MA 02171 |
30.76% | ||
| Citibank,
N.A. 3800 CitiBank Center Tampa Building B/1st Floor Zone 8 Tampa, FL 33610-9122 |
11.30% | |||
| The
Bank of New York Mellon 111 Sanders Creek Parkway 2nd Floor East Syracuse, NY 13057 |
11.24% | |||
| JPMorgan
Chase Bank, National Association 500 Stanton Christiana Road Newark, DE 19713 |
9.87% | |||
| Brown
Brothers Harriman & Co. 525 Washington Blvd. 11th Floor Jersey City, NJ 07310 |
9.78% | |||
| iShares MSCI Taiwan ETF | State
Street Bank and Trust Company 1776 Heritage Drive North Quincy, MA 02171 |
36.22% | ||
| Northern
Trust Company/ United Nations Joint Staff Pension Fund 50 South LaSalle Street Chicago, IL 60675 |
15.51% | |||
| The
Bank of New York Mellon 111 Sanders Creek Parkway 2nd Floor East Syracuse, NY 13057 |
8.34% | |||
| JPMorgan
Chase Bank, National Association 500 Stanton Christiana Road Newark, DE 19713 |
7.26% | |||
| Citibank,
N.A. 3800 CitiBank Center Tampa Building B/1st Floor Zone 8 Tampa, FL 33610-9122 |
6.85% |
| Fund | Management
Fee for the Fiscal Year Ended August 31, 2019 |
Fund
Inception Date |
Management
Fees Paid Net of Waivers for Fiscal Year Ended August 31, 2019 |
Management
Fees Paid Net of Waivers for Fiscal Year Ended August 31, 2018 |
Management
Fees Paid Net of Waivers for Fiscal Year Ended August 31, 2017 | |||||
| iShares Core MSCI Emerging Markets ETF1,2 | 0.14% | 10/18/12 | $ 73,215,381 | $ 61,959,630 | $ 33,589,370 | |||||
| iShares Edge MSCI Min Vol Emerging Markets ETF3 | 0.68% | 10/18/11 | 12,863,133 | 11,242,756 | 9,640,394 | |||||
| iShares Edge MSCI Min Vol Global ETF4 | 0.32% | 10/18/11 | 8,040,816 | 7,062,153 | 6,390,164 | |||||
| iShares ESG MSCI EM ETF5 | 0.25% | 06/28/16 | 1,257,438 | 584,558 | 166,101 | |||||
| iShares MSCI Brazil ETF | 0.59% | 07/10/00 | 47,075,670 | 44,455,160 | 30,600,776 | |||||
| iShares MSCI BRIC ETF | 0.68% | 11/12/07 | 1,383,111 | 1,986,671 | 1,431,569 | |||||
| iShares MSCI Chile ETF | 0.59% | 11/12/07 | 2,396,388 | 2,866,704 | 2,558,275 | |||||
| iShares MSCI Colombia ETF | 0.61% | 06/18/13 | 123,179 | 140,281 | 109,356 | |||||
| iShares MSCI Emerging Markets Asia ETF | 0.49% | 02/08/12 | 2,273,850 | 2,762,084 | 1,400,953 | |||||
| iShares MSCI Emerging Markets ETF | 0.68% | 04/07/03 | 212,553,877 | 252,746,031 | 207,622,093 | |||||
| iShares MSCI Emerging Markets Small-Cap ETF | 0.68% | 08/16/11 | 1,733,722 | 1,980,905 | 1,264,169 | |||||
| iShares MSCI Frontier 100 ETF | 0.79% | 09/12/12 | 3,955,894 | 5,304,003 | 4,353,023 | |||||
| iShares MSCI Global Agriculture Producers ETF6 | 0.39% | 01/31/12 | 116,980 | 117,603 | 106,174 | |||||
| iShares MSCI Global Energy Producers ETF | 0.39% | 01/31/12 | 186,787 | 145,235 | 139,680 | |||||
| iShares MSCI Global Gold Miners ETF | 0.39% | 01/31/12 | 826,403 | 1,282,250 | 977,649 | |||||
| iShares MSCI Global Metals & Mining Producers ETF7 | 0.39% | 01/31/12 | 1,120,023 | 1,925,807 | 1,053,471 | |||||
| iShares MSCI Global Silver and Metals Miners ETF | 0.39% | 01/31/12 | 228,064 | 235,328 | 266,110 | |||||
| iShares MSCI Malaysia ETF | 0.49% | 03/12/96 | 2,524,782 | 2,497,078 | 1,638,179 | |||||
| iShares MSCI South Korea ETF | 0.59% | 05/09/00 | 25,262,393 | 23,961,232 | 20,609,453 |
| Fund | Management
Fee for the Fiscal Year Ended August 31, 2019 |
Fund
Inception Date |
Management
Fees Paid Net of Waivers for Fiscal Year Ended August 31, 2019 |
Management
Fees Paid Net of Waivers for Fiscal Year Ended August 31, 2018 |
Management
Fees Paid Net of Waivers for Fiscal Year Ended August 31, 2017 | |||||
| iShares MSCI Taiwan ETF | 0.59% | 06/20/00 | 19,459,461 | 22,931,584 | 19,279,639 |
| 1 | For the iShares Core MSCI Emerging Markets ETF, BFA has contractually agreed to waive a portion of its management fee such that the Fund’s total annual fund operating expenses after fee waiver will not exceed 0.14% through December 31, 2022. The contractual waiver may be terminated prior to December 31, 2022 only upon written agreement of the Company and BFA. For the fiscal years ended August 31, 2017, August 31, 2018 and August 31, 2019, BFA waived $1,137,131, $1,918,019 and $2,450,441, respectively, of its management fees. |
| 2 | Effective October 5, 2016, the management fee for the iShares Core MSCI Emerging Markets ETF is 0.14%. Prior to October 5, 2016 the management fee for the iShares Core MSCI Emerging Markets ETF was 0.16%. |
| 3 | For the iShares Edge MSCI Min Vol Emerging Markets ETF, BFA has contractually agreed to waive a portion of its management fee such that the Fund’s total annual fund operating expenses after fee waiver will not exceed 0.25% through December 31, 2023. The contractual waiver may be terminated prior to December 31, 2023 only upon written agreement of the Company and BFA. For the fiscal years ended August 31, 2017, August 31, 2018 and August 31, 2019, BFA waived, $17,417,862, $18,950,786 and $22,779,813, respectively, of its management fees. |
| 4 | For the iShares Edge MSCI Min Vol Global ETF, BFA has contractually agreed to waive a portion of its management fee such that the Fund’s total annual fund operating expenses after fee waiver will not exceed 0.20% through December 31, 2023. The contractual waiver may be terminated prior to December 31, 2023 only upon written agreement of the Company and BFA. For the fiscal years ended August 31, 2017, August 31, 2018 and August 31, 2019, BFA waived $3,893,046, $3,882,460 and $4,690,125, respectively, of its management fees. |
| 5 | Effective August 4, 2017, the management fee for the iShares ESG MSCI EM ETF is 0.25%. Prior to August 4, 2017, the management fee for the iShares ESG MSCI EM ETF was 0.45%. |
| 6 | For the iShares MSCI Global Agriculture Producers ETF, BFA has contractually agreed to waive a portion of its management fees in an amount equal to the Acquired Fund Fees and Expenses, if any, attributable to investments by the Fund in other series of iShares Trust and iShares, Inc. through December 31, 2023. The contractual waiver may be terminated prior to December 31, 2023 only upon written agreement of the Company and BFA. For the fiscal years ended August 31, 2017, August 31, 2018 and August 31, 2019, BFA waived $5,765, $5,554 and $0, respectively, of its management fees. |
| 7 | For the iShares MSCI Global Metals & Mining Producers ETF, BFA has contractually agreed to waive a portion of its management fees in an amount equal to the Acquired Fund Fees and Expenses, if any, attributable to investments by the Fund in other series of iShares Trust and iShares, Inc. through December 31, 2023. The contractual waiver may be terminated prior to December 31, 2023 only upon written agreement of the Company and BFA. For the fiscal years ended August 31, 2017, August 31, 2018 and August 31, 2019, BFA waived $0, $0 and $0, respectively, of its management fees. |
| Rachel Aguirre | ||||
| Types of Accounts | Number | Total Assets | ||
| Registered Investment Companies | 300 | $1,150,590,000,000 | ||
| Other Pooled Investment Vehicles | 151 | 590,115,000,000 | ||
| Other Accounts | 127 | 533,337,000,000 |
| Jennifer Hsui | ||||
| Types of Accounts | Number | Total Assets | ||
| Registered Investment Companies | 268 | $1,108,852,000,000 | ||
| Other Pooled Investment Vehicles | 54 | 64,180,000,000 | ||
| Other Accounts | 35 | 24,944,000,000 |
| Alan Mason | ||||
| Types of Accounts | Number | Total Assets | ||
| Registered Investment Companies | 312 | $1,155,540,000,000 | ||
| Other Pooled Investment Vehicles | 0 | N/A | ||
| Other Accounts | 1 | 251,000,000 |
| Greg Savage | ||||
| Types of Accounts | Number | Total Assets | ||
| Registered Investment Companies | 318 | $1,148,989,000,000 | ||
| Other Pooled Investment Vehicles | 15 | 1,409,000,000 | ||
| Other Accounts | 52 | 4,357,000,000 |
| Amy Whitelaw | ||||
| Types of Accounts | Number | Total Assets | ||
| Registered Investment Companies | 258 | $1,069,953,000,000 | ||
| Other Pooled Investment Vehicles | 82 | 30,209,000,000 | ||
| Other Accounts | 3 | 104,000,000 |
| Rachel Aguirre | ||||
| Types of Accounts | Number
of Other Accounts with Performance Fees Managed by Portfolio Manager |
Aggregate
of Total Assets | ||
| Registered Investment Companies | 0 | N/A | ||
| Other Pooled Investment Vehicles | 0 | N/A | ||
| Other Accounts | 0 | N/A |
| Jennifer Hsui | ||||
| Types of Accounts | Number
of Other Accounts with Performance Fees Managed by Portfolio Manager |
Aggregate
of Total Assets | ||
| Registered Investment Companies | 0 | N/A | ||
| Other Pooled Investment Vehicles | 0 | N/A | ||
| Other Accounts | 0 | N/A |
| Alan Mason | ||||
| Types of Accounts | Number
of Other Accounts with Performance Fees Managed by Portfolio Manager |
Aggregate
of Total Assets | ||
| Registered Investment Companies | 0 | N/A | ||
| Other Pooled Investment Vehicles | 0 | N/A | ||
| Other Accounts | 0 | N/A |
| Greg Savage | ||||
| Types of Accounts | Number
of Other Accounts with Performance Fees Managed by Portfolio Manager |
Aggregate
of Total Assets | ||
| Registered Investment Companies | 0 | N/A | ||
| Other Pooled Investment Vehicles | 0 | N/A | ||
| Other Accounts | 0 | N/A |
| Amy Whitelaw | ||||
| Types of Accounts | Number
of Other Accounts with Performance Fees Managed by Portfolio Manager |
Aggregate
of Total Assets | ||
| Registered Investment Companies | 0 | N/A | ||
| Other Pooled Investment Vehicles | 0 | N/A | ||
| Other Accounts | 0 | N/A |
| Rachel Aguirre | |||||||||||||||
| Dollar Range | |||||||||||||||
| Fund | None | $1 to $10k | $10,001
to $50k |
$50,001
to $100k |
$100,001
to $500k |
$500,001
to $1m |
over
$1m | ||||||||
| iShares Core MSCI Emerging Markets ETF | X | ||||||||||||||
| iShares Edge MSCI Min Vol Emerging Markets ETF | X | ||||||||||||||
| iShares Edge MSCI Min Vol Global ETF | X | ||||||||||||||
| iShares ESG MSCI EM ETF | X | ||||||||||||||
| iShares MSCI Brazil ETF | X | ||||||||||||||
| iShares MSCI BRIC ETF | X | ||||||||||||||
| iShares MSCI Chile ETF | X | ||||||||||||||
| iShares MSCI Colombia ETF | X | ||||||||||||||
| iShares MSCI Emerging Markets Asia ETF | X | ||||||||||||||
| iShares MSCI Emerging Markets ETF | X | ||||||||||||||
| iShares MSCI Emerging Markets Small-Cap ETF | X | ||||||||||||||
| iShares MSCI Frontier 100 ETF | X | ||||||||||||||
| iShares MSCI Global Agriculture Producers ETF | X | ||||||||||||||
| iShares MSCI Global Energy Producers ETF | X | ||||||||||||||
| iShares MSCI Global Gold Miners ETF | X | ||||||||||||||
| iShares MSCI Global Metals & Mining Producers ETF | X | ||||||||||||||
| iShares MSCI Global Silver and Metals Miners ETF | X | ||||||||||||||
| iShares MSCI Malaysia ETF | X | ||||||||||||||
| iShares MSCI South Korea ETF | X | ||||||||||||||
| iShares MSCI Taiwan ETF | X | ||||||||||||||
| Jennifer Hsui | |||||||||||||||
| Dollar Range | |||||||||||||||
| Fund | None | $1 to $10k | $10,001
to $50k |
$50,001
to $100k |
$100,001
to $500k |
$500,001
to $1m |
over
$1m | ||||||||
| iShares Core MSCI Emerging Markets ETF | X | ||||||||||||||
| iShares Edge MSCI Min Vol Emerging Markets ETF | X | ||||||||||||||
| Jennifer Hsui | |||||||||||||||
| Dollar Range | |||||||||||||||
| Fund | None | $1 to $10k | $10,001
to $50k |
$50,001
to $100k |
$100,001
to $500k |
$500,001
to $1m |
over
$1m | ||||||||
| iShares Edge MSCI Min Vol Global ETF | X | ||||||||||||||
| iShares ESG MSCI EM ETF | X | ||||||||||||||
| iShares MSCI Brazil ETF | X | ||||||||||||||
| iShares MSCI BRIC ETF | X | ||||||||||||||
| iShares MSCI Chile ETF | X | ||||||||||||||
| iShares MSCI Colombia ETF | X | ||||||||||||||
| iShares MSCI Emerging Markets Asia ETF | X | ||||||||||||||
| iShares MSCI Emerging Markets ETF | X | ||||||||||||||
| iShares MSCI Emerging Markets Small-Cap ETF | X | ||||||||||||||
| iShares MSCI Frontier 100 ETF | X | ||||||||||||||
| iShares MSCI Global Agriculture Producers ETF | X | ||||||||||||||
| iShares MSCI Global Energy Producers ETF | X | ||||||||||||||
| iShares MSCI Global Gold Miners ETF | X | ||||||||||||||
| iShares MSCI Global Metals & Mining Producers ETF | X | ||||||||||||||
| iShares MSCI Global Silver and Metals Miners ETF | X | ||||||||||||||
| iShares MSCI Malaysia ETF | X | ||||||||||||||
| iShares MSCI South Korea ETF | X | ||||||||||||||
| iShares MSCI Taiwan ETF | X | ||||||||||||||
| Alan Mason | |||||||||||||||
| Dollar Range | |||||||||||||||
| Fund | None | $1 to $10k | $10,001
to $50k |
$50,001
to $100k |
$100,001
to $500k |
$500,001
to $1m |
over
$1m | ||||||||
| iShares Core MSCI Emerging Markets ETF | X | ||||||||||||||
| iShares Edge MSCI Min Vol Emerging Markets ETF | X | ||||||||||||||
| iShares Edge MSCI Min Vol Global ETF | X | ||||||||||||||
| iShares ESG MSCI EM ETF | X | ||||||||||||||
| iShares MSCI Brazil ETF | X | ||||||||||||||
| iShares MSCI BRIC ETF | X | ||||||||||||||
| iShares MSCI Chile ETF | X | ||||||||||||||
| iShares MSCI Colombia ETF | X | ||||||||||||||
| iShares MSCI Emerging Markets Asia ETF | X | ||||||||||||||
| iShares MSCI Emerging Markets ETF | X | ||||||||||||||
| iShares MSCI Emerging Markets Small-Cap ETF | X | ||||||||||||||
| iShares MSCI Frontier 100 ETF | X | ||||||||||||||
| iShares MSCI Global Agriculture Producers ETF | X | ||||||||||||||
| iShares MSCI Global Energy Producers ETF | X | ||||||||||||||
| iShares MSCI Global Gold Miners ETF | X | ||||||||||||||
| iShares MSCI Global Metals & Mining Producers ETF | X | ||||||||||||||
| iShares MSCI Global Silver and Metals Miners ETF | X | ||||||||||||||
| iShares MSCI Malaysia ETF | X | ||||||||||||||
| iShares MSCI South Korea ETF | X | ||||||||||||||
| iShares MSCI Taiwan ETF | X | ||||||||||||||
| Greg Savage | |||||||||||||||
| Dollar Range | |||||||||||||||
| Fund | None | $1 to $10k | $10,001
to $50k |
$50,001
to $100k |
$100,001
to $500k |
$500,001
to $1m |
over
$1m | ||||||||
| iShares Core MSCI Emerging Markets ETF | X | ||||||||||||||
| iShares Edge MSCI Min Vol Emerging Markets ETF | X | ||||||||||||||
| iShares Edge MSCI Min Vol Global ETF | X | ||||||||||||||
| iShares ESG MSCI EM ETF | X | ||||||||||||||
| iShares MSCI Brazil ETF | X | ||||||||||||||
| iShares MSCI BRIC ETF | X | ||||||||||||||
| iShares MSCI Chile ETF | X | ||||||||||||||
| iShares MSCI Colombia ETF | X | ||||||||||||||
| iShares MSCI Emerging Markets Asia ETF | X | ||||||||||||||
| iShares MSCI Emerging Markets ETF | X | ||||||||||||||
| iShares MSCI Emerging Markets Small-Cap ETF | X | ||||||||||||||
| iShares MSCI Frontier 100 ETF | X | ||||||||||||||
| iShares MSCI Global Agriculture Producers ETF | X | ||||||||||||||
| iShares MSCI Global Energy Producers ETF | X | ||||||||||||||
| iShares MSCI Global Gold Miners ETF | X | ||||||||||||||
| iShares MSCI Global Metals & Mining Producers ETF | X | ||||||||||||||
| iShares MSCI Global Silver and Metals Miners ETF | X | ||||||||||||||
| iShares MSCI Malaysia ETF | X | ||||||||||||||
| iShares MSCI South Korea ETF | X | ||||||||||||||
| iShares MSCI Taiwan ETF | X | ||||||||||||||
| Amy Whitelaw | |||||||||||||||
| Dollar Range | |||||||||||||||
| Fund | None | $1 to $10k | $10,001
to $50k |
$50,001
to $100k |
$100,001
to $500k |
$500,001
to $1m |
over
$1m | ||||||||
| iShares Core MSCI Emerging Markets ETF | X | ||||||||||||||
| iShares Edge MSCI Min Vol Emerging Markets ETF | X | ||||||||||||||
| iShares Edge MSCI Min Vol Global ETF | X | ||||||||||||||
| iShares ESG MSCI EM ETF | X | ||||||||||||||
| iShares MSCI Brazil ETF | X | ||||||||||||||
| iShares MSCI BRIC ETF | X | ||||||||||||||
| iShares MSCI Chile ETF | X | ||||||||||||||
| iShares MSCI Colombia ETF | X | ||||||||||||||
| iShares MSCI Emerging Markets Asia ETF | X | ||||||||||||||
| iShares MSCI Emerging Markets ETF | X | ||||||||||||||
| iShares MSCI Emerging Markets Small-Cap ETF | X | ||||||||||||||
| iShares MSCI Frontier 100 ETF | X | ||||||||||||||
| iShares MSCI Global Agriculture Producers ETF | X | ||||||||||||||
| iShares MSCI Global Energy Producers ETF | X | ||||||||||||||
| iShares MSCI Global Gold Miners ETF | X | ||||||||||||||
| iShares MSCI Global Metals & Mining Producers ETF | X | ||||||||||||||
| iShares MSCI Global Silver and Metals Miners ETF | X | ||||||||||||||
| iShares MSCI Malaysia ETF | X | ||||||||||||||
| Amy Whitelaw | |||||||||||||||
| Dollar Range | |||||||||||||||
| Fund | None | $1 to $10k | $10,001
to $50k |
$50,001
to $100k |
$100,001
to $500k |
$500,001
to $1m |
over
$1m | ||||||||
| iShares MSCI South Korea ETF | X | ||||||||||||||
| iShares MSCI Taiwan ETF | X | ||||||||||||||
| Fund | Fund
Inception Date |
Administration,
Custodian, Transfer Agency Expenses Paid During Fiscal Year Ended August 31, 2019 |
Administration,
Custodian, Transfer Agency Expenses Paid During Fiscal Year Ended August 31, 2018 |
Administration,
Custodian, Transfer Agency Expenses Paid During Fiscal Year Ended August 31, 2017 | ||||
| iShares Core MSCI Emerging Markets ETF | 10/18/12 | $18,017,288 | $12,884,040 | $7,616,332 | ||||
| iShares Edge MSCI Min Vol Emerging Markets ETF | 10/18/11 | 2,737,944 | 1,956,958 | 1,807,412 | ||||
| iShares Edge MSCI Min Vol Global ETF | 10/18/11 | 432,296 | 308,580 | 289,025 | ||||
| iShares ESG MSCI EM ETF | 06/28/16 | 267,625 | 190,953 | 56,292 | ||||
| iShares MSCI Brazil ETF | 07/10/00 | 1,434,246 | 1,335,032 | 907,668 |
| Fund | Fund
Inception Date |
Administration,
Custodian, Transfer Agency Expenses Paid During Fiscal Year Ended August 31, 2019 |
Administration,
Custodian, Transfer Agency Expenses Paid During Fiscal Year Ended August 31, 2018 |
Administration,
Custodian, Transfer Agency Expenses Paid During Fiscal Year Ended August 31, 2017 | ||||
| iShares MSCI BRIC ETF | 11/12/07 | 88,597 | 88,218 | 66,316 | ||||
| iShares MSCI Chile ETF | 11/12/07 | 846,899 | 1,005,625 | 878,009 | ||||
| iShares MSCI Colombia ETF | 06/18/13 | 111,683 | 105,631 | 65,650 | ||||
| iShares MSCI Emerging Markets Asia ETF | 02/08/12 | 99,670 | 131,373 | 64,876 | ||||
| iShares MSCI Emerging Markets ETF | 04/07/03 | 10,106,064 | 10,414,722 | 8,874,046 | ||||
| iShares MSCI Emerging Markets Small-Cap ETF | 08/16/11 | 199,552 | 253,679 | 125,643 | ||||
| iShares MSCI Frontier 100 ETF | 09/12/12 | 1,880,040 | 2,194,564 | 1,794,793 | ||||
| iShares MSCI Global Agriculture Producers ETF | 01/31/12 | 36,161 | 32,808 | 19,490 | ||||
| iShares MSCI Global Energy Producers ETF | 01/31/12 | 35,064 | 28,654 | 19,311 | ||||
| iShares MSCI Global Gold Miners ETF | 01/31/12 | 33,951 | 30,447 | 32,087 | ||||
| iShares MSCI Global Metals & Mining Producers ETF | 01/31/12 | 86,283 | 113,040 | 76,811 | ||||
| iShares MSCI Global Silver and Metals Miners ETF | 01/31/12 | 25,847 | 19,779 | 13,796 | ||||
| iShares MSCI Malaysia ETF | 03/12/96 | 176,027 | 197,904 | 118,904 | ||||
| iShares MSCI South Korea ETF | 05/09/00 | 921,395 | 893,309 | 717,407 | ||||
| iShares MSCI Taiwan ETF | 06/20/00 | 1,100,662 | 980,422 | 793,486 |
| Fund | iShares
Core MSCI Emerging Markets ETF |
iShares
Edge MSCI Min Vol Emerging Markets ETF |
iShares
Edge MSCI Min Vol Global ETF |
iShares
ESG MSCI EM ETF |
| Gross
income from securities lending activities |
$102,881,921 | $ 2,256,480 | $ 928,367 | $ 397,599 |
| Fees
and/or compensation for securities lending activities and related services |
||||
| Securities
lending income paid to BTC for services as securities lending agent |
11,678,972 | 211,956 | 69,852 | 18,610 |
| Cash
collateral management expenses not included in securities lending income paid to BTC |
1,054,074 | 25,632 | 11,379 | 5,549 |
| Administrative
fees not included in securities lending income paid to BTC |
0 | 0 | 0 | 0 |
| Indemnification
fees not included in securities lending income paid to BTC |
0 | 0 | 0 | 0 |
| Rebates
(paid to borrowers) |
35,793,156 | 917,899 | 506,452 | 281,093 |
| Other
fees not included in securities lending income paid to BTC |
0 | 0 | 0 | 0 |
| Aggregate
fees/compensation for securities lending activities |
$ 48,526,202 | $ 1,155,487 | $ 587,683 | $ 305,252 |
| Net
income from securities lending activities |
$ 54,355,749 | $ 1,100,993 | $ 340,684 | $ 92,347 |
| Fund | iShares
MSCI Brazil ETF |
iShares
MSCI BRIC ETF |
iShares
MSCI Chile ETF |
iShares
MSCI Colombia ETF |
| Gross
income from securities lending activities |
N/A | $ 161,808 | N/A | $ 56 |
| Fees
and/or compensation for securities lending activities and related services |
||||
| Securities
lending income paid to BTC for services as securities lending agent |
N/A | 12,271 | N/A | 8 |
| Fund | iShares
MSCI Brazil ETF |
iShares
MSCI BRIC ETF |
iShares
MSCI Chile ETF |
iShares
MSCI Colombia ETF |
| Cash
collateral management expenses not included in securities lending income paid to BTC |
N/A | 1,936 | N/A | 0 |
| Administrative
fees not included in securities lending income paid to BTC |
0 | 0 | 0 | 0 |
| Indemnification
fees not included in securities lending income paid to BTC |
0 | 0 | 0 | 0 |
| Rebates
(paid to borrowers) |
N/A | 87,486 | N/A | 0 |
| Other
fees not included in securities lending income paid to BTC |
0 | 0 | 0 | 0 |
| Aggregate
fees/compensation for securities lending activities |
N/A | $ 101,693 | N/A | $ 8 |
| Net
income from securities lending activities |
N/A | $ 60,115 | N/A | $ 48 |
| Fund | iShares
MSCI Emerging Markets Asia ETF |
iShares
MSCI Emerging Markets ETF |
iShares
MSCI Emerging Markets Small-Cap ETF |
iShares
MSCI Frontier 100 ETF |
| Gross
income from securities lending activities |
$ 637,267 | $48,301,931 | $ 1,251,300 | $ 197,018 |
| Fees
and/or compensation for securities lending activities and related services |
||||
| Securities
lending income paid to BTC for services as securities lending agent |
38,408 | 4,257,329 | 188,467 | 21,463 |
| Cash
collateral management expenses not included in securities lending income paid to BTC |
8,525 | 575,915 | 7,669 | 1,762 |
| Fund | iShares
MSCI Emerging Markets Asia ETF |
iShares
MSCI Emerging Markets ETF |
iShares
MSCI Emerging Markets Small-Cap ETF |
iShares
MSCI Frontier 100 ETF |
| Administrative
fees not included in securities lending income paid to BTC |
0 | 0 | 0 | 0 |
| Indemnification
fees not included in securities lending income paid to BTC |
0 | 0 | 0 | 0 |
| Rebates
(paid to borrowers) |
398,335 | 23,361,171 | 120,973 | 75,145 |
| Other
fees not included in securities lending income paid to BTC |
0 | 0 | 0 | 0 |
| Aggregate
fees/compensation for securities lending activities |
$ 445,268 | $28,194,415 | $ 317,109 | $ 98,370 |
| Net
income from securities lending activities |
$ 191,999 | $ 20,107,516 | $ 934,191 | $ 98,648 |
| Fund | iShares
MSCI Global Agriculture Producers ETF |
iShares
MSCI Global Energy Producers ETF |
iShares
MSCI Global Gold Miners ETF |
iShares
MSCI Global Metals & Mining Producers ETF |
| Gross
income from securities lending activities |
$ 20,872 | $ 16,273 | $ 173,818 | $ 248,321 |
| Fees
and/or compensation for securities lending activities and related services |
||||
| Securities
lending income paid to BTC for services as securities lending agent |
3,213 | 1,133 | 15,257 | 29,444 |
| Cash
collateral management expenses not included in securities lending income paid to BTC |
142 | 195 | 2,463 | 2,066 |
| Administrative
fees not included in securities lending income paid to BTC |
0 | 0 | 0 | 0 |
| Fund | iShares
MSCI Global Agriculture Producers ETF |
iShares
MSCI Global Energy Producers ETF |
iShares
MSCI Global Gold Miners ETF |
iShares
MSCI Global Metals & Mining Producers ETF |
| Indemnification
fees not included in securities lending income paid to BTC |
0 | 0 | 0 | 0 |
| Rebates
(paid to borrowers) |
1,822 | 9,295 | 80,057 | 67,580 |
| Other
fees not included in securities lending income paid to BTC |
0 | 0 | 0 | 0 |
| Aggregate
fees/compensation for securities lending activities |
$ 5,177 | $ 10,623 | $ 97,777 | $ 99,090 |
| Net
income from securities lending activities |
$ 15,695 | $ 5,650 | $ 76,041 | $ 149,231 |
| Fund | iShares
MSCI Global Silver and Metals Miners ETF |
iShares
MSCI Malaysia ETF |
iShares
MSCI South Korea ETF |
iShares
MSCI Taiwan ETF |
| Gross
income from securities lending activities |
$ 290,474 | $ 485,370 | $ 9,920,777 | $ 6,070,705 |
| Fees
and/or compensation for securities lending activities and related services |
||||
| Securities
lending income paid to BTC for services as securities lending agent |
38,279 | 66,234 | 1,543,769 | 820,651 |
| Cash
collateral management expenses not included in securities lending income paid to BTC |
2,835 | 4,234 | 76,936 | 57,192 |
| Administrative
fees not included in securities lending income paid to BTC |
0 | 0 | 0 | 0 |
| Indemnification
fees not included in securities lending income paid to BTC |
0 | 0 | 0 | 0 |
| Rebates
(paid to borrowers) |
59,989 | 70,074 | 685,828 | 1,970,067 |
| Other
fees not included in securities lending income paid to BTC |
0 | 0 | 0 | 0 |
| Fund | iShares
MSCI Global Silver and Metals Miners ETF |
iShares
MSCI Malaysia ETF |
iShares
MSCI South Korea ETF |
iShares
MSCI Taiwan ETF |
| Aggregate
fees/compensation for securities lending activities |
$ 101,103 | $ 140,542 | $ 2,306,533 | $ 2,847,910 |
| Net
income from securities lending activities |
$ 189,371 | $ 344,828 | $ 7,614,244 | $ 3,222,795 |
| Fund | Fund
Inception Date |
Brokerage
Commissions Paid During Fiscal Year Ended August 31, 2019 |
Brokerage
Commissions Paid During Fiscal Year Ended August 31, 2018 |
Brokerage
Commissions Paid During Fiscal Year Ended August 31, 2017 | ||||
| iShares Core MSCI Emerging Markets ETF | 10/18/12 | $ 12,614,495 | $ 7,073,826 | $6,401,006 | ||||
| iShares Edge MSCI Min Vol Emerging Markets ETF | 10/18/11 | 2,204,789 | 1,308,714 | 997,443 | ||||
| iShares Edge MSCI Min Vol Global ETF | 10/18/11 | 595,024 | 961,447 | 233,737 | ||||
| iShares ESG MSCI EM ETF | 06/28/16 | 292,587 | 150,356 | 31,224 | ||||
| iShares MSCI Brazil ETF | 07/10/00 | 1,351,574 | 839,590 | 639,253 | ||||
| iShares MSCI BRIC ETF | 11/12/07 | 118,236 | 52,894 | 36,231 | ||||
| iShares MSCI Chile ETF | 11/12/07 | 523,035 | 439,480 | 353,383 | ||||
| iShares MSCI Colombia ETF | 06/18/13 | 42,785 | 16,839 | 8,407 | ||||
| iShares MSCI Emerging Markets Asia ETF | 02/08/12 | 80,955 | 140,666 | 80,741 | ||||
| iShares MSCI Emerging Markets ETF | 04/07/03 | 7,272,668 | 5,989,865 | 2,864,879 |
| Fund | Fund
Inception Date |
Brokerage
Commissions Paid During Fiscal Year Ended August 31, 2019 |
Brokerage
Commissions Paid During Fiscal Year Ended August 31, 2018 |
Brokerage
Commissions Paid During Fiscal Year Ended August 31, 2017 | ||||
| iShares MSCI Emerging Markets Small-Cap ETF | 08/16/11 | 90,558 | 216,268 | 67,358 | ||||
| iShares MSCI Frontier 100 ETF | 09/12/12 | 1,129,297 | 1,674,704 | 1,245,035 | ||||
| iShares MSCI Global Agriculture Producers ETF | 01/31/12 | 2,965 | 3,044 | 1,524 | ||||
| iShares MSCI Global Energy Producers ETF | 01/31/12 | 2,281 | 1,057 | 836 | ||||
| iShares MSCI Global Gold Miners ETF | 01/31/12 | 30,771 | 12,031 | 53,218 | ||||
| iShares MSCI Global Metals & Mining Producers ETF | 01/31/12 | 45,769 | 56,459 | 24,970 | ||||
| iShares MSCI Global Silver and Metals Miners ETF | 01/31/12 | 20,055 | 16,852 | 12,610 | ||||
| iShares MSCI Malaysia ETF | 03/12/96 | 311,877 | 426,999 | 112,396 | ||||
| iShares MSCI South Korea ETF | 05/09/00 | 939,977 | 1,399,864 | 476,544 | ||||
| iShares MSCI Taiwan ETF | 06/20/00 | 599,554 | 408,828 | 452,676 |
| Fund | Issuer | Market
Value of Investment | ||
| iShares Core MSCI Emerging Markets ETF | CITIC Securities Co. Ltd. | $ 47,341,713 | ||
| Eygyptian Financial Group - Hermes Holdings Co. | 8,749,481 | |||
| iShares Edge MSCI Min Vol Emerging Markets ETF | Credicorp Ltd. | $ 55,549,377 | ||
| iShares MSCI Brazil ETF | Banco Bradesco | $147,744,566 | ||
| Banco Santander Brasil SA | 99,717,268 | |||
| iShares MSCI BRIC ETF | CITIC Securities Co. Ltd. | $ 289,872 | ||
| Banco Santander Brasil SA | 247,423 | |||
| iShares MSCI Chile ETF | Banco Santander Brasil SA | $ 25,822,517 | ||
| iShares MSCI Emerging Markets Asia ETF | CITIC Securities Co. Ltd. | $ 574,164 | ||
| iShares MSCI Emerging Markets ETF | CITIC Securities Co. Ltd. | $ 24,188,523 | ||
| iShares MSCI Frontier 100 ETF | Bao Viet Holdings | $ 638,818 | ||
| Fund | Fiscal
Year Ended August 31, 2019 |
Fiscal
Year Ended August 31, 2018 | ||
| iShares Core MSCI Emerging Markets ETF | 15% | 6% | ||
| iShares Edge MSCI Min Vol Emerging Markets ETF | 24% | 22% | ||
| iShares Edge MSCI Min Vol Global ETF | 21% | 23% | ||
| iShares ESG MSCI EM ETF | 34% | 45% | ||
| iShares MSCI Brazil ETF | 16% | 30% | ||
| iShares MSCI BRIC ETF | 53% | 22% | ||
| iShares MSCI Chile ETF | 75% | 54% | ||
| iShares MSCI Colombia ETF | 88% | 26% | ||
| iShares MSCI Emerging Markets Asia ETF | 16% | 33% | ||
| iShares MSCI Emerging Markets ETF | 15% | 16% | ||
| iShares MSCI Emerging Markets Small-Cap ETF | 29% | 39% | ||
| iShares MSCI Frontier 100 ETF | 33% | 35% | ||
| iShares MSCI Global Agriculture Producers ETF | 13% | 25% | ||
| iShares MSCI Global Energy Producers ETF | 6% | 5% | ||
| iShares MSCI Global Gold Miners ETF | 15% | 4% | ||
| iShares MSCI Global Metals & Mining Producers ETF | 14% | 14% | ||
| iShares MSCI Global Silver and Metals Miners ETF | 27% | 19% | ||
| iShares MSCI Malaysia ETF | 48% | 63% | ||
| iShares MSCI South Korea ETF | 16% | 18% | ||
| iShares MSCI Taiwan ETF | 7% | 12% |
| Fund | Shares
Per Creation Unit |
Approximate
Value Per Creation Unit (U.S.$) | ||
| iShares Core MSCI Emerging Markets ETF | 600,000 | $ 29,544,000 | ||
| iShares Edge MSCI Min Vol Emerging Markets ETF | 100,000 | 5,707,000 | ||
| iShares Edge MSCI Min Vol Global ETF | 100,000 | 9,460,000 | ||
| iShares ESG MSCI EM ETF | 100,000 | 3,258,000 | ||
| iShares MSCI Brazil ETF | 50,000 | 2,096,000 | ||
| iShares MSCI BRIC ETF | 50,000 | 2,032,500 | ||
| iShares MSCI Chile ETF | 50,000 | 1,870,500 | ||
| iShares MSCI Colombia ETF | 50,000 | 630,500 | ||
| iShares MSCI Emerging Markets Asia ETF | 50,000 | 3,201,500 | ||
| iShares MSCI Emerging Markets ETF | 450,000 | 18,432,000 | ||
| iShares MSCI Emerging Markets Small-Cap ETF | 50,000 | 2,117,000 | ||
| iShares MSCI Frontier 100 ETF | 50,000 | 1,424,500 | ||
| iShares MSCI Global Agriculture Producers ETF | 50,000 | 1,378,500 | ||
| iShares MSCI Global Energy Producers ETF1 | 50,000 | 913,000 | ||
| iShares MSCI Global Gold Miners ETF | 50,000 | 1,086,000 | ||
| iShares MSCI Global Metals & Mining Producers ETF | 50,000 | 1,336,000 | ||
| iShares MSCI Global Silver and Metals Miners ETF | 100,000 | 964,000 | ||
| iShares MSCI Malaysia ETF | 75,000 | 2,088,750 | ||
| iShares MSCI South Korea ETF | 50,000 | 2,835,500 | ||
| iShares MSCI Taiwan ETF | 100,000 | 3,624,000 |
| 1 | The Shares Per Creation Unit and the Approximate Value Per Creation Unit are as of October 11, 2019. |
| Fund | Standard
Creation Transaction Fee |
Maximum
Additional Charge* | ||
| iShares Core MSCI Emerging Markets ETF | $15,000 | 7.0% | ||
| iShares Edge MSCI Min Vol Emerging Markets ETF | 6,100 | 7.0% |
| Fund | Standard
Creation Transaction Fee |
Maximum
Additional Charge* | ||
| iShares Edge MSCI Min Vol Global ETF | 4,200 | 7.0% | ||
| iShares ESG MSCI EM ETF | 12,400 | 3.0% | ||
| iShares MSCI Brazil ETF | 2,400 | 7.0% | ||
| iShares MSCI BRIC ETF | 5,900 | 7.0% | ||
| iShares MSCI Chile ETF | 3,000 | 3.0% | ||
| iShares MSCI Colombia ETF | 3,600 | 3.0% | ||
| iShares MSCI Emerging Markets Asia ETF | 15,000 | 7.0% | ||
| iShares MSCI Emerging Markets ETF | 7,700 | 7.0% | ||
| iShares MSCI Emerging Markets Small-Cap ETF | 15,000 | 7.0% | ||
| iShares MSCI Frontier 100 ETF | 6,800 | 7.0% | ||
| iShares MSCI Global Agriculture Producers ETF | 5,100 | 7.0% | ||
| iShares MSCI Global Energy Producers ETF | 6,100 | 7.0% | ||
| iShares MSCI Global Gold Miners ETF | 800 | 7.0% | ||
| iShares MSCI Global Metals & Mining Producers ETF | 8,400 | 7.0% | ||
| iShares MSCI Global Silver and Metals Miners ETF | 500 | 7.0% | ||
| iShares MSCI Malaysia ETF | 5,000 | 3.0% | ||
| iShares MSCI South Korea ETF | 4,000 | 3.0% | ||
| iShares MSCI Taiwan ETF | 4,500 | 3.0% |
| * | As a percentage of the net asset value per Creation Unit. |
| Fund | Standard
Redemption Transaction Fee |
Maximum
Additional Charge* | ||
| iShares Core MSCI Emerging Markets ETF | $ 15,000 | 2.0% | ||
| iShares Edge MSCI Min Vol Emerging Markets ETF | 6,100 | 2.0% | ||
| iShares Edge MSCI Min Vol Global ETF | 4,200 | 2.0% | ||
| iShares ESG MSCI EM ETF | 12,400 | 2.0% | ||
| iShares MSCI Brazil ETF | 2,400 | 2.0% | ||
| iShares MSCI BRIC ETF | 5,900 | 2.0% | ||
| iShares MSCI Chile ETF | 3,000 | 2.0% | ||
| iShares MSCI Colombia ETF | 3,600 | 2.0% | ||
| iShares MSCI Emerging Markets Asia ETF | 15,000 | 2.0% | ||
| iShares MSCI Emerging Markets ETF | 7,700 | 2.0% | ||
| iShares MSCI Emerging Markets Small-Cap ETF | 15,000 | 2.0% | ||
| iShares MSCI Frontier 100 ETF | 6,800 | 2.0% | ||
| iShares MSCI Global Agriculture Producers ETF | 5,100 | 2.0% | ||
| iShares MSCI Global Energy Producers ETF | 6,100 | 2.0% |
| Fund | Standard
Redemption Transaction Fee |
Maximum
Additional Charge* | ||
| iShares MSCI Global Gold Miners ETF | 800 | 2.0% | ||
| iShares MSCI Global Metals & Mining Producers ETF | 8,400 | 2.0% | ||
| iShares MSCI Global Silver and Metals Miners ETF | 500 | 2.0% | ||
| iShares MSCI Malaysia ETF | 5,000 | 2.0% | ||
| iShares MSCI South Korea ETF | 4,000 | 2.0% | ||
| iShares MSCI Taiwan ETF | 4,500 | 2.0% |
| * | As a percentage of the net asset value per Creation Unit, inclusive of the standard redemption transaction fee. |
| Fund | Non-Expiring | |
| iShares Core MSCI Emerging Markets ETF | $ 2,960,244,052 | |
| iShares Edge MSCI Min Vol Emerging Markets ETF | 682,796,848 | |
| iShares Edge MSCI Min Vol Global ETF | 107,300,323 | |
| iShares ESG MSCI EM ETF | 18,084,612 | |
| iShares MSCI Brazil ETF | 2,428,319,347 | |
| iShares MSCI BRIC ETF | 217,988,152 | |
| iShares MSCI Chile ETF | 138,772,701 | |
| iShares MSCI Colombia ETF | 11,656,921 | |
| iShares MSCI Emerging Markets Asia ETF | 45,597,073 | |
| iShares MSCI Emerging Markets ETF | 10,625,028,180 | |
| iShares MSCI Emerging Markets Small-Cap ETF | 26,517,277 | |
| iShares MSCI Frontier 100 ETF | 147,337,814 |
| Fund | Non-Expiring | |
| iShares MSCI Global Agriculture Producers ETF | 2,807,927 | |
| iShares MSCI Global Energy Producers ETF | 2,230,448 | |
| iShares MSCI Global Gold Miners ETF | 43,645,352 | |
| iShares MSCI Global Metals & Mining Producers ETF | 38,149,859 | |
| iShares MSCI Global Silver and Metals Miners ETF | 17,475,006 | |
| iShares MSCI Malaysia ETF | 54,108,940 | |
| iShares MSCI South Korea ETF | 472,501,073 | |
| iShares MSCI Taiwan ETF | 146,686,322 |
| (a) | The strategic decisions relating to its core income generating activities are taken in, or from, Mauritius; and |
| (b) | Any one of the following conditions is met: |
| (i) | The majority of the board of directors meetings are held in Mauritius; or |
| (ii) | The executive management of the Subsidiary is regularly exercised in Mauritius; |
| • | Capital gains resulting from the sale of Indian securities (including depositary receipts issued by Indian companies) acquired prior to April 1, 2017 will not be subject to tax in India, provided the Subsidiary does not have a Permanent |
| Establishment in India. Capital gains resulting from sale of shares in Indian companies acquired on or after April 1, 2017 will be subject to tax in India as per the domestic tax rates (provided below). | |
| • | Dividends on shares received from an Indian company on which dividend distribution tax has been paid are exempt from tax in the hands of the shareholders. However, the Indian company distributing dividends is subject to a dividend distribution tax at the rate of 20.36%; and |
| • | Interest paid to a Subsidiary in respect of the debt obligations of Indian issuers will be subject to Indian income tax. The tax rate, in the case of rupee-denominated debt obligations, is 43.68%. However if the Subsidiary is a SEBI registered FPI, interest income earned from June 1, 2013 to June 30, 2020 on rupee-denominated bonds of Indian companies and Government securities, will be subject to tax at the rate of 5.46%, provided that the rate of interest does not exceed the prescribed rates. In the case of foreign currency-denominated debt obligations, the tax rate is 21.84%. For approved foreign currency loans advanced from July 1, 2012 to June 30, 2020, the tax rate on interest is 5.46% and for approved foreign currency long-term bonds issued from October 1, 2014 to June 30, 2020, the tax rate on interest is 5.46%. As per the IT Act the withholding tax rate on rupee-denominated bonds issued before July 1, 2020 to 5.46%. However, the Subsidiary may claim the benefit of the provisions of the DTAA to the extent they are more beneficial. DTAA provides for a withholding rate of 7.5% on the interest payments made on or after April 1, 2017. |
| • | Long-term capital gains (being gains on sale of shares held for a period of more than twelve months) listed on a recognized stock exchange would be taxable in India at rate of 10.92%, provided Securities Transaction Tax (“STT”) has been paid, both on acquisition and sale (subject to certain transactions to which the provisions of applicability of payment of STT upon acquisition shall not be applicable) of such shares. Capital gains tax would be calculated on gains exceeding INR 0.1 million (without any indexation and foreign exchange fluctuation benefits). It may also be noted that any capital gains arising up to January 31, 2018 have been grandfathered; |
| • | Short-term capital gains (being gains on sale of shares held for a period of twelve months or less) from the sale of Indian shares listed on a recognized stock exchange will be taxed at the rate of 16.38% provided STT has been paid on the same; |
| • | Long-term capital gains (being gains on sale of shares held for a period of more than 24 months) arising to the Subsidiary from the sale of unlisted securities will be taxed at the rate of 10.92% (without indexation) and short-term capital gains (being gains on sale of shares held for a period of 24 months or less) will be taxed at the rate of 43.68%;* |
| • | Capital gains realized on sale of listed equity shares not executed on a recognized stock exchange in India would be taxed at the rate of 10.92% for long-term gains (being gains on sale of shares held for a period of more than 12 months) and at 43.68% in the case of short-term gains (being gains on sale of shares held for a period of 12 months or less);* and |
| • | Capital gains arising from the transfer of depositary receipts outside India between non-resident investors will not be subject to tax in India. These rates are subject to the beneficial provisions of the DTAA. |
| * | However, as the Subsidiary is a SEBI registered FPI, the rates will be 10.92% and 32.76%, respectively. |
| • | 0.1% payable by the buyer and 0.1% by the seller on the value of transactions of delivery based transfer of an equity share in an Indian company entered in a recognized stock exchange; |
| • | 0.001% on the value of transactions of delivery based sale of a unit of an equity oriented mutual fund entered in a recognized stock exchange, payable by the seller; |
| • | 0.025% on the value of transactions of non-delivery based sale of an equity share in an Indian company or a unit of an equity oriented mutual fund, entered in a recognized stock exchange payable by the seller; |
| • | 0.05% on the value of transactions of derivatives being options, entered in a recognized stock exchange. STT is to be paid by the seller; |
| • | 0.01% on the value of transactions of sale of derivatives being futures, entered in a recognized stock exchange. STT is to be paid by the seller; |
| • | 0.001% on the value of transactions of sale of units of an equity-oriented fund to the Mutual Fund, payable by the seller in accordance with the Finance Act, 2013; |
| • | 0.125% on the value of transactions of sale of derivatives being options, where the option is exercised, entered in a recognized stock exchange. STT is to be paid by buyer; |
| • | 0.2% on the value of transactions of the sale of unlisted shares by existing shareholders in an initial public offer. |
| • | With respect to a foreign entity that holds the Indian assets directly, if the transferor of share or interest in such a foreign entity (along with its associated enterprises), at any time in the twelve months preceding the year of transfer |
| neither holds the right of control or management in the foreign entity, nor holds voting power or share capital or interest exceeding 5% of the total voting power or total share capital or total interest in such foreign entity. | |
| • | With respect to a foreign entity that holds the Indian assets indirectly, if the transferor of share or interest in such foreign entity (along with its associated enterprises), at any time in the twelve months preceding the year of transfer does not hold the right of control or management in relation to the foreign entity, which would entitle them to the right of control or management in the foreign entity which directly holds the Indian assets; or does not hold voting power or share capital or interest exceeding 5% of the total voting power or total share capital or total interest in the foreign entity, which results in holding the same share capital or voting power in the entity which directly holds the Indian assets. |
| • | any arrangement where the aggregate tax benefit to all the parties of the arrangement in the relevant financial year does not exceed INR 30 Million; |
| • | FIIs that choose not to take any benefit under any tax treaty entered with India and have invested in listed or unlisted securities with prior permission of the competent authority in accordance with the applicable regulations; |
| • | non-resident investor in an FII who has invested in an FII, directly or indirectly, by way of an offshore derivative instrument or otherwise; or |
| • | any income derived from the transfer of shares or interests made prior to April 1, 2017. |
iShares Edge MSCI Min Vol Emerging Markets ETF
iShares MSCI Brazil ETF
iShares MSCI BRIC ETF
iShares MSCI Emerging Markets ETF
iShares MSCI Frontier 100 ETF
iShares MSCI Malaysia ETF
iShares MSCI South Korea ETF
iShares MSCI Taiwan ETF
| 1 | iShares ESG 1-5 Year USD Corporate Bond ETF, iShares ESG MSCI EAFE ETF, iShares ESG MSCI EM ETF, iShares ESG MSCI USA ETF, iShares ESG MSCI USA Leaders ETF, iShares ESG MSCI USA Small-Cap ETF, iShares ESG U.S. Aggregate Bond ETF, iShares ESG USD Corporate Bond ETF, iShares Global Green Bond ETF, iShares MSCI ACWI Low Carbon Target ETF, iShares MSCI Global Impact ETF, iShares MSCI KLD 400 Social ETF and iShares MSCI USA ESG Select ETF have separate Proxy Voting Policies. |
| • | Boards and directors |
| • | Auditors and audit-related issues |
| • | Capital structure, mergers, asset sales and other special transactions |
| • | Compensation and benefits |
| • | Environmental and social issues |
| • | General corporate governance matters and shareholder protections |
| • | establishing an appropriate corporate governance structure |
| • | supporting and overseeing management in setting long-term strategic goals, applicable measures of value-creation and milestones that will demonstrate progress, and steps taken if any obstacles are anticipated or incurred |
| • | ensuring the integrity of financial statements |
| • | making independent decisions regarding mergers, acquisitions and disposals |
| • | establishing appropriate executive compensation structures |
| • | addressing business issues, including environmental and social issues, when they have the potential to materially impact company reputation and performance |
| • | current or former employment at the company or a subsidiary within the past several years |
| • | being, or representing, a shareholder with a substantial shareholding in the company |
| • | interlocking directorships |
| • | having any other interest, business or other relationship which could, or could reasonably be perceived to, materially interfere with the director’s ability to act in the best interests of the company |
| • | BlackRock clients who may be issuers of securities or proponents of shareholder resolutions |
| • | BlackRock business partners or third parties who may be issuers of securities or proponents of shareholder resolutions |
| • | BlackRock employees who may sit on the boards of public companies held in Funds managed by BlackRock |
| • | Significant BlackRock, Inc. investors who may be issuers of securities held in Funds managed by BlackRock |
| • | Securities of BlackRock, Inc. or BlackRock investment funds held in Funds managed by BlackRock |
| • | BlackRock, Inc. board members who serve as senior executives of public companies held in Funds managed by BlackRock |
| • | Adopted the Guidelines which are designed to protect and enhance the economic value of the companies in which BlackRock invests on behalf of clients. |
| • | Established a reporting structure that separates BIS from employees with sales, vendor management or business partnership roles. In addition, BlackRock seeks to ensure that all engagements with corporate issuers, dissident shareholders or shareholder proponents are managed consistently and without regard to BlackRock’s relationship with such parties. Clients or business partners are not given special treatment or differentiated access to BIS. BIS prioritizes engagements based on factors including but not limited to our need for additional information to make a voting decision or our view on the likelihood that an engagement could lead to positive outcome(s) over time for the economic value of the company. Within the normal course of business, BIS may engage directly with BlackRock clients, business partners and/or third parties, and/or with employees with sales, vendor management or business partnership roles, in discussions regarding our approach to stewardship, general corporate governance matters, client reporting needs, and/or to otherwise ensure that proxy-related client service levels are met. |
| • | Determined to engage, in certain instances, an independent fiduciary to vote proxies as a further safeguard to avoid potential conflicts of interest, to satisfy regulatory compliance requirements, or as may be otherwise required by applicable law. In such circumstances, the independent fiduciary provides BlackRock’s proxy voting agent with instructions, in accordance with the Guidelines, as to how to vote such proxies, and BlackRock’s proxy voting agent votes the proxy in accordance with the independent fiduciary’s determination. BlackRock uses an independent fiduciary to vote proxies of (i) any company that is affiliated with BlackRock, Inc., (ii) any public company that includes BlackRock employees on its board of directors, (iii) The PNC Financial Services Group, Inc., (iv) any public company of which a BlackRock, Inc. board member serves as a senior executive, and (v) companies when legal or regulatory requirements compel BlackRock to use an independent fiduciary. In selecting an independent fiduciary, we assess several characteristics, including but not limited to: independence, an ability to analyze proxy issues and vote in the best economic interest of our clients, reputation for reliability and integrity, and operational capacity to accurately deliver the assigned votes in a timely manner. We may engage more than one independent fiduciary, in part in order to mitigate potential or perceived conflicts of interest at an independent fiduciary. The Global Committee appoints and reviews the performance of the independent fiduciar(ies), generally on an annual basis. |
| • | The company has already taken sufficient steps to address the concern |
| • | The company is in the process of actively implementing a response |
| • | There is a clear and material economic disadvantage to the company in the near-term if the issue is not addressed in the manner requested by the shareholder proposal |
| 1 | As envisioned by the United Nations Framework Convention on Climate Change (“UNFCC”) Conference of the Parties to the Paris Climate Accord in 2015. |
| 2019 | ||||||
| Country | Trade
Date |
Settlement
Date |
Number
of Days to Settle | |||
| Australia | 04/18/19 | 04/26/19 | 8 | |||
| 12/23/19 | 01/02/20 | 10 | ||||
| Bangladesh | 05/29/19 | 06/09/19 | 11 | |||
| 05/30/19 | 06/10/19 | 11 | ||||
| 06/03/19 | 06/11/19 | 8 | ||||
| 08/06/19 | 08/14/19 | 8 | ||||
| 08/07/19 | 08/18/19 | 11 | ||||
| 08/08/19 | 08/19/19 | 11 | ||||
| China | 01/30/19 | 02/11/19 | 12 | |||
| 01/31/19 | 02/12/19 | 12 | ||||
| 02/01/19 | 02/13/19 | 12 | ||||
| 09/26/19 | 10/08/19 | 12 | ||||
| 09/27/19 | 10/09/19 | 12 | ||||
| 09/30/19 | 10/10/19 | 10 | ||||
| 2019 | ||||||
| Country | Trade
Date |
Settlement
Date |
Number
of Days to Settle | |||
| China Connect – Stock Connect | 02/01/19 | 02/11/19 | 10 | |||
| 09/30/19 | 10/08/19 | 8 | ||||
| Cyprus | 04/24/19 | 05/02/19 | 8 | |||
| 04/25/19 | 05/03/19 | 8 | ||||
| Hungary | 12/20/19 | 12/30/19 | 10 | |||
| 12/23/19 | 12/31/19 | 8 | ||||
| Indonesia | 05/29/19 | 06/10/19 | 12 | |||
| 05/31/19 | 06/11/19 | 11 | ||||
| Japan | 04/24/19 | 05/07/19 | 13 | |||
| 04/25/19 | 05/08/19 | 13 | ||||
| 04/26/19 | 05/09/19 | 13 | ||||
| 12/26/19 | 01/06/20 | 11 | ||||
| 12/27/19 | 01/07/20 | 11 | ||||
| 12/30/19 | 01/08/20 | 9 | ||||
| Jordan | 08/07/19 | 08/15/19 | 8 | |||
| 08/08/19 | 08/18/19 | 10 | ||||
| Kuwait | 08/06/19 | 08/14/19 | 8 | |||
| 08/07/19 | 08/15/19 | 8 | ||||
| 08/08/19 | 08/18/19 | 10 | ||||
| Malawi | 01/08/19 | 01/16/19 | 8 | |||
| 01/09/19 | 01/17/19 | 8 | ||||
| 01/10/19 | 01/18/19 | 8 | ||||
| 01/11/19 | 01/21/19 | 10 | ||||
| 01/14/19 | 01/22/19 | 8 | ||||
| 02/25/19 | 03/05/19 | 8 | ||||
| 02/26/19 | 03/06/19 | 8 | ||||
| 02/27/19 | 03/07/19 | 8 | ||||
| 02/28/19 | 03/08/19 | 8 | ||||
| 03/01/19 | 03/11/19 | 10 | ||||
| 04/12/19 | 04/23/19 | 11 | ||||
| 04/15/19 | 04/24/19 | 9 | ||||
| 04/16/19 | 04/25/19 | 9 | ||||
| 04/17/19 | 04/26/19 | 9 | ||||
| 04/18/19 | 04/29/19 | 11 | ||||
| 04/24/19 | 05/02/19 | 8 | ||||
| 04/25/19 | 05/03/19 | 8 | ||||
| 04/26/19 | 05/06/19 | 10 | ||||
| 04/29/19 | 05/07/19 | 8 | ||||
| 04/30/19 | 05/08/19 | 8 | ||||
| 05/07/19 | 05/15/19 | 8 | ||||
| 05/08/19 | 05/16/19 | 8 | ||||
| 05/09/19 | 05/17/19 | 8 | ||||
| 05/10/19 | 05/20/19 | 10 | ||||
| 2019 | ||||||
| Country | Trade
Date |
Settlement
Date |
Number
of Days to Settle | |||
| 05/13/19 | 05/21/19 | 8 | ||||
| 05/28/19 | 06/05/19 | 8 | ||||
| 05/29/19 | 06/06/19 | 8 | ||||
| 05/30/19 | 06/07/19 | 8 | ||||
| 05/31/19 | 06/10/19 | 10 | ||||
| 06/03/19 | 06/11/19 | 8 | ||||
| 07/01/19 | 07/09/19 | 8 | ||||
| 07/02/19 | 07/10/19 | 8 | ||||
| 07/03/19 | 07/11/19 | 8 | ||||
| 07/04/19 | 07/12/19 | 8 | ||||
| 07/05/19 | 07/15/19 | 10 | ||||
| 10/08/19 | 10/16/19 | 8 | ||||
| 10/09/19 | 10/17/19 | 8 | ||||
| 10/10/19 | 10/18/19 | 8 | ||||
| 10/11/19 | 10/21/19 | 10 | ||||
| 10/14/19 | 10/22/19 | 8 | ||||
| 12/18/19 | 12/27/19 | 9 | ||||
| 12/19/19 | 12/30/19 | 11 | ||||
| 12/20/19 | 12/31/19 | 11 | ||||
| 12/23/19 | 01/02/20 | 10 | ||||
| 12/24/19 | 01/03/20 | 10 | ||||
| Malaysia | 01/30/19 | 02/07/19 | 8 | |||
| 01/31/19 | 02/08/19 | 8 | ||||
| Morocco | 08/07/19 | 08/15/19 | 8 | |||
| 08/08/19 | 08/16/19 | 8 | ||||
| 08/09/19 | 08/19/19 | 10 | ||||
| 11/04/19 | 11/13/19 | 9 | ||||
| 11/05/19 | 11/14/19 | 9 | ||||
| Namibia | 03/14/19 | 03/22/19 | 8 | |||
| 03/15/19 | 03/25/19 | 10 | ||||
| 03/18/19 | 03/26/19 | 8 | ||||
| 03/19/19 | 03/27/19 | 8 | ||||
| 03/20/19 | 03/28/19 | 8 | ||||
| 04/12/19 | 04/23/19 | 11 | ||||
| 04/15/19 | 04/24/19 | 9 | ||||
| 04/16/19 | 04/25/19 | 9 | ||||
| 04/17/19 | 04/26/19 | 9 | ||||
| 04/18/19 | 04/29/19 | 11 | ||||
| 04/24/19 | 05/02/19 | 8 | ||||
| 04/25/19 | 05/03/19 | 8 | ||||
| 04/26/19 | 05/06/19 | 10 | ||||
| 04/29/19 | 05/07/19 | 8 | ||||
| 04/30/19 | 05/08/19 | 8 | ||||
| 05/23/19 | 05/31/19 | 8 | ||||
| 05/24/19 | 06/03/19 | 10 | ||||
| 05/27/19 | 06/04/19 | 8 | ||||
| 05/28/19 | 06/05/19 | 8 | ||||
| 2019 | ||||||
| Country | Trade
Date |
Settlement
Date |
Number
of Days to Settle | |||
| 05/29/19 | 06/06/19 | 8 | ||||
| 06/10/19 | 06/18/19 | 8 | ||||
| 06/11/19 | 06/19/19 | 8 | ||||
| 06/12/19 | 06/20/19 | 8 | ||||
| 06/13/19 | 06/21/19 | 8 | ||||
| 06/14/19 | 06/24/19 | 10 | ||||
| 08/02/19 | 08/12/19 | 10 | ||||
| 08/05/19 | 08/13/19 | 8 | ||||
| 08/06/19 | 08/14/19 | 8 | ||||
| 08/07/19 | 08/15/19 | 8 | ||||
| 08/08/19 | 08/16/19 | 8 | ||||
| 08/19/19 | 08/27/19 | 8 | ||||
| 08/20/19 | 08/28/19 | 8 | ||||
| 08/21/19 | 08/29/19 | 8 | ||||
| 08/22/19 | 08/30/19 | 8 | ||||
| 08/23/19 | 09/02/19 | 10 | ||||
| 09/17/19 | 09/25/19 | 8 | ||||
| 09/18/19 | 09/26/19 | 8 | ||||
| 09/19/19 | 09/27/19 | 8 | ||||
| 09/20/19 | 09/30/19 | 10 | ||||
| 09/23/19 | 10/01/19 | 8 | ||||
| 12/03/19 | 12/11/19 | 8 | ||||
| 12/04/19 | 12/12/19 | 8 | ||||
| 12/05/19 | 12/13/19 | 8 | ||||
| 12/06/19 | 12/17/19 | 11 | ||||
| 12/09/19 | 12/18/19 | 9 | ||||
| 12/11/19 | 12/19/19 | 8 | ||||
| 12/12/19 | 12/20/19 | 8 | ||||
| 12/13/19 | 12/23/19 | 10 | ||||
| 12/18/19 | 12/27/19 | 9 | ||||
| 12/19/19 | 12/30/19 | 11 | ||||
| 12/20/19 | 12/31/19 | 11 | ||||
| 12/23/19 | 01/02/20 | 10 | ||||
| 12/24/19 | 01/03/20 | 10 | ||||
| 12/27/19 | 01/06/20 | 10 | ||||
| 12/30/19 | 01/07/20 | 8 | ||||
| 12/31/19 | 01/08/20 | 8 | ||||
| New Zealand | 04/18/19 | 04/26/19 | 8 | |||
| Oman | 08/06/19 | 08/18/19 | 12 | |||
| 08/07/19 | 08/19/19 | 12 | ||||
| 08/08/19 | 08/20/19 | 12 | ||||
| Philippines | 12/23/19 | 01/02/20 | 10 | |||
| 12/26/19 | 01/03/20 | 8 | ||||
| 12/27/19 | 01/06/20 | 10 | ||||
| Qatar | 05/30/19 | 06/09/19 | 10 | |||
| 06/02/19 | 06/10/19 | 8 | ||||
| 2019 | ||||||
| Country | Trade
Date |
Settlement
Date |
Number
of Days to Settle | |||
| 06/03/19 | 06/11/19 | 8 | ||||
| 08/06/19 | 08/14/19 | 8 | ||||
| 08/07/19 | 08/15/19 | 8 | ||||
| 08/08/19 | 08/18/19 | 10 | ||||
| Russia | 04/26/19 | 05/06/19 | 10 | |||
| 04/29/19 | 05/07/19 | 8 | ||||
| 04/30/19 | 05/08/19 | 8 | ||||
| 12/31/19 | 01/08/20 | 8 | ||||
| Saudi Arabia | 08/08/19 | 08/18/19 | 10 | |||
| 08/11/19 | 08/19/19 | 8 | ||||
| Serbia | 04/25/19 | 05/03/19 | 8 | |||
| 12/30/19 | 01/08/20 | 9 | ||||
| 12/31/19 | 01/09/20 | 9 | ||||
| Srpska | 04/25/19 | 05/03/19 | 8 | |||
| Swaziland | 04/12/19 | 04/23/19 | 11 | |||
| 04/15/19 | 04/24/19 | 9 | ||||
| 04/16/19 | 04/26/19 | 10 | ||||
| 04/17/19 | 04/29/19 | 12 | ||||
| 04/18/19 | 04/30/19 | 12 | ||||
| 04/23/19 | 05/02/19 | 9 | ||||
| 04/24/19 | 05/03/19 | 9 | ||||
| 04/26/19 | 05/06/19 | 10 | ||||
| 04/29/19 | 05/07/19 | 8 | ||||
| 04/30/19 | 05/08/19 | 8 | ||||
| 05/23/19 | 05/31/19 | 8 | ||||
| 05/24/19 | 06/03/19 | 10 | ||||
| 05/27/19 | 06/04/19 | 8 | ||||
| 05/28/19 | 06/05/19 | 8 | ||||
| 05/29/19 | 06/06/19 | 8 | ||||
| 07/15/19 | 07/23/19 | 8 | ||||
| 07/16/19 | 07/24/19 | 8 | ||||
| 07/17/19 | 07/25/19 | 8 | ||||
| 07/18/19 | 07/26/19 | 8 | ||||
| 07/19/19 | 07/29/19 | 10 | ||||
| 08/26/19 | 09/03/19 | 8 | ||||
| 08/27/19 | 09/04/19 | 8 | ||||
| 08/28/19 | 09/05/19 | 8 | ||||
| 08/29/19 | 09/09/19 | 11 | ||||
| 08/30/19 | 09/10/19 | 11 | ||||
| 09/03/19 | 09/11/19 | 8 | ||||
| 09/04/19 | 09/12/19 | 8 | ||||
| 09/05/19 | 09/13/19 | 8 | ||||
| 12/18/19 | 12/27/19 | 9 | ||||
| 12/19/19 | 12/30/19 | 11 | ||||
| 12/20/19 | 12/31/19 | 11 | ||||
| 2019 | ||||||
| Country | Trade
Date |
Settlement
Date |
Number
of Days to Settle | |||
| 12/23/19 | 01/02/20 | 10 | ||||
| 12/24/19 | 01/03/20 | 10 | ||||
| Taiwan | 01/29/19 | 02/11/19 | 13 | |||
| 01/30/19 | 02/12/19 | 13 | ||||
| Tunisia | 05/30/19 | 06/07/19 | 8 | |||
| United Arab Emirates | 08/07/19 | 08/15/19 | 8 | |||
| 08/08/19 | 08/18/19 | 10 | ||||
| Uruguay | 04/15/19 | 04/23/19 | 8 | |||
| 04/16/19 | 04/24/19 | 8 | ||||
| 04/17/19 | 04/25/19 | 8 | ||||
| Vietnam | 01/31/19 | 02/11/19 | 11 | |||
| 02/01/19 | 02/12/19 | 11 | ||||
| Zimbabwe | 04/15/19 | 04/23/19 | 8 | |||
| 04/16/19 | 04/24/19 | 8 | ||||
| 04/17/19 | 04/25/19 | 8 | ||||
| 12/19/19 | 12/27/19 | 8 | ||||
| 12/20/19 | 12/30/19 | 10 | ||||
| 2020 | ||||||
| Country | Trade
Date |
Settlement
Date |
Number
of Days to Settle | |||
| Australia | 04/07/20 | 04/15/20 | 8 | |||
| 04/08/20 | 04/16/20 | 8 | ||||
| 04/09/20 | 04/17/20 | 8 | ||||
| 12/21/20 | 12/29/20 | 8 | ||||
| 12/22/20 | 12/30/20 | 8 | ||||
| 12/23/20 | 01/04/21 | 12 | ||||
| Bangladesh | 05/18/20 | 05/26/20 | 8 | |||
| 05/19/20 | 05/27/20 | 8 | ||||
| 05/20/20 | 05/28/20 | 8 | ||||
| Ghana | 07/28/20 | 08/05/20 | 8 | |||
| 07/29/20 | 08/06/20 | 8 | ||||
| Indonesia | 05/19/20 | 05/28/20 | 9 | |||
| 05/20/20 | 05/29/20 | 9 | ||||
| Israel | 04/06/20 | 04/16/20 | 10 | |||
| 04/07/20 | 04/19/20 | 12 | ||||
| 09/30/20 | 10/11/20 | 11 | ||||
| 10/01/20 | 10/12/20 | 11 | ||||
| 2020 | ||||||
| Country | Trade
Date |
Settlement
Date |
Number
of Days to Settle | |||
| Kuwait | 05/19/20 | 05/27/20 | 8 | |||
| 05/20/20 | 05/28/20 | 8 | ||||
| 05/21/20 | 05/31/20 | 10 | ||||
| 07/27/20 | 08/04/20 | 8 | ||||
| 07/28/20 | 08/05/20 | 8 | ||||
| 07/29/20 | 08/06/20 | 8 | ||||
| Namibia | 04/03/20 | 04/14/20 | 11 | |||
| 04/06/20 | 04/15/20 | 9 | ||||
| 04/07/20 | 04/16/20 | 9 | ||||
| 04/08/20 | 04/17/20 | 9 | ||||
| 04/09/20 | 04/20/20 | 11 | ||||
| 04/24/20 | 05/05/20 | 11 | ||||
| 04/27/20 | 05/06/20 | 9 | ||||
| 04/28/20 | 05/07/20 | 9 | ||||
| 04/29/20 | 05/08/20 | 9 | ||||
| 04/30/20 | 05/11/20 | 11 | ||||
| 05/14/20 | 05/22/20 | 8 | ||||
| 05/15/20 | 05/26/20 | 11 | ||||
| 05/18/20 | 05/27/20 | 9 | ||||
| 05/19/20 | 05/28/20 | 9 | ||||
| 05/20/20 | 05/29/20 | 9 | ||||
| 05/22/20 | 06/01/20 | 10 | ||||
| 08/19/20 | 08/27/20 | 8 | ||||
| 08/20/20 | 08/28/20 | 8 | ||||
| 08/21/20 | 08/31/20 | 10 | ||||
| 08/24/20 | 09/01/20 | 8 | ||||
| 08/25/20 | 09/02/20 | 8 | ||||
| 12/03/20 | 12/11/20 | 8 | ||||
| 12/04/20 | 12/14/20 | 10 | ||||
| 12/07/20 | 12/15/20 | 8 | ||||
| 12/08/20 | 12/16/20 | 8 | ||||
| 12/09/20 | 12/17/20 | 8 | ||||
| 12/18/20 | 12/28/20 | 10 | ||||
| 12/21/20 | 12/29/20 | 8 | ||||
| 12/22/20 | 12/30/20 | 8 | ||||
| 12/23/20 | 12/31/20 | 8 | ||||
| 12/24/20 | 01/04/21 | 11 | ||||
| Norway | 04/06/20 | 04/14/20 | 8 | |||
| 04/07/20 | 04/15/20 | 8 | ||||
| Russia | 04/28/20 | 05/06/20 | 8 | |||
| 04/29/20 | 05/07/20 | 8 | ||||
| 04/30/20 | 05/08/20 | 8 | ||||
| Saudi Arabia | 05/20/20 | 05/31/20 | 11 | |||
| 05/21/20 | 06/01/20 | 11 | ||||
| 07/28/20 | 08/06/20 | 9 | ||||
| 2020 | ||||||
| Country | Trade
Date |
Settlement
Date |
Number
of Days to Settle | |||
| 07/29/20 | 08/09/20 | 11 | ||||
| Sri Lanka | 04/06/20 | 04/15/20 | 9 | |||
| 04/08/20 | 04/16/20 | 8 | ||||
| 04/09/20 | 04/17/20 | 8 | ||||
| Taiwan | 01/21/20 | 01/30/20 | 9 | |||
| 01/22/20 | 01/31/20 | 9 | ||||
| Tanzania | 04/06/20 | 04/14/20 | 8 | |||
| Vietnam | 01/21/20 | 01/30/20 | 9 | |||
| 01/22/20 | 01/31/20 | 9 | ||||
| * | These worst-case redemption cycles are based on information regarding regular holidays available as of January 18, 2019, which may be out of date as of the date of this SAI. Based on changes in holidays, longer (worse) redemption cycles are possible. Further, regional holidays, the treatment by market participants of certain days as unofficial holidays (including days on which no or limited securities transactions occur as a result of substantially shortened trading hours), the elimination of existing holidays, or changes in local securities delivery practices, could affect the information set forth herein. |