December 28, 2018
| 2018 Prospectus |
 |
| ► | iShares Currency Hedged MSCI Emerging Markets ETF | HEEM | CBOE BZX |
The Securities and Exchange Commission
(“SEC”) has not approved or disapproved these securities or passed upon the adequacy of this prospectus. Any representation to the contrary is a criminal offense.
Table of Contents
|
|
S-1 |
|
|
1 |
|
|
2 |
|
|
22 |
|
|
26 |
|
|
26 |
|
|
27 |
|
|
31 |
|
|
41 |
|
|
41 |
|
|
43 |
|
|
43 |
|
|
45 |
“MSCI Emerging Markets 100% Hedged to USD Index” is
a servicemark of MSCI Inc. and has been licensed for use for certain purposes by BlackRock Fund Advisors or its affiliates. iShares® and BlackRock® are registered trademarks of BlackRock Fund Advisors and its affiliates. The Fund is not sponsored, endorsed, sold, or promoted by MSCI Inc., nor does
MSCI Inc. make any representation regarding the advisability of investing in the Fund.
i
[THIS PAGE INTENTIONALLY LEFT BLANK]
iSHARES® CURRENCY HEDGED MSCI EMERGING MARKETS ETF
| Ticker: HEEM | Stock Exchange: Cboe BZX |
Investment Objective
The iShares Currency Hedged MSCI Emerging Markets ETF (the
“Fund”) seeks to track the investment results of an index composed of large- and mid-capitalization emerging market equities while mitigating exposure to fluctuations between the value of the component currencies and the U.S.
dollar.
Fees and Expenses
The following table describes the fees and expenses that you
will incur if you own shares of the Fund. The investment advisory agreement between iShares, Inc. (the “Company”) and BlackRock Fund Advisors (“BFA”) (the “Investment Advisory Agreement”) provides that BFA will
pay all operating expenses of the Fund, except the management fees, interest expenses, taxes, expenses incurred with respect to the acquisition and disposition of portfolio securities and the execution of portfolio transactions, including brokerage
commissions, distribution fees or expenses, litigation expenses and any extraordinary expenses. The Fund may incur “Acquired Fund Fees and Expenses.” Acquired Fund Fees and Expenses reflect the Fund's pro
rata share of the fees and expenses incurred by investing in other investment companies. The impact of Acquired Fund Fees and Expenses is included in the total returns of the Fund. Acquired Fund Fees and Expenses are not included in the
calculation of the ratio of expenses to average net assets shown in the Financial Highlights section of the Fund's prospectus (the “Prospectus”). BFA, the investment adviser to the Fund, has
contractually agreed to waive a portion of its management fees so that the Fund’s total annual fund operating expenses after fee waiver is equal to the Acquired Fund Fees and Expenses attributable to the Fund's investment in the iShares MSCI
Emerging Markets ETF (“EEM” or the “Underlying Fund”), after taking into account any fee waivers by EEM through December 31, 2020. The contractual waiver may be terminated prior to December 31, 2020 only upon written
agreement of the Company and BFA.
You may also incur
usual and customary brokerage commissions and other charges when buying or selling shares of the Fund, which are not reflected in the Example that follows:
| Annual
Fund Operating Expenses (ongoing expenses that you pay each year as a percentage of the value of your investments) | ||||||||||||
| Management
Fees |
Distribution
and Service (12b-1) Fees |
Other
Expenses |
Acquired
Fund Fees and Expenses |
Total
Annual Fund Operating Expenses |
Fee Waiver | Total
Annual Fund Operating Expenses After Fee Waiver | ||||||
| 0.78% | None | None | 0.67% | 1.45% | (0.78)% | 0.67% | ||||||
S-1
Example. This Example is
intended to help you compare the cost of owning shares of the Fund with the cost of investing in other funds. The Example assumes that you invest $10,000 in the Fund for the time periods indicated and then sell all of your shares at the end of those
periods. The Example also assumes that your investment has a 5% return each year and that the Fund’s operating expenses remain the same. Although your actual costs may be higher or lower, based on these assumptions, your costs would
be:
| 1 Year | 3 Years | 5 Years | 10 Years | |||
| $68 | $300 | $638 | $1596 |
S-2
S-3
S-4
S-5
S-6
S-7
S-8
S-9
S-10
S-11
S-12
S-13
Performance Information
The bar chart and table that follow show how the Fund has
performed on a calendar year basis and provide an indication of the risks of investing in the Fund. Both assume that all dividends and distributions have been reinvested in the Fund. Past performance (before and after taxes) does not necessarily
indicate how the Fund will perform in the future. Supplemental information about the Fund’s performance is shown under the heading Total Return Information in the
Supplemental Information section of the Prospectus. If BFA had not waived certain Fund fees during certain periods, the Fund's returns would have been lower.
Year by Year Returns1 (Years Ended December 31)
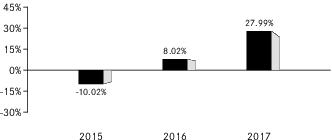
| 1 | The Fund’s year-to-date return as of September 30, 2018 was -3.56%. |
The best calendar quarter return during the periods shown above
was 7.77% in the 3rd quarter of 2017; the worst was -12.29% in the 3rd quarter of 2015.
Updated performance information may be obtained by visiting our
website at www.iShares.com or by calling 1-800-iShares (1-800-474-2737) (toll free).
Average Annual Total Returns
(for the periods ended December 31, 2017)
| One Year | Since
Fund Inception | ||
| (Inception Date: 09/23/2014) | |||
| Return Before Taxes | 27.99% | 6.30% | |
| Return After Taxes on Distributions2 | 27.34% | 5.28% | |
| Return After Taxes on Distributions and Sale of Fund Shares2 | 16.32% | 4.62% | |
| MSCI Emerging Markets 100% Hedged to USD Index (Index returns do not reflect deductions for fees, expenses or taxes) | 28.56% | 6.76% |
| 2 | After-tax returns in the table above are calculated using the historical highest individual U.S. federal marginal income tax rates and do not reflect the impact of state or local taxes. Actual after-tax returns depend on an investor’s tax situation and may differ from those shown, and after-tax returns shown are not relevant to tax-exempt investors or investors who hold shares through tax-deferred arrangements, such as 401(k) plans or individual retirement accounts (“IRAs”). Fund returns after taxes on distributions and sales of Fund shares are calculated assuming that an investor has sufficient capital gains of the same character from other investments to offset any capital losses from the sale of Fund shares. As a result, Fund returns after taxes on distributions and sales of Fund shares may exceed Fund returns before taxes and/or returns after taxes on distributions. |
S-14
S-15
[THIS PAGE INTENTIONALLY LEFT BLANK]
More Information About the Fund
This Prospectus contains important information about investing
in the Fund. Please read this Prospectus carefully before you make any investment decisions. Additional information regarding the Fund is available at www.iShares.com.
BFA is the investment adviser to the Fund. Shares of the Fund
are listed for trading on Cboe BZX Exchange, Inc. (“Cboe BZX”). The market price for a share of the Fund may be different from the Fund’s most recent NAV.
ETFs are funds that trade like other publicly-traded
securities. The Fund is designed to track an index. Similar to shares of an index mutual fund, each share of the Fund represents an ownership interest in an underlying portfolio of securities and other instruments intended to track a market index.
Unlike shares of a mutual fund, which can be bought and redeemed from the issuing fund by all shareholders at a price based on NAV, shares of the Fund may be purchased or redeemed directly from the Fund at NAV solely by Authorized Participants and
only in Creation Unit increments. Also unlike shares of a mutual fund, shares of the Fund are listed on a national securities exchange and trade in the secondary market at market prices that change throughout the day.
The Fund invests in a particular segment of the securities
markets and seeks to track the performance of a currency hedged securities index that may not be representative of the market as a whole. The Fund is designed to be used as part of broader asset allocation strategies. Accordingly, an investment in
the Fund should not constitute a complete investment program.
An index is a financial calculation, based on a grouping of
financial instruments, and is not an investment product, while the Fund is an actual investment portfolio. The performance of the Fund and the Underlying Index may vary for a number of reasons, including transaction costs, non-U.S. currency
valuations, asset valuations, corporate actions (such as mergers and spin-offs), timing variances and differences between the Fund’s portfolio and the Underlying Index resulting from the Fund's use of representative sampling or from legal
restrictions (such as diversification requirements) that apply to the Fund but not to the Underlying Index. From time to time, the Index Provider may make changes to the methodology or other adjustments to the Underlying Index. Unless otherwise
determined by BFA, any such change or adjustment will be reflected in the calculation of the Underlying Index performance on a going-forward basis after the effective date of such change or adjustment. Therefore, the Underlying Index performance
shown for periods prior to the effective date of any such change or adjustment will generally not be recalculated or restated to reflect such change or adjustment.
“Tracking error” is the divergence of the
performance (return) of the Fund's portfolio from that of the Underlying Index. BFA expects that, over time, the Fund’s tracking error will not exceed 5%. Because the Fund uses a representative sampling indexing strategy, it can be expected to
have a larger tracking error than if it used a replication indexing strategy. “Replication” is an indexing strategy in which a fund invests in
1
substantially all of the securities in its underlying index in approximately
the same proportions as in the underlying index.
Under
continuous listing standards adopted by the Fund's listing exchange, which went into effect on January 1, 2018, the Fund is required to confirm on an ongoing basis that the components of the Underlying Index satisfy the applicable listing
requirements. In the event that the Underlying Index does not comply with the applicable listing requirements, the Fund is required to rectify such non-compliance by requesting that the Index Provider modify the Underlying Index, adopting a new
underlying index, or obtaining relief from the SEC. Failure to rectify such non-compliance may result in the Fund being delisted by the listing exchange.
An investment in the Fund is not a bank deposit and it is not
insured or guaranteed by the Federal Deposit Insurance Corporation or any other government agency, BFA or any of its affiliates.
The Fund's investment objective and the Underlying Index may be
changed without shareholder approval.
A Further
Discussion of Principal Risks
The Fund is subject to
various risks, including the principal risks noted below, any of which may adversely affect the Fund’s NAV, trading price, yield, total return and ability to meet its investment objective. The Fund may be exposed to these risks directly or
indirectly through the Fund's investments in the Underlying Fund. You could lose all or part of your investment in the Fund, and the Fund could underperform other investments.
Asian Economic Risk. Many Asian
economies have experienced rapid growth and industrialization in recent years, but there is no assurance that this growth rate will be maintained. Other Asian economies, however, have experienced high inflation, high unemployment, currency
devaluations and restrictions, and over-extension of credit. Geopolitical hostility, political instability, as well as economic or environmental events in any one Asian country may have a significant economic effect on the entire Asian region, as
well as on major trading partners outside Asia. Any adverse event in the Asian markets may have a significant adverse effect on some or all of the economies of the countries in which the Fund or the Underlying Fund invests. Many Asian countries are
subject to political risk, including political instability, corruption and regional conflict with neighboring countries. North Korea and South Korea each have substantial military capabilities, and historical tensions between the two countries
present the risk of war. Escalated tensions involving the two countries and any outbreak of hostilities between the two countries, or even the threat of an outbreak of hostilities, could have a severe adverse effect on the entire Asian region.
Certain Asian countries have also developed increasingly strained relationships with the U.S., and if these relations were to worsen, they could adversely affect Asian issuers that rely on the U.S. for trade. In addition, many Asian countries are
subject to social and labor risks associated with demands for improved political, economic and social conditions. These risks, among others, may adversely affect the value of the Fund’s or the Underlying Fund's investments.
2
Asset Class Risk. The
securities and other assets in the Underlying Index or in the Fund’s or the Underlying Fund's portfolio may underperform in comparison to other securities or indexes that track other countries, groups of countries, regions, industries,
groups of industries, markets, asset classes or sectors. Various types of securities, currencies and indexes may experience cycles of outperformance and underperformance in comparison to the general financial markets depending upon a number of
factors including, among other things, inflation, interest rates, productivity, global demand for local products or resources, and regulation and governmental controls. This may cause the Fund to underperform other investment vehicles that invest in
different asset classes.
Authorized Participant
Concentration Risk. Only an Authorized Participant may engage in creation or redemption transactions directly with the Fund. The Fund has a limited number of institutions that may act as Authorized Participants on
an agency basis (i.e., on behalf of other market participants). To the extent that Authorized Participants exit the business or are unable to proceed
with creation or redemption orders with respect to the Fund and no other Authorized Participant is able to step forward to create or redeem Creation Units, Fund shares may be more likely to trade at a premium or discount to NAV and possibly face
trading halts or delisting. Authorized Participant concentration risk may be heightened because ETFs, such as the Fund, that invest in securities issued by non-U.S. issuers or other securities or instruments that are less widely traded often involve
greater settlement and operational issues and capital costs for Authorized Participants, which may limit the availability of Authorized Participants.
Commodity Risk. The energy,
materials, and agriculture sectors account for a large portion of the exports of certain countries in which the Fund and the Underlying Fund invest. Any changes in these sectors or fluctuations in the commodity markets could have an adverse impact
on a country's economy. Commodity prices may be influenced or characterized by unpredictable factors, including, where applicable, high volatility, changes in supply and demand relationships, weather, agriculture, trade, pestilence, political
instability, changes in interest rates and monetary and other governmental policies, action and inaction, including price changes due to trade relations, including the imposition of tariffs by the U.S. and other importing countries. Securities of
companies held by the Fund that are dependent on a single commodity, or are concentrated in a single commodity sector, may typically exhibit even higher volatility attributable to commodity prices.
Concentration Risk. The Fund
may be susceptible to an increased risk of loss, including losses due to adverse events that affect the Fund’s investments more than the market as a whole, to the extent that the Fund's or the Underlying Fund's investments are concentrated in
the securities of a particular issuer or issuers, country, group of countries, region, market, industry, group of industries, sector or asset class. The Fund may be more adversely affected by the underperformance of those securities, may experience
increased price volatility and may be more susceptible to adverse economic, market, political or regulatory occurrences affecting those securities than a fund that does not concentrate its investments.
3
Currency Hedging Risk. When a
derivative is used as a hedge against a position that the Fund or the Underlying Fund holds, any loss generated by the derivative generally should be substantially offset by gains on the hedged investment, and vice versa. While hedging can
reduce or eliminate losses, it can also reduce or eliminate gains. Hedges are sometimes subject to imperfect matching between the derivative and its reference asset, and there can be no assurance that the Fund’s hedging transactions will be
effective. In seeking to track the “hedging” component of the Underlying Index, the Fund invests in currency forward contracts, (which may include both physically-settled forward contracts and NDFs) designed to hedge the currency
exposure of non-U.S. dollar denominated securities held in its portfolio (directly or indirectly through its investment in the Underlying Fund). NDFs may be less liquid than deliverable currency forward contracts and require the Fund to post
variation margin to the counterparty, which can increase costs for the Fund. A lack of liquidity in NDFs of the hedged currency could result in the Fund being unable to structure its hedging transactions as intended. In addition, BFA may seek to
limit the size of the Fund in order to attempt to reduce the likelihood of a situation where the Fund is unable to obtain sufficient liquidity in an underlying currency hedge to implement its investment objective.
Currency forward contracts, including NDFs, do not eliminate
movements in the value of non-U.S. currencies and securities but rather allow the Fund to establish a fixed rate of exchange for a future point in time. Exchange rates may be volatile and may change quickly and unpredictably in response to both
global economic developments and economic conditions in a geographic region in which the Fund or the Underlying Fund invests. In addition, in order to minimize transaction costs, or for other reasons, the Fund’s exposure to the non-U.S.
dollar component currencies may not be fully hedged at all times or the hedge may not be effective due to counterparty failures or otherwise. At certain times, the Fund may use an optimized hedging strategy and will hedge a smaller number of
non-U.S. dollar component currencies to reduce hedging costs. Governments from time to time may intervene in the currency markets to influence prices and may adopt policies designed to influence foreign exchange rates with respect to their currency.
Because the Fund’s currency hedge is reset on a monthly basis, currency risk can develop or increase intra-month. Furthermore, while the Fund is designed to hedge against currency fluctuations, it is possible that a degree of currency exposure
may remain even at the time a hedging transaction is implemented. As a result, the Fund may not be able to structure its hedging transactions as anticipated or its hedging transactions may not successfully reduce the currency risk included in the
Fund’s portfolio in a way that tracks the Underlying Index. Because currency forwards are over-the-counter instruments, the Fund is subject to counterparty risk as well as market or liquidity risk with respect to the hedging transactions the
Fund enters into. Currency hedging activity exposes the Fund to credit risk due to counterparty exposure. This risk will be higher to the extent that the Fund trades with a single counterparty or small number of counterparties. In addition, the
Fund’s currency hedging activities may involve frequent trading of currency instruments, which may increase transaction costs and cause the Fund’s return to deviate from the Underlying Index.
There is no assurance that the Fund’s strategy will be
effective in hedging fluctuations in the value of these currencies against the U.S. dollar. The effectiveness of the Fund’s
4
currency hedging strategy will in general be affected by the volatility of
both the Underlying Index and the volatility of the U.S. dollar relative to the currencies to be hedged, measured on an aggregate basis. Increased volatility will generally reduce the effectiveness of the Fund’s currency hedging strategy. In
addition, volatility in one or more of the currencies may offset stability in another currency and reduce the overall effectiveness of the hedges. The effectiveness of the Fund’s currency hedging strategy may also be affected by interest
rates, which may differ among the affected countries. Significant differences between U.S. dollar interest rates and some or all of the applicable foreign currency interest rates may impact the effectiveness of the Fund’s currency hedging
strategy. In addition, the currency hedging carried out by the Fund may result in lower returns than those generated through direct investments in the securities comprising the Underlying Index or in the index tracked by the Underlying Fund when the
local currency appreciates against the U.S. dollar.
Investors, such as the Fund, seeking to trade in foreign
currencies may have limited access to certain currency markets due to a variety of factors, including government regulations, adverse tax treatment, exchange controls, currency convertibility issues and lack of market liquidity. These limitations
and restrictions may impact the availability, liquidity and pricing of the financial instruments that are necessary for the Fund to hedge exposure to the currency markets. If the Fund’s ability to enter into contracts to purchase or sell the
currency of a non-U.S. market in which the Fund or the Underlying Fund invests is impaired, the Fund may not be able to achieve its investment objective. In addition, investments in currency forwards expose the Fund to the risks described
under “Derivatives Risk.”
Currency Risk. Because the Fund's and the Underlying Fund's NAVs are determined on the basis of the U.S. dollar, investors may lose money if the currency of one or more of the non-U.S. markets in which the Fund or the Underlying Fund
invests depreciates against the U.S. dollar or if there are delays or limits on repatriation of such currency and the depreciation of one currency is not offset by appreciation in another currency and/or the Fund’s attempt to hedge currency
exposure to the currency or currencies is unsuccessful. Similarly, because the Fund seeks to hedge currency risk in accordance with the Underlying Index, investors may not share in appreciation in the securities comprising the Underlying Index to
the extent that such appreciation is due to increases in the value of the underlying currencies. In addition, fluctuations in the exchange rates of currencies could affect the economy or particular business operations of companies in a geographic
region in which the Fund or the Underlying Fund invests, causing an adverse impact on the Fund’s or the Underlying Fund’s investments in the affected region and the U.S. that is separate from the value of the underlying currency or
currencies and, therefore, unmitigated by the hedging strategy used by the Fund. The hedged currencies may also perform inversely to each other. If this is the case, investors may experience better performance with a fund that is unhedged from a
currency perspective than one that is hedged from a currency perspective, as is the case with the Fund. As a result, investors in the Fund have the potential for losses regardless of the length of time they intend to hold Fund shares and regardless
of the effectiveness of the Fund’s currency hedging transactions. The performance of the Fund may be materially better or worse than the performance of the Underlying Fund due primarily to the Fund's attempt to hedge currency
exposure.
5
Currency exchange rates can be very volatile and can change quickly and
unpredictably. As a result, the Fund’s NAV may change quickly and without warning.
Custody Risk. Custody risk
refers to the risks inherent in the process of clearing and settling trades, as well as the holding of securities and other assets (such as currencies) by local banks, agents and depositories. Low trading volumes and volatile prices in less
developed markets may make trades harder to complete and settle, and governments or trade groups may compel local agents to hold securities and other assets in designated depositories that may not be subject to independent evaluation. Local
agents are held only to the standards of care of their local markets. In general, the less developed a country’s financial markets are, the greater the likelihood of custody problems.
Cyber Security Risk. With the
increased use of technologies such as the internet to conduct business, the Fund, the Underlying Fund, Authorized Participants, service providers and the relevant listing exchange are susceptible to operational, information security and
related “cyber” risks both directly and through their service providers. Similar types of cyber security risks are also present for issuers of securities in which the Fund or the Underlying Fund invests, which could result in material
adverse consequences for such issuers and may cause the Fund’s or the Underlying Fund's investment in such portfolio companies to lose value. Unlike many other types of risks faced by the Fund and the Underlying Fund, these risks
typically are not covered by insurance. In general, cyber incidents can result from deliberate attacks or unintentional events. Cyber incidents include, but are not limited to, gaining unauthorized access to digital systems (e.g., through “hacking” or malicious software coding) for purposes of misappropriating assets or sensitive information, corrupting data, or causing
operational disruption. Cyber-attacks may also be carried out in a manner that does not require gaining unauthorized access, such as causing denial-of-service attacks on websites
(i.e., efforts to make network services unavailable to intended users). Cyber security failures by or breaches of the systems of the Fund’s or
the Underlying Fund's adviser, distributor and other service providers (including, but not limited to, index providers, fund accountants, custodians, transfer agents and administrators), market makers, Authorized Participants, hedging counterparties
to the Fund or the issuers of securities in which the Fund or the Underlying Fund invests, have the ability to cause disruptions and impact business operations, potentially resulting in: financial losses, interference with the Fund’s or the
Underlying Fund's ability to calculate its NAV, disclosure of confidential trading information, impediments to trading, submission of erroneous trades or erroneous creation or redemption orders, the inability of the Fund, the Underlying Fund or
their service providers to transact business, violations of applicable privacy and other laws, regulatory fines, penalties, reputational damage, reimbursement or other compensation costs, or additional compliance costs. In addition, cyber-attacks
may render records of Fund assets and transactions, shareholder ownership of Fund shares, and other data integral to the functioning of the Fund or the Underlying Fund inaccessible or inaccurate or incomplete. Substantial costs may be incurred by
the Fund or the Underlying Fund in order to resolve or prevent cyber incidents in the future. While the Fund and the Underlying Fund has established business continuity plans in the event of, and risk management systems to prevent, such
cyber-attacks, there are inherent
6
limitations in such plans and systems, including the possibility that certain
risks have not been identified and that prevention and remediation efforts will not be successful. Furthermore, the Fund cannot control the cyber security plans and systems put in place by service providers to the Fund, issuers in which the Fund
invests, the Index Provider, hedging counterparties to the Fund, market makers or Authorized Participants. The Fund and its shareholders could be negatively impacted as a result.
Derivatives Risk. The Fund uses
deliverable currency forwards and NDFs to hedge the currency exposure resulting from investments in foreign currency-denominated securities held by the Fund or the Underlying Fund. The Fund’s or the Underlying Fund's use of these
instruments, like investments in other derivatives, may reduce the Fund’s or the Underlying Fund's returns, increase volatility and/or result in losses due to credit risk or ineffective hedging strategies. Volatility is defined as the
characteristic of a security, a currency, an index or a market, to fluctuate significantly in price within a defined period. Currency forwards, like other derivatives, are also subject to counterparty risk, which is the risk that the other party in
the transaction will not fulfill its contractual obligation. A risk of the Fund’s or the Underlying Fund's use of derivatives is that the fluctuations in their values may not correlate perfectly with the currency or currencies being
hedged. The possible lack of a liquid secondary market for derivatives and the resulting inability of the Fund or the Underlying Fund to sell or otherwise close a derivatives position could expose the Fund to losses and could make derivatives
more difficult for the Fund or the Underlying Fund to value accurately. The Fund or the Underlying Fund could also suffer losses related to its derivatives positions as a result of unanticipated market movements, which losses are
potentially unlimited. BFA’s use of derivatives is not intended to predict the direction of securities prices, currency exchange rates, interest rates and other economic factors, which could cause the Fund’s derivatives positions to lose
value. Derivatives may give rise to a form of leverage and may expose the Fund or the Underlying Fund to greater risk and increase its costs. Regulatory requirements affecting the use of derivatives may make derivatives more costly, and may
delay or restrict the exercise of remedies by the Fund upon a counterparty default under derivatives held by the Fund (which could result in losses).
Equity Securities Risk. The
Fund and the Underlying Fund each invest in equity securities, which are subject to changes in value that may be attributable to market perception of a particular issuer or to general stock market fluctuations that affect all issuers. Investments in
equity securities may be more volatile than investments in other asset classes. The Underlying Index is comprised of common stocks, which generally subject their holders to more risks than preferred stocks and debt securities because common
stockholders’ claims are subordinated to those of holders of preferred stocks and debt securities upon the bankruptcy of the issuer.
European Economic Risk. The EU
requires compliance by member states with restrictions on inflation rates, deficits, interest rates and debt levels, as well as fiscal and monetary controls, each of which may significantly affect every country in Europe, including those countries
that are not members of the EU. Changes in imports or exports, changes in governmental or EU regulations on trade, changes in the exchange rate of the euro (the common currency of certain EU countries), the default or threat of
7
default by an EU member state on its sovereign debt and/or an economic
recession in an EU member state may have a significant adverse effect on the economies of EU member states and their trading partners. The European financial markets have historically experienced volatility and adverse trends due to concerns about
economic downturns or rising government debt levels in several European countries, including, but not limited to, Austria, Belgium, Cyprus, France, Greece, Ireland, Italy, Portugal, Spain and Ukraine. These events have adversely affected the
exchange rate of the euro and may continue to significantly affect European countries.
Responses to financial problems by European governments,
central banks and others, including austerity measures and reforms, may not produce the desired results, may result in social unrest, may limit future growth and economic recovery or may have other unintended consequences. Further defaults or
restructurings by governments and other entities of their debt could have additional adverse effects on economies, financial markets and asset valuations around the world. In addition, one or more countries may abandon the euro and/or withdraw from
the EU. In a referendum held on June 23, 2016, the United Kingdom (the “U.K.”) resolved to leave the EU (“Brexit”). The referendum may introduce significant uncertainties and instability in the financial markets as the U.K.
negotiates its exit from the EU. The outcome of negotiations remains uncertain. U.K. businesses are increasingly preparing for a disorderly Brexit, and the consequences for European and U.K. businesses could be severe. The Fund will face risks
associated with the potential uncertainty and consequences that may follow Brexit, including with respect to volatility in exchange rates and interest rates. Brexit could adversely affect European or worldwide political, regulatory, economic or
market conditions and could contribute to instability in global political institutions, regulatory agencies and financial markets. Brexit could also lead to legal uncertainty and politically divergent national laws and regulations as a new
relationship between the U.K. and EU is defined and the U.K. determines which EU laws to replace or replicate. Any of these effects of Brexit could adversely affect any of the companies to which the Fund has exposure and any other assets that the
Fund invests in. The political, economic and legal consequences of Brexit are not yet known. In the short term, financial markets may experience heightened volatility, particularly those in the U.K. and Europe, but possibly worldwide. The U.K. may
be less stable than it has been in recent years, and investments in the U.K. may be difficult to value, or subject to greater or more frequent rises and falls in value. In the longer term, there is likely to be a period of significant political,
regulatory and commercial uncertainty as the U.K. seeks to negotiate its long-term exit from the EU.
Secessionist movements, such as the Catalan movement in Spain
and the independence movement in Scotland, as well as governmental or other responses to such movements, may also create instability and uncertainty in the region. In addition, the national politics of countries in the EU have been unpredictable and
subject to influence by varying political groups and ideologies. The governments of EU countries may be subject to change and such countries may experience social and political unrest. Unanticipated or sudden political or social developments may
result in sudden and significant investment losses. The occurrence of terrorist incidents throughout Europe also could impact financial markets. The impact of these events is not clear but
8
could be significant and far-reaching and could adversely affect the value and
liquidity of the Fund's investments.
Financials Sector
Risk. Companies in the financials sector of an economy are subject to extensive governmental regulation and intervention, which may adversely affect the scope of their activities, the prices they can charge,
the amount of capital they must maintain and, potentially, their size. The extent to which the Fund may invest in a company that engages in securities-related activities or banking is limited by applicable law. Governmental regulation may change
frequently and may have significant adverse consequences for companies in the financials sector, including effects not intended by such regulation. Recently enacted legislation in the U.S. has relaxed capital requirements and other regulatory
burdens on certain U.S. banks. While the effect of the legislation may benefit certain companies in the financials sector, including non-U.S. financials sector companies, increased risk taking by affected banks may also result in greater
overall risk in the financials sector. The impact of changes in capital requirements, or recent or future regulation in various countries, on any individual financial company or on the financials sector as a whole cannot be predicted. Certain risks
may impact the value of investments in the financials sector more severely than those of investments outside this sector, including the risks associated with companies that operate with substantial financial leverage. Companies in the financials
sector may also be adversely affected by increases in interest rates and loan losses, decreases in the availability of money or asset valuations, credit rating downgrades and adverse conditions in other related markets. Insurance companies, in
particular, may be subject to severe price competition and/or rate regulation, which may have an adverse impact on their profitability. The financials sector is particularly sensitive to fluctuations in interest rates. The financials sector is also
a target for cyber-attacks, and may experience technology malfunctions and disruptions. In recent years, cyber-attacks and technology malfunctions and failures have become increasingly frequent in this sector and have reportedly caused losses to
companies in this sector, which may negatively impact the Fund.
Geographic Risk. Some of the
companies in which the Fund or the Underlying Fund invests are located in parts of the world that have historically been prone to natural disasters, such as earthquakes, tornadoes, volcanic eruptions, droughts, floods, hurricanes or tsunamis, and
are economically sensitive to environmental events. Any such event may adversely impact the economies of these geographic areas or business operations of companies in these geographic areas, causing an adverse impact on the value of the
Fund.
Index-Related Risk. The Fund seeks to achieve a return that corresponds generally to the price and yield performance, before fees and expenses, of the Underlying Index as published by the Index Provider. There is no assurance that the
Index Provider or any agents that may act on its behalf will compile the Underlying Index accurately, or that the Underlying Index will be determined, composed or calculated accurately. While the Index Provider provides descriptions of what the
Underlying Index is designed to achieve, neither the Index Provider nor its agents provide any warranty or accept any liability in relation to the quality, accuracy or completeness of the Underlying Index or its related data, and they do not
guarantee that the Underlying Index will be in line with
9
the Index Provider’s methodology. BFA’s mandate as described in
this Prospectus is to manage the Fund consistently with the Underlying Index provided by the Index Provider to BFA. BFA does not provide any warranty or guarantee against the Index Provider’s or any agent’s errors. Errors in respect of
the quality, accuracy and completeness of the data used to compile the Underlying Index may occur from time to time and may not be identified and corrected by the Index Provider for a period of time or at all, particularly where the indices are less
commonly used as benchmarks by funds or managers. For example, during a period where the Underlying Index contains incorrect constituents, the Fund would have market exposure to such constituents and would be underexposed to the Underlying
Index’s other constituents. Such errors may negatively or positively impact the Fund and its shareholders. Shareholders should understand that any gains from Index Provider errors will be kept by the Fund and its shareholders and any losses or
costs resulting from Index Provider errors will be borne by the Fund and its shareholders.
Apart from scheduled rebalances, the Index Provider or its
agents may carry out additional ad hoc rebalances to the Underlying Index in order, for example, to correct an error in the selection of index constituents. When the Underlying Index is rebalanced and the Fund in turn rebalances its portfolio to
attempt to increase the correlation between the Fund’s portfolio and the Underlying Index, any transaction costs and market exposure arising from such portfolio rebalancing will be borne directly by the Fund and its shareholders. Unscheduled
rebalances to the Underlying Index may expose the Fund to additional tracking error risk, which is the risk that the Fund's returns may not track those of the Underlying Index. Therefore, errors and additional ad hoc rebalances carried out by the
Index Provider or its agents to the Underlying Index may increase the costs to and the tracking error risk of the Fund.
Similar risks exist for the Underlying Fund in tracking its
benchmark, which may result in the Fund's performance deviating from the return of the Underlying Index.
Information Technology Sector Risk. Information technology companies face intense competition, both domestically and internationally, which may have an adverse effect on their profit margins. Like other technology companies, information technology
companies may have limited product lines, markets, financial resources or personnel. The products of information technology companies may face obsolescence due to rapid technological developments, frequent new product introduction, unpredictable
changes in growth rates and competition for the services of qualified personnel. Companies in the information technology sector are heavily dependent on patent and intellectual property rights. The loss or impairment of these rights may adversely
affect the profitability of these companies.
Investment in Underlying Fund Risk. The Fund invests a substantial portion of its assets in the Underlying Fund, so the Fund’s investment performance is likely to be directly related to the performance of the Underlying Fund. The Fund may also
invest in other funds, including money market funds. The Fund’s NAV will change with changes in the value of the Underlying Fund and other instruments in which the Fund invests based on their market valuations. An investment in the Fund will
entail more direct and indirect costs and expenses than a direct investment in the Underlying Fund, including as a result of the currency hedging activity conducted by the Fund. For example, the
10
Fund indirectly pays a portion of the expenses (including operating expenses
and management fees) incurred by the Underlying Fund, although some of such fees will be offset by the fee waiver by BFA.
An investor in the Fund may receive taxable gains from
portfolio transactions by the Underlying Fund, as well as taxable gains from transactions in shares of the Underlying Fund held by the Fund. The Fund and the Underlying Fund may also hold common portfolio securities.
As the Fund's allocation to the Underlying Fund changes from
time to time, or to the extent that the expense ratio of the Underlying Fund changes, the weighted average operating expenses borne by the Fund may increase or decrease.
The Fund seeks to hedge the currency exposure of the
instruments held by the Underlying Fund. The indirect nature of the holdings may make the hedging more difficult to achieve, and the Fund may be unable to accurately hedge currency exposure inherent in the Underlying Fund.
Issuer Risk. The performance of
the Fund depends on the performance of individual securities and other instruments to which the Fund or the Underlying Fund has exposure. Any issuer of these securities or counterparty on other instruments may perform poorly, causing the value of
its securities or instruments to decline. Poor performance may be caused by poor management decisions, competitive pressures, changes in technology, expiration of patent protection, disruptions in supply, labor problems or shortages, corporate
restructurings, fraudulent disclosures, credit deterioration of the issuer or other factors. Issuers may, in times of distress or at their own discretion, decide to reduce or eliminate dividends, which may also cause their stock prices to decline.
An issuer may also be subject to risks associated with the countries, states and regions in which the issuer resides, invests, sells products, or otherwise conducts operations.
Large-Capitalization Companies Risk. Large-capitalization companies may be less able than smaller capitalization companies to adapt to changing market conditions. Large-capitalization companies may be more mature and subject to more limited growth
potential compared with smaller capitalization companies. During different market cycles, the performance of large-capitalization companies has trailed the overall performance of the broader securities markets.
Management Risk. Because BFA
uses a representative sampling indexing strategy, the Fund will not fully replicate the Underlying Index and may hold securities and other instruments not included in the Underlying Index. As a result, the Fund is subject to the risk that
BFA’s investment strategy, the implementation of which is subject to a number of constraints, may not produce the intended results.
Market Risk. The Fund and
the Underlying Fund could lose money over short periods due to short-term market movements and over longer periods during more prolonged market downturns. The value of a security, asset or other instrument may decline due to changes in general
market conditions, economic trends or events that are not specifically related to the issuer of the security or asset, or factors that affect a particular issuer or issuers, country, group of countries, region, market, industry, group of
industries, sector or asset class. During a general market downturn, multiple asset
11
classes may be negatively affected. Changes in market conditions and interest
rates generally do not have the same impact on all types of securities and instruments.
Market Trading Risk
Absence of Active Market.
Although shares of the Fund and the Underlying Fund are listed for trading on one or more stock exchanges, there can be no assurance that an active trading market for such shares will develop or be maintained by market makers or Authorized
Participants.
Risk of Secondary Listings. The Fund's and the Underlying Fund's shares may be listed or traded on U.S. and non-U.S. stock exchanges other than the U.S. stock exchange where the Fund's primary listing is maintained, and may otherwise be made
available to non-U.S. investors through funds or structured investment vehicles similar to depositary receipts. There can be no assurance that the Fund’s or the Underlying Fund's shares will continue to trade on any such stock exchange or in
any market or that the Fund’s or the Underlying Fund's shares will continue to meet the requirements for listing or trading on any exchange or in any market. The Fund's or the Underlying Fund's shares may be less actively traded in certain
markets than in others, and investors are subject to the execution and settlement risks and market standards of the market where they or their broker direct their trades for execution. Certain information available to investors who trade Fund or
Underlying Fund shares on a U.S. stock exchange during regular U.S. market hours may not be available to investors who trade in other markets, which may result in secondary market prices in such markets being less efficient.
Secondary Market Trading Risk.
Shares of the Fund or the Underlying Fund may trade in the secondary market at times when the Fund or the Underlying Fund does not accept orders to purchase or redeem shares. At such times, shares may trade in the secondary market with more
significant premiums or discounts than might be experienced at times when the Fund or the Underlying Fund accepts purchase and redemption orders. If the Fund purchases shares of the Underlying Fund at a time when the market price of Underlying Fund
shares is at a premium to their NAV or sells Underlying Fund shares when their market price is at a discount to their NAV, the Fund may incur losses.
Secondary market trading in Fund or Underlying Fund shares may
be halted by a stock exchange because of market conditions or for other reasons. In addition, trading in Fund or Underlying Fund shares on a stock exchange or in any market may be subject to trading halts caused by extraordinary market volatility
pursuant to “circuit breaker” rules on the stock exchange or market.
Shares of the Fund, similar to shares of other issuers listed
on a stock exchange, may be sold short and are therefore subject to the risk of increased volatility and price decreases associated with being sold short.
Shares of the Fund and the Underlying Fund May Trade at Prices
Other Than NAV. Shares of the Fund and the Underlying Fund each trade on stock exchanges at prices at, above or below the Fund’s most recent NAV. The NAV of the Fund and the Underlying Fund are calculated at
the end of each business day and fluctuate with changes in the market value of the Fund’s or the Underlying Fund's holdings. The trading price of each
12
of the Fund's and the Underlying Fund's shares fluctuates continuously
throughout trading hours based on both market supply of and demand for their shares and the underlying value of their portfolio holdings or NAV. As a result, the trading prices of the Fund’s and the Underlying Fund's shares may deviate
significantly from NAV during periods of market volatility. ANY OF THESE FACTORS, AMONG OTHERS, MAY LEAD TO THE FUND'S OR THE UNDERLYING FUND'S SHARES TRADING AT A PREMIUM OR DISCOUNT TO NAV. However, because
shares can be created and redeemed in Creation Units at NAV, BFA believes that large discounts or premiums to the NAV of the Fund or the Underlying Fund, as applicable, are not likely to be sustained over the long term (unlike shares of many
closed-end funds, which frequently trade at appreciable discounts from, and sometimes at premiums to, their NAVs). However, BFA may seek to limit the size of the Fund in order to attempt to mitigate the likelihood of a situation where the Fund is
unable to obtain sufficient liquidity in an underlying currency hedge to implement its investment objective, including by recommending that the Fund limit purchases of Fund shares through Creation Unit transactions. If the Fund elects to impose
limitations on creation transactions, Fund shares may be more likely to trade at a premium to NAV in the secondary market. While the creation/redemption feature is designed to make it more likely that the Fund’s or the Underlying Fund's
shares normally will trade on stock exchanges at prices close to the Fund’s or the Underlying Fund's next calculated NAV, exchange prices are not expected to correlate exactly with the NAV due to timing reasons, supply and demand imbalances
and other factors. In addition, disruptions to creations and redemptions, including disruptions at market makers, Authorized Participants, or other market participants, and during periods of significant market volatility, may result in trading
prices for shares of the Fund or the Underlying Fund that differ significantly from their respective NAV. Authorized Participants may be less willing to create or redeem Fund or Underlying Fund shares if there is a lack of an active market for such
shares or its underlying investments, which may contribute to the Fund’s or Underlying Fund's shares trading at a premium or discount to NAV.
Costs of Buying or Selling Fund Shares. Buying or selling Fund shares on an exchange involves two types of costs that apply to all securities transactions. When buying or selling shares of the Fund through a broker, you will likely incur a brokerage commission
and other charges. In addition, you may incur the cost of the “spread”; that is, the difference between what investors are willing to pay for Fund shares (the “bid” price) and the price at which they are willing to sell Fund
shares (the “ask” price). The spread, which varies over time for shares of the Fund based on trading volume and market liquidity, is generally narrower if the Fund has more trading volume and market liquidity and wider if the Fund
has less trading volume and market liquidity. In addition, increased market volatility may cause wider spreads. There may also be regulatory and other charges that are incurred as a result of trading activity. Because of the costs inherent in buying
or selling Fund shares, frequent trading may detract significantly from investment results and an investment in Fund shares may not be advisable for investors who anticipate regularly making small investments through a brokerage
account.
National Closed Market Trading Risk. To the extent that the underlying securities held by the Fund or the Underlying Fund trade on foreign exchanges or in foreign
13
markets that may be closed when the securities exchange on which the
Fund’s or the Underlying Fund's shares trade is open, there are likely to be deviations between the current price of an underlying security and the last quoted price for the underlying security
(i.e., the Fund’s or the Underlying Fund's quote from the closed foreign market). These deviations could result in premiums or discounts to the Fund’s or the Underlying Fund's NAV that
may be greater than those experienced by other ETFs.
Non-U.S. Securities Risk.
Investments in the securities of non-U.S. issuers are subject to the risks of investing in the markets where such issuers are located, including heightened risks of inflation, nationalization and market fluctuations caused by economic and political
developments. As a result of investing in non-U.S. securities, the Fund or the Underlying Fund may be subject to increased risk of loss caused by any of the factors listed below:
| ■ | Lower levels of liquidity and market efficiency; |
| ■ | Greater securities price volatility; |
| ■ | Exchange rate fluctuations and exchange controls; |
| ■ | Less availability of public information about issuers; |
| ■ | Limitations on foreign ownership of securities; |
| ■ | Imposition of withholding or other taxes; |
| ■ | Imposition of restrictions on the expatriation of the funds or other assets of the Fund; |
| ■ | Higher transaction and custody costs and delays in settlement procedures; |
| ■ | Difficulties in enforcing contractual obligations; |
| ■ | Lower levels of regulation of the securities markets; |
| ■ | Weaker accounting, disclosure and reporting requirements; and |
| ■ | Legal principles relating to corporate governance, directors’ fiduciary duties and liabilities and stockholders’ rights in markets in which the Fund invests may differ and/or may not be as extensive or protective as those that apply in the U.S. |
Operational Risk. The Fund and the Underlying Fund are exposed to operational risks arising from a number of factors, including, but not limited to, human error, processing and communication errors, errors of the Fund’s or the
Underlying Fund's service providers, counterparties or other third-parties, failed or inadequate processes and technology or systems failures. The Fund, the Underlying Fund and BFA seek to reduce these operational risks through controls and
procedures. However, these measures do not address every possible risk and may be inadequate to address significant operational risks.
Passive Investment Risk. The
Fund and the Underlying Fund are not actively managed and may be affected by a general decline in market segments related to the Underlying Index. The Fund invests in securities and other instruments included in, or representative of, the Underlying
Index, regardless of their investment merits. BFA generally does not attempt to invest the Fund's assets in defensive positions under any market conditions, including declining markets.
14
Privatization Risk. Some
countries in which the Fund and the Underlying Fund invests have privatized, or have begun the process of privatizing, certain entities and industries. Newly privatized companies may face strong competition from government-sponsored competitors that
have not been privatized. In some instances, investors in newly privatized entities have suffered losses due to the inability of the newly privatized entities to adjust quickly to a competitive environment or changing regulatory and legal standards
or, in some cases, due to re-nationalization of such privatized entities. There is no assurance that similar losses will not recur.
Reliance on Trading Partners Risk. Economies in emerging market countries generally are heavily dependent upon commodity prices and international trade. Accordingly, these countries have been, and may continue to be, affected adversely by the economies
of their trading partners, trade barriers, exchange controls or managed adjustments in relative currency values and may suffer from extreme and volatile debt burdens or inflation rates. These countries may be subject to other protectionist measures
imposed or negotiated by the countries with which they trade.
Risk of Investing in China.
Investments in Chinese issuers subject the Fund to risks specific to China. Investments in certain Hong Kong-listed securities may also subject the Fund or the Underlying Fund to exposure to Chinese companies. The Chinese economy is subject to a
considerable degree of economic, political and social instability:
Political and Social Risk. The
Chinese government is authoritarian and has periodically used force to suppress civil dissent. Disparities of wealth and the pace of economic liberalization may lead to social turmoil, violence and labor unrest. In addition, China continues to
experience disagreements related to integration with Hong Kong and religious and nationalist disputes in Tibet and Xinjiang. There is also a greater risk in China than in many other countries of currency fluctuations, currency non-convertibility,
interest rate fluctuations and higher rates of inflation as a result of internal social unrest or conflicts with other countries. Unanticipated political or social developments may result in sudden and significant investment losses. China's growing
income inequality, rapidly aging population and significant environmental issues also are factors that may affect the Chinese economy.
Government Control and Regulations. The Chinese government has implemented significant economic reforms in order to liberalize trade policy, promote foreign investment in the economy, reduce government control of the economy and develop market mechanisms.
There can be no assurance these reforms will continue or that they will be effective. Despite recent reform and privatizations, government control over certain sectors or enterprises and significant regulation of investment and industry is still
pervasive, including restrictions on investment in companies or industries deemed to be sensitive to particular national interests, and the Chinese government may restrict foreign ownership of Chinese corporations and/or the repatriation of assets
by foreign investors. Limitations or restrictions on foreign ownership of securities may have adverse effects on the liquidity and performance of the Fund, and could lead to higher tracking error. Chinese government intervention in the market may
have a negative impact on market sentiment, which may in turn affect the performance of the Chinese economy and the Fund’s investments. Chinese
15
markets generally continue to experience inefficiency, volatility and pricing
anomalies that may be connected to governmental influence, lack of publicly-available information and/or political and social instability.
Economic Risk. The Chinese
economy has grown rapidly in the recent past and there is no assurance that this growth rate will be maintained. In fact, the Chinese economy may experience a significant slowdown as a result of, among other things, a deterioration in global demand
for Chinese exports, as well as contraction in spending on domestic goods by Chinese consumers. In addition, China may experience substantial rates of inflation or economic recessions, which would have a negative effect on its economy and securities
market. Delays in enterprise restructuring, slow development of well-functioning financial markets and widespread corruption have also hindered performance of the Chinese economy. China continues to receive substantial pressure from trading partners
to liberalize official currency exchange rates. Reduction in spending on Chinese products and services, institution of additional tariffs or other trade barriers, including as a result of heightened trade tensions between China and the U.S., or a
downturn in any of the economies of China’s key trading partners may have an adverse impact on the Chinese economy.
Expropriation Risk. The
Chinese government maintains a major role in economic policymaking and investing in China involves risk of loss due to expropriation, nationalization, or confiscation of assets and property or the imposition of restrictions on foreign investments
and on repatriation of capital invested.
Security
Risk. China has strained international relations with Taiwan, India, Russia and other neighbors due to territorial disputes, historical animosities, defense concerns and other security concerns. Relations between
China's Han ethnic majority and other ethnic groups in China, including Tibetans and Uighurs, are also strained and have been marked by protests and violence. These situations may cause uncertainty in the Chinese market and may adversely affect the
Chinese economy. In addition, conflict on the Korean Peninsula could adversely affect the Chinese economy.
Chinese Equity Markets. The
Fund may invest in H-shares (securities of companies incorporated in the People's Republic of China (“PRC”) that are denominated in Hong Kong dollars and listed on the Stock Exchange of Hong Kong), A-shares (securities of companies
incorporated in the PRC that are denominated in renminbi and listed on the Shanghai Stock Exchange (“SSE”) and the Shenzhen Stock Exchange (“SZSE”)) and B-shares (securities of companies incorporated in the PRC that are
denominated in U.S. dollars (in the case of the SSE) or Hong Kong dollars (in the case of the SZSE) and listed on the SSE and the SZSE). The Fund may also invest in certain Hong Kong listed securities known as Red-Chips (securities issued by
companies incorporated in certain foreign jurisdictions, which are controlled, directly or indirectly, by entities owned by the national government or local governments in the PRC and derive substantial revenues from or allocate substantial assets
in the PRC) and P-Chips (securities issued by companies incorporated in certain foreign jurisdictions, which are controlled, directly or indirectly, by individuals in the PRC and derive substantial revenues from or allocate substantial assets in the
PRC). The issuance of B-shares and H-shares by Chinese companies and the ability to obtain a “back-door listing” through Red-Chips or P-Chips is still regarded by the Chinese authorities as an experiment in economic
16
reform. “Back-door listing” is a means by which a mainland Chinese
company issues Red-Chips or P-Chips to obtain quick access to international listing and international capital. All of these share mechanisms are relatively untested and subject to political and economic policies in China.
Hong Kong Political Risk. Hong
Kong reverted to Chinese sovereignty on July 1, 1997 as a Special Administrative Region (SAR) of the PRC under the principle of “one country, two systems.” Although China is obligated to maintain the current capitalist economic and
social system of Hong Kong through June 30, 2047, the continuation of economic and social freedoms enjoyed in Hong Kong is dependent on the government of China. Any attempt by China to tighten its control over Hong Kong's political, economic, legal
or social policies may result in an adverse effect on Hong Kong's markets. In addition, the Hong Kong dollar trades at a fixed exchange rate in relation to (or, is “pegged” to) the U.S. dollar, which has contributed to the growth and
stability of the Hong Kong economy. However, it is uncertain how long the currency peg will continue or what effect the establishment of an alternative exchange rate system would have on the Hong Kong economy. Because the Fund's NAV is denominated
in U.S. dollars, the establishment of an alternative exchange rate system could result in a decline in the Fund's NAV.
Risk of Investing in Emerging Markets. Investments in emerging market issuers are subject to a greater risk of loss than investments in issuers located or operating in more developed markets. This is due to, among other things, the potential for greater
market volatility, lower trading volume, higher levels of inflation, political and economic instability, greater risk of a market shutdown and more governmental limitations on foreign investments in emerging market countries than are typically found
in more developed markets. Moreover, emerging markets often have less uniformity in accounting and reporting requirements, less reliable securities valuations and greater risks associated with custody of securities than developed markets. In
addition, emerging markets often have greater risk of capital controls through such measures as taxes or interest rate control than developed markets. Certain emerging market countries may also lack the infrastructure necessary to attract large
amounts of foreign trade and investment. Local securities markets in emerging market countries may trade a small number of securities and may be unable to respond effectively to changes in trading volume, potentially making prompt liquidation of
holdings difficult or impossible at times. Settlement procedures in emerging market countries are frequently less developed and reliable than those in the U.S. (and other developed countries). In addition, significant delays may occur in certain
markets in registering the transfer of securities. Settlement or registration problems may make it more difficult for the Fund or the Underlying Fund to value its portfolio securities and could cause the Fund or the Underlying Fund to miss
attractive investment opportunities.
Investing in
emerging market countries involves a higher risk of loss due to expropriation, nationalization, confiscation of assets and property or the imposition of restrictions on foreign investments and on repatriation of capital invested in certain emerging
market countries.
17
Risk of Investing in Russia.
Investing in Russian securities involves significant risks, in addition to those described under “Risk of Investing in Emerging Markets” and “Non-U.S. Securities Risk” that are not typically associated with investing in U.S.
securities, including:
| ■ | The risk of delays in settling portfolio transactions and the risk of loss arising out of the system of share registration and custody used in Russia; |
| ■ | Risks in connection with the maintenance of the Fund’s or the Underlying Fund's portfolio securities and cash with foreign sub-custodians and securities depositories, including the risk that appropriate sub-custody arrangements will not be available to the Fund or the Underlying Fund; |
| ■ | The risk that the Fund’s or the Underlying Fund's ownership rights in portfolio securities could be lost through fraud or negligence because ownership in shares of Russian companies is recorded by the companies themselves and by registrars, rather than by a central registration system; and |
| ■ | The risk that the Fund or the Underlying Fund may not be able to pursue claims on behalf of its shareholders because of the system of share registration and custody, and because Russian banking institutions and registrars are not guaranteed by the Russian government. |
Russia
Sanctions. The U.S. and the Economic and Monetary Union of the EU, along with the regulatory bodies of a number of countries including Japan, Australia, Norway, Switzerland and Canada (collectively,
“Sanctioning Bodies”), have imposed economic sanctions, which consist of prohibiting certain securities trades, prohibiting certain private transactions in the energy sector, asset freezes and prohibition of all business, against certain
Russian individuals and Russian corporate entities. The Sanctioning Bodies could also institute broader sanctions on Russia. These sanctions, or even the threat of further sanctions, may result in the decline of the value and liquidity of Russian
securities, a weakening of the ruble or other adverse consequences to the Russian economy. These sanctions could also result in the immediate freeze of Russian securities and/or funds invested in prohibited assets, impairing the ability of the Fund
or the Underlying Fund to buy, sell, receive or deliver those securities and/or assets. Additional sanctions against Russia have been, and may in the future be, imposed by the U.S. or other countries.
The sanctions against certain Russian issuers include
prohibitions on transacting in or dealing in issuances of debt or equity of such issuers. Compliance with each of these sanctions may impair the ability of the Fund or the Underlying Fund to buy, sell, hold, receive or deliver the affected
securities or other securities of such issuers. If it becomes impracticable or unlawful for the Fund or the Underlying Fund to hold securities subject to, or otherwise affected by, sanctions (collectively, “affected securities”), or if
deemed appropriate by BFA, the Fund or the Underlying Fund may prohibit in-kind deposits of the affected securities in connection with creation transactions and instead require a cash deposit, which may also increase the Fund's or the Underlying
Fund's transaction costs. The Fund or the Underlying Fund may also be legally required to freeze assets in a blocked account.
Also, if an affected security is included in the Fund’s
or the Underlying Fund's Underlying Index, the Fund or the Underlying Fund may, where practicable, seek to
18
eliminate its holdings of the affected security by employing or augmenting its
representative sampling strategy to seek to track the investment results of its Underlying Index. The use of (or increased use of) a representative sampling strategy may increase the Fund’s or the Underlying Fund's tracking error risk. If the
affected securities constitute a significant percentage of the Underlying Index, the Fund or the Underlying Fund may not be able to effectively implement a representative sampling strategy, which may result in significant tracking error between the
Fund’s or the Underlying Fund's performance and the performance of its Underlying Index.
Current or future sanctions may result in Russia taking counter
measures or retaliatory actions, which may further impair the value and liquidity of Russian securities. These retaliatory measures may include the immediate freeze of Russian assets held by the Fund or the Underlying Fund. In the event of such a
freeze of any Fund or Underlying Fund assets, including depositary receipts, the Fund or the Underlying Fund may need to liquidate non-restricted assets in order to satisfy any Fund or Underlying Fund redemption orders. The liquidation of Fund or
Underlying Fund assets during this time may also result in the Fund or the Underlying Fund receiving substantially lower prices for its securities.
These sanctions may also lead to changes in the Fund’s or
the Underlying Fund's Underlying Index. The Fund’s or the Underlying Fund's Index Provider may remove securities from the Underlying Index or implement caps on the securities of certain issuers that have been subject to recent economic
sanctions. In such an event, it is expected that the Fund or the Underlying Fund will rebalance its portfolio to bring it in line with the Underlying Index as a result of any such changes, which may result in transaction costs and increased tracking
error. These sanctions, the volatility that may result in the trading markets for Russian securities and the possibility that Russia may impose investment or currency controls on investors may cause the Fund or the Underlying Fund to invest in, or
increase the Fund’s or the Underlying Fund's investments in, depositary receipts that represent the securities of the Underlying Index. These investments may result in increased transaction costs and increased tracking error.
Securities Lending Risk. The
Fund and the Underlying Fund may engage in securities lending. Securities lending involves the risk that the Fund or the Underlying Fund may lose money because the borrower of the loaned securities fails to return the securities in a timely
manner or at all. The Fund or the Underlying Fund could also lose money in the event of a decline in the value of collateral provided for loaned securities or a decline in the value of any investments made with cash collateral. These events
could also trigger adverse tax consequences for the Fund or the Underlying Fund. BlackRock Institutional Trust Company, N.A., the Fund's securities lending agent, will take into account the tax impact to shareholders of substitute payments
for dividends when managing the Fund's securities lending program.
Security Risk. Some geographic
areas in which the Fund or the Underlying Fund invests have experienced acts of terrorism and strained international relations due to territorial disputes, historical animosities, defense concerns and other security concerns. These situations may
cause uncertainty in the markets of these geographic
19
areas and may adversely affect their economies and the Fund's and the
Underlying Fund's investments.
Structural Risk. Certain political, economic, legal and currency risks could contribute to a high degree of price volatility in the equity markets of some of the countries in which the Fund or the Underlying Fund may invest and
could adversely affect investments in the Fund or the Underlying Fund.
Political and Social Risk.
Disparities of wealth, the pace and success of democratization and ethnic, religious and racial disaffection, among other factors, may exacerbate social unrest, violence and labor unrest in some of the countries in which the Fund or the Underlying
Fund may invest. Unanticipated or sudden political or social developments may result in sudden and significant investment losses.
Economic Risk. Some countries
in which the Fund or the Underlying Fund may invest may experience economic instability, including instability resulting from substantial rates of inflation or significant devaluations of their currency, or economic recessions, which would have a
negative effect on the economies and securities markets of their economies. Some of these countries may also impose restrictions on the exchange or export of currency or adverse currency exchange rates and may be characterized by a lack of available
currency hedging instruments.
Expropriation Risk. Investments in certain countries in which the Fund or the Underlying Fund may invest may be subject to loss due to expropriation or nationalization of assets and property or the imposition of restrictions on foreign
investments and repatriation of capital.
Large
Government Debt Risk. Chronic structural public sector deficits in some countries in which the Fund or the Underlying Fund may invest may adversely impact securities held by the Fund or the Underlying
Fund.
Tax Risk.
Because the Fund invests in the Underlying Fund, the Fund’s realized losses on sales of shares of the Underlying Fund may be indefinitely or permanently deferred as “wash sales.” Distributions of short-term capital gains by the
Underlying Fund will be recognized as ordinary income by the Fund and would not be offset by the Fund’s capital loss carryforwards, if any. Capital loss carryforwards of the Underlying Fund, if any, would not offset net capital gains of the
Fund. Each of these effects is caused by the Fund’s investment in the Underlying Fund and may result in distributions to Fund shareholders being of higher magnitudes and less likely to qualify for lower capital gain tax rates than if the Fund
were to invest directly in the securities and other instruments comprising the Underlying Index. The Fund invests in derivatives. The federal income tax treatment of a derivative may not be as favorable as a direct investment in an underlying asset.
Derivatives may produce taxable income and taxable realized gain. Derivatives may adversely affect the timing, character and amount of income the Fund realizes from its investments. As a result, a larger portion of the Fund’s distributions may
be treated as ordinary income rather than as capital gains. In addition, certain derivatives are subject to mark-to-market or straddle provisions of the Internal Revenue Code. If such provisions are applicable, there could be an increase (or
decrease) in the amount of taxable dividends paid by the Fund. Income from swaps is generally taxable. In addition, the tax treatment of certain derivatives, such as swaps,
20
is unsettled and may be subject to future legislation, regulation or
administrative pronouncements issued by the IRS.
Tracking
Error Risk. The Fund may be subject to tracking error, which is the divergence of the Fund’s performance from that of the Underlying Index. Tracking error may occur because of differences between the
securities (including shares of the Underlying Fund) and other instruments held in the Fund’s portfolio and those included in the Underlying Index, pricing differences (including, as applicable, differences between a security’s
price at the local market close and the Fund’s valuation of a security at the time of calculation of the Fund’s NAV), differences in transaction and hedging costs and forward rates achieved, the Fund’s holding of uninvested cash,
differences in timing of the accrual of or the valuation of dividends or other distributions, the requirements to maintain pass-through tax treatment, portfolio transactions carried out to minimize the distribution of capital gains to shareholders,
changes to the Underlying Index and the cost to the Fund of complying with various new or existing regulatory requirements. These risks may be heightened during times of increased market volatility or other unusual market conditions in the affected
securities and/or foreign exchange markets. In addition, tracking error may result because the Fund incurs fees and expenses, while the Underlying Index does not, and because the Fund accepts creations and redemptions during time periods between
which it is able to adjust its currency hedges, whereas the Underlying Index does not adjust its hedging during these periods. To the extent that the Fund seeks its investment objective through investments in the Underlying Fund, the Fund may
experience increased tracking error as compared to investing directly in the component securities of the Underlying Index. The potential for increased tracking error may result from investments in the Underlying Fund due to, among other things,
differences in the composition of the investment portfolio of the Underlying Fund as compared to the index tracked by the Underlying Fund and differences in the timing of the Fund’s valuation of: (i) the Underlying Fund and the currency
forward contracts (each valued as of the close of the NYSE, typically 4:00 p.m., Eastern Time), (ii) the valuation of the securities in the Underlying Index (generally valued as of each security’s local market close) and (iii) the currency
forward contracts included in the Underlying Index (generally valued at 4:00 p.m., London time). INDEX ETFs THAT TRACK INDICES WITH SIGNIFICANT WEIGHT IN EMERGING MARKETS ISSUERS MAY EXPERIENCE HIGHER TRACKING ERROR THAN OTHER INDEX ETFs THAT DO NOT
TRACK SUCH INDICES.
U.S. Economic Risk. The U.S. is a significant, and in some cases the most significant, trading partner of, or foreign investor in, certain country or countries in which the Fund or the Underlying Fund invests. As a result, economic
conditions of such countries may be particularly affected by changes in the U.S. economy. A decrease in U.S. imports or exports, new trade and financial regulations or tariffs, changes in the U.S. dollar exchange rate or an economic slowdown in the
U.S. may have a material adverse effect on the economic conditions of such countries and, as a result, securities to which the Fund or the Underlying Fund has exposure.
Valuation Risk. The price the
Fund and the Underlying Fund could receive upon the sale of a security or unwind of a financial instrument or other asset may differ from the
21
Fund's or the Underlying Fund's valuation of the security, instrument or other
asset and from the value used by the Underlying Index, particularly for securities or other instruments that trade in low volume or volatile markets or that are valued using a fair value methodology as a result of trade suspensions or for other
reasons. Because non-U.S. exchanges may be open on days when the Fund does not price its shares, the value of the securities or other instruments in the Fund’s or the Underlying Fund's portfolio may change on days or during time periods when
shareholders will not be able to purchase or sell the Fund’s or the Underlying Fund's shares. In addition, for purposes of calculating the Fund's NAV, the value of assets denominated in non-U.S. currencies is converted into U.S. dollars
using prevailing market rates on the date of valuation as quoted by one or more data service providers. This conversion may result in a difference between the prices used to calculate the Fund's NAV and the prices used by the Underlying Index,
which, in turn, could result in a difference between the Fund's performance and the performance of the Underlying Index. Authorized Participants who purchase or redeem Fund shares on days when the Fund is holding fair-valued securities may receive
fewer or more shares, or lower or higher redemption proceeds, than they would have received had the Fund not fair-valued securities or used a different valuation methodology. The Fund’s ability to value investments may be impacted by
technological issues or errors by pricing services or other third-party service providers.
A Further Discussion of Other Risks
The Fund may also be subject to certain other risks associated
with its investments and investment strategies either directly or indirectly through the Fund's investments in the Underlying Fund.
African Economic Risk.
Investing in the economies of African countries involves risks not typically associated with investments in securities of issuers in more developed economies, countries or geographic regions that may negatively affect the value of investments in the
Fund. Such heightened risks include, among others, expropriation and/or nationalization of assets, restrictions on and government intervention in international trade, confiscatory taxation, political instability, including authoritarian and/or
military involvement in governmental decision making, armed conflict, civil war, and social instability as a result of religious, ethnic and/or socioeconomic unrest or widespread outbreaks of disease.
The securities markets in Africa are underdeveloped and are
often considered to be less correlated to global economic cycles than markets located in more developed economies, countries or geographic regions. Securities markets in African countries are subject to greater risks associated with market
volatility, lower market capitalization, lower trading volume, illiquidity, inflation, greater price fluctuations, uncertainty regarding the existence of trading markets, governmental control and heavy regulation of labor and industry. Moreover,
trading on African securities markets may be suspended altogether.
Certain governments in African countries may restrict or
control to varying degrees the ability of foreign investors to invest in securities of issuers located or operating in those countries. Moreover, certain countries in Africa may require governmental
22
approval or special licenses prior to investment by foreign investors; may
limit the amount of investment by foreign investors in a particular industry and/or issuer; may limit such foreign investment to a certain class of securities of an issuer that may have less advantageous rights than the classes available for
purchase by domestic investors of those countries; and/or may impose additional taxes on foreign investors. These factors, among others, make investing in issuers located or operating in countries in Africa significantly riskier than investing in
issuers located or operating in more developed countries.
Central and South American Economic Risk. The economies of certain Central and South American countries have experienced high interest rates, economic volatility, inflation, currency devaluations, government defaults and high unemployment rates. In addition,
commodities (such as oil, gas and minerals) represent a significant percentage of the region’s exports and as a result many economies in this region are particularly sensitive to fluctuations in commodity prices. Adverse economic events in one
country may have a significant adverse impact on the economies of other countries of this region.
Close-out Risk for Qualified Financial Contracts. Regulations adopted by the prudential regulators, which are scheduled to take effect with respect to the Fund in 2019, will require counterparties that are part of U.S. or foreign global systemically important banking
organizations to include contractual restrictions on close-out and cross-default in agreements relating to qualified financial contracts. Qualified financial contracts include agreements relating to swaps, currency forwards and other derivatives as
well as repurchase agreements and securities lending agreements. The restrictions prevent the Fund from closing out a qualified financial contract during a specified time period if the counterparty is subject to resolution proceedings and prohibit
the Fund from exercising default rights due to a receivership or similar proceeding of an affiliate of the counterparty. Implementation of these requirements may increase credit and other risks to the Fund.
Consumer Discretionary Sector Risk. The success of consumer product manufacturers and retailers is tied closely to the performance of domestic and international economies, interest rates, exchange rates, competition, consumer confidence, changes in
demographics and consumer preferences. Companies in the consumer discretionary sector depend heavily on disposable household income and consumer spending, and may be strongly affected by social trends and marketing campaigns. These companies may be
subject to severe competition, which may have an adverse impact on their profitability.
Consumer Staples Sector Risk.
Companies in the consumer staples sector may be affected by the regulation of various product components and production methods, marketing campaigns and changes in the global economy, consumer spending and consumer demand. Tobacco companies, in
particular, may be adversely affected by new laws, regulations and litigation. Companies in the consumer staples sector may also be adversely affected by changes or trends in commodity prices, which may be influenced by unpredictable factors. These
companies may be subject to severe competition, which may have an adverse impact on their profitability.
23
Dividend Risk. There is no
guarantee that issuers of the stocks held by the Fund will declare dividends in the future or that, if declared, such dividends will remain at current levels or increase over time.
Eastern European Economic Risk.
An investment in issuers located or operating in Eastern Europe may subject the Fund to legal, regulatory, political, currency, security and economic risks specific to Eastern Europe. Economies of certain Eastern
European countries rely heavily on the export of commodities, including oil, gas, and certain metals. As a result, such economies may be impacted by international commodity prices and are particularly vulnerable to global demand for these products.
Geopolitical events, acts of terrorism, and other instability in certain Eastern European countries may cause uncertainty in their financial markets and adversely affect the performance of the issuers to which the Fund and the Underlying Fund have
exposure. The securities markets in some Eastern European countries are substantially smaller and less developed, with less government supervision and regulation of stock exchanges, and may be less liquid and more volatile than securities markets in
the U.S. or Western European countries. In addition, investing in securities of issuers located or operating in Eastern Europe may involve:
| ■ | The risk of delays in settling portfolio transactions and the risk of loss arising out of the system of share registration and custody used in certain Eastern European countries; |
| ■ | Risks in connection with the maintenance of the Fund's portfolio securities and cash with foreign sub-custodians and securities depositories, including the risk that appropriate sub-custody arrangements will not be available to the Fund; |
| ■ | The risk that the Fund's ownership rights in portfolio securities could be lost through fraud or negligence as a result of the fact that ownership in shares of certain Eastern European companies is recorded by the companies themselves and by registrars, rather than a central registration system; |
| ■ | The risk that the Fund may not be able to pursue claims on behalf of its shareholders because of the system of share registration and custody, and because certain Eastern European banking institutions and registrars are not guaranteed by their respective governments; and |
| ■ | Risks in connection with Eastern European countries' dependence on the economic health of Western European countries and the EU as a whole. |
Other risks related to investing in securities of issuers
located or operating in Eastern Europe include: the potential absence of legal structures governing private and foreign investments and private property; the possibility of the loss of all or a substantial portion of the Fund’s assets invested
in issuers located or operating in Eastern Europe as a result of expropriation; and certain national policies which may restrict the Fund’s investment opportunities, including, without limitation, restrictions on investing in issuers or
industries deemed sensitive to relevant national interests. In addition, Eastern European securities markets are particularly sensitive to social, political, economic, and currency events in Russia and may suffer heavy losses as a result of their
trading and investment links to the Russian economy and currency.
24
Energy Sector Risk. The success
of companies in the energy sector may be cyclical and highly dependent on energy prices. The market value of securities issued by companies in the energy sector may decline for many reasons, including, among
other reasons: changes in the levels and volatility of global energy prices, energy supply and demand, and capital expenditures on exploration and production of energy sources; exchange rates, interest rates, economic conditions, and tax treatment;
and energy conservation efforts, increased competition and technological advances. Companies in this sector may be subject to substantial government regulation and contractual fixed pricing, which may increase the cost of doing business and limit
the earnings of these companies. A significant portion of the revenues of these companies may depend on a relatively small number of customers, including governmental entities and utilities. As a result, governmental budget constraints may have a
material adverse effect on the stock prices of companies in this sector. Energy companies may also operate in, or engage in, transactions involving countries with less developed regulatory regimes or a history of expropriation, nationalization or
other adverse policies. Energy companies also face a significant risk of liability from accidents resulting in injury or loss of life or property, pollution or other environmental problems, equipment malfunctions or mishandling of materials and a
risk of loss from terrorism, political strife or natural disasters. Any such event could have serious consequences for the general population of the affected area and could have an adverse impact on the Fund’s or the Underlying Fund's
portfolio and the performance of the Fund. Energy companies can be significantly affected by the supply of, and demand for, specific products (e.g.,
oil and natural gas) and services, exploration and production spending, government subsidization, world events and general economic conditions. Energy companies may have relatively high levels of debt and may be more likely than other companies to
restructure their businesses if there are downturns in energy markets or in the global economy.
Industrials Sector Risk. The
value of securities issued by companies in the industrials sector may be adversely affected by supply and demand changes related to their specific products or services and industrials sector products in general. The products of manufacturing
companies may face obsolescence due to rapid technological developments and frequent new product introduction. Global events and changes in government regulations, economic conditions and exchange rates may adversely affect the performance of
companies in the industrials sector. Companies in the industrials sector may be adversely affected by liability for environmental damage and product liability claims. The industrials sector may also be adversely affected by changes or trends in
commodity prices, which may be influenced by unpredictable factors. Companies in the industrials sector, particularly aerospace and defense companies, may also be adversely affected by government spending policies because companies in this sector
tend to rely to a significant extent on government demand for their products and services.
Materials Sector Risk.
Companies in the materials sector may be adversely affected by commodity price volatility, exchange rates, import controls, increased competition, depletion of resources, technical advances, labor relations, over-production, litigation and
government regulations, among other factors. Companies in the materials sector are also at risk of liability for environmental damage and product liability claims.
25
Production of materials may exceed demand as a result of market imbalances or
economic downturns, leading to poor investment returns.
Mid-Capitalization Companies Risk. Stock prices of mid-capitalization companies may be more volatile than those of large-capitalization companies and, therefore, the Fund’s or the Underlying Fund's respective share price may be more volatile than
those of funds that invest a larger percentage of their assets in stocks issued by large-capitalization companies. Stock prices of mid-capitalization companies are also more vulnerable than those of large-capitalization companies to adverse business
or economic developments, and the stocks of mid-capitalization companies may be less liquid, making it difficult for the Fund or the Underlying Fund to buy and sell shares of mid-capitalization companies. In addition, mid-capitalization companies
generally have less diverse product lines than large-capitalization companies and are more susceptible to adverse developments related to their products.
Threshold/Underinvestment Risk.
If certain aggregate ownership thresholds are reached either through the actions of BFA and its affiliates or the Fund, or as a result of third-party transactions, the ability of BFA and its affiliates on behalf of clients (including the Fund) to
purchase or dispose of investments, or exercise rights or undertake business transactions, may be restricted by regulation or otherwise impaired. The capacity of the Fund to make investments in certain securities may be affected by the relevant
threshold limits, and such limitations may have adverse effects on the liquidity and performance of the Fund’s portfolio holdings compared to the performance of the Underlying Index. This may increase the risk of the Fund being
underinvested to the Underlying Index and increase the risk of tracking error.
Portfolio Holdings Information
A description of the Company's policies and procedures with
respect to the disclosure of the Fund’s portfolio securities is available in the Fund's Statement of Additional Information (“SAI”). The top holdings of the Fund can be found at www.iShares.com. Fund fact sheets provide information
regarding the Fund's top holdings and may be requested by calling 1-800-iShares (1-800-474-2737).
A Further Discussion of Principal Investment Strategies
Overview
The Fund allocates and reallocates its assets among direct
investments in securities and other instruments, and in investments in the Underlying Fund consistent with the allocation and reallocation of securities in the Underlying Index as determined by the Index Provider. The Fund invests in
foreign currency forward contracts designed to hedge non-U.S. currency fluctuations inherent in the securities in the Underlying Index. In addition, the Fund may borrow, lend its portfolio securities to brokers, dealers and financial
institutions, and may invest the collateral in certain short-term instruments, either directly or through one or more money market funds, as described in greater detail in the Fund’s SAI.
26
The Underlying Fund
The Fund invests a substantial portion of its assets in the
Underlying Fund, so the Fund’s investment performance is likely to be directly related to the performance of the Underlying Fund. The Fund’s NAV will change with changes in the value of the Underlying Fund and other instruments in which
the Fund invests, subject to the impact of currency hedges, which may cause the Fund to outperform or underperform the return of the Underlying Fund. An investment in the Fund will entail more direct and indirect costs and expenses than a direct
investment in the Underlying Fund and in currency hedges. The Underlying Fund invests in non-U.S. securities without implementing a hedge of the local currency risk. This strategy is subject to additional risks, as described in this Prospectus
and in the Fund’s SAI.
BFA is not required to
invest the Fund’s assets in any particular underlying fund, including the Underlying Fund, or allocate any particular percentage of the Fund’s assets to any particular underlying fund, including the Underlying Fund. Currently, the Fund
achieves its investment objective by investing a substantial portion of its assets in the Underlying Fund and in currency hedges.
The Underlying Fund seeks investment results that correspond
generally to the price and yield performance, before fees and expenses, of the MSCI Emerging Markets Index, which is designed to measure equity market performance in the global emerging markets. The “MSCI Emerging Markets Index” is a
servicemark of MSCI and has been licensed for use for certain purposes by BFA or its affiliates. The Underlying Fund is not sponsored, endorsed, sold, or promoted by MSCI, and MSCI makes no representation regarding the advisability of investing in
the Underlying Fund or the Fund.
In managing the
Underlying Fund, BFA uses a representative sampling index strategy. Representative sampling is an indexing strategy that involves investing in a representative sample of securities that collectively have an investment profile similar to a specified
benchmark index. Securities selected for the Underlying Fund are expected to have, in the aggregate, investment characteristics (based on factors such as market capitalization and industry weightings), fundamental characteristics (such as return
variability and yield) and liquidity measures similar to those of the applicable underlying index. The Underlying Fund may or may not hold all of the securities that are included in its underlying index and may hold certain securities or other
instruments that are not included in its underlying index or in the Underlying Index.
Management
Investment Adviser. As
investment adviser, BFA has overall responsibility for the general management and administration of the Fund. BFA provides an investment program for the Fund and manages the investment of the Fund’s assets. In managing the Fund, BFA may draw
upon the research and expertise of its asset management affiliates with respect to certain portfolio securities. In seeking to achieve the Fund's investment objective, BFA uses teams of portfolio managers, investment strategists and other investment
specialists. This team approach brings together many disciplines and leverages BFA’s extensive resources.
27
Pursuant to the Investment Advisory Agreement between BFA and
the Company (entered into on behalf of the Fund), BFA is responsible for substantially all expenses of the Fund, except the management fees, interest expenses, taxes, expenses incurred with respect to the acquisition and disposition of portfolio
securities and the execution of portfolio transactions, including brokerage commissions, distribution fees or expenses, litigation expenses and any extraordinary expenses (as determined by a majority of the Directors who are not “interested
persons” of the Company).
For its investment
advisory services to the Fund, BFA is paid a management fee from the Fund based on a percentage of the Fund’s average daily net assets, at the annual rate of 0.78%. BFA has contractually agreed to waive a portion of its management fees so that
the Fund’s total annual fund operating expenses after fee waiver is equal to the Acquired Fund Fees and Expenses attributable to the Fund’s investment in EEM, after taking into account any fee waivers by EEM through December 31, 2020.
The contractual waiver may be terminated prior to December 31, 2020 only upon written agreement of the Company and BFA. In addition, BFA may from time to time voluntarily waive and/or reimburse fees or expenses in order to limit total annual fund
operating expenses (excluding Acquired Fund Fees and Expenses, if any). Any such voluntary waiver or reimbursement may be eliminated by BFA at any time.
BFA is located at 400 Howard Street, San Francisco, CA 94105.
It is an indirect wholly-owned subsidiary of BlackRock, Inc. (“BlackRock”). As of September 30, 2018, BFA and its affiliates provided investment advisory services for assets in excess of $6.44 trillion. BFA and its affiliates trade and
invest for their own accounts in the actual securities and types of securities in which the Fund may also invest, which may affect the price of such securities.
A discussion regarding the basis for the approval by the
Company's Board of Directors (the “Board”) of the Investment Advisory Agreement with BFA is available in the Fund's annual report for the period ended August 31.
Portfolio Managers. Diane
Hsiung, Jennifer Hsui, Alan Mason, Orlando Montalvo and Greg Savage are primarily responsible for the day-to-day management of the Fund. Each Portfolio Manager is responsible for various functions related to portfolio management, including, but not
limited to, investing cash inflows, coordinating with members of his or her portfolio management team to focus on certain asset classes, implementing investment strategy, researching and reviewing investment strategy and overseeing members of his or
her portfolio management team that have more limited responsibilities.
Diane Hsiung has been employed by BFA or its affiliates as a
senior portfolio manager since 2007. Prior to that, Ms. Hsiung was a portfolio manager from 2002 to 2006 for Barclays Global Fund Advisors (“BGFA”). Ms. Hsiung has been a Portfolio Manager of the Fund since 2014.
Jennifer Hsui has been employed by BFA or its affiliates as a
senior portfolio manager since 2007. Prior to that, Ms. Hsui was a portfolio manager from 2006 to 2007 for BGFA. Ms. Hsui has been a Portfolio Manager of the Fund since 2014.
Alan Mason has been employed by BFA or its affiliates as a
portfolio manager since 1991. Mr. Mason has been a Portfolio Manager of the Fund since 2016.
28
Orlando Montalvo has been employed by BFA or its affiliates as
a senior portfolio manager since 2009. Prior to that, Mr. Montalvo was a senior portfolio manager from 2005 to 2009 for BGFA. Mr. Montalvo has been a Portfolio Manager of the Fund since 2014.
Greg Savage has been employed by BFA or its affiliates as a
senior portfolio manager since 2006. Prior to that, Mr. Savage was a portfolio manager from 2001 to 2006 for BGFA. Mr. Savage has been a Portfolio Manager of the Fund since 2014.
The Fund's SAI provides additional information about the
Portfolio Managers' compensation, other accounts managed by the Portfolio Managers and the Portfolio Managers' ownership (if any) of shares in the Fund.
Administrator, Custodian and Transfer Agent. State Street Bank and Trust Company (“State Street”) is the administrator, custodian and transfer agent for the Fund.
Conflicts of Interest. The
investment activities of BFA and its affiliates (including BlackRock and its subsidiaries (collectively, the “Affiliates”)) and their directors, officers and employees and of The PNC Financial Services Group, Inc. (which, through a
subsidiary, has a significant economic interest in BlackRock) and its subsidiaries (each with The PNC Financial Services Group, Inc., an “Entity” and collectively, the “Entities”) in the management of, or their interest in,
their own accounts and other accounts they manage, may present conflicts of interest that could disadvantage the Fund and its shareholders. BFA, its Affiliates and the Entities provide investment management services to other funds and discretionary
managed accounts that may follow investment programs similar to that of the Fund. BFA, its Affiliates and the Entities are involved worldwide with a broad spectrum of financial services and asset management activities and may engage in the ordinary
course of business in activities in which their interests or the interests of their clients may conflict with those of the Fund. BFA or one or more Affiliates or Entities act, or may act, as an investor, investment banker, research provider,
investment manager, commodity pool operator, commodity trading advisor, financier, underwriter, adviser, market maker, trader, prime broker, lender, index provider, agent and principal, and have other direct and indirect interests in
securities, currencies, commodities, derivatives and other instruments in which the Fund may directly or indirectly invest. Thus, it is likely that the Fund will have multiple business relationships with and will invest in, engage in transactions
with, make voting decisions with respect to, or obtain services from, entities for which an Affiliate or an Entity performs or seeks to perform investment banking or other services. Specifically, the Fund may invest in securities of, or engage in
other transactions with, companies with which an Affiliate or an Entity has developed or is trying to develop investment banking relationships or in which an Affiliate or an Entity has significant debt or equity investments or other interests. The
Fund may also invest in issuances (such as structured notes) by entities for which an Affiliate or an Entity provides and is compensated for cash management services relating to the proceeds from the sale of such issuances. The Fund also may invest
in securities of, or engage in other transactions with, companies for which an Affiliate or an Entity provides or may in the future provide research coverage. An Affiliate or an Entity may have business relationships with, and purchase, or
distribute or sell services
29
or products from or to, distributors, consultants or others who recommend the
Fund or who engage in transactions with or for the Fund, and may receive compensation for such services. The Fund may also make brokerage and other payments to Entities in connection with the Fund's portfolio investment transactions. BFA or one or
more Affiliates or Entities may engage in proprietary trading and advise accounts and funds that have investment objectives similar to those of the Fund and/or that engage in and compete for transactions in the same types of securities, currencies
and other instruments as the Fund. This may include transactions in securities issued by other open-end and closed-end investment companies (which may include investment companies that are affiliated with the Fund and BFA, to the extent permitted
under the Investment Company Act of 1940, as amended (the “1940 Act”)). The trading activities of BFA and these Affiliates or Entities are carried out without reference to positions held directly or indirectly by the Fund and may result
in BFA or an Affiliate or an Entity having positions in certain securities that are senior or junior to, or have interests different from or adverse to, the securities that are owned by the Fund.
Neither BlackRock nor any Affiliate is under any obligation to
share any investment opportunity, idea or strategy with the Fund. As a result, an Affiliate may compete with the Fund for appropriate investment opportunities. The results of the Fund's investment activities, therefore, may differ from those of an
Affiliate and of other accounts managed by an Affiliate, and it is possible that the Fund could sustain losses during periods in which one or more Affiliates and other accounts achieve profits on their trading for proprietary or other accounts. The
opposite result is also possible.
In addition, the Fund
may, from time to time, enter into transactions in which BFA or an Affiliate or an Entity or its or their directors, officers or employees or other clients have an adverse interest. Furthermore, transactions undertaken by clients advised or
managed by BFA, its Affiliates or Entities may adversely impact the Fund. Transactions by one or more clients or by BFA, its Affiliates or Entities or their directors, officers or employees, may have the effect of diluting or otherwise
disadvantaging the values, prices or investment strategies of the Fund.
The Fund's activities may be limited because of regulatory
restrictions applicable to BFA, one or more Affiliates or Entities and/or their internal policies designed to comply with such restrictions.
Under a securities lending program approved by the Board, the
Fund has retained BlackRock Institutional Trust Company, N.A., an Affiliate of BFA to serve as the securities lending agent for the Fund to the extent that the Fund participates in the securities lending program. For these services, the securities
lending agent will receive a fee from the Fund, including a fee based on the returns earned on the Fund’s investment of the cash received as collateral for the loaned securities. In addition, one or more Affiliates or Entities may be among the
entities to which the Fund may lend its portfolio securities under the securities lending program.
The activities of BFA, its Affiliates and Entities and their
respective directors, officers or employees, may give rise to other conflicts of interest that could disadvantage the Fund and its shareholders. BFA has adopted policies and procedures designed to address these potential conflicts of interest. See
the SAI for further information.
30
Shareholder Information
Additional shareholder information, including how to buy and
sell shares of the Fund, is available free of charge by calling toll-free: 1-800-iShares (1-800-474-2737) or visiting our website at www.iShares.com.
Buying and Selling Shares.
Shares of the Fund may be acquired or redeemed directly from the Fund only in Creation Units or multiples thereof, as discussed in the Creations and Redemptions section of this Prospectus. Only an Authorized Participant (as defined in the Creations and Redemptions section below)
may engage in creation or redemption transactions directly with the Fund. Once created, shares of the Fund generally trade in the secondary market in amounts less than a Creation Unit.
Shares of the Fund are listed on a national securities exchange
for trading during the trading day. Shares can be bought and sold throughout the trading day like shares of other publicly-traded companies. The Company does not impose any minimum investment for shares of the Fund purchased on an exchange or
otherwise in the secondary market. The Fund's shares trade under the ticker symbol “HEEM.”
Buying or selling Fund shares on an exchange or other secondary
market involves two types of costs that may apply to all securities transactions. When buying or selling shares of the Fund through a broker, you may incur a brokerage commission and other charges. The commission is frequently a fixed amount and may
be a significant proportional cost for investors seeking to buy or sell small amounts of shares. In addition, you may incur the cost of the “spread,” that is, any difference between the bid price and the ask price. The spread varies over
time for shares of the Fund based on the Fund’s trading volume and market liquidity, and is generally lower if the Fund has high trading volume and market liquidity, and higher if the Fund has little trading volume and market liquidity (which
is often the case for funds that are newly launched or small in size). The Fund's spread may also be impacted by the liquidity of the underlying securities held by the Fund, particularly for newly launched or smaller funds or in instances of
significant volatility of the underlying securities.
The
Board has adopted a policy of not monitoring for frequent purchases and redemptions of Fund shares (“frequent trading”) that appear to attempt to take advantage of a potential arbitrage opportunity presented by a lag between a change in
the value of the Fund’s portfolio securities after the close of the primary markets for the Fund’s portfolio securities and the reflection of that change in the Fund’s NAV (“market timing”), because the Fund sells and
redeems its shares directly through transactions that are in-kind and/or for cash, subject to the conditions described below under Creations and Redemptions. The Board has not adopted a policy of monitoring
for other frequent trading activity because shares of the Fund are listed for trading on a national securities exchange.
The national securities exchange on which the Fund's shares are
listed is open for trading Monday through Friday and is closed on weekends and the following holidays (or the days on which they are observed): New Year’s Day, Martin Luther King, Jr. Day, Presidents’ Day, Good Friday, Memorial Day,
Independence Day, Labor Day, Thanksgiving Day and Christmas Day. The Fund’s primary listing exchange is Cboe BZX.
31
Although the SEC has granted an exemptive order to the Company
permitting registered investment companies and unit investment trusts that enter into a participation agreement with the Company (“Investing Funds”) to invest in iShares funds beyond the limits set forth in Section 12(d)(1) of the 1940
Act subject to certain terms and conditions, the exemptive order is not applicable to the Fund. Accordingly, Investing Funds must adhere to the limits set forth in Section 12(d)(1) of the 1940 Act when investing in the Fund.
Book Entry. Shares of the Fund
are held in book-entry form, which means that no stock certificates are issued. The Depository Trust Company (“DTC”) or its nominee is the record owner of, and holds legal title to, all outstanding shares of the Fund.
Investors owning shares of the Fund are beneficial owners as
shown on the records of DTC or its participants. DTC serves as the securities depository for shares of the Fund. DTC participants include securities brokers and dealers, banks, trust companies, clearing corporations and other institutions that
directly or indirectly maintain a custodial relationship with DTC. As a beneficial owner of shares, you are not entitled to receive physical delivery of stock certificates or to have shares registered in your name, and you are not considered a
registered owner of shares. Therefore, to exercise any right as an owner of shares, you must rely upon the procedures of DTC and its participants. These procedures are the same as those that apply to any other securities that you hold in book-entry
or “street name” form.
Share Prices. The trading prices of the Fund’s shares in the secondary market generally differ from the Fund’s daily NAV and are affected by market forces such as the supply of and demand for ETF shares and shares of
underlying securities held by the Fund, economic conditions and other factors. Information regarding the intraday value of shares of the Fund, also known as the “indicative optimized portfolio value” (“IOPV”), is disseminated
every 15 seconds throughout each trading day by the national securities exchange on which the Fund's shares are listed or by market data vendors or other information providers. The IOPV is based on the current market value of the securities or other
assets and/or cash required to be deposited in exchange for a Creation Unit. The IOPV does not necessarily reflect the precise composition of the current portfolio of securities or other assets or other instruments held by the Fund at a particular
point in time or the best possible valuation of the current portfolio. Therefore, the IOPV should not be viewed as a “real-time” update of the Fund's NAV, which is computed only once a day. The IOPV is generally determined by using both
current market quotations and price quotations obtained from broker-dealers and other market intermediaries that may trade in the portfolio securities or other assets held by the Fund. The quotations of certain Fund holdings may not be updated
during U.S. trading hours if such holdings do not trade in the U.S. The Fund is not involved in, or responsible for, the calculation or dissemination of the IOPV and makes no representation or warranty as to its accuracy.
Determination of Net Asset Value. The NAV of the Fund normally is determined once daily Monday through Friday, generally as of the regularly scheduled close of business of the NYSE (normally 4:00 p.m., Eastern time) on each day that the NYSE is open for
trading, based on prices at the time of closing, provided that (i) any Fund assets or liabilities denominated in currencies other than the U.S. dollar are translated
32
into U.S. dollars at the prevailing market rates on the date of valuation as
quoted by one or more data service providers (as detailed below) and (ii) U.S. fixed-income assets may be valued as of the announced closing time for trading in fixed-income instruments in a particular market or exchange. The NAV of the Fund is
calculated by dividing the value of the net assets of the Fund (i.e., the value of its total assets, which includes the values of the Underlying Fund shares in which the Fund invests, less total liabilities)
by the total number of outstanding shares of the Fund, generally rounded to the nearest cent.
The value of the securities and other assets and liabilities
held by the Fund are determined pursuant to valuation policies and procedures approved by the Board.
Equity investments and other instruments for which market
quotations are readily available, as well as investments in an underlying fund, if any, are valued at market value, which is generally determined using the last reported official closing price or, if a reported closing price is not available, the
last traded price on the exchange or market on which the security is primarily traded at the time of valuation.
The Fund, the Underlying Fund or both invest in non-U.S.
securities. Foreign currency exchange rates with respect to the portfolio securities denominated in non-U.S. currencies are generally determined as of 4:00 p.m., London time. The Fund will also invest in currency forward contracts, which are
generally valued as of 4:00 p.m., Eastern time. Non-U.S. securities held by the Fund, the Underlying Fund or both may trade on weekends or other days when the Fund does not price its shares. As a result, the Fund’s NAV may change on days when
Authorized Participants (as defined in the Creations and Redemptions section of this Prospectus) will not be able to purchase or redeem Fund shares.
Generally, trading in non-U.S. securities, U.S. government
securities, money market instruments and certain fixed-income securities is substantially completed each day at various times prior to the close of business on the NYSE. The values of such securities used in computing the NAV of the Fund are
determined as of such times.
When market quotations are
not readily available or are believed by BFA to be unreliable, the Fund’s investments are valued at fair value. Fair value determinations are made by BFA in accordance with policies and procedures approved by the Board. BFA may conclude that a
market quotation is not readily available or is unreliable if a security or other asset or liability does not have a price source due to its lack of liquidity or other reasons, if a market quotation differs significantly from recent price quotations
or otherwise no longer appears to reflect fair value, where the security or other asset or liability is thinly traded, when there is a significant event subsequent to the most recent market quotation, or if the trading market on which a security is
listed is suspended or closed and no appropriate alternative trading market is available. A “significant event” is deemed to occur if BFA determines, in its reasonable business judgment prior to or at the time of pricing the Fund’s
assets or liabilities, that the event is likely to cause a material change to the closing market price of one or more assets or liabilities held by the Fund. Non-U.S. securities whose values are affected by volatility that occurs in the local
markets or in related or highly correlated assets (e.g.,
33
American Depositary Receipts, Global Depositary Receipts or substantially
identical ETFs) on a trading day after the close of non-U.S. securities markets may be fair valued.
Fair value represents a good faith approximation of the value
of an asset or liability. The fair value of an asset or liability held by the Fund is the amount the Fund might reasonably expect to receive from the current sale of that asset or the cost to extinguish that liability in an arm’s-length
transaction. Valuing the Fund’s investments using fair value pricing will result in prices that may differ from current market valuations and that may not be the prices at which those investments could have been sold during the period in which
the particular fair values were used. Use of fair value prices and certain current market valuations could result in a difference between the prices used to calculate the Fund’s NAV and the prices used by the Underlying Index, which, in turn,
could result in a difference between the Fund’s performance and the performance of the Underlying Index.
The value of assets or liabilities denominated in non-U.S.
currencies will be converted into U.S. dollars using prevailing market rates on the date of valuation as quoted by one or more data service providers. Use of a rate different from the rate used by the Index Provider may adversely affect the
Fund’s ability to track the Underlying Index.
Dividends and Distributions
General Policies. Dividends
from net investment income, if any, generally are declared and paid at least once a year by the Fund. Distributions of net realized securities gains, if any, generally are declared and paid once a year, but the Company may make distributions on a
more frequent basis for the Fund. The Company reserves the right to declare special distributions if, in its reasonable discretion, such action is necessary or advisable to preserve its status as a regulated investment company (“RIC”) or
to avoid imposition of income or excise taxes on undistributed income or realized gains.
Dividends and other distributions on shares of the Fund are
distributed on a pro rata basis to beneficial owners of such shares. Dividend payments are made through DTC participants and indirect participants to beneficial owners then of record with proceeds received
from the Fund.
Dividend Reinvestment Service. No dividend reinvestment service is provided by the Company. Broker-dealers may make available the DTC book-entry Dividend Reinvestment Service for use by beneficial owners of the Fund for reinvestment of their dividend
distributions. Beneficial owners should contact their broker to determine the availability and costs of the service and the details of participation therein. Brokers may require beneficial owners to adhere to specific procedures and timetables. If
this service is available and used, dividend distributions of both income and realized gains will be automatically reinvested in additional whole shares of the Fund purchased in the secondary market.
Taxes. As with any investment,
you should consider how your investment in shares of the Fund will be taxed. The tax information in this Prospectus is provided as general information, based on current law. You should consult your own tax professional about the tax consequences of
an investment in shares of the Fund.
34
Unless your investment in Fund shares is made through a
tax-exempt entity or tax-deferred retirement account, such as an IRA, in which case your distributions generally will be taxable when withdrawn, you need to be aware of the possible tax consequences when the Fund makes distributions or you sell Fund
shares.
Taxes on Distributions. Distributions from the Fund’s net investment income (other than qualified dividend income), including distributions of income from securities lending and distributions out of the Fund’s net short-term
capital gains, if any, are taxable to you as ordinary income. Distributions by the Fund of net long-term capital gains, if any, in excess of net short-term capital losses (capital gain dividends) are taxable to you as long-term capital gains,
regardless of how long you have held the Fund’s shares. Distributions by the Fund that qualify as qualified dividend income are taxable to you at long-term capital gain rates. Long-term capital gains and qualified dividend income are generally
eligible for taxation at a maximum rate of 15% or 20% for non-corporate shareholders, depending on whether their income exceeds certain threshold amounts. In addition, a 3.8% U.S. federal Medicare contribution tax is imposed on “net investment
income,” including, but not limited to, interest, dividends, and net gain, of U.S. individuals with income exceeding $200,000 (or $250,000 if married and filing jointly) and of estates and trusts.
Dividends will be qualified dividend income to you if they are
attributable to qualified dividend income received by the Fund. Generally, qualified dividend income includes dividend income from taxable U.S. corporations and qualified non-U.S. corporations, provided that the Fund satisfies certain holding period
requirements in respect of the stock of such corporations and has not hedged its position in the stock in certain ways. Substitute dividends received by the Fund with respect to dividends paid on securities lent out will not be qualified dividend
income. For this purpose, a qualified non-U.S. corporation means any non-U.S. corporation that is eligible for benefits under a comprehensive income tax treaty with the U.S., which includes an exchange of information program, or if the stock with
respect to which the dividend was paid is readily tradable on an established U.S. securities market. The term excludes a corporation that is a passive foreign investment company.
Dividends received by the Fund from a real estate investment
trust (“REIT”) or another RIC generally are qualified dividend income only to the extent such dividend distributions are made out of qualified dividend income received by such REIT or RIC. Additionally, it is expected that dividends
received by the Fund from a REIT and distributed to a shareholder generally will be taxable to the shareholder as ordinary income.
For a dividend to be treated as qualified dividend income, the
dividend must be received with respect to a share of stock held without being hedged by the Fund, and with respect to a share of the Fund held without being hedged by you, for 61 days during the 121-day period beginning at the date which is 60 days
before the date on which such share becomes ex-dividend with respect to such dividend or, in the case of certain preferred stock, 91 days during the 181-day period beginning 90 days before such date.
35
In general, your distributions are subject to U.S. federal
income tax for the year when they are paid. Certain distributions paid in January, however, may be treated as paid on December 31 of the prior year.
Short term capital gains earned by the Underlying Fund will be
ordinary income when distributed to the Fund and will not be offset by the Fund's capital losses. Because the Fund is expected to invest in the Underlying Fund, the Fund's realized losses on sales of shares of the Underlying Fund may be indefinitely
or permanently deferred as “wash sales.” Capital loss carryforwards of the Underlying Fund, if any, would not offset net capital gains of the Fund.
If the Fund’s distributions exceed current and
accumulated earnings and profits, all or a portion of the distributions made in the taxable year may be recharacterized as a return of capital to shareholders. Distributions in excess of the Fund’s minimum distribution requirements, but not in
excess of the Fund’s earnings and profits, will be taxable to shareholders and will not constitute nontaxable returns of capital. A return of capital distribution generally will not be taxable but will reduce the shareholder’s cost basis
and result in a higher capital gain or lower capital loss when those shares on which the distribution was received are sold. Once a shareholder's cost basis is reduced to zero, further distributions will be treated as capital gain, if the
shareholder holds shares of the Fund as capital assets.
Dividends, interest and capital gains earned by the Underlying
Fund with respect to securities issued by non-U.S. issuers may give rise to withholding and other taxes imposed by non-U.S. countries. Tax conventions between certain countries and the U.S. may reduce or eliminate such taxes. If more than 50% of the
total assets of the Underlying Fund at the close of a year consists of non-U.S. stocks or securities (generally, for this purpose, depositary receipts, no matter where traded, of non-U.S. companies are treated as “non-U.S.”) (and 50% of
the total assets of the Fund at the close of the year consists of securities issued by non-U.S. issuers, or, at the close of each quarter, shares of the Underlying Fund), the Fund may “pass through” to you certain non-U.S. income taxes
(including withholding taxes) paid by the Fund or the Underlying Fund. This means that you would be considered to have received as an additional dividend your share of such non-U.S. taxes, but you may be entitled to either a corresponding tax
deduction in calculating your taxable income, or, subject to certain limitations, a credit in calculating your U.S. federal income tax.
For purposes of foreign tax credits for U.S. shareholders of
the Fund, foreign capital gains taxes may not produce associated foreign source income, limiting the availability of such credits for U.S. persons.
If you are neither a resident nor a citizen of the U.S. or if
you are a non-U.S. entity (other than a pass-through entity to the extent owned by U.S. persons), the Fund’s ordinary income dividends (which include distributions of net short-term capital gains) will generally be subject to a 30% U.S.
withholding tax, unless a lower treaty rate applies, provided that withholding tax will generally not apply to any gain or income realized by a non-U.S. shareholder in respect of any distributions of long-term capital gains or upon the sale or other
disposition of shares of the Fund.
36
Separately, a 30% withholding tax is currently imposed on
U.S.-source dividends, interest and other income items and will be imposed on proceeds from the sale, redemption or other disposition of property producing U.S.-source dividends and interest paid after December 31, 2018, to (i) foreign financial
institutions, including non-U.S. investment funds, unless they agree to collect and disclose to the IRS information regarding their direct and indirect U.S. account holders and (ii) certain other foreign entities, unless they certify certain
information regarding their direct and indirect U.S. owners. To avoid withholding, foreign financial institutions will need to (i) enter into agreements with the IRS that state that they will provide the IRS information, including the names,
addresses and taxpayer identification numbers of direct and indirect U.S. account holders, comply with due diligence procedures with respect to the identification of U.S. accounts, report to the IRS certain information with respect to U.S. accounts
maintained, agree to withhold tax on certain payments made to non-compliant foreign financial institutions or to account holders who fail to provide the required information, and determine certain other information concerning their account holders,
or (ii) in the event that an applicable intergovernmental agreement and implementing legislation are adopted, provide local revenue authorities with similar account holder information. Other foreign entities may need to report the name, address, and
taxpayer identification number of each substantial U.S. owner or provide certifications of no substantial U.S. ownership unless certain exceptions apply.
If your Fund shares are loaned out pursuant to a securities
lending arrangement, you may lose the ability to treat Fund dividends paid while the shares are held by the borrower as qualified dividend income. In addition, you may lose the ability to use foreign tax credits passed through by the Fund if your
Fund shares are loaned out pursuant to a securities lending agreement.
If you are a resident or a citizen of the U.S., by law, backup
withholding at a 24% rate will apply to your distributions and proceeds if you have not provided a taxpayer identification number or social security number and made other required certifications.
Taxes When Shares are Sold.
Currently, any capital gain or loss realized upon a sale of Fund shares is generally treated as a long-term gain or loss if the shares have been held for more than one year. Any capital gain or loss realized upon a sale of Fund shares held for one
year or less is generally treated as short-term gain or loss, except that any capital loss on the sale of shares held for six months or less is treated as long-term capital loss to the extent that capital gain dividends were paid with respect to
such shares. Any such capital gains, including from sales of Fund shares or from capital gain dividends, are included in “net investment income” for purposes of the 3.8% U.S. federal Medicare contribution tax mentioned
above.
The foregoing discussion summarizes some of
the consequences under current U.S. federal tax law of an investment in the Fund. It is not a substitute for personal tax advice. You may also be subject to state and local taxation on Fund distributions and sales of shares. Consult your personal
tax advisor about the potential tax consequences of an investment in shares of the Fund under all applicable tax laws.
Chinese Tax Disclosure. The
Fund’s and the Underlying Fund's investments in securities issued by PRC companies may cause the Fund and the Underlying Fund to become subject to withholding and other taxes imposed by the PRC. If the Fund and
37
the Underlying Fund were considered to be tax residents of the PRC, they would
be subject to PRC corporate income tax at the rate of 25% on their worldwide taxable income. If the Fund and the Underlying Fund were considered to be non-resident enterprises with a “permanent establishment” in the PRC, they would be
subject to PRC corporate income tax of 25% on the profits attributable to the permanent establishment. BFA intends to operate the Fund and the Underlying Fund in a manner that will prevent them from being treated as tax residents of the PRC and from
having a permanent establishment in the PRC. It is possible, however, that the PRC could disagree with that conclusion or that changes in PRC tax law could affect the PRC corporate income tax status of the Fund and the Underlying Fund. The PRC
generally imposes withholding income tax at a rate of 10% on dividends, premiums, interest and capital gains originating in the PRC and paid to a company that is not a resident of the PRC for tax purposes and that has no permanent establishment in
China. The withholding is in general made by the relevant PRC tax resident company making such payments. In the event the relevant PRC tax resident company fails to withhold the relevant PRC withholding income tax or otherwise fails to pay the
relevant withholding income tax to the PRC tax authorities, the competent PRC tax authorities may, at their sole discretion, impose tax obligations on the Fund and the Underlying Fund. Foreign investors will be temporarily exempt from withholding
income tax on capital gains derived from the trading of certain shares starting on November 17, 2014. The exemptions are temporary and there is no indication how long the exemptions will continue. While the application and enforcement of this law to
the Fund and the Underlying Fund remains subject to clarification, to the extent that such taxes are imposed on any capital gains of the Fund and the Underlying Fund, the Fund's and the Underlying Fund's NAV or returns may be adversely impacted.
Stamp duty under the PRC laws generally applies to the execution and receipt of taxable documents, which include contracts for the sale of B-shares traded on PRC stock exchanges. In the case of such contracts, the stamp duty is currently imposed on
the seller but not on the purchaser, at the rate of 0.1%.
The above information is only a general summary of the
potential PRC tax consequences that may be imposed on the Fund, the Underlying Fund and their investors either directly or indirectly and should not be taken as a definitive, authoritative or comprehensive statement of the relevant matter. Investors
should seek their own tax advice on their tax position with regard to their investment in the Fund and the Underlying Fund.
The PRC government has implemented a number of tax reform
policies in recent years. The current tax laws and regulations may be revised or amended in the future. Any revision or amendment in tax laws and regulations may affect the after-taxation profit of PRC companies and foreign investors in such
companies, such as the Fund and the Underlying Fund.
Creations and Redemptions.
Prior to trading in the secondary market, shares of the Fund are “created” at NAV by market makers, large investors and institutions only in block-size Creation Units of 50,000 shares or multiples thereof. Each “creator” or
authorized participant (an “Authorized Participant”) has entered into an agreement with the Fund's distributor, BlackRock Investments, LLC (the “Distributor”), an affiliate of BFA.
38
A creation transaction, which is subject to acceptance by the
Distributor and the Fund, generally takes place when an Authorized Participant deposits into the Fund a designated portfolio of securities (including any portion of such securities for which cash may be substituted) and a specified amount of cash
approximating the holdings of the Fund in exchange for a specified number of Creation Units. To the extent practicable, the composition of such portfolio generally corresponds pro rata to the holdings of the
Fund. However, creation and redemption baskets may differ. The Fund may, in certain circumstances, offer Creation Units partially or solely for cash.
Similarly, shares can be redeemed only in Creation Units,
generally for a designated portfolio of securities (including any portion of such securities and other portfolio holdings for which cash may be substituted) held by the Fund and a specified amount of cash. Redeeming holders will receive cash in
respect to the pro rata value of the currency forward contracts and NDFs held by the Fund to the extent attributable to the Creation Unit being redeemed. Except when aggregated in Creation Units, shares are not
redeemable by the Fund.
The prices at which
creations and redemptions occur are based on the next calculation of NAV after a creation or redemption order is received in an acceptable form under the authorized participant agreement.
Only an Authorized Participant may create or redeem Creation
Units with the Fund. Authorized Participants may create or redeem Creation Units for their own accounts or for customers, including, without limitation, affiliates of the Fund.
In the event of a system failure or other interruption,
including disruptions at market makers or Authorized Participants, orders to purchase or redeem Creation Units either may not be executed according to the Fund's instructions or may not be executed at all, or the Fund may not be able to place or
change orders.
To the extent the Fund engages in in-kind
transactions, the Fund intends to comply with the U.S. federal securities laws in accepting securities for deposit and satisfying redemptions with redemption securities by, among other means, assuring that any securities accepted for deposit and any
securities used to satisfy redemption requests will be sold in transactions that would be exempt from registration under the Securities Act of 1933, as amended (the “1933 Act”). Further, an Authorized Participant that is not a
“qualified institutional buyer,” as such term is defined in Rule 144A under the 1933 Act, will not be able to receive restricted securities eligible for resale under Rule 144A.
Creations and redemptions must be made through a firm that is
either a member of the Continuous Net Settlement System of the National Securities Clearing Corporation or a DTC participant that has executed an agreement with the Distributor with respect to creations and redemptions of Creation Unit aggregations.
Information about the procedures regarding creation and redemption of Creation Units (including the cut-off times for receipt of creation and redemption orders) is included in the Fund's SAI.
Because new shares may be created and issued on an ongoing
basis, at any point during the life of the Fund a “distribution,” as such term is used in the 1933 Act, may be occurring. Broker-dealers and other persons are cautioned that some activities on their part may, depending on the
circumstances, result in their being deemed participants in a distribution in a manner that could render them statutory underwriters subject to the prospectus delivery and liability provisions of the 1933 Act. Any determination of whether one is an
underwriter must take into account all the relevant facts and circumstances of each particular case.
39
Broker-dealers should also note that dealers who are not
“underwriters” but are participating in a distribution (as contrasted to ordinary secondary transactions), and thus dealing with shares that are part of an “unsold allotment” within the meaning of Section 4(a)(3)(C) of the
1933 Act, would be unable to take advantage of the prospectus delivery exemption provided by Section 4(a)(3) of the 1933 Act. For delivery of prospectuses to exchange members, the prospectus delivery mechanism of Rule 153 under the 1933 Act is
available only with respect to transactions on a national securities exchange.
Costs Associated with Creations and Redemptions. Authorized Participants are charged standard creation and redemption transaction fees to offset transfer and other transaction costs associated with the issuance and redemption of Creation Units. The standard creation
and redemption transaction fees are set forth in the table below. The standard creation transaction fee is charged to the Authorized Participant on the day such Authorized Participant creates a Creation Unit, and is the same regardless of the number
of Creation Units purchased by the Authorized Participant on the applicable business day. Similarly, the standard redemption transaction fee is charged to the Authorized Participant on the day such Authorized Participant redeems a Creation Unit, and
is the same regardless of the number of Creation Units redeemed by the Authorized Participant on the applicable business day. Creations and redemptions for cash (when cash creations and redemptions (in whole or in part) are available or specified)
are also subject to an additional charge (up to the maximum amounts shown in the table below). This charge is intended to compensate for brokerage, tax, foreign exchange, execution, price movement and other costs and expenses related to cash
transactions (which may, in certain instances, be based on a good faith estimate of transaction costs). Investors who use the services of a broker or other financial intermediary to acquire or dispose of Fund shares may pay fees for such
services.
The following table shows, as of
September 28, 2018, the approximate value of one Creation Unit, standard fees and maximum additional charges for creations and redemptions (as described above and in the Fund's SAI):
| Approximate
Value of a Creation Unit |
Creation
Unit Size |
Standard
Creation/ Redemption Transaction Fee |
Maximum
Additional Charge for Creations* |
Maximum
Additional Charge for Redemptions* | ||||
| $1,269,000 | 50,000 | $500 | 3.0% | 2.0% |
| * | As a percentage of the net asset value per Creation Unit, inclusive, in the case of redemptions, of the standard redemption transaction fee. |
Householding. Householding is
an option available to certain Fund investors. Householding is a method of delivery, based on the preference of the individual investor, in which a single copy of certain shareholder documents can be delivered to investors who share the same
address, even if their accounts are registered under different names. Please contact your broker-dealer if you are interested in enrolling in householding and receiving a single copy of prospectuses and other shareholder documents, or if you are
currently enrolled in householding and wish to change your householding status.
40
Distribution
The Distributor or its agent distributes Creation Units for the
Fund on an agency basis. The Distributor does not maintain a secondary market in shares of the Fund. The Distributor has no role in determining the policies of the Fund or the securities that are purchased or sold by the Fund. The
Distributor’s principal address is 1 University Square Drive, Princeton, NJ 08540.
BFA or its affiliates make payments to broker-dealers,
registered investment advisers, banks or other intermediaries (together, “intermediaries”) related to marketing activities and presentations, educational training programs, conferences, the development of technology platforms and
reporting systems, data provision services, or their making shares of the Fund and certain other iShares funds available to their customers generally and in certain investment programs. Such payments, which may be significant to the intermediary,
are not made by the Fund. Rather, such payments are made by BFA or its affiliates from their own resources, which come directly or indirectly in part from fees paid by the iShares funds complex. Payments of this type are sometimes referred to as
revenue-sharing payments. A financial intermediary may make decisions about which investment options it recommends or makes available, or the level of services provided, to its customers based on the payments or other financial incentives it is
eligible to receive. Therefore, such payments or other financial incentives offered or made to an intermediary create conflicts of interest between the intermediary and its customers and may cause the intermediary to recommend the Fund or other
iShares funds over another investment. More information regarding these payments is contained in the Fund's SAI. Please contact your salesperson or other investment professional for more information regarding any such
payments his or her firm may receive from BFA or its affiliates.
Financial Highlights
The financial highlights table is intended to help investors
understand the Fund’s financial performance since inception. Certain information reflects financial results for a single share of the Fund. The total returns in the table represent the rate that an investor would have earned (or lost) on an
investment in the Fund, assuming reinvestment of all dividends and distributions. This information has been audited by PricewaterhouseCoopers LLP, whose report is included, along with the Fund's financial statements, in the Fund's Annual Report
(available upon request).
41
Financial Highlights
(For a share outstanding throughout each period)
(For a share outstanding throughout each period)
| iShares Currency Hedged MSCI Emerging Markets ETF | |||||||
| Year
Ended 08/31/18 |
Year
Ended 08/31/17 |
Year
Ended 08/31/16 |
Period
From 09/23/14(a) to 08/31/15 | ||||
| Net asset value, beginning of period | $ 25.57 | $ 21.72 | $ 21.40 | $ 24.44 | |||
| Net investment income(b) | 0.60 | 0.36 | 0.50 | 0.41 | |||
| Net realized and unrealized gain (loss)(c) | 0.12 | 3.83 | 1.08 | (2.80) | |||
| Net increase (decrease) from investment operations | 0.72 | 4.19 | 1.58 | (2.39) | |||
| Distributions (d) | |||||||
| From net investment income | (0.59) | (0.34) | (0.48) | (0.65) | |||
| From net realized gain | — | — | (0.78) | — | |||
| Total distributions | (0.59) | (0.34) | (1.26) | (0.65) | |||
| Net asset value, end of period | $ 25.70 | $ 25.57 | $ 21.72 | $ 21.40 | |||
| Total Return | |||||||
| Based on net asset value | 2.77% | 19.55% | 7.84% | (10.01)% (e) | |||
| Ratios to Average Net Assets | |||||||
| Total expenses(f) | 0.78% | 0.78% | 0.78% | 0.78% (g) | |||
| Total expenses after fees waived(f) | 0.00% | 0.00% | 0.00% | 0.02% (g) | |||
| Net investment income | 2.25% | 1.56% | 2.42% | 1.82% (g) | |||
| Supplemental Data | |||||||
| Net assets, end of period (000) | $344,328 | $393,757 | $180,254 | $211,865 | |||
| Portfolio turnover rate(h)(i) | 7% | 4% | 11% | 7% (e) | |||
|
(a) Commencement of operations. | |||||||
| (b) Based on average shares outstanding. | |||||||
| (c) The amounts reported for a share outstanding may not accord with the change in aggregate gains and losses in securities for the fiscal period due to the timing of capital share transactions in relation to the fluctuating market values of the Fund’s underlying securities. | |||||||
| (d) Distributions for annual periods determined in accordance with U.S. federal income tax regulations. | |||||||
| (e) Not annualized. | |||||||
| (f) The Fund indirectly bears its proportionate share of fees and expenses incurred by the underlying fund in which the Fund is invested. This ratio does not include these indirect fees and expenses. | |||||||
| (g) Annualized. | |||||||
| (h) Portfolio turnover rate excludes the portfolio activity of the underlying fund in which the Fund is invested. See the underlying fund's financial highlights for its respective portfolio turnover rates. | |||||||
| (i) Portfolio turnover rate excludes in-kind transactions. | |||||||
42
Index Provider
MSCI is a provider of investment decision support tools to
investors globally. MSCI products and services include indices, portfolio risk and performance analytics, and governance tools. MSCI is not affiliated with the Company, BFA, State Street, the Distributor or any of their respective affiliates.
BFA or its affiliates have entered into a license agreement
with the Index Provider to use the Underlying Index. BFA or its affiliates sublicense rights in the Underlying Index to the Company at no charge.
Disclaimers
The Fund is not sponsored, endorsed, sold or promoted by MSCI or
any affiliate of MSCI. Neither MSCI nor any other party makes any representation or warranty, express or implied, to the owners of shares of the Fund or any member of the public regarding the advisability of investing in funds generally or in the
Fund particularly or the ability of the Underlying Index to track general stock market performance. MSCI is the licensor of certain trademarks, service marks and trade names of MSCI and of the Underlying Index, which is determined, composed and
calculated by MSCI without regard to the issuer of the Fund’s securities or the Fund. MSCI has no obligation to take the needs of the issuer of the Fund’s securities or the owners of shares of the Fund into consideration in determining,
composing or calculating the Underlying Index. MSCI is not responsible for and has not participated in the determination of the timing of, prices at, or quantities of the Fund’s shares to be issued or in the determination or calculation of the
equation by which the Fund’s shares are redeemable for cash. Neither MSCI nor any other party has any obligation or liability to owners of shares of the Fund in connection with the administration, marketing or trading of the Fund’s
shares.
ALTHOUGH MSCI SHALL OBTAIN INFORMATION FOR
INCLUSION IN OR FOR USE IN THE CALCULATION OF THE INDEXES FROM SOURCES WHICH MSCI CONSIDERS RELIABLE, NEITHER MSCI NOR ANY OTHER PARTY GUARANTEES THE ACCURACY AND/OR THE COMPLETENESS OF THE INDEXES OR ANY DATA INCLUDED THEREIN. NEITHER MSCI NOR ANY
OTHER PARTY MAKES ANY WARRANTY, EXPRESS OR IMPLIED, AS TO RESULTS TO BE OBTAINED BY LICENSEE, LICENSEE’S CUSTOMERS AND COUNTERPARTIES, OWNERS OF SHARES OF THE FUND, OR ANY OTHER PERSON OR ENTITY FROM THE USE OF THE INDEXES OR ANY DATA INCLUDED
THEREIN IN CONNECTION WITH THE RIGHTS LICENSED HEREUNDER OR FOR ANY OTHER USE. NEITHER MSCI NOR ANY OTHER PARTY MAKES ANY EXPRESS OR IMPLIED WARRANTIES, AND MSCI HEREBY EXPRESSLY DISCLAIMS ALL WARRANTIES OF MERCHANTABILITY OR FITNESS FOR A
PARTICULAR PURPOSE WITH RESPECT TO THE INDEXES OR ANY DATA INCLUDED THEREIN. WITHOUT LIMITING ANY OF THE FOREGOING, IN NO EVENT SHALL MSCI OR ANY OTHER PARTY HAVE ANY LIABILITY FOR ANY DIRECT, INDIRECT, SPECIAL, PUNITIVE, CONSEQUENTIAL OR ANY OTHER
DAMAGES (INCLUDING LOST PROFITS) EVEN IF NOTIFIED OF THE POSSIBILITY OF SUCH DAMAGES.
43
Shares of the Fund are not sponsored, endorsed or promoted by
Cboe BZX. Cboe BZX makes no representation or warranty, express or implied, to the owners of shares of the Fund or any member of the public regarding the ability of the Fund to track the total return performance of the Underlying Index or the
ability of the Underlying Index to track stock market performance. Cboe BZX is not responsible for, nor has it participated in, the determination of the compilation or the calculation of the Underlying Index, nor in the determination of the timing
of, prices of, or quantities of shares of the Fund to be issued, nor in the determination or calculation of the equation by which the shares are redeemable. Cboe BZX has no obligation or liability to owners of shares of the Fund in connection with
the administration, marketing or trading of the shares of the Fund.
Cboe BZX does not guarantee the accuracy and/or the completeness
of the Underlying Index or any data included therein. Cboe BZX makes no warranty, express or implied, as to results to be obtained by the Company on behalf of the Fund as licensee, licensee’s customers and counterparties, owners of shares of
the Fund, or any other person or entity from the use of the Underlying Index or any data included therein in connection with the rights licensed as described herein or for any other use. Cboe BZX makes no express or implied warranties and hereby
expressly disclaims all warranties of merchantability or fitness for a particular purpose with respect to the Underlying Index or any data included therein. Without limiting any of the foregoing, in no event shall Cboe BZX have any liability for any
direct, indirect, special, punitive, consequential or any other damages (including lost profits) even if notified of the possibility of such damages.
The past performance of the Underlying Index is not a guide to
future performance. BFA and its affiliates do not guarantee the accuracy or the completeness of the Underlying Index or any data included therein and BFA and its affiliates shall have no liability for any errors, omissions or interruptions therein.
BFA and its affiliates make no warranty, express or implied, to the owners of shares of the Fund or to any other person or entity, as to results to be obtained by the Fund from the use of the Underlying Index or any data included therein. Without
limiting any of the foregoing, in no event shall BFA or its affiliates have any liability for any special, punitive, direct, indirect or consequential damages (including lost profits), even if notified of the possibility of such damages.
44
Supplemental Information
I. Premium/Discount Information
The table that follows presents information about the
differences between the daily market price on secondary markets for shares of the Fund and the Fund’s NAV. NAV is the price at which the Fund issues and redeems shares. It is calculated in accordance with the standard formula for valuing
mutual fund shares. The price used to calculate market returns (“Market Price”) of the Fund generally is determined using the midpoint between the highest bid and the lowest ask on the primary securities exchange on which shares of the
Fund are listed for trading, as of the time that the Fund’s NAV is calculated. The Fund’s Market Price may be at, above or below its NAV. The NAV of the Fund will fluctuate with changes in the value of its portfolio holdings. The Market
Price of the Fund will fluctuate in accordance with changes in its NAV, as well as market supply and demand.
Premiums or discounts are the differences (expressed as a
percentage) between the NAV and Market Price of the Fund on a given day, generally at the time the NAV is calculated. A premium is the amount that the Fund is trading above the reported NAV, expressed as a percentage of the NAV. A discount is the
amount that the Fund is trading below the reported NAV, expressed as a percentage of the NAV.
The following information shows the frequency of distributions
of premiums and discounts for the Fund for each full calendar quarter of 2017 through September 30, 2018.
Each line in the table shows the number of trading days in
which the Fund traded within the premium/discount range indicated. Premium/discount ranges with no trading days are omitted. The number of trading days in each premium/discount range is also shown as a percentage of the total number of trading days
in the period covered by the table. All data presented here represents past performance, which cannot be used to predict future results.
| Premium/Discount Range | Number of Days | Percentage of Total Days | ||
| Greater than 3.0% and Less than 3.5% | 1 | 0.23% | ||
| Greater than 1.0% and Less than 1.5% | 3 | 0.68 | ||
| Greater than 0.5% and Less than 1.0% | 13 | 2.96 | ||
| Greater than 0.0% and Less than 0.5% | 213 | 48.52 | ||
| At NAV | 17 | 3.87 | ||
| Less than 0.0% and Greater than -0.5% | 181 | 41.23 | ||
| Less than -0.5% and Greater than -1.0% | 11 | 2.51 | ||
| 439 | 100.00% |
45
II. Total Return Information
The table that follows presents information about the total
returns of the Fund and the Underlying Index as of the fiscal year ended August 31, 2018.
“Average Annual Total Returns” represents the
average annual change in value of an investment over the periods indicated. “Cumulative Total Returns” represents the total change in value of an investment over the periods indicated.
The Fund’s NAV is the value of one share of the Fund as
calculated in accordance with the standard formula for valuing mutual fund shares. The NAV return is based on the NAV of the Fund and the market return is based on the Market Price of the Fund. Market Price generally is determined by using the
midpoint between the highest bid and the lowest ask on the primary stock exchange on which shares of the Fund are listed for trading, as of the time that the Fund's NAV is calculated. Since shares of the Fund did not trade in the secondary market
until after the Fund's inception, for the period from inception to the first day of secondary market trading in shares of the Fund, the NAV of the Fund is used as a proxy for the Market Price to calculate market returns. Market and NAV returns
assume that dividends and capital gain distributions have been reinvested in the Fund at Market Price and NAV, respectively.
An index is a financial calculation, based on a grouping of
financial instruments, that is not an investment product and that tracks a specified financial market or sector. Unlike the Fund, the Underlying Index does not actually hold a portfolio of securities and therefore does not incur the expenses
incurred by the Fund. These expenses negatively impact the performance of the Fund. Also, market returns do not include brokerage commissions and other charges that may be payable on secondary market transactions. If brokerage commissions were
included, market returns would be lower. The returns shown in the following table do not reflect the deduction of taxes that a shareholder would pay on Fund distributions or the redemption or sale of Fund shares. The investment return and principal
value of shares of the Fund will vary with changes in market conditions. Shares of the Fund may be worth more or less than their original cost when they are redeemed or sold in the market. The Fund’s past performance is no guarantee of future
results.
Performance as of August 31, 2018
| Average Annual Total Returns | Cumulative Total Returns | ||||
| 1 Year | Since Inception* | 1 Year | Since Inception* | ||
| Fund NAV | 2.77% | 4.57% | 2.77% | 19.24% | |
| Fund Market | 2.57% | 4.57% | 2.57% | 19.26% | |
| Index | 3.52% | 5.04% | 3.52% | 21.34% | |
| * | Total returns for the period since inception are calculated from the inception date of the Fund (9/23/14). The first day of secondary market trading in shares of the Fund was 9/25/14. |
46
For more information visit www.iShares.com or call
1-800-474-2737
Copies of the Prospectus, SAI and recent
shareholder reports can be found on our website at www.iShares.com. For more information about the Fund, you may request a copy of the SAI. The SAI provides detailed information about the Fund and is incorporated by reference into this Prospectus.
This means that the SAI, for legal purposes, is a part of this Prospectus.
Additional information about the Fund's investments is
available in the Fund's Annual and Semi-Annual Reports to shareholders. In the Fund's Annual Report, you will find a discussion of the market conditions and investment strategies that significantly affected the Fund's performance during the last
fiscal year.
If you have any questions about the Company
or shares of the Fund or you wish to obtain the SAI, Semi-Annual or Annual Report free of charge, please:
| Call: | 1-800-iShares
or 1-800-474-2737 (toll free) Monday through Friday, 8:30 a.m. to 6:30 p.m. (Eastern time) |
| Email: | iSharesETFs@blackrock.com |
| Write: | c/o
BlackRock Investments, LLC 1 University Square Drive, Princeton, NJ 08540 |
Reports and other information about the Fund are available on
the EDGAR database on the SEC's website at www.sec.gov, and copies of this information may be obtained, after paying a duplicating fee, by electronic request at the following e-mail address: publicinfo@sec.gov.
No person is authorized to give any information or to make any
representations about the Fund and its shares not contained in this Prospectus and you should not rely on any other information. Read and keep this Prospectus for future reference.
©2018 BlackRock, Inc. All rights reserved. iSHARES® and BLACKROCK® are registered trademarks of BFA and its affiliates. All other marks are the property of their
respective owners.
Investment Company Act File No.:
811-09102
IS-P-HEEM-0119