| 2017 Prospectus |
 |
| ► | iShares Currency Hedged MSCI Emerging Markets ETF | HEEM | CBOE BZX |
|
|
S-1 |
|
|
1 |
|
|
2 |
|
|
21 |
|
|
25 |
|
|
25 |
|
|
26 |
|
|
29 |
|
|
40 |
|
|
40 |
|
|
42 |
|
|
42 |
|
|
44 |
| Ticker: HEEM | Stock Exchange: Cboe BZX |
| Annual
Fund Operating Expenses (ongoing expenses that you pay each year as a percentage of the value of your investments) | ||||||||||||
| Management
Fees |
Distribution
and Service (12b-1) Fees |
Other
Expenses |
Acquired
Fund Fees and Expenses |
Total
Annual Fund Operating Expenses |
Fee Waiver | Total
Annual Fund Operating Expenses After Fee Waiver | ||||||
| 0.78% | None | None | 0.69% | 1.47% | (0.78)% | 0.69% | ||||||
| 1 Year | 3 Years | 5 Years | 10 Years | |||
| $70 | $221 | $565 | $1542 |
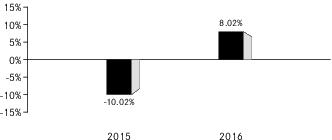
| 1 | The Fund’s year-to-date return as of September 30, 2017 was 22.71%. |
| One Year | Since
Fund Inception | ||
| (Inception Date: 09/23/2014) | |||
| Return Before Taxes | 8.02% | -2.03% | |
| Return After Taxes on Distributions2 | 7.65% | -3.17% | |
| Return After Taxes on Distributions and Sale of Fund Shares2 | 5.02% | -1.71% | |
| MSCI Emerging Markets 100% Hedged to USD Index (Index returns do not reflect deductions for fees, expenses or taxes) | 7.50% | -1.64% |
| 2 | After-tax returns in the table above are calculated using the historical highest individual U.S. federal marginal income tax rates and do not reflect the impact of state or local taxes. Actual after-tax returns depend on an investor’s tax situation and may differ from those shown, and after-tax returns shown are not relevant to tax-exempt investors or investors who hold shares through tax-deferred arrangements, such as 401(k) plans or individual retirement accounts (“IRAs”). Fund returns after taxes on distributions and sales of Fund shares are calculated assuming that an investor has sufficient capital gains of the same character from other investments to offset any capital losses from the sale of Fund shares. As a result, Fund returns after taxes on distributions and sales of Fund shares may exceed Fund returns before taxes and/or returns after taxes on distributions. |
| ■ | Lower levels of liquidity and market efficiency; |
| ■ | Greater securities price volatility; |
| ■ | Exchange rate fluctuations and exchange controls; |
| ■ | Less availability of public information about issuers; |
| ■ | Limitations on foreign ownership of securities; |
| ■ | Imposition of withholding or other taxes; |
| ■ | Imposition of restrictions on the expatriation of the funds or other assets of the Fund; |
| ■ | Higher transaction and custody costs and delays in settlement procedures; |
| ■ | Difficulties in enforcing contractual obligations; |
| ■ | Lower levels of regulation of the securities markets; |
| ■ | Weaker accounting, disclosure and reporting requirements; and |
| ■ | Legal principles relating to corporate governance, directors’ fiduciary duties and liabilities and stockholders’ rights in markets in which the Fund invests may differ and/or may not be as extensive or protective as those that apply in the U.S. |
| ■ | The risk of delays in settling portfolio transactions and the risk of loss arising out of the system of share registration and custody used in Russia; |
| ■ | Risks in connection with the maintenance of the Fund’s or the Underlying Fund's portfolio securities and cash with foreign sub-custodians and securities depositories, including the risk that appropriate sub-custody arrangements will not be available to the Fund or the Underlying Fund; |
| ■ | The risk that the Fund’s or the Underlying Fund's ownership rights in portfolio securities could be lost through fraud or negligence because ownership in shares of Russian companies is recorded by the companies themselves and by registrars, rather than by a central registration system; and |
| ■ | The risk that the Fund or the Underlying Fund may not be able to pursue claims on behalf of its shareholders because of the system of share registration and custody, and because Russian banking institutions and registrars are not guaranteed by the Russian government. |
| ■ | The risk of delays in settling portfolio transactions and the risk of loss arising out of the system of share registration and custody used in certain Eastern European countries; |
| ■ | Risks in connection with the maintenance of the Fund's portfolio securities and cash with foreign sub-custodians and securities depositories, including the risk that appropriate sub-custody arrangements will not be available to the Fund; |
| ■ | The risk that the Fund's ownership rights in portfolio securities could be lost through fraud or negligence as a result of the fact that ownership in shares of certain Eastern European companies is recorded by the companies themselves and by registrars, rather than a central registration system; |
| ■ | The risk that the Fund may not be able to pursue claims on behalf of its shareholders because of the system of share registration and custody, and because certain Eastern European banking institutions and registrars are not guaranteed by their respective governments; and |
| ■ | Risks in connection with Eastern European countries' dependence on the economic health of Western European countries and the EU as a whole. |
| Approximate
Value of a Creation Unit |
Creation
Unit Size |
Standard
Creation/ Redemption Transaction Fee |
Maximum
Additional Charge for Creations* |
Maximum
Additional Charge for Redemptions* | ||||
| $1,290,500 | 50,000 | $500 | 3.0% | 2.0% |
| * | As a percentage of the net asset value per Creation Unit, inclusive, in the case of redemptions, of the standard redemption transaction fee. |
(For a share outstanding throughout each period)
| Year
ended Aug. 31, 2017 |
Year
ended Aug. 31, 2016 |
Period
from Sept. 23, 2014a to Aug. 31, 2015 | |||
| Net asset value, beginning of period | $ 21.72 | $ 21.40 | $ 24.44 | ||
| Income from investment operations: | |||||
| Net investment incomeb | 0.36 | 0.50 | 0.41 | ||
| Net realized and unrealized gain (loss)c | 3.83 | 1.08 | (2.80) | ||
| Total from investment operations | 4.19 | 1.58 | (2.39) | ||
| Less distributions from: | |||||
| Net investment income | (0.34) | (0.48) | (0.65) | ||
| Net realized gain | — | (0.78) | — | ||
| Total distributions | (0.34) | (1.26) | (0.65) | ||
| Net asset value, end of period | $ 25.57 | $ 21.72 | $ 21.40 | ||
| Total return | 19.55% | 7.84% | (10.01)% d | ||
| Ratios/Supplemental data: | |||||
| Net assets, end of period (000s) | $393,757 | $180,254 | $211,865 | ||
| Ratio of expenses to average net assetse,f | 0.00% | 0.00% | 0.02% | ||
| Ratio of expenses to average net assets prior to waived feese,f | 0.78% | 0.78% | 0.78% | ||
| Ratio of net investment income to average net assetse | 1.56% | 2.42% | 1.82% | ||
| Portfolio turnover rateg,h | 4% | 11% | 7% d |
| a | Commencement of operations. |
| b | Based on average shares outstanding throughout each period. |
| c | The amounts reported for a share outstanding may not accord with the change in aggregate gains and losses in securities for the fiscal period due to the timing of capital share transactions in relation to the fluctuating market values of the Fund’s underlying securities. |
| d | Not annualized. |
| e | Annualized for periods of less than one year. |
| f | The Fund indirectly bears its proportionate share of fees and expenses incurred by the underlying fund in which the Fund is invested. This ratio does not include these indirect fees and expenses. |
| g | Portfolio turnover rates exclude portfolio securities received or delivered as a result of processing capital share transactions in Creation Units. |
| h | Portfolio turnover rates exclude the portfolio activity of the underlying fund in which the Fund is invested. |
| Premium/Discount Range | Number of Days | Percentage of Total Days | ||
| Greater than 0.0% and Less than 0.5% | 222 | 50.45% | ||
| At NAV | 19 | 4.32 | ||
| Less than 0.0% and Greater than -0.5% | 198 | 45.00 | ||
| Less than -0.5% and Greater than -1.0% | 1 | 0.23 | ||
| 440 | 100.00% |
| Average Annual Total Returns | Cumulative Total Returns | ||||||
| NAV | MARKET | INDEX | NAV | MARKET | INDEX | ||
| 1 Year | 19.55% | 19.77% | 19.47% | 19.55% | 19.77% | 19.47% | |
| Since Inception* | 5.18% | 5.26% | 5.56% | 16.02% | 16.27% | 17.22% | |
| * | Total returns for the period since inception are calculated from the inception date of the Fund (9/23/14). The first day of secondary market trading in shares of the Fund was 9/25/14. |
| Call: | 1-800-iShares
or 1-800-474-2737 (toll free) Monday through Friday, 8:30 a.m. to 6:30 p.m. (Eastern time) |
| Email: | iSharesETFs@blackrock.com |
| Write: | c/o
BlackRock Investments, LLC 1 University Square Drive, Princeton, NJ 08540 |


| 2017 Prospectus |
|
| ► | iShares Edge MSCI Min Vol EM Currency Hedged ETF | HEMV | CBOE BZX |
|
|
S-1 |
|
|
1 |
|
|
2 |
|
|
21 |
|
|
24 |
|
|
24 |
|
|
25 |
|
|
28 |
|
|
38 |
|
|
38 |
|
|
40 |
|
|
40 |
|
|
42 |
| Ticker: HEMV | Stock Exchange: Cboe BZX |
| Annual
Fund Operating Expenses (ongoing expenses that you pay each year as a percentage of the value of your investments) | ||||||||||||
| Management
Fees |
Distribution
and Service (12b-1) Fees |
Other
Expenses |
Acquired
Fund Fees and Expenses |
Total
Annual Fund Operating Expenses |
Fee Waiver | Total
Annual Fund Operating Expenses After Fee Waiver | ||||||
| 0.78% | None | None | 0.25% | 1.03% | (0.75)% | 0.28% | ||||||
| 1 Year | 3 Years | 5 Years | 10 Years | |||
| $29 | $90 | $335 | $1041 |
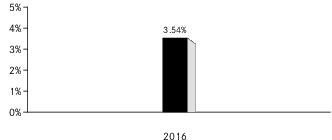
| 1 | The Fund’s year-to-date return as of September 30, 2017 was 14.30%. |
| One Year | Since
Fund Inception | ||
| (Inception Date: 10/29/2015) | |||
| Return Before Taxes | 3.54% | -0.65% | |
| Return After Taxes on Distributions2 | 2.83% | -1.57% | |
| Return After Taxes on Distributions and Sale of Fund Shares2 | 2.50% | -0.62% | |
| MSCI Emerging Markets Minimum Volatility (USD) 100% Hedged to USD Index (Index returns do not reflect deductions for fees, expenses or taxes) | 2.92% | -1.16% |
| 2 | After-tax returns in the table above are calculated using the historical highest individual U.S. federal marginal income tax rates and do not reflect the impact of state or local taxes. Actual after-tax returns depend on an investor’s tax situation and may differ from those shown, and after-tax returns shown are not relevant to tax-exempt investors or investors who hold shares through tax-deferred arrangements, such as 401(k) plans or individual retirement accounts (“IRAs”). Fund returns after taxes on distributions and sales of Fund shares are calculated assuming that an investor has sufficient capital gains of the same character from other investments to offset any capital losses from the sale of Fund shares. As a result, Fund returns after taxes on distributions and sales of Fund shares may exceed Fund returns before taxes and/or returns after taxes on distributions. |
| ■ | Lower levels of liquidity and market efficiency; |
| ■ | Greater securities price volatility; |
| ■ | Exchange rate fluctuations and exchange controls; |
| ■ | Less availability of public information about issuers; |
| ■ | Limitations on foreign ownership of securities; |
| ■ | Imposition of withholding or other taxes; |
| ■ | Imposition of restrictions on the expatriation of the funds or other assets of the Fund; |
| ■ | Higher transaction and custody costs and delays in settlement procedures; |
| ■ | Difficulties in enforcing contractual obligations; |
| ■ | Lower levels of regulation of the securities markets; |
| ■ | Weaker accounting, disclosure and reporting requirements; and |
| ■ | Legal principles relating to corporate governance, directors’ fiduciary duties and liabilities and stockholders’ rights in markets in which the Fund invests may differ and/or may not be as extensive or protective as those that apply in the U.S. |
| ■ | The risk of delays in settling portfolio transactions and the risk of loss arising out of the system of share registration and custody used in Russia; |
| ■ | Risks in connection with the maintenance of the Fund’s or the Underlying Fund's portfolio securities and cash with foreign sub-custodians and securities depositories, including the risk that appropriate sub-custody arrangements will not be available to the Fund or the Underlying Fund; |
| ■ | The risk that the Fund’s or the Underlying Fund's ownership rights in portfolio securities could be lost through fraud or negligence because ownership in shares of |
| Russian companies is recorded by the companies themselves and by registrars, rather than by a central registration system; and | |
| ■ | The risk that the Fund or the Underlying Fund may not be able to pursue claims on behalf of its shareholders because of the system of share registration and custody, and because Russian banking institutions and registrars are not guaranteed by the Russian government. |
Current or future sanctions may result in Russia taking counter measures or retaliatory actions, which may further impair the value and liquidity of Russian securities. These retaliatory measures may include the immediate freeze of Russian assets held by the Fund or the Underlying Fund. In the event of such a freeze of any Fund or Underlying Fund assets, including depositary receipts, the Fund or the Underlying Fund may need to liquidate non-restricted assets in order to satisfy any Fund or Underlying Fund redemption orders. The liquidation of Fund or Underlying Fund assets during this time may also result in the Fund or the Underlying Fund receiving substantially lower prices for its securities.
| Approximate
Value of a Creation Unit |
Creation
Unit Size |
Standard
Creation/ Redemption Transaction Fee |
Maximum
Additional Charge for Creations* |
Maximum
Additional Charge for Redemptions* | ||||
| $1,325,000 | 50,000 | $500 | 3.0% | 2.0% |
| * | As a percentage of the net asset value per Creation Unit, inclusive, in the case of redemptions, of the standard redemption transaction fee. |
(For a share outstanding throughout each period)
| Year
ended Aug. 31, 2017 |
Period
from Oct. 29, 2015a to Aug. 31, 2016 | ||
| Net asset value, beginning of period | $24.71 | $24.50 | |
| Income from investment operations: | |||
| Net investment incomeb | 0.70 | 0.58 | |
| Net realized and unrealized gainc | 1.37 | 0.23 | |
| Total from investment operations | 2.07 | 0.81 | |
| Less distributions from: | |||
| Net investment income | (0.53) | (0.60) | |
| Return of capital | — | (0.00) d | |
| Total distributions | (0.53) | (0.60) | |
| Net asset value, end of period | $26.25 | $ 24.71 | |
| Total return | 8.61% | 3.45% e | |
| Ratios/Supplemental data: | |||
| Net assets, end of period (000s) | $ 6,562 | $ 6,177 | |
| Ratio of expenses to average net assetsf,g | 0.03% | 0.03% | |
| Ratio of expenses to average net assets prior to waived feesf,g | 0.78% | 0.78% | |
| Ratio of net investment income to average net assetsf | 2.85% | 2.88% | |
| Portfolio turnover rateh,i | 8% | 8% e |
| a | Commencement of operations. |
| b | Based on average shares outstanding throughout each period. |
| c | The amounts reported for a share outstanding may not accord with the change in aggregate gains and losses in securities for the fiscal period due to the timing of capital share transactions in relation to the fluctuating market values of the Fund’s underlying securities. |
| d | Rounds to less than 0.01%. |
| e | Not annualized. |
| f | Annualized for periods of less than one year. |
| g | The Fund indirectly bears its proportionate share of fees and expenses incurred by the underlying fund in which the Fund is invested. This ratio does not include these indirect fees and expenses. |
| h | Portfolio turnover rates exclude portfolio securities received or delivered as a result of processing capital share transactions in Creation Units. |
| i | Portfolio turnover rates exclude the portfolio activity of the underlying fund in which the Fund is invested. |
| Premium/Discount Range | Number of Days | Percentage of Total Days | ||
| Greater than 0.5% and Less than 1.0% | 28 | 6.36% | ||
| Greater than 0.0% and Less than 0.5% | 317 | 72.04 | ||
| At NAV | 9 | 2.05 | ||
| Less than 0.0% and Greater than -0.5% | 85 | 19.32 | ||
| Less than -0.5% and Greater than -1.0% | 1 | 0.23 | ||
| 440 | 100.00% |
| Average Annual Total Returns | Cumulative Total Returns | ||||||
| NAV | MARKET | INDEX | NAV | MARKET | INDEX | ||
| 1 Year | 8.61% | 8.54% | 8.87% | 8.61% | 8.54% | 8.87% | |
| Since Inception* | 6.52% | 6.72% | 6.26% | 12.36% | 12.74% | 11.82% | |
| * | Total returns for the period since inception are calculated from the inception date of the Fund (10/29/15). The first day of secondary market trading in shares of the Fund was 11/02/15. |
| Call: | 1-800-iShares
or 1-800-474-2737 (toll free) Monday through Friday, 8:30 a.m. to 6:30 p.m. (Eastern time) |
| Email: | iSharesETFs@blackrock.com |
| Write: | c/o
BlackRock Investments, LLC 1 University Square Drive, Princeton, NJ 08540 |

| 2017 Prospectus |
|
| ► | iShares Edge MSCI Min Vol Emerging Markets ETF | EEMV | CBOE BZX |
|
|
S-1 |
|
|
1 |
|
|
2 |
|
|
20 |
|
|
22 |
|
|
22 |
|
|
26 |
|
|
39 |
|
|
39 |
|
|
41 |
|
|
41 |
|
|
43 |
| Ticker: EEMV | Stock Exchange: Cboe BZX |
| Annual
Fund Operating Expenses (ongoing expenses that you pay each year as a percentage of the value of your investments) | ||||||||||
| Management
Fees |
Distribution
and Service (12b-1) Fees |
Other
Expenses1 |
Total
Annual Fund Operating Expenses |
Fee Waiver | Total
Annual Fund Operating Expenses After Fee Waiver | |||||
| 0.69% | None | 0.00% | 0.69% | (0.44)% | 0.25% | |||||
| 1 | For the most recently completed fiscal year, the amount of Other Expenses rounded to 0.00%. |
| 1 Year | 3 Years | 5 Years | 10 Years | |||
| $26 | $80 | $141 | $570 |

| 1 | The Fund’s year-to-date return as of September 30, 2017 was 18.23%. |
| One Year | Five Years | Since
Fund Inception | |||
| (Inception Date: 10/18/2011) | |||||
| Return Before Taxes | 3.72% | 2.26% | 2.64% | ||
| Return After Taxes on Distributions1 | 3.03% | 1.74% | 2.05% | ||
| Return After Taxes on Distributions and Sale of Fund Shares1 | 2.64% | 1.82% | 2.09% | ||
| MSCI Emerging Markets Minimum Volatility (USD) Index (Index returns do not reflect deductions for fees, expenses or taxes) | 3.90% | 2.45% | 2.84% |
| 1 | After-tax returns in the table above are calculated using the historical highest individual U.S. federal marginal income tax rates and do not reflect the impact of state or local taxes. Actual after-tax returns depend on an investor’s tax situation and may differ from those shown, and after-tax returns shown are not relevant to tax-exempt investors or investors who hold shares through tax-deferred arrangements, such as 401(k) plans or individual retirement accounts (“IRAs”). Fund returns after taxes on distributions and sales of Fund shares are calculated assuming that an investor has sufficient capital gains of the same character from other investments to offset any capital losses from the sale of Fund shares. As a result, Fund returns after taxes on distributions and sales of Fund shares may exceed Fund returns before taxes and/or returns after taxes on distributions. |
| ■ | Lower levels of liquidity and market efficiency; |
| ■ | Greater securities price volatility; |
| ■ | Exchange rate fluctuations and exchange controls; |
| ■ | Less availability of public information about issuers; |
| ■ | Limitations on foreign ownership of securities; |
| ■ | Imposition of withholding or other taxes; |
| ■ | Imposition of restrictions on the expatriation of the funds or other assets of the Fund; |
| ■ | Higher transaction and custody costs and delays in settlement procedures; |
| ■ | Difficulties in enforcing contractual obligations; |
| ■ | Lower levels of regulation of the securities markets; |
| ■ | Weaker accounting, disclosure and reporting requirements; and |
| ■ | Legal principles relating to corporate governance, directors’ fiduciary duties and liabilities and stockholders’ rights in markets in which the Fund invests may differ and/or may not be as extensive or protective as those that apply in the U.S. |
| ■ | The risk of delays in settling portfolio transactions and the risk of loss arising out of the system of share registration and custody used in Russia; |
| ■ | Risks in connection with the maintenance of the Fund’s portfolio securities and cash with foreign sub-custodians and securities depositories, including the risk that appropriate sub-custody arrangements will not be available to the Fund; |
| ■ | The risk that the Fund’s ownership rights in portfolio securities could be lost through fraud or negligence because ownership in shares of Russian companies is recorded by the companies themselves and by registrars, rather than by a central registration system; and |
| ■ | The risk that the Fund may not be able to pursue claims on behalf of its shareholders because of the system of share registration and custody, and because Russian banking institutions and registrars are not guaranteed by the Russian government. |
| ■ | With respect to a foreign entity that holds the Indian assets directly, if the transferor of share or interest in such a foreign entity (along with its associated enterprises), at any time in the twelve months preceding the year of transfer neither holds the right of control or management in the foreign entity, nor holds voting power or share capital or interest exceeding 5% of the total voting power or total share capital or total interest in such foreign entity. |
| ■ | With respect to a foreign entity that holds the Indian assets indirectly, if the transferor of share or interest in such foreign entity (along with its associated enterprises), at any time in the twelve months preceding the year of transfer does not hold the right of control or management in relation to the foreign entity, which would entitle them to the right of control or management in the foreign entity which directly holds the Indian assets; or does not hold voting power or share capital or interest exceeding 5% of the total voting power or total share capital or total interest in the foreign entity, which results in holding the same share capital or voting power in the entity which directly holds the Indian assets. |
| ■ | creates rights, or obligations, which are not ordinarily created between persons dealing at arm's length; |
| ■ | results, directly or indirectly, in the misuse, or abuse, of the provisions of IT Act; |
| ■ | lacks commercial substance; or |
| ■ | is entered into, or carried out, by means, or in a manner, which are not ordinarily employed for bona fide purposes. |
| ■ | any arrangement where the aggregate tax benefit to all the parties of the arrangement in the relevant financial year does not exceed INR 30 Million; |
| ■ | foreign institutional investors (“FIIs”) that choose not to take any benefit under any tax treaty entered with India and have invested in listed or unlisted securities with prior permission of the competent authority in accordance with the applicable regulations; |
| ■ | non-resident investor in an FII who has invested in an FII, directly or indirectly, by way of an offshore derivative instrument or otherwise; or |
| ■ | any income derived from the transfer of shares or interests made prior to April 1, 2017. |
| ■ | Dividend: Dividend income earned by the Subsidiary will not be subject to Indian tax. However, the Indian company declaring and paying such dividend would be subject |
| to Dividend Distribution Tax at an effective rate of 20.36% (effective starting April 1, 2015) on the amount of the dividend paid out. | |
| ■ | Interest: Interest paid to the Subsidiary in respect of debt obligations of Indian issuers will be subject to Indian income tax. The tax rate in the case of a rupee-denominated debt obligation is 43.26%. However if the Subsidiary is a SEBI registered foreign portfolio investor, interest income earned from June 1, 2013 to June 30, 2020 on rupee denominated bonds of Indian companies and Indian government securities will be subject to tax at the rate of 5.41%, provided that the rate of interest does not exceed the prescribed rates. In the case of a foreign-currency denominated debt obligation, the tax rate is 21.63%. For approved foreign-currency loans advanced from July 1, 2012 to June 30, 2020, the tax rate on interest is 5.41% and for approved foreign currency long-term bonds issued from October 1, 2014 to June 30, 2020, the tax rate on interest is 5.41%. FA 17 has reduced the withholding tax rate on rupee-denominated bonds issued before July 1, 2020 to 5.41%. The Protocol provides for a withholding rate of 7.5% on the interest payments made on or after April 1, 2017. |
| ■ | Securities Transaction Tax: All transactions entered on a recognized stock exchange in India are subject to a Securities Transaction Tax (“STT”). STT has been introduced under Section 98 of the Finance (No.2) Act, 2004 on transactions relating to sale, purchases and redemption of shares made by purchasers or sellers of Indian securities and equity oriented mutual fund units. The current STT as levied on the transaction value as follows: |
| ■ | 0.1% payable by the buyer and 0.1% by the seller on the value of transactions of delivery based transfer of an equity share in an Indian company entered in a recognized stock exchange; |
| ■ | 0.001% on the value of transactions of delivery based sale of a unit of an equity oriented mutual fund entered in a recognized stock exchange, payable by the seller; |
| ■ | 0.025% on the value of transactions of non-delivery based sale of an equity share in an Indian company or a unit of an equity oriented mutual fund, entered in a recognized stock exchange payable by the seller; |
| ■ | 0.05% on the value of transactions of derivatives being options, entered in a recognized stock exchange. STT is to be paid by the seller; |
| ■ | 0.01% on the value of transactions of sale of derivatives being futures, entered in a recognized stock exchange. STT is to be paid by the seller; |
| ■ | 0.001% on the value of transactions of sale of units of an equity-oriented fund to the Mutual Fund, payable by the seller in accordance with the Finance Act, 2013; |
| ■ | 0.125% on the value of transactions of sale of derivatives being options, where the option is exercised, entered in a recognized stock exchange. STT is to be paid by buyer; |
| ■ | The Finance Act, 2012 has exempted from tax the capital gains (under the IT Act) arising from the sale of unlisted shares by existing shareholders of a Sub-Fund in an initial public offer. However, such sale is subject to STT at 0.2% of the sale consideration payable by the seller. |
| ■ | Capital Gains: Assuming total income will be more than INR 100 million, the taxation of capital gains would be as follows: (i) long-term capital gains (being gains on sale of shares held for a period of more than 12 months) listed on a recognized stock exchange would not be taxable in India provided STT has been paid on the same (as discussed above); (ii) short-term capital gains (being gains on sale of shares held for a period of 12 months or less) from the sale of Indian shares listed on a recognized stock exchange will be taxed at the rate of 16.22% provided STT has been paid on the same; (iii) long-term capital gains (being gains on sale of shares held for a period of more than 24 months) arising to the Subsidiary from the sale of unlisted securities will be taxed at the rate of 10.82% (without indexation) and short-term capital gains (being gains on sale of shares held for a period of 24 months or less) will be taxed at the rate of 43.26% (however, if the Subsidiary is a SEBI registered sub-account, the rates will be at 10.816% and 32.45%, respectively); (iv) capital gains realized on sale of listed equity shares not executed on a recognized stock exchange in India would be taxed at the rate of 10.815% for long-term gains (being gains on sale of shares held for a period of more than 12 months) and at 43.26% in the case of short-term gains (being gains on sale of shares held for a period of 12 months or less); and (v) capital gains arising from the transfer of depositary receipts outside India between non-resident investors will not be subject to tax in India. FA 2017 introduced an additional requirement of payment of STT at the time of acquisition of shares for the long term capital gain exemption. This additional condition is applicable with respect to certain notified transactions. However, it is not applicable to shares acquired by qualified institutional buyers, which includes Category I and II FPIs. |
| ■ | With respect to a foreign entity that holds the Indian assets directly, if the transferor of share or interest in such a foreign entity (along with its associated enterprises), at any time in the twelve months preceding the year of transfer neither holds the right of control or management in the foreign entity, nor holds voting power or share capital or interest exceeding 5% of the total voting power or total share capital or total interest in such foreign entity. |
| ■ | With respect to a foreign entity that holds the Indian assets indirectly, if the transferor of share or interest in such foreign entity (along with its associated enterprises), at any time in the twelve months preceding the year of transfer does not hold the right of control or management in relation to the foreign entity, which would entitle them to the right of control or management in the foreign entity which directly holds the Indian assets; or does not hold voting power or share capital or interest exceeding 5% of the total voting power or total share capital or total interest in the foreign entity, which results in holding the same share capital or voting power in the entity which directly holds the Indian assets. |
| ■ | any arrangement where the aggregate tax benefit to all the parties of the arrangement in the relevant financial year does not exceed INR 30 Million; |
| ■ | FIIs that choose not to take any benefit under any tax treaty entered with India and have invested in listed or unlisted securities with prior permission of the competent authority in accordance with the applicable regulations; |
| ■ | non-resident investor in an FII who has invested in an FII, directly or indirectly, by way of an offshore derivative instrument or otherwise; or |
| ■ | any income derived from the transfer of shares or interests made prior to April 1, 2017. |
| Approximate
Value of a Creation Unit |
Creation
Unit Size |
Standard
Creation/ Redemption Transaction Fee |
Maximum
Additional Charge for Creations* |
Maximum
Additional Charge for Redemptions* | ||||
| $5,784,000 | 100,000 | $6,100 | 7.0% | 2.0% |
| * | As a percentage of the net asset value per Creation Unit, inclusive, in the case of redemptions, of the standard redemption transaction fee. |
(For a share outstanding throughout each period)
| Year
ended Aug. 31, 2017 |
Year
ended Aug. 31, 2016 |
Year
ended Aug. 31, 2015 |
Year
ended Aug. 31, 2014 |
Year
ended Aug. 31, 2013 | |||||
| Net asset value, beginning of year | $ 53.40 | $ 50.98 | $ 62.47 | $ 55.56 | $ 55.32 | ||||
| Income from investment operations: | |||||||||
| Net investment incomea | 1.28 | 1.57 | 1.58 | 1.51 | 1.85 | ||||
| Net realized and unrealized gain (loss)b | 4.48 | 2.13 | (11.65) | 6.94 | (0.60) | ||||
| Total from investment operations | 5.76 | 3.70 | (10.07) | 8.45 | 1.25 | ||||
| Less distributions from: | |||||||||
| Net investment income | (1.15) | (1.28) | (1.42) | (1.54) | (1.01) | ||||
| Total distributions | (1.15) | (1.28) | (1.42) | (1.54) | (1.01) | ||||
| Net asset value, end of year | $ 58.01 | $ 53.40 | $ 50.98 | $ 62.47 | $ 55.56 | ||||
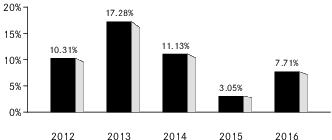
| Total return | 11.11% | 7.48% | (16.32)% | 15.44% | 2.22% | ||||
| Ratios/Supplemental data: | |||||||||
| Net assets, end of year (000s) | $4,037,428 | $4,379,041 | $2,462,357 | $2,080,363 | $2,455,727 | ||||
| Ratio of expenses to average net assets | 0.25% | 0.25% | 0.25% | 0.25% | 0.25% | ||||
| Ratio of expenses to average net assets prior to waived fees | 0.69% | 0.71% | 0.69% | 0.67% | 0.67% | ||||
| Ratio of net investment income to average net assets | 2.40% | 3.12% | 2.71% | 2.58% | 3.13% | ||||
| Portfolio turnover ratec | 23% | 23% | 28% | 34% | 23% |
| a | Based on average shares outstanding throughout each period. |
| b | The amounts reported for a share outstanding may not accord with the change in aggregate gains and losses in securities for the fiscal period due to the timing of capital share transactions in relation to the fluctuating market values of the Fund’s underlying securities. |
| c | Portfolio turnover rates exclude portfolio securities received or delivered in Creation Units but include portfolio transactions that are executed as a result of the Fund processing capital share transactions in Creation Units partially for cash in U.S. dollars. Excluding such cash transactions, the portfolio turnover rates for the years ended August 31, 2017, August 31, 2016, August 31, 2015, August 31, 2014 and August 31, 2013 were 22%, 23%, 24%, 26% and 23%, respectively. |
| Premium/Discount Range | Number of Days | Percentage of Total Days | ||
| Greater than 2.0% and Less than 2.5% | 1 | 0.23% | ||
| Greater than 1.5% and Less than 2.0% | 5 | 1.14 | ||
| Greater than 1.0% and Less than 1.5% | 14 | 3.18 | ||
| Greater than 0.5% and Less than 1.0% | 71 | 16.14 | ||
| Greater than 0.0% and Less than 0.5% | 165 | 37.49 | ||
| At NAV | 5 | 1.14 | ||
| Less than 0.0% and Greater than -0.5% | 122 | 27.72 | ||
| Less than -0.5% and Greater than -1.0% | 44 | 10.00 | ||
| Less than -1.0% and Greater than -1.5% | 8 | 1.82 | ||
| Less than -1.5% and Greater than -2.0% | 4 | 0.91 | ||
| Less than -2.0% and Greater than -2.5% | 1 | 0.23 | ||
| 440 | 100.00% |
| Average Annual Total Returns | Cumulative Total Returns | ||||||
| NAV | MARKET | INDEX | NAV | MARKET | INDEX | ||
| 1 Year | 11.11% | 11.64% | 11.45% | 11.11% | 11.64% | 11.45% | |
| 5 Years | 3.35% | 3.31% | 3.53% | 17.92% | 17.68% | 18.96% | |
| Since Inception* | 5.35% | 5.38% | 5.58% | 35.80% | 36.02% | 37.53% | |
| * | Total returns for the period since inception are calculated from the inception date of the Fund (10/18/11). The first day of secondary market trading in shares of the Fund was 10/20/11. |
| Call: | 1-800-iShares
or 1-800-474-2737 (toll free) Monday through Friday, 8:30 a.m. to 6:30 p.m. (Eastern time) |
| Email: | iSharesETFs@blackrock.com |
| Write: | c/o
BlackRock Investments, LLC 1 University Square Drive, Princeton, NJ 08540 |

| 2017 Prospectus |
|
| ► | iShares Edge MSCI Min Vol Global ETF | ACWV | CBOE BZX |
|
|
S-1 |
|
|
1 |
|
|
2 |
|
|
12 |
|
|
16 |
|
|
16 |
|
|
19 |
|
|
29 |
|
|
29 |
|
|
31 |
|
|
31 |
|
|
33 |
GLOBAL ETF
| Ticker: ACWV | Stock Exchange: Cboe BZX |
| Annual
Fund Operating Expenses (ongoing expenses that you pay each year as a percentage of the value of your investments) | ||||||||||||
| Management
Fees |
Distribution
and Service (12b-1) Fees |
Other
Expenses |
Acquired
Fund Fees and Expenses |
Total
Annual Fund Operating Expenses |
Fee Waiver | Total
Annual Fund Operating Expenses After Fee Waiver | ||||||
| 0.32% | None | None | 0.00% | 0.32% | (0.12)% | 0.20% | ||||||
| 1 Year | 3 Years | 5 Years | 10 Years | |||
| $20 | $64 | $113 | $325 |
| 1 | The Fund’s year-to-date return as of September 30, 2017 was 12.84%. |
| One Year | Five Years | Since
Fund Inception | |||
| (Inception Date: 10/18/2011) | |||||
| Return Before Taxes | 7.71% | 9.80% | 9.99% | ||
| Return After Taxes on Distributions1 | 6.93% | 9.15% | 9.35% | ||
| Return After Taxes on Distributions and Sale of Fund Shares1 | 4.75% | 7.66% | 7.83% | ||
| MSCI ACWI Minimum Volatility (USD) Index (Index returns do not reflect deductions for fees, expenses or taxes) | 7.43% | 9.53% | 9.72% |
| 1 | After-tax returns in the table above are calculated using the historical highest individual U.S. federal marginal income tax rates and do not reflect the impact of state or local taxes. Actual after-tax returns depend on an investor’s tax situation and may differ from those shown, and after-tax returns shown are not relevant to tax-exempt investors or investors who hold shares through tax-deferred arrangements, such as 401(k) plans or individual retirement accounts (“IRAs”). Fund returns after taxes on distributions and sales of Fund shares are calculated assuming that an investor has sufficient capital gains of the same character from other investments to offset any capital losses from the sale of Fund shares. As a result, Fund returns after taxes on distributions and sales of Fund shares may exceed Fund returns before taxes and/or returns after taxes on distributions. |
| ■ | Lower levels of liquidity and market efficiency; |
| ■ | Greater securities price volatility; |
| ■ | Exchange rate fluctuations and exchange controls; |
| ■ | Less availability of public information about issuers; |
| ■ | Limitations on foreign ownership of securities; |
| ■ | Imposition of withholding or other taxes; |
| ■ | Imposition of restrictions on the expatriation of the funds or other assets of the Fund; |
| ■ | Higher transaction and custody costs and delays in settlement procedures; |
| ■ | Difficulties in enforcing contractual obligations; |
| ■ | Lower levels of regulation of the securities markets; |
| ■ | Weaker accounting, disclosure and reporting requirements; and |
| ■ | Legal principles relating to corporate governance, directors’ fiduciary duties and liabilities and stockholders’ rights in markets in which the Fund invests may differ and/or may not be as extensive or protective as those that apply in the U.S. |
| Approximate
Value of a Creation Unit |
Creation
Unit Size |
Standard
Creation/ Redemption Transaction Fee |
Maximum
Additional Charge for Creations* |
Maximum
Additional Charge for Redemptions* | ||||
| $8,124,000 | 100,000 | $4,200 | 7.0% | 2.0% |
| * | As a percentage of the net asset value per Creation Unit, inclusive, in the case of redemptions, of the standard redemption transaction fee. |
(For a share outstanding throughout each period)
| Year
ended Aug. 31, 2017 |
Year
ended Aug. 31, 2016 |
Year
ended Aug. 31, 2015 |
Year
ended Aug. 31, 2014 |
Year
ended Aug. 31, 2013 | |||||||
| Net asset value, beginning of year | $ 75.82 | $ 67.59 | $ 68.25 | $ 59.99 | $ 55.65 | ||||||
| Income from investment operations: | |||||||||||
| Net investment incomea | 1.84 | 1.79 | 1.70 | 1.72 | 1.68 | ||||||
| Net realized and unrealized gain (loss)b | 5.40 | 8.07 | (0.89) | 8.18 | 4.20 | ||||||
| Total from investment operations | 7.24 | 9.86 | 0.81 | 9.90 | 5.88 | ||||||
| Less distributions from: | |||||||||||
| Net investment income | (1.93) | (1.63) | (1.47) | (1.64) | (1.54) | ||||||
| Total distributions | (1.93) | (1.63) | (1.47) | (1.64) | (1.54) | ||||||
| Net asset value, end of year | $ 81.13 | $ 75.82 | $ 67.59 | $ 68.25 | $ 59.99 | ||||||
| Total return | 9.75% | 14.76% | 1.15% | 16.70% | 10.69% | ||||||
| Ratios/Supplemental data: | |||||||||||
| Net assets, end of year (000s) | $3,675,374 | $3,267,688 | $2,115,632 | $1,283,012 | $1,007,760 | ||||||
| Ratio of expenses to average net assets | 0.20% | 0.20% | 0.20% | 0.20% | 0.20% | ||||||
| Ratio of expenses to average net assets prior to waived fees | 0.32% | 0.32% | 0.33% | 0.33% | 0.34% | ||||||
| Ratio of net investment income to average net assets | 2.40% | 2.49% | 2.41% | 2.67% | 2.83% | ||||||
| Portfolio turnover ratec | 24% | 24% | 22% | 24% | 13% | ||||||
|
|
|||||||||||
| a | Based on average shares outstanding throughout each period. |
| b | The amounts reported for a share outstanding may not accord with the change in aggregate gains and losses in securities for the fiscal period due to the timing of capital share transactions in relation to the fluctuating market values of the Fund’s underlying securities. |
| c | Portfolio turnover rates exclude portfolio securities received or delivered in Creation Units but include portfolio transactions that are executed as a result of the Fund processing capital share transactions in Creation Units partially for cash in U.S. dollars. Excluding such cash transactions, the portfolio turnover rates for the years ended August 31, 2017, August 31, 2016, August 31, 2015, August 31, 2014 and August 31, 2013 were 24%, 23%, 22%, 23% and 13%, respectively. |
| Premium/Discount Range | Number of Days | Percentage of Total Days | ||
| Greater than 0.5% and Less than 1.0% | 6 | 1.36% | ||
| Greater than 0.0% and Less than 0.5% | 293 | 66.60 | ||
| At NAV | 11 | 2.50 | ||
| Less than 0.0% and Greater than -0.5% | 128 | 29.09 | ||
| Less than -0.5% and Greater than -1.0% | 2 | 0.45 | ||
| 440 | 100.00% |
| Average Annual Total Returns | Cumulative Total Returns | ||||||
| NAV | MARKET | INDEX | NAV | MARKET | INDEX | ||
| 1 Year | 9.75% | 9.83% | 9.47% | 9.75% | 9.83% | 9.47% | |
| 5 Years | 10.48% | 10.37% | 10.18% | 64.58% | 63.76% | 62.39% | |
| Since Inception* | 11.04% | 11.05% | 10.76% | 84.99% | 85.08% | 82.19% | |
| * | Total returns for the period since inception are calculated from the inception date of the Fund (10/18/11). The first day of secondary market trading in shares of the Fund was 10/20/11. |
| Call: | 1-800-iShares
or 1-800-474-2737 (toll free) Monday through Friday, 8:30 a.m. to 6:30 p.m. (Eastern time) |
| Email: | iSharesETFs@blackrock.com |
| Write: | c/o
BlackRock Investments, LLC 1 University Square Drive, Princeton, NJ 08540 |

| 2017 Prospectus |
|
| ► | iShares Edge MSCI Multifactor Emerging Markets ETF | EMGF | CBOE BZX |
|
|
S-1 |
|
|
1 |
|
|
2 |
|
|
22 |
|
|
27 |
|
|
27 |
|
|
30 |
|
|
45 |
|
|
45 |
|
|
47 |
|
|
47 |
|
|
49 |
| Ticker: EMGF | Stock Exchange: Cboe BZX |
| Annual
Fund Operating Expenses (ongoing expenses that you pay each year as a percentage of the value of your investments)1 | ||||||||||||
| Management
Fees |
Distribution
and Service (12b-1) Fees |
Other
Expenses |
Acquired
Fund Fees and Expenses |
Total
Annual Fund Operating Expenses |
Fee Waiver | Total
Annual Fund Operating Expenses After Fee Waiver | ||||||
| 0.45% | None | None | 0.05% | 0.50% | (0.05)% | 0.45% | ||||||
| 1 | The expense information in the table has been restated to reflect current fees. |
| 1 Year | 3 Years | 5 Years | 10 Years | |||
| $46 | $144 | $258 | $607 |
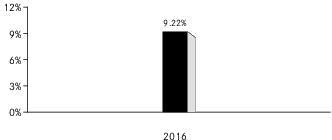
| 1 | The Fund’s year-to-date return as of September 30, 2017 was 30.90%. |
| One Year | Since
Fund Inception | ||
| (Inception Date: 12/08/2015) | |||
| Return Before Taxes | 9.22% | 7.48% | |
| Return After Taxes on Distributions1 | 8.70% | 7.00% | |
| Return After Taxes on Distributions and Sale of Fund Shares1 | 5.65% | 5.70% | |
| MSCI Emerging Markets Diversified Multiple-Factor Index (Index returns do not reflect deductions for fees, expenses or taxes) | 9.60% | 7.76% |
| 1 | After-tax returns in the table above are calculated using the historical highest individual U.S. federal marginal income tax rates and do not reflect the impact of state or local taxes. Actual after-tax returns depend on an investor’s tax situation and may differ from those shown, and after-tax returns shown are not relevant to tax-exempt investors or investors who hold shares through tax-deferred arrangements, such as 401(k) plans or individual retirement accounts (“IRAs”). Fund returns after taxes on distributions and sales of Fund shares are calculated assuming that an investor has sufficient capital gains of the same character from other investments to offset any capital losses from the sale of Fund shares. As a result, Fund returns after taxes on distributions and sales of Fund shares may exceed Fund returns before taxes and/or returns after taxes on distributions. |
| ■ | Lower levels of liquidity and market efficiency; |
| ■ | Greater securities price volatility; |
| ■ | Exchange rate fluctuations and exchange controls; |
| ■ | Less availability of public information about issuers; |
| ■ | Limitations on foreign ownership of securities; |
| ■ | Imposition of withholding or other taxes; |
| ■ | Imposition of restrictions on the expatriation of the funds or other assets of the Fund; |
| ■ | Higher transaction and custody costs and delays in settlement procedures; |
| ■ | Difficulties in enforcing contractual obligations; |
| ■ | Lower levels of regulation of the securities markets; |
| ■ | Weaker accounting, disclosure and reporting requirements; and |
| ■ | Legal principles relating to corporate governance, directors’ fiduciary duties and liabilities and stockholders’ rights in markets in which the Fund invests may differ and/or may not be as extensive or protective as those that apply in the U.S. |
Economic Risk. The Chinese economy has grown rapidly in the recent past and there is no assurance that this growth rate will be maintained. In fact, the Chinese economy may experience a significant slowdown as a result of, among other things, a deterioration in global demand for Chinese exports, as well as contraction in spending on domestic goods by Chinese consumers. In addition, China may experience substantial rates of inflation or economic recessions, which would have a negative effect on its economy and securities market. Delays in enterprise restructuring, slow development of well-functioning financial markets and widespread corruption have also hindered performance of the Chinese economy. China continues to receive substantial pressure from trading partners to liberalize official currency exchange rates.
| ■ | The risk of delays in settling portfolio transactions and the risk of loss arising out of the system of share registration and custody used in Russia; |
| ■ | Risks in connection with the maintenance of the Fund’s portfolio securities and cash with foreign sub-custodians and securities depositories, including the risk that appropriate sub-custody arrangements will not be available to the Fund; |
| ■ | The risk that the Fund’s ownership rights in portfolio securities could be lost through fraud or negligence because ownership in shares of Russian companies is recorded by the companies themselves and by registrars, rather than by a central registration system; and |
| ■ | The risk that the Fund may not be able to pursue claims on behalf of its shareholders because of the system of share registration and custody, and because Russian banking institutions and registrars are not guaranteed by the Russian government. |
Also, if an affected security is included in the Fund's Underlying Index, the Fund may, where practicable, seek to eliminate its holdings of the affected security by employing or augmenting its representative sampling strategy to seek to track the investment results of its Underlying Index. The use of (or increased use of) a representative sampling strategy may increase the Fund’s tracking error risk. If the affected securities constitute a significant percentage of the Underlying Index, the Fund may not be able to effectively implement a representative sampling strategy, which may result in significant tracking error between the Fund’s performance and the performance of its Underlying Index.
| ■ | With respect to a foreign entity that holds the Indian assets directly, if the transferor of share or interest in such a foreign entity (along with its associated enterprises), at any time in the twelve months preceding the year of transfer neither holds the right of control or management in the foreign entity, nor holds voting power or share capital or interest exceeding 5% of the total voting power or total share capital or total interest in such foreign entity. |
| ■ | With respect to a foreign entity that holds the Indian assets indirectly, if the transferor of share or interest in such foreign entity (along with its associated enterprises), at any time in the twelve months preceding the year of transfer does not hold the right of control or management in relation to the foreign entity, which would entitle them to the right of control or management in the foreign entity which directly holds the Indian assets; or does not hold voting power or share capital or interest exceeding 5% of the total voting power or total share capital or total interest in the foreign entity, which results in holding the same share capital or voting power in the entity which directly holds the Indian assets. |
| ■ | creates rights, or obligations, which are not ordinarily created between persons dealing at arm's length; |
| ■ | results, directly or indirectly, in the misuse, or abuse, of the provisions of IT Act; |
| ■ | lacks commercial substance; or |
| ■ | is entered into, or carried out, by means, or in a manner, which are not ordinarily employed for bona fide purposes. |
| ■ | any arrangement where the aggregate tax benefit to all the parties of the arrangement in the relevant financial year does not exceed INR 30 Million; |
| ■ | foreign institutional investors (“FIIs”) that choose not to take any benefit under any tax treaty entered with India and have invested in listed or unlisted securities with prior permission of the competent authority in accordance with the applicable regulations; |
| ■ | non-resident investor in an FII who has invested in an FII, directly or indirectly, by way of an offshore derivative instrument or otherwise; or |
| ■ | any income derived from the transfer of shares or interests made prior to April 1, 2017. |
| ■ | The risk of delays in settling portfolio transactions and the risk of loss arising out of the system of share registration and custody used in certain Eastern European countries; |
| ■ | Risks in connection with the maintenance of the Fund's portfolio securities and cash with foreign sub-custodians and securities depositories, including the risk that appropriate sub-custody arrangements will not be available to the Fund; |
| ■ | The risk that the Fund's ownership rights in portfolio securities could be lost through fraud or negligence as a result of the fact that ownership in shares of certain Eastern European companies is recorded by the companies themselves and by registrars, rather than a central registration system; |
| ■ | The risk that the Fund may not be able to pursue claims on behalf of its shareholders because of the system of share registration and custody, and because certain Eastern European banking institutions and registrars are not guaranteed by their respective governments; and |
| ■ | Risks in connection with Eastern European countries' dependence on the economic health of Western European countries and the EU as a whole. |
| ■ | Dividend: Dividend income earned by the Subsidiary will not be subject to Indian tax. However, the Indian company declaring and paying such dividend would be subject to Dividend Distribution Tax at an effective rate of 20.36% (effective starting April 1, 2015) on the amount of the dividend paid out. |
| ■ | Interest: Interest paid to the Subsidiary in respect of debt obligations of Indian issuers will be subject to Indian income tax. The tax rate in the case of a rupee-denominated debt obligation is 43.26%. However if the Subsidiary is a SEBI registered foreign portfolio investor, interest income earned from June 1, 2013 to June 30, 2020 on rupee denominated bonds of Indian companies and Indian government securities will be subject to tax at the rate of 5.41%, provided that the rate of interest does not exceed the prescribed rates. In the case of a foreign-currency denominated debt obligation, the tax rate is 21.63%. For approved foreign-currency loans advanced from July 1, 2012 to June 30, 2020, the tax rate on interest |
| is 5.41% and for approved foreign currency long-term bonds issued from October 1, 2014 to June 30, 2020, the tax rate on interest is 5.41%. FA 17 has reduced the withholding tax rate on rupee-denominated bonds issued before July 1, 2020 to 5.41%. The Protocol provides for a withholding rate of 7.5% on the interest payments made on or after April 1, 2017. | |
| ■ | Securities Transaction Tax: All transactions entered on a recognized stock exchange in India are subject to a Securities Transaction Tax (“STT”). STT has been introduced under Section 98 of the Finance (No.2) Act, 2004 on transactions relating to sale, purchases and redemption of shares made by purchasers or sellers of Indian securities and equity oriented mutual fund units. The current STT as levied on the transaction value as follows: |
| ■ | 0.1% payable by the buyer and 0.1% by the seller on the value of transactions of delivery based transfer of an equity share in an Indian company entered in a recognized stock exchange; |
| ■ | 0.001% on the value of transactions of delivery based sale of a unit of an equity oriented mutual fund entered in a recognized stock exchange, payable by the seller; |
| ■ | 0.025% on the value of transactions of non-delivery based sale of an equity share in an Indian company or a unit of an equity oriented mutual fund, entered in a recognized stock exchange payable by the seller; |
| ■ | 0.05% on the value of transactions of derivatives being options, entered in a recognized stock exchange. STT is to be paid by the seller; |
| ■ | 0.01% on the value of transactions of sale of derivatives being futures, entered in a recognized stock exchange. STT is to be paid by the seller; |
| ■ | 0.001% on the value of transactions of sale of units of an equity-oriented fund to the Mutual Fund, payable by the seller in accordance with the Finance Act, 2013; |
| ■ | 0.125% on the value of transactions of sale of derivatives being options, where the option is exercised, entered in a recognized stock exchange. STT is to be paid by buyer; |
| ■ | The Finance Act, 2012 has exempted from tax the capital gains (under the IT Act) arising from the sale of unlisted shares by existing shareholders of a Sub-Fund in an initial public offer. However, such sale is subject to STT at 0.2% of the sale consideration payable by the seller. |
| ■ | Capital Gains: Assuming total income will be more than INR 100 million, the taxation of capital gains would be as follows: (i) long-term capital gains (being gains on sale of shares held for a period of more than 12 months) listed on a recognized stock exchange would not be taxable in India provided STT has been paid on the same (as discussed above); (ii) short-term capital gains (being gains on sale of shares held for a period of 12 months or less) from the sale of Indian shares listed on a recognized stock exchange will be taxed at the rate of 16.22% provided STT has been paid on the same; (iii) long-term capital gains (being gains on sale of shares held for a period of more than 24 months) arising to the Subsidiary from the sale of unlisted securities will be taxed at the rate of 10.82% (without indexation) and short-term capital gains (being gains on sale of shares held for a period of 24 months or less) |
| will be taxed at the rate of 43.26% (however, if the Subsidiary is a SEBI registered sub-account, the rates will be at 10.816% and 32.45%, respectively); (iv) capital gains realized on sale of listed equity shares not executed on a recognized stock exchange in India would be taxed at the rate of 10.815% for long-term gains (being gains on sale of shares held for a period of more than 12 months) and at 43.26% in the case of short-term gains (being gains on sale of shares held for a period of 12 months or less); and (v) capital gains arising from the transfer of depositary receipts outside India between non-resident investors will not be subject to tax in India. FA 2017 introduced an additional requirement of payment of STT at the time of acquisition of shares for the long term capital gain exemption. This additional condition is applicable with respect to certain notified transactions. However, it is not applicable to shares acquired by qualified institutional buyers, which includes Category I and II FPIs. |
| ■ | With respect to a foreign entity that holds the Indian assets directly, if the transferor of share or interest in such a foreign entity (along with its associated enterprises), at any time in the twelve months preceding the year of transfer neither holds the right of control or management in the foreign entity, nor holds voting power or share capital or interest exceeding 5% of the total voting power or total share capital or total interest in such foreign entity. |
| ■ | With respect to a foreign entity that holds the Indian assets indirectly, if the |
| ■ | any arrangement where the aggregate tax benefit to all the parties of the arrangement in the relevant financial year does not exceed INR 30 Million; |
| ■ | FIIs that choose not to take any benefit under any tax treaty entered with India and have invested in listed or unlisted securities with prior permission of the competent authority in accordance with the applicable regulations; |
| ■ | non-resident investor in an FII who has invested in an FII, directly or indirectly, by way of an offshore derivative instrument or otherwise; or |
| ■ | any income derived from the transfer of shares or interests made prior to April 1, 2017. |
| Approximate
Value of a Creation Unit |
Creation
Unit Size |
Standard
Creation/ Redemption Transaction Fee |
Maximum
Additional Charge for Creations* |
Maximum
Additional Charge for Redemptions* | ||||
| $4,654,000 | 100,000 | $9,000 | 7.0% | 2.0% |
| * | As a percentage of the net asset value per Creation Unit, inclusive, in the case of redemptions, of the standard redemption transaction fee. |
(For a share outstanding throughout each period)
| Year
ended Aug. 31, 2017 |
Period
from Dec. 8, 2015a to Aug. 31, 2016 | ||
| Net asset value, beginning of period | $ 37.46 | $ 33.82 | |
| Income from investment operations: | |||
| Net investment incomeb | 0.91 | 1.27 | |
| Net realized and unrealized gainc | 8.53 | 2.50 | |
| Total from investment operations | 9.44 | 3.77 | |
| Less distributions from: | |||
| Net investment income | (0.86) | (0.13) | |
| Total distributions | (0.86) | (0.13) | |
| Net asset value, end of period | $ 46.04 | $ 37.46 | |
| Total return | 25.80% | 11.16% d | |
| Ratios/Supplemental data: | |||
| Net assets, end of period (000s) | $82,873 | $29,969 | |
| Ratio of expenses to average net assetse | 0.42% | 0.49% | |
| Ratio of expenses to average net assets prior to waived feese | 0.50% | 0.65% | |
| Ratio of net investment income to average net assetse | 2.24% | 4.91% | |
| Portfolio turnover ratef | 36% | 11% d | |
|
|
|||
| a | Commencement of operations. |
| b | Based on average shares outstanding throughout each period. |
| c | The amounts reported for a share outstanding may not accord with the change in aggregate gains and losses in securities for the fiscal period due to the timing of capital share transactions in relation to the fluctuating market values of the Fund’s underlying securities. |
| d | Not annualized. |
| e | Annualized for periods of less than one year. |
| f | Portfolio turnover rates exclude portfolio securities received or delivered in Creation Units but includes portfolio transactions that are executed as a result of the Fund processing capital share transactions in Creation Units partially for cash in U.S. dollars. Excluding such cash transactions, the portfolio turnover rates for the year ended August 31, 2017 and the period ended August 31, 2016 were 36% and 11%, respectively. |
| Premium/Discount Range | Number of Days | Percentage of Total Days | ||
| Greater than 2.0% and Less than 2.5% | 4 | 0.91% | ||
| Greater than 1.5% and Less than 2.0% | 2 | 0.45 | ||
| Greater than 1.0% and Less than 1.5% | 24 | 5.45 | ||
| Greater than 0.5% and Less than 1.0% | 114 | 25.91 | ||
| Greater than 0.0% and Less than 0.5% | 158 | 35.91 | ||
| At NAV | 2 | 0.45 | ||
| Less than 0.0% and Greater than -0.5% | 93 | 21.14 | ||
| Less than -0.5% and Greater than -1.0% | 34 | 7.73 | ||
| Less than -1.0% and Greater than -1.5% | 5 | 1.14 | ||
| Less than -1.5% and Greater than -2.0% | 3 | 0.68 | ||
| Less than -2.0% and Greater than -2.5% | 1 | 0.23 | ||
| 440 | 100.00% |
| Average Annual Total Returns | Cumulative Total Returns | ||||||
| NAV | MARKET | INDEX | NAV | MARKET | INDEX | ||
| 1 Year | 25.80% | 26.88% | 27.74% | 25.80% | 26.88% | 27.74% | |
| Since Inception* | 21.33% | 21.82% | 22.51% | 39.84% | 40.82% | 42.03% | |
| * | Total returns for the period since inception are calculated from the inception date of the Fund (12/08/15). The first day of secondary market trading in shares of the Fund was 12/10/15. |
| Call: | 1-800-iShares
or 1-800-474-2737 (toll free) Monday through Friday, 8:30 a.m. to 6:30 p.m. (Eastern time) |
| Email: | iSharesETFs@blackrock.com |
| Write: | c/o
BlackRock Investments, LLC 1 University Square Drive, Princeton, NJ 08540 |

| 2017 Prospectus |
|
| ► | iShares MSCI Chile ETF | ECH | CBOE BZX |
|
|
S-1 |
|
|
1 |
|
|
2 |
|
|
12 |
|
|
14 |
|
|
14 |
|
|
17 |
|
|
27 |
|
|
28 |
|
|
29 |
|
|
29 |
|
|
31 |
| Ticker: ECH | Stock Exchange: Cboe BZX |
| Annual
Fund Operating Expenses (ongoing expenses that you pay each year as a percentage of the value of your investments) | ||||||
| Management
Fees |
Distribution
and Service (12b-1) Fees |
Other
Expenses |
Total
Annual Fund Operating Expenses | |||
| 0.62% | None | None | 0.62% | |||
| 1 Year | 3 Years | 5 Years | 10 Years | |||
| $63 | $199 | $346 | $774 |

| 1 | The Fund’s year-to-date return as of September 30, 2017 was 31.93%. |
| One Year | Five Years | Since
Fund Inception | |||
| (Inception Date: 11/12/2007) | |||||
| Return Before Taxes | 17.79% | -6.93% | -1.44% | ||
| Return After Taxes on Distributions1 | 17.31% | -7.20% | -1.59% | ||
| Return After Taxes on Distributions and Sale of Fund Shares1 | 10.47% | -4.98% | -0.84% | ||
| MSCI Chile IMI 25/50 (Index returns do not reflect deductions for fees, expenses or taxes)2 | 17.98% | -6.59% | -0.91% |
| 1 | After-tax returns in the table above are calculated using the historical highest individual U.S. federal marginal income tax rates and do not reflect the impact of state or local taxes. Actual after-tax returns depend on an investor’s tax situation and may differ from those shown, and after-tax returns shown are not relevant to tax-exempt investors or investors who hold shares through tax-deferred arrangements, such as 401(k) plans or individual retirement accounts (“IRAs”). Fund returns after taxes on distributions and sales of Fund shares are calculated assuming that an investor has sufficient capital gains of the same character from other investments to offset any capital losses from the sale of Fund shares. As a result, Fund returns after taxes on distributions and sales of Fund shares may exceed Fund returns before taxes and/or returns after taxes on distributions. |
| 2 | Index returns through February 11, 2013 reflect the performance of the MSCI Chile IMI. Index returns beginning on February 12, 2013 reflect the performance of the MSCI Chile IMI 25/50, which, effective as of February 12, 2013, replaced the MSCI Chile IMI as the Underlying Index of the Fund. |
| ■ | Lower levels of liquidity and market efficiency; |
| ■ | Greater securities price volatility; |
| ■ | Exchange rate fluctuations and exchange controls; |
| ■ | Less availability of public information about issuers; |
| ■ | Limitations on foreign ownership of securities; |
| ■ | Imposition of withholding or other taxes; |
| ■ | Imposition of restrictions on the expatriation of the funds or other assets of the Fund; |
| ■ | Higher transaction and custody costs and delays in settlement procedures; |
| ■ | Difficulties in enforcing contractual obligations; |
| ■ | Lower levels of regulation of the securities markets; |
| ■ | Weaker accounting, disclosure and reporting requirements; and |
| ■ | Legal principles relating to corporate governance, directors’ fiduciary duties and liabilities and stockholders’ rights in markets in which the Fund invests may differ and/or may not be as extensive or protective as those that apply in the U.S. |
| Approximate
Value of a Creation Unit |
Creation
Unit Size |
Standard
Creation/ Redemption Transaction Fee |
Maximum
Additional Charge for Creations* |
Maximum
Additional Charge for Redemptions* | ||||
| $2,430,500 | 50,000 | $3,000 | 3.0% | 2.0% |
| * | As a percentage of the net asset value per Creation Unit, inclusive, in the case of redemptions, of the standard redemption transaction fee. |
(For a share outstanding throughout each period)
| Year
ended Aug. 31, 2017 |
Year
ended Aug. 31, 2016 |
Year
ended Aug. 31, 2015 |
Year
ended Aug. 31, 2014 |
Year
ended Aug. 31, 2013 | |||||||||
| Net asset value, beginning of year | $ 36.77 | $ 34.75 | $ 43.52 | $ 47.70 | $ 60.31 | ||||||||
| Income from investment operations: | |||||||||||||
| Net investment incomea | 0.69 | 0.78 | 0.66 | 0.69 | 0.68 | ||||||||
| Net realized and unrealized gain (loss)b | 11.21 | 2.03 | (8.81) | (4.18) | (12.58) | ||||||||
| Total from investment operations | 11.90 | 2.81 | (8.15) | (3.49) | (11.90) | ||||||||
| Less distributions from: | |||||||||||||
| Net investment income | (0.67) | (0.75) | (0.62) | (0.69) | (0.68) | ||||||||
| Return of capital | (0.04) | (0.04) | — | — | (0.03) | ||||||||
| Total distributions | (0.71) | (0.79) | (0.62) | (0.69) | (0.71) | ||||||||
| Net asset value, end of year | $ 47.96 | $ 36.77 | $ 34.75 | $ 43.52 | $ 47.70 | ||||||||
| Total return | 32.65% | 8.17% | (18.85)% | (7.40)% | (19.87)% | ||||||||
| Ratios/Supplemental data: | |||||||||||||
| Net assets, end of year (000s) | $467,645 | $327,244 | $234,536 | $352,499 | $364,890 | ||||||||
| Ratio of expenses to average net assets | 0.62% | 0.64% | 0.62% | 0.62% | 0.61% | ||||||||
| Ratio of net investment income to average net assets | 1.68% | 2.20% | 1.64% | 1.49% | 1.12% | ||||||||
| Portfolio turnover ratec | 54% | 73% | 71% | 91% | 34% | ||||||||
|
|
|||||||||||||
| a | Based on average shares outstanding throughout each period. |
| b | The amounts reported for a share outstanding may not accord with the change in aggregate gains and losses in securities for the fiscal period due to the timing of capital share transactions in relation to the fluctuating market values of the Fund’s underlying securities. |
| c | Portfolio turnover rates include portfolio transactions that are executed as a result of the Fund processing capital share transactions in Creation Units solely for cash in U.S. dollars. Excluding such cash transactions, the portfolio turnover rates for the years ended August 31, 2017, August 31, 2016, August 31, 2015, August 31, 2014 and August 31, 2013 were 8%, 11%, 10%, 11% and 16% respectively. |
| Premium/Discount Range | Number of Days | Percentage of Total Days | ||
| Greater than 1.5% and Less than 2.0% | 3 | 0.68% | ||
| Greater than 1.0% and Less than 1.5% | 6 | 1.36 | ||
| Greater than 0.5% and Less than 1.0% | 59 | 13.41 | ||
| Greater than 0.0% and Less than 0.5% | 171 | 38.87 | ||
| At NAV | 3 | 0.68 | ||
| Less than 0.0% and Greater than -0.5% | 146 | 33.18 | ||
| Less than -0.5% and Greater than -1.0% | 42 | 9.55 | ||
| Less than -1.0% and Greater than -1.5% | 7 | 1.59 | ||
| Less than -1.5% and Greater than -2.0% | 2 | 0.45 | ||
| Less than -2.0% | 1 | 0.23 | ||
| 440 | 100.00% |
| Average Annual Total Returns | Cumulative Total Returns | ||||||
| NAV | MARKET | INDEX** | NAV | MARKET | INDEX** | ||
| 1 Year | 32.65% | 33.96% | 32.78% | 32.65% | 33.96% | 32.78% | |
| 5 Years | (2.88)% | (2.76)% | (2.66)% | (13.60)% | (13.07)% | (12.61)% | |
| Since Inception* | 1.35% | 1.38% | 1.86% | 14.04% | 14.39% | 19.81% | |
| * | Total returns for the period since inception are calculated from the inception date of the Fund (11/12/07). The first day of secondary market trading in shares of the Fund was 11/16/07. |
| ** | Index performance reflects the performance of the MSCI Chile Investable Market Index through February 11, 2013 and the MSCI Chile IMI 25/50 thereafter. |
| Call: | 1-800-iShares
or 1-800-474-2737 (toll free) Monday through Friday, 8:30 a.m. to 6:30 p.m. (Eastern time) |
| Email: | iSharesETFs@blackrock.com |
| Write: | c/o
BlackRock Investments, LLC 1 University Square Drive, Princeton, NJ 08540 |

| 2017 Prospectus |
|
| ► | iShares MSCI Eurozone ETF | EZU | CBOE BZX |
|
|
S-1 |
|
|
1 |
|
|
2 |
|
|
13 |
|
|
16 |
|
|
16 |
|
|
19 |
|
|
29 |
|
|
29 |
|
|
31 |
|
|
31 |
|
|
33 |
| Ticker: EZU | Stock Exchange: Cboe BZX |
| Annual
Fund Operating Expenses (ongoing expenses that you pay each year as a percentage of the value of your investments) | ||||||
| Management
Fees |
Distribution
and Service (12b-1) Fees |
Other
Expenses1 |
Total
Annual Fund Operating Expenses | |||
| 0.49% | None | 0.00% | 0.49% | |||
| 1 | For the most recently completed fiscal year, the amount of Other Expenses rounded to 0.00%. |
| 1 Year | 3 Years | 5 Years | 10 Years | |||
| $50 | $157 | $274 | $616 |
| 1 | The Fund’s year-to-date return as of September 30, 2017 was 26.75%. |
| One Year | Five Years | Ten Years | |||
| (Inception Date: 7/25/2000) | |||||
| Return Before Taxes | 1.29% | 7.31% | -0.83% | ||
| Return After Taxes on Distributions1 | 0.90% | 7.05% | -0.95% | ||
| Return After Taxes on Distributions and Sale of Fund Shares1 | 1.66% | 6.15% | -0.10% | ||
| MSCI EMU Index (Index returns do not reflect deductions for fees, expenses, or taxes) | 1.34% | 7.41% | -0.74% |
| 1 | After-tax returns in the table above are calculated using the historical highest individual U.S. federal marginal income tax rates and do not reflect the impact of state or local taxes. Actual after-tax returns depend on an investor’s tax situation and may differ from those shown, and after-tax returns shown are not relevant to tax-exempt investors or investors who hold shares through tax-deferred arrangements, such as 401(k) plans or individual retirement accounts (“IRAs”). Fund returns after taxes on distributions and sales of Fund shares are calculated assuming that an investor has sufficient capital gains of the same character from other investments to offset any capital losses from the sale of Fund shares. As a result, Fund returns after taxes on distributions and sales of Fund shares may exceed Fund returns before taxes and/or returns after taxes on distributions. |
| ■ | Lower levels of liquidity and market efficiency; |
| ■ | Greater securities price volatility; |
| ■ | Exchange rate fluctuations and exchange controls; |
| ■ | Less availability of public information about issuers; |
| ■ | Limitations on foreign ownership of securities; |
| ■ | Imposition of withholding or other taxes; |
| ■ | Imposition of restrictions on the expatriation of the funds or other assets of the Fund; |
| ■ | Higher transaction and custody costs and delays in settlement procedures; |
| ■ | Difficulties in enforcing contractual obligations; |
| ■ | Lower levels of regulation of the securities markets; |
| ■ | Weaker accounting, disclosure and reporting requirements; and |
| ■ | Legal principles relating to corporate governance, directors’ fiduciary duties and liabilities and stockholders’ rights in markets in which the Fund invests may differ and/or may not be as extensive or protective as those that apply in the U.S. |
| Approximate
Value of a Creation Unit |
Creation
Unit Size |
Standard
Creation/ Redemption Transaction Fee |
Maximum
Additional Charge for Creations* |
Maximum
Additional Charge for Redemptions* | ||||
| $4,331,000 | 100,000 | $7,500 | 3.0% | 2.0% |
| * | As a percentage of the net asset value per Creation Unit, inclusive, in the case of redemptions, of the standard redemption transaction fee. |
(For a share outstanding throughout each period)
| Year
ended Aug. 31, 2017 |
Year
ended Aug. 31, 2016 |
Year
ended Aug. 31, 2015 |
Year
ended Aug. 31, 2014 |
Year
ended Aug. 31, 2013 | |||||
| Net asset value, beginning of year | $ 34.20 | $ 36.04 | $ 39.98 | $ 34.64 | $ 29.09 | ||||
| Income from investment operations: | |||||||||
| Net investment incomea | 0.99 | 0.92 b | 0.96 | 1.18 | 0.92 | ||||
| Net realized and unrealized gain (loss)c | 7.38 | (1.84) | (3.95) | 5.10 | 5.55 | ||||
| Total from investment operations | 8.37 | (0.92) | (2.99) | 6.28 | 6.47 | ||||
| Less distributions from: | |||||||||
| Net investment income | (0.86) | (0.92) | (0.95) | (0.94) | (0.92) | ||||
| Total distributions | (0.86) | (0.92) | (0.95) | (0.94) | (0.92) | ||||
| Net asset value, end of year | $ 41.71 | $ 34.20 | $ 36.04 | $ 39.98 | $ 34.64 | ||||
| Total return | 24.72% | (2.53)% b | (7.62)% | 18.02% | 22.43% | ||||
| Ratios/Supplemental data: | |||||||||
| Net assets, end of year (000s) | $13,286,216 | $8,293,591 | $10,134,616 | $8,702,637 | $3,539,980 | ||||
| Ratio of expenses to average net assets | 0.49% | 0.48% | 0.48% | 0.48% | 0.50% | ||||
| Ratio of expenses to average net assets excluding professional fees for foreign withholding tax claims | 0.49% | 0.48% | n/a | n/a | n/a | ||||
| Ratio of net investment income to average net assets | 2.63% | 2.69% b | 2.50% | 2.89% | 2.74% | ||||
| Portfolio turnover rated | 4% | 4% | 5% | 7% | 5% | ||||
|
|
| a | Based on average shares outstanding throughout each period. |
| b | Reflects the positive effect of foreign withholding tax claims, net of the associated professional fees, which resulted in the following increases for the year ended August 31, 2016: |
| ■ | Net investment income per share by $0.02. |
| ■ | Total return by 0.08%. |
| ■ | Ratio of net investment income to average net assets by 0.06%. |
| c | The amounts reported for a share outstanding may not accord with the change in aggregate gains and losses in securities for the fiscal period due to the timing of capital share transactions in relation to the fluctuating market values of the Fund’s underlying securities. |
| d | Portfolio turnover rates exclude portfolio securities received or delivered as a result of processing capital share transactions in Creation Units. |
| Premium/Discount Range | Number of Days | Percentage of Total Days | ||
| Greater than 2.0% and Less than 2.5% | 1 | 0.23% | ||
| Greater than 1.5% and Less than 2.0% | 1 | 0.23 | ||
| Greater than 1.0% and Less than 1.5% | 10 | 2.27 | ||
| Greater than 0.5% and Less than 1.0% | 33 | 7.50 | ||
| Greater than 0.0% and Less than 0.5% | 209 | 47.49 | ||
| At NAV | 7 | 1.59 | ||
| Less than 0.0% and Greater than -0.5% | 155 | 35.23 | ||
| Less than -0.5% and Greater than -1.0% | 19 | 4.32 | ||
| Less than -1.0% and Greater than -1.5% | 4 | 0.91 | ||
| Less than -1.5% and Greater than -2.0% | 1 | 0.23 | ||
| 440 | 100.00% |
| Average Annual Total Returns | Cumulative Total Returns | ||||||
| NAV | MARKET | INDEX | NAV | MARKET | INDEX | ||
| 1 Year | 24.72% | 24.95% | 24.91% | 24.72% | 24.95% | 24.91% | |
| 5 Years | 10.16% | 10.28% | 10.29% | 62.26% | 63.08% | 63.22% | |
| 10 Years | 0.12% | 0.15% | 0.23% | 1.25% | 1.51% | 2.32% | |
| Call: | 1-800-iShares
or 1-800-474-2737 (toll free) Monday through Friday, 8:30 a.m. to 6:30 p.m. (Eastern time) |
| Email: | iSharesETFs@blackrock.com |
| Write: | c/o
BlackRock Investments, LLC 1 University Square Drive, Princeton, NJ 08540 |

| 2017 Prospectus |
|
| ► | iShares MSCI Global Metals & Mining Producers ETF | PICK | CBOE BZX |
|
|
S-1 |
|
|
1 |
|
|
2 |
|
|
15 |
|
|
16 |
|
|
16 |
|
|
19 |
|
|
29 |
|
|
29 |
|
|
31 |
|
|
31 |
|
|
33 |
| Ticker: PICK | Stock Exchange: Cboe BZX |
| Annual
Fund Operating Expenses (ongoing expenses that you pay each year as a percentage of the value of your investments) | ||||||||||||
| Management
Fees |
Distribution
and Service (12b-1) Fees |
Other
Expenses |
Acquired
Fund Fees and Expenses |
Total
Annual Fund Operating Expenses |
Fee Waiver | Total
Annual Fund Operating Expenses After Fee Waiver | ||||||
| 0.39% | None | None | 0.00% | 0.39% | (0.00)% | 0.39% | ||||||
| 1 Year | 3 Years | 5 Years | 10 Years | |||
| $40 | $125 | $219 | $493 |
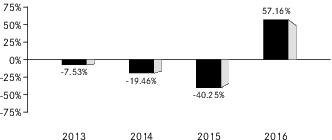
| 1 | The Fund’s year-to-date return as of September 30, 2017 was 20.51%. |
| One Year | Since
Fund Inception | ||
| (Inception Date: 1/31/2012) | |||
| Return Before Taxes | 57.16% | -8.75% | |
| Return After Taxes on Distributions1 | 56.79% | -9.55% | |
| Return After Taxes on Distributions and Sale of Fund Shares1 | 32.76% | -6.31% | |
| MSCI ACWI Select Metals & Mining Producers ex Gold & Silver IMI (Index returns do not reflect deductions for fees, expenses or taxes) | 57.49% | -8.72% |
| 1 | After-tax returns in the table above are calculated using the historical highest individual U.S. federal marginal income tax rates and do not reflect the impact of state or local taxes. Actual after-tax returns depend on an investor’s tax situation and may differ from those shown, and after-tax returns shown are not relevant to tax-exempt investors or investors who hold shares through tax-deferred arrangements, such as 401(k) plans or individual retirement accounts (“IRAs”). Fund returns after taxes on distributions and sales of Fund shares are calculated assuming that an investor has sufficient capital gains of the same character from other investments to offset any capital losses from the sale of Fund shares. As a result, Fund returns after taxes on distributions and sales of Fund shares may exceed Fund returns before taxes and/or returns after taxes on distributions. |
| ■ | Lower levels of liquidity and market efficiency; |
| ■ | Greater securities price volatility; |
| ■ | Exchange rate fluctuations and exchange controls; |
| ■ | Less availability of public information about issuers; |
| ■ | Limitations on foreign ownership of securities; |
| ■ | Imposition of withholding or other taxes; |
| ■ | Imposition of restrictions on the expatriation of the funds or other assets of the Fund; |
| ■ | Higher transaction and custody costs and delays in settlement procedures; |
| ■ | Difficulties in enforcing contractual obligations; |
| ■ | Lower levels of regulation of the securities markets; |
| ■ | Weaker accounting, disclosure and reporting requirements; and |
| ■ | Legal principles relating to corporate governance, directors’ fiduciary duties and liabilities and stockholders’ rights in markets in which the Fund invests may differ and/or may not be as extensive or protective as those that apply in the U.S. |
| ■ | The risk of delays in settling portfolio transactions and the risk of loss arising out of the system of share registration and custody used in Russia; |
| ■ | Risks in connection with the maintenance of the Fund’s portfolio securities and cash with foreign sub-custodians and securities depositories, including the risk that appropriate sub-custody arrangements will not be available to the Fund; |
| ■ | The risk that the Fund’s ownership rights in portfolio securities could be lost through fraud or negligence because ownership in shares of Russian companies is recorded by the companies themselves and by registrars, rather than by a central registration system; and |
| ■ | The risk that the Fund may not be able to pursue claims on behalf of its shareholders because of the system of share registration and custody, and because Russian banking institutions and registrars are not guaranteed by the Russian government. |
| Approximate
Value of a Creation Unit |
Creation
Unit Size |
Standard
Creation/ Redemption Transaction Fee |
Maximum
Additional Charge for Creations* |
Maximum
Additional Charge for Redemptions* | ||||
| $1,544,500 | 50,000 | $8,400 | 7.0% | 2.0% |
| * | As a percentage of the net asset value per Creation Unit, inclusive, in the case of redemptions, of the standard redemption transaction fee. |
(For a share outstanding throughout each period)
| Year
ended Aug. 31, 2017a |
Year
ended Aug. 31, 2016a |
Year
ended Aug. 31, 2015a |
Year
ended Aug. 31, 2014a |
Year
ended Aug. 31, 2013a | |||||
| Net asset value, beginning of year | $ 21.67 | $ 21.30 | $ 40.37 | $ 36.23 | $ 38.01 | ||||
| Income from investment operations: | |||||||||
| Net investment incomeb | 0.53 | 0.42 | 1.62 | 1.00 | 1.00 | ||||
| Net realized and unrealized gain (loss)c | 10.26 | 0.41 | (17.91) | 4.44 | (2.01) | ||||
| Total from investment operations | 10.79 | 0.83 | (16.29) | 5.44 | (1.01) | ||||
| Less distributions from: | |||||||||
| Net investment income | (0.60) | (0.46) | (2.78) | (1.30) | (0.77) | ||||
| Total distributions | (0.60) | (0.46) | (2.78) | (1.30) | (0.77) | ||||
| Net asset value, end of year | $ 31.86 | $ 21.67 | $ 21.30 | $ 40.37 | $ 36.23 | ||||
| Total return | 50.55% | 4.52% | (41.94)% | 15.32% | (2.68)% | ||||
| Ratios/Supplemental data: | |||||||||
| Net assets, end of year (000s) | $347,259 | $223,182 | $69,219 | $183,699 | $222,808 | ||||
| Ratio of expenses to average net assets | 0.39% | 0.39% | 0.39% | 0.39% | 0.39% | ||||
| Ratio of expenses to average net assets prior to waived fees | 0.39% | 0.39% | 0.39% | 0.39% | 0.39% | ||||
| Ratio of net investment income to average net assets | 2.31% | 2.16% | 5.18% | 2.53% | 2.51% | ||||
| Portfolio turnover rated | 12% | 8% | 17% | 18% | 11% | ||||
|
|
|||||||||
| a | Per share amounts reflect a one-for-two reverse stock split effective after the close of trading on November 4, 2016. |
| b | Based on average shares outstanding throughout each period. |
| c | The amounts reported for a share outstanding may not accord with the change in aggregate gains and losses in securities for the fiscal period due to the timing of capital share transactions in relation to the fluctuating market values of the Fund’s underlying securities. |
| d | Portfolio turnover rates exclude portfolio securities received or delivered in Creation Units but include portfolio transactions that are executed as a result of the Fund processing capital share transactions in Creation Units partially for cash in U.S. dollars. Excluding such cash transactions, the portfolio turnover rates for the years ended August 31, 2017, August 31, 2016, August 31, 2015, August 31, 2014 and August 31, 2013 were 6%, 6%, 10%, 15%, and 7% respectively. |
| Premium/Discount Range | Number of Days | Percentage of Total Days | ||
| Greater than 2.5% and Less than 3.0% | 1 | 0.23% | ||
| Greater than 2.0% and Less than 2.5% | 1 | 0.23 | ||
| Greater than 1.5% and Less than 2.0% | 12 | 2.73 | ||
| Greater than 1.0% and Less than 1.5% | 31 | 7.05 | ||
| Greater than 0.5% and Less than 1.0% | 74 | 16.82 | ||
| Greater than 0.0% and Less than 0.5% | 162 | 36.81 | ||
| At NAV | 3 | 0.68 | ||
| Less than 0.0% and Greater than -0.5% | 108 | 24.55 | ||
| Less than -0.5% and Greater than -1.0% | 32 | 7.27 | ||
| Less than -1.0% and Greater than -1.5% | 10 | 2.27 | ||
| Less than -1.5% and Greater than -2.0% | 3 | 0.68 | ||
| Less than -2.0% | 3 | 0.68 | ||
| 440 | 100.00% |
| Average Annual Total Returns | Cumulative Total Returns | ||||||
| NAV | MARKET | INDEX | NAV | MARKET | INDEX | ||
| 1 Year | 50.55% | 52.07% | 50.24% | 50.55% | 52.07% | 50.24% | |
| 5 Years | 0.50% | 0.36% | 0.57% | 2.53% | 1.80% | 2.86% | |
| Since Inception* | (4.09)% | (4.02)% | (4.07)% | (20.81)% | (20.46)% | (20.71)% | |
| * | Total returns for the period since inception are calculated from the inception date of the Fund (1/31/12). The first day of secondary market trading in shares of the Fund was 2/2/12. |
| Call: | 1-800-iShares
or 1-800-474-2737 (toll free) Monday through Friday, 8:30 a.m. to 6:30 p.m. (Eastern time) |
| Email: | iSharesETFs@blackrock.com |
| Write: | c/o
BlackRock Investments, LLC 1 University Square Drive, Princeton, NJ 08540 |

| 2017 Prospectus |
|
| ► | iShares MSCI Global Silver Miners ETF | SLVP | CBOE BZX |
|
|
S-1 |
|
|
1 |
|
|
2 |
|
|
13 |
|
|
15 |
|
|
15 |
|
|
18 |
|
|
27 |
|
|
28 |
|
|
29 |
|
|
29 |
|
|
31 |
MINERS ETF
| Ticker: SLVP | Stock Exchange: Cboe BZX |
| Annual
Fund Operating Expenses (ongoing expenses that you pay each year as a percentage of the value of your investments) | ||||||
| Management
Fees |
Distribution
and Service (12b-1) Fees |
Other
Expenses |
Total
Annual Fund Operating Expenses | |||
| 0.39% | None | None | 0.39% | |||
| 1 Year | 3 Years | 5 Years | 10 Years | |||
| $40 | $125 | $219 | $493 |
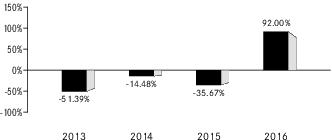
| 1 | The Fund’s year-to-date return as of September 30, 2017 was 3.26%. |
| One Year | Since
Fund Inception | ||
| (Inception Date: 1/31/2012) | |||
| Return Before Taxes | 92.00% | -14.56% | |
| Return After Taxes on Distributions2 | 90.19% | -14.99% | |
| Return After Taxes on Distributions and Sale of Fund Shares2 | 52.20% | -10.24% | |
| MSCI ACWI Select Silver Miners IMI (Index returns do not reflect deductions for fees, expenses or taxes) | 91.82% | -14.54% |
| 2 | After-tax returns in the table above are calculated using the historical highest individual U.S. federal marginal income tax rates and do not reflect the impact of state or local taxes. Actual after-tax returns depend on an investor’s tax situation and may differ from those shown, and after-tax returns shown are not relevant to tax-exempt investors or investors who hold shares through tax-deferred arrangements, such as 401(k) plans or individual retirement accounts (“IRAs”). Fund returns after taxes on distributions and sales of Fund shares are calculated assuming that an investor has sufficient capital gains of the same character from other investments to offset any capital losses from the sale of Fund shares. As a result, Fund returns after taxes on distributions and sales of Fund shares may exceed Fund returns before taxes and/or returns after taxes on distributions. |
| ■ | Lower levels of liquidity and market efficiency; |
| ■ | Greater securities price volatility; |
| ■ | Exchange rate fluctuations and exchange controls; |
| ■ | Less availability of public information about issuers; |
| ■ | Limitations on foreign ownership of securities; |
| ■ | Imposition of withholding or other taxes; |
| ■ | Imposition of restrictions on the expatriation of the funds or other assets of the Fund; |
| ■ | Higher transaction and custody costs and delays in settlement procedures; |
| ■ | Difficulties in enforcing contractual obligations; |
| ■ | Lower levels of regulation of the securities markets; |
| ■ | Weaker accounting, disclosure and reporting requirements; and |
| ■ | Legal principles relating to corporate governance, directors’ fiduciary duties and liabilities and stockholders’ rights in markets in which the Fund invests may differ and/or may not be as extensive or protective as those that apply in the U.S. |
| Approximate
Value of a Creation Unit |
Creation
Unit Size |
Standard
Creation/ Redemption Transaction Fee |
Maximum
Additional Charge for Creations* |
Maximum
Additional Charge for Redemptions* | ||||
| $1,081,000 | 100,000 | $500 | 7.0% | 2.0% |
| * | As a percentage of the net asset value per Creation Unit, inclusive, in the case of redemptions, of the standard redemption transaction fee. |
(For a share outstanding throughout each period)
| Year
ended Aug. 31, 2017 |
Year
ended Aug. 31, 2016 |
Year
ended Aug. 31, 2015 |
Year
ended Aug. 31, 2014 |
Year
ended Aug. 31, 2013 | |||||
| Net asset value, beginning of year | $ 13.61 | $ 6.14 | $ 12.70 | $ 13.92 | $ 20.94 | ||||
| Income from investment operations: | |||||||||
| Net investment incomea | 0.09 | 0.05 | 0.05 | 0.08 | 0.16 | ||||
| Net realized and unrealized gain (loss)b | (1.94) | 7.44 | (6.42) | (1.15) | (6.90) | ||||
| Total from investment operations | (1.85) | 7.49 | (6.37) | (1.07) | (6.74) | ||||
| Less distributions from: | |||||||||
| Net investment income | (0.29) | (0.02) | (0.19) | (0.15) | (0.28) | ||||
| Total distributions | (0.29) | (0.02) | (0.19) | (0.15) | (0.28) | ||||
| Net asset value, end of year | $ 11.47 | $ 13.61 | $ 6.14 | $ 12.70 | $ 13.92 | ||||
| Total return | (13.26)% | 122.11% | (50.51)% | (7.48)% | (32.49)% | ||||
| Ratios/Supplemental data: | |||||||||
| Net assets, end of year (000s) | $64,258 | $87,078 | $12,279 | $13,975 | $ 6,959 | ||||
| Ratio of expenses to average net assets | 0.39% | 0.39% | 0.39% | 0.39% | 0.39% | ||||
| Ratio of net investment income to average net assets | 0.79% | 0.47% | 0.57% | 0.63% | 1.03% | ||||
| Portfolio turnover ratec | 14% | 27% | 31% | 22% | 13% | ||||
|
|
|||||||||
| a | Based on average shares outstanding throughout each period. |
| b | The amounts reported for a share outstanding may not accord with the change in aggregate gains and losses in securities for the fiscal period due to the timing of capital share transactions in relation to the fluctuating market values of the Fund’s underlying securities. |
| c | Portfolio turnover rates exclude portfolio securities received or delivered as a result of processing capital share transactions in Creation Units. |
| Premium/Discount Range | Number of Days | Percentage of Total Days | ||
| Greater than 2.5% | 2 | 0.45% | ||
| Greater than 2.0% and Less than 2.5% | 3 | 0.68 | ||
| Greater than 1.5% and Less than 2.0% | 4 | 0.91 | ||
| Greater than 1.0% and Less than 1.5% | 17 | 3.86 | ||
| Greater than 0.5% and Less than 1.0% | 46 | 10.45 | ||
| Greater than 0.0% and Less than 0.5% | 171 | 38.87 | ||
| At NAV | 3 | 0.68 | ||
| Less than 0.0% and Greater than -0.5% | 173 | 39.33 | ||
| Less than -0.5% and Greater than -1.0% | 16 | 3.64 | ||
| Less than -1.0% and Greater than -1.5% | 3 | 0.68 | ||
| Less than -1.5% and Greater than -2.0% | 2 | 0.45 | ||
| 440 | 100.00% |
| Average Annual Total Returns | Cumulative Total Returns | ||||||
| NAV | MARKET | INDEX | NAV | MARKET | INDEX | ||
| 1 Year | (13.26)% | (12.47)% | (13.44)% | (13.26)% | (12.47)% | (13.44)% | |
| 5 Years | (9.85)% | (9.42)% | (9.86)% | (40.45)% | (39.03)% | (40.48)% | |
| Since Inception* | (11.51)% | (11.41)% | (11.49)% | (49.49)% | (49.19)% | (49.41)% | |
| * | Total returns for the period since inception are calculated from the inception date of the Fund (1/31/12). The first day of secondary market trading in shares of the Fund was 2/2/12. |
| Call: | 1-800-iShares
or 1-800-474-2737 (toll free) Monday through Friday, 8:30 a.m. to 6:30 p.m. (Eastern time) |
| Email: | iSharesETFs@blackrock.com |
| Write: | c/o
BlackRock Investments, LLC 1 University Square Drive, Princeton, NJ 08540 |

| 2018 Prospectus |
|
| ► | iShares Emerging Markets High Yield Bond ETF | EMHY | CBOE BZX |
|
|
S-1 |
|
|
1 |
|
|
2 |
|
|
17 |
|
|
20 |
|
|
21 |
|
|
23 |
|
|
32 |
|
|
33 |
|
|
34 |
|
|
34 |
|
|
36 |
| Ticker: EMHY | Stock Exchange: Cboe BZX |
| Annual
Fund Operating Expenses (ongoing expenses that you pay each year as a percentage of the value of your investments) | ||||||
| Management
Fees |
Distribution
and Service (12b-1) Fees |
Other
Expenses |
Total
Annual Fund Operating Expenses | |||
| 0.50% | None | None | 0.50% | |||
| 1 Year | 3 Years | 5 Years | 10 Years | |||
| $51 | $160 | $280 | $628 |
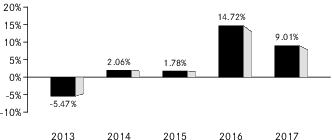
| One Year | Five Years | Since
Fund Inception | |||
| (Inception Date: 4/3/2012) | |||||
| Return Before Taxes | 9.01% | 4.19% | 6.09% | ||
| Return After Taxes on Distributions1 | 6.41% | 1.47% | 3.44% | ||
| Return After Taxes on Distributions and Sale of Fund Shares1 | 5.07% | 1.88% | 3.45% | ||
| Morningstar ® Emerging Markets High Yield Bond IndexSM (Index returns do not reflect deductions for fees, expenses, or taxes) | 9.34% | 4.48% | 6.44% |
| 1 | After-tax returns in the table above are calculated using the historical highest individual U.S. federal marginal income tax rates and do not reflect the impact of state or local taxes. Actual after-tax returns depend on an investor’s tax situation and may differ from those shown, and after-tax returns shown are not relevant to tax-exempt investors or investors who hold shares through tax-deferred arrangements, such as 401(k) plans or individual retirement accounts (“IRAs”). Fund returns after taxes on distributions and sales of Fund shares are calculated assuming that an investor has sufficient capital gains of the same character from other investments to offset any capital losses from the sale of Fund shares. As a result, Fund returns after taxes on distributions and sales of Fund shares may exceed Fund returns before taxes and/or returns after taxes on distributions. |
| ■ | High yield securities may be issued by less creditworthy issuers. Issuers of high yield securities may have a larger amount of outstanding debt relative to their assets than issuers of investment-grade bonds. In the event of an issuer’s bankruptcy, claims of other creditors may have priority over the claims of high yield securities holders, leaving few or no assets available to repay high yield securities holders. |
| ■ | Prices of high yield securities are subject to extreme price fluctuations. Adverse changes in an issuer’s industry and general economic conditions may have a greater impact on the prices of high yield securities than on other higher rated fixed-income securities. The credit rating of a high yield security does not necessarily address its market value risk. Ratings and market value may change from time to time, positively or negatively, to reflect new developments regarding the issuer. |
| ■ | Issuers of high yield securities may be unable to meet their interest or principal payment obligations because of an economic downturn, specific issuer developments, or the unavailability of additional financing. |
| ■ | High yield securities frequently have redemption features that permit an issuer to repurchase the security from the Fund before it matures. If the issuer redeems high yield securities held by the Fund, the Fund may have to invest the proceeds in bonds with lower yields and may lose income. |
| ■ | High yield securities may be less liquid than higher rated fixed-income securities, even under normal economic conditions. There are fewer dealers in the high yield securities market, and there may be significant differences in the prices quoted for high yield securities by the dealers. Because high yield securities are less liquid, judgment may play a greater role in valuing certain of the Fund’s securities than is the case with securities trading in a more liquid market. |
| ■ | The Fund may incur expenses to the extent necessary to seek recovery upon default or to negotiate new terms with a defaulting issuer. |
| ■ | The risk of delays in settling portfolio transactions and the risk of loss arising out of the system of share registration and custody used in Russia; |
| ■ | Risks in connection with the maintenance of the Fund’s portfolio securities and cash with foreign sub-custodians and securities depositories, including the risk that appropriate sub-custody arrangements will not be available to the Fund; |
| ■ | The risk that the Fund’s ownership rights in portfolio securities could be lost through fraud or negligence because ownership in shares of Russian companies is recorded by the companies themselves and by registrars, rather than by a central registration system; and |
| ■ | The risk that the Fund may not be able to pursue claims on behalf of its shareholders because of the system of share registration and custody, and because Russian banking institutions and registrars are not guaranteed by the Russian government. |
| ■ | The risk of delays in settling portfolio transactions and the risk of loss arising out of the system of share registration and custody used in certain Eastern European countries; |
| ■ | Risks in connection with the maintenance of the Fund's portfolio securities and cash with foreign sub-custodians and securities depositories, including the risk that appropriate sub-custody arrangements will not be available to the Fund; |
| ■ | The risk that the Fund's ownership rights in portfolio securities could be lost through fraud or negligence as a result of the fact that ownership in shares of certain Eastern European companies is recorded by the companies themselves and by registrars, rather than a central registration system; |
| ■ | The risk that the Fund may not be able to pursue claims on behalf of its shareholders because of the system of share registration and custody, and because certain Eastern European banking institutions and registrars are not guaranteed by their respective governments; and |
| ■ | Risks in connection with Eastern European countries' dependence on the economic health of Western European countries and the EU as a whole. |
| Approximate
Value of a Creation Unit |
Creation
Unit Size |
Standard
Creation/ Redemption Transaction Fee |
Maximum
Additional Charge for Creations* |
Maximum
Additional Charge for Redemptions* | ||||
| $2,494,000 | 50,000 | $100 | 3.0% | 2.0% |
| * | As a percentage of the net asset value per Creation Unit, inclusive, in the case of redemptions, of the standard redemption transaction fee. |
(For a share outstanding throughout each period)
| Year
ended Oct. 31, 2017 |
Year
ended Oct. 31, 2016 |
Year
ended Oct. 31, 2015 |
Year
ended Oct. 31, 2014 |
Year
ended Oct. 31, 2013 | |||||
| Net asset value, beginning of year | $ 49.97 | $ 46.82 | $ 51.03 | $ 50.90 | $ 53.62 | ||||
| Income from investment operations: | |||||||||
| Net investment incomea | 2.87 | 3.03 | 2.99 | 2.93 | 2.97 | ||||
| Net realized and unrealized gain (loss)b | 0.77 | 3.25 | (4.11) | 0.15 | (2.91) | ||||
| Total from investment operations | 3.64 | 6.28 | (1.12) | 3.08 | 0.06 | ||||
| Less distributions from: | |||||||||
| Net investment income | (3.01) | (3.13) | (3.09) | (2.95) | (2.78) | ||||
| Total distributions | (3.01) | (3.13) | (3.09) | (2.95) | (2.78) | ||||
| Net asset value, end of year | $ 50.60 | $ 49.97 | $ 46.82 | $ 51.03 | $ 50.90 | ||||
| Total return | 7.60% | 14.02% | (2.13)% | 6.24% | 0.14% | ||||
| Ratios/Supplemental data: | |||||||||
| Net assets, end of year (000s) | $624,867 | $107,431 | $159,199 | $199,005 | $203,604 | ||||
| Ratio of expenses to average net assets | 0.50% | 0.50% | 0.55% | 0.65% | 0.65% | ||||
| Ratio of net investment income to average net assets | 5.73% | 6.35% | 6.29% | 5.78% | 5.64% | ||||
| Portfolio turnover ratec | 25% | 29% | 39% | 24% | 57% |
| a | Based on average shares outstanding throughout each period. |
| b | The amounts reported for a share outstanding may not accord with the change in aggregate gains and losses in securities for the fiscal period due to the timing of capital share transactions in relation to the fluctuating market values of the Fund’s underlying securities. |
| c | Portfolio turnover rates exclude portfolio securities received or delivered as a result of processing capital share transactions in Creation Units. |
| Premium/Discount Range | Number of Days | Percentage of Total Days | ||
| Greater than 0.5% and Less than 1.0% | 37 | 14.74% | ||
| Greater than 0.0% and Less than 0.5% | 213 | 84.86 | ||
| At NAV | 0 | 0.00 | ||
| Less than 0.0% and Greater than -0.5% | 1 | 0.40 | ||
| 251 | 100.00% |
| Average Annual Total Returns | Cumulative Total Returns | ||||||
| NAV | MARKET | INDEX | NAV | MARKET | INDEX | ||
| 1 Year | 7.60% | 7.79% | 8.04% | 7.60% | 7.79% | 8.04% | |
| 5 Years | 5.02% | 4.78% | 5.33% | 27.74% | 26.31% | 29.63% | |
| Since Inception* | 6.32% | 6.37% | 6.69% | 40.77% | 41.16% | 43.47% | |
| * | Total returns for the period since inception are calculated from the inception date of the Fund (4/3/12). The first day of secondary market trading in shares of the Fund was 4/3/12. |
| Call: | 1-800-iShares
or 1-800-474-2737 (toll free) Monday through Friday, 8:30 a.m. to 6:30 p.m. (Eastern time) |
| Email: | iSharesETFs@blackrock.com |
| Write: | c/o
BlackRock Investments, LLC 1 University Square Drive, Princeton, NJ 08540 |

| 2018 Prospectus |
|
| ► | iShares International High Yield Bond ETF | HYXU | CBOE BZX |
|
|
S-1 |
|
|
1 |
|
|
2 |
|
|
14 |
|
|
15 |
|
|
15 |
|
|
18 |
|
|
27 |
|
|
27 |
|
|
29 |
|
|
29 |
|
|
31 |
| Ticker: HYXU | Stock Exchange: Cboe BZX |
| Annual
Fund Operating Expenses (ongoing expenses that you pay each year as a percentage of the value of your investments) | ||||||
| Management
Fees |
Distribution
and Service (12b-1) Fees |
Other
Expenses |
Total
Annual Fund Operating Expenses | |||
| 0.40% | None | None | 0.40% | |||
| 1 Year | 3 Years | 5 Years | 10 Years | |||
| $41 | $128 | $224 | $505 |
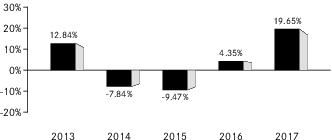
| One Year | Five Years | Since
Fund Inception | |||
| (Inception Date: 4/3/2012) | |||||
| Return Before Taxes | 19.65% | 3.29% | 4.87% | ||
| Return After Taxes on Distributions1 | 19.37% | 2.33% | 3.75% | ||
| Return After Taxes on Distributions and Sale of Fund Shares1 | 11.11% | 2.07% | 3.27% | ||
| Markit iBoxx Global Developed Markets ex-US High Yield Index (Index returns do not reflect deductions for fees, expenses, or taxes) | 20.05% | 3.41% | 4.99% |
| 1 | After-tax returns in the table above are calculated using the historical highest individual U.S. federal marginal income tax rates and do not reflect the impact of state or local taxes. Actual after-tax returns depend on an investor’s tax situation and may differ from those shown, and after-tax returns shown are not relevant to tax-exempt investors or investors who hold shares through tax-deferred arrangements, such as 401(k) plans or individual retirement accounts (“IRAs”). Fund returns after taxes on distributions and sales of Fund shares are calculated assuming that an investor has sufficient capital gains of the same character from other investments to offset any capital losses from the sale of Fund shares. As a result, Fund returns after taxes on distributions and sales of Fund shares may exceed Fund returns before taxes and/or returns after taxes on distributions. |
| ■ | High yield securities may be issued by less creditworthy issuers. Issuers of high yield securities may have a larger amount of outstanding debt relative to their assets than issuers of investment-grade bonds. In the event of an issuer’s bankruptcy, claims of other creditors may have priority over the claims of high yield securities holders, leaving few or no assets available to repay high yield securities holders. |
| ■ | Prices of high yield securities are subject to extreme price fluctuations. Adverse changes in an issuer’s industry and general economic conditions may have a greater impact on the prices of high yield securities than on other higher rated fixed-income securities. The credit rating of a high yield security does not necessarily address its market value risk. Ratings and market value may change from time to time, positively or negatively, to reflect new developments regarding the issuer. |
| ■ | Issuers of high yield securities may be unable to meet their interest or principal payment obligations because of an economic downturn, specific issuer developments, or the unavailability of additional financing. |
| ■ | High yield securities frequently have redemption features that permit an issuer to repurchase the security from the Fund before it matures. If the issuer redeems high yield securities held by the Fund, the Fund may have to invest the proceeds in bonds with lower yields and may lose income. |
| ■ | High yield securities may be less liquid than higher rated fixed-income securities, even under normal economic conditions. There are fewer dealers in the high yield securities market, and there may be significant differences in the prices quoted for high yield securities by the dealers. Because high yield securities are less liquid, |
| judgment may play a greater role in valuing certain of the Fund’s securities than is the case with securities trading in a more liquid market. | |
| ■ | The Fund may incur expenses to the extent necessary to seek recovery upon default or to negotiate new terms with a defaulting issuer. |
| Approximate
Value of a Creation Unit |
Creation
Unit Size |
Standard
Creation/ Redemption Transaction Fee |
Maximum
Additional Charge for Creations* |
Maximum
Additional Charge for Redemptions* | ||||
| $5,403,000 | 100,000 | $1,900 | 3.0% | 2.0% |
| * | As a percentage of the net asset value per Creation Unit, inclusive, in the case of redemptions, of the standard redemption transaction fee. |
(For a share outstanding throughout each period)
| Year
ended Oct. 31, 2017 |
Year
ended Oct. 31, 2016 |
Year
ended Oct. 31, 2015 |
Year
ended Oct. 31, 2014 |
Year
ended Oct. 31, 2013 | |||||
| Net asset value, beginning of year | $ 46.91 | $ 46.44 | $ 52.90 | $ 56.84 | $ 52.01 | ||||
| Income from investment operations: | |||||||||
| Net investment incomea | 1.77 | 1.82 | 1.84 | 2.43 | 3.15 | ||||
| Net realized and unrealized gain (loss)b | 4.85 | (0.47) | (6.57) | (3.55) | 4.51 | ||||
| Total from investment operations | 6.62 | 1.35 | (4.73) | (1.12) | 7.66 | ||||
| Less distributions from: | |||||||||
| Net investment income | (0.40) | (0.26) | (0.05) | (2.82) | (2.83) | ||||
| Net realized gain | — | — | (0.02) | — | — | ||||
| Return of capital | (0.09) | (0.62) | (1.66) | — | — | ||||
| Total distributions | (0.49) | (0.88) | (1.73) | (2.82) | (2.83) | ||||
| Net asset value, end of year | $ 53.04 | $ 46.91 | $ 46.44 | $ 52.90 | $ 56.84 | ||||
| Total return | 14.21% | 2.95% | (9.02)% | (2.20)% | 15.20% | ||||
| Ratios/Supplemental data: | |||||||||
| Net assets, end of year (000s) | $90,160 | $154,796 | $185,756 | $142,827 | $51,153 | ||||
| Ratio of expenses to average net assets | 0.40% | 0.40% | 0.40% | 0.40% | 0.40% | ||||
| Ratio of expenses to average net assets prior to waived fees | n/a | 0.51% | 0.55% | 0.55% | 0.55% | ||||
| Ratio of net investment income to average net assets | 3.62% | 3.93% | 3.85% | 4.25% | 5.85% | ||||
| Portfolio turnover ratec | 49% | 24% | 28% | 25% | 33% |
| a | Based on average shares outstanding throughout each period. |
| b | The amounts reported for a share outstanding may not accord with the change in aggregate gains and losses in securities for the fiscal period due to the timing of capital share transactions in relation to the fluctuating market values of the Fund’s underlying securities. |
| c | Portfolio turnover rates exclude portfolio securities received or delivered as a result of processing capital share transactions in Creation Units. |
| Premium/Discount Range | Number of Days | Percentage of Total Days | ||
| Greater than 1.0% and Less than 1.5% | 3 | 1.20% | ||
| Greater than 0.5% and Less than 1.0% | 57 | 22.71 | ||
| Greater than 0.0% and Less than 0.5% | 175 | 69.72 | ||
| At NAV | 0 | 0.00 | ||
| Less than 0.0% and Greater than -0.5% | 16 | 6.37 | ||
| 251 | 100.00% |
| Average Annual Total Returns | Cumulative Total Returns | ||||||
| NAV | MARKET | INDEX | NAV | MARKET | INDEX | ||
| 1 Year | 14.21% | 14.33% | 14.56% | 14.21% | 14.33% | 14.56% | |
| 5 Years | 3.80% | 3.80% | 3.93% | 20.52% | 20.52% | 21.28% | |
| Since Inception* | 4.57% | 4.62% | 4.69% | 28.35% | 28.65% | 29.08% | |
| * | Total returns for the period since inception are calculated from the inception date of the Fund (4/3/12). The first day of secondary market trading in shares of the Fund was 4/3/12. |
| Call: | 1-800-iShares
or 1-800-474-2737 (toll free) Monday through Friday, 8:30 a.m. to 6:30 p.m. (Eastern time) |
| Email: | iSharesETFs@blackrock.com |
| Write: | c/o
BlackRock Investments, LLC 1 University Square Drive, Princeton, NJ 08540 |

| 2018 Prospectus |
|
| ► | iShares J.P. Morgan EM Corporate Bond ETF | CEMB | CBOE BZX |
|
|
S-1 |
|
|
1 |
|
|
2 |
|
|
18 |
|
|
23 |
|
|
24 |
|
|
26 |
|
|
35 |
|
|
36 |
|
|
37 |
|
|
37 |
|
|
39 |
| Ticker: CEMB | Stock Exchange: Cboe BZX |
| Annual
Fund Operating Expenses (ongoing expenses that you pay each year as a percentage of the value of your investments) | ||||||
| Management
Fees |
Distribution
and Service (12b-1) Fees |
Other
Expenses |
Total
Annual Fund Operating Expenses | |||
| 0.50% | None | None | 0.50% | |||
| 1 Year | 3 Years | 5 Years | 10 Years | |||
| $51 | $160 | $280 | $628 |
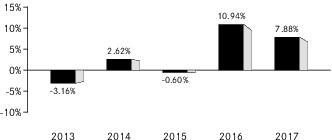
| One Year | Five Years | Since
Fund Inception | |||
| (Inception Date: 4/17/2012) | |||||
| Return Before Taxes | 7.88% | 3.40% | 4.54% | ||
| Return After Taxes on Distributions1 | 5.99% | 1.56% | 2.74% | ||
| Return After Taxes on Distributions and Sale of Fund Shares1 | 4.44% | 1.72% | 2.66% | ||
| Morningstar ® Emerging Markets Corporate Bond IndexSM (Index returns do not reflect deductions for fees, expenses, or taxes)2 | 7.85% | 3.85% | 5.03% | ||
| J.P. Morgan CEMBI Broad Diversified Core Index (Index returns do not reflect deductions for fees, expenses, or taxes)2,3 | N/A | N/A | N/A |
| 1 | After-tax returns in the table above are calculated using the historical highest individual U.S. federal marginal income tax rates and do not reflect the impact of state or local taxes. Actual after-tax returns depend on an investor’s tax situation and may differ from those shown, and after-tax returns shown are not relevant to tax-exempt investors or investors who hold shares through tax-deferred arrangements, such as 401(k) plans or individual retirement accounts (“IRAs”). Fund returns after taxes on distributions and sales of Fund shares are calculated assuming that an investor has sufficient capital gains of the same character from other investments to offset any capital losses from the sale of Fund shares. As a result, Fund returns after taxes on distributions and sales of Fund shares may exceed Fund returns before taxes and/or returns after taxes on distributions. |
| 2 | On June 1, 2017, the Fund’s Underlying Index changed from the Morningstar® Emerging Markets Corporate Bond IndexSM to the J.P. Morgan CEMBI Broad Diversified Core Index. The inception date of the J.P. Morgan CEMBI Broad Diversified Core Index was April 13, 2017. |
| 3 | The total return of the J.P. Morgan CEMBI Broad Diversified Core Index for the period from April 13, 2017 (the inception date of the J.P. Morgan CEMBI Broad Diversified Core Index) through December 31, 2017 was 4.33%. |
| ■ | The risk of delays in settling portfolio transactions and the risk of loss arising out of the system of share registration and custody used in certain Eastern European countries; |
| ■ | Risks in connection with the maintenance of the Fund's portfolio securities and cash with foreign sub-custodians and securities depositories, including the risk that appropriate sub-custody arrangements will not be available to the Fund; |
| ■ | The risk that the Fund's ownership rights in portfolio securities could be lost through fraud or negligence as a result of the fact that ownership in shares of certain Eastern European companies is recorded by the companies themselves and by registrars, rather than a central registration system; |
| ■ | The risk that the Fund may not be able to pursue claims on behalf of its shareholders because of the system of share registration and custody, and because certain Eastern European banking institutions and registrars are not guaranteed by their respective governments; and |
| ■ | Risks in connection with Eastern European countries' dependence on the economic health of Western European countries and the EU as a whole. |
| ■ | High yield securities may be issued by less creditworthy issuers. Issuers of high yield securities may have a larger amount of outstanding debt relative to their assets than issuers of investment-grade bonds. In the event of an issuer’s bankruptcy, claims of other creditors may have priority over the claims of high yield securities holders, leaving few or no assets available to repay high yield securities holders. |
| ■ | Prices of high yield securities are subject to extreme price fluctuations. Adverse changes in an issuer’s industry and general economic conditions may have a greater impact on the prices of high yield securities than on other higher rated fixed-income securities. The credit rating of a high yield security does not necessarily address its market value risk. Ratings and market value may change from time to time, positively or negatively, to reflect new developments regarding the issuer. |
| ■ | Issuers of high yield securities may be unable to meet their interest or principal payment obligations because of an economic downturn, specific issuer developments, or the unavailability of additional financing. |
| ■ | High yield securities frequently have redemption features that permit an issuer to |
| ■ | High yield securities may be less liquid than higher rated fixed-income securities, even under normal economic conditions. There are fewer dealers in the high yield securities market, and there may be significant differences in the prices quoted for high yield securities by the dealers. Because high yield securities are less liquid, judgment may play a greater role in valuing certain of the Fund’s securities than is the case with securities trading in a more liquid market. |
| ■ | The Fund may incur expenses to the extent necessary to seek recovery upon default or to negotiate new terms with a defaulting issuer. |
| ■ | The risk of delays in settling portfolio transactions and the risk of loss arising out of the system of share registration and custody used in Russia; |
| ■ | Risks in connection with the maintenance of the Fund’s portfolio securities and cash with foreign sub-custodians and securities depositories, including the risk that appropriate sub-custody arrangements will not be available to the Fund; |
| ■ | The risk that the Fund’s ownership rights in portfolio securities could be lost through fraud or negligence because ownership in shares of Russian companies is recorded by the companies themselves and by registrars, rather than by a central registration system; and |
| ■ | The risk that the Fund may not be able to pursue claims on behalf of its shareholders because of the system of share registration and custody, and because Russian banking institutions and registrars are not guaranteed by the Russian government. |
Also, if an affected security is included in the Fund's Underlying Index, the Fund may, where practicable, seek to eliminate its holdings of the affected security by employing or augmenting its representative sampling strategy to seek to track the investment results of its Underlying Index. The use of (or increased use of) a representative sampling strategy may increase the Fund’s tracking error risk. If the affected securities constitute a significant percentage of the Underlying Index, the Fund may not be able to effectively implement a representative sampling strategy, which may result in significant tracking error between the Fund’s performance and the performance of its Underlying Index.
| Approximate
Value of a Creation Unit |
Creation
Unit Size |
Standard
Creation/ Redemption Transaction Fee |
Maximum
Additional Charge for Creations* |
Maximum
Additional Charge for Redemptions* | ||||
| $2,557,500 | 50,000 | $100 | 3.0% | 2.0% |
| * | As a percentage of the net asset value per Creation Unit, inclusive, in the case of redemptions, of the standard redemption transaction fee. |
(For a share outstanding throughout each period)
| Year
ended Oct. 31, 2017 |
Year
ended Oct. 31, 2016 |
Year
ended Oct. 31, 2015 |
Year
ended Oct. 31, 2014 |
Year
ended Oct. 31, 2013 | |||||
| Net asset value, beginning of year | $ 50.40 | $ 48.21 | $ 51.18 | $ 50.48 | $ 52.93 | ||||
| Income from investment operations: | |||||||||
| Net investment incomea | 2.10 | 2.19 | 2.19 | 2.01 | 1.92 | ||||
| Net realized and unrealized gain (loss)b | 0.90 | 2.18 | (3.02) | 0.75 | (2.49) | ||||
| Total from investment operations | 3.00 | 4.37 | (0.83) | 2.76 | (0.57) | ||||
| Less distributions from: | |||||||||
| Net investment income | (2.07) | (2.18) | (2.14) | (2.06) | (1.88) | ||||
| Total distributions | (2.07) | (2.18) | (2.14) | (2.06) | (1.88) | ||||
| Net asset value, end of year | $ 51.33 | $ 50.40 | $ 48.21 | $ 51.18 | $ 50.48 | ||||
| Total return | 6.14% | 9.33% | (1.62)% | 5.61% | (1.07)% | ||||
| Ratios/Supplemental data: | |||||||||
| Net assets, end of year (000s) | $87,269 | $32,758 | $28,929 | $25,591 | $35,338 | ||||
| Ratio of expenses to average net assets | 0.50% | 0.50% | 0.53% | 0.60% | 0.60% | ||||
| Ratio of net investment income to average net assets | 4.16% | 4.51% | 4.47% | 3.99% | 3.74% | ||||
| Portfolio turnover ratec | 62% | 22% | 11% | 20% | 33% |
| a | Based on average shares outstanding throughout each period. |
| b | The amounts reported for a share outstanding may not accord with the change in aggregate gains and losses in securities for the fiscal period due to the timing of capital share transactions in relation to the fluctuating market values of the Fund’s underlying securities. |
| c | Portfolio turnover rates exclude portfolio securities received or delivered as a result of processing capital share transactions in Creation Units. |
| Premium/Discount Range | Number of Days | Percentage of Total Days | ||
| Greater than 1.5% and Less than 2.0% | 1 | 0.40% | ||
| Greater than 1.0% and Less than 1.5% | 5 | 1.99 | ||
| Greater than 0.5% and Less than 1.0% | 41 | 16.33 | ||
| Greater than 0.0% and Less than 0.5% | 202 | 80.48 | ||
| At NAV | 0 | 0.00 | ||
| Less than 0.0% and Greater than -0.5% | 2 | 0.80 | ||
| 251 | 100.00% |
| Average
Annual Total Returns |
Cumulative
Total Returns | |||||
| 1 Year | 5 Years | Since
Inception* |
1 Year | 5 Years | Since
Inception* | |
| NAV | 6.14% | 3.59% | 4.63% | 6.14% | 19.27% | 28.51% |
| MARKET | 5.84% | 3.42% | 4.66% | 5.84% | 18.34% | 28.74% |
| INDEX** | 6.55% | 4.14% | 5.20% | 6.55% | 22.51% | 32.42% |
| MORNINGSTAR
EMERGING MARKETS CORPORATE BOND INDEX |
6.29% | 4.09% | 5.16% | 6.29% | 22.21% | 32.11% |
| J.P.
MORGAN CEMBI BROAD DIVERSIFIED CORE INDEX*** |
N/A | N/A | N/A | N/A | N/A | N/A |
| * | Total returns for the period since inception are calculated from the inception date of the Fund (4/17/12). The first day of secondary market trading in shares of the Fund was 4/19/12. |
| ** | Index performance through May 31, 2017 reflects the performance of the Morningstar® Emerging Markets Corporate Bond IndexSM. Index performance beginning on June 1, 2017 reflects the performance of the J.P. Morgan CEMBI Broad Diversified Core Index, which effective as of June 1, 2017, replaced the Morningstar® Emerging Markets Corporate Bond IndexSM as the Underlying Index of the Fund. |
| *** | The inception date of the J.P. Morgan CEMBI Broad Diversified Core Index was April 13, 2017. |
| Call: | 1-800-iShares
or 1-800-474-2737 (toll free) Monday through Friday, 8:30 a.m. to 6:30 p.m. (Eastern time) |
| Email: | iSharesETFs@blackrock.com |
| Write: | c/o
BlackRock Investments, LLC 1 University Square Drive, Princeton, NJ 08540 |

| 2018 Prospectus |
|
| ► | iShares US & Intl High Yield Corp Bond ETF | GHYG | CBOE BZX |
|
|
S-1 |
|
|
1 |
|
|
2 |
|
|
14 |
|
|
17 |
|
|
17 |
|
|
20 |
|
|
29 |
|
|
30 |
|
|
31 |
|
|
31 |
|
|
33 |
| Ticker: GHYG | Stock Exchange: Cboe BZX |
| Annual
Fund Operating Expenses (ongoing expenses that you pay each year as a percentage of the value of your investments) | ||||||
| Management
Fees |
Distribution
and Service (12b-1) Fees |
Other
Expenses |
Total
Annual Fund Operating Expenses | |||
| 0.40% | None | None | 0.40% | |||
| 1 Year | 3 Years | 5 Years | 10 Years | |||
| $41 | $128 | $224 | $505 |
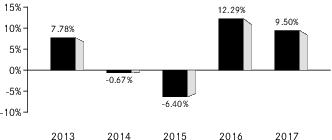
| One Year | Five Years | Since
Fund Inception | |||
| (Inception Date: 4/3/2012) | |||||
| Return Before Taxes | 9.50% | 4.26% | 5.37% | ||
| Return After Taxes on Distributions1 | 7.32% | 2.05% | 3.13% | ||
| Return After Taxes on Distributions and Sale of Fund Shares1 | 5.34% | 2.22% | 3.11% | ||
| Markit iBoxx Global Developed Markets High Yield Index (Index returns do not reflect deductions for fees, expenses, or taxes) | 9.58% | 4.39% | 5.54% |
| 1 | After-tax returns in the table above are calculated using the historical highest individual U.S. federal marginal income tax rates and do not reflect the impact of state or local taxes. Actual after-tax returns depend on an investor’s tax situation and may differ from those shown, and after-tax returns shown are not relevant to tax-exempt investors or investors who hold shares through tax-deferred arrangements, such as 401(k) plans or individual retirement accounts (“IRAs”). Fund returns after taxes on distributions and sales of Fund shares are calculated assuming that an investor has sufficient capital gains of the same character from other investments to offset any capital losses from the sale of Fund shares. As a result, Fund returns after taxes on distributions and sales of Fund shares may exceed Fund returns before taxes and/or returns after taxes on distributions. |
| ■ | High yield securities may be issued by less creditworthy issuers. Issuers of high yield securities may have a larger amount of outstanding debt relative to their assets than issuers of investment-grade bonds. In the event of an issuer’s bankruptcy, claims of other creditors may have priority over the claims of high yield securities holders, leaving few or no assets available to repay high yield securities holders. |
| ■ | Prices of high yield securities are subject to extreme price fluctuations. Adverse changes in an issuer’s industry and general economic conditions may have a greater impact on the prices of high yield securities than on other higher rated fixed-income securities. The credit rating of a high yield security does not necessarily address its market value risk. Ratings and market value may change from time to time, positively or negatively, to reflect new developments regarding the issuer. |
| ■ | Issuers of high yield securities may be unable to meet their interest or principal payment obligations because of an economic downturn, specific issuer developments, or the unavailability of additional financing. |
| ■ | High yield securities frequently have redemption features that permit an issuer to repurchase the security from the Fund before it matures. If the issuer redeems high yield securities held by the Fund, the Fund may have to invest the proceeds in bonds with lower yields and may lose income. |
| ■ | High yield securities may be less liquid than higher rated fixed-income securities, even under normal economic conditions. There are fewer dealers in the high yield securities market, and there may be significant differences in the prices quoted for high yield securities by the dealers. Because high yield securities are less liquid, judgment may play a greater role in valuing certain of the Fund’s securities than is the case with securities trading in a more liquid market. |
| ■ | The Fund may incur expenses to the extent necessary to seek recovery upon default or to negotiate new terms with a defaulting issuer. |
| Approximate
Value of a Creation Unit |
Creation
Unit Size |
Standard
Creation/ Redemption Transaction Fee |
Maximum
Additional Charge for Creations* |
Maximum
Additional Charge for Redemptions* | ||||
| $5,091,000 | 100,000 | $1,250 | 3.0% | 2.0% |
| * | As a percentage of the net asset value per Creation Unit, inclusive, in the case of redemptions, of the standard redemption transaction fee. |
(For a share outstanding throughout each period)
| Year
ended Oct. 31, 2017 |
Year
ended Oct. 31, 2016 |
Year
ended Oct. 31, 2015 |
Year
ended Oct. 31, 2014 |
Year
ended Oct. 31, 2013 | |||||
| Net asset value, beginning of year | $ 48.77 | $ 47.57 | $ 52.00 | $ 53.50 | $ 51.67 | ||||
| Income from investment operations: | |||||||||
| Net investment incomea | 2.45 | 2.55 | 2.56 | 2.84 | 3.05 | ||||
| Net realized and unrealized gain (loss)b | 2.08 | 0.57 | (4.76) | (1.28) | 1.70 | ||||
| Total from investment operations | 4.53 | 3.12 | (2.20) | 1.56 | 4.75 | ||||
| Less distributions from: | |||||||||
| Net investment income | (2.32) | (1.92) | (2.23) | (3.06) | (2.92) | ||||
| Total distributions | (2.32) | (1.92) | (2.23) | (3.06) | (2.92) | ||||
| Net asset value, end of year | $ 50.98 | $ 48.77 | $ 47.57 | $ 52.00 | $ 53.50 | ||||
| Total return | 9.58% | 6.82% | (4.32)% | 2.91% | 9.50% | ||||
| Ratios/Supplemental data: | |||||||||
| Net assets, end of year (000s) | $214,103 | $97,547 | $118,931 | $104,002 | $74,893 | ||||
| Ratio of expenses to average net assets | 0.40% | 0.40% | 0.40% | 0.40% | 0.40% | ||||
| Ratio of expenses to average net assets prior to waived fees | n/a | 0.51% | 0.55% | 0.55% | 0.55% | ||||
| Ratio of net investment income to average net assets | 4.93% | 5.44% | 5.18% | 5.31% | 5.82% | ||||
| Portfolio turnover ratec | 22% | 24% | 21% | 21% | 20% |
| a | Based on average shares outstanding throughout each period. |
| b | The amounts reported for a share outstanding may not accord with the change in aggregate gains and losses in securities for the fiscal period due to the timing of capital share transactions in relation to the fluctuating market values of the Fund’s underlying securities. |
| c | Portfolio turnover rates exclude portfolio securities received or delivered as a result of processing capital share transactions in Creation Units. |
| Premium/Discount Range | Number of Days | Percentage of Total Days | ||
| Greater than 1.0% and Less than 1.5% | 3 | 1.20% | ||
| Greater than 0.5% and Less than 1.0% | 82 | 32.67 | ||
| Greater than 0.0% and Less than 0.5% | 165 | 65.73 | ||
| At NAV | 1 | 0.40 | ||
| 251 | 100.00% |
| Average Annual Total Returns | Cumulative Total Returns | ||||||
| NAV | MARKET | INDEX | NAV | MARKET | INDEX | ||
| 1 Year | 9.58% | 9.49% | 9.66% | 9.58% | 9.49% | 9.66% | |
| 5 Years | 4.76% | 4.72% | 4.91% | 26.19% | 25.94% | 27.07% | |
| Since Inception* | 5.44% | 5.49% | 5.63% | 34.43% | 34.77% | 35.69% | |
| * | Total returns for the period since inception are calculated from the inception date of the Fund (4/3/12). The first day of secondary market trading in shares of the Fund was 4/5/12. |
| Call: | 1-800-iShares
or 1-800-474-2737 (toll free) Monday through Friday, 8:30 a.m. to 6:30 p.m. (Eastern time) |
| Email: | iSharesETFs@blackrock.com |
| Write: | c/o
BlackRock Investments, LLC 1 University Square Drive, Princeton, NJ 08540 |
