September 1, 2017
(as revised April 6, 2018)
| 2017 Prospectus |
 |
| ► | iShares Emerging Markets Dividend ETF | DVYE | NYSE ARCA |
The Securities and Exchange Commission
(“SEC”) has not approved or disapproved these securities or passed upon the adequacy of this prospectus. Any representation to the contrary is a criminal offense.
Table of Contents
|
|
S-1 |
|
|
1 |
|
|
2 |
|
|
13 |
|
|
20 |
|
|
20 |
|
|
23 |
|
|
33 |
|
|
34 |
|
|
35 |
|
|
35 |
|
|
38 |
The “Dow Jones Emerging Markets Select Dividend IndexTM” is a product of S&P Dow Jones Indices LLC (“SPDJI”), and has been licensed for use by BlackRock Fund Advisors or its affiliates.
Standard & Poor’s® and S&P® are
registered trademarks of Standard & Poor’s Financial Services LLC (“S&P”); Dow Jones® is a registered trademark of Dow
Jones Trademark Holdings LLC (“Dow Jones”); iShares® and BlackRock® are registered trademarks of BlackRock Fund Advisors and its affiliates, and these trademarks have been licensed for use by SPDJI and sublicensed for
certain purposes by iShares, Inc. The Fund is not sponsored, endorsed, sold or promoted by SPDJI, Dow Jones, S&P or their respective affiliates, and none of such parties makes any representation regarding the advisability of investing in such
product(s), nor do they have any liability for any errors, omissions, or interruptions of the Dow Jones Emerging Markets Select Dividend Index.
i
[THIS PAGE INTENTIONALLY LEFT BLANK]
iSHARES® EMERGING MARKETS
DIVIDEND ETF
DIVIDEND ETF
| Ticker: DVYE | Stock Exchange: NYSE Arca |
Investment Objective
The iShares Emerging Markets Dividend ETF (the
“Fund”) seeks to track the investment results of an index composed of relatively high dividend paying equities in emerging markets.
Fees and Expenses
The following table describes the fees and expenses that you
will incur if you own shares of the Fund. The investment advisory agreement between iShares, Inc. (the “Company”) and BlackRock Fund Advisors (“BFA”) (the “Investment Advisory Agreement”) provides that BFA will
pay all operating expenses of the Fund, except the management fees, interest expenses, taxes, expenses incurred with respect to the acquisition and disposition of portfolio securities and the execution of portfolio transactions, including brokerage
commissions, distribution fees or expenses, litigation expenses and any extraordinary expenses. The Fund may incur “Acquired Fund Fees and Expenses.” Acquired Fund Fees and Expenses reflect the Fund's pro
rata share of the fees and expenses incurred by investing in other investment companies. The impact of Acquired Fund Fees and Expenses is included in the total returns of the Fund. Acquired Fund Fees and Expenses are not included in the
calculation of the ratio of expenses to average net assets shown in the Financial Highlights section of the Fund's prospectus (the “Prospectus”). BFA, the investment adviser to the Fund, has
contractually agreed to waive a portion of its management fees in an amount equal to the aggregate Acquired Fund Fees and Expenses, if any, attributable to the Fund's investments in other series of iShares Trust and the Company through August 31,
2022. The contractual waiver may be terminated prior to August 31, 2022 only upon written agreement of the Company and BFA.
You may also incur usual and customary brokerage commissions
and other charges when buying or selling shares of the Fund, which are not reflected in the Example that follows:
| Annual
Fund Operating Expenses (ongoing expenses that you pay each year as a percentage of the value of your investments)1 | ||||||||
| Management
Fees |
Distribution
and Service (12b-1) Fees |
Other
Expenses |
Acquired
Fund Fees and Expenses |
Total
Annual Fund Operating Expenses | ||||
| 0.49% | None | None | None | 0.49% | ||||
| 1 | The expense information in
the table has been restated to reflect current management fees. |
S-1
Example. This Example is
intended to help you compare the cost of owning shares of the Fund with the cost of investing in other funds. The Example assumes that you invest $10,000 in the Fund for the time periods indicated and then sell all of your shares at the end of those
periods. The Example also assumes that your investment has a 5% return each year and that the Fund’s operating expenses remain the same. Although your actual costs may be higher or lower, based on these assumptions, your costs would
be:
| 1 Year | 3 Years | 5 Years | 10 Years | |||
| $50 | $157 | $274 | $616 |
S-2
S-3
S-4
S-5
S-6
S-7
S-8
Performance Information
The bar chart and table that follow show how the Fund has
performed on a calendar year basis and provide an indication of the risks of investing in the Fund. Both assume that all dividends and distributions have been reinvested in the Fund. Past performance (before and after taxes) does not necessarily
indicate how the Fund will perform in the future. Supplemental information about the Fund’s performance is shown under the heading Total Return Information in the
Supplemental Information section of the Prospectus. If BFA had not waived certain Fund fees during certain periods, the Fund's returns would have been lower. One of the Fund's contractual waivers was
discontinued on August 1, 2016.
Year by Year Returns1 (Years Ended December 31)
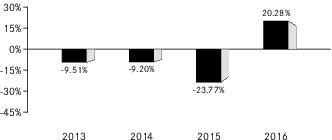
| 1 | The Fund’s year-to-date return as of June 30, 2017 was 16.18%. |
The best calendar quarter return during the periods shown above
was 9.42% in the 3rd quarter of 2016; the worst was -23.74% in the 3rd quarter of 2015.
Updated performance information may be obtained by visiting our
website at www.iShares.com or by calling 1-800-iShares (1-800-474-2737) (toll free).
Average Annual Total Returns
(for the periods ended December 31, 2016)
| One Year | Since
Fund Inception | ||
| (Inception Date: 2/23/2012) | |||
| Return Before Taxes | 20.28% | -4.48% | |
| Return After Taxes on Distributions2 | 19.07% | -5.50% | |
| Return After Taxes on Distributions and Sale of Fund Shares2 | 12.48% | -3.26% | |
| Dow Jones Emerging Markets Select Dividend Index (Index returns do not reflect deductions for fees, expenses, or taxes) | 21.11% | -4.57% |
| 2 | After-tax returns in the table above are calculated using the historical highest individual U.S. federal marginal income tax rates and do not reflect the impact of state or local taxes. Actual after-tax returns depend on an investor’s tax situation and may differ from those shown, and after-tax returns shown are not relevant to tax-exempt investors or investors who hold shares through tax-deferred arrangements, such as 401(k) plans or individual retirement accounts (“IRAs”). Fund returns after taxes on distributions and sales of Fund shares are calculated assuming that an investor has sufficient capital gains of the same character from other investments to offset any capital losses from the sale of Fund shares. As a result, Fund returns after taxes on distributions and sales of Fund shares may exceed Fund returns before taxes and/or returns after taxes on distributions. |
S-9
S-10
More Information About the Fund
This Prospectus contains important information about investing
in the Fund. Please read this Prospectus carefully before you make any investment decisions. Additional information regarding the Fund is available at www.iShares.com.
BFA is the investment adviser to the Fund. Shares of the Fund
are listed for trading on NYSE Arca, Inc. (“NYSE Arca”). The market price for a share of the Fund may be different from the Fund’s most recent NAV.
ETFs are funds that trade like other publicly-traded
securities. The Fund is designed to track an index. Similar to shares of an index mutual fund, each share of the Fund represents an ownership interest in an underlying portfolio of securities and other instruments intended to track a market index.
Unlike shares of a mutual fund, which can be bought and redeemed from the issuing fund by all shareholders at a price based on NAV, shares of the Fund may be purchased or redeemed directly from the Fund at NAV in Creation Unit increments solely by
Authorized Participants. Also unlike shares of a mutual fund, shares of the Fund are listed on a national securities exchange and trade in the secondary market at market prices that change throughout the day.
The Fund invests in a particular segment of the securities
markets and seeks to track the performance of a securities index that may not be representative of the market as a whole. The Fund is designed to be used as part of broader asset allocation strategies. Accordingly, an investment in the Fund should
not constitute a complete investment program.
An index is
a financial calculation, based on a grouping of financial instruments, and is not an investment product, while the Fund is an actual investment portfolio. The performance of the Fund and the Underlying Index may vary for a number of reasons,
including transaction costs, non-U.S. currency valuations, asset valuations, corporate actions (such as mergers and spin-offs), timing variances and differences between the Fund’s portfolio and the Underlying Index resulting from the Fund's
use of representative sampling or from legal restrictions (such as diversification requirements) that apply to the Fund but not to the Underlying Index. From time to time, the Index Provider may make changes to the methodology or other adjustments
to the Underlying Index. Unless otherwise determined by BFA, any such change or adjustment will be reflected in the calculation of the Underlying Index performance on a going-forward basis after the effective date of such change or adjustment.
Therefore, the Underlying Index performance shown for periods prior to the effective date of any such change or adjustment will generally not be recalculated or restated to reflect such change or adjustment. “Tracking error” is the
divergence of the performance (return) of the Fund's portfolio from that of the Underlying Index. BFA expects that, over time, the Fund’s tracking error will not exceed 5%. Because the Fund uses a representative sampling indexing strategy, it
can be expected to have a larger tracking error than if it used a replication indexing strategy. “Replication” is an indexing strategy in which a fund invests in substantially all of the securities in its underlying index in
approximately the same proportions as in the underlying index.
1
Under continuous listing standards adopted by the Fund's
listing exchange, which went into effect on January 1, 2018, the Fund is required to confirm on an ongoing basis that the components of the Underlying Index satisfy the applicable listing requirements. In the event that the Underlying Index does not
comply with the applicable listing requirements, the Fund is required to rectify such non-compliance by requesting that the Index Provider modify the Underlying Index, adopting a new underlying index, or obtaining relief from the SEC. Failure to
rectify such non-compliance may result in the Fund being delisted by the listing exchange.
The Fund may borrow as a temporary measure for extraordinary or
emergency purposes, including to meet redemptions or to facilitate the settlement of securities or other transactions. The Fund does not intend to borrow money in order to leverage its portfolio.
An investment in the Fund is not a bank deposit and it is not
insured or guaranteed by the Federal Deposit Insurance Corporation or any other government agency, BFA or any of its affiliates.
The Fund's investment objective and the Underlying Index may be
changed without shareholder approval.
A Further
Discussion of Principal Risks
The Fund is subject to
various risks, including the principal risks noted below, any of which may adversely affect the Fund’s NAV, trading price, yield, total return and ability to meet its investment objective. You could lose all or part of your investment in the
Fund, and the Fund could underperform other investments.
Asian Economic Risk. Many Asian
economies have experienced rapid growth and industrialization in recent years, but there is no assurance that this growth rate will be maintained. Other Asian economies, however, have experienced high inflation, high unemployment, currency
devaluations and restrictions, and over-extension of credit. Economic events in any one Asian country may have a significant economic effect on the entire Asian region, as well as on major trading partners outside Asia. Any adverse event in the
Asian markets may have a significant adverse effect on some or all of the economies of the countries in which the Fund invests. Many Asian countries are subject to political risk, including political instability, corruption and regional conflict
with neighboring countries. In addition, many Asian countries are subject to social and labor risks associated with demands for improved political, economic and social conditions. These risks, among others, may adversely affect the value of the
Fund’s investments.
Asset Class Risk. The securities and other assets in the Underlying Index or in the Fund’s portfolio may underperform in comparison to other securities or indexes that track other countries, groups of countries, regions,
industries, groups of industries, markets, asset classes or sectors. Various types of securities, currencies and indexes may experience cycles of outperformance and underperformance in comparison to the general financial markets depending upon a
number of factors including, among other things, inflation, interest rates, productivity, global demand for local products or
2
resources, and regulation and governmental controls. This may cause the Fund
to underperform other investment vehicles that invest in different asset classes.
Assets Under Management (AUM) Risk. From time to time, an Authorized Participant, a third-party investor, the Fund’s adviser or an affiliate of the Fund’s adviser, or a fund may invest in the Fund and hold its investment for a specific period
of time in order to facilitate commencement of the Fund’s operations or for the Fund to achieve size or scale. There can be no assurance that any such entity would not redeem its investment or that the
size of the Fund would be maintained at such levels, which could negatively impact the Fund.
Authorized Participant Concentration Risk. Only an Authorized Participant may engage in creation or redemption transactions directly with the Fund. The Fund has a limited number of institutions that may act as Authorized Participants on an agency basis (i.e., on behalf of other market participants). To the extent that Authorized Participants exit the business or are unable to proceed with creation and/or
redemption orders with respect to the Fund and no other Authorized Participant is able to step forward to create or redeem Creation Units, Fund shares may be more likely to trade at a premium or discount to NAV and possibly face trading halts and/or
delisting. Authorized Participant concentration risk may be heightened because ETFs, such as the Fund, that invest in non-U.S. securities or other securities or instruments that are less widely traded often involve greater settlement and operational
issues and capital costs for Authorized Participants, which may limit the availability of Authorized Participants.
Concentration Risk. The Fund
may be susceptible to an increased risk of loss, including losses due to adverse events that affect the Fund’s investments more than the market as a whole, to the extent that the Fund's investments are concentrated in the securities of a
particular issuer or issuers, country, group of countries, region, market, industry, group of industries, sector or asset class. The Fund may be more adversely affected by the underperformance of those securities, may experience increased price
volatility and may be more susceptible to adverse economic, market, political or regulatory occurrences affecting those securities than a fund that does not concentrate its investments.
Currency Risk. Because the
Fund's NAV is determined on the basis of the U.S. dollar, investors may lose money if the currency of a non-U.S. market in which the Fund invests depreciates against the U.S. dollar or if there are delays or limits on repatriation of the local
currency, even if the local currency value of the Fund's holdings in that market increases. Currency exchange rates can be very volatile and can change quickly and unpredictably. As a result, the Fund’s NAV may change quickly and without
warning.
Custody Risk. Custody risk refers to the risks inherent in the process of clearing and settling trades, as well as the holding of securities by local banks, agents and depositories. Low trading volumes and volatile prices in less
developed markets may make trades harder to complete and settle, and governments or trade groups may compel local agents to hold securities in designated depositories that may not be subject to independent evaluation. Local agents are held only to
the standards of care
3
of their local markets. In general, the less developed a country’s
securities markets are, the greater the likelihood of custody problems.
Cyber Security Risk. With the
increased use of technologies such as the internet to conduct business, the Fund, Authorized Participants, service providers and the relevant listing exchange are susceptible to operational, information security and related “cyber”
risks both directly and through their service providers. Similar types of cyber security risks are also present for issuers of securities in which the Fund invests, which could result in material adverse consequences for such issuers and may cause
the Fund’s investment in such portfolio companies to lose value. Unlike many other types of risks faced by the Fund, these risks typically are not covered by insurance. In general, cyber incidents can result from deliberate attacks or
unintentional events. Cyber incidents include, but are not limited to, gaining unauthorized access to digital systems (e.g., through
“hacking” or malicious software coding) for purposes of misappropriating assets or sensitive information, corrupting data, or causing operational disruption. Cyber attacks may also be carried out in a manner that does not require gaining
unauthorized access, such as causing denial-of-service attacks on websites (i.e., efforts to make network services unavailable to intended users).
Cyber security failures by or breaches of the systems of the Fund’s adviser, distributor and other service providers (including, but not limited to, index providers, fund accountants, custodians, transfer agents and administrators), market
makers, Authorized Participants or the issuers of securities in which the Fund invests, have the ability to cause disruptions and impact business operations, potentially resulting in: financial losses, interference with the Fund’s ability to
calculate its NAV, disclosure of confidential trading information, impediments to trading, submission of erroneous trades or erroneous creation or redemption orders, the inability of the Fund or its service providers to transact business, violations
of applicable privacy and other laws, regulatory fines, penalties, reputational damage, reimbursement or other compensation costs, or additional compliance costs. In addition, cyber attacks may render records of Fund assets and transactions,
shareholder ownership of Fund shares, and other data integral to the functioning of the Fund inaccessible or inaccurate or incomplete. Substantial costs may be incurred by the Fund in order to resolve or prevent cyber incidents in the future. While
the Fund has established business continuity plans in the event of, and risk management systems to prevent, such cyber attacks, there are inherent limitations in such plans and systems, including the possibility that certain risks have not been
identified and that prevention and remediation efforts will not be successful. Furthermore, the Fund cannot control the cyber security plans and systems put in place by service providers to the Fund, issuers in which the Fund invests, the Index
Provider, market makers or Authorized Participants. The Fund and its shareholders could be negatively impacted as a result.
Dividend-Paying Stock Risk. The
Fund's strategy of investing in dividend-paying stocks involves the risk that such stocks may fall out of favor with investors and underperform the broader market. Companies that issue dividend-paying stocks are not required to continue to pay
dividends on such stocks. Therefore, there is the possibility that such companies could reduce or eliminate the payment of dividends in the future or the anticipated acceleration of dividends could not occur. Depending upon market conditions,
dividend-paying stocks that meet the Fund’s investment
4
criteria may not be widely available and/or may be highly concentrated in only
a few market sectors.
Equity Securities Risk. The Fund invests in equity securities, which are subject to changes in value that may be attributable to market perception of a particular issuer or to general stock market fluctuations that affect all issuers.
Investments in equity securities may be more volatile than investments in other asset classes. The Underlying Index is comprised of common stocks, which generally subject their holders to more risks than holders of preferred stock and debt
securities because common stockholders’ claims are subordinated to holders of preferred stock and debt securities upon the bankruptcy of the issuer.
Financials Sector Risk.
Companies in the financials sector of an economy are subject to extensive governmental regulation and intervention, which may adversely affect the scope of their activities, the prices they can charge, the amount of capital they must maintain and,
potentially, their size. Governmental regulation may change frequently and may have significant adverse consequences for companies in the financials sector, including effects not intended by such regulation. The impact of more stringent capital
requirements, or recent or future regulation in various countries, on any individual financial company or on the financials sector as a whole cannot be predicted. Certain risks may impact the value of investments in the financials sector more
severely than those of investments outside this sector, including the risks associated with companies that operate with substantial financial leverage. Companies in the financials sector may also be adversely affected by increases in interest rates
and loan losses, decreases in the availability of money or asset valuations, credit rating downgrades and adverse conditions in other related markets. Insurance companies, in particular, may be subject to severe price competition and/or rate
regulation, which may have an adverse impact on their profitability. The financials sector is particularly sensitive to fluctuations in interest rates. The financials sector is also a target for cyber attacks, and may experience technology
malfunctions and disruptions. In recent years, cyber attacks and technology malfunctions and failures have become increasingly frequent in this sector and have reportedly caused losses to companies in this sector, which may negatively impact the
Fund.
Geographic Risk. Some of the companies in which the Fund invests are located in parts of the world that have historically been prone to natural disasters, such as earthquakes, tornadoes, volcanic eruptions, droughts, floods, hurricanes
or tsunamis, and are economically sensitive to environmental events. Any such event may adversely impact the economies of these geographic areas or business operations of companies in these geographic areas, causing an adverse impact on the value of
the Fund.
Index-Related Risk. The Fund seeks to achieve a return that corresponds generally to the price and yield performance, before fees and expenses, of the Underlying Index as published by the Index Provider. There is no assurance that the
Index Provider or any agents that may act on its behalf will compile the Underlying Index accurately, or that the Underlying Index will be determined, composed or calculated accurately. While the Index Provider provides descriptions of what the
Underlying Index is designed to achieve, neither the Index Provider nor its agents provide any warranty or accept any liability in relation to the quality, accuracy or completeness of the Underlying Index or
5
its related data, and they do not guarantee that the Underlying Index will be
in line with the Index Provider’s methodology. BFA’s mandate as described in this Prospectus is to manage the Fund consistently with the Underlying Index provided by the Index Provider to BFA. BFA does not provide any warranty or
guarantee against the Index Provider’s or any agent’s errors. Errors in respect of the quality, accuracy and completeness of the data used to compile the Underlying Index may occur from time to time and may not be identified and
corrected by the Index Provider for a period of time or at all, particularly where the indices are less commonly used as benchmarks by funds or managers. Therefore, gains, losses or costs associated with errors of the Index Provider or its agents
will generally be borne by the Fund and its shareholders. For example, during a period where the Underlying Index contains incorrect constituents, the Fund would have market exposure to such constituents and would be underexposed to the Underlying
Index’s other constituents. Such errors may negatively or positively impact the Fund and its shareholders.
Apart from scheduled rebalances, the Index Provider or its
agents may carry out additional ad hoc rebalances to the Underlying Index in order, for example, to correct an error in the selection of index constituents. When the Underlying Index is rebalanced and the Fund in turn rebalances its portfolio to
attempt to increase the correlation between the Fund’s portfolio and the Underlying Index, any transaction costs and market exposure arising from such portfolio rebalancing will be borne directly by the Fund and its shareholders. Unscheduled
rebalances to the Underlying Index may expose the Fund to additional tracking error risk, which is the risk that the Fund's returns may not track those of the Underlying Index. Therefore, errors and additional ad hoc rebalances carried out by the
Index Provider or its agents to the Underlying Index may increase the costs to and the tracking error risk of the Fund.
Issuer Risk. The performance of
the Fund depends on the performance of individual securities to which the Fund has exposure. Any issuer of these securities may perform poorly, causing the value of its securities to decline. Poor performance may be caused by poor management
decisions, competitive pressures, changes in technology, expiration of patent protection, disruptions in supply, labor problems or shortages, corporate restructurings, fraudulent disclosures, credit deterioration of the issuer or other factors.
Issuers may, in times of distress or at their own discretion, decide to reduce or eliminate dividends, which may also cause their stock prices to decline.
Large-Capitalization Companies Risk. Large-capitalization companies may be less able than smaller capitalization companies to adapt to changing market conditions. Large-capitalization companies may be more mature and subject to more limited growth
potential compared with smaller capitalization companies. During different market cycles, the performance of large-capitalization companies has trailed the overall performance of the broader securities markets.
Management Risk. The Fund may
not fully replicate the Underlying Index and may hold securities not included in the Underlying Index. As a result, the Fund is subject to the risk that BFA’s investment strategy, the implementation of which is subject to a number of
constraints, may not produce the intended results.
Market Risk. The Fund could
lose money over short periods due to short-term market movements and over longer periods during more prolonged market downturns.
6
Securities or other assets may decline in value due to factors affecting
financial markets generally or particular asset classes or industries represented in the markets. The value of a security or other asset may also decline due to general market conditions, economic trends or events that are not specifically
related to the issuer of the security or other asset, or due to factors that affect a particular issuer or issuers, country, group of countries, region, market, industry, group of industries, sector or asset class. During a general market
downturn, multiple asset classes may be negatively affected. Changes in market conditions and interest rates will not have the same impact on all types of securities.
Market Trading Risk
Absence of Active Market.
Although shares of the Fund are listed for trading on one or more stock exchanges, there can be no assurance that an active trading market for such shares will develop or be maintained by market makers or Authorized Participants.
Risk of Secondary Listings.
The Fund's shares may be listed or traded on U.S. and non-U.S. stock exchanges other than the U.S. stock exchange where the Fund's primary listing is maintained, and may otherwise be made available to non-U.S.
investors through funds or structured investment vehicles similar to depositary receipts. There can be no assurance that the Fund’s shares will continue to trade on any such stock exchange or in any market or that the Fund’s shares will
continue to meet the requirements for listing or trading on any exchange or in any market. The Fund's shares may be less actively traded in certain markets than in others, and investors are subject to the execution and settlement risks and market
standards of the market where they or their broker direct their trades for execution. Certain information available to investors who trade Fund shares on a U.S. stock exchange during regular U.S. market hours may not be available to investors who
trade in other markets, which may result in secondary market prices in such markets being less efficient.
Secondary Market Trading Risk.
Shares of the Fund may trade in the secondary market at times when the Fund does not accept orders to purchase or redeem shares. At such times, shares may trade in the secondary market with more significant premiums or discounts than might be
experienced at times when the Fund accepts purchase and redemption orders.
Secondary market trading in Fund shares may be halted by a
stock exchange because of market conditions or for other reasons. In addition, trading in Fund shares on a stock exchange or in any market may be subject to trading halts caused by extraordinary market volatility pursuant to “circuit
breaker” rules on the stock exchange or market.
Shares of the Fund, similar to shares of other issuers listed
on a stock exchange, may be sold short and are therefore subject to the risk of increased volatility and price decreases associated with being sold short.
Shares of the Fund May Trade at Prices Other Than NAV. Shares of the Fund trade on stock exchanges at prices at, above or below the Fund’s most recent NAV. The NAV of the Fund is calculated at the end of each business day and fluctuates with changes in the market value
of the Fund’s holdings. The trading price of the Fund's shares
7
fluctuates continuously throughout trading hours based on both market
supply of and demand for Fund shares and the underlying value of the Fund's portfolio holdings or NAV. As a result, the trading prices of the Fund’s shares may deviate significantly from NAV during periods of market volatility. ANY OF THESE FACTORS, AMONG OTHERS, MAY LEAD TO THE FUND'S SHARES TRADING AT A PREMIUM OR DISCOUNT TO NAV. However, because shares can be created and redeemed in Creation Units at NAV, BFA believes that large
discounts or premiums to the NAV of the Fund are not likely to be sustained over the long term (unlike shares of many closed-end funds, which frequently trade at appreciable discounts from, and sometimes at premiums to, their NAVs). While the
creation/redemption feature is designed to make it more likely that the Fund’s shares normally will trade on stock exchanges at prices close to the Fund’s next calculated NAV, exchange prices are not expected to correlate exactly with
the Fund's NAV due to timing reasons, supply and demand imbalances and other factors. In addition, disruptions to creations and redemptions, including disruptions at market makers, Authorized Participants, or other market participants, and during
periods of significant market volatility, may result in trading prices for shares of the Fund that differ significantly from its NAV. Authorized Participants may be less willing to create or redeem Fund shares if there is a lack of an active market
for such shares or its underlying investments, which may contribute to the Fund’s shares trading at a premium or discount to NAV.
Costs of Buying or Selling Fund Shares. Buying or selling Fund shares on an exchange involves two types of costs that apply to all securities transactions. When buying or selling shares of the Fund through a broker, you will likely incur a brokerage commission
and other charges. In addition, you may incur the cost of the “spread”; that is, the difference between what investors are willing to pay for Fund shares (the “bid” price) and the price at which they are willing to sell Fund
shares (the “ask” price). The spread, which varies over time for shares of the Fund based on trading volume and market liquidity, is generally narrower if the Fund has more trading volume and market liquidity and wider if the Fund
has less trading volume and market liquidity. In addition, increased market volatility may cause wider spreads. There may also be regulatory and other charges that are incurred as a result of trading activity. Because of the costs inherent in buying
or selling Fund shares, frequent trading may detract significantly from investment results and an investment in Fund shares may not be advisable for investors who anticipate regularly making small investments through a brokerage
account.
Mid-Capitalization Companies Risk. Stock prices of mid-capitalization companies may be more volatile than those of large-capitalization companies and, therefore, the Fund’s share price may be more volatile than those of funds that invest a larger
percentage of their assets in stocks issued by large-capitalization companies. Stock prices of mid-capitalization companies are also more vulnerable than those of large-capitalization companies to adverse business or economic developments, and the
stocks of mid-capitalization companies may be less liquid, making it difficult for the Fund to buy and sell shares of mid-capitalization companies. In addition, mid-capitalization companies generally have less diverse product lines than
large-capitalization companies and are more susceptible to adverse developments related to their products.
8
National Closed Market Trading Risk. To the extent that the underlying securities held by the Fund trade on foreign exchanges that may be closed when the securities exchange on which the Fund’s shares trade is open, there are likely to be deviations
between the current price of an underlying security and the last quoted price for the underlying security (i.e., the Fund’s quote from the
closed foreign market). These deviations could result in premiums or discounts to the Fund’s NAV that may be greater than those experienced by other ETFs.
Non-U.S. Securities Risk.
Investments in the securities of non-U.S. issuers are subject to the risks of investing in the markets where such issuers are located, including heightened risks of inflation, nationalization and market fluctuations caused by economic and political
developments. As a result of investing in non-U.S. securities, the Fund may be subject to increased risk of loss caused by any of the factors listed below:
| ■ | Lower levels of liquidity and market efficiency; |
| ■ | Greater securities price volatility; |
| ■ | Exchange rate fluctuations and exchange controls; |
| ■ | Less availability of public information about issuers; |
| ■ | Limitations on foreign ownership of securities; |
| ■ | Imposition of withholding or other taxes; |
| ■ | Imposition of restrictions on the expatriation of the funds or other assets of the Fund; |
| ■ | Higher transaction and custody costs and delays in settlement procedures; |
| ■ | Difficulties in enforcing contractual obligations; |
| ■ | Lower levels of regulation of the securities markets; |
| ■ | Weaker accounting, disclosure and reporting requirements; and |
| ■ | Legal principles relating to corporate governance, directors’ fiduciary duties and liabilities and stockholders’ rights in markets in which the Fund invests may differ and/or may not be as extensive or protective as those that apply in the United States. |
Operational Risk. The Fund is exposed to operational risks arising from a number of factors, including, but not limited to, human error, processing and communication errors, errors of the Fund’s service providers, counterparties or
other third-parties, failed or inadequate processes and technology or systems failures. The Fund and BFA seek to reduce these operational risks through controls and procedures. However, these measures do not address every possible risk and may be
inadequate to address these risks.
Passive
Investment Risk. The Fund is not actively managed and may be affected by a general decline in market segments related to the Underlying Index. The Fund invests in securities included in, or representative of, the
Underlying Index, regardless of their investment merits. BFA generally does not attempt to invest the Fund's assets in defensive positions under any market conditions, including declining markets.
9
Privatization Risk. Some
countries in which the Fund invests have privatized, or have begun the process of privatizing, certain entities and industries. Newly privatized companies may face strong competition from government-sponsored competitors that have not been
privatized. In some instances, investors in newly privatized entities have suffered losses due to the inability of the newly privatized entities to adjust quickly to a competitive environment or changing regulatory and legal standards or, in some
cases, due to re-nationalization of such privatized entities. There is no assurance that similar losses will not recur.
Reliance on Trading Partners Risk. The economies of some countries or regions in which the Fund invests are dependent on trading with certain key trading partners. Reduction in spending on the products and services of these countries or regions,
institution of tariffs or other trade barriers by any of their key trading partners or a slowdown in the economies of any of their key trading partners may cause an adverse impact on the economies of such countries or regions.
Risk of Investing in Emerging Markets. Investments in emerging market issuers are subject to a greater risk of loss than investments in issuers located or operating in more developed markets. This is due to, among other things, the potential for greater
market volatility, lower trading volume, higher levels of inflation, political and economic instability, greater risk of a market shutdown and more governmental limitations on foreign investments in emerging market countries than are typically found
in more developed markets. Moreover, emerging markets often have less uniformity in accounting and reporting requirements, less reliable securities valuations and greater risks associated with custody of securities than developed markets. In
addition, emerging markets often have greater risk of capital controls through such measures as taxes or interest rate control than developed markets. Certain emerging market countries may also lack the infrastructure necessary to attract large
amounts of foreign trade and investment.
Risk of
Investing in Russia. Investing in Russian securities involves significant risks, in addition to those described under “Risk of Investing in Emerging Markets” and “Non-U.S. Securities Risk”
that are not typically associated with investing in U.S. securities, including:
| ■ | The risk of delays in settling portfolio transactions and the risk of loss arising out of the system of share registration and custody used in Russia; |
| ■ | Risks in connection with the maintenance of the Fund’s portfolio securities and cash with foreign sub-custodians and securities depositories, including the risk that appropriate sub-custody arrangements will not be available to the Fund; |
| ■ | The risk that the Fund’s ownership rights in portfolio securities could be lost through fraud or negligence because ownership in shares of Russian companies is recorded by the companies themselves and by registrars, rather than by a central registration system; and |
| ■ | The risk that the Fund may not be able to pursue claims on behalf of its shareholders because of the system of share registration and custody, and because Russian banking institutions and registrars are not guaranteed by the Russian government. |
10
The United States and the Economic Monetary Union of the
European Union (the “EU”), along with the regulatory bodies of a number of countries including Japan, Australia, Norway, Switzerland and Canada (collectively, “Sanctioning Bodies”), have imposed economic sanctions, which
consist of asset freezes and sectoral sanctions on certain Russian individuals and Russian corporate entities. The Sanctioning Bodies could also institute broader sanctions on Russia. These sanctions, or even the threat of further sanctions, may
result in the decline of the value and liquidity of Russian securities, a weakening of the ruble or other adverse consequences to the Russian economy. These sanctions could also result in the immediate freeze of Russian securities, impairing the
ability of the Fund to buy, sell, receive or deliver those securities.
The sanctions against certain Russian issuers include
prohibitions on transacting in or dealing in certain issuances of new debt or new equity of such issuers. Securities held by the Fund issued prior to the date of the sanctions being imposed are not currently subject to any restrictions under the
sanctions. However, compliance with each of these sanctions may impair the ability of the Fund to buy, sell, hold, receive or deliver the affected securities or other securities of such issuers. If it becomes impracticable or unlawful for the Fund
to hold securities subject to, or otherwise affected by, sanctions (collectively, “affected securities”), or if deemed appropriate by BFA, the Fund may prohibit in-kind deposits of the affected securities in connection with creation
transactions and instead require a cash deposit, which may also increase the Fund's transaction costs. The Fund may also be legally required to freeze assets in a blocked account.
Also, if an affected security is included in the Fund’s
Underlying Index, the Fund may, where practicable, seek to eliminate its holdings of the affected security by employing or augmenting its representative sampling strategy to seek to track the investment results of its Underlying Index. The use of
(or increased use of) a representative sampling strategy may increase the Fund’s tracking error risk. If the affected securities constitute a significant percentage of the Underlying Index, the Fund may not be able to effectively implement a
representative sampling strategy, which may result in significant tracking error between the Fund’s performance and the performance of its Underlying Index.
Current or future sanctions may result in Russia taking counter
measures or retaliatory actions, which may further impair the value and liquidity of Russian securities. These retaliatory measures may include the immediate freeze of Russian assets held by the Fund. In the event of such a freeze of any fund
assets, including depositary receipts, the Fund may need to liquidate non-restricted assets in order to satisfy any fund redemption orders. The liquidation of fund assets during this time may also result in the Fund receiving substantially lower
prices for its securities.
These sanctions may also lead
to changes in the Fund’s Underlying Index. The Fund’s Index Provider may remove securities from the Underlying Index or implement caps on the securities of certain issuers that have been subject to recent economic sanctions. In such an
event, it is expected that the Fund will rebalance its portfolio to bring it in line with the Underlying Index as a result of any such changes, which may result in transaction costs and increased tracking error. These sanctions, the volatility that
may result in the trading markets for Russian securities and the possibility that Russia may
11
impose investment or currency controls on investors may cause the Fund to
invest in, or increase the Fund’s investments in, depositary receipts that represent the securities of the Underlying Index. These investments may result in increased transaction costs and increased tracking error.
Risk of Investing in Taiwan.
Investments in Taiwanese issuers may subject the Fund to legal, regulatory, political, currency and economic risks that are specific to Taiwan. Specifically, Taiwan’s geographic proximity and history of political contention with China have
resulted in ongoing tensions between the two countries. These tensions may materially affect the Taiwanese economy and its securities market. Taiwan's economy is export-oriented, so it depends on an open world trade regime and remains vulnerable to
fluctuations in the world economy.
Securities
Lending Risk. The Fund may engage in securities lending. Securities lending involves the risk that the Fund may lose money because the borrower of the loaned securities fails to return the securities in a timely
manner or at all. The Fund could also lose money in the event of a decline in the value of collateral provided for loaned securities or a decline in the value of any investments made with cash collateral. These events could also trigger adverse tax
consequences for the Fund. BlackRock Institutional Trust Company, N.A., the Fund’s securities lending agent, will take into account the tax impact to shareholders of substitute payments for dividends when managing the Fund’s securities
lending program.
Security Risk. Some geographic areas in which the Fund invests have experienced acts of terrorism and strained international relations due to territorial disputes, historical animosities, defense concerns and other security concerns.
These situations may cause uncertainty in the markets of these geographic areas and may adversely affect their economies.
Structural Risk. Certain
emerging market countries are subject to a considerable degree of economic, political and social instability.
Economic Risk. Some emerging
market countries have experienced currency devaluations and substantial (and, in some cases, extremely high) rates of inflation, while others have experienced economic recessions causing a negative effect on the economies and securities markets of
such emerging countries.
Expropriation Risk. Investing in emerging market countries involves a great risk of loss due to expropriation, nationalization, confiscation of assets and property or the imposition of restrictions on foreign investments and repatriation of
capital invested by certain emerging market countries.
Political and Social Risk.
Some governments in emerging market countries are authoritarian in nature or have been installed or removed as a result of military coups, and some governments have periodically used force to suppress civil dissent. Disparities of wealth, the pace
and success of democratization, and ethnic, religious and racial disaffection, may exacerbate social unrest, violence and/or labor unrest in some emerging market countries. Unanticipated political or social developments may result in sudden and
significant investment losses.
Tracking Error Risk. Tracking error is the divergence of a fund’s performance from that of an applicable underlying index. Tracking error may occur because of differences
12
between the securities and other instruments held in a fund’s portfolio
and those included in the applicable underlying index, pricing differences (including, as applicable, differences between a security’s price at the local market close and the fund's valuation of a security at the time of calculation of
the fund's NAV), differences in transaction costs, the fund’s holding of uninvested cash, differences in timing of the accrual of or the valuation of dividends or interest, tax gains or losses, changes to the applicable underlying index or the
costs to the fund of complying with various new or existing regulatory requirements. This risk may be heightened during times of increased market volatility or other unusual market conditions. Tracking error also may result because a fund incurs
fees and expenses, while the applicable underlying index does not. BFA EXPECTS THAT THE FUND MAY EXPERIENCE HIGHER TRACKING ERROR THAN IS TYPICAL FOR SIMILAR INDEX ETFs.
U.S. Economic Risk. The Fund
has significant exposure to U.S. issuers. A decrease in imports or exports, changes in trade regulations and/or an economic recession in the United States may have a material adverse effect on the U.S. economy and the securities listed on U.S.
exchanges. Proposed and adopted policy and legislative changes in the United States are changing many aspects of financial and other regulation and may have a significant effect on the U.S. markets generally, as well as on the value of certain
securities. In addition, a continued rise in the U.S. public debt level or U.S. austerity measures may adversely affect U.S. economic growth and the securities to which the Fund has exposure.
Valuation Risk. The sale price
the Fund could receive for a security or other asset may differ from the Fund's valuation of the security or other asset and from the value used by the Underlying Index, particularly for securities or other assets that trade in low volume
or volatile markets, or that are valued using a fair value methodology. Because non-U.S. exchanges may be open on days when the Fund does not price its shares, the value of the securities or other assets in the Fund’s portfolio may change on
days or during time periods when shareholders will not be able to purchase or sell the Fund’s shares. In addition, for purposes of calculating the Fund's NAV, the value of assets denominated in non-U.S. currencies is converted into U.S.
dollars using prevailing market rates on the date of valuation as quoted by one or more data service providers. This conversion may result in a difference between the prices used to calculate the Fund's NAV and the prices used by the Underlying
Index, which, in turn, could result in a difference between the Fund's performance and the performance of the Underlying Index. Authorized Participants who purchase or redeem Fund shares on days when the Fund is holding fair-valued securities may
receive fewer or more shares or lower or higher redemption proceeds than they would have received if the Fund has not fair-valued securities or had used a different valuation methodology. The Fund’s ability to value investments may be impacted
by technological issues and/or errors by pricing services or other third party service providers.
A Further Discussion of Other Risks
The Fund may also be subject to certain other risks associated
with its investments and investment strategies.
13
African Economic Risk.
Investing in the economies of African countries involves risks not typically associated with investments in securities of issuers in more developed economies, countries or geographic regions that may negatively affect the value of investments in the
Fund. Such heightened risks include, among others, expropriation and/or nationalization of assets, restrictions on and government intervention in international trade, confiscatory taxation, political instability, including authoritarian and/or
military involvement in governmental decision making, armed conflict, civil war, and social instability as a result of religious, ethnic and/or socioeconomic unrest.
The securities markets in Africa are underdeveloped and are
often considered to be less correlated to global economic cycles than markets located in more developed economies, countries or geographic regions. Securities markets in African countries are subject to greater risks associated with market
volatility, lower market capitalization, lower trading volume, illiquidity, inflation, greater price fluctuations, uncertainty regarding the existence of trading markets, governmental control and heavy regulation of labor and industry. Moreover,
trading on African securities markets may be suspended altogether.
Certain governments in African countries may restrict or
control to varying degrees the ability of foreign investors to invest in securities of issuers located or operating in those countries. Moreover, certain countries in Africa may require governmental approval or special licenses prior to investment
by foreign investors; may limit the amount of investment by foreign investors in a particular industry and/or issuer; may limit such foreign investment to a certain class of securities of an issuer that may have less advantageous rights than the
classes available for purchase by domestic investors of those countries; and/or may impose additional taxes on foreign investors. These factors, among others, make investing in issuers located or operating in countries in Africa significantly
riskier than investing in issuers located or operating in more developed countries.
Basic Materials Industry Risk.
Issuers in the basic materials industry may be adversely affected by commodity price volatility, exchange rates, import controls and increased competition. Production of industrial materials often exceeds demand as a result of over-building or
economic downturns, leading to poor investment returns. Issuers in the basic materials industry are at risk for environmental damage and product liability claims and may be adversely affected by depletion of resources, delays in technical progress,
labor relations and government regulations.
Borrowing Risk. Borrowing may
exaggerate changes in the net asset value of Fund shares and in the return on the Fund’s portfolio. Borrowing will cost the Fund interest expense and other fees. The costs of borrowing may reduce the Fund’s return. Borrowing may also
cause the Fund to liquidate positions when it may not be advantageous to do so to satisfy its obligations.
Central and South American Economic Risk. The economies of certain Central and South American countries have experienced high interest rates, economic volatility, inflation, currency devaluations, government defaults and high unemployment rates. In addition,
commodities (such as oil, gas and minerals) represent a significant percentage of the region's exports and many economies in these regions are
14
particularly sensitive to fluctuations in commodity prices. Adverse economic
events in one country may have a significant adverse effect on other countries of these regions.
Close-out Risk for Qualified Financial Contracts. Recently adopted regulations of the prudential regulators, which are scheduled to take effect with respect to the Fund in 2019, will require counterparties that are part of U.S. or foreign global systemically important
banking organizations to include contractual restrictions on close-out and cross-default in agreements relating to qualified financial contracts. Qualified financial contracts include agreements relating to swaps, currency forwards and other
derivatives as well as repurchase agreements and securities lending agreements. The restrictions prevent the Fund from closing out a qualified financial contract during a specified time period if the counterparty is subject to resolution proceedings
and prohibit the Fund from exercising default rights due to a receivership or similar proceeding of an affiliate of the counterparty. Implementation of these requirements may increase credit and other risks to the Fund.
Consumer Discretionary Sector Risk. The success of consumer product manufacturers and retailers is tied closely to the performance of domestic and international economies, interest rates, exchange rates, competition, consumer confidence, changes in
demographics and consumer preferences. Companies in the consumer discretionary sector depend heavily on disposable household income and consumer spending, and may be strongly affected by social trends and marketing campaigns. These companies may be
subject to severe competition, which may have an adverse impact on their profitability.
Consumer Services Industry
Risk. The success of consumer product manufacturers and retailers (including food and drug retailers, general retailers, media, and travel and leisure companies) is tied closely to the performance of the domestic
and international economies, interest rates, exchange rates and consumer confidence. The consumer services industry depends heavily on disposable household income and consumer spending. Companies in the consumer services industry may be subject to
severe competition, which may also have an adverse impact on their profitability. Changes in consumer demographics and preferences in the countries in which the issuers of securities held by the Fund are located and in the countries to which they
export their products may affect the success of consumer products.
Eastern European Economic Risk.
An investment in issuers located or operating in Eastern Europe may subject the Fund to legal, regulatory, political, currency, security and economic risks specific to Eastern Europe. Economies of certain Eastern
European countries rely heavily on the export of commodities, including oil, gas, and certain metals. As a result, such economies may be impacted by international commodity prices and are particularly vulnerable to global demand for these products.
Geopolitical events, acts of terrorism, and other instability in certain Eastern European countries may cause uncertainty in their financial markets and adversely affect the performance of the issuers to which the Fund has exposure. The securities
markets in some Eastern European countries are substantially smaller and less developed, with less government supervision and regulation of stock exchanges, and may be less liquid and more
15
volatile than securities markets in the United States or Western European
countries. In addition, investing in securities of issuers located or operating in Eastern Europe may involve:
| ■ | The risk of delays in settling portfolio transactions and the risk of loss arising out of the system of share registration and custody used in certain Eastern European countries; |
| ■ | Risks in connection with the maintenance of the Fund's portfolio securities and cash with foreign sub-custodians and securities depositories, including the risk that appropriate sub-custody arrangements will not be available to the Fund; |
| ■ | The risk that the Fund's ownership rights in portfolio securities could be lost through fraud or negligence as a result of the fact that ownership in shares of certain Eastern European companies is recorded by the companies themselves and by registrars, rather than a central registration system; |
| ■ | The risk that the Fund may not be able to pursue claims on behalf of its shareholders because of the system of share registration and custody, and because certain Eastern European banking institutions and registrars are not guaranteed by their respective governments; and |
| ■ | Risks in connection with Eastern European countries' dependence on the economic health of Western European countries and the European Union (“EU”) as a whole. |
Other risks related to investing in securities of issuers
located or operating in Eastern Europe include: the potential absence of legal structures governing private and foreign investments and private property; the possibility of the loss of all or a substantial portion of the Fund’s assets invested
in issuers located or operating in Eastern Europe as a result of expropriation; and certain national policies which may restrict the Fund’s investment opportunities, including, without limitation, restrictions on investing in issuers or
industries deemed sensitive to relevant national interests.
Information Technology Sector Risk. Information technology companies face intense competition, both domestically and internationally, which may have an adverse effect on their profit margins. Like other technology companies, information technology
companies may have limited product lines, markets, financial resources or personnel. The products of information technology companies may face obsolescence due to rapid technological developments, frequent new product introduction, unpredictable
changes in growth rates and competition for the services of qualified personnel. Companies in the information technology sector are heavily dependent on patent and intellectual property rights. The loss or impairment of these rights may adversely
affect the profitability of these companies.
Materials Sector Risk.
Companies in the materials sector may be adversely affected by commodity price volatility, exchange rates, import controls, increased competition, depletion of resources, technical advances, labor relations, over-production, litigation and
government regulations, among other factors. Companies in the materials sector are also at risk of liability for environmental damage and product liability claims. Production of materials may exceed demand as a result of market imbalances or
economic downturns, leading to poor investment returns.
16
Oil and Gas Industry Risk. The
profitability of companies in the oil and gas industry is related to worldwide energy prices, exploration costs and production spending. Companies in the oil and gas industry may be at risk for environmental damage claims and other types of
litigation. Companies in the oil and gas industry may be adversely affected by: natural disasters or other catastrophes; changes in exchange rates or interest rates; prices for competitive energy services, economic conditions, tax treatment, or
government regulation; government intervention; negative public perception; or unfavorable events in the regions where companies operate (e.g.,
expropriation, nationalization, confiscation of assets and property, imposition of restrictions on foreign investments or repatriation of capital, military coups, social or political unrest, violence or labor unrest). Companies in the oil and gas
industry may have significant capital investments in, or engage in transactions involving, emerging market countries, which may heighten these risks. Companies that own or operate gas pipelines are subject to certain risks, including pipeline and
equipment leaks and ruptures, explosions, fires, unscheduled downtime, transportation interruptions, discharges or releases of toxic or hazardous gases and other environmental risks.
Real Estate Investment Risk.
The Fund may invest in companies that invest in real estate (“Real Estate Companies”), such as REITs or real estate holding companies, which expose investors to the risks of owning real estate directly, as well as to risks that
relate specifically to the way in which Real Estate Companies are organized and operated. Real estate is highly sensitive to general and local economic conditions and developments and is characterized by intense competition and periodic
overbuilding. Many Real Estate Companies, including REITs, utilize leverage (and some may be highly leveraged), which increases investment risk and the risk normally associated with debt financing, and could potentially increase the Fund’s
losses.
Concentration Risk. Real Estate Companies may own a limited number of properties and concentrate their investments in a particular geographic region, industry or property type. Economic downturns affecting a particular region, industry or
property type may lead to a high volume of defaults within a short period.
Equity REITs Risk. Certain
REITs may make direct investments in real estate. These REITs are often referred to as “Equity REITs.” Equity REITs invest primarily in real properties and may earn rental income from leasing those properties. Equity REITs may also
realize gains or losses from the sale of properties. Equity REITs will be affected by conditions in the real estate rental market and by changes in the value of the properties they own. A decline in rental income may occur because of extended
vacancies, limitations on rents, the failure to collect rents, increased competition from other properties or poor management. Equity REITs also can be affected by rising interest rates. Rising interest rates may cause investors to demand a high
annual yield from future distributions that, in turn, could decrease the market prices for such REITs and for the properties held by such REITs. In addition, rising interest rates also increase the costs of obtaining financing for real estate
projects. Because many real estate projects are dependent upon receiving financing, this could cause the value of the Equity REITs in which the Fund invests to decline.
Interest Rate Risk. Rising
interest rates could result in higher costs of capital for Real Estate Companies, which could negatively affect a Real Estate Company’s ability to
17
meet its payment obligations. Declining interest rates could result in
increased prepayment on loans and require redeployment of capital in less desirable investments.
Leverage Risk. Real Estate
Companies may use leverage (and some may be highly leveraged), which increases investment risk and the risks normally associated with debt financing and could adversely affect a Real Estate Company’s operations and market value in periods of
rising interest rates. Financial covenants related to a Real Estate Company’s leveraging may affect the ability of the Real Estate Company to operate effectively. In addition, investments may be subject to defaults by borrowers and tenants.
Leveraging may also increase repayment risk.
Liquidity Risk. Investing in
Real Estate Companies may involve risks similar to those associated with investing in small-capitalization companies. Real Estate Company securities may be volatile. There may be less trading in Real Estate Company shares, which means that purchase
and sale transactions in those shares could have a magnified impact on share price, resulting in abrupt or erratic price fluctuations. In addition, real estate is relatively illiquid and, therefore, a Real Estate Company may have a limited ability
to vary or liquidate its investments in properties in response to changes in economic or other conditions.
Loan Foreclosure Risk. Real
Estate Companies may foreclose on loans that the Real Estate Company originated and acquired. Foreclosure may generate negative publicity for the underlying property that affects its market value. In addition to length and expense, foreclosure
proceedings may not fully uphold the validity of all of the terms of the applicable loan.
Operational Risk. Real Estate
Companies are dependent upon management skills and may have limited financial resources. Real Estate Companies are generally not diversified and may be subject to heavy cash flow dependency, default by borrowers and self-liquidation. In addition,
transactions between Real Estate Companies and their affiliates may be subject to conflicts of interest, which may adversely affect a Real Estate Company’s shareholders. A Real Estate Company may also have joint ventures in certain of its
properties and, consequently, its ability to control decisions relating to such properties may be limited.
Property Risk. Real Estate
Companies may be subject to risks relating to functional obsolescence or reduced desirability of properties; extended vacancies due to economic conditions and tenant bankruptcies; catastrophic events such as earthquakes, hurricanes, tornadoes and
terrorist acts; eminent domain seizures; and casualty or condemnation losses. Real estate income and values also may be greatly affected by demographic trends, such as population shifts, changing tastes and values, increasing vacancies or declining
rents resulting from legal, cultural, technological, global or local economic developments.
Regulatory Risk. Real estate
income and values may be adversely affected by applicable domestic and foreign laws (including tax laws). Government actions, such as tax increases, zoning law changes or environmental regulations also may have a major impact on real
estate.
18
Repayment Risk. The prices of
Real Estate Company securities may drop because of the failure of borrowers to repay their loans, poor management, or the inability to obtain financing either on favorable terms or at all. If the properties do not generate sufficient income to meet
operating expenses, including, where applicable, debt service, ground lease payments, tenant improvements, third-party leasing commissions and other capital expenditures, the income and ability of the Real Estate Companies to make payments of
interest and principal on their loans will be adversely affected.
Small-Capitalization Companies Risk. Stock prices of small-capitalization companies may be more volatile than those of larger companies and, therefore, the Fund's share price may be more volatile than those of funds that invest a larger percentage of their
assets in stocks issued by mid- or large-capitalization companies. Stock prices of small-capitalization companies are generally more vulnerable than those of mid- or large-capitalization companies to adverse business and economic developments.
Securities of small-capitalization companies may be thinly traded, making it difficult for the Fund to buy and sell them. In addition, small-capitalization companies are typically less financially stable than larger, more established companies and
may depend on a small number of essential personnel, making these companies more vulnerable to experiencing adverse effects due to the loss of personnel. Small-capitalization companies also normally have less diverse product lines than those of mid-
or large-capitalization companies and are more susceptible to adverse developments concerning their products.
Technology Sector Risk.
Technology companies, including information technology companies, face intense competition, both domestically and internationally, which may have an adverse effect on a company’s profit margins. Technology companies may have limited product
lines, markets, financial resources and/or personnel. The products of technology companies may face obsolescence due to rapid technological developments, frequent new product introduction, unpredictable changes in growth rates and competition for
the services of qualified personnel. Companies in the technology sector are heavily dependent on patent and other intellectual property rights. A technology company’s loss or impairment of these rights may adversely affect the company’s
profitability. The technology sector may also be adversely affected by changes or trends in commodity prices, which may be influenced or characterized by unpredictable factors.
Telecommunications Sector Risk.
The telecommunications sector is subject to extensive government regulation. The costs of complying with governmental regulations, delays or failure to receive required regulatory approvals, or the enactment of new regulatory requirements may
negatively affect the business of telecommunications companies. Government actions around the world, specifically in the area of pre-marketing clearance of products and prices, can be arbitrary and unpredictable. Companies in the telecommunications
sector may encounter distressed cash flows due to the need to commit substantial capital to meet increasing competition, particularly in developing new products and services using new technology. Technological innovations may make the products and
services of certain telecommunications companies obsolete. Telecommunications providers are generally
19
required to obtain franchises or licenses in order to provide services in a
given location. Licensing and franchise rights in the telecommunications sector are limited, which may provide an advantage to certain participants. Limited availability of such rights, high barriers to market entry and regulatory oversight, among
other factors, have led to consolidation of companies within the sector, which could lead to further regulation or other negative effects in the future.
Utilities Sector Risk.
Companies in the utilities sector may be adversely affected by changes in exchange rates, domestic and international competition, and governmental limitations on rates charged to customers. The value of regulated utility debt securities (and, to a
lesser extent, equity securities) tends to have an inverse relationship to the movement of interest rates. Deregulation may subject utility companies to greater competition and may adversely affect their profitability. As deregulation allows utility
companies to diversify outside of their original geographic regions and their traditional lines of business, utility companies may engage in riskier ventures. In addition, deregulation may eliminate restrictions on the profits of certain utility
companies, but may also subject these companies to greater risk of loss. Companies in the utilities industry may have difficulty obtaining an adequate return on invested capital, raising capital, or financing large construction projects during
periods of inflation or unsettled capital markets; face restrictions on operations and increased cost and delays attributable to environmental considerations and regulation; find that existing plants, equipment or products have been rendered
obsolete by technological innovations; or be subject to increased costs because of the scarcity of certain fuels or the effects of man-made or natural disasters. Existing and future regulations or legislation may make it difficult for utility
companies to operate profitably. Government regulators monitor and control utility revenues and costs, and therefore may limit utility profits. In certain countries, regulatory authorities may also restrict utility companies’ access to new
markets, thereby diminishing these companies’ long-term prospects. There is no assurance that regulatory authorities will grant rate increases in the future or that such increases will be adequate to permit the payment of dividends on stocks
issued by a utility company. Energy conservation and changes in climate policy may also have a significant adverse impact on the revenues and expenses of utility companies.
Portfolio Holdings Information
A description of the Company's policies and procedures with
respect to the disclosure of the Fund’s portfolio securities is available in the Fund's Statement of Additional Information (“SAI”). The top holdings of the Fund can be found at www.iShares.com. Fund fact sheets provide information
regarding the Fund's top holdings and may be requested by calling 1-800-iShares (1-800-474-2737).
Management
Investment Adviser. As
investment adviser, BFA has overall responsibility for the general management and administration of the Fund. BFA provides an investment program for the Fund and manages the investment of the Fund’s assets. In managing the Fund, BFA may draw
upon the research and expertise of its asset management affiliates with respect to certain portfolio securities. In seeking to achieve the Fund's
20
investment objective, BFA uses teams of portfolio managers, investment
strategists and other investment specialists. This team approach brings together many disciplines and leverages BFA’s extensive resources.
Pursuant to the Investment Advisory Agreement between BFA and
the Company (entered into on behalf of the Fund), BFA is responsible for substantially all expenses of the Fund, except the management fees, interest expenses, taxes, expenses incurred with respect to the acquisition and disposition of portfolio
securities and the execution of portfolio transactions, including brokerage commissions, distribution fees or expenses, litigation expenses and any extraordinary expenses (as determined by a majority of the Directors who are not “interested
persons” of the Company).
For its investment
advisory services to the Fund, BFA is paid a management fee from the Fund based on a percentage of the Fund's average daily net assets, at the annual rate of 0.49%. BFA has contractually agreed to waive a portion of its management fees in an amount
equal to the aggregate Acquired Fund Fees and Expenses, if any, attributable to the Fund's investments in other series of iShares Trust and the Company through August 31, 2022. The contractual waiver may be terminated prior to August 31, 2022 only
upon written agreement of the Company and BFA. In addition, BFA may from time to time voluntarily waive and/or reimburse fees or expenses in order to limit total annual fund operating expenses (excluding Acquired Fund Fees and Expenses, if any). Any
such voluntary waiver or reimbursement may be eliminated by BFA at any time.
BFA is located at 400 Howard Street, San Francisco, CA 94105.
It is an indirect wholly-owned subsidiary of BlackRock, Inc. (“BlackRock”). As of June 30, 2017, BFA and its affiliates provided investment advisory services for assets in excess of $5.6 trillion. BFA and its affiliates trade and invest
for their own accounts in the actual securities and types of securities in which the Fund may also invest, which may affect the price of such securities.
A discussion regarding the basis for the approval by the
Company's Board of Directors (the “Board”) of the Investment Advisory Agreement with BFA is available in the Fund's semi-annual report for the period ended October 31.
Portfolio Managers. Diane
Hsiung, Jennifer Hsui, Alan Mason and Greg Savage are primarily responsible for the day-to-day management of the Fund. Each Portfolio Manager is responsible for various functions related to portfolio management, including, but not limited to,
investing cash inflows, coordinating with members of his or her portfolio management team to focus on certain asset classes, implementing investment strategy, researching and reviewing investment strategy and overseeing members of his or her
portfolio management team that have more limited responsibilities.
Diane Hsiung has been employed by BFA as a senior portfolio
manager since 2007. Prior to that, Ms. Hsiung was a portfolio manager from 2002 to 2006 for Barclays Global Fund Advisors (“BGFA”). Ms. Hsiung has been a Portfolio Manager of the Fund since 2012.
21
Jennifer Hsui has been employed by BFA as a senior portfolio
manager since 2007. Prior to that, Ms. Hsui was a portfolio manager from 2006 to 2007 for BGFA. Ms. Hsui has been a Portfolio Manager of the Fund since 2012.
Alan Mason has been employed by BFA as a portfolio manager
since 1991. Mr. Mason has been a Portfolio Manager of the Fund since 2016.
Greg Savage has been employed by BFA as a senior portfolio
manager since 2006. Prior to that, Mr. Savage was a portfolio manager from 2001 to 2006 for BGFA. Mr. Savage has been a Portfolio Manager of the Fund since 2012.
The Fund's SAI provides additional information about the
Portfolio Managers' compensation, other accounts managed by the Portfolio Managers and the Portfolio Managers' ownership (if any) of shares in the Fund.
Administrator, Custodian and Transfer Agent. State Street Bank and Trust Company (“State Street”) is the administrator, custodian and transfer agent for the Fund.
Conflicts of Interest. The
investment activities of BFA and its affiliates (including BlackRock and The PNC Financial Services Group, Inc., and their affiliates, directors, partners, trustees, managing members, officers and employees (collectively, the
“Affiliates”)) in the management of, or their interest in, their own accounts and other accounts they manage, may present conflicts of interest that could disadvantage the Fund and its shareholders. BFA and the other Affiliates provide
investment management services to other funds and discretionary managed accounts that may follow investment programs similar to that of the Fund. BFA and the other Affiliates are involved worldwide with a broad spectrum of financial services and
asset management activities and may engage in the ordinary course of business in activities in which their interests or the interests of their clients may conflict with those of the Fund. BFA or one or more of the other Affiliates acts, or may act,
as an investor, investment banker, research provider, investment manager, commodity pool operator, commodity trading advisor, financier, underwriter, adviser, market maker, trader, prime broker, lender, agent or principal, and have other direct and
indirect interests in securities, currencies, commodities, derivatives and other instruments in which the Fund may directly or indirectly invest. Thus, it is likely that the Fund will have multiple business relationships with and will invest in,
engage in transactions with, make voting decisions with respect to, or obtain services from, entities for which BFA or an Affiliate performs or seeks to perform investment banking or other services. Specifically, the Fund may invest in securities
of, or engage in other transactions with, companies with which an Affiliate has developed or is trying to develop investment banking relationships or in which an Affiliate has significant debt or equity investments or other interests. The Fund also
may invest in securities of, or engage in other transactions with, companies for which an Affiliate provides or may in the future provide research coverage. An Affiliate may have business relationships with, and purchase, distribute or sell services
or products from or to, distributors, consultants or others who recommend the Fund or who engage in transactions with or for the Fund, and may receive compensation for such services. The Fund may also make brokerage and other payments to Affiliates
in connection with the Fund's portfolio investment transactions.
22
BFA or an Affiliate may engage in proprietary trading and
advise accounts and funds that have investment objectives similar to those of the Fund and/or that engage in and compete for transactions in the same types of securities, currencies and other instruments as the Fund, including securities issued by
other open-end and closed-end investment companies (which may include investment companies that are affiliated with the Fund and BFA, to the extent permitted under the Investment Company Act of 1940, as amended (the “1940 Act”)). The
trading activities of BFA and these Affiliates are carried out without reference to positions held directly or indirectly by the Fund and may result in BFA or an Affiliate having positions in certain securities that are senior or junior to, or
having interests different from or adverse to, the securities that are owned by the Fund.
No Affiliate is under any obligation to share any investment
opportunity, idea or strategy with the Fund. As a result, an Affiliate may compete with the Fund for appropriate investment opportunities. The results of the Fund's investment activities, therefore, may differ from those of an Affiliate and of other
accounts managed by an Affiliate, and it is possible that the Fund could sustain losses during periods in which one or more Affiliates and other accounts achieve profits on their trading for proprietary or other accounts. The opposite result is also
possible.
In addition, the Fund may, from time to time,
enter into transactions in which BFA’s or an Affiliate’s other clients have an adverse interest. Furthermore, transactions undertaken by Affiliate-advised clients may adversely impact the Fund. Transactions by one or more
Affiliate-advised clients or by BFA may have the effect of diluting or otherwise disadvantaging the values, prices or investment strategies of the Fund.
The Fund's activities may be limited because of regulatory
restrictions applicable to one or more Affiliates and/or their internal policies designed to comply with such restrictions.
Under a securities lending program approved by the Board, the
Fund has retained an Affiliate of BFA to serve as the securities lending agent for the Fund to the extent that the Fund participates in the securities lending program. For these services, the securities lending agent will retain a share of the
securities lending revenues. BFA or an Affiliate will also receive compensation for managing the reinvestment of cash collateral. In addition, one or more Affiliates may be among the entities to which the Fund may lend its portfolio securities under
the securities lending program.
The activities of BFA or
the Affiliates may give rise to other conflicts of interest that could disadvantage the Fund and its shareholders. BFA has adopted policies and procedures designed to address these potential conflicts of interest. See the Fund's SAI for further
information.
Shareholder Information
Additional shareholder information, including how to buy and
sell shares of the Fund, is available free of charge by calling toll-free: 1-800-iShares (1-800-474-2737) or visiting our website at www.iShares.com.
Buying and Selling Shares.
Shares of the Fund may be acquired or redeemed directly from the Fund only in Creation Units or multiples thereof, as discussed in the Creations
23
and Redemptions section of this Prospectus.
Only an Authorized Participant (as defined in the Creations and Redemptions section below) may engage in creation or redemption transactions directly with the Fund. Once created, shares of the Fund generally
trade in the secondary market in amounts less than a Creation Unit.
Shares of the Fund are listed on a national securities exchange
for trading during the trading day. Shares can be bought and sold throughout the trading day like shares of other publicly-traded companies. The Company does not impose any minimum investment for shares of the Fund purchased on an exchange or
otherwise in the secondary market. The Fund's shares trade under the trading symbol “DVYE.”
Buying or selling Fund shares on an exchange or other secondary
market involves two types of costs that may apply to all securities transactions. When buying or selling shares of the Fund through a broker, you may incur a brokerage commission and other charges. The commission is frequently a fixed amount and may
be a significant proportional cost for investors seeking to buy or sell small amounts of shares. In addition, you may incur the cost of the “spread,” that is, any difference between the bid price and the ask price. The spread varies over
time for shares of the Fund based on the Fund’s trading volume and market liquidity, and is generally lower if the Fund has high trading volume and market liquidity, and higher if the Fund has little trading volume and market liquidity (which
is often the case for funds that are newly launched or small in size). The Fund's spread may also be impacted by the liquidity of the underlying securities held by the Fund, particularly for newly launched or smaller funds or in instances of
significant volatility of the underlying securities.
The
Board has adopted a policy of not monitoring for frequent purchases and redemptions of Fund shares (“frequent trading”) that appear to attempt to take advantage of a potential arbitrage opportunity presented by a lag between a change in
the value of the Fund’s portfolio securities after the close of the primary markets for the Fund’s portfolio securities and the reflection of that change in the Fund’s NAV (“market timing”), because the Fund sells and
redeems its shares directly through transactions that are in-kind and/or for cash, subject to the conditions described below under Creations and Redemptions. The Board has not adopted a policy of monitoring
for other frequent trading activity because shares of the Fund are listed for trading on a national securities exchange.
The national securities exchange on which the Fund's shares are
listed is open for trading Monday through Friday and is closed on weekends and the following holidays (or the days on which they are observed): New Year’s Day, Martin Luther King, Jr. Day, Presidents’ Day, Good Friday, Memorial Day,
Independence Day, Labor Day, Thanksgiving Day and Christmas Day. The Fund’s primary listing exchange is NYSE Arca.
Section 12(d)(1) of the 1940 Act restricts investments by
investment companies in the securities of other investment companies. Registered investment companies are permitted to invest in the Fund beyond the limits set forth in Section 12(d)(1), subject to certain terms and conditions set forth in SEC rules
or in an SEC exemptive order issued to the Company. In order for a registered investment company to invest in shares of the Fund beyond the limitations of Section 12(d)(1) pursuant to the
24
exemptive relief obtained by the Company, the registered investment company
must enter into an agreement with the Company.
Book Entry. Shares of the Fund are held in book-entry form, which means that no stock certificates are issued. The Depository Trust Company (“DTC”) or its nominee is the record owner of all outstanding shares of the
Fund and holds legal title to all shares.
Investors owning shares of the Fund are beneficial owners as
shown on the records of DTC or its participants. DTC serves as the securities depository for shares of the Fund. DTC participants include securities brokers and dealers, banks, trust companies, clearing corporations and other institutions that
directly or indirectly maintain a custodial relationship with DTC. As a beneficial owner of shares, you are not entitled to receive physical delivery of stock certificates or to have shares registered in your name, and you are not considered a
registered owner of shares. Therefore, to exercise any right as an owner of shares, you must rely upon the procedures of DTC and its participants. These procedures are the same as those that apply to any other registered investment company
securities that you hold in book-entry or “street name” form.
Share Prices. The trading
prices of the Fund’s shares in the secondary market generally differ from the Fund’s daily NAV and are affected by market forces such as the supply of and demand for ETF shares and shares of underlying securities held by the Fund,
economic conditions and other factors. Information regarding the intraday value of shares of the Fund, also known as the “indicative optimized portfolio value” (“IOPV”), is disseminated every 15 seconds throughout each
trading day by the national securities exchange on which the Fund's shares are listed or by market data vendors or other information providers. The IOPV is based on the current market value of the securities or other assets and/or cash required to
be deposited in exchange for a Creation Unit. The IOPV does not necessarily reflect the precise composition of the current portfolio of securities or other assets held by the Fund at a particular point in time or the best possible valuation of the
current portfolio. Therefore, the IOPV should not be viewed as a “real-time” update of the Fund's NAV, which is computed only once a day. The IOPV is generally determined by using both current market quotations and/or price quotations
obtained from broker-dealers and other market intermediaries that may trade in the portfolio securities or other assets held by the Fund. The quotations of certain Fund holdings may not be updated during U.S. trading hours if such holdings do not
trade in the United States. The Fund is not involved in, or responsible for, the calculation or dissemination of the IOPV and makes no representation or warranty as to its accuracy.
Determination of Net Asset Value. The NAV of the Fund normally is determined once daily Monday through Friday, generally as of the regularly scheduled close of business of the New York Stock Exchange (“NYSE”) (normally 4:00 p.m., Eastern
time) on each day that the NYSE is open for trading, based on prices at the time of closing, provided that (i) any Fund assets or liabilities denominated in currencies other than the U.S. dollar are translated into U.S. dollars at the prevailing
market rates on the date of valuation as quoted by one or more data service providers (as detailed below) and (ii) U.S. fixed-income assets may be valued as of the announced closing time for trading in
25
fixed-income instruments in a particular market or exchange. The NAV of the
Fund is calculated by dividing the value of the net assets of the Fund (i.e., the value of its total assets less total liabilities) by the total number of outstanding shares of the Fund, generally rounded to
the nearest cent.
The value of the securities and other
assets and liabilities held by the Fund are determined pursuant to valuation policies and procedures approved by the Board.
Equity investments and other instruments for which market
quotations are readily available, as well as investments in an underlying fund, if any, are valued at market value, which is generally determined using the last reported official closing price or, if a reported closing price is not available, the
last traded price on the exchange or market on which the security is primarily traded at the time of valuation.
The Fund invests in non-U.S. securities. Foreign currency
exchange rates with respect to the portfolio securities denominated in non-U.S. currencies are generally determined as of 4:00 p.m., London time. Non-U.S. securities held by the Fund may trade on weekends or other days when the Fund does not price
its shares. As a result, the Fund’s NAV may change on days when Authorized Participants (as defined in the Creations and Redemptions section of this Prospectus) will not be able to purchase or redeem
Fund shares.
Generally, trading in non-U.S. securities,
U.S. government securities, money market instruments and certain fixed-income securities is substantially completed each day at various times prior to the close of business on the NYSE. The values of such securities used in computing the NAV of the
Fund are determined as of such times.
When market
quotations are not readily available or are believed by BFA to be unreliable, the Fund’s investments are valued at fair value. Fair value determinations are made by BFA in accordance with policies and procedures approved by the Board. BFA may
conclude that a market quotation is not readily available or is unreliable if a security or other asset or liability does not have a price source due to its lack of liquidity or other reasons, if a market quotation differs significantly from recent
price quotations or otherwise no longer appears to reflect fair value, where the security or other asset or liability is thinly traded, when there is a significant event subsequent to the most recent market quotation, or if the trading market on
which a security is listed is suspended or closed and no appropriate alternative trading market is available. A “significant event” is deemed to occur if BFA determines, in its reasonable business judgment prior to or at the time of
pricing the Fund’s assets or liabilities, that the event is likely to cause a material change to the closing market price of one or more assets or liabilities held by the Fund. Non-U.S. securities whose values are affected by volatility that
occurs in the local markets or in related or highly correlated assets (e.g., American Depositary Receipts, Global Depositary Receipts or substantially identical ETFs) on a trading day after the close of
non-U.S. securities markets may be fair valued.
Fair
value represents a good faith approximation of the value of an asset or liability. The fair value of an asset or liability held by the Fund is the amount the Fund might reasonably expect to receive from the current sale of that asset or the cost to
extinguish that liability in an arm’s-length transaction. Valuing the Fund’s investments
26
using fair value pricing will result in prices that may differ from current
market valuations and that may not be the prices at which those investments could have been sold during the period in which the particular fair values were used. Use of fair value prices and certain current market valuations could result in a
difference between the prices used to calculate the Fund’s NAV and the prices used by the Underlying Index, which, in turn, could result in a difference between the Fund’s performance and the performance of the Underlying Index.
The value of assets or liabilities denominated in non-U.S.
currencies will be converted into U.S. dollars using prevailing market rates on the date of valuation as quoted by one or more data service providers. Use of a rate different from the rate used by the Index Provider may adversely affect the
Fund’s ability to track the Underlying Index.
Dividends and Distributions
General Policies. Dividends
from net investment income, if any, generally are declared and paid at least once a year by the Fund. Distributions of net realized securities gains, if any, generally are declared and paid once a year, but the Company may make distributions on a
more frequent basis for the Fund. The Company reserves the right to declare special distributions if, in its reasonable discretion, such action is necessary or advisable to preserve its status as a regulated investment company (“RIC”) or
to avoid imposition of income or excise taxes on undistributed income or realized gains.
Dividends and other distributions on shares of the Fund are
distributed on a pro rata basis to beneficial owners of such shares. Dividend payments are made through DTC participants and indirect participants to beneficial owners then of record with proceeds received
from the Fund.
Dividend Reinvestment Service. No dividend reinvestment service is provided by the Company. Broker-dealers may make available the DTC book-entry Dividend Reinvestment Service for use by beneficial owners of the Fund for reinvestment of their dividend
distributions. Beneficial owners should contact their broker to determine the availability and costs of the service and the details of participation therein. Brokers may require beneficial owners to adhere to specific procedures and timetables. If
this service is available and used, dividend distributions of both income and realized gains will be automatically reinvested in additional whole shares of the Fund purchased in the secondary market.
Taxes. As with any investment,
you should consider how your investment in shares of the Fund will be taxed. The tax information in this Prospectus is provided as general information, based on current law. You should consult your own tax professional about the tax consequences of
an investment in shares of the Fund.
Unless your
investment in Fund shares is made through a tax-exempt entity or tax-deferred retirement account, such as an IRA, in which case your distributions generally will be taxable when withdrawn, you need to be aware of the possible tax consequences when
the Fund makes distributions or you sell Fund shares.
Taxes
on Distributions. Distributions from the Fund’s net investment income (other than qualified dividend income), including distributions of income from securities lending and distributions out of the
Fund’s net short-term capital gains, if any, are taxable to you as ordinary income. Distributions by the Fund of net long-term capital
27
gains, if any, in excess of net short-term capital losses (capital gain
dividends) are taxable to you as long-term capital gains, regardless of how long you have held the Fund’s shares. Distributions by the Fund that qualify as qualified dividend income are taxable to you at long-term capital gain rates. Long-term
capital gains and qualified dividend income are generally eligible for taxation at a maximum rate of 15% for non-corporate shareholders with incomes below approximately $418,000 ($471,000 if married and filing jointly), adjusted annually for
inflation, and 20% for individuals with any income above these amounts that is net long-term capital gain or qualified dividend income. In addition, a 3.8% U.S. federal Medicare contribution tax is imposed on “net investment income,”
including, but not limited to, interest, dividends, and net gain, of U.S. individuals with income exceeding $200,000 (or $250,000 if married and filing jointly) and of estates and trusts.
Dividends will be qualified dividend income to you if they are
attributable to qualified dividend income received by the Fund. Generally, qualified dividend income includes dividend income from taxable U.S. corporations and qualified non-U.S. corporations, provided that the Fund satisfies certain holding period
requirements in respect of the stock of such corporations and has not hedged its position in the stock in certain ways. Substitute dividends received by the Fund with respect to dividends paid on securities lent out will not be qualified dividend
income. For this purpose, a qualified non-U.S. corporation means any non-U.S. corporation that is eligible for benefits under a comprehensive income tax treaty with the United States, which includes an exchange of information program, or if the
stock with respect to which the dividend was paid is readily tradable on an established United States securities market. The term excludes a corporation that is a passive foreign investment company.
Dividends received by the Fund from a REIT or another RIC
generally are qualified dividend income only to the extent such dividend distributions are made out of qualified dividend income received by such REIT or RIC. It is expected that dividends received by the Fund from a REIT and distributed to a
shareholder generally will be taxable to the shareholder as ordinary income.
For a dividend to be treated as qualified dividend income, the
dividend must be received with respect to a share of stock held without being hedged by the Fund, and with respect to a share of the Fund held without being hedged by you, for 61 days during the 121-day period beginning at the date which is 60 days
before the date on which such share becomes ex-dividend with respect to such dividend or, in the case of certain preferred stock, 91 days during the 181-day period beginning 90 days before such date.
In general, your distributions are subject to U.S. federal
income tax for the year when they are paid. Certain distributions paid in January, however, may be treated as paid on December 31 of the prior year.
If the Fund’s distributions exceed current and
accumulated earnings and profits, all or a portion of the distributions made in the taxable year may be recharacterized as a return of capital to shareholders. Distributions in excess of the Fund’s minimum distribution requirements, but not in
excess of the Fund’s earnings and profits, will be taxable to shareholders and will not constitute nontaxable returns of capital. A return of capital distribution generally will not be taxable but will reduce the shareholder’s
28
cost basis and result in a higher capital gain or lower capital loss when
those shares on which the distribution was received are sold. Once a shareholder's cost basis is reduced to zero, further distributions will be treated as capital gain, if the shareholder holds shares of the Fund as capital assets.
Dividends, interest and capital gains earned by the Fund with
respect to non-U.S. securities may give rise to withholding, capital gains and other taxes imposed by non-U.S. countries. Tax conventions between certain countries and the United States may reduce or eliminate such taxes. If more than 50% of the
total assets of the Fund at the close of a year consists of non-U.S. stocks or securities, generally the Fund may “pass through” to you certain non-U.S. income taxes (including withholding taxes) paid by the Fund. This means that you
would be considered to have received as an additional dividend your share of such non-U.S. taxes, but you may be entitled to either a corresponding tax deduction in calculating your taxable income, or, subject to certain limitations, a credit in
calculating your U.S. federal income tax.
For purposes of
foreign tax credits for U.S. shareholders of the Fund, foreign capital gains taxes may not produce associated foreign source income, limiting the availability of such credits for U.S. persons.
If you are neither a resident nor a citizen of the United
States or if you are a non-U.S. entity, the Fund’s ordinary income dividends (which include distributions of net short-term capital gains) will generally be subject to a 30% U.S. withholding tax, unless a lower treaty rate applies, provided
that withholding tax will generally not apply to any gain or income realized by a non-U.S. shareholder in respect of any distributions of long-term capital gains or upon the sale or other disposition of shares of the Fund.
A 30% withholding tax is currently imposed on U.S.-source
dividends, interest and other income items and will be imposed on proceeds from the sale, redemption or other disposition of property producing U.S.-source dividends and interest paid after December 31, 2018, to (i) foreign financial institutions,
including non-U.S. investment funds, unless they agree to collect and disclose to the Internal Revenue Service (“IRS”) information regarding their direct and indirect U.S. account holders and (ii) certain other foreign entities, unless
they certify certain information regarding their direct and indirect U.S. owners. To avoid withholding, foreign financial institutions will need to (i) enter into agreements with the IRS that state that they will provide the IRS information,
including the names, addresses and taxpayer identification numbers of direct and indirect U.S. account holders, comply with due diligence procedures with respect to the identification of U.S. accounts, report to the IRS certain information with
respect to U.S. accounts maintained, agree to withhold tax on certain payments made to non-compliant foreign financial institutions or to account holders who fail to provide the required information, and determine certain other information
concerning their account holders, or (ii) in the event that an applicable intergovernmental agreement and implementing legislation are adopted, provide local revenue authorities with similar account holder information. Other foreign entities may
need to report the name, address, and taxpayer identification number of each substantial U.S. owner or provide certifications of no substantial U.S. ownership unless certain exceptions apply.
If your Fund shares are loaned out pursuant to a securities
lending arrangement, you may lose the ability to treat Fund dividends paid while the shares are held by the
29
borrower as qualified dividend income. In addition, you may lose the ability
to use foreign tax credits passed through by the Fund if your Fund shares are loaned out pursuant to a securities lending agreement.
If you are a resident or a citizen of the United States, by
law, back-up withholding at a 28% rate will apply to your distributions and proceeds if you have not provided a taxpayer identification number or social security number and made other required certifications.
Taxes When Shares are Sold.
Currently, any capital gain or loss realized upon a sale of Fund shares is generally treated as a long-term gain or loss if the shares have been held for more than one year. Any capital gain or loss realized upon a sale of Fund shares held for one
year or less is generally treated as short-term gain or loss, except that any capital loss on the sale of shares held for six months or less is treated as long-term capital loss to the extent that capital gain dividends were paid with respect to
such shares. Any such capital gains, including from sales of Fund shares or from capital gain dividends, are included in “net investment income” for purposes of the 3.8% U.S. federal Medicare contribution tax mentioned
above.
The foregoing discussion summarizes some of
the consequences under current U.S. federal tax law of an investment in the Fund. It is not a substitute for personal tax advice. You may also be subject to state and local taxation on Fund distributions and sales of shares. Consult your personal
tax advisor about the potential tax consequences of an investment in shares of the Fund under all applicable tax laws.
Creations and Redemptions.
Prior to trading in the secondary market, shares of the Fund are “created” at NAV by market makers, large investors and institutions only in block-size Creation Units of 50,000 shares or multiples thereof. Each “creator” or
authorized participant (an “Authorized Participant”) has entered into an agreement with the Fund's distributor, BlackRock Investments, LLC (the “Distributor”), an affiliate of BFA.
A creation transaction, which is subject to acceptance by the
Distributor and the Fund, generally takes place when an Authorized Participant deposits into the Fund a designated portfolio of securities (including any portion of such securities for which cash may be substituted) and a specified amount of cash
approximating the holdings of the Fund in exchange for a specified number of Creation Units. To the extent practicable, the composition of such portfolio generally corresponds pro rata to the holdings of the
Fund. However, creation and redemption baskets may differ.
Similarly, shares can be redeemed only in Creation Units,
generally for a designated portfolio of securities (including any portion of such securities for which cash may be substituted) held by the Fund and a specified amount of cash. Except when aggregated in Creation
Units, shares are not redeemable by the Fund.
The
prices at which creations and redemptions occur are based on the next calculation of NAV after a creation or redemption order is received in an acceptable form under the authorized participant agreement.
Only an Authorized Participant may create or redeem Creation
Units with the Fund. Authorized Participants may create or redeem Creation Units for their own accounts or for customers, including, without limitation, affiliates of the Fund.
30
In the event of a system failure or other interruption,
including disruptions at market makers or Authorized Participants, orders to purchase or redeem Creation Units either may not be executed according to the Fund's instructions or may not be executed at all, or the Fund may not be able to place or
change orders.
To the extent the Fund engages in in-kind
transactions, the Fund intends to comply with the U.S. federal securities laws in accepting securities for deposit and satisfying redemptions with redemption securities by, among other means, assuring that any securities accepted for deposit and any
securities used to satisfy redemption requests will be sold in transactions that would be exempt from registration under the Securities Act of 1933, as amended (the “1933 Act”). Further, an Authorized Participant that is not a
“qualified institutional buyer,” as such term is defined in Rule 144A under the 1933 Act, will not be able to receive restricted securities eligible for resale under Rule 144A.
Creations and redemptions must be made through a firm that is
either a member of the Continuous Net Settlement System of the National Securities Clearing Corporation or a DTC participant that has executed an agreement with the Distributor with respect to creations and redemptions of Creation Unit aggregations.
Information about the procedures regarding creation and redemption of Creation Units (including the cut-off times for receipt of creation and redemption orders) is included in the Fund's SAI.
Because new shares may be created and issued on an ongoing
basis, at any point during the life of the Fund a “distribution,” as such term is used in the 1933 Act, may be occurring. Broker-dealers and other persons are cautioned that some activities on their part may, depending on the
circumstances, result in their being deemed participants in a distribution in a manner that could render them statutory underwriters subject to the prospectus delivery and liability provisions of the 1933 Act. Any determination of whether one is an
underwriter must take into account all the relevant facts and circumstances of each particular case.
Broker-dealers should also note that dealers who are not
“underwriters” but are participating in a distribution (as contrasted to ordinary secondary transactions), and thus dealing with shares that are part of an “unsold allotment” within the meaning of Section 4(a)(3)(C) of the
1933 Act, would be unable to take advantage of the prospectus delivery exemption provided by Section 4(a)(3) of the 1933 Act. For delivery of prospectuses to exchange members, the prospectus delivery mechanism of Rule 153 under the 1933 Act is
available only with respect to transactions on a national securities exchange.
Costs Associated with Creations and Redemptions. Authorized Participants are charged standard creation and redemption transaction fees to offset transfer, processing and other transaction costs associated with the issuance and redemption of Creation Units. The
standard creation and redemption transaction fees are set forth in the table below. The standard creation and redemption transaction fees are charged on each Creation Unit created or redeemed, as applicable, by an Authorized Participant on the day
of the transaction. The standard transaction fee is generally fixed at the amount shown in the table regardless of the number of Creation Units being purchased or redeemed, but may be reduced by the Fund if transfer and processing expenses
associated with the creation or redemption are anticipated to be lower than the stated
31
fee. If a purchase or redemption consists solely or partially of cash, the
Authorized Participant may also be required to pay an additional transaction charge (up to the maximum amounts shown in the table below) to cover brokerage and certain other costs related to a creation or redemption transaction. Investors who use
the services of a broker or other financial intermediary to acquire or dispose of Fund shares may pay fees for such services.
The following table shows, as of May 31, 2017, the approximate
value of one Creation Unit, standard fees and maximum additional charges for creations and redemptions (as described above and in the Fund's SAI):
| Approximate
Value of a Creation Unit |
Creation
Unit Size |
Standard
Creation/ Redemption Transaction Fee |
Maximum
Additional Charge for Creations* |
Maximum
Additional Charge for Redemptions* | ||||
| $2,034,000 | 50,000 | $3,000 | 7.0% | 2.0% |
| * | As a percentage of the net asset value per Creation Unit, inclusive, in the case of redemptions, of the standard redemption transaction fee. |
If a purchase or redemption consists solely or partially of
cash and the Fund places a brokerage transaction for portfolio securities with the Authorized Participant or its affiliated broker-dealer, the Authorized Participant (or an affiliated broker-dealer of the Authorized Participant) may be required, in
its capacity as broker-dealer with respect to that transaction, to cover certain brokerage, tax, foreign exchange, execution, and price movement costs through a brokerage execution guarantee, as further described in the Fund’s SAI.
32
Householding. Householding is
an option available to certain Fund investors. Householding is a method of delivery, based on the preference of the individual investor, in which a single copy of certain shareholder documents can be delivered to investors who share the same
address, even if their accounts are registered under different names. Please contact your broker-dealer if you are interested in enrolling in householding and receiving a single copy of prospectuses and other shareholder documents, or if you are
currently enrolled in householding and wish to change your householding status.
Distribution
The Distributor or its agent distributes Creation Units for the
Fund on an agency basis. The Distributor does not maintain a secondary market in shares of the Fund. The Distributor has no role in determining the policies of the Fund or the securities that are purchased or sold by the Fund. The
Distributor’s principal address is 1 University Square Drive, Princeton, NJ 08540.
BFA or its affiliates make payments to broker-dealers,
registered investment advisers, banks or other intermediaries (together, “intermediaries”) related to marketing activities and presentations, educational training programs, conferences, the development of technology platforms and
reporting systems, data provision services, or their making shares of the Fund and certain other iShares funds available to their customers generally and in certain investment programs. Such payments, which may be significant to the intermediary,
are not made by the Fund. Rather, such payments are made by BFA or its affiliates from their own resources, which come directly or indirectly in part from fees paid by the iShares funds complex. Payments of this type are sometimes referred to as
revenue-sharing payments. A financial intermediary may make decisions about which investment options it recommends or makes available, or the level of services provided, to its customers based on the payments or other financial incentives it is
eligible to receive. Therefore, such payments or other financial incentives offered or made to an intermediary create conflicts of interest between the intermediary and its customers and may cause the intermediary to recommend the Fund or other
iShares funds over another investment. More information regarding these payments is contained in the Fund's SAI. Please contact your salesperson or other investment professional for more information regarding any such
payments his or her firm may receive from BFA or its affiliates.
33
Financial Highlights
The financial highlights table is intended to help investors
understand the Fund’s financial performance for the past five years. Certain information reflects financial results for a single share of the Fund. The total returns in the table represent the rate that an investor would have earned (or lost)
on an investment in the Fund, assuming reinvestment of all dividends and distributions. This information has been audited by PricewaterhouseCoopers LLP, whose report is included, along with the Fund's financial statements, in the Fund's Annual
Report (available upon request).
Financial Highlights
(For a share outstanding throughout each period)
(For a share outstanding throughout each period)
| Year
ended Apr. 30, 2017 |
Year
ended Apr. 30, 2016 |
Year
ended Apr. 30, 2015 |
Year
ended Apr. 30, 2014 |
Year
ended Apr. 30, 2013 | |||||
| Net asset value, beginning of year | $ 33.87 | $ 45.99 | $ 48.33 | $ 53.80 | $ 53.23 | ||||
| Income
from investment operations: |
|||||||||
| Net investment incomea | 1.52 | 1.83 | 2.00 | 1.96 | 2.02 | ||||
| Net realized and unrealized gain (loss)b | 6.06 | (12.13) | (2.45) | (5.18) | 0.56 | ||||
| Total from investment operations | 7.58 | (10.30) | (0.45) | (3.22) | 2.58 | ||||
| Less distributions from: | |||||||||
| Net investment income | (1.59) | (1.76) | (1.89) | (2.25) | (2.01) | ||||
| Return of capital | − | (0.06) | − | − | − | ||||
| Total distributions | (1.59) | (1.82) | (1.89) | (2.25) | (2.01) | ||||
| Net asset value, end of year | $ 39.86 | $ 33.87 | $ 45.99 | $ 48.33 | $ 53.80 | ||||
| Total return | 23.22% | (22.45)% | (0.91)% | (5.86)% | 5.09% | ||||
| Ratios/Supplemental data: | |||||||||
| Net assets, end of year (000s) | $298,932 | $152,410 | $211,562 | $178,838 | $131,806 | ||||
| Ratio of expenses to average net assets | 0.49% | 0.49% | 0.49% | 0.49% | 0.49% | ||||
| Ratio of expenses to average net assets prior to waived fees | 0.52% | 0.68% | 0.68% | 0.68% | 0.68% | ||||
| Ratio of net investment income to average net assets | 4.23% | 5.31% | 4.42% | 4.01% | 3.80% | ||||
| Portfolio turnover ratec | 68% | 67% | 59% | 44% | 41% | ||||
| a | Based on average shares outstanding throughout each period. |
| b | The amounts reported for a share outstanding may not accord with the change in aggregate gains and losses in securities for the fiscal period due to the timing of capital share transactions in relation to the fluctuating market values of the Fund's underlying securities. |
| c | Portfolio turnover rates exclude portfolio securities received or delivered in Creation Units but include portfolio transactions that are executed as a result of the Fund processing capital share transactions in Creation Units partially for cash in U.S. dollars. Excluding such cash transactions, the portfolio turnover rates for the years ended April 30, 2017, April 30, 2016, April 30, 2015, April 30, 2014 and April 30, 2013 were 54%, 55%, 43%, 39% and 41%, respectively. |
34
Index Provider
SPDJI is the Index Provider for the Underlying Index and is not
affiliated with the Company, BFA, State Street, the Distributor or any of their respective affiliates.
SPDJI is a resource for index-based concepts, data and
research. The Index Provider provides financial, economic and investment information and analytical services to the financial community. The Index Provider calculates and maintains the S&P Global 1200TM, which includes the S&P 500® for the United
States, the S&P Europe 350TM for Continental Europe, Ireland and the United Kingdom, the S&P/TOPIX 150TM for Japan, the S&P Asia 50TM, the S&P/TSX 60TM for Canada, the S&P/ASX 50TM and the S&P Latin
America 40TM. The Index Provider also publishes the S&P MidCap 400®, S&P SmallCap 600®, S&P Total Market
IndexTM and S&P U.S. REITTM for the United States.
The Index Provider calculates and maintains the S&P Global Broad Market Index (BMI) Series, a set of rules-based equity benchmarks covering developed and emerging countries around the world. Company additions to and deletions from an S&P
equity index do not in any way reflect an opinion on the investment merits of the company.
BFA or its affiliates have entered into a license agreement
with the Index Provider to use the Underlying Index. BFA or its affiliates sublicense rights in the Underlying Index to the Company at no charge.
Disclaimers
The Underlying Index is a product of SPDJI, and has been licensed
for use by BFA or its affiliates. Standard & Poor’s® and S&P® are registered trademarks of Standard & Poor’s Financial Services LLC, a division of S&P Global (“S&P”); Dow Jones® is a registered trademark of Dow Jones Trademark Holdings LLC (“Dow Jones”); iShares® and BlackRock® are registered trademarks of BFA
and its affiliates, and these trademarks have been licensed for use by SPDJI and sublicensed for certain purposes by the Trust. The Fund is not sponsored, endorsed, sold or promoted by SPDJI, Dow Jones, S&P, any of their respective affiliates
(collectively, “S&P Dow Jones Indices”). S&P Dow Jones Indices makes no representation or warranty, express or implied, to the owners of shares of the Fund or any member of the public regarding the advisability of investing in
securities generally or in the Fund in particular or the ability of the Underlying Index to track general market performance. S&P Dow Jones Indices’ only relationship to the Company and BFA and their affiliates with respect to the
Underlying Index is the licensing of the Underlying Index and certain trademarks, service marks and/or trade names of S&P Dow Jones Indices and/or its licensors. The Underlying Index is determined, composed and calculated by S&P Dow Jones
Indices without regard to the Company, BFA or its affiliates or the Fund. S&P Dow Jones Indices have no obligation to take the needs of BFA or its affiliates or the owners of shares of the Fund into consideration in determining, composing or
calculating the Underlying Index. S&P Dow Jones Indices are not responsible for and have not participated in the determination of the prices, and amount of shares of the Fund or the timing of the issuance or sale of such shares or in the
determination or calculation of the equation by which shares of the Fund are to be converted into cash, surrendered or redeemed, as the case may be. S&P Dow Jones Indices have no obligation or liability in connection with the administration,
marketing or trading of shares
35
of the Fund. There is no assurance that investment products based on the
Underlying Index will accurately track the Underlying Index’s performance or provide positive investment returns. SPDJI is not an investment adviser. Inclusion of a security within an index is not a recommendation by S&P Dow Jones Indices
to buy, sell, or hold such security, nor is it considered to be investment advice.
S&P DOW JONES INDICES DO NOT GUARANTEE THE ADEQUACY,
ACCURACY, TIMELINESS AND/OR THE COMPLETENESS OF THE UNDERLYING INDEX OR ANY DATA RELATED THERETO OR ANY COMMUNICATION, INCLUDING BUT NOT LIMITED TO, ORAL OR WRITTEN COMMUNICATION (INCLUDING ELECTRONIC COMMUNICATIONS) WITH RESPECT THERETO. S&P
DOW JONES INDICES SHALL NOT BE SUBJECT TO ANY DAMAGES OR LIABILITY FOR ANY ERRORS, OMISSIONS, OR DELAYS THEREIN. S&P DOW JONES INDICES MAKE NO EXPRESS OR IMPLIED WARRANTIES, AND EXPRESSLY DISCLAIMS ALL WARRANTIES, OF MERCHANTABILITY OR FITNESS
FOR A PARTICULAR PURPOSE OR USE OR AS TO RESULTS TO BE OBTAINED BY BFA OR ITS AFFILIATES, OWNERS OF SHARES OF THE FUND, OR ANY OTHER PERSON OR ENTITY FROM THE USE OF THE UNDERLYING INDEX OR WITH RESPECT TO ANY DATA RELATED THERETO. WITHOUT LIMITING
ANY OF THE FOREGOING, IN NO EVENT WHATSOEVER SHALL S&P DOW JONES INDICES BE LIABLE FOR ANY INDIRECT, SPECIAL, INCIDENTAL, PUNITIVE, OR CONSEQUENTIAL DAMAGES INCLUDING BUT NOT LIMITED TO, LOSS OF PROFITS, TRADING LOSSES, LOST TIME OR GOODWILL,
EVEN IF THEY HAVE BEEN ADVISED OF THE POSSIBLITY OF SUCH DAMAGES, WHETHER IN CONTRACT, TORT, STRICT LIABILITY, OR OTHERWISE. THERE ARE NO THIRD PARTY BENEFICIARIES OF ANY AGREEMENTS OR ARRANGEMENTS BETWEEN S&P DOW JONES INDICES AND BFA OR ITS
AFFILIATES, OTHER THAN THE LICENSORS OF S&P DOW JONES INDICES.
Shares of the Fund are not sponsored, endorsed or promoted by
NYSE Arca. NYSE Arca makes no representation or warranty, express or implied, to the owners of the shares of the Fund or any member of the public regarding the ability of the Fund to track the total return performance of the Underlying Index or the
ability of the Underlying Index to track stock market performance. NYSE Arca is not responsible for, nor has it participated in, the determination of the compilation or the calculation of the Underlying Index, nor in the determination of the timing
of, prices of, or quantities of shares of the Fund to be issued, nor in the determination or calculation of the equation by which the shares are redeemable. NYSE Arca has no obligation or liability to owners of the shares of the Fund in connection
with the administration, marketing or trading of the shares of the Fund.
NYSE Arca does not guarantee the accuracy and/or the completeness
of the Underlying Index or any data included therein. NYSE Arca makes no warranty, express or implied, as to results to be obtained by the Company on behalf of the Fund as licensee, licensee’s customers and counterparties, owners of the shares
of the Fund, or any other person or entity from the use of the Underlying Index or any data included therein in connection with the rights licensed as described herein or for any other use. NYSE Arca makes no express or implied warranties and hereby
expressly disclaims all warranties of merchantability or fitness for a particular purpose with respect to the Underlying Index or any data included therein. Without limiting any of the
36
foregoing, in no event shall NYSE Arca have any liability for any direct,
indirect, special, punitive, consequential or any other damages (including lost profits) even if notified of the possibility of such damages.
The past performance of the Underlying Index is not a guide to
future performance. BFA and its affiliates do not guarantee the accuracy or the completeness of the Underlying Index or any data included therein and BFA and its affiliates shall have no liability for any errors, omissions or interruptions therein.
BFA and its affiliates make no warranty, express or implied, to the owners of shares of the Fund or to any other person or entity, as to results to be obtained by the Fund from the use of the Underlying Index or any data included therein. Without
limiting any of the foregoing, in no event shall BFA or its affiliates have any liability for any special, punitive, direct, indirect or consequential damages (including lost profits), even if notified of the possibility of such damages.
37
Supplemental Information
I. Premium/Discount Information
The table that follows presents information about the
differences between the daily market price on secondary markets for shares of the Fund and the Fund’s NAV. NAV is the price at which the Fund issues and redeems shares. It is calculated in accordance with the standard formula for valuing
mutual fund shares. The price used to calculate market returns (“Market Price”) of the Fund generally is determined using the midpoint between the highest bid and the lowest ask on the primary securities exchange on which shares of the
Fund are listed for trading, as of the time that the Fund’s NAV is calculated. The Fund’s Market Price may be at, above or below its NAV. The NAV of the Fund will fluctuate with changes in the value of its portfolio holdings. The Market
Price of the Fund will fluctuate in accordance with changes in its NAV, as well as market supply and demand.
Premiums or discounts are the differences (expressed as a
percentage) between the NAV and Market Price of the Fund on a given day, generally at the time the NAV is calculated. A premium is the amount that the Fund is trading above the reported NAV, expressed as a percentage of the NAV. A discount is the
amount that the Fund is trading below the reported NAV, expressed as a percentage of the NAV.
The following information shows the frequency of distributions
of premiums and discounts for the Fund for each full calendar quarter of 2016 and the first two calendar quarters of 2017.
Each line in the table shows the number of trading days in
which the Fund traded within the premium/discount range indicated. The number of trading days in each premium/discount range is also shown as a percentage of the total number of trading days in the period covered by the table. All data presented
here represents past performance, which cannot be used to predict future results.
| Premium/Discount Range | Number of Days | Percentage of Total Days | ||
| Greater than 2.0% and Less than 2.5% | 1 | 0.27% | ||
| Greater than 1.5% and Less than 2.0% | 4 | 1.06 | ||
| Greater than 1.0% and Less than 1.5% | 13 | 3.45 | ||
| Greater than 0.5% and Less than 1.0% | 85 | 22.54 | ||
| Greater than 0.0% and Less than 0.5% | 127 | 33.69 | ||
| At NAV | 4 | 1.06 | ||
| Less than 0.0% and Greater than -0.5% | 88 | 23.33 | ||
| Less than -0.5% and Greater than -1.0% | 35 | 9.28 | ||
| Less than -1.0% and Greater than -1.5% | 11 | 2.92 | ||
| Less than -1.5% and Greater than -2.0% | 4 | 1.06 | ||
| Less than -2.0% and Greater than -2.5% | 3 | 0.8 | ||
| Less than -2.5% and Greater than -3.0% | 1 | 0.27 | ||
| Less than -3.0 | 1 | 0.27 | ||
| 377 | 100.00% |
38
II. Total Return Information
The table that follows presents information about the total
returns of the Fund and the Underlying Index as of the fiscal year ended April 30, 2017.
“Average Annual Total Returns” represents the
average annual change in value of an investment over the periods indicated. “Cumulative Total Returns” represents the total change in value of an investment over the periods indicated.
The Fund’s NAV is the value of one share of the Fund as
calculated in accordance with the standard formula for valuing mutual fund shares. The NAV return is based on the NAV of the Fund and the market return is based on the Market Price of the Fund. Market Price generally is determined by using the
midpoint between the highest bid and the lowest ask on the primary stock exchange on which shares of the Fund are listed for trading, as of the time that the Fund's NAV is calculated. Since shares of the Fund did not trade in the secondary market
until after the Fund's inception, for the period from inception to the first day of secondary market trading in shares of the Fund, the NAV of the Fund is used as a proxy for the Market Price to calculate market returns. Market and NAV returns
assume that dividends and capital gain distributions have been reinvested in the Fund at Market Price and NAV, respectively.
An index is a financial calculation, based on a grouping of
financial instruments, that is not an investment product and that tracks a specified financial market or sector. Unlike the Fund, the Underlying Index does not actually hold a portfolio of securities and therefore does not incur the expenses
incurred by the Fund. These expenses negatively impact the performance of the Fund. Also, market returns do not include brokerage commissions and other charges that may be payable on secondary market transactions. If brokerage commissions were
included, market returns would be lower. The returns shown in the following table do not reflect the deduction of taxes that a shareholder would pay on Fund distributions or the redemption or sale of Fund shares. The investment return and principal
value of shares of the Fund will vary with changes in market conditions. Shares of the Fund may be worth more or less than their original cost when they are redeemed or sold in the market. The Fund’s past performance is no guarantee of future
results.
Performance as of April 30, 2017
| Average Annual Total Returns | Cumulative Total Returns | ||||||
| NAV | MARKET | INDEX | NAV | MARKET | INDEX | ||
| 1 Year | 23.22% | 23.78% | 23.71% | 23.22% | 23.78% | 23.71% | |
| 5 Years | (1.30)% | (1.35)% | (1.39)% | (6.32)% | (6.56)% | (6.74)% | |
| Since Inception* | (1.69)% | (1.62)% | (1.78)% | (8.44)% | (8.11)% | (8.89)% | |
| * | Total returns for the period since inception are calculated from the inception date of the Fund (2/23/12). The first day of secondary market trading in shares of the Fund was 2/24/12. |
39
[THIS PAGE INTENTIONALLY LEFT BLANK]
[THIS PAGE INTENTIONALLY LEFT BLANK]
For more information visit www.iShares.com or call
1-800-474-2737
Copies of the Prospectus, SAI and recent
shareholder reports can be found on our website at www.iShares.com. For more information about the Fund, you may request a copy of the SAI. The SAI provides detailed information about the Fund and is incorporated by reference into this Prospectus.
This means that the SAI, for legal purposes, is a part of this Prospectus.
Additional information about the Fund's investments is
available in the Fund's Annual and Semi-Annual Reports to shareholders. In the Fund's Annual Report, you will find a discussion of the market conditions and investment strategies that significantly affected the Fund's performance during the last
fiscal year.
If you have any questions about the Company
or shares of the Fund or you wish to obtain the SAI, Semi-Annual or Annual Report free of charge, please:
| Call: | 1-800-iShares
or 1-800-474-2737 (toll free) Monday through Friday, 8:30 a.m. to 6:30 p.m. (Eastern time) |
| Email: | iSharesETFs@blackrock.com |
| Write: | c/o
BlackRock Investments, LLC 1 University Square Drive, Princeton, NJ 08540 |
Information about the Fund (including the SAI) can be reviewed
and copied at the SEC's Public Reference Room in Washington, D.C., and information on the operation of the Public Reference Room may be obtained by calling the SEC at 1-202-551-8090. Reports and other information about the Fund are available on the
EDGAR database on the SEC's website at www.sec.gov, and copies of this information may be obtained, after paying a duplicating fee, by electronic request at the following e-mail address: publicinfo@sec.gov, or by writing to the SEC's Public
Reference Room, Washington, D.C. 20549-1520.
No person is
authorized to give any information or to make any representations about the Fund and its shares not contained in this Prospectus and you should not rely on any other information. Read and keep this Prospectus for future reference.
©2017 BlackRock, Inc. All rights reserved. iSHARES® and BLACKROCK® are registered trademarks of BFA and its affiliates. All other marks are the property of their
respective owners.
Investment Company Act File No.:
811-09102
IS-P-DVYE-0418


iShares®, Inc.
Statement of Additional Information
Dated September 1, 2017
(as revised April 6, 2018)
(as revised April 6, 2018)
This Statement of Additional Information (“SAI”)
is not a prospectus. It should be read in conjunction with the current prospectus (the “Prospectus”) for the following series of iShares, Inc. (the “Company”):
| Fund | Ticker | Listing Exchange | ||
| iShares Emerging Markets Dividend ETF (the “Fund”) | DVYE | NYSE Arca |
The Prospectus for the Fund is
dated September 1, 2017, as amended and supplemented from time to time. Capitalized terms used herein that are not defined have the same meaning as in the Prospectus, unless otherwise noted. The Financial Statements and Notes contained in the Annual
Report and Semi-Annual Report of the Company for the Fund are incorporated by reference into and are deemed to be part of this SAI. A copy of the Prospectus, Annual Report and Semi-Annual Report for the Fund may be obtained without charge by writing
to the Company’s distributor, BlackRock Investments, LLC (the “Distributor” or “BRIL”), 1 University Square Drive, Princeton, NJ 08540, calling 1-800-iShares (1-800-474-2737) or visiting
www.iShares.com. The Fund's Prospectus is incorporated by reference into this SAI.
References to the Investment Company Act of 1940, as amended
(the “Investment Company Act” or the “1940 Act”), or other applicable law, will include any rules promulgated thereunder and any guidance, interpretations or modifications by the Securities and Exchange Commission (the
“SEC”), SEC staff or other authority with appropriate jurisdiction, including court interpretations, and exemptive, no action or other relief or permission from the SEC, SEC staff or other authority.
iShares® and BlackRock® are registered trademarks of
BlackRock Fund Advisors and its affiliates.
TABLE OF CONTENTS
i
ii
iii
iv
General Description of the Company and the Fund
The Company currently consists of more than 55 investment
series or portfolios. The Company was organized as a Maryland corporation on September 1, 1994 and is authorized to have multiple series or portfolios. The Company is an open-end management investment company registered with the SEC under the 1940
Act. The offering of the Company's shares is registered under the Securities Act of 1933, as amended (the “1933 Act”). This SAI relates solely to the Fund.
The Fund is managed by BlackRock Fund Advisors
(“BFA”), an indirect wholly-owned subsidiary of BlackRock, Inc., and generally seeks to track the investment results of the specific benchmark index identified in the Fund's Prospectus (the “Underlying Index”).
The Fund offers and issues shares at their net asset value per
share (“NAV”) only in aggregations of a specified number of shares (each, a “Creation Unit”), generally in exchange for a designated portfolio of securities (including any portion of such securities for which cash may be
substituted) included in its Underlying Index (the “Deposit Securities”), together with the deposit of a specified cash payment (the “Cash Component”). Shares of the Fund are listed for trading on NYSE Arca, Inc. (“NYSE
Arca” or the “Listing Exchange”), a national securities exchange. Shares of the Fund are traded in the secondary market and elsewhere at market prices that may be at, above or below the Fund's NAV. Shares are redeemable only in
Creation Units by Authorized Participants (as defined in the Portfolio Holdings Information section of this SAI), and, generally, in exchange for portfolio securities and a Cash Amount (as defined in the Redemption of Creation Units section of this SAI). Creation Units typically are a specified number of shares, generally 50,000 or multiples thereof.
The Company reserves the right to permit or require that
creations and redemptions of shares are effected fully or partially in cash and reserves the right to permit or require the substitution of Deposit Securities in lieu of cash. Shares may be issued in advance of receipt of Deposit Securities, subject
to various conditions, including a requirement that the Authorized Participant maintain with the Company a cash deposit equal to at least 105% and up to 115%, which percentage BFA may change from time to time, of the market value of the omitted
Deposit Securities. The Company may use such cash deposit at any time to purchase Deposit Securities. See the Creation and Redemption of Creation Units section of this SAI. Transaction fees and other costs
associated with creations or redemptions that include a cash portion may be higher than the transaction fees and other costs associated with in-kind creations or redemptions. In all cases, conditions with respect to creations and redemptions of
shares and fees will be limited in accordance with the requirements of SEC rules and regulations applicable to management investment companies offering redeemable securities.
Exchange Listing and Trading
A discussion of exchange listing and trading matters
associated with an investment in the Fund is contained in the Shareholder Information section of the Fund's Prospectus. The discussion below supplements, and should be read in conjunction with, that section of
the Prospectus.
Shares of the Fund are listed for
trading, and trade throughout the day, on the Listing Exchange and in other secondary markets. Shares of the Fund may also be listed on certain non-U.S. exchanges. There can be no assurance that the requirements of the Listing Exchange necessary to
maintain the listing of shares of the Fund will continue to be met. The Listing Exchange may, but is not required to, remove the shares of the Fund from listing if, among other things: (i) following the initial 12-month period beginning upon the
commencement of trading of Fund shares, there are fewer than 50 record and/or beneficial owners of shares of the Fund for 30 or more consecutive trading days, (ii) the value of the Underlying Index on which the Fund is based is no longer calculated
or available, or (iii) any other event shall occur or condition shall exist that, in the opinion of the Listing Exchange, makes further dealings on the Listing Exchange inadvisable. The Listing Exchange will also remove shares of the Fund from
listing and trading upon termination of the Fund.
As in
the case of other publicly-traded securities, when you buy or sell shares of the Fund through a broker, you may incur a brokerage commission determined by that broker, as well as other charges.
In order to provide additional information regarding the
indicative value of shares of the Fund, the Listing Exchange or a market data vendor disseminates information every 15 seconds through the facilities of the Consolidated Tape Association,
1
or through other widely disseminated means, an updated indicative optimized
portfolio value (“IOPV”) for the Fund as calculated by an information provider or market data vendor. The Company is not involved in or responsible for any aspect of the calculation or dissemination of the IOPV and makes no
representation or warranty as to the accuracy of the IOPV.
An IOPV has an equity securities component and a cash
component. The equity securities values included in an IOPV are the values of the Deposit Securities for the Fund. While the IOPV reflects the current value of the Deposit Securities required to be deposited in connection with the purchase of a
Creation Unit, it does not necessarily reflect the precise composition of the current portfolio of securities held by the Fund at a particular point in time because the current portfolio of the Fund may include securities that are not a part of the
current Deposit Securities. Therefore, the Fund’s IOPV disseminated during the Listing Exchange trading hours should not be viewed as a real-time update of the Fund’s NAV, which is calculated only once a day.
The cash component included in an IOPV consists of estimated
accrued interest, dividends and other income, less expenses. If applicable, each IOPV also reflects changes in currency exchange rates between the U.S. dollar and the applicable currency.
The Company reserves the right to adjust the share prices of
the Fund in the future to maintain convenient trading ranges for investors. Any adjustments would be accomplished through stock splits or reverse stock splits, which would have no effect on the net assets of the Fund or an investor's equity interest
in the Fund.
Investment Strategies and Risks
The Fund seeks to achieve its objective by investing primarily
in securities issued by issuers that comprise its Underlying Index and through transactions that provide substantially similar exposure to securities in the Underlying Index. The Fund operates as an index fund and is not actively managed. Adverse
performance of a security in the Fund’s portfolio will ordinarily not result in the elimination of the security from the Fund’s portfolio.
The Fund engages in representative sampling, which is
investing in a sample of securities selected by BFA to have a collective investment profile similar to that of the Fund's Underlying Index. Securities selected have aggregate investment characteristics (based on market capitalization and industry
weightings), fundamental characteristics (such as return variability, earnings valuation and yield) and liquidity measures similar to those of the Underlying Index. A fund that uses representative sampling generally does not hold all of the
securities that are in its underlying index.
Although
the Fund does not seek leveraged returns, certain instruments used by the Fund may have a leveraging effect as described below.
Borrowing. The Fund may
borrow for temporary or emergency purposes, including to meet payments due from redemptions or to facilitate the settlement of securities or other transactions. Under normal market conditions, any borrowing by the Fund will not exceed 10% of the
Fund’s net assets; however, the Fund generally does not intend to borrow money. The Fund, along with certain other iShares funds, has entered into a line of credit with State Street Bank and Trust Company (“State Street”) that may
be used for temporary or emergency purposes, including redemption, settlement of trades and rebalancing of portfolio holdings.
The purchase of securities while borrowings are outstanding
may have the effect of leveraging the Fund. The incurrence of leverage increases the Fund’s exposure to risk, and borrowed funds are subject to interest costs that will reduce net income. Purchasing securities while borrowings are outstanding
creates special risks, such as the potential for greater volatility in the net asset value of Fund shares and in the yield on the Fund’s portfolio. In addition, the interest expenses from borrowings may exceed the income generated by the
Fund’s portfolio and, therefore, the amount available (if any) for distribution to shareholders as dividends may be reduced. BFA may determine to maintain outstanding borrowings if it expects that the benefits to the Fund’s shareholders
will outweigh the current reduced return.
Certain types
of borrowings by the Fund must be made from a bank or may result in the Fund being subject to covenants in credit agreements relating to asset coverage, portfolio composition requirements and other matters. It is not anticipated that observance of
such covenants would impede BFA’s management of the Fund’s portfolio in accordance with the Fund’s investment objectives and policies. However, a breach of any such covenants not cured within the specified cure period may result in
acceleration of outstanding indebtedness and require the Fund to dispose of portfolio investments at a time when it may be disadvantageous to do so.
2
Currency Transactions. A
foreign currency forward contract is an over-the-counter (“OTC”) obligation to purchase or sell a specific currency at a future date, which may be any fixed number of days greater than two days from the date on which the contract is
agreed upon by the parties, at a price set at the time of the contract. A non-deliverable currency forward is an OTC currency forward settled in a specified currency, on a specified date, based on the difference between the agreed-upon exchange rate
and the market exchange rate. A currency futures contract is a contract that trades on an organized futures exchange involving an obligation to deliver or acquire a specified amount of a specific currency, at a specified price and at a specified
future time. Currency futures contracts may be settled on a net cash payment basis rather than by the sale and delivery of the underlying currency. To the extent required by law, liquid assets committed to futures contracts will be maintained. The
Fund does not expect to engage in currency transactions for the purpose of hedging against declines in the value of the Fund's assets that are denominated in a non-U.S. currency. The Fund may enter into non-U.S. currency forward and non-U.S.
currency futures transactions to facilitate local securities settlements or to protect against currency exposure in connection with its distributions to shareholders, but may not enter into such contracts for speculative purposes.
Foreign exchange transactions involve a significant degree of
risk and the markets in which foreign exchange transactions are effected may be highly volatile, highly specialized and highly technical. Significant changes, including changes in liquidity and prices, can occur in such markets within very short
periods of time, often within minutes. Foreign exchange trading risks include, but are not limited to, exchange rate risk, counterparty risk, maturity gap, interest rate risk, and potential interference by foreign governments through regulation of
local exchange markets, foreign investment or particular transactions in non-U.S. currency. If BFA utilizes foreign exchange transactions at an inappropriate time or judges market conditions, trends or correlations incorrectly, foreign exchange
transactions may not serve their intended purpose of improving the correlation of the Fund's return with the performance of the Underlying Index and may lower the Fund’s return. The Fund could experience losses if the value of its currency
forwards, options or futures positions were poorly correlated with its other investments or if it could not close out its positions because of an illiquid market or otherwise. In addition, the Fund could incur transaction costs, including trading
commissions, in connection with certain non-U.S. currency transactions.
Diversification Status.
The Fund is currently classified as a diversified fund under the 1940 Act. This means that the Fund may not purchase securities of an issuer (other than (i) obligations issued or guaranteed by the U.S.
government, its agencies or instrumentalities and (ii) securities of other investment companies) if, with respect to 75% of its total assets, (a) more than 5% of the Fund’s total assets would be invested in securities of that issuer or (b) the
Fund would hold more than 10% of the outstanding voting securities of that issuer. With respect to the remaining 25% of its total assets, the Fund can invest more than 5% of its assets in one issuer. Under the 1940 Act, the Fund cannot change its
classification from diversified to non-diversified without shareholder approval.
The Fund intends to maintain the required level of
diversification and otherwise conduct its operations so as to qualify as a regulated investment company for purposes of the U.S. Internal Revenue Code of 1986, as amended (the “Internal Revenue Code”), and to relieve the Fund of any
liability for U.S. federal income tax to the extent that its earnings are distributed to shareholders, provided that the Fund satisfies a minimum distribution requirement. Compliance with the diversification requirements of the Internal Revenue Code
may limit the investment flexibility of the Fund and may make it less likely that the Fund will meet its investment objective.
Futures, Options on Futures and Securities Options. Futures contracts, options on futures and securities options may be used by the Fund to simulate investment in its Underlying Index, to facilitate trading or to reduce transaction costs. The Fund may enter into
futures contracts and options on futures that are traded on a U.S. or non-U.S. futures exchange. The Fund will not use futures, options on futures or securities options for speculative purposes. The Fund intends to use futures and options on futures
in accordance with Rule 4.5 of the Commodity Futures Trading Commission (the “CFTC”) promulgated under the Commodity Exchange Act (“CEA”). BFA, with respect to the Fund, has claimed an exclusion from the definition of the
term “commodity pool operator” in accordance with Rule 4.5 so that BFA, in respect of the Fund, is not subject to registration or regulation as a commodity pool operator under the CEA. See the Regulation Regarding Derivatives section of this SAI for more information.
Futures contracts provide for the future sale by one party and
purchase by another party of a specified amount of a specific instrument or index at a specified future time and at a specified price. Stock index contracts are based on investments that reflect the market value of common stock of the firms included
in the investments. The Fund may enter into futures contracts to purchase securities indexes when BFA anticipates purchasing the underlying securities and believes prices will rise before the purchase will be made. Upon entering into a futures
contract, the Fund will be required to deposit with the broker an amount of cash or cash equivalents known as “initial margin,” which is similar to a performance bond or good faith
3
deposit on the contract and is returned to the Fund upon termination of the
futures contract if all contractual obligations have been satisfied. Subsequent payments, known as “variation margin,” will be made to and from the broker daily as the price of the instrument or index underlying the futures contract
fluctuates, making the long and short positions in the futures contract more or less valuable, a process known as “marking-to-market.” At any time prior to the expiration of a futures contract, the Fund may elect to close the position by
taking an opposite position, which will operate to terminate the Fund’s existing position in the contract. To the extent required by law, the Fund will segregate liquid assets in an amount equal to its delivery obligations under the futures
contracts. An option on a futures contract, as contrasted with a direct investment in such a contract, gives the purchaser the right, but no obligation, in return for the premium paid, to assume a position in the underlying futures contract at a
specified exercise price at any time prior to the expiration date of the option. Upon exercise of an option, the delivery of the futures position by the writer of the option to the holder of the option will be accompanied by delivery of the
accumulated balance in the writer’s futures margin account that represents the amount by which the market price of the futures contract exceeds (in the case of a call) or is less than (in the case of a put) the exercise price of the option on
the futures contract. The potential for loss related to the purchase of an option on a futures contract is limited to the premium paid for the option plus transaction costs. Because the value of the option is fixed at the point of sale, there are no
daily cash payments by the purchaser to reflect changes in the value of the underlying contract; however, the value of the option changes daily and that change would be reflected in the NAV of the Fund. The potential for loss related to writing call
options is unlimited. The potential for loss related to writing put options is limited to the agreed-upon price per share, also known as the “strike price,” less the premium received from writing the put. The Fund may purchase and write
put and call options on futures contracts that are traded on an exchange as a hedge against changes in value of its portfolio securities or in anticipation of the purchase of securities, and may enter into closing transactions with respect to such
options to terminate existing positions. There is no guarantee that such closing transactions can be effected.
Securities options may be used by the Fund to obtain access to
securities in the Underlying Index or to dispose of securities in the Underlying Index at favorable prices, to invest cash in a securities index that offers similar exposure to that provided by the Underlying Index or otherwise to achieve the
Fund’s objective of tracking the Underlying Index. A call option gives a holder the right to purchase a specific security at a specified price (“exercise price”) within a specified period of time. A put option gives a holder
the right to sell a specific security at an exercise price within a specified period of time. The initial purchaser of a call option pays the “writer” a premium, which is paid at the time of purchase and is retained by the writer whether
or not such option is exercised. The Fund may purchase put options to hedge its portfolio against the risk of a decline in the market value of securities held and may purchase call options to hedge against an increase in the price of securities it
is committed to purchase. The Fund may write put and call options along with a long position in options to increase its ability to hedge against a change in the market value of the securities it holds or is committed to purchase. The Fund may
purchase or sell securities options on a U.S. or non-U.S. securities exchange or in the OTC market through a transaction with a dealer. Options on a securities index are typically settled on a net basis based on the appreciation or depreciation of
the index level over the strike price. Options on single name securities may be cash- or physically-settled, depending upon the market in which they are traded. Options may be structured so as to be exercisable only on certain dates or on a daily
basis. Options may also be structured to have conditions to exercise (i.e., “Knock-in Events”) or conditions that trigger termination (i.e., “Knock-out
Events”). Investments in futures contracts and other investments that contain leverage may require the Fund to maintain liquid assets in an amount equal to its delivery obligations under these contracts and other investments. Generally, the
Fund maintains an amount of liquid assets equal to its obligations relative to the position involved, adjusted daily on a marked-to-market basis. With respect to futures contracts that are contractually required to “cash-settle,” the
Fund maintains liquid assets in an amount at least equal to the Fund’s daily marked-to-market obligation (i.e., the Fund’s daily net liability, if any), rather than the contracts’ notional
value (i.e., the value of the underlying asset). By maintaining assets equal to its net obligation under cash-settled futures contracts, the Fund may employ leverage to a greater extent than if the Fund were
required to set aside assets equal to the futures contracts’ full notional value. The Fund bases its asset maintenance policies on methods permitted by the SEC and its staff and may modify these policies in the future to comply with any
changes in the guidance articulated from time to time by the SEC or its staff. Changes in SEC guidance regarding the use of derivatives by registered investment companies may adversely impact the Fund’s ability to invest in futures, options or
other derivatives or make investments in such instruments more expensive.
Illiquid Securities. The
Fund may invest up to an aggregate amount of 15% of its net assets in illiquid securities (calculated at the time of investment). Illiquid securities may include securities subject to contractual or other restrictions on resale and other instruments
that lack readily available markets, as determined in accordance with SEC staff guidance. The liquidity of a security relates to the ability to readily dispose of the security and the price to be obtained upon disposition of the
security,
4
which may be lower than the price that would be obtained for a comparable,
more liquid security. Illiquid securities may trade at a discount to comparable, more liquid securities and the Fund may not be able to dispose of illiquid securities in a timely fashion or at their expected prices.
Lending Portfolio Securities.
The Fund may lend portfolio securities to certain borrowers that BFA determines to be creditworthy, including borrowers affiliated with BFA. The borrowers provide collateral that is maintained in an amount at least equal to the current market
value of the securities loaned. No securities loan shall be made on behalf of the Fund if, as a result, the aggregate value of all securities loaned by the Fund exceeds one-third of the value of the Fund's total assets (including the value of the
collateral received). The Fund may terminate a loan at any time and obtain the return of the securities loaned. The Fund receives, by way of substitute payment, the value of any interest or cash or non-cash distributions paid on the loaned
securities that it would have received if the securities were not on loan.
With respect to loans that are collateralized by cash, the
borrower may be entitled to receive a fee based on the amount of cash collateral. The Fund is typically compensated by the difference between the amount earned on the reinvestment of cash collateral and the fee paid to the borrower. In the case of
collateral other than cash, the Fund is typically compensated by a fee paid by the borrower equal to a percentage of the market value of the loaned securities. Any cash collateral may be reinvested in certain short-term instruments either directly
on behalf of the lending Fund or through one or more joint accounts or money market funds, including those affiliated with BFA; such investments are subject to investment risk.
The Fund conducts its securities lending pursuant to an
exemptive order from the SEC permitting it to lend portfolio securities to borrowers affiliated with the Fund and to retain an affiliate of the Fund to act as securities lending agent. To the extent that the Fund engages in securities lending,
BlackRock Institutional Trust Company, N.A. (“BTC”) acts as securities lending agent for the Fund, subject to the overall supervision of BFA. BTC administers the lending program in accordance with guidelines approved by the Company's
Board of Directors (the “Board” or the “Directors”).
The Fund retains a portion of the securities lending income
and remits the remaining portion to BTC as compensation for its services as securities lending agent. Securities lending income is generally equal to the total of income earned from the reinvestment of cash collateral (and excludes collateral
investment fees as defined below), and any fees or other payments to and from borrowers of securities. As securities lending agent, BTC bears all operational costs directly related to securities lending. The Fund is responsible for fees in
connection with the investment of cash collateral received for securities on loan in a money market fund managed by BFA; however, BTC has agreed to reduce the amount of securities lending income it receives in order to effectively limit the
collateral investment fees the Fund bears to an annual rate of 0.04% (the “collateral investment fees”). Such money market fund shares will not be subject to a sales load, redemption fee, distribution fee or service fee.
Pursuant to the securities lending agreement dated January 1,
2015:
(i) International equity funds, such as the Fund,
retain 80% of securities lending income (which excludes collateral investment fees) and (ii) this amount can never be less than 70% of the sum of securities lending income plus collateral investment fees.
Under the securities lending program, the Fund is categorized
into one of several specific asset classes. The determination of the Fund’s asset class category (fixed-income, domestic equity, international equity or fund-of-funds), each of which may be subject to a different fee arrangement, is based on a
methodology agreed to by the Company and BTC.
In
addition, commencing the business day following the date that the aggregate securities lending income (which includes, for this purpose, collateral investment fees) earned across the Exchange-Traded Fund Complex (as defined under “Management—Directors and Officers”) in a calendar year exceeds the aggregate securities lending income earned across the Exchange-Traded Fund Complex in calendar year 2013 (the
“Hurdle Date”), the applicable international equity fund, pursuant to the securities lending agreement, will receive for the remainder of that calendar year securities lending income as follows:
(i) 85% of securities lending income (which excludes
collateral investment fees) and (ii) this amount can never be less than 70% of the sum of securities lending income plus collateral investment fees.
Securities lending involves exposure to certain risks,
including operational risk (i.e., the risk of losses resulting from problems in the settlement and accounting process), “gap” risk (i.e., the risk of a
mismatch between the return on cash collateral
5
reinvestments and the fees the Fund has agreed to pay a borrower), and
credit, legal, counterparty and market risk. If a securities lending counterparty were to default, the Fund would be subject to the risk of a possible delay in receiving collateral or in recovering the loaned securities, or to a possible loss of
rights in the collateral. In the event a borrower does not return the Fund’s securities as agreed, the Fund may experience losses if the proceeds received from liquidating the collateral do not at least equal the value of the loaned security
at the time the collateral is liquidated, plus the transaction costs incurred in purchasing replacement securities. This event could trigger adverse tax consequences for the Fund. The Fund could lose money if its short-term investment of the
collateral declines in value over the period of the loan. Substitute payments for dividends received by the Fund for securities loaned out by the Fund will not be considered qualified dividend income. BTC will take into account the tax effects on
shareholders caused by this difference in connection with the Fund’s securities lending program. Substitute payments received on tax-exempt securities loaned out will not be tax-exempt income.
Non-U.S. Securities. The
Fund intends to purchase publicly-traded common stocks of non-U.S. issuers. To the extent the Fund invests in stocks of non-U.S. issuers, the Fund's investment in such stocks may be in the form of American Depositary Receipts (“ADRs”),
Global Depositary Receipts (“GDRs”) and European Depositary Receipts (“EDRs”) (collectively, “Depositary Receipts”). Depositary Receipts are receipts, typically issued by a bank or trust issuer, which evidence
ownership of underlying securities issued by a non-U.S. issuer. For ADRs, the depository is typically a U.S. financial institution, and the underlying securities are issued by a non-U.S. issuer. For other forms of Depositary Receipts, the depository
may be a non-U.S. or a U.S. entity, and the underlying securities may be issued by a non-U.S. or a U.S. issuer. Depositary Receipts are not necessarily denominated in the same currency as their underlying securities. Generally, ADRs, issued in
registered form, are designed for use in the U.S. securities markets, and EDRs, issued in bearer form, are designed for use in European securities markets. GDRs are tradable both in the United States and in Europe and are designed for use throughout
the world.
The Fund will not invest in any
unlisted Depositary Receipt or any Depositary Receipt that BFA deems illiquid at the time of purchase or for which pricing information is not readily available. In general, Depositary Receipts must be sponsored, but the Fund may invest in
unsponsored Depositary Receipts under certain limited circumstances. The issuers of unsponsored Depositary Receipts are not obligated to disclose material information in the United States. Therefore, there may be less information available regarding
such issuers, and there may be no correlation between available information and the market value of the Depositary Receipts.
Investing in the securities of non-U.S. issuers involves
special risks and considerations not typically associated with investing in U.S. issuers. These include differences in accounting, auditing and financial reporting standards; the possibility of expropriation or confiscatory taxation; adverse changes
in investment or exchange control regulations; political instability, which could affect U.S. investments in non-U.S. countries; and potential restrictions on the flow of international capital. Non-U.S. issuers may be subject to less governmental
regulation than U.S. issuers. Moreover, individual non-U.S. economies may differ favorably or unfavorably from the U.S. economy in such respects as growth of gross domestic product (“GDP”), rate of inflation, capital reinvestment,
resource self-sufficiency and balance of payment positions.
Regulation Regarding Derivatives. The CFTC subjects advisors to registered investment companies to regulation by the CFTC if a fund that is advised by the advisor either (i) invests, directly or indirectly, more than a prescribed level of its
liquidation value in CFTC-regulated futures, options and swaps (“CFTC Derivatives”), or (ii) markets itself as providing investment exposure to such instruments. The CFTC also subjects advisors to registered investment companies to
regulation by the CFTC if the registered investment company invests in one or more commodity pools. To the extent the Fund uses CFTC Derivatives, it intends to do so below such prescribed levels and intends not to market itself as a “commodity
pool” or a vehicle for trading such instruments.
BFA has claimed an exclusion from the definition of the term
“commodity pool operator” under the CEA pursuant to Rule 4.5 under the CEA with respect to the Fund. BFA is not, therefore, subject to registration or regulation as a “commodity pool operator” under the CEA with respect to
the Fund.
Derivative contracts, including, without
limitation, swaps, currency forwards, and non-deliverable forwards, are subject to regulation under the Dodd-Frank Wall Street Reform and Consumer Protection Act (“Dodd-Frank Act”) in the U.S. and under comparable regimes in Europe, Asia
and other non-U.S. jurisdictions. Swaps, non-deliverable forwards and certain other derivatives traded in the OTC market became subject to variation margin requirements on March 1, 2017 and will be subject to phase-in requirements with respect to
initial margin, during the phase-in period that continues through 2020. Implementation of the margining and other provisions of the Dodd-Frank Act regarding clearing, mandatory trading,
6
reporting and documentation of swaps and other derivatives have impacted and
may continue to impact the costs to the Fund of trading these instruments and, as a result, may affect returns to investors in the Fund.
As a result of regulatory requirements under the 1940 Act, the
Fund is required to maintain an amount of liquid assets, accrued on a daily basis, having an aggregate value at least equal to the value of the Fund’s obligations under the applicable derivatives contract. To the extent that derivatives
contracts are settled on a physical basis, the Fund will generally be required to maintain an amount of liquid assets equal to the notional value of the contract. On the other hand, in connection with derivatives contracts that are performed on a
net basis, the Fund will generally be required to maintain liquid assets, accrued daily, equal only to the accrued excess, if any, of the Fund’s obligations over those of its counterparty under the contract. Accordingly, reliance by the Fund
on physically-settled derivatives contracts may adversely impact investors by requiring the Fund to set aside a greater amount of liquid assets than would generally be required if the Fund were relying on cash-settled derivatives contracts.
Repurchase Agreements. A
repurchase agreement is an instrument under which the purchaser (i.e., the Fund) acquires the security and the seller agrees, at the time of the
sale, to repurchase the security at a mutually agreed-upon time and price, thereby determining the yield during the purchaser’s holding period. Repurchase agreements may be construed to be collateralized loans by the purchaser to the seller
secured by the securities transferred to the purchaser. If a repurchase agreement is construed to be a collateralized loan, the underlying securities will not be considered to be owned by the Fund but only to constitute collateral for the
seller’s obligation to pay the repurchase price, and, in the event of a default by the seller, the Fund may suffer time delays and incur costs or losses in connection with the disposition of the collateral.
In any repurchase transaction, the collateral for a repurchase
agreement may include: (i) cash items; (ii) obligations issued by the U.S. government or its agencies or instrumentalities; or (iii) obligations that, at the time the repurchase agreement is entered into, are determined to (A) have exceptionally
strong capacity to meet their financial obligations and (B) are sufficiently liquid such that they can be sold at approximately their carrying value in the ordinary course of business within seven days.
Repurchase agreements pose certain risks for the Fund, should
it decide to utilize them. Such risks are not unique to the Fund, but are inherent in repurchase agreements. The Fund seeks to minimize such risks, but because of the inherent legal uncertainties involved in repurchase agreements, such risks cannot
be eliminated. Lower quality collateral and collateral with a longer maturity may be subject to greater price fluctuations than higher quality collateral and collateral with a shorter maturity. If the repurchase agreement counterparty were to
default, lower quality collateral may be more difficult to liquidate than higher quality collateral. Should the counterparty default and the amount of collateral not be sufficient to cover the counterparty’s repurchase obligation, the Fund
would likely retain the status of an unsecured creditor of the counterparty (i.e., the position the Fund would normally be in if it were to hold, pursuant to its investment policies, other unsecured debt
securities of the defaulting counterparty) with respect to the amount of the shortfall. As an unsecured creditor, the Fund would be at risk of losing some or all of the principal and income involved in the transaction.
Reverse Repurchase Agreements.
Reverse repurchase agreements involve the sale of securities with an agreement to repurchase the securities at an agreed-upon price, date and interest payment and have the characteristics of borrowing. Generally, the effect of such
transactions is that the Fund can recover all or most of the cash invested in the portfolio securities involved during the term of the reverse repurchase agreement, while in many cases the Fund is able to keep some of the interest income associated
with those securities. Such transactions are advantageous only if the Fund has an opportunity to earn a rate of interest on the cash derived from these transactions that is greater than the interest cost of obtaining the same amount of cash.
Opportunities to realize earnings from the use of the proceeds equal to or greater than the interest required to be paid may not always be available, and the Fund intends to use the reverse repurchase technique only when BFA believes it will be
advantageous to the Fund. The use of reverse repurchase agreements may exaggerate any increase or decrease in the value of the Fund’s assets. The Fund’s exposure to reverse repurchase agreements will be covered by liquid assets having a
value equal to or greater than the Fund’s obligations under such commitments. The use of reverse repurchase agreements is a form of leverage, and the proceeds obtained by the Fund through reverse repurchase agreements may be invested in
additional securities.
Securities of Investment
Companies. The Fund may invest in the securities of other investment companies (including money market funds) to the extent permitted by law. Pursuant to the 1940 Act, the Fund’s investment in registered
investment companies is generally limited to, subject to certain exceptions: (i) 3% of the total outstanding voting stock of any one investment company; (ii) 5% of the Fund’s total assets with respect to any one investment company; and (iii)
10% of
7
the Fund’s total assets with respect to investment companies in the
aggregate. To the extent allowed by law or regulation, the Fund intends from time to time to invest its assets in the securities of investment companies, including, but not limited to, money market funds, including those advised by or otherwise
affiliated with BFA, in excess of the general limits discussed above. Other investment companies in which the Fund may invest can be expected to incur fees and expenses for operations, such as investment advisory and administration fees, which would
be in addition to those incurred by the Fund. Pursuant to guidance issued by the SEC staff, fees and expenses of money market funds used for cash collateral received in connection with loans of securities are not treated as Acquired Fund Fees and
Expenses, which reflect the Fund’s pro rata share of the fees and expenses incurred by investing in other investment companies (as disclosed in the Prospectus, as applicable).
Short-Term Instruments and Temporary Investments. The Fund may invest in short-term instruments, including money market instruments, on an ongoing basis to provide liquidity or for other reasons. Money market instruments are generally short-term investments that
may include, but are not limited to: (i) shares of money market funds (including those advised by BFA or otherwise affiliated with BFA); (ii) obligations issued or guaranteed by the U.S. government, its agencies or instrumentalities (including
government-sponsored enterprises); (iii) negotiable certificates of deposit (“CDs”), bankers’ acceptances, fixed-time deposits and other obligations of U.S. and non-U.S. banks (including non-U.S. branches) and similar institutions;
(iv) commercial paper rated, at the date of purchase, “Prime-1” by Moody's® Investors Service, Inc., “F-1” by Fitch Ratings,
Inc., or “A-1” by Standard & Poor’s Financial Services LLC (“SPFS”), a subsidiary of S&P Global, Inc. (“S&P Global Ratings”), or if unrated, of comparable quality as determined by BFA; (v)
non-convertible corporate debt securities (e.g., bonds and debentures) with remaining maturities at the date of purchase of not more than 397 days
and that satisfy the rating requirements set forth in Rule 2a-7 under the 1940 Act; (vi) repurchase agreements; and (vii) short-term U.S. dollar-denominated obligations of non-U.S. banks (including U.S. branches) that, in the opinion of BFA, are of
comparable quality to obligations of U.S. banks that may be purchased by the Fund. Any of these instruments may be purchased on a current or forward-settled basis. Time deposits are non-negotiable deposits maintained in banking institutions for
specified periods of time at stated interest rates. Bankers’ acceptances are time drafts drawn on commercial banks by borrowers, usually in connection with international transactions.
Swap Agreements. Swap
agreements are contracts between parties in which one party agrees to make periodic payments to the other party based on the change in market value or level of a specified rate, index or asset. In return, the other party agrees to make periodic
payments to the first party based on the return of a different specified rate, index or asset. Swap agreements will usually be performed on a net basis, with the Fund receiving or paying only the net amount of the two payments. The net amount of the
excess, if any, of the Fund’s obligations over its entitlements with respect to each swap is accrued on a daily basis, and an amount of liquid assets having an aggregate value at least equal to the accrued excess will be maintained by the
Fund.
The Fund may enter into currency, interest
rate or index swaps. The use of currency, interest rate and index swaps is a highly specialized activity that involves investment techniques and risks different from those associated with ordinary portfolio security transactions. These transactions
generally do not involve the delivery of securities or other underlying assets.
Tracking Stocks. A
tracking stock is a separate class of common stock whose value is linked to a specific business unit or operating division within a larger company and is designed to “track” the performance of such business unit or division. The tracking
stock may pay dividends to shareholders independent of the parent company. The parent company, rather than the business unit or division, generally is the issuer of tracking stock. However, holders of the tracking stock may not have the same rights
as holders of the company’s common stock.
Future Developments. The
Board may, in the future, authorize the Fund to invest in securities contracts and investments, other than those listed in this SAI and in the Prospectus, provided they are consistent with the Fund's investment objective and do not violate any of
its investment restrictions or policies.
General
Considerations and Risks
A discussion of some of the
principal risks associated with an investment in the Fund is contained in the Prospectus.
An investment in the Fund should be made with an understanding
that the value of the Fund’s portfolio securities may fluctuate in accordance with changes in the financial condition of the issuers of the portfolio securities, the value of stocks in general, and other factors that affect the
market.
8
Borrowing Risk.
Borrowing may exaggerate changes in the net asset value of Fund shares and in the return on the Fund’s portfolio. Borrowing will cost the Fund interest expense and other fees. The costs of borrowing may
reduce the Fund’s return. Borrowing may cause the Fund to liquidate positions when it may not be advantageous to do so to satisfy its obligations.
Custody Risk. Custody
risk refers to the risks inherent in the process of clearing and settling trades and to the holding of securities, cash and other assets by local banks, agents and depositories. Low trading volumes and volatile prices in less developed markets make
trades harder to complete and settle, and governments or trade groups may compel local agents to hold securities in designated depositories that may not be subject to independent evaluation. Local agents are held only to the standards of care of
their local markets, and thus may be subject to limited or no government oversight. Communications between the United States and emerging market countries may be unreliable, increasing the risk of delayed settlements or losses of security
certificates. In general, the less developed a country’s securities market is, the greater the likelihood of custody problems. Practices in relation to the settlement of securities transactions in emerging markets involve higher risks than
those in developed markets, in part because of the use of brokers and counterparties that are often less well capitalized, and custody and registration of assets in some countries may be unreliable. The possibility of fraud, negligence or undue
influence being exerted by the issuer or refusal to recognize ownership exists in some emerging markets, and, along with other factors, could result in ownership registration being lost. In addition, the laws of certain countries may put limits on
the Fund’s ability to recover its assets if a foreign bank or depository or issuer of a security or an agent of any of the foregoing goes bankrupt. The Fund would absorb any loss resulting from such custody problems and may have no successful
claim for compensation.
Dividend-Paying Stock Risk.
The Fund's strategy of investing in dividend-paying stocks involves the risk that such stocks may fall out of favor with investors and underperform the market. Companies that issue dividend-paying stocks are
not required to continue to pay dividends on such stocks. Therefore, there is the possibility that such companies could reduce or eliminate the payment of dividends in the future or the anticipated acceleration of dividends could not occur.
Depending upon market conditions, dividend-paying stocks that meet the Fund’s investment criteria may not be widely available and/or may be highly concentrated in only a few market sectors. This may limit the ability of the Fund to produce
current income while remaining fully diversified.
Liquidity Risk Management Rule Risk. In October 2016, the SEC adopted a new liquidity risk management rule requiring open-end funds, including exchange-traded funds (“ETFs”), to establish a liquidity risk management program and enhance
disclosures regarding fund liquidity. There are exclusions from certain portions of the liquidity risk management program requirements for “in kind” ETFs. The Fund will be required to comply with the rule by December 1, 2018. The effect
the new rule will have on the Fund, including the Fund’s ability to rely on the exclusions, is not yet known, but the rule may impact the Fund’s performance and ability to achieve its investment objective.
National Closed Market Trading Risk. To the extent that the underlying securities held by the Fund trade on foreign exchanges that are closed when the securities exchange on which the Fund’s shares trade is open, there are likely to be
deviations between the current price of such an underlying security and the last quoted price for the underlying security (i.e., the Fund’s
quote from the closed foreign market). These deviations may result in premiums or discounts to the Fund’s NAV that may be greater than those experienced by other ETFs.
Operational Risk. BFA
and the Fund's other service providers may experience disruptions or operating errors such as processing errors or human errors, inadequate or failed internal or external processes, or systems or technology failures, that could negatively impact the
Fund. While service providers are required to have appropriate operational risk management policies and procedures, their methods of operational risk management may differ from the Fund’s in the setting of priorities, the personnel and
resources available or the effectiveness of relevant controls. BFA, through its monitoring and oversight of service providers, seeks to ensure that service providers take appropriate precautions to avoid and mitigate risks that could lead to
disruptions and operating errors. However, it is not possible for BFA or the other Fund service providers to identify all of the operational risks that may affect the Fund or to develop processes and controls to completely eliminate or mitigate
their occurrence or effects.
Risk of Derivatives. A derivative is a financial contract, the value of which depends on, or is derived from, the value of an underlying asset, such as a security, a commodity (such as gold or silver), a currency or an index (a
measure of value or rates, such as the S&P 500® or the prime lending rate). The Fund may invest in stock index futures contracts, securities
options and other derivatives. Compared to conventional securities, derivatives can be more sensitive to changes in interest rates or to sudden fluctuations in market prices and thus the Fund’s losses may be greater if it invests in
derivatives than if it invests only
9
in conventional securities. Derivatives are also subject to counterparty
risk, which is the risk that the other party in the transaction will not fulfill its contractual obligations. Derivatives generally involve the incurrence of leverage. To address such leverage and to prevent the Fund from being deemed to have issued
senior securities as a result of an investment in derivatives, the Fund will segregate liquid assets equal to its obligations under the derivatives throughout the life of the investment.
Risk of Equity Securities.
An investment in the Fund should be made with an understanding of the risks inherent in an investment in equity securities, including the risk that the financial condition of issuers may become impaired or that the general condition of stock
markets may deteriorate (either of which may cause a decrease in the value of the portfolio securities and thus in the value of shares of the Fund). Common stocks are susceptible to general stock market fluctuations and to increases and decreases in
value as market confidence and perceptions of their issuers change. These investor perceptions are based on various and unpredictable factors, including expectations regarding government, economic, monetary and fiscal policies, inflation and
interest rates, economic expansion or contraction, and global or regional political, economic or banking crises. Holders of common stocks incur more risks than holders of preferred stocks and debt obligations because common stockholders generally
have rights to receive payments from stock issuers that are inferior to the rights of creditors, or holders of debt obligations or preferred stocks. Further, unlike debt securities, which typically have a stated principal amount payable at maturity
(the value of which, however, is subject to market fluctuations prior to maturity), or preferred stocks, which typically have a liquidation preference and which may have stated optional or mandatory redemption provisions, common stocks have neither
a fixed principal amount nor a maturity date. In addition, issuers may, in times of distress or at their own discretion, decide to reduce or eliminate dividends, which may also cause their stock price to decline.
Although most of the securities in the Underlying Index are
listed on a securities exchange, the principal trading market for some of the securities may be in the OTC market. The existence of a liquid trading market for certain securities may depend on whether dealers will make a market in such securities.
There can be no assurance that a market will be made or maintained or that any such market will be or remain liquid. The price at which securities may be sold and the value of the Fund’s shares will be adversely affected if trading markets for
the Fund’s portfolio securities are limited or absent, or if bid/ask spreads are wide.
Risk of Futures and Options on Futures Transactions. There are several risks accompanying the utilization of futures contracts and options on futures contracts. A position in futures contracts and options on futures contracts may be closed only on the exchange on
which the contract was made (or a linked exchange). While the Fund plans to utilize futures contracts only if an active market exists for such contracts, there is no guarantee that a liquid market will exist for the contract at a specified time.
Futures contracts, by definition, project price levels in the future and not current levels of valuation; therefore, market circumstances may result in a discrepancy between the price of the stock index future and the movement in the Fund's
Underlying Index. In the event of adverse price movements, the Fund would continue to be required to make daily cash payments to maintain its required margin. In such situations, if the Fund has insufficient cash, it may have to sell portfolio
securities to meet daily margin requirements at a time when it may be disadvantageous to do so. In addition, the Fund may be required to deliver the instruments underlying the futures contracts it has sold.
The risk of loss in trading futures contracts or uncovered
call options in some strategies (e.g., selling uncovered stock index futures contracts) is potentially unlimited. The Fund does not plan to use futures and options contracts in this way. The risk of a futures
position may still be large as traditionally measured due to the low margin deposits required. In many cases, a relatively small price movement in a futures contract may result in immediate and substantial loss or gain to the investor relative to
the size of a required margin deposit. The Fund, however, intends to utilize futures and options contracts in a manner designed to limit the risk exposure to levels comparable to a direct investment in the types of stocks in which it invests.
Utilization of futures and options on futures by the Fund
involves the risk of imperfect or even negative correlation to the Underlying Index if the index underlying the futures contract differs from the Underlying Index. There is also the risk of loss of margin deposits in the event of bankruptcy of a
broker with whom the Fund has an open position in the futures contract or option. The purchase of put or call options will be based upon predictions by BFA as to anticipated trends, which predictions could prove to be incorrect.
Because the futures market generally imposes less burdensome
margin requirements than the securities market, an increased amount of participation by speculators in the futures market could result in price fluctuations. Certain financial
10
futures exchanges limit the amount of fluctuation permitted in futures
contract prices during a single trading day. The daily limit establishes the maximum amount by which the price of a futures contract may vary either up or down from the previous day’s settlement price at the end of a trading session. Once the
daily limit has been reached in a particular type of contract, no trades may be made on that day at a price beyond that limit. It is possible that futures contract prices could move to the daily limit for several consecutive trading days with little
or no trading, thereby preventing prompt liquidation of futures positions and subjecting the Fund to substantial losses. In the event of adverse price movements, the Fund would be required to make daily cash payments of variation margin.
Risk of Investing in Non-U.S. Equity Securities. An investment in the Fund involves risks similar to those of investing in portfolios of equity securities traded on non-U.S. exchanges. These risks include market fluctuations caused by such factors as economic and
political developments in those foreign countries, changes in interest rates and perceived trends in stock prices. Investing in securities issued by issuers domiciled in countries other than the domicile of the investor and denominated in currencies
other than an investor’s local currency entails certain considerations and risks not typically encountered by the investor in making investments in its home country and in that country’s currency. These considerations include favorable
or unfavorable changes in interest rates, currency exchange rates, exchange control regulations and the costs that may be incurred in connection with conversions between various currencies. Investing in the Fund also involves certain risks and
considerations not typically associated with investing in a fund whose portfolio contains exclusively securities of U.S. issuers. These risks include generally less liquid and less efficient securities markets; generally greater price volatility;
less publicly available information about issuers; the imposition of withholding or other taxes; the imposition of restrictions on the expatriation of funds or other assets of the Fund; restrictions on ownership of Indian and other foreign
countries' securities by foreign entities; higher transaction and custody costs; delays and risks attendant in settlement procedures; difficulties in enforcing contractual obligations; lower liquidity and significantly smaller market capitalization;
different accounting and disclosure standards; lower levels of regulation of the securities markets; more substantial government interference with the economy and businesses; higher rates of inflation; greater social, economic, and political
uncertainty; the risk of nationalization or expropriation of assets; and the risk of war.
Risk of Swap Agreements.
The risk of loss with respect to swaps is generally limited to the net amount of payments that the Fund is contractually obligated to make. Swap agreements are subject to the risk that the swap counterparty will default on its obligations. If
such a default occurs, the Fund will have contractual remedies pursuant to the agreements related to the transaction. However, such remedies may be subject to bankruptcy and insolvency laws, which could affect the Fund’s rights as a creditor
(e.g., the Fund may not receive the net amount of payments that it is contractually entitled to receive).
Regulations are now in effect that require the Fund to post
and collect variation margin (comprised of specified liquid instruments and subject to required haircuts) in connection with trading of OTC swaps. Requirements for posting of initial margin in connection with OTC swaps will be phased-in over the
next several years. The Fund expects that both of these requirements may increase the costs of transacting in swaps. In addition, the prudential regulators have indicated that they intend to adopt regulations requiring certain regulated
counterparties to include in swap agreements terms that restrict the rights of counterparties, such as the Fund, to terminate swaps and foreclose upon collateral in the event that the counterparty and/or its affiliates are subject to certain types
of insolvency proceedings.
Risk of Investing in
Large-Capitalization Companies. Large-capitalization companies may be less able than smaller capitalization companies to adapt to changing market conditions. Large-capitalization companies may be more mature
and subject to more limited growth potential compared with smaller capitalization companies. Over certain periods, the performance of large-capitalization companies has trailed the performance of overall markets.
Risk of Investing in Mid-Capitalization Companies. Stock prices of mid-capitalization companies may be more volatile than those of large-capitalization companies, and, therefore, the Fund’s share price may be more volatile than that of funds that invest a
larger percentage of their assets in stocks issued by large-capitalization companies. Stock prices of mid-capitalization companies are also more vulnerable than those of large-capitalization companies to adverse business or economic developments,
and the stocks of mid-capitalization companies may be less liquid, making it more difficult for the Fund to buy and sell them. In addition, mid-capitalization companies generally have less diverse product lines than large-capitalization companies
and are more susceptible to adverse developments related to their products.
Risk of Investing in Small-Capitalization Companies. Stock prices of small-capitalization companies may be more volatile than those of larger companies, and, therefore, the Fund's share price may be more volatile than that of funds that invest a larger percentage of
their assets in stocks issued by large-capitalization or mid-capitalization companies. Stock prices of
11
small-capitalization companies are generally more vulnerable than those of
large-capitalization or mid-capitalization companies to adverse business and economic developments. The stocks of small-capitalization companies may be thinly traded, making it difficult for the Fund to buy and sell them. In addition,
small-capitalization companies are typically less financially stable than larger, more established companies and may depend on a small number of essential personnel, making them more vulnerable to loss of personnel. Small-capitalization companies
also normally have less diverse product lines than large-capitalization companies and are more susceptible to adverse developments concerning their products.
Risk of Investing in Africa.
Investments in securities of issuers in certain African countries involve heightened risks including, among others, expropriation and/or nationalization of assets, confiscatory taxation, political instability, including authoritarian and/or
military involvement in governmental decision-making, armed conflict, civil war, and social instability as a result of religious, ethnic and/or socio-economic unrest and, in certain countries, genocidal warfare.
Certain countries in Africa generally have less developed
capital markets than traditional emerging market countries, and, consequently, the risks of investing in foreign securities are magnified in such countries. Because securities markets of countries in Africa are generally underdeveloped and are
generally less correlated to global economic cycles than those markets located in more developed countries, securities markets in African countries are subject to greater risks associated with market volatility, lower market capitalization, lower
trading volume, illiquidity, inflation, greater price fluctuations and uncertainty regarding the existence of trading markets. Moreover, trading on African securities markets may be suspended altogether.
Market volatility may also be heightened by the actions of a
small number of investors. Brokerage firms in certain countries in Africa may be fewer in number and less established than brokerage firms in more developed markets. Since the Fund may need to effect securities transactions through these brokerage
firms, the Fund is subject to the risk that these brokerage firms will not be able to fulfill their obligations to the Fund (i.e., counterparty risk). This risk is magnified to the extent that the Fund effects
securities transactions through a single brokerage firm or a small number of brokerage firms.
Certain governments in African countries restrict or control
to varying degrees the ability of foreign investors to invest in securities of issuers located or operating in those countries. Moreover, certain countries in Africa require governmental approval or special licenses prior to investment by foreign
investors and may limit the amount of investment by foreign investors in a particular industry and/or issuer, and may limit such foreign investment to a certain class of securities of an issuer that may have less advantageous rights than the classes
available for purchase by domestic investors of the countries and/or impose additional taxes on foreign investors. A delay in obtaining a government approval or a license would delay investments in a particular country, and, as a result, the Fund
may not be able to invest in certain securities while approval is pending. The government of a particular country may also withdraw or decline to renew a license that enables the Fund to invest in such country. These factors make investing in
issuers located or operating in countries in Africa significantly riskier than investing in issuers located or operating in more developed countries, and any one of these factors could cause a decline in the value of the Fund’s investments.
Issuers located or operating in countries in Africa are generally not subject to the same rules and regulations as issuers located or operating in more developed countries. Therefore, there may be less financial and other information publicly
available with regard to issuers located or operating in countries in Africa and such issuers are generally not subject to the uniform accounting, auditing and financial reporting standards applicable to issuers located or operating in more
developed countries.
In addition, governments of certain
countries in Africa in which the Fund may invest may levy withholding or other taxes on income such as dividends, interest and realized capital gains. Although in certain countries in Africa a portion of these taxes are recoverable, the
non-recovered portion of foreign withholding taxes will reduce the income received from investments in such countries.
Investment in countries in Africa may be subject to a greater
degree of risk associated with governmental approval in connection with the repatriation of investment income, capital or the proceeds of sales of securities by foreign investors. In addition, there is the risk that if an African country’s
balance of payments declines, such African country may impose temporary restrictions on foreign capital remittances. Consequently, the Fund could be adversely affected by delays in, or a refusal to grant, required governmental approval for
repatriation of capital, as well as by the application to the Fund of any restrictions on investments. Additionally, investments in countries in Africa may require the Fund to adopt special procedures, seek local government approvals or take other
actions, each of which may involve additional costs to the Fund.
Securities laws in many countries in Africa are relatively new
and unsettled and, consequently, there is a risk of rapid and unpredictable change in laws regarding foreign investment, securities regulation, title to securities and shareholder rights.
12
Accordingly, foreign investors may be adversely affected by new or amended
laws and regulations. In addition, there may be no single centralized securities exchange on which securities are traded in certain countries in Africa and the systems of corporate governance to which issuers located in countries in Africa are
subject may be less advanced than those systems to which issuers located in more developed countries are subject, and, therefore, shareholders of issuers located in such countries may not receive many of the protections available to shareholders of
issuers located in more developed countries. Even in circumstances where adequate laws and shareholder rights exist, it may not be possible to obtain swift and equitable enforcement of the law. In addition, the enforcement of systems of taxation at
federal, regional and local levels in countries in Africa may be inconsistent and subject to sudden change.
Certain countries in Africa may be heavily dependent upon
international trade and, consequently, have been and may continue to be negatively affected by trade barriers, exchange controls, managed adjustments in relative currency values and other protectionist measures imposed or negotiated by the countries
with which they trade. These countries also have been and may continue to be adversely affected by economic conditions in the countries with which they trade. Certain countries in Africa depend to a significant extent upon exports of primary
commodities such as gold, silver, copper and diamonds. These countries therefore are vulnerable to changes in commodity prices, which may be affected by a variety of factors. In addition, certain issuers located in countries in Africa in which the
Fund invests may operate in, or have dealings with, countries subject to sanctions and/or embargoes imposed by the U.S. government and the United Nations, and/or countries identified by the U.S. government as state sponsors of terrorism. As a
result, an issuer may sustain damage to its reputation if it is identified as an issuer which operates in, or has dealings with, such countries. The Fund, as an investor in such issuers, will be indirectly subject to those risks.
The governments of certain countries in Africa may exercise
substantial influence over many aspects of the private sector and may own or control many companies. Future government actions could have a significant effect on the economic conditions in such countries, which could have a negative impact on
private sector companies. There is also the possibility of diplomatic developments that could adversely affect investments in certain countries in Africa. Some countries in Africa may be affected by a greater degree of public corruption and crime,
including organized crime.
Recent political instability
and protests in North Africa and the Middle East have caused significant disruptions to many industries. In addition, the outbreak of Ebola in Western Africa severely challenged health care industries in those countries and adversely impacted the
region’s economy due to quarantines and disruptions of trade, which has further increased instability in the region. This instability has demonstrated that political and social unrest can spread quickly through the region, and that
developments in one country can influence the political events in neighboring countries. Some protests have turned violent, and civil war and political reconstruction in certain countries such as Libya, Iraq and Syria pose a risk to investments in
the region. Continued political and social unrest in these regions, including the ongoing warfare and terrorist activities in the Middle East and Africa, may negatively affect the value of an investment in the Fund.
Risk of Investing in Asia.
Investments in securities of issuers in certain Asian countries involve risks not typically associated with investments in securities of issuers in other regions. Such heightened risks include, among others, expropriation and/or
nationalization of assets, confiscatory taxation, piracy of intellectual property, data and other security breaches (especially of data stored electronically), political instability, including authoritarian and/or military involvement in
governmental decision-making, armed conflict and social instability as a result of religious, ethnic and/or socio-economic unrest. Certain Asian economies have experienced rapid rates of economic growth and industrialization in recent years, and
there is no assurance that these rates of economic growth and industrialization will be maintained.
Certain Asian countries have democracies with relatively short
histories, which may increase the risk of political instability. These countries have faced political and military unrest, and further unrest could present a risk to their local economies and securities markets. Indonesia and the Philippines have
each experienced violence and terrorism, which has negatively impacted their economies. North Korea and South Korea each have substantial military capabilities, and historical tensions between the two countries present the risk of war; in the recent
past, these tensions have escalated. Any outbreak of hostilities between the two countries could have a severe adverse effect on the South Korean economy and securities market. Political, religious, and border disputes persist in India. India has
recently experienced and may continue to experience civil unrest and hostilities with certain of its neighboring countries. Increased political and social unrest in these geographic areas could adversely affect the performance of investments in this
region.
Certain governments in this region administer
prices on several basic goods, including fuel and electricity, within their respective countries. Certain governments may exercise substantial influence over many aspects of the private sector in their
13
respective countries and may own or control many companies. Future government
actions could have a significant effect on the economic conditions in this region, which in turn could have a negative impact on private sector companies. There is also the possibility of diplomatic developments adversely affecting investments in
the region.
Corruption and the perceived lack of a rule
of law in dealings with international companies in certain Asian countries may discourage foreign investment and could negatively impact the long-term growth of certain economies in this region. In addition, certain countries in the region are
experiencing high unemployment and corruption, and have fragile banking sectors.
Some economies in this region are dependent on a range of
commodities, including oil, natural gas and coal. Accordingly, they are strongly affected by international commodity prices and particularly vulnerable to any weakening in global demand for these products. The market for securities in this region
may also be directly influenced by the flow of international capital, and by the economic and market conditions of neighboring countries. Adverse economic conditions or developments in neighboring countries may increase investors' perception of the
risk of investing in the region as a whole, which may adversely impact the market value of the securities issued by companies in the region.
Risk of Investing in Central and South America. The economies of certain countries in which the Fund invests are affected by the economies of other Central and South American countries, some of which have experienced high interest rates, economic volatility,
inflation, currency devaluations, government defaults, high unemployment rates and political instability which can adversely affect issuers in these countries. In addition, commodities (such as oil, gas and minerals) represent a significant
percentage of the region's exports and many economies in this region are particularly sensitive to fluctuations in commodity prices. Adverse economic events in one country may have a significant adverse effect on some or all of the countries to
which the Fund has exposure.
The governments of
certain countries in Central and South America may exercise substantial influence over many aspects of the private sector and may own or control many companies. Future government actions could have a significant effect on the economic conditions in
such countries, which could have a negative impact on the securities in which the Fund invests. Diplomatic developments may also adversely affect investments in certain countries in Central and South America. Some countries in Central and South
America may be affected by public corruption and crime, including organized crime.
Certain countries in Central and South America may be heavily
dependent upon international trade and, consequently, have been and may continue to be negatively affected by trade barriers, exchange controls, managed adjustments in relative currency values and other protectionist measures imposed or negotiated
by the countries with which they trade. These countries also have been and may continue to be adversely affected by economic conditions in the countries with which they trade. In addition, certain issuers located in countries in Central and South
America in which the Fund invests may have dealings with countries subject to sanctions and/or embargoes imposed by the U.S. government and the United Nations and/or countries identified by the U.S. government as state sponsors of terrorism. An
issuer may sustain damage to its reputation if it is identified as an issuer that has dealings with such countries. The Fund may be adversely affected if it invests in such issuers.
Risk of Investing in Developed Countries. Many countries with developed markets have recently experienced significant economic pressures. These countries generally tend to rely on the services sectors (e.g., the financial services sector) as the primary source of economic growth and may be susceptible to the risks of individual service sectors. For example,
companies in the financial services sector are subject to governmental regulation and, recently, government intervention, which may adversely affect the scope of their activities, the prices they can charge and amount of capital they must maintain.
Recent dislocations in the financial sector and perceived or actual governmental influence over certain financial companies may lead to credit rating downgrades and, as a result, impact, among other things, revenue growth for such companies. If
financial companies experience a prolonged decline in revenue growth, certain developed countries that rely heavily on financial companies as an economic driver may experience a correlative slowdown. Recently, new concerns have emerged with respect
to the economic health of certain developed countries. These concerns primarily stem from heavy indebtedness of many developed countries and their perceived inability to continue to service high debt loads without simultaneously implementing
stringent austerity measures. Such concerns have led to tremendous downward pressure on the economies of these countries. As a result, it is possible that interest rates on debt of certain developed countries may rise to levels that make it
difficult for such countries to service such debt. Spending on health care and retirement pensions in most developed countries has risen dramatically over the last few years. Medical innovation, extended life expectancy and higher public
expectations are likely to continue the increase in health care and pension costs. Any increase in health care and pension
14
costs will likely have a negative impact on the economic growth of many
developed countries. Certain developed countries rely on imports of certain key items, such as crude oil, natural gas, and other commodities. As a result, an increase in demand for, or price fluctuations of, certain commodities may negatively affect
developed country economies. Developed market countries generally are dependent on the economies of certain key trading partners. Changes in any one economy may cause an adverse impact on several developed countries. In addition, heavy regulation
of, among others, labor and product markets may have an adverse effect on certain issuers. Such regulations may negatively affect economic growth or cause prolonged periods of recession. Such risks, among others, may adversely affect the value of
the Fund’s investments.
Risk of Investing in Eastern
Europe. Investing in the securities of issuers located or operating in Eastern Europe is highly speculative and involves risks not usually associated with investing in the more developed markets of Western
Europe. Political and economic reforms are too recent to establish a definite trend away from centrally planned economies and state-owned industries. In the past, some Eastern European governments have expropriated substantial amounts of private
property, and many claims of the property owners have never been fully settled.
Many Eastern European countries continue to move toward market
economies at different paces with different characteristics. Most Eastern European securities markets suffer from thin trading activity, dubious investor protections, and often a dearth of reliable corporate information. Information and transaction
costs, differential taxes, and sometimes political or transfer risk give a comparative advantage to the domestic investor rather than the foreign investor. In addition, these markets are particularly sensitive to social, political, economic, and
currency events in Russia and may suffer heavy losses as a result of their trading and investment links to the Russian economy and currency. Russia also may attempt to assert its influence in the region through economic or even military measures, as
it did with Georgia in the summer of 2008 and Ukraine beginning in 2014. Eastern European economies may also be particularly susceptible to changes in the international credit markets due to their reliance on bank related inflows of capital. The
global economic crisis has restricted international credit supplies, and several Eastern European economies have faced significant credit and economic crises. Although some Eastern European economies are expanding again, major challenges are still
present as a result of their continued dependence on the Western European zone for credit.
Risk of Investing in Emerging Markets. Investments in emerging market countries may be subject to greater risks than investments in developed countries. These risks include: (i) less social, political, and economic stability; (ii) greater illiquidity
and price volatility due to smaller or limited local capital markets for such securities, or low or non-existent trading volumes; (iii) custodians, clearinghouses, foreign exchanges and broker-dealers may be subject to less scrutiny and regulation
by local authorities; (iv) local governments may decide to seize or confiscate securities held by foreign investors and/or local governments may decide to suspend or limit an issuer's ability to make dividend or interest payments; (v) local
governments may limit or entirely restrict repatriation of invested capital, profits, and dividends; (vi) capital gains may be subject to local taxation, including on a retroactive basis; (vii) issuers facing restrictions on dollar or euro payments
imposed by local governments may attempt to make dividend or interest payments to foreign investors in the local currency; (viii) investors may experience difficulty in enforcing legal claims related to the securities and/or local judges may favor
the interests of the issuer over those of foreign investors; (ix) bankruptcy judgments may only be permitted to be paid in the local currency; (x) limited public information regarding the issuer may result in greater difficulty in determining market
valuations of the securities; and (xi) lack of financial reporting on a regular basis, substandard disclosure and differences in accounting standards may make it difficult to ascertain the financial health of an issuer.
Emerging market securities markets are typically marked by a
high concentration of market capitalization and trading volume in a small number of issuers representing a limited number of industries, as well as a high concentration of ownership of such securities by a limited number of investors. In addition,
brokerage and other costs associated with transactions in emerging market securities can be higher, sometimes significantly, than similar costs incurred in securities markets in developed countries. Although some emerging markets have become more
established and tend to issue securities of higher credit quality, the markets for securities in other emerging market countries are in the earliest stages of their development, and these countries issue securities across the credit spectrum. Even
the markets for relatively widely traded securities in emerging market countries may not be able to absorb, without price disruptions, a significant increase in trading volume or trades of a size customarily undertaken by institutional investors in
the securities markets of developed countries. The limited size of many of these securities markets can cause prices to be erratic for reasons apart from factors that affect the soundness and competitiveness of the securities issuers. For example,
prices may be unduly influenced by traders who control large positions in these markets. Additionally, market making and arbitrage activities are generally less extensive in such markets, which may contribute to increased volatility and reduced
liquidity of such markets. The limited liquidity of
15
emerging market country securities may also affect the Fund's ability to
accurately value its portfolio securities or to acquire or dispose of securities at the price and time it wishes to do so or in order to meet redemption requests.
Many emerging market countries suffer from uncertainty and
corruption in their legal frameworks. Legislation may be difficult to interpret and laws may be too new to provide any precedential value. Laws regarding foreign investment and private property may be weak or non-existent. Sudden changes in
governments may result in policies which are less favorable to investors such as policies designed to expropriate or nationalize “sovereign” assets. Certain emerging market countries in the past have expropriated large amounts of private
property, in many cases with little or no compensation, and there can be no assurance that such expropriation will not occur in the future.
Investment in the securities markets of certain emerging
market countries is restricted or controlled to varying degrees. These restrictions may limit the Fund's investment in certain emerging market countries and may increase the expenses of the Fund. Certain emerging market countries require
governmental approval prior to investments by foreign persons or limit investment by foreign persons to only a specified percentage of an issuer's outstanding securities or a specific class of securities which may have less advantageous terms
(including price) than securities of the company available for purchase by nationals.
Many emerging market countries lack the social, political, and
economic stability characteristic of the United States. Political instability among emerging market countries can be common and may be caused by an uneven distribution of wealth, social unrest, labor strikes, civil wars, and religious oppression.
Economic instability in emerging market countries may take the form of: (i) high interest rates; (ii) high levels of inflation, including hyperinflation; (iii) high levels of unemployment or underemployment; (iv) changes in government economic and
tax policies, including confiscatory taxation; and (v) imposition of trade barriers.
The Fund's income and, in some cases, capital gains from
foreign securities will be subject to applicable taxation in certain of the emerging market countries in which it invests, and treaties between the United States and such countries may not be available in some cases to reduce the otherwise
applicable tax rates.
Emerging markets also have
different clearance and settlement procedures, and in certain of these emerging markets there have been times when settlements have been unable to keep pace with the volume of securities transactions, making it difficult to conduct such
transactions.
In the past, certain governments in
emerging market countries have become overly reliant on the international capital markets and other forms of foreign credit to finance large public spending programs, which in the past have caused huge budget deficits. Often, interest payments have
become too overwhelming for a government to meet, representing a large percentage of total GDP. These foreign obligations have become the subject of political debate and served as fuel for political parties of the opposition, which pressure the
government not to make payments to foreign creditors, but instead to use these funds for, among other things, social programs. Either due to an inability to pay or submission to political pressure, foreign governments have been forced to seek a
restructuring of their loan and/or bond obligations, have declared a temporary suspension of interest payments or have defaulted. These events have adversely affected the values of securities issued by foreign governments and corporations domiciled
in those countries and have negatively affected not only their cost of borrowing, but their ability to borrow in the future as well.
Risk of Investing in Europe.
Investing in European countries may expose the Fund to the economic and political risks associated with Europe in general and the specific European countries in which it invests. The economies and markets of
European countries are often closely connected and interdependent, and events in one European country can have an adverse impact on other European countries. The Fund makes investments in securities of issuers that are domiciled in, or have
significant operations in, member countries of the Economic and Monetary Union of the European Union (the “EU”), which requires member countries to comply with restrictions on inflation rates, deficits, interest rates, debt levels and
fiscal and monetary controls, each of which may significantly affect every country in Europe. Changes in imports or exports, changes in governmental or EU regulations on trade, changes in the exchange rate of the euro (the common currency of certain
EU countries), the default or threat of default by an EU member country on its sovereign debt, and/or an economic recession in an EU member country may have a significant adverse effect on the economies of EU member countries and their trading
partners. Although certain European countries do not use the euro, many of these countries are obliged to meet the criteria for joining the euro zone. Consequently, these countries must comply with many of the restrictions noted above. The European
financial markets have experienced volatility and adverse trends in recent years due to concerns about economic downturns, rising government debt levels and the possible default of government debt in several European
16
countries, including, but not limited to, Cyprus, Greece, Ireland, Italy,
Portugal, Spain and Ukraine. In order to prevent further economic deterioration, certain countries, without prior warning, can institute “capital controls.” Countries may use these controls to restrict volatile movements of capital
entering and exiting their country. Such controls may negatively affect the Fund’s investments. A default or debt restructuring by any European country would adversely impact holders of that country's debt and sellers of credit default swaps
linked to that country's creditworthiness, which may be located in countries other than those listed above. In addition, the credit ratings of certain European countries were recently downgraded. These downgrades may result in further deterioration
of investor confidence. These events have adversely affected the value and exchange rate of the euro and may continue to significantly affect the economies of every country in Europe, including countries that do not use the euro and non-EU member
countries. Responses to the financial problems by European governments, central banks and others, including austerity measures and reforms, may not produce the desired results, may result in social unrest and may limit future growth and economic
recovery or have other unintended consequences. Further defaults or restructurings by governments and other entities of their debt could have additional adverse effects on economies, financial markets and asset valuations around the world. In
addition, one or more countries may abandon the euro and/or withdraw from the EU. The impact of these actions, especially if they occur in a disorderly fashion, is not clear but could be significant and far-reaching and could adversely impact the
value of the Fund’s investments in the region. In a referendum held on June 23, 2016, the United Kingdom resolved to leave the EU. The referendum may introduce significant uncertainties and instability in the financial markets as the United
Kingdom negotiates its exit from the EU. The occurrence of terrorist incidents throughout Europe also could impact financial markets. The impact of these events is not clear but could be significant and far-reaching and could adversely affect the
value of the Fund.
Risk of Investing in the Middle East. Many Middle Eastern countries have little or no democratic tradition, and the political and legal systems in such countries may have an adverse impact on the Fund. Many economies in the Middle East are highly
reliant on income from the sale of oil or trade with countries involved in the sale of oil, and their economies are therefore vulnerable to changes in the market for oil and foreign currency values. As global demand for oil fluctuates, many Middle
Eastern economies may be significantly impacted.
In addition, many Middle Eastern governments have exercised
and continue to exercise substantial influence over many aspects of the private sector. In certain cases, a Middle Eastern country’s government may own or control many companies, including some of the largest companies in the country.
Accordingly, governmental actions in the future could have a significant effect on economic conditions in Middle Eastern countries. This could affect private sector companies and the Fund, as well as the value of securities in the Fund's
portfolio.
Certain Middle Eastern markets are in the
earliest stages of development. As a result, there may be a high concentration of market capitalization and trading volume in a small number of issuers representing a limited number of industries, as well as a high concentration of investors and
financial intermediaries. Brokers in Middle Eastern countries typically are fewer in number and less capitalized than brokers in the United States.
The legal systems in certain Middle Eastern countries also may
have an adverse impact on the Fund. For example, the potential liability of a shareholder in a U.S. corporation with respect to acts of the corporation generally is limited to the amount of the shareholder’s investment. However, the notion of
limited liability is less clear in certain Middle Eastern countries. The Fund therefore may be liable in certain Middle Eastern countries for the acts of a corporation in which it invests for an amount greater than its actual investment in that
corporation. Similarly, the rights of investors in Middle Eastern issuers may be more limited than those of shareholders of a U.S. corporation. It may be difficult or impossible to obtain or enforce a legal judgment in a Middle Eastern country. Some
Middle Eastern countries prohibit or impose substantial restrictions on investments in their capital markets, particularly their equity markets, by foreign entities such as the Fund. For example, certain countries may require governmental approval
prior to investment by foreign persons or limit the amount of investment by foreign persons in a particular issuer. Certain Middle Eastern countries may also limit investment by foreign persons to only a specific class of securities of an issuer
that may have less advantageous terms (including price) than securities of the issuer available for purchase by nationals of the relevant Middle Eastern country.
The manner in which foreign investors may invest in companies
in certain Middle Eastern countries, as well as limitations on those investments, may have an adverse impact on the operations of the Fund. For example, in certain of these countries, the Fund may be required to invest initially through a local
broker or other entity and then have the shares that were purchased re-registered in the name of the Fund. Re-registration in some instances may not be possible on a timely basis. This may result in a delay during which the Fund may be denied
certain of its rights as an investor, including rights as to dividends or to be made aware of certain corporate actions. There also may be instances where the Fund places a purchase order but is
17
subsequently informed, at the time of re-registration, that the permissible
allocation of the investment to foreign investors has already been filled and, consequently, the Fund may not be able to invest in the relevant company.
Substantial limitations may exist in certain Middle Eastern
countries with respect to the Fund’s ability to repatriate investment income or capital gains. The Fund could be adversely affected by delays in, or a refusal to grant, any required governmental approval for repatriation of capital, as well as
by the application to the Fund of any restrictions on investment.
Certain Middle Eastern countries may be heavily dependent upon
international trade and, consequently, have been and may continue to be negatively affected by trade barriers, exchange controls, managed adjustments in relative currency values and other protectionist measures imposed or negotiated by the countries
with which they trade. These countries also have been and may continue to be adversely impacted by economic conditions in the countries with which they trade. In addition, certain issuers located in Middle Eastern countries in which the Fund invests
may operate in, or have dealings with, countries subject to sanctions and/or embargoes imposed by the U.S. government and the United Nations, and/or countries identified by the U.S. government as state sponsors of terrorism. As a result, an issuer
may sustain damage to its reputation if it is identified as an issuer which operates in, or has dealings with, such countries. The Fund, as an investor in such issuers, will be indirectly subject to those risks.
Certain Middle Eastern countries have strained relations with
other Middle Eastern countries due to territorial disputes, historical animosities, defense concerns or other reasons, which may adversely affect the economies of these Middle Eastern countries. Certain Middle Eastern countries experience
significant unemployment, as well as widespread underemployment. There has also been a recent increase in recruitment efforts and an aggressive push for territorial control by terrorist groups in the region, which has led to an outbreak of warfare
and hostilities. Warfare in Syria has spread to surrounding areas, including many portions of Iraq and Turkey. Such hostilities may continue into the future or may escalate at any time due to ethnic, racial, political, religious or ideological
tensions between groups in the region or foreign intervention or lack of intervention, among other factors.
Risk of Investing in Russia.
Investing in the Russian securities market involves a high degree of risk and special considerations not typically associated with investing in the U.S. securities market, and should be considered highly
speculative. Risks include: the absence of developed legal structures governing private and foreign investments and private property; the possibility of the loss of all or a substantial portion of the Fund’s assets invested in Russia as a
result of expropriation; certain national policies which may restrict the Fund’s investment opportunities, including, without limitation, restrictions on investing in issuers or industries deemed sensitive to relevant national interests; and
potentially greater price volatility in, significantly smaller capitalization of, and relative illiquidity of, the Russian market. There can also be no assurance that the Fund’s investments in the Russian securities market would not be
expropriated, nationalized or otherwise confiscated. In the event of the settlement of any such claims or such expropriation, nationalization or other confiscation, the Fund could lose its entire investment. In addition, it may be difficult and more
costly to obtain and enforce a judgment in the Russian court system.
Russia may also be subject to a greater degree of economic,
political and social instability than is the case in other developed countries. Such instability may result from, among other things, the following: (i) an authoritarian government or military involvement in political and economic decision-making,
including changes in government through extra-constitutional means; (ii) popular unrest associated with demands for improved political, economic and social conditions; (iii) internal insurgencies; (iv) hostile relations with neighboring countries;
and (v) ethnic, religious and racial disaffection.
The
Russian economy is heavily dependent upon the export of a range of commodities including most industrial metals, forestry products and oil and gas. Accordingly, it is strongly affected by international commodity prices and is particularly vulnerable
to any weakening in global demand for these products. Any acts of terrorism or armed conflicts in Russia or internationally could have an adverse effect on the financial and commodities markets and the global economy. As Russia produces and exports
large amounts of crude oil and gas, any acts of terrorism or armed conflict causing disruptions of Russian oil and gas exports could negatively affect the Russian economy and, thus, adversely affect the financial condition, results of operations or
prospects of related companies. Current and future economic sanctions may also adversely affect the Russian, oil, banking, mining, metals, rail, pipeline and gas sectors, among other sectors.
The Russian government may exercise substantial influence over
many aspects of the private sector and may own or control many companies. Future government actions could have a significant effect on the economic conditions in Russia, which could have a negative impact on private sector companies. There is also
the possibility of diplomatic developments that could adversely affect investments in Russia. In recent years, the Russian government has begun to take bolder steps to re-assert its
18
regional geopolitical influence (including military steps). Such steps may
increase tensions between Russia and its neighbors and Western countries and may negatively affect economic growth. The United States and the Economic Monetary Union of the EU, along with the regulatory bodies of a number of countries including
Japan, Australia, Norway, Switzerland and Canada (collectively, “Sanctioning Bodies”), have imposed economic sanctions, which consist of asset freezes and sectoral sanctions on certain Russian individuals and Russian corporate entities.
The Sanctioning Bodies could also institute broader sanctions on Russia. These sanctions, or even the threat of further sanctions, may result in the decline of the value and liquidity of Russian securities, a weakening of the ruble or other adverse
consequences to the Russian economy. These sanctions could also result in the immediate freeze of Russian securities and/or funds invested in prohibited assets, impairing the ability of the Fund to buy, sell, receive or deliver those securities
and/or assets.
The sanctions against certain Russian
issuers include prohibitions on transacting in or dealing in certain new debt or new equity of such issuers. Securities held by the Fund issued prior to the date of the sanctions being imposed are not currently subject to any restrictions under the
sanctions. However, compliance with each of these sanctions may impair the ability of the Fund to buy, sell, hold, receive or deliver the affected securities or other securities of such issuers. If it becomes impracticable or unlawful for the Fund
to hold securities subject to, or otherwise affected by, sanctions (collectively, “affected securities”), or if deemed appropriate by BFA, the Fund may prohibit in-kind deposits of the affected securities in connection with creation
transactions and instead require a cash deposit, which may also increase the Fund's transaction costs. The Fund may also be legally required to freeze assets in a blocked account.
Also, if an affected security is included in the Fund’s
Underlying Index, the Fund may, where practicable, seek to eliminate its holdings of the affected security by employing or augmenting its representative sampling strategy to seek to track the investment results of its Underlying Index. The use of
(or increased use of) a representative sampling strategy may increase the Fund’s tracking error risk. If the affected securities constitute a significant percentage of the Underlying Index, the Fund may not be able to effectively implement a
representative sampling strategy, which may result in significant tracking error between the Fund’s performance and the performance of its Underlying Index.
Current or future sanctions may result in Russia taking
counter measures or retaliatory actions, which may further impair the value and liquidity of Russian securities. These retaliatory measures may include the immediate freeze of Russian assets held by the Fund. In the event of such a freeze of any
fund assets, including depositary receipts, the Fund may need to liquidate non-restricted assets in order to satisfy any fund redemption orders. The liquidation of fund assets during this time may also result in the Fund receiving substantially
lower prices for its securities.
These sanctions may
also lead to changes in the Fund’s Underlying Index. The Fund’s Index Provider may remove securities from the Underlying Index or implement caps on the securities of certain issuers that have been subject to recent economic sanctions. In
such an event, it is expected that the Fund will rebalance its portfolio to bring it in line with the Underlying Index as a result of any such changes, which may result in transaction costs and increased tracking error. These sanctions, the
volatility that may result in the trading markets for Russian securities and the possibility that Russia may impose investment or currency controls on investors may cause the Fund to invest in, or increase the Fund’s investments in, depositary
receipts that represent the securities of the Underlying Index. These investments may result in increased transaction costs and increased tracking error.
Risk of Investing in Taiwan. Investment in Taiwanese issuers may subject the Fund to loss in the event of adverse political, economic, regulatory and other developments that affect Taiwan, including fluctuations of the New Taiwan dollar versus the U.S. dollar. Taiwan has few natural resources. Any fluctuation or shortage in the commodity markets could have a negative impact on the Taiwanese economy. Appreciation of the New Taiwan dollar, rising labor costs, and increasing environmental consciousness have led some labor-intensive industries to relocate to other countries with cheaper work forces. Continued labor outsourcing may adversely affect the Taiwanese economy. Taiwanese firms are among the world’s largest suppliers of computer monitors and leaders in personal computer manufacturing. A slowdown in global demand for these products will likely have an adverse impact on the Taiwanese economy. The Chinese government views Taiwan as a renegade province and continues to contest Taiwan’s sovereignty. The outbreak of hostilities between the two nations, or even the threat of an outbreak of hostilities will likely adversely impact the Taiwanese economy. Such risks, among others, may adversely affect the value of the Fund’s investments.
19
U.S. Economic Trading Partners Risk. The United States is a significant trading partner of, or foreign investor in, certain countries in which the Fund invests, and the economies of these countries may be particularly affected by changes in the U.S.
economy. A decrease in U.S. imports, new trade regulations, changes in the U.S. dollar exchange rate or an economic slowdown in the United States may have a material adverse effect on economies of the countries in which the Fund invests and, as a
result, securities to which the Fund has exposure.
Risk of Investing in the Basic Materials Industry. Issuers in the basic materials industry could be adversely affected by commodity price volatility, exchange rates, import controls and increased competition. Companies in the basic materials industry may be subject
to swift fluctuations in supply and demand. Fluctuations may be caused by events relating to political and economic developments, the environmental impact of basic materials operations, and the success of exploration projects. Production of
industrial materials often exceeds demand as a result of over-building or economic downturns, leading to poor investment returns. Issuers in the basic materials industry are at risk for environmental damage and product liability claims and may be
adversely affected by depletion of resources, delays in technical progress, labor relations, tax and government regulations related to changes to, among other things, energy and environmental policies.
Risk of Investing in the Consumer Discretionary Sector. Companies engaged in the design, production or distribution of products or services for the consumer discretionary sector (including, without limitation, television and radio broadcasting, manufacturing,
publishing, recording and musical instruments, motion pictures, photography, amusement and theme parks, gaming casinos, sporting goods and sports arenas, camping and recreational equipment, toys and games, apparel, travel-related services,
automobiles, hotels and motels, and fast food and other restaurants) are subject to the risk that their products or services may become obsolete quickly. The success of these companies can depend heavily on disposable household income and consumer
spending. During periods of an expanding economy, the consumer discretionary sector may outperform the consumer staples sector, but may underperform when economic conditions worsen. Moreover, the consumer discretionary sector can be significantly
affected by several factors, including, without limitation, the performance of domestic and international economies, exchange rates, changing consumer preferences, demographics, marketing campaigns, cyclical revenue generation, consumer confidence,
commodity price volatility, labor relations, interest rates, import and export controls, intense competition, technological developments and government regulation.
Risk of Investing in the Consumer Goods Industry. The consumer goods industry includes companies involved in the design, production or distribution of goods for consumers, including food, household, home, personal and office products, clothing and textiles. The
success of the consumer goods industry is tied closely to the performance of the domestic and international economy, interest rates, exchange rates, competition, consumer confidence and consumer disposable income. The consumer goods industry may be
affected by trends, marketing campaigns and other factors affecting consumer demand. Governmental regulation affecting the use of various food additives may affect the profitability of certain companies in the consumer goods industry. Moreover,
international events may affect food and beverage companies that derive a substantial portion of their net income from foreign countries. In addition, tobacco companies may be adversely affected by new laws, regulations and litigation. Many consumer
goods may be marketed globally, and consumer goods companies may be affected by the demand and market conditions in other countries and regions. Companies in the consumer goods industry may be subject to severe competition, which may also have an
adverse impact on their profitability. Changes in demographics and consumer preferences may affect the success of consumer products.
Risk of Investing in the Consumer Services Industry. The success of consumer product manufacturers and retailers (including food and drug retailers, general retailers, media, and travel and leisure) is tied closely to the performance of the domestic and international
economy, interest rates, exchange rates, competition and consumer confidence. The consumer services industry depends heavily on disposable household income and consumer spending. Companies in the consumer services industry may be subject to severe
competition, which may also have an adverse impact on their profitability. Changes in demographics and consumer preferences may affect the success of consumer service providers.
Risk of Investing in the Consumer Staples Sector. Companies in the consumer staples sector may be adversely affected by changes in the global economy, consumer spending, competition, demographics and consumer preferences, and production spending. Companies in the
consumer staples sector may also be affected by changes in global economic, environmental and political events, economic conditions, the depletion of resources, and government regulation. For instance, government regulations may affect the
permissibility of using various food additives and production methods of companies that make food products, which could affect company profitability. In addition, tobacco companies may be adversely affected by the adoption of proposed legislation
and/or by litigation. Companies in the consumer staples sector also may be subject to risks pertaining to the supply of, demand for and prices of raw materials. The prices of raw materials fluctuate in response to a
20
number of factors, including, without limitation, changes in government
agricultural support programs, exchange rates, import and export controls, changes in international agricultural and trading policies, and seasonal and weather conditions. Companies in the consumer staples sector may be subject to severe
competition, which may also have an adverse impact on their profitability.
Risk of Investing in the Energy Sector. Companies in the energy sector are strongly affected by the levels and volatility of global energy prices, energy supply and demand, government regulations and policies, energy production and conservation efforts,
technological change, development of alternative energy sources, and other factors that they cannot control. These companies may also lack resources and have limited business lines. Energy companies may have relatively high levels of debt and may be
more likely to restructure their businesses if there are downturns in certain energy markets or in the global economy. If an energy company in the Fund's portfolio becomes distressed, the Fund could lose all or a substantial portion of its
investment.
The energy sector is cyclical and is
highly dependent on commodity prices; prices and supplies of energy may fluctuate significantly over short and long periods of time due to, among other things, national and international political changes, Organization of Petroleum Exporting
Countries (“OPEC”) policies, changes in relationships among OPEC members and between OPEC and oil-importing nations, the regulatory environment, taxation policies, and the economy of the key energy-consuming countries. Commodity prices
have recently been subject to increased volatility and declines, which may negatively affect companies in which the Fund invests.
Companies in the energy sector may be adversely affected by
terrorism, natural disasters or other catastrophes. Companies in the energy sector are at risk of civil liability from accidents resulting in injury, loss of life or property, pollution or other environmental damage claims. Disruptions in the oil
industry or shifts in fuel consumption may significantly impact companies in this sector. Significant oil and gas deposits are located in emerging markets countries where corruption and security may raise significant risks, in addition to the other
risks of investing in emerging markets. Additionally, the Middle East, where many companies in the energy sector may operate, has historically and recently experienced widespread social unrest.
Companies in the energy sector may also be adversely affected
by changes in exchange rates, interest rates, economic conditions, tax treatment, government regulation and intervention, negative perception, efforts at energy conservation and world events in the regions in which the companies operate (e.g., expropriation, nationalization, confiscation of assets and property or the imposition of restrictions on foreign investments and repatriation of capital, military coups, social unrest, violence or labor
unrest). Because a significant portion of revenues of companies in this sector is derived from a relatively small number of customers that are largely composed of governmental entities and utilities, governmental budget constraints may have a
significant impact on the stock prices of companies in this sector. The energy sector is highly regulated. Entities operating in the energy sector are subject to significant regulation of nearly every aspect of their operations by federal, state and
local governmental agencies. Such regulation can change rapidly or over time in both scope and intensity. Stricter laws, regulations or enforcement policies could be enacted in the future which would likely increase compliance costs and may
materially adversely affect the financial performance of companies in the energy sector.
Risk of Investing in the Financials Sector. Companies in the financials sector include regional and money center banks, securities brokerage firms, asset management companies, savings banks and thrift institutions, specialty finance companies (e.g., credit card, mortgage providers), insurance and insurance brokerage firms, consumer finance firms, financial conglomerates and foreign banking and
financial companies.
Most financial companies are
subject to extensive governmental regulation, which limits their activities and may affect their ability to earn a profit from a given line of business. Government regulation may change frequently and may have significant adverse consequences for
companies in the financials sector, including effects not intended by the regulation. Direct governmental intervention in the operations of financial companies and financial markets may materially and adversely affect the companies in which the Fund
invests, including legislation in many countries that may increase government regulation, repatriation and other intervention. The impact of governmental intervention and legislative changes on any individual financial company or on the financials
sector as a whole cannot be predicted. The valuation of financial companies has been and continues to be subject to unprecedented volatility and may be influenced by unpredictable factors, including interest rate risk and sovereign debt default.
Certain financial businesses are subject to intense competitive pressures, including market share and price competition. Financial companies in foreign countries are subject to market specific and general regulatory and interest rate concerns. In
particular, government regulation in certain foreign countries may include taxes and
21
controls on interest rates, credit availability, minimum capital
requirements, bans on short sales, limits on prices and restrictions on currency transfers. In addition, companies in the financials sector may be the targets of hacking and potential theft of proprietary or customer information or disruptions in
service, which could have a material adverse effect on their businesses.
The profitability of banks, savings and loan associations and
financial companies is largely dependent on the availability and cost of capital funds and can fluctuate significantly when interest rates change; for instance, when interest rates go up, the value of securities issued by many types of companies in
the financials sector generally goes down. In other words, financial companies may be adversely affected in certain market cycles, including, without limitation, during periods of rising interest rates, which may restrict the availability and
increase the cost of capital, and during periods of declining economic conditions, which may cause, among other things, credit losses due to financial difficulties of borrowers.
In addition, general economic conditions are important to the
operations of these companies, and financial difficulties of borrowers may have an adverse effect on the profitability of financial companies. Financial companies can be highly dependent upon access to capital markets, and any impediments to such
access, such as adverse overall economic conditions or a negative perception in the capital markets of a financial company’s financial condition or prospects, could adversely affect its business. Deterioration of credit markets can have an
adverse impact on a broad range of financial markets, causing certain financial companies to incur large losses. In these conditions, companies in the financials sector may experience significant declines in the valuation of their assets, take
actions to raise capital and even cease operations. Some financial companies may also be required to accept or borrow significant amounts of capital from government sources and may face future government-imposed restrictions on their businesses or
increased government intervention. In addition, there is no guarantee that governments will provide any such relief in the future. These actions may cause the securities of many companies in the financials sector to decline in value.
Risk of Investing in the Home Construction Industry. The home construction industry may be significantly affected by changes in government spending, zoning laws, economic conditions, interest rates, commodity prices, consumer confidence and spending, taxation,
demographic patterns, real estate values, overbuilding, housing starts, and new and existing home sales. Rising interest rates, reductions in mortgage availability to consumers, increasing foreclosure rates or increases in the costs of owning a home
could reduce the market for new homes and adversely affect the profitability of home construction companies. Different segments of the home construction industry can be significantly affected by environmental clean-up costs and catastrophic events
such as earthquakes, hurricanes and terrorist acts. Home construction companies may lack diversification, due to ownership of a limited number of properties and concentration in a particular geographic region or property type.
Risk of Investing in the Industrials Sector. The value of securities issued by companies in the industrials sector may be adversely affected by supply of and demand for both their specific products or services and for industrials sector products in general.
The products of manufacturing companies may face obsolescence due to rapid technological developments and frequent new product introduction. Government regulations, world events and economic conditions may affect the performance of companies in the
industrials sector. The industrials sector may also be adversely affected by changes or trends in commodity prices, which may be influenced by unpredictable factors. Aerospace and defense companies, a component of the industrials sector, can be
significantly affected by government spending policies because companies involved in this industry rely, to a significant extent, on government demand for their products and services. Thus, the financial condition of, and investor interest in,
aerospace and defense companies are heavily influenced by governmental defense spending policies, which are typically under pressure from efforts to control government budgets. Transportation stocks, a component of the industrials sector, are
cyclical and can be significantly affected by economic changes, fuel prices, labor relations and insurance costs. Transportation companies in certain countries may also be subject to significant government regulation and oversight, which may
adversely affect their businesses. For example, commodity price declines and unit volume reductions resulting from an over-supply of materials used in the industrials sector can adversely affect the sector. Furthermore, companies in the industrials
sector may be subject to liability for environmental damage, product liability claims, depletion of resources, and mandated expenditures for safety and pollution control.
Risk of Investing in the Information Technology Sector. Information technology companies face intense competition, both domestically and internationally, which may have an adverse effect on profit margins. Like other technology companies, information technology
companies may have limited product lines, markets, financial resources or personnel. The products of information technology companies may face product obsolescence due to rapid technological developments and frequent new product introduction,
unpredictable changes in growth rates and competition for the services of qualified personnel.
22
Technology companies and companies that rely heavily on technology,
especially those of smaller, less-seasoned companies, tend to be more volatile than the overall market. Companies in the information technology sector are heavily dependent on patent and intellectual property rights. The loss or impairment of these
rights may adversely affect the profitability of these companies. Finally, while all companies may be susceptible to network security breaches, certain companies in the information technology sector may be particular targets of hacking and potential
theft of proprietary or consumer information or disruptions in service, which could have a material adverse effect on their businesses. These risks are heightened for information technology companies in foreign markets.
Risk of Investing in the Materials Sector. Companies in the materials sector may be adversely affected by commodity price volatility, exchange rates, import controls, increased competition, depletion of resources, technical progress, labor relations and
government regulations, and mandated expenditures for safety and pollution control, among other factors. Companies in the materials sector are also at risk of liability for environmental damage and product liability claims. Production of materials
may exceed demand as a result of market imbalances or economic downturns, leading to poor investment returns. These risks are heightened for companies in the materials sector located in foreign markets.
Risk of Investing in the Oil and Gas Industry. Companies in the oil and gas industry are strongly affected by the levels and volatility of global energy prices, oil and gas supply and demand, government regulations and policies, oil and gas production and
conservation efforts and technological change. The oil and gas industry is cyclical and from time to time may experience a shortage of drilling rigs, equipment, supplies or qualified personnel, or due to significant demand, such services may not be
available on commercially reasonable terms. Prices and supplies of oil and gas may fluctuate significantly over short and long periods of time due to national and international political changes, OPEC policies, changes in relationships among OPEC
members and between OPEC and oil-importing nations, the regulatory environment, taxation policies, and the economies of key energy-consuming countries. Disruptions in the oil sub-industry or shifts in energy consumption may significantly impact
companies in this industry. For instance, significant oil and gas deposits are located in emerging market countries where corruption and security may raise significant risks, in addition to the other risks of investing in emerging markets. In
addition, the Middle East, where many companies in the oil and gas industry may operate, has recently experienced widespread social unrest. Oil and gas companies operate in a highly competitive industry, with intense price competition. A significant
portion of their revenues may depend on a relatively small number of customers, including governmental entities and utilities. Companies that own or operate gas pipelines are subject to certain risks, including pipeline and equipment leaks and
ruptures, explosions, fires, unscheduled downtime, transportation interruptions, discharges or releases of toxic or hazardous gases and other environmental risks.
Risk of Investing in the Real Estate Industry. Companies in the real estate industry include companies that invest in real estate, such as a real estate investment trust (“REIT”) or a real estate holding company (collectively, “Real Estate
Companies”). Investing in Real Estate Companies exposes investors to the risks of owning real estate directly, as well as to risks that relate specifically to the way in which Real Estate Companies are organized and operated. The real estate
industry is highly sensitive to general and local economic conditions and developments, and characterized by intense competition and periodic overbuilding. Investing in Real Estate Companies involves various risks. Some risks that are specific to
Real Estate Companies are discussed in greater detail below.
Interest Rate Risk. Rising
interest rates could result in higher costs of capital for Real Estate Companies, which could negatively impact a Real Estate Company’s ability to meet its payment obligations. Declining interest rates could result in increased prepayment on
loans and require redeployment of capital in less desirable investments.
Leverage Risk. Real Estate
Companies may use leverage (and some may be highly leveraged), which increases investment risk and could adversely affect a Real Estate Company’s operations and market value in periods of rising interest rates. Real Estate Companies are also
exposed to the risks normally associated with debt financing. Financial covenants related to a Real Estate Company’s leverage may affect the ability of the Real Estate Company to operate effectively. In addition, real property may be subject
to the quality of credit extended and defaults by borrowers and tenants. If the properties do not generate sufficient income to meet operating expenses, including, where applicable, debt service, ground lease payments, tenant improvements,
third-party leasing commissions and other capital expenditures, the income and ability of a Real Estate Company to make payments of any interest and principal on its debt securities will be adversely affected.
Loan Foreclosure Risk. Real
Estate Companies may foreclose on loans that the Real Estate Company originated or acquired. Foreclosure may generate negative publicity for the underlying property that affects its market value. In addition to length and expense, foreclosure
proceedings may not fully uphold the validity of all of the terms of the applicable loan. Claims and
23
defenses asserted by borrowers or other lenders may interfere with the
enforcement of rights by a Real Estate Company. Parallel proceedings, such as bankruptcy, may also delay resolution and limit the amount of recovery on a foreclosed loan by a Real Estate Company even where the property underlying the loan is
liquidated.
Property Risk. Real Estate Companies may be subject to risks relating to functional obsolescence or reduced desirability of properties; extended vacancies due to economic conditions and tenant bankruptcies; catastrophic events such as
earthquakes, hurricanes and terrorist acts; and casualty or condemnation losses. Real estate income and values also may be greatly affected by demographic trends, such as population shifts or changing tastes and values, or increasing vacancies or
declining rents resulting from legal, cultural, technological, global or local economic developments.
Distressed Investment Risk.
Real Estate Companies may invest in distressed, defaulted or out-of-favor bank loans. Identification and implementation by a Real Estate Company of loan modification and restructure programs involves a high degree of uncertainty. Even successful
implementation may still require adverse compromises and may not prevent bankruptcy. Real Estate Companies may also invest in other debt instruments that may become non-performing, including the securities of companies with higher credit and market
risk due to financial or operational difficulties. Higher risk securities may be less liquid and more volatile than the securities of companies not in distress.
Underlying Investment Risk.
Real Estate Companies make investments in a variety of debt and equity instruments with varying risk profiles. For instance, Real Estate Companies may invest in debt instruments secured by commercial property that have high risks of delinquency and
foreclosure than loans on single family homes due to a variety of factors associated with commercial property, including the tie between income available to service debt and productive use of the property. Real Estate Companies may also invest in
debt instruments and preferred equity that are junior in an issuer’s capital structure and that involve privately negotiated structures. Subordinated debt investments, such as B-Notes and mezzanine loans, involve a greater credit risk of
default due to the need to service more senior debt of the issuer. Similarly, preferred equity investments involve a greater risk of loss than conventional debt financing due to their non-collateralized nature and subordinated ranking. Investments
in commercial mortgage-backed securities may also be junior in priority in the event of bankruptcy or similar proceedings. Investments in senior loans may be effectively subordinated if the senior loan is pledged as collateral. The ability of a
holder of junior claims to proceed against a defaulting issuer is circumscribed by the terms of the particular contractual arrangement, which vary considerably from transaction to transaction.
Management Risk. Real Estate
Companies are dependent upon management skills and may have limited financial resources. Real Estate Companies are generally not diversified and may be subject to heavy cash flow dependency, default by borrowers and voluntary liquidation. In
addition, transactions between Real Estate Companies and their affiliates may be subject to conflicts of interest, which may adversely affect a Real Estate Company’s shareholders. A Real Estate Company may also have joint venture investments
in certain of its properties, and, consequently, its ability to control decisions relating to such properties may be limited.
Liquidity Risk. Investing in
Real Estate Companies may involve risks similar to those associated with investing in small-capitalization companies. Real Estate Company securities, like the securities of small-capitalization companies, may be more volatile than, and perform
differently from, shares of large-capitalization companies. There may be less trading in Real Estate Company shares, which means that buy and sell transactions in those shares could have a magnified impact on share price, resulting in abrupt or
erratic price fluctuations. In addition, real estate is relatively illiquid, and, therefore, a Real Estate Company may have a limited ability to vary or liquidate properties in response to changes in economic or other conditions.
Concentration Risk. Real
Estate Companies may own a limited number of properties and concentrate their investments in a particular geographic region or property type. Economic downturns affecting a particular region, industry or property type may lead to a high volume of
defaults within a short period.
Regulatory Risk. Real estate income and values may be adversely affected by such factors as applicable domestic and foreign laws (including tax laws). Government actions, such as tax increases, zoning law changes or environmental
regulations, also may have a major impact on real estate. In addition, quarterly compliance with regulation limiting the proportion of asset types held by a REIT may force certain Real Estate Companies to liquidate or restructure otherwise
attractive investments.
Risk of Investing in the
Technology Sector. Technology companies are characterized by periodic new product introductions, innovations and evolving industry standards, and, as a result, face intense competition, both domestically and
internationally, which may have an adverse effect on profit margins. Companies in the technology sector are often smaller and less experienced companies and may be subject to greater risks than larger companies; these risks may be heightened
for
24
technology companies in foreign markets. Technology companies may have
limited product lines, markets, financial resources or personnel. The products of technology companies may face product obsolescence due to rapid technological developments and frequent new product introduction, changes in consumer and business
purchasing patterns, unpredictable changes in growth rates and competition for the services of qualified personnel. In addition, a rising interest rate environment tends to negatively affect companies in the technology sector because, in such an
environment, those companies with high market valuations may appear less attractive to investors, which may cause sharp decreases in the companies’ market prices. Companies in the technology sector are heavily dependent on patent and
intellectual property rights. The loss or impairment of these rights may adversely affect the profitability of these companies. The technology sector may also be adversely affected by changes or trends in commodity prices, which may be influenced or
characterized by unpredictable factors. Finally, while all companies may be susceptible to network security breaches, certain companies in the technology sector may be particular targets of hacking and potential theft of proprietary or consumer
information or disruptions in service, which could have a material adverse effect on their businesses.
Risk of Investing in the Telecommunications Sector. The telecommunications sector of a country’s economy is often subject to extensive government regulation. The costs of complying with governmental regulations, delays or failure to receive required regulatory
approvals, or the enactment of new regulatory requirements may negatively affect the business of telecommunications companies. Government actions around the world, specifically in the area of pre-marketing clearance of products and prices, can be
arbitrary and unpredictable. Companies in the telecommunications sector may experience distressed cash flows due to the need to commit substantial capital to meet increasing competition, particularly in developing new products and services using new
technology. Technological innovations may make the products and services of certain telecommunications companies obsolete. Finally, while all companies may be susceptible to network security breaches, certain companies in the telecommunications
sector may be particular targets of hacking and potential theft of proprietary or consumer information or disruptions in service, which could have a material adverse effect on their businesses.
Risk of Investing in the Transportation Infrastructure Industry.
Issuers in the transportation infrastructure industry can be significantly affected by economic changes, fuel prices, labor relations, technology developments, exchange rates, industry competition, and
insurance costs. Transportation companies in certain countries may also be subject to significant government regulation and oversight, which may adversely affect their businesses. Other risk factors that may affect the transportation infrastructure
industry include the risk of increases in fuel and other operating costs and the effects of regulatory changes or other government decisions. Companies in the transportation infrastructure industry may be adversely affected by adverse weather, acts
of terrorism or catastrophic events, such as air accidents, train crashes or tunnel fires. Companies in the transportation infrastructure industry may also be subject to the risk of widespread disruption of technology systems and increasing
equipment and operational costs.
Risk of Investing
in the Utilities Sector. The utilities sector may be adversely affected by changing commodity prices, government regulation stipulating rates charged by utilities, increased tariffs, changes in tax laws,
interest rate fluctuations and changes in the cost of providing specific utility services. The utilities industry is also subject to potential terrorist attacks, natural disasters and severe weather conditions, as well as regulatory and operational
burdens associated with the operation and maintenance of nuclear facilities. Government regulators monitor and control utility revenues and costs, and therefore may limit utility profits. In certain countries, regulatory authorities may also
restrict a company’s access to new markets, thereby diminishing the company’s long-term prospects.
There are substantial differences among the regulatory
practices and policies of various jurisdictions, and any regulatory agency may make major shifts in policy from time to time. There is no assurance that regulatory authorities will, in the future, grant rate increases. Additionally, existing and
possible future regulatory legislation may make it even more difficult for utilities to obtain adequate relief. Certain of the issuers of securities held in the Fund's portfolio may own or operate nuclear generating facilities. Governmental
authorities may from time to time review existing policies and impose additional requirements governing the licensing, construction and operation of nuclear power plants. Prolonged changes in climate conditions can also have a significant impact on
both the revenues of an electric and gas utility as well as the expenses of a utility, particularly a hydro-based electric utility.
The rates that traditional regulated utility companies may
charge their customers generally are subject to review and limitation by governmental regulatory commissions. Rate changes may occur only after a prolonged approval period or may not occur at all, which could adversely affect utility companies when
costs are rising. The value of regulated utility debt securities (and, to a lesser extent, equity securities) tends to have an inverse relationship to the movement of interest rates. Certain utility companies have experienced full or partial
deregulation in recent years. These utility companies are frequently
25
more similar to industrial companies in that they are subject to greater
competition and have been permitted by regulators to diversify outside of their original geographic regions and their traditional lines of business. As a result, some companies may be forced to defend their core business and may be less profitable.
Deregulation may also permit a utility company to expand outside of its traditional lines of business and engage in riskier ventures.
Proxy Voting Policy
The Board has delegated the voting of proxies for the
Fund’s securities to BFA pursuant to BFA’s proxy voting guidelines and procedures (the “BlackRock Proxy Voting Guidelines”). Under the BlackRock Proxy Voting Guidelines, BFA will vote proxies related to Fund securities in the
best interests of the Fund and its shareholders. From time to time, a vote may present a conflict between the interests of the Fund’s shareholders, on the one hand, and those of BFA, or any affiliated person of the Fund or BFA, on the other.
BFA maintains policies and procedures that are designed to prevent undue influence on BFA’s proxy voting activity that might stem from any relationship between the issuer of a proxy (or any dissident shareholder) and BFA, BFA’s
affiliates, the Fund or the Fund’s affiliates. Most conflicts are managed through a structural separation of BFA’s Corporate Governance Group from BFA’s employees with sales and client responsibilities. In addition, BFA maintains
procedures to ensure that all engagements with corporate issuers or dissident shareholders are managed consistently and without regard to BFA’s relationship with the issuer of the proxy or the dissident shareholder. In certain instances, BFA
may determine to engage an independent fiduciary to vote proxies as a further safeguard to avoid potential conflicts of interest or as otherwise required by applicable law. Copies of the Fund's Proxy Voting Policy and the BlackRock Proxy Voting
Guidelines are attached as Appendix A.
Information with
respect to how BFA voted proxies relating to the Fund's portfolio securities during the 12-month period ended June 30 is available: (i) without charge, upon request, by calling 1-800-iShares (1-800-474-2737) or through the Fund's website at www.iShares.com; and (ii) on the SEC’s website at www.sec.gov.
Portfolio Holdings Information
The Board has adopted a policy regarding the disclosure of the
Fund's portfolio holdings information that requires that such information be disclosed in a manner that: (i) is consistent with applicable legal requirements and in the best interests of the Fund’s shareholders; (ii) does not put the interests
of BFA, the Distributor or any affiliated person of BFA or the Distributor, above those of Fund shareholders; (iii) does not advantage any current or prospective Fund shareholders over any other current or prospective Fund shareholders, except to
the extent that certain Entities (as described below) may receive portfolio holdings information not available to other current or prospective Fund shareholders in connection with the dissemination of information necessary for transactions in
Creation Units, as discussed below, and certain information may be provided to personnel of BFA and its affiliates who manage funds that invest a significant percentage of their assets in shares of the Fund for the purpose of facilitating risk
management and hedging activities; and (iv) does not provide selective access to portfolio holdings information except pursuant to the procedures outlined below and to the extent appropriate confidentiality arrangements limiting the use of such
information are in effect. The “Entities” referred to in sub-section (iii) above are generally limited to National Securities Clearing Corporation (“NSCC”) members, subscribers to various fee-based subscription services,
large institutional investors (known as “Authorized Participants”) that have been authorized by the Distributor to purchase and redeem large blocks of shares pursuant to legal requirements and market makers and other institutional market
participants and entities that provide information or transactional services.
Each business day, the Fund's portfolio holdings information
is provided to the Distributor or other agent for dissemination through the facilities of the NSCC and/or other fee-based subscription services to NSCC members and/or subscribers to those other fee-based subscription services, including market
makers and Authorized Participants, and to entities that publish and/or analyze such information in connection with the process of purchasing or redeeming Creation Units or trading shares of the Fund in the secondary market or evaluating such
potential transactions. This information typically reflects the Fund’s anticipated holdings on the following business day.
Daily access to information concerning the Fund's portfolio
holdings is permitted: (i) to certain personnel of those service providers that are involved in portfolio management and providing administrative, operational, risk management, or other support to portfolio management; and (ii) to other personnel of
the Fund's investment adviser, the Distributor and their affiliates, and the administrator, custodian and fund accountant who deal directly with, or assist in, functions related to
26
investment management, distribution, administration, custody, securities
lending and fund accounting, as may be necessary to conduct business in the ordinary course in a manner consistent with federal securities laws and regulations thereunder. In addition, the Fund discloses its fixed-income and/or equity portfolio
holdings daily at www.iShares.com. More information about this disclosure is available at www.iShares.com.
Portfolio holdings information made available in connection
with the creation/redemption process may be provided to other entities that provide services to the Fund in the ordinary course of business after it has been disseminated to the NSCC. From time to time, information concerning portfolio holdings
other than portfolio holdings information made available in connection with the creation/redemption process, as discussed above, may be provided to other entities that provide services to the Fund, including rating or ranking organizations, in the
ordinary course of business, no earlier than one business day following the date of the information.
The Fund discloses its complete portfolio holdings schedule in
public filings with the SEC within 70 days of the end of the second and fourth fiscal quarters and within 60 days of the end of the first and third fiscal quarters and will provide such information to shareholders as required by federal securities
laws and regulations thereunder. The Fund may, however, voluntarily disclose all or part of its portfolio holdings other than in connection with the creation/redemption process, as discussed above, in advance of required filings with the SEC,
provided that such information is made generally available to all shareholders and other interested parties in a manner that is consistent with the above policy for disclosure of portfolio holdings information. Such information may be made available
through a publicly available website or other means that make the information available to all likely interested parties contemporaneously.
The Company's Chief Compliance Officer or his delegate may
authorize disclosure of portfolio holdings information pursuant to the above policy and procedures, subject to restrictions on selective disclosure imposed by applicable law.
The Board reviews the policy and procedures for disclosure of
portfolio holdings information at least annually.
Construction and Maintenance of the Underlying Index
A description of the Underlying Index is provided below.
The Dow Jones Emerging Markets Select Dividend Index
Component Selection Criteria.
Stocks in the selection pool are ranked in descending order by indicated annual dividend yield, defined as a stock’s unadjusted indicated annual dividend (not including any special dividends) divided by its
unadjusted price. The top 100 stocks are selected as index components. No more than 30 stocks can be selected from any single country. Selections are subject to the following buffers: (i) for countries that reach the 30-stock limit, non-components
will replace current components if they are ranked among the top six within that country, and for countries that have not reached the 30-stock limit, non-components will replace current components if they are ranked among the top fourteen
collectively; (ii) if no country reaches the 30-stock limit, non-components will replace current components if they are ranked among the top 20; and (iii) existing components are selected top-down from each list until the target component number is
reached. Component weightings are assigned based on indicated annual yield. No single country can represent more than 25% of the Underlying Index. The Underlying Index is reviewed annually in December.
To be included in the selection pool, stocks in the Underlying
Index must satisfy the following conditions: (i) have a non-negative trailing 12-month earnings per share (“EPS”); (ii) indicated annual dividend yield greater than 0%; (iii) have paid dividends during each of the past three years; (iv)
float-adjusted market capitalization of at least $250 million; (v) minimum 3-month daily average trading volume of at least $2 million for new components, or at least $500,000 for current components; and (vi) in the case of multiple classes of
securities, only the most liquid class is eligible.
Float-adjusted Market Capitalization. Free-float market capitalization is calculated by taking the security's price and multiplying it by the number of shares readily available in the market rather than the total number of shares outstanding.
Dow Jones Emerging Markets Select Dividend Index
27
Number of Components:
approximately 100
Index Description. The Underlying Index measures the performance of a selected group of equity securities issued by companies in emerging market countries that have provided relatively high dividend yields on a consistent basis over time.
Dividend yield is calculated using a stock's unadjusted indicated annual dividend (not including any special dividends) divided by its unadjusted price. The starting universe for the index is the Dow Jones Emerging Markets Total Stock Market
Specialty Index, excluding countries classified as frontier markets.
Additional Information. The
Dow Jones Emerging Markets Select Dividend Index is a product of S&P Dow Jones Indices LLC (“SPDJI”), and has been licensed for use by BFA and its affiliates. S& P® is a registered trademark of Standard & Poor’s Financial Services LLC (“SPFS”); Dow Jones® is a registered trademark of Dow Jones Trademark Holdings LLC (“Dow Jones”); and these trademarks have been licensed for use by SPDJI and
sublicensed for certain purposes by BFA or its affiliates. The Fund is not sponsored, endorsed, sold or promoted by SPDJI, Dow Jones, SPFS or their respective affiliates or third party licensors and none of such parties make any representation
regarding the advisability of investing in such product(s) nor do they have any liability for any errors, omissions, or interruptions of the Dow Jones Indexes.
Investment Restrictions
The Board has adopted as a non-fundamental policy the
investment objective of the Fund. Therefore, the Fund may change its investment objective and its Underlying Index without shareholder approval. The Board has adopted as fundamental policies the following numbered restrictions, which cannot be
changed without the approval of the holders of a majority of the Fund’s outstanding voting securities. A vote of a majority of the outstanding voting securities of the Fund is defined in the 1940 Act as the lesser of (i) 67% or more of the
voting securities present at a shareholder meeting, if the holders of more than 50% of the outstanding voting securities of the Fund are present or represented by proxy, or (ii) more than 50% of the outstanding voting securities of the Fund.
The Fund will not:
| 1. | Concentrate its investments (i.e., invest 25% or more of its total assets in the securities of a particular industry or group of industries), except that the Fund will concentrate to approximately the same extent that the Underlying Index concentrates in the securities of a particular industry or group of industries. For purposes of this limitation, securities of the U.S. government (including its agencies and instrumentalities), repurchase agreements collateralized by U.S. government securities, and securities of state or municipal governments and their political subdivisions are not considered to be issued by members of any industry. |
| 2. | Borrow money, except that (i) the Fund may borrow from banks for temporary or emergency (not leveraging) purposes, including the meeting of redemption requests which might otherwise require the untimely disposition of securities; and (ii) the Fund may, to the extent consistent with its investment policies, enter into repurchase agreements, reverse repurchase agreements, forward roll transactions and similar investment strategies and techniques. To the extent that it engages in transactions described in (i) and (ii), the Fund will be limited so that no more than 33 1/3% of the value of its total assets (including the amount borrowed) is derived from such transactions. Any borrowings which come to exceed this amount will be reduced in accordance with applicable law. |
| 3. | Issue any senior security, except as permitted under the 1940 Act, as interpreted, modified or otherwise permitted by any regulatory authority having jurisdiction, from time to time. |
| 4. | Make loans, except as permitted under the 1940 Act, as interpreted, modified or otherwise permitted by regulatory authority having jurisdiction, from time to time. |
| 5. | Purchase or sell real estate unless acquired as a result of ownership of securities or other instruments (but this restriction shall not prevent the Fund from investing in securities of companies engaged in the real estate business or securities or other instruments backed by real estate or mortgages), or commodities or commodity contracts (but this restriction shall not prevent the Fund from trading in futures contracts and options on futures contracts, including options on currencies to the extent consistent with the Fund’s investment objective and policies). |
| 6. | Engage in the business of underwriting securities issued by other persons, except to the extent that the Fund may technically be deemed to be an underwriter under the 1933 Act, in disposing of portfolio securities. |
In addition to the investment restrictions adopted as
fundamental policies set forth above, the Fund has adopted a non-fundamental policy not to invest in the securities of a company for the purpose of exercising management or control, or
28
purchase or otherwise acquire any illiquid security, except as permitted
under the 1940 Act, which currently permits up to 15% of the Fund’s net assets to be invested in illiquid securities (calculated at the time of investment).
BFA monitors the liquidity of restricted securities in the
Fund's portfolio. In reaching liquidity decisions, BFA considers the following factors:
| • | The frequency of trades and quotes for the security; |
| • | The number of dealers wishing to purchase or sell the security and the number of other potential purchasers; |
| • | Dealer undertakings to make a market in the security; and |
| • | The nature of the security and the nature of the marketplace in which it trades (e.g., the time needed to dispose of the security, the method of soliciting offers and the mechanics of transfer). |
If any percentage restriction described above is
complied with at the time of an investment, a later increase or decrease in percentage resulting from a change in values of assets will not constitute a violation of such restriction, except that certain percentage limitations will be observed
continuously in accordance with applicable law.
The Fund
has adopted a non-fundamental investment policy in accordance with Rule 35d-1 under the 1940 Act to invest, under normal circumstances, at least 80% of the value of its net assets, plus the amount of any borrowings for investment purposes, in
securities of the Underlying Index or in Depositary Receipts representing securities in the Underlying Index. The Fund also has adopted a policy to provide its shareholders with at least 60 days’ prior written notice of any change in such
policy. If, subsequent to an investment, the 80% requirement is no longer met, the Fund’s future investments will be made in a manner that will bring the Fund into compliance with this policy.
The Fund has adopted a non-fundamental limitation such that,
under normal market conditions, any borrowings by the Fund will not exceed 10% of the Fund's net assets.
The Fund may not purchase securities of other investment
companies, except to the extent permitted by the 1940 Act. As a matter of policy, however, the Fund will not purchase shares of any registered open-end investment company or registered unit investment trust, in reliance on Section 12(d)(1)(F) or (G)
(the “fund of funds” provisions) of the 1940 Act, at any time the Fund has knowledge that its shares are purchased by another investment company investor in reliance on the provisions of subparagraph (G) of Section 12(d)(1).
Continuous Offering
The method by which Creation Units are created and traded may
raise certain issues under applicable securities laws. Because new Creation Units are issued and sold by the Fund on an ongoing basis, at any point a “distribution,” as such term is used in the 1933 Act, may occur. Broker-dealers and
other persons are cautioned that some activities on their part may, depending on the circumstances, result in their being deemed participants in a distribution in a manner that could render them statutory underwriters and subject them to the
prospectus delivery requirement and liability provisions of the 1933 Act.
For example, a broker-dealer firm or its client may be deemed
a statutory underwriter if it takes Creation Units after placing an order with the Distributor, breaks them down into constituent shares and sells such shares directly to customers or if it chooses to couple the creation of new shares with an active
selling effort involving solicitation of secondary market demand for shares. A determination of whether one is an underwriter for purposes of the 1933 Act must take into account all of the facts and circumstances pertaining to the activities of the
broker-dealer or its client in the particular case and the examples mentioned above should not be considered a complete description of all the activities that could lead to a categorization as an underwriter.
Broker-dealer firms should also note that dealers who are not
“underwriters” but are effecting transactions in shares, whether or not participating in the distribution of shares, generally are required to deliver a prospectus. This is because the prospectus delivery exemption in Section 4(a)(3) of
the 1933 Act is not available in respect of such transactions as a result of Section 24(d) of the 1940 Act. Firms that incur a prospectus delivery obligation with respect to shares of the Fund are reminded that, pursuant to Rule 153 under the 1933
Act, a prospectus delivery obligation under Section 5(b)(2) of the 1933 Act owed to an exchange member in connection with a sale on the Listing Exchange generally is satisfied by the fact that the prospectus is available at the Listing Exchange upon
request. The prospectus delivery mechanism provided in Rule 153 is available only with respect to transactions on an exchange.
29
Management
Directors and Officers.
The Board has responsibility for the overall management and operations of the Company, including general supervision of the duties performed by BFA and other service providers. Each Director serves until he or
she resigns, is removed, dies, retires or becomes incapacitated. Each officer shall hold office until his or her successor is elected and qualifies or until his or her death, resignation or removal. Directors who are not “interested
persons” (as defined in the 1940 Act) of the Company are referred to as independent directors (“Independent Directors”).
The registered investment companies advised by BFA or its
affiliates (the “BlackRock-advised Funds”) are organized into one complex of closed-end funds, two complexes of open-end funds and one complex of ETFs (“Exchange-Traded Fund Complex”) (each, a “BlackRock Fund
Complex”). The Fund is included in the BlackRock Fund Complex referred to as the Exchange-Traded Fund Complex. Each Director also serves as a Trustee of iShares Trust and a Trustee of iShares U.S. ETF Trust and, as a result, oversees a total
of 344 funds within the Exchange-Traded Fund Complex. Drew E. Lawton, from October 2016 to June 2017, and Richard L. Fagnani, from April 2017 to June 2017, served as Advisory Board Members for the Company, iShares Trust and iShares U.S. ETF Trust
with respect to all funds within the Exchange-Traded Fund Complex. With the exception of Robert S. Kapito, Mark K. Wiedman, Charles Park, Martin Small and Benjamin Archibald, the address of each Director and officer is c/o BlackRock, Inc., 400
Howard Street, San Francisco, CA 94105. The address of Mr. Kapito, Mr. Wiedman, Mr. Park, Mr. Small and Mr. Archibald is c/o BlackRock, Inc., Park Avenue Plaza, 55 East 52nd Street, New York, NY 10055. The Board has designated Cecilia H. Herbert as its Independent Board Chair. Additional information about the Fund's Directors
and officers may be found in this SAI, which is available without charge, upon request, by calling toll-free 1-800-iShares (1-800-474-2737).
Interested Directors
| Name (Age) | Position | Principal
Occupation(s) During the Past 5 Years |
Other
Directorships Held by Director | |||
| Robert
S. Kapito1 (60) |
Director
(since 2009). |
President, BlackRock, Inc. (since 2006); Vice Chairman of BlackRock, Inc. and Head of BlackRock’s Portfolio Management Group (since its formation in 1998) and BlackRock, Inc.’s predecessor entities (since 1988); Trustee, University of Pennsylvania (since 2009); President of Board of Directors, Hope & Heroes Children’s Cancer Fund (since 2002). | Director of BlackRock, Inc. (since 2006); Trustee of iShares Trust (since 2009); Trustee of iShares U.S. ETF Trust (since 2011). | |||
| Mark
K. Wiedman2 (46) |
Director (since 2013). | Senior Managing Director, BlackRock, Inc. (since 2014); Managing Director, BlackRock, Inc. (2007-2014); Global Head of BlackRock’s ETF and Index Investments Business (since 2016); Global Head of iShares (2011-2016); Head of Corporate Strategy, BlackRock, Inc. (2009-2011). | Trustee of iShares Trust (since 2013); Trustee of iShares U.S. ETF Trust (since 2013); Director of PennyMac Financial Services, Inc. (since 2008). |
| 1 | Robert S. Kapito is deemed to be an “interested person” (as defined in the 1940 Act) of the Company due to his affiliations with BlackRock, Inc. and its affiliates. |
| 2 | Mark K. Wiedman is deemed to be an “interested person” (as defined in the 1940 Act) of the Company due to his affiliations with BlackRock, Inc. and its affiliates. |
30
Independent Directors
| Name (Age) | Position | Principal
Occupation(s) During the Past 5 Years |
Other
Directorships Held by Director | |||
| Cecilia
H. Herbert (68) |
Director
(since 2005); Independent Board Chair (since 2016). |
Trustee and Member of the Finance, Technology and Quality Committee of Stanford Health Care (since 2016); Trustee and Member of the Investment Committee, WNET, a New York public media company (since 2011); Chair (1994-2005) and Member (since 1992) of the Investment Committee, Archdiocese of San Francisco; Director (1998-2013) and President (2007-2011) of the Board of Directors, Catholic Charities CYO; Trustee (2002-2011) and Chair of the Finance and Investment Committee (2006-2010) of the Thacher School. | Trustee of iShares Trust (since 2005); Trustee of iShares U.S. ETF Trust (since 2011); Independent Board Chair of iShares Trust and iShares U.S. ETF Trust (since 2016); Trustee of Forward Funds (14 portfolios) (since 2009); Trustee of Salient MF Trust (4 portfolios) (since 2015). | |||
| Jane
D. Carlin (61) |
Director
(since 2015); Risk Committee Chair (since 2016). |
Consultant (since 2012); Managing Director and Global Head of Financial Holding Company Governance & Assurance and the Global Head of Operational Risk Management of Morgan Stanley (2006-2012). | Trustee of iShares Trust (since 2015); Trustee of iShares U.S. ETF Trust (since 2015); Director of PHH Corporation (mortgage solutions) (since 2012); Director of The Hanover Insurance Group, Inc. (since 2016). | |||
| Richard
L. Fagnani (62) |
Director
(since 2017); Equity Plus Committee Chair (since 2017). |
Partner, KPMG LLP (2002-2016). | Trustee of iShares Trust (since 2017); Trustee of iShares U.S. ETF Trust (since 2017). | |||
| Charles
A. Hurty (73) |
Director
(since 2005); Audit Committee Chair (since 2006). |
Retired; Partner, KPMG LLP (1968-2001). | Trustee of iShares Trust (since 2005); Trustee of iShares U.S. ETF Trust (since 2011); Director of SkyBridge Alternative Investments Multi-Adviser Hedge Fund Portfolios LLC (2 portfolios) (since 2002). | |||
| John
E. Kerrigan (62) |
Director
(since 2005); Securities Lending Committee Chair (since 2016). |
Chief Investment Officer, Santa Clara University (since 2002). | Trustee of iShares Trust (since 2005); Trustee of iShares U.S. ETF Trust (since 2011). | |||
| Drew
E. Lawton (58) |
Director
(since 2017); 15(c) Committee Chair (since 2017). |
Senior Managing Director of New York Life Insurance Company (2010-2015). | Trustee of iShares Trust (since 2017); Trustee of iShares U.S. ETF Trust (since 2017). | |||
| John
E. Martinez (56) |
Director
(since 2003); Fixed Income Plus Committee Chair (since 2016). |
Director of Real Estate Equity Exchange, Inc. (since 2005). | Trustee of iShares Trust (since 2003); Trustee of iShares U.S. ETF Trust (since 2011). |
31
| Name (Age) | Position | Principal
Occupation(s) During the Past 5 Years |
Other
Directorships Held by Director | |||
| Madhav
V. Rajan (53) |
Director
(since 2011); Nominating and Governance Committee Chair (since 2017). |
Dean, and George Pratt Shultz Professor of Accounting, University of Chicago Booth School of Business (since 2017); Robert K. Jaedicke Professor of Accounting, Stanford University Graduate School of Business (2001-2017); Professor of Law (by courtesy), Stanford Law School (2005-2017); Senior Associate Dean for Academic Affairs and Head of MBA Program, Stanford University Graduate School of Business (2010-2016). | Trustee
of iShares Trust (since 2011); Trustee of iShares U.S. ETF Trust (since 2011); Director, Cavium, Inc. (since 2013). |
Officers
| Name (Age) | Position | Principal
Occupation(s) During the Past 5 Years | ||
| Martin
Small (42) |
President (since 2016). | Managing Director, BlackRock, Inc. (since 2010); Head of U.S. iShares (since 2015); Co-Head of the U.S. Financial Markets Advisory Group, BlackRock, Inc. (2008-2014). | ||
| Jack
Gee (57) |
Treasurer
and Chief Financial Officer (since 2008). |
Managing Director, BlackRock, Inc. (since 2009); Senior Director of Fund Administration of Intermediary Investor Business, BGI (2009). | ||
| Charles
Park (50) |
Chief Compliance Officer (since 2006). | Chief Compliance Officer of BlackRock Advisors, LLC and the BlackRock-advised Funds in the Equity-Bond Complex, the Equity-Liquidity Complex and the Closed-End Complex (since 2014); Chief Compliance Officer of BFA (since 2006). | ||
| Benjamin
Archibald (42) |
Secretary (since 2015). | Managing Director, BlackRock, Inc. (since 2014); Director, BlackRock, Inc. (2010-2013); Secretary of the BlackRock-advised mutual funds (since 2012). | ||
| Steve
Messinger (55) |
Executive
Vice President (since 2016). |
Managing Director, BlackRock, Inc. (2007-2014 and since 2016); Managing Director, Beacon Consulting Group (2014-2016). | ||
| Scott
Radell (48) |
Executive
Vice President (since 2012). |
Managing Director, BlackRock, Inc. (since 2009); Head of Portfolio Solutions, BlackRock, Inc. (since 2009). |
32
| Name (Age) | Position | Principal
Occupation(s) During the Past 5 Years | ||
| Alan
Mason (56) |
Executive
Vice President (since 2016). |
Managing Director, BlackRock, Inc. (since 2009). |
The Board has concluded that, based on each Director’s
experience, qualifications, attributes or skills on an individual basis and in combination with those of the other Directors, each Director should serve as a Director of the Board. Among the attributes common to all Directors are their ability to
review critically, evaluate, question and discuss information provided to them, to interact effectively with the Fund's investment adviser, other service providers, counsel and the independent registered public accounting firm, and to exercise
effective business judgment in the performance of their duties as Directors. A Director’s ability to perform his or her duties effectively may have been attained through the Director’s educational background or professional training;
business, consulting, public service or academic positions; experience from service as a Board member of the Fund and the other funds in the Company (and any predecessor funds), other investment funds, public companies, or non-profit entities or
other organizations; and/or other life experiences. Also, set forth below is a brief discussion of the specific experience, qualifications, attributes or skills of each Director that led the Board to conclude that he or she should serve (or continue
to serve) as a Director.
Robert S. Kapito has been a
Director of the Company since 2009. Mr. Kapito has served as a Trustee of iShares Trust since 2009, a Trustee of iShares U.S. ETF Trust since 2011 and a Director of BlackRock, Inc. since 2006. Mr. Kapito served as a Director of iShares MSCI Russia
Capped ETF, Inc. from 2010 to 2015. In addition, he has over 20 years of experience as part of BlackRock, Inc. and BlackRock, Inc.’s predecessor entities. Mr. Kapito serves as President of BlackRock, Inc., and is a member of the Global
Executive Committee and Chairman of the Global Operating Committee. He is responsible for day-to-day oversight of BlackRock's key operating units, including Investment Strategies, Client Businesses, Technology & Operations, and Risk &
Quantitative Analysis. Prior to assuming his current responsibilities in 2007, Mr. Kapito served as Vice Chairman of BlackRock, Inc. and Head of BlackRock's Portfolio Management Group. In that role, he was responsible for overseeing all portfolio
management within BlackRock, including the Fixed Income, Equity, Liquidity, and Alternative Investment Groups. Mr. Kapito serves as a member of the Board of Trustees of the University of Pennsylvania and the Harvard Business School Board of
Dean’s Advisors. He has also been President of the Board of Directors for the Hope & Heroes Children's Cancer Fund since 2002. Mr. Kapito earned a BS degree in economics from the Wharton School of the University of Pennsylvania in 1979,
and an MBA degree from Harvard Business School in 1983.
Mark K. Wiedman has been a Director of the Company since 2013.
Mr. Wiedman has served as a Trustee of iShares Trust since 2013 and a Trustee of iShares U.S. ETF Trust since 2013. Mr. Wiedman served as a Director of iShares MSCI Russia Capped ETF, Inc. from 2013 to 2015. Mr. Wiedman is the Global Head of
BlackRock’s ETF and Index Investments Business, and Senior Managing Director of BlackRock, Inc. In addition, he is a member of BlackRock's Global Executive Committee. Prior to assuming his current responsibilities in 2016, Mr. Wiedman was the
Global Head of iShares. Mr. Wiedman was previously the head of Corporate Strategy for BlackRock. Mr. Wiedman joined BlackRock in 2004 to help start the advisory business, which evolved into the Financial Markets Advisory Group in BlackRock
Solutions. This group advises financial institutions and governments on managing their capital markets exposures and businesses. Prior to BlackRock, he served as senior advisor and chief of staff for the Under Secretary for Domestic Finance at the
U.S. Department of the Treasury and also was a management consultant at McKinsey & Co., advising financial institutions in the United States, Europe, and Japan. He has taught as an adjunct associate professor of law at Fordham University in New
York and Renmin University in Beijing. Mr. Wiedman serves on the board of PennyMac Financial Services, Inc., a publicly-traded U.S. mortgage banking and investment management firm started in 2008, with BlackRock, Inc. as a sponsor. Mr. Wiedman
earned an AB degree, Phi Beta Kappa, magna cum laude, in social studies from Harvard College in 1992 and a JD degree from Yale Law School in 1996.
Cecilia H. Herbert has been a Director of the Company since
2005 and Chair of the Company’s Board since 2016. Ms. Herbert served as Chair of the Nominating and Governance Committee of the Company from 2012 to 2015 and from 2016 to 2017 and Chair of the Equity Plus Committee of the Company from 2012 to
2015. Ms. Herbert has served as a Trustee of iShares Trust since 2005, Chair of the Nominating and Governance Committee of iShares Trust from 2012 to 2015 and from 2016 to 2017, Chair of the Equity Plus Committee of iShares Trust from 2012 to 2015,
Chair of the iShares Trust's Board since 2016, a Trustee of iShares U.S. ETF Trust since 2011, Chair of the Nominating and Governance Committee of iShares U.S. ETF Trust from 2012 to 2015 and from 2016 to 2017, Chair of the Equity Plus Committee of
iShares U.S. ETF Trust from 2012 to 2015 and Chair of the iShares U.S. ETF Trust's Board since 2016. Ms. Herbert served as a Director of iShares MSCI Russia Capped
33
ETF, Inc. from 2010 to 2015. In addition, Ms. Herbert has served as Trustee
of the Forward Funds since 2009, which was purchased by Salient Partners in 2015, and has also served as Trustee of the Salient MF Trust since 2015. She has served since 1992 on the Investment Council of the Archdiocese of San Francisco and was
Chair from 1994 to 2005. She has served as a Trustee of Stanford Health Care since 2016 and as a Trustee of WNET, New York’s public media station, since 2011. She was President of the Board of Catholic Charities CYO, the largest social
services agency in the San Francisco Bay Area, from 2007 to 2011 and a member of that board from 1992 to 2013. She previously served as Trustee of the Pacific Select Funds from 2004 to 2005 and Trustee of the Montgomery Funds from 1992 to 2003. She
worked from 1973 to 1990 at J.P. Morgan/Morgan Guaranty Trust doing international corporate finance and corporate lending, retiring as Managing Director and Head of the West Coast Office. Ms. Herbert has been on numerous non-profit boards, chairing
investment and finance committees. She holds a double major in economics and communications from Stanford University and an MBA from Harvard Business School.
Jane D. Carlin has been a Director of the Company since 2015
and Chair of the Risk Committee since 2016. Ms. Carlin has served as a Trustee of iShares Trust since 2015, Chair of the Risk Committee of iShares Trust since 2016, a Trustee of iShares U.S. ETF Trust since 2015 and Chair of the Risk Committee of
iShares U.S. ETF Trust since 2016. Ms. Carlin has served as a consultant since 2012 and formerly served as Managing Director and Global Head of Financial Holding Company Governance & Assurance and the Global Head of Operational Risk Management
of Morgan Stanley from 2006 to 2012. In addition, Ms. Carlin served as Managing Director and Global Head of the Bank Operational Risk Oversight Department of Credit Suisse Group from 2003 to 2006. Prior to that, Ms. Carlin served as Managing
Director and Deputy General Counsel of Morgan Stanley. Ms. Carlin has over 30 years of experience in the financial sector and has served in a number of legal, regulatory, and risk management positions. Ms. Carlin has served as an Independent
Director on the Board of PHH Corporation since 2012 and as a Director of The Hanover Insurance Group, Inc. since 2016. She previously served as a Director on the Boards of Astoria Financial Corporation and Astoria Bank. Ms. Carlin was appointed by
the United States Treasury to the Financial Services Sector Coordinating Council for Critical Infrastructure Protection and Homeland Security, where she served as Chairperson from 2010 to 2012 and Vice Chair and Chair of the Cyber Security Committee
from 2009 to 2010. Ms. Carlin has a BA degree in political science from State University of New York at Stony Brook and a JD degree from Benjamin N. Cardozo School of Law.
Richard L. Fagnani has been a Director of the Company since
2017 and Chair of the Equity Plus Committee of the Company since 2017. Mr. Fagnani served as an Advisory Board Member of the Company from April 2017 to June 2017. Mr. Fagnani has served as a Trustee of iShares Trust since 2017, Chair of the Equity
Plus Committee of iShares Trust since 2017, an Advisory Board Member of iShares Trust from April 2017 to June 2017, a Trustee of iShares U.S. ETF Trust since 2017, Chair of the Equity Plus Committee of iShares U.S. ETF Trust since 2017 and an
Advisory Board Member of iShares U.S. ETF Trust from April 2017 to June 2017. Mr. Fagnani served as a Senior Audit Partner at KPMG LLP from 2002 to 2016, most recently as the U.S. asset management audit practice leader responsible for setting
strategic direction and execution of the operating plan for the asset management audit practice. In addition, from 1977 to 2002, Mr. Fagnani served as an Audit Partner at Andersen LLP, where he developed and managed the asset management audit
practice. Mr. Fagnani served as a Trustee on the Board of the Walnut Street Theater in Philadelphia from 2009 to 2014 and as a member of the School of Business Advisory Board at LaSalle University from 2006 to 2014. Mr. Fagnani has a BS degree in
Accounting from LaSalle University.
Charles A. Hurty has
been a Director of the Company since 2005 and Chair of the Audit Committee of the Company since 2006. Mr. Hurty has served as a Trustee of iShares Trust since 2005, Chair of the Audit Committee of iShares Trust since 2006 and a Trustee and Chair of
the Audit Committee of iShares U.S. ETF Trust since 2011. Mr. Hurty served as a Director of iShares MSCI Russia Capped ETF, Inc. from 2010 to 2015. In addition, Mr. Hurty has served as Director of the SkyBridge Alternative Investments Multi-Adviser
Hedge Fund Portfolios LLC (formerly, Citigroup Alternative Investments Multi-Adviser Hedge Fund Portfolios LLC) since 2002. He was a Director of the GMAM Absolute Return Strategy Fund from 2002 to 2015 and was a Director of the CSFB Alternative
Investment Funds from 2005 to December 2009, when the funds were liquidated. Mr. Hurty was formerly a Partner at KPMG, LLP from 1968 to 2001, where he held several leadership roles in KPMG’s Investment Management Practice. Prior to joining
KPMG, Mr. Hurty was an officer in the United States Army. Mr. Hurty has a BS degree in accounting from the University of Kansas.
John E. Kerrigan has been a Director of the Company since 2005
and Chair of the Securities Lending Committee of the Company since 2016. Mr. Kerrigan served as Chair of the Nominating and Governance Committee of the Company from 2010 to 2012 and Chair of the Fixed Income Plus Committee of the Company from 2012
to 2015. Mr. Kerrigan has served as a Trustee of iShares Trust since 2005, Chair of the Fixed Income Plus Committee of iShares Trust from 2012 to 2015, Chair of the Nominating and Governance Committee of iShares Trust from 2010 to 2012, Chair of the
Securities Lending Committee
34
of iShares Trust since 2016, a Trustee of iShares U.S. ETF Trust since 2011,
Chair of the Fixed Income Plus Committee of iShares U.S. ETF Trust from 2012 to 2015, Chair of the Nominating and Governance Committee of iShares U.S. ETF Trust from 2011 to 2012 and Chair of the Securities Lending Committee of iShares U.S. ETF
Trust since 2016. Mr. Kerrigan served as a Director of iShares MSCI Russia Capped ETF, Inc. from 2010 to 2015. Mr. Kerrigan has served as Chief Investment Officer of Santa Clara University since 2002. Mr. Kerrigan was formerly a Managing Director at
Merrill Lynch & Co., including the following responsibilities: Managing Director, Institutional Client Division, Western United States. Mr. Kerrigan has been a Director, since 1999, of The BASIC Fund (Bay Area Scholarships for Inner City
Children). Mr. Kerrigan has a BA degree from Boston College and is a Chartered Financial Analyst Charterholder.
Drew E. Lawton has been a Director of the Company since 2017
and Chair of the 15(c) Committee of the Company since 2017. Mr. Lawton served as an Advisory Board Member of the Company from 2016 to 2017. Mr. Lawton has served as a Trustee of iShares Trust since 2017, Chair of the 15(c) Committee of iShares Trust
since 2017, an Advisory Board Member of iShares Trust from 2016 to 2017, a Trustee of iShares U.S. ETF Trust since 2017, Chair of the 15(c) Committee of iShares U.S. ETF Trust since 2017 and an Advisory Board Member of iShares U.S. ETF Trust from
2016 to 2017. Mr. Lawton served as Director of Principal Funds, Inc., Principal Variable Contracts Funds, Inc. and Principal Exchange-Traded Funds from March 2016 through October 2016. Mr. Lawton served in various capacities at New York Life
Insurance Company from February 2010 to December 2015, most recently as a Senior Managing Director and Chief Executive Officer of New York Life Investment Management. From 2008 to 2010, Mr. Lawton was the President of Fridson Investment Advisors,
LLC. Mr. Lawton previously held multiple roles at Fidelity Investments from 1997 to 2008. Mr. Lawton has a BA degree in Administrative Science from Yale University and an MBA from University of North Texas.
John E. Martinez has been a Director of the Company since 2003
and Chair of the Fixed Income Plus Committee of the Company since 2016. Mr. Martinez served as Chair of the Securities Lending Committee of the Company from 2012 to 2015. Mr. Martinez has served as a Trustee of iShares Trust since 2003, Chair of the
Securities Lending Committee of iShares Trust from 2012 to 2015, Chair of the Fixed Income Plus Committee of iShares Trust since 2016, a Trustee of iShares U.S. ETF Trust since 2011, Chair of the Securities Lending Committee of iShares U.S. ETF
Trust from 2012 to 2015 and Chair of the Fixed Income Plus Committee of iShares U.S. ETF Trust since 2016. Mr. Martinez served as a Director of iShares MSCI Russia Capped ETF, Inc. from 2010 to 2015. Mr. Martinez is a Director of Real Estate Equity
Exchange, Inc., providing governance oversight and consulting services to this privately held firm that develops products and strategies for homeowners in managing the equity in their homes. Mr. Martinez currently serves as a Board member for the
Cloudera Foundation, whose mission is to apply Cloudera’s data science expertise and discipline to solve global social problems. Mr. Martinez previously served as Director of Barclays Global Investors (“BGI”) UK Holdings, where he
provided governance oversight representing BGI’s shareholders (Barclays PLC, BGI management shareholders) through oversight of BGI’s worldwide activities. Mr. Martinez also previously served as Co-Chief Executive Officer of the Global
Index and Markets Group of BGI, Chairman of Barclays Global Investor Services and Chief Executive Officer of the Capital Markets Group of BGI. From 2003 to 2012, he was a Director and Executive Committee Member for Larkin Street Youth Services,
providing governance oversight and strategy development to an agency that provides emergency and transitional housing, healthcare, education, job and life skills training to homeless youth. He now serves on the Larkin Street Honorary Board. From
2010 to 2016, Mr. Martinez served as a Director for Reading Partners, an organization committed to making all children literate through one-on-one tutoring of students in grades K-4 who are not yet reading at grade level. Mr. Martinez has an AB
degree in economics from The University of California, Berkeley and holds an MBA degree in finance and statistics from The University of Chicago Booth School of Business.
Madhav V. Rajan has been a Director of the Company since 2011
and Chair of the Nominating and Governance Committee of the Company since 2017. Mr. Rajan served as Chair of the Equity Plus Committee of the Company from 2016 to 2017, Chair of the Nominating and Governance Committee of the Company in 2016 and
Chair of the 15(c) Committee of the Company from 2012 to 2015 and from 2016 to 2017. Mr. Rajan has served as a Trustee of iShares Trust since 2011, Chair of the Nominating and Governance Committee of iShares Trust since 2017, Chair of the Equity
Plus Committee of iShares Trust from 2016 to 2017, Chair of the Nominating and Governance Committee of iShares Trust in 2016, Chair of the 15(c) Committee of iShares Trust from 2012 to 2015 and from 2016 to 2017, a Trustee of iShares U.S. ETF Trust
since 2011, Chair of the Nominating and Governance Committee of iShares U.S. ETF Trust since 2017, Chair of the Equity Plus Committee of iShares U.S. ETF Trust from 2016 to 2017, Chair of the Nominating and Governance Committee of iShares U.S. ETF
Trust in 2016 and Chair of the 15(c) Committee of iShares U.S. ETF Trust from 2012 to 2015 and from 2016 to 2017. Mr. Rajan served as a Director of iShares MSCI Russia Capped ETF, Inc. from 2011 to 2015. Mr. Rajan is the Dean and George Pratt Shultz
Professor of Accounting at the University of Chicago Booth School of Business. From 2001 to 2017, Mr. Rajan was the Robert K. Jaedicke Professor of Accounting at the Stanford University Graduate School of Business. In April 2017, he received the
school’s Robert T. Davis
35
Award for Lifetime Achievement and Service. He has taught accounting for over
25 years to undergraduate, MBA and law students, as well as to senior executives. From 2010 to 2016, Mr. Rajan served as the Senior Associate Dean for Academic Affairs and head of the MBA Program at the Stanford University Graduate School of
Business. Mr. Rajan served as editor of “The Accounting Review” from 2002 to 2008 and is co-author of “Cost Accounting: A Managerial Emphasis,” a leading cost accounting textbook. Mr. Rajan holds MS and PhD degrees in
Accounting from Carnegie Mellon University.
Board – Leadership Structure and Oversight Responsibilities
Overall responsibility for oversight of the Fund rests with
the Board. The Board has engaged BFA to manage the Fund on a day-to-day basis. The Board is responsible for overseeing BFA and other service providers in the operations of the Fund in accordance with the provisions of the 1940 Act, applicable
provisions of state and other laws and the Company’s charter. The Board is currently composed of ten members, eight of whom are Independent Directors. The Board currently conducts regular in person meetings four times a year. In addition, the
Board frequently holds special in person or telephonic meetings or informal conference calls to discuss specific matters that may arise or require action between regular meetings. The Independent Directors meet regularly outside the presence of
management, in executive session or with other service providers to the Company.
The Board has appointed an Independent Director to serve in
the role of Board Chair. The Board Chair’s role is to preside at all meetings of the Board and to act as a liaison with service providers, officers, attorneys, and other Directors generally between meetings. The Board Chair may also perform
such other functions as may be delegated by the Board from time to time. The Board has established seven standing Committees: a Nominating and Governance Committee, an Audit Committee, a 15(c) Committee, a Securities Lending Committee, a Risk
Committee, an Equity Plus Committee and a Fixed Income Plus Committee to assist the Board in the oversight and direction of the business and affairs of the Fund, and from time to time the Board may establish ad hoc committees or informal working
groups to review and address the policies and practices of the Fund with respect to certain specified matters. The Chair of each standing Committee is an Independent Director. The role of the Chair of each Committee is to preside at all meetings of
the Committee and to act as a liaison with service providers, officers, attorneys and other Directors between meetings. Each standing Committee meets regularly to conduct the oversight functions delegated to the Committee by the Board and reports
its finding to the Board. The Board and each standing Committee conduct annual assessments of their oversight function and structure. The Board has determined that the Board’s leadership structure is appropriate because it allows the Board to
exercise independent judgment over management and it allocates areas of responsibility among committees of Independent Directors and the full Board to enhance effective oversight.
Day-to-day risk management with respect to the Fund is the
responsibility of BFA or other service providers (depending on the nature of the risk), subject to the supervision of BFA. The Fund is subject to a number of risks, including investment, compliance, operational, reputational, counterparty and
valuation risks, among others. While there are a number of risk management functions performed by BFA and other service providers, as applicable, it is not possible to identify and eliminate all of the risks applicable to the Fund. The Directors
have an oversight role in this area, satisfying themselves that risk management processes and controls are in place and operating effectively. Risk oversight forms part of the Board’s general oversight of the Fund and is addressed as part of
various Board and committee activities. In some cases, risk management issues are specifically addressed in presentations and discussions. For example, BFA has an independent dedicated Risk and Quantitative Analysis Group (“RQA”) that
assists BFA in managing fiduciary and corporate risks, including investment, operational, counterparty credit and enterprise risk. Representatives of RQA meet with the Board to discuss their analysis and methodologies, as well as specific risk
topics such as operational and counterparty risks relating to the Fund. The Board, directly or through a committee, also reviews reports from, among others, management and the independent registered public accounting firm for the Company, as
appropriate, regarding risks faced by the Fund and management’s risk functions. The Board has appointed a Chief Compliance Officer who oversees the implementation and testing of the Company's compliance program, including assessments by
independent third parties, and reports to the Board regarding compliance matters for the Company and its principal service providers. In testing and maintaining the compliance program, the Chief Compliance Officer (and his or her delegates) assesses
key compliance risks affecting the Fund, and addresses them in periodic reports to the Board. In addition, the Audit Committee meets with both the Fund's independent registered public accounting firm and BFA’s internal audit group to review
risk controls in place that support the Fund as well as test results. Board oversight of risk is also performed as needed between meetings through communications between BFA and the Board. The Independent Directors have engaged independent legal
counsel to assist them in performing their oversight responsibilities. From time to time, the Board may modify the manner in which it conducts risk oversight. The Board’s oversight role does not make it a guarantor of the Fund's investment
performance or other activities.
36
Committees of the Board of Directors. The members of the Audit Committee are Charles A. Hurty (Chair), Richard L. Fagnani, John E. Kerrigan and Madhav V. Rajan, each of whom is an Independent Director. The purposes of the Audit Committee are to assist
the Board (i) in its oversight of the Company's accounting and financial reporting principles and policies and related controls and procedures maintained by or on behalf of the Company; (ii) in its oversight of the Company's financial statements and
the independent audit thereof; (iii) in selecting, evaluating and, where deemed appropriate, replacing the independent accountants (or nominating the independent accountants to be proposed for shareholder approval in any proxy statement); (iv) in
evaluating the independence of the independent accountants; (v) in complying with legal and regulatory requirements that relate to the Company's accounting and financial reporting, internal controls, compliance controls and independent audits; and
(vi) to assume such other responsibilities as may be delegated by the Board. The Audit Committee met eight times during the fiscal year ended April 30, 2017.
The members of the Nominating and Governance Committee are
Madhav V. Rajan (Chair), Jane D. Carlin, Drew E. Lawton and John E. Martinez, each of whom is an Independent Director. The Nominating and Governance Committee nominates individuals for Independent Director membership on the Board and recommends
appointments to the advisory board (the “Advisory Board”). The Nominating and Governance Committee functions include, but are not limited to, the following: (i) reviewing the qualifications of any person properly identified or nominated
to serve as an Independent Director; (ii) recommending to the Board and current Independent Directors the nominee(s) for appointment as an Independent Director by the Board and current Independent Directors and/or for election as Independent
Directors by shareholders to fill any vacancy for a position of Independent Director(s) on the Board; (iii) recommending to the Board and current Independent Directors the size and composition of the Board and Board committees and whether they
comply with applicable laws and regulations; (iv) recommending a current Independent Director to the Board and current Independent Directors to serve as Board Chair; (v) periodic review of the Board's retirement policy; and (vi) recommending an
appropriate level of compensation for the Independent Directors for their services as Directors, members or chairpersons of committees of the Board, Board Chair and any other positions as the Nominating and Governance Committee considers
appropriate. The Nominating and Governance Committee does not consider Board nominations recommended by shareholders (acting solely in their capacity as a shareholder and not in any other capacity). The Nominating and Governance Committee met four
times during the fiscal year ended April 30, 2017.
Each
Independent Director serves on the 15(c) Committee. The Chair of the 15(c) Committee is Drew E. Lawton. The principal responsibilities of the 15(c) Committee are to support, oversee and organize on behalf of the Board the process for the annual
review and renewal of the Company's advisory and sub-advisory agreements. These responsibilities include: (i) meeting with BlackRock, Inc. in advance of the Board meeting at which the Company's advisory and sub-advisory agreements are to be
considered to discuss generally the process for providing requested information to the Board and the format in which information will be provided; and (ii) considering and discussing with BlackRock, Inc. such other matters and information as may be
necessary and appropriate for the Board to evaluate the investment advisory and sub-advisory agreements of the Company. The 15(c) Committee met one time during the fiscal year ended April 30, 2017.
The members of the Securities Lending Committee are John E.
Kerrigan (Chair), Jane D. Carlin, Richard L. Fagnani and Madhav V. Rajan, each of whom is an Independent Director. The principal responsibilities of the Securities Lending Committee are to support, oversee and organize on behalf of the Board the
process for oversight of the Company's securities lending activities. These responsibilities include: (i) requesting that certain information be provided to the Committee for its review and consideration prior to such information being provided to
the Board; (ii) considering and discussing with BlackRock, Inc. such other matters and information as may be necessary and appropriate for the Board to oversee the Company's securities lending activities and make required findings and approvals; and
(iii) providing a recommendation to the Board regarding the annual approval of the Company's Securities Lending Guidelines and the required findings with respect to, and annual approval of, the Company's agreement with the securities lending agent.
The Securities Lending Committee met two times during the fiscal year ended April 30, 2017.
The members of the Equity Plus Committee are Richard L.
Fagnani (Chair), Charles A. Hurty, John E. Kerrigan and Madhav V. Rajan, each of whom is an Independent Director. The principal responsibilities of the Equity Plus Committee are to support, oversee and organize on behalf of the Board the process for
oversight of Company performance and related matters for equity funds. These responsibilities include: (i) reviewing quarterly reports regarding Company performance, secondary market trading and changes in net assets to identify any matters that
should be brought to the attention of the Board; and (ii) considering any performance or investment related matters as may be delegated to the Committee by the Board from time to time and providing a report or recommendation to the Board as
appropriate. The Equity Plus Committee met four times during the fiscal year ended April 30, 2017.
37
The members of the Fixed Income Plus Committee are John E.
Martinez (Chair), Jane D. Carlin and Drew E. Lawton, each of whom is an Independent Director. The principal responsibilities of the Fixed Income Plus Committee are to support, oversee and organize on behalf of the Board the process for oversight of
Company performance and related matters for fixed-income or multi-asset funds. These responsibilities include: (i) reviewing quarterly reports regarding Company performance, secondary market trading and changes in net assets to identify any matters
that should be brought to the attention of the Board; and (ii) considering any performance or investment related matters as may be delegated to the Committee by the Board from time to time and providing a report or recommendation to the Board as
appropriate. The Fixed Income Plus Committee met four times during the fiscal year ended April 30, 2017.
The members of the Risk Committee are Jane D. Carlin (Chair),
Charles A. Hurty, Drew E. Lawton and John E. Martinez, each of whom is an Independent Director. The principal responsibility of the Risk Committee is to consider and organize on behalf of the Board risk related matters of the Fund so the Board may
most effectively structure itself to oversee them. The Risk Committee commenced on January 1, 2016. The Risk Committee met four times during the fiscal year ended April 30, 2017.
As the Chair of the Board, Cecilia H. Herbert may serve as an
ex-officio member of each Committee.
The following table
sets forth, as of December 31, 2016, the dollar range of equity securities beneficially owned by each Director and Advisory Board Member in the Fund and in other registered investment companies overseen by the Director or Advisory Board Member
within the same family of investment companies as the Company. Ownership is not shown for Richard L. Fagnani because he was appointed to serve as an Advisory Board Member effective April 1, 2017. If a fund is not listed below, the Director or
Advisory Board Member did not own any securities in that fund as of the date indicated above:
| Name | Fund | Dollar
Range of Equity Securities in the Fund |
Aggregate
Dollar Range of Equity Securities in all Registered Investment Companies Overseen by Director or Advisory Board Member in Family of Investment Companies | |||
| Robert S. Kapito | None | None | None | |||
| Mark K. Wiedman | iShares Core MSCI EAFE ETF | $50,001-$100,000 | Over $100,000 | |||
| iShares Core MSCI Emerging Markets ETF | $50,001-$100,000 | |||||
| iShares Core S&P Total U.S. Stock Market ETF | Over $100,000 | |||||
| iShares National Muni Bond ETF | Over $100,000 | |||||
| iShares New York Muni Bond ETF | Over $100,000 | |||||
| Cecilia H. Herbert | iShares California Muni Bond ETF | Over $100,000 | Over $100,000 | |||
| iShares China Large-Cap ETF | $50,001-$100,000 | |||||
| iShares Core Dividend Growth ETF | $10,001-$50,000 | |||||
| iShares Core High Dividend ETF | $1-$10,000 | |||||
| iShares Core MSCI Emerging Markets ETF | $10,001-$50,000 | |||||
| iShares Core MSCI Total International Stock ETF | $10,001-$50,000 | |||||
| iShares Core S&P 500 ETF | Over $100,000 | |||||
| iShares Core S&P Small-Cap ETF | $1-$10,000 | |||||
| iShares Core S&P Total U.S. Stock Market ETF | $10,001-$50,000 | |||||
| iShares Core S&P U.S. Growth ETF | $50,001-$100,000 | |||||
| iShares Core S&P U.S. Value ETF | $50,001-$100,000 | |||||
| iShares iBoxx $ High Yield Corporate Bond ETF | $10,001-$50,000 |
38
| Name | Fund | Dollar
Range of Equity Securities in the Fund |
Aggregate
Dollar Range of Equity Securities in all Registered Investment Companies Overseen by Director or Advisory Board Member in Family of Investment Companies | |||
| iShares International Select Dividend ETF | $1-$10,000 | |||||
| iShares MSCI EAFE ETF | $1-$10,000 | |||||
| iShares MSCI Japan ETF | $10,001-$50,000 | |||||
| iShares National Muni Bond ETF | $10,001-$50,000 | |||||
| iShares U.S. Preferred Stock ETF | $10,001-$50,000 | |||||
| Jane D. Carlin | iShares Core MSCI EAFE ETF | $50,001-$100,000 | Over $100,000 | |||
| iShares Core S&P Small-Cap ETF | $50,001-$100,000 | |||||
| iShares Global Tech ETF | $10,001-$50,000 | |||||
| Richard L. Fagnani | Not Applicable | Not Applicable | Not Applicable | |||
| Charles A. Hurty | iShares China Large-Cap ETF | $10,001-$50,000 | Over $100,000 | |||
| iShares Core Dividend Growth ETF | Over $100,000 | |||||
| iShares Core Growth Allocation ETF | Over $100,000 | |||||
| iShares Core High Dividend ETF | Over $100,000 | |||||
| iShares Core Moderate Allocation ETF | $50,001-$100,000 | |||||
| iShares Core MSCI Emerging Markets ETF | $50,001-$100,000 | |||||
| iShares Core S&P 500 ETF | Over $100,000 | |||||
| iShares Core S&P U.S. Value ETF | $10,001-$50,000 | |||||
| iShares Edge MSCI Min Vol USA ETF | Over $100,000 | |||||
| iShares Global Energy ETF | $10,001-$50,000 | |||||
| iShares Global Healthcare ETF | $10,001-$50,000 | |||||
| iShares Global Tech ETF | $10,001-$50,000 | |||||
| iShares MSCI EAFE ETF | $10,001-$50,000 | |||||
| iShares Russell 2000 ETF | $10,001-$50,000 | |||||
| iShares U.S. Basic Materials ETF | $10,001-$50,000 | |||||
| iShares U.S. Energy ETF | $10,001-$50,000 | |||||
| iShares U.S. Technology ETF | Over $100,000 | |||||
| John E. Kerrigan | iShares MSCI ACWI ETF | $10,001-$50,000 | Over $100,000 | |||
| iShares MSCI ACWI ex U.S. ETF | Over $100,000 | |||||
| iShares Short-Term National Muni Bond ETF | Over $100,000 | |||||
| Drew E. Lawton | iShares MSCI Frontier 100 ETF | $50,001-$100,000 | $50,001-$100,000 | |||
39
| Name | Fund | Dollar
Range of Equity Securities in the Fund |
Aggregate
Dollar Range of Equity Securities in all Registered Investment Companies Overseen by Director or Advisory Board Member in Family of Investment Companies | |||
| John E. Martinez | iShares Core MSCI Total International Stock ETF | $1-$10,000 | Over $100,000 | |||
| iShares Core S&P 500 ETF | Over $100,000 | |||||
| iShares Core S&P Total U.S. Stock Market ETF | $1-$10,000 | |||||
| iShares Global Consumer Staples ETF | Over $100,000 | |||||
| iShares MSCI All Country Asia ex Japan ETF | Over $100,000 | |||||
| iShares MSCI EAFE ETF | Over $100,000 | |||||
| iShares Russell 1000 ETF | Over $100,000 | |||||
| iShares Russell 1000 Value ETF | Over $100,000 | |||||
| iShares Russell 2000 ETF | Over $100,000 | |||||
| iShares Short Maturity Bond ETF | Over $100,000 | |||||
| iShares TIPS Bond ETF | $50,001-$100,000 | |||||
| Madhav V. Rajan | iShares Core Dividend Growth ETF | Over $100,000 | Over $100,000 | |||
| iShares Core High Dividend ETF | Over $100,000 | |||||
| iShares Core S&P 500 ETF | Over $100,000 | |||||
| iShares iBoxx $ High Yield Corporate Bond ETF | Over $100,000 | |||||
| iShares iBoxx $ Investment Grade Corporate Bond ETF | Over $100,000 | |||||
| iShares Russell 2000 ETF | Over $100,000 | |||||
| iShares Select Dividend ETF | Over $100,000 | |||||
| iShares U.S. Preferred Stock ETF | Over $100,000 |
As of December 31, 2016, none of the Independent Directors,
Advisory Board Member or their immediate family members owned beneficially or of record any securities of BFA (the Fund's investment adviser), the Distributor or any person controlling, controlled by or under common control with BFA or the
Distributor.
Remuneration of Directors and Advisory Board
Members.
Effective January 1, 2017, each current
Independent Director is paid an annual retainer of $325,000 for his or her services as a Board member to the BlackRock-advised Funds in the Exchange-Traded Fund Complex (prior to January 1, 2017, the annual retainer was $300,000), together with
out-of-pocket expenses in accordance with the Board’s policy on travel and other business expenses relating to attendance at meetings. The annual retainer for services as an Advisory Board Member is the same as the annual retainer for services
as a Board member.
The Independent Chair of the Board is
paid an additional annual retainer of $50,000. The Chair of each of the Equity Plus Committee, Fixed Income Plus Committee, Securities Lending Committee, Risk Committee, Nominating and Governance Committee and 15(c) Committee is paid an additional
annual retainer of $25,000. The Chair of the Audit Committee is paid an additional annual retainer of $40,000. Cecilia H. Herbert waived the annual retainer for her service as the Chair of the Nominating and Governance Committee. Each Independent
Director that served as a director of subsidiaries of the Exchange-Traded Fund Complex is paid an additional annual retainer of $10,000 (plus an additional $1,772 paid annually to compensate for taxes due in the Republic of Mauritius in connection
with such Director’s service on the boards of certain Mauritius-based subsidiaries).
40
The table below sets forth the compensation earned by each
Independent Director, Interested Director and Advisory Board Member for services to the Fund for the fiscal year ended April 30, 2017 and the aggregate compensation paid to them for services to the Exchange-Traded Fund Complex for the calendar year
ended December 31, 2016.
| Name | iShares
Emerging Markets Dividend ETF |
Pension
or Retirement Benefits Accrued As Part of Company Expenses4 |
Estimated
Annual Benefits Upon Retirement4 |
Total
Compensation From the Fund and Fund Complex5 | ||||
| Independent Directors: | ||||||||
| Robert H. Silver1 | $ 0 | Not Applicable | Not Applicable | $81,250 | ||||
| John E. Kerrigan | 91 | Not Applicable | Not Applicable | 325,000 | ||||
| Charles A. Hurty | 96 | Not Applicable | Not Applicable | 340,000 | ||||
| Cecilia H. Herbert | 98 | Not Applicable | Not Applicable | 361,764 | ||||
| John E. Martinez | 91 | Not Applicable | Not Applicable | 336,764 | ||||
| Madhav V. Rajan | 98 | Not Applicable | Not Applicable | 325,000 | ||||
| Jane D. Carlin | 91 | Not Applicable | Not Applicable | 325,000 | ||||
| Interested Directors: | ||||||||
| Robert S. Kapito | $ 0 | Not Applicable | Not Applicable | $0 | ||||
| Mark K. Wiedman | 0 | Not Applicable | Not Applicable | 0 | ||||
| Advisory Board Members: | ||||||||
| Drew E. Lawton2 | $50 | Not Applicable | Not Applicable | $75,000 6 | ||||
| Richard L. Fagnani3 | 7 | Not Applicable | Not Applicable | Not Applicable7 |
| 1 | Served as an Independent Director through March 31, 2016. |
| 2 | Compensation from the Fund is shown for Drew E. Lawton for the period from October 18, 2016 (date of his appointment to the Advisory Board of the Company) to April 30, 2017. |
| 3 | Compensation from the Fund is shown for Richard L. Fagnani for the period from April 1, 2017 (date of his appointment to the Advisory Board of the Company) to April 30, 2017. |
| 4 | No Director or officer is entitled to any pension or retirement benefits from the Company. |
| 5 | Includes compensation for service on the Boards of Trustees or the Advisory Board for iShares Trust and iShares U.S. ETF Trust. |
| 6 | Total compensation is shown for Drew E. Lawton for the period from October 18, 2016 (date of his appointment to the Advisory Board of the Company, iShares Trust and iShares U.S. ETF Trust) to December 31, 2016. |
| 7 | Total compensation is not shown for Richard L. Fagnani because he was appointed to serve as an Advisory Board Member of the Company, iShares Trust and iShares U.S. ETF Trust effective April 1, 2017. |
Control Persons and Principal Holders of Securities.
The Directors and officers of the Company collectively owned
less than 1% of the Fund's outstanding shares as of July 31, 2017.
Although the Company does not have information concerning the
beneficial ownership of shares held in the names of Depository Trust Company (“DTC”) participants (as defined below), as of July 31, 2017, the name and percentage ownership of each DTC participant that owned of record 5% or more of the
outstanding shares of the Fund were as follows:
| Name and Address | Percentage
of Ownership | |
| National
Financial Services LLC 200 Liberty Street 5th Floor New York, NY 10281 |
25.17% |
41
| Name and Address | Percentage
of Ownership | |
| Merrill
Lynch, Pierce Fenner & Smith Safekeeping 101 Hudson Street 8th Floor Jersey City, NJ 07302 |
11.54% | |
| Pershing
LLC One Pershing Plaza Jersey City, NJ 07399 |
10.33% | |
| Charles
Schwab & Co., Inc. 111 Pavonia Avenue Jersey City, NJ 07310 |
8.52% | |
| UBS
Financial Services Inc. 1000 Harbor Blvd. 8th Floor Weehawken, NJ 07087 |
7.25% | |
| Morgan
Stanley Smith Barney LLC 1300 Thames Street 6th Floor Baltimore, MD 21231 |
6.35% |
Potential Conflicts of Interest. The PNC Financial Services Group, Inc. (“PNC”) has a significant economic interest in BlackRock, Inc., the parent of BFA, the Fund's investment adviser. BlackRock, Inc. and PNC are considered to be
affiliated persons of one another under the 1940 Act. Certain activities of BFA, BlackRock, Inc. and their affiliates (collectively, “BlackRock”) and PNC and its affiliates (collectively, “PNC” and together with BlackRock,
“Affiliates”), with respect to the Fund and/or other accounts managed by BlackRock or PNC, may give rise to actual or perceived conflicts of interest such as those described below.
BlackRock is one of the world's largest asset management
firms. PNC is a diversified financial services organization spanning the retail, business and corporate markets. BlackRock, PNC and their respective affiliates (including, for these purposes, their directors, partners, trustees, managing members,
officers and employees), including the entities and personnel who may be involved in the investment activities and business operations of the Fund, are engaged worldwide in businesses, including managing equities, fixed-income securities, cash and
alternative investments, and banking and other financial services, and have interests other than that of managing the Fund. These are considerations of which investors in the Fund should be aware, and which may cause conflicts of interest that could
disadvantage the Fund and its shareholders. These businesses and interests include potential multiple advisory, transactional, financial and other relationships with, or interests in, companies and interests in securities or other instruments that
may be purchased or sold by the Fund.
BlackRock and the
other Affiliates have proprietary interests in, and may manage or advise with respect to, accounts or funds (including separate accounts and other funds and collective investment vehicles) that have investment objectives similar to those of the Fund
and/or that engage in transactions in the same types of securities, currencies and instruments as the Fund. One or more Affiliates are also major participants in the global currency, equities, swap and fixed-income markets, in each case, for the
accounts of customers and, in some cases, on a proprietary basis. As such, one or more Affiliates are or may be actively engaged in transactions in the same securities, currencies, and instruments in which the Fund invests. Such activities could
affect the prices and availability of the securities, currencies, and instruments in which the Fund invests, which could have an adverse impact on the Fund's performance. Such transactions, particularly in respect of most proprietary accounts or
client accounts, will be executed independently of the Fund's transactions and thus at prices or rates that may be more or less favorable than those obtained by the Fund.
When BlackRock and the other Affiliates seek to purchase or
sell the same assets for their managed accounts, including the Fund, the assets actually purchased or sold may be allocated among the accounts on a basis determined in their good faith discretion to be equitable. In some cases, this system may
adversely affect the size or price of the assets purchased or sold for the Fund. In addition, transactions in investments by one or more other accounts managed by BlackRock or the other Affiliates may have the effect of diluting or otherwise
disadvantaging the values, prices or investment strategies of the Fund,
42
particularly, but not limited to, with respect to small-capitalization,
emerging market or less liquid strategies. This may occur when investment decisions regarding the Fund are based on research or other information that is also used to support decisions for other accounts. When BlackRock or the other Affiliates
implement a portfolio decision or strategy on behalf of another account ahead of, or contemporaneously with, similar decisions or strategies for the Fund, market impact, liquidity constraints, or other factors could result in the Fund receiving less
favorable trading results and the costs of implementing such decisions or strategies could be increased or the Fund could otherwise be disadvantaged. BlackRock or the other Affiliates may, in certain cases, elect to implement internal policies and
procedures designed to limit such consequences, which may cause the Fund to be unable to engage in certain activities, including purchasing or disposing of securities, when it might otherwise be desirable for it to do so.
Conflicts may also arise because portfolio decisions regarding
the Fund may benefit other accounts managed by BlackRock or the other Affiliates. For example, the sale of a long position or establishment of a short position by the Fund may impair the price of the same security sold short by (and therefore
benefit) one or more Affiliates or their other accounts or funds, and the purchase of a security or covering of a short position in a security by the Fund may increase the price of the same security held by (and therefore benefit) one or more
Affiliates or their other accounts or funds.
In certain
circumstances, BlackRock, on behalf of the Fund, may seek to buy from or sell securities to another fund or account advised by BlackRock or an Affiliate. BlackRock may (but is not required to) effect purchases and sales between BlackRock clients or
clients of Affiliates (“cross trades”), including the Fund, if BlackRock believes such transactions are appropriate based on each party's investment objectives and guidelines, subject to applicable law and regulation. There may be
potential conflicts of interest or regulatory issues relating to these transactions which could limit BlackRock’s decision to engage in these transactions for the Fund. BlackRock may have a potentially conflicting division of loyalties and
responsibilities to the parties in such transactions. On any occasion when the Fund participates in a cross trade, BlackRock will comply with procedures adopted under applicable rules and SEC guidance.
BlackRock and the other Affiliates and their clients may
pursue or enforce rights with respect to an issuer in which the Fund has invested, and those activities may have an adverse effect on the Fund. As a result, prices, availability, liquidity and terms of the Fund's investments may be negatively
impacted by the activities of BlackRock or the other Affiliates or their clients, and transactions for the Fund may be impaired or effected at prices or terms that may be less favorable than would otherwise have been the case.
The results of the Fund’s investment activities may
differ significantly from the results achieved by BlackRock and the other Affiliates for their proprietary accounts or other accounts (including investment companies or collective investment vehicles) managed or advised by them. It is possible that
one or more Affiliate-managed accounts and such other accounts will achieve investment results that are substantially more or less favorable than the results achieved by the Fund. Moreover, it is possible that the Fund will sustain losses during
periods in which one or more Affiliates or Affiliate-managed accounts achieve significant profits on their trading for proprietary or other accounts. The opposite result is also possible.
From time to time, the Fund may be restricted from purchasing
or selling securities, or from engaging in other investment activities because of regulatory, legal or contractual requirements applicable to BlackRock or one or more Affiliates or other accounts managed or advised by BlackRock or the other
Affiliates for clients worldwide, and/or the internal policies of BlackRock and the other Affiliates designed to comply with such requirements. As a result, there may be periods, for example, when BlackRock and/or one or more Affiliates will not
initiate or recommend certain types of transactions in certain securities or instruments with respect to which BlackRock and/or one or more Affiliates are performing services or when position limits have been reached. For example, the investment
activities of one or more Affiliates for their proprietary accounts and accounts under their management may limit the investment opportunities for the Fund in certain emerging and other markets in which limitations are imposed upon the amount of
investment, in the aggregate or in individual issuers, by affiliated foreign investors.
In connection with its management of the Fund, BlackRock may
have access to certain fundamental analysis and proprietary technical models developed by one or more Affiliates. BlackRock will not be under any obligation, however, to effect transactions on behalf of the Fund in accordance with such analysis and
models. In addition, neither BlackRock nor any of the other Affiliates will have any obligation to make available any information regarding their proprietary activities or strategies, or the activities or strategies used for other accounts managed
by them, for the benefit of the management of the Fund and it is not anticipated that BlackRock will have access to such information for the purpose of managing the Fund. The proprietary activities or portfolio strategies of BlackRock and the other
Affiliates, or the activities or strategies used for
43
accounts managed by them or other customer accounts could conflict with the
transactions and strategies employed by BlackRock in managing the Fund.
The Fund may be included in investment models developed by
BlackRock and the other Affiliates for use by clients and financial advisors. The price, availability and liquidity of the Fund may be impacted by purchases and redemptions of the Fund by model-driven investment portfolios.
In addition, certain principals and certain employees of
BlackRock are also principals or employees of Affiliates. As a result, these principals and employees may have obligations to such other entities or their clients and such obligations to other entities or clients may be a consideration of which
investors in the Fund should be aware.
BlackRock may
enter into transactions and invest in securities, instruments and currencies on behalf of the Fund in which clients of BlackRock or the other Affiliates, or, to the extent permitted by the SEC and applicable law, BlackRock or another Affiliate,
serves as the counterparty, principal or issuer. In such cases, such party's interests in the transaction will be adverse to the interests of the Fund, and such party may have no incentive to assure that the Fund obtains the best possible prices or
terms in connection with the transactions. In addition, the purchase, holding and sale of such investments by the Fund may enhance the profitability of BlackRock or the other Affiliates. One or more Affiliates may also create, write or issue
derivatives for their clients, the underlying securities, currencies or instruments of which may be those in which the Fund invests or which may be based on the performance of the Fund. The Fund may, subject to applicable law, purchase investments
that are the subject of an underwriting or other distribution by one or more Affiliates and may also enter into transactions with other clients of an Affiliate where such other clients have interests adverse to those of the Fund.
At times, these activities may cause departments of BlackRock
or the other Affiliates to give advice to clients that may cause these clients to take actions adverse to the interests of the Fund. To the extent affiliated transactions are permitted, the Fund will deal with BlackRock and the other Affiliates
(except with respect to BFA or affiliated sub-advisers of the Fund, as applicable) on an arms-length basis.
To the extent authorized by applicable law, one or more
Affiliates may act as broker, dealer, agent, lender or adviser or in other commercial capacities for the Fund. It is anticipated that the commissions, markups, markdowns, financial advisory fees, underwriting and placement fees, sales fees,
financing and commitment fees, brokerage fees, other fees, compensation or profits, rates, terms and conditions charged by an Affiliate will be in its view commercially reasonable, although each Affiliate, including its sales personnel, will have an
interest in obtaining fees and other amounts that are favorable to the Affiliate and such sales personnel, which may have an adverse effect on the Fund.
Subject to applicable law, the Affiliates (and their personnel
and other distributors) will be entitled to retain fees and other amounts that they receive in connection with their service to the Fund as broker, dealer, agent, lender, adviser or in other commercial capacities. No accounting to the Fund or its
shareholders will be required, and no fees or other compensation payable by the Fund or its shareholders will be reduced by reason of receipt by an Affiliate of any such fees or other amounts.
When an Affiliate acts as broker, dealer, agent, adviser or in
other commercial capacities in relation to the Fund, the Affiliate may take commercial steps in its own interests, which may have an adverse effect on the Fund. The Fund will be required to establish business relationships with its counterparties
based on the Fund's own credit standing. Neither BlackRock nor any of the Affiliates will have any obligation to allow their credit to be used in connection with the Fund's establishment of its business relationships, nor is it expected that the
Fund's counterparties will rely on the credit of BlackRock or any of the other Affiliates in evaluating the Fund's creditworthiness.
Lending on behalf of the Fund is done by BTC pursuant to SEC
exemptive relief, enabling BTC to act as securities lending agent to, and receive a share of securities lending revenues from, the Fund. An Affiliate will also receive compensation for managing the reinvestment of the cash collateral from securities
lending. There are potential conflicts of interest in managing a securities lending program, including but not limited to: (i) BTC as securities lending agent may have an incentive to increase or decrease the amount of securities on loan or to lend
particular securities in order to generate additional risk-adjusted revenue for BTC and its affiliates; and (ii) BTC as securities lending agent may have an incentive to allocate loans to clients that would provide more revenue to BlackRock. As
described further below, BlackRock seeks to mitigate this conflict by providing its securities lending clients with equal lending opportunities over time in order to approximate pro-rata allocation.
44
As part of its securities lending program, BlackRock
indemnifies certain clients and/or funds against a shortfall in collateral in the event of borrower default. BlackRock’s RQA calculates, on a regular basis, BlackRock’s potential dollar exposure to the risk of collateral shortfall upon
counterparty default (“shortfall risk”) under the securities lending program for both indemnified and non-indemnified clients. On a periodic basis, RQA also determines the maximum amount of potential indemnified shortfall risk arising
from securities lending activities (“indemnification exposure limit”) and the maximum amount of counterparty-specific credit exposure (“credit limits”) BlackRock is willing to assume as well as the program’s operational
complexity. RQA oversees the risk model that calculates projected shortfall values using loan-level factors such as loan and collateral type and market value as well as specific borrower counterparty credit characteristics. When necessary, RQA may
further adjust other securities lending program attributes by restricting eligible collateral or reducing counterparty credit limits. As a result, the management of the indemnification exposure limit may affect the amount of securities lending
activity BlackRock may conduct at any given point in time and impact indemnified and non-indemnified clients by reducing the volume of lending opportunities for certain loans (including by asset type, collateral type and/or revenue profile).
BlackRock uses a predetermined systematic process in order to
approximate pro-rata allocation over time. In order to allocate a loan to a portfolio: (i) BlackRock as a whole must have sufficient lending capacity pursuant to the various program limits (i.e.,
indemnification exposure limit and counterparty credit limits); (ii) the lending portfolio must hold the asset at the time a loan opportunity arrives; and (iii) the lending portfolio must also have enough inventory, either on its own or when
aggregated with other portfolios into one single market delivery, to satisfy the loan request. In doing so, BlackRock seeks to provide equal lending opportunities for all portfolios, independent of whether BlackRock indemnifies the portfolio. Equal
opportunities for lending portfolios does not guarantee equal outcomes. Specifically, short and long-term outcomes for individual clients may vary due to asset mix, asset/liability spreads on different securities, and the overall limits imposed by
the firm.
Purchases and sales of securities and other
assets for the Fund may be bunched or aggregated with orders for other BlackRock client and fund accounts. BlackRock, however, is not required to bunch or aggregate orders if portfolio management decisions for different accounts or funds are made
separately, or if it determines that bunching or aggregating is not practicable or required, is not in the best interest of the Fund, or in cases involving client direction.
Prevailing trading activity frequently may make impossible the
receipt of the same price or execution on the entire volume of securities purchased or sold. When this occurs, the various prices may be averaged, and the Fund will be charged or credited with the average price. Thus, the effect of the aggregation
may operate on some occasions to the disadvantage of the Fund. In addition, under certain circumstances, the Fund will not be charged the same commission or commission equivalent rates in connection with a bunched or aggregated order.
BlackRock may select brokers (including, without limitation,
Affiliates, to the extent permitted by applicable law) that furnish BlackRock, the Fund, other BlackRock client accounts or other Affiliates or personnel, directly or through correspondent relationships, with research or other appropriate services
which provide, in BlackRock's view, appropriate assistance to BlackRock in the investment decision-making process (including with respect to futures, fixed-price offerings and OTC transactions). Such research or other services may include, to the
extent permitted by law, research reports on companies, industries and securities; economic and financial data; financial publications; proxy analysis; trade industry seminars; computer data bases; research-oriented software and other services and
products. Research or other services obtained in this manner may be used in servicing other BlackRock client accounts, including in connection with BlackRock client accounts other than those that pay commissions to the broker relating to the
research or other service arrangements. Such products and services may disproportionately benefit other BlackRock client accounts relative to the Fund based on the amount of brokerage commissions paid by the Fund and such other BlackRock client
accounts. For example, research or other services that are paid for through one client's commissions may not be used in managing that client's account. In addition, other BlackRock client accounts may receive the benefit, including disproportionate
benefits, of economies of scale or price discounts in connection with products and services that may be provided to the Fund and to such other BlackRock client accounts. To the extent that BlackRock uses soft dollars, it will not have to pay for
those products and services itself.
BlackRock does not
currently enter into arrangements to use the Fund's assets for, or participate in, soft dollars, although BlackRock may receive research that is bundled with the trade execution, clearing, and/or settlement services provided by a particular
broker-dealer. To the extent that BlackRock receives research on this basis, many of the same conflicts related to traditional soft dollars may exist. For example, the research effectively will be paid by client commissions that also will be used to
pay for the execution, clearing, and settlement services provided by the broker-dealer and will not be paid by BlackRock.
45
BlackRock may endeavor to execute trades through brokers who,
pursuant to such arrangements, provide research or other services in order to ensure the continued receipt of research or other services BlackRock believes are useful in its investment decision-making process. BlackRock may from time to time choose
not to engage in the above described arrangements to varying degrees. BlackRock may also enter into commission sharing arrangements under which BlackRock may execute transactions through a broker-dealer, including, where permitted, an Affiliate, and
request that the broker-dealer allocate a portion of the commissions or commission credits to another firm that provides research to BlackRock. To the extent that BlackRock engages in commission sharing arrangements, many of the same conflicts
related to traditional soft dollars may exist.
BlackRock
may utilize certain electronic crossing networks (“ECNs”) (including, without limitation, ECNs in which BlackRock or the other Affiliates have an investment or other interest, to the extent permitted by applicable law) in executing
client securities transactions for certain types of securities. These ECNs may charge fees for their services, including access fees and transaction fees. The transaction fees, which are similar to commissions or markups/markdowns, will
generally be charged to clients and, like commissions and markups/markdowns, would generally be included in the cost of the securities purchased. Access fees may be paid by BlackRock even though incurred in connection with executing transactions on
behalf of clients, including the Fund. In certain circumstances, ECNs may offer volume discounts that will reduce the access fees typically paid by BlackRock. BlackRock will only utilize ECNs consistent with its obligation to seek to obtain best
execution in client transactions.
BlackRock has adopted
policies and procedures designed to prevent conflicts of interest from influencing proxy voting decisions that it makes on behalf of advisory clients, including the Fund, and to help ensure that such decisions are made in accordance with BlackRock's
fiduciary obligations to its clients. Nevertheless, notwithstanding such proxy voting policies and procedures, actual proxy voting decisions of BlackRock may have the effect of favoring the interests of other clients or businesses of other divisions
or units of BlackRock and/or the other Affiliates, provided that BlackRock believes such voting decisions to be in accordance with its fiduciary obligations. For a more detailed discussion of these policies and procedures, see the Proxy Voting Policy section of this SAI.
It is also possible that, from time to time, BlackRock or the
other Affiliates may, subject to compliance with applicable law, purchase and hold shares of the Fund. Increasing the Fund’s assets may enhance liquidity, investment flexibility and diversification and may contribute to economies of scale that
tend to reduce the Fund's expense ratio. BlackRock and the other Affiliates reserve the right, subject to compliance with applicable law, to sell into the market or redeem in Creation Units through an Authorized Participant at any time some or all
of the shares of the Fund acquired for their own accounts. A large sale or redemption of shares of the Fund by BlackRock or the other Affiliates could significantly reduce the asset size of the Fund, which might have an adverse effect on the Fund's
liquidity, investment flexibility, portfolio diversification, expense ratio or ability to comply with the listing requirements for the Fund. BlackRock seeks to consider the effect of redemptions on the Fund and other shareholders in deciding whether
to redeem its shares but is not obligated to do so and may elect not to do so.
It is possible that the Fund may invest in securities of, or
engage in transactions with, companies with which an Affiliate has developed or is trying to develop investment banking relationships as well as securities of entities in which BlackRock or the other Affiliates has significant debt or equity
investments or other interests or in which an Affiliate makes a market. The Fund also may invest in securities of, or engage in transactions with, companies to which an Affiliate provides or may in the future provide research coverage. Such
investments or transactions could cause conflicts between the interests of the Fund and the interests of BlackRock, other clients of BlackRock or the other Affiliates. In making investment decisions for the Fund, BlackRock is not permitted to obtain
or use material non-public information acquired by any division, department or Affiliate of BlackRock in the course of these activities. In addition, from time to time, the activities of an Affiliate may limit the Fund's flexibility in purchases and
sales of securities. When an Affiliate is engaged in an underwriting or other distribution of securities of an entity, BlackRock may be prohibited from purchasing or recommending the purchase of certain securities of that entity for the Fund. As
indicated below, BlackRock or the other Affiliates may engage in transactions with companies in which BlackRock-advised funds or other clients of BlackRock or of an Affiliate have an investment.
BlackRock and Chubb Limited (“Chubb”), a public
company whose securities are held by BlackRock-advised funds and other accounts, partially funded the creation of a re-insurance company (“Re Co”) pursuant to which each has approximately a 9.9% ownership interest and each has
representation on the board of directors. Certain employees and executives of BlackRock have a less than ½ of 1% ownership interest in Re Co. BlackRock manages the investment portfolio of Re Co, which is held in a wholly-owned subsidiary. Re Co
participates as a reinsurer with reinsurance contracts underwritten by
46
subsidiaries of Chubb. An independent director of certain BlackRock-advised
funds also serves as an independent director of Chubb and has no interest or involvement in the Re Co transaction.
BlackRock and the other Affiliates, their personnel and other
financial service providers may have interests in promoting sales of the Fund. With respect to BlackRock and the other Affiliates and their personnel, the remuneration and profitability relating to services to and sales of the Fund or other products
may be greater than remuneration and profitability relating to services to and sales of certain funds or other products that might be provided or offered. BlackRock and the other Affiliates and their sales personnel may directly or indirectly
receive a portion of the fees and commissions charged to the Fund or its shareholders. BlackRock and its advisory or other personnel may also benefit from increased amounts of assets under management. Fees and commissions may also be higher than for
other products or services, and the remuneration and profitability to BlackRock or the other Affiliates and such personnel resulting from transactions on behalf of or management of the Fund may be greater than the remuneration and profitability
resulting from other funds or products.
BlackRock and
the other Affiliates and their personnel may receive greater compensation or greater profit in connection with an account for which BlackRock serves as an adviser than with an account advised by an unaffiliated investment adviser. Differentials in
compensation may be related to the fact that BlackRock may pay a portion of its advisory fee to its Affiliate, or relate to compensation arrangements, including for portfolio management, brokerage transactions or account servicing. Any differential
in compensation may create a financial incentive on the part of BlackRock or the other Affiliates and their personnel to recommend BlackRock over unaffiliated investment advisers or to effect transactions differently in one account over
another.
Third parties, including service providers to
BlackRock or the Fund, may sponsor events (including, but not limited to, marketing and promotional activities and presentations, educational training programs and conferences) for registered representatives, other professionals and individual
investors. There is a potential conflict of interest as such sponsorships may defray the costs of such activities to BlackRock, and may provide an incentive to BlackRock to retain such third parties to provide services to the Fund.
BlackRock and the other Affiliates may provide valuation
assistance to certain clients with respect to certain securities or other investments and the valuation recommendations made for their clients' accounts may differ from the valuations for the same securities or investments assigned by the Fund's
pricing vendors, especially if such valuations are based on broker-dealer quotes or other data sources unavailable to the Fund's pricing vendors. While BlackRock will generally communicate its valuation information or determinations to the Fund's
pricing vendors and/or fund accountants, there may be instances where the Fund's pricing vendors or fund accountants assign a different valuation to a security or other investment than the valuation for such security or investment determined or
recommended by BlackRock.
As disclosed in more detail in
the Determination of Net Asset Value section of the Fund’s Prospectus and this SAI, when market quotations are not readily available or are believed by BlackRock to be unreliable, the Fund’s
investments are valued at fair value by BlackRock in accordance with procedures adopted by the Board. When determining “fair value price,” BlackRock seeks to determine the price that the Fund might reasonably expect to receive from the
current sale of that asset or liability in an arm’s-length transaction. The price generally may not be determined based on what the Fund might expect to receive for selling an asset or liability at a later time or if it holds the asset or
liability to maturity. While fair value determinations will be based upon all available factors that BlackRock deems relevant at the time of the determination, and may be based on analytical values determined by BlackRock using proprietary or
third-party valuation models, fair value represents only a good faith approximation of the value of an asset or liability. The fair value of one or more assets or liabilities may not, in retrospect, be the price at which those assets or liabilities
could have been sold during the period in which the particular fair values were used in determining the Fund’s net asset value. As a result, the Fund’s sale or redemption of its shares at net asset value, at a time when a holding or
holdings are valued by BlackRock (pursuant to Board-adopted procedures) at fair value, may have the effect of diluting or increasing the economic interest of existing shareholders and may affect the amount of revenue received by BlackRock with
respect to services for which it receives an asset-based fee.
To the extent permitted by applicable law, the Fund may invest
all or some of its short-term cash investments in any money market fund or similarly-managed private fund advised or managed by BlackRock. In connection with any such investments, the Fund, to the extent permitted by the 1940 Act, may pay its share
of expenses of a money market fund or other similarly-managed private fund in which it invests, which may result in the Fund bearing some additional expenses.
BlackRock and the other Affiliates and their directors,
officers and employees, may buy and sell securities or other investments for their own accounts and may have conflicts of interest with respect to investments made on behalf of the
47
Fund. As a result of differing trading and investment strategies or
constraints, positions may be taken by directors, officers, employees and Affiliates that are the same, different from or made at different times than positions taken for the Fund. To lessen the possibility that the Fund will be adversely affected
by this personal trading, the Fund, BFA and BlackRock, Inc. have each adopted a code of ethics in compliance with Section 17(j) of the 1940 Act that restricts securities trading in the personal accounts of investment professionals and others who
normally come into possession of information regarding the Fund's portfolio transactions. Each code of ethics is available by contacting BlackRock or by accessing the EDGAR Database on the SEC's Internet site at http://www.sec.gov, and copies may be
obtained, after paying a duplicating fee, by e-mail at publicinfo@sec.gov or by writing the SEC's Public Reference Room, Washington, DC 20549-1520. Information about accessing documents on the SEC’s website may be obtained by calling the SEC
at (800) SEC-0330.
BlackRock and the other Affiliates
will not purchase securities or other property from, or sell securities or other property to, the Fund, except that the Fund may in accordance with rules or guidance adopted under the 1940 Act engage in transactions with accounts that are affiliated
with the Fund as a result of common officers, directors, or investment advisers or pursuant to exemptive orders granted to the Fund and/or BlackRock by the SEC. These transactions would be effected in circumstances in which BlackRock determined that
it would be appropriate for the Fund to purchase and another client of BlackRock to sell, or the Fund to sell and another client of BlackRock to purchase, the same security or instrument on the same day. From time to time, the activities of the Fund
may be restricted because of regulatory requirements applicable to BlackRock or the other Affiliates and/or BlackRock's internal policies designed to comply with, limit the applicability of, or otherwise relate to such requirements. A client not
advised by BlackRock would not be subject to some of those considerations. There may be periods when BlackRock may not initiate or recommend certain types of transactions, or may otherwise restrict or limit their advice in certain securities or
instruments issued by or related to companies for which an Affiliate is performing investment banking, market making, advisory or other services or has proprietary positions. For example, when an Affiliate is engaged in an underwriting or other
distribution of securities of, or advisory services for, a company, the Fund may be prohibited from or limited in purchasing or selling securities of that company. In addition, when BlackRock provides advisory or risk management services for a
company, BlackRock may be prohibited from or limited in purchasing or selling securities of that company on behalf of the Fund, particularly where such services result in BlackRock obtaining material non-public information about the company (e.g., in connection with participation in a creditors’ committee). Similar situations could arise if personnel of BlackRock or the other Affiliates serve as directors of companies the securities of which the
Fund wishes to purchase or sell. However, if permitted by applicable law, and where consistent with BlackRock’s policies and procedures (including the necessary implementation of appropriate information barriers), the Fund may purchase
securities or instruments that are issued by such companies, are the subject of an underwriting, distribution or advisory assignment by an Affiliate, or are the subject of an advisory or risk management assignment by BlackRock, or where personnel of
BlackRock or the other Affiliates are directors or officers of the issuer.
The investment activities of one or more Affiliates for their
proprietary accounts and for client accounts may also limit the investment strategies and rights of the Fund. For example, in certain circumstances where the Fund invests in securities issued by companies that operate in certain regulated industries
or in certain emerging or international markets, are subject to corporate or regulatory ownership definitions, or invest in certain futures and derivative transactions, there may be limits on the aggregate amount invested by Affiliates (including
BlackRock) for their proprietary accounts and for client accounts (including the Fund) that may not be exceeded without the grant of a license or other regulatory or corporate consent or, if exceeded, may cause BlackRock, the Fund or other client
accounts to suffer disadvantages or business restrictions.
If certain aggregate ownership thresholds are reached or
certain transactions are undertaken, the ability of BlackRock on behalf of clients (including the Fund) to purchase or dispose of investments, or exercise rights or undertake business transactions, may be restricted by regulation or otherwise
impaired. As a result, BlackRock, on behalf of clients (including the Fund), may limit purchases, sell existing investments, or otherwise restrict or limit the exercise of rights (including voting rights) when BlackRock, in its sole discretion,
deems it appropriate in light of potential regulatory or other restrictions on ownership or other consequences resulting from reaching investment thresholds.
In those circumstances where ownership thresholds or
limitations must be observed, BlackRock seeks to allocate limited investment opportunities equitably among clients (including the Fund), taking into consideration benchmark weight and investment strategy. When ownership in certain securities nears
an applicable threshold, BlackRock may limit purchases in such securities to the issuer's weighting in the applicable benchmark used by BlackRock to manage the Fund. If client (including Fund) holdings of an issuer exceed an applicable threshold and
BlackRock is unable to obtain relief to enable the
48
continued holding of such investments, it may be necessary to sell down these
positions to meet the applicable limitations. In these cases, benchmark overweight positions will be sold prior to benchmark positions being reduced to meet applicable limitations.
In addition to the foregoing, other ownership thresholds may
trigger reporting requirements to governmental and regulatory authorities, and such reports may entail the disclosure of the identity of a client or BlackRock’s intended strategy with respect to such security or asset.
BlackRock and the other Affiliates may not serve as Authorized
Participants in the creation and redemption of iShares ETFs, but may serve as authorized participants of third-party ETFs.
BlackRock may enter into contractual arrangements with
third-party service providers to the Fund (e.g., custodians and administrators) pursuant to which BlackRock receives fee discounts or concessions in recognition of BlackRock’s overall relationship with
such service providers. To the extent that BlackRock is responsible for paying these service providers out of its management fee, the benefits of any such fee discounts or concessions may accrue, in whole or in part, to BlackRock.
BlackRock or the other Affiliates own or have an ownership
interest in certain trading, portfolio management, operations and/or information systems used by Fund service providers. These systems are, or will be, used by a Fund service provider in connection with the provision of services to accounts managed
by BlackRock and funds managed and sponsored by BlackRock, including the Fund, that engage the service provider (typically the custodian). The Fund’s service provider remunerates BlackRock or the other Affiliates for the use of the systems.
The Fund service provider’s payments to BlackRock or the other Affiliates for the use of these systems may enhance the profitability of BlackRock and the other Affiliates. BlackRock’s or the other Affiliates’ receipt of fees from a
service provider in connection with the use of systems provided by BlackRock or the other Affiliates may create an incentive for BlackRock to recommend that the Fund enter into or renew an arrangement with the service provider.
Present and future activities of BlackRock and the other
Affiliates, including BFA, in addition to those described in this section, may give rise to additional conflicts of interest.
Legal Proceedings. On
June 16, 2016, iShares Trust, BlackRock, Inc. and certain of its advisory affiliates, and certain directors/trustees and officers of the Trust (collectively, “Defendants”) were named as defendants in a purported class action lawsuit
filed in California state court. The lawsuit was filed by investors (collectively, “Plaintiffs”) in certain iShares funds (iShares Core S&P 500 ETF, iShares Core S&P Small-Cap ETF, iShares Morningstar Large-Cap ETF, iShares
Morningstar Mid-Cap ETF, iShares Russell 1000 Growth ETF, iShares Russell Mid-Cap ETF, iShares Russell Mid-Cap Growth ETF, iShares Russell Mid-Cap Value ETF, iShares Select Dividend ETF, iShares U.S. Aerospace & Defense ETF and iShares U.S.
Preferred Stock ETF) (collectively, the “Named Funds”), and alleges Defendants violated the federal securities laws, purportedly by failing to adequately disclose in prospectuses issued by the Named Funds the risks of using stop-loss
orders in the event of a “flash crash,” such as the one that occurred on May 6, 2010. Plaintiffs seek unspecified monetary damages. The Plaintiffs’ complaint was dismissed in December 2016 and on January 6, 2017, Plaintiffs filed
an amended complaint. Defendants filed a motion for judgment on the pleadings seeking dismissal of that complaint. On April 27, 2017, the court granted Defendants' motion in part and denied it in part. Defendants believe the claims are without merit
and intend to vigorously defend themselves against the allegations in the lawsuit.
Investment Advisory, Administrative and Distribution
Services
Investment Adviser. BFA serves as investment adviser to the Fund pursuant to an investment advisory agreement between the Company, on behalf of the Fund, and BFA. BFA is a California corporation indirectly owned by BlackRock, Inc. and
is registered as an investment adviser under the Investment Advisers Act of 1940, as amended. Under the investment advisory agreement, BFA, subject to the supervision of the Board and in conformity with the stated investment policies of the Fund,
manages and administers the Company and the investment of the Fund’s assets. BFA is responsible for placing purchase and sale orders and providing continuous supervision of the investment portfolio of the Fund.
Pursuant to the investment advisory agreement, BFA may, from
time to time, in its sole discretion and to the extent permitted by applicable law, appoint one or more sub-advisers, including, without limitation, affiliates of BFA, to perform investment
49
advisory or other services with respect to the Fund. In addition, BFA may
delegate certain of its investment advisory functions under the investment advisory agreement to one or more of its affiliates to the extent permitted by applicable law. BFA may terminate any or all sub-advisers or such delegation arrangements in
its sole discretion upon appropriate notice at any time to the extent permitted by applicable law.
BFA is responsible, under the investment advisory agreement,
for substantially all expenses of the Fund, including the cost of transfer agency, custody, fund administration, legal, audit and other services. BFA is not responsible for, and the Fund will bear, the management fees, interest expenses, taxes,
expenses incurred with respect to the acquisition and disposition of portfolio securities and the execution of portfolio transactions, including brokerage commissions, distribution fees or expenses, litigation expenses and any extraordinary expenses
(as determined by a majority of the Independent Directors).
For its investment advisory services to the Fund, BFA received
a management fee at the annual rate (as a percentage of the Fund's average net assets) set forth below for the fiscal year ended April 30, 2017. BFA has contractually agreed to waive a portion of its management fees in an amount equal to the
aggregate Acquired Fund Fees and Expenses, if any, attributable to the Fund's investments in other series of iShares Trust and the Company through August 31, 2022. The contractual waiver may be terminated prior to August 31, 2022 only upon written
agreement of the Company and BFA. Prior to August 1, 2016, BFA contractually agreed to waive any additional portion of its management fees necessary to limit the Total Annual Fund Operating Expenses to 0.49% of the average daily net assets through
August 31, 2017. The contractual waiver was discontinued as of August 1, 2016. For the fiscal years ended April 30, 2017, April 30, 2016, and April 30, 2015, BFA waived $73,967, $322,833, and $444,931 of management fees, respectively.
The following table sets forth the management fees paid by the
Fund to BFA for the fiscal years noted:
| Management
Fee for the Fiscal Year Ended April 30, 2017 |
Fund
Inception Date |
Management
Fees Paid for Fiscal Year Ended April 30, 2017 |
Management
Fees Paid for Fiscal Year Ended April 30, 2016 |
Management
Fees Paid for Fiscal Year Ended April 30, 2015 | ||||
| 0.49% 1 | 02/23/12 | $1,117,215 | $832,571 | $1,147,454 |
| 1 | Effective August 1, 2016, the management fee for the iShares Emerging Markets Dividend ETF is 0.49%. Prior to August 1, 2016, the management fee for the iShares Emerging Markets Dividend ETF was 0.68%. |
The investment advisory agreement with respect to the Fund
continues in effect for two years from its effective date, and thereafter is subject to annual approval by (i) the Board, or (ii) the vote of a majority of the outstanding voting securities (as defined in the 1940 Act) of the Fund, provided that in
either event such continuance also is approved by a majority of the Board members who are not interested persons (as defined in the 1940 Act) of the Fund, by a vote cast in person at a meeting called for the purpose of voting on such approval.
The investment advisory agreement with respect to the Fund is
terminable without penalty, on 60 days’ notice, by the Board or by a vote of the holders of a majority of the Fund’s outstanding voting securities (as defined in the 1940 Act). The investment advisory agreement is also terminable upon 60
days’ notice by BFA and will terminate automatically in the event of its assignment (as defined in the 1940 Act).
Portfolio Managers. As
of April 30, 2017, the individuals named as Portfolio Managers in the Fund's Prospectus were also primarily responsible for the day-to-day management of other iShares funds and certain other types of portfolios and/or accounts as
follows:
| Diane Hsiung | ||||
| Types of Accounts | Number | Total Assets | ||
| Registered Investment Companies | 267 | $873,219,000,000 | ||
| Other Pooled Investment Vehicles | 2 | 23,000,000 | ||
| Other Accounts | 0 | 0 |
50
| Jennifer Hsui | ||||
| Types of Accounts | Number | Total Assets | ||
| Registered Investment Companies | 287 | $903,488,000,000 | ||
| Other Pooled Investment Vehicles | 4 | 1,572,000,000 | ||
| Other Accounts | 2 | 488,000,000 |
| Alan Mason | ||||
| Types of Accounts | Number | Total Assets | ||
| Registered Investment Companies | 358 | $ 974,688,000,000 | ||
| Other Pooled Investment Vehicles | 288 | 622,347,000,000 | ||
| Other Accounts | 217 | 79,660,000,000 |
| Greg Savage | ||||
| Types of Accounts | Number | Total Assets | ||
| Registered Investment Companies | 402 | $930,524,000,000 | ||
| Other Pooled Investment Vehicles | 2 | 1,549,000,000 | ||
| Other Accounts | 18 | 12,947,000,000 |
Each of the portfolios or accounts
for which the Portfolio Managers are primarily responsible for the day-to-day management seeks to track the rate of return, risk profile and other characteristics of independent third-party indexes by either replicating the same combination of
securities and other financial instruments that constitute those indexes or through a representative sampling of the securities and other financial instruments that constitute those indexes based on objective criteria and data. Pursuant to
BFA’s policy, investment opportunities are allocated equitably among the Fund and other portfolios and accounts. For example, under certain circumstances, an investment opportunity may be restricted due to limited supply in the market, legal
constraints or other factors, in which event the investment opportunity will be allocated equitably among those portfolios and accounts, including the Fund, seeking such investment opportunity. As a consequence, from time to time the Fund may
receive a smaller allocation of an investment opportunity than it would have if the Portfolio Managers and BFA and its affiliates did not manage other portfolios or accounts.
Like the Fund, the other portfolios or accounts for which the
Portfolio Managers are primarily responsible for the day-to-day portfolio management generally pay an asset-based fee to BFA or its affiliates, as applicable, for its advisory services. One or more of those other portfolios or accounts, however, may
pay BFA or its affiliates a performance-based fee in lieu of, or in addition to, an asset-based fee for its advisory services. A portfolio or account with a performance-based fee would pay BFA or its affiliates a portion of that portfolio’s or
account’s gains, or would pay BFA or its affiliates more for its services than would otherwise be the case if BFA or any of its affiliates meets or exceeds specified performance targets. Performance-based fee arrangements could present an
incentive for BFA or its affiliates to devote greater resources, and allocate more investment opportunities, to the portfolios or accounts that have those fee arrangements, relative to other portfolios or accounts, in order to earn larger fees.
Although BFA and each of its affiliates have an obligation to allocate resources and opportunities equitably among portfolios and accounts and intend to do so, shareholders of the Fund should be aware that, as with any group of portfolios and
accounts managed by an investment adviser and/or its affiliates pursuant to varying fee arrangements, including performance-based fee arrangements, there is the potential for a conflict of interest, which may result in the Portfolio Managers
favoring those portfolios or accounts with performance-based fee arrangements.
The tables below show, for each Portfolio Manager, the number
of portfolios or accounts of the types set forth in the above tables and the aggregate of total assets in those portfolios or accounts with respect to which the investment management fees are based on the performance of those portfolios or
accounts as of April 30, 2017:
| Diane Hsiung | ||||
| Types of Accounts | Number
of Other Accounts with Performance Fees Managed by Portfolio Manager |
Aggregate
of Total Assets | ||
| Registered Investment Companies | 0 | N/A | ||
| Other Pooled Investment Vehicles | 0 | N/A |
51
| Diane Hsiung | ||||
| Types of Accounts | Number
of Other Accounts with Performance Fees Managed by Portfolio Manager |
Aggregate
of Total Assets | ||
| Other Accounts | 0 | N/A |
| Jennifer Hsui | ||||
| Types of Accounts | Number
of Other Accounts with Performance Fees Managed by Portfolio Manager |
Aggregate
of Total Assets | ||
| Registered Investment Companies | 0 | N/A | ||
| Other Pooled Investment Vehicles | 0 | N/A | ||
| Other Accounts | 0 | N/A |
| Alan Mason | ||||
| Types of Accounts | Number
of Other Accounts with Performance Fees Managed by Portfolio Manager |
Aggregate
of Total Assets | ||
| Registered Investment Companies | 0 | N/A | ||
| Other Pooled Investment Vehicles | 0 | N/A | ||
| Other Accounts | 0 | N/A |
| Greg Savage | ||||
| Types of Accounts | Number
of Other Accounts with Performance Fees Managed by Portfolio Manager |
Aggregate
of Total Assets | ||
| Registered Investment Companies | 0 | N/A | ||
| Other Pooled Investment Vehicles | 0 | N/A | ||
| Other Accounts | 0 | N/A |
The discussion below describes the
Portfolio Managers' compensation as of April 30, 2017.
Portfolio Manager Compensation Overview
BlackRock, Inc.'s financial arrangements with its portfolio
managers, its competitive compensation and its career path emphasis at all levels reflect the value senior management places on key resources. Compensation may include a variety of components and may vary from year to year based on a number of
factors. The principal components of compensation include a base salary, a performance-based discretionary bonus, participation in various benefits programs and one or more of the incentive compensation programs established by BlackRock, Inc.
Base compensation. Generally,
portfolio managers receive base compensation based on their position with the firm.
Discretionary Incentive Compensation. Discretionary incentive compensation is a function of several components: the performance of BlackRock, Inc., the performance of the portfolio manager's group within BlackRock, Inc. and the individual's performance and
contribution to the overall performance of these portfolios and BlackRock, Inc.
Distribution of Discretionary Incentive Compensation. Discretionary incentive compensation is distributed to portfolio managers in a combination of cash and BlackRock, Inc. restricted stock units which vest ratably over a number of years. The BlackRock, Inc. restricted
stock units, if properly vested, will be settled in BlackRock, Inc. common stock. Typically, the cash bonus, when combined with base salary, represents more than 60% of total compensation for the portfolio managers. Paying a portion of annual
bonuses in stock puts compensation earned by a portfolio manager for a given year “at risk” based on BlackRock, Inc.'s ability to sustain and improve its performance over future periods.
52
Long-Term Incentive Plan Awards — From time to time, long-term incentive equity awards are granted to certain key employees to aid in retention, align their interests with long-term shareholder interests and motivate performance. Equity awards are
generally granted in the form of BlackRock, Inc. restricted stock units that, once vested, settle in BlackRock, Inc. common stock.
Other Compensation Benefits.
In addition to base compensation and discretionary incentive compensation, portfolio managers may be eligible to receive or participate in one or more of the following:
Incentive Savings Plans
— BlackRock, Inc. has created a variety of incentive savings plans in which BlackRock, Inc. employees are eligible to participate, including a 401(k) plan, the BlackRock Retirement Savings Plan (“RSP”), and the BlackRock Employee
Stock Purchase Plan (“ESPP”). The employer contribution components of the RSP include a company match equal to 50% of the first 8% of eligible pay contributed to the plan capped at $5,000 per year, and a company retirement contribution
equal to 3-5% of eligible compensation up to the U.S. Internal Revenue Service (the “IRS”) limit ($265,000 for 2015). The RSP offers a range of investment options, including registered investment companies and collective investment funds
managed by the firm. BlackRock, Inc. contributions follow the investment direction set by participants for their own contributions or, absent participant investment direction, are invested into an index target date fund that corresponds to, or is
closest to, the year in which the participant attains age 65. The ESPP allows for investment in BlackRock, Inc. common stock at a 5% discount on the fair market value of the stock on the purchase date. Annual participation in the ESPP is limited to
the purchase of 1,000 shares of common stock or a dollar value of $25,000 based on its fair market value on the Purchase Date. Diane Hsiung, Jennifer Hsui, Alan Mason and Greg Savage are each eligible to participate in these plans.
As of April 30, 2017, the Portfolio Managers did not
beneficially own shares of the Fund.
Codes of Ethics. The Company, BFA and the Distributor have adopted codes of ethics pursuant to Rule 17j-1 under the 1940 Act. The codes of ethics permit personnel subject to the codes of ethics to invest in securities, subject to
certain limitations, including securities that may be purchased or held by the Fund. The codes of ethics are on public file with, and are available from, the SEC.
Anti-Money Laundering Requirements. The Fund is subject to the USA PATRIOT Act (the “Patriot Act”). The Patriot Act is intended to prevent the use of the U.S. financial system in furtherance of money laundering, terrorism or other illicit
activities. Pursuant to requirements under the Patriot Act, the Fund may request information from Authorized Participants to enable it to form a reasonable belief that it knows the true identity of its Authorized Participants. This information will
be used to verify the identity of Authorized Participants or, in some cases, the status of financial professionals; it will be used only for compliance with the requirements of the Patriot Act.
The Fund reserves the right to reject purchase orders from
persons who have not submitted information sufficient to allow the Fund to verify their identity. The Fund also reserves the right to redeem any amounts in the Fund from persons whose identity it is unable to verify on a timely basis. It is the
Fund's policy to cooperate fully with appropriate regulators in any investigations conducted with respect to potential money laundering, terrorism or other illicit activities.
Administrator, Custodian and Transfer Agent. State Street serves as administrator, custodian and transfer agent for the Fund under the Master Services Agreement and related Service Schedule (the “Service Module”). State Street’s principal
address is 1 Iron Street, Boston, MA 02210. Pursuant to the Service Module for Fund Administration and Accounting Services with the Company, State Street provides necessary administrative, legal, tax and accounting and financial reporting services
for the maintenance and operations of the Company and the Fund. In addition, State Street makes available the office space, equipment, personnel and facilities required to provide such services. Pursuant to the Service Module for Custodial Services
with the Company, State Street maintains, in separate accounts, cash, securities and other assets of the Company and the Fund, keeps all necessary accounts and records and provides other services. State Street is required, upon the order of the
Company, to deliver securities held by State Street and to make payments for securities purchased by the Company for the Fund. State Street is authorized to appoint certain foreign custodians or foreign custody managers for Fund investments outside
the United States. Pursuant to the Service Module for Transfer Agency Services with the Company, State Street acts as a transfer agent for the Fund’s authorized and issued shares of beneficial interest, and as dividend disbursing agent of the
Company. As compensation for these services, State Street receives certain out-of-pocket costs, transaction fees and asset-based fees which are accrued daily and paid monthly by BFA from its management fee.
The following table sets forth the administration, custodian
and transfer agency expenses of the Fund paid by BFA to State Street for the fiscal years noted:
53
| Fund
Inception Date |
Administration,
Custodian, Transfer Agency Expenses Paid During Fiscal Year Ended April 30, 2017 |
Administration,
Custodian, Transfer Agency Expenses Paid During Fiscal Year Ended April 30, 2016 |
Administration,
Custodian, Transfer Agency Expenses Paid During Fiscal Year Ended April 30, 2015 | |||
| 02/23/12 | $ 120,089 | $ 85,912 | $100,935 |
Distributor. The Distributor's principal address is 1 University Square Drive, Princeton, NJ 08540. Shares are continuously offered for sale by the Fund through the Distributor or its agent only in Creation Units, as described
in the Prospectus and below in the Creation and Redemption of Creation Units section of this SAI. Fund shares in amounts less than Creation Units are generally not distributed by the Distributor or its agent. The Distributor or its agent will arrange for the delivery of the Prospectus and, upon
request, this SAI to persons purchasing Creation Units and will maintain records of both orders placed with it or its agents and confirmations of acceptance furnished by it or its agents. The Distributor is a broker-dealer registered under the
Securities Exchange Act of 1934, as amended (the “1934 Act”), and a member of the Financial Industry Regulatory Authority, Inc. (“FINRA”). The Distributor is also licensed as a broker-dealer in all 50 U.S. states, as well as
in Puerto Rico, the U.S. Virgin Islands and the District of Columbia.
The Distribution Agreement for the Fund provides that it may
be terminated at any time, without the payment of any penalty, on at least 60 days' prior written notice to the other party following (i) the vote of a majority of the Independent Directors, or (ii) the vote of a majority of the outstanding voting
securities (as defined in the 1940 Act) of the Fund. The Distribution Agreement will terminate automatically in the event of its assignment (as defined in the 1940 Act).
The Distributor may also enter into agreements with securities
dealers (“Soliciting Dealers”) who will solicit purchases of Creation Units of Fund shares. Such Soliciting Dealers may also be Authorized Participants (as described below), DTC participants and/or investor services organizations.
BFA or its affiliates may, from time to time and from its own
resources, pay, defray or absorb costs relating to distribution, including payments out of its own resources to the Distributor, or to otherwise promote the sale of shares.
The following table sets forth the compensation paid by BFA to
SEI Investments Distribution Co. (“SEI”) for certain services, not primarily intended to result in the sale of Fund shares, provided to the Fund during the fiscal years noted:
| Fund
Inception Date |
Distributor
Compensation Paid During Fiscal Year Ended April 30, 2017 |
Distributor
Compensation Paid During Fiscal Year Ended April 30, 2016 |
Distributor
Compensation Paid During Fiscal Year Ended April 30, 20151 | |||
| 02/23/12 | $0 | $0 | $1,534 |
| 1 | These fees reflect payments made to SEI, acting as an agent of the Distributor. |
Payments by BFA and its Affiliates. BFA and/or its affiliates (“BFA Entities”) may pay certain broker-dealers, registered investment advisers, banks and other financial intermediaries (“Intermediaries”) for certain activities
related to the Fund, other iShares funds or exchange-traded products in general. BFA Entities make these payments from their own assets and not from the assets of the Fund. Although a portion of BFA Entities’ revenue comes directly or
indirectly in part from fees paid by the Fund, other iShares funds or exchange-traded products, these payments do not increase the price paid by investors for the purchase of shares of, or the cost of owning, the Fund, other iShares funds or
exchange-traded products. BFA Entities make payments for Intermediaries’ participation in activities that are designed to make registered representatives, other professionals and individual investors more knowledgeable about exchange-traded
products, including the Fund and other iShares funds, or for other activities, such as participation in marketing activities and presentations, educational training programs, conferences, the development of technology platforms and reporting systems
(“Education Costs”). BFA Entities also make payments to Intermediaries for certain printing, publishing and mailing costs or materials relating to the Fund, other iShares funds or exchange-traded products (“Publishing
Costs”). In addition, BFA Entities make payments to Intermediaries that make shares of the Fund, other iShares funds or exchange-traded products available to their clients, develop new products that feature iShares or otherwise promote the
Fund, other iShares funds and exchange-traded
54
products. BFA Entities may also reimburse expenses or make payments from
their own assets to Intermediaries or other persons in consideration of services or other activities that the BFA Entities believe may benefit the iShares business or facilitate investment in the Fund, other iShares funds or exchange-traded
products. Payments of the type described above are sometimes referred to as revenue-sharing payments.
Payments to an Intermediary may be significant to the
Intermediary, and amounts that Intermediaries pay to your salesperson or other investment professional may also be significant for your salesperson or other investment professional. Because an Intermediary may make decisions about which investment
options it will recommend or make available to its clients or what services to provide for various products based on payments it receives or is eligible to receive, such payments may create conflicts of interest between the Intermediary and its
clients and these financial incentives may cause the Intermediary to recommend the Fund, other iShares funds or exchange-traded products over other investments. The same conflicts of interest and financial incentives exist with respect to your
salesperson or other investment professional if he or she receives similar payments from his or her Intermediary firm.
In addition to the payments described above, BFA Entities have
developed proprietary tools, calculators and related interactive or digital content that is made available through the www.BlackRock.com website at no additional cost to Intermediaries. BlackRock may configure these tools and calculators and
localizes the content for Intermediaries as part of its customary digital marketing support and promotion of the Fund, other iShares funds, exchange-traded products and BlackRock mutual funds.
As of March 1, 2013, BFA Entities have contractual
arrangements to make payments (in addition to payments for Education Costs or Publishing Costs) to one Intermediary, Fidelity Brokerage Services LLC (“FBS”). Effective June 4, 2016, this relationship was expanded to include National
Financial Services, LLC (“NFS”), an affiliate of FBS. Pursuant to this special, long-term and significant arrangement (the “Marketing Program”), FBS, NFS and certain of their affiliates (collectively “Fidelity”)
have agreed, among other things, to actively promote iShares funds to customers, investment professionals and other intermediaries and in advertising campaigns as the preferred exchange-traded product, to offer certain iShares funds in certain
Fidelity platforms and investment programs, in some cases at a waived or reduced commission rate or ticket charge, and to provide marketing data to BFA Entities. BFA Entities have agreed to facilitate the Marketing Program by, among other things,
making certain payments to FBS and NFS for marketing and implementing certain brokerage and investment programs. Upon termination of the arrangement, the BFA Entities will make additional payments to FBS and/or NFS based upon a number of criteria,
including the overall success of the Marketing Program and the level of services provided by FBS and NFS during the wind-down period.
In addition, BFA Entities may enter into other contractual
arrangements with Intermediaries that the BFA Entities believe may benefit the iShares business or facilitate investment in iShares funds. Such agreements may include payments by BFA Entities to such Intermediaries for data collection and provision,
technology support, platform enhancement, or co-marketing and cross-promotional efforts. Payments made pursuant to such arrangements may vary in any year and may be different for different Intermediaries. In certain cases, the payments described in
the preceding sentence may be subject to certain minimum payment levels. Such payments will not be asset- or revenue-based. As of the date of this SAI, the Intermediaries receiving such contractual payments include: Commonwealth Equity Services,
Inc., LPL Financial LLC, Morgan Stanley Smith Barney LLC, Pershing LLC and UBS Financial Services Inc.
Any additions, modifications, or deletions to Intermediaries
listed above that have occurred since the date noted above are not included in the list. Further, BFA Entities make Education Costs and Publishing Costs payments to other Intermediaries that are not listed above. BFA Entities may determine to make
such payments based on any number of metrics. For example, BFA Entities may make payments at year-end or other intervals in a fixed amount, an amount based upon an Intermediary’s services at defined levels or an amount based on the
Intermediary’s net sales of one or more iShares funds in a year or other period, any of which arrangements may include an agreed-upon minimum or maximum payment, or any combination of the foregoing. As of the date of this SAI, BFA anticipates
that the payments paid by BFA Entities in connection with the Fund, iShares funds and exchange-traded products in general will be immaterial to BFA Entities in the aggregate for the next year. Please contact your
salesperson or other investment professional for more information regarding any such payments or financial incentives his or her Intermediary firm may receive. Any payments made, or financial incentives offered, by the BFA Entities to an
Intermediary may create the incentive for the Intermediary to encourage customers to buy shares of the Fund, other iShares funds or other exchange-traded products.
55
The Fund may participate in certain market maker incentive
programs of a national securities exchange in which an affiliate of the Fund would pay a fee to the exchange used for the purpose of incentivizing one or more market makers in the securities of the Fund to enhance the liquidity and quality of the
secondary market of securities of the Fund. The fee would then be credited by the exchange to one or more market makers that meet or exceed liquidity and market quality standards with respect to the securities of the Fund. Each market maker
incentive program is subject to approval from the SEC. Any such fee payments made to an exchange will be made by an affiliate of the Fund solely for the benefit of the Fund and will not be paid from any Fund assets. Other funds managed by BFA may
also participate in such programs.
Determination of Net
Asset Value
Valuation of Shares. The NAV for the Fund is generally calculated as of the close of business on the New York Stock Exchange (“NYSE”) (normally 4:00 p.m., Eastern time) on each business day the NYSE is open. Valuation of
securities held by the Fund is as follows:
Equity
Investments. Equity securities traded on a recognized securities exchange (e.g., NYSE), on separate trading boards
of a securities exchange or through a market system that provides contemporaneous transaction pricing information (each, an “Exchange”) are valued using information obtained via independent pricing services, generally at the closing
price on the Exchange on which the security is primarily traded, or if an Exchange closing price is not available, the last traded price on that Exchange prior to the time as of which the Fund’s assets or liabilities are valued. However, under
certain circumstances, other means of determining current market value may be used. If an equity security is traded on more than one Exchange, the current market value of the security where it is primarily traded generally will be used. In the event
that there are no sales involving an equity security held by the Fund on a day on which the Fund values such security, the prior day’s price will be used, unless, in accordance with valuation procedures approved by the Board (the
“Valuation Procedures”), BlackRock determines in good faith that such prior day’s price no longer reflects the fair value of the security, in which case such asset would be treated as a Fair Value Asset (as defined
below).
Fixed-Income Investments. Fixed-income securities for which market quotations are readily available are generally valued using such securities’ current market value. The Fund values fixed-income portfolio securities using the last available
bid prices or current market quotations provided by dealers or prices (including evaluated prices) supplied by the Fund’s approved independent third-party pricing services, each in accordance with the Valuation Procedures. The pricing services
may use matrix pricing or valuation models that utilize certain inputs and assumptions to derive values, including transaction data (e.g., recent
representative bids and offers), credit quality information, perceived market movements, news, and other relevant information and by other methods, which may include consideration of: yields or prices of securities of comparable quality, coupon,
maturity and type; indications as to values from dealers; general market conditions; and/or other factors and assumptions. Pricing services generally value fixed-income securities assuming orderly transactions of an institutional round lot size, but
the Fund may hold or transact in such securities in smaller, odd lot sizes. Odd lots often trade at lower prices than institutional round lots. The amortized cost method of valuation may be used with respect to debt obligations with sixty days or
less remaining to maturity unless BlackRock determines in good faith that such method does not represent fair value. Loan participation notes are generally valued at the mean of the last available bid prices from one or more brokers or dealers as
obtained from independent third-party pricing services. Certain fixed-income investments, including asset-backed and mortgage-related securities, may be valued based on valuation models that consider the estimated cash flows of each tranche of the
entity, establish a benchmark yield and develop an estimated tranche-specific spread to the benchmark yield based on the unique attributes of the tranche.
Options, Futures, Swaps and Other Derivatives. Exchange-traded equity options for which market quotations are readily available are valued at the mean of the last bid and ask prices as quoted on the Exchange or the board of trade on which such options are traded. In
the event that there is no mean price available for an exchange traded equity option held by the Fund on a day on which the Fund values such option, the last bid (long positions) or ask (short positions) price, if available, will be used as the
value of such option. If no such bid or ask price is available on a day on which the Fund values such option, the prior day’s price will be used, unless BlackRock determines in good faith that such prior day’s price no longer reflects
the fair value of the option, in which case such option will be treated as a Fair Value Asset (as defined below). OTC derivatives are valued using the last available bid prices or current market quotations provided by dealers or prices (including
evaluated prices) supplied by the Fund’s approved independent third-party pricing services, each in accordance with the Valuation Procedures. OTC derivatives may be valued using a mathematical model which may incorporate a number of market
data factors. Financial futures contracts and options thereon, which are traded on exchanges, are valued at their settle price as of
56
the close of such exchanges. Swap agreements and other derivatives are
generally valued daily based upon quotations from market makers or by a pricing service in accordance with the Valuation Procedures.
Underlying Funds. Shares of
underlying ETFs will be valued at their most recent closing price on an Exchange. Shares of underlying money market funds will be valued at their NAV.
General Valuation Information.
The price the Fund could receive upon the sale of any particular portfolio investment may differ from the Fund’s valuation of the investment, particularly for securities that trade in thin or volatile markets
or that are valued using a fair valuation methodology or a price provided by an independent pricing service. As a result, the price received upon the sale of an investment may be less than the value ascribed by the Fund, and the Fund could realize a
greater than expected loss or lesser than expected gain upon the sale of the investment. The Fund’s ability to value its investment may also be impacted by technological issues and/or errors by pricing services or other third-party service
providers.
All cash, receivables and current
payables are carried on the Fund’s books at their face value.
Prices obtained from independent third-party pricing services,
broker-dealers or market makers to value the Fund’s securities and other assets and liabilities are based on information available at the time the Fund values its assets and liabilities. In the event that a pricing service quotation is revised
or updated subsequent to the day on which the Fund valued such security or other asset or liability, the revised pricing service quotation generally will be applied prospectively. Such determination will be made considering pertinent facts and
circumstances surrounding the revision.
In the event
that application of the methods of valuation discussed above result in a price for a security which is deemed not to be representative of the fair market value of such security, the security will be valued by, under the direction of or in accordance
with a method approved by the Board as reflecting fair value. All other assets and liabilities (including securities for which market quotations are not readily available) held by the Fund (including restricted securities) are valued at fair value
as determined in good faith by the Board or by BlackRock (its delegate) pursuant to the Valuation Procedures. Any assets and liabilities that are denominated in a foreign currency are converted into U.S. dollars using prevailing market rates on the
date of valuation as quoted by one or more data service providers.
Certain of the securities acquired by the Fund may be traded
on foreign exchanges or OTC markets on days on which the Fund’s NAV is not calculated. In such cases, the NAV of the Fund’s shares may be significantly affected on days when Authorized Participants can neither purchase nor redeem shares
of the Fund.
Generally, trading in non-U.S. securities,
U.S. government securities, money market instruments and certain fixed-income securities is substantially completed each day at various times prior to the close of business on the NYSE. The values of such securities used in computing the NAV of the
Fund are determined as of such times.
Use of fair value
prices and certain current market valuations could result in a difference between the prices used to calculate the Fund’s NAV and the prices used in the Underlying Index, which, in turn, could result in a difference between the Fund’s
performance and the performance of the Underlying Index.
Fair Value. When market
quotations are not readily available or are believed in good faith by BlackRock to be unreliable, the Fund’s investments are valued at fair value (“Fair Value Assets”). Fair Value Assets are valued by BlackRock in accordance with
the Valuation Procedures. BlackRock may reasonably conclude that a market quotation is not readily available or is unreliable if, among other things, a security or other asset or liability does not have a price source due to its complete lack of
trading, if BlackRock believes in good faith that a market quotation from a broker-dealer or other source is unreliable (e.g., where it varies
significantly from a recent trade, or no longer reflects the fair value of the security or other asset or liability subsequent to the most recent market quotation), or where the security or other asset or liability is only thinly traded or due to
the occurrence of a significant event subsequent to the most recent market quotation. For this purpose, a “significant event” is deemed to occur if BlackRock determines, in its reasonable business judgment, that an event has occurred
after the close of trading for an asset or liability but prior to or at the time of pricing the Fund’s assets or liabilities, and that the event is likely to cause a material change to the closing market price of the assets or liabilities held
by the Fund. Non-U.S. securities whose values are affected by volatility that occurs in the markets or in related or highly correlated assets (e.g.,
ADRs, GDRs or ETFs that invest in components of the Underlying Index) on a trading day after the close of non-U.S. securities markets may be fair valued. On any day the NYSE is open and a foreign market or the primary exchange on which a foreign
asset or liability is traded is closed, such asset or liability will be valued using the prior day’s price, provided that BlackRock is not aware of any
57
significant event or other information that would cause such price to no
longer reflect the fair value of the asset or liability, in which case such asset or liability would be treated as a Fair Value Asset.
BlackRock, with input from the BlackRock Investment Strategy
Group, will submit its recommendations regarding the valuation and/or valuation methodologies for Fair Value Assets to BlackRock’s Valuation Committee. The BlackRock Valuation Committee may accept, modify or reject any recommendations. In
addition, the Fund’s accounting agent periodically endeavors to confirm the prices it receives from all third-party pricing services, index providers and broker-dealers, and, with the assistance of BlackRock, to regularly evaluate the values
assigned to the securities and other assets and liabilities of the Fund. The pricing of all Fair Value Assets is subsequently reported to and, where appropriate, ratified by the Board.
When determining the price for a Fair Value Asset, the
BlackRock Valuation Committee (or BlackRock’s Pricing Group) will seek to determine the price that the Fund might reasonably expect to receive upon the current sale of that asset or liability in an arm’s-length transaction on the date on
which the assets or liabilities are being valued, and does not seek to determine the price that the Fund might expect to receive for selling the asset, or the cost of extinguishing a liability, at a later time or if it holds the asset or liability
to maturity. Fair value determinations will be based upon all available factors that the BlackRock Valuation Committee (or BlackRock’s Pricing Group) deems relevant at the time of the determination, and may be based on analytical values
determined by BlackRock using proprietary or third-party valuation models.
Fair value represents a good faith approximation of the value
of an asset or liability. When determining the fair value of an asset, one or more of a variety of fair valuation methodologies may be used (depending on certain factors, including the asset type). For example, the asset may be priced on the basis
of the original cost of the investment or, alternatively, using proprietary or third-party models (including models that rely upon direct portfolio management pricing inputs and which reflect the significance attributed to the various factors and
assumptions being considered). Prices of actual, executed or historical transactions in the relevant asset and/or liability (or related or comparable assets and/or liabilities) or, where appropriate, an appraisal by a third-party experienced in the
valuation of similar assets and/or liabilities, may also be used as a basis for establishing the fair value of an asset or liability. The fair value of one or more assets or liabilities may not, in retrospect, be the price at which those assets or
liabilities could have been sold during the period in which the particular fair values were used in determining the Fund’s NAV. As a result, the Fund’s sale or redemption of its shares at NAV, at a time when a holding or holdings are
valued at fair value, may have the effect of diluting or increasing the economic interest of existing shareholders.
The Fund’s annual audited financial statements, which
are prepared in accordance with accounting principles generally accepted in the United States of America (“US GAAP”), follow the requirements for valuation set forth in Financial Accounting Standards Board Accounting Standards
Codification Topic 820, “Fair Value Measurements and Disclosures” (“ASC 820”), which defines and establishes a framework for measuring fair value under US GAAP and expands financial statement disclosure requirements relating
to fair value measurements. Generally, ASC 820 and other accounting rules applicable to funds and various assets in which they invest are evolving. Such changes may adversely affect the Fund. For example, the evolution of rules governing the
determination of the fair market value of assets or liabilities to the extent such rules become more stringent would tend to increase the cost and/or reduce the availability of third-party determinations of fair market value. This may in turn
increase the costs associated with selling assets or affect their liquidity due to the Fund’s inability to obtain a third-party determination of fair market value.
Brokerage Transactions
Subject to policies established by the Board, BFA is primarily
responsible for the execution of the Fund’s portfolio transactions and the allocation of brokerage. BFA does not execute transactions through any particular broker or dealer, but seeks to obtain the best net results for the Fund, taking into
account such factors as price (including the applicable brokerage commission or dealer spread), size of order, difficulty of execution, operational facilities of the firm and the firm’s risk and skill in positioning blocks of securities. While
BFA generally seeks reasonable trade execution costs, the Fund does not necessarily pay the lowest spread or commission available, and payment of the lowest commission or spread is not necessarily consistent with obtaining the best price and
execution in particular transactions. Subject to applicable legal requirements, BFA may select a broker based partly upon brokerage or research services provided to BFA and its clients, including the Fund. In return for such services, BFA may cause
the Fund to pay a higher commission than other brokers would charge if BFA determines in good faith that the commission is reasonable in relation to the services provided.
58
In selecting brokers or dealers to execute portfolio
transactions, BFA seeks to obtain the best price and most favorable execution for the Fund and may take into account a variety of factors including: (i) the size, nature and character of the security or instrument being traded and the markets in
which it is purchased or sold; (ii) the desired timing of the transaction; (iii) BFA’s knowledge of the expected commission rates and spreads currently available; (iv) the activity existing and expected in the market for the particular
security or instrument, including any anticipated execution difficulties; (v) the full range of brokerage services provided; (vi) the broker’s or dealer’s capital; (vii) the quality of research and research services provided; (viii) the
reasonableness of the commission, dealer spread or its equivalent for the specific transaction; and (ix) BFA’s knowledge of any actual or apparent operational problems of a broker or dealer. Brokers may also be selected because of their
ability to handle special or difficult executions, such as may be involved in large block trades, less liquid securities, or other circumstances.
Section 28(e) of the 1934 Act (“Section 28(e)”)
permits a U.S. investment adviser, under certain circumstances, to cause an account to pay a broker or dealer a commission for effecting a transaction in securities that exceeds the amount another broker or dealer would have charged for effecting
the same transaction in recognition of the value of brokerage and research services provided by that broker or dealer. This includes commissions paid on riskless principal transactions in securities under certain conditions.
From time to time, the Fund may purchase new issues of
securities in a fixed price offering. In these situations, the broker may be a member of the selling group that will, in addition to selling securities, provide BFA with research services. FINRA has adopted rules expressly permitting these types of
arrangements under certain circumstances. Generally, the broker will provide research “credits” in these situations at a rate that is higher than that available for typical secondary market transactions. These arrangements may not fall
within the safe harbor of Section 28(e).
The Fund
anticipates that brokerage transactions involving foreign equity securities generally will be conducted primarily on the principal stock exchanges of the applicable country. Foreign equity securities may be held by the Fund in the form of depositary
receipts, or other securities convertible into foreign equity securities. Depositary receipts may be listed on stock exchanges, or traded in OTC markets in the United States or Europe, as the case may be. ADRs, like other securities traded in the
United States, will be subject to negotiated commission rates.
OTC issues, including most fixed-income securities such as
corporate debt and U.S. Government securities, are normally traded on a “net” basis without a stated commission, through dealers acting for their own account and not as brokers. The Fund will primarily engage in transactions with these
dealers or deal directly with the issuer unless a better price or execution could be obtained by using a broker. Prices paid to a dealer with respect to both foreign and domestic securities will generally include a “spread,” which is the
difference between the prices at which the dealer is willing to purchase and sell the specific security at the time, and includes the dealer’s normal profit.
Under the 1940 Act, persons affiliated with the Fund and
persons who are affiliated with such affiliated persons are prohibited from dealing with the Fund as principal in the purchase and sale of securities unless a permissive order allowing such transactions is obtained from the SEC. Since transactions
in the OTC market usually involve transactions with the dealers acting as principal for their own accounts, the Fund will not deal with affiliated persons, including PNC and its affiliates, in connection with such transactions. The Fund will not
purchase securities during the existence of any underwriting or selling group relating to such securities of which BFA, PNC, BRIL or any affiliated person (as defined in the 1940 Act) thereof is a member except pursuant to procedures adopted by the
Board in accordance with Rule 10f-3 under the 1940 Act.
Purchases of money market instruments by the Fund are made
from dealers, underwriters and issuers. The Fund does not currently expect to incur any brokerage commission expense on such transactions because money market instruments are generally traded on a “net” basis with dealers acting as
principal for their own accounts without a stated commission. The price of the security, however, usually includes a profit to the dealer.
BFA may, from time to time, effect trades on behalf of and for
the account of the Fund with brokers or dealers that are affiliated with BFA, in conformity with Rule 17e-1 under the 1940 Act and SEC rules and regulations. Under these provisions, any commissions paid to affiliated brokers or dealers must be
reasonable and fair compared to the commissions charged by other brokers or dealers in comparable transactions.
59
Securities purchased in underwritten offerings include a fixed
amount of compensation to the underwriter, generally referred to as the underwriter’s concession or discount. When securities are purchased or sold directly from or to an issuer, no commissions or discounts are paid.
Investment decisions for the Fund and for other investment
accounts managed by BFA and the other Affiliates are made independently of each other in light of differing conditions. A variety of factors will be considered in making investment allocations. These factors include: (i) investment objectives or
strategies for particular accounts, including sector, industry, country or region and capitalization weightings; (ii) tax considerations of an account; (iii) risk or investment concentration parameters for an account; (iv) supply or demand for a
security at a given price level; (v) size of available investment; (vi) cash availability and liquidity requirements for accounts; (vii) regulatory restrictions; (viii) minimum investment size of an account; (ix) relative size of account; and (x)
such other factors as may be approved by BlackRock’s general counsel. Moreover, investments may not be allocated to one client account over another based on any of the following considerations: (i) to favor one client account at the expense of
another; (ii) to generate higher fees paid by one client account over another or to produce greater performance compensation to BlackRock; (iii) to develop or enhance a relationship with a client or prospective client; (iv) to compensate a client
for past services or benefits rendered to BlackRock or to induce future services or benefits to be rendered to BlackRock; or (v) to manage or equalize investment performance among different client accounts. BFA and the other Affiliates may deal,
trade and invest for their own respective accounts in the types of securities in which the Fund may invest.
Initial public offerings of securities may be over-subscribed
and subsequently trade at a premium in the secondary market. When BFA is given an opportunity to invest in such an initial offering or “new” or “hot” issue, the supply of securities available for client accounts is often less
than the amount of securities the accounts would otherwise take. In order to allocate these investments fairly and equitably among client accounts over time, each portfolio manager or a member of his or her respective investment team will indicate
to BFA’s trading desk their level of interest in a particular offering with respect to eligible clients’ accounts for which that team is responsible. Initial public offerings of U.S. equity securities will be identified as eligible for
particular client accounts that are managed by portfolio teams who have indicated interest in the offering based on market capitalization of the issuer of the security and the investment mandate of the client account and in the case of international
equity securities, the country where the offering is taking place and the investment mandate of the client account. Generally, shares received during the initial public offering will be allocated among participating client accounts within each
investment mandate on a pro rata basis. This pro rata allocation may result in the Fund receiving less of a particular security than if pro-rating had not occurred. All
allocations of securities will be subject, where relevant, to share minimums established for accounts and compliance constraints. In situations where supply is too limited to be allocated among all accounts for which the investment is eligible,
portfolio managers may rotate such investment opportunities among one or more accounts so long as the rotation system provides for fair access for all client accounts over time. Other allocation methodologies that are considered by BFA to be fair
and equitable to clients may be used as well.
Because
different accounts may have differing investment objectives and policies, BFA may buy and sell the same securities at the same time for different clients based on the particular investment objective, guidelines and strategies of those accounts. For
example, BFA may decide that it may be entirely appropriate for a growth fund to sell a security at the same time a value fund is buying that security. To the extent that transactions on behalf of more than one client of BFA or the other Affiliates
during the same period may increase the demand for securities being purchased or the supply of securities being sold, there may be an adverse effect on price. For example, sales of a security by BlackRock on behalf of one or more of its clients may
decrease the market price of such security, adversely impacting other BlackRock clients that still hold the security. If purchases or sales of securities arise for consideration at or about the same time that would involve the Fund or other clients
or funds for which BFA or another Affiliate act as investment manager, transactions in such securities will be made, insofar as feasible, for the respective funds and clients in a manner deemed equitable to all.
In certain instances, BFA may find it efficient for purposes
of seeking to obtain best execution, to aggregate or “bunch” certain contemporaneous purchases or sale orders of its advisory accounts and advisory accounts of affiliates. In general, all contemporaneous trades for client accounts under
management by the same portfolio manager or investment team will be bunched in a single order if the trader believes the bunched trade would provide each client with an opportunity to achieve a more favorable execution at a potentially lower
execution cost. The costs associated with a bunched order will be shared pro rata among the clients in the bunched order. Generally, if an order for a particular portfolio manager or management team is filled
at several different prices through multiple trades, all accounts participating in the order will receive the average price (except in the case of certain international markets where average pricing is not permitted). While in some cases this
practice could have a detrimental effect upon the price or value of the security as far as the Fund is concerned, in other cases it could
60
be beneficial to the Fund. Transactions effected by BFA or the other
Affiliates on behalf of more than one of its clients during the same period may increase the demand for securities being purchased or the supply of securities being sold, causing an adverse effect on price. The trader will give the bunched order to
the broker-dealer that the trader has identified as being able to provide the best execution of the order. Orders for purchase or sale of securities will be placed within a reasonable amount of time of the order receipt and bunched orders will be
kept bunched only long enough to execute the order.
The
table below sets forth the brokerage commissions paid by the Fund for the fiscal years noted. Any differences in brokerage commissions paid by the Fund from year to year are due to increases or decreases in the Fund’s assets over those
periods:
| Fund
Inception Date |
Brokerage
Commissions Paid During Fiscal Year Ended April 30, 2017 |
Brokerage
Commissions Paid During Fiscal Year Ended April 30, 2016 |
Brokerage
Commissions Paid During Fiscal Year Ended April 30, 2015 | |||
| 02/23/12 | $154,052 | $109,153 | $174,411 |
The Fund did not pay any brokerage
commissions to BRIL, an affiliate of BFA, or to its affiliates during the fiscal year ended April 30, 2017.
The Fund's purchase and sale orders for securities may be
combined with those of other investment companies, clients or accounts that BlackRock manages or advises. If purchases or sales of portfolio securities of the Fund and one or more other accounts managed or advised by BlackRock are considered at or
about the same time, transactions in such securities are allocated among the Fund and the other accounts in a manner deemed equitable to all by BlackRock. In some cases, this procedure could have a detrimental effect on the price or volume of the
security as far as the Fund is concerned. However, in other cases, it is possible that the ability to participate in volume transactions and to negotiate lower transaction costs will be beneficial to the Fund. BlackRock may deal, trade and invest
for its own account in the types of securities in which the Fund may invest. BlackRock may, from time to time, effect trades on behalf of and for the account of the Fund with brokers or dealers that are affiliated with BFA, in conformity with the
1940 Act and SEC rules and regulations. Under these provisions, any commissions paid to affiliated brokers or dealers must be reasonable and fair compared to the commissions charged by other brokers or dealers in comparable transactions. The Fund
will not deal with affiliates in principal transactions unless permitted by applicable SEC rules or regulations, or by SEC exemptive order.
Portfolio turnover may vary from year to year, as well as
within a year. High turnover rates may result in comparatively greater brokerage expenses. The table below sets forth the portfolio turnover rates of the Fund for the fiscal years noted:
| Fiscal Year ended April 30, 2017 | Fiscal Year ended April 30, 2016 | ||
| 68% | 67% |
Creation or redemption
transactions, to the extent consisting of cash, may require the Fund to contemporaneously transact with broker-dealers for purchases of Deposit Securities (as defined below under Fund Deposit) or sales of Fund
Securities (as defined below under Redemption of Creation Units), as applicable. Such transactions with a particular broker-dealer may be conditioned upon the broker-dealer's agreement to transact at
guaranteed price levels in order to reduce transaction costs the Fund would otherwise incur as a consequence of settling creation or redemption baskets in cash rather than in-kind.
Following the Fund’s receipt of an order to purchase or
redeem creation or redemption baskets, to the extent such purchases or redemptions consist of a cash portion, the Fund will enter an order with a broker or dealer to purchase or sell the Deposit Securities or Fund Securities, as applicable. The
terms of such order may, depending on the timing of the transaction and certain other factors, require the broker or dealer to guarantee that the Fund will achieve execution of its order at a price at least as favorable to the Fund as the
Fund’s valuation of the Deposit Securities/Fund Securities used for purposes of calculating the NAV applied to the creation or redemption transaction giving rise to the order (the “Execution Performance Guarantee”). Such orders may
be placed with the purchasing or redeeming Authorized Participant in its capacity as a broker-dealer, with its affiliated broker-dealer or with a third-party broker-dealer. The amount payable to the Fund in respect of any Execution Performance
Guarantee will depend on the results achieved by the executing firm and will vary depending on market activity, timing and a variety of other factors.
61
To ensure that an Execution Performance Guarantee will be
honored on orders arising from creation transactions executed by an Authorized Participant or its affiliate as broker-dealer, an Authorized Participant is required to deposit an amount with the Fund (the “Execution Performance Deposit”).
If the broker-dealer executing the order achieves executions in market transactions at a price equal to or more favorable than the Fund’s valuation of the Deposit Securities, the Fund receives the benefit of the favorable executions and
returns to the Authorized Participant the Execution Performance Deposit. If, however, the broker-dealer executing the order is unable to achieve executions in market transactions at a price at least equal to the Fund’s valuation of the
securities, the Fund retains the portion of the Execution Performance Deposit equal to the full amount of the execution shortfall (including any taxes, brokerage commissions or other costs) and may require the Authorized Participant to deposit any
additional amount required to cover the full amount of the actual Execution Performance Guarantee.
To ensure that an Execution Performance Guarantee will be
honored for brokerage orders arising from redemption transactions executed by an Authorized Participant or its affiliate as broker-dealer, an Authorized Participant agrees to pay the shortfall amount (the “Execution Performance Offset”).
If the broker-dealer executing the order achieves executions in market transactions at a price equal to or more favorable than the Fund’s valuation of the Fund Securities, the Fund receives the benefit of the favorable executions and the
Authorized Participant is not called upon to honor the Execution Performance Offset. If, however, the broker-dealer is unable to achieve executions in market transactions at a price at least equal to the Fund’s valuation of the securities, the
Fund will be entitled to the portion of the Execution Performance Offset equal to the full amount of the execution shortfall (including any taxes, brokerage commissions or other costs).
The circumstances under which the Execution Performance
Guarantee will be used and the expected amount of any Execution Performance Deposit or Execution Performance Offset for the Fund will be disclosed in the procedures handbook for Authorized Participants and may change from time to time based on the
actual experience of the Fund.
Additional Information
Concerning the Company
Capital Stock. The Company currently is comprised of 55 series referred to as funds. Each series issues shares of common stock, par value $0.001 per share. The Company has authorized and issued the following funds as separate
series of capital stock: iShares Asia/Pacific Dividend ETF, iShares Core MSCI Emerging Markets ETF, iShares Currency Hedged MSCI Emerging Markets ETF, iShares Edge MSCI Min Vol EM Currency Hedged ETF, iShares Edge MSCI Min Vol Emerging Markets ETF,
iShares Edge MSCI Min Vol Global ETF, iShares Edge MSCI Multifactor Emerging Markets ETF, iShares Emerging Markets Dividend ETF, iShares Emerging Markets High Yield Bond ETF, iShares Global High Yield Corporate Bond ETF, iShares International High
Yield Bond ETF, iShares J.P. Morgan EM Corporate Bond ETF, iShares J.P. Morgan EM Local Currency Bond ETF, iShares MSCI Australia ETF, iShares MSCI Austria Capped ETF, iShares MSCI Belgium Capped ETF, iShares MSCI Brazil Capped ETF, iShares MSCI
BRIC ETF, iShares MSCI Canada ETF, iShares MSCI Chile Capped ETF, iShares MSCI Colombia Capped ETF, iShares MSCI EM ESG Optimized ETF, iShares MSCI Emerging Markets Asia ETF, iShares MSCI Emerging Markets ETF, iShares MSCI Emerging Markets ex China,
iShares MSCI Emerging Markets Small-Cap ETF, iShares MSCI Eurozone ETF, iShares MSCI France ETF, iShares MSCI Frontier 100 ETF, iShares MSCI Germany ETF, iShares MSCI Global Agriculture Producers ETF, iShares MSCI Global Energy Producers ETF,
iShares MSCI Global Gold Miners ETF, iShares MSCI Global Metals & Mining Producers ETF, iShares MSCI Global Silver Miners ETF, iShares MSCI Hong Kong ETF, iShares MSCI Israel Capped ETF, iShares MSCI Italy Capped ETF, iShares MSCI Japan ETF,
iShares MSCI Japan Small-Cap ETF, iShares MSCI Malaysia ETF, iShares MSCI Mexico Capped ETF, iShares MSCI Netherlands ETF, iShares MSCI Pacific ex Japan ETF, iShares MSCI Russia Capped ETF, iShares MSCI Singapore Capped ETF, iShares MSCI South
Africa ETF, iShares MSCI South Korea Capped ETF, iShares MSCI Spain Capped ETF, iShares MSCI Sweden Capped ETF, iShares MSCI Switzerland Capped ETF, iShares MSCI Taiwan Capped ETF, iShares MSCI Thailand Capped ETF, iShares MSCI Turkey ETF, iShares
MSCI USA Equal Weighted ETF and iShares MSCI World ETF. The Company has authorized for issuance, but is not currently offering for sale to the public, nine additional series of shares of common stock. The Board may designate additional series of
common stock and classify shares of a particular series into one or more classes of that series. The Amended and Restated Articles of Incorporation confers upon the Board the power to establish the number of shares which constitute a Creation Unit
or by resolution, restrict the redemption right to Creation Units.
Each share issued by a fund has a pro rata interest in the assets of that fund. The Company is currently authorized to issue 33.85 billion shares of common stock. The following number of shares is currently authorized for each of the funds: iShares
Asia/Pacific Dividend ETF, 500 million shares; iShares Core MSCI Emerging Markets ETF, 2.05 billion shares; iShares Currency Hedged MSCI Emerging Markets ETF, 250 million shares; iShares Edge MSCI Min Vol EM Currency Hedged ETF, 25 million
62
shares; iShares Edge MSCI Min Vol Emerging Markets ETF, 500 million shares;
iShares Edge MSCI Min Vol Global ETF, 500 million shares; iShares Edge MSCI Multifactor Emerging Markets ETF, 25 million shares; iShares Emerging Markets Dividend ETF, 500 million shares; iShares Emerging Markets High Yield Bond ETF, 500 million
shares; iShares Global High Yield Corporate Bond ETF, 500 million shares; iShares International High Yield Bond ETF, 500 million shares; iShares J.P. Morgan EM Corporate Bond ETF, 500 million shares; iShares J.P. Morgan EM Local Currency Bond ETF,
500 million shares; iShares MSCI Australia ETF, 627.8 million shares; iShares MSCI Austria Capped ETF, 100 million shares; iShares MSCI Belgium Capped ETF, 136.2 million shares; iShares MSCI Brazil Capped ETF, 500 million shares; iShares MSCI BRIC
ETF, 500 million shares; iShares MSCI Canada ETF, 340.2 million shares; iShares MSCI Chile Capped ETF, 200 million shares; iShares MSCI Colombia Capped ETF, 25 million shares; iShares MSCI EM ESG Optimized ETF, 25 million shares; iShares MSCI
Emerging Markets Asia ETF, 500 million shares; iShares MSCI Emerging Markets ETF, 2 billion shares; iShares MSCI Emerging Markets ex China ETF, 25 million shares; iShares MSCI Emerging Markets Small-Cap ETF, 500 million shares; iShares MSCI Eurozone
ETF, 1 billion shares; iShares MSCI France ETF, 340.2 million shares; iShares MSCI Frontier 100 ETF, 500 million shares; iShares MSCI Germany ETF, 482.2 million shares; iShares MSCI Global Agriculture Producers ETF, 500 million shares; iShares MSCI
Global Energy Producers ETF, 500 million shares; iShares MSCI Global Gold Miners ETF, 500 million shares; iShares MSCI Global Metals & Mining Producers ETF, 500 million shares; iShares MSCI Global Silver Miners ETF, 500 million shares; iShares
MSCI Hong Kong ETF, 375 million shares; iShares MSCI Israel Capped ETF, 500 million shares; iShares MSCI Italy Capped ETF, 295.4 million shares; iShares MSCI Japan ETF, 2.5246 billion shares; iShares MSCI Japan Small-Cap ETF, 500 million shares;
iShares MSCI Malaysia ETF, 300 million shares; iShares MSCI Mexico Capped ETF, 255 million shares; iShares MSCI Netherlands ETF, 255 million shares; iShares MSCI Pacific ex Japan ETF, 1 billion shares; iShares MSCI Russia Capped ETF, 1 billion
shares; iShares MSCI Singapore Capped ETF, 300 million shares; iShares MSCI South Africa ETF, 400 million shares; iShares MSCI South Korea Capped ETF, 200 million shares; iShares MSCI Spain Capped ETF, 127.8 million shares; iShares MSCI Sweden
Capped ETF, 63.6 million shares; iShares MSCI Switzerland Capped ETF, 318.625 million shares; iShares MSCI Taiwan Capped ETF, 900 million shares; iShares MSCI Thailand Capped ETF, 200 million shares; iShares MSCI Turkey ETF, 200 million shares;
iShares MSCI USA Equal Weighted ETF, 500 million shares; and iShares MSCI World ETF, 500 million shares. Fractional shares will not be issued. Shares have no preemptive, exchange, subscription or conversion rights and are freely transferable. Each
share is entitled to participate equally in dividends and distributions declared by the Board with respect to the relevant fund, and in the net distributable assets of such fund on liquidation. Shareholders are entitled to require the Company to
redeem Creation Units of their shares.
Each share has
one vote with respect to matters upon which a stockholder vote is required consistent with the requirements of the 1940 Act and the rules promulgated thereunder and the Maryland General Corporation Law. Stockholders have no cumulative voting rights
with respect to their shares. Shares of all funds vote together as a single class except that, if the matter being voted on affects only a particular fund or, if a matter affects a particular fund differently from other funds, that fund will vote
separately on such matter.
Under Maryland law, the
Company is not required to hold an annual meeting of stockholders unless required to do so under the 1940 Act. The policy of the Company is not to hold an annual meeting of stockholders unless required to do so under the 1940 Act. Under Maryland
law, Directors of the Company may be removed by vote of the stockholders.
Following the creation of the initial Creation Unit(s) of
shares of a fund and immediately prior to the commencement of trading in the fund’s shares, a holder of shares may be a “control person” of the fund, as defined in Rule 0-1 under the 1940 Act. The fund cannot predict the length of
time for which one or more stockholders may remain a control person of the fund.
Stockholders may make inquiries by writing to iShares, Inc.,
c/o BlackRock Investments, LLC, 1 University Square Drive, Princeton, NJ 08540.
Absent an applicable exemption or other relief from the SEC or
its staff, beneficial owners of more than 5% of the shares of a fund may be subject to the reporting provisions of Section 13 of the 1934 Act and the SEC’s rules promulgated thereunder. In addition, absent an applicable exemption or other
relief from the SEC or its staff, officers and directors of a fund and beneficial owners of 10% of the shares of the fund (“Insiders”) may be subject to the insider reporting, short-swing profit and short sale provisions of Section 16 of
the 1934 Act and the SEC’s rules promulgated thereunder. Beneficial owners and Insiders should consult with their own legal counsel concerning their obligations under Sections 13 and 16 of the 1934 Act and existing guidance provided by the SEC
staff.
63
Termination of the Company or the Fund. The Company or the Fund may be terminated by a majority vote of the Board, or the affirmative vote of a supermajority of the stockholders of the Company or the Fund entitled to vote on termination. Although the
shares are not automatically redeemable upon the occurrence of any specific event, the Company's organizational documents provide that the Board will have the unrestricted power to alter the number of shares in a Creation Unit. Therefore, in the
event of a termination of the Company or the Fund, the Board, in its sole discretion, could determine to permit the shares to be redeemable in aggregations smaller than Creation Units or to be individually redeemable. In such circumstance, the
Company or the Fund may make redemptions in-kind, for cash or for a combination of cash or securities. Further, in the event of a termination of the Company or the Fund, the Company or the Fund might elect to pay cash redemptions to all
shareholders, with an in-kind election for shareholders owning in excess of a certain stated minimum amount.
DTC as Securities Depository for Shares of the Fund. Shares of the Fund are represented by securities registered in the name of DTC or its nominee and deposited with, or on behalf of, DTC.
DTC was created in 1973 to enable electronic movement of
securities between its participants (“DTC Participants”), and NSCC was established in 1976 to provide a single settlement system for securities clearing and to serve as central counterparty
for securities trades among DTC Participants. In 1999, DTC and NSCC were consolidated within The Depository Trust & Clearing Corporation (“DTCC”) and became wholly-owned subsidiaries of DTCC. The common stock of DTCC is owned by the DTC Participants, but NYSE and FINRA, through subsidiaries, hold preferred shares in DTCC that provide them with the right to elect one member each to the DTCC board of directors. Access to the DTC system is available to entities, such as banks, brokers, dealers and trust companies, that clear through or maintain a custodial relationship with a DTC Participant, either directly or indirectly (“Indirect Participants”).
for securities trades among DTC Participants. In 1999, DTC and NSCC were consolidated within The Depository Trust & Clearing Corporation (“DTCC”) and became wholly-owned subsidiaries of DTCC. The common stock of DTCC is owned by the DTC Participants, but NYSE and FINRA, through subsidiaries, hold preferred shares in DTCC that provide them with the right to elect one member each to the DTCC board of directors. Access to the DTC system is available to entities, such as banks, brokers, dealers and trust companies, that clear through or maintain a custodial relationship with a DTC Participant, either directly or indirectly (“Indirect Participants”).
Beneficial ownership of shares is limited to DTC Participants,
Indirect Participants and persons holding interests through DTC Participants and Indirect Participants. Ownership of beneficial interests in shares (owners of such beneficial interests are referred to herein as “Beneficial Owners”) is
shown on, and the transfer of ownership is effected only through, records maintained by DTC (with respect to DTC Participants) and on the records of DTC Participants (with respect to Indirect Participants and Beneficial Owners that are not DTC
Participants). Beneficial Owners will receive from or through the DTC Participant a written confirmation relating to their purchase of shares. The laws of some jurisdictions may require that certain purchasers of securities take physical delivery of
such securities in definitive form. Such laws may impair the ability of certain investors to acquire beneficial interests in shares of the Fund.
Conveyance of all notices, statements and other communications
to Beneficial Owners is effected as follows. Pursuant to the Depositary Agreement between the Company and DTC, DTC is required to make available to the Company upon request and for a fee to be charged to the Company a listing of the shares of the
Fund held by each DTC Participant. The Company shall inquire of each such DTC Participant as to the number of Beneficial Owners holding shares, directly or indirectly, through such DTC Participant. The Company shall provide each such DTC Participant
with copies of such notice, statement or other communication, in such form, number and at such place as such DTC Participant may reasonably request, in order that such notice, statement or communication may be transmitted by such DTC Participant,
directly or indirectly, to such Beneficial Owners. In addition, the Company shall pay to each such DTC Participant a fair and reasonable amount as reimbursement for the expenses attendant to such transmittal, all subject to applicable statutory and
regulatory requirements.
Share distributions shall be
made to DTC or its nominee, Cede & Co., as the registered holder of all shares of the Company. DTC or its nominee, upon receipt of any such distributions, shall credit immediately DTC Participants’ accounts with payments in amounts
proportionate to their respective beneficial interests in shares of the Fund as shown on the records of DTC or its nominee. Payments by DTC Participants to Indirect Participants and Beneficial Owners of shares held through such DTC Participants will
be governed by standing instructions and customary practices, as is now the case with securities held for the accounts of customers in bearer form or registered in a “street name,” and will be the responsibility of such DTC
Participants.
The Company has no responsibility or
liability for any aspect of the records relating to or notices to Beneficial Owners, or payments made on account of beneficial ownership interests in such shares, or for maintaining, supervising or reviewing any records relating to such beneficial
ownership interests, or for any other aspect of the relationship between DTC and the DTC Participants or the relationship between such DTC Participants and the Indirect Participants and Beneficial Owners owning through such DTC Participants. DTC may
decide to discontinue providing its service with respect to shares of the Company at
64
any time by giving reasonable notice to the Company and discharging its
responsibilities with respect thereto under applicable law. Under such circumstances, the Company shall take action to find a replacement for DTC to perform its functions at a comparable cost.
Distribution of Shares.
In connection with the Fund's launch, the Fund was seeded through the sale of one or more Creation Units by the Fund to one or more initial investors. Initial investors participating in the seeding may be
Authorized Participants, a lead market maker or other third party investor or an affiliate of the Fund or the Fund’s adviser. Each such initial investor may sell some or all of the shares underlying the Creation Unit(s) held by them pursuant
to the registration statement for the Fund (each, a “Selling Shareholder”), which shares have been registered to permit the resale from time to time after purchase. The Fund will not receive any of the proceeds from the resale by the
Selling Shareholders of these shares.
Selling
Shareholders may sell shares owned by them directly or through broker-dealers, in accordance with applicable law, on any national securities exchange on which the shares may be listed or quoted at the time of sale, through trading systems, in the
OTC market or in transactions other than on these exchanges or systems at fixed prices, at prevailing market prices at the time of the sale, at varying prices determined at the time of sale, or at negotiated prices. These sales may be effected
through brokerage transactions, privately negotiated trades, block sales, entry into options or other derivatives transactions or through any other means authorized by applicable law. Selling Shareholders may redeem the shares held in Creation Unit
size by them through an Authorized Participant.
Any
Selling Shareholder and any broker-dealer or agents participating in the distribution of shares may be deemed to be “underwriters” within the meaning of Section 2(a)(11) of the 1933 Act, in connection with such sales.
Any Selling Shareholder and any other person participating in
such distribution will be subject to applicable provisions of the 1934 Act and the rules and regulations thereunder.
Creation and Redemption of Creation Units
General. The Company
issues and sells shares of the Fund only in Creation Units on a continuous basis through the Distributor or its agent, without a sales load, at a price based on the Fund's NAV next determined after receipt, on any Business Day (as defined
below), of an order received by the Distributor or its agent in proper form. On days when the Listing Exchange closes earlier than normal, the Fund may require orders to be placed earlier in the day. The following table sets forth the number of
shares of the Fund that constitute a Creation Unit for the Fund and the value of such Creation Unit as of May 31, 2017:
| Shares
Per Creation Unit |
Value
Per Creation Unit (U.S.$) | |
| 50,000 | $2,034,000 |
In its discretion, the Company reserves the right to increase
or decrease the number of the Fund’s shares that constitute a Creation Unit. The Board reserves the right to declare a split or a consolidation in the number of shares outstanding of the Fund, and to make a corresponding change in the number
of shares constituting a Creation Unit, in the event that the per share price in the secondary market rises (or declines) to an amount that falls outside the range deemed desirable by the Board.
A “Business Day” with respect to the Fund is any
day on which the Listing Exchange on which the Fund is listed for trading is open for business. As of the date of this SAI, the Listing Exchange observes the following holidays, as observed: New Year's Day, Martin Luther King, Jr. Day, Presidents'
Day, Good Friday, Memorial Day, Independence Day, Labor Day, Thanksgiving Day and Christmas Day.
Fund Deposit. The
consideration for purchase of Creation Units of the Fund generally consists of Deposit Securities and the Cash Component computed as described below. Together, the Deposit Securities and the Cash Component constitute the “Fund Deposit,”
which, when combined with the Fund’s portfolio securities is designed to generate performance that has a collective investment profile similar to that of the Underlying Index. The Fund Deposit represents the minimum initial and subsequent
investment amount for a Creation Unit of the Fund.
65
The “Cash Component” is an amount equal to the difference between the NAV of the shares (per Creation Unit) and the “Deposit Amount,” which is an amount equal to the market value of the Deposit Securities, and serves to compensate for any differences between the NAV per Creation Unit and the Deposit Amount. Payment of any stamp duty or other similar fees and expenses payable upon transfer of beneficial ownership of the Deposit Securities are the sole responsibility of the Authorized Participant purchasing the Creation Unit.
BFA makes available through the NSCC on each
Business Day prior to the opening of business on the Listing Exchange, the list of names and the required number of shares of each Deposit Security and the amount of the Cash Component to be included in the current Fund Deposit (based on information
as of the end of the previous Business Day for the Fund). Such Fund Deposit is applicable, subject to any adjustments as described below, to purchases of Creation Units of shares of the Fund until such time as the next-announced Fund Deposit is made
available.
The identity and number of shares of the
Deposit Securities change pursuant to changes in the composition of the Fund's portfolio and as rebalancing adjustments and corporate action events are reflected from time to time by BFA with a view to the investment objective of the Fund. The
composition of the Deposit Securities may also change in response to adjustments to the weighting or composition of the component securities constituting the Underlying Index.
The Fund reserves the right to permit or require the
substitution of a “cash in lieu” amount to be added to the Cash Component to replace any Deposit Security that may not be available in sufficient quantity for delivery or that may not be eligible for transfer through DTC or the clearing
process (as discussed below) or that the Authorized Participant is not able to trade due to a trading restriction. The Fund also reserves the right to permit or require a “cash in lieu” amount in certain circumstances, including
circumstances in which the delivery of the Deposit Security by the Authorized Participant would be restricted under applicable securities or other local laws or in certain other situations.
Cash Purchase Method.
Although the Company does not generally permit partial or full cash purchases of Creation Units of its funds, when partial or full cash purchases of Creation Units are available or specified (e.g., Creation Units of the Fund are generally offered partially for cash), they will be effected in essentially the same manner as in-kind purchases thereof. In
the case of a partial or full cash purchase, the Authorized Participant must pay the cash equivalent of the Deposit Securities it would otherwise be required to provide through an in-kind purchase, plus the same Cash Component required to be paid by
an in-kind purchaser. The Authorized Participant will also be required to pay certain transaction fees and charges for cash purchases, as described below, and, if transacting as broker with the Fund, may be required to cover certain brokerage, tax,
foreign exchange, execution and price movement costs through an Execution Performance Guarantee, as described in the Brokerage Transactions section
of this SAI.
Procedures for Creation of Creation
Units. To be eligible to place orders with the Distributor and to create a Creation Unit of the Fund, an entity must be: (i) a “Participating Party,”
i.e., a broker-dealer or other participant in the clearing process through the Continuous Net Settlement System of the NSCC (the “Clearing
Process”), a clearing agency that is registered with the SEC, or (ii) a DTC Participant, and must have executed an agreement with the Distributor, with respect to creations and redemptions of Creation Units (“Authorized Participant
Agreement”) (discussed below). A Participating Party or DTC Participant who has executed an Authorized Participant Agreement is referred to as an “Authorized Participant.” All shares of the Fund, however created, will be entered on
the records of DTC in the name of Cede & Co. for the account of a DTC Participant.
Role of the Authorized Participant. Creation Units may be purchased only by or through a DTC Participant that has entered into an Authorized Participant Agreement with the Distributor (an “Authorized Participant”). Such Authorized
Participant will agree, pursuant to the terms of such Authorized Participant Agreement and on behalf of itself or any investor on whose behalf it will act, to certain conditions, including that such Authorized Participant will make available in
advance of each purchase of shares an amount of cash sufficient to pay the Cash Component, once the net asset value of a Creation Unit is next determined after receipt of the purchase order in proper form, together with the transaction fees
described below. An Authorized Participant, acting on behalf of an investor, may require the investor to enter into an agreement with such Authorized Participant with respect to certain matters, including payment of the Cash Component. Investors who
are not Authorized Participants must make appropriate arrangements with an Authorized Participant. Investors should be aware that their particular broker may not be a DTC Participant or may not have executed an Authorized Participant Agreement and
that orders to purchase Creation Units may have to be placed by the investor's broker through an Authorized Participant. As a result, purchase orders placed through an Authorized Participant may result in additional charges to such investor. The
Company does not expect to enter into an Authorized Participant Agreement with more than a small number of DTC
66
Participants. A list of current Authorized Participants may be obtained from
the Distributor. The Distributor has adopted guidelines regarding Authorized Participants’ transactions in Creation Units that are made available to all Authorized Participants. These guidelines set forth the processes and standards for
Authorized Participants to transact with the Distributor and its agents in connection with creation and redemption transactions. In addition, the Distributor may be appointed as the proxy of the Authorized Participant and may be granted a power of
attorney under its Authorized Participant Agreement.
Purchase Orders. To
initiate an order for a Creation Unit, an Authorized Participant must submit to the Distributor or its agent an irrevocable order to purchase shares of the Fund, in proper form, generally before 4:00 p.m., Eastern time on any Business Day to
receive that day’s NAV. The Distributor or its agent will notify BFA and the custodian of such order. The custodian will then provide such information to any appropriate sub-custodian. Procedures and requirements governing the delivery of the
Fund Deposit are set forth in the procedures handbook for Authorized Participants and may change from time to time. Investors, other than Authorized Participants, are responsible for making arrangements for a creation request to be made through an
Authorized Participant. The Distributor or its agent will provide a list of current Authorized Participants upon request. Those placing orders to purchase Creation Units through an Authorized Participant should allow sufficient time to permit proper
submission of the purchase order to the Distributor or its agent by the Cutoff Time (as defined below) on such Business Day.
The Authorized Participant must also make available on or
before the contractual settlement date, by means satisfactory to the Fund, immediately available or same day funds estimated by the Fund to be sufficient to pay the Cash Component next determined after acceptance of the purchase order, together with
the applicable purchase transaction fees. Those placing orders should ascertain the deadline for cash transfers by contacting the operations department of the broker or depositary institution effectuating the transfer of the Cash Component. This
deadline is likely to be significantly earlier than the Cutoff Time of the Fund. Investors should be aware that an Authorized Participant may require orders for purchases of shares placed with it to be in the particular form required by the
individual Authorized Participant.
The Authorized
Participant is responsible for any and all expenses and costs incurred by the Fund, including any applicable cash amounts, in connection with any purchase order.
Timing of Submission of Purchase Orders. An Authorized Participant must submit an irrevocable order to purchase shares of the Fund generally before 4:00 p.m., Eastern time on any Business Day in order to receive that day's NAV. Creation Orders must be
transmitted by an Authorized Participant in the form required by the Fund to the Distributor or its agent pursuant to procedures set forth in the Authorized Participant Agreement. Economic or market disruptions or changes, or telephone or other
communication failure, may impede the ability to reach the Distributor or its agent or an Authorized Participant. Orders to create shares of the Fund that are submitted on the Business Day immediately preceding a holiday or a day (other than a
weekend) when the equity markets in the relevant non-U.S. market are closed may not be accepted. The Fund's deadline specified above for the submission of purchase orders is referred to as the Fund's “Cutoff Time.” The Distributor or its
agent, in their discretion, may permit the submission of such orders and requests by or through an Authorized Participant at any time (including on days on which the Listing Exchange is not open for business) via communication through the facilities
of the Distributor's or its agent's proprietary website maintained for this purpose. Purchase orders and redemption requests, if accepted by the Company, will be processed based on the NAV next determined after such acceptance in accordance with the
Fund's Cutoff Times as provided in the Authorized Participant Agreement and disclosed in this SAI.
Acceptance of Orders for Creation Units. Subject to the conditions that (i) an irrevocable purchase order has been submitted by the Authorized Participant (either on its own or another investor's behalf) and (ii) arrangements satisfactory to the Fund
are in place for payment of the Cash Component and any other cash amounts which may be due, the Fund will accept the order, subject to the Fund's right (and the right of the Distributor and BFA) to reject any order until acceptance, as set forth
below.
Once the Fund has accepted an order, upon
the next determination of the net asset value of the shares, the Fund will confirm the issuance of a Creation Unit, against receipt of payment, at such net asset value. The Distributor or its agent will then transmit a confirmation of acceptance to
the Authorized Participant that placed the order.
The
Fund reserves the absolute right to reject or revoke a creation order transmitted to it by the Distributor or its agent if (i) the order is not in proper form; (ii) the investor(s), upon obtaining the shares ordered, would own 80% or more of the
currently outstanding shares of the Fund; (iii) the Deposit Securities delivered do not conform to the identity and number of shares specified, as described above; (iv) acceptance of the Deposit Securities would have certain adverse tax
consequences
67
to the Fund; (v) acceptance of the Fund Deposit would, in the opinion of
counsel, be unlawful; (vi) acceptance of the Fund Deposit would, in the discretion of the Fund or BFA, have an adverse effect on the Fund or the rights of beneficial owners; or (vii) circumstances outside the control of the Fund, the Distributor or
its agent and BFA make it impracticable to process purchase orders. The Distributor or its agent shall notify a prospective purchaser of a Creation Unit and/or the Authorized Participant acting on behalf of such purchaser of its rejection of such
order. The Fund, State Street, the sub-custodian and the Distributor or its agent are under no duty, however, to give notification of any defects or irregularities in the delivery of Fund Deposits nor shall any of them incur any liability for
failure to give such notification.
Issuance of a Creation
Unit. Except as provided herein, a Creation Unit will not be issued until the transfer of good title to the Fund of the Deposit Securities and the payment of the Cash Component have been completed. When the
sub-custodian has confirmed to the custodian that the securities included in the Fund Deposit (or the cash value thereof) have been delivered to the account of the relevant sub-custodian or sub-custodians, the Distributor or its agent and BFA shall
be notified of such delivery and the Fund will issue and cause the delivery of the Creation Unit. Creation Units are currently issued on a “T+3 basis” (i.e., three Business Days after trade date). However, the Fund reserves the right to settle Creation Unit transactions on a basis other than T+3 in order to accommodate non-U.S. market holiday schedules (as discussed in
Appendix B to this SAI), to account for different treatment among non-U.S. and U.S. markets of dividend record dates and ex-dividend dates (i.e., the
last day the holder of a security can sell the security and still receive dividends payable on the security) and in certain other circumstances.
To the extent contemplated by an Authorized Participant's
agreement with the Distributor, the Fund will issue Creation Units to such Authorized Participant, notwithstanding the fact that the corresponding Fund Deposits have not been received in part or in whole, in reliance on the undertaking of the
Authorized Participant to deliver the missing Deposit Securities as soon as possible, which undertaking shall be secured by such Authorized Participant's delivery and maintenance of collateral having a value at least equal to 105% and up to 115%,
which percentage BFA may change at any time, in its sole discretion, of the value of the missing Deposit Securities in accordance with the Fund's then-effective procedures. The Company may use such cash deposit at any time to buy Deposit Securities
for the Fund. The only collateral that is acceptable to the Fund is cash in U.S. dollars. Such cash collateral must be delivered no later than the time specified by the Fund or its custodian on the contractual settlement date. The cash collateral
posted by the Authorized Participant may be invested at the risk of the Authorized Participant, and income, if any, on invested cash collateral will be paid to that Authorized Participant. Information concerning the Fund's current procedures for
collateralization of missing Deposit Securities is available from the Distributor or its agent. The Authorized Participant Agreement will permit the Fund to buy the missing Deposit Securities at any time and will subject the Authorized Participant
to liability for any shortfall between the cost to the Fund of purchasing such securities and the cash collateral including, without limitation, liability for related brokerage, borrowings and other charges.
In certain cases, Authorized Participants may create and
redeem Creation Units on the same trade date and in these instances, the Fund reserves the right to settle these transactions on a net basis or require a representation from the Authorized Participants that the creation and redemption transactions
are for separate beneficial owners. All questions as to the number of shares of each security in the Deposit Securities and the validity, form, eligibility and acceptance for deposit of any securities to be delivered shall be determined by the Fund
and the Fund's determination shall be final and binding.
Costs Associated with Creation Transactions. A standard creation transaction fee is imposed to offset the transfer, processing and other transaction costs associated with the issuance of Creation Units. The standard creation transaction fee is charged on
each Creation Unit created by an Authorized Participant on the day of the transaction. The standard creation transaction fee is generally fixed at the amount shown in the table regardless of the number of Creation Units being purchased, but may be
reduced by the Fund if transfer and processing expenses associated with the creation are anticipated to be lower than the stated fee. If a purchase consists of a cash portion, the Authorized Participant may also be required to pay an additional
transaction charge (up to the maximum amount shown below) to cover brokerage and certain other costs related to the creation transaction. Authorized Participants will also bear the costs of transferring the Deposit Securities to the Fund. Certain
fees/costs associated with creation transactions may be waived in certain circumstances. Investors who use the services of a broker or other financial intermediary to acquire Fund shares may be charged a fee for such services.
The following table sets forth the Fund's standard creation
transaction fees and maximum additional charge (as described above):
68
| Standard
Creation Transaction Fee |
Maximum
Additional Charge* | |
| $3,000 | 7.0% |
| * | As a percentage of the net asset value per Creation Unit. |
If a
purchase consists of a cash portion and the Fund places a brokerage transaction to purchase portfolio securities with the Authorized Participant or its affiliated broker-dealer, the Authorized Participant (or its affiliated broker-dealer) may be
required, in its capacity as broker-dealer with respect to that transaction, to cover certain brokerage, tax, foreign exchange, execution, and market impact costs through an Execution Performance Guarantee, as described in the Brokerage Transactions section of this SAI.
Redemption of Creation Units.
Shares of the Fund may be redeemed by Authorized Participants only in Creation Units at their NAV next determined after receipt of a redemption request in proper form by the Distributor or its agent and only
on a Business Day. The Fund will not redeem shares in amounts less than Creation Units. There can be no assurance, however, that there will be sufficient liquidity in the secondary market at any time to permit assembly of a Creation Unit. Investors
should expect to incur brokerage and other costs in connection with assembling a sufficient number of shares to constitute a Creation Unit that could be redeemed by an Authorized Participant. Beneficial owners also may sell shares in the
secondary market.
The Fund generally redeems
Creation Units partially for cash; however, the Fund reserves the right to distribute securities and other portfolio instruments in-kind as payment for Creation Units being redeemed. Please see the Cash Redemption
Method section below and the following discussion summarizing the in-kind method for further information on redeeming Creation Units of the Fund.
BFA makes available through the NSCC, prior to the opening of
business on the Listing Exchange on each Business Day, the designated portfolio of securities (including any portion of such securities for which cash may be substituted) that will be applicable (subject to possible amendment or correction) to
redemption requests received in proper form (as defined below) on that day (“Fund Securities”), and an amount of cash (the “Cash Amount,” as described below). Such Fund Securities and the corresponding Cash Amount (each
subject to possible amendment or correction) are applicable, in order to effect redemptions of Creation Units of the Fund until such time as the next announced composition of the Fund Securities and Cash Amount is made available. Fund Securities
received on redemption may not be identical to Deposit Securities that are applicable to creations of Creation Units. Procedures and requirements governing redemption transactions are set forth in the handbook for Authorized Participants and may
change from time to time.
If redemptions are not paid in
cash, the redemption proceeds for a Creation Unit generally consist of Fund Securities, plus the Cash Amount, which is an amount equal to the difference between the net asset value of the shares being redeemed, as next determined after the receipt
of a redemption request in proper form, and the value of Fund Securities, less a redemption transaction fee (as described below).
The Company may, in its sole discretion, substitute a
“cash in lieu” amount to replace any Fund Security. The Company also reserves the right to permit or require a “cash in lieu” amount in certain circumstances, including circumstances in which: (i) the delivery of a Fund
Security to the Authorized Participant would be restricted under applicable securities or other local laws; or (ii) the delivery of a Fund Security to the Authorized Participant would result in the disposition of the Fund Security by the Authorized
Participant due to restrictions under applicable securities or other local laws, or in certain other situations. The amount of cash paid out in such cases will be equivalent to the value of the substituted security listed as a Fund Security. In the
event that the Fund Securities have a value greater than the NAV of the shares, a compensating cash payment equal to the difference is required to be made by or through an Authorized Participant by the redeeming shareholder. The Fund generally
redeems Creation Units partially for cash. The Fund may, in its sole discretion, provide such redeeming Authorized Participant a portfolio of securities that differs from the exact composition of the Fund Securities, but does not differ in
NAV.
Cash Redemption Method. Although the Company does not generally permit full cash redemptions of Creation Units of its funds, when partial or full cash redemptions of Creation Units are available or specified (e.g., Creation Units of the Fund are generally redeemed partially for cash), they will be effected in essentially the same manner as in-kind redemptions thereof.
In the case of partial or full cash redemption, the Authorized Participant receives the cash equivalent of the Fund Securities and other instruments it would otherwise receive through an in-kind redemption, plus the same Cash Amount to be paid to
an
69
in-kind redeemer. The Authorized Participant will also be required to pay
certain transaction fees and charges for cash redemptions, as described below, and, if transacting as broker with the Fund, may be required to cover certain brokerage, tax, foreign exchange, execution and price movement costs through an Execution
Performance Guarantee, as described in the Brokerage Transactions section of this SAI.
Costs Associated with Redemption Transactions. A redemption transaction fee is imposed to offset transfer, processing and other transaction costs that may be incurred by the Fund. The standard redemption transaction fee is charged on each Creation Unit redeemed
by an Authorized Participant on the day of the transaction. The standard redemption transaction fee is generally fixed at the amount shown in the table regardless of the number of Creation Units being redeemed, but may be reduced by the Fund if
transfer and processing expenses associated with the redemption are anticipated to be lower than the stated fee. If a redemption consists of a cash portion, the Authorized Participant may also be required to pay an additional transaction charge (up
to the maximum amount shown below) to cover brokerage and certain other costs related to the redemption transaction. Authorized Participants will also bear the costs of transferring the Fund Securities from the Fund to their account on their order.
Certain fees/costs associated with redemption transactions may be waived in certain circumstances. Investors who use the services of a broker or other financial intermediary to dispose of Fund shares may be charged a fee for such
services.
The following table sets forth the
Fund's standard redemption transaction fees and maximum additional charge (as described above):
| Standard
Redemption Transaction Fee |
Maximum
Additional Charge* | |
| $3,000 | 2.0% |
| * | As a percentage of the net asset value per Creation Unit, inclusive of the standard redemption transaction fee. |
If a redemption consists of a cash portion and the Fund places
a brokerage transaction to sell portfolio securities with the Authorized Participant or its affiliated broker-dealer, the Authorized Participant (or its affiliated broker-dealer) may be required, in its capacity as broker-dealer with respect to that
transaction, to cover certain brokerage, tax, foreign exchange, execution, and price movement costs through an Execution Performance Guarantee, as described in the Brokerage Transactions section of this
SAI.
Placement of Redemption Orders. Redemption requests for Creation Units of the Fund must be submitted to the Distributor or its agent by or through an Authorized Participant. An Authorized Participant must submit an irrevocable request to redeem
shares of the Fund generally before 4:00 p.m., Eastern time on any Business Day in order to receive that day's NAV. On days when the Listing Exchange closes earlier than normal, the Fund may require orders to redeem Creation Units to be placed
earlier that day. Investors, other than Authorized Participants, are responsible for making arrangements for a redemption request to be made through an Authorized Participant. The Distributor or its agent will provide a list of current Authorized
Participants upon request.
The Authorized
Participant must transmit the request for redemption in the form required by the Fund to the Distributor or its agent in accordance with procedures set forth in the Authorized Participant Agreement. Investors should be aware that their particular
broker may not have executed an Authorized Participant Agreement and that, therefore, requests to redeem Creation Units may have to be placed by the investor's broker through an Authorized Participant who has executed an Authorized Participant
Agreement. At any time, only a limited number of broker-dealers will have an Authorized Participant Agreement in effect. Investors making a redemption request should be aware that such request must be in the form specified by such Authorized
Participant. Investors making a request to redeem Creation Units should allow sufficient time to permit proper submission of the request by an Authorized Participant and transfer of the shares to the Fund's transfer agent; such investors should
allow for the additional time that may be required to effect redemptions through their banks, brokers or other financial intermediaries if such intermediaries are not Authorized Participants.
A redemption request is considered to be in “proper
form” if: (i) an Authorized Participant has transferred or caused to be transferred to the Fund's transfer agent the Creation Unit redeemed through the book-entry system of DTC so as to be effective by the Listing Exchange closing time on any
Business Day on which the redemption request is submitted; (ii) a request in form satisfactory to the Fund is received by the Distributor or its agent from the Authorized Participant on behalf of
70
itself or another redeeming investor within the time periods specified above;
and (iii) all other procedures set forth in the Authorized Participant Agreement are properly followed.
Upon receiving a redemption request, the Distributor or its
agent shall notify the Fund and the Fund's transfer agent of such redemption request. The tender of an investor's shares for redemption and the distribution of the securities and/or cash included in the redemption payment made in respect of Creation
Units redeemed will be made through DTC and the relevant Authorized Participant to the Beneficial Owner thereof as recorded on the book-entry system of DTC or the DTC Participant through which such investor holds, as the case may be, or by such
other means specified by the Authorized Participant submitting the redemption request.
A redeeming Authorized Participant, whether on its own account
or acting on behalf of a Beneficial Owner, must maintain appropriate security arrangements with a qualified broker-dealer, bank or other custody providers in each jurisdiction in which any of the portfolio securities are customarily traded, to which
account such portfolio securities will be delivered.
Deliveries of redemption proceeds by the Fund generally will
be made within three Business Days (i.e., “T+3”). However, as discussed in Appendix B to this SAI, the Fund reserves the right to settle redemption transactions and deliver redemption proceeds on
another basis to accommodate non-U.S. market holiday schedules, to account for different treatment among non-U.S. and U.S. markets of dividend record dates and dividend ex-dates (i.e., the last date the holder
of a security can sell the security and still receive dividends payable on the security sold) and in certain other circumstances. Appendix B to this SAI identifies the instances, if any, where more than seven days would be needed to deliver
redemption proceeds. Pursuant to an order of the SEC, the Company will make delivery of redemption proceeds within the number of days stated in Appendix B to this SAI to be the maximum number of days necessary to deliver redemption proceeds.
If neither the Authorized Participant nor the Beneficial Owner
on whose behalf the Authorized Participant is acting has appropriate arrangements to take delivery of Fund Securities in the applicable non-U.S. jurisdiction and it is not possible to make other such arrangements, or if it is not possible to effect
deliveries of Fund Securities in such jurisdiction, the Company may in its discretion exercise its option to redeem such shares in cash, and the Beneficial Owner will be required to receive its redemption proceeds in cash. In such case, the investor
will receive a cash payment equal to the net asset value of its shares based on the NAV of the Fund next determined after the redemption request is received in proper form (minus a redemption transaction fee and additional charges specified above to
offset the Company's brokerage and other transaction costs associated with the disposition of Fund Securities). Redemptions of shares for Fund Securities will be subject to compliance with applicable U.S. federal and state securities laws and the
Fund (whether or not it otherwise permits cash redemptions) reserves the right to redeem Creation Units for cash to the extent that the Fund cannot lawfully deliver specific Fund Securities upon redemptions or cannot do so without first registering
the Fund Securities under such laws.
Although the
Company does not ordinarily permit cash redemptions of Creation Units (except that, as noted above, Creation Units of the Fund generally will be redeemed partially for cash), in the event that cash redemptions are permitted or required by the
Company, proceeds will be paid to the Authorized Participant redeeming shares as soon as practicable after the date of redemption (within seven calendar days thereafter, except for the instances listed in Appendix B to this SAI in which more than
seven calendar days would be needed).
To the extent
contemplated by an Authorized Participant's agreement with the Distributor or its agent, in the event an Authorized Participant has submitted a redemption request in proper form but is unable to transfer all or part of the Creation Unit to be
redeemed to the Fund, at or prior to 10:00 a.m., Eastern time on the Listing Exchange business day after the date of submission of such redemption request, the Distributor or its agent will accept the redemption request in reliance on the
undertaking by the Authorized Participant to deliver the missing shares as soon as possible. Such undertaking shall be secured by the Authorized Participant's delivery and maintenance of collateral consisting of cash, in U.S. dollars in immediately
available funds, having a value at least equal to 105% and up to 115%, which percentage BFA may change at any time, in its sole discretion, of the value of the missing shares. Such cash collateral must be delivered no later than the time specified
by the Fund or its custodian on the day after the date of submission of such redemption request and shall be held by State Street and marked-to-market daily. The fees of State Street and any sub-custodians in respect of the delivery, maintenance and
redelivery of the cash collateral shall be payable by the Authorized Participant. The cash collateral posted by the Authorized Participant may be invested at the risk of the Authorized Participant, and income, if any, on invested cash collateral
will be paid to that Authorized Participant. The authorized participant agreement permits the Fund to acquire shares of the Fund at any time and subjects the Authorized Participant to liability for any shortfall between the aggregate of
71
the cost to the Fund of purchasing such shares, plus the value of the Cash
Amount, and the value of the cash collateral together with liability for related brokerage and other charges.
Because the portfolio securities of the Fund may trade on
exchange(s) on days that the Listing Exchange is closed or are otherwise not Business Days for the Fund, shareholders may not be able to redeem their shares of the Fund, or purchase or sell shares of the Fund on the Listing Exchange on days when the
NAV of the Fund could be significantly affected by events in the relevant non-U.S. markets.
The right of redemption may be suspended or the date of
payment postponed with respect to the Fund: (i) for any period during which the Listing Exchange is closed (other than customary weekend and holiday closings); (ii) for any period during which trading on the Listing Exchange is suspended or
restricted; (iii) for any period during which an emergency exists as a result of which disposal of the shares of the Fund's portfolio securities or determination of its net asset value is not reasonably practicable; or (iv) in such other
circumstance as is permitted by the SEC.
Taxation on
Creations and Redemptions of Creation Units. An Authorized Participant generally will recognize either gain or loss upon the exchange of Deposit Securities for Creation Units. This gain or loss is calculated
by taking the market value of the Creation Units purchased over the Authorized Participant’s aggregate basis in the Deposit Securities exchanged therefor. However, the IRS may apply the wash sales rules to determine that any loss realized upon
the exchange of Deposit Securities for Creation Units is not currently deductible. Authorized Participants should consult their own tax advisors.
Current U.S. federal income tax laws dictate that capital gain
or loss realized from the redemption of Creation Units will generally create long-term capital gain or loss if the Authorized Participant holds the Creation Units for more than one year, or short-term capital gain or loss if the Creation Units were
held for one year or less, if the Creation Units are held as capital assets.
Taxes
The following is a summary of certain material U.S. federal
income tax considerations regarding the purchase, ownership and disposition of shares of the Fund. This summary does not address all of the potential U.S. federal income tax consequences that may be applicable to the Fund or to all categories of
investors, some of which may be subject to special tax rules. Current and prospective shareholders are urged to consult their own tax advisors with respect to the specific U.S. federal, state, local and non-U.S. tax consequences of investing in the
Fund. The summary is based on the laws and judicial and administrative interpretations thereof in effect on the date of this SAI, all of which are subject to change, possibly with retroactive effect.
Regulated Investment Company Qualifications. The Fund intends to qualify for treatment as a separate RIC under Subchapter M of the Internal Revenue Code. To qualify for treatment as a RIC, the Fund must annually distribute at least 90% of its investment
company taxable income (which includes dividends, interest and net short-term capital gains) and meet several other requirements. Among such other requirements are the following: (i) at least 90% of the Fund’s annual gross income must be
derived from dividends, interest, payments with respect to securities loans, gains from the sale or other disposition of stock or securities or non-U.S. currencies, other income (including, but not limited to, gains from options, futures or forward
contracts) derived with respect to its business of investing in such stock, securities or currencies, and net income derived from interests in qualified publicly-traded partnerships
(i.e., partnerships that are traded on an established securities market or tradable on a secondary market, other than partnerships that derive 90% of
their income from interest, dividends, capital gains and other traditionally permitted mutual fund income); and (ii) at the close of each quarter of the Fund's taxable year, (a) at least 50% of the market value of the Fund’s total assets must
be represented by cash and cash items, U.S. government securities, securities of other RICs and other securities, with such other securities limited for purposes of this calculation in respect of any one issuer to an amount not greater than 5% of
the value of the Fund’s assets and not greater than 10% of the outstanding voting securities of such issuer, and (b) not more than 25% of the value of the Fund's total assets may be invested in the securities (other than U.S. government
securities or the securities of other RICs) of any one issuer, of two or more issuers of which 20% or more of the voting stock is held by the Fund and that are engaged in the same or similar trades or businesses or related trades or businesses, or
the securities of one or more qualified publicly-traded partnerships.
The Fund may be able to cure a failure to derive 90% of its
income from the sources specified above or a failure to diversify its holdings in the manner described above by paying a tax and/or by disposing of certain assets. If, in any taxable year, the
72
Fund fails one of these tests and does not timely cure the failure, the Fund
will be taxed in the same manner as an ordinary corporation and distributions to its shareholders will not be deductible by the Fund in computing its taxable income.
Although, in general, the passive loss rules of the Internal
Revenue Code do not apply to RICs, such rules do apply to a RIC with respect to items attributable to interests in qualified publicly-traded partnerships. The Fund's investments in partnerships, including in qualified publicly-traded partnerships,
may result in the Fund being subject to state, local, or non-U.S. income, franchise or withholding tax liabilities.
Taxation of RICs. As a
RIC, the Fund will not be subject to U.S. federal income tax on the portion of its taxable investment income and capital gains that it distributes to its shareholders, provided that it satisfies a minimum distribution requirement. To satisfy the
minimum distribution requirement, the Fund must distribute to its shareholders at least the sum of (i) 90% of its “investment company taxable income” (i.e., income other than its net realized long-term capital gain over its net realized short-term capital loss), plus or minus certain adjustments, and (ii) 90% of its net tax-exempt income for the taxable year. The Fund will
be subject to income tax at regular corporate rates on any taxable income or gains that it does not distribute to its shareholders. If the Fund fails to qualify for any taxable year as a RIC or fails to meet the distribution requirement, all of its
taxable income will be subject to tax at regular corporate income tax rates without any deduction for distributions to shareholders, and such distributions generally will be taxable to shareholders as ordinary dividends to the extent of the
Fund’s current and accumulated earnings and profits. In such event, distributions to individuals should be eligible to be treated as qualified dividend income and distributions to corporate shareholders generally should be eligible for the
dividends received deduction. Although the Fund intends to distribute substantially all of its net investment income and its capital gains for each taxable year, the Fund will be subject to U.S. federal income taxation to the extent any such income
or gains are not distributed. If the Fund fails to qualify as a RIC in any year, it must pay out its earnings and profits accumulated in that year in order to qualify again as a RIC. If the Fund fails to qualify as a RIC for a period greater than
two taxable years, the Fund may be required to recognize any net built-in gains with respect to certain of its assets (i.e., the excess of the
aggregate gains, including items of income, over aggregate losses that would have been realized with respect to such assets if the Fund had been liquidated) if it qualifies as a RIC in a subsequent year.
Excise Tax. The Fund
will be subject to a 4% excise tax on certain undistributed income if it does not distribute to its shareholders in each calendar year at least 98% of its ordinary income for the calendar year plus 98.2% of its capital gain net income for the 12
months ended October 31 of such year. For this purpose, however, any ordinary income or capital gain net income retained by the Fund that is subject to corporate income tax will be considered to have been distributed by year-end. In addition, the
minimum amounts that must be distributed in any year to avoid the excise tax will be increased or decreased to reflect any underdistribution or overdistribution, as the case may be, from the previous year. The Fund intends to declare and distribute
dividends and distributions in the amounts and at the times necessary to avoid the application of this 4% excise tax.
Net Capital Loss Carryforwards. Net capital loss carryforwards may be applied against any net realized capital gains in each succeeding year, until they have been reduced to zero.
In the event that the Fund were to experience an ownership
change as defined under the Internal Revenue Code, the loss carryforwards and other favorable tax attributes of the Fund, if any, may be subject to limitation.
As of April 30, 2017, the tax year-end of the Fund, the Fund
had non-expiring capital loss carryforwards in the amount of $80,727,897 available to offset future realized capital gains.
Taxation of U.S. Shareholders.
Dividends and other distributions by the Fund are generally treated under the Internal Revenue Code as received by the shareholders at the time the dividend or distribution is made. However, any dividend or distribution declared by the Fund
in October, November or December of any calendar year and payable to shareholders of record on a specified date in such a month shall be deemed to have been received by each shareholder on December 31 of such calendar year and to have been paid by
the Fund not later than such December 31, provided such dividend is actually paid by the Fund during January of the following calendar year.
The Fund intends to distribute annually to its shareholders
substantially all of its investment company taxable income and any net realized long-term capital gains in excess of net realized short-term capital losses (including any capital loss carryovers). However, if the Fund retains for investment an
amount equal to all or a portion of its net long-term capital gains in excess of its net short-term capital losses (including any capital loss carryovers), it will be subject to a corporate tax (at a maximum rate of 35%) on the amount retained. In
that event, the Fund will designate such retained amounts as
73
undistributed capital gains in a notice to its shareholders who (a) will be
required to include in income for U.S. federal income tax purposes, as long-term capital gains, their proportionate shares of the undistributed amount, (b) will be entitled to credit their proportionate shares of the 35% tax paid by the Fund on the
undistributed amount against their U.S. federal income tax liabilities, if any, and to claim refunds to the extent their credits exceed their liabilities, if any, and (c) will be entitled to increase their tax basis, for U.S. federal income tax
purposes, in their shares by an amount equal to 65% of the amount of undistributed capital gains included in the shareholder’s income. Organizations or persons not subject to U.S. federal income tax on such capital gains will be entitled to a
refund of their pro rata share of such taxes paid by the Fund upon filing appropriate returns or claims for refund with the IRS.
Distributions of net realized long-term capital gains, if any,
that the Fund reports as capital gains dividends are taxable as long-term capital gains, whether paid in cash or in shares and regardless of how long a shareholder has held shares of the Fund. All other dividends of the Fund (including dividends
from short-term capital gains) from its current and accumulated earnings and profits (“regular dividends”) are generally subject to tax as ordinary income, subject to the discussion of qualified dividend income below. Married couples
filing jointly with income over approximately $471,000 and unmarried individuals with income over approximately $418,000, amounts adjusted annually for inflation, are subject to a 20% tax on any income in excess of those amounts that is long-term
capital gain or qualified dividend income, and generally all other long-term capital gain is taxed at 15% (0% at certain income levels). In addition, the top marginal ordinary income tax rate is 39.6% for income in excess of the above
thresholds.
If an individual receives a regular dividend
qualifying for the long-term capital gains rates and such dividend constitutes an “extraordinary dividend,” and the individual subsequently recognizes a loss on the sale or exchange of stock in respect of which the extraordinary dividend
was paid, then the loss will be long-term capital loss to the extent of such extraordinary dividend. An “extraordinary dividend” on common stock for this purpose is generally a dividend (i) in an amount greater than or equal to 10% of
the taxpayer’s tax basis (or trading value) in a share of stock, aggregating dividends with ex-dividend dates within an 85-day period, or (ii) in an amount greater than 20% of the taxpayer’s tax basis (or trading value) in a share of
stock, aggregating dividends with ex-dividend dates within a 365-day period.
Distributions in excess of the Fund’s current and
accumulated earnings and profits will, as to each shareholder, be treated as a tax-free return of capital to the extent of a shareholder’s basis in shares of the Fund, and as a capital gain thereafter (if the shareholder holds shares of the
Fund as capital assets). Distributions in excess of the Fund’s minimum distribution requirements, but not in excess of the Fund’s earnings and profits, will be taxable to shareholders and will not constitute nontaxable returns of
capital. Shareholders receiving dividends or distributions in the form of additional shares should be treated for U.S. federal income tax purposes as receiving a distribution in an amount equal to the amount of money that the shareholders receiving
cash dividends or distributions will receive and should have a cost basis in the shares received equal to such amount. Dividends paid by the Fund that are attributable to dividends received by the Fund from domestic corporations may qualify for the
federal dividends received deduction for corporations.
A
3.8% U.S. federal Medicare contribution tax is imposed on net investment income, including, but not limited to, interest, dividends, and net gain from investments, of U.S. individuals with income exceeding $200,000 (or $250,000 if married and filing
jointly) and of estates and trusts.
Investors
considering buying shares just prior to a dividend or capital gain distribution should be aware that, although the price of shares purchased at that time may reflect the amount of the forthcoming distribution, such dividend or distribution may
nevertheless be taxable to them. If the Fund is the holder of record of any security on the record date for any dividends payable with respect to such security, such dividends will be included in the Fund’s gross income not as of the date
received but as of the later of (a) the date such security became ex-dividend with respect to such dividends (i.e., the date on which a buyer of the security would not be entitled to receive the declared, but
unpaid, dividends); or (b) the date the Fund acquired such security. Accordingly, in order to satisfy its income distribution requirements, the Fund may be required to pay dividends based on anticipated earnings, and shareholders may receive
dividends in an earlier year than would otherwise be the case.
In certain situations, the Fund may, for a taxable year, defer
all or a portion of its net capital loss (or if there is no net capital loss, then any net long-term or short-term capital loss) realized after October and its late-year ordinary loss (defined as the sum of (i) the excess of post-October foreign
currency and passive foreign investment company (“PFIC”) losses over post-October foreign currency and PFIC gains and (ii) the excess of post-December ordinary losses over post-December ordinary income) until the next taxable year in
computing its investment company taxable income and net capital gain, which will
74
defer the recognition of such realized losses. Such deferrals and other rules
regarding gains and losses realized after October (or December) may affect the tax character of shareholder distributions.
Sales of Shares. Upon
the sale or exchange of shares of the Fund, a shareholder will realize a taxable gain or loss equal to the difference between the amount realized and the shareholder’s basis in shares of the Fund. A redemption of shares by the Fund will be
treated as a sale for this purpose. Such gain or loss will be treated as capital gain or loss if the shares are capital assets in the shareholder’s hands and will be long-term capital gain or loss if the shares are held for more than one year
and short-term capital gain or loss if the shares are held for one year or less. Any loss realized on a sale or exchange will be disallowed to the extent the shares disposed of are replaced, including replacement through the reinvesting of dividends
or capital gains distributions, or by an option on substantially identical shares within a 61-day period beginning 30 days before and ending 30 days after the disposition of the shares. In such a case, the basis of the shares acquired will be
increased to reflect the disallowed loss. Any loss realized by a shareholder on the sale of Fund shares held by the shareholder for six months or less will be treated for U.S. federal income tax purposes as a long-term capital loss to the extent of
any distributions or deemed distributions of long-term capital gains received by the shareholder with respect to such share. The Medicare contribution tax described above will apply to the sale of Fund shares.
If a shareholder incurs a sales charge in acquiring shares of
the Fund, disposes of those shares within 90 days and then, on or before January 31 of the following calendar year, acquires shares in a mutual fund for which the otherwise applicable sales charge is reduced by reason of a reinvestment right (e.g., an exchange privilege), the original sales charge will not be taken into account in computing gain/loss on the original shares to the extent the subsequent sales charge is reduced. Instead, the disregarded
portion of the original sales charge will be added to the tax basis of the newly acquired shares. Furthermore, the same rule also applies to a disposition of the newly acquired shares made within 90 days of the second acquisition. This provision
prevents shareholders from immediately deducting the sales charge by shifting their investments within a family of mutual funds.
Back-Up Withholding. In
certain cases, the Fund will be required to withhold at a 28% rate and remit to the U.S. Treasury such amounts withheld from any distributions paid to a shareholder who: (i) has failed to provide a correct taxpayer identification number; (ii) is
subject to back-up withholding by the IRS; (iii) has failed to certify to the Fund that such shareholder is not subject to back-up withholding; or (iv) has not certified that such shareholder is a U.S. person (including a U.S. resident alien).
Back-up withholding is not an additional tax and any amount withheld may be credited against a shareholder's U.S. federal income tax liability.
Sections 351 and 362.
The Company, on behalf of the Fund, has the right to reject an order for a purchase of shares of the Fund if the purchaser (or group of purchasers) would, upon obtaining the shares so ordered, own 80% or more
of the outstanding shares of the Fund and if, pursuant to Sections 351 and 362 of the Internal Revenue Code, the Fund would have a basis in the securities different from the market value of such securities on the date of deposit. If the Fund’s
basis in such securities on the date of deposit was less than market value on such date, the Fund, upon disposition of the securities, would recognize more taxable gain or less taxable loss than if its basis in the securities had been equal to
market value. It is not anticipated that the Company will exercise the right of rejection except in a case where the Company determines that accepting the order could result in material adverse tax consequences to the Fund or its shareholders. The
Company also has the right to require information necessary to determine beneficial share ownership for purposes of the 80% determination.
Taxation of Certain Derivatives. The Fund’s transactions in zero coupon securities, non-U.S. currencies, forward contracts, options and futures contracts (including options and futures contracts on non-U.S. currencies), to the extent
permitted, will be subject to special provisions of the Internal Revenue Code (including provisions relating to “hedging transactions” and “straddles”) that, among other consequences, may affect the character of gains and
losses realized by the Fund (i.e., may affect whether gains or losses are ordinary or capital), accelerate recognition of income to the Fund and
defer Fund losses. These rules could therefore affect the character, amount and timing of distributions to shareholders. These provisions also (a) will require the Fund to mark-to-market certain types of the positions in its portfolio (i.e., treat them as if they were closed out at the end of each year) and (b) may cause the Fund to recognize income without receiving cash with which to pay
dividends or make distributions in amounts necessary to satisfy the distribution requirements for avoiding income and excise taxes. The Fund will monitor its transactions, will make the appropriate tax elections and will make the appropriate entries
in its books and records when it acquires any zero coupon security, non-U.S. currency, forward contract, option, futures contract or hedged investment in order to mitigate the effect of these rules and prevent disqualification of the Fund as a
RIC.
75
The Fund’s investments in so-called “Section 1256
contracts,” such as regulated futures contracts, most non-U.S. currency forward contracts traded in the interbank market and options on most security indexes, are subject to special tax rules. All Section 1256 contracts held by the Fund at the
end of its taxable year are required to be marked to their market value, and any unrealized gain or loss on those positions will be included in the Fund’s income as if each position had been sold for its fair market value at the end of the
taxable year. The resulting gain or loss will be combined with any gain or loss realized by the Fund from positions in Section 1256 contracts closed during the taxable year. Provided such positions were held as capital assets and were not part of a
“hedging transaction” nor part of a “straddle,” 60% of the resulting net gain or loss will be treated as long-term capital gain or loss, and 40% of such net gain or loss will be treated as short-term capital gain or loss,
regardless of the period of time the positions were actually held by the Fund.
As a result of entering into swap contracts, the Fund may make
or receive periodic net payments. The Fund may also make or receive a payment when a swap is terminated prior to maturity through an assignment of the swap or other closing transaction. Periodic net payments will generally constitute ordinary income
or deductions, while termination of a swap will generally result in capital gain or loss (which will be a long-term capital gain or loss if the Fund has been a party to the swap for more than one year). With respect to certain types of swaps, the
Fund may be required to currently recognize income or loss with respect to future payments on such swaps or may elect under certain circumstances to mark such swaps to market annually for tax purposes as ordinary income or loss.
Qualified Dividend Income.
Distributions by the Fund of investment company taxable income (including any short-term capital gains), whether received in cash or shares, will be taxable either as ordinary income or as qualified dividend
income, which is eligible to be taxed at long-term capital gain rates to the extent the Fund receives qualified dividend income on the securities it holds and the Fund reports the distribution as qualified dividend income. Qualified dividend income
is, in general, dividend income from taxable U.S. corporations (but generally not from U.S. REITs) and certain non-U.S. corporations (e.g., non-U.S.
corporations that are not “passive foreign investment companies” and which are incorporated in a possession of the United States or in certain countries with a comprehensive tax treaty with the United States, or the stock of which is
readily tradable on an established securities market in the United States (where the dividends are paid with respect to such stock)). Under current IRS guidance, the United States has appropriate comprehensive income tax treaties with the following
countries: Australia, Austria, Bangladesh, Barbados, Belgium, Bulgaria, Canada, China (but not with Hong Kong, which is treated as a separate jurisdiction for U.S. tax purposes), Cyprus, the Czech Republic, Denmark, Egypt, Estonia, Finland, France,
Germany, Greece, Hungary, Iceland, India, Indonesia, Ireland, Israel, Italy, Jamaica, Japan, Kazakhstan, Latvia, Lithuania, Luxembourg, Malta, Mexico, Morocco, the Netherlands, New Zealand, Norway, Pakistan, the Philippines, Poland, Portugal,
Romania, Russia, the Slovak Republic, Slovenia, South Africa, South Korea, Spain, Sri Lanka, Sweden, Switzerland, Thailand, Trinidad and Tobago, Tunisia, Turkey, Ukraine, the United Kingdom, and Venezuela. Substitute payments received by the Fund
for securities lent out by the Fund will not be qualified dividend income.
A dividend from the Fund will not be treated as qualified
dividend income to the extent that: (i) the shareholder has not held the shares on which the dividend was paid for 61 days during the 121-day period that begins on the date that is 60 days before the date on which the shares become ex-dividend with
respect to such dividend or the Fund fails to satisfy those holding period requirements with respect to the securities it holds that paid the dividends distributed to the shareholder (or, in the case of certain preferred stocks, the holding
requirement of 91 days during the 181-day period beginning on the date that is 90 days before the date on which the stock becomes ex-dividend with respect to such dividend); (ii) the Fund or the shareholder is under an obligation (whether pursuant
to a short sale or otherwise) to make related payments with respect to substantially similar or related property; or (iii) the shareholder elects to treat such dividend as investment income under Section 163(d)(4)(B) of the Internal Revenue Code.
Dividends received by the Fund from a REIT or another RIC may be treated as qualified dividend income only to the extent the dividend distributions are attributable to qualified dividend income received by such REIT or other RIC. It is expected that
dividends received by the Fund from a REIT and distributed to a shareholder generally will be taxable to the shareholder as ordinary income. Distributions by the Fund of its net short-term capital gains will be taxable as ordinary income.
Corporate Dividends Received Deduction. Dividends paid by the Fund that are attributable to dividends received by the Fund from U.S. corporations may qualify for the U.S. federal dividends received deduction for corporations. A 46-day minimum holding
period during the 90-day period that begins 45 days prior to ex-dividend date (or 91-day minimum holding period during the 180 period beginning 90 days prior to ex-dividend date for certain preference dividends) during which risk of loss may not be
diminished is required for the applicable shares, at both the Fund and shareholder level, for a dividend to be eligible for the dividends received deduction. Restrictions may apply if indebtedness, including a short sale, is attributable to the
investment.
76
Excess Inclusion Income.
Under current law, the Fund serves to block unrelated business taxable income (“UBTI”) from being realized by its tax-exempt shareholders. Notwithstanding the foregoing, a tax-exempt shareholder
could realize UBTI by virtue of its investment in the Fund if shares in the Fund constitute debt-financed property in the hands of the tax-exempt shareholder within the meaning of Section 514(b) of the Internal Revenue Code. Certain types of income
received by the Fund from REITs, real estate mortgage investment conduits, taxable mortgage pools or other investments may cause the Fund to report some or all of its distributions as “excess inclusion income.” To Fund shareholders, such
excess inclusion income may: (i) constitute taxable income, as UBTI for those shareholders who would otherwise be tax-exempt such as individual retirement accounts, 401(k) accounts, Keogh plans, pension plans and certain charitable entities; (ii)
not be offset by otherwise allowable deductions for tax purposes; (iii) not be eligible for reduced U.S. withholding for non-U.S. shareholders even from tax treaty countries; and (iv) cause the Fund to be subject to tax if certain
“disqualified organizations,” as defined by the Internal Revenue Code, are Fund shareholders. If a charitable remainder annuity trust or a charitable remainder unitrust (each as defined in Section 664 of the Internal Revenue Code) has
UBTI for a taxable year, a 100% excise tax on the UBTI is imposed on the trust.
Non-U.S. Investments.
Under Section 988 of the Internal Revenue Code, gains or losses attributable to fluctuations in exchange rates between the time the Fund accrues income or receivables or expenses or other liabilities
denominated in a non-U.S. currency and the time the Fund actually collects such income or pays such liabilities are generally treated as ordinary income or ordinary loss. In general, gains (and losses) realized on debt instruments will be treated as
Section 988 gain (or loss) to the extent attributable to changes in exchange rates between the U.S. dollar and the currencies in which the instruments are denominated. Similarly, gains or losses on non-U.S. currency, non-U.S. currency forward
contracts and certain non-U.S. currency options or futures contracts denominated in non-U.S. currency, to the extent attributable to fluctuations in exchange rates between the acquisition and disposition dates, are also treated as ordinary income or
loss unless the Fund were to elect otherwise.
The Fund may
be subject to non-U.S. income taxes withheld at the source. The Fund, if permitted to do so, may elect to “pass through” to its investors the amount of non-U.S. income taxes paid by the Fund provided that the Fund held the security on
the dividend settlement date and for at least 15 additional days immediately before and/or thereafter, with the result that each investor with respect to shares of the Fund held for a minimum 16-day holding period at the time of deemed distribution
will (i) include in gross income, even though not actually received, the investor’s pro rata share of the Fund’s non-U.S. income taxes, and (ii) either deduct (in calculating U.S. taxable income,
but only for investors who itemize their deductions on their personal tax returns) or credit (in calculating U.S. federal income tax) the investor’s pro rata share of the Fund’s non-U.S. income
taxes. Withholding taxes on dividends on non-U.S. securities while such securities are lent out by the Fund are not eligible for non-U.S. tax credit pass through. Taxes not “passed through” for tax purposes will not be available to
shareholders for foreign tax credit purposes. A non-U.S. person invested in the Fund in a year that the Fund elects to “pass through” its non-U.S. taxes may be treated as receiving additional dividend income subject to U.S. withholding
tax. A non-U.S. tax credit may not exceed the investor’s U.S. federal income tax otherwise payable with respect to the investor’s non-U.S. source income. For this purpose, shareholders must treat as non-U.S. source gross income (i) their
proportionate shares of non-U.S. taxes paid by the Fund and (ii) the portion of any dividend paid by the Fund that represents income derived from non-U.S. sources; the Fund’s gain from the sale of securities will generally be treated as
U.S.-source income. Certain limitations will be imposed to the extent to which the non-U.S. tax credit may be claimed. If your Fund shares are loaned pursuant to securities lending arrangements, you may lose the ability to use any non-U.S. tax
credits passed through by the Fund or to treat Fund dividends (paid while the shares are held by the borrower) as qualified dividends. Regarding a short sale with respect to shares of the Fund, substitute payments made to the lender of such shares
may not be deductible under certain circumstances. Consult your financial intermediary or tax advisor.
Passive Foreign Investment Companies. If the Fund purchases shares in PFICs, it may be subject to U.S. federal income tax on a portion of any “excess distribution” or gain from the disposition of such shares even if such income is
distributed as a taxable dividend by the Fund to its shareholders. Additional charges in the nature of interest may be imposed on the Fund in respect of deferred taxes arising from such distributions or gains.
If the Fund were to invest in a PFIC and elect to treat the
PFIC as a “qualified electing fund” under the Internal Revenue Code, in lieu of the foregoing requirements, the Fund might be required to include in income each year a portion of the ordinary earnings and net capital gains of the
qualified electing fund, even if not distributed to the Fund, and such amounts would be subject to the 90% and excise tax distribution requirements described above. In order to make this election, the Fund would be required to obtain certain annual
information from the PFICs in which it invests, which may be difficult or impossible to obtain. Currently proposed IRS regulations, if adopted, would treat such included amounts as nonqualifying RIC income to the Fund unless such amounts were also
distributed to the Fund.
77
Alternatively, the Fund may make a mark-to-market election
that would result in the Fund being treated as if it had sold and repurchased its PFIC stock at the end of each year. In such case, the Fund would report any such gains as ordinary income and would deduct any such losses as ordinary losses to the
extent of previously recognized gains. The election must be made separately for each PFIC owned by the Fund and, once made, would be effective for all subsequent taxable years, unless revoked with the consent of the IRS. By making the election, the
Fund could potentially ameliorate the adverse tax consequences with respect to its ownership of shares in a PFIC, but in any particular year may be required to recognize income in excess of the distributions it receives from PFICs and its proceeds
from dispositions of PFIC stock. The Fund may have to distribute this “phantom” income and gain to satisfy the 90% distribution requirement and to avoid imposition of the 4% excise tax.
The Fund will make the appropriate tax elections, if possible,
and take any additional steps that are necessary to mitigate the effects of these rules.
Reporting. If a
shareholder recognizes a loss with respect to the Fund’s shares of $2 million or more for an individual shareholder or $10 million or more for a corporate shareholder, the shareholder must file with the IRS a disclosure statement on IRS Form
8886. Direct shareholders of portfolio securities are in many cases exempted from this reporting requirement, but under current guidance, shareholders of a RIC are not exempted. The fact that a loss is reportable under these regulations does not
affect the legal determination of whether the taxpayer’s treatment of the loss is proper. Shareholders should consult their tax advisors to determine the applicability of these regulations in light of their individual
circumstances.
Other Taxes. Dividends, distributions and redemption proceeds may also be subject to additional state, local and non-U.S. taxes depending on each shareholder’s particular situation.
Taxation of Non-U.S. Shareholders. Dividends paid by the Fund to non-U.S. shareholders are generally subject to withholding tax at a 30% rate or a reduced rate specified by an applicable income tax treaty to the extent derived from investment income
and short-term capital gains. Dividends paid by the Fund from net tax-exempt income or long-term capital gains are generally not subject to such withholding tax. In order to obtain a reduced rate of withholding, a non-U.S. shareholder will be
required to provide an IRS Form W-8BEN or IRS Form W-8BEN-E certifying its entitlement to benefits under a treaty. The withholding tax does not apply to regular dividends paid to a non-U.S. shareholder who provides an IRS Form W-8ECI, certifying
that the dividends are effectively connected with the non-U.S. shareholder’s conduct of a trade or business within the United States. Instead, the effectively connected dividends will be subject to regular U.S. income tax as if the non-U.S.
shareholder were a U.S. shareholder. A non-U.S. corporation receiving effectively connected dividends may also be subject to additional “branch profits tax” imposed at a rate of 30% (or lower treaty rate). A non-U.S. shareholder who
fails to provide an IRS Form W-8BEN, IRS Form W-8BEN-E or other applicable form may be subject to back-up withholding at the appropriate rate.
Properly-reported dividends are generally exempt from U.S.
federal withholding tax where they (i) are paid in respect of the Fund’s “qualified net interest income” (generally, the Fund’s U.S. source interest income, other than certain contingent interest and interest from obligations
of a corporation or partnership in which the Fund is at least a 10% shareholder, reduced by expenses that are allocable to such income) or (ii) are paid in respect of the Fund’s “qualified short-term capital gains” (generally, the
excess of the Fund’s net short-term capital gain over the Fund’s long-term capital loss for such taxable year). However, depending on its circumstances, the Fund may report all, some or none of its potentially eligible dividends as such
qualified net interest income or as qualified short-term capital gains and/or treat such dividends, in whole or in part, as ineligible for this exemption from withholding. In order to qualify for this exemption from withholding, a non-U.S.
shareholder will need to comply with applicable certification requirements relating to its non-U.S. status (including, in general, furnishing an IRS Form W-8BEN, IRS Form W-8BEN-E or substitute Form). In the case of shares held through an
intermediary, the intermediary may withhold even if the Fund reports the payment as qualified net interest income or qualified short-term capital gain. Non-U.S. shareholders should contact their intermediaries with respect to the application of
these rules to their accounts.
Distributions that the
Fund reports as “short-term capital gain dividends” or “long-term capital gain dividends” will not be treated as such to a recipient foreign shareholder if the distribution is attributable to gain received from the sale or
exchange of U.S. real property or an interest in a U.S. real property holding corporation and the Fund’s direct or indirect interests in U.S. real property exceeded certain levels. Instead, if the foreign shareholder has not owned more than 5%
of the outstanding shares of the Fund at any time during the one year period ending on the date of distribution, such distributions will be subject to 30% withholding by the Fund and will be treated as ordinary dividends to the foreign shareholder;
if the foreign
78
shareholder owned more than 5% of the outstanding shares of the Fund at any
time during the one year period ending on the date of the distribution, such distribution will be treated as real property gain subject to 35% withholding tax and could subject the foreign shareholder to U.S. filing requirements. Additionally, if
the Fund’s direct or indirect interests in U.S. real property were to exceed certain levels, a foreign shareholder realizing gains upon redemption from the Fund could be subject to the 35% withholding tax and U.S. filing requirements unless
more than 50% of the Fund’s shares were owned by U.S. persons at such time or unless the foreign person had not held more than 5% of the Fund’s outstanding shares throughout either such person’s holding period for the redeemed
shares or, if shorter, the previous five years.
The
rules laid out in the previous paragraph, other than the withholding rules, will apply notwithstanding the Fund’s participation in a wash sale transaction or its payment of a substitute dividend.
A 30% withholding tax is currently imposed on U.S.-source
dividends, interest and other income items and will be imposed on proceeds from the sale, redemption or other disposition of property producing U.S.-source dividends and interest paid after December 31, 2018 to: (i) foreign financial institutions,
including non-U.S. investment funds, unless they agree to collect and disclose to the IRS information regarding their direct and indirect U.S. account holders; and (ii) certain other foreign entities, unless they certify certain information
regarding their direct and indirect U.S. owners. To avoid withholding, foreign financial institutions will need to: (i) enter into agreements with the IRS that state that they will provide the IRS information, including the names, addresses and
taxpayer identification numbers of direct and indirect U.S. account holders; comply with due diligence procedures with respect to the identification of U.S. accounts; report to the IRS certain information with respect to U.S. accounts maintained;
agree to withhold tax on certain payments made to non-compliant foreign financial institutions or to account holders who fail to provide the required information; and determine certain other information concerning their account holders, or (ii) in
the event an intergovernmental agreement and implementing legislation are adopted, provide local revenue authorities with similar account holder information. Other foreign entities may need to report the name, address, and taxpayer identification
number of each substantial U.S. owner or provide certifications of no substantial U.S. ownership unless certain exceptions apply.
Shares of the Fund held by a non-U.S. shareholder at death
will be considered situated within the United States and subject to the U.S. estate tax.
The foregoing discussion is a summary of certain material U.S.
federal income tax considerations only and is not intended as a substitute for careful tax planning. Purchasers of shares should consult their own tax advisors as to the tax consequences of investing in such shares, including consequences under
state, local and non-U.S. tax laws. Finally, the foregoing discussion is based on applicable provisions of the Internal Revenue Code, regulations, judicial authority and administrative interpretations in effect on the date of this SAI. Changes in
applicable authority could materially affect the conclusions discussed above, and such changes often occur.
Financial Statements
The Fund's audited Financial Statements, including the
Financial Highlights, appearing in the Annual Report to Shareholders and the report therein of PricewaterhouseCoopers LLP, an independent registered public accounting firm, are hereby incorporated by reference in this SAI. The Annual Report to
Shareholders, which contains the referenced audited financial statements, is available upon request and without charge.
Miscellaneous Information
Counsel. Willkie Farr
& Gallagher LLP, located at 787 Seventh Avenue, New York, NY 10019, is counsel to the Company.
Independent Registered Public Accounting Firm. PricewaterhouseCoopers LLP, located at Three Embarcadero Center, San Francisco, CA 94111, serves as the Company's independent registered public accounting firm, audits the Fund's financial statements, and may
perform other services.
Shareholder Communications
to the Board. The Board has established a process for shareholders to communicate with the Board. Shareholders may contact the Board by mail. Correspondence should be addressed to iShares Board of Directors,
c/o BlackRock Fund Advisors, iShares Fund Administration, 400 Howard Street, San Francisco, CA 94105. Shareholder communications to the Board should include the following information: (i) the name and address of the shareholder; (ii)
the
79
number of shares owned by the shareholder; (iii) the Fund(s) of which the
shareholder owns shares; and (iv) if these shares are owned indirectly through a broker, financial intermediary or other record owner, the name of the broker, financial intermediary or other record owner. All correspondence received as set forth
above shall be reviewed by the Secretary of the Company and reported to the Board.
Investors’ Rights.
The Fund relies on the services of BFA and its other service providers, including the Distributor, administrator, custodian and transfer agent. Further information about the duties and roles of these service
providers is set out in this SAI. Investors who acquire shares of the Fund are not parties to the relevant agreement with these service providers and do not have express contractual rights against the Fund or its service providers, except certain
institutional investors that are Authorized Participants may have certain express contractual rights with respect to the Distributor under the terms of the relevant Authorized Participant Agreement. Investors may have certain legal rights under
federal or state law against the Fund or its service providers. In the event that an investor considers that it may have a claim against the Fund, or against any service provider in connection with its investment in the Fund, such investor should
consult its own legal advisor.
By contract,
Authorized Participants irrevocably submit to the non-exclusive jurisdiction of any New York State or U.S. federal court sitting in New York City over any suit, action or proceeding arising out of or relating to the Authorized Participant Agreement.
Jurisdiction over other claims, whether by investors or Authorized Participants, will turn on the facts of the particular case and the law of the jurisdiction in which the proceeding is brought.
80
Appendix A - Proxy Voting Policy and BlackRock Proxy Voting
Guidelines
BlackRock U.S. Registered Funds
iShares by BlackRock
Open-End Fund1 and ETF Proxy Voting Policy
Procedures Governing Delegation of Proxy Voting to Fund
Adviser
September 28, 2015
The Boards of Trustees/Directors (“Directors”) of
open-end funds advised by BlackRock Fund Advisors or BlackRock Advisors, LLC (“BlackRock”) (the “Funds”), have the responsibility for the oversight of voting proxies relating to portfolio securities of the Funds, and have
determined that it is in the best interests of the Funds and their shareholders to delegate that responsibility to BlackRock as part of BlackRock’s authority to manage, acquire and dispose of account assets, all as contemplated by the
Funds’ respective investment management agreements.
BlackRock has adopted guidelines and procedures (together and
as from time to time amended, the “BlackRock Proxy Voting Guidelines”) governing proxy voting by accounts managed by BlackRock.
BlackRock will cast votes on behalf of each of the Funds on
specific proxy issues in respect of securities held by each such Fund in accordance with the BlackRock Proxy Voting Guidelines.1
BlackRock will report on an annual basis to the Directors on
(1) all proxy votes that BlackRock has made on behalf of the Funds in the preceding year together with a certification from the Funds’ Chief Compliance Officer that all votes were in accordance with the BlackRock Proxy Voting Guidelines, and
(2) any changes to the BlackRock Proxy Voting Guidelines that have not previously been reported.
©2015 BlackRock
| 1 | iShares ESG 1-5 Year USD Corporate Bond ETF, iShares ESG USD Corporate Bond ETF, iShares MSCI ACWI Low Carbon Target ETF, iShares MSCI All Peru Capped ETF, iShares MSCI EAFE ESG Optimized ETF, iShares MSCI EM ESG Optimized ETF, iShares MSCI Global Impact ETF, iShares MSCI KLD 400 Social ETF, iShares MSCI USA ESG Optimized ETF and iShares MSCI USA ESG Select ETF have separate Fund Proxy Voting Policies. |
A-1
BlackRock
Global corporate governance & engagement principles
June 2014
A-2
INTRODUCTION TO BLACKROCK
BlackRock is the world’s preeminent asset management
firm and a premier provider of global investment management, risk management and advisory services to institutional and individual clients around the world. BlackRock offers a wide range of investment strategies and product structures to meet
clients’ needs, including individual and institutional separate accounts, mutual funds, closed-end funds, and other pooled investment vehicles and the industry-leading iShares exchange traded funds. Through BlackRock Solutions®, we offer risk management, strategic advisory and enterprise investment system services to a broad base of clients.
PHILOSOPHY ON CORPORATE GOVERNANCE
BlackRock’s corporate governance program is focused on
protecting and enhancing the economic value of the companies in which it invests on behalf of clients. We do this through engagement with boards and management of investee companies and, for those clients who have given us authority, through voting
at shareholder meetings.
We believe that there are
certain fundamental rights attached to share ownership. Companies and their boards should be accountable to shareholders and structured with appropriate checks and balances to ensure that they operate in shareholders’ interests. Effective
voting rights are central to the rights of ownership and there should be one vote for one share. Shareholders should have the right to elect, remove and nominate directors, approve the appointment of the auditor and to amend the corporate charter or
by-laws. Shareholders should be able to vote on matters that are material to the protection of their investment including but not limited to changes to the purpose of the business, dilution levels and pre-emptive rights, the distribution of income
and the capital structure. In order to exercise these rights effectively, we believe shareholders have the right to sufficient and timely information to be able to take an informed view of the proposals, and of the performance of the company and
management.
Our focus is on the board of directors, as
the agent of shareholders, which should set the company’s strategic aims within a framework of prudent and effective controls which enables risk to be assessed and managed. The board should provide direction and leadership to the management
and oversee management’s performance. Our starting position is to be supportive of boards in their oversight efforts on our behalf and we would generally expect to support the items of business they put to a vote at shareholder meetings. Votes
cast against or withheld from resolutions proposed by the board are a signal that we are concerned that the directors or management have either not acted in the interests of shareholders or have not responded adequately to shareholder concerns
regarding strategy or performance.
These principles set
out our approach to engaging with companies, provide guidance on our position on corporate governance and outline how our views might be reflected in our voting decisions. Corporate governance practices vary internationally and our expectations in
relation to individual companies are based on the legal and regulatory framework of each market. However, as noted above, we do believe that there are some overarching principles of corporate governance that apply globally. We assess voting matters
on a case-by-case basis and in light of each company’s unique circumstances. We are interested to understand from the company’s reporting its approach to corporate governance, particularly where it is different from the usual market
practice, and how it benefits shareholders.
BlackRock
also believes that shareholders have responsibilities in relation to monitoring and providing feedback to companies, sometimes known as stewardship. These ownership responsibilities include, in our view, engaging with management or board members on
corporate governance matters, voting proxies in the best long-term economic interests of shareholders and engaging with regulatory bodies to ensure a sound policy framework consistent with promoting long-term shareholder value creation.
Institutional shareholders also have responsibilities to their clients to have appropriate resources and oversight structures. Our own approach to oversight in relation to our corporate governance activities is set out in the section below titled
“BlackRock’s oversight of its corporate governance activities”.
CORPORATE GOVERNANCE, ENGAGEMENT AND VOTING
We recognize that accepted standards of corporate governance
differ between markets but we believe that there are sufficient common threads globally to identify an overarching set of principles. The primary objective of our corporate governance activities is the protection and enhancement of the value of our
clients’ investments in public corporations. Thus, these principles focus on practices and structures that we consider to be supportive of long-term value creation. We discuss below the principles under six key themes. In our regional and
market-specific voting guidelines we explain how these
A-3
principles inform our voting decisions in relation to specific resolutions
that may appear on the agenda of a shareholder meeting in the relevant market.
The six key themes are:
| • | Boards and directors |
| • | Auditors and audit-related issues |
| • | Capital structure, mergers, asset sales and other special transactions |
| • | Remuneration and benefits |
| • | Social, ethical and environmental issues |
| • | General corporate governance matters |
At a
minimum we would expect companies to observe the accepted corporate governance standard in their domestic market or to explain why doing so is not in the interests of shareholders. Where company reporting and disclosure is inadequate or the approach
taken is inconsistent with our view of what is in the best interests of shareholders, we typically will engage with the company and/or use our vote to encourage a change in practice. In making voting decisions, we take into account research from
proxy advisors, other internal and external research, information published by the company or provided through engagement and the views of our equity portfolio managers.
BlackRock views engagement as an important activity;
engagement provides BlackRock with the opportunity to improve our understanding of investee companies and their governance structures, so that our voting decisions may be better informed. Engagement also allows us to share our philosophy and
approach to investment and corporate governance with companies to enhance their understanding of our objectives. There are a range of approaches we may take in engaging companies depending on the nature of the issue under consideration, the company
and the market.
Boards and directors
The performance of the board is critical to the economic
success of the company and to the protection of shareholders’ interests. Board members serve as agents of shareholders in overseeing the strategic direction and operation of the company. For this reason, BlackRock focuses on directors in many
of its engagements and sees the election of directors as one of its most important responsibilities in the proxy voting context.
We expect the board of directors to promote and protect
shareholder interests by:
| • | establishing an appropriate corporate governance structure; |
| • | supporting and overseeing management in setting strategy; |
| • | ensuring the integrity of financial statements; |
| • | making decisions regarding mergers, acquisitions and disposals; |
| • | establishing appropriate executive compensation structures; and |
| • | addressing business issues including social, ethical and environmental issues when they have the potential to materially impact company reputation and performance. |
There should be clear definitions of the role of the board,
the sub-committees of the board and the senior management such that the responsibilities of each are well understood and accepted. Companies should report publicly the approach taken to governance (including in relation to board structure) and why
this approach is in the interest of shareholders. We will engage with the appropriate directors where we have concerns about the performance of the board or the company, the broad strategy of the company or the performance of individual board
members. Concerns about directors may include their role on the board of a different company where that board has performed poorly and failed to protect shareholder interests.
BlackRock believes that directors should stand for re-election
on a regular basis. We assess directors nominated for election or re-election in the context of the composition of the board as a whole. There should be detailed disclosure of the relevant credentials of the individual directors in order that
shareholders can assess the caliber of an individual nominee. We expect there to be a sufficient number of independent directors on the board to ensure the protection of the interests of all shareholders. Common impediments to independence may
include but are not limited to:
| • | current employment at the company or a subsidiary; |
A-4
| • | former employment within the past several years as an executive of the company; |
| • | providing substantial professional services to the company and/or members of the company’s management; |
| • | having had a substantial business relationship in the past three years; |
| • | having, or representing a shareholder with, a substantial shareholding in the company; |
| • | being an immediate family member of any of the aforementioned; and |
| • | interlocking directorships. |
BlackRock believes
that the operation of the board is enhanced when there is a clearly independent, senior non-executive director to lead it. Where the chairman is also the CEO or is otherwise not independent the company should have an independent lead director. The
role of this director is to enhance the effectiveness of the independent members of the board through shaping the agenda, ensuring adequate information is provided to the board and encouraging independent participation in board deliberations. The
lead independent board director should be available to shareholders if they have concerns that they wish to discuss.
To ensure that the board remains effective, regular reviews of
board performance should be carried out and assessments made of gaps in skills or experience amongst the members. BlackRock believes it is beneficial for new directors to be brought onto the board periodically to refresh the group’s thinking
and to ensure both continuity and adequate succession planning. In identifying potential candidates, boards should take into consideration the diversity of experience and expertise of the current directors and how that might be augmented by incoming
directors. We believe that directors are in the best position to assess the optimal size for the board, but we would be concerned if a board seemed too small to have an appropriate balance of directors or too large to be effective.
There are matters for which the board has responsibility that
may involve a conflict of interest for executives or for affiliated directors. BlackRock believes that shareholders’ interests are best served when the independent members of the board form a sub-committee to deal with such matters. In many
markets, these sub-committees of the board specialize in audit, director nominations and compensation matters. An ad hoc committee might also be formed to decide on a special transaction, particularly one with a related party.
Auditors and audit-related issues
BlackRock recognizes the critical importance of financial
statements which should provide a complete and accurate picture of a company’s financial condition. We will hold the members of the audit committee or equivalent responsible for overseeing the management of the audit function. We take
particular note of cases involving significant financial restatements or ad hoc notifications of material financial weakness.
The integrity of financial statements depends on the auditor
being free of any impediments to being an effective check on management. To that end, we believe it is important that auditors are, and are seen to be, independent. Where the audit firm provides services to the company in addition to the audit, the
fees earned should be disclosed and explained. Audit committees should also have in place a procedure for assuring annually the independence of the auditor.
Capital structure, mergers, asset sales and other special
transactions
The capital structure of a company is
critical to its owners, the shareholders, as it impacts the value of their investment and the priority of their interest in the company relative to that of other equity or debt investors. Pre-emption rights are a key protection for shareholders
against the dilution of their interests.
In assessing
mergers, asset sales or other special transactions, BlackRock’s primary consideration is the long-term economic interests of shareholders. Boards proposing a transaction need to clearly explain the economic and strategic rationale behind it.
We will review a proposed transaction to determine the degree to which it enhances long-term shareholder value. We would prefer that proposed transactions have the unanimous support of the board and have been negotiated at arm’s length. We may
seek reassurance from the board that executive and/or board members’ financial interests in a given transaction have not affected their ability to place shareholders’ interests before their own. Where the transaction involves related
parties, we would expect the recommendation to support it to come from the independent directors and would prefer only non-conflicted shareholders to vote on the proposal.
A-5
BlackRock believes that shareholders have a right to dispose
of company shares in the open market without unnecessary restriction. In our view, corporate mechanisms designed to limit shareholders’ ability to sell their shares are contrary to basic property rights. Such mechanisms can serve to protect
and entrench interests other than those of the shareholders. We believe that shareholders are broadly capable of making decisions in their own best interests. We would expect any so-called ‘shareholder rights plans’ being proposed by a
board to be subject to shareholder approval on introduction and periodically thereafter for continuation.
Remuneration and benefits
BlackRock expects a company’s board of directors to put
in place a compensation structure that incentivizes and rewards executives appropriately and is aligned with shareholder interests, particularly long-term shareholder returns. We would expect the compensation committee to take into account the
specific circumstances of the company and the key individuals the board is trying to incentivize. We encourage companies to ensure that their compensation packages incorporate appropriate and challenging performance conditions consistent with
corporate strategy and market practice. We use third party research, in addition to our own analysis, to evaluate existing and proposed compensation structures. We hold members of the compensation committee or equivalent accountable for poor
compensation practices or structures.
BlackRock believes
that there should be a clear link between variable pay and company performance as reflected in returns to shareholders. We are not supportive of one-off or special bonuses unrelated to company or individual performance. We support incentive plans
that pay out rewards earned over multiple and extended time periods. We believe consideration should be given to building claw back provisions into incentive plans such that executives would be required to repay rewards where they were not justified
by actual performance. Compensation committees should guard against contractual arrangements that would entitle executives to material compensation for early termination of their contract. Finally, pension contributions should be reasonable in light
of market practice.
Outside directors should be
compensated in a manner that does not risk compromising their independence or aligning their interests too closely with those of the management, whom they are charged with overseeing.
Social, ethical, and environmental issues
Our fiduciary duty to clients is to protect and enhance their
economic interest in the companies in which we invest on their behalf. It is within this context that we undertake our corporate governance activities. We believe that well-managed companies will deal effectively with the social, ethical and
environmental (“SEE”) aspects of their businesses.
BlackRock expects companies to identify and report on the
material, business-specific SEE risks and opportunities and to explain how these are managed. This explanation should make clear how the approach taken by the company best serves the interests of shareholders and protects and enhances the long-term
economic value of the company. The key performance indicators in relation to SEE matters should also be disclosed and performance against them discussed, along with any peer group benchmarking and verification processes in place. This helps
shareholders assess how well management is dealing with the SEE aspects of the business. Any global standards adopted should also be disclosed and discussed in this context.
We may vote against the election of directors where we have
concerns that a company might not be dealing with SEE issues appropriately. Sometimes we may reflect such concerns by supporting a shareholder proposal on the issue, where there seems to be either a significant potential threat or realized harm to
shareholders’ interests caused by poor management of SEE matters. In deciding our course of action, we will assess whether the company has already taken sufficient steps to address the concern and whether there is a clear and material economic
disadvantage to the company if the issue is not addressed.
More commonly, given that these are often not voting issues,
we will engage directly with the board or management. The trigger for engagement on a particular SEE concern is our assessment that there is potential for material economic ramifications for shareholders.
We do not see it as our role to make social, ethical or
political judgments on behalf of clients. We expect investee companies to comply, at a minimum, with the laws and regulations of the jurisdictions in which they operate. They should explain how they manage situations where such laws or regulations
are contradictory or ambiguous.
A-6
General corporate governance matters
BlackRock believes that shareholders have a right to timely
and detailed information on the financial performance and viability of the companies in which they invest. In addition, companies should also publish information on the governance structures in place and the rights of shareholders to influence
these. The reporting and disclosure provided by companies helps shareholders assess whether the economic interests of shareholders have been protected and the quality of the board’s oversight of management. BlackRock believes shareholders
should have the right to vote on key corporate governance matters, including on changes to governance mechanisms, to submit proposals to the shareholders’ meeting and to call special meetings of shareholders.
BLACKROCK’S OVERSIGHT OF ITS CORPORATE GOVERNANCE
ACTIVITIES
Oversight
BlackRock holds itself to a very high standard in its
corporate governance activities, including in relation to executing proxy votes. This function is executed by a team of dedicated BlackRock employees without sales responsibilities (the “Corporate Governance Group”), and which is
considered an investment function. BlackRock maintains three regional oversight committees (“Corporate Governance Committees”) for the Americas, Europe, the Middle East and Africa (EMEA) and Asia-Pacific, consisting of senior BlackRock
investment professionals. All of the regional Corporate Governance Committees report to a Global Corporate Governance Oversight Committee, which is a risk-focused committee composed of senior representatives of the active and index equity investment
businesses, the Deputy General Counsel, the Global Executive Committee member to whom the Corporate Governance Group reports and the head of the Corporate Governance Group. The Corporate Governance Committees review and approve amendments to their
respective proxy voting guidelines (“Guidelines”) and grant authority to the Global Head of Corporate Governance (“Global Head”), a dedicated BlackRock employee without sales responsibilities, to vote in accordance with the
Guidelines. The Global Head leads the Corporate Governance Group to carry out engagement, voting and vote operations in a manner consistent with the relevant Corporate Governance Committee’s mandate. The Corporate Governance Group engages
companies in conjunction with the portfolio managers in discussions of significant governance issues, conducts research on corporate governance issues and participates in industry discussions to keep abreast of the field of corporate governance. The
Corporate Governance Group, or vendors overseen by the Corporate Governance Group, also monitor upcoming proxy votes, execute proxy votes and maintain records of votes cast. The Corporate Governance Group may refer complicated or particularly
controversial matters or discussions to the appropriate investors and/or regional Corporate Governance Committees for their review, discussion and guidance prior to making a voting decision.
BlackRock’s Equity Policy Oversight Committee (EPOC) is
informed of certain aspects of the work of the Global Corporate Governance Oversight Committee and the Corporate Governance Group.
Vote execution
BlackRock carefully considers proxies submitted to funds and
other fiduciary accounts (“Funds”) for which it has voting authority. BlackRock votes (or refrains from voting) proxies for each Fund for which it has voting authority based on BlackRock’s evaluation of the best long-term economic
interests of shareholders, in the exercise of its independent business judgment, and without regard to the relationship of the issuer of the proxy (or any dissident shareholder) to the Fund, the Fund’s affiliates (if any), BlackRock or
BlackRock’s affiliates.
When exercising voting
rights, BlackRock will normally vote on specific proxy issues in accordance with its Guidelines for the relevant market. The Guidelines are reviewed regularly and are amended consistent with changes in the local market practice, as developments in
corporate governance occur, or as otherwise deemed advisable by BlackRock’s Corporate Governance Committees. The Corporate Governance Committees may, in the exercise of their business judgment, conclude that the Guidelines do not cover the
specific matter upon which a proxy vote is requested or that an exception to the Guidelines would be in the best long-term economic interests of BlackRock’s clients.
In the uncommon circumstance of there being a vote with
respect to fixed-income securities or the securities of privately held issuers the decision generally will be made by a Fund’s portfolio managers and/or the Corporate Governance Group based on their assessment of the particular transactions or
other matters at issue.
In certain markets, proxy voting
involves logistical issues which can affect BlackRock’s ability to vote such proxies, as well as the desirability of voting such proxies. These issues include but are not limited to: (i) untimely notice of shareholder
A-7
meetings; (ii) restrictions on a foreigner’s ability to exercise votes;
(iii) requirements to vote proxies in person; (iv) “share- blocking” (requirements that investors who exercise their voting rights surrender the right to dispose of their holdings for some specified period in proximity to the shareholder
meeting); (v) potential difficulties in translating the proxy; and (vi) requirements to provide local agents with unrestricted powers of attorney to facilitate voting instructions. We are not supportive of impediments to the exercise of voting
rights such as shareblocking or overly burdensome administrative requirements.
As a consequence, BlackRock votes proxies in these markets
only on a “best-efforts” basis. In addition, the Corporate Governance Committees may determine that it is generally in the best interests of BlackRock clients not to vote proxies of companies in certain countries if the committee
determines that the costs (including but not limited to opportunity costs associated with shareblocking constraints) associated with exercising a vote are expected to outweigh the benefit the client would derive by voting on the issuer’s
proposal.
While it is expected that BlackRock, as a
fiduciary, will generally seek to vote proxies over which BlackRock exercises voting authority in a uniform manner for all BlackRock clients, the relevant Corporate Governance Committee, in conjunction with the portfolio manager of an account, may
determine that the specific circumstances of such an account require that such account’s proxies be voted differently due to such account’s investment objective or other factors that differentiate it from other accounts. In addition,
BlackRock believes portfolio managers may from time to time legitimately reach differing but equally valid views, as fiduciaries for their funds and the client assets in those Funds, on how best to maximize economic value in respect of a particular
investment. Accordingly, portfolio managers retain full discretion to vote the shares in the Funds they manage based on their analysis of the economic impact of a particular ballot item.
Conflicts management
BlackRock maintains policies and procedures that are designed
to prevent undue influence on BlackRock’s proxy voting activity that might stem from any relationship between the issuer of a proxy (or any dissident shareholder) and BlackRock, BlackRock’s affiliates, a Fund or a Fund’s
affiliates. Some of the steps BlackRock has taken to prevent conflicts include, but are not limited to:
| • | BlackRock has adopted a proxy voting oversight structure whereby the Corporate Governance Committees oversee the voting decisions and other activities of the Corporate Governance Group, and particularly its activities with respect to voting in the relevant region of each Corporate Governance Committee’s jurisdiction. |
| • | The Corporate Governance Committees have adopted Guidelines for each region, which set forth the firm’s views with respect to certain corporate governance and other issues that typically arise in the proxy voting context. The Corporate Governance Committees receive periodic reports regarding the specific votes cast by the Corporate Governance Group and regular updates on material process issues, procedural changes and other matters of concern to the Corporate Governance Committees. |
| • | BlackRock’s Global Corporate Governance Oversight Committee oversees the Global Head, the Corporate Governance Group and the Corporate Governance Committees. The Global Corporate Governance Oversight Committee conducts a review, at least annually, of the proxy voting process to ensure compliance with BlackRock’s risk policies and procedures. |
| • | BlackRock maintains a reporting structure that separates the Global Head and Corporate Governance Group from employees with sales responsibilities. In addition, BlackRock maintains procedures intended to ensure that all engagements with corporate issuers or dissident shareholders are managed consistently and without regard to BlackRock’s relationship with the issuer of the proxy or dissident shareholder. Within the normal course of business, the Global Head or Corporate Governance Group may engage directly with BlackRock clients, and with employees with sales responsibilities, in discussions regarding general corporate governance policy matters, and to otherwise ensure that proxy-related client service levels are met. The Global Head or Corporate Governance Group does not discuss any specific voting matter with a client prior to the disclosure of the vote decision to all applicable clients after the shareholder meeting has taken place, except if the client is acting in the capacity as issuer of the proxy or dissident shareholder and is engaging through the established procedures independent of the client relationship. |
| • | In certain instances, BlackRock may determine to engage an independent fiduciary to vote proxies as a further safeguard to avoid potential conflicts of interest or as otherwise required by applicable law. The independent fiduciary may either vote such proxies or provide BlackRock with instructions as to how to vote such proxies. In the latter case, BlackRock votes the proxy in accordance with the independent fiduciary’s determination. Use of an independent fiduciary has been |
A-8
| adopted for voting the proxies related to any company that is affiliated with BlackRock or any company that includes BlackRock employees on its board of directors. |
With regard to the relationship between securities lending and
proxy voting, BlackRock’s approach is driven by our clients’ economic interests. The evaluation of the economic desirability of recalling loans involves balancing the revenue producing value of loans against the likely economic value of
casting votes. Based on our evaluation of this relationship, we believe that generally the likely economic value of casting most votes is less than the securities lending income, either because the votes will not have significant economic
consequences or because the outcome of the vote would not be affected by BlackRock recalling loaned securities in order to ensure they are voted. Periodically, BlackRock analyzes the process and benefits of voting proxies for securities on loan, and
will consider whether any modification of its proxy voting policies or procedures is necessary in light of future conditions. In addition, BlackRock may in its discretion determine that the value of voting outweighs the cost of recalling shares, and
thus recall shares to vote in that instance.
Voting
guidelines
The issue-specific voting Guidelines
published for each region/country in which we vote are intended to summarize BlackRock’s general philosophy and approach to issues that may commonly arise in the proxy voting context in each market where we invest. These Guidelines are not
intended to be exhaustive. BlackRock applies the Guidelines on a case-by-case basis, in the context of the individual circumstances of each company and the specific issue under review.
As such, these Guidelines do not provide a guide to how
BlackRock will vote in every instance. Rather, they share our view about corporate governance issues generally, and provide insight into how we typically approach issues that commonly arise on corporate ballots.
Reporting
We report our proxy voting activity directly to clients and
publicly as required. In addition, we publish for clients a more detailed discussion of our corporate governance activities, including engagement with companies and with other relevant parties.
A-9
Appendix B - Regular Holidays and Redemptions
Regular Holidays. For
every occurrence of one or more intervening holidays in the applicable non-U.S. market that are not holidays observed in the U.S. equity market, the redemption settlement cycle may be extended by the number of such intervening holidays. In addition
to holidays, other unforeseeable closings in a non-U.S. market due to emergencies and delivery cycles for transferring securities to redeeming investors may also prevent the Company from delivering securities within the normal settlement
period.
The securities delivery cycles
currently practicable for transferring portfolio securities to redeeming investors, coupled with non-U.S. market holiday schedules, will require a delivery process longer than seven calendar days, in certain circumstances. The holidays
applicable to the Fund during such periods are listed below, as are instances where more than seven days will be needed to deliver redemption proceeds. Although certain holidays may occur on different dates in subsequent years, the number of days
required to deliver redemption proceeds in any given year is not expected to exceed the maximum number of days listed below for the Fund. The proclamation of new holidays, the treatment by market participants of certain days as “informal
holidays” (e.g., days on which no or limited securities transactions occur, as a result of substantially shortened trading hours), the elimination of existing holidays, or changes in
local securities delivery practices, could affect the information set forth herein in the future.
In calendar year 2017 (the only year for which holidays are
known at the time of filing of this SAI), the dates of regular holidays affecting the relevant securities markets in which the Fund invests are as follows (please note that these holiday schedules are subject to potential changes in the relevant
securities markets):
2017
B-1
Redemptions
The longest redemption cycle for a Fund is a function of the longest redemption cycle among the countries and regions whose securities comprise the Funds. In calendar year 2017 (the only year for which holidays are known at the time of this
SAI filing), the dates of regular holidays affecting the following securities markets present the worst-case redemption cycles* for a Fund as follows:
| 2017 | ||||||
| Country | Trade
Date |
Settlement
Date |
Number
of Days to Settle | |||
| Brazil | 02/22/17 | 03/02/17 | 8 | |||
B-2
| 2017 | ||||||
| Country | Trade
Date |
Settlement
Date |
Number
of Days to Settle | |||
| 02/23/17 | 03/03/17 | 8 | ||||
| 02/24/17 | 03/06/17 | 11 | ||||
| China | 01/24/17 | 02/03/17 | 10 | |||
| 01/25/17 | 02/06/17 | 12 | ||||
| 01/26/17 | 02/07/17 | 12 | ||||
| 09/27/17 | 10/09/17 | 12 | ||||
| 09/28/17 | 10/10/17 | 12 | ||||
| 09/29/17 | 10/11/17 | 12 | ||||
| Indonesia | 06/21/17 | 07/03/17 | 12 | |||
| 06/22/17 | 07/04/17 | 12 | ||||
| 06/23/17 | 07/05/17 | 12 | ||||
| South Africa | 03/14/17 | 03/22/17 | 8 | |||
| 03/15/17 | 03/23/17 | 8 | ||||
| 03/16/17 | 03/24/17 | 8 | ||||
| 03/17/17 | 03/27/17 | 10 | ||||
| 03/20/17 | 03/28/17 | 8 | ||||
| 04/07/17 | 04/18/17 | 11 | ||||
| 04/10/17 | 04/19/17 | 9 | ||||
| 04/11/17 | 04/20/17 | 9 | ||||
| 04/12/17 | 04/21/17 | 9 | ||||
| 04/13/17 | 04/24/17 | 11 | ||||
| 04/20/17 | 04/28/17 | 8 | ||||
| 04/21/17 | 05/02/17 | 11 | ||||
| 04/24/17 | 05/03/17 | 9 | ||||
| 04/25/17 | 05/04/17 | 9 | ||||
| 04/26/17 | 05/05/17 | 9 | ||||
| 04/28/17 | 05/08/17 | 10 | ||||
| 06/09/17 | 06/19/17 | 10 | ||||
| 06/12/17 | 06/20/17 | 8 | ||||
| 06/13/17 | 06/21/17 | 8 | ||||
| 06/14/17 | 06/22/17 | 8 | ||||
| 06/15/17 | 06/23/17 | 8 | ||||
| 08/02/17 | 08/10/17 | 8 | ||||
| 08/03/17 | 08/11/17 | 8 | ||||
| 08/04/17 | 08/14/17 | 10 | ||||
| 08/07/17 | 08/15/17 | 8 | ||||
| 08/08/17 | 08/16/17 | 8 | ||||
| 09/18/17 | 09/26/17 | 8 | ||||
| 09/19/17 | 09/27/17 | 8 | ||||
| 09/20/17 | 09/28/17 | 8 | ||||
| 09/21/17 | 09/29/17 | 8 | ||||
| 09/22/17 | 10/02/17 | 10 | ||||
| 12/18/17 | 12/27/17 | 9 | ||||
| 12/19/17 | 12/28/17 | 9 | ||||
| 12/20/17 | 12/29/17 | 9 | ||||
| 12/21/17 | 01/03/18 | 13 | ||||
| 12/22/17 | 01/04/18 | 13 | ||||
B-3
| 2017 | ||||||
| Country | Trade
Date |
Settlement
Date |
Number
of Days to Settle | |||
| Taiwan | 01/23/17 | 02/02/17 | 10 | |||
| 01/24/17 | 02/03/17 | 10 | ||||
| Turkey | 08/28/17 | 09/05/17 | 8 | |||
| 08/29/17 | 09/06/17 | 8 | ||||
| * | These worst-case redemption cycles are based on information regarding regular holidays, which may be out of date. Based on changes in holidays, longer (worse) redemption cycles are possible. |
B-4
IS-SAI-DVYE-0418