| 2016 Prospectus |
 |
| ► | iShares MSCI Canada ETF | EWC | NYSE ARCA |
|
|
S-1 |
|
|
1 |
|
|
2 |
|
|
11 |
|
|
12 |
|
|
12 |
|
|
16 |
|
|
25 |
|
|
26 |
|
|
27 |
|
|
27 |
|
|
29 |
| Ticker: EWC | Stock Exchange: NYSE Arca |
| Annual
Fund Operating Expenses (ongoing expenses that you pay each year as a percentage of the value of your investments) | ||||||
| Management
Fees |
Distribution
and Service (12b-1) Fees |
Other
Expenses |
Total
Annual Fund Operating Expenses | |||
| 0.48% | None | None | 0.48% | |||
| 1 Year | 3 Years | 5 Years | 10 Years | |||
| $49 | $154 | $269 | $604 |
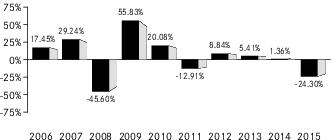
| 1 | The Fund’s year-to-date return as of September 30, 2016 was 20.51%. |
| One Year | Five Years | Ten Years | |||
| (Inception Date: 3/12/1996) | |||||
| Return Before Taxes | -24.30% | -5.18% | 1.71% | ||
| Return After Taxes on Distributions1 | -24.46% | -5.28% | 1.68% | ||
| Return After Taxes on Distributions and Sale of Fund Shares1 | -13.15% | -3.39% | 1.81% | ||
| MSCI Canada Index (Index returns do not reflect deductions for fees, expenses, or taxes)2 | -24.16% | -4.99% | 1.94% | ||
| MSCI Canada Custom Capped Index (Index returns do not reflect deductions for fees, expenses, or taxes)2 | N/A | N/A | N/A |
| 1 | After-tax returns in the table above are calculated using the historical highest individual U.S. federal marginal income tax rates and do not reflect the impact of state or local taxes. Actual after-tax returns depend on an investor’s tax situation and may differ from those shown, and after-tax returns shown are not relevant to tax-exempt investors or investors who hold shares through tax-deferred arrangements, such as 401(k) plans or individual retirement accounts (“IRAs”). Fund returns after taxes on distributions and sales of Fund shares are calculated assuming that an investor has sufficient capital gains of the same character from other investments to offset any capital losses from the sale of Fund shares. As a result, Fund returns after taxes on distributions and sales of Fund shares may exceed Fund returns before taxes and/or returns after taxes on distributions. |
| 2 | On September 1, 2017, the Fund's Underlying Index changed from the MSCI Canada Index to the MSCI Canada Custom Capped Index. The inception date of the MSCI Canada Custom Capped Index was May 12, 2017. |
| ■ | Lower levels of liquidity and market efficiency; |
| ■ | Greater securities price volatility; |
| ■ | Exchange rate fluctuations and exchange controls; |
| ■ | Less availability of public information about issuers; |
| ■ | Limitations on foreign ownership of securities; |
| ■ | Imposition of withholding or other taxes; |
| ■ | Imposition of restrictions on the expatriation of the funds or other assets of the Fund; |
| ■ | Higher transaction and custody costs and delays in settlement procedures; |
| ■ | Difficulties in enforcing contractual obligations; |
| ■ | Lower levels of regulation of the securities markets; |
| ■ | Weaker accounting, disclosure and reporting requirements; and |
| ■ | Legal principles relating to corporate governance, directors’ fiduciary duties and liabilities and stockholders’ rights in markets in which the Fund invests may differ and/or may not be as extensive or protective as those that apply in the United States. |
| Approximate
Value of a Creation Unit |
Creation
Unit Size |
Standard
Creation/ Redemption Transaction Fee |
Maximum
Additional Charge for Creations* |
Maximum
Additional Charge for Redemptions* | ||||
| $2,561,000 | 100,000 | $1,900 | 3.0% | 2.0% |
| * | As a percentage of the net asset value per Creation Unit, inclusive, in the case of redemptions, of the standard redemption transaction fee. |
(For a share outstanding throughout each period)
| Year
ended Aug. 31, 2016 |
Year
ended Aug. 31, 2015 |
Year
ended Aug. 31, 2014 |
Year
ended Aug. 31, 2013 |
Year
ended Aug. 31, 2012 | |||||
| Net asset value, beginning of year | $ 24.02 | $ 32.93 | $ 27.34 | $ 27.52 | $ 29.89 | ||||
| Income from investment operations: | |||||||||
| Net investment incomea | 0.51 | 0.54 | 0.59 | 0.60 | 0.53 | ||||
| Net realized and unrealized gain (loss)b | 1.29 | (8.85) | 5.62 | (0.10) | (2.33) | ||||
| Total from investment operations | 1.80 | (8.31) | 6.21 | 0.50 | (1.80) | ||||
| Less distributions from: | |||||||||
| Net investment income | (0.49) | (0.60) | (0.62) | (0.68) | (0.57) | ||||
| Total distributions | (0.49) | (0.60) | (0.62) | (0.68) | (0.57) | ||||
| Net asset value, end of year | $ 25.33 | $ 24.02 | $ 32.93 | $ 27.34 | $ 27.52 | ||||
| Total return | 7.73% | (25.48)% | 23.00% | 1.84% | (5.87)% | ||||
| Ratios/Supplemental data: | |||||||||
| Net assets, end of year (000s) | $3,097,794 | $1,931,454 | $3,786,906 | $3,428,223 | $4,254,544 | ||||
| Ratio of expenses to average net assets | 0.48% | 0.48% | 0.48% | 0.51% | 0.53% | ||||
| Ratio of net investment income to average net assets | 2.18% | 1.92% | 1.97% | 2.12% | 1.94% | ||||
| Portfolio turnover ratec | 4% | 5% | 6% | 7% | 5% |
| a | Based on average shares outstanding throughout each period. |
| b | The amounts reported for a share outstanding may not accord with the change in aggregate gains and losses in securities for the fiscal period due to the timing of capital share transactions in relation to the fluctuating market values of the Fund’s underlying securities. |
| c | Portfolio turnover rates exclude portfolio securities received or delivered as a result of processing capital share transactions in Creation Units. |
| Premium/Discount Range | Number of Days | Percentage of Total Days | ||
| Greater than 1.5% and Less than 2.0% | 2 | 0.45% | ||
| Greater than 1.0% and Less than 1.5% | 3 | 0.68 | ||
| Greater than 0.5% and Less than 1.0% | 19 | 4.31 | ||
| Between 0.5% and -0.5% | 400 | 90.70 | ||
| Less than -0.5% and Greater than -1.0% | 16 | 3.63 | ||
| Less than -1.0% and Greater than -1.5% | 1 | 0.23 | ||
| 441 | 100.00% |
| Average Annual Total Returns | Cumulative Total Returns | ||||||
| NAV | MARKET | INDEX* | NAV | MARKET | INDEX* | ||
| 1 Year | 7.73% | 6.62% | 7.88% | 7.73% | 6.62% | 7.88% | |
| 5 Years | (1.09)% | (1.07)% | (0.93)% | (5.34)% | (5.23)% | (4.55)% | |
| 10 Years | 2.23% | 2.18% | 2.44% | 24.68% | 24.12% | 27.32% | |
| * | Index performance reflects the performance of the MSCI Canada Index. Effective September 1, 2017, the Fund’s Underlying Index was changed to the MSCI Canada Custom Capped Index. |
| Call: | 1-800-iShares
or 1-800-474-2737 (toll free) Monday through Friday, 8:30 a.m. to 6:30 p.m. (Eastern time) |
| Email: | iSharesETFs@blackrock.com |
| Write: | c/o
BlackRock Investments, LLC 1 University Square Drive, Princeton, NJ 08540 |


| 2016 Prospectus |
|
| ► | iShares MSCI Netherlands ETF | EWN | NYSE ARCA |
|
|
S-1 |
|
|
1 |
|
|
2 |
|
|
11 |
|
|
12 |
|
|
12 |
|
|
16 |
|
|
25 |
|
|
26 |
|
|
27 |
|
|
27 |
|
|
29 |
| Ticker: EWN | Stock Exchange: NYSE Arca |
| Annual
Fund Operating Expenses (ongoing expenses that you pay each year as a percentage of the value of your investments) | ||||||
| Management
Fees |
Distribution
and Service (12b-1) Fees |
Other
Expenses |
Total
Annual Fund Operating Expenses | |||
| 0.48% | None | None | 0.48% | |||
| 1 Year | 3 Years | 5 Years | 10 Years | |||
| $49 | $154 | $269 | $604 |
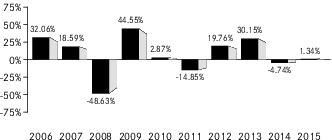
| 1 | The Fund’s year-to-date return as of September 30, 2016 was 6.19%. |
| One Year | Five Years | Ten Years | |||
| (Inception Date: 3/12/1996) | |||||
| Return Before Taxes | 1.34% | 5.08% | 4.36% | ||
| Return After Taxes on Distributions1 | 1.18% | 4.97% | 4.31% | ||
| Return After Taxes on Distributions and Sale of Fund Shares1 | 1.43% | 4.33% | 3.96% | ||
| MSCI Netherlands IMI (Index returns do not reflect deductions for fees, expenses, or taxes)2 | 1.71% | 5.32% | 4.71% | ||
| MSCI Netherlands IMI 25/50 Index (Index returns do not reflect deductions for fees, expenses, or taxes)2 | N/A | N/A | N/A |
| 1 | After-tax returns in the table above are calculated using the historical highest individual U.S. federal marginal income tax rates and do not reflect the impact of state or local taxes. Actual after-tax returns depend on an investor’s tax situation and may differ from those shown, and after-tax returns shown are not relevant to tax-exempt investors or investors who hold shares through tax-deferred arrangements, such as 401(k) plans or individual retirement accounts (“IRAs”). Fund returns after taxes on distributions and sales of Fund shares are calculated assuming that an investor has sufficient capital gains of the same character from other investments to offset any capital losses from the sale of Fund shares. As a result, Fund returns after taxes on distributions and sales of Fund shares may exceed Fund returns before taxes and/or returns after taxes on distributions. |
| 2 | Index returns through January 31, 2008 reflect the performance of the MSCI Netherlands Index. Index returns beginning on February 1, 2008 reflect the performance of the MSCI Netherlands IMI, which, effective as of February 1, 2008, replaced the MSCI Netherlands Index as the Underlying Index of the Fund. On September 1, 2017, the Fund's Underlying Index changed from MSCI Netherlands IMI to MSCI Netherlands IMI 25/50 Index. The inception date of the MSCI Netherlands IMI 25/50 Index was July 20, 2016. |
| ■ | Lower levels of liquidity and market efficiency; |
| ■ | Greater securities price volatility; |
| ■ | Exchange rate fluctuations and exchange controls; |
| ■ | Less availability of public information about issuers; |
| ■ | Limitations on foreign ownership of securities; |
| ■ | Imposition of withholding or other taxes; |
| ■ | Imposition of restrictions on the expatriation of the funds or other assets of the Fund; |
| ■ | Higher transaction and custody costs and delays in settlement procedures; |
| ■ | Difficulties in enforcing contractual obligations; |
| ■ | Lower levels of regulation of the securities markets; |
| ■ | Weaker accounting, disclosure and reporting requirements; and |
| ■ | Legal principles relating to corporate governance, directors’ fiduciary duties and liabilities and stockholders’ rights in markets in which the Fund invests may differ and/or may not be as extensive or protective as those that apply in the United States. |
| Approximate
Value of a Creation Unit |
Creation
Unit Size |
Standard
Creation/ Redemption Transaction Fee |
Maximum
Additional Charge for Creations* |
Maximum
Additional Charge for Redemptions* | ||||
| $1,253,500 | 50,000 | $1,000 | 3.0% | 2.0% |
| * | As a percentage of the net asset value per Creation Unit, inclusive, in the case of redemptions, of the standard redemption transaction fee. |
(For a share outstanding throughout each period)
| Year
ended Aug. 31, 2016 |
Year
ended Aug. 31, 2015 |
Year
ended Aug. 31, 2014 |
Year
ended Aug. 31, 2013 |
Year
ended Aug. 31, 2012 | |||||
| Net asset value, beginning of year | $ 24.48 | $ 24.64 | $ 22.52 | $ 18.23 | $ 18.45 | ||||
| Income from investment operations: | |||||||||
| Net investment incomea | 0.71 | 0.50 | 0.45 | 0.44 | 0.39 | ||||
| Net realized and unrealized gain (loss)b | 0.08 | (0.27) | 2.22 | 4.19 | (0.08) | ||||
| Total from investment operations | 0.79 | 0.23 | 2.67 | 4.63 | 0.31 | ||||
| Less distributions from: | |||||||||
| Net investment income | (0.49) | (0.39) | (0.55) | (0.34) | (0.53) | ||||
| Total distributions | (0.49) | (0.39) | (0.55) | (0.34) | (0.53) | ||||
| Net asset value, end of year | $ 24.78 | $ 24.48 | $ 24.64 | $ 22.52 | $ 18.23 | ||||
| Total return | 3.32% | 0.87% | 11.80% | 25.57% | 1.96% | ||||
| Ratios/Supplemental data: | |||||||||
| Net assets, end of year (000s) | $184,587 | $176,282 | $165,092 | $253,390 | $78,397 | ||||
| Ratio of expenses to average net assets | 0.48% | 0.48% | 0.48% | 0.50% | 0.53% | ||||
| Ratio of net investment income to average net assets | 2.97% | 2.01% | 1.78% | 2.09% | 2.21% | ||||
| Portfolio turnover ratec | 24% | 6% | 7% | 11% | 10% |
| a | Based on average shares outstanding throughout each period. |
| b | The amounts reported for a share outstanding may not accord with the change in aggregate gains and losses in securities for the fiscal period due to the timing of capital share transactions in relation to the fluctuating market values of the Fund’s underlying securities. |
| c | Portfolio turnover rates exclude portfolio securities received or delivered as a result of processing capital share transactions in Creation Units. |
| Premium/Discount Range | Number of Days | Percentage of Total Days | ||
| Greater than 2.0% | 1 | 0.23% | ||
| Greater than 1.5% and Less than 2.0% | 2 | 0.45 | ||
| Greater than 1.0% and Less than 1.5% | 12 | 2.72 | ||
| Greater than 0.5% and Less than 1.0% | 55 | 12.47 | ||
| Between 0.5% and -0.5% | 334 | 75.74 | ||
| Less than -0.5% and Greater than -1.0% | 31 | 7.03 | ||
| Less than -1.0% and Greater than -1.5% | 3 | 0.68 | ||
| Less than -1.5% and Greater than -2.0% | 2 | 0.45 | ||
| Less than -2.0% and Greater than -2.5% | 1 | 0.23 | ||
| 441 | 100.00% |
| Average Annual Total Returns | Cumulative Total Returns | ||||||
| NAV | MARKET | INDEX* | NAV | MARKET | INDEX* | ||
| 1 Year | 3.32% | 3.57% | 3.77% | 3.32% | 3.57% | 3.77% | |
| 5 Years | 8.33% | 8.39% | 8.61% | 49.17% | 49.59% | 51.12% | |
| 10 Years | 3.02% | 3.01% | 3.45% | 34.62% | 34.55% | 40.37% | |
| * | Index performance through January 31, 2008 reflects the performance of the MSCI Netherlands Index. Index performance beginning on February 1, 2008 reflects the performance of the MSCI Netherlands IMI, which effective as of February 1, 2008, replaced the MSCI Netherlands Index as the underlying index of the Fund. Effective September 1, 2017, the Fund’s Underlying Index was changed to the MSCI Netherlands IMI 25/50 Index. |
| Call: | 1-800-iShares
or 1-800-474-2737 (toll free) Monday through Friday, 8:30 a.m. to 6:30 p.m. (Eastern time) |
| Email: | iSharesETFs@blackrock.com |
| Write: | c/o
BlackRock Investments, LLC 1 University Square Drive, Princeton, NJ 08540 |

| 2016 Prospectus |
|
| ► | iShares MSCI South Africa ETF | EZA | NYSE ARCA |
|
|
S-1 |
|
|
1 |
|
|
2 |
|
|
13 |
|
|
16 |
|
|
16 |
|
|
19 |
|
|
28 |
|
|
29 |
|
|
30 |
|
|
30 |
|
|
32 |
| Ticker: EZA | Stock Exchange: NYSE Arca |
| Annual
Fund Operating Expenses (ongoing expenses that you pay each year as a percentage of the value of your investments) | ||||||
| Management
Fees |
Distribution
and Service (12b-1) Fees |
Other
Expenses |
Total
Annual Fund Operating Expenses | |||
| 0.64% | None | None | 0.64% | |||
| 1 Year | 3 Years | 5 Years | 10 Years | |||
| $65 | $205 | $357 | $798 |

| 1 | The Fund’s year-to-date return as of September 30, 2016 was 22.26%. |
| One Year | Five Years | Ten Years | |||
| (Inception Date: 2/3/2003) | |||||
| Return Before Taxes | -25.92% | -6.23% | 2.61% | ||
| Return After Taxes on Distributions1 | -26.12% | -6.52% | 2.20% | ||
| Return After Taxes on Distributions and Sale of Fund Shares1 | -13.93% | -4.17% | 2.41% | ||
| MSCI South Africa Index (Index returns do not reflect deductions for fees, expenses, or taxes)2 | -25.45% | -5.65% | 3.43% | ||
| MSCI South Africa 25/50 Index (Index returns do not reflect deductions for fees, expenses, or taxes)2 | N/A | N/A | N/A |
| 1 | After-tax returns in the table above are calculated using the historical highest individual U.S. federal marginal income tax rates and do not reflect the impact of state or local taxes. Actual after-tax returns depend on an investor’s tax situation and may differ from those shown, and after-tax returns shown are not relevant to tax-exempt investors or investors who hold shares through tax-deferred arrangements, such as 401(k) plans or individual retirement accounts (“IRAs”). Fund returns after taxes on distributions and sales of Fund shares are calculated assuming that an investor has sufficient capital gains of the same character from other investments to offset any capital losses from the sale of Fund shares. As a result, Fund returns after taxes on distributions and sales of Fund shares may exceed Fund returns before taxes and/or returns after taxes on distributions. |
| 2 | On September 1, 2017, the Fund's Underlying Index changed from the MSCI South Africa Index to the MSCI South Africa 25/50 Index. The inception date of the MSCI South Africa 25/50 Index was May 12, 2017. |
| ■ | Lower levels of liquidity and market efficiency; |
| ■ | Greater securities price volatility; |
| ■ | Exchange rate fluctuations and exchange controls; |
| ■ | Less availability of public information about issuers; |
| ■ | Limitations on foreign ownership of securities; |
| ■ | Imposition of withholding or other taxes; |
| ■ | Imposition of restrictions on the expatriation of the funds or other assets of the Fund; |
| ■ | Higher transaction and custody costs and delays in settlement procedures; |
| ■ | Difficulties in enforcing contractual obligations; |
| ■ | Lower levels of regulation of the securities markets; |
| ■ | Weaker accounting, disclosure and reporting requirements; and |
| ■ | Legal principles relating to corporate governance, directors’ fiduciary duties and liabilities and stockholders’ rights in markets in which the Fund invests may differ and/or may not be as extensive or protective as those that apply in the United States. |
| Approximate
Value of a Creation Unit |
Creation
Unit Size |
Standard
Creation/ Redemption Transaction Fee |
Maximum
Additional Charge for Creations* |
Maximum
Additional Charge for Redemptions* | ||||
| $5,580,000 | 100,000 | $1,200 | 3.0% | 2.0% |
| * | As a percentage of the net asset value per Creation Unit, inclusive, in the case of redemptions, of the standard redemption transaction fee. |
(For a share outstanding throughout each period)
| Year
ended Aug. 31, 2016 |
Year
ended Aug. 31, 2015 |
Year
ended Aug. 31, 2014 |
Year
ended Aug. 31, 2013 |
Year
ended Aug. 31, 2012 | |||||
| Net asset value, beginning of year | $ 57.44 | $ 70.77 | $ 58.88 | $ 64.65 | $ 69.06 | ||||
| Income from investment operations: | |||||||||
| Net investment incomea | 1.02 | 1.28 | 1.57 | 1.32 | 2.10 | ||||
| Net realized and unrealized gain (loss)b | (3.24) | (13.24) | 11.86 | (5.31) | (4.41) | ||||
| Total from investment operations | (2.22) | (11.96) | 13.43 | (3.99) | (2.31) | ||||
| Less distributions from: | |||||||||
| Net investment income | (2.44) | (1.37) | (1.54) | (1.78) | (2.10) | ||||
| Total distributions | (2.44) | (1.37) | (1.54) | (1.78) | (2.10) | ||||
| Net asset value, end of year | $ 52.78 | $ 57.44 | $ 70.77 | $ 58.88 | $ 64.65 | ||||
| Total return | (3.64)% | (17.07)% | 23.13% | (6.35)% | (3.17)% | ||||
| Ratios/Supplemental data: | |||||||||
| Net assets, end of year (000s) | $406,443 | $373,346 | $587,396 | $547,569 | $471,922 | ||||
| Ratio of expenses to average net assets | 0.64% | 0.62% | 0.62% | 0.61% | 0.61% | ||||
| Ratio of net investment income to average net assets | 1.96% | 1.94% | 2.40% | 2.08% | 3.26% | ||||
| Portfolio turnover ratec | 12% | 9% | 6% | 5% | 4% |
| a | Based on average shares outstanding throughout each period. |
| b | The amounts reported for a share outstanding may not accord with the change in aggregate gains and losses in securities for the fiscal period due to the timing of capital share transactions in relation to the fluctuating market values of the Fund’s underlying securities. |
| c | Portfolio turnover rates exclude portfolio securities received or delivered as a result of processing capital share transactions in Creation Units. |
| Premium/Discount Range | Number of Days | Percentage of Total Days | ||
| Greater than 4.0% | 2 | 0.45% | ||
| Greater than 3.5% and Less than 4.0% | 1 | 0.23 | ||
| Greater than 3.0% and Less than 3.5% | 1 | 0.23 | ||
| Greater than 2.5% and Less than 3.0% | 2 | 0.45 | ||
| Greater than 2.0% and Less than 2.5% | 7 | 1.59 | ||
| Greater than 1.5% and Less than 2.0% | 12 | 2.72 | ||
| Greater than 1.0% and Less than 1.5% | 36 | 8.16 | ||
| Greater than 0.5% and Less than 1.0% | 76 | 17.23 | ||
| Between 0.5% and -0.5% | 197 | 44.68 | ||
| Less than -0.5% and Greater than -1.0% | 61 | 13.83 | ||
| Less than -1.0% and Greater than -1.5% | 28 | 6.35 | ||
| Less than -1.5% and Greater than -2.0% | 8 | 1.81 | ||
| Less than -2.0% and Greater than -2.5% | 4 | 0.91 | ||
| Less than -2.5% and Greater than -3.0% | 3 | 0.68 | ||
| Less than -3.0% | 3 | 0.68 | ||
| 441 | 100.00% |
| Average Annual Total Returns | Cumulative Total Returns | ||||||
| NAV | MARKET | INDEX* | NAV | MARKET | INDEX* | ||
| 1 Year | (3.64)% | (4.17)% | (3.03)% | (3.64)% | (4.17)% | (3.03)% | |
| 5 Years | (2.25)% | (2.29)% | (1.62)% | (10.78)% | (10.94)% | (7.85)% | |
| 10 Years | 4.15% | 3.99% | 4.97% | 50.15% | 47.88% | 62.38% | |
| * | Index performance reflects the performance of the MSCI South Africa Index. Effective September 1, 2017, the Fund’s Underlying Index was changed to the MSCI South Africa 25/50 Index. |
| Call: | 1-800-iShares
or 1-800-474-2737 (toll free) Monday through Friday, 8:30 a.m. to 6:30 p.m. (Eastern time) |
| Email: | iSharesETFs@blackrock.com |
| Write: | c/o
BlackRock Investments, LLC 1 University Square Drive, Princeton, NJ 08540 |

(as revised September 1, 2017)
| Funds | Ticker | Listing Exchange | ||
| iShares MSCI Australia ETF | EWA | NYSE Arca | ||
| iShares MSCI Austria Capped ETF | EWO | NYSE Arca | ||
| iShares MSCI Belgium Capped ETF | EWK | NYSE Arca | ||
| iShares MSCI Canada ETF | EWC | NYSE Arca | ||
| iShares MSCI Eurozone ETF | EZU | BATS | ||
| iShares MSCI France ETF | EWQ | NYSE Arca | ||
| iShares MSCI Germany ETF | EWG | NYSE Arca | ||
| iShares MSCI Global Gold Miners ETF | RING | NYSE Arca | ||
| iShares MSCI Global Silver Miners ETF | SLVP | NYSE Arca | ||
| iShares MSCI Hong Kong ETF | EWH | NYSE Arca | ||
| iShares MSCI Israel Capped ETF | EIS | NYSE Arca | ||
| iShares MSCI Italy Capped ETF | EWI | NYSE Arca | ||
| iShares MSCI Japan ETF | EWJ | NYSE Arca | ||
| iShares MSCI Japan Small-Cap ETF | SCJ | NYSE Arca | ||
| iShares MSCI Mexico Capped ETF | EWW | NYSE Arca | ||
| iShares MSCI Netherlands ETF | EWN | NYSE Arca | ||
| iShares MSCI Pacific ex Japan ETF | EPP | NYSE Arca | ||
| iShares MSCI Russia Capped ETF | ERUS | NYSE Arca | ||
| iShares MSCI Singapore Capped ETF | EWS | NYSE Arca | ||
| iShares MSCI South Africa ETF | EZA | NYSE Arca | ||
| iShares MSCI Spain Capped ETF | EWP | NYSE Arca | ||
| iShares MSCI Sweden Capped ETF | EWD | NYSE Arca | ||
| iShares MSCI Switzerland Capped ETF | EWL | NYSE Arca | ||
| iShares MSCI Thailand Capped ETF | THD | NYSE Arca | ||
| iShares MSCI Turkey ETF | TUR | NYSE Arca | ||
| iShares MSCI USA Equal Weighted ETF | EUSA | NYSE Arca | ||
| iShares MSCI World ETF | URTH | NYSE Arca |
| • | iShares MSCI Australia ETF |
| • | iShares MSCI Austria Capped ETF |
| • | iShares MSCI Belgium Capped ETF |
| • | iShares MSCI Canada ETF |
| • | iShares MSCI Eurozone ETF |
| • | iShares MSCI France ETF |
| • | iShares MSCI Germany ETF |
| • | iShares MSCI Global Gold Miners ETF |
| • | iShares MSCI Global Silver Miners ETF |
| • | iShares MSCI Hong Kong ETF |
| • | iShares MSCI Israel Capped ETF |
| • | iShares MSCI Italy Capped ETF |
| • | iShares MSCI Japan ETF |
| • | iShares MSCI Japan Small-Cap ETF |
| • | iShares MSCI Mexico Capped ETF |
| • | iShares MSCI Netherlands ETF |
| • | iShares MSCI Pacific ex Japan ETF |
| • | iShares MSCI Russia Capped ETF1 |
| • | iShares MSCI Singapore Capped ETF2 |
| • | iShares MSCI South Africa ETF |
| • | iShares MSCI Spain Capped ETF |
| • | iShares MSCI Sweden Capped ETF3 |
| • | iShares MSCI Switzerland Capped ETF |
| • | iShares MSCI Thailand Capped ETF |
| • | iShares MSCI Turkey ETF |
| • | iShares MSCI USA Equal Weighted ETF |
| • | iShares MSCI World ETF |
| 1 | The iShares MSCI Russia Capped ETF previously operated as a series of iShares MSCI Russia Capped ETF, Inc. (the “Predecessor Fund”). Before the Fund commenced operations, all of the assets and liabilities of the Predecessor Fund were transferred to the Fund in a reorganization (the “Reorganization”), which was tax-free for U.S. federal income tax purposes. The Reorganization occurred on January 26, 2015. As a result of the Reorganization, the Fund assumed the performance and accounting history of the Predecessor Fund. A portion of the financial and performance information included in this SAI is that of the Predecessor Fund. |
| 2 | On December 1, 2016, the name of the Fund changed from iShares MSCI Singapore ETF to iShares MSCI Singapore Capped ETF, and the Fund’s Underlying Index changed from MSCI Singapore Index to MSCI Singapore 25/50 Index. |
| 3 | On December 1, 2016, the name of the Fund changed from iShares MSCI Sweden ETF to iShares MSCI Sweden Capped ETF, and the Fund’s Underlying Index changed from MSCI Sweden Index to MSCI Sweden 25/50 Index. |
| Diversified Funds | Non-Diversified Funds | |
| iShares MSCI Canada ETF | iShares MSCI Australia ETF | |
| iShares MSCI Eurozone ETF | iShares MSCI Austria Capped ETF | |
| iShares MSCI Japan ETF | iShares MSCI Belgium Capped ETF | |
| iShares MSCI Japan Small-Cap ETF | iShares MSCI France ETF | |
| iShares MSCI Pacific ex Japan ETF | iShares MSCI Germany ETF | |
| iShares MSCI USA Equal Weighted ETF | iShares MSCI Global Gold Miners ETF | |
| iShares MSCI World ETF | iShares MSCI Global Silver Miners ETF | |
| iShares MSCI Hong Kong ETF | ||
| iShares MSCI Israel Capped ETF | ||
| iShares MSCI Italy Capped ETF | ||
| iShares MSCI Mexico Capped ETF | ||
| iShares MSCI Netherlands ETF | ||
| iShares MSCI Russia Capped ETF | ||
| iShares MSCI Singapore Capped ETF | ||
| iShares MSCI South Africa ETF | ||
| iShares MSCI Spain Capped ETF | ||
| iShares MSCI Sweden Capped ETF | ||
| iShares MSCI Switzerland Capped ETF | ||
| iShares MSCI Thailand Capped ETF | ||
| iShares MSCI Turkey ETF |
| • | MSCI Global Standard Indexes cover all investable large- and mid-cap securities by including approximately 85% of each market's free float-adjusted market capitalization. |
| • | MSCI Global Small Cap Indexes provide coverage to all companies with a market capitalization below that of the companies in the MSCI Global Standard Indexes by including above and beyond the coverage of the MSCI Global Standard Indexes. |
| • | Achieving global size integrity by ensuring that companies of comparable and relevant sizes are included in a given size segment across all markets in a composite index; and |
| • | Achieving consistent market coverage by ensuring that each market's size segment is represented in its proportional weight in the composite universe. |
| • | Semi-Annual Index Reviews (“SAIRs”), conducted on a fixed semi-annual timetable that systematically reassess the various dimensions of the equity universe for all markets; |
| • | Quarterly Index Reviews (“QIRs”), aimed at promptly reflecting other significant market events; and |
| • | Ongoing event-related changes, such as mergers, acquisitions, spin-offs, bankruptcies, reorganizations and other similar corporate events, which generally are implemented in the indexes as they occur. |
| 1. | Lend any funds or other assets except through the purchase of all or a portion of an issue of securities or obligations of the type in which it is permitted to invest (including participation interests in such securities or obligations) and except that a Fund may lend its portfolio securities in an amount not to exceed 33 1/3% of the value of its total assets; |
| 2. | Issue senior securities or borrow money, except borrowings from banks for temporary or emergency purposes in an amount up to 33 1/3% of the value of the Fund’s total assets (including the amount borrowed), valued at the lesser of cost or market, less liabilities (not including the amount borrowed) valued at the time the borrowing is made, and the Fund will not purchase securities while borrowings in excess of 5% of the Fund’s total assets are outstanding, provided, that for purposes of this restriction, short-term credits necessary for the clearance of transactions are not considered borrowings; |
| 3. | Pledge, hypothecate, mortgage or otherwise encumber its assets, except to secure permitted borrowings. (The deposit of underlying securities and other assets in escrow and collateral arrangements with respect to initial or variation margin for currency transactions and futures contracts will not be deemed to be pledges of the Fund’s assets); |
| 4. | Purchase a security (other than obligations of the U.S. government, its agencies or instrumentalities) if as a result 25% or more of its total assets would be invested in a single issuer. (This restriction applies to the iShares MSCI Singapore Capped ETF only); |
| 5. | Purchase, hold or deal in real estate, or oil, gas or mineral interests or leases, but a Fund may purchase and sell securities that are issued by companies that invest or deal in such assets; |
| 6. | Act as an underwriter of securities of other issuers, except to the extent the Fund may be deemed an underwriter in connection with the sale of securities in its portfolio; |
| 7. | Purchase securities on margin, except for such short-term credits as are necessary for the clearance of transactions, except that a Fund may make margin deposits in connection with transactions in currencies, options, futures and options on futures; |
| 8. | Sell securities short; or |
| 9. | Invest in commodities or commodity contracts, except that a Fund may buy and sell currencies and forward contracts with respect thereto, and may transact in futures contracts on securities, stock indices and currencies and options on such futures contracts and make margin deposits in connection with such contracts. |
| 1. | Make loans, except as permitted under the 1940 Act, as interpreted, modified or otherwise permitted by regulatory authority having jurisdiction, from time to time; |
| 2. | Issue any senior security, except as permitted under the 1940 Act, as interpreted, modified or otherwise permitted by regulatory authority having jurisdiction, from time to time; |
| 3. | Pledge, hypothecate, mortgage or otherwise encumber its assets, except to secure permitted borrowings. (The deposit of underlying securities and other assets in escrow and collateral arrangements with respect to initial or variation margin for currency transactions and futures contracts will not be deemed to be pledges of the Fund’s assets); |
| 4. | Purchase, hold or deal in real estate, or oil, gas or mineral interests or leases, but a Fund may purchase and sell securities that are issued by companies that invest or deal in such assets; |
| 5. | Act as an underwriter of securities of other issuers, except to the extent the Fund may be deemed an underwriter in connection with the sale of securities in its portfolio; |
| 6. | Purchase securities on margin, except for such short-term credits as are necessary for the clearance of transactions, except that a Fund may make margin deposits in connection with transactions in currencies, options, futures and options on futures; |
| 7. | Sell securities short; or |
| 8. | Invest in commodities or commodity contracts, except that a Fund may buy and sell currencies and forward contracts with respect thereto, and may transact in futures contracts on securities, stock indices and currencies and options on such futures contracts and make margin deposits in connection with such contracts. |
| 1. | Concentrate its investments (i.e., invest 25% or more of its total assets in the securities of a particular industry or group of industries), except that a Fund will concentrate to approximately the same extent that its Underlying Index concentrates in the securities of such particular industry or group of industries. For purposes of this limitation, securities of the U.S. government (including its agencies and instrumentalities), repurchase agreements collateralized by U.S. government securities, and securities of state or municipal governments and their political subdivisions are not considered to be issued by members of any industry; |
| 2. | Borrow money, except that (i) each Fund may borrow from banks for temporary or emergency (not leveraging) purposes, including the meeting of redemption requests which might otherwise require the untimely disposition of securities, and (ii) each Fund may, to the extent consistent with its investment policies, enter into repurchase agreements, reverse repurchase agreements, forward roll transactions and similar investment strategies and techniques. To the extent that it engages in transactions described in (i) and (ii), each Fund will be limited so that no more than 33 1/3% of the value of its total assets (including the amount borrowed) is derived from such transactions. Any borrowings which come to exceed this amount will be reduced in accordance with applicable law; |
| 3. | Issue any senior security, except as permitted under the 1940 Act, as interpreted, modified or otherwise permitted by regulatory authority having jurisdiction, from time to time; |
| 4. | Make loans, except as permitted under the 1940 Act, as interpreted, modified or otherwise permitted by regulatory authority having jurisdiction, from time to time; |
| 5. | Purchase or sell real estate unless acquired as a result of ownership of securities or other investments (but this restriction shall not prevent each Fund from investing in securities of companies engaged in the real estate business or securities or other instruments backed by real estate or mortgages), or commodities or commodity contracts (but this |
| restriction shall not prevent each Fund from trading in futures contracts and options on futures contracts, including options on currencies to the extent consistent with each Fund's investment objectives and policies); or | |
| 6. | Engage in the business of underwriting securities issued by other persons, except to the extent that each Fund may technically be deemed to be an underwriter under the 1933 Act, the disposing of portfolio securities. |
| 1. | Concentrate its investments (i.e., invest 25% or more of its total assets in the securities of a particular industry or group of industries), except that each Fund will concentrate to approximately the same extent that its Underlying Index concentrates in the securities of a particular industry or group of industries. For purposes of this limitation, securities of the U.S. government (including its agencies and instrumentalities), repurchase agreements collateralized by U.S. government securities, and securities of state or municipal governments and their political subdivisions are not considered to be issued by members of any industry. |
| 2. | Borrow money, except that (i) each Fund may borrow from banks for temporary or emergency (not leveraging) purposes, including the meeting of redemption requests which might otherwise require the untimely disposition of securities, and (ii) each Fund may, to the extent consistent with its investment policies, enter into repurchase agreements, reverse repurchase agreements, forward roll transactions and similar investment strategies and techniques. To the extent that it engages in transactions described in (i) and (ii), each Fund will be limited so that no more than 33⅓% of the value of its total assets (including the amount borrowed) is derived from such transactions. Any borrowings which come to exceed this amount will be reduced in accordance with applicable law. |
| 3. | Issue any senior security, except as permitted under the 1940 Act, as interpreted, modified or otherwise permitted by any regulatory authority having jurisdiction, from time to time. |
| 4. | Make loans, except as permitted under the 1940 Act, as interpreted, modified or otherwise permitted by regulatory authority having jurisdiction, from time to time. |
| 5. | Purchase or sell real estate unless acquired as a result of ownership of securities or other instruments (but this restriction shall not prevent each Fund from investing in securities of companies engaged in the real estate business or securities or other instruments backed by real estate or mortgages), or commodities or commodity contracts (but this restriction shall not prevent each Fund from investing in securities of companies engaged in the production, ownership or distribution of commodities or in commodity-related businesses or from trading in futures contracts and options on futures contracts, including options on currencies to the extent consistent with each Fund’s investment objective and policies). |
| 6. | Engage in the business of underwriting securities issued by other persons, except to the extent that each Fund may technically be deemed to be an underwriter under the Securities Act, in disposing of portfolio securities. |
| Fund | Industry or Industries | |
| iShares MSCI Singapore ETF | Banks |
| Fund | Industry or Industries | |
| iShares MSCI Australia ETF | Banks | |
| iShares MSCI Canada ETF | Banks | |
| iShares MSCI Global Gold Miners ETF | Mining | |
| iShares MSCI Global Silver Miners ETF | Mining | |
| iShares MSCI Pacific ex Japan ETF | Banks | |
| iShares MSCI Russia Capped ETF | Oil & Gas | |
| iShares MSCI Spain Capped ETF | Banks | |
| iShares MSCI Switzerland Capped ETF | Pharmaceuticals | |
| iShares MSCI Turkey ETF | Banks |
| • | The frequency of trades and quotes for the security; |
| • | The number of dealers wishing to purchase or sell the security and the number of other potential purchasers; |
| • | Dealer undertakings to make a market in the security; and |
| • | The nature of the security and the nature of the marketplace in which it trades (e.g., the time needed to dispose of the security, the method of soliciting offers and the mechanics of transfer). |
| 1. | Invest in the securities of a company for the purpose of exercising management or control, or in any event purchase and hold more than 10% of the securities of a single issuer, provided that the Company may vote the investment securities owned by each Fund in accordance with its views; or |
| 2. | Hold illiquid assets in excess of 15% of its net assets. An illiquid asset is any asset which may not be sold or disposed of in the ordinary course of business within seven days at approximately the value at which the Fund has valued the investment. |
| 1. | The frequency of trades and quotes for the security; |
| 2. | The number of dealers wishing to purchase or sell the security and the number of other potential purchasers; |
| 3. | Dealer undertakings to make a market in the security; and |
| 4. | The nature of the security and the nature of the marketplace in which it trades (e.g., the time needed to dispose of the security, the method of soliciting offers and the mechanics of transfer). |
| Name (Age) | Position | Principal
Occupation(s) During the Past 5 Years |
Other
Directorships Held by Director | |||
| Robert
S. Kapito1 (59) |
Director
(since 2009). |
President, BlackRock, Inc. (since 2006); Vice Chairman of BlackRock, Inc. and Head of BlackRock’s Portfolio Management Group (since its formation in 1998) and BlackRock, Inc.’s predecessor entities (since 1988); Trustee, University of Pennsylvania (since 2009); President of Board of Directors, Hope & Heroes Children’s Cancer Fund (since 2002). | Director of BlackRock, Inc. (since 2006); Trustee of iShares Trust (since 2009); Trustee of iShares U.S. ETF Trust (since 2011). |
| Name (Age) | Position | Principal
Occupation(s) During the Past 5 Years |
Other
Directorships Held by Director | |||
| Mark
K. Wiedman2 (46) |
Director (since 2013). | Senior Managing Director, BlackRock, Inc. (since 2014); Managing Director, BlackRock, Inc. (2007-2014); Global Head of BlackRock’s ETF and Index Investments Business (since 2016); Global Head of iShares (2011-2016); Head of Corporate Strategy, BlackRock, Inc. (2009-2011). | Trustee of iShares Trust (since 2013); Trustee of iShares U.S. ETF Trust (since 2013); Director of PennyMac Financial Services, Inc. (since 2008). |
| 1 | Robert S. Kapito is deemed to be an “interested person” (as defined in the 1940 Act) of the Company due to his affiliations with BlackRock, Inc. and its affiliates. |
| 2 | Mark K. Wiedman is deemed to be an “interested person” (as defined in the 1940 Act) of the Company due to his affiliations with BlackRock, Inc. and its affiliates. |
| Name (Age) | Position | Principal
Occupation(s) During the Past 5 Years |
Other
Directorships Held by Director | |||
| Cecilia
H. Herbert (68) |
Director
(since 2005); Independent Board Chair (since 2016). |
Trustee and Member of the Finance, Technology and Quality Committee of Stanford Health Care (since 2016); Trustee and Member of the Investment Committee, WNET, a New York public media company (since 2011); Chair (1994-2005) and Member (since 1992) of the Investment Committee, Archdiocese of San Francisco; Director (1998-2013) and President (2007-2011) of the Board of Directors, Catholic Charities CYO; Trustee (2002-2011) and Chair of the Finance and Investment Committee (2006-2010) of the Thacher School. | Trustee of iShares Trust (since 2005); Trustee of iShares U.S. ETF Trust (since 2011); Independent Board Chair of iShares Trust and iShares U.S. ETF Trust (since 2016); Trustee of Forward Funds (14 portfolios) (since 2009); Trustee of Salient MF Trust (4 portfolios) (since 2015). | |||
| Jane
D. Carlin (60) |
Director
(since 2015); Risk Committee Chair (since 2016). |
Consultant (since 2012); Managing Director and Global Head of Financial Holding Company Governance & Assurance and the Global Head of Operational Risk Management of Morgan Stanley (2006-2012). | Trustee of iShares Trust (since 2015); Trustee of iShares U.S. ETF Trust (since 2015); Director of PHH Corporation (mortgage solutions) (since 2012); Director of The Hanover Insurance Group, Inc. (since 2016). | |||
| Richard
L. Fagnani (62) |
Director
(since 2017); Equity Plus Committee Chair (since 2017). |
Partner, KPMG LLP (2002-2016). | Trustee of iShares Trust (since 2017); Trustee of iShares U.S. ETF Trust (since 2017). |
| Name (Age) | Position | Principal
Occupation(s) During the Past 5 Years |
Other
Directorships Held by Director | |||
| Charles
A. Hurty (73) |
Director
(since 2005); Audit Committee Chair (since 2006). |
Retired; Partner, KPMG LLP (1968-2001). | Trustee of iShares Trust (since 2005); Trustee of iShares U.S. ETF Trust (since 2011); Director of SkyBridge Alternative Investments Multi-Adviser Hedge Fund Portfolios LLC (2 portfolios) (since 2002). | |||
| John
E. Kerrigan (61) |
Director
(since 2005); Securities Lending Committee Chair (since 2016). |
Chief Investment Officer, Santa Clara University (since 2002). | Trustee of iShares Trust (since 2005); Trustee of iShares U.S. ETF Trust (since 2011). | |||
| Drew
E. Lawton (58) |
Director
(since 2017); 15(c) Committee Chair (since 2017). |
Senior Managing Director of New York Life Insurance Company (2010-2015). | Trustee of iShares Trust (since 2017); Trustee of iShares U.S. ETF Trust (since 2017). | |||
| John
E. Martinez (56) |
Director
(since 2003); Fixed Income Plus Committee Chair (since 2016). |
Director of Real Estate Equity Exchange, Inc. (since 2005). | Trustee of iShares Trust (since 2003); Trustee of iShares U.S. ETF Trust (since 2011). | |||
| Madhav
V. Rajan (52) |
Director
(since 2011); Nominating and Governance Committee Chair (since 2017). |
Dean, and George Pratt Shultz Professor of Accounting, University of Chicago Booth School of Business (since 2017); Robert K. Jaedicke Professor of Accounting, Stanford University Graduate School of Business (2001-2017); Professor of Law (by courtesy), Stanford Law School (2005-2017); Senior Associate Dean for Academic Affairs and Head of MBA Program, Stanford University Graduate School of Business (2010-2016). | Trustee
of iShares Trust (since 2011); Trustee of iShares U.S. ETF Trust (since 2011); Director, Cavium, Inc. (since 2013). |
| Name (Age) | Position | Principal
Occupation(s) During the Past 5 Years | ||
| Martin
Small (41) |
President (since 2016). | Managing Director, BlackRock, Inc. (since 2010); Head of U.S. iShares (since 2015); Co-Head of the U.S. Financial Markets Advisory Group, BlackRock, Inc. (2008-2014). | ||
| Jack
Gee (57) |
Treasurer
and Chief Financial Officer (since 2008). |
Managing Director, BlackRock, Inc. (since 2009); Senior Director of Fund Administration of Intermediary Investor Business, BGI (2009). |
| Name (Age) | Position | Principal
Occupation(s) During the Past 5 Years | ||
| Charles
Park (49) |
Chief Compliance Officer (since 2006). | Chief Compliance Officer of BlackRock Advisors, LLC and the BlackRock-advised Funds in the Equity-Bond Complex, the Equity-Liquidity Complex and the Closed-End Complex (since 2014); Chief Compliance Officer of BFA (since 2006). | ||
| Benjamin
Archibald (42) |
Secretary (since 2015). | Managing Director, BlackRock, Inc. (since 2014); Director, BlackRock, Inc. (2010-2013); Secretary of the BlackRock-advised mutual funds (since 2012). | ||
| Steve
Messinger (55) |
Executive
Vice President (since 2016). |
Managing Director, BlackRock, Inc. (2007-2014 and since 2016); Managing Director, Beacon Consulting Group (2014-2016). | ||
| Scott
Radell (48) |
Executive
Vice President (since 2012). |
Managing Director, BlackRock, Inc. (since 2009); Head of Portfolio Solutions, BlackRock, Inc. (since 2009). | ||
| Alan
Mason (56) |
Executive
Vice President (since 2016). |
Managing Director, BlackRock, Inc. (since 2009). |
| Name of Director | Fund | Dollar
Range of Equity Securities in the Fund |
Aggregate
Dollar Range of Equity Securities in all Registered Investment Companies Overseen by Director in Family of Investment Companies | |||
| Robert S. Kapito | None | None | None | |||
| Mark Wiedman | iShares Core MSCI EAFE ETF | $50,001-$100,000 | Over $100,000 | |||
| iShares Core MSCI Emerging Markets ETF | $50,001-$100,000 |
| Name of Director | Fund | Dollar
Range of Equity Securities in the Fund |
Aggregate
Dollar Range of Equity Securities in all Registered Investment Companies Overseen by Director in Family of Investment Companies | |||
| iShares Core S&P Total U.S. Stock Market ETF | Over $100,000 | |||||
| John E. Martinez | iShares Core MSCI Emerging Markets ETF | $50,001-$100,000 | Over $100,000 | |||
| iShares Core S&P 500 ETF | Over $100,000 | |||||
| iShares Core S&P Mid-Cap ETF | $10,001-$50,000 | |||||
| iShares Core S&P Small-Cap ETF | $10,001-$50,000 | |||||
| iShares Core S&P Total U.S. Stock Market ETF | $1-$10,000 | |||||
| iShares Global Consumer Staples ETF | Over $100,000 | |||||
| iShares MSCI All Country Asia ex Japan ETF | Over $100,000 | |||||
| iShares MSCI EAFE ETF | Over $100,000 | |||||
| iShares Russell 1000 ETF | Over $100,000 | |||||
| iShares Russell 1000 Value ETF | Over $100,000 | |||||
| iShares Russell 2000 ETF | Over $100,000 | |||||
| iShares TIPS Bond ETF | $50,001-$100,000 | |||||
| Cecilia H. Herbert | iShares China Large-Cap ETF | Over $100,000 | Over $100,000 | |||
| iShares Core Dividend Growth ETF | $10,001-$50,000 | |||||
| iShares Core High Dividend ETF | $1-$10,000 | |||||
| iShares Core MSCI Emerging Markets ETF | $10,001-$50,000 | |||||
| iShares Core MSCI Total International Stock ETF | $10,001-$50,000 | |||||
| iShares Core S&P Small-Cap ETF | $1-$10,000 | |||||
| iShares Core S&P Total U.S. Stock Market ETF | $10,001-$50,000 | |||||
| iShares Core S&P U.S. Growth ETF | $50,001-$100,000 | |||||
| iShares Core S&P U.S. Value ETF | $10,001-$50,000 | |||||
| iShares iBoxx $ High Yield Corporate Bond ETF | $10,001-$50,000 | |||||
| iShares International Select Dividend ETF | $1-$10,000 | |||||
| iShares MSCI EAFE ETF | $1-$10,000 | |||||
| iShares MSCI Emerging Markets ETF | $1-$10,000 | |||||
| iShares MSCI Japan ETF | $10,001-$50,000 | |||||
| iShares National Muni Bond ETF | $10,001-$50,000 | |||||
| iShares U.S. Preferred Stock ETF | $10,001-$50,000 | |||||
| Charles A. Hurty | iShares China Large-Cap ETF | $10,001-$50,000 | Over $100,000 | |||
| iShares Core Growth Allocation ETF | $50,001-$100,000 | |||||
| iShares Core High Dividend ETF | $10,001-$50,000 | |||||
| iShares Core Moderate Allocation ETF | $50,001-$100,000 | |||||
| iShares Core MSCI Emerging Markets ETF | $10,001-$50,000 |
| Name of Director | Fund | Dollar
Range of Equity Securities in the Fund |
Aggregate
Dollar Range of Equity Securities in all Registered Investment Companies Overseen by Director in Family of Investment Companies | |||
| iShares Core S&P 500 ETF | $10,001-$50,000 | |||||
| iShares Global Energy ETF | $10,001-$50,000 | |||||
| iShares Global Healthcare ETF | $10,001-$50,000 | |||||
| iShares Global Tech ETF | $10,001-$50,000 | |||||
| iShares MSCI EAFE ETF | $10,001-$50,000 | |||||
| iShares Russell 2000 ETF | $10,001-$50,000 | |||||
| iShares U.S. Basic Materials ETF | $10,001-$50,000 | |||||
| iShares U.S. Energy ETF | $10,001-$50,000 | |||||
| iShares U.S. Technology ETF | $50,001-$100,000 | |||||
| John E. Kerrigan | iShares MSCI ACWI ETF | $10,001-$50,000 | Over $100,000 | |||
| iShares MSCI ACWI ex U.S. ETF | Over $100,000 | |||||
| iShares Short-Term National Muni Bond ETF | Over $100,000 | |||||
| Madhav V. Rajan | iShares Core Dividend Growth ETF | Over $100,000 | Over $100,000 | |||
| iShares Core High Dividend ETF | Over $100,000 | |||||
| iShares Core MSCI Emerging Markets ETF | Over $100,000 | |||||
| iShares Core S&P 500 ETF | Over $100,000 | |||||
| iShares iBoxx $ High Yield Corporate Bond ETF | Over $100,000 | |||||
| iShares iBoxx $ Investment Grade Corporate Bond ETF | Over $100,000 | |||||
| iShares Russell 2000 ETF | Over $100,000 | |||||
| iShares Select Dividend ETF | Over $100,000 | |||||
| Jane D. Carlin | iShares Core MSCI EAFE ETF | $50,001-$100,000 | Over $100,000 | |||
| iShares Core S&P Small-Cap ETF | $10,001-$50,000 | |||||
| iShares Global Tech ETF | $10,001-$50,000 |
| Name of Director | iShares
MSCI Australia ETF |
iShares
MSCI Austria Capped ETF |
iShares
MSCI Belgium Capped ETF |
iShares
MSCI Canada ETF | ||||
| Independent Directors: | ||||||||
| Robert H. Silver1 | $ 349 | $ 13 | $28 | $651 | ||||
| John E. Martinez | 599 | 22 | 48 | 1,115 | ||||
| Cecilia H. Herbert | 645 | 24 | 51 | 1,201 | ||||
| Charles A. Hurty | 627 | 23 | 50 | 1,167 | ||||
| John E. Kerrigan | 599 | 22 | 48 | 1,115 | ||||
| Madhav V. Rajan | 599 | 22 | 48 | 1,115 | ||||
| Jane D. Carlin | 599 | 22 | 48 | 1,115 | ||||
| Interested Directors: | ||||||||
| Robert S. Kapito | $ 0 | $ 0 | $ 0 | $0 | ||||
| Mark K. Wiedman | 0 | 0 | 0 | 0 | ||||
| Advisory Board Members: | ||||||||
| Drew E. Lawton2 | Not Applicable | Not Applicable | Not Applicable | Not Applicable | ||||
| Richard L. Fagnani3 | Not Applicable | Not Applicable | Not Applicable | Not Applicable |
| Name of Director | iShares
MSCI Eurozone ETF |
iShares
MSCI France ETF |
iShares
MSCI Germany ETF |
iShares
MSCI Global Gold Miners ETF | ||||
| Independent Directors: | ||||||||
| Robert H. Silver1 | $ 1,462 | $ 69 | $ 653 | $56 | ||||
| John E. Martinez | 2,506 | 119 | 1,119 | 96 | ||||
| Cecilia H. Herbert | 2,699 | 128 | 1,205 | 104 | ||||
| Charles A. Hurty | 2,622 | 124 | 1,170 | 101 | ||||
| John E. Kerrigan | 2,506 | 119 | 1,119 | 96 | ||||
| Madhav V. Rajan | 2,506 | 119 | 1,119 | 96 | ||||
| Jane D. Carlin | 2,506 | 119 | 1,119 | 96 | ||||
| Interested Directors: | ||||||||
| Robert S. Kapito | $ 0 | $ 0 | $ 0 | $0 | ||||
| Mark K. Wiedman | 0 | 0 | 0 | 0 | ||||
| Advisory Board Members: | ||||||||
| Drew E. Lawton2 | Not Applicable | Not Applicable | Not Applicable | Not Applicable |
| Name of Director | iShares
MSCI Eurozone ETF |
iShares
MSCI France ETF |
iShares
MSCI Germany ETF |
iShares
MSCI Global Gold Miners ETF | ||||
| Richard L. Fagnani3 | Not Applicable | Not Applicable | Not Applicable | Not Applicable |
| Name of Director | iShares
MSCI Global Silver Miners ETF |
iShares
MSCI Hong Kong ETF |
iShares
MSCI Israel Capped ETF |
iShares
MSCI Italy Capped ETF | ||||
| Independent Directors: | ||||||||
| Robert H. Silver1 | $ 19 | $ 335 | $ 20 | $96 | ||||
| John E. Martinez | 32 | 574 | 34 | 164 | ||||
| Cecilia H. Herbert | 35 | 618 | 36 | 177 | ||||
| Charles A. Hurty | 34 | 600 | 35 | 172 | ||||
| John E. Kerrigan | 32 | 574 | 34 | 164 | ||||
| Madhav V. Rajan | 32 | 574 | 34 | 164 | ||||
| Jane D. Carlin | 32 | 574 | 34 | 164 | ||||
| Interested Directors: | ||||||||
| Robert S. Kapito | $ 0 | $ 0 | $ 0 | $0 | ||||
| Mark K. Wiedman | 0 | 0 | 0 | 0 | ||||
| Advisory Board Members: | ||||||||
| Drew E. Lawton2 | Not Applicable | Not Applicable | Not Applicable | Not Applicable | ||||
| Richard L. Fagnani3 | Not Applicable | Not Applicable | Not Applicable | Not Applicable |
| Name of Director | iShares
MSCI Japan ETF |
iShares
MSCI Japan Small-Cap ETF |
iShares
MSCI Mexico Capped ETF |
iShares
MSCI Netherlands ETF | ||||
| Independent Directors: | ||||||||
| Robert H. Silver1 | $2,848 | $ 35 | $277 | $39 | ||||
| John E. Martinez | 4,882 | 59 | 476 | 67 | ||||
| Cecilia H. Herbert | 5,258 | 64 | 512 | 72 | ||||
| Charles A. Hurty | 5,107 | 62 | 498 | 70 | ||||
| John E. Kerrigan | 4,882 | 59 | 476 | 67 | ||||
| Madhav V. Rajan | 4,882 | 59 | 476 | 67 | ||||
| Jane D. Carlin | 4,882 | 59 | 476 | 67 | ||||
| Interested Directors: | ||||||||
| Robert S. Kapito | $ 0 | $ 0 | $ 0 | $0 | ||||
| Mark K. Wiedman | 0 | 0 | 0 | 0 | ||||
| Advisory Board Members: | ||||||||
| Drew E. Lawton2 | Not Applicable | Not Applicable | Not Applicable | Not Applicable | ||||
| Richard L. Fagnani3 | Not Applicable | Not Applicable | Not Applicable | Not Applicable |
| Name of Director | iShares
MSCI Pacific ex Japan ETF |
iShares
MSCI Russia Capped ETF |
iShares
MSCI Singapore Capped ETF |
iShares
MSCI South Africa ETF | ||||
| Independent Directors: |
| Name of Director | iShares
MSCI Pacific ex Japan ETF |
iShares
MSCI Russia Capped ETF |
iShares
MSCI Singapore Capped ETF |
iShares
MSCI South Africa ETF | ||||
| Robert H. Silver1 | $497 | $ 65 | $ 119 | $86 | ||||
| John E. Martinez | 852 | 112 | 203 | 147 | ||||
| Cecilia H. Herbert | 917 | 121 | 219 | 158 | ||||
| Charles A. Hurty | 891 | 117 | 213 | 154 | ||||
| John E. Kerrigan | 852 | 112 | 203 | 147 | ||||
| Madhav V. Rajan | 852 | 112 | 203 | 147 | ||||
| Jane D. Carlin | 852 | 112 | 203 | 147 | ||||
| Interested Directors: | ||||||||
| Robert S. Kapito | $ 0 | $ 0 | $ 0 | $0 | ||||
| Mark K. Wiedman | 0 | 0 | 0 | 0 | ||||
| Advisory Board Members: | ||||||||
| Drew E. Lawton2 | Not Applicable | Not Applicable | Not Applicable | Not Applicable | ||||
| Richard L. Fagnani3 | Not Applicable | Not Applicable | Not Applicable | Not Applicable |
| Name of Director | iShares
MSCI Spain Capped ETF |
iShares
MSCI Sweden Capped ETF |
iShares
MSCI Switzerland Capped ETF |
iShares
MSCI Thailand Capped ETF | ||||
| Independent Directors: | ||||||||
| Robert H. Silver1 | $ 123 | $ 60 | $229 | $95 | ||||
| John E. Martinez | 211 | 103 | 393 | 163 | ||||
| Cecilia H. Herbert | 227 | 111 | 423 | 176 | ||||
| Charles A. Hurty | 221 | 108 | 411 | 171 | ||||
| John E. Kerrigan | 211 | 103 | 393 | 163 | ||||
| Madhav V. Rajan | 211 | 103 | 393 | 163 | ||||
| Jane D. Carlin | 211 | 103 | 393 | 163 | ||||
| Interested Directors: | ||||||||
| Robert S. Kapito | $ 0 | $ 0 | $ 0 | $0 | ||||
| Mark K. Wiedman | 0 | 0 | 0 | 0 | ||||
| Advisory Board Members: | ||||||||
| Drew E. Lawton2 | Not Applicable | Not Applicable | Not Applicable | Not Applicable | ||||
| Richard L. Fagnani3 | Not Applicable | Not Applicable | Not Applicable | Not Applicable |
| Name of Director | iShares
MSCI Turkey ETF |
iShares
MSCI USA Equal Weighted ETF |
iShares
MSCI World ETF | |||
| Independent Directors: | ||||||
| Robert H. Silver1 | $ 78 | $ 16 | $61 | |||
| John E. Martinez | 133 | 27 | 104 | |||
| Cecilia H. Herbert | 143 | 29 | 112 |
| Name of Director | iShares
MSCI Turkey ETF |
iShares
MSCI USA Equal Weighted ETF |
iShares
MSCI World ETF | |||
| Charles A. Hurty | 139 | 28 | 109 | |||
| John E. Kerrigan | 133 | 27 | 104 | |||
| Madhav V. Rajan | 133 | 27 | 104 | |||
| Jane D. Carlin | 133 | 27 | 104 | |||
| Interested Directors: | ||||||
| Robert S. Kapito | $ 0 | $ 0 | $0 | |||
| Mark K. Wiedman | 0 | 0 | 0 | |||
| Advisory Board Members: | ||||||
| Drew E. Lawton2 | Not Applicable | Not Applicable | Not Applicable | |||
| Richard L. Fagnani3 | Not Applicable | Not Applicable | Not Applicable |
| Name of Director | Pension
or Retirement Benefits Accrued As Part of Company Expenses4 |
Estimated
Annual Benefits Upon Retirement4 |
Total
Compensation From the Funds and Fund Complex5 | |||
| Independent Directors: | ||||||
| Robert H. Silver1 | Not Applicable | Not Applicable | $350,000 | |||
| John E. Martinez | Not Applicable | Not Applicable | 326,764 | |||
| Cecilia H. Herbert | Not Applicable | Not Applicable | 341,764 | |||
| Charles A. Hurty | Not Applicable | Not Applicable | 340,000 | |||
| John E. Kerrigan | Not Applicable | Not Applicable | 315,000 | |||
| Madhav V. Rajan | Not Applicable | Not Applicable | 315,000 | |||
| Jane D. Carlin | Not Applicable | Not Applicable | 300,000 6 | |||
| Interested Directors: | ||||||
| Robert S. Kapito | Not Applicable | Not Applicable | $0 | |||
| Mark K. Wiedman | Not Applicable | Not Applicable | 0 | |||
| Advisory Board Members: | ||||||
| Drew E. Lawton2 | Not Applicable | Not Applicable | Not Applicable | |||
| Richard L. Fagnani3 | Not Applicable | Not Applicable | Not Applicable |
| 1 | Served as an Independent Director through March 31, 2016. |
| 2 | Compensation is not shown for Drew E. Lawton because he was appointed to serve as an Advisory Board Member effective October 18, 2016. |
| 3 | Compensation is not shown for Richard L. Fagnani because he was appointed to serve as an Advisory Board Member effective April 1, 2017. |
| 4 | No Director or officer is entitled to any pension or retirement benefits from the Company. |
| 5 | Includes compensation for service on the Boards of Trustees for iShares Trust and iShares U.S. ETF Trust and the Board of Directors of iShares MSCI Russia Capped ETF, Inc. |
| 6 | Total compensation is shown for Jane D. Carlin for the period from February 3, 2015 to December 31, 2015 because she was appointed to serve as an Independent Director of the Company effective February 3, 2015. |
| Fund | Name | Percentage
of Ownership | ||
| iShares MSCI Australia ETF | State
Street Bank and Trust Company 1776 Heritage Drive North Quincy, MA 02171 |
15.00% | ||
| Citibank,
N.A. 3800 CitiBank Center Tampa Building A/Floor 2 Tampa, FL 33610 |
7.98% | |||
| The
Bank of New York Mellon 401 Salina Street 2nd Floor Syracuse, NY 13202 |
7.89% | |||
| National
Financial Services LLC 200 Liberty Street 5th Floor New York, NY 10281 |
6.91% | |||
| Charles
Schwab & Co., Inc. 111 Pavonia Avenue Jersey City, NJ 07310 |
6.18% | |||
| iShares MSCI Austria Capped ETF | The
Bank of New York Mellon 401 Salina Street 2nd Floor Syracuse, NY 13202 |
9.77% | ||
| TD
Ameritrade Clearing, Inc. 1005 N. Ameritrade Place Bellevue, NE 68005 |
7.71% | |||
| CIBC
World Markets Inc./CDS 161 Bay Street 10th Floor Toronto ON Ontario M5J 258 CA |
7.53% | |||
| Mellon
Trust of New England, National Association Three Mellon Bank Center Floor 1533700 Pittsburgh, PA 15259 |
7.03% | |||
| Merrill
Lynch, Pierce Fenner & Smith Safekeeping 101 Hudson Street 8th Floor Jersey City, NJ 07302 |
6.69% |
| Fund | Name | Percentage
of Ownership | ||
| Charles
Schwab & Co., Inc. 111 Pavonia Avenue Jersey City, NJ 07310 |
5.90% | |||
| National
Financial Services LLC 200 Liberty Street 5th Floor New York, NY 10281 |
5.88% | |||
| Wells
Fargo Securities, LLC 8739 Research Drive Charlotte, NC 28262-0675 |
5.51% | |||
| iShares MSCI Belgium Capped ETF | State
Street Bank and Trust Company 1776 Heritage Drive North Quincy, MA 02171 |
15.90% | ||
| Brown
Brothers Harriman & Co. 525 Washington Blvd. 11th Floor Jersey City, NJ 07310 |
12.12% | |||
| National
Financial Services LLC 200 Liberty Street 5th Floor New York, NY 10281 |
10.82% | |||
| Morgan
Stanley Smith Barney LLC 1300 Thames Street 6th Floor Baltimore, MD 21231 |
10.29% | |||
| Charles
Schwab & Co., Inc. 111 Pavonia Avenue Jersey City, NJ 07310 |
6.14% | |||
| First
Clearing, LLC 901 East Byrd Street Richmond, VA 23219 |
5.71% | |||
| iShares MSCI Canada ETF | Northern
Trust Company (The) 801 South Canal Street Chicago, IL 60612 |
11.80% | ||
| BNP
Paribas, New York Branch/Custody Services 525 Washington BLVD. Jersey City, NJ 07310 |
9.36% | |||
| Citibank,
N.A. 3800 CitiBank Center Tampa Building A/Floor 2 Tampa, FL 33610 |
9.08% | |||
| The
Bank of New York Mellon 401 Salina Street 2nd Floor Syracuse, NY 13202 |
9.06% | |||
| State
Street Bank and Trust Company 1776 Heritage Drive North Quincy, MA 02171 |
8.51% |
| Fund | Name | Percentage
of Ownership | ||
| Brown
Brothers Harriman & Co. 525 Washington Blvd. 11th Floor Jersey City, NJ 07310 |
6.72% | |||
| Merrill
Lynch, Pierce Fenner & Smith Safekeeping 101 Hudson Street 8th Floor Jersey City, NJ 07302 |
5.93% | |||
| National
Financial Services LLC 200 Liberty Street 5th Floor New York, NY 10281 |
5.53% | |||
| iShares MSCI Eurozone ETF | Brown
Brothers Harriman & Co. 525 Washington Blvd. 11th Floor Jersey City, NJ 07310 |
18.00% | ||
| BlackRock
Institutional Trust Company, N.A. 400 Howard Street San Francisco, CA 94105 |
15.68% | |||
| Citibank,
N.A. 3800 CitiBank Center Tampa Building A/Floor 2 Tampa, FL 33610 |
13.73% | |||
| State
Street Bank and Trust Company 1776 Heritage Drive North Quincy, MA 02171 |
10.79% | |||
| The
Bank of New York Mellon 401 Salina Street 2nd Floor Syracuse, NY 13202 |
8.94% | |||
| Deutsche
Bank Securities Inc./Cedear 1251 Avenue of the Americas New York, NY 10020 |
6.63% | |||
| iShares MSCI France ETF | State
Street Bank and Trust Company 1776 Heritage Drive North Quincy, MA 02171 |
15.22% | ||
| Brown
Brothers Harriman & Co. 525 Washington Blvd. 11th Floor Jersey City, NJ 07310 |
9.24% | |||
| Citibank,
N.A. 3800 CitiBank Center Tampa Building A/Floor 2 Tampa, FL 33610 |
9.04% | |||
| Deutsche
Bank Securities Inc./Cedear 1251 Avenue of the Americas New York, NY 10020 |
8.60% |
| Fund | Name | Percentage
of Ownership | ||
| The
Bank of New York Mellon 401 Salina Street 2nd Floor Syracuse, NY 13202 |
8.24% | |||
| First
Clearing, LLC 901 East Byrd Street Richmond, VA 23219 |
6.62% | |||
| iShares MSCI Germany ETF | Brown
Brothers Harriman & Co. 525 Washington Blvd. 11th Floor Jersey City, NJ 07310 |
28.25% | ||
| BlackRock
Institutional Trust Company, N.A. 400 Howard Street San Francisco, CA 94105 |
11.56% | |||
| Citibank,
N.A. 3800 CitiBank Center Tampa Building A/Floor 2 Tampa, FL 33610 |
8.55% | |||
| Bank
of America NA/Client Assets 135 S LaSalle St Chicago, IL 60603 |
7.95% | |||
| State
Street Bank and Trust Company 1776 Heritage Drive North Quincy, MA 02171 |
6.64% | |||
| iShares MSCI Global Gold Miners ETF | State
Street Bank and Trust Company 1776 Heritage Drive North Quincy, MA 02171 |
38.76% | ||
| National
Financial Services LLC 200 Liberty Street 5th Floor New York, NY 10281 |
13.02% | |||
| Bank
of America NA/Client Assets 135 S LaSalle St Chicago, IL 60603 |
8.52% | |||
| iShares MSCI Global Silver Miners ETF | National
Financial Services LLC 200 Liberty Street 5th Floor New York, NY 10281 |
27.99% | ||
| Charles
Schwab & Co., Inc. 111 Pavonia Avenue Jersey City, NJ 07310 |
8.55% | |||
| Goldman,
Sachs & Co. 30 Hudson Street 16th Floor Jersey City, NJ 07302 |
6.95% |
| Fund | Name | Percentage
of Ownership | ||
| Citibank,
N.A. 3800 CitiBank Center Tampa Building A/Floor 2 Tampa, FL 33610 |
6.29% | |||
| TD
Ameritrade Clearing, Inc. 1005 N. Ameritrade Place Bellevue, NE 68005 |
5.16% | |||
| iShares MSCI Hong Kong ETF | Charles
Schwab & Co., Inc. 111 Pavonia Avenue Jersey City, NJ 07310 |
20.97% | ||
| Brown
Brothers Harriman & Co. 525 Washington Blvd. 11th Floor Jersey City, NJ 07310 |
12.37% | |||
| Bank
of America NA/Client Assets 135 S LaSalle St Chicago, IL 60603 |
11.36% | |||
| The
Bank of New York Mellon 401 Salina Street 2nd Floor Syracuse, NY 13202 |
6.80% | |||
| iShares MSCI Israel Capped ETF | Charles
Schwab & Co., Inc. 111 Pavonia Avenue Jersey City, NJ 07310 |
12.00% | ||
| National
Financial Services LLC 200 Liberty Street 5th Floor New York, NY 10281 |
8.96% | |||
| BNP
Paribas, New York Branch/Custody Services 525 Washington BLVD. Jersey City, NJ 07310 |
8.24% | |||
| Brown
Brothers Harriman & Co. 525 Washington Blvd. 11th Floor Jersey City, NJ 07310 |
8.00% | |||
| Morgan
Stanley Smith Barney LLC 1300 Thames Street 6th Floor Baltimore, MD 21231 |
5.68% | |||
| The
Bank of New York Mellon 401 Salina Street 2nd Floor Syracuse, NY 13202 |
5.02% | |||
| iShares MSCI Italy Capped ETF | State
Street Bank and Trust Company 1776 Heritage Drive North Quincy, MA 02171 |
26.83% |
| Fund | Name | Percentage
of Ownership | ||
| Brown
Brothers Harriman & Co. 525 Washington Blvd. 11th Floor Jersey City, NJ 07310 |
14.68% | |||
| Northern
Trust Company (The) 801 South Canal Street Chicago, IL 60612 |
7.78% | |||
| Citibank,
N.A. 3800 CitiBank Center Tampa Building A/Floor 2 Tampa, FL 33610 |
6.56% | |||
| The
Bank of New York Mellon 401 Salina Street 2nd Floor Syracuse, NY 13202 |
5.37% | |||
| Charles
Schwab & Co., Inc. 111 Pavonia Avenue Jersey City, NJ 07310 |
5.09% | |||
| iShares MSCI Japan ETF | Brown
Brothers Harriman & Co. 525 Washington Blvd. 11th Floor Jersey City, NJ 07310 |
18.73% | ||
| Citibank,
N.A. 3800 CitiBank Center Tampa Building A/Floor 2 Tampa, FL 33610 |
11.56% | |||
| State
Street Bank and Trust Company 1776 Heritage Drive North Quincy, MA 02171 |
10.12% | |||
| JPMorgan
Chase Bank, National Association 14201 Dallas Pkwy 12th Floor Dallas, TX 75240 |
8.38% | |||
| Morgan
Stanley Smith Barney LLC 1300 Thames Street 6th Floor Baltimore, MD 21231 |
6.36% | |||
| The
Bank of New York Mellon 401 Salina Street 2nd Floor Syracuse, NY 13202 |
6.24% | |||
| iShares MSCI Japan Small-Cap ETF | Morgan
Stanley Smith Barney LLC 1300 Thames Street 6th Floor Baltimore, MD 21231 |
12.09% | ||
| The
Bank of New York Mellon 401 Salina Street 2nd Floor Syracuse, NY 13202 |
8.55% |
| Fund | Name | Percentage
of Ownership | ||
| JPMorgan
Chase Bank, National Association 14201 Dallas Pkwy 12th Floor Dallas, TX 75240 |
8.49% | |||
| Brown
Brothers Harriman & Co. 525 Washington Blvd. 11th Floor Jersey City, NJ 07310 |
8.04% | |||
| Citibank,
N.A. 3800 CitiBank Center Tampa Building A/Floor 2 Tampa, FL 33610 |
7.85% | |||
| Charles
Schwab & Co., Inc. 111 Pavonia Avenue Jersey City, NJ 07310 |
7.77% | |||
| State
Street Bank and Trust Company 1776 Heritage Drive North Quincy, MA 02171 |
6.49% | |||
| iShares MSCI Mexico Capped ETF | Brown
Brothers Harriman & Co. 525 Washington Blvd. 11th Floor Jersey City, NJ 07310 |
11.98% | ||
| Northern
Trust Company (The) 801 South Canal Street Chicago, IL 60612 |
10.13% | |||
| Merrill
Lynch, Pierce, Fenner & Smith Incorporated 101 Hudson Street 9th Floor Jersey City, NJ 07302-3997 |
7.62% | |||
| The
Bank of New York Mellon 401 Salina Street 2nd Floor Syracuse, NY 13202 |
6.62% | |||
| Citibank,
N.A. 3800 CitiBank Center Tampa Building A/Floor 2 Tampa, FL 33610 |
5.60% | |||
| Charles
Schwab & Co., Inc. 111 Pavonia Avenue Jersey City, NJ 07310 |
5.01% | |||
| iShares MSCI Netherlands ETF | State
Street Bank and Trust Company 1776 Heritage Drive North Quincy, MA 02171 |
22.78% | ||
| Mellon
Trust of New England, National Association Three Mellon Bank Center Floor 1533700 Pittsburgh, PA 15259 |
20.17% |
| Fund | Name | Percentage
of Ownership | ||
| Brown
Brothers Harriman & Co. 525 Washington Blvd. 11th Floor Jersey City, NJ 07310 |
5.02% | |||
| iShares MSCI Pacific ex Japan ETF | Merrill
Lynch, Pierce Fenner & Smith Safekeeping 101 Hudson Street 8th Floor Jersey City, NJ 07302 |
18.33% | ||
| Citibank,
N.A. 3800 CitiBank Center Tampa Building A/Floor 2 Tampa, FL 33610 |
10.19% | |||
| State
Street Bank and Trust Company 1776 Heritage Drive North Quincy, MA 02171 |
7.19% | |||
| Charles
Schwab & Co., Inc. 111 Pavonia Avenue Jersey City, NJ 07310 |
7.15% | |||
| National
Financial Services LLC 200 Liberty Street 5th Floor New York, NY 10281 |
5.53% | |||
| iShares MSCI Russia Capped ETF | State
Street Bank and Trust Company 1776 Heritage Drive North Quincy, MA 02171 |
16.93% | ||
| JPMorgan
Chase Bank, National Association 14201 Dallas Pkwy 12th Floor Dallas, TX 75240 |
16.50% | |||
| Deutsche
Bank Securities Inc./Cedear 1251 Avenue of the Americas New York, NY 10020 |
7.86% | |||
| Citibank,
N.A. 3800 CitiBank Center Tampa Building A/Floor 2 Tampa, FL 33610 |
6.43% | |||
| Brown
Brothers Harriman & Co. 525 Washington Blvd. 11th Floor Jersey City, NJ 07310 |
6.18% | |||
| iShares MSCI Singapore Capped ETF | Citibank,
N.A. 3800 CitiBank Center Tampa Building A/Floor 2 Tampa, FL 33610 |
10.31% | ||
| Charles
Schwab & Co., Inc. 111 Pavonia Avenue Jersey City, NJ 07310 |
9.92% |
| Fund | Name | Percentage
of Ownership | ||
| National
Financial Services LLC 200 Liberty Street 5th Floor New York, NY 10281 |
8.36% | |||
| First
Clearing, LLC 901 East Byrd Street Richmond, VA 23219 |
7.99% | |||
| iShares MSCI South Africa ETF | State
Street Bank and Trust Company 1776 Heritage Drive North Quincy, MA 02171 |
44.96% | ||
| The
Bank of New York Mellon 401 Salina Street 2nd Floor Syracuse, NY 13202 |
8.26% | |||
| Brown
Brothers Harriman & Co. 525 Washington Blvd. 11th Floor Jersey City, NJ 07310 |
7.77% | |||
| iShares MSCI Spain Capped ETF | Brown
Brothers Harriman & Co. 525 Washington Blvd. 11th Floor Jersey City, NJ 07310 |
12.18% | ||
| State
Street Bank and Trust Company 1776 Heritage Drive North Quincy, MA 02171 |
10.15% | |||
| Citibank,
N.A. 3800 CitiBank Center Tampa Building A/Floor 2 Tampa, FL 33610 |
7.68% | |||
| First
Clearing, LLC 901 East Byrd Street Richmond, VA 23219 |
6.75% | |||
| Deutsche
Bank Securities Inc./Cedear 1251 Avenue of the Americas New York, NY 10020 |
6.71% | |||
| National
Financial Services LLC 200 Liberty Street 5th Floor New York, NY 10281 |
5.91% | |||
| Charles
Schwab & Co., Inc. 111 Pavonia Avenue Jersey City, NJ 07310 |
5.26% | |||
| iShares MSCI Sweden Capped ETF | Merrill
Lynch, Pierce Fenner & Smith Safekeeping 101 Hudson Street 8th Floor Jersey City, NJ 07302 |
25.21% |
| Fund | Name | Percentage
of Ownership | ||
| Brown
Brothers Harriman & Co. 525 Washington Blvd. 11th Floor Jersey City, NJ 07310 |
9.37% | |||
| Citibank,
N.A. 3800 CitiBank Center Tampa Building A/Floor 2 Tampa, FL 33610 |
5.76% | |||
| Charles
Schwab & Co., Inc. 111 Pavonia Avenue Jersey City, NJ 07310 |
5.35% | |||
| iShares MSCI Switzerland Capped ETF | Merrill
Lynch, Pierce Fenner & Smith Safekeeping 101 Hudson Street 8th Floor Jersey City, NJ 07302 |
22.94% | ||
| State
Street Bank and Trust Company 1776 Heritage Drive North Quincy, MA 02171 |
9.97% | |||
| Citibank,
N.A. 3800 CitiBank Center Tampa Building A/Floor 2 Tampa, FL 33610 |
9.28% | |||
| National
Financial Services LLC 200 Liberty Street 5th Floor New York, NY 10281 |
8.79% | |||
| Charles
Schwab & Co., Inc. 111 Pavonia Avenue Jersey City, NJ 07310 |
6.86% | |||
| Brown
Brothers Harriman & Co. 525 Washington Blvd. 11th Floor Jersey City, NJ 07310 |
5.89% | |||
| iShares MSCI Thailand Capped ETF | Northern
Trust Company/ United Nations Joint Staff Pension Fund 50 South LaSalle Street Chicago, IL 60675 |
21.35% | ||
| State
Street Bank and Trust Company 1776 Heritage Drive North Quincy, MA 02171 |
16.28% | |||
| Citibank,
N.A. 3800 CitiBank Center Tampa Building A/Floor 2 Tampa, FL 33610 |
5.93% |
| Fund | Name | Percentage
of Ownership | ||
| Mellon
Trust of New England, National Association Three Mellon Bank Center Floor 1533700 Pittsburgh, PA 15259 |
5.23% | |||
| iShares MSCI Turkey ETF | State
Street Bank and Trust Company 1776 Heritage Drive North Quincy, MA 02171 |
12.26% | ||
| JPMorgan
Chase Bank, National Association 14201 Dallas Pkwy 12th Floor Dallas, TX 75240 |
9.01% | |||
| Citibank,
N.A. 3800 CitiBank Center Tampa Building A/Floor 2 Tampa, FL 33610 |
7.99% | |||
| The
Bank of New York Mellon 401 Salina Street 2nd Floor Syracuse, NY 13202 |
7.88% | |||
| Brown
Brothers Harriman & Co. 525 Washington Blvd. 11th Floor Jersey City, NJ 07310 |
7.48% | |||
| National
Financial Services LLC 200 Liberty Street 5th Floor New York, NY 10281 |
6.76% | |||
| Goldman,
Sachs & Co. 30 Hudson Street 16th Floor Jersey City, NJ 07302 |
5.59% | |||
| Charles
Schwab & Co., Inc. 111 Pavonia Avenue Jersey City, NJ 07310 |
5.29% | |||
| iShares MSCI USA Equal Weighted ETF | National
Financial Services LLC 200 Liberty Street 5th Floor New York, NY 10281 |
16.21% | ||
| Northern
Trust Company (The) 801 South Canal Street Chicago, IL 60612 |
15.79% | |||
| State
Street Bank and Trust Company 1776 Heritage Drive North Quincy, MA 02171 |
14.50% | |||
| Credit
Suisse Securities (USA) LLC One Madison Ave 3rd Floor New York, NY 10010 |
10.53% |
| Fund | Name | Percentage
of Ownership | ||
| Charles
Schwab & Co., Inc. 111 Pavonia Avenue Jersey City, NJ 07310 |
7.02% | |||
| iShares MSCI World ETF | JPMorgan
Chase Bank, National Association 14201 Dallas Pkwy 12th Floor Dallas, TX 75240 |
27.44% | ||
| Brown
Brothers Harriman & Co. 525 Washington Blvd. 11th Floor Jersey City, NJ 07310 |
16.84% | |||
| UBS
Financial Services Inc. 1000 Harbor Blvd. 8th Floor Weehawken, NJ 07087 |
6.98% | |||
| Citibank,
N.A. 3800 CitiBank Center Tampa Building A/Floor 2 Tampa, FL 33610 |
6.27% | |||
| National
Financial Services LLC 200 Liberty Street 5th Floor New York, NY 10281 |
6.24% | |||
| The
Bank of New York Mellon 401 Salina Street 2nd Floor Syracuse, NY 13202 |
6.19% |
| Average Daily Net Assets of Combined Funds | Rate
of Management Fee for the iShares MSCI Pacific ex Japan ETF |
| First $46 billion | 0.5000% |
| Greater than $46 billion – up to $81 billion | 0.4750% |
| Greater than $81 billion – up to $111 billion | 0.4513% |
| Greater than $111 billion up to $141 billion | 0.4287% |
| Greater than $141 billion | 0.4073 % |
| Fund | Management
Fee for the Fiscal Year Ended August 31, 2016 |
Fund
Inception Date |
Management
Fees Paid Net of Waivers for Fiscal Year Ended August 31, 2016 |
Management
Fees Paid Net of Waivers for Fiscal Year Ended August 31, 2015 |
Management
Fees Paid Net of Waivers for Fiscal Year Ended August 31, 2014 | |||||
| iShares MSCI Australia ETF | 0.48% | 03/12/96 | $ 6,860,963 | $ 7,960,415 | $ 9,309,890 | |||||
| iShares MSCI Austria Capped ETF | 0.48% | 03/12/96 | 295,007 | 292,186 | 423,284 | |||||
| iShares MSCI Belgium Capped ETF | 0.48% | 03/12/96 | 898,831 | 784,484 | 402,608 | |||||
| iShares MSCI Canada ETF | 0.48% | 03/12/96 | 11,048,003 | 12,771,622 | 16,221,385 | |||||
| iShares MSCI Eurozone ETF | 0.48% | 07/25/00 | 56,101,620 | 43,090,544 | 42,364,200 | |||||
| iShares MSCI France ETF | 0.48% | 03/12/96 | 1,755,176 | 1,578,364 | 2,136,157 |
| Fund | Management
Fee for the Fiscal Year Ended August 31, 2016 |
Fund
Inception Date |
Management
Fees Paid Net of Waivers for Fiscal Year Ended August 31, 2016 |
Management
Fees Paid Net of Waivers for Fiscal Year Ended August 31, 2015 |
Management
Fees Paid Net of Waivers for Fiscal Year Ended August 31, 2014 | |||||
| iShares MSCI Germany ETF | 0.48% | 03/12/96 | 24,428,612 | 28,550,112 | 26,930,838 | |||||
| iShares MSCI Global Gold Miners ETF | 0.39% | 01/31/12 | 451,251 | 216,127 | 202,118 | |||||
| iShares MSCI Global Silver Miners ETF | 0.39% | 01/31/12 | 128,700 | 52,280 | 34,325 | |||||
| iShares MSCI Hong Kong ETF | 0.48% | 03/12/96 | 9,828,837 | 15,472,269 | 10,514,616 | |||||
| iShares MSCI Israel Capped ETF | 0.64% | 03/26/08 | 700,713 | 778,200 | 660,053 | |||||
| iShares MSCI Italy Capped ETF | 0.48% | 03/12/96 | 4,260,265 | 4,950,493 | 5,770,615 | |||||
| iShares MSCI Japan ETF | 0.48% | 03/12/96 | 83,098,869 | 78,965,332 | 64,952,270 | |||||
| iShares MSCI Japan Small-Cap ETF | 0.48% | 12/20/07 | 865,162 | 701,139 | 658,384 | |||||
| iShares MSCI Mexico Capped ETF | 0.48% | 03/12/96 | 5,958,256 | 10,089,636 | 12,859,191 | |||||
| iShares MSCI Netherlands ETF | 0.48% | 03/12/96 | 898,127 | 789,963 | 1,273,241 | |||||
| iShares MSCI Pacific ex Japan ETF | 0.49% | 10/25/01 | 9,789,421 | 13,450,529 | 15,652,518 | |||||
| iShares MSCI Russia Capped ETF | 0.64% | 11/09/10 | 1,610,412 | 1,596,025 | 1,894,067 | |||||
| iShares MSCI Singapore Capped ETF | 0.48% | 03/12/96 | 2,669,085 | 3,991,035 | 5,164,682 | |||||
| iShares MSCI South Africa ETF | 0.64% | 02/03/03 | 2,287,159 | 2,791,571 | 3,384,634 | |||||
| iShares MSCI Spain Capped ETF | 0.48% | 03/12/96 | 5,289,563 | 8,425,166 | 7,203,889 | |||||
| iShares MSCI Sweden Capped ETF | 0.48% | 03/12/96 | 1,567,657 | 1,789,253 | 2,380,666 | |||||
| iShares MSCI Switzerland Capped ETF | 0.48% | 03/12/96 | 5,530,695 | 5,453,148 | 5,066,631 | |||||
| iShares MSCI Thailand Capped ETF | 0.63% | 03/26/08 | 1,855,406 | 2,698,099 | 3,396,409 | |||||
| iShares MSCI Turkey ETF | 0.64% | 03/26/08 | 2,183,539 | 2,927,726 | 3,190,075 | |||||
| iShares MSCI USA Equal Weighted ETF | 0.15% | 05/05/10 | 74,046 | 79,043 | 196,623 | |||||
| iShares MSCI World ETF | 0.24% | 01/10/12 | 576,599 | 513,995 | 299,743 |
| Diane Hsiung | ||||
| Types of Accounts | Number | Total Assets | ||
| Registered Investment Companies | 224 | $659,537,000,000 | ||
| Other Pooled Investment Vehicles | 15 | 3,975,000,000 | ||
| Other Accounts | 0 | N/A | ||
| Accounts with Incentive-Based Fee Arrangements | 0 | N/A |
| Jennifer Hsui | ||||
| Types of Accounts | Number | Total Assets | ||
| Registered Investment Companies | 240 | $680,351,000,000 | ||
| Other Pooled Investment Vehicles | 16 | 4,295,000,000 |
| Jennifer Hsui | ||||
| Types of Accounts | Number | Total Assets | ||
| Other Accounts | 0 | N/A | ||
| Accounts with Incentive-Based Fee Arrangements | 0 | N/A |
| Alan Mason | ||||
| Types of Accounts | Number | Total Assets | ||
| Registered Investment Companies | 336 | $743,866,000,000 | ||
| Other Pooled Investment Vehicles | 285 | 574,676,000,000 | ||
| Other Accounts | 185 | 39,352,000,000 | ||
| Accounts with Incentive-Based Fee Arrangements | 0 | N/A |
| Greg Savage | ||||
| Types of Accounts | Number | Total Assets | ||
| Registered Investment Companies | 309 | $736,846,000,000 | ||
| Other Pooled Investment Vehicles | 75 | 26,632,000,000 | ||
| Other Accounts | 0 | N/A | ||
| Accounts with Incentive-Based Fee Arrangements | 0 | N/A |
| Diane Hsiung | ||||
| Types of Accounts | Number
of Other Accounts with Performance Fees Managed by Portfolio Manager |
Aggregate
of Total Assets | ||
| Registered Investment Companies | 0 | N/A | ||
| Other Pooled Investment Vehicles | 0 | N/A | ||
| Other Accounts | 0 | N/A |
| Jennifer Hsui | ||||
| Types of Accounts | Number
of Other Accounts with Performance Fees Managed by Portfolio Manager |
Aggregate
of Total Assets | ||
| Registered Investment Companies | 0 | N/A | ||
| Other Pooled Investment Vehicles | 0 | N/A | ||
| Other Accounts | 0 | N/A |
| Alan Mason | ||||
| Types of Accounts | Number
of Other Accounts with Performance Fees Managed by Portfolio Manager |
Aggregate
of Total Assets | ||
| Registered Investment Companies | 0 | N/A | ||
| Other Pooled Investment Vehicles | 0 | N/A | ||
| Other Accounts | 0 | N/A |
| Greg Savage | ||||
| Types of Accounts | Number
of Other Accounts with Performance Fees Managed by Portfolio Manager |
Aggregate
of Total Assets | ||
| Registered Investment Companies | 0 | N/A | ||
| Other Pooled Investment Vehicles | 0 | N/A | ||
| Other Accounts | 0 | N/A |
| Diane Hsiung | |||||||||||||||
| Dollar Range | |||||||||||||||
| Fund | None | $1 to $10k | $10,001
to $50k |
$50,001
to $100k |
$100,001
to $500k |
$500,001
to $1m |
over
$1m | ||||||||
| iShares MSCI Australia ETF | X | ||||||||||||||
| iShares MSCI Austria Capped ETF | X | ||||||||||||||
| iShares MSCI Belgium Capped ETF | X | ||||||||||||||
| iShares MSCI Canada ETF | X | ||||||||||||||
| iShares MSCI Eurozone ETF | X | ||||||||||||||
| iShares MSCI France ETF | X | ||||||||||||||
| iShares MSCI Germany ETF | X | ||||||||||||||
| iShares MSCI Global Gold Miners ETF | X | ||||||||||||||
| iShares MSCI Global Silver Miners ETF | X | ||||||||||||||
| iShares MSCI Hong Kong ETF | X | ||||||||||||||
| iShares MSCI Israel Capped ETF | X | ||||||||||||||
| iShares MSCI Italy Capped ETF | X | ||||||||||||||
| iShares MSCI Japan ETF | X | ||||||||||||||
| iShares MSCI Japan Small-Cap ETF | X | ||||||||||||||
| iShares MSCI Mexico Capped ETF | X | ||||||||||||||
| iShares MSCI Netherlands ETF | X | ||||||||||||||
| iShares MSCI Pacific ex Japan ETF | X | ||||||||||||||
| iShares MSCI Russia Capped ETF | X | ||||||||||||||
| iShares MSCI Singapore Capped ETF | X | ||||||||||||||
| iShares MSCI South Africa ETF | X | ||||||||||||||
| iShares MSCI Spain Capped ETF | X | ||||||||||||||
| iShares MSCI Sweden Capped ETF | X | ||||||||||||||
| Diane Hsiung | |||||||||||||||
| Dollar Range | |||||||||||||||
| Fund | None | $1 to $10k | $10,001
to $50k |
$50,001
to $100k |
$100,001
to $500k |
$500,001
to $1m |
over
$1m | ||||||||
| iShares MSCI Switzerland Capped ETF | X | ||||||||||||||
| iShares MSCI Thailand Capped ETF | X | ||||||||||||||
| iShares MSCI Turkey ETF | X | ||||||||||||||
| iShares MSCI USA Equal Weighted ETF | X | ||||||||||||||
| iShares MSCI World ETF | X | ||||||||||||||
| Jennifer Hsui | |||||||||||||||
| Dollar Range | |||||||||||||||
| Fund | None | $1 to $10k | $10,001
to $50k |
$50,001
to $100k |
$100,001
to $500k |
$500,001
to $1m |
over
$1m | ||||||||
| iShares MSCI Australia ETF | X | ||||||||||||||
| iShares MSCI Austria Capped ETF | X | ||||||||||||||
| iShares MSCI Belgium Capped ETF | X | ||||||||||||||
| iShares MSCI Canada ETF | X | ||||||||||||||
| iShares MSCI Eurozone ETF | X | ||||||||||||||
| iShares MSCI France ETF | X | ||||||||||||||
| iShares MSCI Germany ETF | X | ||||||||||||||
| iShares MSCI Global Gold Miners ETF | X | ||||||||||||||
| iShares MSCI Global Silver Miners ETF | X | ||||||||||||||
| iShares MSCI Hong Kong ETF | X | ||||||||||||||
| iShares MSCI Israel Capped ETF | X | ||||||||||||||
| iShares MSCI Italy Capped ETF | X | ||||||||||||||
| iShares MSCI Japan ETF | X | ||||||||||||||
| iShares MSCI Japan Small-Cap ETF | X | ||||||||||||||
| iShares MSCI Mexico Capped ETF | X | ||||||||||||||
| iShares MSCI Netherlands ETF | X | ||||||||||||||
| iShares MSCI Pacific ex Japan ETF | X | ||||||||||||||
| iShares MSCI Russia Capped ETF | X | ||||||||||||||
| iShares MSCI Singapore Capped ETF | X | ||||||||||||||
| iShares MSCI South Africa ETF | X | ||||||||||||||
| iShares MSCI Spain Capped ETF | X | ||||||||||||||
| iShares MSCI Sweden Capped ETF | X | ||||||||||||||
| iShares MSCI Switzerland Capped ETF | X | ||||||||||||||
| iShares MSCI Thailand Capped ETF | X | ||||||||||||||
| iShares MSCI Turkey ETF | X | ||||||||||||||
| iShares MSCI USA Equal Weighted ETF | X | ||||||||||||||
| iShares MSCI World ETF | X | ||||||||||||||
| Alan Mason | |||||||||||||||
| Dollar Range | |||||||||||||||
| Fund | None | $1 to $10k | $10,001
to $50k |
$50,001
to $100k |
$100,001
to $500k |
$500,001
to $1m |
over
$1m | ||||||||
| iShares MSCI Australia ETF | X | ||||||||||||||
| iShares MSCI Austria Capped ETF | X | ||||||||||||||
| Alan Mason | |||||||||||||||
| Dollar Range | |||||||||||||||
| Fund | None | $1 to $10k | $10,001
to $50k |
$50,001
to $100k |
$100,001
to $500k |
$500,001
to $1m |
over
$1m | ||||||||
| iShares MSCI Belgium Capped ETF | X | ||||||||||||||
| iShares MSCI Canada ETF | X | ||||||||||||||
| iShares MSCI Eurozone ETF | X | ||||||||||||||
| iShares MSCI France ETF | X | ||||||||||||||
| iShares MSCI Germany ETF | X | ||||||||||||||
| iShares MSCI Global Gold Miners ETF | X | ||||||||||||||
| iShares MSCI Global Silver Miners ETF | X | ||||||||||||||
| iShares MSCI Hong Kong ETF | X | ||||||||||||||
| iShares MSCI Israel Capped ETF | X | ||||||||||||||
| iShares MSCI Italy Capped ETF | X | ||||||||||||||
| iShares MSCI Japan ETF | X | ||||||||||||||
| iShares MSCI Japan Small-Cap ETF | X | ||||||||||||||
| iShares MSCI Mexico Capped ETF | X | ||||||||||||||
| iShares MSCI Netherlands ETF | X | ||||||||||||||
| iShares MSCI Pacific ex Japan ETF | X | ||||||||||||||
| iShares MSCI Russia Capped ETF | X | ||||||||||||||
| iShares MSCI Singapore Capped ETF | X | ||||||||||||||
| iShares MSCI South Africa ETF | X | ||||||||||||||
| iShares MSCI Spain Capped ETF | X | ||||||||||||||
| iShares MSCI Sweden Capped ETF | X | ||||||||||||||
| iShares MSCI Switzerland Capped ETF | X | ||||||||||||||
| iShares MSCI Thailand Capped ETF | X | ||||||||||||||
| iShares MSCI Turkey ETF | X | ||||||||||||||
| iShares MSCI USA Equal Weighted ETF | X | ||||||||||||||
| iShares MSCI World ETF | X | ||||||||||||||
| Greg Savage | |||||||||||||||
| Dollar Range | |||||||||||||||
| Fund | None | $1 to $10k | $10,001
to $50k |
$50,001
to $100k |
$100,001
to $500k |
$500,001
to $1m |
over
$1m | ||||||||
| iShares MSCI Australia ETF | X | ||||||||||||||
| iShares MSCI Austria Capped ETF | X | ||||||||||||||
| iShares MSCI Belgium Capped ETF | X | ||||||||||||||
| iShares MSCI Canada ETF | X | ||||||||||||||
| iShares MSCI Eurozone ETF | X | ||||||||||||||
| iShares MSCI France ETF | X | ||||||||||||||
| iShares MSCI Germany ETF | X | ||||||||||||||
| iShares MSCI Global Gold Miners ETF | X | ||||||||||||||
| iShares MSCI Global Silver Miners ETF | X | ||||||||||||||
| iShares MSCI Hong Kong ETF | X | ||||||||||||||
| iShares MSCI Israel Capped ETF | X | ||||||||||||||
| iShares MSCI Italy Capped ETF | X | ||||||||||||||
| iShares MSCI Japan ETF | X | ||||||||||||||
| iShares MSCI Japan Small-Cap ETF | X | ||||||||||||||
| iShares MSCI Mexico Capped ETF | X | ||||||||||||||
| Greg Savage | |||||||||||||||
| Dollar Range | |||||||||||||||
| Fund | None | $1 to $10k | $10,001
to $50k |
$50,001
to $100k |
$100,001
to $500k |
$500,001
to $1m |
over
$1m | ||||||||
| iShares MSCI Netherlands ETF | X | ||||||||||||||
| iShares MSCI Pacific ex Japan ETF | X | ||||||||||||||
| iShares MSCI Russia Capped ETF | X | ||||||||||||||
| iShares MSCI Singapore Capped ETF | X | ||||||||||||||
| iShares MSCI South Africa ETF | X | ||||||||||||||
| iShares MSCI Spain Capped ETF | X | ||||||||||||||
| iShares MSCI Sweden Capped ETF | X | ||||||||||||||
| iShares MSCI Switzerland Capped ETF | X | ||||||||||||||
| iShares MSCI Thailand Capped ETF | X | ||||||||||||||
| iShares MSCI Turkey ETF | X | ||||||||||||||
| iShares MSCI USA Equal Weighted ETF | X | ||||||||||||||
| iShares MSCI World ETF | X | ||||||||||||||
| Fund | Fund
Inception Date |
Administration,
Custodian, Transfer Agency Expenses Paid During Fiscal Year Ended August 31, 2016 |
Administration,
Custodian, Transfer Agency Expenses Paid During Fiscal Year Ended August 31, 2015 |
Administration,
Custodian, Transfer Agency Expenses Paid During Fiscal Year Ended August 31, 2014 | ||||
| iShares MSCI Australia ETF | 03/12/96 | $ 122,545 | $ 132,291 | $ 141,820 | ||||
| iShares MSCI Austria Capped ETF | 03/12/96 | 41,616 | 28,942 | 34,809 | ||||
| iShares MSCI Belgium Capped ETF | 03/12/96 | 45,520 | 34,434 | 23,326 | ||||
| iShares MSCI Canada ETF | 03/12/96 | 125,146 | 129,242 | 157,605 | ||||
| iShares MSCI Eurozone ETF | 07/25/00 | 714,702 | 570,597 | 602,393 | ||||
| iShares MSCI France ETF | 03/12/96 | 55,907 | 45,238 | 48,068 | ||||
| iShares MSCI Germany ETF | 03/12/96 | 296,554 | 346,177 | 323,304 | ||||
| iShares MSCI Global Gold Miners ETF | 01/31/12 | 26,340 | 17,330 | 15,661 | ||||
| iShares MSCI Global Silver Miners ETF | 01/31/12 | 16,296 | 13,830 | 9,093 | ||||
| iShares MSCI Hong Kong ETF | 03/12/96 | 133,680 | 209,256 | 131,149 | ||||
| iShares MSCI Israel Capped ETF | 03/26/08 | 83,416 | 75,942 | 77,890 | ||||
| iShares MSCI Italy Capped ETF | 03/12/96 | 72,644 | 73,306 | 85,505 | ||||
| iShares MSCI Japan ETF | 03/12/96 | 494,336 | 476,657 | 399,207 | ||||
| iShares MSCI Japan Small-Cap ETF | 12/20/07 | 24,007 | 11,644 | 22,798 | ||||
| iShares MSCI Mexico Capped ETF | 03/12/96 | 175,529 | 253,667 | 320,989 | ||||
| iShares MSCI Netherlands ETF | 03/12/96 | 29,401 | 24,143 | 31,460 | ||||
| iShares MSCI Pacific ex Japan ETF | 10/25/01 | 191,087 | 235,690 | 321,809 | ||||
| iShares MSCI Russia Capped ETF | 11/09/10 | 500,149 | 432,003 | 596,265 | ||||
| iShares MSCI Singapore Capped ETF | 03/12/96 | 107,423 | 124,087 | 233,767 | ||||
| iShares MSCI South Africa ETF | 02/03/03 | 60,034 | 63,866 | 77,192 | ||||
| iShares MSCI Spain Capped ETF | 03/12/96 | 71,352 | 108,761 | 97,458 | ||||
| iShares MSCI Sweden Capped ETF | 03/12/96 | 32,944 | 39,115 | 45,895 | ||||
| iShares MSCI Switzerland Capped ETF | 03/12/96 | 85,893 | 82,377 | 71,424 | ||||
| iShares MSCI Thailand Capped ETF | 03/26/08 | 63,804 | 70,441 | 79,972 | ||||
| iShares MSCI Turkey ETF | 03/26/08 | 118,326 | 147,844 | 173,362 | ||||
| iShares MSCI USA Equal Weighted ETF | 05/05/10 | 18,174 | 9,516 | 14,126 | ||||
| iShares MSCI World ETF | 01/10/12 | 32,614 | 41,325 | 30,622 |
| Fund | Fund
Inception Date |
Distributor
Compensation Paid During Fiscal Year Ended August 31, 2016 |
Distributor
Compensation Paid During Fiscal Year Ended August 31, 2015 |
Distributor
Compensation Paid During Fiscal Year Ended August 31, 20141 | |||
| iShares MSCI Australia ETF | 03/12/96 | $0 | $0 | $6,438 | |||
| iShares MSCI Austria Capped ETF | 03/12/96 | 0 | 0 | 6,438 | |||
| iShares MSCI Belgium Capped ETF | 03/12/96 | 0 | 0 | 6,438 | |||
| iShares MSCI Canada ETF | 03/12/96 | 0 | 0 | 6,438 | |||
| iShares MSCI Eurozone ETF | 07/25/00 | 0 | 0 | 6,438 | |||
| iShares MSCI France ETF | 03/12/96 | 0 | 0 | 6,438 | |||
| iShares MSCI Germany ETF | 03/12/96 | 0 | 0 | 6,438 | |||
| iShares MSCI Global Gold Miners ETF | 01/31/12 | 0 | 0 | 6,438 | |||
| iShares MSCI Global Silver Miners ETF | 01/31/12 | 0 | 0 | 6,438 | |||
| iShares MSCI Hong Kong ETF | 03/12/96 | 0 | 0 | 6,438 | |||
| iShares MSCI Israel Capped ETF | 03/26/08 | 0 | 0 | 6,438 | |||
| iShares MSCI Italy Capped ETF | 03/12/96 | 0 | 0 | 6,438 | |||
| iShares MSCI Japan ETF | 03/12/96 | 0 | 0 | 6,438 | |||
| iShares MSCI Japan Small-Cap ETF | 12/20/07 | 0 | 0 | 6,438 | |||
| iShares MSCI Mexico Capped ETF | 03/12/96 | 0 | 0 | 6,438 | |||
| iShares MSCI Netherlands ETF | 03/12/96 | 0 | 0 | 6,438 | |||
| iShares MSCI Pacific ex Japan ETF | 10/25/01 | 0 | 0 | 6,438 | |||
| iShares MSCI Russia Capped ETF | 11/09/10 | 0 | 0 | 6,438 | |||
| iShares MSCI Singapore Capped ETF | 03/12/96 | 0 | 0 | 6,438 | |||
| iShares MSCI South Africa ETF | 02/03/03 | 0 | 0 | 6,438 | |||
| iShares MSCI Spain Capped ETF | 03/12/96 | 0 | 0 | 6,438 | |||
| iShares MSCI Sweden Capped ETF | 03/12/96 | 0 | 0 | 6,438 | |||
| iShares MSCI Switzerland Capped ETF | 03/12/96 | 0 | 0 | 6,438 | |||
| iShares MSCI Thailand Capped ETF | 03/26/08 | 0 | 0 | 6,438 | |||
| iShares MSCI Turkey ETF | 03/26/08 | 0 | 0 | 6,438 | |||
| iShares MSCI USA Equal Weighted ETF | 05/05/10 | 0 | 0 | 6,438 | |||
| iShares MSCI World ETF | 01/10/12 | 0 | 0 | 6,438 |
| 1 | These fees reflect payments made to SEI, acting as an agent of the Distributor. |
| Fund | Fund
Inception Date |
Brokerage
Commissions Paid During Fiscal Year Ended August 31, 2016 |
Brokerage
Commissions Paid During Fiscal Year Ended August 31, 2015 |
Brokerage
Commissions Paid During Fiscal Year Ended August 31, 2014 | ||||
| iShares MSCI Australia ETF | 03/12/96 | $ 26,846 | $ 68,464 | $ 53,580 | ||||
| iShares MSCI Austria Capped ETF | 03/12/96 | 1,425 | 1,778 | 6,450 | ||||
| iShares MSCI Belgium Capped ETF | 03/12/96 | 7,927 | 1,285 | 1,923 | ||||
| iShares MSCI Canada ETF | 03/12/96 | 38,919 | 47,160 | 63,082 | ||||
| iShares MSCI Eurozone ETF | 07/25/00 | 88,817 | 129,361 | 172,276 | ||||
| iShares MSCI France ETF | 03/12/96 | 6,018 | 9,699 | 8,063 | ||||
| iShares MSCI Germany ETF | 03/12/96 | 43,771 | 57,810 | 128,152 | ||||
| iShares MSCI Global Gold Miners ETF | 01/31/12 | 12,194 | 4,138 | 1,508 | ||||
| iShares MSCI Global Silver Miners ETF | 01/31/12 | 24,717 | 8,557 | 334 | ||||
| iShares MSCI Hong Kong ETF | 03/12/96 | 28,655 | 132,602 | 41,857 | ||||
| iShares MSCI Israel Capped ETF | 03/26/08 | 23,272 | 11,791 | 6,192 | ||||
| iShares MSCI Italy Capped ETF | 03/12/96 | 31,398 | 56,309 | 104,773 | ||||
| iShares MSCI Japan ETF | 03/12/96 | 186,608 | 149,528 | 94,146 | ||||
| iShares MSCI Japan Small-Cap ETF | 12/20/07 | 4,991 | 4,292 | 12,828 | ||||
| iShares MSCI Mexico Capped ETF | 03/12/96 | 72,211 | 265,575 | 159,405 | ||||
| iShares MSCI Netherlands ETF | 03/12/96 | 8,703 | 4,403 | 5,197 | ||||
| iShares MSCI Pacific ex Japan ETF | 10/25/01 | 23,397 | 82,176 | 104,974 | ||||
| iShares MSCI Russia Capped ETF | 11/09/10 | 40,037 | 34,551 | 26,540 | ||||
| iShares MSCI Singapore Capped ETF | 03/12/96 | 22,514 | 29,394 | 28,518 | ||||
| iShares MSCI South Africa ETF | 02/03/03 | 18,575 | 11,229 | 13,691 | ||||
| iShares MSCI Spain Capped ETF | 03/12/96 | 29,771 | 61,447 | 75,194 | ||||
| iShares MSCI Sweden Capped ETF | 03/12/96 | 6,213 | 6,193 | 14,446 | ||||
| iShares MSCI Switzerland Capped ETF | 03/12/96 | 15,801 | 31,670 | 15,689 | ||||
| iShares MSCI Thailand Capped ETF | 03/26/08 | 43,852 | 28,314 | 42,185 | ||||
| iShares MSCI Turkey ETF | 03/26/08 | 13,950 | 20,803 | 48,753 | ||||
| iShares MSCI USA Equal Weighted ETF | 05/05/10 | 1,174 | 1,466 | 1,144 | ||||
| iShares MSCI World ETF | 01/10/12 | 2,099 | 2,496 | 2,325 |
| Fund | Issuer | Market
Value of Investment | ||
| iShares MSCI Eurozone ETF | Societe Generale SA | $ 63,523,530 | ||
| ABN AMRO Group NV | $ 10,649,738 | |||
| iShares MSCI France ETF | Societe Generale SA | $ 7,759,054 | ||
| iShares MSCI Japan ETF | Nomura Holdings Inc. | $ 81,670,510 | ||
| iShares MSCI Netherlands Capped ETF | ABN AMRO Group NV | $ 2,038,498 | ||
| iShares MSCI Switzerland Capped ETF | UBS Group, AG | $48,822,222 | ||
| Credit Suisse Group AG | $ 24,367,904 | |||
| iShares MSCI USA Equal Weighted ETF | Bank of America Corp. | $ 125,101 | ||
| Goldman Sachs Group, Inc. (The) | $ 123,536 | |||
| Citigroup, Inc. | $ 122,596 |
| Fund | Issuer | Market
Value of Investment | ||
| JPMorgan Chase & Co. | $ 122,580 | |||
| iShares MSCI World ETF | JPMorgan Chase & Co. | $2,084,400 | ||
| Bank of America Corp. | $ 1,417,738 | |||
| HSBC Holdings PLC | $ 1,241,331 | |||
| Citigroup, Inc. | $ 1,193,500 | |||
| Goldman Sachs Group, Inc. (The) | $ 542,272 | |||
| UBS Group, AG | $ 458,056 | |||
| Societe Generale SA | $ 234,148 | |||
| Nomura Holdings Inc. | $ 226,136 | |||
| Credit Suisse Group AG | $ 204,532 |
| Fund | Fiscal
Year Ended August 31, 2016 |
Fiscal
Year Ended August 31, 2015 | ||
| iShares MSCI Australia ETF | 7% | 9% | ||
| iShares MSCI Austria Capped ETF | 15% | 18% | ||
| iShares MSCI Belgium Capped ETF | 19% | 7% | ||
| iShares MSCI Canada ETF | 4% | 5% | ||
| iShares MSCI Eurozone ETF | 4% | 5% | ||
| iShares MSCI France ETF | 6% | 6% | ||
| iShares MSCI Germany ETF | 3% | 3% | ||
| iShares MSCI Global Gold Miners ETF | 30% | 20% | ||
| iShares MSCI Global Silver Miners ETF | 27% | 31% | ||
| iShares MSCI Hong Kong ETF | 9% | 7% | ||
| iShares MSCI Israel Capped ETF | 46% | 14% | ||
| iShares MSCI Italy Capped ETF | 16% | 22% | ||
| iShares MSCI Japan ETF | 4% | 2% | ||
| iShares MSCI Japan Small-Cap ETF | 12% | 10% | ||
| iShares MSCI Mexico Capped ETF | 8% | 13% | ||
| iShares MSCI Netherlands ETF | 24% | 6% | ||
| iShares MSCI Pacific ex Japan ETF | 6% | 7% |
| Fund | Fiscal
Year Ended August 31, 2016 |
Fiscal
Year Ended August 31, 2015 | ||
| iShares MSCI Russia Capped ETF | 23% | 19% | ||
| iShares MSCI Singapore Capped ETF | 7% | 10% | ||
| iShares MSCI South Africa ETF | 12% | 9% | ||
| iShares MSCI Spain Capped ETF | 9% | 15% | ||
| iShares MSCI Sweden Capped ETF | 7% | 4% | ||
| iShares MSCI Switzerland Capped ETF | 6% | 7% | ||
| iShares MSCI Thailand Capped ETF | 16% | 13% | ||
| iShares MSCI Turkey ETF | 6% | 6% | ||
| iShares MSCI USA Equal Weighted ETF | 28% | 39% | ||
| iShares MSCI World ETF | 5% | 5% |
| Fund | Shares
Per Creation Unit |
Value
Per Creation Unit (U.S.$) | ||
| iShares MSCI Australia ETF | 200,000 | $4,158,000 | ||
| iShares MSCI Austria Capped ETF | 100,000 | 1,633,000 | ||
| iShares MSCI Belgium Capped ETF | 80,000 | 1,508,000 | ||
| iShares MSCI Canada ETF | 100,000 | 2,561,000 | ||
| iShares MSCI Eurozone ETF | 100,000 | 3,450,000 | ||
| iShares MSCI France ETF | 200,000 | 4,828,000 | ||
| iShares MSCI Germany ETF | 300,000 | 7,881,000 | ||
| iShares MSCI Global Gold Miners ETF1 | 50,000 | 1,053,600 | ||
| iShares MSCI Global Silver Miners ETF | 100,000 | 1,420,000 | ||
| iShares MSCI Hong Kong ETF | 75,000 | 1,637,250 | ||
| iShares MSCI Israel Capped ETF | 50,000 | 2,416,500 | ||
| iShares MSCI Italy Capped ETF1 | 75,000 | 1,633,100 | ||
| iShares MSCI Japan ETF1 | 150,000 | 7,449,600 | ||
| iShares MSCI Japan Small-Cap ETF | 100,000 | 6,425,000 | ||
| iShares MSCI Mexico Capped ETF | 100,000 | 4,860,000 | ||
| iShares MSCI Netherlands ETF | 50,000 | 1,253,500 | ||
| iShares MSCI Pacific ex Japan ETF | 300,000 | 12,603,000 | ||
| iShares MSCI Russia Capped ETF1 | 50,000 | 1,402,000 | ||
| iShares MSCI Singapore Capped ETF1 | 50,000 | 1,033,500 | ||
| iShares MSCI South Africa ETF | 100,000 | 5,580,000 | ||
| iShares MSCI Spain Capped ETF | 75,000 | 2,013,000 | ||
| iShares MSCI Sweden Capped ETF | 75,000 | 2,184,000 | ||
| iShares MSCI Switzerland Capped ETF | 125,000 | 3,816,250 | ||
| iShares MSCI Thailand Capped ETF | 50,000 | 3,648,000 | ||
| iShares MSCI Turkey ETF | 50,000 | 1,890,000 | ||
| iShares MSCI USA Equal Weighted ETF | 50,000 | 2,298,500 | ||
| iShares MSCI World ETF | 100,000 | 7,252,000 |
| 1 | For the iShares MSCI Global Gold Miners ETF, iShares MSCI Italy Capped ETF, iShares MSCI Japan ETF, iShares MSCI Russia Capped ETF and iShares MSCI Singapore Capped ETF, the shares per creation unit and the value per creation unit are as of November 7, 2016. |
| Fund | Standard
Creation Transaction Fee |
Maximum
Additional Charge* | ||
| iShares MSCI Australia ETF | $ 2,400 | 3.0% | ||
| iShares MSCI Austria Capped ETF | 600 | 3.0% | ||
| iShares MSCI Belgium Capped ETF | 700 | 3.0% | ||
| iShares MSCI Canada ETF | 1,900 | 3.0% | ||
| iShares MSCI Eurozone ETF | 7,500 | 3.0% | ||
| iShares MSCI France ETF | 2,900 | 3.0% | ||
| iShares MSCI Germany ETF | 1,500 | 3.0% | ||
| iShares MSCI Global Gold Miners ETF | 800 | 7.0% | ||
| iShares MSCI Global Silver Miners ETF | 500 | 7.0% | ||
| iShares MSCI Hong Kong ETF | 2,000 | 7.0% | ||
| iShares MSCI Israel Capped ETF | 3,300 | 3.0% | ||
| iShares MSCI Italy Capped ETF | 1,400 | 3.0% | ||
| iShares MSCI Japan ETF | 5,000 | 3.0% | ||
| iShares MSCI Japan Small-Cap ETF | 6,000 | 3.0% | ||
| iShares MSCI Mexico Capped ETF | 1,400 | 3.0% | ||
| iShares MSCI Netherlands ETF | 1,000 | 3.0% | ||
| iShares MSCI Pacific ex Japan ETF | 6,000 | 7.0% | ||
| iShares MSCI Russia Capped ETF | 2,300 | 3.0% | ||
| iShares MSCI Singapore Capped ETF | 2,000 | 3.0% | ||
| iShares MSCI South Africa ETF | 1,200 | 3.0% | ||
| iShares MSCI Spain Capped ETF | 1,500 | 3.0% | ||
| iShares MSCI Sweden Capped ETF | 1,300 | 3.0% | ||
| iShares MSCI Switzerland Capped ETF | 1,500 | 3.0% | ||
| iShares MSCI Thailand Capped ETF | 1,700 | 3.0% | ||
| iShares MSCI Turkey ETF | 1,600 | 3.0% | ||
| iShares MSCI USA Equal Weighted ETF | 1,500 | 3.0% | ||
| iShares MSCI World ETF | 15,000 | 7.0% |
| * | As a percentage of the net asset value per Creation Unit. |
| Fund | Standard
Redemption Transaction Fee |
Maximum
Additional Charge* | ||
| iShares MSCI Australia ETF | $ 2,400 | 2.0% | ||
| iShares MSCI Austria Capped ETF | 600 | 2.0% | ||
| iShares MSCI Belgium Capped ETF | 700 | 2.0% | ||
| iShares MSCI Canada ETF | 1,900 | 2.0% | ||
| iShares MSCI Eurozone ETF | 7,500 | 2.0% | ||
| iShares MSCI France ETF | 2,900 | 2.0% | ||
| iShares MSCI Germany ETF | 1,500 | 2.0% | ||
| iShares MSCI Global Gold Miners ETF | 800 | 2.0% | ||
| iShares MSCI Global Silver Miners ETF | 500 | 2.0% | ||
| iShares MSCI Hong Kong ETF | 2,000 | 2.0% | ||
| iShares MSCI Israel Capped ETF | 3,300 | 2.0% | ||
| iShares MSCI Italy Capped ETF | 1,400 | 2.0% | ||
| iShares MSCI Japan ETF | 5,000 | 2.0% | ||
| iShares MSCI Japan Small-Cap ETF | 6,000 | 2.0% | ||
| iShares MSCI Mexico Capped ETF | 1,400 | 2.0% | ||
| iShares MSCI Netherlands ETF | 1,000 | 2.0% | ||
| iShares MSCI Pacific ex Japan ETF | 6,000 | 2.0% | ||
| iShares MSCI Russia Capped ETF | 2,300 | 2.0% | ||
| iShares MSCI Singapore Capped ETF | 2,000 | 2.0% | ||
| iShares MSCI South Africa ETF | 1,200 | 2.0% | ||
| iShares MSCI Spain Capped ETF | 1,500 | 2.0% | ||
| iShares MSCI Sweden Capped ETF | 1,300 | 2.0% | ||
| iShares MSCI Switzerland Capped ETF | 1,500 | 2.0% | ||
| iShares MSCI Thailand Capped ETF | 1,700 | 2.0% | ||
| iShares MSCI Turkey ETF | 1,600 | 2.0% | ||
| iShares MSCI USA Equal Weighted ETF | 1,500 | 2.0% | ||
| iShares MSCI World ETF | 15,000 | 2.0% |
| * | As a percentage of the net asset value per Creation Unit, inclusive of the standard redemption transaction fee. |
| Fund | Non-Expiring 1 | Expiring
2017 |
Expiring
2018 |
Expiring
2019 |
Total | |||||
| iShares MSCI Australia ETF | $ 137,537,973 | $ 24,006,125 | $ 23,348,244 | $ 12,127,364 | $197,019,706 | |||||
| iShares MSCI Austria Capped ETF | 32,264,922 | 7,102,366 | 16,657,011 | 13,826,937 | 69,851,236 | |||||
| iShares MSCI Belgium Capped ETF | 12,888,603 | 5,953,120 | 10,826,174 | 19,023,517 | 48,691,414 | |||||
| iShares MSCI Canada ETF | 272,374,434 | 27,886,883 | 68,928,677 | 14,903,919 | 384,093,913 | |||||
| iShares MSCI Eurozone ETF | 94,683,428 | 26,644,200 | 68,035,542 | 30,230,739 | 219,593,909 | |||||
| iShares MSCI France ETF | 26,988,853 | 3,408,374 | 7,008,530 | 2,858,814 | 40,264,571 | |||||
| iShares MSCI Germany ETF | 41,405,856 | 27,790,050 | 28,490,949 | 32,215,954 | 129,902,809 | |||||
| iShares MSCI Global Gold Miners ETF | 13,627,904 | — | — | — | 13,627,904 | |||||
| iShares MSCI Global Silver Miners ETF | 3,202,603 | — | — | — | 3,202,603 | |||||
| iShares MSCI Hong Kong ETF | 222,203,643 | 29,235,556 | 114,836,904 | 34,565,959 | 400,842,062 | |||||
| iShares MSCI Israel Capped ETF | 19,023,801 | 784,479 | 10,801,191 | 7,130,249 | 37,739,720 | |||||
| iShares MSCI Italy Capped ETF | 68,671,316 | 2,743,650 | 18,169,627 | 9,459,662 | 99,044,255 | |||||
| iShares MSCI Japan ETF | 371,710,340 | 116,295,478 | 173,577,101 | 139,228,194 | 800,811,113 | |||||
| iShares MSCI Japan Small-Cap ETF | 3,140,817 | 131,718 | 541,322 | 203,697 | 4,017,554 | |||||
| iShares MSCI Mexico Capped ETF | 134,670,245 | 8,973,988 | 2,789,471 | 22,863,665 | 169,297,369 | |||||
| iShares MSCI Netherlands ETF | 10,460,395 | 5,819,153 | 22,256,170 | 2,329,005 | 40,864,723 | |||||
| iShares MSCI Pacific ex Japan ETF | 264,867,220 | 66,207,828 | 104,799,503 | 36,600,987 | 472,475,538 | |||||
| iShares MSCI Russia Capped ETF | 48,854,119 | — | — | — | 48,854,119 | |||||
| iShares MSCI Singapore Capped ETF | 53,847,762 | 15,680,510 | 132,420,824 | 11,588,528 | 213,537,624 | |||||
| iShares MSCI South Africa ETF | 50,591,544 | 15,339,464 | 14,856,365 | 6,137,142 | 86,924,515 | |||||
| iShares MSCI Spain Capped ETF | 51,684,017 | 5,946,927 | 15,120,672 | 8,619,903 | 81,371,519 | |||||
| iShares MSCI Sweden Capped ETF | 14,620,306 | 13,686,746 | 8,483,510 | 5,244,977 | 42,035,539 | |||||
| iShares MSCI Switzerland Capped ETF | 15,786,844 | 2,837,786 | 22,569,380 | 6,955,758 | 48,149,768 | |||||
| iShares MSCI Thailand Capped ETF | 12,695,752 | 555,444 | 2,321,428 | 1,304,910 | 16,877,534 | |||||
| iShares MSCI Turkey ETF | 43,587,314 | 720,636 | 5,982,737 | 3,859,184 | 54,149,871 | |||||
| iShares MSCI USA Equal Weighted ETF | 1,654,423 | — | — | — | 1,654,423 | |||||
| iShares MSCI World ETF | 514,129 | — | — | — | 514,129 |
| 1 | Must be utilized prior to losses subject to expiration. |
iShares MSCI Germany ETF
iShares MSCI Hong Kong ETF
iShares MSCI Japan ETF
iShares MSCI Japan Small-Cap ETF
iShares MSCI Mexico Capped ETF
iShares MSCI Thailand Capped ETF
iShares MSCI USA Equal Weighted ETF
| 1 | iShares MSCI ACWI Low Carbon Target ETF, iShares MSCI All Peru Capped ETF, iShares MSCI EAFE ESG Optimized ETF, iShares MSCI EM ESG Optimized ETF, iShares MSCI Global Impact ETF, iShares MSCI KLD 400 Social ETF and iShares MSCI USA ESG Select ETF have separate Fund Proxy Voting Policies. |
| • | Boards and directors |
| • | Auditors and audit-related issues |
| • | Capital structure, mergers, asset sales and other special transactions |
| • | Remuneration and benefits |
| • | Social, ethical and environmental issues |
| • | General corporate governance matters |
| • | establishing an appropriate corporate governance structure; |
| • | supporting and overseeing management in setting strategy; |
| • | ensuring the integrity of financial statements; |
| • | making decisions regarding mergers, acquisitions and disposals; |
| • | establishing appropriate executive compensation structures; and |
| • | addressing business issues including social, ethical and environmental issues when they have the potential to materially impact company reputation and performance. |
| • | current employment at the company or a subsidiary; |
| • | former employment within the past several years as an executive of the company; |
| • | providing substantial professional services to the company and/or members of the company’s management; |
| • | having had a substantial business relationship in the past three years; |
| • | having, or representing a shareholder with, a substantial shareholding in the company; |
| • | being an immediate family member of any of the aforementioned; and |
| • | interlocking directorships. |
| • | BlackRock has adopted a proxy voting oversight structure whereby the Corporate Governance Committees oversee the voting decisions and other activities of the Corporate Governance Group, and particularly its activities with respect to voting in the relevant region of each Corporate Governance Committee’s jurisdiction. |
| • | The Corporate Governance Committees have adopted Guidelines for each region, which set forth the firm’s views with respect to certain corporate governance and other issues that typically arise in the proxy voting context. The Corporate Governance Committees receive periodic reports regarding the specific votes cast by the Corporate Governance Group and regular updates on material process issues, procedural changes and other matters of concern to the Corporate Governance Committees. |
| • | BlackRock’s Global Corporate Governance Oversight Committee oversees the Global Head, the Corporate Governance Group and the Corporate Governance Committees. The Global Corporate Governance Oversight Committee conducts a review, at least annually, of the proxy voting process to ensure compliance with BlackRock’s risk policies and procedures. |
| • | BlackRock maintains a reporting structure that separates the Global Head and Corporate Governance Group from employees with sales responsibilities. In addition, BlackRock maintains procedures intended to ensure that all engagements with corporate issuers or dissident shareholders are managed consistently and without regard to BlackRock’s relationship with the issuer of the proxy or dissident shareholder. Within the normal course of business, the Global Head or Corporate Governance Group may engage directly with BlackRock clients, and with employees with sales responsibilities, in discussions regarding general corporate governance policy matters, and to otherwise ensure that proxy-related client service levels are met. The Global Head or Corporate Governance Group does not discuss any specific voting matter with a client prior to the disclosure of the vote decision to all applicable clients after the shareholder meeting has taken place, except if the client is acting in the capacity as issuer of the proxy or dissident shareholder and is engaging through the established procedures independent of the client relationship. |
| • | In certain instances, BlackRock may determine to engage an independent fiduciary to vote proxies as a further safeguard to avoid potential conflicts of interest or as otherwise required by applicable law. The independent fiduciary may either vote such proxies or provide BlackRock with instructions as to how to vote such proxies. In the latter case, BlackRock votes the proxy in accordance with the independent fiduciary’s determination. Use of an independent fiduciary has been |
| adopted for voting the proxies related to any company that is affiliated with BlackRock or any company that includes BlackRock employees on its board of directors. |
| 2016 | ||||||
| Country | Trade
Date |
Settlement
Date |
Number
of Days to Settle | |||
| Australia | 03/22/16 | 03/30/16 | 8 | |||
| 12/20/16 | 12/29/16 | 9 | ||||
| 12/21/16 | 01/03/17 | 12 | ||||
| 12/22/16 | 01/04/17 | 13 | ||||
| Bahrain | 09/07/16 | 09/15/16 | 8 | |||
| 09/08/16 | 09/18/16 | 10 | ||||
| Bangladesh | 06/29/16 | 07/10/16 | 11 | |||
| 09/06/16 | 09/15/16 | 9 | ||||
| 09/07/16 | 09/18/16 | 11 | ||||
| 09/08/16 | 09/19/16 | 11 | ||||
| 2016 | ||||||
| Country | Trade
Date |
Settlement
Date |
Number
of Days to Settle | |||
| Brazil | 02/03/16 | 02/11/16 | 8 | |||
| 02/04/16 | 02/12/16 | 8 | ||||
| 02/05/16 | 02/15/16 | 10 | ||||
| China | 02/03/16 | 02/17/16 | 14 | |||
| 02/04/16 | 02/18/16 | 14 | ||||
| 02/05/16 | 02/19/16 | 14 | ||||
| 04/27/16 | 05/09/16 | 12 | ||||
| 04/28/16 | 05/10/16 | 12 | ||||
| 04/29/16 | 05/11/16 | 12 | ||||
| 09/28/16 | 10/11/16 | 13 | ||||
| 09/29/16 | 10/12/16 | 13 | ||||
| 09/30/16 | 10/13/16 | 13 | ||||
| Colombia | 03/18/16 | 03/28/16 | 10 | |||
| Costa Rica | 12/21/16 | 01/02/17 | 12 | |||
| 12/22/16 | 01/03/17 | 12 | ||||
| 12/23/16 | 01/04/17 | 12 | ||||
| Ghana | 06/30/16 | 07/08/16 | 8 | |||
| Indonesia | 06/29/16 | 07/11/16 | 12 | |||
| 06/30/16 | 07/12/16 | 12 | ||||
| 07/01/16 | 07/13/16 | 12 | ||||
| Ireland | 12/21/16 | 12/29/16 | 8 | |||
| 12/22/16 | 01/03/17 | 12 | ||||
| Israel | 04/20/16 | 05/01/16 | 11 | |||
| 04/21/16 | 05/02/16 | 11 | ||||
| 10/10/16 | 10/25/16 | 15 | ||||
| 10/13/16 | 10/26/16 | 13 | ||||
| Japan | 04/27/16 | 05/06/16 | 9 | |||
| 04/28/16 | 05/09/16 | 11 | ||||
| 05/02/16 | 05/10/16 | 8 | ||||
| Jordan | 06/30/16 | 07/11/16 | 11 | |||
| 07/03/16 | 07/12/16 | 9 | ||||
| 09/07/16 | 09/18/16 | 11 | ||||
| 09/08/16 | 09/19/16 | 11 | ||||
| Kuwait | 09/06/16 | 09/15/16 | 9 | |||
| 09/07/16 | 09/18/16 | 11 | ||||
| Lebanon | 07/01/16 | 7/11/16 | 10 | |||
| 07/04/16 | 7/12/16 | 8 | ||||
| 07/05/16 | 7/13/16 | 8 | ||||
| 2016 | ||||||
| Country | Trade
Date |
Settlement
Date |
Number
of Days to Settle | |||
| Malawi | 01/08/16 | 01/18/16 | 10 | |||
| 01/11/16 | 01/19/16 | 8 | ||||
| 01/12/16 | 01/20/16 | 8 | ||||
| 01/13/16 | 01/21/16 | 8 | ||||
| 01/14/16 | 01/22/16 | 8 | ||||
| 02/25/16 | 03/04/16 | 8 | ||||
| 02/26/16 | 03/07/16 | 10 | ||||
| 02/29/16 | 03/08/16 | 8 | ||||
| 03/01/16 | 03/09/16 | 8 | ||||
| 03/02/16 | 03/10/16 | 8 | ||||
| 03/18/16 | 03/29/16 | 11 | ||||
| 03/21/16 | 03/30/16 | 9 | ||||
| 03/22/16 | 03/31/16 | 9 | ||||
| 03/23/16 | 04/01/16 | 9 | ||||
| 03/24/16 | 04/04/16 | 11 | ||||
| 04/25/16 | 05/03/16 | 8 | ||||
| 04/26/16 | 05/04/16 | 8 | ||||
| 04/27/16 | 05/05/16 | 8 | ||||
| 04/28/16 | 05/06/16 | 8 | ||||
| 04/29/16 | 05/09/16 | 10 | ||||
| 06/07/16 | 06/15/16 | 8 | ||||
| 06/08/16 | 06/16/16 | 8 | ||||
| 06/09/16 | 06/17/16 | 8 | ||||
| 06/10/16 | 06/20/16 | 10 | ||||
| 06/13/16 | 06/21/16 | 8 | ||||
| 06/29/16 | 07/08/16 | 10 | ||||
| 06/30/16 | 07/11/16 | 11 | ||||
| 07/01/16 | 07/12/16 | 11 | ||||
| 07/04/16 | 07/13/16 | 9 | ||||
| 07/05/16 | 07/14/16 | 9 | ||||
| 12/19/16 | 12/27/16 | 8 | ||||
| 12/20/16 | 12/28/16 | 8 | ||||
| 12/21/16 | 12/29/16 | 8 | ||||
| 12/22/16 | 12/30/16 | 8 | ||||
| 12/23/16 | 01/03/17 | 11 | ||||
| 12/27/16 | 01/04/17 | 8 | ||||
| 12/28/16 | 01/05/17 | 8 | ||||
| 12/29/16 | 01/06/17 | 8 | ||||
| 12/30/16 | 01/09/17 | 10 | ||||
| Malaysia | 07/01/16 | 07/11/16 | 10 | |||
| 07/04/16 | 07/12/16 | 8 | ||||
| 07/05/16 | 07/13/16 | 8 | ||||
| Mexico | 03/18/16 | 03/28/16 | 10 | |||
| Morocco | 09/07/16 | 09/15/16 | 8 | |||
| 09/08/16 | 09/16/16 | 8 | ||||
| 09/09/16 | 09/19/16 | 10 | ||||
| 2016 | ||||||
| Country | Trade
Date |
Settlement
Date |
Number
of Days to Settle | |||
| Namibia | 03/14/16 | 03/22/16 | 8 | |||
| 03/15/16 | 03/23/16 | 8 | ||||
| 03/16/16 | 03/24/16 | 8 | ||||
| 03/17/16 | 03/29/16 | 12 | ||||
| 03/18/16 | 03/30/16 | 12 | ||||
| 03/22/16 | 03/31/16 | 9 | ||||
| 03/23/16 | 04/01/16 | 9 | ||||
| 03/24/16 | 04/04/16 | 11 | ||||
| 04/20/16 | 04/28/16 | 8 | ||||
| 04/21/16 | 04/29/16 | 8 | ||||
| 04/22/16 | 05/03/16 | 11 | ||||
| 04/25/16 | 05/06/16 | 11 | ||||
| 04/26/16 | 05/09/16 | 13 | ||||
| 04/28/16 | 05/10/16 | 12 | ||||
| 04/29/16 | 05/11/16 | 12 | ||||
| 05/03/16 | 05/12/16 | 9 | ||||
| 05/18/16 | 05/26/16 | 8 | ||||
| 05/19/16 | 05/27/16 | 8 | ||||
| 05/20/16 | 05/30/16 | 10 | ||||
| 05/23/16 | 05/31/16 | 8 | ||||
| 05/24/16 | 06/01/16 | 8 | ||||
| 06/09/16 | 06/17/16 | 8 | ||||
| 06/10/16 | 06/20/16 | 10 | ||||
| 06/13/16 | 06/21/16 | 8 | ||||
| 06/14/16 | 06/22/16 | 8 | ||||
| 06/15/16 | 06/23/16 | 8 | ||||
| 08/02/16 | 08/10/16 | 8 | ||||
| 08/03/16 | 08/11/16 | 8 | ||||
| 08/04/16 | 08/12/16 | 8 | ||||
| 08/05/16 | 08/15/16 | 10 | ||||
| 08/08/16 | 08/16/16 | 8 | ||||
| 08/19/16 | 08/29/16 | 10 | ||||
| 08/22/16 | 08/30/16 | 8 | ||||
| 08/23/16 | 08/31/16 | 8 | ||||
| 08/24/16 | 09/01/16 | 8 | ||||
| 08/25/16 | 09/02/16 | 8 | ||||
| 12/09/16 | 12/19/16 | 10 | ||||
| 12/12/16 | 12/20/16 | 8 | ||||
| 12/13/16 | 12/21/16 | 8 | ||||
| 12/14/16 | 12/22/16 | 8 | ||||
| 12/15/16 | 12/23/16 | 8 | ||||
| 12/19/16 | 12/27/16 | 8 | ||||
| 12/20/16 | 12/28/16 | 8 | ||||
| 12/21/16 | 12/29/16 | 8 | ||||
| 12/22/16 | 12/30/16 | 8 | ||||
| 12/23/16 | 01/03/17 | 11 | ||||
| 12/27/16 | 01/04/17 | 8 | ||||
| 12/28/16 | 01/05/17 | 8 | ||||
| 12/29/16 | 01/06/17 | 8 | ||||
| 2016 | ||||||
| Country | Trade
Date |
Settlement
Date |
Number
of Days to Settle | |||
| 12/30/16 | 01/09/17 | 10 | ||||
| New Zealand | 03/21/16 | 03/29/16 | 8 | |||
| 03/22/16 | 03/30/16 | 8 | ||||
| 03/23/16 | 03/31/16 | 8 | ||||
| 12/20/16 | 12/28/16 | 8 | ||||
| 12/21/16 | 12/29/16 | 8 | ||||
| 12/22/16 | 01/04/17 | 13 | ||||
| 12/28/16 | 01/05/17 | 8 | ||||
| 12/29/16 | 01/06/17 | 8 | ||||
| Norway | 03/21/16 | 03/29/16 | 8 | |||
| 03/22/16 | 03/30/16 | 8 | ||||
| Oman | 070/3/16 | 07/11/16 | 8 | |||
| 07/04/16 | 07/12/16 | 8 | ||||
| 07/05/16 | 07/13/16 | 8 | ||||
| 09/06/16 | 09/15/16 | 9 | ||||
| 09/07/16 | 09/18/16 | 11 | ||||
| 09/08/16 | 09/19/16 | 11 | ||||
| Pakistan | 09/08/16 | 09/19/16 | 11 | |||
| 09/09/16 | 09/20/16 | 11 | ||||
| Palestine | 06/30/16 | 07/10/16 | 10 | |||
| 07/03/16 | 07/11/16 | 8 | ||||
| 07/04/16 | 07/12/16 | 8 | ||||
| 09/06/16 | 09/15/16 | 9 | ||||
| 09/07/16 | 09/18/16 | 11 | ||||
| 09/08/16 | 09/19/16 | 11 | ||||
| The Philippines | 10/26/16 | 11/03/16 | 8 | |||
| 10/27/16 | 11/04/16 | 8 | ||||
| 10/28/16 | 11/07/16 | 10 | ||||
| Qatar | 07/03/16 | 07/12/16 | 9 | |||
| 07/04/16 | 07/13/16 | 9 | ||||
| 07/05/16 | 07/14/16 | 9 | ||||
| 09/06/16 | 09/18/16 | 12 | ||||
| 09/07/16 | 09/19/16 | 12 | ||||
| 09/08/16 | 09/20/16 | 12 | ||||
| Saudi Arabia | 06/30/16 | 07/12/16 | 12 | |||
| 07/03/16 | 07/13/16 | 10 | ||||
| 09/07/16 | 09/18/16 | 11 | ||||
| 09/08/16 | 09/19/16 | 11 | ||||
| Serbia | 04/26/16 | 05/04/16 | 8 | |||
| 04/27/16 | 05/05/16 | 8 | ||||
| 04/28/16 | 05/06/16 | 8 | ||||
| 2016 | ||||||
| Country | Trade
Date |
Settlement
Date |
Number
of Days to Settle | |||
| The Slovak Republic | 12/22/16 | 01/02/17 | 11 | |||
| 12/23/16 | 01/03/17 | 11 | ||||
| South Africa | 03/14/16 | 03/22/16 | 8 | |||
| 03/15/16 | 03/23/16 | 8 | ||||
| 03/16/16 | 03/24/16 | 8 | ||||
| 03/17/16 | 03/29/16 | 12 | ||||
| 03/18/16 | 03/30/16 | 12 | ||||
| 03/22/16 | 03/31/16 | 9 | ||||
| 03/23/16 | 04/01/16 | 9 | ||||
| 03/24/16 | 04/04/16 | 11 | ||||
| 04/20/16 | 04/28/16 | 8 | ||||
| 04/21/16 | 04/29/16 | 8 | ||||
| 04/22/16 | 05/03/16 | 11 | ||||
| 04/25/16 | 05/04/16 | 9 | ||||
| 04/26/16 | 05/05/16 | 9 | ||||
| 04/28/16 | 05/06/16 | 8 | ||||
| 04/29/16 | 05/09/16 | 10 | ||||
| 06/09/16 | 06/17/16 | 8 | ||||
| 06/10/16 | 06/20/16 | 10 | ||||
| 06/13/16 | 06/21/16 | 8 | ||||
| 06/14/16 | 06/22/16 | 8 | ||||
| 06/15/16 | 06/23/16 | 8 | ||||
| 08/02/16 | 08/10/16 | 8 | ||||
| 08/03/16 | 08/11/16 | 8 | ||||
| 08/04/16 | 08/12/16 | 8 | ||||
| 08/05/16 | 08/15/16 | 10 | ||||
| 08/08/16 | 08/16/16 | 8 | ||||
| 12/09/16 | 12/19/16 | 10 | ||||
| 12/12/16 | 12/20/16 | 8 | ||||
| 12/13/16 | 12/21/16 | 8 | ||||
| 12/14/16 | 12/22/16 | 8 | ||||
| 12/15/16 | 12/28/16 | 13 | ||||
| 12/16/16 | 12/28/16 | 12 | ||||
| 12/19/16 | 12/29/16 | 10 | ||||
| 12/20/16 | 01/02/17 | 13 | ||||
| 12/21/16 | 01/03/17 | 13 | ||||
| 12/22/16 | 01/04/17 | 13 | ||||
| 12/28/16 | 01/05/17 | 8 | ||||
| 12/29/16 | 01/06/17 | 8 | ||||
| Srpska | 01/04/16 | 01/12/16 | 8 | |||
| 01/05/16 | 01/13/16 | 8 | ||||
| Swaziland | 03/18/16 | 03/29/16 | 11 | |||
| 03/21/16 | 03/30/16 | 9 | ||||
| 03/22/16 | 03/31/16 | 9 | ||||
| 03/23/16 | 04/01/16 | 9 | ||||
| 03/24/16 | 04/04/16 | 11 | ||||
| 2016 | ||||||
| Country | Trade
Date |
Settlement
Date |
Number
of Days to Settle | |||
| 04/12/16 | 04/20/16 | 8 | ||||
| 04/13/16 | 04/21/16 | 8 | ||||
| 04/14/16 | 04/22/16 | 8 | ||||
| 04/15/16 | 04/26/16 | 11 | ||||
| 04/18/16 | 04/27/16 | 9 | ||||
| 04/20/16 | 04/28/16 | 8 | ||||
| 04/21/16 | 04/29/16 | 8 | ||||
| 04/22/16 | 05/02/16 | 10 | ||||
| 04/28/16 | 05/06/16 | 8 | ||||
| 04/29/16 | 05/09/16 | 10 | ||||
| 05/02/16 | 05/10/16 | 8 | ||||
| 05/03/16 | 05/11/16 | 8 | ||||
| 05/04/16 | 05/12/16 | 8 | ||||
| 07/15/16 | 07/25/16 | 10 | ||||
| 07/18/16 | 07/26/16 | 8 | ||||
| 07/19/16 | 07/27/16 | 8 | ||||
| 07/20/16 | 07/28/16 | 8 | ||||
| 07/21/16 | 07/29/16 | 8 | ||||
| 08/30/16 | 09/07/16 | 8 | ||||
| 08/31/16 | 09/08/16 | 8 | ||||
| 09/01/16 | 09/09/16 | 8 | ||||
| 09/02/16 | 09/12/16 | 10 | ||||
| 09/05/16 | 09/13/16 | 8 | ||||
| 12/19/16 | 12/27/16 | 8 | ||||
| 12/20/16 | 12/28/16 | 8 | ||||
| 12/21/16 | 12/29/16 | 8 | ||||
| 12/22/16 | 12/30/16 | 8 | ||||
| 12/23/16 | 01/03/17 | 11 | ||||
| 12/27/16 | 01/04/17 | 8 | ||||
| 12/28/16 | 01/05/17 | 8 | ||||
| 12/29/16 | 01/06/17 | 8 | ||||
| 12/30/16 | 01/09/17 | 10 | ||||
| Taiwan | 02/02/16 | 02/15/16 | 13 | |||
| 02/03/16 | 02/16/16 | 13 | ||||
| Thailand | 04/08/16 | 04/18/16 | 10 | |||
| 04/11/16 | 04/19/16 | 8 | ||||
| 04/12/16 | 04/20/16 | 8 | ||||
| 04/29/16 | 05/09/16 | 10 | ||||
| Trinidad and Tobago | 03/23/16 | 03/31/16 | 8 | |||
| 03/24/16 | 04/01/16 | 8 | ||||
| Tunisia | 06/30/16 | 07/08/16 | 8 | |||
| 07/01/16 | 07/11/16 | 10 | ||||
| 07/04/16 | 07/12/16 | 8 | ||||
| Turkey | 06/30/16 | 07/11/16 | 11 | |||
| 07/01/16 | 07/12/16 | 11 | ||||
| 2016 | ||||||
| Country | Trade
Date |
Settlement
Date |
Number
of Days to Settle | |||
| 09/08/16 | 09/19/16 | 11 | ||||
| 09/09/16 | 09/20/16 | 11 | ||||
| Uganda | 01/19/16 | 01/27/16 | 8 | |||
| 01/20/16 | 01/28/16 | 8 | ||||
| 01/21/16 | 01/29/16 | 8 | ||||
| 01/22/16 | 02/01/16 | 10 | ||||
| 01/25/16 | 02/02/16 | 8 | ||||
| 02/09/16 | 02/17/16 | 8 | ||||
| 02/10/16 | 02/18/16 | 8 | ||||
| 02/11/16 | 02/19/16 | 8 | ||||
| 02/12/16 | 02/22/16 | 10 | ||||
| 02/15/16 | 02/23/16 | 8 | ||||
| 03/01/16 | 03/09/16 | 8 | ||||
| 03/02/16 | 03/10/16 | 8 | ||||
| 03/03/16 | 03/11/16 | 8 | ||||
| 03/04/16 | 03/14/16 | 10 | ||||
| 03/07/16 | 03/15/16 | 8 | ||||
| 03/18/16 | 03/29/16 | 11 | ||||
| 03/21/16 | 03/30/16 | 9 | ||||
| 03/22/16 | 03/31/16 | 9 | ||||
| 03/23/16 | 04/01/16 | 9 | ||||
| 03/24/16 | 04/04/16 | 11 | ||||
| 05/27/16 | 06/06/16 | 10 | ||||
| 05/30/16 | 06/07/16 | 8 | ||||
| 05/31/16 | 06/08/16 | 8 | ||||
| 06/01/16 | 06/10/16 | 9 | ||||
| 06/02/16 | 06/13/16 | 11 | ||||
| 06/06/16 | 06/14/16 | 8 | ||||
| 06/07/16 | 06/15/16 | 8 | ||||
| 06/08/16 | 06/16/16 | 8 | ||||
| 12/19/16 | 12/27/16 | 8 | ||||
| 12/20/16 | 12/28/16 | 8 | ||||
| 12/21/16 | 12/29/16 | 8 | ||||
| 12/22/16 | 12/30/16 | 8 | ||||
| 12/23/16 | 01/03/17 | 11 | ||||
| 12/27/16 | 01/04/17 | 8 | ||||
| 12/28/16 | 01/05/17 | 8 | ||||
| 12/29/16 | 01/06/17 | 8 | ||||
| 12/30/16 | 01/09/17 | 10 | ||||
| Ukraine | 01/05/16 | 01/13/16 | 8 | |||
| The United Arab Emirates | 09/07/16 | 09/15/16 | 8 | |||
| 09/08/16 | 09/18/16 | 10 | ||||
| Vietnam | 02/03/16 | 02/15/16 | 12 | |||
| 02/04/16 | 02/16/16 | 12 | ||||
| 02/05/16 | 02/17/16 | 12 | ||||
| 2016 | ||||||
| Country | Trade
Date |
Settlement
Date |
Number
of Days to Settle | |||
| Zimbabwe | 03/18/16 | 03/29/16 | 11 | |||
| 03/21/16 | 03/30/16 | 9 | ||||
| 03/22/16 | 03/31/16 | 9 | ||||
| 03/23/16 | 04/01/16 | 9 | ||||
| 03/24/16 | 04/04/16 | 11 | ||||
| 04/11/16 | 04/19/16 | 8 | ||||
| 04/12/16 | 04/20/16 | 8 | ||||
| 04/13/16 | 04/21/16 | 8 | ||||
| 04/14/16 | 04/22/16 | 8 | ||||
| 04/15/16 | 04/25/16 | 10 | ||||
| 04/25/16 | 05/03/16 | 8 | ||||
| 04/26/16 | 05/04/16 | 8 | ||||
| 04/27/16 | 05/05/16 | 8 | ||||
| 04/28/16 | 05/06/16 | 8 | ||||
| 04/29/16 | 05/09/16 | 10 | ||||
| 05/18/16 | 05/26/16 | 8 | ||||
| 05/19/16 | 05/27/16 | 8 | ||||
| 05/20/16 | 05/30/16 | 10 | ||||
| 05/23/16 | 05/31/16 | 8 | ||||
| 05/24/16 | 06/01/16 | 8 | ||||
| 08/01/16 | 08/10/16 | 9 | ||||
| 08/02/16 | 08/11/16 | 9 | ||||
| 08/03/16 | 08/12/16 | 9 | ||||
| 08/04/16 | 08/15/16 | 11 | ||||
| 08/05/16 | 08/16/16 | 11 | ||||
| 12/15/16 | 12/23/16 | 8 | ||||
| 12/16/16 | 12/27/16 | 11 | ||||
| 12/19/16 | 12/28/16 | 9 | ||||
| 12/20/16 | 12/29/16 | 9 | ||||
| 12/21/16 | 12/30/16 | 9 | ||||
| 12/23/16 | 01/03/17 | 11 | ||||
| 12/27/16 | 01/04/17 | 8 | ||||
| 12/28/16 | 01/05/17 | 8 | ||||
| 12/29/16 | 01/06/17 | 8 | ||||
| 12/30/16 | 01/09/17 | 10 | ||||
| 2017 | ||||||
| Country | Trade
Date |
Settlement
Date |
Number
of Days to Settle | |||
| Australia | 04/11/17 | 04/19/17 | 8 | |||
| 04/12/17 | 04/20/17 | 8 | ||||
| 04/13/17 | 04/21/17 | 8 | ||||
| Bangladesh | 06/20/17 | 06/28/17 | 8 | |||
| 06/21/17 | 06/29/17 | 8 | ||||
| 06/22/17 | 07/02/17 | 10 | ||||
| Brazil | 02/22/17 | 03/02/17 | 8 | |||
| 2017 | ||||||
| Country | Trade
Date |
Settlement
Date |
Number
of Days to Settle | |||
| 02/23/17 | 03/03/17 | 8 | ||||
| 02/24/17 | 03/06/17 | 11 | ||||
| China | 01/24/17 | 02/03/17 | 10 | |||
| 01/25/17 | 02/06/17 | 12 | ||||
| 01/26/17 | 02/07/17 | 12 | ||||
| 09/27/17 | 10/09/17 | 12 | ||||
| 09/28/17 | 10/10/17 | 12 | ||||
| 09/29/17 | 10/11/17 | 12 | ||||
| Costa Rica | 04/07/17 | 04/17/17 | 10 | |||
| 04/10/17 | 04/18/17 | 8 | ||||
| Indonesia | 06/21/17 | 07/03/17 | 12 | |||
| 06/22/17 | 07/04/17 | 12 | ||||
| 06/23/17 | 07/05/17 | 12 | ||||
| Israel | 04/06/17 | 04/18/17 | 12 | |||
| 04/09/17 | 04/19/17 | 10 | ||||
| 10/02/17 | 10/15/17 | 13 | ||||
| 10/03/17 | 10/16/17 | 13 | ||||
| Japan | 04/28/17 | 05/08/17 | 10 | |||
| 05/01/17 | 05/09/17 | 8 | ||||
| 05/02/17 | 05/10/17 | 8 | ||||
| Jordan | 06/21/17 | 06/29/17 | 8 | |||
| 06/22/17 | 07/02/17 | 10 | ||||
| Malawi | 01/09/17 | 01/17/17 | 8 | |||
| 01/10/17 | 01/18/17 | 8 | ||||
| 01/11/17 | 01/19/17 | 8 | ||||
| 01/12/17 | 01/20/17 | 8 | ||||
| 01/13/17 | 01/23/17 | 10 | ||||
| 02/24/17 | 03/06/17 | 10 | ||||
| 02/27/17 | 03/07/17 | 8 | ||||
| 02/28/17 | 03/08/17 | 8 | ||||
| 03/01/17 | 03/09/17 | 8 | ||||
| 03/02/17 | 03/10/17 | 8 | ||||
| 04/07/17 | 04/18/17 | 11 | ||||
| 04/10/17 | 04/19/17 | 9 | ||||
| 04/11/17 | 04/20/17 | 9 | ||||
| 04/12/17 | 04/21/17 | 9 | ||||
| 04/13/17 | 04/24/17 | 11 | ||||
| 04/24/17 | 05/02/17 | 8 | ||||
| 04/25/17 | 05/03/17 | 8 | ||||
| 04/26/17 | 05/04/17 | 8 | ||||
| 04/27/17 | 05/05/17 | 8 | ||||
| 04/28/17 | 05/08/17 | 10 | ||||
| 05/08/17 | 05/16/17 | 8 | ||||
| 2017 | ||||||
| Country | Trade
Date |
Settlement
Date |
Number
of Days to Settle | |||
| 05/09/17 | 05/17/17 | 8 | ||||
| 05/10/17 | 05/18/17 | 8 | ||||
| 05/11/17 | 05/19/17 | 8 | ||||
| 05/12/17 | 05/22/17 | 10 | ||||
| 06/19/17 | 06/27/17 | 8 | ||||
| 06/20/17 | 06/28/17 | 8 | ||||
| 06/21/17 | 06/29/17 | 8 | ||||
| 06/22/17 | 06/30/17 | 8 | ||||
| 06/23/17 | 07/03/17 | 10 | ||||
| 06/29/17 | 07/07/17 | 8 | ||||
| 06/30/17 | 07/10/17 | 8 | ||||
| 07/03/17 | 07/11/17 | 8 | ||||
| 07/04/17 | 07/12/17 | 8 | ||||
| 07/05/17 | 07/13/17 | 8 | ||||
| 12/18/17 | 12/27/17 | 9 | ||||
| 12/19/17 | 12/28/17 | 9 | ||||
| 12/20/17 | 12/29/17 | 9 | ||||
| 12/21/17 | 01/02/18 | 12 | ||||
| 12/22/17 | 01/03/18 | 12 | ||||
| Malaysia | 01/24/17 | 02/01/17 | 8 | |||
| 01/25/17 | 02/02/17 | 8 | ||||
| 01/26/17 | 02/03/17 | 8 | ||||
| Namibia | 03/14/17 | 03/22/17 | 8 | |||
| 03/15/17 | 03/23/17 | 8 | ||||
| 03/16/17 | 03/24/17 | 8 | ||||
| 03/17/17 | 03/27/17 | 10 | ||||
| 03/20/17 | 03/28/17 | 8 | ||||
| 04/07/17 | 04/18/17 | 11 | ||||
| 04/10/17 | 04/19/17 | 9 | ||||
| 04/11/17 | 04/20/17 | 9 | ||||
| 04/12/17 | 04/21/17 | 9 | ||||
| 04/13/17 | 04/24/17 | 11 | ||||
| 04/20/17 | 04/28/17 | 8 | ||||
| 04/21/17 | 05/01/17 | 10 | ||||
| 04/24/17 | 05/02/17 | 8 | ||||
| 04/25/17 | 05/05/17 | 10 | ||||
| 04/26/17 | 05/08/17 | 12 | ||||
| 04/28/17 | 05/09/17 | 11 | ||||
| 05/02/17 | 05/10/17 | 8 | ||||
| 05/03/17 | 05/11/17 | 8 | ||||
| 05/18/17 | 05/26/17 | 8 | ||||
| 05/19/17 | 05/29/17 | 10 | ||||
| 05/22/17 | 05/30/17 | 8 | ||||
| 05/23/17 | 05/31/17 | 8 | ||||
| 05/24/17 | 06/01/17 | 8 | ||||
| 06/09/17 | 06/19/17 | 10 | ||||
| 06/12/17 | 06/20/17 | 8 | ||||
| 06/13/17 | 06/21/17 | 8 | ||||
| 2017 | ||||||
| Country | Trade
Date |
Settlement
Date |
Number
of Days to Settle | |||
| 06/14/17 | 06/22/17 | 8 | ||||
| 06/15/17 | 06/23/17 | 8 | ||||
| 08/02/17 | 08/10/17 | 8 | ||||
| 08/03/17 | 08/11/17 | 8 | ||||
| 08/04/17 | 08/14/17 | 10 | ||||
| 08/07/17 | 08/15/17 | 8 | ||||
| 08/08/17 | 08/16/17 | 8 | ||||
| 09/18/17 | 09/26/17 | 8 | ||||
| 09/19/17 | 09/27/17 | 8 | ||||
| 09/20/17 | 09/28/17 | 8 | ||||
| 09/21/17 | 09/29/17 | 8 | ||||
| 09/22/17 | 10/02/17 | 10 | ||||
| 12/04/17 | 12/12/17 | 8 | ||||
| 12/05/17 | 12/13/17 | 8 | ||||
| 12/06/17 | 12/14/17 | 8 | ||||
| 12/07/17 | 12/15/17 | 8 | ||||
| 12/08/17 | 12/18/17 | 10 | ||||
| 12/18/17 | 12/28/17 | 10 | ||||
| 12/19/17 | 12/29/17 | 10 | ||||
| 12/20/17 | 01/02/18 | 13 | ||||
| 12/21/17 | 01/03/18 | 13 | ||||
| 12/22/17 | 01/04/18 | 13 | ||||
| Norway | 04/10/17 | 04/18/17 | 8 | |||
| 04/11/17 | 04/19/17 | 8 | ||||
| Qatar | 06/20/17 | 06/28/17 | 8 | |||
| 06/21/17 | 06/29/17 | 8 | ||||
| 06/22/17 | 06/30/17 | 8 | ||||
| Saudi Arabia | 06/24/17 | 07/02/17 | 8 | |||
| 06/25/17 | 07/03/17 | 8 | ||||
| South Africa | 03/14/17 | 03/22/17 | 8 | |||
| 03/15/17 | 03/23/17 | 8 | ||||
| 03/16/17 | 03/24/17 | 8 | ||||
| 03/17/17 | 03/27/17 | 10 | ||||
| 03/20/17 | 03/28/17 | 8 | ||||
| 04/07/17 | 04/18/17 | 11 | ||||
| 04/10/17 | 04/19/17 | 9 | ||||
| 04/11/17 | 04/20/17 | 9 | ||||
| 04/12/17 | 04/21/17 | 9 | ||||
| 04/13/17 | 04/24/17 | 11 | ||||
| 04/20/17 | 04/28/17 | 8 | ||||
| 04/21/17 | 05/02/17 | 11 | ||||
| 04/24/17 | 05/03/17 | 9 | ||||
| 04/25/17 | 05/04/17 | 9 | ||||
| 04/26/17 | 05/05/17 | 9 | ||||
| 04/28/17 | 05/08/17 | 10 | ||||
| 06/09/17 | 06/19/17 | 10 | ||||
| 2017 | ||||||
| Country | Trade
Date |
Settlement
Date |
Number
of Days to Settle | |||
| 06/12/17 | 06/20/17 | 8 | ||||
| 06/13/17 | 06/21/17 | 8 | ||||
| 06/14/17 | 06/22/17 | 8 | ||||
| 06/15/17 | 06/23/17 | 8 | ||||
| 08/02/17 | 08/10/17 | 8 | ||||
| 08/03/17 | 08/11/17 | 8 | ||||
| 08/04/17 | 08/14/17 | 10 | ||||
| 08/07/17 | 08/15/17 | 8 | ||||
| 08/08/17 | 08/16/17 | 8 | ||||
| 09/18/17 | 09/26/17 | 8 | ||||
| 09/19/17 | 09/27/17 | 8 | ||||
| 09/20/17 | 09/28/17 | 8 | ||||
| 09/21/17 | 09/29/17 | 8 | ||||
| 09/22/17 | 10/02/17 | 10 | ||||
| 12/18/17 | 12/27/17 | 9 | ||||
| 12/19/17 | 12/28/17 | 9 | ||||
| 12/20/17 | 12/29/17 | 9 | ||||
| 12/21/17 | 01/03/18 | 13 | ||||
| 12/22/17 | 01/04/18 | 13 | ||||
| South Korea | 09/29/17 | 10/10/17 | 11 | |||
| 10/02/17 | 10/11/17 | 9 | ||||
| Sri Lanka | 04/07/17 | 04/17/17 | 10 | |||
| Swaziland | 04/07/17 | 04/18/17 | 11 | |||
| 04/10/17 | 04/20/17 | 10 | ||||
| 04/11/17 | 04/21/17 | 10 | ||||
| 04/12/17 | 04/24/17 | 12 | ||||
| 04/13/17 | 04/26/17 | 13 | ||||
| 04/18/17 | 04/27/17 | 9 | ||||
| 04/20/17 | 04/28/17 | 8 | ||||
| 04/21/17 | 05/02/17 | 11 | ||||
| 04/24/17 | 05/03/17 | 9 | ||||
| 04/26/17 | 05/04/17 | 8 | ||||
| 04/27/17 | 05/08/17 | 11 | ||||
| 04/28/17 | 05/09/17 | 11 | ||||
| 05/02/17 | 05/10/17 | 8 | ||||
| 05/03/17 | 05/11/17 | 8 | ||||
| 05/04/17 | 05/12/17 | 8 | ||||
| 08/30/17 | 09/07/17 | 8 | ||||
| 08/31/17 | 09/08/17 | 8 | ||||
| 09/01/17 | 09/11/17 | 10 | ||||
| 09/04/17 | 09/12/17 | 8 | ||||
| 09/05/17 | 09/13/17 | 8 | ||||
| 12/18/17 | 12/27/17 | 9 | ||||
| 12/19/17 | 12/28/17 | 9 | ||||
| 12/20/17 | 12/29/17 | 9 | ||||
| 12/21/17 | 01/02/18 | 12 | ||||
| 12/22/17 | 01/03/18 | 12 | ||||
| 2017 | ||||||
| Country | Trade
Date |
Settlement
Date |
Number
of Days to Settle | |||
| Taiwan | 01/23/17 | 02/02/17 | 10 | |||
| 01/24/17 | 02/03/17 | 10 | ||||
| Turkey | 08/28/17 | 09/05/17 | 8 | |||
| 08/29/17 | 09/06/17 | 8 | ||||
| Uganda | 01/19/17 | 01/27/17 | 8 | |||
| 01/20/17 | 01/30/17 | 10 | ||||
| 01/23/17 | 02/01/17 | 9 | ||||
| 01/24/17 | 02/02/17 | 9 | ||||
| 01/25/17 | 02/03/17 | 9 | ||||
| 02/09/17 | 02/17/17 | 8 | ||||
| 02/10/17 | 02/18/17 | 8 | ||||
| 02/13/17 | 02/21/17 | 8 | ||||
| 02/14/17 | 02/22/17 | 8 | ||||
| 02/15/17 | 02/23/17 | 8 | ||||
| 03/01/17 | 03/09/17 | 8 | ||||
| 03/02/17 | 03/10/17 | 8 | ||||
| 03/03/17 | 03/13/17 | 10 | ||||
| 03/06/17 | 03/14/17 | 8 | ||||
| 03/07/17 | 03/15/17 | 8 | ||||
| 04/07/17 | 04/18/17 | 11 | ||||
| 04/10/17 | 04/19/17 | 9 | ||||
| 04/11/17 | 04/20/17 | 9 | ||||
| 04/12/17 | 04/21/17 | 9 | ||||
| 04/13/17 | 04/24/17 | 11 | ||||
| 04/24/17 | 05/02/17 | 8 | ||||
| 04/25/17 | 05/03/17 | 8 | ||||
| 04/26/17 | 05/04/17 | 8 | ||||
| 04/27/17 | 05/05/17 | 8 | ||||
| 04/28/17 | 05/08/17 | 10 | ||||
| 06/02/17 | 06/12/17 | 10 | ||||
| 06/05/17 | 06/13/17 | 8 | ||||
| 06/06/17 | 06/14/17 | 8 | ||||
| 06/07/17 | 06/15/17 | 8 | ||||
| 06/08/17 | 06/16/17 | 8 | ||||
| 06/19/17 | 06/27/17 | 8 | ||||
| 06/20/17 | 06/28/17 | 8 | ||||
| 06/21/17 | 06/29/17 | 8 | ||||
| 06/22/17 | 06/30/17 | 8 | ||||
| 06/23/17 | 07/03/17 | 10 | ||||
| 06/30/17 | 07/10/17 | 10 | ||||
| 07/03/17 | 07/11/17 | 8 | ||||
| 07/04/17 | 07/12/17 | 8 | ||||
| 07/05/17 | 07/13/17 | 8 | ||||
| 07/06/17 | 07/14/17 | 8 | ||||
| 09/06/17 | 09/14/17 | 8 | ||||
| 09/07/17 | 09/15/17 | 8 | ||||
| 09/08/17 | 09/18/17 | 10 | ||||
| 2017 | ||||||
| Country | Trade
Date |
Settlement
Date |
Number
of Days to Settle | |||
| 09/11/17 | 09/19/17 | 8 | ||||
| 09/12/17 | 09/20/17 | 8 | ||||
| 10/02/17 | 10/10/17 | 8 | ||||
| 10/03/17 | 10/11/17 | 8 | ||||
| 10/04/17 | 10/12/17 | 8 | ||||
| 10/05/17 | 10/13/17 | 8 | ||||
| 10/06/17 | 10/16/17 | 10 | ||||
| 11/23/17 | 12/01/17 | 8 | ||||
| 11/24/17 | 12/04/17 | 10 | ||||
| 11/27/17 | 12/05/17 | 8 | ||||
| 11/28/17 | 12/06/17 | 8 | ||||
| 11/29/17 | 12/07/17 | 8 | ||||
| 12/18/17 | 12/27/17 | 9 | ||||
| 12/19/17 | 12/28/17 | 9 | ||||
| 12/20/17 | 12/29/17 | 9 | ||||
| 12/21/17 | 01/02/18 | 12 | ||||
| 12/22/17 | 01/03/18 | 12 | ||||
| Uruguay | 04/10/17 | 04/18/17 | 8 | |||
| 04/11/17 | 04/19/17 | 8 | ||||
| 04/12/17 | 04/20/17 | 8 | ||||
| Vietnam | 01/23/17 | 02/02/17 | 10 | |||
| 01/24/17 | 02/03/17 | 10 | ||||
| 01/25/17 | 02/06/17 | 12 | ||||
| Zimbabwe | 04/07/17 | 04/19/17 | 12 | |||
| 04/10/17 | 04/20/17 | 10 | ||||
| 04/11/17 | 04/21/17 | 10 | ||||
| 04/12/17 | 04/24/17 | 12 | ||||
| 04/13/17 | 04/25/17 | 12 | ||||
| 04/24/17 | 05/02/17 | 8 | ||||
| 04/25/17 | 05/03/17 | 8 | ||||
| 04/26/17 | 05/04/17 | 8 | ||||
| 04/27/17 | 05/05/17 | 8 | ||||
| 04/28/17 | 05/08/17 | 10 | ||||
| 05/18/17 | 05/26/17 | 8 | ||||
| 05/19/17 | 05/29/17 | 10 | ||||
| 05/22/17 | 05/30/17 | 8 | ||||
| 05/23/17 | 05/31/17 | 8 | ||||
| 05/24/17 | 06/01/17 | 8 | ||||
| 08/07/17 | 08/16/17 | 9 | ||||
| 08/08/17 | 08/17/17 | 9 | ||||
| 08/09/17 | 08/18/17 | 9 | ||||
| 08/10/17 | 08/21/17 | 11 | ||||
| 08/11/17 | 08/22/17 | 11 | ||||
| 12/15/17 | 12/27/17 | 12 | ||||
| 12/18/17 | 12/28/17 | 10 | ||||
| 12/19/17 | 12/29/17 | 10 | ||||
| 12/20/17 | 01/02/18 | 13 | ||||
| 2017 | ||||||
| Country | Trade
Date |
Settlement
Date |
Number
of Days to Settle | |||
| 12/21/17 | 01/03/18 | 13 | ||||
| * | These worst-case redemption cycles are based on information regarding regular holidays, which may be out of date. Based on changes in holidays, longer (worse) redemption cycles are possible. |