| 2016 Prospectus |
 |
| ► | iShares Core MSCI Emerging Markets ETF | IEMG | NYSE ARCA |
|
|
S-1 |
|
|
1 |
|
|
2 |
|
|
19 |
|
|
22 |
|
|
23 |
|
|
25 |
|
|
39 |
|
|
39 |
|
|
41 |
|
|
41 |
|
|
43 |
| Ticker: IEMG | Stock Exchange: NYSE Arca |
| Annual
Fund Operating Expenses (ongoing expenses that you pay each year as a percentage of the value of your investments)1 | ||||||||||||
| Management
Fees |
Distribution
and Service (12b-1) Fees |
Other
Expenses |
Acquired
Fund Fees and Expenses |
Total
Annual Fund Operating Expenses |
Fee Waiver | Total
Annual Fund Operating Expenses After Fee Waiver | ||||||
| 0.14% | None | 0.01% | 0.00% | 0.15% | (0.01)% | 0.14% | ||||||
| 1 | The expense information in the table has been restated to reflect current management fees. |
| 1 Year | 3 Years | 5 Years | 10 Years | |||
| $14 | $47 | $84 | $191 |
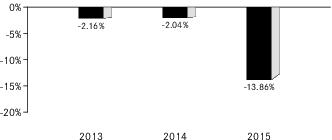
| 1 | The Fund’s year-to-date return as of September 30, 2016 was 15.14%. |
| One Year | Since
Fund Inception | ||
| (Inception Date: 10/18/2012) | |||
| Return Before Taxes | -13.86% | -4.49% | |
| Return After Taxes on Distributions2 | -14.35% | -4.94% | |
| Return After Taxes on Distributions and Sale of Fund Shares2 | -7.43% | -3.30% | |
| MSCI Emerging Markets IMI (Index returns do not reflect deductions for fees, expenses or taxes) | -13.86% | -4.48% |
| 2 | After-tax returns in the table above are calculated using the historical highest individual U.S. federal marginal income tax rates and do not reflect the impact of state or local taxes. Actual after-tax returns depend on an investor’s tax situation and may differ from those shown, and after-tax returns shown are not relevant to tax-exempt investors or investors who hold shares through tax-deferred arrangements, such as 401(k) plans or individual retirement accounts (“IRAs”). Fund returns after taxes on distributions and sales of Fund shares are calculated assuming that an investor has sufficient capital gains of the same character from other investments to offset any capital losses from the sale of Fund shares. As a result, Fund returns after taxes on distributions and sales of Fund shares may exceed Fund returns before taxes and/or returns after taxes on distributions. |
| ■ | Lower levels of liquidity and market efficiency; |
| ■ | Greater securities price volatility; |
| ■ | Exchange rate fluctuations and exchange controls; |
| ■ | Less availability of public information about issuers; |
| ■ | Limitations on foreign ownership of securities; |
| ■ | Imposition of withholding or other taxes; |
| ■ | Imposition of restrictions on the expatriation of the funds or other assets of the Fund; |
| ■ | Higher transaction and custody costs and delays in settlement procedures; |
| ■ | Difficulties in enforcing contractual obligations; |
| ■ | Lower levels of regulation of the securities markets; |
| ■ | Weaker accounting, disclosure and reporting requirements; and |
| ■ | Legal principles relating to corporate governance, directors’ fiduciary duties and liabilities and stockholders’ rights in markets in which the Fund invests may differ and/or may not be as extensive or protective as those that apply in the United States. |
Economic Risk. The Chinese economy has grown rapidly in the recent past and there is no assurance that this growth rate will be maintained. In fact, the Chinese economy may experience a significant slowdown as a result of, among other things, a deterioration in global demand for Chinese exports, as well as contraction in spending on domestic goods by Chinese consumers. In addition, China may experience substantial rates of inflation or economic recessions, which would have a negative effect on its economy and securities market. Delays in enterprise restructuring, slow development of well-functioning financial markets and widespread corruption have also hindered performance of the Chinese economy. China continues to receive substantial pressure from trading partners to liberalize official currency exchange rates.
| ■ | The risk of delays in settling portfolio transactions and the risk of loss arising out of the system of share registration and custody used in Russia; |
| ■ | Risks in connection with the maintenance of the Fund’s portfolio securities and cash |
| ■ | The risk that the Fund’s ownership rights in portfolio securities could be lost through fraud or negligence because ownership in shares of Russian companies is recorded by the companies themselves and by registrars, rather than by a central registration system; and |
| ■ | The risk that the Fund may not be able to pursue claims on behalf of its shareholders because of the system of share registration and custody, and because Russian banking institutions and registrars are not guaranteed by the Russian government. |
Current or future sanctions may result in Russia taking counter measures or retaliatory actions, which may further impair the value and liquidity of Russian securities. These retaliatory measures may include the immediate freeze of Russian assets held by the Fund. In the event of such a freeze of any Fund assets, including depositary receipts, the Fund may need to liquidate non-restricted assets in order to satisfy any Fund redemption orders. The liquidation of Fund assets during this time may also result in the Fund receiving substantially lower prices for its securities.
| ■ | With respect to a foreign entity that holds the Indian assets directly, if the transferor of shares or interests in such a foreign entity (along with its associated enterprises), at any time in the 12 months preceding the year of transfer neither holds the right of control or management in the foreign entity, nor holds voting power or share capital or interest exceeding 5% of the total voting power or total share capital in such foreign entity. |
| ■ | With respect to a foreign entity that holds the Indian assets indirectly, if the transferor of shares or interests in such foreign entity (along with its associated enterprises), at any time in the 12 months preceding the year of transfer does not hold the right of control or management in relation to the foreign entity, which would entitle them to the right of control or management in the foreign entity which directly holds the Indian assets; or does not hold voting power or share capital or interest exceeding 5% of the total voting power or total share capital in the foreign entity, which results in holding the same share capital or voting power in the entity which directly holds the Indian assets. |
| ■ | creates rights, or obligations, which are not ordinarily created between persons dealing at arm's length; |
| ■ | results, directly or indirectly, in the misuse, or abuse, of the provisions of IT Act; |
| ■ | lacks commercial substance; or |
| ■ | is entered into, or carried out, by means, or in a manner, which are not ordinarily employed for bona fide purposes. |
| ■ | any arrangement where the aggregate tax benefit to all the parties of the arrangement in the relevant financial year does not exceed INR 30 Million; |
| ■ | foreign institutional investors (“FIIs”) that choose not to take any benefit under any tax treaty entered with India and have invested in listed or unlisted securities with prior permission of the competent authority in accordance with the applicable regulations; |
| ■ | non-resident investor in an FII who has invested in an FII, directly or indirectly, by way of an offshore derivative instrument or otherwise; or |
| ■ | any income derived from the transfer of investments made prior to August 30, 2010. |
| ■ | Dividend: Dividend income earned by the Subsidiary will not be subject to Indian tax. However, the Indian company declaring and paying such dividend would be subject to Dividend Distribution Tax at an effective rate of 20.36% (effective starting April 1, 2015) on the amount of the dividend paid out. |
| ■ | Interest: Interest paid to the Subsidiary in respect of debt obligations of Indian issuers will be subject to Indian income tax. The tax rate in the case of a rupee-denominated debt obligation is 43.26%. However if the Subsidiary is a SEBI registered sub-account, interest income earned from June 1, 2013 to June 30, 2017 on rupee denominated bonds of Indian companies and Indian government securities will be subject to tax at the rate of 5.41%, provided that the rate of interest does not exceed the prescribed rates. In the case of a foreign-currency denominated debt obligation, the tax rate is 21.63%. For approved foreign-currency loans advanced from July 1, 2012 to June 30, 2017, the tax rate on interest is 5.41% and for approved foreign currency long-term bonds issued from October 1, 2014 to June 30, 2017, the tax rate on interest is 5.41%. However, if the Subsidiary is registered as a sub-account with SEBI, interest from securities will be subject to tax at the rate of 21.63%. |
| ■ | Securities Transaction Tax: All transactions entered on a recognized stock exchange in India are subject to a Securities Transaction Tax (“STT”). STT has been introduced under Section 98 of the Finance (No.2) Act, 2004 on transactions relating to sale, purchases and redemption of investments made by purchasers or sellers of Indian securities and equity oriented mutual fund units. The current STT as levied on the transaction value as follows: |
| ■ | 0.1% payable by the buyer and 0.1% by the seller on the value of transactions of delivery based transfer of an equity share in an Indian company entered in a recognized stock exchange; |
| ■ | 0.001% on the value of transactions of delivery based sale of a unit of an equity oriented mutual fund entered in a recognized stock exchange, payable by the seller; |
| ■ | 0.025% on the value of transactions of non-delivery based sale of an equity share in an Indian company or a unit of an equity oriented mutual fund, entered in a recognized stock exchange payable by the seller; |
| ■ | 0.05% on the value of transactions of derivatives being options, entered in a recognized stock exchange. STT is to be paid by the seller; |
| ■ | 0.01% on the value of transactions of sale of derivatives being futures, entered in a recognized stock exchange. STT is to be paid by the seller; |
| ■ | 0.001% on the value of transactions of sale of units of an equity-oriented fund to the Mutual Fund, payable by the seller in accordance with the Finance Act, 2013; |
| ■ | 0.125% on the value of transactions of sale of derivatives being options, where the option is exercised, entered in a recognized stock exchange. STT is to be paid by buyer; |
| ■ | The Finance Act, 2012 has exempted from tax the capital gains (under the ITA) arising from the sale of unlisted shares by existing shareholders of a Sub-Fund in an initial public offer. However, such sale is subject to STT at 0.2% of the sale consideration payable by the seller. |
| ■ | Capital Gains: The taxation of capital gains would be as follows: (i) long-term capital gains (being gains on sale of shares held for a period of more than 12 months) listed on a recognized stock exchange would not be taxable in India provided STT has been paid on the same (as discussed above); (ii) short-term capital gains (being gains on sale of shares held for a period of 12 months or less) from the sale of Indian shares listed on a recognized stock exchange will be taxed at the rate of 16.223% provided STT has been paid on the same; (iii) long-term capital gains (being gains on sale of shares held for a period of more than 36 months) arising to the Subsidiary from the sale of unlisted securities will be taxed at the rate of 10.815% (without indexation) and short-term capital gains (being gains on sale of shares held for a period of 36 months or less) will be taxed at the rate of 43.26%;* (iv) capital gains realized on sale of listed equity shares not executed on a recognized stock exchange in India would be taxed at the rate of 21.63% for long-term gains (being gains on sale of shares held for a period of more than 12 months) and at 43.26% in the case of short-term gains (being gains on sale of shares held for a period of 12 months or less);* and (v) capital gains arising from the transfer of depositary receipts outside India between non-resident investors will not be subject to tax in India. |
| * | However, if the Subsidiary is a SEBI registered sub-account, the rates will be 10.816% and 32.45%, respectively. |
| ■ | With respect to a foreign entity that holds the Indian assets directly, if the transferor of shares or interests in such a foreign entity (along with its associated enterprises), at any time in the 12 months preceding the year of transfer neither holds the right of control or management in the foreign entity, nor holds voting power or share capital or interest exceeding 5% of the total voting power or total share capital in such foreign entity. |
| ■ | With respect to a foreign entity that holds the Indian assets indirectly, if the transferor of shares or interests in such foreign entity (along with its associated enterprises), at any time in the 12 months preceding the year of transfer does not hold the right of control or management in relation to the foreign entity, which would entitle them to the right of control or management in the foreign entity which directly holds the Indian assets; or does not hold voting power or share capital or interest exceeding 5% of the total voting power or total share capital in the foreign entity, which results in holding the same share capital or voting power in the entity which directly holds the Indian assets. |
| ■ | any arrangement where the aggregate tax benefit to all the parties of the arrangement in the relevant financial year does not exceed INR 30 Million; |
| ■ | FIIs that choose not to take any benefit under any tax treaty entered with India and have invested in listed or unlisted securities with prior permission of the competent authority in accordance with the applicable regulations; |
| ■ | non-resident investor in an FII who has invested in an FII, directly or indirectly, by way of an offshore derivative instrument or otherwise; or |
| ■ | any income derived from the transfer of investments made prior to August 30, 2010. |
| Approximate
Value of a Creation Unit |
Creation
Unit Size |
Standard
Creation/ Redemption Transaction Fee |
Maximum
Additional Charge for Creations* |
Maximum
Additional Charge for Redemptions* | ||||
| $27,120,000 | 600,000 | $15,000 | 7.0% | 2.0% |
| * | As a percentage of the net asset value per Creation Unit, inclusive, in the case of redemptions, of the standard redemption transaction fee. |
(For a share outstanding throughout each period)
| Year
ended Aug. 31, 2016 |
Year
ended Aug. 31, 2015 |
Year
ended Aug. 31, 2014 |
Period
from Oct. 18, 2012a to Aug. 31, 2013 | |||||||
| Net asset value, beginning of period | $ 40.75 | $ 53.89 | $ 45.71 | $ 49.06 | ||||||
| Income from investment operations: | ||||||||||
| Net investment incomeb | 1.20 | 1.21 | 1.31 | 1.33 | ||||||
| Net realized and unrealized gain (loss)c | 3.58 | (13.26) | 7.78 | (4.14) | ||||||
| Total from investment operations | 4.78 | (12.05) | 9.09 | (2.81) | ||||||
| Less distributions from: | ||||||||||
| Net investment income | (0.93) | (1.09) | (0.91) | (0.54) | ||||||
| Total distributions | (0.93) | (1.09) | (0.91) | (0.54) | ||||||
| Net asset value, end of period | $ 44.60 | $ 40.75 | $ 53.89 | $ 45.71 | ||||||
| Total return | 11.99% | (22.61)% | 20.05% | (5.75)% d | ||||||
| Net assets, end of period (000s) | $16,003,488 | $7,025,331 | $5,669,167 | $1,864,965 | ||||||
| Ratio of expenses to average net assetse | 0.17% | 0.18% | 0.17% | 0.05% | ||||||
| Ratio of expenses to average net assets prior to waived feese | 0.17% | 0.18% | 0.18% | 0.18% | ||||||
| Ratio of net investment income to average net assetse | 2.93% | 2.49% | 2.61% | 3.17% | ||||||
| Portfolio turnover ratef | 10% | 7% | 8% | 15% | ||||||
|
|
||||||||||
| a | Commencement of operations. |
| b | Based on average shares outstanding throughout each period. |
| c | The amounts reported for a share outstanding may not accord with the change in aggregate gains and losses in securities for the fiscal period due to the timing of capital share transactions in relation to the fluctuating market values of the Fund’s underlying securities. |
| d | Not annualized. |
| e | Annualized for periods of less than one year. |
| f | Portfolio turnover rates exclude portfolio securities received or delivered in Creation Units but includes portfolio transactions that are executed as a result of the Fund processing capital share transactions in Creation Units partial for cash in U.S. dollars. Excluding such cash transactions, the portfolio turnover rates for years ended August 31, 2016, August 31, 2015, August 31, 2014 and the period ended August 31, 2013 were 10%, 7%, 8%, and 15%, respectively. |
| Premium/Discount Range | Number of Days | Percentage of Total Days | ||
| Greater than 2.0% and Less than 2.5% | 2 | 0.45% | ||
| Greater than 1.5% and Less than 2.0% | 18 | 4.08 | ||
| Greater than 1.0% and Less than 1.5% | 37 | 8.39 | ||
| Greater than 0.5% and Less than 1.0% | 99 | 22.46 | ||
| Between 0.5% and -0.5% | 218 | 49.44 | ||
| Less than -0.5% and Greater than -1.0% | 43 | 9.75 | ||
| Less than -1.0% and Greater than -1.5% | 14 | 3.17 | ||
| Less than -1.5% and Greater than -2.0% | 8 | 1.81 | ||
| Less than -2.0% | 2 | 0.45 | ||
| 441 | 100.00% |
| Average Annual Total Returns | Cumulative Total Returns | ||||||
| NAV | MARKET | INDEX | NAV | MARKET | INDEX | ||
| 1 Year | 11.99% | 11.58% | 11.73% | 11.99% | 11.58% | 11.73% | |
| Since Inception* | (0.50)% | (0.61)% | (0.51)% | (1.93)% | (2.34)% | (1.95)% | |
| * | Total returns for the period since inception are calculated from the inception date of the Fund (10/18/12). The first day of secondary market trading in shares of the Fund was 10/22/12. |
| Call: | 1-800-iShares
or 1-800-474-2737 (toll free) Monday through Friday, 8:30 a.m. to 6:30 p.m. (Eastern time) |
| Email: | iSharesETFs@blackrock.com |
| Write: | c/o
BlackRock Investments, LLC 1 University Square Drive, Princeton, NJ 08540 |


| 2016 Prospectus |
|
| ► | iShares Currency Hedged MSCI Emerging Markets ETF | HEEM | NYSE ARCA |
|
|
S-1 |
|
|
1 |
|
|
2 |
|
|
20 |
|
|
23 |
|
|
24 |
|
|
25 |
|
|
28 |
|
|
38 |
|
|
38 |
|
|
40 |
|
|
40 |
|
|
42 |
| Ticker: HEEM | Stock Exchange: NYSE Arca |
| Annual
Fund Operating Expenses (ongoing expenses that you pay each year as a percentage of the value of your investments) | ||||||||||||
| Management
Fees |
Distribution
and Service (12b-1) Fees |
Other
Expenses |
Acquired
Fund Fees and Expenses |
Total
Annual Fund Operating Expenses |
Fee Waiver | Total
Annual Fund Operating Expenses After Fee Waiver | ||||||
| 0.78% | None | None | 0.71% | 1.49% | (0.78)% | 0.71% | ||||||
| 1 Year | 3 Years | 5 Years | 10 Years | |||
| $73 | $227 | $488 | $1,484 |
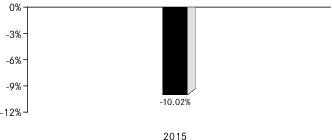
| 1 | The Fund’s year-to-date return as of September 30, 2016 was 11.36%. |
| One Year | Since
Fund Inception | ||
| (Inception Date: 09/23/2014) | |||
| Return Before Taxes | -10.02% | -9.26% | |
| Return After Taxes on Distributions1 | -11.51% | -10.89% | |
| Return After Taxes on Distributions and Sale of Fund Shares1 | -4.84% | -7.26% | |
| MSCI Emerging Markets 100% Hedged to USD Index (Index returns do not reflect deductions for fees, expenses or taxes) | -8.22% | -8.28% |
| 1 | After-tax returns in the table above are calculated using the historical highest individual U.S. federal marginal income tax rates and do not reflect the impact of state or local taxes. Actual after-tax returns depend on an investor’s tax situation and may differ from those shown, and after-tax returns shown are not relevant to tax-exempt investors or investors who hold shares through tax-deferred arrangements, such as 401(k) plans or individual retirement accounts (“IRAs”). Fund returns after taxes on distributions and sales of Fund shares are calculated assuming that an investor has sufficient capital gains of the same character from other investments to offset any capital losses from the sale of Fund shares. As a result, Fund returns after taxes on distributions and sales of Fund shares may exceed Fund returns before taxes and/or returns after taxes on distributions. |
| ■ | Lower levels of liquidity and market efficiency; |
| ■ | Greater securities price volatility; |
| ■ | Exchange rate fluctuations and exchange controls; |
| ■ | Less availability of public information about issuers; |
| ■ | Limitations on foreign ownership of securities; |
| ■ | Imposition of withholding or other taxes; |
| ■ | Imposition of restrictions on the expatriation of the funds or other assets of the Fund; |
| ■ | Higher transaction and custody costs and delays in settlement procedures; |
| ■ | Difficulties in enforcing contractual obligations; |
| ■ | Lower levels of regulation of the securities markets; |
| ■ | Weaker accounting, disclosure and reporting requirements; and |
| ■ | Legal principles relating to corporate governance, directors’ fiduciary duties and liabilities and stockholders’ rights in markets in which the Fund invests may differ and/or may not be as extensive or protective as those that apply in the United States. |
Government Control and Regulations. The Chinese government has implemented significant economic reforms in order to liberalize trade policy, promote foreign investment in the economy, reduce government control of the economy and develop market mechanisms. There can be no assurance these reforms will continue or that they will be effective. Despite recent reform and privatizations, significant regulation of investment and industry is still pervasive, including restrictions on investment in companies or industries deemed to be sensitive to particular national interests, and the Chinese government may restrict foreign ownership of Chinese corporations and/or repatriate assets. Limitations or restrictions on foreign ownership of securities may have adverse effects on the liquidity and performance of the Fund, and could lead to higher tracking error. Chinese markets generally continue to experience inefficiency, volatility and pricing anomalies that may be connected to governmental influence, a lack of publicly-available information and/or political and social instability.
| ■ | The risk of delays in settling portfolio transactions and the risk of loss arising out of the system of share registration and custody used in Russia; |
| ■ | Risks in connection with the maintenance of the Fund’s or the Underlying Fund's portfolio securities and cash with foreign sub-custodians and securities depositories, including the risk that appropriate sub-custody arrangements will not be available to the Fund or the Underlying Fund; |
| ■ | The risk that the Fund’s or the Underlying Fund's ownership rights in portfolio securities could be lost through fraud or negligence because ownership in shares of Russian companies is recorded by the companies themselves and by registrars, rather than by a central registration system; and |
| ■ | The risk that the Fund or the Underlying Fund may not be able to pursue claims on behalf of its shareholders because of the system of share registration and custody, |
| and because Russian banking institutions and registrars are not guaranteed by the Russian government. |
| ■ | The risk of delays in settling portfolio transactions and the risk of loss arising out of the system of share registration and custody used in certain Eastern European countries; |
| ■ | Risks in connection with the maintenance of the Fund's portfolio securities and cash with foreign sub-custodians and securities depositories, including the risk that appropriate sub-custody arrangements will not be available to the Fund; |
| ■ | The risk that the Fund's ownership rights in portfolio securities could be lost through fraud or negligence as a result of the fact that ownership in shares of certain |
| Eastern European companies is recorded by the companies themselves and by registrars, rather than a central registration system; | |
| ■ | The risk that the Fund may not be able to pursue claims on behalf of its shareholders because of the system of share registration and custody, and because certain Eastern European banking institutions and registrars are not guaranteed by their respective governments; and |
| ■ | Risks in connection with Eastern European countries' dependence on the economic health of Western European countries and the EU as a whole. |
| Approximate
Value of a Creation Unit |
Creation
Unit Size |
Standard
Creation/ Redemption Transaction Fee |
Maximum
Additional Charge for Creations* |
Maximum
Additional Charge for Redemptions* | ||||
| $1,101,000 | 50,000 | $500 | 3.0% | 2.0% |
| * | As a percentage of the net asset value per Creation Unit, inclusive, in the case of redemptions, of the standard redemption transaction fee. |
(For a share outstanding throughout each period)
| Year
ended Aug. 31, 2016 |
Period
from Sept. 23, 2014a to Aug. 31, 2015 |
||||||
| Net asset value, beginning of period | $ 21.40 | $ 24.44 | |||||
| Income from investment operations: | |||||||
| Net investment incomeb | 0.50 | 0.41 | |||||
| Net realized and unrealized gain (loss)c | 1.08 | (2.80) | |||||
| Total from investment operations | 1.58 | (2.39) | |||||
| Less distributions from: | |||||||
| Net investment income | (0.48) | (0.65) | |||||
| Net realized gain | (0.78) | — | |||||
| Total distributions | (1.26) | (0.65) | |||||
| Net asset value, end of period | $ 21.72 | $ 21.40 | |||||
| Total return | 7.84% | (10.01)% d | |||||
| Ratios/Supplemental data: | |||||||
| Net assets, end of period (000s) | $180,254 | $211,865 | |||||
| Ratio of expenses to average net assetse,f | 0.00% | 0.02% | |||||
| Ratio of expenses to average net assets prior to waived feese,f | 0.78% | 0.78% | |||||
| Ratio of net investment income to average net assetse | 2.42% | 1.82% | |||||
| Portfolio turnover rateh,i | 11% | 7% | |||||
|
|
|||||||
| a | Commencement of operations. |
| b | Based on average shares outstanding throughout each period. |
| c | The amounts reported for a share outstanding may not accord with the change in aggregate gains and losses in securities for the fiscal period due to the timing of capital share transactions in relation to the fluctuating market values of the Fund’s underlying securities. |
| d | Not annualized. |
| e | Annualized for periods of less than one year. |
| f | The Fund indirectly bears its proportionate share of fees and expenses incurred by the underlying fund in which the Fund is invested. This ratio does not include these indirect fees and expenses. |
| g | Portfolio turnover rates exclude portfolio securities received or delivered as a result of processing capital share transactions in Creation Units. |
| h | Portfolio turnover rates exclude the portfolio activity of the underlying fund in which the Fund is invested. |
| Premium/Discount Range | Number of Days | Percentage of Total Days | ||
| Greater than 0.5% and Less than 1.0% | 5 | 1.13% | ||
| Between 0.5% and -0.5% | 435 | 98.64 | ||
| Less than -0.5% and Greater than -1.0% | 1 | 0.23 | ||
| 441 | 100.00% |
| Average Annual Total Returns | Cumulative Total Returns | ||||||
| NAV | MARKET | INDEX | NAV | MARKET | INDEX | ||
| 1 Year | 7.84% | 7.88% | 8.31% | 7.84% | 7.88% | 8.31% | |
| Since Inception* | (1.53)% | (1.52)% | (0.97)% | (2.95)% | (2.93)% | (1.88)% | |
| * | Total returns for the period since inception are calculated from the inception date of the Fund (9/23/14). The first day of secondary market trading in shares of the Fund was 9/25/14. |
| Call: | 1-800-iShares
or 1-800-474-2737 (toll free) Monday through Friday, 8:30 a.m. to 6:30 p.m. (Eastern time) |
| Email: | iSharesETFs@blackrock.com |
| Write: | c/o
BlackRock Investments, LLC 1 University Square Drive, Princeton, NJ 08540 |

| 2016 Prospectus |
|
| ► | iShares Edge MSCI Min Vol Emerging Markets ETF | EEMV | NYSE ARCA |
|
|
S-1 |
|
|
1 |
|
|
2 |
|
|
20 |
|
|
23 |
|
|
23 |
|
|
26 |
|
|
39 |
|
|
39 |
|
|
41 |
|
|
41 |
|
|
43 |
| Ticker: EEMV | Stock Exchange: NYSE Arca |
| Annual
Fund Operating Expenses (ongoing expenses that you pay each year as a percentage of the value of your investments) | ||||||||||||
| Management
Fees |
Distribution
and Service (12b-1) Fees |
Foreign
Taxes |
Other
Expenses1 |
Total
Annual Fund Operating Expenses |
Fee Waiver | Total
Annual Fund Operating Expenses After Fee Waiver | ||||||
| 0.71% | None | 0.00% | 0.00% | 0.71% | (0.46)% | 0.25% | ||||||
| 1 | For the most recently completed fiscal year, the amount of Other Expenses rounded to 0.00%. |
| 1 Year | 3 Years | 5 Years | 10 Years | |||
| $26 | $80 | $141 | $520 |
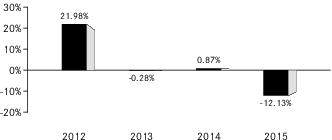
| 1 | The Fund’s year-to-date return as of September 30, 2016 was 11.03%. |
| One Year | Since
Fund Inception | ||
| (Inception Date: 10/18/2011) | |||
| Return Before Taxes | -12.13% | 2.38% | |
| Return After Taxes on Distributions2 | -12.62% | 1.82% | |
| Return After Taxes on Distributions and Sale of Fund Shares2 | -6.42% | 1.93% | |
| MSCI Emerging Markets Minimum Volatility (USD) Index (Index returns do not reflect deductions for fees, expenses or taxes) | -12.05% | 2.58% |
| 2 | After-tax returns in the table above are calculated using the historical highest individual U.S. federal marginal income tax rates and do not reflect the impact of state or local taxes. Actual after-tax returns depend on an investor’s tax situation and may differ from those shown, and after-tax returns shown are not relevant to tax-exempt investors or investors who hold shares through tax-deferred arrangements, such as 401(k) plans or individual retirement accounts (“IRAs”). Fund returns after taxes on distributions and sales of Fund shares are calculated assuming that an investor has sufficient capital gains of the same character from other investments to offset any capital losses from the sale of Fund shares. As a result, Fund returns after taxes on distributions and sales of Fund shares may exceed Fund returns before taxes and/or returns after taxes on distributions. |
| ■ | Lower levels of liquidity and market efficiency; |
| ■ | Greater securities price volatility; |
| ■ | Exchange rate fluctuations and exchange controls; |
| ■ | Less availability of public information about issuers; |
| ■ | Limitations on foreign ownership of securities; |
| ■ | Imposition of withholding or other taxes; |
| ■ | Imposition of restrictions on the expatriation of the funds or other assets of the Fund; |
| ■ | Higher transaction and custody costs and delays in settlement procedures; |
| ■ | Difficulties in enforcing contractual obligations; |
| ■ | Lower levels of regulation of the securities markets; |
| ■ | Weaker accounting, disclosure and reporting requirements; and |
| ■ | Legal principles relating to corporate governance, directors’ fiduciary duties and |
Government Control and Regulations. The Chinese government has implemented significant economic reforms in order to liberalize trade policy, promote foreign investment in the economy, reduce government control of the economy and develop market mechanisms. There can be no assurance these reforms will continue or that they will be effective. Despite recent reform and privatizations, significant regulation of investment and industry is still pervasive, including restrictions on investment in companies or industries deemed to be sensitive to particular national interests, and the Chinese government may restrict foreign ownership of Chinese corporations and/or repatriate assets. Limitations or restrictions on foreign ownership of securities may have adverse effects on the liquidity and performance of the Fund, and could lead to higher tracking error. Chinese markets generally continue to experience inefficiency, volatility and pricing anomalies that may be connected to governmental influence, a lack of publicly-available information and/or political and social instability.
| ■ | The risk of delays in settling portfolio transactions and the risk of loss arising out of the system of share registration and custody used in Russia; |
| ■ | Risks in connection with the maintenance of the Fund’s portfolio securities and cash with foreign sub-custodians and securities depositories, including the risk that appropriate sub-custody arrangements will not be available to the Fund; |
| ■ | The risk that the Fund’s ownership rights in portfolio securities could be lost through fraud or negligence because ownership in shares of Russian companies is recorded by the companies themselves and by registrars, rather than by a central registration system; and |
| ■ | The risk that the Fund may not be able to pursue claims on behalf of its shareholders because of the system of share registration and custody, and because Russian banking institutions and registrars are not guaranteed by the Russian government. |
| ■ | With respect to a foreign entity that holds the Indian assets directly, if the transferor of shares or interests in such a foreign entity (along with its associated enterprises), at any time in the 12 months preceding the year of transfer neither holds the right of control or management in the foreign entity, nor holds voting power or share capital or interest exceeding 5% of the total voting power or total share capital in such foreign entity. |
| ■ | With respect to a foreign entity that holds the Indian assets indirectly, if the transferor of shares or interests in such foreign entity (along with its associated enterprises), at any time in the 12 months preceding the year of transfer does not hold the right of control or management in relation to the foreign entity, which would entitle them to the right of control or management in the foreign entity which directly holds the Indian assets; or does not hold voting power or share capital or interest exceeding 5% of the total voting power or total share capital in the foreign entity, which results in holding the same share capital or voting power in the entity which directly holds the Indian assets. |
| ■ | creates rights, or obligations, which are not ordinarily created between persons dealing at arm's length; |
| ■ | results, directly or indirectly, in the misuse, or abuse, of the provisions of IT Act; |
| ■ | lacks commercial substance; or |
| ■ | is entered into, or carried out, by means, or in a manner, which are not ordinarily employed for bona fide purposes. |
| ■ | any arrangement where the aggregate tax benefit to all the parties of the arrangement in the relevant financial year does not exceed INR 30 Million; |
| ■ | foreign institutional investors (“FIIs”) that choose not to take any benefit under any tax treaty entered with India and have invested in listed or unlisted securities with prior permission of the competent authority in accordance with the applicable regulations; |
| ■ | non-resident investor in an FII who has invested in an FII, directly or indirectly, by way of an offshore derivative instrument or otherwise; or |
| ■ | any income derived from the transfer of investments made prior to August 30, 2010. |
| ■ | Dividend: Dividend income earned by the Subsidiary will not be subject to Indian tax. However, the Indian company declaring and paying such dividend would be subject to Dividend Distribution Tax at an effective rate of 20.36% (effective starting April 1, 2015) on the amount of the dividend paid out. |
| ■ | Interest: Interest paid to the Subsidiary in respect of debt obligations of Indian issuers will be subject to Indian income tax. The tax rate in the case of a rupee-denominated debt obligation is 43.26%. However if the Subsidiary is a SEBI registered sub-account, interest income earned from June 1, 2013 to June 30, 2017 on rupee denominated bonds of Indian companies and Indian government securities will be subject to tax at the rate of 5.41%, provided that the rate of interest does not exceed the prescribed rates. In the case of a foreign-currency denominated debt obligation, the tax rate is 21.63%. For approved foreign-currency loans advanced from July 1, 2012 to June 30, 2017, the tax rate on interest is 5.41% and for approved foreign currency long-term bonds issued from October 1, 2014 to June 30, 2017, the tax rate on interest is 5.41%. However, if the Subsidiary is registered as a sub-account with SEBI, interest from securities will be subject to tax at the rate of 21.63%. |
| ■ | Securities Transaction Tax: All transactions entered on a recognized stock exchange in India are subject to a Securities Transaction Tax (“STT”). STT has been introduced under Section 98 of the Finance (No.2) Act, 2004 on transactions relating to sale, purchases and redemption of investments made by purchasers or sellers of Indian securities and equity oriented mutual fund units. The current STT as levied on the transaction value as follows: |
| ■ | 0.1% payable by the buyer and 0.1% by the seller on the value of transactions of delivery based transfer of an equity share in an Indian company entered in a recognized stock exchange; |
| ■ | 0.001% on the value of transactions of delivery based sale of a unit of an equity oriented mutual fund entered in a recognized stock exchange, payable by the seller; |
| ■ | 0.025% on the value of transactions of non-delivery based sale of an equity share in an Indian company or a unit of an equity oriented mutual fund, entered in a recognized stock exchange payable by the seller; |
| ■ | 0.05% on the value of transactions of derivatives being options, entered in a recognized stock exchange. STT is to be paid by the seller; |
| ■ | 0.01% on the value of transactions of sale of derivatives being futures, entered in a recognized stock exchange. STT is to be paid by the seller; |
| ■ | 0.001% on the value of transactions of sale of units of an equity-oriented fund to the Mutual Fund, payable by the seller in accordance with the Finance Act, 2013; |
| ■ | 0.125% on the value of transactions of sale of derivatives being options, where the option is exercised, entered in a recognized stock exchange. STT is to be paid by buyer; |
| ■ | The Finance Act, 2012 has exempted from tax the capital gains (under the ITA) arising from the sale of unlisted shares by existing shareholders of a Sub-Fund in an initial public offer. However, such sale is subject to STT at 0.2% of the sale consideration payable by the seller. |
| ■ | Capital Gains: The taxation of capital gains would be as follows: (i) long-term capital gains (being gains on sale of shares held for a period of more than 12 months) listed on a recognized stock exchange would not be taxable in India provided STT has been paid on the same (as discussed above); (ii) short-term capital gains (being gains on sale of shares held for a period of 12 months or less) from the sale of Indian shares listed on a recognized stock exchange will be taxed at the rate of 16.223% provided STT has been paid on the same; (iii) long-term capital gains (being gains on sale of shares held for a period of more than 36 months) arising to the Subsidiary from the sale of unlisted securities will be taxed at the rate of 10.815% (without indexation) and short-term capital gains (being gains on sale of shares held for a period of 36 months or less) will be taxed at the rate of 43.26%;* (iv) capital gains realized on sale of listed equity shares not executed on a recognized stock exchange in India would be taxed at the rate of 21.63% for long-term gains (being gains on sale of shares held for a period of more than 12 months) and at 43.26% in the case of short-term gains (being gains on sale of shares held for a period of 12 months or less);* and (v) capital gains arising from the transfer of depositary receipts outside India between non-resident investors will not be subject to tax in India. |
| * | However, if the Subsidiary is a SEBI registered sub-account, the rates will be 10.816% and 32.45%, respectively. |
| ■ | With respect to a foreign entity that holds the Indian assets directly, if the transferor of shares or interests in such a foreign entity (along with its associated enterprises), at any time in the 12 months preceding the year of transfer neither holds the right of control or management in the foreign entity, nor holds voting power or share capital or interest exceeding 5% of the total voting power or total share capital in such foreign entity. |
| ■ | With respect to a foreign entity that holds the Indian assets indirectly, if the transferor of shares or interests in such foreign entity (along with its associated enterprises), at any time in the 12 months preceding the year of transfer does not hold the right of control or management in relation to the foreign entity, which would entitle them to the right of control or management in the foreign entity which directly holds the Indian assets; or does not hold voting power or share capital or interest exceeding 5% of the total voting power or total share capital in the foreign entity, which results in holding the same share capital or voting power in the entity which directly holds the Indian assets. |
| ■ | any arrangement where the aggregate tax benefit to all the parties of the arrangement in the relevant financial year does not exceed INR 30 Million; |
| ■ | FIIs that choose not to take any benefit under any tax treaty entered with India and have invested in listed or unlisted securities with prior permission of the competent authority in accordance with the applicable regulations; |
| ■ | non-resident investor in an FII who has invested in an FII, directly or indirectly, by way of an offshore derivative instrument or otherwise; or |
| ■ | any income derived from the transfer of investments made prior to August 30, 2010. |
| Approximate
Value of a Creation Unit |
Creation
Unit Size |
Standard
Creation/ Redemption Transaction Fee |
Maximum
Additional Charge for Creations* |
Maximum
Additional Charge for Redemptions* | ||||
| $5,356,000 | 100,000 | $6,100 | 7.0% | 2.0% |
| * | As a percentage of the net asset value per Creation Unit, inclusive, in the case of redemptions, of the standard redemption transaction fee. |
(For a share outstanding throughout each period)
| Year
ended Aug. 31, 2016 |
Year
ended Aug. 31, 2015 |
Year
ended Aug. 31, 2014 |
Year
ended Aug. 31, 2013 |
Period
from Oct. 18, 2011a to Aug. 31, 2012 | |||||||||
| Net asset value, beginning of period | $ 50.98 | $ 62.47 | $ 55.56 | $ 55.32 | $ 49.30 | ||||||||
| Income from investment operations: | |||||||||||||
| Net investment incomeb | 1.57 | 1.58 | 1.51 | 1.85 | 1.93 | ||||||||
| Net realized and unrealized gain (loss)c | 2.13 | (11.65) | 6.94 | (0.60) | 5.41 | ||||||||
| Total from investment operations | 3.70 | (10.07) | 8.45 | 1.25 | 7.34 | ||||||||
| Less distributions from: | |||||||||||||
| Net investment income | (1.28) | (1.42) | (1.54) | (1.01) | (1.32) | ||||||||
| Total distributions | (1.28) | (1.42) | (1.54) | (1.01) | (1.32) | ||||||||
| Net asset value, end of period | $ 53.40 | $ 50.98 | $ 62.47 | $ 55.56 | $ 55.32 | ||||||||
| Total return | 7.48% | (16.32)% | 15.44% | 2.22% | 15.16% d | ||||||||
| Ratios/Supplemental data: | |||||||||||||
| Net assets, end of period (000s) | $4,379,041 | $2,462,357 | $2,080,363 | $2,455,727 | $387,227 | ||||||||
| Ratio of expenses to average net assetse | 0.25% | 0.25% | 0.25% | 0.25% | 0.25% | ||||||||
| Ratio of expenses to average net assets prior to waived feese | 0.71% | 0.69% | 0.67% | 0.67% | 0.69% | ||||||||
| Ratio of net investment income to average net assetse | 3.12% | 2.71% | 2.58% | 3.13% | 4.08% | ||||||||
| Portfolio turnover ratef | 23% | 28% | 34% | 23% | 31% | ||||||||
|
|
|||||||||||||
| a | Commencement of operations. |
| b | Based on average shares outstanding throughout each period. |
| c | The amounts reported for a share outstanding may not accord with the change in aggregate gains and losses in securities for the fiscal period due to the timing of capital share transactions in relation to the fluctuating market values of the Fund’s underlying securities. |
| d | Not annualized. |
| e | Annualized for periods of less than one year. |
| f | Portfolio turnover rates exclude portfolio securities received or delivered in Creation Units but include portfolio transactions that are executed as a result of the Fund processing capital share transactions in Creation Units partially for cash in U.S. dollars. Excluding such cash transactions, the portfolio turnover rates for the years ended August 31, 2016, August 31, 2015, August 31, 2014, August 31, 2013 and the period ended August 31, 2012 were 23%, 24%, 26%, 23% and 16%, respectively. |
| Premium/Discount Range | Number of Days | Percentage of Total Days | ||
| Greater than 2.0% and Less than 2.5% | 1 | 0.23% | ||
| Greater than 1.5% and Less than 2.0% | 10 | 2.27 | ||
| Greater than 1.0% and Less than 1.5% | 29 | 6.58 | ||
| Greater than 0.5% and Less than 1.0% | 119 | 26.98 | ||
| Between 0.5% and -0.5% | 233 | 52.83 | ||
| Less than -0.5% and Greater than -1.0% | 31 | 7.03 | ||
| Less than -1.0% and Greater than -1.5% | 14 | 3.17 | ||
| Less than -1.5% and Greater than -2.0% | 4 | 0.91 | ||
| 441 | 100.00% |
| Average Annual Total Returns | Cumulative Total Returns | ||||||
| NAV | MARKET | INDEX | NAV | MARKET | INDEX | ||
| 1 Year | 7.48% | 7.45% | 7.79% | 7.48% | 7.45% | 7.79% | |
| Since Inception* | 4.20% | 4.13% | 4.41% | 22.22% | 21.83% | 23.40% | |
| * | Total returns for the period since inception are calculated from the inception date of the Fund (10/18/11). The first day of secondary market trading in shares of the Fund was 10/20/11. |
| Call: | 1-800-iShares
or 1-800-474-2737 (toll free) Monday through Friday, 8:30 a.m. to 6:30 p.m. (Eastern time) |
| Email: | iSharesETFs@blackrock.com |
| Write: | c/o
BlackRock Investments, LLC 1 University Square Drive, Princeton, NJ 08540 |

| 2016 Prospectus |
|
| ► | iShares Edge MSCI Min Vol Global ETF | ACWV | NYSE ARCA |
|
|
S-1 |
|
|
1 |
|
|
2 |
|
|
12 |
|
|
15 |
|
|
15 |
|
|
19 |
|
|
28 |
|
|
28 |
|
|
30 |
|
|
30 |
|
|
32 |
GLOBAL ETF
| Ticker: ACWV | Stock Exchange: NYSE Arca |
| Annual
Fund Operating Expenses (ongoing expenses that you pay each year as a percentage of the value of your investments) | ||||||||||||
| Management
Fees |
Distribution
and Service (12b-1) Fees |
Other
Expenses |
Acquired
Fund Fees and Expenses |
Total
Annual Fund Operating Expenses |
Fee Waiver | Total
Annual Fund Operating Expenses After Fee Waiver | ||||||
| 0.32% | None | None | 0.00% | 0.32% | (0.12)% | 0.20% | ||||||
| 1 Year | 3 Years | 5 Years | 10 Years | |||
| $20 | $64 | $113 | $308 |
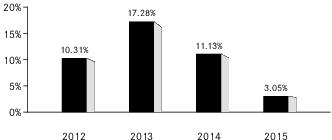
| 1 | The Fund’s year-to-date return as of September 30, 2016 was 10.86%. |
| One Year | Since
Fund Inception | ||
| (Inception Date: 10/18/2011) | |||
| Return Before Taxes | 3.05% | 10.54% | |
| Return After Taxes on Distributions2 | 2.44% | 9.93% | |
| Return After Taxes on Distributions and Sale of Fund Shares2 | 2.12% | 8.24% | |
| MSCI ACWI Minimum Volatility (USD) Index (Index returns do not reflect deductions for fees, expenses or taxes) | 2.76% | 10.27% |
| 2 | After-tax returns in the table above are calculated using the historical highest individual U.S. federal marginal income tax rates and do not reflect the impact of state or local taxes. Actual after-tax returns depend on an investor’s tax situation and may differ from those shown, and after-tax returns shown are not relevant to tax-exempt investors or investors who hold shares through tax-deferred arrangements, such as 401(k) plans or individual retirement accounts (“IRAs”). Fund returns after taxes on distributions and sales of Fund shares are calculated assuming that an investor has sufficient capital gains of the same character from other investments to offset any capital losses from the sale of Fund shares. As a result, Fund returns after taxes on distributions and sales of Fund shares may exceed Fund returns before taxes and/or returns after taxes on distributions. |
| ■ | Lower levels of liquidity and market efficiency; |
| ■ | Greater securities price volatility; |
| ■ | Exchange rate fluctuations and exchange controls; |
| ■ | Less availability of public information about issuers; |
| ■ | Limitations on foreign ownership of securities; |
| ■ | Imposition of withholding or other taxes; |
| ■ | Imposition of restrictions on the expatriation of the funds or other assets of the Fund; |
| ■ | Higher transaction and custody costs and delays in settlement procedures; |
| ■ | Difficulties in enforcing contractual obligations; |
| ■ | Lower levels of regulation of the securities markets; |
| ■ | Weaker accounting, disclosure and reporting requirements; and |
| ■ | Legal principles relating to corporate governance, directors’ fiduciary duties and liabilities and stockholders’ rights in markets in which the Fund invests may differ and/or may not be as extensive or protective as those that apply in the United States. |
| Approximate
Value of a Creation Unit |
Creation
Unit Size |
Standard
Creation/ Redemption Transaction Fee |
Maximum
Additional Charge for Creations* |
Maximum
Additional Charge for Redemptions* | ||||
| $7,600,000 | 100,000 | $4,200 | 7.0% | 2.0% |
| * | As a percentage of the net asset value per Creation Unit, inclusive, in the case of redemptions, of the standard redemption transaction fee. |
(For a share outstanding throughout each period)
| Year
ended Aug. 31, 2016 |
Year
ended Aug. 31, 2015 |
Year
ended Aug. 31, 2014 |
Year
ended Aug. 31, 2013 |
Period
from Oct. 18, 2011a to Aug. 31, 2012 | |||||
| Net asset value, beginning of period | $ 67.59 | $ 68.25 | $ 59.99 | $ 55.65 | $ 50.02 | ||||
| Income from investment operations: | |||||||||
| Net investment incomeb | 1.79 | 1.70 | 1.72 | 1.68 | 1.49 | ||||
| Net realized and unrealized gain (loss)c | 8.07 | (0.89) | 8.18 | 4.20 | 4.67 | ||||
| Total from investment operations | 9.86 | 0.81 | 9.90 | 5.88 | 6.16 | ||||
| Less distributions from: | |||||||||
| Net investment income | (1.63) | (1.47) | (1.64) | (1.54) | (0.53) | ||||
| Total distributions | (1.63) | (1.47) | (1.64) | (1.54) | (0.53) | ||||
| Net asset value, end of period | $ 75.82 | $ 67.59 | $ 68.25 | $ 59.99 | $ 55.65 | ||||
| Total return | 14.76% | 1.15% | 16.70% | 10.69% | 12.41% d | ||||
| Ratios/Supplemental data: | |||||||||
| Net assets, end of period (000s) | $3,267,688 | $2,115,632 | $1,283,012 | $1,007,760 | $578,776 | ||||
| Ratio of expenses to average net assetse | 0.20% | 0.20% | 0.20% | 0.20% | 0.23% | ||||
| Ratio of expenses to average net assets prior to waived feese | 0.32% | 0.33% | 0.33% | 0.34% | 0.34% | ||||
| Ratio of net investment income to average net assetse | 2.49% | 2.41% | 2.67% | 2.83% | 3.17% | ||||
| Portfolio turnover ratef | 24% | 22% | 24% | 13% | 22% | ||||
|
|
| a | Commencement of operations. |
| b | Based on average shares outstanding throughout each period. |
| c | The amounts reported for a share outstanding may not accord with the change in aggregate gains and losses in securities for the fiscal period due to the timing of capital share transactions in relation to the fluctuating market values of the Fund’s underlying securities. |
| d | Not annualized. |
| e | Annualized for periods of less than one year. |
| f | Portfolio turnover rates exclude portfolio securities received or delivered in Creation Units but include portfolio transactions that are executed as a result of the Fund processing capital share transactions in Creation Units partially for cash in U.S. dollars. Excluding such cash transactions, the portfolio turnover rates for the years ended August 31, 2016, August 31, 2015, August 31, 2014, August 31, 2013 and the period ended August 31, 2012 were 23%, 22%, 23%, 13% and 22%, respectively. |
| Premium/Discount Range | Number of Days | Percentage of Total Days | ||
| Greater than 0.5% and Less than 1.0% | 15 | 3.40% | ||
| Between 0.5% and -0.5% | 422 | 95.69 | ||
| Less than -0.5% and Greater than -1.0% | 4 | 0.91 | ||
| 441 | 100.00% |
| Average Annual Total Returns | Cumulative Total Returns | ||||||
| NAV | MARKET | INDEX | NAV | MARKET | INDEX | ||
| 1 Year | 14.76% | 14.97% | 14.51% | 14.76% | 14.97% | 14.51% | |
| Since Inception* | 11.31% | 11.30% | 11.03% | 68.56% | 68.51% | 66.43% | |
| * | Total returns for the period since inception are calculated from the inception date of the Fund (10/18/11). The first day of secondary market trading in shares of the Fund was 10/20/11. |
| Call: | 1-800-iShares
or 1-800-474-2737 (toll free) Monday through Friday, 8:30 a.m. to 6:30 p.m. (Eastern time) |
| Email: | iSharesETFs@blackrock.com |
| Write: | c/o
BlackRock Investments, LLC 1 University Square Drive, Princeton, NJ 08540 |

| 2016 Prospectus |
|
| ► | iShares Edge MSCI Min Vol EM Currency Hedged ETF | HEMV | BATS |
|
|
S-1 |
|
|
1 |
|
|
2 |
|
|
20 |
|
|
23 |
|
|
23 |
|
|
24 |
|
|
27 |
|
|
36 |
|
|
37 |
|
|
38 |
|
|
38 |
|
|
40 |
| Ticker: HEMV | Stock Exchange: BATS |
| Annual
Fund Operating Expenses (ongoing expenses that you pay each year as a percentage of the value of your investments) | ||||||||||||
| Management
Fees |
Distribution
and Service (12b-1) Fees |
Other
Expenses |
Acquired
Fund Fees and Expenses |
Total
Annual Fund Operating Expenses |
Fee Waiver | Total
Annual Fund Operating Expenses After Fee Waiver | ||||||
| 0.78% | None | None | 0.25% | 1.03% | (0.75)% | 0.28% | ||||||
| 1 Year | 3 Years | 5 Years | 10 Years | |||
| $29 | $90 | $248 | $959 |
| ■ | Lower levels of liquidity and market efficiency; |
| ■ | Greater securities price volatility; |
| ■ | Exchange rate fluctuations and exchange controls; |
| ■ | Less availability of public information about issuers; |
| ■ | Limitations on foreign ownership of securities; |
| ■ | Imposition of withholding or other taxes; |
| ■ | Imposition of restrictions on the expatriation of the funds or other assets of the Fund; |
| ■ | Higher transaction and custody costs and delays in settlement procedures; |
| ■ | Difficulties in enforcing contractual obligations; |
| ■ | Lower levels of regulation of the securities markets; |
| ■ | Weaker accounting, disclosure and reporting requirements; and |
| ■ | Legal principles relating to corporate governance, directors’ fiduciary duties and liabilities and stockholders’ rights in markets in which the Fund invests may differ and/or may not be as extensive or protective as those that apply in the United States. |
| ■ | The risk of delays in settling portfolio transactions and the risk of loss arising out of the system of share registration and custody used in Russia; |
| ■ | Risks in connection with the maintenance of the Fund’s or the Underlying Fund's portfolio securities and cash with foreign sub-custodians and securities depositories, including the risk that appropriate sub-custody arrangements will not be available to the Fund or the Underlying Fund; |
| ■ | The risk that the Fund’s or the Underlying Fund's ownership rights in portfolio securities could be lost through fraud or negligence because ownership in shares of Russian companies is recorded by the companies themselves and by registrars, rather than by a central registration system; and |
| ■ | The risk that the Fund or the Underlying Fund may not be able to pursue claims on behalf of its shareholders because of the system of share registration and custody, and because Russian banking institutions and registrars are not guaranteed by the Russian government. |
| Approximate
Value of a Creation Unit |
Creation
Unit Size |
Standard
Creation/ Redemption Transaction Fee |
Maximum
Additional Charge for Creations* |
Maximum
Additional Charge for Redemptions* | ||||
| $1,244,000 | 50,000 | $500 | 3.0% | 2.0% |
| * | As a percentage of the net asset value per Creation Unit, inclusive, in the case of redemptions, of the standard redemption transaction fee. |
(For a share outstanding throughout the period)
| Period
from Oct. 29, 2015a to Aug. 31, 2016 | ||||||
| Net asset value, beginning of period | $24.50 | |||||
| Income from investment operations: | ||||||
| Net investment incomeb | 0.58 | |||||
| Net realized and unrealized gainc | 0.23 | |||||
| Total from investment operations | 0.81 | |||||
| Less distributions from: | ||||||
| Net investment income | (0.60) | |||||
| Return of capital | (0.00) d | |||||
| Total distributions | (0.60) | |||||
| Net asset value, end of period | $ 24.71 | |||||
| Total return | 3.45% e | |||||
| Ratios/Supplemental data: | ||||||
| Net assets, end of period (000s) | $ 6,177 | |||||
| Ratio of expenses to average net assetsf,g | 0.03% | |||||
| Ratio of expenses to average net assets prior to waived feesf,g | 0.78% | |||||
| Ratio of net investment income to average net assetsf | 2.88% | |||||
| Portfolio turnover rateh,i | 8% | |||||
|
|
||||||
| a | Commencement of operations. |
| b | Based on average shares outstanding throughout the period. |
| c | The amount reported for a share outstanding may not accord with the change in aggregate gains and losses in securities for the fiscal period due to the timing of capital share transactions in relation to the fluctuating market values of the Fund’s underlying securities. |
| d | Rounds to less than $0.01. |
| e | Not annualized. |
| f | Annualized for periods of less than one year. |
| g | The Fund indirectly bears its proportionate share of fees and expenses incurred by the underlying fund in which the Fund is invested. This ratio does not include these indirect fees and expenses. |
| h | Portfolio turnover rate excludes portfolio securities received or delivered as a result of processing capital share transactions in Creation Units. |
| i | Portfolio turnover rate excludes the portfolio activity of the underlying fund in which the Fund is invested. |
| Premium/Discount Range | Number of Days | Percentage of Total Days | ||
| Greater than 1.5% | 2 | 0.86% | ||
| Greater than 1.0% and Less than 1.5% | 7 | 3.00 | ||
| Greater than 0.5% and Less than 1.0% | 40 | 17.17 | ||
| Between 0.5% and -0.5% | 146 | 62.66 | ||
| Less than -0.5% and Greater than -1.0% | 32 | 13.73 | ||
| Less than -1.0% and Greater than -1.5% | 2 | 0.86 | ||
| Less than -1.5% and Greater than -2.0% | 1 | 0.43 | ||
| Less than -2.0% | 3 | 1.29 | ||
| 233 | 100.00% |
| Cumulative Total Returns | |||
| NAV | MARKET | INDEX | |
| Since Inception* | 3.45% | 4.13% | 2.71% |
| * | Total returns for the period since inception are calculated from the inception date of the Fund (10/29/15). The first day of secondary market trading in shares of the Fund was 11/02/15. |
| Call: | 1-800-iShares
or 1-800-474-2737 (toll free) Monday through Friday, 8:30 a.m. to 6:30 p.m. (Eastern time) |
| Email: | iSharesETFs@blackrock.com |
| Write: | c/o
BlackRock Investments, LLC 1 University Square Drive, Princeton, NJ 08540 |

(as revised July 3, 2017)
| Fund | Ticker | Listing Exchange | ||
| iShares Asia/Pacific Dividend ETF (the “Fund”) | DVYA | NYSE Arca |
| 1. | Concentrate its investments (i.e., invest 25% or more of its total assets in the securities of a particular industry or group of industries), except that the Fund will concentrate to approximately the same extent that the Underlying Index concentrates in the securities of a particular industry or group of industries. For purposes of this limitation, securities of the U.S. government (including its agencies and instrumentalities), repurchase agreements collateralized by U.S. government securities, and securities of state or municipal governments and their political subdivisions are not considered to be issued by members of any industry. |
| 2. | Borrow money, except that (i) the Fund may borrow from banks for temporary or emergency (not leveraging) purposes, including the meeting of redemption requests which might otherwise require the untimely disposition of securities; and (ii) the Fund may, to the extent consistent with its investment policies, enter into repurchase agreements, reverse repurchase agreements, forward roll transactions and similar investment strategies and techniques. To the extent that it engages in transactions described in (i) and (ii), the Fund will be limited so that no more than 33 1/3% of the value of its total assets (including the amount borrowed) is derived from such transactions. Any borrowings which come to exceed this amount will be reduced in accordance with applicable law. |
| 3. | Issue any senior security, except as permitted under the 1940 Act, as interpreted, modified or otherwise permitted by any regulatory authority having jurisdiction, from time to time. |
| 4. | Make loans, except as permitted under the 1940 Act, as interpreted, modified or otherwise permitted by regulatory authority having jurisdiction, from time to time. |
| 5. | Purchase or sell real estate unless acquired as a result of ownership of securities or other instruments (but this restriction shall not prevent the Fund from investing in securities of companies engaged in the real estate business or securities or other instruments backed by real estate or mortgages), or commodities or commodity contracts (but this restriction shall not prevent the Fund from trading in futures contracts and options on futures contracts, including options on currencies to the extent consistent with the Fund’s investment objective and policies). |
| 6. | Engage in the business of underwriting securities issued by other persons, except to the extent that the Fund may technically be deemed to be an underwriter under the 1933 Act, in disposing of portfolio securities. |
| • | The frequency of trades and quotes for the security; |
| • | The number of dealers wishing to purchase or sell the security and the number of other potential purchasers; |
| • | Dealer undertakings to make a market in the security; and |
| • | The nature of the security and the nature of the marketplace in which it trades (e.g., the time needed to dispose of the security, the method of soliciting offers and the mechanics of transfer). |
| Name (Age) | Position | Principal
Occupation(s) During the Past 5 Years |
Other
Directorships Held by Director | |||
| Robert
S. Kapito1 (59) |
Director
(since 2009). |
President, BlackRock, Inc. (since 2006); Vice Chairman of BlackRock, Inc. and Head of BlackRock’s Portfolio Management Group (since its formation in 1998) and BlackRock, Inc.’s predecessor entities (since 1988); Trustee, University of Pennsylvania (since 2009); President of Board of Directors, Hope & Heroes Children’s Cancer Fund (since 2002). | Director of BlackRock, Inc. (since 2006); Trustee of iShares Trust (since 2009); Trustee of iShares U.S. ETF Trust (since 2011). | |||
| Mark
K. Wiedman2 (45) |
Director (since 2013). | Senior Managing Director, BlackRock, Inc. (since 2014); Managing Director, BlackRock, Inc. (2007-2014); Global Head of BlackRock’s ETF and Index Investments Business (since 2016); Global Head of iShares (2011-2016); Head of Corporate Strategy, BlackRock, Inc. (2009-2011). | Trustee of iShares Trust (since 2013); Trustee of iShares U.S. ETF Trust (since 2013); Director of PennyMac Financial Services, Inc. (since 2008). |
| 1 | Robert S. Kapito is deemed to be an “interested person” (as defined in the 1940 Act) of the Company due to his affiliations with BlackRock, Inc. and its affiliates. |
| 2 | Mark K. Wiedman is deemed to be an “interested person” (as defined in the 1940 Act) of the Company due to his affiliations with BlackRock, Inc. and its affiliates. |
| Name (Age) | Position | Principal
Occupation(s) During the Past 5 Years |
Other
Directorships Held by Director | |||
| Cecilia
H. Herbert (68) |
Director
(since 2005); Independent Board Chair (since 2016). |
Trustee and Member of the Finance, Technology and Quality Committee of Stanford Health Care (since 2016); Trustee and Member of the Investment Committee, WNET, a New York public media company (since 2011); Chair (1994-2005) and Member (since 1992) of the Investment Committee, Archdiocese of San Francisco; Director (1998-2013) and President (2007-2011) of the Board of Directors, Catholic Charities CYO; Trustee (2002-2011) and Chair of the Finance and Investment Committee (2006-2010) of the Thacher School. | Trustee of iShares Trust (since 2005); Trustee of iShares U.S. ETF Trust (since 2011); Independent Board Chair of iShares Trust and iShares U.S. ETF Trust (since 2016); Trustee of Forward Funds (14 portfolios) (since 2009); Trustee of Salient MF Trust (4 portfolios) (since 2015). | |||
| Jane
D. Carlin (60) |
Director
(since 2015); Risk Committee Chair (since 2016). |
Consultant (since 2012); Managing Director and Global Head of Financial Holding Company Governance & Assurance and the Global Head of Operational Risk Management of Morgan Stanley (2006-2012). | Trustee of iShares Trust (since 2015); Trustee of iShares U.S. ETF Trust (since 2015); Director of PHH Corporation (mortgage solutions) (since 2012); Director of The Hanover Insurance Group, Inc. (since 2016). | |||
| Richard
L. Fagnani (62) |
Director
(since 2017); Equity Plus Committee Chair (since 2017). |
Retired; Partner, KPMG LLP (2002-2016). | Trustee of iShares Trust (since 2017); Trustee of iShares U.S. ETF Trust (since 2017). | |||
| Charles
A. Hurty (72) |
Director
(since 2005); Audit Committee Chair (since 2006). |
Partner, KPMG LLP (1968-2001). | Trustee of iShares Trust (since 2005); Trustee of iShares U.S. ETF Trust (since 2011); Director of SkyBridge Alternative Investments Multi-Adviser Hedge Fund Portfolios LLC (2 portfolios) (since 2002). | |||
| John
E. Kerrigan (61) |
Director
(since 2005); Securities Lending Committee Chair (since 2016). |
Chief Investment Officer, Santa Clara University (since 2002). | Trustee of iShares Trust (since 2005); Trustee of iShares U.S. ETF Trust (since 2011). | |||
| Drew
E. Lawton (58) |
Director
(since 2017); 15(c) Committee Chair (since 2017). |
Senior Managing Director of New York Life Insurance Company (2010-2015). | Trustee of iShares Trust (since 2017); Trustee of iShares U.S. ETF Trust (since 2017). | |||
| John
E. Martinez (56) |
Director
(since 2003); Fixed Income Plus Committee Chair (since 2016). |
Director of Real Estate Equity Exchange, Inc. (since 2005). | Trustee of iShares Trust (since 2003); Trustee of iShares U.S. ETF Trust (since 2011). |
| Name (Age) | Position | Principal
Occupation(s) During the Past 5 Years |
Other
Directorships Held by Director | |||
| Madhav
V. Rajan (52) |
Director
(since 2011); Nominating and Governance Committee Chair (since 2017). |
Dean, and George Pratt Shultz Professor of Accounting, University of Chicago Booth School of Business (since 2017); Robert K. Jaedicke Professor of Accounting, Stanford University Graduate School of Business (2001-2017); Professor of Law (by courtesy), Stanford Law School (2005-2017); Senior Associate Dean for Academic Affairs and Head of MBA Program, Stanford University Graduate School of Business (2010-2016). | Trustee
of iShares Trust (since 2011); Trustee of iShares U.S. ETF Trust (since 2011); Director, Cavium, Inc. (since 2013). |
| Name (Age) | Position | Principal
Occupation(s) During the Past 5 Years | ||
| Martin
Small (41) |
President (since 2016). | Managing Director, BlackRock, Inc. (since 2010); Head of U.S. iShares (since 2015); Co-Head of the U.S. Financial Markets Advisory Group, BlackRock, Inc. (2008-2014). | ||
| Jack
Gee (56) |
Treasurer
and Chief Financial Officer (since 2008). |
Managing Director, BlackRock, Inc. (since 2009); Senior Director of Fund Administration of Intermediary Investor Business, BGI (2009). | ||
| Charles
Park (49) |
Chief Compliance Officer (since 2006). | Chief Compliance Officer of BlackRock Advisors, LLC and the BlackRock-advised Funds in the Equity-Bond Complex, the Equity-Liquidity Complex and the Closed-End Complex (since 2014); Chief Compliance Officer of BFA (since 2006). | ||
| Benjamin
Archibald (42) |
Secretary (since 2015). | Managing Director, BlackRock, Inc. (since 2014); Director, BlackRock, Inc. (2010-2013); Secretary of the BlackRock-advised mutual funds (since 2012). | ||
| Steve
Messinger (55) |
Executive
Vice President (since 2016). |
Managing Director, BlackRock, Inc. (2007-2014 and since 2016); Managing Director, Beacon Consulting Group (2014-2016). | ||
| Scott
Radell (47) |
Executive
Vice President (since 2012). |
Managing Director, BlackRock, Inc. (since 2009); Head of Portfolio Solutions, BlackRock, Inc. (since 2009). |
| Name (Age) | Position | Principal
Occupation(s) During the Past 5 Years | ||
| Alan
Mason (56) |
Executive
Vice President (since 2016). |
Managing Director, BlackRock, Inc. (since 2009). |
| Name of Director | Fund | Dollar
Range of Equity Securities in the Fund |
Aggregate
Dollar Range of Equity Securities in all Registered Investment Companies Overseen by Director in Family of Investment Companies | |||
| Robert S. Kapito | None | None | None | |||
| Mark Wiedman | iShares Core MSCI EAFE ETF | $50,001-$100,000 | Over $100,000 | |||
| iShares Core MSCI Emerging Markets ETF | $50,001-$100,000 | |||||
| iShares Core S&P Total U.S. Stock Market ETF | Over $100,000 | |||||
| John E. Martinez | iShares Core MSCI Emerging Markets ETF | $50,001-$100,000 | Over $100,000 | |||
| iShares Core S&P 500 ETF | Over $100,000 | |||||
| iShares Core S&P Mid-Cap ETF | $10,001-$50,000 | |||||
| iShares Core S&P Small-Cap ETF | $10,001-$50,000 | |||||
| iShares Core S&P Total U.S. Stock Market ETF | $1-$10,000 | |||||
| iShares Global Consumer Staples ETF | Over $100,000 | |||||
| iShares MSCI All Country Asia ex Japan ETF | Over $100,000 | |||||
| iShares MSCI EAFE ETF | Over $100,000 | |||||
| iShares Russell 1000 ETF | Over $100,000 | |||||
| iShares Russell 1000 Value ETF | Over $100,000 | |||||
| iShares Russell 2000 ETF | Over $100,000 | |||||
| iShares TIPS Bond ETF | $50,001-$100,000 | |||||
| Cecilia H. Herbert | iShares China Large-Cap ETF | Over $100,000 | Over $100,000 | |||
| iShares Core Dividend Growth ETF | $10,001-$50,000 | |||||
| iShares Core High Dividend ETF | $1-$10,000 |
| Name of Director | Fund | Dollar
Range of Equity Securities in the Fund |
Aggregate
Dollar Range of Equity Securities in all Registered Investment Companies Overseen by Director in Family of Investment Companies | |||
| iShares Core MSCI Emerging Markets ETF | $10,001-$50,000 | |||||
| iShares Core MSCI Total International Stock ETF | $10,001-$50,000 | |||||
| iShares Core Russell U.S. Growth ETF | $50,001-$100,000 | |||||
| iShares Core Russell U.S. Value ETF | $10,001-$50,000 | |||||
| iShares Core S&P Small-Cap ETF | $1-$10,000 | |||||
| iShares Core S&P Total U.S. Stock Market ETF | $10,001-$50,000 | |||||
| iShares iBoxx $ High Yield Corporate Bond ETF | $10,001-$50,000 | |||||
| iShares International Select Dividend ETF | $1-$10,000 | |||||
| iShares MSCI EAFE ETF | $1-$10,000 | |||||
| iShares MSCI Emerging Markets ETF | $1-$10,000 | |||||
| iShares MSCI Japan ETF | $10,001-$50,000 | |||||
| iShares National Muni Bond ETF | $10,001-$50,000 | |||||
| iShares U.S. Preferred Stock ETF | $10,001-$50,000 | |||||
| Charles A. Hurty | iShares China Large-Cap ETF | $10,001-$50,000 | Over $100,000 | |||
| iShares Core Growth Allocation ETF | $50,001-$100,000 | |||||
| iShares Core High Dividend ETF | $10,001-$50,000 | |||||
| iShares Core Moderate Allocation ETF | $50,001-$100,000 | |||||
| iShares Core MSCI Emerging Markets ETF | $10,001-$50,000 | |||||
| iShares Core S&P 500 ETF | $10,001-$50,000 | |||||
| iShares Global Energy ETF | $10,001-$50,000 | |||||
| iShares Global Healthcare ETF | $10,001-$50,000 | |||||
| iShares Global Tech ETF | $10,001-$50,000 | |||||
| iShares MSCI EAFE ETF | $10,001-$50,000 | |||||
| iShares Russell 2000 ETF | $10,001-$50,000 | |||||
| iShares U.S. Basic Materials ETF | $10,001-$50,000 | |||||
| iShares U.S. Energy ETF | $10,001-$50,000 | |||||
| iShares U.S. Technology ETF | $50,001-$100,000 | |||||
| John E. Kerrigan | iShares MSCI ACWI ETF | $10,001-$50,000 | Over $100,000 | |||
| iShares MSCI ACWI ex U.S. ETF | Over $100,000 | |||||
| iShares Short-Term National Muni Bond ETF | Over $100,000 | |||||
| Madhav V. Rajan | iShares Core Dividend Growth ETF | Over $100,000 | Over $100,000 | |||
| iShares Core High Dividend ETF | Over $100,000 | |||||
| iShares Core MSCI Emerging Markets ETF | Over $100,000 | |||||
| iShares Core S&P 500 ETF | Over $100,000 |
| Name of Director | Fund | Dollar
Range of Equity Securities in the Fund |
Aggregate
Dollar Range of Equity Securities in all Registered Investment Companies Overseen by Director in Family of Investment Companies | |||
| iShares iBoxx $ High Yield Corporate Bond ETF | Over $100,000 | |||||
| iShares iBoxx $ Investment Grade Corporate Bond ETF | Over $100,000 | |||||
| iShares Russell 2000 ETF | Over $100,000 | |||||
| iShares Select Dividend ETF | Over $100,000 | |||||
| Jane D. Carlin | iShares Core MSCI EAFE ETF | $50,001-$100,000 | Over $100,000 | |||
| iShares Core S&P Small-Cap ETF | $10,001-$50,000 | |||||
| iShares Global Tech ETF | $10,001-$50,000 |
| Name of Director | iShares
Asia/Pacific Dividend ETF |
Pension
or Retirement Benefits Accrued As Part of Company Expenses2 |
Estimated
Annual Benefits Upon Retirement2 |
Total
Compensation From the Fund and Fund Complex3 | ||||
| Independent Director: | ||||||||
| Robert H. Silver1 | $ 24 | Not Applicable | Not Applicable | $350,000 | ||||
| John E. Kerrigan | 21 | Not Applicable | Not Applicable | 315,000 | ||||
| Charles A. Hurty | 23 | Not Applicable | Not Applicable | 340,000 | ||||
| Cecilia H. Herbert | 22 | Not Applicable | Not Applicable | 341,764 | ||||
| John E. Martinez | 21 | Not Applicable | Not Applicable | 326,764 | ||||
| Madhav V. Rajan | 21 | Not Applicable | Not Applicable | 315,000 | ||||
| Jane D. Carlin | 20 | Not Applicable | Not Applicable | 300,000 4 |
| Name of Director | iShares
Asia/Pacific Dividend ETF |
Pension
or Retirement Benefits Accrued As Part of Company Expenses2 |
Estimated
Annual Benefits Upon Retirement2 |
Total
Compensation From the Fund and Fund Complex3 | ||||
| Interested Director: | ||||||||
| Robert S. Kapito | $0 | Not Applicable | Not Applicable | $0 | ||||
| Mark K. Wiedman | 0 | Not Applicable | Not Applicable | 0 | ||||
| Advisory Board Members: | ||||||||
| Drew E. Lawton5 | Not Applicable | Not Applicable | Not Applicable | Not Applicable | ||||
| Richard L. Fagnani6 | Not Applicable | Not Applicable | Not Applicable | Not Applicable |
| 1 | Served as an Independent Director through March 31, 2016. |
| 2 | No Director or officer is entitled to any pension or retirement benefits from the Company. |
| 3 | Includes compensation for service on the Boards of Trustees for iShares Trust and iShares U.S. ETF Trust and the Board of Directors of iShares MSCI Russia Capped ETF, Inc. |
| 4 | Total compensation is shown for Jane D. Carlin for the period from February 3, 2015 to December 31, 2015 because she was appointed to serve as an Independent Trustee of the Trust effective February 3, 2015. |
| 5 | Compensation is not shown for Drew E. Lawton because he was appointed to serve as an Advisory Board Member effective October 18, 2016. |
| 6 | Compensation is not shown for Richard L. Fagnani because he was appointed to serve as an Advisory Board Member effective April 1, 2017. |
| Name and Address | Percentage
of Ownership | |
| State
Street Bank and Trust Company 1776 Heritage Drive North Quincy, MA 02171 |
34.45% | |
| National
Financial Services LLC 200 Liberty Street 5th Floor New York, NY 10281 |
7.93% | |
| Credit
Suisse Securities (USA) LLC One Madison Ave 3rd Floor New York, NY 10010 |
6.45% | |
| Sanford
C. Bernstein & Co., LLC 1 North Lexington Avenue White Plains, NY 10601 |
6.32% | |
| Citibank,
N.A. 3800 CitiBank Center Tampa Building A/Floor 2 Tampa, FL 33610 |
5.25% |
| Management
Fee for the Fiscal Year Ended April 30, 2016 |
Fund
Inception Date |
Management
Fees Paid for Fiscal Year Ended April 30, 2016 |
Management
Fees Paid for Fiscal Year Ended April 30, 2015 |
Management
Fees Paid for Fiscal Year Ended April 30, 2014 | ||||
| 0.49% | 02/23/12 | $200,717 | $255,600 | $211,504 |
| Diane Hsiung | ||||
| Types of Accounts | Number | Total Assets | ||
| Registered Investment Companies | 243 | $654,000,000,000 | ||
| Other Pooled Investment Vehicles | 16 | 5,000,000,000 | ||
| Other Accounts | 0 | N/A | ||
| Accounts with Incentive-Based Fee Arrangements | 0 | N/A |
| Jennifer Hsui | ||||
| Types of Accounts | Number | Total Assets | ||
| Registered Investment Companies | 254 | $668,000,000,000 | ||
| Other Pooled Investment Vehicles | 3 | 5,000,000,000 | ||
| Other Accounts | 0 | N/A |
| Jennifer Hsui | ||||
| Types of Accounts | Number | Total Assets | ||
| Accounts with Incentive-Based Fee Arrangements | 0 | N/A |
| Alan Mason | ||||
| Types of Accounts | Number | Total Assets | ||
| Registered Investment Companies | 346 | $ 730,000,000,000 | ||
| Other Pooled Investment Vehicles | 309 | 568,000,000,000 | ||
| Other Accounts | 181 | 38,000,000,000 | ||
| Accounts with Incentive-Based Fee Arrangements | 0 | N/A |
| Greg Savage | ||||
| Types of Accounts | Number | Total Assets | ||
| Registered Investment Companies | 326 | $723,000,000,000 | ||
| Other Pooled Investment Vehicles | 74 | 30,000,000,000 | ||
| Other Accounts | 3 | 227,000,000 | ||
| Accounts with Incentive-Based Fee Arrangements | 0 | N/A |
| Diane Hsiung | ||||
| Types of Accounts | Number
of Other Accounts with Performance Fees Managed by Portfolio Manager |
Aggregate
of Total Assets | ||
| Registered Investment Companies | 0 | N/A | ||
| Other Pooled Investment Vehicles | 0 | N/A |
| Diane Hsiung | ||||
| Types of Accounts | Number
of Other Accounts with Performance Fees Managed by Portfolio Manager |
Aggregate
of Total Assets | ||
| Other Accounts | 0 | N/A |
| Jennifer Hsui | ||||
| Types of Accounts | Number
of Other Accounts with Performance Fees Managed by Portfolio Manager |
Aggregate
of Total Assets | ||
| Registered Investment Companies | 0 | N/A | ||
| Other Pooled Investment Vehicles | 0 | N/A | ||
| Other Accounts | 0 | N/A |
| Alan Mason | ||||
| Types of Accounts | Number
of Other Accounts with Performance Fees Managed by Portfolio Manager |
Aggregate
of Total Assets | ||
| Registered Investment Companies | 0 | N/A | ||
| Other Pooled Investment Vehicles | 0 | N/A | ||
| Other Accounts | 0 | N/A |
| Greg Savage | ||||
| Types of Accounts | Number
of Other Accounts with Performance Fees Managed by Portfolio Manager |
Aggregate
of Total Assets | ||
| Registered Investment Companies | 0 | N/A | ||
| Other Pooled Investment Vehicles | 0 | N/A | ||
| Other Accounts | 0 | N/A |
| Fund
Inception Date |
Administration,
Custodian, Transfer Agency Expenses Paid During Fiscal Year Ended April 30, 2016 |
Administration,
Custodian, Transfer Agency Expenses Paid During Fiscal Year Ended April 30, 2015 |
Administration,
Custodian, Transfer Agency Expenses Paid During Fiscal Year Ended April 30, 2014 | |||
| 02/23/12 | $ 20,489 | $20,620 | $18,652 |
| Fund
Inception Date |
Distributor
Compensation Paid During Fiscal Year Ended April 30, 20161 |
Distributor
Compensation Paid During Fiscal Year Ended April 30, 20151 |
Distributor
Compensation Paid During Fiscal Year Ended April 30, 20141 | |||
| 02/23/12 | $0 | $1,534 | $7,660 |
| 1 | These fees reflect payments made to SEI, acting as an agent of the Distributor. |
| Fund
Inception Date |
Brokerage
Commissions Paid During Fiscal Year Ended April 30, 2016 |
Brokerage
Commissions Paid During Fiscal Year Ended April 30, 2015 |
Brokerage
Commissions Paid During Fiscal Year Ended April 30, 2014 | |||
| 02/23/12 | $8,861 | $12,473 | $8,467 |
| Fiscal Year ended April 30, 2016 | Fiscal Year ended April 30, 2015 | ||
| 32% | 40% |
| Shares
Per Creation Unit |
Value
Per Creation Unit (U.S.$) | |
| 50,000 | $2,267,000 |
| Standard
Creation Transaction Fee |
Maximum
Additional Charge* | |
| $800 | 7.0% |
| * | As a percentage of the net asset value per Creation Unit. |
| Standard
Redemption Transaction Fee |
Maximum
Additional Charge* | |
| $800 | 2.0% |
| * | As a percentage of the net asset value per Creation Unit, inclusive of the standard redemption transaction fee. |
| 1 | iShares MSCI ACWI Low Carbon Target ETF, iShares MSCI All Peru Capped ETF, iShares MSCI KLD 400 Social ETF, iShares MSCI USA ESG Select ETF and iShares Sustainable MSCI Global Impact ETF have separate Fund Proxy Voting Policies. |
| • | Boards and directors |
| • | Auditors and audit-related issues |
| • | Capital structure, mergers, asset sales and other special transactions |
| • | Remuneration and benefits |
| • | Social, ethical and environmental issues |
| • | General corporate governance matters |
| • | establishing an appropriate corporate governance structure; |
| • | supporting and overseeing management in setting strategy; |
| • | ensuring the integrity of financial statements; |
| • | making decisions regarding mergers, acquisitions and disposals; |
| • | establishing appropriate executive compensation structures; and |
| • | addressing business issues including social, ethical and environmental issues when they have the potential to materially impact company reputation and performance. |
| • | current employment at the company or a subsidiary; |
| • | former employment within the past several years as an executive of the company; |
| • | providing substantial professional services to the company and/or members of the company’s management; |
| • | having had a substantial business relationship in the past three years; |
| • | having, or representing a shareholder with, a substantial shareholding in the company; |
| • | being an immediate family member of any of the aforementioned; and |
| • | interlocking directorships. |
| • | BlackRock has adopted a proxy voting oversight structure whereby the Corporate Governance Committees oversee the voting decisions and other activities of the Corporate Governance Group, and particularly its activities with respect to voting in the relevant region of each Corporate Governance Committee’s jurisdiction. |
| • | The Corporate Governance Committees have adopted Guidelines for each region, which set forth the firm’s views with respect to certain corporate governance and other issues that typically arise in the proxy voting context. The Corporate Governance Committees receive periodic reports regarding the specific votes cast by the Corporate Governance Group and regular updates on material process issues, procedural changes and other matters of concern to the Corporate Governance Committees. |
| • | BlackRock’s Global Corporate Governance Oversight Committee oversees the Global Head, the Corporate Governance Group and the Corporate Governance Committees. The Global Corporate Governance Oversight Committee conducts a review, at least annually, of the proxy voting process to ensure compliance with BlackRock’s risk policies and procedures. |
| • | BlackRock maintains a reporting structure that separates the Global Head and Corporate Governance Group from employees with sales responsibilities. In addition, BlackRock maintains procedures intended to ensure that all engagements with corporate issuers or dissident shareholders are managed consistently and without regard to BlackRock’s relationship with the issuer of the proxy or dissident shareholder. Within the normal course of business, the Global Head or Corporate Governance Group may engage directly with BlackRock clients, and with employees with sales responsibilities, in discussions regarding general corporate governance policy matters, and to otherwise ensure that proxy-related client service levels are met. The Global Head or Corporate Governance Group does not discuss any specific voting matter with a client prior to the disclosure of the vote decision to all applicable clients after the shareholder meeting has taken place, except if the client is acting in the capacity as issuer of the proxy or dissident shareholder and is engaging through the established procedures independent of the client relationship. |
| • | In certain instances, BlackRock may determine to engage an independent fiduciary to vote proxies as a further safeguard to avoid potential conflicts of interest or as otherwise required by applicable law. The independent fiduciary may either vote such proxies or provide BlackRock with instructions as to how to vote such proxies. In the latter case, BlackRock votes the proxy in accordance with the independent fiduciary’s determination. Use of an independent fiduciary has been |
| adopted for voting the proxies related to any company that is affiliated with BlackRock or any company that includes BlackRock employees on its board of directors. |
| 2016 | ||||||
| Country | Trade
Date |
Settlement
Date |
Number
of Days to Settle | |||
| Australia | 12/21/16 | 12/29/16 | 8 | |||
| 12/22/16 | 01/02/17 | 11 | ||||
| China | 02/03/16 | 02/17/16 | 14 | |||
| 02/04/16 | 02/18/16 | 14 | ||||
| 02/05/16 | 02/19/16 | 14 | ||||
| 04/27/16 | 05/09/16 | 12 | ||||
| 04/28/16 | 05/10/16 | 12 | ||||
| 04/29/16 | 05/11/16 | 12 | ||||
| 09/28/16 | 10/11/16 | 13 | ||||
| 09/29/16 | 10/12/16 | 13 | ||||
| 09/30/16 | 10/13/16 | 13 | ||||
| Japan | 04/27/16 | 05/06/16 | 9 | |||
| 04/28/16 | 05/09/16 | 11 | ||||
| 05/02/16 | 05/10/16 | 8 | ||||
| 08/02/16 | 08/10/16 | 8 | ||||
| 08/03/16 | 08/11/16 | 8 | ||||
| 08/04/16 | 08/12/16 | 8 | ||||
| 08/05/16 | 08/15/16 | 10 | ||||
| 08/08/16 | 08/16/16 | 8 | ||||
| 08/19/16 | 08/29/16 | 10 | ||||
| 08/22/16 | 08/30/16 | 8 | ||||
| 08/23/16 | 08/31/16 | 8 | ||||
| 08/24/16 | 09/01/16 | 8 | ||||
| 08/25/16 | 09/02/16 | 8 | ||||
| 12/09/16 | 12/19/16 | 10 | ||||
| 12/12/16 | 12/20/16 | 8 | ||||
| 12/13/16 | 12/21/16 | 8 | ||||
| 12/14/16 | 12/22/16 | 8 | ||||
| 12/15/16 | 12/23/16 | 8 | ||||
| 12/19/16 | 12/27/16 | 8 | ||||
| * | These worst-case redemption cycles are based on information regarding regular holidays, which may be out of date. Based on changes in holidays, longer (worse) redemption cycles are possible. |
(as revised July 3, 2017)
| Fund | Ticker | Listing Exchange | ||
| iShares Emerging Markets Dividend ETF (the “Fund”) | DVYE | NYSE Arca |
| 1. | Concentrate its investments (i.e., invest 25% or more of its total assets in the securities of a particular industry or group of industries), except that the Fund will concentrate to approximately the same extent that the Underlying Index concentrates in the securities of a particular industry or group of industries. For purposes of this limitation, securities of the U.S. government (including its agencies and instrumentalities), repurchase agreements collateralized by U.S. government securities, and securities of state or municipal governments and their political subdivisions are not considered to be issued by members of any industry. |
| 2. | Borrow money, except that (i) the Fund may borrow from banks for temporary or emergency (not leveraging) purposes, including the meeting of redemption requests which might otherwise require the untimely disposition of securities; and (ii) the Fund may, to the extent consistent with its investment policies, enter into repurchase agreements, reverse repurchase agreements, forward roll transactions and similar investment strategies and techniques. To the extent that it engages in transactions described in (i) and (ii), the Fund will be limited so that no more than 33 1/3% of the value of its total assets (including the amount borrowed) is derived from such transactions. Any borrowings which come to exceed this amount will be reduced in accordance with applicable law. |
| 3. | Issue any senior security, except as permitted under the 1940 Act, as interpreted, modified or otherwise permitted by any regulatory authority having jurisdiction, from time to time. |
| 4. | Make loans, except as permitted under the 1940 Act, as interpreted, modified or otherwise permitted by regulatory authority having jurisdiction, from time to time. |
| 5. | Purchase or sell real estate unless acquired as a result of ownership of securities or other instruments (but this restriction shall not prevent the Fund from investing in securities of companies engaged in the real estate business or securities or other instruments backed by real estate or mortgages), or commodities or commodity contracts (but this restriction shall not prevent the Fund from trading in futures contracts and options on futures contracts, including options on currencies to the extent consistent with the Fund’s investment objective and policies). |
| 6. | Engage in the business of underwriting securities issued by other persons, except to the extent that the Fund may technically be deemed to be an underwriter under the 1933 Act, in disposing of portfolio securities. |
| • | The frequency of trades and quotes for the security; |
| • | The number of dealers wishing to purchase or sell the security and the number of other potential purchasers; |
| • | Dealer undertakings to make a market in the security; and |
| • | The nature of the security and the nature of the marketplace in which it trades (e.g., the time needed to dispose of the security, the method of soliciting offers and the mechanics of transfer). |
| Name (Age) | Position | Principal
Occupation(s) During the Past 5 Years |
Other
Directorships Held by Director | |||
| Robert
S. Kapito1 (59) |
Director
(since 2009). |
President, BlackRock, Inc. (since 2006); Vice Chairman of BlackRock, Inc. and Head of BlackRock’s Portfolio Management Group (since its formation in 1998) and BlackRock, Inc.’s predecessor entities (since 1988); Trustee, University of Pennsylvania (since 2009); President of Board of Directors, Hope & Heroes Children’s Cancer Fund (since 2002). | Director of BlackRock, Inc. (since 2006); Trustee of iShares Trust (since 2009); Trustee of iShares U.S. ETF Trust (since 2011). | |||
| Mark
K. Wiedman2 (45) |
Director (since 2013). | Senior Managing Director, BlackRock, Inc. (since 2014); Managing Director, BlackRock, Inc. (2007-2014); Global Head of BlackRock’s ETF and Index Investments Business (since 2016); Global Head of iShares (2011-2016); Head of Corporate Strategy, BlackRock, Inc. (2009-2011). | Trustee of iShares Trust (since 2013); Trustee of iShares U.S. ETF Trust (since 2013); Director of PennyMac Financial Services, Inc. (since 2008). |
| 1 | Robert S. Kapito is deemed to be an “interested person” (as defined in the 1940 Act) of the Company due to his affiliations with BlackRock, Inc. and its affiliates. |
| 2 | Mark K. Wiedman is deemed to be an “interested person” (as defined in the 1940 Act) of the Company due to his affiliations with BlackRock, Inc. and its affiliates. |
| Name (Age) | Position | Principal
Occupation(s) During the Past 5 Years |
Other
Directorships Held by Director | |||
| Cecilia
H. Herbert (68) |
Director
(since 2005); Independent Board Chair (since 2016). |
Trustee and Member of the Finance, Technology and Quality Committee of Stanford Health Care (since 2016); Trustee and Member of the Investment Committee, WNET, a New York public media company (since 2011); Chair (1994-2005) and Member (since 1992) of the Investment Committee, Archdiocese of San Francisco; Director (1998-2013) and President (2007-2011) of the Board of Directors, Catholic Charities CYO; Trustee (2002-2011) and Chair of the Finance and Investment Committee (2006-2010) of the Thacher School. | Trustee of iShares Trust (since 2005); Trustee of iShares U.S. ETF Trust (since 2011); Independent Board Chair of iShares Trust and iShares U.S. ETF Trust (since 2016); Trustee of Forward Funds (14 portfolios) (since 2009); Trustee of Salient MF Trust (4 portfolios) (since 2015). | |||
| Jane
D. Carlin (60) |
Director
(since 2015); Risk Committee Chair (since 2016). |
Consultant (since 2012); Managing Director and Global Head of Financial Holding Company Governance & Assurance and the Global Head of Operational Risk Management of Morgan Stanley (2006-2012). | Trustee of iShares Trust (since 2015); Trustee of iShares U.S. ETF Trust (since 2015); Director of PHH Corporation (mortgage solutions) (since 2012); Director of The Hanover Insurance Group, Inc. (since 2016). | |||
| Richard
L. Fagnani (62) |
Director
(since 2017); Equity Plus Committee Chair (since 2017). |
Partner, KPMG LLP (2002-2016). | Trustee of iShares Trust (since 2017); Trustee of iShares U.S. ETF Trust (since 2017). | |||
| Charles
A. Hurty (72) |
Director
(since 2005); Audit Committee Chair (since 2006). |
Retired; Partner, KPMG LLP (1968-2001). | Trustee of iShares Trust (since 2005); Trustee of iShares U.S. ETF Trust (since 2011); Director of SkyBridge Alternative Investments Multi-Adviser Hedge Fund Portfolios LLC (2 portfolios) (since 2002). | |||
| John
E. Kerrigan (61) |
Director
(since 2005); Securities Lending Committee Chair (since 2016). |
Chief Investment Officer, Santa Clara University (since 2002). | Trustee of iShares Trust (since 2005); Trustee of iShares U.S. ETF Trust (since 2011). | |||
| Drew
E. Lawton (58) |
Director
(since 2017); 15(c) Committee Chair (since 2017). |
Senior Managing Director of New York Life Insurance Company (2010-2015). | Trustee of iShares Trust (since 2017); Trustee of iShares U.S. ETF Trust (since 2017). | |||
| John
E. Martinez (56) |
Director
(since 2003); Fixed Income Plus Committee Chair (since 2016). |
Director of Real Estate Equity Exchange, Inc. (since 2005). | Trustee of iShares Trust (since 2003); Trustee of iShares U.S. ETF Trust (since 2011). |
| Name (Age) | Position | Principal
Occupation(s) During the Past 5 Years |
Other
Directorships Held by Director | |||
| Madhav
V. Rajan (52) |
Director
(since 2011); Nominating and Governance Committee Chair (since 2017). |
Dean, and George Pratt Shultz Professor of Accounting, University of Chicago Booth School of Business (since 2017); Robert K. Jaedicke Professor of Accounting, Stanford University Graduate School of Business (2001-2017); Professor of Law (by courtesy), Stanford Law School (2005-2017); Senior Associate Dean for Academic Affairs and Head of MBA Program, Stanford University Graduate School of Business (2010-2016). | Trustee
of iShares Trust (since 2011); Trustee of iShares U.S. ETF Trust (since 2011); Director, Cavium, Inc. (since 2013). |
| Name (Age) | Position | Principal
Occupation(s) During the Past 5 Years | ||
| Martin
Small (41) |
President (since 2016). | Managing Director, BlackRock, Inc. (since 2010); Head of U.S. iShares (since 2015); Co-Head of the U.S. Financial Markets Advisory Group, BlackRock, Inc. (2008-2014). | ||
| Jack
Gee (56) |
Treasurer
and Chief Financial Officer (since 2008). |
Managing Director, BlackRock, Inc. (since 2009); Senior Director of Fund Administration of Intermediary Investor Business, BGI (2009). | ||
| Charles
Park (49) |
Chief Compliance Officer (since 2006). | Chief Compliance Officer of BlackRock Advisors, LLC and the BlackRock-advised Funds in the Equity-Bond Complex, the Equity-Liquidity Complex and the Closed-End Complex (since 2014); Chief Compliance Officer of BFA (since 2006). | ||
| Benjamin
Archibald (42) |
Secretary (since 2015). | Managing Director, BlackRock, Inc. (since 2014); Director, BlackRock, Inc. (2010-2013); Secretary of the BlackRock-advised mutual funds (since 2012). | ||
| Steve
Messinger (55) |
Executive
Vice President (since 2016). |
Managing Director, BlackRock, Inc. (2007-2014 and since 2016); Managing Director, Beacon Consulting Group (2014-2016). | ||
| Scott
Radell (47) |
Executive
Vice President (since 2012). |
Managing Director, BlackRock, Inc. (since 2009); Head of Portfolio Solutions, BlackRock, Inc. (since 2009). |
| Name (Age) | Position | Principal
Occupation(s) During the Past 5 Years | ||
| Alan
Mason (56) |
Executive
Vice President (since 2016). |
Managing Director, BlackRock, Inc. (since 2009). |
| Name of Director | Fund | Dollar
Range of Equity Securities in the Fund |
Aggregate
Dollar Range of Equity Securities in all Registered Investment Companies Overseen by Director in Family of Investment Companies | |||
| Robert S. Kapito | None | None | None | |||
| Mark Wiedman | iShares Core MSCI EAFE ETF | $50,001-$100,000 | Over $100,000 | |||
| iShares Core MSCI Emerging Markets ETF | $50,001-$100,000 | |||||
| iShares Core S&P Total U.S. Stock Market ETF | Over $100,000 | |||||
| John E. Martinez | iShares Core MSCI Emerging Markets ETF | $50,001-$100,000 | Over $100,000 | |||
| iShares Core S&P 500 ETF | Over $100,000 | |||||
| iShares Core S&P Mid-Cap ETF | $10,001-$50,000 | |||||
| iShares Core S&P Small-Cap ETF | $10,001-$50,000 | |||||
| iShares Core S&P Total U.S. Stock Market ETF | $1-$10,000 | |||||
| iShares Global Consumer Staples ETF | Over $100,000 | |||||
| iShares MSCI All Country Asia ex Japan ETF | Over $100,000 | |||||
| iShares MSCI EAFE ETF | Over $100,000 | |||||
| iShares Russell 1000 ETF | Over $100,000 | |||||
| iShares Russell 1000 Value ETF | Over $100,000 | |||||
| iShares Russell 2000 ETF | Over $100,000 | |||||
| iShares TIPS Bond ETF | $50,001-$100,000 | |||||
| Cecilia H. Herbert | iShares China Large-Cap ETF | Over $100,000 | Over $100,000 | |||
| iShares Core Dividend Growth ETF | $10,001-$50,000 | |||||
| iShares Core High Dividend ETF | $1-$10,000 |
| Name of Director | Fund | Dollar
Range of Equity Securities in the Fund |
Aggregate
Dollar Range of Equity Securities in all Registered Investment Companies Overseen by Director in Family of Investment Companies | |||
| iShares Core MSCI Emerging Markets ETF | $10,001-$50,000 | |||||
| iShares Core MSCI Total International Stock ETF | $10,001-$50,000 | |||||
| iShares Core Russell U.S. Growth ETF | $50,001-$100,000 | |||||
| iShares Core Russell U.S. Value ETF | $10,001-$50,000 | |||||
| iShares Core S&P Small-Cap ETF | $1-$10,000 | |||||
| iShares Core S&P Total U.S. Stock Market ETF | $10,001-$50,000 | |||||
| iShares iBoxx $ High Yield Corporate Bond ETF | $10,001-$50,000 | |||||
| iShares International Select Dividend ETF | $1-$10,000 | |||||
| iShares MSCI EAFE ETF | $1-$10,000 | |||||
| iShares MSCI Emerging Markets ETF | $1-$10,000 | |||||
| iShares MSCI Japan ETF | $10,001-$50,000 | |||||
| iShares National Muni Bond ETF | $10,001-$50,000 | |||||
| iShares U.S. Preferred Stock ETF | $10,001-$50,000 | |||||
| Charles A. Hurty | iShares China Large-Cap ETF | $10,001-$50,000 | Over $100,000 | |||
| iShares Core Growth Allocation ETF | $50,001-$100,000 | |||||
| iShares Core High Dividend ETF | $10,001-$50,000 | |||||
| iShares Core Moderate Allocation ETF | $50,001-$100,000 | |||||
| iShares Core MSCI Emerging Markets ETF | $10,001-$50,000 | |||||
| iShares Core S&P 500 ETF | $10,001-$50,000 | |||||
| iShares Global Energy ETF | $10,001-$50,000 | |||||
| iShares Global Healthcare ETF | $10,001-$50,000 | |||||
| iShares Global Tech ETF | $10,001-$50,000 | |||||
| iShares MSCI EAFE ETF | $10,001-$50,000 | |||||
| iShares Russell 2000 ETF | $10,001-$50,000 | |||||
| iShares U.S. Basic Materials ETF | $10,001-$50,000 | |||||
| iShares U.S. Energy ETF | $10,001-$50,000 | |||||
| iShares U.S. Technology ETF | $50,001-$100,000 | |||||
| John E. Kerrigan | iShares MSCI ACWI ETF | $10,001-$50,000 | Over $100,000 | |||
| iShares MSCI ACWI ex U.S. ETF | Over $100,000 | |||||
| iShares Short-Term National Muni Bond ETF | Over $100,000 | |||||
| Madhav V. Rajan | iShares Core Dividend Growth ETF | Over $100,000 | Over $100,000 | |||
| iShares Core High Dividend ETF | Over $100,000 | |||||
| iShares Core MSCI Emerging Markets ETF | Over $100,000 | |||||
| iShares Core S&P 500 ETF | Over $100,000 |
| Name of Director | Fund | Dollar
Range of Equity Securities in the Fund |
Aggregate
Dollar Range of Equity Securities in all Registered Investment Companies Overseen by Director in Family of Investment Companies | |||
| iShares iBoxx $ High Yield Corporate Bond ETF | Over $100,000 | |||||
| iShares iBoxx $ Investment Grade Corporate Bond ETF | Over $100,000 | |||||
| iShares Russell 2000 ETF | Over $100,000 | |||||
| iShares Select Dividend ETF | Over $100,000 | |||||
| Jane D. Carlin | iShares Core MSCI EAFE ETF | $50,001-$100,000 | Over $100,000 | |||
| iShares Core S&P Small-Cap ETF | $10,001-$50,000 | |||||
| iShares Global Tech ETF | $10,001-$50,000 |
| Name of Director | iShares
Emerging Markets Dividend ETF |
Pension
or Retirement Benefits Accrued As Part of Company Expenses2 |
Estimated
Annual Benefits Upon Retirement2 |
Total
Compensation From the Fund and Fund Complex3 | ||||
| Independent Director: | ||||||||
| Robert H. Silver1 | $64 | Not Applicable | Not Applicable | $350,000 | ||||
| John E. Kerrigan | 57 | Not Applicable | Not Applicable | 315,000 | ||||
| Charles A. Hurty | 62 | Not Applicable | Not Applicable | 340,000 | ||||
| Cecilia H. Herbert | 60 | Not Applicable | Not Applicable | 341,764 | ||||
| John E. Martinez | 57 | Not Applicable | Not Applicable | 326,764 | ||||
| Madhav V. Rajan | 57 | Not Applicable | Not Applicable | 315,000 | ||||
| Jane D. Carlin | 55 | Not Applicable | Not Applicable | 300,000 4 |
| Name of Director | iShares
Emerging Markets Dividend ETF |
Pension
or Retirement Benefits Accrued As Part of Company Expenses2 |
Estimated
Annual Benefits Upon Retirement2 |
Total
Compensation From the Fund and Fund Complex3 | ||||
| Interested Director: | ||||||||
| Robert S. Kapito | $0 | Not Applicable | Not Applicable | $0 | ||||
| Mark K. Wiedman | 0 | Not Applicable | Not Applicable | 0 | ||||
| Advisory Board Members: | ||||||||
| Drew E. Lawton5 | Not Applicable | Not Applicable | Not Applicable | Not Applicable | ||||
| Richard L. Fagnani6 | Not Applicable | Not Applicable | Not Applicable | Not Applicable |
| 1 | Served as an Independent Director through March 31, 2016. |
| 2 | No Director or officer is entitled to any pension or retirement benefits from the Company. |
| 3 | Includes compensation for service on the Boards of Trustees for iShares Trust and iShares U.S. ETF Trust and the Board of Directors of iShares MSCI Russia Capped ETF, Inc. |
| 4 | Total compensation is shown for Jane D. Carlin for the period from February 3, 2015 to December 31, 2015 because she was appointed to serve as an Independent Trustee of the Trust effective February 3, 2015. |
| 5 | Compensation is not shown for Drew E. Lawton because he was appointed to serve as an Advisory Board Member effective October 18, 2016. |
| 6 | Compensation is not shown for Richard L. Fagnani because he was appointed to serve as an Advisory Board Member effective April 1, 2017. |
| Name and Address | Percentage
of Ownership | |
| National
Financial Services LLC 200 Liberty Street 5th Floor New York, NY 10281 |
25.12% | |
| Merrill
Lynch, Pierce Fenner & Smith Safekeeping 101 Hudson Street 8th Floor Jersey City, NJ 07302 |
12.21% | |
| Charles
Schwab & Co., Inc. 111 Pavonia Avenue Jersey City, NJ 07310 |
6.26% |
| Management
Fee for the Fiscal Year Ended April 30, 2016 |
Fund
Inception Date |
Management
Fees Paid for Fiscal Year Ended April 30, 2016 |
Management
Fees Paid for Fiscal Year Ended April 30, 2015 |
Management
Fees Paid for Fiscal Year Ended April 30, 2014 | ||||
| 0.68% 1 | 02/23/12 | $1,155,404 | $1,592,385 | $1,133,588 |
| 1 | Effective August 1, 2016, the management fee for the iShares Emerging Markets Dividend ETF is 0.49%. Prior to August 1, 2016, the management for the iShares Emerging Markets Dividend ETF was 0.68%. |
| Diane Hsiung | ||||
| Types of Accounts | Number | Total Assets | ||
| Registered Investment Companies | 243 | $654,000,000,000 | ||
| Other Pooled Investment Vehicles | 16 | 5,000,000,000 | ||
| Other Accounts | 0 | N/A | ||
| Accounts with Incentive-Based Fee Arrangements | 0 | N/A |
| Jennifer Hsui | ||||
| Types of Accounts | Number | Total Assets | ||
| Registered Investment Companies | 254 | $668,000,000,000 | ||
| Other Pooled Investment Vehicles | 3 | 5,000,000,000 | ||
| Other Accounts | 0 | N/A | ||
| Accounts with Incentive-Based Fee Arrangements | 0 | N/A |
| Alan Mason | ||||
| Types of Accounts | Number | Total Assets | ||
| Registered Investment Companies | 346 | $ 730,000,000,000 | ||
| Other Pooled Investment Vehicles | 309 | 568,000,000,000 | ||
| Other Accounts | 181 | 38,000,000,000 | ||
| Accounts with Incentive-Based Fee Arrangements | 0 | N/A |
| Greg Savage | ||||
| Types of Accounts | Number | Total Assets | ||
| Registered Investment Companies | 326 | $723,000,000,000 | ||
| Other Pooled Investment Vehicles | 74 | 30,000,000,000 | ||
| Other Accounts | 3 | 227,000,000 | ||
| Accounts with Incentive-Based Fee Arrangements | 0 | N/A |
| Diane Hsiung | ||||
| Types of Accounts | Number
of Other Accounts with Performance Fees Managed by Portfolio Manager |
Aggregate
of Total Assets | ||
| Registered Investment Companies | 0 | N/A | ||
| Other Pooled Investment Vehicles | 0 | N/A | ||
| Other Accounts | 0 | N/A |
| Jennifer Hsui | ||||
| Types of Accounts | Number
of Other Accounts with Performance Fees Managed by Portfolio Manager |
Aggregate
of Total Assets | ||
| Registered Investment Companies | 0 | N/A | ||
| Other Pooled Investment Vehicles | 0 | N/A | ||
| Other Accounts | 0 | N/A |
| Alan Mason | ||||
| Types of Accounts | Number
of Other Accounts with Performance Fees Managed by Portfolio Manager |
Aggregate
of Total Assets | ||
| Registered Investment Companies | 0 | N/A | ||
| Other Pooled Investment Vehicles | 0 | N/A | ||
| Other Accounts | 0 | N/A |
| Greg Savage | ||||
| Types of Accounts | Number
of Other Accounts with Performance Fees Managed by Portfolio Manager |
Aggregate
of Total Assets | ||
| Registered Investment Companies | 0 | N/A | ||
| Other Pooled Investment Vehicles | 0 | N/A | ||
| Other Accounts | 0 | N/A |
| Fund
Inception Date |
Administration,
Custodian, Transfer Agency Expenses Paid During Fiscal Year Ended April 30, 2016 |
Administration,
Custodian, Transfer Agency Expenses Paid During Fiscal Year Ended April 30, 2015 |
Administration,
Custodian, Transfer Agency Expenses Paid During Fiscal Year Ended April 30, 2014 | |||
| 02/23/12 | $ 85,912 | $100,935 | $57,635 |
| Fund
Inception Date |
Distributor
Compensation Paid During Fiscal Year Ended April 30, 20161 |
Distributor
Compensation Paid During Fiscal Year Ended April 30, 20151 |
Distributor
Compensation Paid During Fiscal Year Ended April 30, 20141 | |||
| 02/23/12 | $0 | $1,534 | $7,660 |
| 1 | These fees reflect payments made to SEI, acting as an agent of the Distributor. |
| Fund
Inception Date |
Brokerage
Commissions Paid During Fiscal Year Ended April 30, 2016 |
Brokerage
Commissions Paid During Fiscal Year Ended April 30, 2015 |
Brokerage
Commissions Paid During Fiscal Year Ended April 30, 2014 | |||
| 02/23/12 | $109,153 | $174,411 | $106,226 |
| Fiscal Year ended April 30, 2016 | Fiscal Year ended April 30, 2015 | ||
| 67% | 59% |
| Shares
Per Creation Unit |
Value
Per Creation Unit (U.S.$) | |
| 50,000 | $1,752,000 |
| Standard
Creation Transaction Fee |
Maximum
Additional Charge* | |
| $3,000 | 7.0% |
| * | As a percentage of the net asset value per Creation Unit. |
| Standard
Redemption Transaction Fee |
Maximum
Additional Charge* | |
| $3,000 | 2.0% |
| * | As a percentage of the net asset value per Creation Unit, inclusive of the standard redemption transaction fee. |
| 1 | iShares MSCI ACWI Low Carbon Target ETF, iShares MSCI All Peru Capped ETF, iShares MSCI KLD 400 Social ETF, iShares MSCI USA ESG Select ETF and iShares Sustainable MSCI Global Impact ETF have separate Fund Proxy Voting Policies. |
| • | Boards and directors |
| • | Auditors and audit-related issues |
| • | Capital structure, mergers, asset sales and other special transactions |
| • | Remuneration and benefits |
| • | Social, ethical and environmental issues |
| • | General corporate governance matters |
| • | establishing an appropriate corporate governance structure; |
| • | supporting and overseeing management in setting strategy; |
| • | ensuring the integrity of financial statements; |
| • | making decisions regarding mergers, acquisitions and disposals; |
| • | establishing appropriate executive compensation structures; and |
| • | addressing business issues including social, ethical and environmental issues when they have the potential to materially impact company reputation and performance. |
| • | current employment at the company or a subsidiary; |
| • | former employment within the past several years as an executive of the company; |
| • | providing substantial professional services to the company and/or members of the company’s management; |
| • | having had a substantial business relationship in the past three years; |
| • | having, or representing a shareholder with, a substantial shareholding in the company; |
| • | being an immediate family member of any of the aforementioned; and |
| • | interlocking directorships. |
| • | BlackRock has adopted a proxy voting oversight structure whereby the Corporate Governance Committees oversee the voting decisions and other activities of the Corporate Governance Group, and particularly its activities with respect to voting in the relevant region of each Corporate Governance Committee’s jurisdiction. |
| • | The Corporate Governance Committees have adopted Guidelines for each region, which set forth the firm’s views with respect to certain corporate governance and other issues that typically arise in the proxy voting context. The Corporate Governance Committees receive periodic reports regarding the specific votes cast by the Corporate Governance Group and regular updates on material process issues, procedural changes and other matters of concern to the Corporate Governance Committees. |
| • | BlackRock’s Global Corporate Governance Oversight Committee oversees the Global Head, the Corporate Governance Group and the Corporate Governance Committees. The Global Corporate Governance Oversight Committee conducts a review, at least annually, of the proxy voting process to ensure compliance with BlackRock’s risk policies and procedures. |
| • | BlackRock maintains a reporting structure that separates the Global Head and Corporate Governance Group from employees with sales responsibilities. In addition, BlackRock maintains procedures intended to ensure that all engagements with corporate issuers or dissident shareholders are managed consistently and without regard to BlackRock’s relationship with the issuer of the proxy or dissident shareholder. Within the normal course of business, the Global Head or Corporate Governance Group may engage directly with BlackRock clients, and with employees with sales responsibilities, in discussions regarding general corporate governance policy matters, and to otherwise ensure that proxy-related client service levels are met. The Global Head or Corporate Governance Group does not discuss any specific voting matter with a client prior to the disclosure of the vote decision to all applicable clients after the shareholder meeting has taken place, except if the client is acting in the capacity as issuer of the proxy or dissident shareholder and is engaging through the established procedures independent of the client relationship. |
| • | In certain instances, BlackRock may determine to engage an independent fiduciary to vote proxies as a further safeguard to avoid potential conflicts of interest or as otherwise required by applicable law. The independent fiduciary may either vote such proxies or provide BlackRock with instructions as to how to vote such proxies. In the latter case, BlackRock votes the proxy in accordance with the independent fiduciary’s determination. Use of an independent fiduciary has been |
| adopted for voting the proxies related to any company that is affiliated with BlackRock or any company that includes BlackRock employees on its board of directors. |
| 2016 | ||||||
| Country | Trade
Date |
Settlement
Date |
Number
of Days to Settle | |||
| Brazil | 02/03/16 | 02/11/16 | 8 | |||
| 02/04/16 | 02/12/16 | 8 | ||||
| 02/05/16 | 02/15/16 | 10 | ||||
| China | 02/03/16 | 02/17/16 | 14 | |||
| 02/04/16 | 02/18/16 | 14 | ||||
| 02/05/16 | 02/19/16 | 14 | ||||
| 04/27/16 | 05/09/16 | 12 | ||||
| 04/28/16 | 05/10/16 | 12 | ||||
| 04/29/16 | 05/11/16 | 12 | ||||
| 09/28/16 | 10/11/16 | 13 | ||||
| 09/29/16 | 10/12/16 | 13 | ||||
| 09/30/16 | 10/13/16 | 13 | ||||
| Colombia | 03/18/16 | 03/28/16 | 10 | |||
| Malaysia | 07/01/16 | 07/11/16 | 10 | |||
| 07/04/16 | 07/12/16 | 8 | ||||
| 07/05/16 | 07/13/16 | 8 | ||||
| The Philippines | 10/26/16 | 11/03/16 | 8 | |||
| 10/27/16 | 11/04/16 | 8 | ||||
| 10/28/16 | 11/07/16 | 10 | ||||
| South Africa | 12/20/16 | 12/28/16 | 8 | |||
| 12/21/16 | 12/29/16 | 8 | ||||
| 12/22/16 | 01/02/17 | 11 | ||||
| Taiwan | 02/02/16 | 02/15/16 | 13 | |||
| 02/03/16 | 02/16/16 | 13 | ||||
| Thailand | 04/08/16 | 04/18/16 | 10 | |||
| 04/11/16 | 04/19/16 | 8 | ||||
| 04/12/16 | 04/20/16 | 8 | ||||
| 04/29/16 | 05/09/16 | 10 | ||||
| Turkey | 06/30/16 | 07/11/16 | 11 | |||
| 07/01/16 | 07/12/16 | 11 | ||||
| 09/08/16 | 09/19/16 | 11 | ||||
| 09/09/16 | 09/20/16 | 11 | ||||
| * | These worst-case redemption cycles are based on information regarding regular holidays, which may be out of date. Based on changes in holidays, longer (worse) redemption cycles are possible. |
(as revised July 3, 2017)
| Fund | Ticker | Listing Exchange | ||
| iShares Edge MSCI Multifactor Emerging Markets ETF (the “Fund”) | EMGF | BATS |
| • | With respect to a foreign entity that holds the Indian assets directly, if the transferor of share or interest in such a foreign entity (along with its associated enterprises), at any time in the twelve months preceding the year of transfer neither holds the right of control or management in the foreign entity, nor holds voting power or share capital or interest exceeding 5% of the total voting power or total share capital in such foreign entity. |
| • | With respect to a foreign entity that holds the Indian assets indirectly, if the transferor of share or interest in such foreign entity (along with its associated enterprises), at any time in the twelve months preceding the year of transfer does not hold the right of control or management in relation to the foreign entity, which would entitle them to the right of control or management in the foreign entity which directly holds the Indian assets; or does not hold voting power or share capital or interest exceeding 5% of the total voting power or total share capital in the foreign entity, which results in holding the same share capital or voting power in the entity which directly holds the Indian assets. |
| • | creates rights, or obligations, which are not ordinarily created between persons dealing at arm's length; |
| • | results, directly or indirectly, in the misuse, or abuse, of the provisions of IT Act; |
| • | lacks commercial substance; or |
| • | is entered into, or carried out, by means, or in a manner, which are not ordinarily employed for bona fide purposes. |
| • | any arrangement where the aggregate tax benefit to all the parties of the arrangement in the relevant financial year does not exceed INR 30 Million; |
| • | foreign institutional investors (“FIIs”) that choose not to take any benefit under any tax treaty entered with India and has invested in listed or unlisted securities with prior permission of the competent authority in accordance with the applicable regulations; |
| • | non-resident investor in an FII who has invested in an FII, directly or indirectly, by way of an offshore derivative instrument or otherwise; or |
| • | any income derived from the transfer of investments made prior to August 30, 2010. |
| 1. | Concentrate its investments in a particular industry, as that term is used in the Investment Company Act. Except that the Fund will concentrate to approximately the same extent that its Underlying Index concentrates in the securities of a particular industry or group of industries. |
| 2. | Borrow money, except as permitted under the Investment Company Act. |
| 3. | Issue senior securities to the extent such issuance would violate the Investment Company Act. |
| 4. | Purchase or hold real estate, except the Fund may purchase and hold securities or other instruments that are secured by, or linked to, real estate or interests therein, securities of real estate investment trusts (“REITs”), mortgage-related securities and securities of issuers engaged in the real estate business, and the Fund may purchase and hold real estate as a result of the ownership of securities or other instruments. |
| 5. | Underwrite securities issued by others, except to the extent that the sale of portfolio securities by the Fund may be deemed to be an underwriting or as otherwise permitted by applicable law. |
| 6. | Purchase or sell commodities or commodity contracts, except as permitted by the Investment Company Act. |
| 7. | Make loans to the extent prohibited by the Investment Company Act. |
| a. | Purchase securities of other investment companies, except to the extent permitted by the Investment Company Act. As a matter of policy, however, the Fund will not purchase shares of any registered open-end investment company or registered unit investment trust, in reliance on Section 12(d)(1)(F) or (G) (the “fund of funds” provisions) of the Investment Company Act, at any time the Fund has knowledge that its shares are purchased by another investment company investor in reliance on the provisions of subparagraph (G) of Section 12(d)(1); provided that such policy will only be in effect if the Fund ceases to invest its assets in reliance on Section 12(d)(1)(G) in the iShares MSCI India ETF or iShares India 50 ETF. |
| b. | Make short sales of securities or maintain a short position, except to the extent permitted by the Fund's Prospectus and SAI, as amended from time to time, and applicable law. |
| Name (Age) | Position | Principal
Occupation(s) During the Past 5 Years |
Other
Directorships Held by Director | |||
| Robert
S. Kapito1 (59) |
Director
(since 2009). |
President, BlackRock, Inc. (since 2006); Vice Chairman of BlackRock, Inc. and Head of BlackRock’s Portfolio Management Group (since its formation in 1998) and BlackRock, Inc.’s predecessor entities (since 1988); Trustee, University of Pennsylvania (since 2009); President of Board of Directors, Hope & Heroes Children’s Cancer Fund (since 2002). | Director of BlackRock, Inc. (since 2006); Trustee of iShares Trust (since 2009); Trustee of iShares U.S. ETF Trust (since 2011). | |||
| Mark
K. Wiedman2 (46) |
Director (since 2013). | Senior Managing Director, BlackRock, Inc. (since 2014); Managing Director, BlackRock, Inc. (2007-2014); Global Head of BlackRock’s ETF and Index Investments Business (since 2016); Global Head of iShares (2011-2016); Head of Corporate Strategy, BlackRock, Inc. (2009-2011). | Trustee of iShares Trust (since 2013); Trustee of iShares U.S. ETF Trust (since 2013); Director of PennyMac Financial Services, Inc. (since 2008). |
| 1 | Robert S. Kapito is deemed to be an “interested person” (as defined in the 1940 Act) of the Company due to his affiliations with BlackRock, Inc. and its affiliates. |
| 2 | Mark K. Wiedman is deemed to be an “interested person” (as defined in the 1940 Act) of the Company due to his affiliations with BlackRock, Inc. and its affiliates. |
| Name (Age) | Position | Principal
Occupation(s) During the Past 5 Years |
Other
Directorships Held by Director | |||
| Cecilia
H. Herbert (68) |
Director
(since 2005); Independent Board Chair (since 2016). |
Trustee and Member of the Finance, Technology and Quality Committee of Stanford Health Care (since 2016); Trustee and Member of the Investment Committee, WNET, a New York public media company (since 2011); Chair (1994-2005) and Member (since 1992) of the Investment Committee, Archdiocese of San Francisco; Director (1998-2013) and President (2007-2011) of the Board of Directors, Catholic Charities CYO; Trustee (2002-2011) and Chair of the Finance and Investment Committee (2006-2010) of the Thacher School. | Trustee of iShares Trust (since 2005); Trustee of iShares U.S. ETF Trust (since 2011); Independent Board Chair of iShares Trust and iShares U.S. ETF Trust (since 2016); Trustee of Forward Funds (14 portfolios) (since 2009); Trustee of Salient MF Trust (4 portfolios) (since 2015). |
| Name (Age) | Position | Principal
Occupation(s) During the Past 5 Years |
Other
Directorships Held by Director | |||
| Jane
D. Carlin (60) |
Director
(since 2015); Risk Committee Chair (since 2016). |
Consultant (since 2012); Managing Director and Global Head of Financial Holding Company Governance & Assurance and the Global Head of Operational Risk Management of Morgan Stanley (2006-2012). | Trustee of iShares Trust (since 2015); Trustee of iShares U.S. ETF Trust (since 2015); Director of PHH Corporation (mortgage solutions) (since 2012); Director of The Hanover Insurance Group, Inc. (since 2016). | |||
| Richard
L. Fagnani (62) |
Director
(since 2017); Equity Plus Committee Chair (since 2017). |
Partner, KPMG LLP (2002-2016). | Trustee of iShares Trust (since 2017); Trustee of iShares U.S. ETF Trust (since 2017). | |||
| Charles
A. Hurty (73) |
Director
(since 2005); Audit Committee Chair (since 2006). |
Retired; Partner, KPMG LLP (1968-2001). | Trustee of iShares Trust (since 2005); Trustee of iShares U.S. ETF Trust (since 2011); Director of SkyBridge Alternative Investments Multi-Adviser Hedge Fund Portfolios LLC (2 portfolios) (since 2002). | |||
| John
E. Kerrigan (61) |
Director
(since 2005); Securities Lending Committee Chair (since 2016). |
Chief Investment Officer, Santa Clara University (since 2002). | Trustee of iShares Trust (since 2005); Trustee of iShares U.S. ETF Trust (since 2011). | |||
| Drew
E. Lawton (58) |
Director
(since 2017); 15(c) Committee Chair (since 2017). |
Senior Managing Director of New York Life Insurance Company (2010-2015). | Trustee of iShares Trust (since 2017); Trustee of iShares U.S. ETF Trust (since 2017). | |||
| John
E. Martinez (56) |
Director
(since 2003); Fixed Income Plus Committee Chair (since 2016). |
Director of Real Estate Equity Exchange, Inc. (since 2005). | Trustee of iShares Trust (since 2003); Trustee of iShares U.S. ETF Trust (since 2011). | |||
| Madhav
V. Rajan (52) |
Director
(since 2011); Nominating and Governance Committee Chair (since 2017). |
Dean, and George Pratt Shultz Professor of Accounting, University of Chicago Booth School of Business (since 2017); Robert K. Jaedicke Professor of Accounting, Stanford University Graduate School of Business (2001-2017); Professor of Law (by courtesy), Stanford Law School (2005-2017); Senior Associate Dean for Academic Affairs and Head of MBA Program, Stanford University Graduate School of Business (2010-2016). | Trustee
of iShares Trust (since 2011); Trustee of iShares U.S. ETF Trust (since 2011); Director, Cavium, Inc. (since 2013). |
| Name (Age) | Position | Principal
Occupation(s) During the Past 5 Years | ||
| Martin
Small (41) |
President (since 2016). | Managing Director, BlackRock, Inc. (since 2010); Head of U.S. iShares (since 2015); Co-Head of the U.S. Financial Markets Advisory Group, BlackRock, Inc. (2008-2014). | ||
| Jack
Gee (57) |
Treasurer
and Chief Financial Officer (since 2008). |
Managing Director, BlackRock, Inc. (since 2009); Senior Director of Fund Administration of Intermediary Investor Business, BGI (2009). | ||
| Charles
Park (49) |
Chief Compliance Officer (since 2006). | Chief Compliance Officer of BlackRock Advisors, LLC and the BlackRock-advised Funds in the Equity-Bond Complex, the Equity-Liquidity Complex and the Closed-End Complex (since 2014); Chief Compliance Officer of BFA (since 2006). | ||
| Benjamin
Archibald (42) |
Secretary (since 2015). | Managing Director, BlackRock, Inc. (since 2014); Director, BlackRock, Inc. (2010-2013); Secretary of the BlackRock-advised mutual funds (since 2012). | ||
| Steve
Messinger (55) |
Executive
Vice President (since 2016). |
Managing Director, BlackRock, Inc. (2007-2014 and since 2016); Managing Director, Beacon Consulting Group (2014-2016). | ||
| Scott
Radell (48) |
Executive
Vice President (since 2012). |
Managing Director, BlackRock, Inc. (since 2009); Head of Portfolio Solutions, BlackRock, Inc. (since 2009). | ||
| Alan
Mason (56) |
Executive
Vice President (since 2016). |
Managing Director, BlackRock, Inc. (since 2009). |
| Name of Director | Fund | Dollar
Range of Equity Securities in the Fund |
Aggregate
Dollar Range of Equity Securities in all Registered Investment Companies Overseen by Director in Family of Investment Companies | |||
| Robert S. Kapito | None | None | None | |||
| Mark Wiedman | iShares Core MSCI EAFE ETF | $50,001-$100,000 | Over $100,000 | |||
| iShares Core MSCI Emerging Markets ETF | $50,001-$100,000 | |||||
| iShares Core S&P Total U.S. Stock Market ETF | Over $100,000 | |||||
| John E. Martinez | iShares Core MSCI Emerging Markets ETF | $50,001-$100,000 | Over $100,000 | |||
| iShares Core S&P 500 ETF | Over $100,000 | |||||
| iShares Core S&P Mid-Cap ETF | $10,001-$50,000 | |||||
| iShares Core S&P Small-Cap ETF | $10,001-$50,000 | |||||
| iShares Core S&P Total U.S. Stock Market ETF | $1-$10,000 | |||||
| iShares Global Consumer Staples ETF | Over $100,000 | |||||
| iShares MSCI All Country Asia ex Japan ETF | Over $100,000 | |||||
| iShares MSCI EAFE ETF | Over $100,000 | |||||
| iShares Russell 1000 ETF | Over $100,000 | |||||
| iShares Russell 1000 Value ETF | Over $100,000 | |||||
| iShares Russell 2000 ETF | Over $100,000 | |||||
| iShares TIPS Bond ETF | $50,001-$100,000 | |||||
| Cecilia H. Herbert | iShares China Large-Cap ETF | Over $100,000 | Over $100,000 | |||
| iShares Core Dividend Growth ETF | $10,001-$50,000 | |||||
| iShares Core High Dividend ETF | $1-$10,000 | |||||
| iShares Core MSCI Emerging Markets ETF | $10,001-$50,000 | |||||
| iShares Core MSCI Total International Stock ETF | $10,001-$50,000 | |||||
| iShares Core S&P Small-Cap ETF | $1-$10,000 | |||||
| iShares Core S&P Total U.S. Stock Market ETF | $10,001-$50,000 | |||||
| iShares Core S&P U.S. Growth ETF | $50,001-$100,000 | |||||
| iShares Core S&P U.S. Value ETF | $10,001-$50,000 | |||||
| iShares iBoxx $ High Yield Corporate Bond ETF | $10,001-$50,000 | |||||
| iShares International Select Dividend ETF | $1-$10,000 | |||||
| iShares MSCI EAFE ETF | $1-$10,000 | |||||
| iShares MSCI Emerging Markets ETF | $1-$10,000 | |||||
| iShares MSCI Japan ETF | $10,001-$50,000 | |||||
| iShares National Muni Bond ETF | $10,001-$50,000 | |||||
| iShares U.S. Preferred Stock ETF | $10,001-$50,000 |
| Name of Director | Fund | Dollar
Range of Equity Securities in the Fund |
Aggregate
Dollar Range of Equity Securities in all Registered Investment Companies Overseen by Director in Family of Investment Companies | |||
| Charles A. Hurty | iShares China Large-Cap ETF | $10,001-$50,000 | Over $100,000 | |||
| iShares Core Growth Allocation ETF | $50,001-$100,000 | |||||
| iShares Core High Dividend ETF | $10,001-$50,000 | |||||
| iShares Core Moderate Allocation ETF | $50,001-$100,000 | |||||
| iShares Core MSCI Emerging Markets ETF | $10,001-$50,000 | |||||
| iShares Core S&P 500 ETF | $10,001-$50,000 | |||||
| iShares Global Energy ETF | $10,001-$50,000 | |||||
| iShares Global Healthcare ETF | $10,001-$50,000 | |||||
| iShares Global Tech ETF | $10,001-$50,000 | |||||
| iShares MSCI EAFE ETF | $10,001-$50,000 | |||||
| iShares Russell 2000 ETF | $10,001-$50,000 | |||||
| iShares U.S. Basic Materials ETF | $10,001-$50,000 | |||||
| iShares U.S. Energy ETF | $10,001-$50,000 | |||||
| iShares U.S. Technology ETF | $50,001-$100,000 | |||||
| John E. Kerrigan | iShares MSCI ACWI ETF | $10,001-$50,000 | Over $100,000 | |||
| iShares MSCI ACWI ex U.S. ETF | Over $100,000 | |||||
| iShares Short-Term National Muni Bond ETF | Over $100,000 | |||||
| Madhav V. Rajan | iShares Core Dividend Growth ETF | Over $100,000 | Over $100,000 | |||
| iShares Core High Dividend ETF | Over $100,000 | |||||
| iShares Core MSCI Emerging Markets ETF | Over $100,000 | |||||
| iShares Core S&P 500 ETF | Over $100,000 | |||||
| iShares iBoxx $ High Yield Corporate Bond ETF | Over $100,000 | |||||
| iShares iBoxx $ Investment Grade Corporate Bond ETF | Over $100,000 | |||||
| iShares Russell 2000 ETF | Over $100,000 | |||||
| iShares Select Dividend ETF | Over $100,000 | |||||
| Jane D. Carlin | iShares Core MSCI EAFE ETF | $50,001-$100,000 | Over $100,000 | |||
| iShares Core S&P Small-Cap ETF | $10,001-$50,000 | |||||
| iShares Global Tech ETF | $10,001-$50,000 |
| Name of Director | iShares
Edge MSCI Multifactor Emerging Markets ETF |
Pension
or Retirement Benefits Accrued As Part of Company Expenses1 |
Estimated
Annual Benefits Upon Retirement1 |
Total
Compensation From the Fund and Fund Complex2 | ||||
| Independent Director: | ||||||||
| Robert H. Silver3 | $ 6 | Not Applicable | Not Applicable | $ 350,000 | ||||
| John E. Kerrigan | 11 | Not Applicable | Not Applicable | 315,000 | ||||
| Charles A. Hurty | 11 | Not Applicable | Not Applicable | 340,000 | ||||
| Cecilia H. Herbert | 12 | Not Applicable | Not Applicable | 341,764 | ||||
| John E. Martinez | 11 | Not Applicable | Not Applicable | 326,764 | ||||
| Madhav V. Rajan | 11 | Not Applicable | Not Applicable | 315,000 | ||||
| Jane D. Carlin | 11 | Not Applicable | Not Applicable | 300,000 4 | ||||
| Interested Director: | ||||||||
| Robert S. Kapito | $ 0 | Not Applicable | Not Applicable | $0 | ||||
| Mark K. Wiedman | 0 | Not Applicable | Not Applicable | 0 | ||||
| Advisory Board Members: | ||||||||
| Drew E. Lawton5 | Not Applicable | Not Applicable | Not Applicable | Not Applicable | ||||
| Richard L. Fagnani6 | Not Applicable | Not Applicable | Not Applicable | Not Applicable |
| 1 | No Director or officer is entitled to any pension or retirement benefits from the Company. |
| 2 | Includes compensation for service on the Boards of Trustees for iShares Trust and iShares U.S. ETF Trust and the Board of Directors of iShares MSCI Russia Capped ETF, Inc. |
| 3 | Served as an Independent Director through March 31, 2016. |
| 4 | Total compensation is shown for Jane D. Carlin for the period from February 3, 2015 to December 31, 2015 because she was appointed to serve as an Independent Director of the Company effective February 3, 2015. |
| 5 | Compensation is not shown for Drew E. Lawton because he was appointed to serve as an Advisory Board Member effective October 18, 2016. |
| 6 | Compensation is not shown for Richard L. Fagnani because he was appointed to serve as an Advisory Board Member effective April 1, 2017. |
| Name and Address | Percentage
of Ownership | |
| Goldman,
Sachs & Co. 30 Hudson Street 16th Floor Jersey City, NJ 07302 |
40.28% | |
| The
Bank of New York Mellon 401 Salina Street 2nd Floor Syracuse, NY 13202 |
30.31% | |
| Wells
Fargo Securities, LLC 8739 Research Drive Charlotte, NC 28262-0675 |
19.79% |
| Management
Fee for the Fiscal Year Ended August 31, 20161 |
Fund
Inception Date |
Management
Fees Paid Net of Waivers for Fiscal Year Ended August 31, 2016 |
Management
Fees Paid Net of Waivers for Fiscal Year Ended August 31, 2015 |
Management
Fees Paid Net of Waivers for Fiscal Year Ended August 31, 2014 | ||||
| 0.45% | 12/08/2015 | $42,577 | N/A | N/A |
| 1 | Effective December 16, 2016, the management fee for the Fund is 0.45%. Prior to December 16, 2016, the management fee for the Fund was 0.65%. |
| Diane Hsiung | ||||
| Types of Accounts | Number | Total Assets | ||
| Registered Investment Companies | 250 | $701,656,000,000 | ||
| Other Pooled Investment Vehicles | 15 | 3,975,000,000 | ||
| Other Accounts | 0 | N/A | ||
| Accounts with Incentive-Based Fee Arrangements | 0 | N/A |
| Jennifer Hsui | ||||
| Types of Accounts | Number | Total Assets | ||
| Registered Investment Companies | 266 | $722,470,000,000 | ||
| Other Pooled Investment Vehicles | 16 | 4,295,000,000 | ||
| Other Accounts | 0 | N/A | ||
| Accounts with Incentive-Based Fee Arrangements | 0 | N/A |
| Alan Mason | ||||
| Types of Accounts | Number | Total Assets | ||
| Registered Investment Companies | 362 | $785,985,000,000 | ||
| Other Pooled Investment Vehicles | 285 | 574,676,000,000 | ||
| Other Accounts | 185 | 39,352,000,000 | ||
| Accounts with Incentive-Based Fee Arrangements | 0 | N/A |
| Greg Savage | ||||
| Types of Accounts | Number | Total Assets | ||
| Registered Investment Companies | 335 | $778,965,000,000 | ||
| Other Pooled Investment Vehicles | 75 | 26,632,000,000 | ||
| Other Accounts | 0 | N/A | ||
| Accounts with Incentive-Based Fee Arrangements | 0 | N/A |
| Diane Hsiung | ||||
| Types of Accounts | Number
of Other Accounts with Performance Fees Managed by Portfolio Manager |
Aggregate
of Total Assets | ||
| Registered Investment Companies | 0 | N/A | ||
| Other Pooled Investment Vehicles | 0 | N/A | ||
| Other Accounts | 0 | N/A |
| Jennifer Hsui | ||||
| Types of Accounts | Number
of Other Accounts with Performance Fees Managed by Portfolio Manager |
Aggregate
of Total Assets | ||
| Registered Investment Companies | 0 | N/A | ||
| Other Pooled Investment Vehicles | 0 | N/A | ||
| Other Accounts | 0 | N/A |
| Alan Mason | ||||
| Types of Accounts | Number
of Other Accounts with Performance Fees Managed by Portfolio Manager |
Aggregate
of Total Assets | ||
| Registered Investment Companies | 0 | N/A | ||
| Other Pooled Investment Vehicles | 0 | N/A | ||
| Other Accounts | 0 | N/A |
| Greg Savage | ||||
| Types of Accounts | Number
of Other Accounts with Performance Fees Managed by Portfolio Manager |
Aggregate
of Total Assets | ||
| Registered Investment Companies | 0 | N/A | ||
| Other Pooled Investment Vehicles | 0 | N/A | ||
| Other Accounts | 0 | N/A |
| Fund
Inception Date |
Administration,
Custodian, Transfer Agency Expenses Paid During Fiscal Year Ended August 31, 2016 |
Administration,
Custodian, Transfer Agency Expenses Paid During Fiscal Year Ended August 31, 2015 |
Administration,
Custodian, Transfer Agency Expenses Paid During Fiscal Year Ended August 31, 2014 | |||
| 12/08/2015 | $24,272 | N/A | N/A |
| Fund
Inception Date |
Brokerage
Commissions Paid During Fiscal Year Ended August 31, 2016 |
Brokerage
Commissions Paid During Fiscal Year Ended August 31, 2015 |
Brokerage
Commissions Paid During Fiscal Year Ended August 31, 2014 | |||
| 12/08/2015 | $ 5,600 | N/A | N/A |
| Fiscal Year ended August 31, 2016 | Fiscal Year ended August 31, 2015 | ||
| 11% | N/A |
| Shares
Per Creation Unit |
Value
Per Creation Unit (U.S.$) | |
| 100,000 | $3,809,000 |
| Standard
Creation Transaction Fee |
Maximum
Additional Charge* | |
| $9,000 | 7.0% |
| * | As a percentage of the net asset value per Creation Unit. |
| Standard
Redemption Transaction Fee |
Maximum
Additional Charge* | |
| $9,000 | 2.0% |
| * | As a percentage of the net asset value per Creation Unit, inclusive of the standard redemption transaction fee. |
| • | Capital gains resulting from the sale of Indian securities (including depositary receipts issued by Indian companies) acquired prior to April 1, 2017 will not be subject to tax in India, provided the Subsidiary does not have Permanent Establishments (“PE”) in India. Capital gains resulting from sale of shares in Indian companies acquired on or after April 1, 2017 will be subject to tax in India as per the domestic tax rates (provided below). If the Subsidiaries are able to satisfy the conditions under the limitation of benefits article introduced by the Protocol, capital gains on shares acquired on or after April 1, 2017 and sold prior to April 1, 2019 may be taxed at 50% of the applicable Indian tax rate; |
| • | Dividends on shares received from an Indian company on which dividend distribution tax has been paid are exempt from tax in the hands of the shareholders. However, the Indian company distributing dividends is subject to a dividend distribution tax at the rate of 20.36%; and |
| • | Interest paid to the Subsidiary in respect of the debt obligations of Indian issuers will be subject to Indian income tax. The tax rate, in the case of rupee-denominated debt obligations, is 43.26%. However if the Subsidiary is a SEBI registered foreign portfolio investor, interest income earned from June 1, 2013 to June 30, 2017 on rupee-denominated bonds of Indian companies and Government securities, will be subject to tax at the rate of 5.41%, provided that the rate of interest does not exceed the prescribed rates. In the case of foreign currency-denominated debt obligations, the tax rate is 21.63%. For approved foreign currency loans advanced from July 1, 2012 to June 30, 2017, the tax rate on interest is 5.41% and for approved foreign currency long-term bonds issued from October 1, 2014 to June 30, 2017, the tax rate on interest is 5.41%. The Protocol provides for a withholding rate of 7.5% on the interest payments made on or after April 1, 2017. |
| • | Long-term capital gains (being gains on sale of shares held for a period of more than twelve months) listed on a recognized stock exchange would not be taxable in India provided Securities Transaction Tax (“STT”) has been paid on the same (as discussed below); |
| • | Short-term capital gains (being gains on sale of shares held for a period of twelve months or less) from the sale of Indian shares listed on a recognized stock exchange will be taxed at the rate of 16.223% provided STT has been paid on the same; |
| • | Long-term capital gains (being gains on sale of shares held for a period of more than 24 months) arising to the Subsidiary from the sale of unlisted securities will be taxed at the rate of 10.815% (without indexation) and short-term capital gains (being gains on sale of shares held for a period of 24 months or less) will be taxed at the rate of 43.26%;* |
| • | Capital gains realized on sale of listed equity shares not executed on a recognized stock exchange in India would be taxed at the rate of 21.63% for long-term gains (being gains on sale of shares held for a period of more than 12 |
| months) and at 43.26% in the case of short-term gains (being gains on sale of shares held for a period of 12 months or less);* and | |
| • | Capital gains arising from the transfer of depositary receipts outside India between non-resident investors will not be subject to tax in India. |
| * | However, if the Subsidiary is a SEBI registered foreign portfolio investor, the rates will be 10.816% and 32.45%, respectively. |
| • | 0.1% payable by the buyer and 0.1% by the seller on the value of transactions of delivery based transfer of an equity share in an Indian company entered in a recognized stock exchange; |
| • | 0.001% on the value of transactions of delivery based sale of a unit of an equity oriented mutual fund entered in a recognized stock exchange, payable by the seller; |
| • | 0.025% on the value of transactions of non-delivery based sale of an equity share in an Indian company or a unit of an equity oriented mutual fund, entered in a recognized stock exchange payable by the seller; |
| • | 0.05% on the value of transactions of derivatives being options, entered in a recognized stock exchange. STT is to be paid by the seller; |
| • | 0.01% on the value of transactions of sale of derivatives being futures, entered in a recognized stock exchange. STT is to be paid by the seller; |
| • | 0.001% on the value of transactions of sale of units of an equity-oriented fund to the Mutual Fund, payable by the seller in accordance with the Finance Act, 2013; |
| • | 0.125% on the value of transactions of sale of derivatives being options, where the option is exercised, entered in a recognized stock exchange. STT is to be paid by buyer; |
| • | The Finance Act, 2012 has exempted from tax the capital gains (under the ITA) arising from the sale of unlisted shares by existing shareholders of a Sub-Fund in an initial public offer. However, such sale is subject to STT at 0.2% of the sale consideration payable by the seller. |
| • | With respect to a foreign entity that holds the Indian assets directly, if the transferor of share or interest in such a foreign entity (along with its associated enterprises), at any time in the twelve months preceding the year of transfer neither holds the right of control or management in the foreign entity, nor holds voting power or share capital or interest exceeding 5% of the total voting power or total share capital in such foreign entity. |
| • | With respect to a foreign entity that holds the Indian assets indirectly, if the transferor of share or interest in such foreign entity (along with its associated enterprises), at any time in the twelve months preceding the year of transfer does not hold the right of control or management in relation to the foreign entity, which would entitle them to the right of control or management in the foreign entity which directly holds the Indian assets; or does not hold voting power or share capital or interest exceeding 5% of the total voting power or total share capital in the foreign entity, which results in holding the same share capital or voting power in the entity which directly holds the Indian assets. |
| • | any arrangement where the aggregate tax benefit to all the parties of the arrangement in the relevant financial year does not exceed INR 30 Million; |
| • | FIIs that choose not to take any benefit under any tax treaty entered with India and have invested in listed or unlisted securities with prior permission of the competent authority in accordance with the applicable regulations; |
| • | non-resident investor in an FII who has invested in an FII, directly or indirectly, by way of an offshore derivative instrument or otherwise; or |
| • | any income derived from the transfer of investments made prior to August 30, 2010. |
| 1 | iShares MSCI ACWI Low Carbon Target ETF, iShares MSCI All Peru Capped ETF, iShares MSCI EAFE ESG Optimized ETF, iShares MSCI EM ESG Optimized ETF, iShares MSCI Global Impact ETF, iShares MSCI KLD 400 Social ETF and iShares MSCI USA ESG Select ETF have separate Fund Proxy Voting Policies. |
| • | Boards and directors |
| • | Auditors and audit-related issues |
| • | Capital structure, mergers, asset sales and other special transactions |
| • | Remuneration and benefits |
| • | Social, ethical and environmental issues |
| • | General corporate governance matters |
| • | establishing an appropriate corporate governance structure; |
| • | supporting and overseeing management in setting strategy; |
| • | ensuring the integrity of financial statements; |
| • | making decisions regarding mergers, acquisitions and disposals; |
| • | establishing appropriate executive compensation structures; and |
| • | addressing business issues including social, ethical and environmental issues when they have the potential to materially impact company reputation and performance. |
| • | current employment at the company or a subsidiary; |
| • | former employment within the past several years as an executive of the company; |
| • | providing substantial professional services to the company and/or members of the company’s management; |
| • | having had a substantial business relationship in the past three years; |
| • | having, or representing a shareholder with, a substantial shareholding in the company; |
| • | being an immediate family member of any of the aforementioned; and |
| • | interlocking directorships. |
| • | BlackRock has adopted a proxy voting oversight structure whereby the Corporate Governance Committees oversee the voting decisions and other activities of the Corporate Governance Group, and particularly its activities with respect to voting in the relevant region of each Corporate Governance Committee’s jurisdiction. |
| • | The Corporate Governance Committees have adopted Guidelines for each region, which set forth the firm’s views with respect to certain corporate governance and other issues that typically arise in the proxy voting context. The Corporate Governance Committees receive periodic reports regarding the specific votes cast by the Corporate Governance Group and regular updates on material process issues, procedural changes and other matters of concern to the Corporate Governance Committees. |
| • | BlackRock’s Global Corporate Governance Oversight Committee oversees the Global Head, the Corporate Governance Group and the Corporate Governance Committees. The Global Corporate Governance Oversight Committee conducts a review, at least annually, of the proxy voting process to ensure compliance with BlackRock’s risk policies and procedures. |
| • | BlackRock maintains a reporting structure that separates the Global Head and Corporate Governance Group from employees with sales responsibilities. In addition, BlackRock maintains procedures intended to ensure that all engagements with corporate issuers or dissident shareholders are managed consistently and without regard to BlackRock’s relationship with the issuer of the proxy or dissident shareholder. Within the normal course of business, the Global Head or Corporate Governance Group may engage directly with BlackRock clients, and with employees with sales responsibilities, in discussions regarding general corporate governance policy matters, and to otherwise ensure that proxy-related client service levels are met. The Global Head or Corporate Governance Group does not discuss any specific voting matter with a client prior to the disclosure of the vote decision to all applicable clients after the shareholder meeting has taken place, except if the client is acting in the capacity as issuer of the proxy or dissident shareholder and is engaging through the established procedures independent of the client relationship. |
| • | In certain instances, BlackRock may determine to engage an independent fiduciary to vote proxies as a further safeguard to avoid potential conflicts of interest or as otherwise required by applicable law. The independent fiduciary may either vote such proxies or provide BlackRock with instructions as to how to vote such proxies. In the latter case, BlackRock votes the proxy in accordance with the independent fiduciary’s determination. Use of an independent fiduciary has been |
| adopted for voting the proxies related to any company that is affiliated with BlackRock or any company that includes BlackRock employees on its board of directors. |
| Turkey | |||
| January 1 | July 5 | September 12 | October 28 |
| April 23 | July 6 | September 13 | October 29 |
| May 1 | July 7 | September 14 | |
| May 19 | July 8 | September 15 | |
| July 4 | August 30 | September 16 | |
| The United Arab Emirates | |||
| January 2 | July 7 | September 13 | December 4 |
| May 4 | August 6 | September 14 | December 11 |
| May 5 | September 10 | October 2 | December 12 |
| July 5 | September 11 | November 30 | |
| July 6 | September 12 | December 3 | |
| 2016 | ||||||
| Country | Trade
Date |
Settlement
Date |
Number
of Days to Settle | |||
| Brazil | 02/03/16 | 02/11/16 | 8 | |||
| 02/04/16 | 02/12/16 | 8 | ||||
| 02/05/16 | 02/15/16 | 10 | ||||
| China | 02/03/16 | 02/17/16 | 14 | |||
| 02/04/16 | 02/18/16 | 14 | ||||
| 02/05/16 | 02/19/16 | 14 | ||||
| 04/27/16 | 05/09/16 | 12 | ||||
| 04/28/16 | 05/10/16 | 12 | ||||
| 04/29/16 | 05/11/16 | 12 | ||||
| 09/28/16 | 10/11/16 | 13 | ||||
| 09/29/16 | 10/12/16 | 13 | ||||
| 09/30/16 | 10/13/16 | 13 | ||||
| Colombia | 03/18/16 | 03/28/16 | 10 | |||
| Indonesia | 06/29/16 | 07/11/16 | 12 | |||
| 06/30/16 | 07/12/16 | 12 | ||||
| 07/01/16 | 07/13/16 | 12 | ||||
| Malaysia | 07/01/16 | 07/11/16 | 10 | |||
| 07/04/16 | 07/12/16 | 8 | ||||
| 07/05/16 | 07/13/16 | 8 | ||||
| Mexico | 03/18/16 | 03/28/16 | 10 | |||
| Philippines | 10/26/16 | 11/03/16 | 8 | |||
| 10/27/16 | 11/04/16 | 8 | ||||
| 10/28/16 | 11/07/16 | 10 | ||||
| Qatar | 07/03/16 | 07/12/16 | 9 | |||
| 07/04/16 | 07/13/16 | 9 | ||||
| 07/05/16 | 07/14/16 | 9 | ||||
| 09/06/16 | 09/18/16 | 12 | ||||
| 09/07/16 | 09/19/16 | 12 | ||||
| 09/08/16 | 09/20/16 | 12 | ||||
| South Africa | 03/14/16 | 03/22/16 | 8 | |||
| 03/15/16 | 03/23/16 | 8 | ||||
| 03/16/16 | 03/24/16 | 8 | ||||
| 03/17/16 | 03/29/16 | 12 | ||||
| 03/18/16 | 03/30/16 | 12 | ||||
| 03/22/16 | 03/31/16 | 9 | ||||
| 03/23/16 | 04/01/16 | 9 | ||||
| 03/24/16 | 04/04/16 | 11 | ||||
| 2016 | ||||||
| Country | Trade
Date |
Settlement
Date |
Number
of Days to Settle | |||
| 04/20/16 | 04/28/16 | 8 | ||||
| 04/21/16 | 04/29/16 | 8 | ||||
| 04/22/16 | 05/03/16 | 11 | ||||
| 04/25/16 | 05/04/16 | 9 | ||||
| 04/26/16 | 05/05/16 | 9 | ||||
| 04/28/16 | 05/06/16 | 8 | ||||
| 04/29/16 | 05/09/16 | 10 | ||||
| 06/09/16 | 06/17/16 | 8 | ||||
| 06/10/16 | 06/20/16 | 10 | ||||
| 06/13/16 | 06/21/16 | 8 | ||||
| 06/14/16 | 06/22/16 | 8 | ||||
| 06/15/16 | 06/23/16 | 8 | ||||
| 08/02/16 | 08/10/16 | 8 | ||||
| 08/03/16 | 08/11/16 | 8 | ||||
| 08/04/16 | 08/12/16 | 8 | ||||
| 08/05/16 | 08/15/16 | 10 | ||||
| 08/08/16 | 08/16/16 | 8 | ||||
| 12/09/16 | 12/19/16 | 10 | ||||
| 12/12/16 | 12/20/16 | 8 | ||||
| 12/13/16 | 12/21/16 | 8 | ||||
| 12/14/16 | 12/22/16 | 8 | ||||
| 12/15/16 | 12/28/16 | 13 | ||||
| 12/16/16 | 12/28/16 | 12 | ||||
| 12/19/16 | 12/29/16 | 10 | ||||
| 12/20/16 | 01/02/17 | 13 | ||||
| 12/21/16 | 01/03/17 | 13 | ||||
| 12/22/16 | 01/04/17 | 13 | ||||
| 12/28/16 | 01/05/17 | 8 | ||||
| 12/29/16 | 01/06/17 | 8 | ||||
| Taiwan | 02/02/16 | 02/15/16 | 13 | |||
| 02/03/16 | 02/16/16 | 13 | ||||
| Thailand | 04/08/16 | 04/18/16 | 10 | |||
| 04/11/16 | 04/19/16 | 8 | ||||
| 04/12/16 | 04/20/16 | 8 | ||||
| 04/29/16 | 05/09/16 | 10 | ||||
| Turkey | 06/30/16 | 07/11/16 | 11 | |||
| 07/01/16 | 07/12/16 | 11 | ||||
| 09/08/16 | 09/19/16 | 11 | ||||
| 09/09/16 | 09/20/16 | 11 | ||||
| United Arab Emirates | 09/07/16 | 09/15/16 | 8 | |||
| 09/08/16 | 09/18/16 | 10 | ||||
| 2017 | ||||||
| Country | Trade
Date |
Settlement
Date |
Number
of Days to Settle | |||
| Brazil | 02/22/17 | 03/02/17 | 8 | |||
| 02/23/17 | 03/03/17 | 8 | ||||
| 02/24/17 | 03/06/17 | 11 | ||||
| China | 01/24/17 | 02/03/17 | 10 | |||
| 01/25/17 | 02/06/17 | 12 | ||||
| 01/26/17 | 02/07/17 | 12 | ||||
| 09/27/17 | 10/09/17 | 12 | ||||
| 09/28/17 | 10/10/17 | 12 | ||||
| 09/29/17 | 10/11/17 | 12 | ||||
| Indonesia | 06/21/17 | 07/03/17 | 12 | |||
| 06/22/17 | 07/04/17 | 12 | ||||
| 06/23/17 | 07/05/17 | 12 | ||||
| Malaysia | 01/24/17 | 02/01/17 | 8 | |||
| 01/25/17 | 02/02/17 | 8 | ||||
| 01/26/17 | 02/03/17 | 8 | ||||
| Qatar | 06/20/17 | 06/28/17 | 8 | |||
| 06/21/17 | 06/29/17 | 8 | ||||
| 06/22/17 | 06/30/17 | 8 | ||||
| South Africa | 03/14/17 | 03/22/17 | 8 | |||
| 03/15/17 | 03/23/17 | 8 | ||||
| 03/16/17 | 03/24/17 | 8 | ||||
| 03/17/17 | 03/27/17 | 10 | ||||
| 03/20/17 | 03/28/17 | 8 | ||||
| 04/07/17 | 04/18/17 | 11 | ||||
| 04/10/17 | 04/19/17 | 9 | ||||
| 04/11/17 | 04/20/17 | 9 | ||||
| 04/12/17 | 04/21/17 | 9 | ||||
| 04/13/17 | 04/24/17 | 11 | ||||
| 04/20/17 | 04/28/17 | 8 | ||||
| 04/21/17 | 05/02/17 | 11 | ||||
| 04/24/17 | 05/03/17 | 9 | ||||
| 04/25/17 | 05/04/17 | 9 | ||||
| 04/26/17 | 05/05/17 | 9 | ||||
| 04/28/17 | 05/08/17 | 10 | ||||
| 06/09/17 | 06/19/17 | 10 | ||||
| 06/12/17 | 06/20/17 | 8 | ||||
| 06/13/17 | 06/21/17 | 8 | ||||
| 06/14/17 | 06/22/17 | 8 | ||||
| 06/15/17 | 06/23/17 | 8 | ||||
| 08/02/17 | 08/10/17 | 8 | ||||
| 08/03/17 | 08/11/17 | 8 | ||||
| 08/04/17 | 08/14/17 | 10 | ||||
| 08/07/17 | 08/15/17 | 8 | ||||
| 08/08/17 | 08/16/17 | 8 | ||||
| 09/18/17 | 09/26/17 | 8 | ||||
| 2017 | ||||||
| Country | Trade
Date |
Settlement
Date |
Number
of Days to Settle | |||
| 09/19/17 | 09/27/17 | 8 | ||||
| 09/20/17 | 09/28/17 | 8 | ||||
| 09/21/17 | 09/29/17 | 8 | ||||
| 09/22/17 | 10/02/17 | 10 | ||||
| 12/18/17 | 12/27/17 | 9 | ||||
| 12/19/17 | 12/28/17 | 9 | ||||
| 12/20/17 | 12/29/17 | 9 | ||||
| 12/21/17 | 01/03/18 | 13 | ||||
| 12/22/17 | 01/04/18 | 13 | ||||
| South Korea | 09/29/17 | 10/10/17 | 11 | |||
| 10/02/17 | 10/11/17 | 9 | ||||
| Taiwan | 01/23/17 | 02/02/17 | 10 | |||
| 01/24/17 | 02/03/17 | 10 | ||||
| Turkey | 08/28/17 | 09/05/17 | 8 | |||
| 08/29/17 | 09/06/17 | 8 | ||||
| * | These worst-case redemption cycles are based on information regarding regular holidays, which may be out of date. Based on changes in holidays, longer (worse) redemption cycles are possible. |
(as revised July 3, 2017)
| Fund | Ticker | Listing Exchange | ||
| iShares Currency Hedged MSCI Emerging Markets ETF | HEEM | NYSE Arca | ||
| iShares Edge MSCI Min Vol EM Currency Hedged ETF | HEMV | BATS |
| • | iShares Currency Hedged MSCI Emerging Markets ETF |
| • | iShares Edge MSCI Min Vol EM Currency Hedged ETF1 |
| 1 | On May 12, 2016, the name of the Fund changed from iShares Currency Hedged MSCI EM Minimum Volatility ETF to iShares Edge MSCI Min Vol EM Currency Hedged ETF. |
| • | MSCI Global Standard Indexes cover all investable large- and mid-cap securities by including approximately 85% of each market's free float-adjusted market capitalization. |
| • | MSCI Global Small Cap Indexes provide coverage to all companies with a market capitalization below that of the companies in the MSCI Global Standard Indexes by including above and beyond the coverage of the MSCI Global Standard Indexes. |
| • | Achieving global size integrity by ensuring that companies of comparable and relevant sizes are included in a given size segment across all markets in a composite index; and |
| • | Achieving consistent market coverage by ensuring that each market's size segment is represented in its proportional weight in the composite universe. |
| • | Semi-Annual Index Reviews (“SAIRs”), conducted on a fixed semi-annual timetable that systematically reassess the various dimensions of the equity universe for all markets; |
| • | Quarterly Index Reviews (“QIRs”), aimed at promptly reflecting other significant market events; and |
| • | Ongoing event-related changes, such as mergers, acquisitions, spin-offs, bankruptcies, reorganizations and other similar corporate events, which generally are implemented in the indexes as they occur. |
| • | The maximum weight of an index constituent will be the lower of 1.5% or 20 times its weight in the MSCI Global Standard Index; |
| • | The minimum weight of an index constituent will be 0.05%; |
| • | For countries in the MSCI Global Standard Index with weight greater than or equal to 2.5% in the Parent Index, the MSCI Global Minimum Volatility Indexes weight will not deviate by more than ±5% of its weight in the MSCI Global Standard Index; |
| • | For countries in the MSCI Global Standard Index with weight less than 2.5% in the Parent Index, the maximum MSCI Global Minimum Volatility Indexes weight will be three times its weight in the MSCI Global Standard Index; |
| • | Sector weights will not deviate by more than ±5% from its weight in the MSCI Global Standard Index; |
| • | Exposure to risk indices from Barra’s multi-factor risk model, including (i) Momentum; (ii) Value; (iii) Size; (iv) Size Nonlinearity; (v) Growth; (vi) Liquidity; and (vii) Financial Leverage will be limited to ±0.25 standard deviations relative to the MSCI Global Standard Index; exposure to the volatility risk index will be unlimited; and |
| • | The maximum one-way turnover will be 10%. |
| 1. | Concentrate its investments in a particular industry, as that term is used in the Investment Company Act, except that the Fund will concentrate to approximately the same extent that its Underlying Index concentrates in the securities of a particular industry or group of industries. |
| 2. | Borrow money, except as permitted under the Investment Company Act. |
| 3. | Issue senior securities to the extent such issuance would violate the Investment Company Act. |
| 4. | Purchase or hold real estate, except the Fund may purchase and hold securities or other instruments that are secured by, or linked to, real estate or interests therein, securities of REITs, mortgage-related securities and securities of issuers engaged in the real estate business, and the Fund may purchase and hold real estate as a result of the ownership of securities or other instruments. |
| 5. | Underwrite securities issued by others, except to the extent that the sale of portfolio securities by the Fund may be deemed to be an underwriting or as otherwise permitted by applicable law. |
| 6. | Purchase or sell commodities or commodity contracts, except as permitted by the Investment Company Act. |
| 7. | Make loans to the extent prohibited by the Investment Company Act. |
| a. | Purchase securities of other investment companies, except to the extent permitted by the Investment Company Act. As a matter of policy, however, each Fund will not purchase shares of any registered open-end investment company or registered unit investment trust, in reliance on Section 12(d)(1)(F) or (G) (the “fund of funds” provisions) of the Investment Company Act, at any time each Fund has knowledge that its shares are purchased by another investment company investor in reliance on the provisions of subparagraph (G) of Section 12(d)(1); provided that such policy will only be in effect if the Fund ceases to invest its assets in reliance on Section 12(d)(1)(G) in the iShares MSCI Emerging Markets ETF or the iShares Edge MSCI Min Vol Emerging Markets ETF (or a different Underlying Fund), as applicable. |
| b. | Make short sales of securities or maintain a short position, except to the extent permitted by each Fund's Prospectus and SAI, as amended from time to time, and applicable law. |
| • | The frequency of trades and quotes for the security; |
| • | The number of dealers wishing to purchase or sell the security and the number of other potential purchasers; |
| • | Dealer undertakings to make a market in the security; and |
| • | The nature of the security and the nature of the marketplace in which it trades (e.g., the time needed to dispose of the security, the method of soliciting offers and the mechanics of transfer). |
| Name (Age) | Position | Principal
Occupation(s) During the Past 5 Years |
Other
Directorships Held by Director | |||
| Robert
S. Kapito1 (59) |
Director
(since 2009). |
President, BlackRock, Inc. (since 2006); Vice Chairman of BlackRock, Inc. and Head of BlackRock’s Portfolio Management Group (since its formation in 1998) and BlackRock, Inc.’s predecessor entities (since 1988); Trustee, University of Pennsylvania (since 2009); President of Board of Directors, Hope & Heroes Children’s Cancer Fund (since 2002). | Director of BlackRock, Inc. (since 2006); Trustee of iShares Trust (since 2009); Trustee of iShares U.S. ETF Trust (since 2011). | |||
| Mark
K. Wiedman2 (46) |
Director (since 2013). | Senior Managing Director, BlackRock, Inc. (since 2014); Managing Director, BlackRock, Inc. (2007-2014); Global Head of BlackRock’s ETF and Index Investments Business (since 2016); Global Head of iShares (2011-2016); Head of Corporate Strategy, BlackRock, Inc. (2009-2011). | Trustee of iShares Trust (since 2013); Trustee of iShares U.S. ETF Trust (since 2013); Director of PennyMac Financial Services, Inc. (since 2008). |
| 1 | Robert S. Kapito is deemed to be an “interested person” (as defined in the 1940 Act) of the Company due to his affiliations with BlackRock, Inc. and its affiliates. |
| 2 | Mark K. Wiedman is deemed to be an “interested person” (as defined in the 1940 Act) of the Company due to his affiliations with BlackRock, Inc. and its affiliates. |
| Name (Age) | Position | Principal
Occupation(s) During the Past 5 Years |
Other
Directorships Held by Director | |||
| Cecilia
H. Herbert (68) |
Director
(since 2005); Independent Board Chair (since 2016). |
Trustee and Member of the Finance, Technology and Quality Committee of Stanford Health Care (since 2016); Trustee and Member of the Investment Committee, WNET, a New York public media company (since 2011); Chair (1994-2005) and Member (since 1992) of the Investment Committee, Archdiocese of San Francisco; Director (1998-2013) and President (2007-2011) of the Board of Directors, Catholic Charities CYO; Trustee (2002-2011) and Chair of the Finance and Investment Committee (2006-2010) of the Thacher School. | Trustee of iShares Trust (since 2005); Trustee of iShares U.S. ETF Trust (since 2011); Independent Board Chair of iShares Trust and iShares U.S. ETF Trust (since 2016); Trustee of Forward Funds (14 portfolios) (since 2009); Trustee of Salient MF Trust (4 portfolios) (since 2015). | |||
| Jane
D. Carlin (60) |
Director
(since 2015); Risk Committee Chair (since 2016). |
Consultant (since 2012); Managing Director and Global Head of Financial Holding Company Governance & Assurance and the Global Head of Operational Risk Management of Morgan Stanley (2006-2012). | Trustee of iShares Trust (since 2015); Trustee of iShares U.S. ETF Trust (since 2015); Director of PHH Corporation (mortgage solutions) (since 2012); Director of The Hanover Insurance Group, Inc. (since 2016). | |||
| Richard
L. Fagnani (62) |
Director
(since 2017); Equity Plus Committee Chair (since 2017). |
Partner, KPMG LLP (2002-2016). | Trustee of iShares Trust (since 2017); Trustee of iShares U.S. ETF Trust (since 2017). | |||
| Charles
A. Hurty (73) |
Director
(since 2005); Audit Committee Chair (since 2006). |
Retired; Partner, KPMG LLP (1968-2001). | Trustee of iShares Trust (since 2005); Trustee of iShares U.S. ETF Trust (since 2011); Director of SkyBridge Alternative Investments Multi-Adviser Hedge Fund Portfolios LLC (2 portfolios) (since 2002). | |||
| John
E. Kerrigan (61) |
Director
(since 2005); Securities Lending Committee Chair (since 2016). |
Chief Investment Officer, Santa Clara University (since 2002). | Trustee of iShares Trust (since 2005); Trustee of iShares U.S. ETF Trust (since 2011). | |||
| Drew
E. Lawton (58) |
Director
(since 2017); 15(c) Committee Chair (since 2017). |
Senior Managing Director of New York Life Insurance Company (2010-2015). | Trustee of iShares Trust (since 2017); Trustee of iShares U.S. ETF Trust (since 2017). | |||
| John
E. Martinez (56) |
Director
(since 2003); Fixed Income Plus Committee Chair (since 2016). |
Director of Real Estate Equity Exchange, Inc. (since 2005). | Trustee of iShares Trust (since 2003); Trustee of iShares U.S. ETF Trust (since 2011). |
| Name (Age) | Position | Principal
Occupation(s) During the Past 5 Years |
Other
Directorships Held by Director | |||
| Madhav
V. Rajan (52) |
Director
(since 2011); Nominating and Governance Committee Chair (since 2017). |
Dean, and George Pratt Shultz Professor of Accounting, University of Chicago Booth School of Business (since 2017); Robert K. Jaedicke Professor of Accounting, Stanford University Graduate School of Business (2001-2017); Professor of Law (by courtesy), Stanford Law School (2005-2017); Senior Associate Dean for Academic Affairs and Head of MBA Program, Stanford University Graduate School of Business (2010-2016). | Trustee
of iShares Trust (since 2011); Trustee of iShares U.S. ETF Trust (since 2011); Director, Cavium, Inc. (since 2013). |
| Name (Age) | Position | Principal
Occupation(s) During the Past 5 Years | ||
| Martin
Small (41) |
President (since 2016). | Managing Director, BlackRock, Inc. (since 2010); Head of U.S. iShares (since 2015); Co-Head of the U.S. Financial Markets Advisory Group, BlackRock, Inc. (2008-2014). | ||
| Jack
Gee (57) |
Treasurer
and Chief Financial Officer (since 2008). |
Managing Director, BlackRock, Inc. (since 2009); Senior Director of Fund Administration of Intermediary Investor Business, BGI (2009). | ||
| Charles
Park (49) |
Chief Compliance Officer (since 2006). | Chief Compliance Officer of BlackRock Advisors, LLC and the BlackRock-advised Funds in the Equity-Bond Complex, the Equity-Liquidity Complex and the Closed-End Complex (since 2014); Chief Compliance Officer of BFA (since 2006). | ||
| Benjamin
Archibald (42) |
Secretary (since 2015). | Managing Director, BlackRock, Inc. (since 2014); Director, BlackRock, Inc. (2010-2013); Secretary of the BlackRock-advised mutual funds (since 2012). | ||
| Steve
Messinger (55) |
Executive
Vice President (since 2016). |
Managing Director, BlackRock, Inc. (2007-2014 and since 2016); Managing Director, Beacon Consulting Group (2014-2016). | ||
| Scott
Radell (48) |
Executive
Vice President (since 2012). |
Managing Director, BlackRock, Inc. (since 2009); Head of Portfolio Solutions, BlackRock, Inc. (since 2009). |
| Name (Age) | Position | Principal
Occupation(s) During the Past 5 Years | ||
| Alan
Mason (56) |
Executive
Vice President (since 2016). |
Managing Director, BlackRock, Inc. (since 2009). |
| Name of Director | Fund | Dollar
Range of Equity Securities in the Fund |
Aggregate
Dollar Range of Equity Securities in all Registered Investment Companies Overseen by Director in Family of Investment Companies | |||
| Robert S. Kapito | None | None | None | |||
| Mark Wiedman | iShares Core MSCI EAFE ETF | $50,001-$100,000 | Over $100,000 | |||
| iShares Core MSCI Emerging Markets ETF | $50,001-$100,000 | |||||
| iShares Core S&P Total U.S. Stock Market ETF | Over $100,000 | |||||
| John E. Martinez | iShares Core MSCI Emerging Markets ETF | $50,001-$100,000 | Over $100,000 | |||
| iShares Core S&P 500 ETF | Over $100,000 | |||||
| iShares Core S&P Mid-Cap ETF | $10,001-$50,000 | |||||
| iShares Core S&P Small-Cap ETF | $10,001-$50,000 | |||||
| iShares Core S&P Total U.S. Stock Market ETF | $1-$10,000 | |||||
| iShares Global Consumer Staples ETF | Over $100,000 | |||||
| iShares MSCI All Country Asia ex Japan ETF | Over $100,000 | |||||
| iShares MSCI EAFE ETF | Over $100,000 | |||||
| iShares Russell 1000 ETF | Over $100,000 | |||||
| iShares Russell 1000 Value ETF | Over $100,000 | |||||
| iShares Russell 2000 ETF | Over $100,000 | |||||
| iShares TIPS Bond ETF | $50,001-$100,000 | |||||
| Cecilia H. Herbert | iShares China Large-Cap ETF | Over $100,000 | Over $100,000 | |||
| iShares Core Dividend Growth ETF | $10,001-$50,000 |
| Name of Director | Fund | Dollar
Range of Equity Securities in the Fund |
Aggregate
Dollar Range of Equity Securities in all Registered Investment Companies Overseen by Director in Family of Investment Companies | |||
| iShares Core High Dividend ETF | $1-$10,000 | |||||
| iShares Core MSCI Emerging Markets ETF | $10,001-$50,000 | |||||
| iShares Core MSCI Total International Stock ETF | $10,001-$50,000 | |||||
| iShares Core S&P Small-Cap ETF | $1-$10,000 | |||||
| iShares Core S&P Total U.S. Stock Market ETF | $10,001-$50,000 | |||||
| iShares Core S&P U.S. Growth ETF | $50,001-$100,000 | |||||
| iShares Core S&P U.S. Value ETF | $10,001-$50,000 | |||||
| iShares iBoxx $ High Yield Corporate Bond ETF | $10,001-$50,000 | |||||
| iShares International Select Dividend ETF | $1-$10,000 | |||||
| iShares MSCI EAFE ETF | $1-$10,000 | |||||
| iShares MSCI Emerging Markets ETF | $1-$10,000 | |||||
| iShares MSCI Japan ETF | $10,001-$50,000 | |||||
| iShares National Muni Bond ETF | $10,001-$50,000 | |||||
| iShares U.S. Preferred Stock ETF | $10,001-$50,000 | |||||
| Charles A. Hurty | iShares China Large-Cap ETF | $10,001-$50,000 | Over $100,000 | |||
| iShares Core Growth Allocation ETF | $50,001-$100,000 | |||||
| iShares Core High Dividend ETF | $10,001-$50,000 | |||||
| iShares Core Moderate Allocation ETF | $50,001-$100,000 | |||||
| iShares Core MSCI Emerging Markets ETF | $10,001-$50,000 | |||||
| iShares Core S&P 500 ETF | $10,001-$50,000 | |||||
| iShares Global Energy ETF | $10,001-$50,000 | |||||
| iShares Global Healthcare ETF | $10,001-$50,000 | |||||
| iShares Global Tech ETF | $10,001-$50,000 | |||||
| iShares MSCI EAFE ETF | $10,001-$50,000 | |||||
| iShares Russell 2000 ETF | $10,001-$50,000 | |||||
| iShares U.S. Basic Materials ETF | $10,001-$50,000 | |||||
| iShares U.S. Energy ETF | $10,001-$50,000 | |||||
| iShares U.S. Technology ETF | $50,001-$100,000 | |||||
| John E. Kerrigan | iShares MSCI ACWI ETF | $10,001-$50,000 | Over $100,000 | |||
| iShares MSCI ACWI ex U.S. ETF | Over $100,000 | |||||
| iShares Short-Term National Muni Bond ETF | Over $100,000 | |||||
| Madhav V. Rajan | iShares Core Dividend Growth ETF | Over $100,000 | Over $100,000 | |||
| iShares Core High Dividend ETF | Over $100,000 | |||||
| iShares Core MSCI Emerging Markets ETF | Over $100,000 |
| Name of Director | Fund | Dollar
Range of Equity Securities in the Fund |
Aggregate
Dollar Range of Equity Securities in all Registered Investment Companies Overseen by Director in Family of Investment Companies | |||
| iShares Core S&P 500 ETF | Over $100,000 | |||||
| iShares iBoxx $ High Yield Corporate Bond ETF | Over $100,000 | |||||
| iShares iBoxx $ Investment Grade Corporate Bond ETF | Over $100,000 | |||||
| iShares Russell 2000 ETF | Over $100,000 | |||||
| iShares Select Dividend ETF | Over $100,000 | |||||
| Jane D. Carlin | iShares Core MSCI EAFE ETF | $50,001-$100,000 | Over $100,000 | |||
| iShares Core S&P Small-Cap ETF | $10,001-$50,000 | |||||
| iShares Global Tech ETF | $10,001-$50,000 |
| Name of Director | iShares
Currency Hedged MSCI Emerging Markets ETF |
iShares
Edge MSCI Min Vol EM Currency Hedged ETF2 | ||
| Independent Directors: | ||||
| Robert H. Silver1 | $38 | $1 | ||
| John E. Kerrigan | 65 | 2 | ||
| Charles A. Hurty | 68 | 2 | ||
| Cecilia H. Herbert | 70 | 2 | ||
| John E. Martinez | 65 | 2 | ||
| Madhav V. Rajan | 65 | 2 | ||
| Jane D. Carlin | 65 | 2 |
| Name of Director | iShares
Currency Hedged MSCI Emerging Markets ETF |
iShares
Edge MSCI Min Vol EM Currency Hedged ETF2 | ||
| Interested Directors: | ||||
| Robert S. Kapito | $0 | $0 | ||
| Mark K. Wiedman | 0 | 0 | ||
| Advisory Board Members: | ||||
| Drew E. Lawton3 | Not Applicable | Not Applicable | ||
| Richard L. Fagnani4 | Not Applicable | Not Applicable |
| Name of Director | Pension
or Retirement Benefits Accrued As Part of Company Expenses5 |
Estimated
Annual Benefits Upon Retirement5 |
Total
Compensation From the Funds and Fund Complex6 | |||
| Independent Directors: | ||||||
| Robert H. Silver1 | Not Applicable | Not Applicable | $ 350,000 | |||
| John E. Kerrigan | Not Applicable | Not Applicable | 315,000 | |||
| Charles A. Hurty | Not Applicable | Not Applicable | 340,000 | |||
| Cecilia H. Herbert | Not Applicable | Not Applicable | 341,764 | |||
| John E. Martinez | Not Applicable | Not Applicable | 326,764 | |||
| Madhav V. Rajan | Not Applicable | Not Applicable | 315,000 | |||
| Jane D. Carlin | Not Applicable | Not Applicable | 300,000 7 | |||
| Interested Directors: | ||||||
| Robert S. Kapito | Not Applicable | Not Applicable | $0 | |||
| Mark K. Wiedman | Not Applicable | Not Applicable | 0 | |||
| Advisory Board Members: | ||||||
| Drew E. Lawton3 | Not Applicable | Not Applicable | Not Applicable | |||
| Richard L. Fagnani4 | Not Applicable | Not Applicable | Not Applicable |
| 1 | Served as an Independent Director through March 31, 2016. |
| 2 | Compensation reported is from the Fund’s inception to August 31, 2016. |
| 3 | Compensation is not shown for Drew E. Lawton because he was appointed to serve as an Advisory Board Member effective October 18, 2016. |
| 4 | Compensation is not shown for Richard L. Fagnani because he was appointed to serve as an Advisory Board Member effective April 1, 2017. |
| 5 | No Director or officer is entitled to any pension or retirement benefits from the Company. |
| 6 | Includes compensation for service on the Boards of Trustees for iShares Trust and iShares U.S. ETF Trust and the Board of Directors of iShares MSCI Russia Capped ETF, Inc. |
| 7 | Total compensation is shown for Jane D. Carlin for the period from February 3, 2015 to December 31, 2015 because she was appointed to serve as an Independent Director of the Company effective February 3, 2015. |
| Fund | Name and Address | Percentage
of Ownership | ||
| iShares Currency Hedged MSCI Emerging Markets ETF | Charles
Schwab & Co., Inc. 111 Pavonia Avenue Jersey City, NJ 07310 |
27.30% | ||
| Citibank,
N.A. 3800 CitiBank Center Tampa Building A/Floor 2 Tampa, FL 33610 |
10.89% | |||
| Janney
Montgomery Scott LLC 26 Broadway New York, NY 10004 |
8.88% | |||
| National
Financial Services LLC 200 Liberty Street 5th Floor New York, NY 10281 |
8.05% | |||
| Merrill
Lynch, Pierce Fenner & Smith Safekeeping 101 Hudson Street 8th Floor Jersey City, NJ 07302 |
5.73% | |||
| TD
Ameritrade Clearing, Inc. 1005 N. Ameritrade Place Bellevue, NE 68005 |
5.08% | |||
| iShares Edge MSCI Min Vol EM Currency Hedged ETF | National
Financial Services LLC 200 Liberty Street 5th Floor New York, NY 10281 |
72.18% | ||
| J.P.
Morgan Clearing Corp One Metrotech Center North Brooklyn, NY 11201 |
10.74% | |||
| Merrill
Lynch, Pierce, Fenner & Smith Incorporated 101 Hudson Street 9th Floor Jersey City, NJ 07302-3997 |
6.39% |
| Fund | Management
Fee for the Fiscal Year Ended August 31, 2016 |
Fund
Inception Date |
Management
Fees Paid Net of Waivers for Fiscal Year Ended August 31, 2016 |
Management
Fees Paid Net of Waivers for Fiscal Year Ended August 31, 2015 |
Management
Fees Paid Net of Waivers for Fiscal Year Ended August 31, 2014 | ||||
| iShares Currency Hedged MSCI Emerging Markets ETF1 | 0.78% | 09/23/2014 | $ 0 | $12,299 | N/A | ||||
| iShares Edge MSCI Min Vol EM Currency Hedged ETF2 | 0.78% | 10/29/2015 | 1,096 | N/A | N/A |
| 1 | For the iShares Currency Hedged MSCI Emerging Markets ETF, BFA has contractually agreed to waive a portion of its management fees so that the Fund’s total annual fund operating expenses after fee waiver is equal to the Acquired Fund Fees and Expenses attributable to the Fund’s investment in the iShares MSCI Emerging Markets ETF (“EEM”), after taking into account any fee waivers by EEM through December 31, 2020. The contractual waiver may be terminated prior to December 31, 2020 only upon written agreement of the Company and BFA. For the fiscal years ended August 31, 2015 and August 31, 2016, BFA waived $617,304 and $1,557,249, respectively, of its management fees. |
| 2 | For the iShares Edge MSCI Min Vol EM Currency Hedged ETF, BFA has contractually agreed to waive a portion of its management fees so that the Fund’s total annual fund operating expenses after fee waiver is equal to the Acquired Fund Fees and Expenses attributable to the Fund’s investment in the iShares Edge MSCI Min Vol Emerging Markets ETF (“EEMV”), after taking into account any fee waivers by EEMV, plus 0.03% through December 31, 2020. The contractual waiver may be terminated prior to December 31, 2020 only upon written agreement of the Company and BFA. For the fiscal year ended August 31, 2016, BFA waived $27,449, of its management fees. |
| Diane Hsiung | ||||
| Types of Accounts | Number | Total Assets | ||
| Registered Investment Companies | 249 | $701,500,000,000 | ||
| Other Pooled Investment Vehicles | 15 | 3,975,000,000 | ||
| Other Accounts | 0 | N/A | ||
| Accounts with Incentive-Based Fee Arrangements | 0 | N/A |
| Jennifer Hsui | ||||
| Types of Accounts | Number | Total Assets | ||
| Registered Investment Companies | 265 | $722,313,000,000 |
| Jennifer Hsui | ||||
| Types of Accounts | Number | Total Assets | ||
| Other Pooled Investment Vehicles | 16 | 4,295,000,000 | ||
| Other Accounts | 0 | N/A | ||
| Accounts with Incentive-Based Fee Arrangements | 0 | N/A |
| Alan Mason | ||||
| Types of Accounts | Number | Total Assets | ||
| Registered Investment Companies | 361 | $785,829,000,000 | ||
| Other Pooled Investment Vehicles | 285 | 574,676,000,000 | ||
| Other Accounts | 185 | 39,352,000,000 | ||
| Accounts with Incentive-Based Fee Arrangements | 0 | N/A |
| Orlando Montalvo | ||||
| Types of Accounts | Number | Total Assets | ||
| Registered Investment Companies | 87 | $218,053,000,000 | ||
| Other Pooled Investment Vehicles | 7 | 3,179,000,000 | ||
| Other Accounts | 9 | 5,247,000,000 | ||
| Accounts with Incentive-Based Fee Arrangements | 0 | N/A |
| Greg Savage | ||||
| Types of Accounts | Number | Total Assets | ||
| Registered Investment Companies | 334 | $778,995,000,000 | ||
| Other Pooled Investment Vehicles | 75 | 26,632,000,000 | ||
| Other Accounts | 0 | N/A | ||
| Accounts with Incentive-Based Fee Arrangements | 0 | N/A |
| Diane Hsiung | ||||
| Types of Accounts | Number
of Other Accounts with Performance Fees Managed by Portfolio Manager |
Aggregate
of Total Assets | ||
| Registered Investment Companies | 0 | N/A | ||
| Other Pooled Investment Vehicles | 0 | N/A | ||
| Other Accounts | 0 | N/A |
| Jennifer Hsui | ||||
| Types of Accounts | Number
of Other Accounts with Performance Fees Managed by Portfolio Manager |
Aggregate
of Total Assets | ||
| Registered Investment Companies | 0 | N/A | ||
| Other Pooled Investment Vehicles | 0 | N/A | ||
| Other Accounts | 0 | N/A |
| Alan Mason | ||||
| Types of Accounts | Number
of Other Accounts with Performance Fees Managed by Portfolio Manager |
Aggregate
of Total Assets | ||
| Registered Investment Companies | 0 | N/A | ||
| Other Pooled Investment Vehicles | 0 | N/A | ||
| Other Accounts | 0 | N/A |
| Orlando Montalvo | ||||
| Types of Accounts | Number
of Other Accounts with Performance Fees Managed by Portfolio Manager |
Aggregate
of Total Assets | ||
| Registered Investment Companies | 0 | N/A | ||
| Other Pooled Investment Vehicles | 0 | N/A | ||
| Other Accounts | 0 | N/A |
| Greg Savage | ||||
| Types of Accounts | Number
of Other Accounts with Performance Fees Managed by Portfolio Manager |
Aggregate
of Total Assets | ||
| Registered Investment Companies | 0 | N/A | ||
| Other Pooled Investment Vehicles | 0 | N/A | ||
| Other Accounts | 0 | N/A |
| Fund | Fund
Inception Date |
Administration,
Custodian, Transfer Agency Expenses Paid During Fiscal Year Ended August 31, 2016 |
Administration,
Custodian, Transfer Agency Expenses Paid During Fiscal Year Ended August 31, 2015 |
Administration,
Custodian, Transfer Agency Expenses Paid During Fiscal Year Ended August 31, 2014 | |||
| iShares Currency Hedged MSCI Emerging Markets ETF | 09/23/2014 | $16,194 | $9,084 | N/A | |||
| iShares Edge MSCI Min Vol EM Currency Hedged ETF | 10/29/2015 | 5,436 | N/A | N/A |
| Fund | Fund
Inception Date |
Distributor
Compensation Paid During Fiscal Year Ended August 31, 2016 |
Distributor
Compensation Paid During Fiscal Year Ended August 31, 20151 |
Distributor
Compensation Paid During Fiscal Year Ended August 31, 2014 | ||||
| iShares Currency Hedged MSCI Emerging Markets ETF | 09/23/2014 | $0 | $ 0 | N/A | ||||
| iShares Edge MSCI Min Vol EM Currency Hedged ETF | 10/29/2015 | 0 | N/A | N/A |
| 1 | These fees reflect payments made to SEI, acting as an agent of the Distributor. |
| Fund | Fund
Inception Date |
Brokerage
Commissions Paid During Fiscal Year Ended August 31, 2016 |
Brokerage
Commissions Paid During Fiscal Year Ended August 31, 2015 |
Brokerage
Commissions Paid During Fiscal Year Ended August 31, 2014 | |||
| iShares Currency Hedged MSCI Emerging Markets ETF | 09/23/2014 | $ 10,532 | $3,253 | N/A | |||
| iShares Edge MSCI Min Vol EM Currency Hedged ETF | 10/29/2015 | 99 | N/A | N/A |
| Fund | Fiscal
Year ended August 31, 2016 |
Fiscal
Year ended August 31, 2015 | ||
| iShares Currency Hedged MSCI Emerging Markets ETF | 11% | 7% | ||
| iShares Edge MSCI Min Vol EM Currency Hedged ETF | 8% | N/A |
| Fund | Shares
Per Creation Unit |
Value
Per Creation Unit (U.S.$) | ||
| iShares Currency Hedged MSCI Emerging Markets ETF | 50,000 | $1,101,000 | ||
| iShares Edge MSCI Min Vol EM Currency Hedged ETF | 50,000 | 1,244,000 |
| Fund | Standard
Creation Transaction Fee |
Maximum
Additional Charge* | ||
| iShares Currency Hedged MSCI Emerging Markets ETF | $500 | 3.0% | ||
| iShares Edge MSCI Min Vol EM Currency Hedged ETF | 500 | 3.0% |
| * | As a percentage of the net asset value per Creation Unit. |
| Fund | Standard
Redemption Transaction Fee |
Maximum
Additional Charge* | ||
| iShares Currency Hedged MSCI Emerging Markets ETF | $500 | 2.0% | ||
| iShares Edge MSCI Min Vol EM Currency Hedged ETF | 500 | 2.0% |
| * | As a percentage of the net asset value per Creation Unit, inclusive of the standard redemption transaction fee. |
| Fund | Non-Expiring 1 | |
| iShares Edge MSCI Min Vol EM Currency Hedged ETF | $3,704 |
| 1 | Must be utilized prior to losses subject to expiration. |
| 1 | iShares MSCI ACWI Low Carbon Target ETF, iShares MSCI All Peru Capped ETF, iShares MSCI EAFE ESG Optimized ETF, iShares MSCI EM ESG Optimized ETF, iShares MSCI Global Impact ETF, iShares MSCI KLD 400 Social ETF and iShares MSCI USA ESG Select ETF have separate Fund Proxy Voting Policies. |
| • | Boards and directors |
| • | Auditors and audit-related issues |
| • | Capital structure, mergers, asset sales and other special transactions |
| • | Remuneration and benefits |
| • | Social, ethical and environmental issues |
| • | General corporate governance matters |
| • | establishing an appropriate corporate governance structure; |
| • | supporting and overseeing management in setting strategy; |
| • | ensuring the integrity of financial statements; |
| • | making decisions regarding mergers, acquisitions and disposals; |
| • | establishing appropriate executive compensation structures; and |
| • | addressing business issues including social, ethical and environmental issues when they have the potential to materially impact company reputation and performance. |
| • | current employment at the company or a subsidiary; |
| • | former employment within the past several years as an executive of the company; |
| • | providing substantial professional services to the company and/or members of the company’s management; |
| • | having had a substantial business relationship in the past three years; |
| • | having, or representing a shareholder with, a substantial shareholding in the company; |
| • | being an immediate family member of any of the aforementioned; and |
| • | interlocking directorships. |
| • | BlackRock has adopted a proxy voting oversight structure whereby the Corporate Governance Committees oversee the voting decisions and other activities of the Corporate Governance Group, and particularly its activities with respect to voting in the relevant region of each Corporate Governance Committee’s jurisdiction. |
| • | The Corporate Governance Committees have adopted Guidelines for each region, which set forth the firm’s views with respect to certain corporate governance and other issues that typically arise in the proxy voting context. The Corporate Governance Committees receive periodic reports regarding the specific votes cast by the Corporate Governance Group and regular updates on material process issues, procedural changes and other matters of concern to the Corporate Governance Committees. |
| • | BlackRock’s Global Corporate Governance Oversight Committee oversees the Global Head, the Corporate Governance Group and the Corporate Governance Committees. The Global Corporate Governance Oversight Committee conducts a review, at least annually, of the proxy voting process to ensure compliance with BlackRock’s risk policies and procedures. |
| • | BlackRock maintains a reporting structure that separates the Global Head and Corporate Governance Group from employees with sales responsibilities. In addition, BlackRock maintains procedures intended to ensure that all engagements with corporate issuers or dissident shareholders are managed consistently and without regard to BlackRock’s relationship with the issuer of the proxy or dissident shareholder. Within the normal course of business, the Global Head or Corporate Governance Group may engage directly with BlackRock clients, and with employees with sales responsibilities, in discussions regarding general corporate governance policy matters, and to otherwise ensure that proxy-related client service levels are met. The Global Head or Corporate Governance Group does not discuss any specific voting matter with a client prior to the disclosure of the vote decision to all applicable clients after the shareholder meeting has taken place, except if the client is acting in the capacity as issuer of the proxy or dissident shareholder and is engaging through the established procedures independent of the client relationship. |
| • | In certain instances, BlackRock may determine to engage an independent fiduciary to vote proxies as a further safeguard to avoid potential conflicts of interest or as otherwise required by applicable law. The independent fiduciary may either vote such proxies or provide BlackRock with instructions as to how to vote such proxies. In the latter case, BlackRock votes the proxy in accordance with the independent fiduciary’s determination. Use of an independent fiduciary has been |
| adopted for voting the proxies related to any company that is affiliated with BlackRock or any company that includes BlackRock employees on its board of directors. |
| 2016 | ||||||
| Country | Trade
Date |
Settlement
Date |
Number
of Days to Settle | |||
| Australia | 03/22/16 | 03/30/16 | 8 | |||
| 12/20/16 | 12/29/16 | 9 | ||||
| 12/21/16 | 01/03/17 | 12 | ||||
| 12/22/16 | 01/04/17 | 13 | ||||
| Bahrain | 09/07/16 | 09/15/16 | 8 | |||
| 09/08/16 | 09/18/16 | 10 | ||||
| Bangladesh | 06/29/16 | 07/10/16 | 11 | |||
| 09/06/16 | 09/15/16 | 9 | ||||
| 09/07/16 | 09/18/16 | 11 | ||||
| 09/08/16 | 09/19/16 | 11 | ||||
| Brazil | 02/03/16 | 02/11/16 | 8 | |||
| 02/04/16 | 02/12/16 | 8 | ||||
| 02/05/16 | 02/15/16 | 10 | ||||
| China | 02/03/16 | 02/17/16 | 14 | |||
| 02/04/16 | 02/18/16 | 14 | ||||
| 02/05/16 | 02/19/16 | 14 | ||||
| 04/27/16 | 05/09/16 | 12 | ||||
| 04/28/16 | 05/10/16 | 12 | ||||
| 04/29/16 | 05/11/16 | 12 | ||||
| 09/28/16 | 10/11/16 | 13 | ||||
| 09/29/16 | 10/12/16 | 13 | ||||
| 09/30/16 | 10/13/16 | 13 | ||||
| Colombia | 03/18/16 | 03/28/16 | 10 | |||
| Costa Rica | 12/21/16 | 01/02/17 | 12 | |||
| 12/22/16 | 01/03/17 | 12 | ||||
| 12/23/16 | 01/04/17 | 12 | ||||
| Ghana | 06/30/16 | 07/08/16 | 8 | |||
| Indonesia | 06/29/16 | 07/11/16 | 12 | |||
| 06/30/16 | 07/12/16 | 12 | ||||
| 2016 | ||||||
| Country | Trade
Date |
Settlement
Date |
Number
of Days to Settle | |||
| 07/01/16 | 07/13/16 | 12 | ||||
| Ireland | 12/21/16 | 12/29/16 | 8 | |||
| 12/22/16 | 01/03/17 | 12 | ||||
| Israel | 04/20/16 | 05/01/16 | 11 | |||
| 04/21/16 | 05/02/16 | 11 | ||||
| 10/10/16 | 10/25/16 | 15 | ||||
| 10/13/16 | 10/26/16 | 13 | ||||
| Japan | 04/27/16 | 05/06/16 | 9 | |||
| 04/28/16 | 05/09/16 | 11 | ||||
| 05/02/16 | 05/10/16 | 8 | ||||
| Jordan | 06/30/16 | 07/11/16 | 11 | |||
| 07/03/16 | 07/12/16 | 9 | ||||
| 09/07/16 | 09/18/16 | 11 | ||||
| 09/08/16 | 09/19/16 | 11 | ||||
| Kuwait | 09/06/16 | 09/15/16 | 9 | |||
| 09/07/16 | 09/18/16 | 11 | ||||
| Lebanon | 07/01/16 | 7/11/16 | 10 | |||
| 07/04/16 | 7/12/16 | 8 | ||||
| 07/05/16 | 7/13/16 | 8 | ||||
| Malawi | 01/08/16 | 01/18/16 | 10 | |||
| 01/11/16 | 01/19/16 | 8 | ||||
| 01/12/16 | 01/20/16 | 8 | ||||
| 01/13/16 | 01/21/16 | 8 | ||||
| 01/14/16 | 01/22/16 | 8 | ||||
| 02/25/16 | 03/04/16 | 8 | ||||
| 02/26/16 | 03/07/16 | 10 | ||||
| 02/29/16 | 03/08/16 | 8 | ||||
| 03/01/16 | 03/09/16 | 8 | ||||
| 03/02/16 | 03/10/16 | 8 | ||||
| 03/18/16 | 03/29/16 | 11 | ||||
| 03/21/16 | 03/30/16 | 9 | ||||
| 03/22/16 | 03/31/16 | 9 | ||||
| 03/23/16 | 04/01/16 | 9 | ||||
| 03/24/16 | 04/04/16 | 11 | ||||
| 04/25/16 | 05/03/16 | 8 | ||||
| 04/26/16 | 05/04/16 | 8 | ||||
| 04/27/16 | 05/05/16 | 8 | ||||
| 04/28/16 | 05/06/16 | 8 | ||||
| 04/29/16 | 05/09/16 | 10 | ||||
| 06/07/16 | 06/15/16 | 8 | ||||
| 06/08/16 | 06/16/16 | 8 | ||||
| 06/09/16 | 06/17/16 | 8 | ||||
| 06/10/16 | 06/20/16 | 10 | ||||
| 2016 | ||||||
| Country | Trade
Date |
Settlement
Date |
Number
of Days to Settle | |||
| 06/13/16 | 06/21/16 | 8 | ||||
| 06/29/16 | 07/08/16 | 10 | ||||
| 06/30/16 | 07/11/16 | 11 | ||||
| 07/01/16 | 07/12/16 | 11 | ||||
| 07/04/16 | 07/13/16 | 9 | ||||
| 07/05/16 | 07/14/16 | 9 | ||||
| 12/19/16 | 12/27/16 | 8 | ||||
| 12/20/16 | 12/28/16 | 8 | ||||
| 12/21/16 | 12/29/16 | 8 | ||||
| 12/22/16 | 12/30/16 | 8 | ||||
| 12/23/16 | 01/03/17 | 11 | ||||
| 12/27/16 | 01/04/17 | 8 | ||||
| 12/28/16 | 01/05/17 | 8 | ||||
| 12/29/16 | 01/06/17 | 8 | ||||
| 12/30/16 | 01/09/17 | 10 | ||||
| Malaysia | 07/01/16 | 07/11/16 | 10 | |||
| 07/04/16 | 07/12/16 | 8 | ||||
| 07/05/16 | 07/13/16 | 8 | ||||
| Mexico | 03/18/16 | 03/28/16 | 10 | |||
| Morocco | 09/07/16 | 09/15/16 | 8 | |||
| 09/08/16 | 09/16/16 | 8 | ||||
| 09/09/16 | 09/19/16 | 10 | ||||
| Namibia | 03/14/16 | 03/22/16 | 8 | |||
| 03/15/16 | 03/23/16 | 8 | ||||
| 03/16/16 | 03/24/16 | 8 | ||||
| 03/17/16 | 03/29/16 | 12 | ||||
| 03/18/16 | 03/30/16 | 12 | ||||
| 03/22/16 | 03/31/16 | 9 | ||||
| 03/23/16 | 04/01/16 | 9 | ||||
| 03/24/16 | 04/04/16 | 11 | ||||
| 04/20/16 | 04/28/16 | 8 | ||||
| 04/21/16 | 04/29/16 | 8 | ||||
| 04/22/16 | 05/03/16 | 11 | ||||
| 04/25/16 | 05/06/16 | 11 | ||||
| 04/26/16 | 05/09/16 | 13 | ||||
| 04/28/16 | 05/10/16 | 12 | ||||
| 04/29/16 | 05/11/16 | 12 | ||||
| 05/03/16 | 05/12/16 | 9 | ||||
| 05/18/16 | 05/26/16 | 8 | ||||
| 05/19/16 | 05/27/16 | 8 | ||||
| 05/20/16 | 05/30/16 | 10 | ||||
| 05/23/16 | 05/31/16 | 8 | ||||
| 05/24/16 | 06/01/16 | 8 | ||||
| 06/09/16 | 06/17/16 | 8 | ||||
| 06/10/16 | 06/20/16 | 10 | ||||
| 06/13/16 | 06/21/16 | 8 | ||||
| 2016 | ||||||
| Country | Trade
Date |
Settlement
Date |
Number
of Days to Settle | |||
| 06/14/16 | 06/22/16 | 8 | ||||
| 06/15/16 | 06/23/16 | 8 | ||||
| 08/02/16 | 08/10/16 | 8 | ||||
| 08/03/16 | 08/11/16 | 8 | ||||
| 08/04/16 | 08/12/16 | 8 | ||||
| 08/05/16 | 08/15/16 | 10 | ||||
| 08/08/16 | 08/16/16 | 8 | ||||
| 08/19/16 | 08/29/16 | 10 | ||||
| 08/22/16 | 08/30/16 | 8 | ||||
| 08/23/16 | 08/31/16 | 8 | ||||
| 08/24/16 | 09/01/16 | 8 | ||||
| 08/25/16 | 09/02/16 | 8 | ||||
| 12/09/16 | 12/19/16 | 10 | ||||
| 12/12/16 | 12/20/16 | 8 | ||||
| 12/13/16 | 12/21/16 | 8 | ||||
| 12/14/16 | 12/22/16 | 8 | ||||
| 12/15/16 | 12/23/16 | 8 | ||||
| 12/19/16 | 12/27/16 | 8 | ||||
| 12/20/16 | 12/28/16 | 8 | ||||
| 12/21/16 | 12/29/16 | 8 | ||||
| 12/22/16 | 12/30/16 | 8 | ||||
| 12/23/16 | 01/03/17 | 11 | ||||
| 12/27/16 | 01/04/17 | 8 | ||||
| 12/28/16 | 01/05/17 | 8 | ||||
| 12/29/16 | 01/06/17 | 8 | ||||
| 12/30/16 | 01/09/17 | 10 | ||||
| New Zealand | 03/21/16 | 03/29/16 | 8 | |||
| 03/22/16 | 03/30/16 | 8 | ||||
| 03/23/16 | 03/31/16 | 8 | ||||
| 12/20/16 | 12/28/16 | 8 | ||||
| 12/21/16 | 12/29/16 | 8 | ||||
| 12/22/16 | 01/04/17 | 13 | ||||
| 12/28/16 | 01/05/17 | 8 | ||||
| 12/29/16 | 01/06/17 | 8 | ||||
| Norway | 03/21/16 | 03/29/16 | 8 | |||
| 03/22/16 | 03/30/16 | 8 | ||||
| Oman | 070/3/16 | 07/11/16 | 8 | |||
| 07/04/16 | 07/12/16 | 8 | ||||
| 07/05/16 | 07/13/16 | 8 | ||||
| 09/06/16 | 09/15/16 | 9 | ||||
| 09/07/16 | 09/18/16 | 11 | ||||
| 09/08/16 | 09/19/16 | 11 | ||||
| Pakistan | 09/08/16 | 09/19/16 | 11 | |||
| 09/09/16 | 09/20/16 | 11 | ||||
| Palestine | 06/30/16 | 07/10/16 | 10 | |||
| 2016 | ||||||
| Country | Trade
Date |
Settlement
Date |
Number
of Days to Settle | |||
| 07/03/16 | 07/11/16 | 8 | ||||
| 07/04/16 | 07/12/16 | 8 | ||||
| 09/06/16 | 09/15/16 | 9 | ||||
| 09/07/16 | 09/18/16 | 11 | ||||
| 09/08/16 | 09/19/16 | 11 | ||||
| The Philippines | 10/26/16 | 11/03/16 | 8 | |||
| 10/27/16 | 11/04/16 | 8 | ||||
| 10/28/16 | 11/07/16 | 10 | ||||
| Qatar | 07/03/16 | 07/12/16 | 9 | |||
| 07/04/16 | 07/13/16 | 9 | ||||
| 07/05/16 | 07/14/16 | 9 | ||||
| 09/06/16 | 09/18/16 | 12 | ||||
| 09/07/16 | 09/19/16 | 12 | ||||
| 09/08/16 | 09/20/16 | 12 | ||||
| Saudi Arabia | 06/30/16 | 07/12/16 | 12 | |||
| 07/03/16 | 07/13/16 | 10 | ||||
| 09/07/16 | 09/18/16 | 11 | ||||
| 09/08/16 | 09/19/16 | 11 | ||||
| Serbia | 04/26/16 | 05/04/16 | 8 | |||
| 04/27/16 | 05/05/16 | 8 | ||||
| 04/28/16 | 05/06/16 | 8 | ||||
| The Slovak Republic | 12/22/16 | 01/02/17 | 11 | |||
| 12/23/16 | 01/03/17 | 11 | ||||
| South Africa | 03/14/16 | 03/22/16 | 8 | |||
| 03/15/16 | 03/23/16 | 8 | ||||
| 03/16/16 | 03/24/16 | 8 | ||||
| 03/17/16 | 03/29/16 | 12 | ||||
| 03/18/16 | 03/30/16 | 12 | ||||
| 03/22/16 | 03/31/16 | 9 | ||||
| 03/23/16 | 04/01/16 | 9 | ||||
| 03/24/16 | 04/04/16 | 11 | ||||
| 04/20/16 | 04/28/16 | 8 | ||||
| 04/21/16 | 04/29/16 | 8 | ||||
| 04/22/16 | 05/03/16 | 11 | ||||
| 04/25/16 | 05/04/16 | 9 | ||||
| 04/26/16 | 05/05/16 | 9 | ||||
| 04/28/16 | 05/06/16 | 8 | ||||
| 04/29/16 | 05/09/16 | 10 | ||||
| 06/09/16 | 06/17/16 | 8 | ||||
| 06/10/16 | 06/20/16 | 10 | ||||
| 06/13/16 | 06/21/16 | 8 | ||||
| 06/14/16 | 06/22/16 | 8 | ||||
| 06/15/16 | 06/23/16 | 8 | ||||
| 08/02/16 | 08/10/16 | 8 | ||||
| 2016 | ||||||
| Country | Trade
Date |
Settlement
Date |
Number
of Days to Settle | |||
| 08/03/16 | 08/11/16 | 8 | ||||
| 08/04/16 | 08/12/16 | 8 | ||||
| 08/05/16 | 08/15/16 | 10 | ||||
| 08/08/16 | 08/16/16 | 8 | ||||
| 12/09/16 | 12/19/16 | 10 | ||||
| 12/12/16 | 12/20/16 | 8 | ||||
| 12/13/16 | 12/21/16 | 8 | ||||
| 12/14/16 | 12/22/16 | 8 | ||||
| 12/15/16 | 12/28/16 | 13 | ||||
| 12/16/16 | 12/28/16 | 12 | ||||
| 12/19/16 | 12/29/16 | 10 | ||||
| 12/20/16 | 01/02/17 | 13 | ||||
| 12/21/16 | 01/03/17 | 13 | ||||
| 12/22/16 | 01/04/17 | 13 | ||||
| 12/28/16 | 01/05/17 | 8 | ||||
| 12/29/16 | 01/06/17 | 8 | ||||
| Srpska | 01/04/16 | 01/12/16 | 8 | |||
| 01/05/16 | 01/13/16 | 8 | ||||
| Swaziland | 03/18/16 | 03/29/16 | 11 | |||
| 03/21/16 | 03/30/16 | 9 | ||||
| 03/22/16 | 03/31/16 | 9 | ||||
| 03/23/16 | 04/01/16 | 9 | ||||
| 03/24/16 | 04/04/16 | 11 | ||||
| 04/12/16 | 04/20/16 | 8 | ||||
| 04/13/16 | 04/21/16 | 8 | ||||
| 04/14/16 | 04/22/16 | 8 | ||||
| 04/15/16 | 04/26/16 | 11 | ||||
| 04/18/16 | 04/27/16 | 9 | ||||
| 04/20/16 | 04/28/16 | 8 | ||||
| 04/21/16 | 04/29/16 | 8 | ||||
| 04/22/16 | 05/02/16 | 10 | ||||
| 04/28/16 | 05/06/16 | 8 | ||||
| 04/29/16 | 05/09/16 | 10 | ||||
| 05/02/16 | 05/10/16 | 8 | ||||
| 05/03/16 | 05/11/16 | 8 | ||||
| 05/04/16 | 05/12/16 | 8 | ||||
| 07/15/16 | 07/25/16 | 10 | ||||
| 07/18/16 | 07/26/16 | 8 | ||||
| 07/19/16 | 07/27/16 | 8 | ||||
| 07/20/16 | 07/28/16 | 8 | ||||
| 07/21/16 | 07/29/16 | 8 | ||||
| 08/30/16 | 09/07/16 | 8 | ||||
| 08/31/16 | 09/08/16 | 8 | ||||
| 09/01/16 | 09/09/16 | 8 | ||||
| 09/02/16 | 09/12/16 | 10 | ||||
| 09/05/16 | 09/13/16 | 8 | ||||
| 12/19/16 | 12/27/16 | 8 | ||||
| 12/20/16 | 12/28/16 | 8 | ||||
| 2016 | ||||||
| Country | Trade
Date |
Settlement
Date |
Number
of Days to Settle | |||
| 12/21/16 | 12/29/16 | 8 | ||||
| 12/22/16 | 12/30/16 | 8 | ||||
| 12/23/16 | 01/03/17 | 11 | ||||
| 12/27/16 | 01/04/17 | 8 | ||||
| 12/28/16 | 01/05/17 | 8 | ||||
| 12/29/16 | 01/06/17 | 8 | ||||
| 12/30/16 | 01/09/17 | 10 | ||||
| Taiwan | 02/02/16 | 02/15/16 | 13 | |||
| 02/03/16 | 02/16/16 | 13 | ||||
| Thailand | 04/08/16 | 04/18/16 | 10 | |||
| 04/11/16 | 04/19/16 | 8 | ||||
| 04/12/16 | 04/20/16 | 8 | ||||
| 04/29/16 | 05/09/16 | 10 | ||||
| Trinidad and Tobago | 03/23/16 | 03/31/16 | 8 | |||
| 03/24/16 | 04/01/16 | 8 | ||||
| Tunisia | 06/30/16 | 07/08/16 | 8 | |||
| 07/01/16 | 07/11/16 | 10 | ||||
| 07/04/16 | 07/12/16 | 8 | ||||
| Turkey | 06/30/16 | 07/11/16 | 11 | |||
| 07/01/16 | 07/12/16 | 11 | ||||
| 09/08/16 | 09/19/16 | 11 | ||||
| 09/09/16 | 09/20/16 | 11 | ||||
| Uganda | 01/19/16 | 01/27/16 | 8 | |||
| 01/20/16 | 01/28/16 | 8 | ||||
| 01/21/16 | 01/29/16 | 8 | ||||
| 01/22/16 | 02/01/16 | 10 | ||||
| 01/25/16 | 02/02/16 | 8 | ||||
| 02/09/16 | 02/17/16 | 8 | ||||
| 02/10/16 | 02/18/16 | 8 | ||||
| 02/11/16 | 02/19/16 | 8 | ||||
| 02/12/16 | 02/22/16 | 10 | ||||
| 02/15/16 | 02/23/16 | 8 | ||||
| 03/01/16 | 03/09/16 | 8 | ||||
| 03/02/16 | 03/10/16 | 8 | ||||
| 03/03/16 | 03/11/16 | 8 | ||||
| 03/04/16 | 03/14/16 | 10 | ||||
| 03/07/16 | 03/15/16 | 8 | ||||
| 03/18/16 | 03/29/16 | 11 | ||||
| 03/21/16 | 03/30/16 | 9 | ||||
| 03/22/16 | 03/31/16 | 9 | ||||
| 03/23/16 | 04/01/16 | 9 | ||||
| 03/24/16 | 04/04/16 | 11 | ||||
| 05/27/16 | 06/06/16 | 10 | ||||
| 05/30/16 | 06/07/16 | 8 | ||||
| 2016 | ||||||
| Country | Trade
Date |
Settlement
Date |
Number
of Days to Settle | |||
| 05/31/16 | 06/08/16 | 8 | ||||
| 06/01/16 | 06/10/16 | 9 | ||||
| 06/02/16 | 06/13/16 | 11 | ||||
| 06/06/16 | 06/14/16 | 8 | ||||
| 06/07/16 | 06/15/16 | 8 | ||||
| 06/08/16 | 06/16/16 | 8 | ||||
| 12/19/16 | 12/27/16 | 8 | ||||
| 12/20/16 | 12/28/16 | 8 | ||||
| 12/21/16 | 12/29/16 | 8 | ||||
| 12/22/16 | 12/30/16 | 8 | ||||
| 12/23/16 | 01/03/17 | 11 | ||||
| 12/27/16 | 01/04/17 | 8 | ||||
| 12/28/16 | 01/05/17 | 8 | ||||
| 12/29/16 | 01/06/17 | 8 | ||||
| 12/30/16 | 01/09/17 | 10 | ||||
| Ukraine | 01/05/16 | 01/13/16 | 8 | |||
| The United Arab Emirates | 09/07/16 | 09/15/16 | 8 | |||
| 09/08/16 | 09/18/16 | 10 | ||||
| Vietnam | 02/03/16 | 02/15/16 | 12 | |||
| 02/04/16 | 02/16/16 | 12 | ||||
| 02/05/16 | 02/17/16 | 12 | ||||
| Zimbabwe | 03/18/16 | 03/29/16 | 11 | |||
| 03/21/16 | 03/30/16 | 9 | ||||
| 03/22/16 | 03/31/16 | 9 | ||||
| 03/23/16 | 04/01/16 | 9 | ||||
| 03/24/16 | 04/04/16 | 11 | ||||
| 04/11/16 | 04/19/16 | 8 | ||||
| 04/12/16 | 04/20/16 | 8 | ||||
| 04/13/16 | 04/21/16 | 8 | ||||
| 04/14/16 | 04/22/16 | 8 | ||||
| 04/15/16 | 04/25/16 | 10 | ||||
| 04/25/16 | 05/03/16 | 8 | ||||
| 04/26/16 | 05/04/16 | 8 | ||||
| 04/27/16 | 05/05/16 | 8 | ||||
| 04/28/16 | 05/06/16 | 8 | ||||
| 04/29/16 | 05/09/16 | 10 | ||||
| 05/18/16 | 05/26/16 | 8 | ||||
| 05/19/16 | 05/27/16 | 8 | ||||
| 05/20/16 | 05/30/16 | 10 | ||||
| 05/23/16 | 05/31/16 | 8 | ||||
| 05/24/16 | 06/01/16 | 8 | ||||
| 08/01/16 | 08/10/16 | 9 | ||||
| 08/02/16 | 08/11/16 | 9 | ||||
| 08/03/16 | 08/12/16 | 9 | ||||
| 08/04/16 | 08/15/16 | 11 | ||||
| 08/05/16 | 08/16/16 | 11 | ||||
| 2016 | ||||||
| Country | Trade
Date |
Settlement
Date |
Number
of Days to Settle | |||
| 12/15/16 | 12/23/16 | 8 | ||||
| 12/16/16 | 12/27/16 | 11 | ||||
| 12/19/16 | 12/28/16 | 9 | ||||
| 12/20/16 | 12/29/16 | 9 | ||||
| 12/21/16 | 12/30/16 | 9 | ||||
| 12/23/16 | 01/03/17 | 11 | ||||
| 12/27/16 | 01/04/17 | 8 | ||||
| 12/28/16 | 01/05/17 | 8 | ||||
| 12/29/16 | 01/06/17 | 8 | ||||
| 12/30/16 | 01/09/17 | 10 | ||||
| 2017 | ||||||
| Country | Trade
Date |
Settlement
Date |
Number
of Days to Settle | |||
| Australia | 04/11/17 | 04/19/17 | 8 | |||
| 04/12/17 | 04/20/17 | 8 | ||||
| 04/13/17 | 04/21/17 | 8 | ||||
| Bangladesh | 06/20/17 | 06/28/17 | 8 | |||
| 06/21/17 | 06/29/17 | 8 | ||||
| 06/22/17 | 07/02/17 | 10 | ||||
| Brazil | 02/22/17 | 03/02/17 | 8 | |||
| 02/23/17 | 03/03/17 | 8 | ||||
| 02/24/17 | 03/06/17 | 11 | ||||
| China | 01/24/17 | 02/03/17 | 10 | |||
| 01/25/17 | 02/06/17 | 12 | ||||
| 01/26/17 | 02/07/17 | 12 | ||||
| 09/27/17 | 10/09/17 | 12 | ||||
| 09/28/17 | 10/10/17 | 12 | ||||
| 09/29/17 | 10/11/17 | 12 | ||||
| Costa Rica | 04/07/17 | 04/17/17 | 10 | |||
| 04/10/17 | 04/18/17 | 8 | ||||
| Indonesia | 06/21/17 | 07/03/17 | 12 | |||
| 06/22/17 | 07/04/17 | 12 | ||||
| 06/23/17 | 07/05/17 | 12 | ||||
| Israel | 04/06/17 | 04/18/17 | 12 | |||
| 04/09/17 | 04/19/17 | 10 | ||||
| 10/02/17 | 10/15/17 | 13 | ||||
| 10/03/17 | 10/16/17 | 13 | ||||
| Japan | 04/28/17 | 05/08/17 | 10 | |||
| 05/01/17 | 05/09/17 | 8 | ||||
| 05/02/17 | 05/10/17 | 8 | ||||
| 2017 | ||||||
| Country | Trade
Date |
Settlement
Date |
Number
of Days to Settle | |||
| Jordan | 06/21/17 | 06/29/17 | 8 | |||
| 06/22/17 | 07/02/17 | 10 | ||||
| Malawi | 01/09/17 | 01/17/17 | 8 | |||
| 01/10/17 | 01/18/17 | 8 | ||||
| 01/11/17 | 01/19/17 | 8 | ||||
| 01/12/17 | 01/20/17 | 8 | ||||
| 01/13/17 | 01/23/17 | 10 | ||||
| 02/24/17 | 03/06/17 | 10 | ||||
| 02/27/17 | 03/07/17 | 8 | ||||
| 02/28/17 | 03/08/17 | 8 | ||||
| 03/01/17 | 03/09/17 | 8 | ||||
| 03/02/17 | 03/10/17 | 8 | ||||
| 04/07/17 | 04/18/17 | 11 | ||||
| 04/10/17 | 04/19/17 | 9 | ||||
| 04/11/17 | 04/20/17 | 9 | ||||
| 04/12/17 | 04/21/17 | 9 | ||||
| 04/13/17 | 04/24/17 | 11 | ||||
| 04/24/17 | 05/02/17 | 8 | ||||
| 04/25/17 | 05/03/17 | 8 | ||||
| 04/26/17 | 05/04/17 | 8 | ||||
| 04/27/17 | 05/05/17 | 8 | ||||
| 04/28/17 | 05/08/17 | 10 | ||||
| 05/08/17 | 05/16/17 | 8 | ||||
| 05/09/17 | 05/17/17 | 8 | ||||
| 05/10/17 | 05/18/17 | 8 | ||||
| 05/11/17 | 05/19/17 | 8 | ||||
| 05/12/17 | 05/22/17 | 10 | ||||
| 06/19/17 | 06/27/17 | 8 | ||||
| 06/20/17 | 06/28/17 | 8 | ||||
| 06/21/17 | 06/29/17 | 8 | ||||
| 06/22/17 | 06/30/17 | 8 | ||||
| 06/23/17 | 07/03/17 | 10 | ||||
| 06/29/17 | 07/07/17 | 8 | ||||
| 06/30/17 | 07/10/17 | 8 | ||||
| 07/03/17 | 07/11/17 | 8 | ||||
| 07/04/17 | 07/12/17 | 8 | ||||
| 07/05/17 | 07/13/17 | 8 | ||||
| 12/18/17 | 12/27/17 | 9 | ||||
| 12/19/17 | 12/28/17 | 9 | ||||
| 12/20/17 | 12/29/17 | 9 | ||||
| 12/21/17 | 01/02/18 | 12 | ||||
| 12/22/17 | 01/03/18 | 12 | ||||
| Malaysia | 01/24/17 | 02/01/17 | 8 | |||
| 01/25/17 | 02/02/17 | 8 | ||||
| 01/26/17 | 02/03/17 | 8 | ||||
| Namibia | 03/14/17 | 03/22/17 | 8 | |||
| 2017 | ||||||
| Country | Trade
Date |
Settlement
Date |
Number
of Days to Settle | |||
| 03/15/17 | 03/23/17 | 8 | ||||
| 03/16/17 | 03/24/17 | 8 | ||||
| 03/17/17 | 03/27/17 | 10 | ||||
| 03/20/17 | 03/28/17 | 8 | ||||
| 04/07/17 | 04/18/17 | 11 | ||||
| 04/10/17 | 04/19/17 | 9 | ||||
| 04/11/17 | 04/20/17 | 9 | ||||
| 04/12/17 | 04/21/17 | 9 | ||||
| 04/13/17 | 04/24/17 | 11 | ||||
| 04/20/17 | 04/28/17 | 8 | ||||
| 04/21/17 | 05/01/17 | 10 | ||||
| 04/24/17 | 05/02/17 | 8 | ||||
| 04/25/17 | 05/05/17 | 10 | ||||
| 04/26/17 | 05/08/17 | 12 | ||||
| 04/28/17 | 05/09/17 | 11 | ||||
| 05/02/17 | 05/10/17 | 8 | ||||
| 05/03/17 | 05/11/17 | 8 | ||||
| 05/18/17 | 05/26/17 | 8 | ||||
| 05/19/17 | 05/29/17 | 10 | ||||
| 05/22/17 | 05/30/17 | 8 | ||||
| 05/23/17 | 05/31/17 | 8 | ||||
| 05/24/17 | 06/01/17 | 8 | ||||
| 06/09/17 | 06/19/17 | 10 | ||||
| 06/12/17 | 06/20/17 | 8 | ||||
| 06/13/17 | 06/21/17 | 8 | ||||
| 06/14/17 | 06/22/17 | 8 | ||||
| 06/15/17 | 06/23/17 | 8 | ||||
| 08/02/17 | 08/10/17 | 8 | ||||
| 08/03/17 | 08/11/17 | 8 | ||||
| 08/04/17 | 08/14/17 | 10 | ||||
| 08/07/17 | 08/15/17 | 8 | ||||
| 08/08/17 | 08/16/17 | 8 | ||||
| 09/18/17 | 09/26/17 | 8 | ||||
| 09/19/17 | 09/27/17 | 8 | ||||
| 09/20/17 | 09/28/17 | 8 | ||||
| 09/21/17 | 09/29/17 | 8 | ||||
| 09/22/17 | 10/02/17 | 10 | ||||
| 12/04/17 | 12/12/17 | 8 | ||||
| 12/05/17 | 12/13/17 | 8 | ||||
| 12/06/17 | 12/14/17 | 8 | ||||
| 12/07/17 | 12/15/17 | 8 | ||||
| 12/08/17 | 12/18/17 | 10 | ||||
| 12/18/17 | 12/28/17 | 10 | ||||
| 12/19/17 | 12/29/17 | 10 | ||||
| 12/20/17 | 01/02/18 | 13 | ||||
| 12/21/17 | 01/03/18 | 13 | ||||
| 12/22/17 | 01/04/18 | 13 | ||||
| Norway | 04/10/17 | 04/18/17 | 8 | |||
| 04/11/17 | 04/19/17 | 8 | ||||
| 2017 | ||||||
| Country | Trade
Date |
Settlement
Date |
Number
of Days to Settle | |||
| Qatar | 06/20/17 | 06/28/17 | 8 | |||
| 06/21/17 | 06/29/17 | 8 | ||||
| 06/22/17 | 06/30/17 | 8 | ||||
| Saudi Arabia | 06/24/17 | 07/02/17 | 8 | |||
| 06/25/17 | 07/03/17 | 8 | ||||
| South Africa | 03/14/17 | 03/22/17 | 8 | |||
| 03/15/17 | 03/23/17 | 8 | ||||
| 03/16/17 | 03/24/17 | 8 | ||||
| 03/17/17 | 03/27/17 | 10 | ||||
| 03/20/17 | 03/28/17 | 8 | ||||
| 04/07/17 | 04/18/17 | 11 | ||||
| 04/10/17 | 04/19/17 | 9 | ||||
| 04/11/17 | 04/20/17 | 9 | ||||
| 04/12/17 | 04/21/17 | 9 | ||||
| 04/13/17 | 04/24/17 | 11 | ||||
| 04/20/17 | 04/28/17 | 8 | ||||
| 04/21/17 | 05/02/17 | 11 | ||||
| 04/24/17 | 05/03/17 | 9 | ||||
| 04/25/17 | 05/04/17 | 9 | ||||
| 04/26/17 | 05/05/17 | 9 | ||||
| 04/28/17 | 05/08/17 | 10 | ||||
| 06/09/17 | 06/19/17 | 10 | ||||
| 06/12/17 | 06/20/17 | 8 | ||||
| 06/13/17 | 06/21/17 | 8 | ||||
| 06/14/17 | 06/22/17 | 8 | ||||
| 06/15/17 | 06/23/17 | 8 | ||||
| 08/02/17 | 08/10/17 | 8 | ||||
| 08/03/17 | 08/11/17 | 8 | ||||
| 08/04/17 | 08/14/17 | 10 | ||||
| 08/07/17 | 08/15/17 | 8 | ||||
| 08/08/17 | 08/16/17 | 8 | ||||
| 09/18/17 | 09/26/17 | 8 | ||||
| 09/19/17 | 09/27/17 | 8 | ||||
| 09/20/17 | 09/28/17 | 8 | ||||
| 09/21/17 | 09/29/17 | 8 | ||||
| 09/22/17 | 10/02/17 | 10 | ||||
| 12/18/17 | 12/27/17 | 9 | ||||
| 12/19/17 | 12/28/17 | 9 | ||||
| 12/20/17 | 12/29/17 | 9 | ||||
| 12/21/17 | 01/03/18 | 13 | ||||
| 12/22/17 | 01/04/18 | 13 | ||||
| South Korea | 09/29/17 | 10/10/17 | 11 | |||
| 10/02/17 | 10/11/17 | 9 | ||||
| Sri Lanka | 04/07/17 | 04/17/17 | 10 | |||
| 2017 | ||||||
| Country | Trade
Date |
Settlement
Date |
Number
of Days to Settle | |||
| Swaziland | 04/07/17 | 04/18/17 | 11 | |||
| 04/10/17 | 04/20/17 | 10 | ||||
| 04/11/17 | 04/21/17 | 10 | ||||
| 04/12/17 | 04/24/17 | 12 | ||||
| 04/13/17 | 04/26/17 | 13 | ||||
| 04/18/17 | 04/27/17 | 9 | ||||
| 04/20/17 | 04/28/17 | 8 | ||||
| 04/21/17 | 05/02/17 | 11 | ||||
| 04/24/17 | 05/03/17 | 9 | ||||
| 04/26/17 | 05/04/17 | 8 | ||||
| 04/27/17 | 05/08/17 | 11 | ||||
| 04/28/17 | 05/09/17 | 11 | ||||
| 05/02/17 | 05/10/17 | 8 | ||||
| 05/03/17 | 05/11/17 | 8 | ||||
| 05/04/17 | 05/12/17 | 8 | ||||
| 08/30/17 | 09/07/17 | 8 | ||||
| 08/31/17 | 09/08/17 | 8 | ||||
| 09/01/17 | 09/11/17 | 10 | ||||
| 09/04/17 | 09/12/17 | 8 | ||||
| 09/05/17 | 09/13/17 | 8 | ||||
| 12/18/17 | 12/27/17 | 9 | ||||
| 12/19/17 | 12/28/17 | 9 | ||||
| 12/20/17 | 12/29/17 | 9 | ||||
| 12/21/17 | 01/02/18 | 12 | ||||
| 12/22/17 | 01/03/18 | 12 | ||||
| Taiwan | 01/23/17 | 02/02/17 | 10 | |||
| 01/24/17 | 02/03/17 | 10 | ||||
| Turkey | 08/28/17 | 09/05/17 | 8 | |||
| 08/29/17 | 09/06/17 | 8 | ||||
| Uganda | 01/19/17 | 01/27/17 | 8 | |||
| 01/20/17 | 01/30/17 | 10 | ||||
| 01/23/17 | 02/01/17 | 9 | ||||
| 01/24/17 | 02/02/17 | 9 | ||||
| 01/25/17 | 02/03/17 | 9 | ||||
| 02/09/17 | 02/17/17 | 8 | ||||
| 02/10/17 | 02/18/17 | 8 | ||||
| 02/13/17 | 02/21/17 | 8 | ||||
| 02/14/17 | 02/22/17 | 8 | ||||
| 02/15/17 | 02/23/17 | 8 | ||||
| 03/01/17 | 03/09/17 | 8 | ||||
| 03/02/17 | 03/10/17 | 8 | ||||
| 03/03/17 | 03/13/17 | 10 | ||||
| 03/06/17 | 03/14/17 | 8 | ||||
| 03/07/17 | 03/15/17 | 8 | ||||
| 04/07/17 | 04/18/17 | 11 | ||||
| 04/10/17 | 04/19/17 | 9 | ||||
| 04/11/17 | 04/20/17 | 9 | ||||
| 2017 | ||||||
| Country | Trade
Date |
Settlement
Date |
Number
of Days to Settle | |||
| 04/12/17 | 04/21/17 | 9 | ||||
| 04/13/17 | 04/24/17 | 11 | ||||
| 04/24/17 | 05/02/17 | 8 | ||||
| 04/25/17 | 05/03/17 | 8 | ||||
| 04/26/17 | 05/04/17 | 8 | ||||
| 04/27/17 | 05/05/17 | 8 | ||||
| 04/28/17 | 05/08/17 | 10 | ||||
| 06/02/17 | 06/12/17 | 10 | ||||
| 06/05/17 | 06/13/17 | 8 | ||||
| 06/06/17 | 06/14/17 | 8 | ||||
| 06/07/17 | 06/15/17 | 8 | ||||
| 06/08/17 | 06/16/17 | 8 | ||||
| 06/19/17 | 06/27/17 | 8 | ||||
| 06/20/17 | 06/28/17 | 8 | ||||
| 06/21/17 | 06/29/17 | 8 | ||||
| 06/22/17 | 06/30/17 | 8 | ||||
| 06/23/17 | 07/03/17 | 10 | ||||
| 06/30/17 | 07/10/17 | 10 | ||||
| 07/03/17 | 07/11/17 | 8 | ||||
| 07/04/17 | 07/12/17 | 8 | ||||
| 07/05/17 | 07/13/17 | 8 | ||||
| 07/06/17 | 07/14/17 | 8 | ||||
| 09/06/17 | 09/14/17 | 8 | ||||
| 09/07/17 | 09/15/17 | 8 | ||||
| 09/08/17 | 09/18/17 | 10 | ||||
| 09/11/17 | 09/19/17 | 8 | ||||
| 09/12/17 | 09/20/17 | 8 | ||||
| 10/02/17 | 10/10/17 | 8 | ||||
| 10/03/17 | 10/11/17 | 8 | ||||
| 10/04/17 | 10/12/17 | 8 | ||||
| 10/05/17 | 10/13/17 | 8 | ||||
| 10/06/17 | 10/16/17 | 10 | ||||
| 11/23/17 | 12/01/17 | 8 | ||||
| 11/24/17 | 12/04/17 | 10 | ||||
| 11/27/17 | 12/05/17 | 8 | ||||
| 11/28/17 | 12/06/17 | 8 | ||||
| 11/29/17 | 12/07/17 | 8 | ||||
| 12/18/17 | 12/27/17 | 9 | ||||
| 12/19/17 | 12/28/17 | 9 | ||||
| 12/20/17 | 12/29/17 | 9 | ||||
| 12/21/17 | 01/02/18 | 12 | ||||
| 12/22/17 | 01/03/18 | 12 | ||||
| Uruguay | 04/10/17 | 04/18/17 | 8 | |||
| 04/11/17 | 04/19/17 | 8 | ||||
| 04/12/17 | 04/20/17 | 8 | ||||
| Vietnam | 01/23/17 | 02/02/17 | 10 | |||
| 01/24/17 | 02/03/17 | 10 | ||||
| 01/25/17 | 02/06/17 | 12 | ||||
| 2017 | ||||||
| Country | Trade
Date |
Settlement
Date |
Number
of Days to Settle | |||
| Zimbabwe | 04/07/17 | 04/19/17 | 12 | |||
| 04/10/17 | 04/20/17 | 10 | ||||
| 04/11/17 | 04/21/17 | 10 | ||||
| 04/12/17 | 04/24/17 | 12 | ||||
| 04/13/17 | 04/25/17 | 12 | ||||
| 04/24/17 | 05/02/17 | 8 | ||||
| 04/25/17 | 05/03/17 | 8 | ||||
| 04/26/17 | 05/04/17 | 8 | ||||
| 04/27/17 | 05/05/17 | 8 | ||||
| 04/28/17 | 05/08/17 | 10 | ||||
| 05/18/17 | 05/26/17 | 8 | ||||
| 05/19/17 | 05/29/17 | 10 | ||||
| 05/22/17 | 05/30/17 | 8 | ||||
| 05/23/17 | 05/31/17 | 8 | ||||
| 05/24/17 | 06/01/17 | 8 | ||||
| 08/07/17 | 08/16/17 | 9 | ||||
| 08/08/17 | 08/17/17 | 9 | ||||
| 08/09/17 | 08/18/17 | 9 | ||||
| 08/10/17 | 08/21/17 | 11 | ||||
| 08/11/17 | 08/22/17 | 11 | ||||
| 12/15/17 | 12/27/17 | 12 | ||||
| 12/18/17 | 12/28/17 | 10 | ||||
| 12/19/17 | 12/29/17 | 10 | ||||
| 12/20/17 | 01/02/18 | 13 | ||||
| 12/21/17 | 01/03/18 | 13 | ||||
| * | These worst-case redemption cycles are based on information regarding regular holidays, which may be out of date. Based on changes in holidays, longer (worse) redemption cycles are possible. |
(as revised July 3, 2017)
| Funds | Ticker | Listing Exchange | ||
| iShares MSCI Australia ETF | EWA | NYSE Arca | ||
| iShares MSCI Austria Capped ETF | EWO | NYSE Arca | ||
| iShares MSCI Belgium Capped ETF | EWK | NYSE Arca | ||
| iShares MSCI Canada ETF | EWC | NYSE Arca | ||
| iShares MSCI Eurozone ETF | EZU | BATS | ||
| iShares MSCI France ETF | EWQ | NYSE Arca | ||
| iShares MSCI Germany ETF | EWG | NYSE Arca | ||
| iShares MSCI Global Gold Miners ETF | RING | NYSE Arca | ||
| iShares MSCI Global Silver Miners ETF | SLVP | NYSE Arca | ||
| iShares MSCI Hong Kong ETF | EWH | NYSE Arca | ||
| iShares MSCI Israel Capped ETF | EIS | NYSE Arca | ||
| iShares MSCI Italy Capped ETF | EWI | NYSE Arca | ||
| iShares MSCI Japan ETF | EWJ | NYSE Arca | ||
| iShares MSCI Japan Small-Cap ETF | SCJ | NYSE Arca | ||
| iShares MSCI Mexico Capped ETF | EWW | NYSE Arca | ||
| iShares MSCI Netherlands ETF | EWN | NYSE Arca | ||
| iShares MSCI Pacific ex Japan ETF | EPP | NYSE Arca | ||
| iShares MSCI Russia Capped ETF | ERUS | NYSE Arca | ||
| iShares MSCI Singapore Capped ETF | EWS | NYSE Arca | ||
| iShares MSCI South Africa ETF | EZA | NYSE Arca | ||
| iShares MSCI Spain Capped ETF | EWP | NYSE Arca | ||
| iShares MSCI Sweden Capped ETF | EWD | NYSE Arca | ||
| iShares MSCI Switzerland Capped ETF | EWL | NYSE Arca | ||
| iShares MSCI Thailand Capped ETF | THD | NYSE Arca | ||
| iShares MSCI Turkey ETF | TUR | NYSE Arca | ||
| iShares MSCI USA Equal Weighted ETF | EUSA | NYSE Arca | ||
| iShares MSCI World ETF | URTH | NYSE Arca |
| Current | New | |
| Underlying Index | MSCI South Africa Index | MSCI South Africa 25/50 Index |
| Current | New | |
| Underlying Index | MSCI Netherlands Investable Market Index | MSCI Netherlands IMI 25/50 Index |
| Current | New | |
| Underlying Index | MSCI Canada Index | MSCI Canada Custom Capped Index |
| • | iShares MSCI Australia ETF |
| • | iShares MSCI Austria Capped ETF |
| • | iShares MSCI Belgium Capped ETF |
| • | iShares MSCI Canada ETF |
| • | iShares MSCI Eurozone ETF |
| • | iShares MSCI France ETF |
| • | iShares MSCI Germany ETF |
| • | iShares MSCI Global Gold Miners ETF |
| • | iShares MSCI Global Silver Miners ETF |
| • | iShares MSCI Hong Kong ETF |
| • | iShares MSCI Israel Capped ETF |
| • | iShares MSCI Italy Capped ETF |
| • | iShares MSCI Japan ETF |
| • | iShares MSCI Japan Small-Cap ETF |
| • | iShares MSCI Mexico Capped ETF |
| • | iShares MSCI Netherlands ETF |
| • | iShares MSCI Pacific ex Japan ETF |
| • | iShares MSCI Russia Capped ETF1 |
| • | iShares MSCI Singapore Capped ETF2 |
| • | iShares MSCI South Africa ETF |
| • | iShares MSCI Spain Capped ETF |
| • | iShares MSCI Sweden Capped ETF3 |
| • | iShares MSCI Switzerland Capped ETF |
| • | iShares MSCI Thailand Capped ETF |
| • | iShares MSCI Turkey ETF |
| • | iShares MSCI USA Equal Weighted ETF |
| • | iShares MSCI World ETF |
| 1 | The iShares MSCI Russia Capped ETF previously operated as a series of iShares MSCI Russia Capped ETF, Inc. (the “Predecessor Fund”). Before the Fund commenced operations, all of the assets and liabilities of the Predecessor Fund were transferred to the Fund in a reorganization (the “Reorganization”), which was tax-free for U.S. federal income tax purposes. The Reorganization occurred on January 26, 2015. As a result of the Reorganization, the Fund assumed the performance and accounting history of the Predecessor Fund. A portion of the financial and performance information included in this SAI is that of the Predecessor Fund. |
| 2 | On December 1, 2016, the name of the Fund changed from iShares MSCI Singapore ETF to iShares MSCI Singapore Capped ETF, and the Fund’s Underlying Index changed from MSCI Singapore Index to MSCI Singapore 25/50 Index. |
| 3 | On December 1, 2016, the name of the Fund changed from iShares MSCI Sweden ETF to iShares MSCI Sweden Capped ETF, and the Fund’s Underlying Index changed from MSCI Sweden Index to MSCI Sweden 25/50 Index. |
| Diversified Funds | Non-Diversified Funds | |
| iShares MSCI Canada ETF | iShares MSCI Australia ETF | |
| iShares MSCI Eurozone ETF | iShares MSCI Austria Capped ETF | |
| iShares MSCI Japan ETF | iShares MSCI Belgium Capped ETF | |
| iShares MSCI Japan Small-Cap ETF | iShares MSCI France ETF | |
| iShares MSCI Pacific ex Japan ETF | iShares MSCI Germany ETF | |
| iShares MSCI USA Equal Weighted ETF | iShares MSCI Global Gold Miners ETF | |
| iShares MSCI World ETF | iShares MSCI Global Silver Miners ETF | |
| iShares MSCI Hong Kong ETF | ||
| iShares MSCI Israel Capped ETF | ||
| iShares MSCI Italy Capped ETF | ||
| iShares MSCI Mexico Capped ETF | ||
| iShares MSCI Netherlands ETF | ||
| iShares MSCI Russia Capped ETF | ||
| iShares MSCI Singapore Capped ETF | ||
| iShares MSCI South Africa ETF | ||
| iShares MSCI Spain Capped ETF | ||
| iShares MSCI Sweden Capped ETF | ||
| iShares MSCI Switzerland Capped ETF | ||
| iShares MSCI Thailand Capped ETF | ||
| iShares MSCI Turkey ETF |
| • | MSCI Global Standard Indexes cover all investable large- and mid-cap securities by including approximately 85% of each market's free float-adjusted market capitalization. |
| • | MSCI Global Small Cap Indexes provide coverage to all companies with a market capitalization below that of the companies in the MSCI Global Standard Indexes by including above and beyond the coverage of the MSCI Global Standard Indexes. |
| • | Achieving global size integrity by ensuring that companies of comparable and relevant sizes are included in a given size segment across all markets in a composite index; and |
| • | Achieving consistent market coverage by ensuring that each market's size segment is represented in its proportional weight in the composite universe. |
| • | Semi-Annual Index Reviews (“SAIRs”), conducted on a fixed semi-annual timetable that systematically reassess the various dimensions of the equity universe for all markets; |
| • | Quarterly Index Reviews (“QIRs”), aimed at promptly reflecting other significant market events; and |
| • | Ongoing event-related changes, such as mergers, acquisitions, spin-offs, bankruptcies, reorganizations and other similar corporate events, which generally are implemented in the indexes as they occur. |
| 1. | Lend any funds or other assets except through the purchase of all or a portion of an issue of securities or obligations of the type in which it is permitted to invest (including participation interests in such securities or obligations) and except that a Fund may lend its portfolio securities in an amount not to exceed 33 1/3% of the value of its total assets; |
| 2. | Issue senior securities or borrow money, except borrowings from banks for temporary or emergency purposes in an amount up to 33 1/3% of the value of the Fund’s total assets (including the amount borrowed), valued at the lesser of cost or market, less liabilities (not including the amount borrowed) valued at the time the borrowing is made, and the Fund will not purchase securities while borrowings in excess of 5% of the Fund’s total assets are outstanding, provided, that for purposes of this restriction, short-term credits necessary for the clearance of transactions are not considered borrowings; |
| 3. | Pledge, hypothecate, mortgage or otherwise encumber its assets, except to secure permitted borrowings. (The deposit of underlying securities and other assets in escrow and collateral arrangements with respect to initial or variation margin for currency transactions and futures contracts will not be deemed to be pledges of the Fund’s assets); |
| 4. | Purchase a security (other than obligations of the U.S. government, its agencies or instrumentalities) if as a result 25% or more of its total assets would be invested in a single issuer. (This restriction applies to the iShares MSCI Singapore Capped ETF only); |
| 5. | Purchase, hold or deal in real estate, or oil, gas or mineral interests or leases, but a Fund may purchase and sell securities that are issued by companies that invest or deal in such assets; |
| 6. | Act as an underwriter of securities of other issuers, except to the extent the Fund may be deemed an underwriter in connection with the sale of securities in its portfolio; |
| 7. | Purchase securities on margin, except for such short-term credits as are necessary for the clearance of transactions, except that a Fund may make margin deposits in connection with transactions in currencies, options, futures and options on futures; |
| 8. | Sell securities short; or |
| 9. | Invest in commodities or commodity contracts, except that a Fund may buy and sell currencies and forward contracts with respect thereto, and may transact in futures contracts on securities, stock indices and currencies and options on such futures contracts and make margin deposits in connection with such contracts. |
| 1. | Make loans, except as permitted under the 1940 Act, as interpreted, modified or otherwise permitted by regulatory authority having jurisdiction, from time to time; |
| 2. | Issue any senior security, except as permitted under the 1940 Act, as interpreted, modified or otherwise permitted by regulatory authority having jurisdiction, from time to time; |
| 3. | Pledge, hypothecate, mortgage or otherwise encumber its assets, except to secure permitted borrowings. (The deposit of underlying securities and other assets in escrow and collateral arrangements with respect to initial or variation margin for currency transactions and futures contracts will not be deemed to be pledges of the Fund’s assets); |
| 4. | Purchase, hold or deal in real estate, or oil, gas or mineral interests or leases, but a Fund may purchase and sell securities that are issued by companies that invest or deal in such assets; |
| 5. | Act as an underwriter of securities of other issuers, except to the extent the Fund may be deemed an underwriter in connection with the sale of securities in its portfolio; |
| 6. | Purchase securities on margin, except for such short-term credits as are necessary for the clearance of transactions, except that a Fund may make margin deposits in connection with transactions in currencies, options, futures and options on futures; |
| 7. | Sell securities short; or |
| 8. | Invest in commodities or commodity contracts, except that a Fund may buy and sell currencies and forward contracts with respect thereto, and may transact in futures contracts on securities, stock indices and currencies and options on such futures contracts and make margin deposits in connection with such contracts. |
| 1. | Concentrate its investments (i.e., invest 25% or more of its total assets in the securities of a particular industry or group of industries), except that a Fund will concentrate to approximately the same extent that its Underlying Index concentrates in the securities of such particular industry or group of industries. For purposes of this limitation, securities of the U.S. government (including its agencies and instrumentalities), repurchase agreements collateralized by U.S. government securities, and securities of state or municipal governments and their political subdivisions are not considered to be issued by members of any industry; |
| 2. | Borrow money, except that (i) each Fund may borrow from banks for temporary or emergency (not leveraging) purposes, including the meeting of redemption requests which might otherwise require the untimely disposition of securities, and (ii) each Fund may, to the extent consistent with its investment policies, enter into repurchase agreements, reverse repurchase agreements, forward roll transactions and similar investment strategies and techniques. To the extent that it engages in transactions described in (i) and (ii), each Fund will be limited so that no more than 33 1/3% of the value of its total assets (including the amount borrowed) is derived from such transactions. Any borrowings which come to exceed this amount will be reduced in accordance with applicable law; |
| 3. | Issue any senior security, except as permitted under the 1940 Act, as interpreted, modified or otherwise permitted by regulatory authority having jurisdiction, from time to time; |
| 4. | Make loans, except as permitted under the 1940 Act, as interpreted, modified or otherwise permitted by regulatory authority having jurisdiction, from time to time; |
| 5. | Purchase or sell real estate unless acquired as a result of ownership of securities or other investments (but this restriction shall not prevent each Fund from investing in securities of companies engaged in the real estate business or securities or other instruments backed by real estate or mortgages), or commodities or commodity contracts (but this restriction shall not prevent each Fund from trading in futures contracts and options on futures contracts, including options on currencies to the extent consistent with each Fund's investment objectives and policies); or |
| 6. | Engage in the business of underwriting securities issued by other persons, except to the extent that each Fund may technically be deemed to be an underwriter under the 1933 Act, the disposing of portfolio securities. |
| 1. | Concentrate its investments (i.e., invest 25% or more of its total assets in the securities of a particular industry or group of industries), except that each Fund will concentrate to approximately the same extent that its Underlying Index concentrates in the securities of a particular industry or group of industries. For purposes of this limitation, securities of the U.S. government (including its agencies and instrumentalities), repurchase agreements collateralized by U.S. government securities, and securities of state or municipal governments and their political subdivisions are not considered to be issued by members of any industry. |
| 2. | Borrow money, except that (i) each Fund may borrow from banks for temporary or emergency (not leveraging) purposes, including the meeting of redemption requests which might otherwise require the untimely disposition of securities, and (ii) each Fund may, to the extent consistent with its investment policies, enter into repurchase agreements, reverse repurchase agreements, forward roll transactions and similar investment strategies and techniques. To the extent that it engages in transactions described in (i) and (ii), each Fund will be limited so that no more than 33⅓% of the value of its total assets (including the amount borrowed) is derived from such transactions. Any borrowings which come to exceed this amount will be reduced in accordance with applicable law. |
| 3. | Issue any senior security, except as permitted under the 1940 Act, as interpreted, modified or otherwise permitted by any regulatory authority having jurisdiction, from time to time. |
| 4. | Make loans, except as permitted under the 1940 Act, as interpreted, modified or otherwise permitted by regulatory authority having jurisdiction, from time to time. |
| 5. | Purchase or sell real estate unless acquired as a result of ownership of securities or other instruments (but this restriction shall not prevent each Fund from investing in securities of companies engaged in the real estate business or securities or other instruments backed by real estate or mortgages), or commodities or commodity contracts (but this restriction shall not prevent each Fund from investing in securities of companies engaged in the production, ownership or distribution of commodities or in commodity-related businesses or from trading in futures contracts and options on futures contracts, including options on currencies to the extent consistent with each Fund’s investment objective and policies). |
| 6. | Engage in the business of underwriting securities issued by other persons, except to the extent that each Fund may technically be deemed to be an underwriter under the Securities Act, in disposing of portfolio securities. |
| Fund | Industry or Industries | |
| iShares MSCI Singapore ETF | Banks |
| Fund | Industry or Industries | |
| iShares MSCI Australia ETF | Banks | |
| iShares MSCI Canada ETF | Banks | |
| iShares MSCI Global Gold Miners ETF | Mining | |
| iShares MSCI Global Silver Miners ETF | Mining | |
| iShares MSCI Pacific ex Japan ETF | Banks | |
| iShares MSCI Russia Capped ETF | Oil & Gas | |
| iShares MSCI Spain Capped ETF | Banks | |
| iShares MSCI Switzerland Capped ETF | Pharmaceuticals | |
| iShares MSCI Turkey ETF | Banks |
| • | The frequency of trades and quotes for the security; |
| • | The number of dealers wishing to purchase or sell the security and the number of other potential purchasers; |
| • | Dealer undertakings to make a market in the security; and |
| • | The nature of the security and the nature of the marketplace in which it trades (e.g., the time needed to dispose of the security, the method of soliciting offers and the mechanics of transfer). |
| 1. | Invest in the securities of a company for the purpose of exercising management or control, or in any event purchase and hold more than 10% of the securities of a single issuer, provided that the Company may vote the investment securities owned by each Fund in accordance with its views; or |
| 2. | Hold illiquid assets in excess of 15% of its net assets. An illiquid asset is any asset which may not be sold or disposed of in the ordinary course of business within seven days at approximately the value at which the Fund has valued the investment. |
| 1. | The frequency of trades and quotes for the security; |
| 2. | The number of dealers wishing to purchase or sell the security and the number of other potential purchasers; |
| 3. | Dealer undertakings to make a market in the security; and |
| 4. | The nature of the security and the nature of the marketplace in which it trades (e.g., the time needed to dispose of the security, the method of soliciting offers and the mechanics of transfer). |
| Name (Age) | Position | Principal
Occupation(s) During the Past 5 Years |
Other
Directorships Held by Director | |||
| Robert
S. Kapito1 (59) |
Director
(since 2009). |
President, BlackRock, Inc. (since 2006); Vice Chairman of BlackRock, Inc. and Head of BlackRock’s Portfolio Management Group (since its formation in 1998) and BlackRock, Inc.’s predecessor entities (since 1988); Trustee, University of Pennsylvania (since 2009); President of Board of Directors, Hope & Heroes Children’s Cancer Fund (since 2002). | Director of BlackRock, Inc. (since 2006); Trustee of iShares Trust (since 2009); Trustee of iShares U.S. ETF Trust (since 2011). |
| Name (Age) | Position | Principal
Occupation(s) During the Past 5 Years |
Other
Directorships Held by Director | |||
| Mark
K. Wiedman2 (46) |
Director (since 2013). | Senior Managing Director, BlackRock, Inc. (since 2014); Managing Director, BlackRock, Inc. (2007-2014); Global Head of BlackRock’s ETF and Index Investments Business (since 2016); Global Head of iShares (2011-2016); Head of Corporate Strategy, BlackRock, Inc. (2009-2011). | Trustee of iShares Trust (since 2013); Trustee of iShares U.S. ETF Trust (since 2013); Director of PennyMac Financial Services, Inc. (since 2008). |
| 1 | Robert S. Kapito is deemed to be an “interested person” (as defined in the 1940 Act) of the Company due to his affiliations with BlackRock, Inc. and its affiliates. |
| 2 | Mark K. Wiedman is deemed to be an “interested person” (as defined in the 1940 Act) of the Company due to his affiliations with BlackRock, Inc. and its affiliates. |
| Name (Age) | Position | Principal
Occupation(s) During the Past 5 Years |
Other
Directorships Held by Director | |||
| Cecilia
H. Herbert (68) |
Director
(since 2005); Independent Board Chair (since 2016). |
Trustee and Member of the Finance, Technology and Quality Committee of Stanford Health Care (since 2016); Trustee and Member of the Investment Committee, WNET, a New York public media company (since 2011); Chair (1994-2005) and Member (since 1992) of the Investment Committee, Archdiocese of San Francisco; Director (1998-2013) and President (2007-2011) of the Board of Directors, Catholic Charities CYO; Trustee (2002-2011) and Chair of the Finance and Investment Committee (2006-2010) of the Thacher School. | Trustee of iShares Trust (since 2005); Trustee of iShares U.S. ETF Trust (since 2011); Independent Board Chair of iShares Trust and iShares U.S. ETF Trust (since 2016); Trustee of Forward Funds (14 portfolios) (since 2009); Trustee of Salient MF Trust (4 portfolios) (since 2015). | |||
| Jane
D. Carlin (60) |
Director
(since 2015); Risk Committee Chair (since 2016). |
Consultant (since 2012); Managing Director and Global Head of Financial Holding Company Governance & Assurance and the Global Head of Operational Risk Management of Morgan Stanley (2006-2012). | Trustee of iShares Trust (since 2015); Trustee of iShares U.S. ETF Trust (since 2015); Director of PHH Corporation (mortgage solutions) (since 2012); Director of The Hanover Insurance Group, Inc. (since 2016). | |||
| Richard
L. Fagnani (62) |
Director
(since 2017); Equity Plus Committee Chair (since 2017). |
Partner, KPMG LLP (2002-2016). | Trustee of iShares Trust (since 2017); Trustee of iShares U.S. ETF Trust (since 2017). |
| Name (Age) | Position | Principal
Occupation(s) During the Past 5 Years |
Other
Directorships Held by Director | |||
| Charles
A. Hurty (73) |
Director
(since 2005); Audit Committee Chair (since 2006). |
Retired; Partner, KPMG LLP (1968-2001). | Trustee of iShares Trust (since 2005); Trustee of iShares U.S. ETF Trust (since 2011); Director of SkyBridge Alternative Investments Multi-Adviser Hedge Fund Portfolios LLC (2 portfolios) (since 2002). | |||
| John
E. Kerrigan (61) |
Director
(since 2005); Securities Lending Committee Chair (since 2016). |
Chief Investment Officer, Santa Clara University (since 2002). | Trustee of iShares Trust (since 2005); Trustee of iShares U.S. ETF Trust (since 2011). | |||
| Drew
E. Lawton (58) |
Director
(since 2017); 15(c) Committee Chair (since 2017). |
Senior Managing Director of New York Life Insurance Company (2010-2015). | Trustee of iShares Trust (since 2017); Trustee of iShares U.S. ETF Trust (since 2017). | |||
| John
E. Martinez (56) |
Director
(since 2003); Fixed Income Plus Committee Chair (since 2016). |
Director of Real Estate Equity Exchange, Inc. (since 2005). | Trustee of iShares Trust (since 2003); Trustee of iShares U.S. ETF Trust (since 2011). | |||
| Madhav
V. Rajan (52) |
Director
(since 2011); Nominating and Governance Committee Chair (since 2017). |
Dean, and George Pratt Shultz Professor of Accounting, University of Chicago Booth School of Business (since 2017); Robert K. Jaedicke Professor of Accounting, Stanford University Graduate School of Business (2001-2017); Professor of Law (by courtesy), Stanford Law School (2005-2017); Senior Associate Dean for Academic Affairs and Head of MBA Program, Stanford University Graduate School of Business (2010-2016). | Trustee
of iShares Trust (since 2011); Trustee of iShares U.S. ETF Trust (since 2011); Director, Cavium, Inc. (since 2013). |
| Name (Age) | Position | Principal
Occupation(s) During the Past 5 Years | ||
| Martin
Small (41) |
President (since 2016). | Managing Director, BlackRock, Inc. (since 2010); Head of U.S. iShares (since 2015); Co-Head of the U.S. Financial Markets Advisory Group, BlackRock, Inc. (2008-2014). | ||
| Jack
Gee (57) |
Treasurer
and Chief Financial Officer (since 2008). |
Managing Director, BlackRock, Inc. (since 2009); Senior Director of Fund Administration of Intermediary Investor Business, BGI (2009). |
| Name (Age) | Position | Principal
Occupation(s) During the Past 5 Years | ||
| Charles
Park (49) |
Chief Compliance Officer (since 2006). | Chief Compliance Officer of BlackRock Advisors, LLC and the BlackRock-advised Funds in the Equity-Bond Complex, the Equity-Liquidity Complex and the Closed-End Complex (since 2014); Chief Compliance Officer of BFA (since 2006). | ||
| Benjamin
Archibald (42) |
Secretary (since 2015). | Managing Director, BlackRock, Inc. (since 2014); Director, BlackRock, Inc. (2010-2013); Secretary of the BlackRock-advised mutual funds (since 2012). | ||
| Steve
Messinger (55) |
Executive
Vice President (since 2016). |
Managing Director, BlackRock, Inc. (2007-2014 and since 2016); Managing Director, Beacon Consulting Group (2014-2016). | ||
| Scott
Radell (48) |
Executive
Vice President (since 2012). |
Managing Director, BlackRock, Inc. (since 2009); Head of Portfolio Solutions, BlackRock, Inc. (since 2009). | ||
| Alan
Mason (56) |
Executive
Vice President (since 2016). |
Managing Director, BlackRock, Inc. (since 2009). |
| Name of Director | Fund | Dollar
Range of Equity Securities in the Fund |
Aggregate
Dollar Range of Equity Securities in all Registered Investment Companies Overseen by Director in Family of Investment Companies | |||
| Robert S. Kapito | None | None | None | |||
| Mark Wiedman | iShares Core MSCI EAFE ETF | $50,001-$100,000 | Over $100,000 |
| Name of Director | Fund | Dollar
Range of Equity Securities in the Fund |
Aggregate
Dollar Range of Equity Securities in all Registered Investment Companies Overseen by Director in Family of Investment Companies | |||
| iShares Core MSCI Emerging Markets ETF | $50,001-$100,000 | |||||
| iShares Core S&P Total U.S. Stock Market ETF | Over $100,000 | |||||
| John E. Martinez | iShares Core MSCI Emerging Markets ETF | $50,001-$100,000 | Over $100,000 | |||
| iShares Core S&P 500 ETF | Over $100,000 | |||||
| iShares Core S&P Mid-Cap ETF | $10,001-$50,000 | |||||
| iShares Core S&P Small-Cap ETF | $10,001-$50,000 | |||||
| iShares Core S&P Total U.S. Stock Market ETF | $1-$10,000 | |||||
| iShares Global Consumer Staples ETF | Over $100,000 | |||||
| iShares MSCI All Country Asia ex Japan ETF | Over $100,000 | |||||
| iShares MSCI EAFE ETF | Over $100,000 | |||||
| iShares Russell 1000 ETF | Over $100,000 | |||||
| iShares Russell 1000 Value ETF | Over $100,000 | |||||
| iShares Russell 2000 ETF | Over $100,000 | |||||
| iShares TIPS Bond ETF | $50,001-$100,000 | |||||
| Cecilia H. Herbert | iShares China Large-Cap ETF | Over $100,000 | Over $100,000 | |||
| iShares Core Dividend Growth ETF | $10,001-$50,000 | |||||
| iShares Core High Dividend ETF | $1-$10,000 | |||||
| iShares Core MSCI Emerging Markets ETF | $10,001-$50,000 | |||||
| iShares Core MSCI Total International Stock ETF | $10,001-$50,000 | |||||
| iShares Core S&P Small-Cap ETF | $1-$10,000 | |||||
| iShares Core S&P Total U.S. Stock Market ETF | $10,001-$50,000 | |||||
| iShares Core S&P U.S. Growth ETF | $50,001-$100,000 | |||||
| iShares Core S&P U.S. Value ETF | $10,001-$50,000 | |||||
| iShares iBoxx $ High Yield Corporate Bond ETF | $10,001-$50,000 | |||||
| iShares International Select Dividend ETF | $1-$10,000 | |||||
| iShares MSCI EAFE ETF | $1-$10,000 | |||||
| iShares MSCI Emerging Markets ETF | $1-$10,000 | |||||
| iShares MSCI Japan ETF | $10,001-$50,000 | |||||
| iShares National Muni Bond ETF | $10,001-$50,000 | |||||
| iShares U.S. Preferred Stock ETF | $10,001-$50,000 | |||||
| Charles A. Hurty | iShares China Large-Cap ETF | $10,001-$50,000 | Over $100,000 | |||
| iShares Core Growth Allocation ETF | $50,001-$100,000 | |||||
| iShares Core High Dividend ETF | $10,001-$50,000 | |||||
| iShares Core Moderate Allocation ETF | $50,001-$100,000 |
| Name of Director | Fund | Dollar
Range of Equity Securities in the Fund |
Aggregate
Dollar Range of Equity Securities in all Registered Investment Companies Overseen by Director in Family of Investment Companies | |||
| iShares Core MSCI Emerging Markets ETF | $10,001-$50,000 | |||||
| iShares Core S&P 500 ETF | $10,001-$50,000 | |||||
| iShares Global Energy ETF | $10,001-$50,000 | |||||
| iShares Global Healthcare ETF | $10,001-$50,000 | |||||
| iShares Global Tech ETF | $10,001-$50,000 | |||||
| iShares MSCI EAFE ETF | $10,001-$50,000 | |||||
| iShares Russell 2000 ETF | $10,001-$50,000 | |||||
| iShares U.S. Basic Materials ETF | $10,001-$50,000 | |||||
| iShares U.S. Energy ETF | $10,001-$50,000 | |||||
| iShares U.S. Technology ETF | $50,001-$100,000 | |||||
| John E. Kerrigan | iShares MSCI ACWI ETF | $10,001-$50,000 | Over $100,000 | |||
| iShares MSCI ACWI ex U.S. ETF | Over $100,000 | |||||
| iShares Short-Term National Muni Bond ETF | Over $100,000 | |||||
| Madhav V. Rajan | iShares Core Dividend Growth ETF | Over $100,000 | Over $100,000 | |||
| iShares Core High Dividend ETF | Over $100,000 | |||||
| iShares Core MSCI Emerging Markets ETF | Over $100,000 | |||||
| iShares Core S&P 500 ETF | Over $100,000 | |||||
| iShares iBoxx $ High Yield Corporate Bond ETF | Over $100,000 | |||||
| iShares iBoxx $ Investment Grade Corporate Bond ETF | Over $100,000 | |||||
| iShares Russell 2000 ETF | Over $100,000 | |||||
| iShares Select Dividend ETF | Over $100,000 | |||||
| Jane D. Carlin | iShares Core MSCI EAFE ETF | $50,001-$100,000 | Over $100,000 | |||
| iShares Core S&P Small-Cap ETF | $10,001-$50,000 | |||||
| iShares Global Tech ETF | $10,001-$50,000 |
| Name of Director | iShares
MSCI Australia ETF |
iShares
MSCI Austria Capped ETF |
iShares
MSCI Belgium Capped ETF |
iShares
MSCI Canada ETF | ||||
| Independent Directors: | ||||||||
| Robert H. Silver1 | $ 349 | $ 13 | $28 | $651 | ||||
| John E. Martinez | 599 | 22 | 48 | 1,115 | ||||
| Cecilia H. Herbert | 645 | 24 | 51 | 1,201 | ||||
| Charles A. Hurty | 627 | 23 | 50 | 1,167 | ||||
| John E. Kerrigan | 599 | 22 | 48 | 1,115 | ||||
| Madhav V. Rajan | 599 | 22 | 48 | 1,115 | ||||
| Jane D. Carlin | 599 | 22 | 48 | 1,115 | ||||
| Interested Directors: | ||||||||
| Robert S. Kapito | $ 0 | $ 0 | $ 0 | $0 | ||||
| Mark K. Wiedman | 0 | 0 | 0 | 0 | ||||
| Advisory Board Members: | ||||||||
| Drew E. Lawton2 | Not Applicable | Not Applicable | Not Applicable | Not Applicable | ||||
| Richard L. Fagnani3 | Not Applicable | Not Applicable | Not Applicable | Not Applicable |
| Name of Director | iShares
MSCI Eurozone ETF |
iShares
MSCI France ETF |
iShares
MSCI Germany ETF |
iShares
MSCI Global Gold Miners ETF | ||||
| Independent Directors: | ||||||||
| Robert H. Silver1 | $ 1,462 | $ 69 | $ 653 | $56 | ||||
| John E. Martinez | 2,506 | 119 | 1,119 | 96 | ||||
| Cecilia H. Herbert | 2,699 | 128 | 1,205 | 104 | ||||
| Charles A. Hurty | 2,622 | 124 | 1,170 | 101 | ||||
| John E. Kerrigan | 2,506 | 119 | 1,119 | 96 | ||||
| Madhav V. Rajan | 2,506 | 119 | 1,119 | 96 | ||||
| Jane D. Carlin | 2,506 | 119 | 1,119 | 96 | ||||
| Interested Directors: | ||||||||
| Robert S. Kapito | $ 0 | $ 0 | $ 0 | $0 | ||||
| Mark K. Wiedman | 0 | 0 | 0 | 0 | ||||
| Advisory Board Members: |
| Name of Director | iShares
MSCI Eurozone ETF |
iShares
MSCI France ETF |
iShares
MSCI Germany ETF |
iShares
MSCI Global Gold Miners ETF | ||||
| Drew E. Lawton2 | Not Applicable | Not Applicable | Not Applicable | Not Applicable | ||||
| Richard L. Fagnani3 | Not Applicable | Not Applicable | Not Applicable | Not Applicable |
| Name of Director | iShares
MSCI Global Silver Miners ETF |
iShares
MSCI Hong Kong ETF |
iShares
MSCI Israel Capped ETF |
iShares
MSCI Italy Capped ETF | ||||
| Independent Directors: | ||||||||
| Robert H. Silver1 | $ 19 | $ 335 | $ 20 | $96 | ||||
| John E. Martinez | 32 | 574 | 34 | 164 | ||||
| Cecilia H. Herbert | 35 | 618 | 36 | 177 | ||||
| Charles A. Hurty | 34 | 600 | 35 | 172 | ||||
| John E. Kerrigan | 32 | 574 | 34 | 164 | ||||
| Madhav V. Rajan | 32 | 574 | 34 | 164 | ||||
| Jane D. Carlin | 32 | 574 | 34 | 164 | ||||
| Interested Directors: | ||||||||
| Robert S. Kapito | $ 0 | $ 0 | $ 0 | $0 | ||||
| Mark K. Wiedman | 0 | 0 | 0 | 0 | ||||
| Advisory Board Members: | ||||||||
| Drew E. Lawton2 | Not Applicable | Not Applicable | Not Applicable | Not Applicable | ||||
| Richard L. Fagnani3 | Not Applicable | Not Applicable | Not Applicable | Not Applicable |
| Name of Director | iShares
MSCI Japan ETF |
iShares
MSCI Japan Small-Cap ETF |
iShares
MSCI Mexico Capped ETF |
iShares
MSCI Netherlands ETF | ||||
| Independent Directors: | ||||||||
| Robert H. Silver1 | $2,848 | $ 35 | $277 | $39 | ||||
| John E. Martinez | 4,882 | 59 | 476 | 67 | ||||
| Cecilia H. Herbert | 5,258 | 64 | 512 | 72 | ||||
| Charles A. Hurty | 5,107 | 62 | 498 | 70 | ||||
| John E. Kerrigan | 4,882 | 59 | 476 | 67 | ||||
| Madhav V. Rajan | 4,882 | 59 | 476 | 67 | ||||
| Jane D. Carlin | 4,882 | 59 | 476 | 67 | ||||
| Interested Directors: | ||||||||
| Robert S. Kapito | $ 0 | $ 0 | $ 0 | $0 | ||||
| Mark K. Wiedman | 0 | 0 | 0 | 0 | ||||
| Advisory Board Members: | ||||||||
| Drew E. Lawton2 | Not Applicable | Not Applicable | Not Applicable | Not Applicable | ||||
| Richard L. Fagnani3 | Not Applicable | Not Applicable | Not Applicable | Not Applicable |
| Name of Director | iShares
MSCI Pacific ex Japan ETF |
iShares
MSCI Russia Capped ETF |
iShares
MSCI Singapore Capped ETF |
iShares
MSCI South Africa ETF | ||||
| Independent Directors: | ||||||||
| Robert H. Silver1 | $497 | $ 65 | $ 119 | $86 | ||||
| John E. Martinez | 852 | 112 | 203 | 147 | ||||
| Cecilia H. Herbert | 917 | 121 | 219 | 158 | ||||
| Charles A. Hurty | 891 | 117 | 213 | 154 | ||||
| John E. Kerrigan | 852 | 112 | 203 | 147 | ||||
| Madhav V. Rajan | 852 | 112 | 203 | 147 | ||||
| Jane D. Carlin | 852 | 112 | 203 | 147 | ||||
| Interested Directors: | ||||||||
| Robert S. Kapito | $ 0 | $ 0 | $ 0 | $0 | ||||
| Mark K. Wiedman | 0 | 0 | 0 | 0 | ||||
| Advisory Board Members: | ||||||||
| Drew E. Lawton2 | Not Applicable | Not Applicable | Not Applicable | Not Applicable | ||||
| Richard L. Fagnani3 | Not Applicable | Not Applicable | Not Applicable | Not Applicable |
| Name of Director | iShares
MSCI Spain Capped ETF |
iShares
MSCI Sweden Capped ETF |
iShares
MSCI Switzerland Capped ETF |
iShares
MSCI Thailand Capped ETF | ||||
| Independent Directors: | ||||||||
| Robert H. Silver1 | $ 123 | $ 60 | $229 | $95 | ||||
| John E. Martinez | 211 | 103 | 393 | 163 | ||||
| Cecilia H. Herbert | 227 | 111 | 423 | 176 | ||||
| Charles A. Hurty | 221 | 108 | 411 | 171 | ||||
| John E. Kerrigan | 211 | 103 | 393 | 163 | ||||
| Madhav V. Rajan | 211 | 103 | 393 | 163 | ||||
| Jane D. Carlin | 211 | 103 | 393 | 163 | ||||
| Interested Directors: | ||||||||
| Robert S. Kapito | $ 0 | $ 0 | $ 0 | $0 | ||||
| Mark K. Wiedman | 0 | 0 | 0 | 0 | ||||
| Advisory Board Members: | ||||||||
| Drew E. Lawton2 | Not Applicable | Not Applicable | Not Applicable | Not Applicable | ||||
| Richard L. Fagnani3 | Not Applicable | Not Applicable | Not Applicable | Not Applicable |
| Name of Director | iShares
MSCI Turkey ETF |
iShares
MSCI USA Equal Weighted ETF |
iShares
MSCI World ETF | |||
| Independent Directors: | ||||||
| Robert H. Silver1 | $ 78 | $ 16 | $61 | |||
| John E. Martinez | 133 | 27 | 104 | |||
| Cecilia H. Herbert | 143 | 29 | 112 | |||
| Charles A. Hurty | 139 | 28 | 109 |
| Name of Director | iShares
MSCI Turkey ETF |
iShares
MSCI USA Equal Weighted ETF |
iShares
MSCI World ETF | |||
| John E. Kerrigan | 133 | 27 | 104 | |||
| Madhav V. Rajan | 133 | 27 | 104 | |||
| Jane D. Carlin | 133 | 27 | 104 | |||
| Interested Directors: | ||||||
| Robert S. Kapito | $ 0 | $ 0 | $0 | |||
| Mark K. Wiedman | 0 | 0 | 0 | |||
| Advisory Board Members: | ||||||
| Drew E. Lawton2 | Not Applicable | Not Applicable | Not Applicable | |||
| Richard L. Fagnani3 | Not Applicable | Not Applicable | Not Applicable |
| Name of Director | Pension
or Retirement Benefits Accrued As Part of Company Expenses4 |
Estimated
Annual Benefits Upon Retirement4 |
Total
Compensation From the Funds and Fund Complex5 | |||
| Independent Directors: | ||||||
| Robert H. Silver1 | Not Applicable | Not Applicable | $350,000 | |||
| John E. Martinez | Not Applicable | Not Applicable | 326,764 | |||
| Cecilia H. Herbert | Not Applicable | Not Applicable | 341,764 | |||
| Charles A. Hurty | Not Applicable | Not Applicable | 340,000 | |||
| John E. Kerrigan | Not Applicable | Not Applicable | 315,000 | |||
| Madhav V. Rajan | Not Applicable | Not Applicable | 315,000 | |||
| Jane D. Carlin | Not Applicable | Not Applicable | 300,000 6 | |||
| Interested Directors: | ||||||
| Robert S. Kapito | Not Applicable | Not Applicable | $0 | |||
| Mark K. Wiedman | Not Applicable | Not Applicable | 0 | |||
| Advisory Board Members: | ||||||
| Drew E. Lawton2 | Not Applicable | Not Applicable | Not Applicable | |||
| Richard L. Fagnani3 | Not Applicable | Not Applicable | Not Applicable |
| 1 | Served as an Independent Director through March 31, 2016. |
| 2 | Compensation is not shown for Drew E. Lawton because he was appointed to serve as an Advisory Board Member effective October 18, 2016. |
| 3 | Compensation is not shown for Richard L. Fagnani because he was appointed to serve as an Advisory Board Member effective April 1, 2017. |
| 4 | No Director or officer is entitled to any pension or retirement benefits from the Company. |
| 5 | Includes compensation for service on the Boards of Trustees for iShares Trust and iShares U.S. ETF Trust and the Board of Directors of iShares MSCI Russia Capped ETF, Inc. |
| 6 | Total compensation is shown for Jane D. Carlin for the period from February 3, 2015 to December 31, 2015 because she was appointed to serve as an Independent Director of the Company effective February 3, 2015. |
| Fund | Name | Percentage
of Ownership | ||
| iShares MSCI Australia ETF | State
Street Bank and Trust Company 1776 Heritage Drive North Quincy, MA 02171 |
15.00% | ||
| Citibank,
N.A. 3800 CitiBank Center Tampa Building A/Floor 2 Tampa, FL 33610 |
7.98% | |||
| The
Bank of New York Mellon 401 Salina Street 2nd Floor Syracuse, NY 13202 |
7.89% | |||
| National
Financial Services LLC 200 Liberty Street 5th Floor New York, NY 10281 |
6.91% | |||
| Charles
Schwab & Co., Inc. 111 Pavonia Avenue Jersey City, NJ 07310 |
6.18% | |||
| iShares MSCI Austria Capped ETF | The
Bank of New York Mellon 401 Salina Street 2nd Floor Syracuse, NY 13202 |
9.77% | ||
| TD
Ameritrade Clearing, Inc. 1005 N. Ameritrade Place Bellevue, NE 68005 |
7.71% | |||
| CIBC
World Markets Inc./CDS 161 Bay Street 10th Floor Toronto ON Ontario M5J 258 CA |
7.53% | |||
| Mellon
Trust of New England, National Association Three Mellon Bank Center Floor 1533700 Pittsburgh, PA 15259 |
7.03% | |||
| Merrill
Lynch, Pierce Fenner & Smith Safekeeping 101 Hudson Street 8th Floor Jersey City, NJ 07302 |
6.69% |
| Fund | Name | Percentage
of Ownership | ||
| Charles
Schwab & Co., Inc. 111 Pavonia Avenue Jersey City, NJ 07310 |
5.90% | |||
| National
Financial Services LLC 200 Liberty Street 5th Floor New York, NY 10281 |
5.88% | |||
| Wells
Fargo Securities, LLC 8739 Research Drive Charlotte, NC 28262-0675 |
5.51% | |||
| iShares MSCI Belgium Capped ETF | State
Street Bank and Trust Company 1776 Heritage Drive North Quincy, MA 02171 |
15.90% | ||
| Brown
Brothers Harriman & Co. 525 Washington Blvd. 11th Floor Jersey City, NJ 07310 |
12.12% | |||
| National
Financial Services LLC 200 Liberty Street 5th Floor New York, NY 10281 |
10.82% | |||
| Morgan
Stanley Smith Barney LLC 1300 Thames Street 6th Floor Baltimore, MD 21231 |
10.29% | |||
| Charles
Schwab & Co., Inc. 111 Pavonia Avenue Jersey City, NJ 07310 |
6.14% | |||
| First
Clearing, LLC 901 East Byrd Street Richmond, VA 23219 |
5.71% | |||
| iShares MSCI Canada ETF | Northern
Trust Company (The) 801 South Canal Street Chicago, IL 60612 |
11.80% | ||
| BNP
Paribas, New York Branch/Custody Services 525 Washington BLVD. Jersey City, NJ 07310 |
9.36% | |||
| Citibank,
N.A. 3800 CitiBank Center Tampa Building A/Floor 2 Tampa, FL 33610 |
9.08% | |||
| The
Bank of New York Mellon 401 Salina Street 2nd Floor Syracuse, NY 13202 |
9.06% | |||
| State
Street Bank and Trust Company 1776 Heritage Drive North Quincy, MA 02171 |
8.51% |
| Fund | Name | Percentage
of Ownership | ||
| Brown
Brothers Harriman & Co. 525 Washington Blvd. 11th Floor Jersey City, NJ 07310 |
6.72% | |||
| Merrill
Lynch, Pierce Fenner & Smith Safekeeping 101 Hudson Street 8th Floor Jersey City, NJ 07302 |
5.93% | |||
| National
Financial Services LLC 200 Liberty Street 5th Floor New York, NY 10281 |
5.53% | |||
| iShares MSCI Eurozone ETF | Brown
Brothers Harriman & Co. 525 Washington Blvd. 11th Floor Jersey City, NJ 07310 |
18.00% | ||
| BlackRock
Institutional Trust Company, N.A. 400 Howard Street San Francisco, CA 94105 |
15.68% | |||
| Citibank,
N.A. 3800 CitiBank Center Tampa Building A/Floor 2 Tampa, FL 33610 |
13.73% | |||
| State
Street Bank and Trust Company 1776 Heritage Drive North Quincy, MA 02171 |
10.79% | |||
| The
Bank of New York Mellon 401 Salina Street 2nd Floor Syracuse, NY 13202 |
8.94% | |||
| Deutsche
Bank Securities Inc./Cedear 1251 Avenue of the Americas New York, NY 10020 |
6.63% | |||
| iShares MSCI France ETF | State
Street Bank and Trust Company 1776 Heritage Drive North Quincy, MA 02171 |
15.22% | ||
| Brown
Brothers Harriman & Co. 525 Washington Blvd. 11th Floor Jersey City, NJ 07310 |
9.24% | |||
| Citibank,
N.A. 3800 CitiBank Center Tampa Building A/Floor 2 Tampa, FL 33610 |
9.04% | |||
| Deutsche
Bank Securities Inc./Cedear 1251 Avenue of the Americas New York, NY 10020 |
8.60% |
| Fund | Name | Percentage
of Ownership | ||
| The
Bank of New York Mellon 401 Salina Street 2nd Floor Syracuse, NY 13202 |
8.24% | |||
| First
Clearing, LLC 901 East Byrd Street Richmond, VA 23219 |
6.62% | |||
| iShares MSCI Germany ETF | Brown
Brothers Harriman & Co. 525 Washington Blvd. 11th Floor Jersey City, NJ 07310 |
28.25% | ||
| BlackRock
Institutional Trust Company, N.A. 400 Howard Street San Francisco, CA 94105 |
11.56% | |||
| Citibank,
N.A. 3800 CitiBank Center Tampa Building A/Floor 2 Tampa, FL 33610 |
8.55% | |||
| Bank
of America NA/Client Assets 135 S LaSalle St Chicago, IL 60603 |
7.95% | |||
| State
Street Bank and Trust Company 1776 Heritage Drive North Quincy, MA 02171 |
6.64% | |||
| iShares MSCI Global Gold Miners ETF | State
Street Bank and Trust Company 1776 Heritage Drive North Quincy, MA 02171 |
38.76% | ||
| National
Financial Services LLC 200 Liberty Street 5th Floor New York, NY 10281 |
13.02% | |||
| Bank
of America NA/Client Assets 135 S LaSalle St Chicago, IL 60603 |
8.52% | |||
| iShares MSCI Global Silver Miners ETF | National
Financial Services LLC 200 Liberty Street 5th Floor New York, NY 10281 |
27.99% | ||
| Charles
Schwab & Co., Inc. 111 Pavonia Avenue Jersey City, NJ 07310 |
8.55% | |||
| Goldman,
Sachs & Co. 30 Hudson Street 16th Floor Jersey City, NJ 07302 |
6.95% |
| Fund | Name | Percentage
of Ownership | ||
| Citibank,
N.A. 3800 CitiBank Center Tampa Building A/Floor 2 Tampa, FL 33610 |
6.29% | |||
| TD
Ameritrade Clearing, Inc. 1005 N. Ameritrade Place Bellevue, NE 68005 |
5.16% | |||
| iShares MSCI Hong Kong ETF | Charles
Schwab & Co., Inc. 111 Pavonia Avenue Jersey City, NJ 07310 |
20.97% | ||
| Brown
Brothers Harriman & Co. 525 Washington Blvd. 11th Floor Jersey City, NJ 07310 |
12.37% | |||
| Bank
of America NA/Client Assets 135 S LaSalle St Chicago, IL 60603 |
11.36% | |||
| The
Bank of New York Mellon 401 Salina Street 2nd Floor Syracuse, NY 13202 |
6.80% | |||
| iShares MSCI Israel Capped ETF | Charles
Schwab & Co., Inc. 111 Pavonia Avenue Jersey City, NJ 07310 |
12.00% | ||
| National
Financial Services LLC 200 Liberty Street 5th Floor New York, NY 10281 |
8.96% | |||
| BNP
Paribas, New York Branch/Custody Services 525 Washington BLVD. Jersey City, NJ 07310 |
8.24% | |||
| Brown
Brothers Harriman & Co. 525 Washington Blvd. 11th Floor Jersey City, NJ 07310 |
8.00% | |||
| Morgan
Stanley Smith Barney LLC 1300 Thames Street 6th Floor Baltimore, MD 21231 |
5.68% | |||
| The
Bank of New York Mellon 401 Salina Street 2nd Floor Syracuse, NY 13202 |
5.02% | |||
| iShares MSCI Italy Capped ETF | State
Street Bank and Trust Company 1776 Heritage Drive North Quincy, MA 02171 |
26.83% |
| Fund | Name | Percentage
of Ownership | ||
| Brown
Brothers Harriman & Co. 525 Washington Blvd. 11th Floor Jersey City, NJ 07310 |
14.68% | |||
| Northern
Trust Company (The) 801 South Canal Street Chicago, IL 60612 |
7.78% | |||
| Citibank,
N.A. 3800 CitiBank Center Tampa Building A/Floor 2 Tampa, FL 33610 |
6.56% | |||
| The
Bank of New York Mellon 401 Salina Street 2nd Floor Syracuse, NY 13202 |
5.37% | |||
| Charles
Schwab & Co., Inc. 111 Pavonia Avenue Jersey City, NJ 07310 |
5.09% | |||
| iShares MSCI Japan ETF | Brown
Brothers Harriman & Co. 525 Washington Blvd. 11th Floor Jersey City, NJ 07310 |
18.73% | ||
| Citibank,
N.A. 3800 CitiBank Center Tampa Building A/Floor 2 Tampa, FL 33610 |
11.56% | |||
| State
Street Bank and Trust Company 1776 Heritage Drive North Quincy, MA 02171 |
10.12% | |||
| JPMorgan
Chase Bank, National Association 14201 Dallas Pkwy 12th Floor Dallas, TX 75240 |
8.38% | |||
| Morgan
Stanley Smith Barney LLC 1300 Thames Street 6th Floor Baltimore, MD 21231 |
6.36% | |||
| The
Bank of New York Mellon 401 Salina Street 2nd Floor Syracuse, NY 13202 |
6.24% | |||
| iShares MSCI Japan Small-Cap ETF | Morgan
Stanley Smith Barney LLC 1300 Thames Street 6th Floor Baltimore, MD 21231 |
12.09% | ||
| The
Bank of New York Mellon 401 Salina Street 2nd Floor Syracuse, NY 13202 |
8.55% |
| Fund | Name | Percentage
of Ownership | ||
| JPMorgan
Chase Bank, National Association 14201 Dallas Pkwy 12th Floor Dallas, TX 75240 |
8.49% | |||
| Brown
Brothers Harriman & Co. 525 Washington Blvd. 11th Floor Jersey City, NJ 07310 |
8.04% | |||
| Citibank,
N.A. 3800 CitiBank Center Tampa Building A/Floor 2 Tampa, FL 33610 |
7.85% | |||
| Charles
Schwab & Co., Inc. 111 Pavonia Avenue Jersey City, NJ 07310 |
7.77% | |||
| State
Street Bank and Trust Company 1776 Heritage Drive North Quincy, MA 02171 |
6.49% | |||
| iShares MSCI Mexico Capped ETF | Brown
Brothers Harriman & Co. 525 Washington Blvd. 11th Floor Jersey City, NJ 07310 |
11.98% | ||
| Northern
Trust Company (The) 801 South Canal Street Chicago, IL 60612 |
10.13% | |||
| Merrill
Lynch, Pierce, Fenner & Smith Incorporated 101 Hudson Street 9th Floor Jersey City, NJ 07302-3997 |
7.62% | |||
| The
Bank of New York Mellon 401 Salina Street 2nd Floor Syracuse, NY 13202 |
6.62% | |||
| Citibank,
N.A. 3800 CitiBank Center Tampa Building A/Floor 2 Tampa, FL 33610 |
5.60% | |||
| Charles
Schwab & Co., Inc. 111 Pavonia Avenue Jersey City, NJ 07310 |
5.01% | |||
| iShares MSCI Netherlands ETF | State
Street Bank and Trust Company 1776 Heritage Drive North Quincy, MA 02171 |
22.78% | ||
| Mellon
Trust of New England, National Association Three Mellon Bank Center Floor 1533700 Pittsburgh, PA 15259 |
20.17% |
| Fund | Name | Percentage
of Ownership | ||
| Brown
Brothers Harriman & Co. 525 Washington Blvd. 11th Floor Jersey City, NJ 07310 |
5.02% | |||
| iShares MSCI Pacific ex Japan ETF | Merrill
Lynch, Pierce Fenner & Smith Safekeeping 101 Hudson Street 8th Floor Jersey City, NJ 07302 |
18.33% | ||
| Citibank,
N.A. 3800 CitiBank Center Tampa Building A/Floor 2 Tampa, FL 33610 |
10.19% | |||
| State
Street Bank and Trust Company 1776 Heritage Drive North Quincy, MA 02171 |
7.19% | |||
| Charles
Schwab & Co., Inc. 111 Pavonia Avenue Jersey City, NJ 07310 |
7.15% | |||
| National
Financial Services LLC 200 Liberty Street 5th Floor New York, NY 10281 |
5.53% | |||
| iShares MSCI Russia Capped ETF | State
Street Bank and Trust Company 1776 Heritage Drive North Quincy, MA 02171 |
16.93% | ||
| JPMorgan
Chase Bank, National Association 14201 Dallas Pkwy 12th Floor Dallas, TX 75240 |
16.50% | |||
| Deutsche
Bank Securities Inc./Cedear 1251 Avenue of the Americas New York, NY 10020 |
7.86% | |||
| Citibank,
N.A. 3800 CitiBank Center Tampa Building A/Floor 2 Tampa, FL 33610 |
6.43% | |||
| Brown
Brothers Harriman & Co. 525 Washington Blvd. 11th Floor Jersey City, NJ 07310 |
6.18% | |||
| iShares MSCI Singapore Capped ETF | Citibank,
N.A. 3800 CitiBank Center Tampa Building A/Floor 2 Tampa, FL 33610 |
10.31% | ||
| Charles
Schwab & Co., Inc. 111 Pavonia Avenue Jersey City, NJ 07310 |
9.92% |
| Fund | Name | Percentage
of Ownership | ||
| National
Financial Services LLC 200 Liberty Street 5th Floor New York, NY 10281 |
8.36% | |||
| First
Clearing, LLC 901 East Byrd Street Richmond, VA 23219 |
7.99% | |||
| iShares MSCI South Africa ETF | State
Street Bank and Trust Company 1776 Heritage Drive North Quincy, MA 02171 |
44.96% | ||
| The
Bank of New York Mellon 401 Salina Street 2nd Floor Syracuse, NY 13202 |
8.26% | |||
| Brown
Brothers Harriman & Co. 525 Washington Blvd. 11th Floor Jersey City, NJ 07310 |
7.77% | |||
| iShares MSCI Spain Capped ETF | Brown
Brothers Harriman & Co. 525 Washington Blvd. 11th Floor Jersey City, NJ 07310 |
12.18% | ||
| State
Street Bank and Trust Company 1776 Heritage Drive North Quincy, MA 02171 |
10.15% | |||
| Citibank,
N.A. 3800 CitiBank Center Tampa Building A/Floor 2 Tampa, FL 33610 |
7.68% | |||
| First
Clearing, LLC 901 East Byrd Street Richmond, VA 23219 |
6.75% | |||
| Deutsche
Bank Securities Inc./Cedear 1251 Avenue of the Americas New York, NY 10020 |
6.71% | |||
| National
Financial Services LLC 200 Liberty Street 5th Floor New York, NY 10281 |
5.91% | |||
| Charles
Schwab & Co., Inc. 111 Pavonia Avenue Jersey City, NJ 07310 |
5.26% | |||
| iShares MSCI Sweden Capped ETF | Merrill
Lynch, Pierce Fenner & Smith Safekeeping 101 Hudson Street 8th Floor Jersey City, NJ 07302 |
25.21% |
| Fund | Name | Percentage
of Ownership | ||
| Brown
Brothers Harriman & Co. 525 Washington Blvd. 11th Floor Jersey City, NJ 07310 |
9.37% | |||
| Citibank,
N.A. 3800 CitiBank Center Tampa Building A/Floor 2 Tampa, FL 33610 |
5.76% | |||
| Charles
Schwab & Co., Inc. 111 Pavonia Avenue Jersey City, NJ 07310 |
5.35% | |||
| iShares MSCI Switzerland Capped ETF | Merrill
Lynch, Pierce Fenner & Smith Safekeeping 101 Hudson Street 8th Floor Jersey City, NJ 07302 |
22.94% | ||
| State
Street Bank and Trust Company 1776 Heritage Drive North Quincy, MA 02171 |
9.97% | |||
| Citibank,
N.A. 3800 CitiBank Center Tampa Building A/Floor 2 Tampa, FL 33610 |
9.28% | |||
| National
Financial Services LLC 200 Liberty Street 5th Floor New York, NY 10281 |
8.79% | |||
| Charles
Schwab & Co., Inc. 111 Pavonia Avenue Jersey City, NJ 07310 |
6.86% | |||
| Brown
Brothers Harriman & Co. 525 Washington Blvd. 11th Floor Jersey City, NJ 07310 |
5.89% | |||
| iShares MSCI Thailand Capped ETF | Northern
Trust Company/ United Nations Joint Staff Pension Fund 50 South LaSalle Street Chicago, IL 60675 |
21.35% | ||
| State
Street Bank and Trust Company 1776 Heritage Drive North Quincy, MA 02171 |
16.28% | |||
| Citibank,
N.A. 3800 CitiBank Center Tampa Building A/Floor 2 Tampa, FL 33610 |
5.93% |
| Fund | Name | Percentage
of Ownership | ||
| Mellon
Trust of New England, National Association Three Mellon Bank Center Floor 1533700 Pittsburgh, PA 15259 |
5.23% | |||
| iShares MSCI Turkey ETF | State
Street Bank and Trust Company 1776 Heritage Drive North Quincy, MA 02171 |
12.26% | ||
| JPMorgan
Chase Bank, National Association 14201 Dallas Pkwy 12th Floor Dallas, TX 75240 |
9.01% | |||
| Citibank,
N.A. 3800 CitiBank Center Tampa Building A/Floor 2 Tampa, FL 33610 |
7.99% | |||
| The
Bank of New York Mellon 401 Salina Street 2nd Floor Syracuse, NY 13202 |
7.88% | |||
| Brown
Brothers Harriman & Co. 525 Washington Blvd. 11th Floor Jersey City, NJ 07310 |
7.48% | |||
| National
Financial Services LLC 200 Liberty Street 5th Floor New York, NY 10281 |
6.76% | |||
| Goldman,
Sachs & Co. 30 Hudson Street 16th Floor Jersey City, NJ 07302 |
5.59% | |||
| Charles
Schwab & Co., Inc. 111 Pavonia Avenue Jersey City, NJ 07310 |
5.29% | |||
| iShares MSCI USA Equal Weighted ETF | National
Financial Services LLC 200 Liberty Street 5th Floor New York, NY 10281 |
16.21% | ||
| Northern
Trust Company (The) 801 South Canal Street Chicago, IL 60612 |
15.79% | |||
| State
Street Bank and Trust Company 1776 Heritage Drive North Quincy, MA 02171 |
14.50% | |||
| Credit
Suisse Securities (USA) LLC One Madison Ave 3rd Floor New York, NY 10010 |
10.53% |
| Fund | Name | Percentage
of Ownership | ||
| Charles
Schwab & Co., Inc. 111 Pavonia Avenue Jersey City, NJ 07310 |
7.02% | |||
| iShares MSCI World ETF | JPMorgan
Chase Bank, National Association 14201 Dallas Pkwy 12th Floor Dallas, TX 75240 |
27.44% | ||
| Brown
Brothers Harriman & Co. 525 Washington Blvd. 11th Floor Jersey City, NJ 07310 |
16.84% | |||
| UBS
Financial Services Inc. 1000 Harbor Blvd. 8th Floor Weehawken, NJ 07087 |
6.98% | |||
| Citibank,
N.A. 3800 CitiBank Center Tampa Building A/Floor 2 Tampa, FL 33610 |
6.27% | |||
| National
Financial Services LLC 200 Liberty Street 5th Floor New York, NY 10281 |
6.24% | |||
| The
Bank of New York Mellon 401 Salina Street 2nd Floor Syracuse, NY 13202 |
6.19% |
| Average Daily Net Assets of Combined Funds | Rate
of Management Fee for the iShares MSCI Pacific ex Japan ETF |
| First $46 billion | 0.5000% |
| Greater than $46 billion – up to $81 billion | 0.4750% |
| Greater than $81 billion – up to $111 billion | 0.4513% |
| Greater than $111 billion up to $141 billion | 0.4287% |
| Greater than $141 billion | 0.4073 % |
| Fund | Management
Fee for the Fiscal Year Ended August 31, 2016 |
Fund
Inception Date |
Management
Fees Paid Net of Waivers for Fiscal Year Ended August 31, 2016 |
Management
Fees Paid Net of Waivers for Fiscal Year Ended August 31, 2015 |
Management
Fees Paid Net of Waivers for Fiscal Year Ended August 31, 2014 | |||||
| iShares MSCI Australia ETF | 0.48% | 03/12/96 | $ 6,860,963 | $ 7,960,415 | $ 9,309,890 | |||||
| iShares MSCI Austria Capped ETF | 0.48% | 03/12/96 | 295,007 | 292,186 | 423,284 | |||||
| iShares MSCI Belgium Capped ETF | 0.48% | 03/12/96 | 898,831 | 784,484 | 402,608 | |||||
| iShares MSCI Canada ETF | 0.48% | 03/12/96 | 11,048,003 | 12,771,622 | 16,221,385 | |||||
| iShares MSCI Eurozone ETF | 0.48% | 07/25/00 | 56,101,620 | 43,090,544 | 42,364,200 | |||||
| iShares MSCI France ETF | 0.48% | 03/12/96 | 1,755,176 | 1,578,364 | 2,136,157 |
| Fund | Management
Fee for the Fiscal Year Ended August 31, 2016 |
Fund
Inception Date |
Management
Fees Paid Net of Waivers for Fiscal Year Ended August 31, 2016 |
Management
Fees Paid Net of Waivers for Fiscal Year Ended August 31, 2015 |
Management
Fees Paid Net of Waivers for Fiscal Year Ended August 31, 2014 | |||||
| iShares MSCI Germany ETF | 0.48% | 03/12/96 | 24,428,612 | 28,550,112 | 26,930,838 | |||||
| iShares MSCI Global Gold Miners ETF | 0.39% | 01/31/12 | 451,251 | 216,127 | 202,118 | |||||
| iShares MSCI Global Silver Miners ETF | 0.39% | 01/31/12 | 128,700 | 52,280 | 34,325 | |||||
| iShares MSCI Hong Kong ETF | 0.48% | 03/12/96 | 9,828,837 | 15,472,269 | 10,514,616 | |||||
| iShares MSCI Israel Capped ETF | 0.64% | 03/26/08 | 700,713 | 778,200 | 660,053 | |||||
| iShares MSCI Italy Capped ETF | 0.48% | 03/12/96 | 4,260,265 | 4,950,493 | 5,770,615 | |||||
| iShares MSCI Japan ETF | 0.48% | 03/12/96 | 83,098,869 | 78,965,332 | 64,952,270 | |||||
| iShares MSCI Japan Small-Cap ETF | 0.48% | 12/20/07 | 865,162 | 701,139 | 658,384 | |||||
| iShares MSCI Mexico Capped ETF | 0.48% | 03/12/96 | 5,958,256 | 10,089,636 | 12,859,191 | |||||
| iShares MSCI Netherlands ETF | 0.48% | 03/12/96 | 898,127 | 789,963 | 1,273,241 | |||||
| iShares MSCI Pacific ex Japan ETF | 0.49% | 10/25/01 | 9,789,421 | 13,450,529 | 15,652,518 | |||||
| iShares MSCI Russia Capped ETF | 0.64% | 11/09/10 | 1,610,412 | 1,596,025 | 1,894,067 | |||||
| iShares MSCI Singapore Capped ETF | 0.48% | 03/12/96 | 2,669,085 | 3,991,035 | 5,164,682 | |||||
| iShares MSCI South Africa ETF | 0.64% | 02/03/03 | 2,287,159 | 2,791,571 | 3,384,634 | |||||
| iShares MSCI Spain Capped ETF | 0.48% | 03/12/96 | 5,289,563 | 8,425,166 | 7,203,889 | |||||
| iShares MSCI Sweden Capped ETF | 0.48% | 03/12/96 | 1,567,657 | 1,789,253 | 2,380,666 | |||||
| iShares MSCI Switzerland Capped ETF | 0.48% | 03/12/96 | 5,530,695 | 5,453,148 | 5,066,631 | |||||
| iShares MSCI Thailand Capped ETF | 0.63% | 03/26/08 | 1,855,406 | 2,698,099 | 3,396,409 | |||||
| iShares MSCI Turkey ETF | 0.64% | 03/26/08 | 2,183,539 | 2,927,726 | 3,190,075 | |||||
| iShares MSCI USA Equal Weighted ETF | 0.15% | 05/05/10 | 74,046 | 79,043 | 196,623 | |||||
| iShares MSCI World ETF | 0.24% | 01/10/12 | 576,599 | 513,995 | 299,743 |
| Diane Hsiung | ||||
| Types of Accounts | Number | Total Assets | ||
| Registered Investment Companies | 224 | $659,537,000,000 | ||
| Other Pooled Investment Vehicles | 15 | 3,975,000,000 | ||
| Other Accounts | 0 | N/A | ||
| Accounts with Incentive-Based Fee Arrangements | 0 | N/A |
| Jennifer Hsui | ||||
| Types of Accounts | Number | Total Assets | ||
| Registered Investment Companies | 240 | $680,351,000,000 | ||
| Other Pooled Investment Vehicles | 16 | 4,295,000,000 |
| Jennifer Hsui | ||||
| Types of Accounts | Number | Total Assets | ||
| Other Accounts | 0 | N/A | ||
| Accounts with Incentive-Based Fee Arrangements | 0 | N/A |
| Alan Mason | ||||
| Types of Accounts | Number | Total Assets | ||
| Registered Investment Companies | 336 | $743,866,000,000 | ||
| Other Pooled Investment Vehicles | 285 | 574,676,000,000 | ||
| Other Accounts | 185 | 39,352,000,000 | ||
| Accounts with Incentive-Based Fee Arrangements | 0 | N/A |
| Greg Savage | ||||
| Types of Accounts | Number | Total Assets | ||
| Registered Investment Companies | 309 | $736,846,000,000 | ||
| Other Pooled Investment Vehicles | 75 | 26,632,000,000 | ||
| Other Accounts | 0 | N/A | ||
| Accounts with Incentive-Based Fee Arrangements | 0 | N/A |
| Diane Hsiung | ||||
| Types of Accounts | Number
of Other Accounts with Performance Fees Managed by Portfolio Manager |
Aggregate
of Total Assets | ||
| Registered Investment Companies | 0 | N/A | ||
| Other Pooled Investment Vehicles | 0 | N/A | ||
| Other Accounts | 0 | N/A |
| Jennifer Hsui | ||||
| Types of Accounts | Number
of Other Accounts with Performance Fees Managed by Portfolio Manager |
Aggregate
of Total Assets | ||
| Registered Investment Companies | 0 | N/A | ||
| Other Pooled Investment Vehicles | 0 | N/A | ||
| Other Accounts | 0 | N/A |
| Alan Mason | ||||
| Types of Accounts | Number
of Other Accounts with Performance Fees Managed by Portfolio Manager |
Aggregate
of Total Assets | ||
| Registered Investment Companies | 0 | N/A | ||
| Other Pooled Investment Vehicles | 0 | N/A | ||
| Other Accounts | 0 | N/A |
| Greg Savage | ||||
| Types of Accounts | Number
of Other Accounts with Performance Fees Managed by Portfolio Manager |
Aggregate
of Total Assets | ||
| Registered Investment Companies | 0 | N/A | ||
| Other Pooled Investment Vehicles | 0 | N/A | ||
| Other Accounts | 0 | N/A |
| Diane Hsiung | |||||||||||||||
| Dollar Range | |||||||||||||||
| Fund | None | $1 to $10k | $10,001
to $50k |
$50,001
to $100k |
$100,001
to $500k |
$500,001
to $1m |
over
$1m | ||||||||
| iShares MSCI Australia ETF | X | ||||||||||||||
| iShares MSCI Austria Capped ETF | X | ||||||||||||||
| iShares MSCI Belgium Capped ETF | X | ||||||||||||||
| iShares MSCI Canada ETF | X | ||||||||||||||
| iShares MSCI Eurozone ETF | X | ||||||||||||||
| iShares MSCI France ETF | X | ||||||||||||||
| iShares MSCI Germany ETF | X | ||||||||||||||
| iShares MSCI Global Gold Miners ETF | X | ||||||||||||||
| iShares MSCI Global Silver Miners ETF | X | ||||||||||||||
| iShares MSCI Hong Kong ETF | X | ||||||||||||||
| iShares MSCI Israel Capped ETF | X | ||||||||||||||
| iShares MSCI Italy Capped ETF | X | ||||||||||||||
| iShares MSCI Japan ETF | X | ||||||||||||||
| iShares MSCI Japan Small-Cap ETF | X | ||||||||||||||
| iShares MSCI Mexico Capped ETF | X | ||||||||||||||
| iShares MSCI Netherlands ETF | X | ||||||||||||||
| iShares MSCI Pacific ex Japan ETF | X | ||||||||||||||
| iShares MSCI Russia Capped ETF | X | ||||||||||||||
| iShares MSCI Singapore Capped ETF | X | ||||||||||||||
| iShares MSCI South Africa ETF | X | ||||||||||||||
| iShares MSCI Spain Capped ETF | X | ||||||||||||||
| iShares MSCI Sweden Capped ETF | X | ||||||||||||||
| Diane Hsiung | |||||||||||||||
| Dollar Range | |||||||||||||||
| Fund | None | $1 to $10k | $10,001
to $50k |
$50,001
to $100k |
$100,001
to $500k |
$500,001
to $1m |
over
$1m | ||||||||
| iShares MSCI Switzerland Capped ETF | X | ||||||||||||||
| iShares MSCI Thailand Capped ETF | X | ||||||||||||||
| iShares MSCI Turkey ETF | X | ||||||||||||||
| iShares MSCI USA Equal Weighted ETF | X | ||||||||||||||
| iShares MSCI World ETF | X | ||||||||||||||
| Jennifer Hsui | |||||||||||||||
| Dollar Range | |||||||||||||||
| Fund | None | $1 to $10k | $10,001
to $50k |
$50,001
to $100k |
$100,001
to $500k |
$500,001
to $1m |
over
$1m | ||||||||
| iShares MSCI Australia ETF | X | ||||||||||||||
| iShares MSCI Austria Capped ETF | X | ||||||||||||||
| iShares MSCI Belgium Capped ETF | X | ||||||||||||||
| iShares MSCI Canada ETF | X | ||||||||||||||
| iShares MSCI Eurozone ETF | X | ||||||||||||||
| iShares MSCI France ETF | X | ||||||||||||||
| iShares MSCI Germany ETF | X | ||||||||||||||
| iShares MSCI Global Gold Miners ETF | X | ||||||||||||||
| iShares MSCI Global Silver Miners ETF | X | ||||||||||||||
| iShares MSCI Hong Kong ETF | X | ||||||||||||||
| iShares MSCI Israel Capped ETF | X | ||||||||||||||
| iShares MSCI Italy Capped ETF | X | ||||||||||||||
| iShares MSCI Japan ETF | X | ||||||||||||||
| iShares MSCI Japan Small-Cap ETF | X | ||||||||||||||
| iShares MSCI Mexico Capped ETF | X | ||||||||||||||
| iShares MSCI Netherlands ETF | X | ||||||||||||||
| iShares MSCI Pacific ex Japan ETF | X | ||||||||||||||
| iShares MSCI Russia Capped ETF | X | ||||||||||||||
| iShares MSCI Singapore Capped ETF | X | ||||||||||||||
| iShares MSCI South Africa ETF | X | ||||||||||||||
| iShares MSCI Spain Capped ETF | X | ||||||||||||||
| iShares MSCI Sweden Capped ETF | X | ||||||||||||||
| iShares MSCI Switzerland Capped ETF | X | ||||||||||||||
| iShares MSCI Thailand Capped ETF | X | ||||||||||||||
| iShares MSCI Turkey ETF | X | ||||||||||||||
| iShares MSCI USA Equal Weighted ETF | X | ||||||||||||||
| iShares MSCI World ETF | X | ||||||||||||||
| Alan Mason | |||||||||||||||
| Dollar Range | |||||||||||||||
| Fund | None | $1 to $10k | $10,001
to $50k |
$50,001
to $100k |
$100,001
to $500k |
$500,001
to $1m |
over
$1m | ||||||||
| iShares MSCI Australia ETF | X | ||||||||||||||
| iShares MSCI Austria Capped ETF | X | ||||||||||||||
| Alan Mason | |||||||||||||||
| Dollar Range | |||||||||||||||
| Fund | None | $1 to $10k | $10,001
to $50k |
$50,001
to $100k |
$100,001
to $500k |
$500,001
to $1m |
over
$1m | ||||||||
| iShares MSCI Belgium Capped ETF | X | ||||||||||||||
| iShares MSCI Canada ETF | X | ||||||||||||||
| iShares MSCI Eurozone ETF | X | ||||||||||||||
| iShares MSCI France ETF | X | ||||||||||||||
| iShares MSCI Germany ETF | X | ||||||||||||||
| iShares MSCI Global Gold Miners ETF | X | ||||||||||||||
| iShares MSCI Global Silver Miners ETF | X | ||||||||||||||
| iShares MSCI Hong Kong ETF | X | ||||||||||||||
| iShares MSCI Israel Capped ETF | X | ||||||||||||||
| iShares MSCI Italy Capped ETF | X | ||||||||||||||
| iShares MSCI Japan ETF | X | ||||||||||||||
| iShares MSCI Japan Small-Cap ETF | X | ||||||||||||||
| iShares MSCI Mexico Capped ETF | X | ||||||||||||||
| iShares MSCI Netherlands ETF | X | ||||||||||||||
| iShares MSCI Pacific ex Japan ETF | X | ||||||||||||||
| iShares MSCI Russia Capped ETF | X | ||||||||||||||
| iShares MSCI Singapore Capped ETF | X | ||||||||||||||
| iShares MSCI South Africa ETF | X | ||||||||||||||
| iShares MSCI Spain Capped ETF | X | ||||||||||||||
| iShares MSCI Sweden Capped ETF | X | ||||||||||||||
| iShares MSCI Switzerland Capped ETF | X | ||||||||||||||
| iShares MSCI Thailand Capped ETF | X | ||||||||||||||
| iShares MSCI Turkey ETF | X | ||||||||||||||
| iShares MSCI USA Equal Weighted ETF | X | ||||||||||||||
| iShares MSCI World ETF | X | ||||||||||||||
| Greg Savage | |||||||||||||||
| Dollar Range | |||||||||||||||
| Fund | None | $1 to $10k | $10,001
to $50k |
$50,001
to $100k |
$100,001
to $500k |
$500,001
to $1m |
over
$1m | ||||||||
| iShares MSCI Australia ETF | X | ||||||||||||||
| iShares MSCI Austria Capped ETF | X | ||||||||||||||
| iShares MSCI Belgium Capped ETF | X | ||||||||||||||
| iShares MSCI Canada ETF | X | ||||||||||||||
| iShares MSCI Eurozone ETF | X | ||||||||||||||
| iShares MSCI France ETF | X | ||||||||||||||
| iShares MSCI Germany ETF | X | ||||||||||||||
| iShares MSCI Global Gold Miners ETF | X | ||||||||||||||
| iShares MSCI Global Silver Miners ETF | X | ||||||||||||||
| iShares MSCI Hong Kong ETF | X | ||||||||||||||
| iShares MSCI Israel Capped ETF | X | ||||||||||||||
| iShares MSCI Italy Capped ETF | X | ||||||||||||||
| iShares MSCI Japan ETF | X | ||||||||||||||
| iShares MSCI Japan Small-Cap ETF | X | ||||||||||||||
| iShares MSCI Mexico Capped ETF | X | ||||||||||||||
| Greg Savage | |||||||||||||||
| Dollar Range | |||||||||||||||
| Fund | None | $1 to $10k | $10,001
to $50k |
$50,001
to $100k |
$100,001
to $500k |
$500,001
to $1m |
over
$1m | ||||||||
| iShares MSCI Netherlands ETF | X | ||||||||||||||
| iShares MSCI Pacific ex Japan ETF | X | ||||||||||||||
| iShares MSCI Russia Capped ETF | X | ||||||||||||||
| iShares MSCI Singapore Capped ETF | X | ||||||||||||||
| iShares MSCI South Africa ETF | X | ||||||||||||||
| iShares MSCI Spain Capped ETF | X | ||||||||||||||
| iShares MSCI Sweden Capped ETF | X | ||||||||||||||
| iShares MSCI Switzerland Capped ETF | X | ||||||||||||||
| iShares MSCI Thailand Capped ETF | X | ||||||||||||||
| iShares MSCI Turkey ETF | X | ||||||||||||||
| iShares MSCI USA Equal Weighted ETF | X | ||||||||||||||
| iShares MSCI World ETF | X | ||||||||||||||
| Fund | Fund
Inception Date |
Administration,
Custodian, Transfer Agency Expenses Paid During Fiscal Year Ended August 31, 2016 |
Administration,
Custodian, Transfer Agency Expenses Paid During Fiscal Year Ended August 31, 2015 |
Administration,
Custodian, Transfer Agency Expenses Paid During Fiscal Year Ended August 31, 2014 | ||||
| iShares MSCI Australia ETF | 03/12/96 | $ 122,545 | $ 132,291 | $ 141,820 | ||||
| iShares MSCI Austria Capped ETF | 03/12/96 | 41,616 | 28,942 | 34,809 | ||||
| iShares MSCI Belgium Capped ETF | 03/12/96 | 45,520 | 34,434 | 23,326 | ||||
| iShares MSCI Canada ETF | 03/12/96 | 125,146 | 129,242 | 157,605 | ||||
| iShares MSCI Eurozone ETF | 07/25/00 | 714,702 | 570,597 | 602,393 | ||||
| iShares MSCI France ETF | 03/12/96 | 55,907 | 45,238 | 48,068 | ||||
| iShares MSCI Germany ETF | 03/12/96 | 296,554 | 346,177 | 323,304 | ||||
| iShares MSCI Global Gold Miners ETF | 01/31/12 | 26,340 | 17,330 | 15,661 | ||||
| iShares MSCI Global Silver Miners ETF | 01/31/12 | 16,296 | 13,830 | 9,093 | ||||
| iShares MSCI Hong Kong ETF | 03/12/96 | 133,680 | 209,256 | 131,149 | ||||
| iShares MSCI Israel Capped ETF | 03/26/08 | 83,416 | 75,942 | 77,890 | ||||
| iShares MSCI Italy Capped ETF | 03/12/96 | 72,644 | 73,306 | 85,505 | ||||
| iShares MSCI Japan ETF | 03/12/96 | 494,336 | 476,657 | 399,207 | ||||
| iShares MSCI Japan Small-Cap ETF | 12/20/07 | 24,007 | 11,644 | 22,798 | ||||
| iShares MSCI Mexico Capped ETF | 03/12/96 | 175,529 | 253,667 | 320,989 | ||||
| iShares MSCI Netherlands ETF | 03/12/96 | 29,401 | 24,143 | 31,460 | ||||
| iShares MSCI Pacific ex Japan ETF | 10/25/01 | 191,087 | 235,690 | 321,809 | ||||
| iShares MSCI Russia Capped ETF | 11/09/10 | 500,149 | 432,003 | 596,265 | ||||
| iShares MSCI Singapore Capped ETF | 03/12/96 | 107,423 | 124,087 | 233,767 | ||||
| iShares MSCI South Africa ETF | 02/03/03 | 60,034 | 63,866 | 77,192 | ||||
| iShares MSCI Spain Capped ETF | 03/12/96 | 71,352 | 108,761 | 97,458 | ||||
| iShares MSCI Sweden Capped ETF | 03/12/96 | 32,944 | 39,115 | 45,895 | ||||
| iShares MSCI Switzerland Capped ETF | 03/12/96 | 85,893 | 82,377 | 71,424 | ||||
| iShares MSCI Thailand Capped ETF | 03/26/08 | 63,804 | 70,441 | 79,972 | ||||
| iShares MSCI Turkey ETF | 03/26/08 | 118,326 | 147,844 | 173,362 | ||||
| iShares MSCI USA Equal Weighted ETF | 05/05/10 | 18,174 | 9,516 | 14,126 | ||||
| iShares MSCI World ETF | 01/10/12 | 32,614 | 41,325 | 30,622 |
| Fund | Fund
Inception Date |
Distributor
Compensation Paid During Fiscal Year Ended August 31, 2016 |
Distributor
Compensation Paid During Fiscal Year Ended August 31, 2015 |
Distributor
Compensation Paid During Fiscal Year Ended August 31, 20141 | |||
| iShares MSCI Australia ETF | 03/12/96 | $0 | $0 | $6,438 | |||
| iShares MSCI Austria Capped ETF | 03/12/96 | 0 | 0 | 6,438 | |||
| iShares MSCI Belgium Capped ETF | 03/12/96 | 0 | 0 | 6,438 | |||
| iShares MSCI Canada ETF | 03/12/96 | 0 | 0 | 6,438 | |||
| iShares MSCI Eurozone ETF | 07/25/00 | 0 | 0 | 6,438 | |||
| iShares MSCI France ETF | 03/12/96 | 0 | 0 | 6,438 | |||
| iShares MSCI Germany ETF | 03/12/96 | 0 | 0 | 6,438 | |||
| iShares MSCI Global Gold Miners ETF | 01/31/12 | 0 | 0 | 6,438 | |||
| iShares MSCI Global Silver Miners ETF | 01/31/12 | 0 | 0 | 6,438 | |||
| iShares MSCI Hong Kong ETF | 03/12/96 | 0 | 0 | 6,438 | |||
| iShares MSCI Israel Capped ETF | 03/26/08 | 0 | 0 | 6,438 | |||
| iShares MSCI Italy Capped ETF | 03/12/96 | 0 | 0 | 6,438 | |||
| iShares MSCI Japan ETF | 03/12/96 | 0 | 0 | 6,438 | |||
| iShares MSCI Japan Small-Cap ETF | 12/20/07 | 0 | 0 | 6,438 | |||
| iShares MSCI Mexico Capped ETF | 03/12/96 | 0 | 0 | 6,438 | |||
| iShares MSCI Netherlands ETF | 03/12/96 | 0 | 0 | 6,438 | |||
| iShares MSCI Pacific ex Japan ETF | 10/25/01 | 0 | 0 | 6,438 | |||
| iShares MSCI Russia Capped ETF | 11/09/10 | 0 | 0 | 6,438 | |||
| iShares MSCI Singapore Capped ETF | 03/12/96 | 0 | 0 | 6,438 | |||
| iShares MSCI South Africa ETF | 02/03/03 | 0 | 0 | 6,438 | |||
| iShares MSCI Spain Capped ETF | 03/12/96 | 0 | 0 | 6,438 | |||
| iShares MSCI Sweden Capped ETF | 03/12/96 | 0 | 0 | 6,438 | |||
| iShares MSCI Switzerland Capped ETF | 03/12/96 | 0 | 0 | 6,438 | |||
| iShares MSCI Thailand Capped ETF | 03/26/08 | 0 | 0 | 6,438 | |||
| iShares MSCI Turkey ETF | 03/26/08 | 0 | 0 | 6,438 | |||
| iShares MSCI USA Equal Weighted ETF | 05/05/10 | 0 | 0 | 6,438 | |||
| iShares MSCI World ETF | 01/10/12 | 0 | 0 | 6,438 |
| 1 | These fees reflect payments made to SEI, acting as an agent of the Distributor. |
| Fund | Fund
Inception Date |
Brokerage
Commissions Paid During Fiscal Year Ended August 31, 2016 |
Brokerage
Commissions Paid During Fiscal Year Ended August 31, 2015 |
Brokerage
Commissions Paid During Fiscal Year Ended August 31, 2014 | ||||
| iShares MSCI Australia ETF | 03/12/96 | $ 26,846 | $ 68,464 | $ 53,580 | ||||
| iShares MSCI Austria Capped ETF | 03/12/96 | 1,425 | 1,778 | 6,450 | ||||
| iShares MSCI Belgium Capped ETF | 03/12/96 | 7,927 | 1,285 | 1,923 | ||||
| iShares MSCI Canada ETF | 03/12/96 | 38,919 | 47,160 | 63,082 | ||||
| iShares MSCI Eurozone ETF | 07/25/00 | 88,817 | 129,361 | 172,276 | ||||
| iShares MSCI France ETF | 03/12/96 | 6,018 | 9,699 | 8,063 | ||||
| iShares MSCI Germany ETF | 03/12/96 | 43,771 | 57,810 | 128,152 | ||||
| iShares MSCI Global Gold Miners ETF | 01/31/12 | 12,194 | 4,138 | 1,508 | ||||
| iShares MSCI Global Silver Miners ETF | 01/31/12 | 24,717 | 8,557 | 334 | ||||
| iShares MSCI Hong Kong ETF | 03/12/96 | 28,655 | 132,602 | 41,857 | ||||
| iShares MSCI Israel Capped ETF | 03/26/08 | 23,272 | 11,791 | 6,192 | ||||
| iShares MSCI Italy Capped ETF | 03/12/96 | 31,398 | 56,309 | 104,773 | ||||
| iShares MSCI Japan ETF | 03/12/96 | 186,608 | 149,528 | 94,146 | ||||
| iShares MSCI Japan Small-Cap ETF | 12/20/07 | 4,991 | 4,292 | 12,828 | ||||
| iShares MSCI Mexico Capped ETF | 03/12/96 | 72,211 | 265,575 | 159,405 | ||||
| iShares MSCI Netherlands ETF | 03/12/96 | 8,703 | 4,403 | 5,197 | ||||
| iShares MSCI Pacific ex Japan ETF | 10/25/01 | 23,397 | 82,176 | 104,974 | ||||
| iShares MSCI Russia Capped ETF | 11/09/10 | 40,037 | 34,551 | 26,540 | ||||
| iShares MSCI Singapore Capped ETF | 03/12/96 | 22,514 | 29,394 | 28,518 | ||||
| iShares MSCI South Africa ETF | 02/03/03 | 18,575 | 11,229 | 13,691 | ||||
| iShares MSCI Spain Capped ETF | 03/12/96 | 29,771 | 61,447 | 75,194 | ||||
| iShares MSCI Sweden Capped ETF | 03/12/96 | 6,213 | 6,193 | 14,446 | ||||
| iShares MSCI Switzerland Capped ETF | 03/12/96 | 15,801 | 31,670 | 15,689 | ||||
| iShares MSCI Thailand Capped ETF | 03/26/08 | 43,852 | 28,314 | 42,185 | ||||
| iShares MSCI Turkey ETF | 03/26/08 | 13,950 | 20,803 | 48,753 | ||||
| iShares MSCI USA Equal Weighted ETF | 05/05/10 | 1,174 | 1,466 | 1,144 | ||||
| iShares MSCI World ETF | 01/10/12 | 2,099 | 2,496 | 2,325 |
| Fund | Issuer | Market
Value of Investment | ||
| iShares MSCI Eurozone ETF | Societe Generale SA | $ 63,523,530 | ||
| ABN AMRO Group NV | $ 10,649,738 | |||
| iShares MSCI France ETF | Societe Generale SA | $ 7,759,054 | ||
| iShares MSCI Japan ETF | Nomura Holdings Inc. | $ 81,670,510 | ||
| iShares MSCI Netherlands Capped ETF | ABN AMRO Group NV | $ 2,038,498 | ||
| iShares MSCI Switzerland Capped ETF | UBS Group, AG | $48,822,222 | ||
| Credit Suisse Group AG | $ 24,367,904 | |||
| iShares MSCI USA Equal Weighted ETF | Bank of America Corp. | $ 125,101 | ||
| Goldman Sachs Group, Inc. (The) | $ 123,536 | |||
| Citigroup, Inc. | $ 122,596 |
| Fund | Issuer | Market
Value of Investment | ||
| JPMorgan Chase & Co. | $ 122,580 | |||
| iShares MSCI World ETF | JPMorgan Chase & Co. | $2,084,400 | ||
| Bank of America Corp. | $ 1,417,738 | |||
| HSBC Holdings PLC | $ 1,241,331 | |||
| Citigroup, Inc. | $ 1,193,500 | |||
| Goldman Sachs Group, Inc. (The) | $ 542,272 | |||
| UBS Group, AG | $ 458,056 | |||
| Societe Generale SA | $ 234,148 | |||
| Nomura Holdings Inc. | $ 226,136 | |||
| Credit Suisse Group AG | $ 204,532 |
| Fund | Fiscal
Year Ended August 31, 2016 |
Fiscal
Year Ended August 31, 2015 | ||
| iShares MSCI Australia ETF | 7% | 9% | ||
| iShares MSCI Austria Capped ETF | 15% | 18% | ||
| iShares MSCI Belgium Capped ETF | 19% | 7% | ||
| iShares MSCI Canada ETF | 4% | 5% | ||
| iShares MSCI Eurozone ETF | 4% | 5% | ||
| iShares MSCI France ETF | 6% | 6% | ||
| iShares MSCI Germany ETF | 3% | 3% | ||
| iShares MSCI Global Gold Miners ETF | 30% | 20% | ||
| iShares MSCI Global Silver Miners ETF | 27% | 31% | ||
| iShares MSCI Hong Kong ETF | 9% | 7% | ||
| iShares MSCI Israel Capped ETF | 46% | 14% | ||
| iShares MSCI Italy Capped ETF | 16% | 22% | ||
| iShares MSCI Japan ETF | 4% | 2% | ||
| iShares MSCI Japan Small-Cap ETF | 12% | 10% | ||
| iShares MSCI Mexico Capped ETF | 8% | 13% | ||
| iShares MSCI Netherlands ETF | 24% | 6% | ||
| iShares MSCI Pacific ex Japan ETF | 6% | 7% |
| Fund | Fiscal
Year Ended August 31, 2016 |
Fiscal
Year Ended August 31, 2015 | ||
| iShares MSCI Russia Capped ETF | 23% | 19% | ||
| iShares MSCI Singapore Capped ETF | 7% | 10% | ||
| iShares MSCI South Africa ETF | 12% | 9% | ||
| iShares MSCI Spain Capped ETF | 9% | 15% | ||
| iShares MSCI Sweden Capped ETF | 7% | 4% | ||
| iShares MSCI Switzerland Capped ETF | 6% | 7% | ||
| iShares MSCI Thailand Capped ETF | 16% | 13% | ||
| iShares MSCI Turkey ETF | 6% | 6% | ||
| iShares MSCI USA Equal Weighted ETF | 28% | 39% | ||
| iShares MSCI World ETF | 5% | 5% |
| Fund | Shares
Per Creation Unit |
Value
Per Creation Unit (U.S.$) | ||
| iShares MSCI Australia ETF | 200,000 | $4,158,000 | ||
| iShares MSCI Austria Capped ETF | 100,000 | 1,633,000 | ||
| iShares MSCI Belgium Capped ETF | 80,000 | 1,508,000 | ||
| iShares MSCI Canada ETF | 100,000 | 2,561,000 | ||
| iShares MSCI Eurozone ETF | 100,000 | 3,450,000 | ||
| iShares MSCI France ETF | 200,000 | 4,828,000 | ||
| iShares MSCI Germany ETF | 300,000 | 7,881,000 | ||
| iShares MSCI Global Gold Miners ETF1 | 50,000 | 1,053,600 | ||
| iShares MSCI Global Silver Miners ETF | 100,000 | 1,420,000 | ||
| iShares MSCI Hong Kong ETF | 75,000 | 1,637,250 | ||
| iShares MSCI Israel Capped ETF | 50,000 | 2,416,500 | ||
| iShares MSCI Italy Capped ETF1 | 75,000 | 1,633,100 | ||
| iShares MSCI Japan ETF1 | 150,000 | 7,449,600 | ||
| iShares MSCI Japan Small-Cap ETF | 100,000 | 6,425,000 | ||
| iShares MSCI Mexico Capped ETF | 100,000 | 4,860,000 | ||
| iShares MSCI Netherlands ETF | 50,000 | 1,253,500 | ||
| iShares MSCI Pacific ex Japan ETF | 300,000 | 12,603,000 | ||
| iShares MSCI Russia Capped ETF1 | 50,000 | 1,402,000 | ||
| iShares MSCI Singapore Capped ETF1 | 50,000 | 1,033,500 | ||
| iShares MSCI South Africa ETF | 100,000 | 5,580,000 | ||
| iShares MSCI Spain Capped ETF | 75,000 | 2,013,000 | ||
| iShares MSCI Sweden Capped ETF | 75,000 | 2,184,000 | ||
| iShares MSCI Switzerland Capped ETF | 125,000 | 3,816,250 | ||
| iShares MSCI Thailand Capped ETF | 50,000 | 3,648,000 | ||
| iShares MSCI Turkey ETF | 50,000 | 1,890,000 | ||
| iShares MSCI USA Equal Weighted ETF | 50,000 | 2,298,500 | ||
| iShares MSCI World ETF | 100,000 | 7,252,000 |
| 1 | For the iShares MSCI Global Gold Miners ETF, iShares MSCI Italy Capped ETF, iShares MSCI Japan ETF, iShares MSCI Russia Capped ETF and iShares MSCI Singapore Capped ETF, the shares per creation unit and the value per creation unit are as of November 7, 2016. |
| Fund | Standard
Creation Transaction Fee |
Maximum
Additional Charge* | ||
| iShares MSCI Australia ETF | $ 2,400 | 3.0% | ||
| iShares MSCI Austria Capped ETF | 600 | 3.0% | ||
| iShares MSCI Belgium Capped ETF | 700 | 3.0% | ||
| iShares MSCI Canada ETF | 1,900 | 3.0% | ||
| iShares MSCI Eurozone ETF | 7,500 | 3.0% | ||
| iShares MSCI France ETF | 2,900 | 3.0% | ||
| iShares MSCI Germany ETF | 1,500 | 3.0% | ||
| iShares MSCI Global Gold Miners ETF | 800 | 7.0% | ||
| iShares MSCI Global Silver Miners ETF | 500 | 7.0% | ||
| iShares MSCI Hong Kong ETF | 2,000 | 7.0% | ||
| iShares MSCI Israel Capped ETF | 3,300 | 3.0% | ||
| iShares MSCI Italy Capped ETF | 1,400 | 3.0% | ||
| iShares MSCI Japan ETF | 5,000 | 3.0% | ||
| iShares MSCI Japan Small-Cap ETF | 6,000 | 3.0% | ||
| iShares MSCI Mexico Capped ETF | 1,400 | 3.0% | ||
| iShares MSCI Netherlands ETF | 1,000 | 3.0% | ||
| iShares MSCI Pacific ex Japan ETF | 6,000 | 7.0% | ||
| iShares MSCI Russia Capped ETF | 2,300 | 3.0% | ||
| iShares MSCI Singapore Capped ETF | 2,000 | 3.0% | ||
| iShares MSCI South Africa ETF | 1,200 | 3.0% | ||
| iShares MSCI Spain Capped ETF | 1,500 | 3.0% | ||
| iShares MSCI Sweden Capped ETF | 1,300 | 3.0% | ||
| iShares MSCI Switzerland Capped ETF | 1,500 | 3.0% | ||
| iShares MSCI Thailand Capped ETF | 1,700 | 3.0% | ||
| iShares MSCI Turkey ETF | 1,600 | 3.0% | ||
| iShares MSCI USA Equal Weighted ETF | 1,500 | 3.0% | ||
| iShares MSCI World ETF | 15,000 | 7.0% |
| * | As a percentage of the net asset value per Creation Unit. |
| Fund | Standard
Redemption Transaction Fee |
Maximum
Additional Charge* | ||
| iShares MSCI Australia ETF | $ 2,400 | 2.0% | ||
| iShares MSCI Austria Capped ETF | 600 | 2.0% | ||
| iShares MSCI Belgium Capped ETF | 700 | 2.0% | ||
| iShares MSCI Canada ETF | 1,900 | 2.0% | ||
| iShares MSCI Eurozone ETF | 7,500 | 2.0% | ||
| iShares MSCI France ETF | 2,900 | 2.0% | ||
| iShares MSCI Germany ETF | 1,500 | 2.0% | ||
| iShares MSCI Global Gold Miners ETF | 800 | 2.0% | ||
| iShares MSCI Global Silver Miners ETF | 500 | 2.0% | ||
| iShares MSCI Hong Kong ETF | 2,000 | 2.0% | ||
| iShares MSCI Israel Capped ETF | 3,300 | 2.0% | ||
| iShares MSCI Italy Capped ETF | 1,400 | 2.0% | ||
| iShares MSCI Japan ETF | 5,000 | 2.0% | ||
| iShares MSCI Japan Small-Cap ETF | 6,000 | 2.0% | ||
| iShares MSCI Mexico Capped ETF | 1,400 | 2.0% | ||
| iShares MSCI Netherlands ETF | 1,000 | 2.0% | ||
| iShares MSCI Pacific ex Japan ETF | 6,000 | 2.0% | ||
| iShares MSCI Russia Capped ETF | 2,300 | 2.0% | ||
| iShares MSCI Singapore Capped ETF | 2,000 | 2.0% | ||
| iShares MSCI South Africa ETF | 1,200 | 2.0% | ||
| iShares MSCI Spain Capped ETF | 1,500 | 2.0% | ||
| iShares MSCI Sweden Capped ETF | 1,300 | 2.0% | ||
| iShares MSCI Switzerland Capped ETF | 1,500 | 2.0% | ||
| iShares MSCI Thailand Capped ETF | 1,700 | 2.0% | ||
| iShares MSCI Turkey ETF | 1,600 | 2.0% | ||
| iShares MSCI USA Equal Weighted ETF | 1,500 | 2.0% | ||
| iShares MSCI World ETF | 15,000 | 2.0% |
| * | As a percentage of the net asset value per Creation Unit, inclusive of the standard redemption transaction fee. |
| Fund | Non-Expiring 1 | Expiring
2017 |
Expiring
2018 |
Expiring
2019 |
Total | |||||
| iShares MSCI Australia ETF | $ 137,537,973 | $ 24,006,125 | $ 23,348,244 | $ 12,127,364 | $197,019,706 | |||||
| iShares MSCI Austria Capped ETF | 32,264,922 | 7,102,366 | 16,657,011 | 13,826,937 | 69,851,236 | |||||
| iShares MSCI Belgium Capped ETF | 12,888,603 | 5,953,120 | 10,826,174 | 19,023,517 | 48,691,414 | |||||
| iShares MSCI Canada ETF | 272,374,434 | 27,886,883 | 68,928,677 | 14,903,919 | 384,093,913 | |||||
| iShares MSCI Eurozone ETF | 94,683,428 | 26,644,200 | 68,035,542 | 30,230,739 | 219,593,909 | |||||
| iShares MSCI France ETF | 26,988,853 | 3,408,374 | 7,008,530 | 2,858,814 | 40,264,571 | |||||
| iShares MSCI Germany ETF | 41,405,856 | 27,790,050 | 28,490,949 | 32,215,954 | 129,902,809 | |||||
| iShares MSCI Global Gold Miners ETF | 13,627,904 | — | — | — | 13,627,904 | |||||
| iShares MSCI Global Silver Miners ETF | 3,202,603 | — | — | — | 3,202,603 | |||||
| iShares MSCI Hong Kong ETF | 222,203,643 | 29,235,556 | 114,836,904 | 34,565,959 | 400,842,062 | |||||
| iShares MSCI Israel Capped ETF | 19,023,801 | 784,479 | 10,801,191 | 7,130,249 | 37,739,720 | |||||
| iShares MSCI Italy Capped ETF | 68,671,316 | 2,743,650 | 18,169,627 | 9,459,662 | 99,044,255 | |||||
| iShares MSCI Japan ETF | 371,710,340 | 116,295,478 | 173,577,101 | 139,228,194 | 800,811,113 | |||||
| iShares MSCI Japan Small-Cap ETF | 3,140,817 | 131,718 | 541,322 | 203,697 | 4,017,554 | |||||
| iShares MSCI Mexico Capped ETF | 134,670,245 | 8,973,988 | 2,789,471 | 22,863,665 | 169,297,369 | |||||
| iShares MSCI Netherlands ETF | 10,460,395 | 5,819,153 | 22,256,170 | 2,329,005 | 40,864,723 | |||||
| iShares MSCI Pacific ex Japan ETF | 264,867,220 | 66,207,828 | 104,799,503 | 36,600,987 | 472,475,538 | |||||
| iShares MSCI Russia Capped ETF | 48,854,119 | — | — | — | 48,854,119 | |||||
| iShares MSCI Singapore Capped ETF | 53,847,762 | 15,680,510 | 132,420,824 | 11,588,528 | 213,537,624 | |||||
| iShares MSCI South Africa ETF | 50,591,544 | 15,339,464 | 14,856,365 | 6,137,142 | 86,924,515 | |||||
| iShares MSCI Spain Capped ETF | 51,684,017 | 5,946,927 | 15,120,672 | 8,619,903 | 81,371,519 | |||||
| iShares MSCI Sweden Capped ETF | 14,620,306 | 13,686,746 | 8,483,510 | 5,244,977 | 42,035,539 | |||||
| iShares MSCI Switzerland Capped ETF | 15,786,844 | 2,837,786 | 22,569,380 | 6,955,758 | 48,149,768 | |||||
| iShares MSCI Thailand Capped ETF | 12,695,752 | 555,444 | 2,321,428 | 1,304,910 | 16,877,534 | |||||
| iShares MSCI Turkey ETF | 43,587,314 | 720,636 | 5,982,737 | 3,859,184 | 54,149,871 | |||||
| iShares MSCI USA Equal Weighted ETF | 1,654,423 | — | — | — | 1,654,423 | |||||
| iShares MSCI World ETF | 514,129 | — | — | — | 514,129 |
| 1 | Must be utilized prior to losses subject to expiration. |
iShares MSCI Germany ETF
iShares MSCI Hong Kong ETF
iShares MSCI Japan ETF
iShares MSCI Japan Small-Cap ETF
iShares MSCI Mexico Capped ETF
iShares MSCI Thailand Capped ETF
iShares MSCI USA Equal Weighted ETF
| 1 | iShares MSCI ACWI Low Carbon Target ETF, iShares MSCI All Peru Capped ETF, iShares MSCI EAFE ESG Optimized ETF, iShares MSCI EM ESG Optimized ETF, iShares MSCI Global Impact ETF, iShares MSCI KLD 400 Social ETF and iShares MSCI USA ESG Select ETF have separate Fund Proxy Voting Policies. |
| • | Boards and directors |
| • | Auditors and audit-related issues |
| • | Capital structure, mergers, asset sales and other special transactions |
| • | Remuneration and benefits |
| • | Social, ethical and environmental issues |
| • | General corporate governance matters |
| • | establishing an appropriate corporate governance structure; |
| • | supporting and overseeing management in setting strategy; |
| • | ensuring the integrity of financial statements; |
| • | making decisions regarding mergers, acquisitions and disposals; |
| • | establishing appropriate executive compensation structures; and |
| • | addressing business issues including social, ethical and environmental issues when they have the potential to materially impact company reputation and performance. |
| • | current employment at the company or a subsidiary; |
| • | former employment within the past several years as an executive of the company; |
| • | providing substantial professional services to the company and/or members of the company’s management; |
| • | having had a substantial business relationship in the past three years; |
| • | having, or representing a shareholder with, a substantial shareholding in the company; |
| • | being an immediate family member of any of the aforementioned; and |
| • | interlocking directorships. |
| • | BlackRock has adopted a proxy voting oversight structure whereby the Corporate Governance Committees oversee the voting decisions and other activities of the Corporate Governance Group, and particularly its activities with respect to voting in the relevant region of each Corporate Governance Committee’s jurisdiction. |
| • | The Corporate Governance Committees have adopted Guidelines for each region, which set forth the firm’s views with respect to certain corporate governance and other issues that typically arise in the proxy voting context. The Corporate Governance Committees receive periodic reports regarding the specific votes cast by the Corporate Governance Group and regular updates on material process issues, procedural changes and other matters of concern to the Corporate Governance Committees. |
| • | BlackRock’s Global Corporate Governance Oversight Committee oversees the Global Head, the Corporate Governance Group and the Corporate Governance Committees. The Global Corporate Governance Oversight Committee conducts a review, at least annually, of the proxy voting process to ensure compliance with BlackRock’s risk policies and procedures. |
| • | BlackRock maintains a reporting structure that separates the Global Head and Corporate Governance Group from employees with sales responsibilities. In addition, BlackRock maintains procedures intended to ensure that all engagements with corporate issuers or dissident shareholders are managed consistently and without regard to BlackRock’s relationship with the issuer of the proxy or dissident shareholder. Within the normal course of business, the Global Head or Corporate Governance Group may engage directly with BlackRock clients, and with employees with sales responsibilities, in discussions regarding general corporate governance policy matters, and to otherwise ensure that proxy-related client service levels are met. The Global Head or Corporate Governance Group does not discuss any specific voting matter with a client prior to the disclosure of the vote decision to all applicable clients after the shareholder meeting has taken place, except if the client is acting in the capacity as issuer of the proxy or dissident shareholder and is engaging through the established procedures independent of the client relationship. |
| • | In certain instances, BlackRock may determine to engage an independent fiduciary to vote proxies as a further safeguard to avoid potential conflicts of interest or as otherwise required by applicable law. The independent fiduciary may either vote such proxies or provide BlackRock with instructions as to how to vote such proxies. In the latter case, BlackRock votes the proxy in accordance with the independent fiduciary’s determination. Use of an independent fiduciary has been |
| adopted for voting the proxies related to any company that is affiliated with BlackRock or any company that includes BlackRock employees on its board of directors. |
| 2016 | ||||||
| Country | Trade
Date |
Settlement
Date |
Number
of Days to Settle | |||
| Australia | 03/22/16 | 03/30/16 | 8 | |||
| 12/20/16 | 12/29/16 | 9 | ||||
| 12/21/16 | 01/03/17 | 12 | ||||
| 12/22/16 | 01/04/17 | 13 | ||||
| Bahrain | 09/07/16 | 09/15/16 | 8 | |||
| 09/08/16 | 09/18/16 | 10 | ||||
| Bangladesh | 06/29/16 | 07/10/16 | 11 | |||
| 09/06/16 | 09/15/16 | 9 | ||||
| 09/07/16 | 09/18/16 | 11 | ||||
| 09/08/16 | 09/19/16 | 11 | ||||
| 2016 | ||||||
| Country | Trade
Date |
Settlement
Date |
Number
of Days to Settle | |||
| Brazil | 02/03/16 | 02/11/16 | 8 | |||
| 02/04/16 | 02/12/16 | 8 | ||||
| 02/05/16 | 02/15/16 | 10 | ||||
| China | 02/03/16 | 02/17/16 | 14 | |||
| 02/04/16 | 02/18/16 | 14 | ||||
| 02/05/16 | 02/19/16 | 14 | ||||
| 04/27/16 | 05/09/16 | 12 | ||||
| 04/28/16 | 05/10/16 | 12 | ||||
| 04/29/16 | 05/11/16 | 12 | ||||
| 09/28/16 | 10/11/16 | 13 | ||||
| 09/29/16 | 10/12/16 | 13 | ||||
| 09/30/16 | 10/13/16 | 13 | ||||
| Colombia | 03/18/16 | 03/28/16 | 10 | |||
| Costa Rica | 12/21/16 | 01/02/17 | 12 | |||
| 12/22/16 | 01/03/17 | 12 | ||||
| 12/23/16 | 01/04/17 | 12 | ||||
| Ghana | 06/30/16 | 07/08/16 | 8 | |||
| Indonesia | 06/29/16 | 07/11/16 | 12 | |||
| 06/30/16 | 07/12/16 | 12 | ||||
| 07/01/16 | 07/13/16 | 12 | ||||
| Ireland | 12/21/16 | 12/29/16 | 8 | |||
| 12/22/16 | 01/03/17 | 12 | ||||
| Israel | 04/20/16 | 05/01/16 | 11 | |||
| 04/21/16 | 05/02/16 | 11 | ||||
| 10/10/16 | 10/25/16 | 15 | ||||
| 10/13/16 | 10/26/16 | 13 | ||||
| Japan | 04/27/16 | 05/06/16 | 9 | |||
| 04/28/16 | 05/09/16 | 11 | ||||
| 05/02/16 | 05/10/16 | 8 | ||||
| Jordan | 06/30/16 | 07/11/16 | 11 | |||
| 07/03/16 | 07/12/16 | 9 | ||||
| 09/07/16 | 09/18/16 | 11 | ||||
| 09/08/16 | 09/19/16 | 11 | ||||
| Kuwait | 09/06/16 | 09/15/16 | 9 | |||
| 09/07/16 | 09/18/16 | 11 | ||||
| Lebanon | 07/01/16 | 7/11/16 | 10 | |||
| 07/04/16 | 7/12/16 | 8 | ||||
| 07/05/16 | 7/13/16 | 8 | ||||
| 2016 | ||||||
| Country | Trade
Date |
Settlement
Date |
Number
of Days to Settle | |||
| Malawi | 01/08/16 | 01/18/16 | 10 | |||
| 01/11/16 | 01/19/16 | 8 | ||||
| 01/12/16 | 01/20/16 | 8 | ||||
| 01/13/16 | 01/21/16 | 8 | ||||
| 01/14/16 | 01/22/16 | 8 | ||||
| 02/25/16 | 03/04/16 | 8 | ||||
| 02/26/16 | 03/07/16 | 10 | ||||
| 02/29/16 | 03/08/16 | 8 | ||||
| 03/01/16 | 03/09/16 | 8 | ||||
| 03/02/16 | 03/10/16 | 8 | ||||
| 03/18/16 | 03/29/16 | 11 | ||||
| 03/21/16 | 03/30/16 | 9 | ||||
| 03/22/16 | 03/31/16 | 9 | ||||
| 03/23/16 | 04/01/16 | 9 | ||||
| 03/24/16 | 04/04/16 | 11 | ||||
| 04/25/16 | 05/03/16 | 8 | ||||
| 04/26/16 | 05/04/16 | 8 | ||||
| 04/27/16 | 05/05/16 | 8 | ||||
| 04/28/16 | 05/06/16 | 8 | ||||
| 04/29/16 | 05/09/16 | 10 | ||||
| 06/07/16 | 06/15/16 | 8 | ||||
| 06/08/16 | 06/16/16 | 8 | ||||
| 06/09/16 | 06/17/16 | 8 | ||||
| 06/10/16 | 06/20/16 | 10 | ||||
| 06/13/16 | 06/21/16 | 8 | ||||
| 06/29/16 | 07/08/16 | 10 | ||||
| 06/30/16 | 07/11/16 | 11 | ||||
| 07/01/16 | 07/12/16 | 11 | ||||
| 07/04/16 | 07/13/16 | 9 | ||||
| 07/05/16 | 07/14/16 | 9 | ||||
| 12/19/16 | 12/27/16 | 8 | ||||
| 12/20/16 | 12/28/16 | 8 | ||||
| 12/21/16 | 12/29/16 | 8 | ||||
| 12/22/16 | 12/30/16 | 8 | ||||
| 12/23/16 | 01/03/17 | 11 | ||||
| 12/27/16 | 01/04/17 | 8 | ||||
| 12/28/16 | 01/05/17 | 8 | ||||
| 12/29/16 | 01/06/17 | 8 | ||||
| 12/30/16 | 01/09/17 | 10 | ||||
| Malaysia | 07/01/16 | 07/11/16 | 10 | |||
| 07/04/16 | 07/12/16 | 8 | ||||
| 07/05/16 | 07/13/16 | 8 | ||||
| Mexico | 03/18/16 | 03/28/16 | 10 | |||
| Morocco | 09/07/16 | 09/15/16 | 8 | |||
| 09/08/16 | 09/16/16 | 8 | ||||
| 09/09/16 | 09/19/16 | 10 | ||||
| 2016 | ||||||
| Country | Trade
Date |
Settlement
Date |
Number
of Days to Settle | |||
| Namibia | 03/14/16 | 03/22/16 | 8 | |||
| 03/15/16 | 03/23/16 | 8 | ||||
| 03/16/16 | 03/24/16 | 8 | ||||
| 03/17/16 | 03/29/16 | 12 | ||||
| 03/18/16 | 03/30/16 | 12 | ||||
| 03/22/16 | 03/31/16 | 9 | ||||
| 03/23/16 | 04/01/16 | 9 | ||||
| 03/24/16 | 04/04/16 | 11 | ||||
| 04/20/16 | 04/28/16 | 8 | ||||
| 04/21/16 | 04/29/16 | 8 | ||||
| 04/22/16 | 05/03/16 | 11 | ||||
| 04/25/16 | 05/06/16 | 11 | ||||
| 04/26/16 | 05/09/16 | 13 | ||||
| 04/28/16 | 05/10/16 | 12 | ||||
| 04/29/16 | 05/11/16 | 12 | ||||
| 05/03/16 | 05/12/16 | 9 | ||||
| 05/18/16 | 05/26/16 | 8 | ||||
| 05/19/16 | 05/27/16 | 8 | ||||
| 05/20/16 | 05/30/16 | 10 | ||||
| 05/23/16 | 05/31/16 | 8 | ||||
| 05/24/16 | 06/01/16 | 8 | ||||
| 06/09/16 | 06/17/16 | 8 | ||||
| 06/10/16 | 06/20/16 | 10 | ||||
| 06/13/16 | 06/21/16 | 8 | ||||
| 06/14/16 | 06/22/16 | 8 | ||||
| 06/15/16 | 06/23/16 | 8 | ||||
| 08/02/16 | 08/10/16 | 8 | ||||
| 08/03/16 | 08/11/16 | 8 | ||||
| 08/04/16 | 08/12/16 | 8 | ||||
| 08/05/16 | 08/15/16 | 10 | ||||
| 08/08/16 | 08/16/16 | 8 | ||||
| 08/19/16 | 08/29/16 | 10 | ||||
| 08/22/16 | 08/30/16 | 8 | ||||
| 08/23/16 | 08/31/16 | 8 | ||||
| 08/24/16 | 09/01/16 | 8 | ||||
| 08/25/16 | 09/02/16 | 8 | ||||
| 12/09/16 | 12/19/16 | 10 | ||||
| 12/12/16 | 12/20/16 | 8 | ||||
| 12/13/16 | 12/21/16 | 8 | ||||
| 12/14/16 | 12/22/16 | 8 | ||||
| 12/15/16 | 12/23/16 | 8 | ||||
| 12/19/16 | 12/27/16 | 8 | ||||
| 12/20/16 | 12/28/16 | 8 | ||||
| 12/21/16 | 12/29/16 | 8 | ||||
| 12/22/16 | 12/30/16 | 8 | ||||
| 12/23/16 | 01/03/17 | 11 | ||||
| 12/27/16 | 01/04/17 | 8 | ||||
| 12/28/16 | 01/05/17 | 8 | ||||
| 12/29/16 | 01/06/17 | 8 | ||||
| 2016 | ||||||
| Country | Trade
Date |
Settlement
Date |
Number
of Days to Settle | |||
| 12/30/16 | 01/09/17 | 10 | ||||
| New Zealand | 03/21/16 | 03/29/16 | 8 | |||
| 03/22/16 | 03/30/16 | 8 | ||||
| 03/23/16 | 03/31/16 | 8 | ||||
| 12/20/16 | 12/28/16 | 8 | ||||
| 12/21/16 | 12/29/16 | 8 | ||||
| 12/22/16 | 01/04/17 | 13 | ||||
| 12/28/16 | 01/05/17 | 8 | ||||
| 12/29/16 | 01/06/17 | 8 | ||||
| Norway | 03/21/16 | 03/29/16 | 8 | |||
| 03/22/16 | 03/30/16 | 8 | ||||
| Oman | 070/3/16 | 07/11/16 | 8 | |||
| 07/04/16 | 07/12/16 | 8 | ||||
| 07/05/16 | 07/13/16 | 8 | ||||
| 09/06/16 | 09/15/16 | 9 | ||||
| 09/07/16 | 09/18/16 | 11 | ||||
| 09/08/16 | 09/19/16 | 11 | ||||
| Pakistan | 09/08/16 | 09/19/16 | 11 | |||
| 09/09/16 | 09/20/16 | 11 | ||||
| Palestine | 06/30/16 | 07/10/16 | 10 | |||
| 07/03/16 | 07/11/16 | 8 | ||||
| 07/04/16 | 07/12/16 | 8 | ||||
| 09/06/16 | 09/15/16 | 9 | ||||
| 09/07/16 | 09/18/16 | 11 | ||||
| 09/08/16 | 09/19/16 | 11 | ||||
| The Philippines | 10/26/16 | 11/03/16 | 8 | |||
| 10/27/16 | 11/04/16 | 8 | ||||
| 10/28/16 | 11/07/16 | 10 | ||||
| Qatar | 07/03/16 | 07/12/16 | 9 | |||
| 07/04/16 | 07/13/16 | 9 | ||||
| 07/05/16 | 07/14/16 | 9 | ||||
| 09/06/16 | 09/18/16 | 12 | ||||
| 09/07/16 | 09/19/16 | 12 | ||||
| 09/08/16 | 09/20/16 | 12 | ||||
| Saudi Arabia | 06/30/16 | 07/12/16 | 12 | |||
| 07/03/16 | 07/13/16 | 10 | ||||
| 09/07/16 | 09/18/16 | 11 | ||||
| 09/08/16 | 09/19/16 | 11 | ||||
| Serbia | 04/26/16 | 05/04/16 | 8 | |||
| 04/27/16 | 05/05/16 | 8 | ||||
| 04/28/16 | 05/06/16 | 8 | ||||
| 2016 | ||||||
| Country | Trade
Date |
Settlement
Date |
Number
of Days to Settle | |||
| The Slovak Republic | 12/22/16 | 01/02/17 | 11 | |||
| 12/23/16 | 01/03/17 | 11 | ||||
| South Africa | 03/14/16 | 03/22/16 | 8 | |||
| 03/15/16 | 03/23/16 | 8 | ||||
| 03/16/16 | 03/24/16 | 8 | ||||
| 03/17/16 | 03/29/16 | 12 | ||||
| 03/18/16 | 03/30/16 | 12 | ||||
| 03/22/16 | 03/31/16 | 9 | ||||
| 03/23/16 | 04/01/16 | 9 | ||||
| 03/24/16 | 04/04/16 | 11 | ||||
| 04/20/16 | 04/28/16 | 8 | ||||
| 04/21/16 | 04/29/16 | 8 | ||||
| 04/22/16 | 05/03/16 | 11 | ||||
| 04/25/16 | 05/04/16 | 9 | ||||
| 04/26/16 | 05/05/16 | 9 | ||||
| 04/28/16 | 05/06/16 | 8 | ||||
| 04/29/16 | 05/09/16 | 10 | ||||
| 06/09/16 | 06/17/16 | 8 | ||||
| 06/10/16 | 06/20/16 | 10 | ||||
| 06/13/16 | 06/21/16 | 8 | ||||
| 06/14/16 | 06/22/16 | 8 | ||||
| 06/15/16 | 06/23/16 | 8 | ||||
| 08/02/16 | 08/10/16 | 8 | ||||
| 08/03/16 | 08/11/16 | 8 | ||||
| 08/04/16 | 08/12/16 | 8 | ||||
| 08/05/16 | 08/15/16 | 10 | ||||
| 08/08/16 | 08/16/16 | 8 | ||||
| 12/09/16 | 12/19/16 | 10 | ||||
| 12/12/16 | 12/20/16 | 8 | ||||
| 12/13/16 | 12/21/16 | 8 | ||||
| 12/14/16 | 12/22/16 | 8 | ||||
| 12/15/16 | 12/28/16 | 13 | ||||
| 12/16/16 | 12/28/16 | 12 | ||||
| 12/19/16 | 12/29/16 | 10 | ||||
| 12/20/16 | 01/02/17 | 13 | ||||
| 12/21/16 | 01/03/17 | 13 | ||||
| 12/22/16 | 01/04/17 | 13 | ||||
| 12/28/16 | 01/05/17 | 8 | ||||
| 12/29/16 | 01/06/17 | 8 | ||||
| Srpska | 01/04/16 | 01/12/16 | 8 | |||
| 01/05/16 | 01/13/16 | 8 | ||||
| Swaziland | 03/18/16 | 03/29/16 | 11 | |||
| 03/21/16 | 03/30/16 | 9 | ||||
| 03/22/16 | 03/31/16 | 9 | ||||
| 03/23/16 | 04/01/16 | 9 | ||||
| 03/24/16 | 04/04/16 | 11 | ||||
| 2016 | ||||||
| Country | Trade
Date |
Settlement
Date |
Number
of Days to Settle | |||
| 04/12/16 | 04/20/16 | 8 | ||||
| 04/13/16 | 04/21/16 | 8 | ||||
| 04/14/16 | 04/22/16 | 8 | ||||
| 04/15/16 | 04/26/16 | 11 | ||||
| 04/18/16 | 04/27/16 | 9 | ||||
| 04/20/16 | 04/28/16 | 8 | ||||
| 04/21/16 | 04/29/16 | 8 | ||||
| 04/22/16 | 05/02/16 | 10 | ||||
| 04/28/16 | 05/06/16 | 8 | ||||
| 04/29/16 | 05/09/16 | 10 | ||||
| 05/02/16 | 05/10/16 | 8 | ||||
| 05/03/16 | 05/11/16 | 8 | ||||
| 05/04/16 | 05/12/16 | 8 | ||||
| 07/15/16 | 07/25/16 | 10 | ||||
| 07/18/16 | 07/26/16 | 8 | ||||
| 07/19/16 | 07/27/16 | 8 | ||||
| 07/20/16 | 07/28/16 | 8 | ||||
| 07/21/16 | 07/29/16 | 8 | ||||
| 08/30/16 | 09/07/16 | 8 | ||||
| 08/31/16 | 09/08/16 | 8 | ||||
| 09/01/16 | 09/09/16 | 8 | ||||
| 09/02/16 | 09/12/16 | 10 | ||||
| 09/05/16 | 09/13/16 | 8 | ||||
| 12/19/16 | 12/27/16 | 8 | ||||
| 12/20/16 | 12/28/16 | 8 | ||||
| 12/21/16 | 12/29/16 | 8 | ||||
| 12/22/16 | 12/30/16 | 8 | ||||
| 12/23/16 | 01/03/17 | 11 | ||||
| 12/27/16 | 01/04/17 | 8 | ||||
| 12/28/16 | 01/05/17 | 8 | ||||
| 12/29/16 | 01/06/17 | 8 | ||||
| 12/30/16 | 01/09/17 | 10 | ||||
| Taiwan | 02/02/16 | 02/15/16 | 13 | |||
| 02/03/16 | 02/16/16 | 13 | ||||
| Thailand | 04/08/16 | 04/18/16 | 10 | |||
| 04/11/16 | 04/19/16 | 8 | ||||
| 04/12/16 | 04/20/16 | 8 | ||||
| 04/29/16 | 05/09/16 | 10 | ||||
| Trinidad and Tobago | 03/23/16 | 03/31/16 | 8 | |||
| 03/24/16 | 04/01/16 | 8 | ||||
| Tunisia | 06/30/16 | 07/08/16 | 8 | |||
| 07/01/16 | 07/11/16 | 10 | ||||
| 07/04/16 | 07/12/16 | 8 | ||||
| Turkey | 06/30/16 | 07/11/16 | 11 | |||
| 07/01/16 | 07/12/16 | 11 | ||||
| 2016 | ||||||
| Country | Trade
Date |
Settlement
Date |
Number
of Days to Settle | |||
| 09/08/16 | 09/19/16 | 11 | ||||
| 09/09/16 | 09/20/16 | 11 | ||||
| Uganda | 01/19/16 | 01/27/16 | 8 | |||
| 01/20/16 | 01/28/16 | 8 | ||||
| 01/21/16 | 01/29/16 | 8 | ||||
| 01/22/16 | 02/01/16 | 10 | ||||
| 01/25/16 | 02/02/16 | 8 | ||||
| 02/09/16 | 02/17/16 | 8 | ||||
| 02/10/16 | 02/18/16 | 8 | ||||
| 02/11/16 | 02/19/16 | 8 | ||||
| 02/12/16 | 02/22/16 | 10 | ||||
| 02/15/16 | 02/23/16 | 8 | ||||
| 03/01/16 | 03/09/16 | 8 | ||||
| 03/02/16 | 03/10/16 | 8 | ||||
| 03/03/16 | 03/11/16 | 8 | ||||
| 03/04/16 | 03/14/16 | 10 | ||||
| 03/07/16 | 03/15/16 | 8 | ||||
| 03/18/16 | 03/29/16 | 11 | ||||
| 03/21/16 | 03/30/16 | 9 | ||||
| 03/22/16 | 03/31/16 | 9 | ||||
| 03/23/16 | 04/01/16 | 9 | ||||
| 03/24/16 | 04/04/16 | 11 | ||||
| 05/27/16 | 06/06/16 | 10 | ||||
| 05/30/16 | 06/07/16 | 8 | ||||
| 05/31/16 | 06/08/16 | 8 | ||||
| 06/01/16 | 06/10/16 | 9 | ||||
| 06/02/16 | 06/13/16 | 11 | ||||
| 06/06/16 | 06/14/16 | 8 | ||||
| 06/07/16 | 06/15/16 | 8 | ||||
| 06/08/16 | 06/16/16 | 8 | ||||
| 12/19/16 | 12/27/16 | 8 | ||||
| 12/20/16 | 12/28/16 | 8 | ||||
| 12/21/16 | 12/29/16 | 8 | ||||
| 12/22/16 | 12/30/16 | 8 | ||||
| 12/23/16 | 01/03/17 | 11 | ||||
| 12/27/16 | 01/04/17 | 8 | ||||
| 12/28/16 | 01/05/17 | 8 | ||||
| 12/29/16 | 01/06/17 | 8 | ||||
| 12/30/16 | 01/09/17 | 10 | ||||
| Ukraine | 01/05/16 | 01/13/16 | 8 | |||
| The United Arab Emirates | 09/07/16 | 09/15/16 | 8 | |||
| 09/08/16 | 09/18/16 | 10 | ||||
| Vietnam | 02/03/16 | 02/15/16 | 12 | |||
| 02/04/16 | 02/16/16 | 12 | ||||
| 02/05/16 | 02/17/16 | 12 | ||||
| 2016 | ||||||
| Country | Trade
Date |
Settlement
Date |
Number
of Days to Settle | |||
| Zimbabwe | 03/18/16 | 03/29/16 | 11 | |||
| 03/21/16 | 03/30/16 | 9 | ||||
| 03/22/16 | 03/31/16 | 9 | ||||
| 03/23/16 | 04/01/16 | 9 | ||||
| 03/24/16 | 04/04/16 | 11 | ||||
| 04/11/16 | 04/19/16 | 8 | ||||
| 04/12/16 | 04/20/16 | 8 | ||||
| 04/13/16 | 04/21/16 | 8 | ||||
| 04/14/16 | 04/22/16 | 8 | ||||
| 04/15/16 | 04/25/16 | 10 | ||||
| 04/25/16 | 05/03/16 | 8 | ||||
| 04/26/16 | 05/04/16 | 8 | ||||
| 04/27/16 | 05/05/16 | 8 | ||||
| 04/28/16 | 05/06/16 | 8 | ||||
| 04/29/16 | 05/09/16 | 10 | ||||
| 05/18/16 | 05/26/16 | 8 | ||||
| 05/19/16 | 05/27/16 | 8 | ||||
| 05/20/16 | 05/30/16 | 10 | ||||
| 05/23/16 | 05/31/16 | 8 | ||||
| 05/24/16 | 06/01/16 | 8 | ||||
| 08/01/16 | 08/10/16 | 9 | ||||
| 08/02/16 | 08/11/16 | 9 | ||||
| 08/03/16 | 08/12/16 | 9 | ||||
| 08/04/16 | 08/15/16 | 11 | ||||
| 08/05/16 | 08/16/16 | 11 | ||||
| 12/15/16 | 12/23/16 | 8 | ||||
| 12/16/16 | 12/27/16 | 11 | ||||
| 12/19/16 | 12/28/16 | 9 | ||||
| 12/20/16 | 12/29/16 | 9 | ||||
| 12/21/16 | 12/30/16 | 9 | ||||
| 12/23/16 | 01/03/17 | 11 | ||||
| 12/27/16 | 01/04/17 | 8 | ||||
| 12/28/16 | 01/05/17 | 8 | ||||
| 12/29/16 | 01/06/17 | 8 | ||||
| 12/30/16 | 01/09/17 | 10 | ||||
| 2017 | ||||||
| Country | Trade
Date |
Settlement
Date |
Number
of Days to Settle | |||
| Australia | 04/11/17 | 04/19/17 | 8 | |||
| 04/12/17 | 04/20/17 | 8 | ||||
| 04/13/17 | 04/21/17 | 8 | ||||
| Bangladesh | 06/20/17 | 06/28/17 | 8 | |||
| 06/21/17 | 06/29/17 | 8 | ||||
| 06/22/17 | 07/02/17 | 10 | ||||
| Brazil | 02/22/17 | 03/02/17 | 8 | |||
| 2017 | ||||||
| Country | Trade
Date |
Settlement
Date |
Number
of Days to Settle | |||
| 02/23/17 | 03/03/17 | 8 | ||||
| 02/24/17 | 03/06/17 | 11 | ||||
| China | 01/24/17 | 02/03/17 | 10 | |||
| 01/25/17 | 02/06/17 | 12 | ||||
| 01/26/17 | 02/07/17 | 12 | ||||
| 09/27/17 | 10/09/17 | 12 | ||||
| 09/28/17 | 10/10/17 | 12 | ||||
| 09/29/17 | 10/11/17 | 12 | ||||
| Costa Rica | 04/07/17 | 04/17/17 | 10 | |||
| 04/10/17 | 04/18/17 | 8 | ||||
| Indonesia | 06/21/17 | 07/03/17 | 12 | |||
| 06/22/17 | 07/04/17 | 12 | ||||
| 06/23/17 | 07/05/17 | 12 | ||||
| Israel | 04/06/17 | 04/18/17 | 12 | |||
| 04/09/17 | 04/19/17 | 10 | ||||
| 10/02/17 | 10/15/17 | 13 | ||||
| 10/03/17 | 10/16/17 | 13 | ||||
| Japan | 04/28/17 | 05/08/17 | 10 | |||
| 05/01/17 | 05/09/17 | 8 | ||||
| 05/02/17 | 05/10/17 | 8 | ||||
| Jordan | 06/21/17 | 06/29/17 | 8 | |||
| 06/22/17 | 07/02/17 | 10 | ||||
| Malawi | 01/09/17 | 01/17/17 | 8 | |||
| 01/10/17 | 01/18/17 | 8 | ||||
| 01/11/17 | 01/19/17 | 8 | ||||
| 01/12/17 | 01/20/17 | 8 | ||||
| 01/13/17 | 01/23/17 | 10 | ||||
| 02/24/17 | 03/06/17 | 10 | ||||
| 02/27/17 | 03/07/17 | 8 | ||||
| 02/28/17 | 03/08/17 | 8 | ||||
| 03/01/17 | 03/09/17 | 8 | ||||
| 03/02/17 | 03/10/17 | 8 | ||||
| 04/07/17 | 04/18/17 | 11 | ||||
| 04/10/17 | 04/19/17 | 9 | ||||
| 04/11/17 | 04/20/17 | 9 | ||||
| 04/12/17 | 04/21/17 | 9 | ||||
| 04/13/17 | 04/24/17 | 11 | ||||
| 04/24/17 | 05/02/17 | 8 | ||||
| 04/25/17 | 05/03/17 | 8 | ||||
| 04/26/17 | 05/04/17 | 8 | ||||
| 04/27/17 | 05/05/17 | 8 | ||||
| 04/28/17 | 05/08/17 | 10 | ||||
| 05/08/17 | 05/16/17 | 8 | ||||
| 2017 | ||||||
| Country | Trade
Date |
Settlement
Date |
Number
of Days to Settle | |||
| 05/09/17 | 05/17/17 | 8 | ||||
| 05/10/17 | 05/18/17 | 8 | ||||
| 05/11/17 | 05/19/17 | 8 | ||||
| 05/12/17 | 05/22/17 | 10 | ||||
| 06/19/17 | 06/27/17 | 8 | ||||
| 06/20/17 | 06/28/17 | 8 | ||||
| 06/21/17 | 06/29/17 | 8 | ||||
| 06/22/17 | 06/30/17 | 8 | ||||
| 06/23/17 | 07/03/17 | 10 | ||||
| 06/29/17 | 07/07/17 | 8 | ||||
| 06/30/17 | 07/10/17 | 8 | ||||
| 07/03/17 | 07/11/17 | 8 | ||||
| 07/04/17 | 07/12/17 | 8 | ||||
| 07/05/17 | 07/13/17 | 8 | ||||
| 12/18/17 | 12/27/17 | 9 | ||||
| 12/19/17 | 12/28/17 | 9 | ||||
| 12/20/17 | 12/29/17 | 9 | ||||
| 12/21/17 | 01/02/18 | 12 | ||||
| 12/22/17 | 01/03/18 | 12 | ||||
| Malaysia | 01/24/17 | 02/01/17 | 8 | |||
| 01/25/17 | 02/02/17 | 8 | ||||
| 01/26/17 | 02/03/17 | 8 | ||||
| Namibia | 03/14/17 | 03/22/17 | 8 | |||
| 03/15/17 | 03/23/17 | 8 | ||||
| 03/16/17 | 03/24/17 | 8 | ||||
| 03/17/17 | 03/27/17 | 10 | ||||
| 03/20/17 | 03/28/17 | 8 | ||||
| 04/07/17 | 04/18/17 | 11 | ||||
| 04/10/17 | 04/19/17 | 9 | ||||
| 04/11/17 | 04/20/17 | 9 | ||||
| 04/12/17 | 04/21/17 | 9 | ||||
| 04/13/17 | 04/24/17 | 11 | ||||
| 04/20/17 | 04/28/17 | 8 | ||||
| 04/21/17 | 05/01/17 | 10 | ||||
| 04/24/17 | 05/02/17 | 8 | ||||
| 04/25/17 | 05/05/17 | 10 | ||||
| 04/26/17 | 05/08/17 | 12 | ||||
| 04/28/17 | 05/09/17 | 11 | ||||
| 05/02/17 | 05/10/17 | 8 | ||||
| 05/03/17 | 05/11/17 | 8 | ||||
| 05/18/17 | 05/26/17 | 8 | ||||
| 05/19/17 | 05/29/17 | 10 | ||||
| 05/22/17 | 05/30/17 | 8 | ||||
| 05/23/17 | 05/31/17 | 8 | ||||
| 05/24/17 | 06/01/17 | 8 | ||||
| 06/09/17 | 06/19/17 | 10 | ||||
| 06/12/17 | 06/20/17 | 8 | ||||
| 06/13/17 | 06/21/17 | 8 | ||||
| 2017 | ||||||
| Country | Trade
Date |
Settlement
Date |
Number
of Days to Settle | |||
| 06/14/17 | 06/22/17 | 8 | ||||
| 06/15/17 | 06/23/17 | 8 | ||||
| 08/02/17 | 08/10/17 | 8 | ||||
| 08/03/17 | 08/11/17 | 8 | ||||
| 08/04/17 | 08/14/17 | 10 | ||||
| 08/07/17 | 08/15/17 | 8 | ||||
| 08/08/17 | 08/16/17 | 8 | ||||
| 09/18/17 | 09/26/17 | 8 | ||||
| 09/19/17 | 09/27/17 | 8 | ||||
| 09/20/17 | 09/28/17 | 8 | ||||
| 09/21/17 | 09/29/17 | 8 | ||||
| 09/22/17 | 10/02/17 | 10 | ||||
| 12/04/17 | 12/12/17 | 8 | ||||
| 12/05/17 | 12/13/17 | 8 | ||||
| 12/06/17 | 12/14/17 | 8 | ||||
| 12/07/17 | 12/15/17 | 8 | ||||
| 12/08/17 | 12/18/17 | 10 | ||||
| 12/18/17 | 12/28/17 | 10 | ||||
| 12/19/17 | 12/29/17 | 10 | ||||
| 12/20/17 | 01/02/18 | 13 | ||||
| 12/21/17 | 01/03/18 | 13 | ||||
| 12/22/17 | 01/04/18 | 13 | ||||
| Norway | 04/10/17 | 04/18/17 | 8 | |||
| 04/11/17 | 04/19/17 | 8 | ||||
| Qatar | 06/20/17 | 06/28/17 | 8 | |||
| 06/21/17 | 06/29/17 | 8 | ||||
| 06/22/17 | 06/30/17 | 8 | ||||
| Saudi Arabia | 06/24/17 | 07/02/17 | 8 | |||
| 06/25/17 | 07/03/17 | 8 | ||||
| South Africa | 03/14/17 | 03/22/17 | 8 | |||
| 03/15/17 | 03/23/17 | 8 | ||||
| 03/16/17 | 03/24/17 | 8 | ||||
| 03/17/17 | 03/27/17 | 10 | ||||
| 03/20/17 | 03/28/17 | 8 | ||||
| 04/07/17 | 04/18/17 | 11 | ||||
| 04/10/17 | 04/19/17 | 9 | ||||
| 04/11/17 | 04/20/17 | 9 | ||||
| 04/12/17 | 04/21/17 | 9 | ||||
| 04/13/17 | 04/24/17 | 11 | ||||
| 04/20/17 | 04/28/17 | 8 | ||||
| 04/21/17 | 05/02/17 | 11 | ||||
| 04/24/17 | 05/03/17 | 9 | ||||
| 04/25/17 | 05/04/17 | 9 | ||||
| 04/26/17 | 05/05/17 | 9 | ||||
| 04/28/17 | 05/08/17 | 10 | ||||
| 06/09/17 | 06/19/17 | 10 | ||||
| 2017 | ||||||
| Country | Trade
Date |
Settlement
Date |
Number
of Days to Settle | |||
| 06/12/17 | 06/20/17 | 8 | ||||
| 06/13/17 | 06/21/17 | 8 | ||||
| 06/14/17 | 06/22/17 | 8 | ||||
| 06/15/17 | 06/23/17 | 8 | ||||
| 08/02/17 | 08/10/17 | 8 | ||||
| 08/03/17 | 08/11/17 | 8 | ||||
| 08/04/17 | 08/14/17 | 10 | ||||
| 08/07/17 | 08/15/17 | 8 | ||||
| 08/08/17 | 08/16/17 | 8 | ||||
| 09/18/17 | 09/26/17 | 8 | ||||
| 09/19/17 | 09/27/17 | 8 | ||||
| 09/20/17 | 09/28/17 | 8 | ||||
| 09/21/17 | 09/29/17 | 8 | ||||
| 09/22/17 | 10/02/17 | 10 | ||||
| 12/18/17 | 12/27/17 | 9 | ||||
| 12/19/17 | 12/28/17 | 9 | ||||
| 12/20/17 | 12/29/17 | 9 | ||||
| 12/21/17 | 01/03/18 | 13 | ||||
| 12/22/17 | 01/04/18 | 13 | ||||
| South Korea | 09/29/17 | 10/10/17 | 11 | |||
| 10/02/17 | 10/11/17 | 9 | ||||
| Sri Lanka | 04/07/17 | 04/17/17 | 10 | |||
| Swaziland | 04/07/17 | 04/18/17 | 11 | |||
| 04/10/17 | 04/20/17 | 10 | ||||
| 04/11/17 | 04/21/17 | 10 | ||||
| 04/12/17 | 04/24/17 | 12 | ||||
| 04/13/17 | 04/26/17 | 13 | ||||
| 04/18/17 | 04/27/17 | 9 | ||||
| 04/20/17 | 04/28/17 | 8 | ||||
| 04/21/17 | 05/02/17 | 11 | ||||
| 04/24/17 | 05/03/17 | 9 | ||||
| 04/26/17 | 05/04/17 | 8 | ||||
| 04/27/17 | 05/08/17 | 11 | ||||
| 04/28/17 | 05/09/17 | 11 | ||||
| 05/02/17 | 05/10/17 | 8 | ||||
| 05/03/17 | 05/11/17 | 8 | ||||
| 05/04/17 | 05/12/17 | 8 | ||||
| 08/30/17 | 09/07/17 | 8 | ||||
| 08/31/17 | 09/08/17 | 8 | ||||
| 09/01/17 | 09/11/17 | 10 | ||||
| 09/04/17 | 09/12/17 | 8 | ||||
| 09/05/17 | 09/13/17 | 8 | ||||
| 12/18/17 | 12/27/17 | 9 | ||||
| 12/19/17 | 12/28/17 | 9 | ||||
| 12/20/17 | 12/29/17 | 9 | ||||
| 12/21/17 | 01/02/18 | 12 | ||||
| 12/22/17 | 01/03/18 | 12 | ||||
| 2017 | ||||||
| Country | Trade
Date |
Settlement
Date |
Number
of Days to Settle | |||
| Taiwan | 01/23/17 | 02/02/17 | 10 | |||
| 01/24/17 | 02/03/17 | 10 | ||||
| Turkey | 08/28/17 | 09/05/17 | 8 | |||
| 08/29/17 | 09/06/17 | 8 | ||||
| Uganda | 01/19/17 | 01/27/17 | 8 | |||
| 01/20/17 | 01/30/17 | 10 | ||||
| 01/23/17 | 02/01/17 | 9 | ||||
| 01/24/17 | 02/02/17 | 9 | ||||
| 01/25/17 | 02/03/17 | 9 | ||||
| 02/09/17 | 02/17/17 | 8 | ||||
| 02/10/17 | 02/18/17 | 8 | ||||
| 02/13/17 | 02/21/17 | 8 | ||||
| 02/14/17 | 02/22/17 | 8 | ||||
| 02/15/17 | 02/23/17 | 8 | ||||
| 03/01/17 | 03/09/17 | 8 | ||||
| 03/02/17 | 03/10/17 | 8 | ||||
| 03/03/17 | 03/13/17 | 10 | ||||
| 03/06/17 | 03/14/17 | 8 | ||||
| 03/07/17 | 03/15/17 | 8 | ||||
| 04/07/17 | 04/18/17 | 11 | ||||
| 04/10/17 | 04/19/17 | 9 | ||||
| 04/11/17 | 04/20/17 | 9 | ||||
| 04/12/17 | 04/21/17 | 9 | ||||
| 04/13/17 | 04/24/17 | 11 | ||||
| 04/24/17 | 05/02/17 | 8 | ||||
| 04/25/17 | 05/03/17 | 8 | ||||
| 04/26/17 | 05/04/17 | 8 | ||||
| 04/27/17 | 05/05/17 | 8 | ||||
| 04/28/17 | 05/08/17 | 10 | ||||
| 06/02/17 | 06/12/17 | 10 | ||||
| 06/05/17 | 06/13/17 | 8 | ||||
| 06/06/17 | 06/14/17 | 8 | ||||
| 06/07/17 | 06/15/17 | 8 | ||||
| 06/08/17 | 06/16/17 | 8 | ||||
| 06/19/17 | 06/27/17 | 8 | ||||
| 06/20/17 | 06/28/17 | 8 | ||||
| 06/21/17 | 06/29/17 | 8 | ||||
| 06/22/17 | 06/30/17 | 8 | ||||
| 06/23/17 | 07/03/17 | 10 | ||||
| 06/30/17 | 07/10/17 | 10 | ||||
| 07/03/17 | 07/11/17 | 8 | ||||
| 07/04/17 | 07/12/17 | 8 | ||||
| 07/05/17 | 07/13/17 | 8 | ||||
| 07/06/17 | 07/14/17 | 8 | ||||
| 09/06/17 | 09/14/17 | 8 | ||||
| 09/07/17 | 09/15/17 | 8 | ||||
| 09/08/17 | 09/18/17 | 10 | ||||
| 2017 | ||||||
| Country | Trade
Date |
Settlement
Date |
Number
of Days to Settle | |||
| 09/11/17 | 09/19/17 | 8 | ||||
| 09/12/17 | 09/20/17 | 8 | ||||
| 10/02/17 | 10/10/17 | 8 | ||||
| 10/03/17 | 10/11/17 | 8 | ||||
| 10/04/17 | 10/12/17 | 8 | ||||
| 10/05/17 | 10/13/17 | 8 | ||||
| 10/06/17 | 10/16/17 | 10 | ||||
| 11/23/17 | 12/01/17 | 8 | ||||
| 11/24/17 | 12/04/17 | 10 | ||||
| 11/27/17 | 12/05/17 | 8 | ||||
| 11/28/17 | 12/06/17 | 8 | ||||
| 11/29/17 | 12/07/17 | 8 | ||||
| 12/18/17 | 12/27/17 | 9 | ||||
| 12/19/17 | 12/28/17 | 9 | ||||
| 12/20/17 | 12/29/17 | 9 | ||||
| 12/21/17 | 01/02/18 | 12 | ||||
| 12/22/17 | 01/03/18 | 12 | ||||
| Uruguay | 04/10/17 | 04/18/17 | 8 | |||
| 04/11/17 | 04/19/17 | 8 | ||||
| 04/12/17 | 04/20/17 | 8 | ||||
| Vietnam | 01/23/17 | 02/02/17 | 10 | |||
| 01/24/17 | 02/03/17 | 10 | ||||
| 01/25/17 | 02/06/17 | 12 | ||||
| Zimbabwe | 04/07/17 | 04/19/17 | 12 | |||
| 04/10/17 | 04/20/17 | 10 | ||||
| 04/11/17 | 04/21/17 | 10 | ||||
| 04/12/17 | 04/24/17 | 12 | ||||
| 04/13/17 | 04/25/17 | 12 | ||||
| 04/24/17 | 05/02/17 | 8 | ||||
| 04/25/17 | 05/03/17 | 8 | ||||
| 04/26/17 | 05/04/17 | 8 | ||||
| 04/27/17 | 05/05/17 | 8 | ||||
| 04/28/17 | 05/08/17 | 10 | ||||
| 05/18/17 | 05/26/17 | 8 | ||||
| 05/19/17 | 05/29/17 | 10 | ||||
| 05/22/17 | 05/30/17 | 8 | ||||
| 05/23/17 | 05/31/17 | 8 | ||||
| 05/24/17 | 06/01/17 | 8 | ||||
| 08/07/17 | 08/16/17 | 9 | ||||
| 08/08/17 | 08/17/17 | 9 | ||||
| 08/09/17 | 08/18/17 | 9 | ||||
| 08/10/17 | 08/21/17 | 11 | ||||
| 08/11/17 | 08/22/17 | 11 | ||||
| 12/15/17 | 12/27/17 | 12 | ||||
| 12/18/17 | 12/28/17 | 10 | ||||
| 12/19/17 | 12/29/17 | 10 | ||||
| 12/20/17 | 01/02/18 | 13 | ||||
| 2017 | ||||||
| Country | Trade
Date |
Settlement
Date |
Number
of Days to Settle | |||
| 12/21/17 | 01/03/18 | 13 | ||||
| * | These worst-case redemption cycles are based on information regarding regular holidays, which may be out of date. Based on changes in holidays, longer (worse) redemption cycles are possible. |
(as revised July 3, 2017)
| Funds | Ticker | Listing Exchange | ||
| iShares Core MSCI Emerging Markets ETF | IEMG | NYSE Arca | ||
| iShares Edge MSCI Min Vol Emerging Markets ETF | EEMV | NYSE Arca | ||
| iShares Edge MSCI Min Vol Global ETF | ACWV | NYSE Arca | ||
| iShares MSCI Brazil Capped ETF | EWZ | NYSE Arca | ||
| iShares MSCI BRIC ETF | BKF | NYSE Arca | ||
| iShares MSCI Chile Capped ETF | ECH | NYSE Arca | ||
| iShares MSCI Colombia Capped ETF | ICOL | NYSE Arca | ||
| iShares MSCI Emerging Markets Asia ETF | EEMA | NASDAQ | ||
| iShares MSCI Emerging Markets ETF | EEM | NYSE Arca | ||
| iShares MSCI Emerging Markets Small-Cap ETF | EEMS | NYSE Arca | ||
| iShares MSCI EM ESG Optimized ETF | ESGE | NASDAQ | ||
| iShares MSCI Frontier 100 ETF | FM | NYSE Arca | ||
| iShares MSCI Global Agriculture Producers ETF | VEGI | NYSE Arca | ||
| iShares MSCI Global Energy Producers ETF | FILL | NYSE Arca | ||
| iShares MSCI Global Metals & Mining Producers ETF | PICK | NYSE Arca | ||
| iShares MSCI Malaysia ETF | EWM | NYSE Arca | ||
| iShares MSCI South Korea Capped ETF | EWY | NYSE Arca | ||
| iShares MSCI Taiwan Capped ETF | EWT | NYSE Arca |
| • | iShares Core MSCI Emerging Markets ETF |
| • | iShares Edge MSCI Min Vol Emerging Markets ETF1 |
| • | iShares Edge MSCI Min Vol Global ETF2 |
| • | iShares MSCI Brazil Capped ETF |
| • | iShares MSCI BRIC ETF |
| • | iShares MSCI Chile Capped ETF |
| • | iShares MSCI Colombia Capped ETF |
| • | iShares MSCI Emerging Markets Asia ETF |
| • | iShares MSCI Emerging Markets ETF |
| • | iShares MSCI Emerging Markets Small-Cap ETF |
| • | iShares MSCI EM ESG Optimized ETF3 |
| • | iShares MSCI Frontier 100 ETF |
| • | iShares MSCI Global Agriculture Producers ETF |
| • | iShares MSCI Global Energy Producers ETF |
| • | iShares MSCI Global Metals & Mining Producers ETF |
| • | iShares MSCI Malaysia ETF |
| • | iShares MSCI South Korea Capped ETF |
| • | iShares MSCI Taiwan Capped ETF4 |
| 1 | On May 12, 2016, the name of the Fund changed from iShares MSCI Emerging Markets Minimum Volatility ETF to iShares Edge MSCI Min Vol Emerging Markets ETF. |
| 2 | On May 12, 2016, the name of the Fund changed from iShares MSCI All Country World Minimum Volatility ETF to iShares Edge MSCI Min Vol Global ETF. |
| 3 | On August 22, 2016, the name of the Fund changed from iShares MSCI EM ESG Select ETF to iShares MSCI EM ESG Optimized ETF, and the name of the Fund’s Underlying Index changed from MSCI EM ESG Select Index to MSCI Emerging Markets ESG Focus Index. |
| 4 | On December 1, 2016, the name of the Fund changed from iShares MSCI Taiwan ETF to iShares MSCI Taiwan Capped ETF, and the Fund’s Underlying Index changed from MSCI Taiwan Index to MSCI Taiwan 25/50 Index. |
| Diversified Funds | Non-Diversified Funds | |
| iShares Core MSCI Emerging Markets ETF | iShares MSCI Brazil Capped ETF | |
| iShares Edge MSCI Min Vol Emerging Markets ETF | iShares MSCI Chile Capped ETF | |
| iShares Edge MSCI Min Vol Global ETF | iShares MSCI Colombia Capped ETF | |
| iShares MSCI BRIC ETF | iShares MSCI EM ESG Optimized ETF | |
| iShares MSCI Emerging Markets Asia ETF | iShares MSCI Global Agriculture Producers ETF | |
| iShares MSCI Emerging Markets ETF | iShares MSCI Global Energy Producers ETF | |
| iShares MSCI Emerging Markets Small-Cap ETF | iShares MSCI Global Metals & Mining Producers ETF | |
| iShares MSCI Frontier 100 ETF | iShares MSCI Malaysia ETF | |
| iShares MSCI South Korea Capped ETF | ||
| iShares MSCI Taiwan Capped ETF |
| • | With respect to a foreign entity that holds the Indian assets directly, if the transferor of share or interest in such a foreign entity (along with its associated enterprises), at any time in the twelve months preceding the year of transfer neither holds the right of control or management in the foreign entity, nor holds voting power or share capital or interest exceeding 5% of the total voting power or total share capital in such foreign entity. |
| • | With respect to a foreign entity that holds the Indian assets indirectly, if the transferor of share or interest in such foreign entity (along with its associated enterprises), at any time in the twelve months preceding the year of transfer does not hold the right of control or management in relation to the foreign entity, which would entitle them to the right of control or management in the foreign entity which directly holds the Indian assets; or does not hold voting power or share capital or interest exceeding 5% of the total voting power or total share capital in the foreign entity, which results in holding the same share capital or voting power in the entity which directly holds the Indian assets. |
| • | creates rights, or obligations, which are not ordinarily created between persons dealing at arm's length; |
| • | results, directly or indirectly, in the misuse, or abuse, of the provisions of IT Act; |
| • | lacks commercial substance; or |
| • | is entered into, or carried out, by means, or in a manner, which are not ordinarily employed for bona fide purposes. |
| • | any arrangement where the aggregate tax benefit to all the parties of the arrangement in the relevant financial year does not exceed INR 30 Million; |
| • | foreign institutional investors (“FIIs”) that choose not to take any benefit under any tax treaty entered with India and has invested in listed or unlisted securities with prior permission of the competent authority in accordance with the applicable regulations; |
| • | non-resident investor in an FII who has invested in an FII, directly or indirectly, by way of an offshore derivative instrument or otherwise; or |
| • | any income derived from the transfer of investments made prior to August 30, 2010. |
| • | The iShares MSCI EM ESG Optimized ETF votes on the election of directors on a case-by-case basis. The iShares MSCI EM ESG Optimized ETF generally opposes slates of director nominees that are not comprised of a majority of independent directors and withholds votes from non-independent directors who sit on key board committees; |
| • | The iShares MSCI EM ESG Optimized ETF generally supports social, workforce and environmental proposals that promote “good corporate citizenship” and/or “environmental stewardship” while enhancing long term shareholder and stakeholder value and proposals that call for more detailed and comparable reporting of a company’s social, workforce and environmental performance; and |
| • | The iShares MSCI EM ESG Optimized ETF generally votes against anti-takeover proposals and proposals that limit the ability of shareholders to act independently of management. |
| • | MSCI Global Standard Indexes cover all investable large- and mid-cap securities by including approximately 85% of each market's free float-adjusted market capitalization. |
| • | MSCI Global Small Cap Indexes provide coverage to all companies with a market capitalization below that of the companies in the MSCI Global Standard Indexes by including above and beyond the coverage of the MSCI Global Standard Indexes. |
| • | Achieving global size integrity by ensuring that companies of comparable and relevant sizes are included in a given size segment across all markets in a composite index; and |
| • | Achieving consistent market coverage by ensuring that each market's size segment is represented in its proportional weight in the composite universe. |
| • | Semi-Annual Index Reviews (“SAIRs”), conducted on a fixed semi-annual timetable that systematically reassess the various dimensions of the equity universe for all markets; |
| • | Quarterly Index Reviews (“QIRs”), aimed at promptly reflecting other significant market events; and |
| • | Ongoing event-related changes, such as mergers, acquisitions, spin-offs, bankruptcies, reorganizations and other similar corporate events, which generally are implemented in the indexes as they occur. |
| • | The maximum weight of an index constituent will be the lower of 1.5% or 20 times its weight in the MSCI Global Standard Index; |
| • | The minimum weight of an index constituent will be 0.05%; |
| • | For countries in the MSCI Global Standard Index with weight greater than or equal to 2.5% in the Parent Index, the MSCI Global Minimum Volatility Indexes weight will not deviate by more than ±5% of its weight in the MSCI Global Standard Index; |
| • | For countries in the MSCI Global Standard Index with weight less than 2.5% in the Parent Index, the maximum MSCI Global Minimum Volatility Indexes weight will be three times its weight in the MSCI Global Standard Index; |
| • | Sector weights will not deviate by more than ±5% from its weight in the MSCI Global Standard Index; |
| • | Exposure to risk indices from Barra’s multi-factor risk model, including (i) Momentum; (ii) Value; (iii) Size; (iv) Size Nonlinearity; (v) Growth; (vi) Liquidity; and (vii) Financial Leverage will be limited to ±0.25 standard deviations relative to the MSCI Global Standard Index; exposure to the volatility risk index will be unlimited; and |
| • | The maximum one-way turnover will be 10%. |
| • | Poultry and Livestock: companies are included only if they are significantly involved in the breeding of animals by themselves or through contract farming; |
| • | Dairy: manufacturers of milk and milk products such as cheese and yogurt, are excluded due to the absence of revenue break up; |
| • | Sugar: manufacturers of sugar are included even if they do not farm sugarcane. Companies selling sweeteners, sugar free, syrups, etc. are excluded; |
| • | Edible oil: companies processing edible oil without cultivating the plantation are excluded; |
| • | Confectioneries and snacks: manufacturers of finished products are excluded due to their presence at the lower spectrum of the value chain; |
| • | Coffee: coffee companies are excluded due to their reliance on external parties for raw materials; and |
| • | Fishing: fishing companies are generally included whether they operate fisheries or receive their catch from the ocean. |
| 1. | Concentrate its investments in a particular industry, as that term is used in the Investment Company Act, except that each Fund will concentrate to approximately the same extent that its Underlying Index concentrates in the securities of a particular industry or group of industries. |
| 2. | Borrow money, except as permitted under the Investment Company Act. |
| 3. | Issue senior securities to the extent such issuance would violate the Investment Company Act. |
| 4. | Purchase or hold real estate, except each Fund may purchase and hold securities or other instruments that are secured by, or linked to, real estate or interests therein, securities of real estate investment trusts, mortgage-related securities and securities of issuers engaged in the real estate business, and each Fund may purchase and hold real estate as a result of the ownership of securities or other instruments. |
| 5. | Underwrite securities issued by others, except to the extent that the sale of portfolio securities by each Fund may be deemed to be an underwriting or as otherwise permitted by applicable law. |
| 6. | Purchase or sell commodities or commodity contracts, except as permitted by the Investment Company Act. |
| 7. | Make loans to the extent prohibited by the Investment Company Act. |
| a. | Purchase securities of other investment companies, except to the extent permitted by the Investment Company Act. As a matter of policy, however, each Fund will not purchase shares of any registered open-end investment company or registered unit investment trust, in reliance on Section 12(d)(1)(F) or (G) (the “fund of funds” provisions) of the Investment Company Act, at any time the Fund has knowledge that its shares are purchased by another investment company investor in reliance on the provisions of subparagraph (G) of Section 12(d)(1). |
| b. | Make short sales of securities or maintain a short position, except to the extent permitted by a Fund’s Prospectus and SAI, as amended from time to time, and applicable law. |
| 1. | Make loans, except as permitted under the 1940 Act, as interpreted, modified or otherwise permitted by regulatory authority having jurisdiction, from time to time; |
| 2. | Issue any senior security, except as permitted under the 1940 Act, as interpreted, modified or otherwise permitted by regulatory authority having jurisdiction, from time to time; |
| 3. | Pledge, hypothecate, mortgage or otherwise encumber its assets, except to secure permitted borrowings. (The deposit of underlying securities and other assets in escrow and collateral arrangements with respect to initial or variation margin for currency transactions and futures contracts will not be deemed to be pledges of the Fund’s assets); |
| 4. | Purchase, hold or deal in real estate, or oil, gas or mineral interests or leases, but the Fund may purchase and sell securities that are issued by companies that invest or deal in such assets; |
| 5. | Act as an underwriter of securities of other issuers, except to the extent the Fund may be deemed an underwriter in connection with the sale of securities in its portfolio; |
| 6. | Purchase securities on margin, except for such short-term credits as are necessary for the clearance of transactions, except that the Fund may make margin deposits in connection with transactions in currencies, options, futures and options on futures; |
| 7. | Sell securities short; or |
| 8. | Invest in commodities or commodity contracts, except that the Fund may buy and sell currencies and forward contracts with respect thereto, and may transact in futures contracts on securities, stock indices and currencies and options on such futures contracts and make margin deposits in connection with such contracts. |
| 1. | Concentrate its investments (i.e., invest 25% or more of its total assets in the securities of a particular industry or group of industries), except that each Fund will concentrate to approximately the same extent that its Underlying Index concentrates in the securities of such particular industry or group of industries. For purposes of this limitation, securities of the U.S. government (including its agencies and instrumentalities), repurchase agreements collateralized by U.S. government securities, and securities of state or municipal governments and their political subdivisions are not considered to be issued by members of any industry. |
| 2. | Borrow money, except that (i) each Fund may borrow from banks for temporary or emergency (not leveraging) purposes, including the meeting of redemption requests which might otherwise require the untimely disposition of securities; and (ii) each Fund may, to the extent consistent with its investment policies, enter into repurchase agreements, reverse repurchase agreements, forward roll transactions and similar investment strategies and techniques. To the extent that it engages in transactions described in (i) and (ii), each Fund will be limited so that no more than 33 1/3% of the value of its total assets (including the amount borrowed) is derived from such transactions. Any borrowings which come to exceed this amount will be reduced in accordance with applicable law. |
| 3. | Issue any senior security, except as permitted under the 1940 Act, as interpreted, modified or otherwise permitted by regulatory authority having jurisdiction, from time to time. |
| 4. | Make loans, except as permitted under the 1940 Act, as interpreted, modified or otherwise permitted by regulatory authority having jurisdiction, from time to time. |
| 5. | Purchase or sell real estate unless acquired as a result of ownership of securities or other instruments (but this |
| restriction shall not prevent each Fund from investing in securities of companies engaged in the real estate business or securities or other instruments backed by real estate or mortgages), or commodities or commodity contracts (but this restriction shall not prevent each Fund from investing in securities of companies engaged in the production, ownership or distribution of commodities or in commodity-related businesses for the iShares Frontier 100 ETF, iShares MSCI Global Agriculture Producers ETF, iShares MSCI Global Energy Producers ETF and iShares MSCI Global Metals & Mining Producers ETF or from trading in futures contracts and options on futures contracts, including options on currencies to the extent consistent with each Fund’s investment objective and policies). | |
| 6. | Engage in the business of underwriting securities issued by other persons, except to the extent that each Fund may technically be deemed to be an underwriter under the 1933 Act, in disposing of portfolio securities. |
| 1. | Lend any funds or other assets except through the purchase of all or a portion of an issue of securities or obligations of the type in which it is permitted to invest (including participation interests in such securities or obligations) and except that a Fund may lend its portfolio securities in an amount not to exceed 33 1/3% of the value of its total assets; |
| 2. | Issue senior securities or borrow money, except borrowings from banks for temporary or emergency purposes in an amount up to 33 1/3% of the value of the Fund’s total assets (including the amount borrowed), valued at the lesser of cost or market, less liabilities (not including the amount borrowed) valued at the time the borrowing is made, and the Fund will not purchase securities while borrowings in excess of 5% of the Fund’s total assets are outstanding, provided, that for purposes of this restriction, short-term credits necessary for the clearance of transactions are not considered borrowings; |
| 3. | Pledge, hypothecate, mortgage or otherwise encumber its assets, except to secure permitted borrowings. (The deposit of underlying securities and other assets in escrow and collateral arrangements with respect to initial or variation margin for currency transactions and futures contracts will not be deemed to be pledges of the Fund’s assets); |
| 4. | Purchase a security (other than obligations of the U.S. government, its agencies or instrumentalities) if as a result 25% or more of its total assets would be invested in a single issuer. (This restriction applies to the iShares MSCI South Korea Capped ETF only); |
| 5. | Purchase, hold or deal in real estate, or oil, gas or mineral interests or leases, but a Fund may purchase and sell securities that are issued by companies that invest or deal in such assets; |
| 6. | Act as an underwriter of securities of other issuers, except to the extent the Fund may be deemed an underwriter in connection with the sale of securities in its portfolio; |
| 7. | Purchase securities on margin, except for such short-term credits as are necessary for the clearance of transactions, except that a Fund may make margin deposits in connection with transactions in currencies, options, futures and options on futures; |
| 8. | Sell securities short; or |
| 9. | Invest in commodities or commodity contracts, except that a Fund may buy and sell currencies and forward contracts with respect thereto, and may transact in futures contracts on securities, stock indices and currencies and options on such futures contracts and make margin deposits in connection with such contracts. |
| 1. | Concentrate its investments (i.e., invest 25% or more of its total assets in the securities of a particular industry or group of industries), except that the Fund will concentrate to approximately the same extent that the Underlying Index concentrates in the securities of such particular industry or group of industries. For purposes of this limitation, securities of the U.S. government (including its agencies and instrumentalities), repurchase agreements collateralized by U.S. government securities, and securities of state or municipal governments and their political subdivisions are not considered to be issued by members of any industry. |
| 2. | Borrow money, except that (i) the Fund may borrow from banks for temporary or emergency (not leveraging) purposes, including the meeting of redemption requests which might otherwise require the untimely disposition of securities; and |
| (ii) the Fund may, to the extent consistent with its investment policies, enter into repurchase agreements, reverse repurchase agreements, forward roll transactions and similar investment strategies and techniques. To the extent that it engages in transactions described in (i) and (ii), the Fund will be limited so that no more than 33 1/3% of the value of its total assets (including the amount borrowed) is derived from such transactions. Any borrowings which come to exceed this amount will be reduced in accordance with applicable law. | |
| 3. | Issue “senior securities” as defined in the 1940 Act and the rules, regulations and orders thereunder, except as permitted under the 1940 Act and the rules, regulation and orders thereunder. |
| 4. | Make loans, except as permitted under the 1940 Act, and as interpreted, modified or otherwise permitted by regulatory authority having jurisdiction, from time to time. |
| 5. | Purchase or sell real estate unless acquired as a result of ownership of securities or other instruments (but this restriction shall not prevent the Fund from investing in securities of companies engaged in the real estate business or securities or other instruments backed by real estate or mortgages), or commodities or commodity contracts (but this restriction shall not prevent the Fund from trading in futures contracts and options on futures contracts, including options on currencies to the extent consistent with the Fund’s investment objective and policies). |
| 6. | Engage in the business of underwriting securities issued by other persons, except to the extent that the Fund may technically be deemed to be an underwriter under the 1933 Act, in disposing of portfolio securities. |
| Fund | Industry or Industries | |
| iShares MSCI Colombia Capped ETF | Banks | |
| iShares MSCI Frontier 100 ETF | Banks | |
| iShares MSCI Global Agriculture Producers ETF | Chemicals | |
| iShares MSCI Global Energy Producers ETF | Oil & Gas | |
| iShares MSCI Global Metals & Mining Producers ETF | Mining | |
| iShares MSCI Global Metals & Mining Producers ETF | Iron/ Steel | |
| iShares MSCI Malaysia ETF | Banks | |
| iShares MSCI South Korea Capped ETF | Semiconductors | |
| iShares MSCI Taiwan ETF | Semiconductors |
| • | The frequency of trades and quotes for the security; |
| • | The number of dealers wishing to purchase or sell the security and the number of other potential purchasers; |
| • | Dealer undertakings to make a market in the security; and |
| • | The nature of the security and the nature of the marketplace in which it trades (e.g., the time needed to dispose of the security, the method of soliciting offers and the mechanics of transfer). |
| Name (Age) | Position | Principal
Occupation(s) During the Past 5 Years |
Other
Directorships Held by Director | |||
| Robert
S. Kapito1 (59) |
Director
(since 2009). |
President, BlackRock, Inc. (since 2006); Vice Chairman of BlackRock, Inc. and Head of BlackRock’s Portfolio Management Group (since its formation in 1998) and BlackRock, Inc.’s predecessor entities (since 1988); Trustee, University of Pennsylvania (since 2009); President of Board of Directors, Hope & Heroes Children’s Cancer Fund (since 2002). | Director of BlackRock, Inc. (since 2006); Trustee of iShares Trust (since 2009); Trustee of iShares U.S. ETF Trust (since 2011). | |||
| Mark
K. Wiedman2 (46) |
Director (since 2013). | Senior Managing Director, BlackRock, Inc. (since 2014); Managing Director, BlackRock, Inc. (2007-2014); Global Head of BlackRock’s ETF and Index Investments Business (since 2016); Global Head of iShares (2011-2016); Head of Corporate Strategy, BlackRock, Inc. (2009-2011). | Trustee of iShares Trust (since 2013); Trustee of iShares U.S. ETF Trust (since 2013); Director of PennyMac Financial Services, Inc. (since 2008). |
| 1 | Robert S. Kapito is deemed to be an “interested person” (as defined in the 1940 Act) of the Company due to his affiliations with BlackRock, Inc. and its affiliates. |
| 2 | Mark K. Wiedman is deemed to be an “interested person” (as defined in the 1940 Act) of the Company due to his affiliations with BlackRock, Inc. and its affiliates. |
| Name (Age) | Position | Principal
Occupation(s) During the Past 5 Years |
Other
Directorships Held by Director | |||
| Cecilia
H. Herbert (68) |
Director
(since 2005); Independent Board Chair (since 2016). |
Trustee and Member of the Finance, Technology and Quality Committee of Stanford Health Care (since 2016); Trustee and Member of the Investment Committee, WNET, a New York public media company (since 2011); Chair (1994-2005) and Member (since 1992) of the Investment Committee, Archdiocese of San Francisco; Director (1998-2013) and President (2007-2011) of the Board of Directors, Catholic Charities CYO; Trustee (2002-2011) and Chair of the Finance and Investment Committee (2006-2010) of the Thacher School. | Trustee of iShares Trust (since 2005); Trustee of iShares U.S. ETF Trust (since 2011); Independent Board Chair of iShares Trust and iShares U.S. ETF Trust (since 2016); Trustee of Forward Funds (14 portfolios) (since 2009); Trustee of Salient MF Trust (4 portfolios) (since 2015). | |||
| Jane
D. Carlin (60) |
Director
(since 2015); Risk Committee Chair (since 2016). |
Consultant (since 2012); Managing Director and Global Head of Financial Holding Company Governance & Assurance and the Global Head of Operational Risk Management of Morgan Stanley (2006-2012). | Trustee of iShares Trust (since 2015); Trustee of iShares U.S. ETF Trust (since 2015); Director of PHH Corporation (mortgage solutions) (since 2012); Director of The Hanover Insurance Group, Inc. (since 2016). | |||
| Richard
L. Fagnani (62) |
Director
(since 2017); Equity Plus Committee Chair (since 2017). |
Partner, KPMG LLP (2002-2016). | Trustee of iShares Trust (since 2017); Trustee of iShares U.S. ETF Trust (since 2017). | |||
| Charles
A. Hurty (73) |
Director
(since 2005); Audit Committee Chair (since 2006). |
Retired; Partner, KPMG LLP (1968-2001). | Trustee of iShares Trust (since 2005); Trustee of iShares U.S. ETF Trust (since 2011); Director of SkyBridge Alternative Investments Multi-Adviser Hedge Fund Portfolios LLC (2 portfolios) (since 2002). | |||
| John
E. Kerrigan (61) |
Director
(since 2005); Securities Lending Committee Chair (since 2016). |
Chief Investment Officer, Santa Clara University (since 2002). | Trustee of iShares Trust (since 2005); Trustee of iShares U.S. ETF Trust (since 2011). | |||
| Drew
E. Lawton (58) |
Director
(since 2017); 15(c) Committee Chair (since 2017). |
Senior Managing Director of New York Life Insurance Company (2010-2015). | Trustee of iShares Trust (since 2017); Trustee of iShares U.S. ETF Trust (since 2017). | |||
| John
E. Martinez (56) |
Director
(since 2003); Fixed Income Plus Committee Chair (since 2016). |
Director of Real Estate Equity Exchange, Inc. (since 2005). | Trustee of iShares Trust (since 2003); Trustee of iShares U.S. ETF Trust (since 2011). |
| Name (Age) | Position | Principal
Occupation(s) During the Past 5 Years |
Other
Directorships Held by Director | |||
| Madhav
V. Rajan (52) |
Director
(since 2011); Nominating and Governance Committee Chair (since 2017). |
Dean, and George Pratt Shultz Professor of Accounting, University of Chicago Booth School of Business (since 2017); Robert K. Jaedicke Professor of Accounting, Stanford University Graduate School of Business (2001-2017); Professor of Law (by courtesy), Stanford Law School (2005-2017); Senior Associate Dean for Academic Affairs and Head of MBA Program, Stanford University Graduate School of Business (2010-2016). | Trustee
of iShares Trust (since 2011); Trustee of iShares U.S. ETF Trust (since 2011); Director, Cavium, Inc. (since 2013). |
| Name (Age) | Position | Principal
Occupation(s) During the Past 5 Years | ||
| Martin
Small (41) |
President (since 2016). | Managing Director, BlackRock, Inc. (since 2010); Head of U.S. iShares (since 2015); Co-Head of the U.S. Financial Markets Advisory Group, BlackRock, Inc. (2008-2014). | ||
| Jack
Gee (57) |
Treasurer
and Chief Financial Officer (since 2008). |
Managing Director, BlackRock, Inc. (since 2009); Senior Director of Fund Administration of Intermediary Investor Business, BGI (2009). | ||
| Charles
Park (49) |
Chief Compliance Officer (since 2006). | Chief Compliance Officer of BlackRock Advisors, LLC and the BlackRock-advised Funds in the Equity-Bond Complex, the Equity-Liquidity Complex and the Closed-End Complex (since 2014); Chief Compliance Officer of BFA (since 2006). | ||
| Benjamin
Archibald (42) |
Secretary (since 2015). | Managing Director, BlackRock, Inc. (since 2014); Director, BlackRock, Inc. (2010-2013); Secretary of the BlackRock-advised mutual funds (since 2012). | ||
| Steve
Messinger (55) |
Executive
Vice President (since 2016). |
Managing Director, BlackRock, Inc. (2007-2014 and since 2016); Managing Director, Beacon Consulting Group (2014-2016). | ||
| Scott
Radell (48) |
Executive
Vice President (since 2012). |
Managing Director, BlackRock, Inc. (since 2009); Head of Portfolio Solutions, BlackRock, Inc. (since 2009). |
| Name (Age) | Position | Principal
Occupation(s) During the Past 5 Years | ||
| Alan
Mason (56) |
Executive
Vice President (since 2016). |
Managing Director, BlackRock, Inc. (since 2009). |
| Name of Director | Fund | Dollar
Range of Equity Securities in the Fund |
Aggregate
Dollar Range of Equity Securities in all Registered Investment Companies Overseen by Director in Family of Investment Companies | |||
| Robert S. Kapito | None | None | None | |||
| Mark Wiedman | iShares Core MSCI EAFE ETF | $50,001-$100,000 | Over $100,000 | |||
| iShares Core MSCI Emerging Markets ETF | $50,001-$100,000 | |||||
| iShares Core S&P Total U.S. Stock Market ETF | Over $100,000 | |||||
| John E. Martinez | iShares Core MSCI Emerging Markets ETF | $50,001-$100,000 | Over $100,000 | |||
| iShares Core S&P 500 ETF | Over $100,000 | |||||
| iShares Core S&P Mid-Cap ETF | $10,001-$50,000 | |||||
| iShares Core S&P Small-Cap ETF | $10,001-$50,000 | |||||
| iShares Core S&P Total U.S. Stock Market ETF | $1-$10,000 | |||||
| iShares Global Consumer Staples ETF | Over $100,000 | |||||
| iShares MSCI All Country Asia ex Japan ETF | Over $100,000 | |||||
| iShares MSCI EAFE ETF | Over $100,000 | |||||
| iShares Russell 1000 ETF | Over $100,000 | |||||
| iShares Russell 1000 Value ETF | Over $100,000 | |||||
| iShares Russell 2000 ETF | Over $100,000 | |||||
| iShares TIPS Bond ETF | $50,001-$100,000 | |||||
| Cecilia H. Herbert | iShares China Large-Cap ETF | Over $100,000 | Over $100,000 | |||
| iShares Core Dividend Growth ETF | $10,001-$50,000 |
| Name of Director | Fund | Dollar
Range of Equity Securities in the Fund |
Aggregate
Dollar Range of Equity Securities in all Registered Investment Companies Overseen by Director in Family of Investment Companies | |||
| iShares Core High Dividend ETF | $1-$10,000 | |||||
| iShares Core MSCI Emerging Markets ETF | $10,001-$50,000 | |||||
| iShares Core MSCI Total International Stock ETF | $10,001-$50,000 | |||||
| iShares Core S&P Small-Cap ETF | $1-$10,000 | |||||
| iShares Core S&P Total U.S. Stock Market ETF | $10,001-$50,000 | |||||
| iShares Core S&P U.S. Growth ETF | $50,001-$100,000 | |||||
| iShares Core S&P U.S. Value ETF | $10,001-$50,000 | |||||
| iShares iBoxx $ High Yield Corporate Bond ETF | $10,001-$50,000 | |||||
| iShares International Select Dividend ETF | $1-$10,000 | |||||
| iShares MSCI EAFE ETF | $1-$10,000 | |||||
| iShares MSCI Emerging Markets ETF | $1-$10,000 | |||||
| iShares MSCI Japan ETF | $10,001-$50,000 | |||||
| iShares National Muni Bond ETF | $10,001-$50,000 | |||||
| iShares U.S. Preferred Stock ETF | $10,001-$50,000 | |||||
| Charles A. Hurty | iShares China Large-Cap ETF | $10,001-$50,000 | Over $100,000 | |||
| iShares Core Growth Allocation ETF | $50,001-$100,000 | |||||
| iShares Core High Dividend ETF | $10,001-$50,000 | |||||
| iShares Core Moderate Allocation ETF | $50,001-$100,000 | |||||
| iShares Core MSCI Emerging Markets ETF | $10,001-$50,000 | |||||
| iShares Core S&P 500 ETF | $10,001-$50,000 | |||||
| iShares Global Energy ETF | $10,001-$50,000 | |||||
| iShares Global Healthcare ETF | $10,001-$50,000 | |||||
| iShares Global Tech ETF | $10,001-$50,000 | |||||
| iShares MSCI EAFE ETF | $10,001-$50,000 | |||||
| iShares Russell 2000 ETF | $10,001-$50,000 | |||||
| iShares U.S. Basic Materials ETF | $10,001-$50,000 | |||||
| iShares U.S. Energy ETF | $10,001-$50,000 | |||||
| iShares U.S. Technology ETF | $50,001-$100,000 | |||||
| John E. Kerrigan | iShares MSCI ACWI ETF | $10,001-$50,000 | Over $100,000 | |||
| iShares MSCI ACWI ex U.S. ETF | Over $100,000 | |||||
| iShares Short-Term National Muni Bond ETF | Over $100,000 | |||||
| Madhav V. Rajan | iShares Core Dividend Growth ETF | Over $100,000 | Over $100,000 | |||
| iShares Core High Dividend ETF | Over $100,000 | |||||
| iShares Core MSCI Emerging Markets ETF | Over $100,000 |
| Name of Director | Fund | Dollar
Range of Equity Securities in the Fund |
Aggregate
Dollar Range of Equity Securities in all Registered Investment Companies Overseen by Director in Family of Investment Companies | |||
| iShares Core S&P 500 ETF | Over $100,000 | |||||
| iShares iBoxx $ High Yield Corporate Bond ETF | Over $100,000 | |||||
| iShares iBoxx $ Investment Grade Corporate Bond ETF | Over $100,000 | |||||
| iShares Russell 2000 ETF | Over $100,000 | |||||
| iShares Select Dividend ETF | Over $100,000 | |||||
| Jane D. Carlin | iShares Core MSCI EAFE ETF | $50,001-$100,000 | Over $100,000 | |||
| iShares Core S&P Small-Cap ETF | $10,001-$50,000 | |||||
| iShares Global Tech ETF | $10,001-$50,000 |
| Name of Director | iShares
Core MSCI Emerging Markets ETF |
iShares
Edge MSCI Min Vol Emerging Markets ETF |
iShares
Edge MSCI Min Vol Global ETF |
iShares
MSCI Brazil Capped ETF | ||||
| Independent Directors: | ||||||||
| Robert H. Silver1 | $ 3,320 | $ 907 | $ 673 | $820 | ||||
| John E. Martinez | 6,761 | 2,625 | 1,153 | 1,406 | ||||
| Cecilia H. Herbert | 7,199 | 2,744 | 1,242 | 1,514 | ||||
| Charles A. Hurty | 5,954 | 1,627 | 1,207 | 1,470 | ||||
| John E. Kerrigan | 5,692 | 1,555 | 1,153 | 1,406 | ||||
| Madhav V. Rajan | 5,692 | 1,555 | 1,153 | 1,406 | ||||
| Jane D. Carlin | 5,692 | 1,555 | 1,153 | 1,406 |
| Name of Director | iShares
Core MSCI Emerging Markets ETF |
iShares
Edge MSCI Min Vol Emerging Markets ETF |
iShares
Edge MSCI Min Vol Global ETF |
iShares
MSCI Brazil Capped ETF | ||||
| Interested Directors: | ||||||||
| Robert S. Kapito | $0 | $0 | $0 | $0 | ||||
| Mark K. Wiedman | 0 | 0 | 0 | 0 | ||||
| Advisory Board Members: | ||||||||
| Drew E. Lawton2 | Not Applicable | Not Applicable | Not Applicable | Not Applicable | ||||
| Richard L. Fagnani3 | Not Applicable | Not Applicable | Not Applicable | Not Applicable |
| Name of Director | iShares
MSCI BRIC ETF |
iShares
MSCI Chile Capped ETF |
iShares
MSCI Colombia Capped ETF |
iShares
MSCI Emerging Markets Asia ETF | ||||
| Independent Directors: | ||||||||
| Robert H. Silver1 | $ 38 | $ 69 | $4 | $46 | ||||
| John E. Martinez | 1,135 | 118 | 6 | 1,148 | ||||
| Cecilia H. Herbert | 1,140 | 127 | 7 | 1,154 | ||||
| Charles A. Hurty | 69 | 124 | 6 | 82 | ||||
| John E. Kerrigan | 66 | 118 | 6 | 78 | ||||
| Madhav V. Rajan | 66 | 118 | 6 | 78 | ||||
| Jane D. Carlin | 66 | 118 | 6 | 78 | ||||
| Interested Directors: | ||||||||
| Robert S. Kapito | $ 0 | $ 0 | $0 | $0 | ||||
| Mark K. Wiedman | 0 | 0 | 0 | 0 | ||||
| Advisory Board Members: | ||||||||
| Drew E. Lawton2 | Not Applicable | Not Applicable | Not Applicable | Not Applicable | ||||
| Richard L. Fagnani3 | Not Applicable | Not Applicable | Not Applicable | Not Applicable |
| Name of Director | iShares
MSCI Emerging Markets ETF |
iShares
MSCI Emerging Markets Small-Cap ETF |
iShares
MSCI EM ESG Optimized ETF4 |
iShares
MSCI Frontier 100 ETF | ||||
| Independent Directors: | ||||||||
| Robert H. Silver1 | $ 6,430 | $ 26 | $ 1 | $86 | ||||
| John E. Martinez | 12,092 | 1,113 | 2 | 147 | ||||
| Cecilia H. Herbert | 12,940 | 1,117 | 2 | 159 | ||||
| Charles A. Hurty | 11,531 | 46 | 2 | 154 | ||||
| John E. Kerrigan | 11,023 | 44 | 2 | 147 | ||||
| Madhav V. Rajan | 11,023 | 44 | 2 | 147 | ||||
| Jane D. Carlin | 11,023 | 44 | 2 | 147 | ||||
| Interested Directors: | ||||||||
| Name of Director | iShares
MSCI Emerging Markets ETF |
iShares
MSCI Emerging Markets Small-Cap ETF |
iShares
MSCI EM ESG Optimized ETF4 |
iShares
MSCI Frontier 100 ETF | ||||
| Robert S. Kapito | $0 | $0 | $0 | $0 | ||||
| Mark K. Wiedman | 0 | 0 | 0 | 0 | ||||
| Advisory Board Members: | ||||||||
| Drew E. Lawton2 | Not Applicable | Not Applicable | Not Applicable | Not Applicable | ||||
| Richard L. Fagnani3 | Not Applicable | Not Applicable | Not Applicable | Not Applicable |
| Name of Director | iShares
MSCI Global Agriculture Producers ETF |
iShares
MSCI Global Energy Producers ETF |
iShares
MSCI Global Metals & Mining Producers ETF |
iShares
MSCI Malaysia ETF | ||||
| Independent Directors: | ||||||||
| Robert H. Silver1 | $ 6 | $ 8 | $ 47 | $71 | ||||
| John E. Martinez | 10 | 14 | 81 | 121 | ||||
| Cecilia H. Herbert | 11 | 15 | 87 | 131 | ||||
| Charles A. Hurty | 11 | 14 | 84 | 127 | ||||
| John E. Kerrigan | 10 | 14 | 81 | 121 | ||||
| Madhav V. Rajan | 10 | 14 | 81 | 121 | ||||
| Jane D. Carlin | 10 | 14 | 81 | 121 | ||||
| Interested Directors: | ||||||||
| Robert S. Kapito | $ 0 | $ 0 | $ 0 | $0 | ||||
| Mark K. Wiedman | 0 | 0 | 0 | 0 | ||||
| Advisory Board Members: | ||||||||
| Drew E. Lawton2 | Not Applicable | Not Applicable | Not Applicable | Not Applicable | ||||
| Richard L. Fagnani3 | Not Applicable | Not Applicable | Not Applicable | Not Applicable |
| Name of Director | iShares
MSCI South Korea Capped ETF |
iShares
MSCI Taiwan Capped ETF | ||
| Independent Directors: | ||||
| Robert H. Silver1 | $ 723 | $559 | ||
| John E. Martinez | 1,239 | 959 | ||
| Cecilia H. Herbert | 1,334 | 1,033 | ||
| Charles A. Hurty | 1,296 | 1,003 | ||
| John E. Kerrigan | 1,239 | 959 | ||
| Madhav V. Rajan | 1,239 | 959 | ||
| Jane D. Carlin | 1,239 | 959 | ||
| Interested Directors: | ||||
| Robert S. Kapito | $ 0 | $0 | ||
| Mark K. Wiedman | 0 | 0 |
| Name of Director | iShares
MSCI South Korea Capped ETF |
iShares
MSCI Taiwan Capped ETF | ||
| Advisory Board Members: | ||||
| Drew E. Lawton2 | Not Applicable | Not Applicable | ||
| Richard L. Fagnani3 | Not Applicable | Not Applicable |
| Name of Director | Pension
or Retirement Benefits Accrued As Part of Company Expenses5 |
Estimated
Annual Benefits Upon Retirement5 |
Total
Compensation From the Funds and Fund Complex6 | |||
| Independent Directors: | ||||||
| Robert H. Silver1 | Not Applicable | Not Applicable | $350,000 | |||
| John E. Martinez | Not Applicable | Not Applicable | 326,764 | |||
| Cecilia H. Herbert | Not Applicable | Not Applicable | 341,764 | |||
| Charles A. Hurty | Not Applicable | Not Applicable | 340,000 | |||
| John E. Kerrigan | Not Applicable | Not Applicable | 315,000 | |||
| Madhav V. Rajan | Not Applicable | Not Applicable | 315,000 | |||
| Jane D. Carlin | Not Applicable | Not Applicable | 300,000 7 | |||
| Interested Directors: | ||||||
| Robert S. Kapito | Not Applicable | Not Applicable | $0 | |||
| Mark K. Wiedman | Not Applicable | Not Applicable | 0 | |||
| Advisory Board Members: | ||||||
| Drew E. Lawton2 | Not Applicable | Not Applicable | Not Applicable | |||
| Richard L. Fagnani3 | Not Applicable | Not Applicable | Not Applicable |
| 1 | Served as an Independent Director through March 31, 2016. |
| 2 | Compensation is not shown for Drew E. Lawton because he was appointed to serve as an Advisory Board Member effective October 18, 2016. |
| 3 | Compensation is not shown for Richard L. Fagnani because he was appointed to serve as an Advisory Board Member effective April 1, 2017. |
| 4 | Compensation reported is from the Fund’s inception to August 31, 2016. |
| 5 | No Director or officer is entitled to any pension or retirement benefits from the Company. |
| 6 | Includes compensation for service on the Boards of Trustees for iShares Trust and iShares U.S. ETF Trust and the Board of Directors of iShares MSCI Russia Capped ETF, Inc. |
| 7 | Total compensation is shown for Jane D. Carlin for the period from February 3, 2015 to December 31, 2015 because she was appointed to serve as an Independent Director of the Company effective February 3, 2015. |
| Fund | Name | Percentage
of Ownership | ||
| iShares Core MSCI Emerging Markets ETF | National
Financial Services LLC 200 Liberty Street 5th Floor New York, NY 10281 |
12.75% | ||
| Merrill
Lynch, Pierce Fenner & Smith Safekeeping 101 Hudson Street 8th Floor Jersey City, NJ 07302 |
12.66% | |||
| State
Street Bank and Trust Company 1776 Heritage Drive North Quincy, MA 02171 |
6.40% | |||
| UBS
Financial Services Inc. 1000 Harbor Blvd. 8th Floor Weehawken, NJ 07087 |
6.31% | |||
| The
Bank of New York Mellon 401 Salina Street 2nd Floor Syracuse, NY 13202 |
6.13% | |||
| Morgan
Stanley Smith Barney LLC 1300 Thames Street 6th Floor Baltimore, MD 21231 |
5.98% | |||
| Charles
Schwab & Co., Inc. 111 Pavonia Avenue Jersey City, NJ 07310 |
5.78% | |||
| TD
Ameritrade Clearing, Inc. 1005 N. Ameritrade Place Bellevue, NE 68005 |
5.42% | |||
| Northern
Trust Company (The) 801 South Canal Street Chicago, IL 60612 |
5.31% | |||
| iShares Edge MSCI Min Vol Emerging Markets ETF | Bank
of America, National Association 411 N. Akard Street 5th Floor Dallas, TX 75201 |
11.95% | ||
| National
Financial Services LLC 200 Liberty Street 5th Floor New York, NY 10281 |
10.84% | |||
| Charles
Schwab & Co., Inc. 111 Pavonia Avenue Jersey City, NJ 07310 |
10.39% | |||
| UBS
Financial Services Inc. 1000 Harbor Blvd. 8th Floor Weehawken, NJ 07087 |
7.10% |
| Fund | Name | Percentage
of Ownership | ||
| Morgan
Stanley Smith Barney LLC 1300 Thames Street 6th Floor Baltimore, MD 21231 |
6.79% | |||
| JPMorgan
Chase Bank, National Association 14201 Dallas Pkwy 12th Floor Dallas, TX 75240 |
5.39% | |||
| iShares Edge MSCI Min Vol Global ETF | Northern
Trust Company/ United Nations Joint Staff Pension Fund 50 South LaSalle Street Chicago, IL 60675 |
17.83% | ||
| JPMorgan
Chase Bank, National Association 14201 Dallas Pkwy 12th Floor Dallas, TX 75240 |
9.78% | |||
| National
Financial Services LLC 200 Liberty Street 5th Floor New York, NY 10281 |
7.99% | |||
| Merrill
Lynch, Pierce Fenner & Smith Safekeeping 101 Hudson Street 8th Floor Jersey City, NJ 07302 |
7.86% | |||
| Brown
Brothers Harriman & Co. 525 Washington Blvd. 11th Floor Jersey City, NJ 07310 |
6.52% | |||
| Charles
Schwab & Co., Inc. 111 Pavonia Avenue Jersey City, NJ 07310 |
5.99% | |||
| iShares MSCI Brazil Capped ETF | Brown
Brothers Harriman & Co. 525 Washington Blvd. 11th Floor Jersey City, NJ 07310 |
27.09% | ||
| The
Bank of New York Mellon 401 Salina Street 2nd Floor Syracuse, NY 13202 |
7.35% | |||
| Citibank,
N.A. 3800 CitiBank Center Tampa Building A/Floor 2 Tampa, FL 33610 |
6.52% | |||
| iShares MSCI BRIC ETF | National
Financial Services LLC 200 Liberty Street 5th Floor New York, NY 10281 |
12.54% |
| Fund | Name | Percentage
of Ownership | ||
| Computershare
Trust Company, N.A. 250 Royall Street Canton, MA 02021 |
11.83% | |||
| Charles
Schwab & Co., Inc. 111 Pavonia Avenue Jersey City, NJ 07310 |
6.87% | |||
| TD
Ameritrade Clearing, Inc. 1005 N. Ameritrade Place Bellevue, NE 68005 |
6.86% | |||
| Morgan
Stanley Smith Barney LLC 1300 Thames Street 6th Floor Baltimore, MD 21231 |
6.16% | |||
| iShares MSCI Chile Capped ETF | Brown
Brothers Harriman & Co. 525 Washington Blvd. 11th Floor Jersey City, NJ 07310 |
33.96% | ||
| State
Street Bank and Trust Company 1776 Heritage Drive North Quincy, MA 02171 |
11.40% | |||
| Deutsche
Bank Securities Inc./Cedear 1251 Avenue of the Americas New York, NY 10020 |
8.08% | |||
| The
Bank of New York Mellon 401 Salina Street 2nd Floor Syracuse, NY 13202 |
6.45% | |||
| Charles
Schwab & Co., Inc. 111 Pavonia Avenue Jersey City, NJ 07310 |
5.48% | |||
| iShares MSCI Colombia Capped ETF | JPMorgan
Chase Bank, National Association 14201 Dallas Pkwy 12th Floor Dallas, TX 75240 |
31.48% | ||
| BNP
Paribas, New York Branch/Custody Services 525 Washington BLVD. Jersey City, NJ 07310 |
19.32% | |||
| Brown
Brothers Harriman & Co. 525 Washington Blvd. 11th Floor Jersey City, NJ 07310 |
6.40% | |||
| State
Street Bank and Trust Company 1776 Heritage Drive North Quincy, MA 02171 |
5.75% | |||
| iShares MSCI Emerging Markets Asia ETF | Charles
Schwab & Co., Inc. 111 Pavonia Avenue Jersey City, NJ 07310 |
19.87% |
| Fund | Name | Percentage
of Ownership | ||
| The
Bank of New York Mellon 401 Salina Street 2nd Floor Syracuse, NY 13202 |
11.28% | |||
| Northern
Trust Company (The) 801 South Canal Street Chicago, IL 60612 |
10.29% | |||
| Brown
Brothers Harriman & Co. 525 Washington Blvd. 11th Floor Jersey City, NJ 07310 |
6.54% | |||
| Merrill
Lynch, Pierce, Fenner & Smith Incorporated 101 Hudson Street 9th Floor Jersey City, NJ 07302-3997 |
6.47% | |||
| Morgan
Stanley & Co. Incorporated One Pierrepont Plaza 8th Floor Brooklyn, NY 11201 |
6.42% | |||
| iShares MSCI Emerging Markets ETF | Mellon
Trust of New England, National Association Three Mellon Bank Center Floor 1533700 Pittsburgh, PA 15259 |
10.87% | ||
| State
Street Bank and Trust Company 1776 Heritage Drive North Quincy, MA 02171 |
10.35% | |||
| The
Bank of New York Mellon 401 Salina Street 2nd Floor Syracuse, NY 13202 |
9.09% | |||
| Brown
Brothers Harriman & Co. 525 Washington Blvd. 11th Floor Jersey City, NJ 07310 |
6.70% | |||
| National
Financial Services LLC 200 Liberty Street 5th Floor New York, NY 10281 |
5.13% | |||
| iShares MSCI Emerging Markets Small-Cap ETF | National
Financial Services LLC 200 Liberty Street 5th Floor New York, NY 10281 |
31.81% | ||
| Charles
Schwab & Co., Inc. 111 Pavonia Avenue Jersey City, NJ 07310 |
10.55% |
| Fund | Name | Percentage
of Ownership | ||
| JPMorgan
Chase Bank, National Association 14201 Dallas Pkwy 12th Floor Dallas, TX 75240 |
9.01% | |||
| Brown
Brothers Harriman & Co. 525 Washington Blvd. 11th Floor Jersey City, NJ 07310 |
7.22% | |||
| BMO
Nesbitt Burns Inc. /CDS 250 Yonge Street 7th Floor Toronto, ON M5B 2M8 |
5.66% | |||
| State
Street Bank and Trust Company 1776 Heritage Drive North Quincy, MA 02171 |
5.39% | |||
| iShares MSCI EM ESG Optimized ETF | Merrill
Lynch, Pierce Fenner & Smith Safekeeping 101 Hudson Street 8th Floor Jersey City, NJ 07302 |
33.08% | ||
| J.P.
Morgan Clearing Corp One Metrotech Center North Brooklyn, NY 11201 |
30.96% | |||
| Brown
Brothers Harriman & Co. 525 Washington Blvd. 11th Floor Jersey City, NJ 07310 |
12.57% | |||
| Charles
Schwab & Co., Inc. 111 Pavonia Avenue Jersey City, NJ 07310 |
5.90% | |||
| Fiducie
Desjardins Inc./CDS 1170 Peel Street Suite 300 Montreal, Quebec, H3B 0A9 Canada |
5.00% | |||
| iShares MSCI Frontier 100 ETF | National
Financial Services LLC 200 Liberty Street 5th Floor New York, NY 10281 |
13.99% | ||
| State
Street Bank and Trust Company 1776 Heritage Drive North Quincy, MA 02171 |
9.46% | |||
| Charles
Schwab & Co., Inc. 111 Pavonia Avenue Jersey City, NJ 07310 |
8.69% | |||
| Citibank,
N.A. 3800 CitiBank Center Tampa Building A/Floor 2 Tampa, FL 33610 |
7.56% |
| Fund | Name | Percentage
of Ownership | ||
| TD
Ameritrade Clearing, Inc. 1005 N. Ameritrade Place Bellevue, NE 68005 |
6.50% | |||
| Morgan
Stanley Smith Barney LLC 1300 Thames Street 6th Floor Baltimore, MD 21231 |
5.81% | |||
| Pershing
LLC One Pershing Plaza Jersey City, NJ 07399 |
5.74% | |||
| M&I
Marshall & Ilsley Bank 11270 W Park Place 7th Floor Milwaukee, WI 53224 |
5.13% | |||
| Northern
Trust Company (The) 801 South Canal Street Chicago, IL 60612 |
5.07% | |||
| iShares MSCI Global Agriculture Producers ETF | National
Financial Services LLC 200 Liberty Street 5th Floor New York, NY 10281 |
29.11% | ||
| Pershing
LLC One Pershing Plaza Jersey City, NJ 07399 |
11.92% | |||
| Charles
Schwab & Co., Inc. 111 Pavonia Avenue Jersey City, NJ 07310 |
11.21% | |||
| UBS
Financial Services Inc. 1000 Harbor Blvd. 8th Floor Weehawken, NJ 07087 |
5.35% | |||
| iShares MSCI Global Energy Producers ETF | National
Financial Services LLC 200 Liberty Street 5th Floor New York, NY 10281 |
14.31% | ||
| Pershing
LLC One Pershing Plaza Jersey City, NJ 07399 |
10.55% | |||
| Merrill
Lynch, Pierce Fenner & Smith Safekeeping 101 Hudson Street 8th Floor Jersey City, NJ 07302 |
10.02% | |||
| American
Enterprise Investment Services, Inc. 901 3rd Avenue South Minneapolis, MN 55474 |
9.77% | |||
| Charles
Schwab & Co., Inc. 111 Pavonia Avenue Jersey City, NJ 07310 |
7.50% |
| Fund | Name | Percentage
of Ownership | ||
| LPL
Financial Corporation 9785 Towne Centre Drive San Diego, CA 92121-1968 |
6.88% | |||
| Brown
Brothers Harriman & Co. 525 Washington Blvd. 11th Floor Jersey City, NJ 07310 |
6.09% | |||
| RBC
Dominion Securities, Inc. 200 Bay Street, 6th Floor Royal Bank Plaza North Tower Toronto, ON M5J 2W7 |
5.22% | |||
| iShares MSCI Global Metals & Mining Producers ETF | Citibank,
N.A. 3800 CitiBank Center Tampa Building A/Floor 2 Tampa, FL 33610 |
20.68% | ||
| National
Financial Services LLC 200 Liberty Street 5th Floor New York, NY 10281 |
13.82% | |||
| Charles
Schwab & Co., Inc. 111 Pavonia Avenue Jersey City, NJ 07310 |
11.96% | |||
| State
Street Bank and Trust Company 1776 Heritage Drive North Quincy, MA 02171 |
9.83% | |||
| Brown
Brothers Harriman & Co. 525 Washington Blvd. 11th Floor Jersey City, NJ 07310 |
5.66% | |||
| iShares MSCI Malaysia ETF | State
Street Bank and Trust Company 1776 Heritage Drive North Quincy, MA 02171 |
15.34% | ||
| JPMorgan
Chase Bank, National Association 14201 Dallas Pkwy 12th Floor Dallas, TX 75240 |
14.47% | |||
| Merrill
Lynch, Pierce, Fenner & Smith Incorporated 101 Hudson Street 9th Floor Jersey City, NJ 07302-3997 |
8.59% | |||
| The
Bank of New York Mellon 401 Salina Street 2nd Floor Syracuse, NY 13202 |
7.03% | |||
| Charles
Schwab & Co., Inc. 111 Pavonia Avenue Jersey City, NJ 07310 |
5.46% |
| Fund | Name | Percentage
of Ownership | ||
| National
Financial Services LLC 200 Liberty Street 5th Floor New York, NY 10281 |
5.03% | |||
| iShares MSCI South Korea Capped ETF | State
Street Bank and Trust Company 1776 Heritage Drive North Quincy, MA 02171 |
25.57% | ||
| Deutsche
Bank Securities Inc./Cedear 1251 Avenue of the Americas New York, NY 10020 |
7.86% | |||
| Citibank,
N.A. 3800 CitiBank Center Tampa Building A/Floor 2 Tampa, FL 33610 |
7.55% | |||
| The
Bank of New York Mellon 401 Salina Street 2nd Floor Syracuse, NY 13202 |
7.28% | |||
| Brown
Brothers Harriman & Co. 525 Washington Blvd. 11th Floor Jersey City, NJ 07310 |
6.14% | |||
| Northern
Trust Company (The) 801 South Canal Street Chicago, IL 60612 |
5.37% | |||
| iShares MSCI Taiwan Capped ETF | State
Street Bank and Trust Company 1776 Heritage Drive North Quincy, MA 02171 |
23.56% | ||
| Brown
Brothers Harriman & Co. 525 Washington Blvd. 11th Floor Jersey City, NJ 07310 |
18.12% | |||
| The
Bank of New York Mellon 401 Salina Street 2nd Floor Syracuse, NY 13202 |
10.46% | |||
| Northern
Trust Company/ United Nations Joint Staff Pension Fund 50 South LaSalle Street Chicago, IL 60675 |
8.61% | |||
| Citibank,
N.A. 3800 CitiBank Center Tampa Building A/Floor 2 Tampa, FL 33610 |
6.62% | |||
| Northern
Trust Company (The) 801 South Canal Street Chicago, IL 60612 |
5.06% |
| Fund | Management
Fee for the Fiscal Year Ended August 31, 2016 |
Fund
Inception Date |
Management
Fees Paid Net of Waivers for Fiscal Year Ended August 31, 2016 |
Management
Fees Paid Net of Waivers for Fiscal Year Ended August 31, 2015 |
Management
Fees Paid Net of Waivers for Fiscal Year Ended August 31, 2014 | |||||
| iShares Core MSCI Emerging Markets ETF1,2 | 0.14% | 10/18/12 | $ 16,700,926 | $ 11,987,656 | $ 6,104,082 | |||||
| iShares Edge MSCI Min Vol Emerging Markets ETF3 | 0.71% | 10/18/11 | 7,756,746 | 5,672,240 | 5,578,740 | |||||
| iShares Edge MSCI Min Vol Global ETF4 | 0.32% | 10/18/11 | 5,185,560 | 3,679,771 | 2,256,772 | |||||
| iShares MSCI Brazil Capped ETF | 0.63% | 07/10/00 | 16,208,706 | 22,930,693 | 29,033,197 | |||||
| iShares MSCI BRIC ETF | 0.71% | 11/12/07 | 1,248,307 | 2,041,675 | 2,950,620 | |||||
| iShares MSCI Chile Capped ETF | 0.64% | 11/12/07 | 1,731,868 | 1,705,573 | 2,104,233 | |||||
| iShares MSCI Colombia Capped ETF | 0.61% | 06/18/13 | 97,210 | 104,511 | 129,378 | |||||
| iShares MSCI Emerging Markets Asia ETF5,6 | 0.49% | 02/08/12 | 615,020 | 639,530 | 213,549 | |||||
| iShares MSCI Emerging Markets ETF7 | 0.71% | 04/07/03 | 162,269,425 | 221,482,303 | 257,625,411 | |||||
| iShares MSCI Emerging Markets Small-Cap ETF | 0.71% | 08/16/11 | 656,745 | 432,881 | 247,131 | |||||
| iShares MSCI EM ESG Optimized ETF | 0.45% | 06/28/16 | 4,334 | N/A | N/A | |||||
| iShares MSCI Frontier 100 ETF | 0.79% | 09/12/12 | 3,510,094 | 4,883,454 | 4,380,187 | |||||
| iShares MSCI Global Agriculture Producers ETF8 | 0.39% | 01/31/12 | 96,779 | 148,268 | 159,598 | |||||
| iShares MSCI Global Energy Producers ETF | 0.39% | 01/31/12 | 123,535 | 82,566 | 21,673 | |||||
| iShares MSCI Global Metals & Mining Producers ETF9 | 0.39% | 01/31/12 | 458,695 | 566,461 | 670,187 | |||||
| iShares MSCI Malaysia ETF | 0.48% | 03/12/96 | 1,350,953 | 2,476,145 | 3,846,410 | |||||
| iShares MSCI South Korea Capped ETF | 0.64% | 05/09/00 | 20,701,322 | 25,858,763 | 26,444,377 | |||||
| iShares MSCI Taiwan Capped ETF | 0.64% | 06/20/00 | 16,552,838 | 22,392,457 | 18,110,836 |
| 1 | For the iShares Core MSCI Emerging Markets ETF, BFA has contractually agreed to waive a portion of its management fee in order to limit the Fund’s total annual fund operating expenses after fee waiver to 0.14% through December 31, 2017. The contractual waiver may be terminated prior to December 31, 2017 only upon written agreement of the Company and BFA. For the fiscal years ended August 31, 2014, August 31, 2015 and August 31, 2016, BFA waived $0, $0 and $0, respectively, of its management fees. As of December 31, 2015, the previous contractual waiver is no longer in effect. For the fiscal year ended August 31, 2014, BFA voluntarily waived $501,946 of its management fees. As of November 1, 2013, the voluntary waiver is no longer in effect. |
| 2 | Effective October 5, 2016, the management fee for the iShares Core MSCI Emerging Markets ETF is 0.14%. From November 10, 2015 to October 4, 2016 the management fee for the iShares Core MSCI Emerging Markets ETF was 0.16%. Prior to November 10, 2015, the management fee for the iShares Core MSCI Emerging Markets ETF was 0.18%. |
| 3 | For the iShares Edge MSCI Min Vol Emerging Markets ETF, BFA has contractually agreed to waive a portion of its management fee in order to limit the Fund’s total annual fund operating expenses after fee waiver to 0.25% through December 31, 2023. The contractual waiver may be terminated prior to December 31, 2023 only upon written agreement of the Company and BFA. For the fiscal years ended August 31, 2014, August 31, 2015 and August 31, 2016, BFA waived $9,452,759, $9,914,710 and $14,435,231, respectively, of its management fees. |
| 4 | For the iShares Edge MSCI Min Vol Global ETF, BFA has contractually agreed to waive a portion of its management fee in order to limit the Fund’s total annual fund operating expenses after fee waiver to 0.20% through December 31, 2023. The contractual waiver may be terminated prior to December 31, 2023 only upon written agreement of the Company and BFA. For the fiscal years ended August 31, 2014, August 31, 2015 and August 31, 2016, BFA waived $6,390, $2,346,015 and $3,236,389, respectively, of its management fees. For the fiscal years ended August 31, 2014 and August 31, 2015, BFA voluntarily waived $1,493,893 and $0, respectively, of its management fees. As of September 12, 2014, the voluntary waiver is no longer in effect. |
| 5 | For the iShares MSCI Emerging Markets Asia ETF, BFA contractually agreed to waive a portion of its management fee for its investment advisory services to the Fund in order to limit Total Annual Fund Operating Expenses to 0.49% of average daily net assets through December 31, 2018. As of August 1, 2016, the contractual waiver is no longer in effect. For the fiscal years ended August 31, 2014, August 31, 2015 and August 31, 2016, BFA waived $82,805, $247,981 and $215,086, respectively, of its management fees. |
| 6 | Effective August 1, 2016, the management fee for the iShares MSCI Emerging Markets Asia ETF is 0.49%. Prior to August 1, 2016, the management fee for the iShares MSCI Emerging Markets Asia ETF was 0.68%. |
| 7 | For the iShares MSCI Emerging Markets ETF, for the fiscal years ended August 31, 2014, August 31, 2015 and August 31, 2016, BFA waived $0, $0 and $0, respectively, of its management fees. As of December 31, 2015, the contractual waiver is no longer in effect. For the fiscal years ended August 31, 2014 and August 31, 2015, BFA voluntarily waived $784,811 and $0, respectively, of its management fees. As of September 12, 2014, the voluntary waiver is no longer in effect. |
| 8 | For the iShares MSCI Global Agriculture Producers ETF, BFA has contractually agreed to waive a portion of its management fees in an amount equal to the Acquired Fund Fees and Expenses, if any, attributable to the Fund's investments in other series of iShares Trust and iShares, Inc. through December 31, 2023. The contractual waiver may be terminated prior to December 31, 2023 only upon written agreement of the Company and BFA. For the fiscal years ended August 31, 2014, August 31, 2015 and August 31, 2016, BFA waived $2,676, $3,225 and $3,606, respectively, of its management fees. |
| 9 | For the iShares MSCI Global Metals & Mining Producers ETF, BFA has contractually agreed to waive a portion of its management fees in an amount equal to the Acquired Fund Fees and Expenses, if any, attributable to the Fund's investments in other series of iShares Trust and iShares, Inc. through December 31, 2023. The contractual waiver may be terminated prior to December 31, 2023 only upon written agreement of the Company and BFA. For the fiscal years ended August 31, 2014, August 31, 2015 and August 31, 2016, BFA waived $0, $0 and $0, respectively, of its management fees. |
| Diane Hsiung | ||||
| Types of Accounts | Number | Total Assets | ||
| Registered Investment Companies | 233 | $635,285,000,000 | ||
| Other Pooled Investment Vehicles | 15 | 3,975,000,000 | ||
| Other Accounts | 0 | N/A | ||
| Accounts with Incentive-Based Fee Arrangements | 0 | N/A |
| Jennifer Hsui | ||||
| Types of Accounts | Number | Total Assets | ||
| Registered Investment Companies | 249 | $656,098,000,000 | ||
| Other Pooled Investment Vehicles | 16 | 4,295,000,000 | ||
| Other Accounts | 0 | N/A | ||
| Accounts with Incentive-Based Fee Arrangements | 0 | N/A |
| Alan Mason | ||||
| Types of Accounts | Number | Total Assets | ||
| Registered Investment Companies | 344 | $ 719,614,000,000 | ||
| Other Pooled Investment Vehicles | 285 | 574,676,000,000 | ||
| Other Accounts | 185 | 39,352,000,000 | ||
| Accounts with Incentive-Based Fee Arrangements | 0 | N/A |
| Greg Savage | ||||
| Types of Accounts | Number | Total Assets | ||
| Registered Investment Companies | 317 | $712,594,000,000 | ||
| Other Pooled Investment Vehicles | 75 | 26,632,000,000 | ||
| Other Accounts | 0 | N/A | ||
| Accounts with Incentive-Based Fee Arrangements | 0 | N/A |
| Diane Hsiung | ||||
| Types of Accounts | Number
of Other Accounts with Performance Fees Managed by Portfolio Manager |
Aggregate
of Total Assets | ||
| Registered Investment Companies | 0 | N/A | ||
| Other Pooled Investment Vehicles | 0 | N/A | ||
| Other Accounts | 0 | N/A |
| Jennifer Hsui | ||||
| Types of Accounts | Number
of Other Accounts with Performance Fees Managed by Portfolio Manager |
Aggregate
of Total Assets | ||
| Registered Investment Companies | 0 | N/A | ||
| Other Pooled Investment Vehicles | 0 | N/A | ||
| Other Accounts | 0 | N/A |
| Alan Mason | ||||
| Types of Accounts | Number
of Other Accounts with Performance Fees Managed by Portfolio Manager |
Aggregate
of Total Assets | ||
| Registered Investment Companies | 0 | N/A | ||
| Other Pooled Investment Vehicles | 0 | N/A | ||
| Other Accounts | 0 | N/A |
| Greg Savage | ||||
| Types of Accounts | Number
of Other Accounts with Performance Fees Managed by Portfolio Manager |
Aggregate
of Total Assets | ||
| Registered Investment Companies | 0 | N/A | ||
| Other Pooled Investment Vehicles | 0 | N/A | ||
| Other Accounts | 0 | N/A |
| Diane Hsiung | |||||||||||||||
| Dollar Range | |||||||||||||||
| Fund | None | $1 to $10k | $10,001
to $50k |
$50,001
to $100k |
$100,001
to $500k |
$500,001
to $1m |
over
$1m | ||||||||
| iShares Core MSCI Emerging Markets ETF | X | ||||||||||||||
| iShares Edge MSCI Min Vol Emerging Markets ETF | X | ||||||||||||||
| iShares Edge MSCI Min Vol Global ETF | X | ||||||||||||||
| iShares MSCI Brazil Capped ETF | X | ||||||||||||||
| iShares MSCI BRIC ETF | X | ||||||||||||||
| iShares MSCI Chile Capped ETF | X | ||||||||||||||
| iShares MSCI Colombia Capped ETF | X | ||||||||||||||
| iShares MSCI Emerging Markets Asia ETF | X | ||||||||||||||
| iShares MSCI Emerging Markets ETF | X | ||||||||||||||
| iShares MSCI Emerging Markets Small-Cap ETF | X | ||||||||||||||
| iShares MSCI EM ESG Optimized ETF | X | ||||||||||||||
| iShares MSCI Frontier 100 ETF | X | ||||||||||||||
| iShares MSCI Global Agriculture Producers ETF | X | ||||||||||||||
| iShares MSCI Global Energy Producers ETF | X | ||||||||||||||
| iShares MSCI Global Metals & Mining Producers ETF | X | ||||||||||||||
| iShares MSCI Malaysia ETF | X | ||||||||||||||
| iShares MSCI South Korea Capped ETF | X | ||||||||||||||
| iShares MSCI Taiwan Capped ETF | X | ||||||||||||||
| Jennifer Hsui | |||||||||||||||
| Dollar Range | |||||||||||||||
| Fund | None | $1 to $10k | $10,001
to $50k |
$50,001
to $100k |
$100,001
to $500k |
$500,001
to $1m |
over
$1m | ||||||||
| iShares Core MSCI Emerging Markets ETF | X | ||||||||||||||
| iShares Edge MSCI Min Vol Emerging Markets ETF | X | ||||||||||||||
| iShares Edge MSCI Min Vol Global ETF | X | ||||||||||||||
| iShares MSCI Brazil Capped ETF | X | ||||||||||||||
| iShares MSCI BRIC ETF | X | ||||||||||||||
| iShares MSCI Chile Capped ETF | X | ||||||||||||||
| iShares MSCI Colombia Capped ETF | X | ||||||||||||||
| iShares MSCI Emerging Markets Asia ETF | X | ||||||||||||||
| iShares MSCI Emerging Markets ETF | X | ||||||||||||||
| iShares MSCI Emerging Markets Small-Cap ETF | X | ||||||||||||||
| iShares MSCI EM ESG Optimized ETF | X | ||||||||||||||
| iShares MSCI Frontier 100 ETF | X | ||||||||||||||
| iShares MSCI Global Agriculture Producers ETF | X | ||||||||||||||
| iShares MSCI Global Energy Producers ETF | X | ||||||||||||||
| iShares MSCI Global Metals & Mining Producers ETF | X | ||||||||||||||
| iShares MSCI Malaysia ETF | X | ||||||||||||||
| iShares MSCI South Korea Capped ETF | X | ||||||||||||||
| iShares MSCI Taiwan Capped ETF | X | ||||||||||||||
| Alan Mason | |||||||||||||||
| Dollar Range | |||||||||||||||
| Fund | None | $1 to $10k | $10,001
to $50k |
$50,001
to $100k |
$100,001
to $500k |
$500,001
to $1m |
over
$1m | ||||||||
| iShares Core MSCI Emerging Markets ETF | X | ||||||||||||||
| iShares Edge MSCI Min Vol Emerging Markets ETF | X | ||||||||||||||
| iShares Edge MSCI Min Vol Global ETF | X | ||||||||||||||
| iShares MSCI Brazil Capped ETF | X | ||||||||||||||
| iShares MSCI BRIC ETF | X | ||||||||||||||
| iShares MSCI Chile Capped ETF | X | ||||||||||||||
| iShares MSCI Colombia Capped ETF | X | ||||||||||||||
| iShares MSCI Emerging Markets Asia ETF | X | ||||||||||||||
| iShares MSCI Emerging Markets ETF | X | ||||||||||||||
| iShares MSCI Emerging Markets Small-Cap ETF | X | ||||||||||||||
| iShares MSCI EM ESG Optimized ETF | X | ||||||||||||||
| iShares MSCI Frontier 100 ETF | X | ||||||||||||||
| iShares MSCI Global Agriculture Producers ETF | X | ||||||||||||||
| iShares MSCI Global Energy Producers ETF | X | ||||||||||||||
| iShares MSCI Global Metals & Mining Producers ETF | X | ||||||||||||||
| iShares MSCI Malaysia ETF | X | ||||||||||||||
| iShares MSCI South Korea Capped ETF | X | ||||||||||||||
| iShares MSCI Taiwan Capped ETF | X | ||||||||||||||
| Greg Savage | |||||||||||||||
| Dollar Range | |||||||||||||||
| Fund | None | $1 to $10k | $10,001
to $50k |
$50,001
to $100k |
$100,001
to $500k |
$500,001
to $1m |
over
$1m | ||||||||
| iShares Core MSCI Emerging Markets ETF | X | ||||||||||||||
| iShares Edge MSCI Min Vol Emerging Markets ETF | X | ||||||||||||||
| iShares Edge MSCI Min Vol Global ETF | X | ||||||||||||||
| iShares MSCI Brazil Capped ETF | X | ||||||||||||||
| iShares MSCI BRIC ETF | X | ||||||||||||||
| iShares MSCI Chile Capped ETF | X | ||||||||||||||
| iShares MSCI Colombia Capped ETF | X | ||||||||||||||
| iShares MSCI Emerging Markets Asia ETF | X | ||||||||||||||
| iShares MSCI Emerging Markets ETF | X | ||||||||||||||
| iShares MSCI Emerging Markets Small-Cap ETF | X | ||||||||||||||
| iShares MSCI EM ESG Optimized ETF | X | ||||||||||||||
| iShares MSCI Frontier 100 ETF | X | ||||||||||||||
| iShares MSCI Global Agriculture Producers ETF | X | ||||||||||||||
| iShares MSCI Global Energy Producers ETF | X | ||||||||||||||
| iShares MSCI Global Metals & Mining Producers ETF | X | ||||||||||||||
| iShares MSCI Malaysia ETF | X | ||||||||||||||
| iShares MSCI South Korea Capped ETF | X | ||||||||||||||
| iShares MSCI Taiwan Capped ETF | X | ||||||||||||||
| Fund | Fund
Inception Date |
Administration,
Custodian, Transfer Agency Expenses Paid During Fiscal Year Ended August 31, 2016 |
Administration,
Custodian, Transfer Agency Expenses Paid During Fiscal Year Ended August 31, 2015 |
Administration,
Custodian, Transfer Agency Expenses Paid During Fiscal Year Ended August 31, 2014 | ||||
| iShares Core MSCI Emerging Markets ETF | 10/18/12 | $ 3,514,217 | $2,250,895 | $ 1,465,620 | ||||
| iShares Edge MSCI Min Vol Emerging Markets ETF | 10/18/11 | 1,712,564 | 1,319,663 | 1,127,202 | ||||
| iShares Edge MSCI Min Vol Global ETF | 10/18/11 | 269,859 | 227,622 | 127,080 | ||||
| iShares MSCI Brazil Capped ETF | 07/10/00 | 498,884 | 676,115 | 919,967 | ||||
| iShares MSCI BRIC ETF | 11/12/07 | 65,162 | 100,260 | 176,744 | ||||
| iShares MSCI Chile Capped ETF | 11/12/07 | 593,416 | 588,484 | 760,304 | ||||
| iShares MSCI Colombia Capped ETF | 06/18/13 | 78,545 | 94,389 | 105,161 | ||||
| iShares MSCI Emerging Markets Asia ETF | 02/08/12 | 54,970 | 44,136 | 14,813 | ||||
| iShares MSCI Emerging Markets ETF | 04/07/03 | 7,494,020 | 9,972,532 | 12,892,794 | ||||
| iShares MSCI Emerging Markets Small-Cap ETF | 08/16/11 | 80,977 | 61,597 | 55,099 | ||||
| iShares MSCI EM ESG Optimized ETF | 06/28/16 | 16,266 | N/A | N/A | ||||
| iShares MSCI Frontier 100 ETF | 09/12/12 | 1,570,528 | 2,347,970 | 2,645,084 | ||||
| iShares MSCI Global Agriculture Producers ETF | 01/31/12 | 16,880 | 20,388 | 27,334 | ||||
| iShares MSCI Global Energy Producers ETF | 01/31/12 | 16,674 | 15,788 | 11,668 | ||||
| iShares MSCI Global Metals & Mining Producers ETF | 01/31/12 | 46,797 | 49,648 | 53,841 | ||||
| iShares MSCI Malaysia ETF | 03/12/96 | 121,320 | 151,204 | 224,810 | ||||
| iShares MSCI South Korea Capped ETF | 05/09/00 | 701,268 | 882,085 | 915,327 | ||||
| iShares MSCI Taiwan Capped ETF | 06/20/00 | 707,660 | 863,984 | 696,950 |
| Fund | Fund
Inception Date |
Distributor
Compensation Paid During Fiscal Year Ended August 31, 2016 |
Distributor
Compensation Paid During Fiscal Year Ended August 31, 2015 |
Distributor
Compensation Paid During Fiscal Year Ended August 31, 20141 | |||
| iShares Core MSCI Emerging Markets ETF | 10/18/12 | $0 | $ 0 | $6,438 | |||
| iShares Edge MSCI Min Vol Emerging Markets ETF | 10/18/11 | 0 | 0 | 6,438 | |||
| iShares Edge MSCI Min Vol Global ETF | 10/18/11 | 0 | 0 | 6,438 | |||
| iShares MSCI Brazil Capped ETF | 07/10/00 | 0 | 0 | 6,438 | |||
| iShares MSCI BRIC ETF | 11/12/07 | 0 | 0 | 6,438 | |||
| iShares MSCI Chile Capped ETF | 11/12/07 | 0 | 0 | 6,438 | |||
| iShares MSCI Colombia Capped ETF | 06/18/13 | 0 | 0 | 6,438 | |||
| iShares MSCI Emerging Markets Asia ETF | 02/08/12 | 0 | 0 | 6,438 | |||
| iShares MSCI Emerging Markets ETF | 04/07/03 | 0 | 0 | 6,438 | |||
| iShares MSCI Emerging Markets Small-Cap ETF | 08/16/11 | 0 | 0 | 6,438 | |||
| iShares MSCI EM ESG Optimized ETF | 06/28/16 | 0 | N/A | N/A | |||
| iShares MSCI Frontier 100 ETF | 09/12/12 | 0 | 0 | 6,438 | |||
| iShares MSCI Global Agriculture Producers ETF | 01/31/12 | 0 | 0 | 6,438 | |||
| iShares MSCI Global Energy Producers ETF | 01/31/12 | 0 | 0 | 6,438 | |||
| iShares MSCI Global Metals & Mining Producers ETF | 01/31/12 | 0 | 0 | 6,438 | |||
| iShares MSCI Malaysia ETF | 03/12/96 | 0 | 0 | 6,438 | |||
| iShares MSCI South Korea Capped ETF | 05/09/00 | 0 | 0 | 6,438 | |||
| iShares MSCI Taiwan Capped ETF | 06/20/00 | 0 | 0 | 6,438 |
| 1 | These fees reflect payments made to SEI, acting as an agent of the Distributor. |
| Fund | Fund
Inception Date |
Brokerage
Commissions Paid During Fiscal Year Ended August 31, 2016 |
Brokerage
Commissions Paid During Fiscal Year Ended August 31, 2015 |
Brokerage
Commissions Paid During Fiscal Year Ended August 31, 2014 | ||||
| iShares Core MSCI Emerging Markets ETF | 10/18/12 | $ 3,369,989 | $ 1,767,732 | $ 1,734,760 | ||||
| iShares Edge MSCI Min Vol Emerging Markets ETF | 10/18/11 | 1,148,967 | 746,843 | 874,319 | ||||
| iShares Edge MSCI Min Vol Global ETF | 10/18/11 | 512,807 | 693,412 | 348,651 | ||||
| iShares MSCI Brazil Capped ETF | 07/10/00 | 229,059 | 640,217 | 848,728 | ||||
| iShares MSCI BRIC ETF | 11/12/07 | 16,461 | 40,078 | 60,924 | ||||
| iShares MSCI Chile Capped ETF | 11/12/07 | 188,882 | 333,378 | 507,866 | ||||
| iShares MSCI Colombia Capped ETF | 06/18/13 | 17,148 | 20,030 | 19,263 | ||||
| iShares MSCI Emerging Markets Asia ETF | 02/08/12 | 21,657 | 40,633 | 31,590 | ||||
| iShares MSCI Emerging Markets ETF | 04/07/03 | 7,744,566 | 6,974,591 | 10,188,164 | ||||
| iShares MSCI Emerging Markets Small-Cap ETF | 08/16/11 | 30,250 | 28,290 | 8,901 | ||||
| iShares MSCI EM ESG Optimized ETF | 06/28/16 | 1,444 | N/A | N/A | ||||
| iShares MSCI Frontier 100 ETF | 09/12/12 | 786,643 | 2,418,354 | 4,805,891 | ||||
| iShares MSCI Global Agriculture Producers ETF | 01/31/12 | 633 | 1,259 | 3,180 | ||||
| iShares MSCI Global Energy Producers ETF | 01/31/12 | 576 | 766 | 351 | ||||
| iShares MSCI Global Metals & Mining Producers ETF | 01/31/12 | 13,518 | 16,772 | 24,100 | ||||
| iShares MSCI Malaysia ETF | 03/12/96 | 213,558 | 194,444 | 169,350 | ||||
| iShares MSCI South Korea Capped ETF | 05/09/00 | 637,523 | 881,665 | 727,654 | ||||
| iShares MSCI Taiwan Capped ETF | 06/20/00 | 875,744 | 921,335 | 362,060 |
| Fund | Fiscal
Year Ended August 31, 2016 |
Fiscal
Year Ended August 31, 2015 | ||
| iShares Core MSCI Emerging Markets ETF | 10% | 7% |
| Fund | Fiscal
Year Ended August 31, 2016 |
Fiscal
Year Ended August 31, 2015 | ||
| iShares Edge MSCI Min Vol Emerging Markets ETF | 23% | 28% | ||
| iShares Edge MSCI Min Vol Global ETF | 24% | 22% | ||
| iShares MSCI Brazil Capped ETF | 18% | 63% | ||
| iShares MSCI BRIC ETF | 20% | 9% | ||
| iShares MSCI Chile Capped ETF | 73% | 71% | ||
| iShares MSCI Colombia Capped ETF | 68% | 86% | ||
| iShares MSCI Emerging Markets Asia ETF | 22% | 16% | ||
| iShares MSCI Emerging Markets ETF | 23% | 10% | ||
| iShares MSCI Emerging Markets Small-Cap ETF | 24% | 23% | ||
| iShares MSCI EM ESG Optimized ETF | 9% | N/A | ||
| iShares MSCI Frontier 100 ETF | 20% | 47% | ||
| iShares MSCI Global Agriculture Producers ETF | 7% | 10% | ||
| iShares MSCI Global Energy Producers ETF | 6% | 4% | ||
| iShares MSCI Global Metals & Mining Producers ETF | 8% | 17% | ||
| iShares MSCI Malaysia ETF | 72% | 24% | ||
| iShares MSCI South Korea Capped ETF | 22% | 24% | ||
| iShares MSCI Taiwan Capped ETF | 27% | 14% |
| Fund | Shares
Per Creation Unit |
Value
Per Creation Unit (U.S.$) | ||
| iShares Core MSCI Emerging Markets ETF | 600,000 | $27,120,000 | ||
| iShares Edge MSCI Min Vol Emerging Markets ETF | 100,000 | 5,356,000 | ||
| iShares Edge MSCI Min Vol Global ETF | 100,000 | 7,600,000 | ||
| iShares MSCI Brazil Capped ETF | 50,000 | 1,680,500 | ||
| iShares MSCI BRIC ETF | 50,000 | 1,700,500 | ||
| iShares MSCI Chile Capped ETF | 50,000 | 1,838,000 | ||
| iShares MSCI Colombia Capped ETF | 50,000 | 655,000 | ||
| iShares MSCI Emerging Markets Asia ETF | 50,000 | 2,852,500 | ||
| iShares MSCI Emerging Markets ETF | 450,000 | 16,735,500 | ||
| iShares MSCI Emerging Markets Small-Cap ETF | 50,000 | 2,191,000 | ||
| iShares MSCI EM ESG Optimized ETF | 50,000 | 2,851,000 | ||
| iShares MSCI Frontier 100 ETF | 50,000 | 1,250,000 | ||
| iShares MSCI Global Agriculture Producers ETF | 50,000 | 1,194,000 | ||
| iShares MSCI Global Energy Producers ETF | 100,000 | 1,919,000 | ||
| iShares MSCI Global Metals & Mining Producers ETF1 | 50,000 | 1,185,900 | ||
| iShares MSCI Malaysia ETF1 | 75,000 | 2,371,600 | ||
| iShares MSCI South Korea Capped ETF | 50,000 | 2,886,500 | ||
| iShares MSCI Taiwan Capped ETF1 | 100,000 | 3,087,800 |
| 1 | For the iShares MSCI Global Metals & Mining Producers ETF, iShares MSCI Malaysia ETF and iShares MSCI Taiwan Capped ETF, the shares per creation unit and the value per creation unit are as of November 7, 2016. |
The Cash Component is an amount equal to the difference between the NAV of the shares (per Creation Unit) and the “Deposit Amount,” which is an amount equal to the market value of the Deposit Securities, and serves to compensate for any differences between the NAV per Creation Unit and the Deposit Amount. Payment of any stamp duty or other similar fees and expenses payable upon transfer of beneficial ownership of the Deposit Securities are the sole responsibility of the Authorized Participant purchasing a Creation Unit.
| Fund | Standard
Creation Transaction Fee |
Maximum
Additional Charge* | ||
| iShares Core MSCI Emerging Markets ETF | $ 15,000 | 7.0% | ||
| iShares Edge MSCI Min Vol Emerging Markets ETF | 6,100 | 7.0% | ||
| iShares Edge MSCI Min Vol Global ETF | 4,200 | 7.0% | ||
| iShares MSCI Brazil Capped ETF | 2,400 | 7.0% | ||
| iShares MSCI BRIC ETF | 5,900 | 7.0% | ||
| iShares MSCI Chile Capped ETF | 3,000 | 3.0% | ||
| iShares MSCI Colombia Capped ETF | 3,600 | 3.0% | ||
| iShares MSCI Emerging Markets Asia ETF | 15,000 | 7.0% | ||
| iShares MSCI Emerging Markets ETF | 7,700 | 7.0% | ||
| iShares MSCI Emerging Markets Small-Cap ETF | 15,000 | 7.0% | ||
| iShares MSCI EM ESG Optimized ETF | 12,400 | 3.0% | ||
| iShares MSCI Frontier 100 ETF | 6,800 | 7.0% | ||
| iShares MSCI Global Agriculture Producers ETF | 5,100 | 7.0% | ||
| iShares MSCI Global Energy Producers ETF | 6,100 | 7.0% | ||
| iShares MSCI Global Metals & Mining Producers ETF | 8,400 | 7.0% | ||
| iShares MSCI Malaysia ETF | 5,000 | 3.0% | ||
| iShares MSCI South Korea Capped ETF | 4,000 | 3.0% | ||
| iShares MSCI Taiwan Capped ETF | 4,500 | 3.0% |
| * | As a percentage of the net asset value per Creation Unit. |
| Fund | Standard
Redemption Transaction Fee |
Maximum
Additional Charge* | ||
| iShares Core MSCI Emerging Markets ETF | $ 15,000 | 2.0% | ||
| iShares Edge MSCI Min Vol Emerging Markets ETF | 6,100 | 2.0% | ||
| iShares Edge MSCI Min Vol Global ETF | 4,200 | 2.0% | ||
| iShares MSCI Brazil Capped ETF | 2,400 | 2.0% | ||
| iShares MSCI BRIC ETF | 5,900 | 2.0% | ||
| iShares MSCI Chile Capped ETF | 3,000 | 2.0% | ||
| iShares MSCI Colombia Capped ETF | 3,600 | 2.0% | ||
| iShares MSCI Emerging Markets Asia ETF | 15,000 | 2.0% | ||
| iShares MSCI Emerging Markets ETF | 7,700 | 2.0% | ||
| iShares MSCI Emerging Markets Small-Cap ETF | 15,000 | 2.0% | ||
| iShares MSCI EM ESG Optimized ETF | 12,400 | 2.0% | ||
| iShares MSCI Frontier 100 ETF | 6,800 | 2.0% | ||
| iShares MSCI Global Agriculture Producers ETF | 5,100 | 2.0% | ||
| iShares MSCI Global Energy Producers ETF | 6,100 | 2.0% | ||
| iShares MSCI Global Metals & Mining Producers ETF | 8,400 | 2.0% | ||
| iShares MSCI Malaysia ETF | 5,000 | 2.0% | ||
| iShares MSCI South Korea Capped ETF | 4,000 | 2.0% | ||
| iShares MSCI Taiwan Capped ETF | 4,500 | 2.0% |
| * | As a percentage of the net asset value per Creation Unit, inclusive of the standard redemption transaction fee. |
| Fund | Non-Expiring 1 | Expiring
2017 |
Expiring
2018 |
Expiring
2019 |
Total | |||||
| iShares Core MSCI Emerging Markets ETF | $ 147,376,048 | $ — | $ — | $ — | $147,376,048 | |||||
| iShares Edge MSCI Min Vol Emerging Markets ETF | 172,802,777 | — | — | — | 172,802,777 | |||||
| iShares Edge MSCI Min Vol Global ETF | 24,755,016 | — | — | — | 24,755,016 | |||||
| iShares MSCI Brazil Capped ETF | 1,852,610,863 | — | 198,226,310 | — | 2,050,837,173 | |||||
| iShares MSCI BRIC ETF | 179,085,849 | 1,540,740 | 11,268,086 | 7,760,558 | 199,655,233 | |||||
| iShares MSCI Chile Capped ETF | 136,278,156 | 1,886,881 | 11,712,090 | 976,991 | 150,854,118 | |||||
| iShares MSCI Colombia Capped ETF | 2,558,346 | — | — | — | 2,558,346 | |||||
| iShares MSCI Emerging Markets Asia ETF | 16,908,873 | — | — | — | 16,908,873 | |||||
| iShares MSCI Emerging Markets ETF | 6,504,918,854 | 228,196,854 | 1,201,366,175 | 873,167,649 | 8,807,649,532 | |||||
| iShares MSCI Emerging Markets Small-Cap ETF | 6,025,784 | — | — | — | 6,025,784 | |||||
| iShares MSCI EM ESG Optimized ETF | 39 | — | — | — | 39 | |||||
| iShares MSCI Frontier 100 ETF | 20,910,745 | — | — | — | 20,910,745 | |||||
| iShares MSCI Global Agriculture Producers ETF | 1,515,500 | — | — | — | 1,515,500 | |||||
| iShares MSCI Global Energy Producers ETF | 477,249 | — | — | — | 477,249 | |||||
| iShares MSCI Global Metals & Mining Producers ETF | 12,611,075 | — | — | — | 12,611,075 | |||||
| iShares MSCI South Korea Capped ETF | 348,410,462 | 60,990,953 | 226,591,665 | 78,503,704 | 714,496,784 | |||||
| iShares MSCI Taiwan Capped ETF | 211,790,962 | 343,375,145 | 363,052,013 | 19,669,958 | 937,888,078 |
| 1 | Must be utilized prior to losses subject to expiration. |
| • | Capital gains resulting from the sale of Indian securities (including depositary receipts issued by Indian companies) acquired prior to April 1, 2017 will not be subject to tax in India, provided the Subsidiary does not have Permanent Establishments (“PE”) in India. Capital gains resulting from sale of shares in Indian companies acquired on or after April 1, 2017 will be subject to tax in India as per the domestic tax rates (provided below). If the Subsidiaries are able to satisfy the conditions under the limitation of benefits article introduced by the Protocol, capital gains on shares acquired on or after April 1, 2017 and sold prior to April 1, 2019 may be taxed at 50% of the applicable Indian tax rate; |
| • | Dividends on shares received from an Indian company on which dividend distribution tax has been paid are exempt from tax in the hands of the shareholders. However, the Indian company distributing dividends is subject to a dividend distribution tax at the rate of 20.36%; and |
| • | Interest paid to a Subsidiary in respect of the debt obligations of Indian issuers will be subject to Indian income tax. The tax rate, in the case of rupee-denominated debt obligations, is 43.26%. However if the Subsidiary is a SEBI registered foreign portfolio investor, interest income earned from June 1, 2013 to June 30, 2017 on rupee-denominated bonds of Indian companies and Government securities, will be subject to tax at the rate of 5.41%, provided that the rate of interest does not exceed the prescribed rates. In the case of foreign currency-denominated debt obligations, the tax rate is 21.63%. For approved foreign currency loans advanced from July 1, 2012 to June 30, 2017, the tax rate on interest is 5.41% and for approved foreign currency long-term bonds issued from October 1, 2014 to June 30, 2017, the tax rate on interest is 5.41%. The Protocol provides for a withholding rate of 7.5% on the interest payments made on or after April 1, 2017. |
| • | Long-term capital gains (being gains on sale of shares held for a period of more than twelve months) listed on a recognized stock exchange would not be taxable in India provided Securities Transaction Tax (“STT”) has been paid on the same (as discussed below); |
| • | Short-term capital gains (being gains on sale of shares held for a period of twelve months or less) from the sale of Indian shares listed on a recognized stock exchange will be taxed at the rate of 16.223% provided STT has been paid on the same; |
| • | Long-term capital gains (being gains on sale of shares held for a period of more than 24 months) arising to the Subsidiary from the sale of unlisted securities will be taxed at the rate of 10.815% (without indexation) and short-term capital gains (being gains on sale of shares held for a period of 24 months or less) will be taxed at the rate of 43.26%;* |
| • | Capital gains realized on sale of listed equity shares not executed on a recognized stock exchange in India would be taxed at the rate of 21.63% for long-term gains (being gains on sale of shares held for a period of more than 12 months) and at 43.26% in the case of short-term gains (being gains on sale of shares held for a period of 12 months or less);* and |
| • | Capital gains arising from the transfer of depositary receipts outside India between non-resident investors will not be subject to tax in India. |
| * | However, if the Subsidiary is a SEBI registered foreign portfolio investor, the rates will be 10.816% and 32.45%, respectively. |
| • | 0.1% payable by the buyer and 0.1% by the seller on the value of transactions of delivery based transfer of an equity share in an Indian company entered in a recognized stock exchange; |
| • | 0.001% on the value of transactions of delivery based sale of a unit of an equity oriented mutual fund entered in a recognized stock exchange, payable by the seller; |
| • | 0.025% on the value of transactions of non-delivery based sale of an equity share in an Indian company or a unit of an equity oriented mutual fund, entered in a recognized stock exchange payable by the seller; |
| • | 0.05% on the value of transactions of derivatives being options, entered in a recognized stock exchange. STT is to be paid by the seller; |
| • | 0.01% on the value of transactions of sale of derivatives being futures, entered in a recognized stock exchange. STT is to be paid by the seller; |
| • | 0.001% on the value of transactions of sale of units of an equity-oriented fund to the Mutual Fund, payable by the seller in accordance with the Finance Act, 2013; |
| • | 0.125% on the value of transactions of sale of derivatives being options, where the option is exercised, entered in a recognized stock exchange. STT is to be paid by buyer; |
| • | The Finance Act, 2012 has exempted from tax the capital gains (under the ITA) arising from the sale of unlisted shares by existing shareholders of a Sub-Fund in an initial public offer. However, such sale is subject to STT at 0.2% of the sale consideration payable by the seller. |
| • | With respect to a foreign entity that holds the Indian assets directly, if the transferor of share or interest in such a foreign entity (along with its associated enterprises), at any time in the twelve months preceding the year of transfer neither holds the right of control or management in the foreign entity, nor holds voting power or share capital or interest exceeding 5% of the total voting power or total share capital in such foreign entity. |
| • | With respect to a foreign entity that holds the Indian assets indirectly, if the transferor of share or interest in such foreign entity (along with its associated enterprises), at any time in the twelve months preceding the year of transfer does not hold the right of control or management in relation to the foreign entity, which would entitle them to the right of control or management in the foreign entity which directly holds the Indian assets; or does not hold voting power or share capital or interest exceeding 5% of the total voting power or total share capital in the foreign entity, which results in holding the same share capital or voting power in the entity which directly holds the Indian assets. |
| • | any arrangement where the aggregate tax benefit to all the parties of the arrangement in the relevant financial year does not exceed INR 30 Million; |
| • | FIIs that choose not to take any benefit under any tax treaty entered with India and have invested in listed or unlisted securities with prior permission of the competent authority in accordance with the applicable regulations; |
| • | non-resident investor in an FII who has invested in an FII, directly or indirectly, by way of an offshore derivative instrument or otherwise; or |
| • | any income derived from the transfer of investments made prior to August 30, 2010. |
iShares Edge MSCI Min Vol Emerging Markets ETF
iShares MSCI Brazil Capped ETF
iShares MSCI BRIC ETF
iShares MSCI Emerging Markets ETF
iShares MSCI Malaysia ETF
iShares MSCI South Korea Capped ETF
iShares MSCI Taiwan Capped ETF
| 1 | iShares MSCI ACWI Low Carbon Target ETF, iShares MSCI All Peru Capped ETF, iShares MSCI EAFE ESG Optimized ETF, iShares MSCI EM ESG Optimized ETF, iShares MSCI Global Impact ETF, iShares MSCI KLD 400 Social ETF and iShares MSCI USA ESG Select ETF have separate Fund Proxy Voting Policies. |
| • | Boards and directors |
| • | Auditors and audit-related issues |
| • | Capital structure, mergers, asset sales and other special transactions |
| • | Remuneration and benefits |
| • | Social, ethical and environmental issues |
| • | General corporate governance matters |
| • | establishing an appropriate corporate governance structure; |
| • | supporting and overseeing management in setting strategy; |
| • | ensuring the integrity of financial statements; |
| • | making decisions regarding mergers, acquisitions and disposals; |
| • | establishing appropriate executive compensation structures; and |
| • | addressing business issues including social, ethical and environmental issues when they have the potential to materially impact company reputation and performance. |
| • | current employment at the company or a subsidiary; |
| • | former employment within the past several years as an executive of the company; |
| • | providing substantial professional services to the company and/or members of the company’s management; |
| • | having had a substantial business relationship in the past three years; |
| • | having, or representing a shareholder with, a substantial shareholding in the company; |
| • | being an immediate family member of any of the aforementioned; and |
| • | interlocking directorships. |
| • | BlackRock has adopted a proxy voting oversight structure whereby the Corporate Governance Committees oversee the voting decisions and other activities of the Corporate Governance Group, and particularly its activities with respect to voting in the relevant region of each Corporate Governance Committee’s jurisdiction. |
| • | The Corporate Governance Committees have adopted Guidelines for each region, which set forth the firm’s views with respect to certain corporate governance and other issues that typically arise in the proxy voting context. The Corporate Governance Committees receive periodic reports regarding the specific votes cast by the Corporate Governance Group and regular updates on material process issues, procedural changes and other matters of concern to the Corporate Governance Committees. |
| • | BlackRock’s Global Corporate Governance Oversight Committee oversees the Global Head, the Corporate Governance Group and the Corporate Governance Committees. The Global Corporate Governance Oversight Committee conducts a review, at least annually, of the proxy voting process to ensure compliance with BlackRock’s risk policies and procedures. |
| • | BlackRock maintains a reporting structure that separates the Global Head and Corporate Governance Group from employees with sales responsibilities. In addition, BlackRock maintains procedures intended to ensure that all engagements with corporate issuers or dissident shareholders are managed consistently and without regard to BlackRock’s relationship with the issuer of the proxy or dissident shareholder. Within the normal course of business, the Global Head or Corporate Governance Group may engage directly with BlackRock clients, and with employees with sales responsibilities, in discussions regarding general corporate governance policy matters, and to otherwise ensure that proxy-related client service levels are met. The Global Head or Corporate Governance Group does not discuss any specific voting matter with a client prior to the disclosure of the vote decision to all applicable clients after the shareholder meeting has taken place, except if the client is acting in the capacity as issuer of the proxy or dissident shareholder and is engaging through the established procedures independent of the client relationship. |
| • | In certain instances, BlackRock may determine to engage an independent fiduciary to vote proxies as a further safeguard to avoid potential conflicts of interest or as otherwise required by applicable law. The independent fiduciary may either vote such proxies or provide BlackRock with instructions as to how to vote such proxies. In the latter case, BlackRock votes the proxy in accordance with the independent fiduciary’s determination. Use of an independent fiduciary has been |
| adopted for voting the proxies related to any company that is affiliated with BlackRock or any company that includes BlackRock employees on its board of directors. |
| 2016 | ||||||
| Country | Trade
Date |
Settlement
Date |
Number
of Days to Settle | |||
| Australia | 03/22/16 | 03/30/16 | 8 | |||
| 12/20/16 | 12/29/16 | 9 | ||||
| 12/21/16 | 01/03/17 | 12 | ||||
| 12/22/16 | 01/04/17 | 13 | ||||
| Bahrain | 09/07/16 | 09/15/16 | 8 | |||
| 09/08/16 | 09/18/16 | 10 | ||||
| Bangladesh | 06/29/16 | 07/10/16 | 11 | |||
| 09/06/16 | 09/15/16 | 9 | ||||
| 09/07/16 | 09/18/16 | 11 | ||||
| 09/08/16 | 09/19/16 | 11 | ||||
| 2016 | ||||||
| Country | Trade
Date |
Settlement
Date |
Number
of Days to Settle | |||
| Brazil | 02/03/16 | 02/11/16 | 8 | |||
| 02/04/16 | 02/12/16 | 8 | ||||
| 02/05/16 | 02/15/16 | 10 | ||||
| China | 02/03/16 | 02/17/16 | 14 | |||
| 02/04/16 | 02/18/16 | 14 | ||||
| 02/05/16 | 02/19/16 | 14 | ||||
| 04/27/16 | 05/09/16 | 12 | ||||
| 04/28/16 | 05/10/16 | 12 | ||||
| 04/29/16 | 05/11/16 | 12 | ||||
| 09/28/16 | 10/11/16 | 13 | ||||
| 09/29/16 | 10/12/16 | 13 | ||||
| 09/30/16 | 10/13/16 | 13 | ||||
| Colombia | 03/18/16 | 03/28/16 | 10 | |||
| Costa Rica | 12/21/16 | 01/02/17 | 12 | |||
| 12/22/16 | 01/03/17 | 12 | ||||
| 12/23/16 | 01/04/17 | 12 | ||||
| Ghana | 06/30/16 | 07/08/16 | 8 | |||
| Indonesia | 06/29/16 | 07/11/16 | 12 | |||
| 06/30/16 | 07/12/16 | 12 | ||||
| 07/01/16 | 07/13/16 | 12 | ||||
| Ireland | 12/21/16 | 12/29/16 | 8 | |||
| 12/22/16 | 01/03/17 | 12 | ||||
| Israel | 04/20/16 | 05/01/16 | 11 | |||
| 04/21/16 | 05/02/16 | 11 | ||||
| 10/10/16 | 10/25/16 | 15 | ||||
| 10/13/16 | 10/26/16 | 13 | ||||
| Japan | 04/27/16 | 05/06/16 | 9 | |||
| 04/28/16 | 05/09/16 | 11 | ||||
| 05/02/16 | 05/10/16 | 8 | ||||
| Jordan | 06/30/16 | 07/11/16 | 11 | |||
| 07/03/16 | 07/12/16 | 9 | ||||
| 09/07/16 | 09/18/16 | 11 | ||||
| 09/08/16 | 09/19/16 | 11 | ||||
| Kuwait | 09/06/16 | 09/15/16 | 9 | |||
| 09/07/16 | 09/18/16 | 11 | ||||
| Lebanon | 07/01/16 | 7/11/16 | 10 | |||
| 07/04/16 | 7/12/16 | 8 | ||||
| 07/05/16 | 7/13/16 | 8 | ||||
| 2016 | ||||||
| Country | Trade
Date |
Settlement
Date |
Number
of Days to Settle | |||
| Malawi | 01/08/16 | 01/18/16 | 10 | |||
| 01/11/16 | 01/19/16 | 8 | ||||
| 01/12/16 | 01/20/16 | 8 | ||||
| 01/13/16 | 01/21/16 | 8 | ||||
| 01/14/16 | 01/22/16 | 8 | ||||
| 02/25/16 | 03/04/16 | 8 | ||||
| 02/26/16 | 03/07/16 | 10 | ||||
| 02/29/16 | 03/08/16 | 8 | ||||
| 03/01/16 | 03/09/16 | 8 | ||||
| 03/02/16 | 03/10/16 | 8 | ||||
| 03/18/16 | 03/29/16 | 11 | ||||
| 03/21/16 | 03/30/16 | 9 | ||||
| 03/22/16 | 03/31/16 | 9 | ||||
| 03/23/16 | 04/01/16 | 9 | ||||
| 03/24/16 | 04/04/16 | 11 | ||||
| 04/25/16 | 05/03/16 | 8 | ||||
| 04/26/16 | 05/04/16 | 8 | ||||
| 04/27/16 | 05/05/16 | 8 | ||||
| 04/28/16 | 05/06/16 | 8 | ||||
| 04/29/16 | 05/09/16 | 10 | ||||
| 06/07/16 | 06/15/16 | 8 | ||||
| 06/08/16 | 06/16/16 | 8 | ||||
| 06/09/16 | 06/17/16 | 8 | ||||
| 06/10/16 | 06/20/16 | 10 | ||||
| 06/13/16 | 06/21/16 | 8 | ||||
| 06/29/16 | 07/08/16 | 10 | ||||
| 06/30/16 | 07/11/16 | 11 | ||||
| 07/01/16 | 07/12/16 | 11 | ||||
| 07/04/16 | 07/13/16 | 9 | ||||
| 07/05/16 | 07/14/16 | 9 | ||||
| 12/19/16 | 12/27/16 | 8 | ||||
| 12/20/16 | 12/28/16 | 8 | ||||
| 12/21/16 | 12/29/16 | 8 | ||||
| 12/22/16 | 12/30/16 | 8 | ||||
| 12/23/16 | 01/03/17 | 11 | ||||
| 12/27/16 | 01/04/17 | 8 | ||||
| 12/28/16 | 01/05/17 | 8 | ||||
| 12/29/16 | 01/06/17 | 8 | ||||
| 12/30/16 | 01/09/17 | 10 | ||||
| Malaysia | 07/01/16 | 07/11/16 | 10 | |||
| 07/04/16 | 07/12/16 | 8 | ||||
| 07/05/16 | 07/13/16 | 8 | ||||
| Mexico | 03/18/16 | 03/28/16 | 10 | |||
| Morocco | 09/07/16 | 09/15/16 | 8 | |||
| 09/08/16 | 09/16/16 | 8 | ||||
| 09/09/16 | 09/19/16 | 10 | ||||
| 2016 | ||||||
| Country | Trade
Date |
Settlement
Date |
Number
of Days to Settle | |||
| Namibia | 03/14/16 | 03/22/16 | 8 | |||
| 03/15/16 | 03/23/16 | 8 | ||||
| 03/16/16 | 03/24/16 | 8 | ||||
| 03/17/16 | 03/29/16 | 12 | ||||
| 03/18/16 | 03/30/16 | 12 | ||||
| 03/22/16 | 03/31/16 | 9 | ||||
| 03/23/16 | 04/01/16 | 9 | ||||
| 03/24/16 | 04/04/16 | 11 | ||||
| 04/20/16 | 04/28/16 | 8 | ||||
| 04/21/16 | 04/29/16 | 8 | ||||
| 04/22/16 | 05/03/16 | 11 | ||||
| 04/25/16 | 05/06/16 | 11 | ||||
| 04/26/16 | 05/09/16 | 13 | ||||
| 04/28/16 | 05/10/16 | 12 | ||||
| 04/29/16 | 05/11/16 | 12 | ||||
| 05/03/16 | 05/12/16 | 9 | ||||
| 05/18/16 | 05/26/16 | 8 | ||||
| 05/19/16 | 05/27/16 | 8 | ||||
| 05/20/16 | 05/30/16 | 10 | ||||
| 05/23/16 | 05/31/16 | 8 | ||||
| 05/24/16 | 06/01/16 | 8 | ||||
| 06/09/16 | 06/17/16 | 8 | ||||
| 06/10/16 | 06/20/16 | 10 | ||||
| 06/13/16 | 06/21/16 | 8 | ||||
| 06/14/16 | 06/22/16 | 8 | ||||
| 06/15/16 | 06/23/16 | 8 | ||||
| 08/02/16 | 08/10/16 | 8 | ||||
| 08/03/16 | 08/11/16 | 8 | ||||
| 08/04/16 | 08/12/16 | 8 | ||||
| 08/05/16 | 08/15/16 | 10 | ||||
| 08/08/16 | 08/16/16 | 8 | ||||
| 08/19/16 | 08/29/16 | 10 | ||||
| 08/22/16 | 08/30/16 | 8 | ||||
| 08/23/16 | 08/31/16 | 8 | ||||
| 08/24/16 | 09/01/16 | 8 | ||||
| 08/25/16 | 09/02/16 | 8 | ||||
| 12/09/16 | 12/19/16 | 10 | ||||
| 12/12/16 | 12/20/16 | 8 | ||||
| 12/13/16 | 12/21/16 | 8 | ||||
| 12/14/16 | 12/22/16 | 8 | ||||
| 12/15/16 | 12/23/16 | 8 | ||||
| 12/19/16 | 12/27/16 | 8 | ||||
| 12/20/16 | 12/28/16 | 8 | ||||
| 12/21/16 | 12/29/16 | 8 | ||||
| 12/22/16 | 12/30/16 | 8 | ||||
| 12/23/16 | 01/03/17 | 11 | ||||
| 12/27/16 | 01/04/17 | 8 | ||||
| 12/28/16 | 01/05/17 | 8 | ||||
| 12/29/16 | 01/06/17 | 8 | ||||
| 2016 | ||||||
| Country | Trade
Date |
Settlement
Date |
Number
of Days to Settle | |||
| 12/30/16 | 01/09/17 | 10 | ||||
| New Zealand | 03/21/16 | 03/29/16 | 8 | |||
| 03/22/16 | 03/30/16 | 8 | ||||
| 03/23/16 | 03/31/16 | 8 | ||||
| 12/20/16 | 12/28/16 | 8 | ||||
| 12/21/16 | 12/29/16 | 8 | ||||
| 12/22/16 | 01/04/17 | 13 | ||||
| 12/28/16 | 01/05/17 | 8 | ||||
| 12/29/16 | 01/06/17 | 8 | ||||
| Norway | 03/21/16 | 03/29/16 | 8 | |||
| 03/22/16 | 03/30/16 | 8 | ||||
| Oman | 070/3/16 | 07/11/16 | 8 | |||
| 07/04/16 | 07/12/16 | 8 | ||||
| 07/05/16 | 07/13/16 | 8 | ||||
| 09/06/16 | 09/15/16 | 9 | ||||
| 09/07/16 | 09/18/16 | 11 | ||||
| 09/08/16 | 09/19/16 | 11 | ||||
| Pakistan | 09/08/16 | 09/19/16 | 11 | |||
| 09/09/16 | 09/20/16 | 11 | ||||
| Palestine | 06/30/16 | 07/10/16 | 10 | |||
| 07/03/16 | 07/11/16 | 8 | ||||
| 07/04/16 | 07/12/16 | 8 | ||||
| 09/06/16 | 09/15/16 | 9 | ||||
| 09/07/16 | 09/18/16 | 11 | ||||
| 09/08/16 | 09/19/16 | 11 | ||||
| The Philippines | 10/26/16 | 11/03/16 | 8 | |||
| 10/27/16 | 11/04/16 | 8 | ||||
| 10/28/16 | 11/07/16 | 10 | ||||
| Qatar | 07/03/16 | 07/12/16 | 9 | |||
| 07/04/16 | 07/13/16 | 9 | ||||
| 07/05/16 | 07/14/16 | 9 | ||||
| 09/06/16 | 09/18/16 | 12 | ||||
| 09/07/16 | 09/19/16 | 12 | ||||
| 09/08/16 | 09/20/16 | 12 | ||||
| Saudi Arabia | 06/30/16 | 07/12/16 | 12 | |||
| 07/03/16 | 07/13/16 | 10 | ||||
| 09/07/16 | 09/18/16 | 11 | ||||
| 09/08/16 | 09/19/16 | 11 | ||||
| Serbia | 04/26/16 | 05/04/16 | 8 | |||
| 04/27/16 | 05/05/16 | 8 | ||||
| 04/28/16 | 05/06/16 | 8 | ||||
| 2016 | ||||||
| Country | Trade
Date |
Settlement
Date |
Number
of Days to Settle | |||
| The Slovak Republic | 12/22/16 | 01/02/17 | 11 | |||
| 12/23/16 | 01/03/17 | 11 | ||||
| South Africa | 03/14/16 | 03/22/16 | 8 | |||
| 03/15/16 | 03/23/16 | 8 | ||||
| 03/16/16 | 03/24/16 | 8 | ||||
| 03/17/16 | 03/29/16 | 12 | ||||
| 03/18/16 | 03/30/16 | 12 | ||||
| 03/22/16 | 03/31/16 | 9 | ||||
| 03/23/16 | 04/01/16 | 9 | ||||
| 03/24/16 | 04/04/16 | 11 | ||||
| 04/20/16 | 04/28/16 | 8 | ||||
| 04/21/16 | 04/29/16 | 8 | ||||
| 04/22/16 | 05/03/16 | 11 | ||||
| 04/25/16 | 05/04/16 | 9 | ||||
| 04/26/16 | 05/05/16 | 9 | ||||
| 04/28/16 | 05/06/16 | 8 | ||||
| 04/29/16 | 05/09/16 | 10 | ||||
| 06/09/16 | 06/17/16 | 8 | ||||
| 06/10/16 | 06/20/16 | 10 | ||||
| 06/13/16 | 06/21/16 | 8 | ||||
| 06/14/16 | 06/22/16 | 8 | ||||
| 06/15/16 | 06/23/16 | 8 | ||||
| 08/02/16 | 08/10/16 | 8 | ||||
| 08/03/16 | 08/11/16 | 8 | ||||
| 08/04/16 | 08/12/16 | 8 | ||||
| 08/05/16 | 08/15/16 | 10 | ||||
| 08/08/16 | 08/16/16 | 8 | ||||
| 12/09/16 | 12/19/16 | 10 | ||||
| 12/12/16 | 12/20/16 | 8 | ||||
| 12/13/16 | 12/21/16 | 8 | ||||
| 12/14/16 | 12/22/16 | 8 | ||||
| 12/15/16 | 12/28/16 | 13 | ||||
| 12/16/16 | 12/28/16 | 12 | ||||
| 12/19/16 | 12/29/16 | 10 | ||||
| 12/20/16 | 01/02/17 | 13 | ||||
| 12/21/16 | 01/03/17 | 13 | ||||
| 12/22/16 | 01/04/17 | 13 | ||||
| 12/28/16 | 01/05/17 | 8 | ||||
| 12/29/16 | 01/06/17 | 8 | ||||
| Srpska | 01/04/16 | 01/12/16 | 8 | |||
| 01/05/16 | 01/13/16 | 8 | ||||
| Swaziland | 03/18/16 | 03/29/16 | 11 | |||
| 03/21/16 | 03/30/16 | 9 | ||||
| 03/22/16 | 03/31/16 | 9 | ||||
| 03/23/16 | 04/01/16 | 9 | ||||
| 03/24/16 | 04/04/16 | 11 | ||||
| 2016 | ||||||
| Country | Trade
Date |
Settlement
Date |
Number
of Days to Settle | |||
| 04/12/16 | 04/20/16 | 8 | ||||
| 04/13/16 | 04/21/16 | 8 | ||||
| 04/14/16 | 04/22/16 | 8 | ||||
| 04/15/16 | 04/26/16 | 11 | ||||
| 04/18/16 | 04/27/16 | 9 | ||||
| 04/20/16 | 04/28/16 | 8 | ||||
| 04/21/16 | 04/29/16 | 8 | ||||
| 04/22/16 | 05/02/16 | 10 | ||||
| 04/28/16 | 05/06/16 | 8 | ||||
| 04/29/16 | 05/09/16 | 10 | ||||
| 05/02/16 | 05/10/16 | 8 | ||||
| 05/03/16 | 05/11/16 | 8 | ||||
| 05/04/16 | 05/12/16 | 8 | ||||
| 07/15/16 | 07/25/16 | 10 | ||||
| 07/18/16 | 07/26/16 | 8 | ||||
| 07/19/16 | 07/27/16 | 8 | ||||
| 07/20/16 | 07/28/16 | 8 | ||||
| 07/21/16 | 07/29/16 | 8 | ||||
| 08/30/16 | 09/07/16 | 8 | ||||
| 08/31/16 | 09/08/16 | 8 | ||||
| 09/01/16 | 09/09/16 | 8 | ||||
| 09/02/16 | 09/12/16 | 10 | ||||
| 09/05/16 | 09/13/16 | 8 | ||||
| 12/19/16 | 12/27/16 | 8 | ||||
| 12/20/16 | 12/28/16 | 8 | ||||
| 12/21/16 | 12/29/16 | 8 | ||||
| 12/22/16 | 12/30/16 | 8 | ||||
| 12/23/16 | 01/03/17 | 11 | ||||
| 12/27/16 | 01/04/17 | 8 | ||||
| 12/28/16 | 01/05/17 | 8 | ||||
| 12/29/16 | 01/06/17 | 8 | ||||
| 12/30/16 | 01/09/17 | 10 | ||||
| Taiwan | 02/02/16 | 02/15/16 | 13 | |||
| 02/03/16 | 02/16/16 | 13 | ||||
| Thailand | 04/08/16 | 04/18/16 | 10 | |||
| 04/11/16 | 04/19/16 | 8 | ||||
| 04/12/16 | 04/20/16 | 8 | ||||
| 04/29/16 | 05/09/16 | 10 | ||||
| Trinidad and Tobago | 03/23/16 | 03/31/16 | 8 | |||
| 03/24/16 | 04/01/16 | 8 | ||||
| Tunisia | 06/30/16 | 07/08/16 | 8 | |||
| 07/01/16 | 07/11/16 | 10 | ||||
| 07/04/16 | 07/12/16 | 8 | ||||
| Turkey | 06/30/16 | 07/11/16 | 11 | |||
| 07/01/16 | 07/12/16 | 11 | ||||
| 2016 | ||||||
| Country | Trade
Date |
Settlement
Date |
Number
of Days to Settle | |||
| 09/08/16 | 09/19/16 | 11 | ||||
| 09/09/16 | 09/20/16 | 11 | ||||
| Uganda | 01/19/16 | 01/27/16 | 8 | |||
| 01/20/16 | 01/28/16 | 8 | ||||
| 01/21/16 | 01/29/16 | 8 | ||||
| 01/22/16 | 02/01/16 | 10 | ||||
| 01/25/16 | 02/02/16 | 8 | ||||
| 02/09/16 | 02/17/16 | 8 | ||||
| 02/10/16 | 02/18/16 | 8 | ||||
| 02/11/16 | 02/19/16 | 8 | ||||
| 02/12/16 | 02/22/16 | 10 | ||||
| 02/15/16 | 02/23/16 | 8 | ||||
| 03/01/16 | 03/09/16 | 8 | ||||
| 03/02/16 | 03/10/16 | 8 | ||||
| 03/03/16 | 03/11/16 | 8 | ||||
| 03/04/16 | 03/14/16 | 10 | ||||
| 03/07/16 | 03/15/16 | 8 | ||||
| 03/18/16 | 03/29/16 | 11 | ||||
| 03/21/16 | 03/30/16 | 9 | ||||
| 03/22/16 | 03/31/16 | 9 | ||||
| 03/23/16 | 04/01/16 | 9 | ||||
| 03/24/16 | 04/04/16 | 11 | ||||
| 05/27/16 | 06/06/16 | 10 | ||||
| 05/30/16 | 06/07/16 | 8 | ||||
| 05/31/16 | 06/08/16 | 8 | ||||
| 06/01/16 | 06/10/16 | 9 | ||||
| 06/02/16 | 06/13/16 | 11 | ||||
| 06/06/16 | 06/14/16 | 8 | ||||
| 06/07/16 | 06/15/16 | 8 | ||||
| 06/08/16 | 06/16/16 | 8 | ||||
| 12/19/16 | 12/27/16 | 8 | ||||
| 12/20/16 | 12/28/16 | 8 | ||||
| 12/21/16 | 12/29/16 | 8 | ||||
| 12/22/16 | 12/30/16 | 8 | ||||
| 12/23/16 | 01/03/17 | 11 | ||||
| 12/27/16 | 01/04/17 | 8 | ||||
| 12/28/16 | 01/05/17 | 8 | ||||
| 12/29/16 | 01/06/17 | 8 | ||||
| 12/30/16 | 01/09/17 | 10 | ||||
| Ukraine | 01/05/16 | 01/13/16 | 8 | |||
| The United Arab Emirates | 09/07/16 | 09/15/16 | 8 | |||
| 09/08/16 | 09/18/16 | 10 | ||||
| Vietnam | 02/03/16 | 02/15/16 | 12 | |||
| 02/04/16 | 02/16/16 | 12 | ||||
| 02/05/16 | 02/17/16 | 12 | ||||
| 2016 | ||||||
| Country | Trade
Date |
Settlement
Date |
Number
of Days to Settle | |||
| Zimbabwe | 03/18/16 | 03/29/16 | 11 | |||
| 03/21/16 | 03/30/16 | 9 | ||||
| 03/22/16 | 03/31/16 | 9 | ||||
| 03/23/16 | 04/01/16 | 9 | ||||
| 03/24/16 | 04/04/16 | 11 | ||||
| 04/11/16 | 04/19/16 | 8 | ||||
| 04/12/16 | 04/20/16 | 8 | ||||
| 04/13/16 | 04/21/16 | 8 | ||||
| 04/14/16 | 04/22/16 | 8 | ||||
| 04/15/16 | 04/25/16 | 10 | ||||
| 04/25/16 | 05/03/16 | 8 | ||||
| 04/26/16 | 05/04/16 | 8 | ||||
| 04/27/16 | 05/05/16 | 8 | ||||
| 04/28/16 | 05/06/16 | 8 | ||||
| 04/29/16 | 05/09/16 | 10 | ||||
| 05/18/16 | 05/26/16 | 8 | ||||
| 05/19/16 | 05/27/16 | 8 | ||||
| 05/20/16 | 05/30/16 | 10 | ||||
| 05/23/16 | 05/31/16 | 8 | ||||
| 05/24/16 | 06/01/16 | 8 | ||||
| 08/01/16 | 08/10/16 | 9 | ||||
| 08/02/16 | 08/11/16 | 9 | ||||
| 08/03/16 | 08/12/16 | 9 | ||||
| 08/04/16 | 08/15/16 | 11 | ||||
| 08/05/16 | 08/16/16 | 11 | ||||
| 12/15/16 | 12/23/16 | 8 | ||||
| 12/16/16 | 12/27/16 | 11 | ||||
| 12/19/16 | 12/28/16 | 9 | ||||
| 12/20/16 | 12/29/16 | 9 | ||||
| 12/21/16 | 12/30/16 | 9 | ||||
| 12/23/16 | 01/03/17 | 11 | ||||
| 12/27/16 | 01/04/17 | 8 | ||||
| 12/28/16 | 01/05/17 | 8 | ||||
| 12/29/16 | 01/06/17 | 8 | ||||
| 12/30/16 | 01/09/17 | 10 | ||||
| 2017 | ||||||
| Country | Trade
Date |
Settlement
Date |
Number
of Days to Settle | |||
| Australia | 04/11/17 | 04/19/17 | 8 | |||
| 04/12/17 | 04/20/17 | 8 | ||||
| 04/13/17 | 04/21/17 | 8 | ||||
| Bangladesh | 06/20/17 | 06/28/17 | 8 | |||
| 06/21/17 | 06/29/17 | 8 | ||||
| 06/22/17 | 07/02/17 | 10 | ||||
| Brazil | 02/22/17 | 03/02/17 | 8 | |||
| 2017 | ||||||
| Country | Trade
Date |
Settlement
Date |
Number
of Days to Settle | |||
| 02/23/17 | 03/03/17 | 8 | ||||
| 02/24/17 | 03/06/17 | 11 | ||||
| China | 01/24/17 | 02/03/17 | 10 | |||
| 01/25/17 | 02/06/17 | 12 | ||||
| 01/26/17 | 02/07/17 | 12 | ||||
| 09/27/17 | 10/09/17 | 12 | ||||
| 09/28/17 | 10/10/17 | 12 | ||||
| 09/29/17 | 10/11/17 | 12 | ||||
| Costa Rica | 04/07/17 | 04/17/17 | 10 | |||
| 04/10/17 | 04/18/17 | 8 | ||||
| Indonesia | 06/21/17 | 07/03/17 | 12 | |||
| 06/22/17 | 07/04/17 | 12 | ||||
| 06/23/17 | 07/05/17 | 12 | ||||
| Israel | 04/06/17 | 04/18/17 | 12 | |||
| 04/09/17 | 04/19/17 | 10 | ||||
| 10/02/17 | 10/15/17 | 13 | ||||
| 10/03/17 | 10/16/17 | 13 | ||||
| Japan | 04/28/17 | 05/08/17 | 10 | |||
| 05/01/17 | 05/09/17 | 8 | ||||
| 05/02/17 | 05/10/17 | 8 | ||||
| Jordan | 06/21/17 | 06/29/17 | 8 | |||
| 06/22/17 | 07/02/17 | 10 | ||||
| Malawi | 01/09/17 | 01/17/17 | 8 | |||
| 01/10/17 | 01/18/17 | 8 | ||||
| 01/11/17 | 01/19/17 | 8 | ||||
| 01/12/17 | 01/20/17 | 8 | ||||
| 01/13/17 | 01/23/17 | 10 | ||||
| 02/24/17 | 03/06/17 | 10 | ||||
| 02/27/17 | 03/07/17 | 8 | ||||
| 02/28/17 | 03/08/17 | 8 | ||||
| 03/01/17 | 03/09/17 | 8 | ||||
| 03/02/17 | 03/10/17 | 8 | ||||
| 04/07/17 | 04/18/17 | 11 | ||||
| 04/10/17 | 04/19/17 | 9 | ||||
| 04/11/17 | 04/20/17 | 9 | ||||
| 04/12/17 | 04/21/17 | 9 | ||||
| 04/13/17 | 04/24/17 | 11 | ||||
| 04/24/17 | 05/02/17 | 8 | ||||
| 04/25/17 | 05/03/17 | 8 | ||||
| 04/26/17 | 05/04/17 | 8 | ||||
| 04/27/17 | 05/05/17 | 8 | ||||
| 04/28/17 | 05/08/17 | 10 | ||||
| 05/08/17 | 05/16/17 | 8 | ||||
| 2017 | ||||||
| Country | Trade
Date |
Settlement
Date |
Number
of Days to Settle | |||
| 05/09/17 | 05/17/17 | 8 | ||||
| 05/10/17 | 05/18/17 | 8 | ||||
| 05/11/17 | 05/19/17 | 8 | ||||
| 05/12/17 | 05/22/17 | 10 | ||||
| 06/19/17 | 06/27/17 | 8 | ||||
| 06/20/17 | 06/28/17 | 8 | ||||
| 06/21/17 | 06/29/17 | 8 | ||||
| 06/22/17 | 06/30/17 | 8 | ||||
| 06/23/17 | 07/03/17 | 10 | ||||
| 06/29/17 | 07/07/17 | 8 | ||||
| 06/30/17 | 07/10/17 | 8 | ||||
| 07/03/17 | 07/11/17 | 8 | ||||
| 07/04/17 | 07/12/17 | 8 | ||||
| 07/05/17 | 07/13/17 | 8 | ||||
| 12/18/17 | 12/27/17 | 9 | ||||
| 12/19/17 | 12/28/17 | 9 | ||||
| 12/20/17 | 12/29/17 | 9 | ||||
| 12/21/17 | 01/02/18 | 12 | ||||
| 12/22/17 | 01/03/18 | 12 | ||||
| Malaysia | 01/24/17 | 02/01/17 | 8 | |||
| 01/25/17 | 02/02/17 | 8 | ||||
| 01/26/17 | 02/03/17 | 8 | ||||
| Namibia | 03/14/17 | 03/22/17 | 8 | |||
| 03/15/17 | 03/23/17 | 8 | ||||
| 03/16/17 | 03/24/17 | 8 | ||||
| 03/17/17 | 03/27/17 | 10 | ||||
| 03/20/17 | 03/28/17 | 8 | ||||
| 04/07/17 | 04/18/17 | 11 | ||||
| 04/10/17 | 04/19/17 | 9 | ||||
| 04/11/17 | 04/20/17 | 9 | ||||
| 04/12/17 | 04/21/17 | 9 | ||||
| 04/13/17 | 04/24/17 | 11 | ||||
| 04/20/17 | 04/28/17 | 8 | ||||
| 04/21/17 | 05/01/17 | 10 | ||||
| 04/24/17 | 05/02/17 | 8 | ||||
| 04/25/17 | 05/05/17 | 10 | ||||
| 04/26/17 | 05/08/17 | 12 | ||||
| 04/28/17 | 05/09/17 | 11 | ||||
| 05/02/17 | 05/10/17 | 8 | ||||
| 05/03/17 | 05/11/17 | 8 | ||||
| 05/18/17 | 05/26/17 | 8 | ||||
| 05/19/17 | 05/29/17 | 10 | ||||
| 05/22/17 | 05/30/17 | 8 | ||||
| 05/23/17 | 05/31/17 | 8 | ||||
| 05/24/17 | 06/01/17 | 8 | ||||
| 06/09/17 | 06/19/17 | 10 | ||||
| 06/12/17 | 06/20/17 | 8 | ||||
| 06/13/17 | 06/21/17 | 8 | ||||
| 2017 | ||||||
| Country | Trade
Date |
Settlement
Date |
Number
of Days to Settle | |||
| 06/14/17 | 06/22/17 | 8 | ||||
| 06/15/17 | 06/23/17 | 8 | ||||
| 08/02/17 | 08/10/17 | 8 | ||||
| 08/03/17 | 08/11/17 | 8 | ||||
| 08/04/17 | 08/14/17 | 10 | ||||
| 08/07/17 | 08/15/17 | 8 | ||||
| 08/08/17 | 08/16/17 | 8 | ||||
| 09/18/17 | 09/26/17 | 8 | ||||
| 09/19/17 | 09/27/17 | 8 | ||||
| 09/20/17 | 09/28/17 | 8 | ||||
| 09/21/17 | 09/29/17 | 8 | ||||
| 09/22/17 | 10/02/17 | 10 | ||||
| 12/04/17 | 12/12/17 | 8 | ||||
| 12/05/17 | 12/13/17 | 8 | ||||
| 12/06/17 | 12/14/17 | 8 | ||||
| 12/07/17 | 12/15/17 | 8 | ||||
| 12/08/17 | 12/18/17 | 10 | ||||
| 12/18/17 | 12/28/17 | 10 | ||||
| 12/19/17 | 12/29/17 | 10 | ||||
| 12/20/17 | 01/02/18 | 13 | ||||
| 12/21/17 | 01/03/18 | 13 | ||||
| 12/22/17 | 01/04/18 | 13 | ||||
| Norway | 04/10/17 | 04/18/17 | 8 | |||
| 04/11/17 | 04/19/17 | 8 | ||||
| Qatar | 06/20/17 | 06/28/17 | 8 | |||
| 06/21/17 | 06/29/17 | 8 | ||||
| 06/22/17 | 06/30/17 | 8 | ||||
| Saudi Arabia | 06/24/17 | 07/02/17 | 8 | |||
| 06/25/17 | 07/03/17 | 8 | ||||
| South Africa | 03/14/17 | 03/22/17 | 8 | |||
| 03/15/17 | 03/23/17 | 8 | ||||
| 03/16/17 | 03/24/17 | 8 | ||||
| 03/17/17 | 03/27/17 | 10 | ||||
| 03/20/17 | 03/28/17 | 8 | ||||
| 04/07/17 | 04/18/17 | 11 | ||||
| 04/10/17 | 04/19/17 | 9 | ||||
| 04/11/17 | 04/20/17 | 9 | ||||
| 04/12/17 | 04/21/17 | 9 | ||||
| 04/13/17 | 04/24/17 | 11 | ||||
| 04/20/17 | 04/28/17 | 8 | ||||
| 04/21/17 | 05/02/17 | 11 | ||||
| 04/24/17 | 05/03/17 | 9 | ||||
| 04/25/17 | 05/04/17 | 9 | ||||
| 04/26/17 | 05/05/17 | 9 | ||||
| 04/28/17 | 05/08/17 | 10 | ||||
| 06/09/17 | 06/19/17 | 10 | ||||
| 2017 | ||||||
| Country | Trade
Date |
Settlement
Date |
Number
of Days to Settle | |||
| 06/12/17 | 06/20/17 | 8 | ||||
| 06/13/17 | 06/21/17 | 8 | ||||
| 06/14/17 | 06/22/17 | 8 | ||||
| 06/15/17 | 06/23/17 | 8 | ||||
| 08/02/17 | 08/10/17 | 8 | ||||
| 08/03/17 | 08/11/17 | 8 | ||||
| 08/04/17 | 08/14/17 | 10 | ||||
| 08/07/17 | 08/15/17 | 8 | ||||
| 08/08/17 | 08/16/17 | 8 | ||||
| 09/18/17 | 09/26/17 | 8 | ||||
| 09/19/17 | 09/27/17 | 8 | ||||
| 09/20/17 | 09/28/17 | 8 | ||||
| 09/21/17 | 09/29/17 | 8 | ||||
| 09/22/17 | 10/02/17 | 10 | ||||
| 12/18/17 | 12/27/17 | 9 | ||||
| 12/19/17 | 12/28/17 | 9 | ||||
| 12/20/17 | 12/29/17 | 9 | ||||
| 12/21/17 | 01/03/18 | 13 | ||||
| 12/22/17 | 01/04/18 | 13 | ||||
| South Korea | 09/29/17 | 10/10/17 | 11 | |||
| 10/02/17 | 10/11/17 | 9 | ||||
| Sri Lanka | 04/07/17 | 04/17/17 | 10 | |||
| Swaziland | 04/07/17 | 04/18/17 | 11 | |||
| 04/10/17 | 04/20/17 | 10 | ||||
| 04/11/17 | 04/21/17 | 10 | ||||
| 04/12/17 | 04/24/17 | 12 | ||||
| 04/13/17 | 04/26/17 | 13 | ||||
| 04/18/17 | 04/27/17 | 9 | ||||
| 04/20/17 | 04/28/17 | 8 | ||||
| 04/21/17 | 05/02/17 | 11 | ||||
| 04/24/17 | 05/03/17 | 9 | ||||
| 04/26/17 | 05/04/17 | 8 | ||||
| 04/27/17 | 05/08/17 | 11 | ||||
| 04/28/17 | 05/09/17 | 11 | ||||
| 05/02/17 | 05/10/17 | 8 | ||||
| 05/03/17 | 05/11/17 | 8 | ||||
| 05/04/17 | 05/12/17 | 8 | ||||
| 08/30/17 | 09/07/17 | 8 | ||||
| 08/31/17 | 09/08/17 | 8 | ||||
| 09/01/17 | 09/11/17 | 10 | ||||
| 09/04/17 | 09/12/17 | 8 | ||||
| 09/05/17 | 09/13/17 | 8 | ||||
| 12/18/17 | 12/27/17 | 9 | ||||
| 12/19/17 | 12/28/17 | 9 | ||||
| 12/20/17 | 12/29/17 | 9 | ||||
| 12/21/17 | 01/02/18 | 12 | ||||
| 12/22/17 | 01/03/18 | 12 | ||||
| 2017 | ||||||
| Country | Trade
Date |
Settlement
Date |
Number
of Days to Settle | |||
| Taiwan | 01/23/17 | 02/02/17 | 10 | |||
| 01/24/17 | 02/03/17 | 10 | ||||
| Turkey | 08/28/17 | 09/05/17 | 8 | |||
| 08/29/17 | 09/06/17 | 8 | ||||
| Uganda | 01/19/17 | 01/27/17 | 8 | |||
| 01/20/17 | 01/30/17 | 10 | ||||
| 01/23/17 | 02/01/17 | 9 | ||||
| 01/24/17 | 02/02/17 | 9 | ||||
| 01/25/17 | 02/03/17 | 9 | ||||
| 02/09/17 | 02/17/17 | 8 | ||||
| 02/10/17 | 02/18/17 | 8 | ||||
| 02/13/17 | 02/21/17 | 8 | ||||
| 02/14/17 | 02/22/17 | 8 | ||||
| 02/15/17 | 02/23/17 | 8 | ||||
| 03/01/17 | 03/09/17 | 8 | ||||
| 03/02/17 | 03/10/17 | 8 | ||||
| 03/03/17 | 03/13/17 | 10 | ||||
| 03/06/17 | 03/14/17 | 8 | ||||
| 03/07/17 | 03/15/17 | 8 | ||||
| 04/07/17 | 04/18/17 | 11 | ||||
| 04/10/17 | 04/19/17 | 9 | ||||
| 04/11/17 | 04/20/17 | 9 | ||||
| 04/12/17 | 04/21/17 | 9 | ||||
| 04/13/17 | 04/24/17 | 11 | ||||
| 04/24/17 | 05/02/17 | 8 | ||||
| 04/25/17 | 05/03/17 | 8 | ||||
| 04/26/17 | 05/04/17 | 8 | ||||
| 04/27/17 | 05/05/17 | 8 | ||||
| 04/28/17 | 05/08/17 | 10 | ||||
| 06/02/17 | 06/12/17 | 10 | ||||
| 06/05/17 | 06/13/17 | 8 | ||||
| 06/06/17 | 06/14/17 | 8 | ||||
| 06/07/17 | 06/15/17 | 8 | ||||
| 06/08/17 | 06/16/17 | 8 | ||||
| 06/19/17 | 06/27/17 | 8 | ||||
| 06/20/17 | 06/28/17 | 8 | ||||
| 06/21/17 | 06/29/17 | 8 | ||||
| 06/22/17 | 06/30/17 | 8 | ||||
| 06/23/17 | 07/03/17 | 10 | ||||
| 06/30/17 | 07/10/17 | 10 | ||||
| 07/03/17 | 07/11/17 | 8 | ||||
| 07/04/17 | 07/12/17 | 8 | ||||
| 07/05/17 | 07/13/17 | 8 | ||||
| 07/06/17 | 07/14/17 | 8 | ||||
| 09/06/17 | 09/14/17 | 8 | ||||
| 09/07/17 | 09/15/17 | 8 | ||||
| 09/08/17 | 09/18/17 | 10 | ||||
| 2017 | ||||||
| Country | Trade
Date |
Settlement
Date |
Number
of Days to Settle | |||
| 09/11/17 | 09/19/17 | 8 | ||||
| 09/12/17 | 09/20/17 | 8 | ||||
| 10/02/17 | 10/10/17 | 8 | ||||
| 10/03/17 | 10/11/17 | 8 | ||||
| 10/04/17 | 10/12/17 | 8 | ||||
| 10/05/17 | 10/13/17 | 8 | ||||
| 10/06/17 | 10/16/17 | 10 | ||||
| 11/23/17 | 12/01/17 | 8 | ||||
| 11/24/17 | 12/04/17 | 10 | ||||
| 11/27/17 | 12/05/17 | 8 | ||||
| 11/28/17 | 12/06/17 | 8 | ||||
| 11/29/17 | 12/07/17 | 8 | ||||
| 12/18/17 | 12/27/17 | 9 | ||||
| 12/19/17 | 12/28/17 | 9 | ||||
| 12/20/17 | 12/29/17 | 9 | ||||
| 12/21/17 | 01/02/18 | 12 | ||||
| 12/22/17 | 01/03/18 | 12 | ||||
| Uruguay | 04/10/17 | 04/18/17 | 8 | |||
| 04/11/17 | 04/19/17 | 8 | ||||
| 04/12/17 | 04/20/17 | 8 | ||||
| Vietnam | 01/23/17 | 02/02/17 | 10 | |||
| 01/24/17 | 02/03/17 | 10 | ||||
| 01/25/17 | 02/06/17 | 12 | ||||
| Zimbabwe | 04/07/17 | 04/19/17 | 12 | |||
| 04/10/17 | 04/20/17 | 10 | ||||
| 04/11/17 | 04/21/17 | 10 | ||||
| 04/12/17 | 04/24/17 | 12 | ||||
| 04/13/17 | 04/25/17 | 12 | ||||
| 04/24/17 | 05/02/17 | 8 | ||||
| 04/25/17 | 05/03/17 | 8 | ||||
| 04/26/17 | 05/04/17 | 8 | ||||
| 04/27/17 | 05/05/17 | 8 | ||||
| 04/28/17 | 05/08/17 | 10 | ||||
| 05/18/17 | 05/26/17 | 8 | ||||
| 05/19/17 | 05/29/17 | 10 | ||||
| 05/22/17 | 05/30/17 | 8 | ||||
| 05/23/17 | 05/31/17 | 8 | ||||
| 05/24/17 | 06/01/17 | 8 | ||||
| 08/07/17 | 08/16/17 | 9 | ||||
| 08/08/17 | 08/17/17 | 9 | ||||
| 08/09/17 | 08/18/17 | 9 | ||||
| 08/10/17 | 08/21/17 | 11 | ||||
| 08/11/17 | 08/22/17 | 11 | ||||
| 12/15/17 | 12/27/17 | 12 | ||||
| 12/18/17 | 12/28/17 | 10 | ||||
| 12/19/17 | 12/29/17 | 10 | ||||
| 12/20/17 | 01/02/18 | 13 | ||||
| 2017 | ||||||
| Country | Trade
Date |
Settlement
Date |
Number
of Days to Settle | |||
| 12/21/17 | 01/03/18 | 13 | ||||
| * | These worst-case redemption cycles are based on information regarding regular holidays, which may be out of date. Based on changes in holidays, longer (worse) redemption cycles are possible. |
(as revised July 3, 2017)
| Funds | Ticker | Listing Exchange | ||
| iShares Emerging Markets High Yield Bond ETF | EMHY | BATS | ||
| iShares Global High Yield Corporate Bond ETF | GHYG | BATS | ||
| iShares International High Yield Bond ETF | HYXU | BATS | ||
| iShares J.P. Morgan EM Corporate Bond ETF | CEMB | BATS | ||
| iShares J.P. Morgan EM Local Currency Bond ETF | LEMB | NYSE Arca |
| • | iShares Emerging Markets High Yield Bond ETF |
| • | iShares Global High Yield Corporate Bond ETF |
| • | iShares International High Yield Bond ETF |
| • | iShares J.P. Morgan EM Corporate Bond ETF1 |
| • | iShares
J.P. Morgan EM Local Currency Bond ETF2 |
| 1 | On June 1, 2017, the name of the Fund changed from iShares Emerging Markets Corporate Bond ETF to iShares J.P. Morgan EM Corporate Bond ETF and the Fund’s Underlying Index changed from the Morningstar® Emerging Markets Corporate Bond IndexSM to the J.P. Morgan CEMBI Broad Diversified Core Index. |
| 2 | On June 1, 2017, the name of the Fund changed from iShares Emerging Markets Local Currency Bond ETF to iShares J.P. Morgan EM Local Currency Bond ETF and the Fund’s Underlying Index changed from the Bloomberg Barclays Emerging Markets Broad Local Currency Bond Index to the J.P. Morgan GBI-EM Global Diversified 15% Cap 4.5% Floor Index. |
| Diversified Funds | Non-Diversified Funds | |
| iShares Global High Yield Corporate Bond ETF | iShares Emerging Markets High Yield Bond ETF | |
| iShares International High Yield Bond ETF | iShares J.P. Morgan EM Local Currency Bond ETF | |
| iShares J.P. Morgan EM Corporate Bond ETF |
| • | High yield bonds may be issued by less creditworthy companies. These securities are vulnerable to adverse changes in the issuer’s industry and to general economic conditions. Issuers of high yield bonds may be unable to meet their interest or principal payment obligations because of an economic downturn, specific issuer developments or the unavailability of additional financing. |
| • | The issuers of high yield bonds may have a larger amount of outstanding debt relative to their assets than issuers of investment grade bonds. If the issuer experiences financial stress, it may be unable to meet its debt obligations. The issuer’s ability to pay its debt obligations also may be lessened by specific issuer developments, or the unavailability of additional financing. Issuers of high yield securities are often in the growth stage of their development and/or involved in a reorganization or takeover. |
| • | High yield bonds are frequently ranked junior to claims by other creditors. If the issuer cannot meet its obligations, the senior obligations are generally paid off before the junior obligations, which will potentially limit a Fund’s ability to fully recover principal, to receive interest payments when senior securities are in default or to receive restructuring benefits paid to holders of more senior classes of debt. Thus, investors in high yield securities frequently have a lower degree of protection with respect to principal and interest payments than do investors in higher rated securities. |
| • | High yield bonds frequently have redemption features that permit an issuer to repurchase the security from a Fund before it matures. If an issuer redeems the high yield bonds, a Fund may have to invest the proceeds in bonds with lower yields and may lose income. |
| • | Prices of high yield bonds are subject to extreme fluctuations. Negative economic developments may have a greater impact on the prices of high yield bonds than on those of other higher rated fixed-income securities. |
| • | High yield bonds may be less liquid than higher rated fixed-income securities even under normal economic conditions. Under certain economic and/or market conditions, a Fund may have difficulty disposing of certain high yield securities due to the limited number of investors in that sector of the market. There are fewer dealers in the high yield bond market, and there may be significant differences in the prices quoted for high yield bonds by dealers, and such quotations may not be the actual prices available for a purchase or sale. Because high yield bonds are less liquid, judgment may play a greater role in the prices and values generated for such securities than in the case of securities trading in a more liquid market. |
| • | The secondary markets for high yield securities generally are not as liquid as the secondary markets for higher rated securities. The secondary markets for high yield securities generally are concentrated in relatively few market makers and participants in the markets are mostly institutional investors, including insurance companies, banks, other financial institutions and mutual funds. In addition, the trading volume for high yield securities is generally lower than that for higher rated securities and the secondary markets could contract under adverse market or economic conditions independent of any specific adverse changes in the condition of a particular issuer. Under certain economic and/or market conditions, a Fund may have difficulty disposing of certain high yield securities due to the limited number of investors in that sector of the market. A less liquid secondary market may adversely affect the market price of the high yield security, which may result in increased difficulty selling the particular issue and obtaining accurate market quotations on the issue when valuing a Fund’s assets. Market quotations on high yield securities are available only from a limited number of dealers, and such quotations may not be the actual prices available for a purchase or sale. When the secondary market for high yield securities becomes more illiquid, or in the absence of readily available market quotations for such securities, the relative lack of reliable objective data makes it more difficult to value such securities, and judgment plays a more important role in determining such valuations. |
| • | A Fund may incur expenses to the extent necessary to seek recovery upon default or to negotiate new terms with a defaulting issuer. |
| • | The high yield bond markets may react strongly to adverse news about an issuer or the economy, or to the perception or expectation of adverse news, whether or not it is based on fundamental analysis. Additionally, prices for high yield securities may be affected by legislative and regulatory developments. These developments could adversely affect a Fund’s net asset value and investment practices, the secondary market for high yield securities, the financial condition of issuers of these securities and the value and liquidity of outstanding high yield securities, especially in a thinly traded market. For example, federal legislation requiring the divestiture by federally insured savings and loan associations of their investments in high yield bonds and limiting the deductibility of interest by certain corporate issuers of high yield bonds adversely affected the market in the past. |
| 1. | Concentrate its investments (i.e., invest 25% or more of its total assets in the securities of a particular industry or group of industries), except that the Fund will concentrate to approximately the same extent that the Underlying Index concentrates in the securities of a particular industry or group of industries. For purposes of this limitation, securities of the U.S. government (including its agencies and instrumentalities), repurchase agreements collateralized by U.S. government securities, and securities of state or municipal governments and their political subdivisions are not considered to be issued by members of any industry. |
| 2. | Borrow money, except that (i) the Fund may borrow from banks for temporary or emergency (not leveraging) purposes, including the meeting of redemption requests which might otherwise require the untimely disposition of securities; and (ii) the Fund may, to the extent consistent with its investment policies, enter into repurchase agreements, reverse repurchase agreements, forward roll transactions and similar investment strategies and techniques. To the extent that it engages in transactions described in (i) and (ii), the Fund will be limited so that no more than 33 1/3% of the value of its total assets (including the amount borrowed) is derived from such transactions. Any borrowings which come to exceed this amount will be reduced in accordance with applicable law. |
| 3. | Issue any senior security, except as permitted under the 1940 Act, as interpreted, modified or otherwise permitted by any regulatory authority having jurisdiction, from time to time. |
| 4. | Make loans, except as permitted under the 1940 Act, as interpreted, modified or otherwise permitted by regulatory authority having jurisdiction, from time to time. |
| 5. | Purchase or sell real estate unless acquired as a result of ownership of securities or other instruments (but this restriction shall not prevent the Fund from investing in securities of companies engaged in the real estate business or securities or other instruments backed by real estate or mortgages), or commodities or commodity contracts (but this restriction shall not prevent the Fund from trading in futures contracts and options on futures contracts, including options on currencies to the extent consistent with the Fund’s investment objective and policies). |
| 6. | Engage in the business of underwriting securities issued by other persons, except to the extent that the Fund may technically be deemed to be an underwriter under the 1933 Act, in disposing of portfolio securities. |
| 1. | Concentrate its investments (i.e., invest 25% or more of its total assets in the securities of a particular industry or group of industries), except that the Fund will concentrate to approximately the same extent that the Underlying Index concentrates in the securities of a particular industry or group of industries. For purposes of this limitation, securities of the U.S. government (including its agencies and instrumentalities), repurchase agreements collateralized by U.S. government securities, and securities of state or municipal governments and their political subdivisions are not considered to be issued by members of any industry. |
| 2. | Borrow money, except that (i) the Fund may borrow from banks for temporary or emergency (not leveraging) purposes, including the meeting of redemption requests which might otherwise require the untimely disposition of securities; and (ii) the Fund may, to the extent consistent with its investment policies, enter into repurchase agreements, reverse repurchase agreements, forward roll transactions and similar investment strategies and techniques. To the extent that it engages in transactions described in (i) and (ii), the Fund will be limited so that no more than 33 1/3% of the value of |
| its total assets (including the amount borrowed) is derived from such transactions. Any borrowings which come to exceed this amount will be reduced in accordance with applicable law. | |
| 3. | Issue “senior securities” as defined in the 1940 Act and the rules, regulations and orders thereunder, except as permitted under the 1940 Act and the rules, regulation and orders thereunder. |
| 4. | Make loans, except as permitted under the 1940 Act, as interpreted, modified or otherwise permitted by regulatory authority having jurisdiction, from time to time. |
| 5. | Purchase or sell real estate unless acquired as a result of ownership of securities or other instruments (but this restriction shall not prevent the Fund from investing in securities of companies engaged in the real estate business or securities or other instruments backed by real estate or mortgages), or commodities or commodity contracts (but this restriction shall not prevent the Fund from trading in futures contracts and options on futures contracts, including options on currencies to the extent consistent with the Fund’s investment objective and policies). |
| 6. | Engage in the business of underwriting securities issued by other persons, except to the extent that the Fund may technically be deemed to be an underwriter under the 1933 Act, in disposing of portfolio securities. |
| • | The frequency of trades and quotes for the security; |
| • | The number of dealers wishing to purchase or sell the security and the number of other potential purchasers; |
| • | Dealer undertakings to make a market in the security; and |
| • | The nature of the security and the nature of the marketplace in which it trades (e.g., the time needed to dispose of the security, the method of soliciting offers and the mechanics of transfer). |
| Name (Age) | Position | Principal
Occupation(s) During the Past 5 Years |
Other
Directorships Held by Director | |||
| Robert
S. Kapito1 (60) |
Director
(since 2009). |
President, BlackRock, Inc. (since 2006); Vice Chairman of BlackRock, Inc. and Head of BlackRock’s Portfolio Management Group (since its formation in 1998) and BlackRock, Inc.’s predecessor entities (since 1988); Trustee, University of Pennsylvania (since 2009); President of Board of Directors, Hope & Heroes Children’s Cancer Fund (since 2002). | Director of BlackRock, Inc. (since 2006); Trustee of iShares Trust (since 2009); Trustee of iShares U.S. ETF Trust (since 2011). |
| Name (Age) | Position | Principal
Occupation(s) During the Past 5 Years |
Other
Directorships Held by Director | |||
| Mark
K. Wiedman2 (46) |
Director (since 2013). | Senior Managing Director, BlackRock, Inc. (since 2014); Managing Director, BlackRock, Inc. (2007-2014); Global Head of BlackRock’s ETF and Index Investments Business (since 2016); Global Head of iShares (2011-2016); Head of Corporate Strategy, BlackRock, Inc. (2009-2011). | Trustee of iShares Trust (since 2013); Trustee of iShares U.S. ETF Trust (since 2013); Director of PennyMac Financial Services, Inc. (since 2008). |
| 1 | Robert S. Kapito is deemed to be an “interested person” (as defined in the 1940 Act) of the Company due to his affiliations with BlackRock, Inc. and its affiliates. |
| 2 | Mark K. Wiedman is deemed to be an “interested person” (as defined in the 1940 Act) of the Company due to his affiliations with BlackRock, Inc. and its affiliates. |
| Name (Age) | Position | Principal
Occupation(s) During the Past 5 Years |
Other
Directorships Held by Director | |||
| Cecilia
H. Herbert (68) |
Director
(since 2005); Independent Board Chair (since 2016). |
Trustee and Member of the Finance, Technology and Quality Committee of Stanford Health Care (since 2016); Trustee and Member of the Investment Committee, WNET, a New York public media company (since 2011); Chair (1994-2005) and Member (since 1992) of the Investment Committee, Archdiocese of San Francisco; Director (1998-2013) and President (2007-2011) of the Board of Directors, Catholic Charities CYO; Trustee (2002-2011) and Chair of the Finance and Investment Committee (2006-2010) of the Thacher School. | Trustee of iShares Trust (since 2005); Trustee of iShares U.S. ETF Trust (since 2011); Independent Board Chair of iShares Trust and iShares U.S. ETF Trust (since 2016); Trustee of Forward Funds (14 portfolios) (since 2009); Trustee of Salient MF Trust (4 portfolios) (since 2015). | |||
| Jane
D. Carlin (61) |
Director
(since 2015); Risk Committee Chair (since 2016). |
Consultant (since 2012); Managing Director and Global Head of Financial Holding Company Governance & Assurance and the Global Head of Operational Risk Management of Morgan Stanley (2006-2012). | Trustee of iShares Trust (since 2015); Trustee of iShares U.S. ETF Trust (since 2015); Director of PHH Corporation (mortgage solutions) (since 2012); Director of The Hanover Insurance Group, Inc. (since 2016). | |||
| Richard
L. Fagnani (62) |
Director
(since 2017); Equity Plus Committee Chair (since 2017). |
Partner, KPMG LLP (2002-2016). | Trustee of iShares Trust (since 2017); Trustee of iShares U.S. ETF Trust (since 2017). |
| Name (Age) | Position | Principal
Occupation(s) During the Past 5 Years |
Other
Directorships Held by Director | |||
| Charles
A. Hurty (73) |
Director
(since 2005); Audit Committee Chair (since 2006). |
Retired; Partner, KPMG LLP (1968-2001). | Trustee of iShares Trust (since 2005); Trustee of iShares U.S. ETF Trust (since 2011); Director of SkyBridge Alternative Investments Multi-Adviser Hedge Fund Portfolios LLC (2 portfolios) (since 2002). | |||
| John
E. Kerrigan (61) |
Director
(since 2005); Securities Lending Committee Chair (since 2016). |
Chief Investment Officer, Santa Clara University (since 2002). | Trustee of iShares Trust (since 2005); Trustee of iShares U.S. ETF Trust (since 2011). | |||
| Drew
E. Lawton (58) |
Director
(since 2017); 15(c) Committee Chair (since 2017). |
Senior Managing Director of New York Life Insurance Company (2010-2015). | Trustee of iShares Trust (since 2017); Trustee of iShares U.S. ETF Trust (since 2017). | |||
| John
E. Martinez (56) |
Director
(since 2003); Fixed Income Plus Committee Chair (since 2016). |
Director of Real Estate Equity Exchange, Inc. (since 2005). | Trustee of iShares Trust (since 2003); Trustee of iShares U.S. ETF Trust (since 2011). | |||
| Madhav
V. Rajan (52) |
Director
(since 2011); Nominating and Governance Committee Chair (since 2017). |
Dean, and George Pratt Shultz Professor of Accounting, University of Chicago Booth School of Business (since 2017); Robert K. Jaedicke Professor of Accounting, Stanford University Graduate School of Business (2001-2017); Professor of Law (by courtesy), Stanford Law School (2005-2017); Senior Associate Dean for Academic Affairs and Head of MBA Program, Stanford University Graduate School of Business (2010-2016). | Trustee
of iShares Trust (since 2011); Trustee of iShares U.S. ETF Trust (since 2011); Director, Cavium, Inc. (since 2013). |
| Name (Age) | Position | Principal
Occupation(s) During the Past 5 Years | ||
| Martin
Small (41) |
President (since 2016). | Managing Director, BlackRock, Inc. (since 2010); Head of U.S. iShares (since 2015); Co-Head of the U.S. Financial Markets Advisory Group, BlackRock, Inc. (2008-2014). | ||
| Jack
Gee (57) |
Treasurer
and Chief Financial Officer (since 2008). |
Managing Director, BlackRock, Inc. (since 2009); Senior Director of Fund Administration of Intermediary Investor Business, BGI (2009). |
| Name (Age) | Position | Principal
Occupation(s) During the Past 5 Years | ||
| Charles
Park (49) |
Chief Compliance Officer (since 2006). | Chief Compliance Officer of BlackRock Advisors, LLC and the BlackRock-advised Funds in the Equity-Bond Complex, the Equity-Liquidity Complex and the Closed-End Complex (since 2014); Chief Compliance Officer of BFA (since 2006). | ||
| Benjamin
Archibald (42) |
Secretary (since 2015). | Managing Director, BlackRock, Inc. (since 2014); Director, BlackRock, Inc. (2010-2013); Secretary of the BlackRock-advised mutual funds (since 2012). | ||
| Steve
Messinger (55) |
Executive
Vice President (since 2016). |
Managing Director, BlackRock, Inc. (2007-2014 and since 2016); Managing Director, Beacon Consulting Group (2014-2016). | ||
| Scott
Radell (48) |
Executive
Vice President (since 2012). |
Managing Director, BlackRock, Inc. (since 2009); Head of Portfolio Solutions, BlackRock, Inc. (since 2009). | ||
| Alan
Mason (56) |
Executive
Vice President (since 2016). |
Managing Director, BlackRock, Inc. (since 2009). |
| Name | Fund | Dollar
Range of Equity Securities in the Fund |
Aggregate
Dollar Range of Equity Securities in all Registered Investment Companies Overseen by Director or Advisory Board Member in Family of Investment Companies | |||
| Robert S. Kapito | None | None | None |
| Name | Fund | Dollar
Range of Equity Securities in the Fund |
Aggregate
Dollar Range of Equity Securities in all Registered Investment Companies Overseen by Director or Advisory Board Member in Family of Investment Companies | |||
| Mark K. Wiedman | iShares Core MSCI EAFE ETF | $50,001-$100,000 | Over $100,000 | |||
| iShares Core MSCI Emerging Markets ETF | $50,001-$100,000 | |||||
| iShares Core S&P Total U.S. Stock Market ETF | Over $100,000 | |||||
| iShares National Muni Bond ETF | Over $100,000 | |||||
| iShares New York Muni Bond ETF | Over $100,000 | |||||
| John E. Martinez | iShares Core MSCI Total International Stock ETF | $1-$10,000 | Over $100,000 | |||
| iShares Core S&P 500 ETF | Over $100,000 | |||||
| iShares Core S&P Total U.S. Stock Market ETF | $1-$10,000 | |||||
| iShares Global Consumer Staples ETF | Over $100,000 | |||||
| iShares MSCI All Country Asia ex Japan ETF | Over $100,000 | |||||
| iShares MSCI EAFE ETF | Over $100,000 | |||||
| iShares Russell 1000 ETF | Over $100,000 | |||||
| iShares Russell 1000 Value ETF | Over $100,000 | |||||
| iShares Russell 2000 ETF | Over $100,000 | |||||
| iShares Short Maturity Bond ETF | Over $100,000 | |||||
| iShares TIPS Bond ETF | $50,001-$100,000 | |||||
| Cecilia H. Herbert | iShares California Muni Bond ETF | Over $100,000 | Over $100,000 | |||
| iShares China Large-Cap ETF | $50,001-$100,000 | |||||
| iShares Core Dividend Growth ETF | $10,001-$50,000 | |||||
| iShares Core High Dividend ETF | $1-$10,000 | |||||
| iShares Core MSCI Emerging Markets ETF | $10,001-$50,000 | |||||
| iShares Core MSCI Total International Stock ETF | $10,001-$50,000 | |||||
| iShares Core S&P 500 ETF | Over $100,000 | |||||
| iShares Core S&P Small-Cap ETF | $1-$10,000 | |||||
| iShares Core S&P Total U.S. Stock Market ETF | $10,001-$50,000 | |||||
| iShares Core S&P U.S. Growth ETF | $50,001-$100,000 | |||||
| iShares Core S&P U.S. Value ETF | $50,001-$100,000 | |||||
| iShares iBoxx $ High Yield Corporate Bond ETF | $10,001-$50,000 | |||||
| iShares International Select Dividend ETF | $1-$10,000 | |||||
| iShares MSCI EAFE ETF | $1-$10,000 | |||||
| iShares MSCI Japan ETF | $10,001-$50,000 | |||||
| iShares National Muni Bond ETF | $10,001-$50,000 | |||||
| iShares U.S. Preferred Stock ETF | $10,001-$50,000 |
| Name | Fund | Dollar
Range of Equity Securities in the Fund |
Aggregate
Dollar Range of Equity Securities in all Registered Investment Companies Overseen by Director or Advisory Board Member in Family of Investment Companies | |||
| Charles A. Hurty | iShares China Large-Cap ETF | $10,001-$50,000 | Over $100,000 | |||
| iShares Core Dividend Growth ETF | Over $100,000 | |||||
| iShares Core Growth Allocation ETF | Over $100,000 | |||||
| iShares Core High Dividend ETF | Over $100,000 | |||||
| iShares Core Moderate Allocation ETF | $50,001-$100,000 | |||||
| iShares Core MSCI Emerging Markets ETF | $50,001-$100,000 | |||||
| iShares Core S&P 500 ETF | Over $100,000 | |||||
| iShares Core S&P U.S. Value ETF | $10,001-$50,000 | |||||
| iShares Edge MSCI Min Vol USA ETF | Over $100,000 | |||||
| iShares Global Energy ETF | $10,001-$50,000 | |||||
| iShares Global Healthcare ETF | $10,001-$50,000 | |||||
| iShares Global Tech ETF | $10,001-$50,000 | |||||
| iShares MSCI EAFE ETF | $10,001-$50,000 | |||||
| iShares Russell 2000 ETF | $10,001-$50,000 | |||||
| iShares U.S. Basic Materials ETF | $10,001-$50,000 | |||||
| iShares U.S. Energy ETF | $10,001-$50,000 | |||||
| iShares U.S. Technology ETF | Over $100,000 | |||||
| John E. Kerrigan | iShares MSCI ACWI ETF | $10,001-$50,000 | Over $100,000 | |||
| iShares MSCI ACWI ex U.S. ETF | Over $100,000 | |||||
| iShares Short-Term National Muni Bond ETF | Over $100,000 | |||||
| Madhav V. Rajan | iShares Core Dividend Growth ETF | Over $100,000 | Over $100,000 | |||
| iShares Core High Dividend ETF | Over $100,000 | |||||
| iShares Core S&P 500 ETF | Over $100,000 | |||||
| iShares iBoxx $ High Yield Corporate Bond ETF | Over $100,000 | |||||
| iShares iBoxx $ Investment Grade Corporate Bond ETF | Over $100,000 | |||||
| iShares Russell 2000 ETF | Over $100,000 | |||||
| iShares Select Dividend ETF | Over $100,000 | |||||
| iShares U.S. Preferred Stock ETF | Over $100,000 | |||||
| Jane D. Carlin | iShares Core MSCI EAFE ETF | $50,001-$100,000 | Over $100,000 | |||
| iShares Core S&P Small-Cap ETF | $50,001-$100,000 | |||||
| iShares Global Tech ETF | $10,001-$50,000 |
| Name | Fund | Dollar
Range of Equity Securities in the Fund |
Aggregate
Dollar Range of Equity Securities in all Registered Investment Companies Overseen by Director or Advisory Board Member in Family of Investment Companies | |||
| Drew E. Lawton | iShares MSCI Frontier 100 ETF | $50,001-$100,000 | $50,001-$100,000 |
| Name | iShares
Emerging Markets High Yield Bond ETF |
iShares
Global High Yield Corporate Bond ETF |
iShares
International High Yield Bond ETF | |||
| Independent Directors: | ||||||
| John E. Kerrigan | $39 | $ 35 | $56 | |||
| Charles A. Hurty | 41 | 37 | 58 | |||
| Cecilia H. Herbert | 42 | 38 | 60 | |||
| Robert H. Silver1 | 10 | 9 | 14 | |||
| John E. Martinez | 39 | 35 | 56 | |||
| Madhav V. Rajan | 39 | 35 | 56 | |||
| Jane D. Carlin | 39 | 35 | 56 | |||
| Interested Directors: | ||||||
| Robert S. Kapito | $ 0 | $ 0 | $0 | |||
| Mark K. Wiedman | 0 | 0 | 0 | |||
| Advisory Board Members: | ||||||
| Drew E. Lawton2 | $9 | $8 | $13 |
| Name | iShares
Emerging Markets High Yield Bond ETF |
iShares
Global High Yield Corporate Bond ETF |
iShares
International High Yield Bond ETF | |||
| Richard L. Fagnani3 | Not Applicable | Not Applicable | Not Applicable |
| Name | iShares
J.P. Morgan EM Corporate Bond ETF |
iShares
J.P. Morgan EM Local Currency Bond ETF | ||
| Independent Directors: | ||||
| John E. Kerrigan | $ 12 | $154 | ||
| Charles A. Hurty | 12 | 161 | ||
| Cecilia H. Herbert | 13 | 166 | ||
| Robert H. Silver1 | 3 | 38 | ||
| John E. Martinez | 12 | 154 | ||
| Madhav V. Rajan | 12 | 154 | ||
| Jane D. Carlin | 12 | 154 | ||
| Interested Directors: | ||||
| Robert S. Kapito | $ 0 | $0 | ||
| Mark K. Wiedman | 0 | 0 | ||
| Advisory Board Members: | ||||
| Drew E. Lawton2 | $3 | $35 | ||
| Richard L. Fagnani3 | Not Applicable | Not Applicable |
| Name | Pension
or Retirement Benefits Accrued As Part of Company Expenses4 |
Estimated
Annual Benefits Upon Retirement4 |
Total
Compensation From the Funds and Fund Complex5 | |||
| Independent Directors: | ||||||
| Robert H. Silver1 | Not Applicable | Not Applicable | $81,250 | |||
| John E. Kerrigan | Not Applicable | Not Applicable | 325,000 | |||
| Charles A. Hurty | Not Applicable | Not Applicable | 340,000 | |||
| Cecilia H. Herbert | Not Applicable | Not Applicable | 361,764 | |||
| John E. Martinez | Not Applicable | Not Applicable | 336,764 | |||
| Madhav V. Rajan | Not Applicable | Not Applicable | 325,000 | |||
| Jane D. Carlin | Not Applicable | Not Applicable | 325,000 | |||
| Interested Directors: | ||||||
| Robert S. Kapito | Not Applicable | Not Applicable | $0 | |||
| Mark K. Wiedman | Not Applicable | Not Applicable | 0 | |||
| Advisory Board Members: | ||||||
| Drew E. Lawton2 | Not Applicable | Not Applicable | $75,000 6 | |||
| Richard L. Fagnani3 | Not Applicable | Not Applicable | Not Applicable |
| 1 | Served as an Independent Director through March 31, 2016. |
| 2 | Compensation from each Fund is shown for Drew E. Lawton for the period from October 18, 2016 (date of his appointment to the Advisory Board of the Trust) to October 31, 2016. |
| 3 | Compensation is not shown for Richard L. Fagnani because he was appointed to serve as an Advisory Board Member effective April 1, 2017. |
| 4 | No Director or officer is entitled to any pension or retirement benefits from the Company. |
| 5 | Includes compensation for service on the Boards of Trustees or the Advisory Boards for iShares Trust and iShares U.S. ETF Trust. |
| 6 | Total compensation is shown for Drew E. Lawton for the period from October 18, 2016 (date of his appointment to the Advisory Board of the Company, iShares Trust and iShares U.S. ETF Trust) to December 31, 2016. |
| Fund | Name | Percentage
of Ownership | ||
| iShares Emerging Markets High Yield Bond ETF | Morgan
Stanley Smith Barney LLC 1300 Thames Street 6th Floor Baltimore, MD 21231 |
10.41% | ||
| National
Financial Services LLC 200 Liberty Street 5th Floor New York, NY 10281 |
10.06% | |||
| Charles
Schwab & Co., Inc. 111 Pavonia Avenue Jersey City, NJ 07310 |
8.17% | |||
| The
Bank of New York Mellon 401 Salina Street 2nd Floor Syracuse, NY 13202 |
7.82% | |||
| Merrill
Lynch, Pierce, Fenner & Smith Incorporated 101 Hudson Street 9th Floor Jersey City, NJ 07302-3997 |
6.99% | |||
| Raymond,
James & Associates, Inc. 880 Carillon Parkway P.O. Box 12749 St. Petersburg, FL 33733 |
6.76% | |||
| Merrill
Lynch, Pierce Fenner & Smith Safekeeping 101 Hudson Street 8th Floor Jersey City, NJ 07302 |
6.38% | |||
| iShares Global High Yield Corporate Bond ETF | Merrill
Lynch, Pierce Fenner & Smith Safekeeping 101 Hudson Street 8th Floor Jersey City, NJ 07302 |
30.49% | ||
| National
Financial Services LLC 200 Liberty Street 5th Floor New York, NY 10281 |
12.24% |
| Fund | Name | Percentage
of Ownership | ||
| Charles
Schwab & Co., Inc. 111 Pavonia Avenue Jersey City, NJ 07310 |
8.99% | |||
| Raymond,
James & Associates, Inc. 880 Carillon Parkway P.O. Box 12749 St. Petersburg, FL 33733 |
5.06% | |||
| iShares International High Yield Bond ETF | The
Bank of New York Mellon 401 Salina Street 2nd Floor Syracuse, NY 13202 |
22.04% | ||
| U.S.
Bank N.A. 1555 North Rivercenter Dr. Suite 302 Milwaukee, WI 53212 |
11.33% | |||
| American
Enterprise Investment Services, Inc. 901 3rd Avenue South Minneapolis, MN 55474 |
9.19% | |||
| Pershing
LLC One Pershing Plaza Jersey City, NJ 07399 |
6.59% | |||
| J.P.
Morgan Clearing Corp One Metrotech Center North Brooklyn, NY 11201 |
5.35% | |||
| National
Financial Services LLC 200 Liberty Street 5th Floor New York, NY 10281 |
5.07% | |||
| iShares J.P. Morgan EM Corporate Bond ETF | Charles
Schwab & Co., Inc. 111 Pavonia Avenue Jersey City, NJ 07310 |
9.53% | ||
| Raymond,
James & Associates, Inc. 880 Carillon Parkway P.O. Box 12749 St. Petersburg, FL 33733 |
9.42% | |||
| Citibank,
N.A. 3800 CitiBank Center Tampa Building A/Floor 2 Tampa, FL 33610 |
7.13% | |||
| Morgan
Stanley Smith Barney LLC 1300 Thames Street 6th Floor Baltimore, MD 21231 |
6.97% | |||
| National
Financial Services LLC 200 Liberty Street 5th Floor New York, NY 10281 |
6.59% |
| Fund | Name | Percentage
of Ownership | ||
| UBS
Financial Services Inc. 1000 Harbor Blvd. 8th Floor Weehawken, NJ 07087 |
6.53% | |||
| TD
Ameritrade Clearing, Inc. 1005 N. Ameritrade Place Bellevue, NE 68005 |
5.82% | |||
| U.S.
Bank N.A. 1555 North Rivercenter Dr. Suite 302 Milwaukee, WI 53212 |
5.15% | |||
| iShares J.P. Morgan EM Local Currency Bond ETF | The
Bank of New York Mellon 401 Salina Street 2nd Floor Syracuse, NY 13202 |
30.19% | ||
| JPMorgan
Chase Bank, National Association 14201 Dallas Pkwy 12th Floor Dallas, TX 75240 |
10.97% | |||
| Morgan
Stanley Smith Barney LLC 1300 Thames Street 6th Floor Baltimore, MD 21231 |
5.34% |
| Fund | Management
Fee for Fiscal Year Ended Oct. 31, 2016 |
Fund
Inception Date |
Management
Fees Paid, Net of Waivers, for Fiscal Year Ended Oct. 31, 2016 |
Management
Fees Paid, Net of Waivers, for Fiscal Year Ended Oct. 31, 2015 |
Management
Fees Paid, Net of Waivers, for Fiscal Year Ended Oct. 31, 2014 | |||||
| iShares Emerging Markets High Yield Bond ETF | 0.50% | 04/03/12 | $ 351,011 | $ 1,074,126 | $1,265,426 | |||||
| iShares Global High Yield Corporate Bond ETF1, 2 | 0.40% | 04/03/12 | 394,444 | 374,379 | 375,061 | |||||
| iShares International High Yield Bond ETF3, 4 | 0.40% | 04/03/12 | 656,372 | 884,567 | 526,091 | |||||
| iShares J.P. Morgan EM Corporate Bond ETF | 0.50% | 04/17/12 | 125,126 | 151,278 | 154,114 | |||||
| iShares J.P. Morgan EM Local Currency Bond ETF5 | 0.50% | 10/18/11 | 2,204,539 | 2,822,136 | 3,521,831 |
| 1 | For the iShares Global High Yield Corporate Bond ETF, BFA contractually agreed to waive a portion of its management fee in order to limit Total Annual Fund Operating Expenses to 0.40% of average daily net assets through February 28, 2017. The contractual waiver was discontinued as of August 1, 2016. For the fiscal years ended October 31, 2016, October 31, 2015 and October 31, 2014, BFA waived $110,551, $140,390 and $140,648 of its management fees, respectively. |
| 2 | Effective August 1, 2016, the management fee for the iShares Global High Yield Corporate Bond ETF is 0.40%. Prior to August 1, 2016, the management fee for the iShares Global High Yield Corporate Bond ETF was 0.55%. |
| 3 | For the iShares International High Yield Bond ETF, BFA contractually agreed to waive a portion of its management fee in order to limit the Total Annual Fund Operating Expenses to 0.40% of average daily net assets through February 28, 2017. The contractual waiver was discontinued on August 1, 2016. For the fiscal years ended October 31, 2016, October 31, 2015 and October 31, 2014, BFA waived $179,217, $331,713 and $197,284 of its management fees, respectively. |
| 4 | Effective August 1, 2016, the management fee for the iShares International High Yield Bond ETF is 0.40%. Prior to August 1, 2016, the management fee for the iShares International High Yield Bond ETF was 0.55%. |
| 5 | For the iShares J.P. Morgan EM Local Currency Bond ETF, BFA has voluntarily agreed to waive a portion of its management fee in order to limit the management fee to 0.50%. Any such voluntary waiver or reimbursement may be eliminated by BFA at any time, without notice. For the fiscal years ended October 31, 2016, October 31, 2015 and October 31, 2014, BFA waived $0, $177,866 and $36,951 of its management fees, respectively. |
| James Mauro | ||||
| Types of Accounts | Number | Total Assets | ||
| Registered Investment Companies | 83 | $216,207,000,000 | ||
| Other Pooled Investment Vehicles | 13 | 22,160,000,000 | ||
| Other Accounts | 8 | 12,050,000,000 | ||
| Accounts with Incentive-Based Fee Arrangements | 0 | N/A |
| Scott Radell | ||||
| Types of Accounts | Number | Total Assets | ||
| Registered Investment Companies | 93 | $223,047,000,000 | ||
| Other Pooled Investment Vehicles | 8 | 3,353,000,000 | ||
| Other Accounts | 9 | 5,307,000,000 | ||
| Accounts with Incentive-Based Fee Arrangements | 2 | 1,043,000,000 |
| James Mauro | ||||
| Types of Accounts | Number
of Other Accounts with Performance Fees Managed by Portfolio Manager |
Aggregate
of Total Assets | ||
| Registered Investment Companies | 0 | N/A | ||
| Other Pooled Investment Vehicles | 0 | N/A | ||
| Other Accounts | 0 | N/A |
| Scott Radell | ||||
| Types of Accounts | Number
of Other Accounts with Performance Fees Managed by Portfolio Manager |
Aggregate
of Total Assets | ||
| Registered Investment Companies | 1 | $830,000,000 | ||
| Other Pooled Investment Vehicles | 1 | 213,000,000 | ||
| Other Accounts | 0 | N/A |
| Fund | Fund
Inception Date |
Administration,
Custody & Transfer Agency Expenses Paid During Fiscal Year Ended Oct. 31, 2016 |
Administration,
Custody & Transfer Agency Expenses Paid During Fiscal Year Ended Oct. 31, 2015 |
Administration,
Custody & Transfer Agency Expenses Paid During Fiscal Year Ended Oct. 31, 2014 | ||||
| iShares Emerging Markets High Yield Bond ETF | 04/03/12 | $ 19,674 | $ 47,490 | $ 34,232 | ||||
| iShares Global High Yield Corporate Bond ETF | 04/03/12 | 16,206 | 18,945 | 16,040 | ||||
| iShares International High Yield Bond ETF | 04/03/12 | 31,371 | 52,661 | 27,834 | ||||
| iShares J.P. Morgan EM Corporate Bond ETF | 04/17/12 | 6,642 | 8,782 | 11,113 | ||||
| iShares J.P. Morgan EM Local Currency Bond ETF | 10/18/11 | 217,488 | 270,081 | 272,841 |
| Fund | Fund
Inception Date |
Distributor
Compensation Paid During Fiscal Year Ended October 31, 2016 |
Distributor
Compensation Paid During Fiscal Year Ended October 31, 2015 |
Distributor
Compensation Paid During Fiscal Year Ended October 31, 20141 | ||||
| iShares Emerging Markets High Yield Bond ETF | 04/03/12 | $0 | $0 | $5,122 | ||||
| iShares Global High Yield Corporate Bond ETF | 04/03/12 | 0 | 0 | 5,122 | ||||
| iShares International High Yield Bond ETF | 04/03/12 | 0 | 0 | 5,122 | ||||
| iShares J.P. Morgan EM Corporate Bond ETF | 04/17/12 | 0 | 0 | 5,122 | ||||
| iShares J.P. Morgan EM Local Currency Bond ETF | 10/18/11 | 0 | 0 | 5,122 |
| 1 | These fees reflect payments made to SEI, acting as an agent of the Distributor. |
| Fund | Fund
Inception Date |
Brokerage
Commissions Paid During Fiscal Year Ended Oct. 31, 2016 |
Brokerage
Commissions Paid During Fiscal Year Ended Oct. 31, 2015 |
Brokerage
Commissions Paid During Fiscal Year Ended Oct. 31, 2014 | ||||
| iShares Emerging Markets High Yield Bond ETF | 04/03/12 | $ 0 | $0 | $0 | ||||
| iShares Global High Yield Corporate Bond ETF | 04/03/12 | 123 | 0 | 0 | ||||
| iShares International High Yield Bond ETF | 04/03/12 | 485 | 0 | 0 | ||||
| iShares J.P. Morgan EM Corporate Bond ETF | 04/17/12 | 0 | 0 | 0 | ||||
| iShares J.P. Morgan EM Local Currency Bond ETF | 10/18/11 | 0 | 0 | 0 |
| Fund | Fiscal Year ended October 31, 2016 | Fiscal Year ended October 31, 2015 | ||
| iShares Emerging Markets High Yield Bond ETF | 29% | 39% | ||
| iShares Global High Yield Corporate Bond ETF | 24% | 21% | ||
| iShares International High Yield Bond ETF | 24% | 28% | ||
| iShares J.P. Morgan EM Corporate Bond ETF | 22% | 11% | ||
| iShares J.P. Morgan EM Local Currency Bond ETF | 59% | 46% |
| Fund | Shares
Per Creation Unit |
Value
Per Creation Unit (U.S.$) | ||
| iShares Emerging Markets High Yield Bond ETF | 50,000 | $2,413,000 | ||
| iShares Global High Yield Corporate Bond ETF | 100,000 | 4,804,000 | ||
| iShares International High Yield Bond ETF | 100,000 | 4,523,000 | ||
| iShares J.P. Morgan EM Corporate Bond ETF | 50,000 | 2,451,500 | ||
| iShares J.P. Morgan EM Local Currency Bond ETF | 200,000 | 8,498,000 |
| Fund | Standard
Creation Transaction Fee |
Maximum
Additional Charge* | ||
| iShares Emerging Markets High Yield Bond ETF | $ 100 | 3.0% | ||
| iShares Global High Yield Corporate Bond ETF | 1,250 | 3.0% | ||
| iShares International High Yield Bond ETF | 1,900 | 3.0% | ||
| iShares J.P. Morgan EM Corporate Bond ETF | 100 | 3.0% | ||
| iShares J.P. Morgan EM Local Currency Bond ETF | 2,000 | 7.0% |
| * | As a percentage of the net asset value per Creation Unit. |
| Fund | Standard
Redemption Transaction Fee |
Maximum
Additional Charge* | ||
| iShares Emerging Markets High Yield Bond ETF | $ 100 | 2.0% | ||
| iShares Global High Yield Corporate Bond ETF | 1,250 | 2.0% | ||
| iShares International High Yield Bond ETF | 1,900 | 2.0% | ||
| iShares J.P. Morgan EM Corporate Bond ETF | 100 | 2.0% | ||
| iShares J.P. Morgan EM Local Currency Bond ETF | 2,000 | 2.0% |
| * | As a percentage of the net asset value per Creation Unit, inclusive of the standard transaction fee. |
| Fund | Non-Expiring | |
| iShares Emerging Markets High Yield Bond ETF | $ 17,583,299 | |
| iShares Global High Yield Corporate Bond ETF | 3,723,811 | |
| iShares International High Yield Bond ETF | 4,020,660 | |
| iShares J.P. Morgan EM Corporate Bond ETF | 679,122 | |
| iShares J.P. Morgan EM Local Currency Bond ETF | 10,212,040 |
| 1 | iShares MSCI ACWI Low Carbon Target ETF, iShares MSCI All Peru Capped ETF, iShares MSCI EAFE ESG Optimized ETF, iShares MSCI EM ESG Optimized ETF, iShares MSCI Global Impact ETF, iShares MSCI KLD 400 Social ETF, iShares MSCI USA ESG Optimized ETF and iShares MSCI USA ESG Select ETF have separate Fund Proxy Voting Policies. |
| • | Boards and directors |
| • | Auditors and audit-related issues |
| • | Capital structure, mergers, asset sales and other special transactions |
| • | Remuneration and benefits |
| • | Social, ethical and environmental issues |
| • | General corporate governance matters |
| • | establishing an appropriate corporate governance structure; |
| • | supporting and overseeing management in setting strategy; |
| • | ensuring the integrity of financial statements; |
| • | making decisions regarding mergers, acquisitions and disposals; |
| • | establishing appropriate executive compensation structures; and |
| • | addressing business issues including social, ethical and environmental issues when they have the potential to materially impact company reputation and performance. |
| • | current employment at the company or a subsidiary; |
| • | former employment within the past several years as an executive of the company; |
| • | providing substantial professional services to the company and/or members of the company’s management; |
| • | having had a substantial business relationship in the past three years; |
| • | having, or representing a shareholder with, a substantial shareholding in the company; |
| • | being an immediate family member of any of the aforementioned; and |
| • | interlocking directorships. |
| • | BlackRock has adopted a proxy voting oversight structure whereby the Corporate Governance Committees oversee the voting decisions and other activities of the Corporate Governance Group, and particularly its activities with respect to voting in the relevant region of each Corporate Governance Committee’s jurisdiction. |
| • | The Corporate Governance Committees have adopted Guidelines for each region, which set forth the firm’s views with respect to certain corporate governance and other issues that typically arise in the proxy voting context. The Corporate Governance Committees receive periodic reports regarding the specific votes cast by the Corporate Governance Group and regular updates on material process issues, procedural changes and other matters of concern to the Corporate Governance Committees. |
| • | BlackRock’s Global Corporate Governance Oversight Committee oversees the Global Head, the Corporate Governance Group and the Corporate Governance Committees. The Global Corporate Governance Oversight Committee conducts a review, at least annually, of the proxy voting process to ensure compliance with BlackRock’s risk policies and procedures. |
| • | BlackRock maintains a reporting structure that separates the Global Head and Corporate Governance Group from employees with sales responsibilities. In addition, BlackRock maintains procedures intended to ensure that all engagements with corporate issuers or dissident shareholders are managed consistently and without regard to BlackRock’s relationship with the issuer of the proxy or dissident shareholder. Within the normal course of business, the Global Head or Corporate Governance Group may engage directly with BlackRock clients, and with employees with sales responsibilities, in discussions regarding general corporate governance policy matters, and to otherwise ensure that proxy-related client service levels are met. The Global Head or Corporate Governance Group does not discuss any specific voting matter with a client prior to the disclosure of the vote decision to all applicable clients after the shareholder meeting has taken place, except if the client is acting in the capacity as issuer of the proxy or dissident shareholder and is engaging through the established procedures independent of the client relationship. |
| • | In certain instances, BlackRock may determine to engage an independent fiduciary to vote proxies as a further safeguard to avoid potential conflicts of interest or as otherwise required by applicable law. The independent fiduciary may either vote such proxies or provide BlackRock with instructions as to how to vote such proxies. In the latter case, BlackRock votes the proxy in accordance with the independent fiduciary’s determination. Use of an independent fiduciary has been |
| adopted for voting the proxies related to any company that is affiliated with BlackRock or any company that includes BlackRock employees on its board of directors. |